2020/21 KSP Policy Consultation Report
358
Presented by the MOEF, Republic of Korea 2020/21 KSP Policy Consultation Report Albania Gas Sector Expansion Strategy for Energy Diversification in Albania
-
Upload
khangminh22 -
Category
Documents
-
view
4 -
download
0
Transcript of 2020/21 KSP Policy Consultation Report

Presented by the MOEF, Republic of Korea
2020/21 KSP Policy Consultation ReportAlbania Gas Sector Expansion Strategy for Energy
Diversification in Albania

Government Publications Registration Number
11-1051000-001116-01
2020/21 KSP Policy Consultation ReportAlbania Gas Sector Expansion Strategy for Energy
Diversification in Albania

Project Title GasSectorExpansionStrategyforEnergyDiversificationinAlbania
Prepared for TheGovernmentofAlbania
In cooperation with Ministry of Infrastructure and Energy (MIE)
Supportedby MinistryofEconomyandFinance(MOEF),RepublicofKorea
KoreaDevelopmentInstitute(KDI)
Preparedby Hanyang University Industry-University Cooperation Foundation (HYU-IUCF)
Project Directors JungwookKim,ExecutiveDirector,CenterforInternationalDevelopment(CID),KDI
SanghoonAhn,FormerExecutiveDirector,CID,KDI
Project Manager KyoungDougKwon,Specialist,CID,KDI
ProjectOfficers HeaweonChoi,SeniorResearchAssociate,DivisionofPolicyConsultation,CID,KDI
Hyeseung Choi, Senior Researcher, Center for Energy Governance & Security, Hanyang University
SeniorAdvisor Joong-KyumKim,FormerCEOofKoreaElectricPowerCorporation
Principal Investigator YounkyooKim,Professor,HanyangUniversity
Authors Chapter1.YounkyooKim,Professor,HanyangUniversity
Chapter2.JinsooKim,AssociateProfessor,HanyangUniversity
NamjinRoh,ResearchFellow,KoreaEnergyEconomicsInstitute
Dritan Spahiu, Local Gas Expert
Chapter3.SungkyuLee,SeniorResearchFellow,KoreaEnergyEconomicsInstitute
Eunmyung Lee, Senior Research Fellow, Hanyang University
Stavri Dhima, Former Head of the Gas Sector, Ministry of Infrastructure and Energy
Chapter4.YounkyooKim,Professor,HanyangUniversity
YoungDooKim,Professor,JeonbukUniversity
WonbaeKim,SeniorResearcher,HanyangUniversity
ArtanLeskoviku,HeadofEnergy,NationalAgencyofNaturalResources
English Editor Editage
2020/21 KSP Policy Consultation Report
GovernmentPublicationsRegistrationNumber11-1051000-001116-01ISBN979-11-5932-658-5 979-11-5932-641-7(set)Copyright ⓒ2021byMinistryofEconomyandFinance,RepublicofKorea

2020/21 KSP Policy Consultation ReportGas Sector Expansion Strategy for Energy
Diversification in Albania

PrefaceTheKnowledgeSharingProgram(KSP) isaknowledge-intensivedevelopmentandeconomic
cooperationprogramdesignedtoshareKorea’sdevelopmentexperienceswithpartnercountries.
Since2004,theMinistryofEconomyandFinanceoftheRepublicofKorea(MOEF)hasbeen
managingKSPforpartnercountriesregardingtheircapacityofpolicybuildingandsustainable
development.Tomeet theneedsofpartnercountries,KSPoffers comprehensivepolicy
consultations through in-depth analysis and training opportunities.
OnbehalfofHanyangUniversity,IwouldliketoexpressourdeepestappreciationtotheMinistry
ofInfrastructureandEnergy(MIE), theGovernmentofAlbaniaandtheKoreaDevelopment
Institute(KDI),andtheMinistryofEconomy&Finance(MOEF)fortheircollaboration inthe
project. In particular, I would like to extend my profound gratitude to H.E. Ilir Bejtja, Vice Minister
of MIE and Illia Gjermani, Director General of Oil and Gas Development of MIE, the Government
ofAlbania.IwouldalsoliketothankMr.EralTrasja,Mr.DritanSpahiu,Dr.StavriDhima,Mr.
ArtanLeskoviku,Dr.MaksimShuli,Mr.AgimNashi,Mrs.EvisÇano,Mrs.RenataAliko,Mr.Arqile
Piperi,Mr.SidritTako,Mr.AlbanIbrahimifortheirunwaveringsupport.Thecompletionofthe
project“GasSectorExpansionStrategyforEnergyDiversificationinAlbania”wouldnothavebeen
possiblewithouttheirdevotion.
IalsowishtothanktheKSPconsultationteam:Dr.Joong-KyumKim(SeniorAdvisorandHead),
ProfessorYounkyooKim(PrincipalInvestigator),andDr.JinsooKim,Dr.NamjinRoh,Dr.Sungkyu
Lee,Mr.EunmyungLee,Dr.YoungDooKim,andMr.WonbaeKim(FellowResearchers) for
producing this report.
Thisprojectbenefitedgreatly fromthecontributionofseveralothersfromboth insideand
outsidetheAlbaniangovernment,suchasDr.FrankUmbach,HeadofResearch,EUCERS/CASSIS,
University of Bonn and Dr. Stephen Blank, Senior Fellow, Foreign Policy Research Institute (FPRI). I
wouldliketoextendmysincereappreciationforallthosewhohavemadevaluablecontributions
to the successful completion of this project. I am also grateful to the Center for International
Development (CID)ofKDI, inparticularDr. JungwookKimandDr.SanghoonAhn (Project
Directors),Dr.KyoungDougKwon(ProjectManager),andMs.HeaweonChoi(ProjectOfficer),for
their hard work and dedication toward the project.

IfirmlybelievethatKSPwillserveasasteppingstonetofurtherelevatemutual learningand
economiccooperationbetweenAlbaniaandKorea,andhopethat itwillcontributetotheir
sustainabledevelopment.
Sung Kyu Ha
Dean
Industry-University Cooperation Foundation
Hanyang University

Contents2020/21KSPwithAlbania ················································································································ 023Executive Summary ·························································································································· 029
Chapter 1 Introduction
Summary ·········································································································································· 0331.ObjectivesandScope ··················································································································· 0342. Methodology ································································································································ 0373.GasSupply,Demand,andMarketinAlbania ············································································· 040 3.1. Energy Supply and Demand ································································································· 040 3.2. Natural Gas Demand Structure ···························································································· 047 3.3. Gas Supply Structure ············································································································· 053 3.4. Gas Market Development ····································································································· 0614. South-East Europe (SEE) Gas Supply and Demand ····································································· 062References ········································································································································ 078
Chapter 2 Long-Term Outlook for Natural Gas Demand/Supply in Albania and the Strategy for Demand Drive of Natural Gas
Summary ·········································································································································· 0851. Introduction ·································································································································· 0862.KoreanExperiencesofNaturalGasDemandModeling····························································· 087 2.1.NaturalGasDemandinKorea ······························································································ 087 2.2.WorldPanelModelofKorea ································································································· 0913.EnergyDemandForecastingModels:Bottom-upvs.Top-down ··············································· 092 3.1.EnergyDemandModelingApproaches ··············································································· 092 3.2.Bottom-upModelandtheGasMasterPlanforAlbania ····················································· 0944. Strategies for Updating Demand Forecasts in the Gas Master Plan ········································· 096 4.1.CurrentStatusofGasDemandinAlbania ··········································································· 096 4.2.OurApproachtoGMPinAlbania ························································································· 1015.ResultsandProposalsforNaturalGasDemandPromotioninAlbania ···································· 104 5.1.Household&ServiceSector ·································································································· 104 5.2.IndustrySector ······················································································································ 106

5.3.TransportSector ···················································································································· 114 5.4.SurveyResults ························································································································ 119 5.5.ConclusionandSuggestions ································································································ 121References ········································································································································ 125
Chapter 3 National Policy Establishment for Natural Gas Industrial Structure and Market Design in Albania
Summary ·········································································································································· 1291. Introduction ·································································································································· 1312.StrategyandTasksforDevelopmentofNaturalGasIndustryofAlbania ································ 132 2.1. Current Situation of Energy Industry and Restructuring Policy of Government ·············· 132 2.2. Energy Pricing System in Electricity and Natural Gas Markets ··········································· 135 2.3.TheEU’sNew“EuropeanGreenDeal”andtheFutureConstraintRoleof NaturalGasforEurope’sEnergySupply ·············································································· 1383.OverviewofKorea'sNaturalGasIndustry ·················································································· 155 3.1. Supply and Demand of Natural Gas ····················································································· 155 3.2. Import of LNG and Supply Infrastructure ············································································ 158 3.3. Hydrogen ······························································································································· 1604.DevelopmentofKorea’sNaturalGasIndustry ··········································································· 160 4.1.EffortstowardsStableEnergySupplyforEconomicDevelopment ···································· 160 4.2. Implementation of the Introduction of LNG and Development of the Gas Market ·········· 163 4.3.SupportviaNaturalGasTariff ······························································································ 169 4.4.FinancialAidstoLNGBusiness ····························································································· 171 4.5.Long-TermEnergySupplyandDemandPlan ······································································ 1725.ComparisonofLawsandRegulationsonNaturalGasinAlbaniaandKorea ··························· 178 5.1.LawsandRegulationsonNaturalGasinAlbania ································································ 178 5.2.LawsandRegulationsonNaturalGasinKorea ·································································· 180 5.3.ComparisonofLawsandRegulationsbetweentheTwoCountries ··································· 1846.Recommendation:TheEstablishmentofaNaturalGas-RelatedAgency ································· 187 6.1.NeedsandStepsRequiredtoEstablishaNaturalGas-RelatedAgency ····························· 187 6.2.EstablishmentofEnergyPolicyandTechnologyThinkTank ·············································· 189 6.3.EstablishmentofOrganizationsRelatedtoGasSafetyandTechnology ··························· 198References ········································································································································ 203

Chapter 4 Albania’s Natural Gas Infrastructure Build-out and Technical Cooperation
Summary ·········································································································································· 2091. Introduction ·································································································································· 2102.Albania’sNationalNaturalGasInfrastructureBuild-out ··························································· 211 2.1. Domestic Resources ·············································································································· 221 2.2. National Infrastructure Build-out ························································································ 2253.Albania’sNaturalGasInfrastructureInterconnectionwithNeighboringCountries ················ 232 3.1.IonianAdriaticPipeline ········································································································· 232 3.2.LNGKrk ·································································································································· 235 3.3. LNG Revithoussa ··················································································································· 236 3.4. Eagle LNG······························································································································· 2374.ComparativeAssessmentofLNGIntroductionMethods ·························································· 239 4.1.FSRUTechnical&EconomicAssessment ············································································· 242 4.2.SSLNGTechnical&EconomicAssessment ··········································································· 278 4.3.SiteAssessment ····················································································································· 3175.RecommendationsforAlbania ···································································································· 331 5.1.StatusofAlbania’sGasSupplySystem ················································································· 331 5.2.HowtoStarttheLNGBusinessinAlbania? ·········································································· 3376.SharingKorea’sKnowledge&ExperienceinNaturalGas&LNGInfrastructure ······················ 343 6.1.Korea’sKnowledge&ExperienceinLNG ············································································· 343 6.2.Korea’sKnowledge&ExperienceinSSLNG ········································································· 3447.TechnicalCooperationbetweenSouthKoreaandAlbania ························································ 349 7.1. Transmission ·························································································································· 349 7.2.Equipment ····························································································································· 350 7.3. LNG Technologies ·················································································································· 3518.RecommendationsfortheDevelopmentofAlbgazSh.a.withBenchmarksonKOGAS ·········· 351References ········································································································································ 354
Contents

Contents l List of Tables
Chapter 1
<Table1-1> ObjectivesoftheProject ························································································· 037<Table1-2> SoutheastEurope–Macroeconomic&EnergySnapshot2016 ··························· 041<Table1-3> AlbaniaTPESperSector,2020-2040 ······································································· 042<Table1-4> AlbaniaTPESperFuel,2020-2040 ·········································································· 042<Table1-5> PotentialNaturalGasConsumptionby2040 ························································ 047<Table1-6> TotalNaturalGasConsumptioninAlbania ···························································· 048<Table1-7> “Non-Binding”PhaseoftheMarketTestof2019 ·················································· 052
Chapter 2
<Table2-1> StructureofPrimaryEnergySupplybySourceinRepublicofKorea ··················· 088<Table2-2> NaturalGasDemandProjectioninKorea ······························································ 090<Table2-3> ComparisonofEnergyDemandModelingApproaches ······································· 093<Table2-4> TotalPrimaryEnergySupplyinAlbania ································································· 097<Table2-5> GDPGrowthinAlbania ··························································································· 097<Table2-6> TotalFinalEnergyConsumptionbySectorinAlbania··········································· 097<Table2-7> TPESbyResourcesinAlbania,NaturalGasScenario ············································ 098<Table2-8> TFECbySectorinAlbania,NaturalGasScenario··················································· 099<Table2-9> PotentialNaturalGasConsumptionin2040(NaturalGasScenario) ··················· 100<Table2-10> PriceLevelofAlternativeFueltoNaturalGas ······················································· 105<Table2-11> PriceLevelofNaturalGasforPriceCompetitiveness ··········································· 105<Table2-12> AssumptionforGDPGrowthandStructure ·························································· 107<Table2-13> TFECbySectorinAlbania,NaturalGasScenario··················································· 110<Table2-14> TFECbyFuelTypeinChemical&PetrochemicalofNon-OECD(2017) ················· 111<Table2-15> TFECbyFuelTypeinSteel&IronIndustryofNon-OECD(2017) ·························· 113<Table2-16> DemandforFertilizerNutrientUseintheWorld ·················································· 114<Table2-17> FertilizersImportsbyNutrientintheAlbania ······················································· 114<Table2-18> TFECinTransportSectorinAlbania(2019) ···························································· 116<Table2-19> WorldLNGBunkeringDemandOutlook ······························································· 118<Table2-20> InlandLNGBunkeringDemandinAlbania ··························································· 119<Table2-21> SurveyPoolfortheNaturalGasDemandAnalysis ··············································· 119<Table2-22> AnticipatedDemandIncreaseby2040 ·································································· 120<Table2-23> RoughEstimationforFutureNaturalGasDemandinAlbanianIndustries········· 121

Contents l List of Tables
<Table2-24> AssumptionsfortheScenariostoUpdatetheGMP ·············································· 122<Table2-25> EstimatedNaturalGasDemandinAlbania ··························································· 123
Chapter 3
<Table3-1> LNGDemandForecastbySectorintheBasicPlan ··············································· 164<Table3-2> MajorDiscussionTopicsbyWorkingGroupDivision ············································ 176
Chapter 4
<Table4-1> DesignGasQuantitiesforSupplyofConsumersonanAnnualBasisin2040 ···· 215<Table4-2> TotalPotentialNaturalGasConsumptioninAlbaniaby2040 ······························ 216<Table4-3> ListofPotentialAnchorLoadswithIndicatedNaturalGasConsumption ··········· 218<Table4-4> ForecastedNaturalGasConsumptioninRefineriesinAlbania ···························· 219<Table4-5> IAPSummary ··········································································································· 234<Table4-6> CapacityTrendofImportTerminalsbyRegion ····················································· 244<Table4-7> FSRUandLandPowerPlants ·················································································· 249<Table4-8> ComparisonofFSUandBMPP ··············································································· 251<Table4-9> FSPPShipStructure ································································································· 253<Table4-10> ClassificationandCharacteristicsofRegasificationFacilities ······························· 254<Table4-11> FSRUProjectStatus(AsoftheEndof2020) ·························································· 262<Table4-12> CapacityComparisonforLandTerminalandFSRU ··············································· 268<Table4-13> ComparisonbetweenOnshoreTerminal,FSRUandCoveredFSRUs ··················· 271<Table4-14> WorldSSLNGMarket,2020–2025 ·········································································· 278<Table4-15> DefiningSSLNGandComparisonswithStandardLNG ········································ 283<Table4-16> LNGImportTerminalsinEurope ············································································ 308<Table4-17> MediterraneanLNGTerminals-SSLNGServices ··················································· 311<Table4-18> CapitalandOperatingCostofSSLNG ···································································· 313<Table4-19> MainAssumptions ··································································································· 315<Table4-20> AssumptionsforDieselReplacementinPowerGenerations ······························· 316<Table4-21> TableofRankings ···································································································· 330<Table4-22> FSRUFleetattheEndof2020 ················································································· 340

Contents l List of Figures
Chapter 1
[Figure1-1] KSPProcedure ········································································································· 040[Figure1-2] TPESbyEnergySource,2018 ·················································································· 042[Figure1-3] InstalledPowerCapacity,2018 ·············································································· 043[Figure1-4] DistributionofPrimaryEnergySupplybyDemandSector,2018 ························· 044[Figure1-5] ElectricityProduction,ConsumptionandNetImports,2014-2019 ····················· 044[Figure1-6] NetEnergyImports,2014-2018 ············································································· 045[Figure1-7] Albania’sGDPGrowthin2019ComparedwithCountriesinSouthEastEurope ··· 048[Figure1-8] Albania’sEnergyDemandGrowthin2015-2017 ··················································· 049[Figure1-9] Albania’sIndustrialGasDemandGrowthin2019 ················································· 049[Figure1-10] Albania’sDieselPricesin2019················································································ 050[Figure1-11] IndustrialNaturalGasPricesin2019····································································· 051[Figure1-12] Albania’sLPGPricesin2019 ··················································································· 051[Figure1-13] NaturalGasConsumption,2020-2040 ··································································· 052[Figure1-14] GasSupplyGrowthin2015-2017 ··········································································· 053[Figure1-15] NaturalGasUseGrowthinPowerGeneration,2015-2017 ·································· 054[Figure1-16] DryNaturalGasProductionofAlbania ·································································· 054[Figure1-17] GasProductioninAlbania,2009-2018 ··································································· 055[Figure1-18] South-EastEuropeGeography ··············································································· 062[Figure1-19] Russia’sNewGasPipelinesinSouthEasternEurope ············································ 063[Figure1-20] TANAP-TAP-SCPPipeline-Network ·········································································· 065[Figure1-21] EuropeanLNGImportsin2018-2020 ···································································· 071[Figure1-22] PNGvs.LNGImportsinEuropein2019 ································································ 072[Figure 1-23] Potential Export Routes of Gas from the Eastern Mediterranean Export Countries (Israel, Cyprus, and Egypt) ························································· 075[Figure 1-24] Eastern Mediterranean Gas Fields, Gas Pipelines and Egypt’sLNGExportTerminal ·················································································· 076
Chapter 2
[Figure2-1] CityGasDemandbyUsein2019 ············································································ 089[Figure2-2] HistoricalNaturalGasDemandinKorea(1992-2020) ·········································· 089[Figure2-3] MonthlyGasDemandinKorea(2014-2020)·························································· 091[Figure2-4] KoreanOutlookofGenerationOutputShare(TargetScenario)··························· 091

[Figure2-5] AnalysisFrameworkofMAED ················································································· 095[Figure2-6] TotalPrimaryEnergySupplyinAlbania,NaturalGasScenario,2040 ·················· 098[Figure2-7] TotalFinalEnergyConsumptioninAlbania,NaturalGasScenario,2040 ············ 099[Figure2-8] NaturalGasDemandProjectionintheGMPofAlbania ······································· 100[Figure2-9] ASurveyfortheNaturalGasDemandofAlbanianIndustrialSectors ················· 101[Figure2-10] Oil&NaturalGasPriceOutlookinEurope ···························································· 106[Figure2-11] ProjectedGDPGrowthRateofAlbania ·································································· 106[Figure2-12] FinalEnergyConsumptioninAlbaniabyIndustrialSector(2019) ······················· 107[Figure 2-13] Fractional Distillation Unit of Crude Oil ································································· 109[Figure 2-14] Manufacturing Process of Hot Rolled Steel Sheet and Coil ·································· 112[Figure2-15] Harber-BoschProcessFlow ···················································································· 113[Figure2-16] Heavy-dutyVehiclesGHGIntensity ········································································ 115[Figure 2-17] LNG Refueling Sites and LNG HDT Sales in China ················································· 115[Figure2-18] NaturalGasMarketShareinHeavyDutyTrucks ··················································· 116[Figure 2-19] Yearly Development of LNG Fueled Fleet ······························································· 117[Figure2-20] NumberofPortforLNGBunkeringbyStageandRegion ···································· 118
Chapter 3
[Figure3-1] ElectricityPricesforHouseholdCustomersintheRegionalCountries(2019) ···· 137[Figure 3-2] Electricity Prices for Non-Household Customers in the RegionalCountries(2019) ······················································································ 137[Figure 3-3] Previous EU Energy and Climate Policy Goals prior to the EGD ··························· 139[Figure3-4] TheEuropeanGreenDeal(Dec.2019) ··································································· 140[Figure3-5] NextGenerationFundoftheEU ············································································ 141[Figure3-6] GlobalEnergyTransitionInvestments(2004-2020) ·············································· 142[Figure3-7] Renewables-DecliningLevelisedCostofElectricity(2010-2019) ························ 143[Figure3-8] DecliningBatteryCosts ··························································································· 145[Figure3-9] DevelopmentofGreenversusBlueandGreyHydrogenCosts(2020-2030) ······· 152[Figure3-10] TheEU’sHydrogenStrategyinThreeSteps(July2020) ········································ 153[Figure 3-11] Hydrogen Options Based on Energy Resources ···················································· 154[Figure3-12] GrowthRateofTPESandContributionsofNaturalGasinKorea ························ 156[Figure3-13] Korea’sNaturalGasConsumption,2008-2018 ······················································ 157[Figure3-14] Korea’sLNGImportsbySource,2008-2018 ·························································· 158
Contents l List of Figures

[Figure3-15] OverviewofChangesintheKoreanEconomyandEnergySector ······················· 161[Figure3-16] EnergyIndustryStructureofKorea ······································································· 162[Figure3-17] ChangesinTotalPrimaryEnergySupplyofKorea ················································ 162[Figure3-18] NaturalGasBusinessFlowChart ··········································································· 165[Figure3-19] StructureofEnergySpecificFundsinKorea ·························································· 172[Figure3-20] StructureofNationalEnergyPlanbySector ························································· 173[Figure 3-21] Promotion Results of the 3rd Energy Master Plan ················································ 175[Figure 3-22] Promotion of the Basic Plan for Electricity Supply and Demand ·························· 177[Figure3-23] StructureofNationalEnergyPlanbySector ························································· 188[Figure3-24] FamilyTreeofEnergyInstitutesinKorea ······························································ 189[Figure3-25] KEEI’sManagementVisionandStrategies ···························································· 190[Figure3-26] OrganizationofKEEI ······························································································· 191[Figure3-27] OrganizationofKIER ······························································································· 193[Figure3-28] OrganizationofKIGAM ··························································································· 195[Figure3-29] OrganizationofKETEP ···························································································· 197[Figure3-30] OrganizationofKGS ································································································ 199[Figure3-31] OrganizationofKOGAS-Tech ·················································································· 201
Chapter 4
[Figure4-1] TAPRouteandStrategicPartnershipProjects ······················································· 212[Figure4-2] MunicipalitiesandLGUsViableforFurtherScreeningforGasification ··············· 213[Figure4-3] TotalPotentialNaturalGasConsumptioninAlbaniabyConsumptionSector ···· 217[Figure4-4] LocationsofAnchorConsumers ············································································ 218[Figure4-5] ProductionbyOilField ···························································································· 223[Figure4-6] AlbanianExplorationBlocks ··················································································· 225[Figure4-7] AlbanianSectionofIAPRoute ················································································ 233[Figure4-8] LocationofLNGKrk ································································································ 235[Figure 4-9] Revithoussa LNG Terminal ······················································································ 236[Figure4-10] LocationofEagleLNGTerminal ············································································· 238[Figure4-11] ComparisonbetweenFSRUandFSU ····································································· 243[Figure 4-12] Import Terminal Construction and Capacity Change ············································ 244[Figure4-13] ItalyAdriaticLNGTerminal ····················································································· 247[Figure 4-14] Malaysia Sungai Udang Terminal ··········································································· 247

[Figure4-15] BrazilPecémFSRUTerminal ··················································································· 248[Figure4-16] ArgentineandLithuanianFSRUTerminals ···························································· 248[Figure 4-17] Toscana FSRU Terminal, Italy ·················································································· 249[Figure4-18] NusantaraandLampungFSRUTerminal,Indonesia ············································ 250[Figure 4-19] FSU and BMPP ········································································································· 251[Figure4-20] LNGCandFSPP ········································································································ 252[Figure 4-21] LNGC, FSU, and BMPP ····························································································· 252[Figure 4-22] Components ············································································································ 253[Figure 4-23] Structure of FSRU Superstructure ·········································································· 255[Figure 4-24] FRSU Income Trend ································································································· 261[Figure4-25] FloatingRegasificationTerminalInstallationTrend ·············································· 261[Figure4-26] FloatingTerminalFacilityCapacityTrend ······························································ 263[Figure 4-27] Trend of FSRU Ships ································································································ 264[Figure4-28] NumberofFSRUShipOwnershipbyOperator ····················································· 267[Figure4-29] NaturalGasLiquefactionProcess ·········································································· 279[Figure4-30] NaturalGasLiquefactionProcessattheReceivingEnd ······································· 280[Figure 4-31] Value Chain of Conventional LNG and SSLNG ······················································· 281[Figure4-32] DefinitionofSSLNG ································································································· 281[Figure 4-33] Standard LNG and SSLNG ······················································································· 282[Figure 4-34] Standard LNG Value Chain······················································································ 283[Figure4-35] LNGValueChain ······································································································ 284[Figure4-36] SSLNGValueChain ·································································································· 285[Figure4-37] SmallScaleLiquefactionPlantinChina ································································· 286[Figure4-38] SmallSatelliteTerminal··························································································· 287[Figure4-39] StorageandRegasificationBarge ·········································································· 288[Figure4-40] MediumScaleTerminal ·························································································· 288[Figure 4-41] Full Containment Tank ···························································································· 290[Figure 4-42] Bullet Tank ··············································································································· 290[Figure4-43] LNGStorageAlternatives ························································································ 291[Figure 4-44] Transporting CNG ···································································································· 292[Figure4-45] LNGvs.CNG ············································································································· 293[Figure4-46] OnshoreReceivingTerminals ················································································· 293[Figure4-47] LocalLiquefactionPlant ·························································································· 294
Contents l List of Figures

[Figure4-48] LNGTrailer49,200Liters,4.8Bar ··········································································· 295[Figure4-49] IntermodalTransportwithISOContainers(20ft) ················································· 295[Figure4-50] IntermodalTransportwithISOContainers ··························································· 295[Figure4-51] 54ISOContainerswithCapacityof43,500Liters ················································· 296[Figure4-52] ORV··························································································································· 297[Figure4-53] SubmergedCombustionVaporizer ········································································ 298[Figure4-54] Shell-and-TubeLNGVaporizer ················································································ 298[Figure4-55] LNGSatelliteStation ······························································································· 299[Figure4-56] LNGMicrobulk ········································································································· 299[Figure4-57] LNG/LCNGVehicleFuelingStation ········································································· 300[Figure4-58] PortsEngagedinLNGBunkeringorStudyingIt ··················································· 301[Figure4-59] LNGColdEnergyUtilization ···················································································· 302[Figure4-60] LNGImportTerminalsOfferingSmallScaleServices ··········································· 310[Figure4-61] CapitalCostsofLNGProjectsandServices ··························································· 313[Figure4-62] SSLNG-BasedGasSupplytoaPowerPlant ··························································· 315[Figure4-63] DieselReplacementinPowerGeneration ····························································· 315[Figure4-64] SSLNG-BasedGasSupplytoIndustries ································································· 316[Figure4-65] MapShowingtheAreaofInvestigation ································································ 319[Figure4-66] IdentifiedLocations ································································································ 321[Figure4-67] SatelliteImageofLocation1 ·················································································· 322[Figure4-68] ArialViewofLocation1 ··························································································· 323[Figure4-69] ViewfromtheNorthtoPortoRomano ·································································· 324[Figure4-70] SatelliteImageofLocation2 ·················································································· 325[Figure4-71] NewlyBuiltTouristHotelsbehindSpilleBeach ····················································· 326[Figure 4-72] Satellite Image of Location 3 ·················································································· 328[Figure4-73] NewlyBuiltHotelneartheVillageofDorezezaeRe ············································· 328[Figure4-74] ViewofSazanIslandLookingWest ········································································ 329[Figure4-75] SatelliteImageofLocation4 ·················································································· 329[Figure4-76] TypicalLNGSupplyChain ······················································································· 334[Figure 4-77] FSRU LNG Unloading Type ······················································································ 335[Figure4-78] SSLNGApplications ································································································· 336[Figure4-79] LNGImportTerminalsSurroundingAlbania ························································· 339

Abbreviation Definition
AAV Ambient Air Vaporizers
AKBN National Agency of Natural Resources (Albanian: Agjencia Kombëtare e Burimeve Natyrore)
ALKOGAP Albania-Kosovo Gas Pipeline
ALL Albanian Lek (Official Currency of Albania)
ALPEX Albanian Power Exchange
API American Petroleum Institute
ARMO Albanian Refining and Marketing of Oil
BCM Billion Cubic Meters
BNEF Bloomberg New Energy Finance
BPLE Basic Plan of The Electricity Supply and Demand
BRUA Bulgaria, Romania, Hungary and Austria (Gas Interconnector)
CAPEX Capital Expenditures
CCGT Combined Cycle Gas Turbine
CCS Carbon Capture and Storage
CEECS Central and Eastern European Countries
CESEC Central and South Eastern Europe Energy Connectivity
CNG Compressed Natural Gas
DCM Decision of The Council of Ministers
DCS Distributed Control System
DME Dimethyl Ether
DSO Distribution System Operator
ECT Energy Community Treaty
EE Energy Efficiency
EEZ Exclusive Economic Zone
EGD European Green Deal
EGMS Energy and Greenhouse Gas Modeling System
List of Abbreviations

Abbreviation Definition
EIB European Investment Bank
EMGP East Mediterranean Gas Pipeline
ENTSOG European Network of Transmission System Operators
EPC Engineering, Procurement and Construction
EPRB Electricity Policy Review Board
ERE Energy Regulatory Authority (Albanian: Enti Rregullator i Energjisë)
ESS Energy Storage System
EU European Union
EUROSTAT Statistical Office of The European Union.
FID Final Investment Decision
FSHU Universal Service Supplier
FSPP Floating Storage Power Plant
FSRU Floating Storage and Regasification Unit
FSU Floating Storage Unit
FTL Free Market Supplier
GDP Gross Domestic Product
GHG Greenhouse Gas
GIS Geopolitical Intelligence Services
GMP(A) Gas Master Plan (of Albania)
GTC Gas Technology Corporation
HDT Heavy Duty Truck
HDV Heavy Duty Vehicles
HIPPS High Integrity Pressure Protection System
HLW High Level Waste
HPP Hydro Power Plant
HVDC High Voltage Direct Current
IAEA International Atomic Energy Agency
List of Abbreviations

Abbreviation Definition
IAP Ionian Adriatic Pipeline
ICED Income Coefficient of Energy Demand
IEA International Energy Agency
IENE Institute of Energy for South East Europe,
IFAAV Intermediate Fluid Ambient Air Vaporizers
IFV Intermediate Fluid Vaporiser
IGB Interconnector Greece-Bulgaria
IGU International Gas Union
IMO International Maritime Organisation
IRENA International Renewable Energy Agency
ISO International Organization for Standardization
JTF Just Transition Fund
KAS Konrad Adenauer Foundation
KDI Korea Development Institute
KEEI Korea Energy Economics Institute
KEPCO Korea Electric Power Corporation
KESH Albanian Power Corporation
KESIS Korea Energy Statistical Information System
KETEP Korea Institute of Energy Technology Evaluation and Planning
KGS Korea Gas Safety Corporation
KGU Korean Gas Union
KIER Korea Institute of Energy Research
KIGAM Korea Institute of Geoscience and Mineral Resources
KIITE Korea Institute of Industrial Technology Evaluation.
KOGAS Korea Gas Corporation
KOGAS-TECH Korea Gas Technology Corporation
KOSTT Transmission System Operator of The Republic of Kosovo
List of Abbreviations

Abbreviation Definition
KPE Korea Power Exchange
KSP Knowledge Sharing Program
KTOE Kilotonne of Oil Equivalent
LCNG Liquid to Compressed Natural Gas
LEAP Long-range Energy Alternatives Planning
LGU Local Government Unit
LNG Liquefied Natural Gas
LPG Liquefied Petroleum Gas
MAED Model for Analysis of Energy Demand
MCM Million Cubic Meter
MIE Ministry of Infrastructure and Energy of Albania
MMBTU Metric Million British Thermal Unit
MOEF Ministry of Economy and Finance of the Republic of Korea
MOTIE Ministry of Trade, Industry and Energy
NBC National Business Center
NDC Nationally Determined Contribution
NECPS National Energy and Climate Plans
NGH Natural Gas Hydrate
NGVA European Natural Gas Vehicle Association
NGVS Natural Gas Vehicles
NREAP Albania's National Renewable Energy Action Plans
O&M Operation and Maintenance
OECD Organisation for Economic Co-operation and Development
OPEX Operational Expenditures
ORF Onshore Receiving Facility
ORV Open Rack Vaporiser
OSHEE (or OSSH) Albanian Power Distribution Operator

Abbreviation Definition
OST Transmission System Operator
PCIS Projects of Common Interest
PECI Project of Energy Community Interest
PFD Process Flow Diagram
PID Piping & Instrument Flow Diagram
PIG Pipeline Inspection Gauge
PMI Project of Mutual Interest
PNG Pipeline Natural Gas
PRMS Pressure Reducing and Metering Station
PV Photovoltaic
R&D Research and Development
RCT Reverse Cooling Tower
RECAP Regional Project Energy Security and Climate Change Asia-Pacific
RES Renewable Energy Sources
SCP South Caucasus Pipeline
SCV Submerged Combustion Vaporiser
SEE/CEE Southeast and Central Europe
SGC Southern Gas Corridor
SOCAR State Oil Company of The Azerbaijan
SSLNG Small Scale LNG
STV Shell and Tube Vaporisers
TANAP Trans-Anatolian Pipeline
TAP Trans Adriatic Pipeline
TBP Trans-Balkan Pipeline
TFC Total Final Consumption
TPES Total Primary Energy Supply
TPP Thermo Power Plant
List of Abbreviations

Abbreviation Definition
TSO Transmission System Operator
TYNDP Ten Year Network Development Plan
UAE United Arab Emirates
UNECE United Nations Economic Commission for Europe
UNEP United Nations Environment Programme
UNFCCC United Nations Framework Convention on Climate Change
USA United States of America
USAID United States Agency for International Development
USD United States Dollar
VAT Value-added Tax
WB World Bank
WB6 Western Balkans 6
WBIF Western Balkans Investment Framework
WEO World Energy Outlook

2020/21 KSP with AlbaniaHyeseung Choi (Hanyang University)

023
2020/21 KSP with Albania
Albania is one of the fastest growing economy in the western Balkan region with an economic growth rate of 4% in 2018. One of the biggest impediment of economic growth in Albania is its current energy situation. Albania has been heavily relying on diesel and heavy oil as the primary sources of energy for transportation and industry to satisfy its increasing energy demand. Comparatively, Albania’s gas market size is one of the smallest in the western Balkan region, recording 15 million cubic meters in production and consumption in 2015. As a Contracting Party of the Energy Community and a signatory to the Energy Charter, Albania faces the need to diversify its energy sources, such as using natural gas, to maintain the supply and demand of LNG.
Accordingly, upon the Ministry of Infrastructure and Energy (MIE) of Albania’s submission of the KSP demand survey, the Ministry of Economy and Finance (MOEF) of the Republic of Korea conducted a review session of the proposal for diversifying the energy sector of Albania. The “Policy to facilitate the role of natural gas in the energy sector in Albania” was thus confirmed.
The main objectives of the 2020/21 KSP with Albania is to support its government in diversifying energy sources apart from imported petroleum and achieving energy independence. Furthermore, it aims to support Albania to efficiently manage the existing and new gas fields, and increase the institutional and technical expertise of its energy institutions. Based on the Republic of Korea’s past experience in the field of natural gas development, the Korean Research Team has provided policy directions and recommendations on three sub-topics. The details of the project, including the sub-topics and main project participants are listed below.
2020/21 KSP with AlbaniaHyeseung Choi (Hanyang University)

Gas Sector Expansion Strategy for Energy Diversification in Albania
024
Sub-Topics Researchers Local Consultants
Long-Term Outlook for Natural Gas Demand/Supply in Albania and
the Strategy for Demand-Drive of Natural Gas
Jinsoo Kim(Associate Professor, Hanyang University)
Namjin Roh(Research Fellow,
Korea Energy Economics Institute)
Dritan Spahiu(Local Gas Expert)
National Policy Establishment for Natural Gas Industrial Structure
and Market Design in Albania
Sungkyu Lee(Senior Research Fellow,
Korea Energy Economics Institute)Eunmyung Lee
(Senior Research Fellow, Hanyang University)
Stavri Dhima(Former Head of Gas Sector,
Ministry of Infrastructure and Energy)
Albania’s Natural Gas Infrastructure Build-out and Technical Cooperation
Younkyoo Kim(Professor, Hanyang University)
Young Doo Kim(Professor, Jeonbuk University)
Wonbae Kim(Senior Researcher,
Hanyang University)
Artan Leskoviku(Head of Energy,
National Agency of Natural Resources)
• Senior Advisor: Joong-Kyum Kim, Former CEO of Korea Electric Power Corporation• Project Manager: Kyoung Doug Kwon, Specialist, CID, KDI• Principal Investigator: Younkyoo Kim, Professor, Hanyang University
Due to the COVID-19 pandemic, activities of the 2020/21 KSP with Albania were conducted online. Aside from official activities, both the Korean and Albanian delegations ensured effective communication, through email exchanges and organizing online meetings if required.
The 2020/21 KSP with Albania was officially launched online on December 10, 2020 via ‛Launching Seminar and High-level Meeting’ in the presence of Dr. Joong-Kyum Kim, Senior Advisor and Head of 2020/21 KSP with Albania from the Korean side, and H.E. Ilir Bejtja, Deputy Minister of MIE. High-level Officials from both sides discussed policy priorities of Albania. The main goal of the Launching Seminar was to exchange ideas and set the goals of the KSP with the Albanian government and KSP Research Team. Mr. Illia Gjermani, the Petroleum Director of MIE gave a thorough presentation on the overview of the Energy Sector and Demand from the Albanian Government. This Seminar facilitated the Korean Research Team to understand the scope of this research, which is in line with policy priorities of Albania.
After three months of preliminary research by the Korean Research Team, the participants of the 2020/21 KSP with Albania gathered online to conduct ‛KSP Policy Seminar and In-depth Study’ on March 11th. High-level Officials from both sides also joined the Policy Seminar, where Dr. Joong-Kyum Kim, Senior Advisor and Head of 2020/21 KSP with Albania

025
delivered opening remarks, followed by welcoming remarks by H.E. Ilir Bejtja of MIE and congratulatory remarks by Ambassador Soosuk Lim of the Embassy of Republic of Korea to Greece. Experts from various Albanian affiliated institutions such as Energy Regulatory Authority (ERE), National Agency of Natural Resources (AKBN), Albpetrol, and Albgaz joined the Policy Seminar to provide the Korean Research Team with necessary information and materials. For each of the three sub-topics, the Korean researchers presented their preliminary findings to the Albanian delegation. Then, three local experts delivered presentations on 1) Status of supply and demand of natural gas and other energy sources in Albania, 2) development of the gas sector and real targets of national policy for energy diversification in Albania, and 3) Albania’s natural gas infrastructure. The discussion and Q&A sessions were held with experts from affiliated institutions.
As the third official stage, ‘Interim Reporting and Policy Practitioners’ Workshop’ was held online on May 31, 2021. Again, Interim Reporting of 2020/21 KSP with Albania began with opening remarks by Dr. Joong-Kyum Kim, Senior Advisor and Head of 2020/21 KSP with Albania, followed by welcoming remarks by H.E. Ilir Bejtja of MIE. The aim of the interim reporting was to receive feedbacks on the tentative final policy recommendations from the Korean Research Team.
Following the interim reporting, the Korean Research Team hosted a two-day online Workshop arranged for Albanian policy practitioners on June 1–2, 2021. The Korean Research Team considered the topics that were of interest to the Albanian policy practitioners. A total of four lectures were delivered. First, Dr. Ho-Mu Lee, the Director of Research Planning & Coordination of KEEI delivered his presentation on ‘Introduction to Korea Energy Economics Institute (KEEI): History, role and organization.’ Second, Mr. Wonbae Kim, Former Director of Pyeongtaek LNG Terminal, KOGAS presented on ‘Safety Measures for Natural Gas Pipeline Infrastructure System.’ Third, Dr. Euyseok Yang, Senior Research Fellow of KEEI made a presentation on ‘Direction of Energy Transition Policy and Development of Hydrogen Economy: Korea.’ Lastly, Dr. Stephen Blank, Senior Fellow of Foreign Policy Research Institute presented on ‘Southeast Europe Energy Security and Implications for Albania.’
As the last stage of 2020/21 KSP with Albania, ‘Final Reporting Workshop and Senior Policy Dialogue’ was launched on July 27, 2021. As the Head of the Korean side, Dr. Joong-Kyum Kim, Senior Advisor and Head of 2020/21 KSP with Albania delivered welcoming remarks, appreciating the active participation of all the participants to make 2020/21 KSP with Albania a success. As the Head of the Albanian side, H.E. Ilir Bejtja of MIE hoped that 2020/21 KSP with Albania will prove to be the first milestone in energy diversification
2020/21 KSP with Albania

Gas Sector Expansion Strategy for Energy Diversification in Albania
026
of Albania. Ambassador Jung Il Lee of the Republic of Korea to Greece delivered a congratulatory speech, emphasizing on continued economic cooperation between Albania and Korea. Following the remarks by high-level officials from both countries, the Korean researchers presented the result of policy consultation to top policy makers and relevant officials of Albania.


Executive Summary YounkyooKim(HanyangUniversity)

029
Based on the Korean experience, this report introduces the natural gas demand models and structure of gas consumption in energy-intensive industries in the context of Long-Term Energy Demand Outlook for 2040. Estimation for natural gas demand in different sectors can be more convincing and reliable by understanding the energy demand structure in each industry. The following three possible scenarios have been proposed to update the natural gas demand of the GMP of Albania: Low Economic Feasibility, Base, and Active Market Development.
The report proposes the following policy suggestions for the Albanian government to promote the natural gas demand and realize the “Active market development” scenario in Albania:
- Securing the price competitiveness of natural gas is of utmost importance to ensure the successful promotion of natural gas. As evident from survey responses and theories on energy demand modeling, there is an evident willingness to change energy sources and fuels if the price and infrastructure costs remain reasonable.
- Climate crisis and GHG emission reduction is a global megatrend, and the Albanian government and industries need to consider the climate issues. Therefore, survey responses suggest that electrification and power generation by natural gas and fuel substitution is not a choice; it is the only option we have. Renewables could be the future of power generation, but it is difficult to supply all electricity demand from renewables only.
- Natural gas supply infrastructure is essential for price competitiveness as well accessibility. We propose promising options in Chapter 4. but giving a clear policy signal to the possible consumers, including industries, is also important.
- The estimated demand in our study has some limitations: the number of respondents of the survey is limited, the data is not sufficient to analyze the demand with
Executive SummaryYounkyooKim(HanyangUniversity)
Executive Summ
ary

Gas Sector Expansion Strategy for Energy Diversification in Albania
030
econometric or bottom-up models (e.g., the price level of each energy sources), and we do not have enough resources to develop a national energy demand model, especially for electricity. We believe that the Albanian government can handle all these limitations in the future with our suggestions in the other sections.
The report compares laws and regulations on natural gas of Korea and Albania to establish national policies related to the natural gas industrial structure and market design. Energy-related laws and regulations of Albania, including natural gas, have been well enacted and revised in line with the EU's legal framework, backed by EU’s policy consulting support. Restructuring of the energy industry is also being implemented within the guidelines of the EU. Korea has more than 40 years of experiences in the field of gas industry development and safety management. As the natural gas industry develops and market expands in Albania, the need for establishing related laws, regulations, and organization in business activities and safety management sectors will increase substantially.
The report identifies the necessity to establish energy policy and technology think tank as government-affiliated research institutes for their active and effective role in ensuring energy security improvement and energy industry development. It proposes establishing organizations related to gas safety and technology such as the Korea Gas Safety Corporation (KGS) and the Korea Gas Technology Corporation (KOGAS-Tech). Government-funded research institutes such as Korea Energy Economics Institute (KEEI), Korea Institute of Energy Research (KIER), Korea Institute of Geoscience and Mineral Resources (KIGAM), and Korea Institute of Energy Technology Evaluation and Planning (KETEP), are conducting research activities to propose various policy and investment alternatives to the government and energy businesses for quickly responding to changing international energy landscape and developing new technologies. In Korea, certain public enterprises are in charge of the safety of natural gas supply and technology development. KGS is a governmental testing, inspection, and education organization. KOGAS-Tech was established to install reliable and safe natural gas supply facility and reduce the industry’s reliance on foreign technology through technical development in the engineering sector as a subsidiary of Korea Gas Corporation (KOGAS). Korea’s institutions and organization that support the government and energy business could be useful for the stable development of the Albanian natural gas industry.
To expedite and facilitate the gasification of Albania, the Government of Albania is recommended to consider LNG import options along with ensuring pipeline infrastructure development. There are three LNG import methods.

031
1. On shore LNG Import (Regasification) Terminal2. Floating Storage Regasification Unit (FSRU), Floating Storage Unit (FSU), etc.3. On Shore Small Scale LNG (SSLNG)
In Albania, the uses of SSLNG emerges as a solution to feed isolated areas that are not connected to the gas grid, where residential, industrial, and commercial sectors are present. The development of the pipeline transmission and distribution systems alone does not ensure a supply of gas to the two major natural gas consumption centers: the triangle of Fier-Vlora-Ballsh and the region of Durres and Tirana.
LNG technologies are readily possible for “fast-track” implementation of mini LNG facilities, with relatively low investments compared to pipelines or large- scale onshore LNG facilities. Areas limited by a lack of pipeline infrastructure in Albania can be enabled by SSLNG, which can facilitate the rapid establishment of power plants, oil and gas exploration and refining, fertilizers, the food industry, ceramics, etc.
ALBGAZ's development plan, which benchmarked Korea's Gas Corporation, is also presented. Safe and efficient construction by presenting examples of improvements that Korea Gas Corporation has experienced and improved while constructing and operating facilities for about 40 years.
It is also important to select key employees of ALBGAZ and receive training in Korea as part of the capacity-building program. Currently, KOGAS is an important benchmarking target because construction and operation are being pursued at the same time. By proposing to the Albanian government to train LNG procurement experts and to operate a separate LNG procurement department within ALBGAZ, it will be recommended to strengthen the capacity of policy and technical personnel and technical skills for stable and economical natural gas procurement.
Executive Summ
ary

Introduction
YounkyooKim(HanyangUniversity)
1.ObjectivesandScope2. Methodology3.GasSupply,Demand,andMarketinAlbania4. South-East Europe (SEE) Gas Supply and Demand
C H A P T E R
01
KeywordsEnergySecurity,EnergyDiversification,NaturalGasDemand,SupplyProjection, Natural Gas Market, Demand-Drive of Natural Gas

033
CHAPTER
01Introduction
Summary
The most urgent question for Albania is how to satisfy its rising energy demand. If Albania is to support its growth, it needs to find additional domestic energy sources. Albania has relatively abundant oil reserves but natural gas reserves have almost been exploited and recoverable reserves seem very limited. Albania has an isolated gas distribution system, which is not connected to international gas transmission systems. Therefore, integration with regional and EU energy markets will be an important step for Albania to meet its growing energy demand.
Albania is among the most vulnerable countries to climate change in the Southeast European region. The government of Albania aims to overcome the imbalance of energy supply and demand by following key strategies and policy measures. For example, diversification of energy sources, precisely through non-hydro renewable energy expansion and gasification.
The Trans Adriatic Pipeline (TAP)—a gas pipeline—is already in operation. Albania has a specific strategic plan for the development of the hydrocarbon sector, especially the natural gas sector. These plans and programs are embodied in the National Energy Strategy for 2018-2030 approved by the Ministerial Committee Decision on July 31, 2018 and the Albanian Gas Master Plan approved by the Ministerial Council on April 2, 2018.
This study aims to illuminate several headwinds and challenges that the future development of Albania's natural gas sector will face along the three respective sub-topics agreed upon by the governments of the Republic of Albania and the Republic of Korea.
The main objectives of the research team are to provide policy directions and recommendations for the policy challenges based on the Republic of Korea’s experience to facilitate the government of Albania’s implementation of the Gas Master Plan. The research
IntroductionYounkyooKim(HanyangUniversity)

Gas Sector Expansion Strategy for Energy Diversification in Albania
034
team has identified the following central questions and objectives corresponding with the three respective sub-topics:
- Long-term Energy Demand Outlook for 2040 and Strategy to Enhance the Role of Natural Gas in Albania.
- Establishment of national policy related to the natural gas industrial structure and market design.
- Feasibility Study on the Introduction of the Liquefied Natural Gas (LNG and SLNG) into Energy Mix in Albania and Technology for the Construction /Operation of Gas Infrastructure.
1. Objectives and Scope
As of 2016, Albania had virtually no gas sector. Its infrastructure was dilapidated to the extent where repair did not make economic sense, and the pattern of settlement of Albania’s citizens with large numbers of sparsely populated settlement worked against an integrated gas network. Therefore, a completely new network was required.1 The TAP pipeline as part of the larger TANAP-TAP project will not only have a significantly positive impact on Albania’s overall economy, but also effectively galvanize the creation of a plan for a new network and relevant projects. Indeed, the gasification plan is clearly inspired by the reports of USAID and a 2016 European funded research on Albania’s gas economy which provided a master plan for Albania’s gasification (henceforth, the Gas Master Plan (GMP)). The GMP identified the energy sector as a strategic growth sector and enabler for the growth of Albania’s economy. It also observed that regardless of its formal status in the overall EU integration project, Albania was bound to accept the corresponding EU Acquis Communautaire in line with the implementation dynamics determined by the (EU’s) Energy Community institutions according to the EnC Treaty’s provisions.
Energy consumption is expected to increase as annual GDP growth is projected at 4% over the next decade. The most urgent question for Albania is how to meet this rising demand. If Albania is to support its growth, it first need to find additional domestic energy sources. Albania has relatively abundant oil reserves; however, its natural gas reserves have almost been exploited and recoverable reserves seem very limited. Albania has an isolated gas distribution system, which is not connected to the international gas transmission systems. Therefore, the integration of regional Albanian and EU energy markets will
1 European Western Balkans Joint Fund, Western Balkans Investment Framework Infrastructure Project Facility Technical Assistance 4 (IPF 4), WB11-ALB-ENE-01 (Gas Master Plan for Albania & Project Identification Plan, 2016), p. 15 (Henceforth Gas Master Plan).

035
CHAPTER
01Introduction
be imperative for Albania to satisfy its growing energy demand for energy. Recently, the Albanian government launched a major investment in the field of energy delivery infrastructure at both national and regional levels.
Albania has also accomplished several feats in terms of energy sector reforms. Its energy sector, especially the electricity sector, is introducing European regulations and institutions. The Trans Adriatic Pipeline (TAP) is already in operation. Albania has a specific strategic plan for the development of the hydrocarbon sector, especially the natural gas sector. These plans and programs are embodied in the National Energy Strategy for 2018-2030 approved by Ministerial Committee Decision on July 31, 2018 and the Albanian Gas Master Plan approved by the Ministerial Council on April 2, 2018.
However, the government will face many challenges in implementing the GMP. One of the most important latest changes is the European Green Deal was introduced by the EU in December 2019. A new ambitious emissions reduction target was established: minus 55% for 2030 (instead of the previous -40%). The EGD has huge implications for the EU’s future energy mix and energy security, including the financing of new energy sources and infrastructures. Even by phasing-out coal in Europe completely, the EU will not be able to achieve its long-term emission reduction goal of minus 95% by 2050. In fact, it needs to reduce its overall gas consumption by 2030.2
Conventionally, it has been believed that for natural gas to play a significant role for gas as a transition fuel, let alone a destination fuel, national governments would have to develop gas-related strategies that encourage its use in the near- and medium-term while facilitating a subsequent orderly transition from gas toward a vast use of renewables.3 In other words, until recently, switching from coal to gas was considered as the most cost-efficient way of securing a major reduction of carbon emissions.
The conventional wisdom may no longer be wise because increasing evidence suggests that it is already cheaper to produce power from renewables than coal or other fuels. For Northern, Western, and even Southern Europe, it almost certainly means that any incremental requirement for power generation will come from renewables.4
Where will the EGD leave natural gas for Albania in the context of the climate
2 Frank Umbach, “Gas Supply Perspectives for Albania under new Conditions of EU Energy and Climate Policies as well as Market Competitiveness Factors,” Manuscript submitted to the Albania KSP research team, April, 2021, p. 2.
3 United Nations Economic Commission for Europe (UNECE), How Natural Gas Can Displace Competing Fuels (Geneva, Switzerland, 2019), p. 5 of Executive Summary.
4 Ibid., p. 7.

Gas Sector Expansion Strategy for Energy Diversification in Albania
036
emergency? Gas does possess distinct advantages that should manifest for at least two decades. The principal concern for Albania is whether the climate emergency will disrupt the supply of water for the production of hydropower, which is the mainstay of energy production. Subsequently, Poland’s desire to secure a “just transition” is instructive for the Government of Albania. A new gas import infrastructure, notably the LNG terminal at Świnoujście and the Baltic line will enable Poland to import Norwegian gas via Denmark, thereby retaining gas’ high share in the energy mix for some years.5
Relatively, Southeast Europe remains Europe’s most polluting and least energy efficient region compared to its GDP. It is energy intensive but also intensive in CO2 per unit of used energy. Southeast Europe will significantly benefit from the introduction and expansion of gas. The countries and districts that will gain most from access to natural gas are Albania, Bosnia-Herzegovina, Kosovo, Montenegro, and North Macedonia, along with southern districts of Croatia and various regions of Serbia.6 LNG will be an important player in the market, due to the plan for new LNG import terminals in the region. The development of small-scale on-shore LNG and floating LNG regasification terminals has the ability to facilitate the emergence of new markets for gas in the western Balkan region. The European Network of Transmission System Operators for Gas (ENTSOG) considers that the potential for LNG supply from all sources will almost double over the next 20 years, from 115 bcm in 2020 to 228 bcm in 2040.7 The maximum capacity for pipeline gas delivery will rise by around 50 bcm.
The development of a functioning and flexible gas market and regional integration of gas market will significantly enable access to natural gas for these countries. However, the implementation of the Southern Gas Corridor project and gas import diversification is not yet complete. Thus, the extent of Russia’s future geo-economic and geopolitical influence through its gas pipeline policy in South Eastern Europe and its opposition to that of EU remains ambiguous. ENTSOG considers that Russia has the potential to expand its pipeline capacity to European customers from the current maximum of 194 bcm/y to 226 bcm/y by 2040.8
The GMP stipulates that natural gas demand in Albania will continue to follow its upward trend supported by its environmental qualities, government investment in the transmission network, and attractiveness for electricity producers. However, the GMP has several caveats. Therefore, building on the major findings from the GMP, this report further investigates the
5 Ibid., p. 7.6 United Nations Economic Commission for Europe (UNECE). The Potential for Natural Gas to Penetrate New Markets (Geneva, Swit-
zerland, 2020), p. 4.7 Ibid., p. 2.8 Ibid.

037
CHAPTER
01Introduction
Albanian energy and gas sector from the perspective of security of gas supply.
This study aims to illuminate several headwinds and challenges that the future development of Albania's natural gas sector will face along the three sub-topics agreed upon by the governments of the Republic of Albania and the Republic of Korea.
The main objectives of the research team are to provide policy directions and recommendations for the policy challenges based on the Republic of Korea’s experience to facilitate the Government of Albania’s implementation of the Gas Master Plan.
The research team has identified central questions and objectives corresponding with the three respective sub-topics.
<Table 1-1> Objectives of the Project
Overarching Topic Policy to Facilitate the Role of Natural Gas in the Energy Sector in Albania
Sub Topic 1
Long-Term Energy Demand Outlook for 2040 and Strategy to Enhance the Role of Natural Gas in Albania- Planning for natural gas supply to the power generation, industry, residential/service
sectors through long-term energy demand forecast by 2040- Establish a plan to construct and establish nationwide natural gas supply networks by
region/time
Sub Topic 2
Establish National Policy Related to the Natural Gas Industrial Structure and Market Design- Institutional framework for the natural gas industry, including the legal system related to
the industrial structure and the corporate form/roles- Policy design for the natural gas market mechanism/rules, such as financing method,
pricing, technology application, supply obligation, etc- (also possibly) Increasing the technical expertise of institutions /entities related to the gas
sector
Sub Topic 3
Feasibility Study on the Introduction of the Liquefied Natural Gas (LNG and SLNG) into Energy Mix in Albania and Technology for the Construction /Operation of Gas Infrastructure- Study on the possibility of the LNG and SLNG project based on the evaluation of the global
LNG market conditions and Albania’s energy supply and demand structure- Sharing Korea’s experience for technical know-how for the construction and operation of
infrastructure facilities such as LNG receiving terminal and nationwide pipeline networks
Source: Author.
2. Methodology
The Knowledge Sharing Program (KSP) is a knowledge-intensive development and economic cooperation program. It is designed to successfully share Korea’s experience in development with partner countries. Since 2004, the Ministry of Economy and Finance of the

Gas Sector Expansion Strategy for Energy Diversification in Albania
038
Republic of Korea (MOEF) has been overseeing KSP for partner countries to facilitate their sustainable development and capacity for policy building. KSP has offered comprehensive policy consultations tailored to the needs of partner countries through in-depth analysis and training opportunities.
In July 2020, upon the submission of the KSP demand survey by the Ministry of Infrastructure and Energy (MIE), the Government of Albania, the MOEF of the Republic of Korea held a review session to propose and confirm the project of increase the abilities of Albanian institutions and entities to enable efficient use of energy sources that are environmentally friendly (with a focus on the natural gas sector). This project aimed to support the Albanian government to diversify energy sources apart from imported petroleum, achieve energy independence, and manage existing or new gas fields. Therefore, the institutional and technical expertise of our energy institutions/entities is extremely important.
The initial project proposal from the Albania government included the following four research sub-topics: 1) to diversify energy sources apart from imported petroleum, 2) to achieve Albania’s energy independence, 3) to better manage existing or new gas fields, and 4) to increase the institutional and technical expertise.
In association with the Korean field experts in the energy sector, we have discussed the current circumstances of Albania’s energy sector and drawn from Korea’s strength. Based on these, the field expert and KDI suggested a revision of the overarching topic and sub-topics, considering that KSP is a policy consultation project that will last for about 10 months. After discussion with the MIE, we agreed to revise the topic as follows:
Based on the revised topics and open bidding process of the Korea Development Institute (KDI) in September 2020, the Center for Energy Governance and Security, Hanyang University, Seoul, Republic of Korea, was designated as the implementing agency in Korea.
The Center for Energy Governance & Security (EGS) was established in 2012 with a major grant from the Korean Ministry of Education. EGS located at Hanyang University’s Seoul Campus, aims to conduct dynamic research on current energy issues while bringing groups of energy experts from major countries in the Asia-Pacific (the United States, China, Japan, Singapore, and Australia) together with an interest and capability to engage in the region. To better understand the notion of ‘global energy governance and energy security’ and the role of Asia, the center disseminates its research by collaborating with leading institutions worldwide through briefings, publications, conferences, and newspaper op-eds.

039
CHAPTER
01Introduction
An international joint team, including researchers from the Korea Energy Economics Institute and other international researchers, was formed according to the Hanyang University’s EGS. The research team comprises Korean experts, policy practitioners, and local consultants. A policy practitioner is a public officer or civil servant who is concerned with related ministerial policies. They are entitled to give (written) comments or opinions on the research proposals, interim reports, and draft of final reports and responsible for organizing networks among the policy institutions or organizations. KSP implementing agency will invite policy practitioner/project manager for the “Interim Reporting & Policy Practitioners’ Workshop,” which will be held in Korea during the program implementation period.
Local consultants in Albania have assisted Korean experts to collect data, review policy documents of the partner country, make preliminary analyses and write a part of the final report with the main author’s (Korean expert) agreement. The scope of work between local consultants and Korean experts is as follows:
- Local consultants are required to provide relevant data and information for effective research, co-author the final report on case-by-case issues, and cooperate with the Korean experts to complete the report.
- While Korean experts will primarily assess studies on the Korean experience, local consultants will assess studies on the challenges faced by the partner country.
- Recommendations for methods to apply the Korean experiences to address the partner country’s problems will be made by experts from both countries.
The research team will jointly work to provide tailored policy recommendations and technical assistance based on the scope of work. Normally, the project lasts for 10—12 months. During this period, Korean experts were expected to visit the partner country three times. Partner country's policy practitioners were expected to visit Korea once to attend the Practitioner's Capacity Building Workshop. However, due to COVID-19 and corresponding measures quarantine, self-quarantine, and restriction on external and official activities, the Korean delegation’s visit to Albania and inviting Albanian delegation over to Korea was restricted for the duration of the entire project. Consequently, alternative means, such as video conference, video recording, in-depth study in written form, and so on, were utilized to conduct each activity.

Gas Sector Expansion Strategy for Energy Diversification in Albania
040
[Figure 1-1] KSP Procedure
· Preliminary Meeting
· Project ConceptPaper (PCP)
· Selection of Research Team
· Launching Seminar and High-Level Meeting
· Policy Seminar and In-Depth Study
· Interim ReportingWorkshop and Policy Practitioners' Workshop
· Senior Policy Dialogue and Final Reporting Workshop
· Advisory Committee
· Editorial ReviewCommittee
· Project Evaluation
· Regional Seminars· Dissemination
Conferences· Ex-Post
Management
Planning Implementation Monitoring &Evaluation Dissemination
Source: KSP (2021).
3. Gas Supply, Demand, and Market in Albania
3.1. Energy Supply and Demand
Since 1992, the economy of the Republic of Albania has experienced a transformation from a centralized to a market economy. Over 2000-2016 it grew by 4%bcm/y and by 2000 it had overtaken Ukraine in terms of its per capita. In 2000, Albania’s per capita was $5,500, while Ukraine’s was $4,700.9 As of 2019, the GDP per capital of Albania was $5,353. Over the past two decades, the value of Gross Domestic Product (GDP) per capita has increased due to a number of factors, including an ambitious economic development program, donor-supported development assistance, and a favorable geographical position as a bridge connecting the Balkans with Western Europe.
Based on the GDP and as a member of the Energy Community, Albania’s GDP per capita maintain a 30% average of EU-28 per capita GDP.10
One of the most important inputs for economic development is energy. The use of energy is central to the operation of any modern economy and drives economic productivity and industrial growth. Since several production and consumption activities involve energy as a basic input, it becomes a key source of economic growth.
9 Julian Bowden, “SE Europe gas markets: towards integration,” OIES Paper Ng. 150 (2019), Oxford Institute for Energy Studies, p. 4. 10 Ibid., p. 3.

041
CHAPTER
01Introduction
<Table 1-2> Southeast Europe – Macroeconomic & Energy Snapshot 2016
Region Country Population(millions)
GDP per Cap$ year 2010, ppp
Electricity Dem. and per Capita (kwh)
Gas in Total Energy (%)
Gas Demand(bcm)
Gas Output(bcm)
Imports from
Russia (bcm)
Supply from Russia (%)
EU
Romania 19.7 20,800 2,700 28 11.5 9.9 1.7 15
Bulgaria 7.1 17,400 5,000 15 3.2 0.1 3.1 97
Greece 10.8 23,800 5,500 15 3.8 - 2.7 70
Croatia 4.2 20,600 4,000 26 2.6 1.6 0.8 31
Slovenia 2.1 28,900 7,000 10 0.9 - 0.5 57
Total or Average 43.9 21,300 4,100 - 22.0 11.6 8.8 40
Energy Commu
nity
Albania 2.9 11,000 2,200 1 - - - -
Serbia 7.1 13,100 4,600 12 2.4 0.5 1.9 79
Montenegro 0.6 15,400 4,700 - - - - -
Kosovo 1.8 9,100 2,400 - - - - -
Energy Commu
nity
Rep of North Macedonia 2.1 13,000 3200 7 0.2 - 0.2 100
Bosnia & Herzegovina 3.5 10,800 4600 3 0.2 - 0.2 100
Total / average 18.0 12,000 3900 - 2.8 0.5 2.3 82
Total
Total SEE 61.8 - - - 24.8 12.1 11.1 45
Total EU-28 511.3 35,500 6000 23 449.3 124.7 142.9 32
Total SEE 5 in EUas % of EU-28
9 60 68 - 5 9 6 -
Source: Julian Bowden (2019).
Energy demands are expected to grow as Albania’s economy grows. Currently, energy imports restrict economic growth considerably, have a negative effect on the country’s trade deficit, and leave the country open to supply shocks. Albania’s energy mix is dominated by fossil fuels–mainly crude oil–which accounts for more than half of the Total Primary Energy Supply (TPES) as well. Furthermore, domestic production is not able to satisfy demand; Albania is therefore, on an average, a net energy importer.

Gas Sector Expansion Strategy for Energy Diversification in Albania
042
[Figure 1-2] TPES by Energy Source, 2018
51%
29%
10% 9%
1%
2.4 Mtoe
1,206 ktoe57%
519 ktoe24%
159 ktoe, 7%
46 ktoe2%
186 ktoe, 9%16 ktoe, 1%
CoalOilGasPrimary ElectricityBiomass
LigniteCrude OilNatural GasElectricityBiomassOthers
Total toes
2,131 ktoe
3.0
2.5
2.0
1.5
1.0
0.5
0
1990
1992
1994
1996
1998
2000
2002
2004
2006
2008
2010
2012
2014
2016
2018
Note: Including heat ; Nuclear (1TWh=0.26 Mtoe), Hydroelectricity and wind (1 TWh = 0.086 Mtoe), Geothermal (1 TWh=0.86 Mtoe).Source: IRENA (2021).
<Table 1-3> Albania TPES per Sector, 2020-2040(Unit: ktoe)
Sector 2013 2020 2025 2030 2035 2040
Households 708 776 803 852 902 956
Services 240 297 323 363 411 452
Industry 475 627 706 907 1,003 1,097
Transport 816 1,081 1,327 1,657 1,864 1,922
Agriculture 122 143 169 212 257 295
Construction & Mining 12 26 43 73 119 192
Total 2,373 2,950 3,370 4,064 4,555 4,914
Source: Gas Master Plan (2016). p.129.
<Table 1-4> Albania TPES per Fuel, 2020-2040(Unit: ktoe)
Fuel 2013 2020 2025 2030 2035 2040
Solid Fuels 93 93 79 41 34 30
Oil Products 1,200 1,424 1,697 2,054 2,302 2,393
Natural Gas 8 242 458 833 1,060 1,371

043
CHAPTER
01Introduction
Fuel 2013 2020 2025 2030 2035 2040
Wood, Biomass 182 255 281 290 287 257
Other 16 18 19 18 18 12
Solar 6 22 31 43 55 99
Hydro Elec. 409 623 769 778 754 755
Imported Elec. 454 252 34 0 0 0
Total 2,367 2,928 3,369 4,057 4,509 4,917
Source: Gas Master Plan (2016). p.133.
Therefore, one of the most important challenges faced by Albania’s future economic development is to increase energy supply according to scale-up of demand, reducing the high level of energy intensity to build an efficient economy that competes in domestic and foreign markets. In summary, the Albanian energy system has the following characteristics:
- High dependence on the import of petroleum by-products - The importance of hydropower in the country's energy balance - Most of the energy consumption from the transport sector - Minimum supply of natural gas from domestic production
[Figure 1-3] Installed Power Capacity, 2018(Unit: MW, %)
Total
2,204 MW
Solar PVCrude OilLarge HydropowerSmall Hydropower
10, 198, 4
192, 9(<10)
1,90486
Source: IRENA (2021). p.18.
<Table 1-4> Continued

Gas Sector Expansion Strategy for Energy Diversification in Albania
044
[Figure 1-4] Distribution of Primary Energy Supply by Demand Sector, 2018(Unit: MW, %)
IndustryTransportResidentlalServicesOther
836 MW40%
190 MW24%
207 MW, 10%
127 MW, 6%
418 MW20%
Source: IRENA (2021). p.22.
Albania’s energy mix has one of the highest shares of renewable energy. The diversification of the country’s electricity sector is critical, as the current system is almost entirely hydro-based and thus susceptible to climatic variations. Hydropower accounts for the largest share of the country’s electricity generation, representing around 95% of the Albania’s installed power capacity. Imports of petroleum products and electricity place a considerable weight on economic growth and the country’s trade deficit.11
[Figure 1-5] Electricity Production, Consumption and Net Imports, 2014-2019(Unit: GWh)
Net domestic production Net ImportsElectrical losses Electricity consumption
-2,000
0
2,000
4,000
6,000
8,000
10,000
2014 2015 2016 2017 2018 2019
Source: IRENA (2021). p.19.
11 International Renewable Energy Agency (IRENA), Renewables Readiness Assessment: The Republic of Albania (Abu Dhabi, UAE, 2021), p. 14.

045
CHAPTER
01Introduction
Challenges associated with establishing and implementing reforms to increase the stability of energy supply include meeting the country's demand for domestically produced crude oil. The self-sufficiency of primary energy sources has decreased from 97% in 1990 to about 41.2% in 2016. Therefore, meeting the energy demand for petroleum by-products is associated with increasing the amount of crude oil not only processed and traded in the country, but also through regional market consolidation and further liberalization.
[Figure 1-6] Net Energy Imports, 2014-2018
Net import (ktoe) Import (ktoe) Export (ktoe) Net Import/TPES
0
600
400
200
800
1,000
1,200
1,400
1,600
1,800
2,000
0
15
10
50
20
25
30
35
40
45
50
ktoe
2014 2015 2016 2017 2018
Net
Impo
rt/T
PES
(%)
32%
12%
23%
46%
24%
Source: International Renewable Energy Agency (IRENA), Renewables Readiness Assessment: The Republic of Albania (Abu Dhabi, UAE: 2021), p. 21.
In addition to these challenges, the Albanian energy system must meet the Renewable Energy Sources (RES) target in 2020, the Energy Efficiency (EE) target for reducing end-use energy, and the National Targeted Contribution’s (NDC) target for the reduction of greenhouse gas (GHG) emissions.
Albania signed the Paris Agreement on April 22, 2016, ushering in a new era in the international climate policy process. In fact, Albania joined the United Nations Framework Convention on Climate Change (UNFCCC) in 1995 and the Kyoto Protocol in 2005. Albania has begun the process of changing its status from a developing country to a developed country in the context of the UNFCCC. This process is an integral part of the European Union's integration process and includes annual Green-House Gas (GHG) monitoring and reporting. It also involves national-level capacity development for the formulation and implementation of policies for GHG mitigation and climate change adaptation, including the transposition and implementation of the European Union acquis on climate change.

Gas Sector Expansion Strategy for Energy Diversification in Albania
046
Albania is among the most vulnerable countries of Southeast Europe to climate change. The government of Albania aims to overcome the energy supply-demand imbalance by following these key strategies and policy measures: diversification of energy sources, precisely through non-hydro renewable energy expansion and gasification.
The National Determined Contribution (NDC) level has been revised to make it more sophisticated for the integration of Energy and Climate Plan that is expected to be fully developed and adopted. In line with the EU 20-20-20 target, Albania introduced a target country contribution within the Paris Agreement process in September 2015 to reduce CO2
emissions compared to the 2016 baseline scenario, targeting a 11.5% decline by 2030.
Meanwhile, the decision of the Ministerial Conference on plans and programs to further reduce greenhouse gas impacts has also been approved.
The Albanian government has taken commendable steps to promote the use of non-hydro renewable energy. In its 2018 National Energy Sector Strategy, Albania stipulated a 42% share of renewable energy in the Total Primary Energy Supply (TPES) by 2030. Also, Albania’s National Renewable Energy Action Plan (NREAP) establishes renewable energy targets for 2020 and forthcoming years. The NREAP is expected to be superseded by the National Energy and Climate Plan (NECP).
The recommendations in the Strategic Goals for Energy Sector Development are combined scenarios embodying the potential to achieve the following outcomes, in many cases exceeding the projected commitments at the national level by 2030:
- Reduction of energy imports by 32% compared to the baseline scenario; - Increase the share of RES in 2030 by 42%; - Reduction of final energy demand by 15.5%, close to the energy efficiency target; - Reduction of GHG emissions by 11.5% compared to the baseline scenario; - Reducing the energy intensity of GDP by 18%; and - Increasing the penetration of natural gas through the TAP (Trans-Adriatic Pipeline)
project in the supply of primary energy sources from 0.36% in 2015, to 19.81% in 2030, focusing on the investment of natural gas infrastructure to serve the electricity sectors and industry in the short run and residential and commercial customers in the long run.
Albania has specific strategic goals for the development of its gas sector. These plans and programs are embodied in the document “National Energy Strategy 2018-2030” (approved

047
CHAPTER
01Introduction
by Ministerial Committee Decision No. 480 dated 31 July 2018 “On Approval of the National Energy Strategy 2018 - 2020,” Official Gazette 119 Issue, 8 September 2018) and “Albania Gas Master Plan,” (approved by Decision No. 87 of the Ministerial Council dated 14 February, 2018 “Confirming Albanian Natural Gas Plan and Priority Projects Regarding Development Approval,” Official Gazette no. 23, dated 20 February 2018). The main goals of the gasification of Albania are as follows:
- Preparation of necessary Albanian legislation for the gas sector in accordance with the European legal framework (regulatory and investment framework credibility);
- Connecting Albania and international gas networks according to the best option (Eurasia Gas Corridor and Energy Community Gas Ring);
- National gas resources and national gas infrastructure development; - Reorganization of existing pipeline system for gas transmission in Albania; - Albanian gas market management; - Using natural gas as an alternative energy source and for the production of electrical
energy using gas-fired power plants; and - Underground gas storage and LNG terminal project development.
3.2. Natural Gas Demand Structure
Albania's current gas market size is one of the smallest in the western Balkan region, with 15 million cubic meters production and consumption in 2015. Domestic production, which has declined sharply since the 90s, is being used to meet domestic consumption, and the amount of energy consumed which is produced by natural gas is currently very small. However, over the next 20 years, the country's total potential gas consumption is expected to reach 1.37 bcm by 2040 and the current domestic reserves will be explored more preferentially to meet future requirements.
<Table 1-5> Potential Natural Gas Consumption by 2040
Division mcm ktoe
Residential Sector 228.8 190.0
Service Sector 267.8 222.5
Industrial Sector Incl. Agriculture and Transport 430.2 357.3
Total for Sectors 926.8 769.8
Anchor Consumers 684.4 568.4
Total 1,611.2 1,338.2
Source: Gas Master Plan (2016). p.130.

Gas Sector Expansion Strategy for Energy Diversification in Albania
048
<Table 1-6> Total Natural Gas Consumption in Albania(Unit: mcm)
Division 2020 2021 2025 2030 2035 2040
Theoretical demand for natural gas regardless of the climate change scenario 1,182 - 1,791 2,193 2,454 2,851
Theoretical demand for natural gas considering the climate change scenario 1,182 - 1,339 1,555 1,799 2,078
Demand based on the development scenario of the Natural Gas Master Plan - 244 - 833 - 1,371
Natural gas demand based on the Gas Promotion scenario”- calculated based on
the LEAP analysis1,182 173 421.81 1150,90 - -
Source: USAID (2018).
Albania is heavily dependent on oil products, such as diesel and heavy oil, as primary sources of energy for the manufacturing industries and transportation. As a signatory to the Energy Community Treaty and the obligation to adopt and implement EU energy law, the country seeks eventual EU membership. EU energy policy is already impacting policymaking and investment decisions in Albania. Decarbonization of the energy sector is a priority in EU’s policy objectives.
Albania’s GDP growth and energy demand growth is among the highest in South East Europe.
[Figure 1-7] Albania’s GDP Growth in 2019 Compared with Countries in South East Europe(Unit: %)
MontenegroRomania
AlbaniaCzech Republic
BulgariaSerbia
HungaryN.Macedonia
SloveniaBosnia & Herzegovina
CroatiaKosovoPoland
SlovakiaAustria
Average: 8.2
10.7 10.4 9.9 9.5 9.1 8.5 8.2 8.0 7.8 7.5 7.2 7.2 7.0 6.26.0
Source: US DoE (2020). p.29.

049
CHAPTER
01Introduction
[Figure 1-8] Albania’s Energy Demand Growth in 2015-2017(Unit: %)
KosovoPoland
MontenegroSlovakia
SerbiaCzech Republic
HungaryRomania
Bosnia & HerzegovinaCroatia
SloveniaAlbaniaAustria
N. MacedoniaBulgaria
6.3 6.3 5.0 4.9 4.3 3.4 3.3 2.7 2.5 2.2 2.0 1.6 1.4 1.21.0 Average: 3.2
Source: US DoE (2020). p.30.
Demand for gas has been high in the Albanian economy. Industrial gas demand growth is particularly high, whereas incumbent diesel prices are significantly higher than other countries in the region.
[Figure 1-9] Albania’s Industrial Gas Demand Growth in 2019(Unit: %)
20.1 11.7 8.6 6.8 6.5 5.8 4.6 4.4 4.1 3.9 3.1 0.5N/AN/A
Average: 6.1-1.3
N. MacedoniaSerbia
Bosnia & HerzegovinaPolandCroatia
AlbaniaHungarySloveniaSlovakia
Czech RepublicAustria
BulgariaKosovo
MontenegroRomania
Source: US DoE (2020). p.31.

Gas Sector Expansion Strategy for Energy Diversification in Albania
050
[Figure 1-10] Albania’s Diesel Prices in 2019(Unit: €)
Average: 1.150
SerbiaAlbania
MontenegroSloveniaSlovakia
Czech RepublicHungaryBulgaria
CroatiaAustria
Bosnia & HerzegovinaRomania
N. MacedoniaKosovoPoland
1.361 1.268 1.250 1.243 1.223 1.190 1.179 1.176 1.160 1.129 1.074 1.021 1.016 1.0000.974
Source: US DoE (2020). p.35.
Industrial gas is consumed in petrochemicals, as feedstock and for process heat. Gas is also used to produce energy in oil and gas extraction, oil refineries, and liquefaction and regasification facilities. Gas is used in other industrial operations, for example, iron and steel, non-metallic minerals (e.g., cement, ceramics, glass, etc.), and food and tobacco.12
Compared to oil, gas can be more competitive; this is evident from the oil-to-gas switching in industries around the world. Industrial areas are a good market for natural gas because high-temperature heat markets do not have compelling options that could displace gas. Although developments along the learning curve could make both hydrogen and bioenergy competitive post 2030.
12 Nikos Tsafos, “How Will Natural Gas Fare in the Energy Transition?” January 14, 2020, https://www.csis.org/analysis/how-will-natu-ral-gas-fare-energy-transition.

051
CHAPTER
01Introduction
[Figure 1-11] Industrial Natural Gas Prices in 2019(Unit: € without taxes, per kWh)
Average: 0.035N/AN/AN/A
Czech RepublicSerbia
Bosnia & HerzegovinaPoland
SlovakiaSlovenia
AustriaN. Macedonia
RomaniaBulgaria
CroatiaHungaryAlbaniaKosovo
Montenegro
0.051 0.039 0.037 0.035 0.034 0.034 0.033 0.032 0.032 0.031 0.0300.029
Source: US DoE (2020). p.35.
[Figure 1-12] Albania’s LPG Prices in 2019(Unit: € per liter with taxes)
Average: 0.538
AustriaHungary
SerbiaSlovenia
MontenegroBosnia & Herzegovina
SlovakiaRomania
KosovoAlbania
Czech RepublicCroatia
N MacedoniaPoland
Bulgaria
0.770 0.641 0.621 0.610 0.597 0.550 0.545 0.540 0.500 0.481 0.470 0.460 0.446 0.4300.409
Source: US DoE (2020). p.35.
The electricity industry is expected to be the largest gas consumer. Forecasted natural gas consumption in refineries and other industrial anchor consumers in 2040 could be around 247 mcm, and future potential natural gas consumption for electricity generation could be around 437 mcm in 2040.

Gas Sector Expansion Strategy for Energy Diversification in Albania
052
[Figure 1-13] Natural Gas Consumption, 2020-2040(Unit: mcm)
0
500
1000
1500
2000
2500
3000
Households Services Transport AgricultureIndustry Anchor consumers Total
2020 2025 2030 2035 2040
661661
737
2922
30320
410
818
3615
38400
571
893
4382047
489
568
2342340
22253244
661661
234234
222222
253253
244244
1,413
1,791
2,193
2,454
2,851
Source: Gas Master Plan (2016). p.34.
The following projects served as inputs for the “Non-binding” Phase of the Market Test in 2019:
<Table 1-7> “Non-Binding” Phase of the Market Test of 2019
Project (PIP) Capacity (mcm) Energy Production (MWh/h) End-user Expected
Commissioning
TPP Vlora 150-450 100-300 TPP Vlora (Gas-to-Power) 2025
PRMS Vlora 250 - SME & Residents 2024
PRMS Fier 250 - SME & Residents 2024
PRMS Korça 250 - SME & Residents 2024
TPP Korça 300 200 TPP Korça (Gas-to-Power) 2026
Source: Albgaz (2021).
In the context of road transportation, gas satisfies 2% of global energy demand, driven by a few countries that have prioritized the deployment of compressed natural gas (CNG) vehicles for passenger cars or short-haul trucks or liquefied natural gas (LNG) for heavy-duty trucks. LNG is increasingly used in heavy-duty trucks for its potential to offer truck fleet operators significant savings in fuel and maintenance costs and reduces GNG emissions,

053
CHAPTER
01Introduction
particulate matter, and oxides of sulfur and nitrogen. In Europe, over 10,000 LNG-fueled trucks are currently operating with more than 4,500 new vehicles registered in 2019. Outside this sector, the use of gas is further limited with a 0.14% market share in “domestic navigation” and a 0.003% share in “world marine bunkers.”
3.3. Gas Supply Structure
In Albania, supply could not keep up with demand. As a consequence, critical consumers of natural gas, such as fertilizer plants and power plants, have shut down due to the unavailability of gas. Increased gas demand especially from power generation and industrial sectors is expected if a long-term gas supply is secured.
[Figure 1-14] Gas Supply Growth in 2015-2017(Unit: %)
N. MacedoniaAlbania
SerbiaCroatia
Bosnia & HerzegovinaPolandAustria
RomaniaHungaryBulgariaSlovenia
Czech RepublicSlovakia
KosovoMontenegro Average: 8.6
17.1 10.0 9.4 6.3 5.3 4.4 3.9 3.3 3.2 3.2 1.7 1.7N/AN/A
42.1
Source: US DoE (2020). p.32.

Gas Sector Expansion Strategy for Energy Diversification in Albania
054
[Figure 1-15] Natural Gas Use Growth in Power Generation, 2015-2017(Unit: %)
-6.4- 16.5
112.8N. MacedoniaCroatiaSerbia
PolandCzech Republic
HungaryAustria
RomaniaSloveniaBulgariaAlbaniaKosovo
MontenegroSlovakia
Bosnia & Herzegovina Average: 23.9
60.758.7
25.6 18.3 12.3 9.0 6.6 4.6 1.5N/AN/AN/A
Source: US DoE (2020). p.33.
3.3.1. Domestic Resources
Commercial production and consumption of natural gas in Albania began in the 1960s. By the end of 2005 approximately 3.5 bcm of natural gas was produced from gas fields. Additional 9.8 bcm of natural gas was extracted from oil fields in the form of associated gas. As a result, a total of 13.3 bcm of natural gas was produced in Albania. Therefore, there has been an imbalance between gas supply and demand in Albania since the 2000s.
[Figure 1-16] Dry Natural Gas Production of Albania(Unit: Billion Cubic Feet)
Min=0.40 (2007); Max=25.00 (1988)25.0023.3621.7220.0818.4416.8015.1613.5211.8810.24
8.606.965.323.682.040.40
1980 1985 1990 1995 2000 2005 2010
Source: Titi Tudorancea (2021).

055
CHAPTER
01Introduction
In 2018, Albania’s gas production totaled about 91.807.5 million cubic meters of associated gas through oil production from existing oil fields. Albania's gas production in 2019 equaled 80.047.51 million cubic meters of associated gas, an almost negligible amount used only for technological processes in the oil industry
[Figure 1-17] Gas Production in Albania, 2009-2018(Unit: ktoe)
0
10,000
20,000
30,000
40,000
50,000
60,000
201420132012201120102009 2015 2016 2017 2018
Source: NANR (2019).
To provide gas to the Albanian economy and increase the contribution of this energy source to the diversification of energy sources, it is extremely important to evaluate the opportunities to increase domestic gas production from existing sources (especially the opportunities provided by gas condensate of Delvinë gas field) as well as new discoveries (for example, the discovery of the SHELL company in the Shpirag-Block 2 structure at a depth of 5,000 to 6,000 m). In 2014, SHELL Int. & Petromanas announced the discovery of a new well in Shpiragu-2. Gas was successfully extracted in the 3-day test for this well. 220-330 tons/day of oil (37 degrees API); Gas 80000 -100000 cm / day. Drilling of the Shpiragu-4 well in 2019 confirmed great interest in the structure of Shpiragu. The Shell company continues to drill other wells.
Although the country's production is low and few reserves have been economically explored to meet potential gas demand, Albania can play a key role in the development and deployment of its regional network, leveraging its geographic location within the western Balkans region. Albania's connection to the regional gas network will have a positive impact on improving the country's energy situation and the proportion of energy use.
In fact, Albania's existing gas pipeline network has a total length of 498 km, which connects all existing operating gas fields that have almost been depleted. In any case, the

Gas Sector Expansion Strategy for Energy Diversification in Albania
056
existing gas networks are in poor technical condition, since most of these gas networks are unused and only a few are used for gas transport, but the pressure is low.
3.3.2. Pipeline Imports
The development of national and regional grid infrastructure gives Albania more options to build its natural gas supply portfolio, expanding its role as a trading hub in the region. Any investment in gas transmission and distribution networks is driven by the demand for natural gas by all the industries of a country. Therefore, the consolidation of the pipeline infrastructure will ensure the distribution of gas in the domestic market and strengthen the national economy.
Natural gas via pipelines are primarily being built to be linked to various power plants. However, demographic characteristics of Albanian settlements are unfavorable for the development of a unified gas distribution network. Albania has a relatively large number of settlements (approx. 3,000) with a relatively small number of inhabitants per settlement.13 It has been forecasted that in 2040, natural gas consumption will reach 470 mcm and represent 21% of total Albania, while the growth rate is higher for urban areas.
Additional gas supply is required to displace diesel and heavy fuel-oil for sectors of the economy that cannot be served through the existing pipeline infrastructure. Further, new pipeline investments will be too expensive given the scale of demand in these remote regions. Consequently, small-scale LNG could address this market.
3.3.3. LNG Imports
A modern natural gas liquefaction operation includes a suite of trains, each of which takes a certain volume of natural gas and converts it into LNG. The capacity of a typical liquefaction train ranges from 3 to 8 MTPA, which amounts to 4 to 10 bcm per year. Growing technology and capital project innovation has led to the emergence of mid-scale LNG trains. Mid-scale LNG trains are fewer than large-scale or, even smaller-scale LNG plants, but are receiving increasing attention. Mid-scale LNG plants typically possess trains with the capacity of 1 to 2 MTPA, which translates to 100 to 300 Million standard cubic feet per day (MMCFD). Small-scale LNG, which includes mini, micro, and containerized LNG segments focuses on serving specific end-use markets including heavy-duty trucking, rail, marine, peak shaving power, and industrial activities.14
13 Gas Master Plan for Albania & Project Identification Plan, Gas Infrastructure Master Plan, Nov. 2016, p. 34. 14 US Department of Energy, Opportunities for Small-Scale LNG in Central & Eastern Europe (2020), p. 23.

057
CHAPTER
01Introduction
Mini- or micro-plants are typically much smaller at less than 0.2 MTPA. Finally, LNG can also be shipped in ISO containers with a typical volume of 10,000 gallons. Containerized LNG is being used in small industrial plants, farming activities, and road paving, as well as power generation in small, remote communities.
In addition to the planned LNG terminals in the SEE and Balkans (FSRU LNG terminals in KrK Island, Croatia and FSRU LNG terminals in Alexandropolis, Greece), Albania offers interesting assessment options for the projected growth and role of domestic demand. Balkan hub within the broader energy interconnection framework is being implemented with the launch of the TAP pipeline. Albania is expected to play a key role in this development.
To enhance energy security within the European energy community, and also through the diversification of import routes and the realization of energy interconnections between regions, the current trend in the EU is to promote the realization of Floating Storage Regasification Unit (FSRU) LNG terminals. That is, the Krk and Alexandroupolis terminals and the suspended Eagle LNG project in Albania—this is considered as a “fast route” to open up the energy market for natural gas. Time required for construction is significantly reduced, costs are significantly lower than similarly sized land-based alternatives, and these generally have less local opposition than new land-based terminals. FSRUs can be reused and installed in new locations, demonstrating greater flexibility in terms of location and usage.
However, the FSRU LNG facility has hitherto been conceived as a large-scale terminal with a nominal capacity exceeding the natural gas requirements of the SEE and Balkans. Considering the future energy demand prospects after the global pandemic, large-scale development ideas and terminals for importing LNG do not appear to be realistic, and scenarios for new import facilities require adjustment to meet emerging requirements.
By analyzing the potential evolution of natural gas in Albania, this Balkan country (similar to most Southeast European countries) has established large pipelines to supply gas to the region, such as relatively small-scale interconnectors and regional distribution systems. Villages and districts are not served by this distribution systems as they are connected to the already existing major cross-border pipelines and LNG import terminals.
The Eagle LNG terminal is one of the first projects to establish an offshore LNG facility in Albania, which was discussed by Albanian and EU authorities a decade ago. Eagle LNG is envisioned as a floating FSRU vessel for the import and regasification of LNG located off the coast of Albania, near Fier, with a nominal capacity of 3-8 bcm/y which can be increased to 12 bcm/y.

Gas Sector Expansion Strategy for Energy Diversification in Albania
058
In addition to the purpose of meeting Albanian domestic demand and other Balkan countries through interconnecting pipelines, Eagle LNG aims to establish new and alternative gas import routes to the EU market. In fact, the original project planned to construct a subsea gas pipeline with a capacity of 10 bcm per year, spread across 110 km from Levan, Albania to Brindisi, Italy. The Italian group Falcione signed a licensing agreement with the Albanian government in 2008 for the construction and operation of an LNG regasification terminal near southern Levan and an offshore gas pipeline to Italy.
When the project was elaborated (13 years ago), the Albanian government planned to deliver volumes of natural gas to the Thermal Power Plant in Vlora and industrial facilities located in the prospective Industrial Park of Elbasan, since they are the two main relevant anchor-consumers. The Eagle LNG project has been selected by the EU Commission and Energy Community as a “Project of Energy Community Interest” and is included in ENTSOG Ten Year Network Development Plan.
Given the new energy scenario, the promotion of small-scale LNG (SSLNG) appears to be the best cost-effective option to plan a potential LNG facility in Albania. According to the International Gas Union (IGU) criteria, SSLNG is defined as any facility with a liquefaction and regasification capacity of 0.05–1.0 million tons per annum (mtpa) and vessels with a capacity of 60,000 cubic meters (m3) or less.15
SSLNG has the advantages of lower initial investment costs compared to conventional LNG. Meaning, supplies can come online in a relatively short period of time, and it is flexible in terms of logistics and operation unlike pipeline supply.
SSLNG could be the best option for Balkan countries to meet their environmental targets of reducing carbon footprint in their energy system and satisfy their relatively small demand for natural gas.
A significant impetus to develop a SSLNG facility along the Albanian coast will be the introduction of regulations on marine fuels by the International Maritime Organisation (IMO). This will further boost LNG’s use as fuel for marine vessels. In January 2020 IMO implemented a new regulation for a 0.50% global sulfur cap for marine fuels through “IMO 2020.” In comparison to oil-based fuels, LNG produces negligible sulfur and significantly lower nitrogen emission when used as a fuel.
15 International Gas Union, “2018 World LNG Report: 27th World Gas Conference Edition,” https://www.igu.org/sites/default/files/node-document-field_file/IGU_LNG_2018_0.pdf.

059
CHAPTER
01Introduction
Despite a slow uptake of LNG-fueled vessels, it is expected that over time the LNG industry will gain from IMO 2020 and the Sulphur Directive, in the context of increasing LNG bunkering (i.e., small-scale loading) activities of European LNG import terminals.
Given its geographic strategic location as maritime gateway of the Adriatic Sea toward Northeastern Italy and then Central Europe, Albania could become an LNG-refuel hub for trade boats, navy vessels, and oil tankers which cross the Adriatic Sea to reach several important ports (Venice, Ancona, Split, Bar).
Offering small-scale services, such as marine bunkering, will be the key to ensure the success of a potential SSLNG terminal in Albania, provided that the Krk LNG terminal does not provide small-scale services in the near future, which would be necessary to make LNG available for road and marine transportation.16
Adopting new vehicles and ships using LNG and the construction of fueling facilities in strategic routes and locations will be key determinants to ensure the use of LNG in the transportation sector.
To promote the use of SSLNG as a fuel for land transportation in natural gas-fired vehicle, Albanian government has to adopt specific policies, actions, and initiatives to favor the spread of natural gas vehicles (NGVs), including Compressed Natural Gas (CNG) fueled vehicles, through economic incentives to buy them or in terms of fuel prices. Further, the government could rally for the conversion of diesel vehicles to CNG vehicles, which would eliminate the price sensitivity of diesel and drive down transport costs. One of the ongoing projects is the conversion of buses from diesel to LNG and CNG in Tirana.17
From a SSLNG regasification terminal, natural gas could shipped and distributed to small-scale gas-fired power plants, city gas distribution networks, or end-use demand sites to fuel vehicles or vessels through short land pipelines or trucks.
When SSLNG is used to supply natural gas in the residential sector, LNG is transported by trucks to satellite receiving terminals and re-gasified to be supplied to customers by city gas pipeline network. Since energy supply to the residential sector is highly cost sensitive, it will be very difficult to economically supply gas through SSLNG for the residential sector in emerging economies that do not have similar infrastructural advantages.18 This could
16 United States Energy Association, “Opportunities for Small-Svale LNG in Central and Eastern Europe,”USEA, December 2020, pp. 55, 64, https://usea.org/sites/default/files/event/2020%20CEE%20SS%20LNG %20Report%20vfs.pdf55,64.
17 United States Energy Association, “Opportunities for Small-Scale LNG in Central and Eastern Europe,” p. 43.18 APEC Energy Working Group, “Small-scale LNG in Asia-Pacific,” September 2019, pp. 3, 31-32, https://www.apec.org/Publica-

Gas Sector Expansion Strategy for Energy Diversification in Albania
060
be the case for Albania, considering that the expected growth of natural gas in residential sectors will be the highest compared to the other sectors. However, tailored governmental policies that promote the use of natural gas to meet environmental targets could represent an opportunity for SSLNG in the residential sector.
Another reason for the growing interest in SSLNG is the improvement of its relative economic efficiency. Unlike in Asia, the price of natural gas in Europe and the United States is determined by the balance of supply and demand. In markets where LNG prices are based on price benchmarks determined by gas-to-gas competition which is disassociated from crude oil prices, LNG can be highly competitive compared to petroleum products. For instance, if natural gas continues to be cheaper than some petroleum products and the price difference between crude oil and natural gas expands over the long term, more investment on infrastructure to substitute petroleum products would be expected.19
In terms of the security of LNG supply, Albania can benefit from a long-term relation with the United States by the virtue of its NATO membership since 2009.– The United States has recently become an LNG exporter and plans to increase its supply to the EU, especially after the meeting between EU’s Jean- Claude Juncker and President Trump.. By early 2020, the EU had imported more than 24 bcm of LNG from the United States since April 2016,20 and since mid-2018, the United States LNG exports to Europe have risen by nearly 600%.21
Both for geopolitical and economic reasons, the United States is interested to promote new LNG terminal in Albania, mainly the SSLNG option which appeared to be more suitable and tailored for Tirana government’s and the Balkan countries’ energy needs. The United States Assistant Secretary for Fossil Energy, Steven Winberg, expressly supported this possibility during his speech at the Small-Scale LNG Deployment in Central and Eastern Workshop in Tirana.22
Small-scale LNG can play a critical role in the dubbed “virtual pipelines” which will allow the connection of a global LNG market with Albanian gas demand without physically building a pipeline but using trucks to deliver the gas in containers from a distribution point to customers in Albania and possibly Kosovo.
tions/2019/09/Small-scale-LNG-in-Asia-Pacific.19 Ibid, p .5. 20 European Commission, EU-US LNG trade, https://ec.europa.eu/energy/sites/ener/files/eu-us_lng_trade_folder.pdf.21 US Department of Energy, Small-Scale LNG Deployment in Central and Eastern Europe Workshop February 6, 2020, https://www.
energy.gov/fe/articles/small-scale-lng-deployment-central-and-eastern-europe-workshop.22 Ibid.

061
CHAPTER
01Introduction
3.4. Gas Market Development
For access to regional and European gas infrastructure, the Albanian government and responsible agencies have prepared all the necessary legal acts and infrastructural investments to achieve access.
Albania was one of the first contracting parties/countries to successfully transition to the Third Energy Package in 2015. Market opening measures and cross-border market integration as part of this package are important steps toward regional/European energy markets. Investments in new energy sources and infrastructure will help Albania's energy sector to continue its transformation into a more competitive market as it adapts to the initiatives and goals of the Third Energy Package.
The most notable progress has been made in the process of building an organized electricity market. While the electricity sector is among the first to transition to a third energy package, it is dominated by quantum trading for large customers, while other customers and retail markets are regulated. In particular, financial segregation is underway, and the positive aspects of TSO ownership segregation were adopted into the 2016 law.
Like mentioned before, Albania has a specific strategic plan for the development of the hydrocarbon sector, especially the natural gas sector. A cornerstone of energy source diversification through the development of the gas sector is the availability of the option to operate the Trans Adriatic Pipeline (TAP project) by the end of 2020 in correspondence with the consolidation activities of the Albanian public gas company Albgaz SA.
In September 2015, Albania adopted a new law for the natural gas sector, which transposes provisions from the Third Energy Package. In December 2016, the Albanian government decided to separate the gas activities from existing public oil and gas company ALBPETROL, creating a new public company, Albgaz as a combined organization for transmission and distribution. According to the 2009/73 / EC directive and Albanian law on the gas sector, each gas TSO will be separated from other activities, including the division in terms of ownership.
According to these plans and programs, Albania will play a specific institutional role in providing a key link and completing an energy node connecting Italy, Central Europe, and the Balkans. The vision of the Albanian government is to serve as an energy transport conduit for all forms of electricity, natural gas, and oil, facilitating the economic development, moving through Europe by sea and overland gas pipelines. Owing to its geographical location, Albania is in a position to share its newly acquired energy sources with its neighbors in Southeast

Gas Sector Expansion Strategy for Energy Diversification in Albania
062
Europe through the development of energy circulation networks.
As the TAP pipeline is already operational, it is essential to enhance oil and gas exploration and production in Albania and offshore, including drafting an integrated strategic plan for the oil and gas sub-sectors of the entire economy.
Naturally, in this context, the national strategy for the oil and gas sector includes:
- The establishment of basic standards that adequately define Albania's current position in the development of the region's oil and gas sector.
- Define a set of development goals to be achieved in 2030 and beyond 2040. - Develop detailed plans for implementing each component of the strategic plan. - Policies and institutions with the necessary technical, legal, regulatory, and regulatory
compliance elements to effectively manage the economic development of national hydrocarbon resources.
4. South-East Europe (SEE) Gas Supply and Demand
Integration with SEE’s regional energy markets will be a crucial for Albania to satisfy its growing energy demand. Investing in new energy sources and corresponding infrastructure will facilitate the integration of the Albanian energy sector toward a more competitive regional energy market.
[Figure 1-18] South-East Europe Geography
RomaniaSloveniaCroatia
Bosnia &Herzegovina
Montenegro
Serbia
Rep ofNorthMacedonia
Bulgaria
Greece
Albania
Kosovo
0 100 200 300 km
Note: Gas demand 2016 (bcm): Romania 11.5, Bulgaria 3.2, Greece 3.8, Croatia 2.6, Slovenia 0.9, Serbia 0.5, Montenegro 0, Rep of North Macedonia 0.2, Bosnia & Herzegovina 0.2, Kosovo 0, Albania 0.
Source: Julian Bowden (2019).

063
CHAPTER
01Introduction
Much of Southeast Europe has limited access to gas and particularly diversified supplies.23 The western Balkan region can be described as comprising fragmented gas markets, each with a self-regulating environment, and individual markets with little competitive cross-border trading. Originally created to fulfil domestic needs, these markets in their present form, are an obstacle to the achievement of a regional market environment without significant reforms and additional investment in infrastructure. In addition, the gas sector in Montenegro, Kosovo, and Albania is not completely developed and includes a very small non-commercial gas market.
The region’s total demand is around 25 bcm. Apart from Romania, which has been producing gas for over one hundred years, gas in the rest of the region has developed through imports, mostly from Russia. It has long been a transit region for Russian gas. Russian gas enters the region from Ukraine and then passes through the Trans Balkan Pipeline system from Romania to Bulgaria, Greece, Turkey and the Republic of North Macedonia.24
[Figure 1-19] Russia’s New Gas Pipelines in South Eastern Europe
Linking TurkStream to the European networkFrom Russia
Italy
Black Sea
Hungary
Romania
Ukraine
SerbiaBulgaria
Albania Kiyikoy
TurkeyInterconnector Turkey-Greece-Italy
TurkStream
InterconnectorGreece-Bulgaria
Russia
Black Sea
South Stream Lite
Banatski Dvor storage facility
Baumgarten
Greece
TAPExistingUnder constructionPlanned
Source: GIS (2018).
Before COVID-19, the European natural gas demand had been expected to remain more or less stable and stagnant till 2030. However, the European domestic gas production will continue to decline. Consequently, the EU’s demand for gas import and import dependence
23 United Nations Economic Commission for Europe (UNECE), The Potential for Natural Gas to Penetrate New Markets, (Geneva, 2020), p. 3. United Nations Economic Commission for Europe (UNECE), How Natural Gas Can Displace Competing Fuel, (Geneva, 2019).
24 Julian Bowden, “SE Europe gas markets: towards integration,” OIES Paper Ng. 150 (2019), Oxford Institute for Energy Studies, p. 1.

Gas Sector Expansion Strategy for Energy Diversification in Albania
064
for natural gas will increase at least until 2025/2030. While today around 72% of the EU gas demand is fulfilled through imports, this share could increase to more than 80% by 2030.
In contrast to the EU’s gas import diversification efforts, Russian pipeline supplies have further increased and covered 43% of the EU’s total net-gas imports of 326 bcm in 2020, albeit the import volume decreased from 358 bcm in 2019. If pipeline and LNG imports are considered together in the fourth quarter of 2020, the Russian share accounted for 53% (49% pipeline and 4% LNG) according to the newest official EU statistics.25
More than half of the Russian gas was supplied via a single route, that is, the Ukrainian pipeline transmission system. Given the relevance of natural gas for the European energy system on the one hand and the tensions between the EU, Russia, and Ukraine on the other, one main goal of the EU is to diversify its supply sources and supply routes. Consequently, the EU has financed infrastructural projects like LNG import terminals or import pipelines such as the Southern Gas Corridor to incentivize the market entry of potential new suppliers. Furthermore, the EU has supported infrastructure projects within Europe to promote the integration of an EU internal gas market which facilitates exchange of natural gas between the member states that were considered as national “gas islands” with no or one gas pipeline connection to their neighboring countries such as the Baltic states and South Eastern Europe.
Europe’s gas supply security and import diversification have enhanced significantly since the completion and operationalization of TAP in December 2020, along with the Krk-LNG import terminal (with a capacity of 1.3 bcm/y), . This can potentially reduce Russia’s gas pipeline imports in South Eastern Europe in the forthcoming years and decades. In contrast to the original estimates, the total estimated costs of US $44.6 bn, the SGC was constructed in just US $33 bn.26
Since 2018, Turkey has been the EU's main transit state for gas supplies to Europe, after Ukraine, by importing gas from Azerbaijan via the newly built TANAP and extending TAP gas pipeline. The following four gas pipelines are significant:
- South Caucasus Pipeline (SCP): from the Azerbaijani Shah Deniz gas field to the territories of Azerbaijan, Georgia, and Turkey to connect to TANAP.
- Trans-Anatolian Pipeline (TANAP): began operation in June 2018 with a capacity of 16 bcm/y (originally planned to be 16 bcm/y; by 2023 the capacity is already to be
25 See European Commission, Quarterly Report on European Gas Markets, p. 11.26 Ariel Cohen, “Bad News for Russia as Gas from Azerbaijan now Flows to Western Europe,” Forbes, 6 January 2021. Shahmar Hajiev,
“The News You Possibly Missed: TAP Pipeline up and Running,” Euractiv.com (please include the URL instead), 19 November 2020. Richard L. Morningstar et al., “Rapid Response: The Southern Gas Corridor Opens Today,” Atlantic Council, (31 December 2020).

065
CHAPTER
01Introduction
expanded to 23 bcm/y). - Trans-Adriatic Pipeline (TAP): began operation at the end of December 2020 with a
capacity of 10 bcm/y. - Russia’s Turk Stream pipeline: the first pipeline was built and has been operational
since January 2020 with a capacity of 15.75 bcm/y and a second one is in the process of being built with the same capacity.
[Figure 1-20] TANAP-TAP-SCP Pipeline-Network
Elements of the Southern Gas Corridor
Russia
TurkeyGreece
Italy
Kazakhstan
Azerbaijan
Iran
Turkmenistan
Shah Deniz
CaspianSea
Black Sea
Mediterranean Sea
TurkeyTAP 10 bcm/yUnder construction, expected 2020 Increasing to 20 bcm/y
TANAP16 bcm/yOperationalIncreasing to 23 bcm/y in 2023
South Caucasus Pipeline25 bcm/yOperational
Trans-Caspian Pipeline30 bcm/yPlanned
Source: GIS (2018).
Europe identifies an important opportunity to meet its energy needs by developing the Southern gas corridor, which include the supply of gas from the Caspian area (including Azerbaijan and Turkmenistan, Kazakhstan and Iran, in the future) and possibly from the Middle East (e.g., Iraq). SEE countries (e.g., Greece, Croatia, Bulgaria, Romania, Turkey, and Serbia) have well established gas markets, with supplies coming primarily through imports from Russia. In the case of Turkey, gas is imported from Iran and Azerbaijan. Greece and Turkey, which have LNG terminals, also import from Algeria, Nigeria, Qatar, and other LNG suppliers. Croatia and Romania satisfy their demand through domestic production while the share of domestic gas is lesser Bulgaria, Serbia, and Turkey.
Even though the Balkan states collectively represent rather small energy markets, they are crucial for energy policy and energy security in Europe. Given the stakes for achieving energy security, the Balkan states, due to their geographical location and proximity to energy

Gas Sector Expansion Strategy for Energy Diversification in Albania
066
suppliers play an outsized role in affecting the security of European states both individually and collectively. Consequently, they are witness to the constant large-scale East-West strategic rivalry. Therefore, any Balkan crisis or challenge reverberates across Europe and the Atlantic Ocean. The Balkan states are a critical linchpin in the European energy system where pipelines, especially gas pipelines, traverse multiple jurisdictions. They have become an epicenter of the confrontation between Moscow and the West (i.e., the United States, its NATO allies, and the EU). The attempted Russian coups in Montenegro and the Republic of North Macedonia (previously called Macedonia) illustrate this point.27
With the operationalization of the KrK island LNG terminal and TAP line, transfer of gas from Azerbaijan to Bulgaria and from Russia’s TurkStream project through Bulgaria to Serbia and Hungary depict a picture of intense and overt East-West gas rivalry. This is because the KrK Island terminal challenges Gazprom’s monopoly in the Balkan region. While Bulgaria’s government is pretending that buying Azeri gas qualifies as full diversification of gas supply, it is still covertly tied to the TurkStream and its so called Turkstream 2 branch through Bulgaria to Serbia.28 The Krk Island terminal challenges that monopoly in Croatia, Hungary, and Ukraine, which are relatively large markets of the Gazprom. Croatia was supplied with the United States LNG through a tanker which was further modified pumped into the EU-linked Croatian distribution network. Therefore, this marked a Croatia’ leap toward diversification since hitherto, it had been using Gazprom to fulfill its demand.29 The nation can now also export gas to Hungary, Ukraine, and other countries.30
Thus, the Russian energy giant is exposed to serious competition in Croatia, which exerts pressure on gas prices in Croatia since a considerable part of the Krk terminal gas will most likely be exported. It is believed that Hungary will get the bulk of gas from there, and Ukraine is considered as a potential customer. The completion of a Balkan Stream pipeline stretches from the Turkish border across Bulgaria to Serbia which is an intermediate measures to eventually extend the pipeline to Hungary. However, it is unlikely to materialize before 2022. Until then, Gazprom will be supplying Hungary via a transit route across
27 “Russian Spies Found Guilty Of Montenegro Coup Attempt,” https://www.aljazeera.com/news/2019/5/9/russian-spies-found-guilty-of-montenegro-coup-attempt, May 9, 2019; Frieda Ghitis, “Russia Tries to Tip the Scales in the Fight Over Macedonia’s Future,” https://www.worldpoliticsreview.com/articles/26241/russia-tries-to-tip-the-scales-in-the-fight-over-macedonia-s-future, October 4, 2018.
28 “Russia Evades US Sanctions On TurkStream Using Proxy Companies,” https://csd.bg/blog/blogpost/2020/10/19/russia-evades-us-sanctions-on-turkstream-using-proxy-companies/, October 19, 2020.; “Russian Companies Subcontracted for Bulgarian Section of Turk Stream to Expedite Its Completion,” https://www.rwradvisory.com/russian-companies-subcontracted-for-bulgarian-sec-tion-of-turk-stream-to-expedite-its-completion/, August 11, 2020.; Ivalo Stanchev, “How Russia took over the gas pipeline and 3 Bil-lion Bulgarian Lev , (In Bulgarian), https://www.capital.bg/biznes/energetika/2020/10/16/4127009_kak_rusiia_si_vze_gazoprovoda_i_3_mlrd_leva/?ref=header-theme, October 16, 2020.
29 Richard Grenell, Carla Sands, Gordon Sondland, “Opinion: Europe Must Retain Control of Its Energy Security,” https://www.dw.com/en/opinion-europe-must-retain-control-of-its-energy-security/a-47399924, February 7, 2019.
30 Andrey Gurkov, “Gazprom Loses Gas Monopoly As Southeast European Market Advances,” https://www.dw.com/en/gazprom-los-es-gas-monopoly-as-southeast-european-market-advances/a-56173827, January 8, 2021.

067
CHAPTER
01Introduction
Ukraine. According to Croatia Week, the LNG terminal near Krk is completely booked for the next three years, with sizeable orders extending into 2035. It will make the terminal a long-term and sought-after competitor, even though re-gasified LNG is usually more expensive than pipeline gas.31
Russia's South Stream pipeline has been replaced by another pipeline, that is, Turk Stream.32 The first strand of the Russian Turk Stream pipeline began commercial operation in January 2020. Originally, Moscow wanted to build four pipelines from Turk-Stream with a total capacity of 63 bcm per year (bcm/y). However, in 2014, Gazprom only commissioned the construction of a Turk Stream gas pipeline with a capacity of 15.75 bcm/y. Nonetheless, it replaces the existing Trans-Balkan gas pipeline with a present capacity of 16 bcm/y, which is used by Turkey to import Russian gas via Ukraine, Moldova, Romania, and Bulgaria.
Turk Stream's first pipeline supplies only gas to the Turkish market and replaces the Trans-Balkan Pipeline (TBP) with a total capacity of 27 bcm/y. The second Turk Stream pipeline was scheduled to begin operation in 2021 (originally scheduled to be completed in early 2020 before the end of the Russian gas transit agreement with Ukraine) which would replace the TBP completely. However, the Turk Stream Pipeline (such as Nord Stream-2) is subject to the United States’ sanctions, so the completion of the second pipeline in 2021 remains ambiguous.33
Of the previous TANAP capacity of 16 bcm/y, Turkey is allowed to consume 6 bcm/y in accor dance with the contract, while 10 bcm/y must be forwarded to Greece. Gas from Azerbaijan will be transported to Italy via Albania through the TAP link pipeline in the Mediterranean with a capacity of 10 bcm/y. However, currently, 8 bcm/y are supplied to Italy, 1 bcm/y to Bulgaria, and 1 bcm/y to Greece.
Unlike some regional states, such as Bulgaria, Hungary, Serbia, Greece, and Macedonia, that have supported the Russian Turk Stream pipeline project, the European Commission has repeatedly expressed reservations about the Turk Stream pipeline from the outset (as with South Stream). This applies in particular to the construction of a third and fourth pipeline, which could jeopardize the EU’s gas diversification project by strengthening Russia’s positions in SEE both economically and geopolitically. This corresponds with concerns over Russia’s proposal to build a South Stream-Lite pipeline from the Turkish-Bulgarian border to Baumgarten (Austria) or Hungary, which would distribute larger Turk
31 Ibid.32 See also Gina Cohen, “Natural Gas Import and Export Routes in South-East Europe and Turkey,” 2019.33 See also Aura Sabadus, “TurkStream Disruption: Turkey, Greece can become new Gas Hubs,” Energypost.eu (Please include the URL
isntead), 15 October 2019.

Gas Sector Expansion Strategy for Energy Diversification in Albania
068
Stream gas supplies throughout south-eastern Europe.34 The course of this pipeline would be largely identical to the previous South Stream pipeline which was rejected by the European Commission.
Russia has also proposed the construction of a Turkey-Greece-Italy/ITGI interconnector (also known as the "Poseidon" project). This is clearly directed against other EU regional pipeline plans, such as the Bulgaria-Romania-Hungary-Austria (BRUA) and Eastring pipelines, which have been established to enable a better diversification of non-Russian gas supplies throughout SEE.35
The construction of all four Turk Stream gas pipelines would threaten Turkey's ambition to establish its own gas hub, as the pipelines would carry up to 47 bcm/y to the Turkish-Greek border. However, this could cause significant barriers for the Turkish-Greek gas infrastructure system, as 10 bcm of Azerbaijani gas is transported to Europe through the same regional gas infrastructure (via the TANAP-TAP gas network).
Thus, the Kremlin could significantly influence Turkey's energy policy orientations and Azerbaijani gas supplies to Europe via Turkey.
Therefore, there is considerable scope for the development of the gas market in Southeast Europe. Certain opportunities also exist in Northern and Western Europe, but the intensity of the debate over climate change in those regions makes it much harder to assess the extent of further penetration in already developed markets.
The development of small-scale on-shore and floating LNG regasification terminals will facilitate the emergence of new markets for gas, notably in the western Balkan region, especially if it is accompanied with the development or expansion of regional pipelines.36
There are plans to establish new LNG import terminals in the region which will make LNG an important player in the market. Two FSRU (Floating Storage and Regasification Units) are supposed to be constructed in Kavala and Alexandroupolis in Northern Greece and one in Croatia on the Krk Island, to supply gas to the Greek, Bulgarian, and Turkish natural gas systems. In addition to Azeri gas, TAP could be used to transport North African gas to Southern Europe and Turkey through reverse flow. Greece and Bulgaria, and Bulgaria
34 See Silvia Favasuli, “South Stream Lite likely to Terminate in Hungary,” Natural Gas Daily, August 31, 2018.35 See John Roberts, “Three Pipelines and Three Seas. BRUA, TAP, the IAP and Gasification in Southeast Europe,” Atlantic Council, Wash-
ington D.C., September 2018; Silvia Favasuli, “BRUA Uncertainty Tests Exxon and OMV’s Patience,” Natural Gas Daily, September 5, 2018.
36 Bowden, op. cit., p. 2.

069
CHAPTER
01Introduction
to Turkey will also be connected via new interconnector pipelines. Its immediate result is the availability of gas for trading outside long-term contracts. Consequently, the establishment of a natural gas trading hub to enable trading between Greece, Bulgaria, and Turkey, will ensure the determination of market prices through the exchange of marginal gas volumes.
The European gas market has become more competitive as LNG vies to replace the declining local production from the North Sea and the Netherlands. Gazprom estimated that in 2019, its share of the European market was 35.5% compared to around 37% in 2018. The company’s domestic rival, Novatek PJSC, is also expanding its LNG sales in Europe. However, not all countries are equally dependent on Russian imports. Gazprom remains the traditional key supplier for Finland, Latvia, Belarus, and the Balkan countries. Western Europe gets gas from a wider range of sources, including Norway, Qatar, African nations, and Trinidad. Furthermore, more nations, from Germany to Croatia, are seeking to build LNG import terminals to accept shipments from around the world.
In November 2018, Presidents Recep Tayyip Erdogan and Vladimir Putin inaugurated the operation of the first leg of the Turkish Stream. Also called TurkStream, it consists of an undersea pipeline spanning 930 km (578 miles) from the Russian Black Sea coast to Kiyikoy, west of Istanbul. It will carry 15.75 bcm of Russian gas in a year to Turkey for domestic consumption. The second leg of TurkStream, slated for construction, is designed to carry the same amount into SEE through Bulgaria, Serbia, and Hungary, further cementing the region’s dependence on Russian gas. TurkStream and its northern equivalent Nord Stream 2 are game-changers for Moscow because they enable Gazprom, which is Russia’s majority state-owned energy company, to bypass Ukraine as a conduit for funneling Russian gas into Europe.
Washington has opposed both the pipeline projects. Russia already claims 40% of the EU’s gas market. In fact, TurkStream and Nord Stream 2 are designed to strengthen and possibly expand Russia’s foothold.
As competitive as the Russian gas is in Europe, it maintains complete monopoly in the Balkan region. –Greece, which is a exception in the region, could play a pivotal role in breaking Moscow’s hold over the market. Greece’s gas transmission system operator, DESFA, has just finished expanding its LNG terminal—the only one in southeast Europe—and is building compressors that will allow it to pump gas north into Bulgaria via the Soviet-era Trans-Balkan Pipeline that was designed to bring Russian gas south. This means Greece will be able to export the United States LNG to the Balkan region. Starting on a small scale in 2019, those exports are poised to expand massively with the development of a new DESFA pipeline, that is, the Gas Interconnector Greece-Bulgaria (IGB), which is scheduled to go begin in 2020.

Gas Sector Expansion Strategy for Energy Diversification in Albania
070
Another pipeline project, the Trans Adriatic Pipeline, is expected to start pumping natural gas from Azerbaijan to Italy via Turkey and Greece in 2020. Some of this gas will eventually reach the Balkans via the IGB. However, transiting gas through Turkey to satisfy Greece’s requirement has potential drawbacks. This year, Greece is set to receive most of its pipeline gas, both Azeri and Russian, via Turkey. Nevertheless, Turkey could close supply to Greece if it wanted to shut off supply. Such a scenario further bolsters the attractiveness of LNG which will ensure Greece’s independence from both Russia as a source of gas and Turkey as a transit country.
Meanwhile, three private consortia are drafting plans to build LNG storage facilities to feed the Balkan consumption, two of which are expected to make final investment decisions this year. The catalyst for this new LNG investment is Greece’s accelerating transition to cleaner energy. Greece plans to completely abolish coal by 2028—10 years earlier than Germany—and replace the lost energy capacity with gas and renewables.
Greece is proving to be a test case to understand the power of LNG. In just two years, the country has transitioned from near-total dependence on Russian gas to an energy mix consisting of 40% LNG. Moscow is already positioning chess pieces to counter LNG’s rising influences. In July 2019, Russian Minister of Energy, Alexander Novak, announced that the second leg of TurkStream will not go through Greece, as originally planned, but via Bulgaria and Serbia, to reach Hungary.
Greece may be pivotal as a conduit for the only significant new gas discoveries near Europe and eastern Mediterranean. Along with Israel and Cyprus, Greece champions eastern Mediterranean, through a proposed 2,000-km (1,243-mile) pipeline (mostly undersea), intended to run from Israel’s Levantine Basin offshore gas reserves to Cyprus, Crete, and the Greek mainland. The goal of the pipeline is to supply Europe with an alternative to Russian gas.
While Greek, American, and European companies are significantly involved in exploring and exploiting east Mediterranean gases, there has been no Turkish or Russian presence in this new market.
Turkey has expressed its displeasure by intercepting exploration vessels in Cypriot waters on at least two occasions, and sending its own vessels to explore the Cyprus’s maritime territory. On November 27, 2019 it struck a deal with Libya to claim a broad corridor of water across the Mediterranean Sea that cuts across Greece’s claims, further escalating tensions.

071
CHAPTER
01Introduction
The EU is importing an increasing amount of LNG from the United States to diversify and secure its energy supply. Import of LNG from the United States has increased substantially since the first shipment in April 2016. Data reveals that at the end of 2019 LNG exports to the EU recorded the highest volume ever. In November 2019 imports reached 3 bcm and their value was estimated at €0.5 billion. In December 2019 LNG imports from the United States reached a new monthly record: 3.2 bcm, with an estimated value of €0.5 billion. There was a steep increase of United States LNG imports in the EU after the Trump-Juncker agreement in July 2018, mainly in France, Italy, Lithuania, Malta, Netherlands, Poland, Portugal, Spain, the United Kingdom, Greece, and Belgium. The high-level business to business energy forum held May 2, 2019 signified the strengthened cooperation between the United States and the EU. By early 2020 the EU had imported more than 24 bcm of LNG from the United States since April 2016.
With the decreasing demand of LNG in Japan and South Korea and its steadily increasing demand in China in 2019, Europe has become the major destination for cargoes unwanted in Asia in 2020. Analysts expect that from a record of around 85 million tons of LNG delivered to Europe last year, the region will increase its purchases by more than 10 million tons in 2020. Uncommitted cargoes will largely end up in northwest Europe, a region which plays a key balancing role in situations of oversupply.
[Figure 1-21] European LNG Imports in 2018-2020(Unit: Million tonnes)
Jan 2020 Jan 2019 Jan 2018
0
0.4
0.2
0.6
0.8
1.0
1.2
1.4
1.6
1.8
Turkey LithuaniaGreecePolandPortugalNether-lands
BelgiumItalyFranceSpainUnitedKingdom
Source: Ekaterina Kravtsova (2020).

Gas Sector Expansion Strategy for Energy Diversification in Albania
072
The shift is facilitated by the United States and Russia launching new LNG export projects that direct most of their supplies to Europe. For example, the United States has by far been the largest LNG exporter to Europe in January 2020, followed by Russia, and Qatar.37
[Figure 1-22] PNG vs. LNG Imports in Europe in 2019(Unit: bcm)
PNG Imports LNG Imports
0
405060
102030
708090
100
Germany Italy France U.K. Spain Belgium Poland
Source: GECF (2020).
The transition to a hub-based pricing mechanism is considered by many as a key to EU’s energy dependence problem. The European gas sector has been facing major challenges affecting the way natural gas is traded and priced. Oil indexation is the dominant pricing mechanism, but is currently under increasing pressure as trading is gradually shifting to indexation on hub market prices.38 Natural gas hubs tend to be at the heart of gas infrastructure networks such as pipelines and LNG terminals. The hub is used as a central pricing point for the network’s natural gas. Gas hubs require pipeline networks and storage sites that allow supplies to be traded and transported at a short notice. Diverse sources of gas supply, including domestic output, pipeline imports and overseas LNG shipments, are seen as favorable to avoid domination by a few producers. A strong consumer base, with competing buying interests, for example, from household, power, and industrial consumers, is considered as crucial to develop a diverse market-place. Regulation that allow domestic and foreign participants to trade and access pipelines and storage facilities is also essential to establish a gas hub. Participants must also trust the government to not intervene when prices go against local interests. Further, the oversupply of gas is also considered as necessary in the early stages of developing a trading hub to allow the commodity to be exchanged in significant volumes.
37 Ekaterina Kravtsova, “Europe's LNG Imports Expected to Soar to 100 mln tons in 2020.” Reuters, January 31, 2020.38 Institute of Energy for South East Europe, Natural Gas Trading Hub for SE Europe, https://www.iene.eu/iene-completes-pioneering-
study-on-natural-gas-pricing-hub-for-se-europe-p2348.html.

073
CHAPTER
01Introduction
Today, there are nine natural gas hubs operating across Europe. According to the International Gas Union, gas-on-gas accounted for 78% of the European market in 2019 with Oil indexation down to 22% from 24%, in the previous year. Gas-on-gas pricing accounted for 48.4% of the global demand. The changes have reflected a number of factors over the years: initially a decline in the volume of gas imported under the traditional oil-indexed contracts which were replaced by imports of spot gas being traded in increasing volumes at hubs. In Northwest Europe (Belgium, Denmark, France, Germany, Ireland, Luxembourg, the Netherlands, and the United Kingdom), oil indexation been eliminated completely, with gas-on-gas competition accounting for 95% of the market last year, wherein only 5% was indexed to oil.
Central Europe (Austria, the Czech Republic, Hungary, Poland, Slovakia, and Switzerland) saw a sizeable shift in 2019. Oil indexation declined from 22% in 2018 to 19% in 2019, while gas-on-gas competition increased from 76% in 2018 to 80% in 2019. This principally reflects increasing imports of spot gas, often from Germany, and contract renegotiations. In the Mediterranean (Greece, Italy, Portugal, Spain, and Turkey), gas-on-gas pricing also increased significantly in 2019. In 2019, 53% of sales were priced against gas—up from 44% in 2018—while the share of oil indexation dropped from 56% in 2018 to 47%. This reflected an increase in spot LNG imports into the region.
OIES Energy Insight39 provides an update on the maturity and development of European traded gas hubs, including both longer-term hubs and recently emerging ones, both from a liquidity and price perspective, to facilitate an overall assessment of the policy goal of achieving a Single Energy Market for natural gas in Europe. The update considers whether the natural gas market in Europe is working well and functioning in line with policy makers’ ambitions; whether it is providing the competitive and correct price signals to market players, and whether wholesale traders can buy gas at the same price throughout Europe, as they would in a truly interconnected European market for energy.
The integration is expected to increase the effectiveness of the energy market, create a single European gas and electricity market, contribute toward keeping prices low, and ensure the security of supply. Trade between EU member states will become more flexible and thus, possible curtailments of Russian supplies will have less impact on the European gas market.
39 Patrick Heather and Beatrice Petrovich, “European Traded Gas Hubs: A Decade of Change, “ Oxford Institute for Energy Studies, 2019.

Gas Sector Expansion Strategy for Energy Diversification in Albania
074
Trading hubs do not exist in Southern and Eastern Europe. The region is now starting to warm up to the prospect of a liquid market where long-term contracts and spot or short-term trading are combined. The establishment and functioning of a Gas Trading Hub requires a deregulated gas market, which is currently not the case in most South Eastern European countries.
A hub can be a physical point, where several pipelines intersect (e.g., Zeebrugge) or it can be a virtual (balancing) point inside a pipeline system (like the NBP). In other words, a physical hub is an actual transit location or physical point where gas pipelines intersect and natural gas is traded.
Meanwhile, a virtual hub is a trading platform accessed by a wide number of participants to enable financial transactions of natural gas. Physical hubs are located at a specific location where natural gas must imperatively be transported to. However, in the case of virtual hubs, the trading platform serves a trans-regional zone or an entire country. Therefore, the traded gas can be injected at any point on a trans-regional or national grid regardless of the point of extraction. The obvious advantage of virtual hubs is that the gas which has been paid for to enter the network can be traded, while only gas physically passing through a precise location can be traded through physical hubs, which entails higher risks.
One could argue that the operation of a physical, transit regional hub, such as the Belgian Zeebrugge, could be plausible in near future due to the flexibility resulting from the operation of the existing and planned interconnections in the region. The region could serve as a transit route for carrying Azerbaijani gas to smaller hubs in the region, as well as to the Central European Gas Hub in Austria—the newest operational gas hub. Like the Zeebrugge, a hub where pipelines meet physically, regional hub storage and LNG facilities, as well as pipeline connections could become a possible balancing strategy for both storage and transportation. Meanwhile, a virtual hub would offer even greater flexibility, because gas eligible for trading is that which has been paid for to access the network. Especially when moving toward an entry-exit system, which is mandated by EU’s regulation for member states, virtual hubs are more suitable for gas trading.
With the completion of Trans-Adriatic Pipeline (TAP), some marginal gas quantities will become available in SEE for trading. Therefore, as far as trading is concerned, this will facilitate the determination of market prices. Turkey is already a major gas importer from Russia, Iran, and Azerbaijan. In the future Turkey is likely to get gas from Kurdistan and Iraq as well.

075
CHAPTER
01Introduction
Azerbaijan’s state-owned oil and gas company SOCAR has just found more hydrocarbons in the Caspian Sea. However, the ultra-deep-sea discovery around 7,200 m offshore might be very expensive and might not be cost-competitive during global gas oversupply, which may last until 2025–2030.40 Overall, the prospects for an expansion of the TANAP-TAP network have deteriorated due to the declining demand of gas by the EU after 2030 in the context of the EGD, as only „green gases” (hydrogen, methane gas, biogas) will be used gradually to protect the global climate by 2050. This hampers the profitability of major gas projects that have to be commercially operated for at least 20 years, unless they support the transportation of hydrogen to Europe in the future.
Problems of commerciality have also grown for the EU’s East-Med-Pipeline for transporting gas supplies from Israel, Cyprus, and Egypt to Greece and Italy. The final investment decision for the 1,900 km long and around €5bn East-Med gas pipeline (1,300 km offshore and 600 km over land) from Israel to Greece (with the extension of 300 km long Poseidon underwater gas pipeline to Italy) was originally planned in 2022 and its commissioning of gas transport to Europe in 2025.
[Figure 1-23] Potential Export Routes of Gas from the Eastern Mediterranean Export Countries (Israel, Cyprus, and Egypt)
TURKEY
TANAP
SYRIA
LEB.
JORDAN
ISRAEL
IRAQ
SAUDI ARABIAEGYPT
Damietta and IdkuLNG facilities
EASTMED
Pipeline to Europethrough Turkey
LNG to EuropePipeline to
Egyptian LNGfacilities
Pipelineto Turkey
LNG to Asia
GREECEAegean
Sea
ТАР
BULGARIA Black Sea
ITALY
Mediterranean Sea
LIBYA
Source: Stratfor.com (2018).
40 Joseph Murphy, “Azeri Find Lifts Caspian Hopes,” Gas in Transition 1, no. 1 (April 19, 2021): 9-11.

Gas Sector Expansion Strategy for Energy Diversification in Albania
076
In August 2019, Cyprus and Egypt agreed to build a gas pipeline from Zohr to Cyprus to allow the transfer of Egyptian natural gas to the East-Med pipeline to Greece and Italy. In January 2020, Greece, Cyprus, and Israel confirmed the construction of the pipeline from its Aphrodite-Ishai gas fields, and in July 2020 the Israeli government confirmed its final approval to the agreement with the EU states. The US has also diplomatically supported the project. However, trilateral pipeline cooperation is not enough to advance the East-Med gas pipeline project without the EU’s political and economic support. This is all essentially significant since the pipeline has met with political resistance from Turkey. Thus, Turkey would not be able to directly benefit from the pipeline or strengthen its geopolitical claim to power in the region.
[Figure 1-24] Eastern Mediterranean Gas Fields, Gas Pipelines and Egypt’s LNG Export Terminal
SYRIA
Nicosia Baniyas
AqabaTaba
DamiettaLNG
ISRAELArishIdkuLNG
AshkelonPort Said
Amman
DamascusAphroditegas field
MediterraneanSea
LEBANON
Tripoli HomsCYPRUS
IRAQ
SAUDI ARABIAJORDAN
EGYPT
Holds anestimated 30trillion cubicfeet of gas
Zohr
Holds anestimated 22 trillioncubic feet of gas
Discovered inDecember 2010
Leviathan Gas pipelineProposed pipelineLicense blocks
Tel Aviv
Source: Reuter (2016).
The overall commercial prospects for building the East-Med-pipeline and development of regional gas fields in the eastern Mediterranean had already deteriorated before the global pandemic erupted, due to the global gas market glut and the United States fracking revolution, LNG technology innovations, and development of new short-term and flexible gas contracts. With the outbreak of the COVID-19 pandemic and global economic crisis since 2020, along with the corresponding losses of energy companies, many investment projects have either already been abandoned or the final investment decisions have been postponed indefinitely.

077
CHAPTER
01Introduction
With the announcement of the European Green Deal, the EU no longer wants to support new fossil energy projects (including natural gas projects), but only to grant exceptions in special circumstances. Hence, the political-financial support of the East-Med pipeline is no longer secured by the European side, since construction is not expected to be completed until 2025. In 2020, a large number of gas companies had suspended offshore production in the eastern Mediterranean due to falling demand and comparatively high exploration costs. Increasing competition in the world's oil and gas markets has also intensified gas projects in the eastern Mediterranean.
While the UAE also supports the East-Med gas pipeline project, this runs counter to the interests of Qatar–the world's largest LNG exporter (temporarily replaced by Australia in 2019)–which intends to continue to expand its exports in the coming years despite global oversupply in the gas markets. The construction of the East-Med gas pipeline could halve Qatar's LNG exports to Europe. Greece and Egypt are presently discussing the alteration of the route of the East-Med pipeline in response to technical difficulties and questions of commercial viability. The discussed revised pipeline would still start from the Israelian Leviathan-gas field and transported to Egypt via a land route and then to the island of Crete via a new pipeline through the demarcated Greek-Egyptian Exclusive Economic Zone (EEZ), reaching Alexandroupolis, from where it will be transported to any final destination in Europe.41
Thus, while the commerciality of the East-Med-pipeline and prospects for expanding the TAP-TANAP-SCPX under the new circumstances have deteriorated, the EU’s SGC project is not yet completed as regional gas interconnectors (such as BRUA, Eastring, or the Ionian Adriatic Pipeline/IAP) have not been constructed that would connect the Western Balkan states such as Albania.
41 Sarantis Michalopoulos, “Athen and Cairo Mull Changing the Route of EastMed Pipeline,” Euractiv.com (Please include the URL in-stead), 4 March 2021.

Gas Sector Expansion Strategy for Energy Diversification in Albania
078
Assenova, Margarita. & Zaur, Shiriyev. 2015. Azerbaijan and the New Energy Geopolitics of Southeastern Europe. The Jamestown Foundation.
Bond, Kingsmill, Ed Vaughan, and Harry Benham. 2020. Decline and Fall: The Size & Vulner-ability of the Fossil Fuel System, Carbon Tracker Report, June (accessed: https://carbon-tracker.org/reports/decline-and-fall/Decline and Fall: The Size & Vulnerability of the Fossil Fuel System).
BP. 2019. The 2019 BP Statistical Review of World Energy (accessed: https://www.bp.com/en/global/corporate/energy-economics/statistical-review-of-world-energy.html).
Bowden, Julian. 2019. “SE Europe Gas Markets: Towards Integration,” OIES Paper Ng. 150 (2019), Oxford Institute for Energy Studies.
Cornot-Gandolphe, Sylvie. 2018. New and Emerging LNG Markets: The Demand Shock. Paris, France: IFRI, June.
Cornot-Gandolphe, Sylvie. 2019. China’s Quest for Blue Skies: Astonishing Transformation of the Domestic Gas Market. Paris, France: IFRI.
Deloitte. 2016. How can business models adapt to evolving LNG markets?. Deloitte Center for Energy Solutions.
Ebomger, Jane. 2010. “Albania’s Energy Sector: Vulnerable to Climate Change”. ECA Knowl-edge Brief. Volume 29. The World Bank.
Energy Community Secretariat. 2019. Annual Implementation Report 2018/2019 1 November 2019.
Energy Regulatory Authority. 2019. “The Situation of the Power Sector and ERE Activity during 2018.” Annual Report.
Energy Regulatory Authority. 2020. “The Situation of the Power Sector and ERE Activity during 2019.” Annual report.
European Commission. 2019. Albania should urgently diversify away from hydropower, properly conduct environmental assessments (https://balkangreenenergynews.com/ eu-ropean-commission-albania-should-urgently-diversify-away-from-hydropower-proper-
References

079
CHAPTER
01Introduction
ly-conduct-environmental-assessments/)
European Union. 2016. Renewable energy potentials of Albania. (https://cordis. europa.eu/article/id/124474-renewable-energy-potentials-of-albania)
European Western Balkans Joint Fund, Western Balkans Investment Framework Infrastruc-ture Project Facility Technical Assistance 4 (IPF 4), WB11-ALB-ENE-01, Gas Master Plan For Albania & Project Identification Plan, 2016, p. 15 (Henceforth Gas Master Plan).
Faye, Michael., McArthur, John., Sachs, Jeffrey., & Snow, Thomas. 2004. “The Challenges Fac-ing Landlocked Developing Countries,” Journal of Human Development, 5(1), 31-68.
Gas Exporting Countries Forum (GECF). 2020a. Growing Competition between Pipeline Gas and LNG Supplies in the European Union amid the Covid-19 Outbreak. Expert Commen-tary, August 2020.
Gas Exporting Countries Forum (GECF). 2020b. “Update on Global Gas and LNG Prices in 2020: How has it Coped with Recent Market Dynamics?”.
Geopolitical Intelligence Services. 2019. “How Turkey scored big in the gas pipeline game,” (https://www.gisreportsonline.com/gis-dossier-how-turkey-scored-big-in-the-gas- pipe-line-game,energy,2706.html)
Giamouridis, Anastasios. 2009. “Natural Gas in Greece and Albania Supply and Demand Prospects to 2015,” OIES paper, ng 37, Oxford Institute for Energy Studies.
Government of Albania. 2003. The National Strategy of Energy and Plan of Action.
Grenell, Richard. Sands, Carla. Sondland, Gordon. 2019. “Opinion: Europe Must Retain Con-trol Of Its Energy Security,” https://www.dw.com/en/opinion-europe-must-retain-con-trol-of-its-energy-security/a-47399924, February 7, 2019.
Gurpreet Chugh and Leonard Crook, Navigating the Path to a Well-Functioning Gas Trading Hub in India, June 2019 (https://www.icf.com/insights/public-policy/well-functioning-gas-trading-hub-in-india#).
Hall, Marshall. 2020. “Net Zero Targets and GHG Emission Reduction in the UK and Norwe-gian Upstream Oil and Gas Industry: A Comparative Assessment”, OIES Paper, ng 164, Oxford Institute for Energy Studies, November.
Heather, Patrick. and Petrovich, Beatrice. 2019. European Traded Gas Hubs: A Decade of Change, Oxford Institute for Energy Studies.
Henderson, James and Vitaly Yermakov. 2019. Russian LNG: Becoming a Global Force. Ox-

Gas Sector Expansion Strategy for Energy Diversification in Albania
080
ford Institute for Energy Studies, November.
IMF. 2017. Albania IMF Country Report No. 17/374.
Institute of Energy for South East Europe, Natural Gas Trading Hub for SE Europe (https://www.iene.eu/iene-completes-pioneering-study-on-natural-gas-pricing-hub-for-se-eu-rope-p2348.html).
International Energy Agency (IEA). 2020a. The Impact of the COVID-19 Crisis on Clean Ener-gy Progress. June 11 (accessed: https://www.iea.org/articles/the-impact-of-the-covid-19-crisis-on-clean-energy-progress).
International Energy Agency (IEA). 2020b. Tracking Clean Energy Progress (TCEP) (accessed : https://www.iea.org/topics/tracking-clean-energy-progress).
International Energy Agency (IEA). 2020c. Gas 2020. June. (accessed: https://www.iea.org /reports/gas-2020).
International Energy Agency (IEA). 2019. World Energy Statistics
International Gas Union. 2018. FLNG Report.
International Gas Union. 2019. 2019 World LNG Report.
International Gas Union. 2020. 2020 World LNG Report.
International Gas Union. 2020. Global Gas Trends 2020.
International Renewable Energy Agency (IRENA). 2021. Renewables Readiness Assessment: The Republic of Albania. Abu Dhabi, UAE.
Kim, Younkyoo & Stephen Blank. 2016. "The New Great Game of Caspian Energy in 2013-2014: “Turk Stream,” Russia and Turkey." Journal of Balkan and Near Eastern Studies, 18(1), pp. 37-55.
Kim, Younkyoo & Stephen Blank. 2020. “Russia and the Mediterranean in the Era of Great Power Competition: Russia’s New Naval Challenges to the West,” Mediterranean Review, 13(1), (June), pp. 65-98.
Kim, Younkyoo & Stephen Blank. 2019. “Russia’s arms sales policy after the Ukraine sanc-tions”. Asian Politics & Policy, 11(3), pp. 380-398.
Kim, Younkyoo. 2017. “Asian LNG Market Changes under Low Oil Prices: Prospects for Trad-ing Hubs and a Price Index.” Geosystem Engineering, 20(3), pp. 129-141.

081
CHAPTER
01Introduction
Kim, Younkyoo. 2018. “Nascent Gas Markets in the Era of Low Oil Prices: The Challenges and Opportunities of Energy Security in Southeast Asia.” In Slawomir Raszewski (Ed.) The In-ternational Political Economy of Oil and Gas. London & New York: Palgrave Macmillan.
Kim, Younkyoo. 2018. “Russia’s Pivot to Asia: A Balance Sheet”. The Journal of Peace Studies, 19(2).
Kravtsova, Ekaterina. 2020. “Europe's LNG Imports Expected to Soar to 100 mln tons in 2020.” Reuters, January 31, 2020.
Ministry of Infrastructure and Energy, Albania, Brief Overview Of the Energy Sector and De-mand From the Albanian Government, Tirana, December 10, 2020.
Roze, Jimmy. 2007. “Security of gas supply for Europe,” European Review of Energy Markets, Vol. 2, No. 2 (December 2007), p. 4
Thomson, Philip & Julia Derrick. 2019. Energy 2019. Global Legal Insights.
U.S. Energy Information Administration (EIA). 2020. Short Term Energy Outlook, July 2020. (accessed: https://www.eia.gov/outlooks/steo/pdf/steo_full.pdf).
United Nations Economic Commission for Europe (UNECE). 2020. The Potential for Natural Gas to Penetrate New Markets. Geneva.
United Nations Economic Commission for Europe (UNECE). 2019. How Natural Gas Can Dis-place Competing Fuel. Geneva.
United States Agency for International Development (USAID). 2018. Energy Strategy for Alba-nia: Enhancing Capacity for Low Emission Development Strategies (EC-LEDS).
Walstad, Andreas. 2020. “LNG Poised for European Market Share Battle.” Petroleum Econo-mist, April 27.
Warsaw Institute Review. 2019. Western Balkans: Infrastructure and Energy From a Geopo-litical Perspective.
Western Balkans Investment Framework (WBIF). 2016. Gas Master Plan for Albania.
Williams-Derry, Clark and Ghee Peh. 2020. “No Upside: The U.S. LNG Buildout Faces Price Resistance From China Chinese Gas Importers Were Losing Money on LNG Imports Even Before the COVID-19 Crisis.” Institute for Energy Economics and Financial Analysis (IEEFA), July.
Wood Mackenzie. 2017. Global LNG long-term outlook 2017.

Gas Sector Expansion Strategy for Energy Diversification in Albania
082
Wood Mackenzie. 2020. Asia Pacific Gas and LNG – Six Themes to Watch in 2020. (accessed: https://www.woodmac.com/press-releases/asia-pacific-gas-and-lng---6-themes-to-watch -in-20202/)
Woroniuk, David. Karam, Arzé. Tooraj Jamasb. 2019. “European Gas Markets, Trading Hubs, and Price Formation: A Network Perspective,” Energy Policy Research Group, University of Cambridge, Cambridge Working Paper in Economics 1964.
World Gas Intelligence. 2020. “Gazprom Exposes Damaging Impact of LNG.” June 24.
Zhuri, Mariona. 2019. “Analysis of the Albanian Power System and its potential to become a green battery for Balkan Peninsula.” Norwegian University of Science and Technology.


Long-Term Outlook for Natural Gas Demand/Supply in Albania and the Strategy for Demand Drive of Natural GasJinsoo Kim (Hanyang University)Namjin Roh (Korea Energy Economics Institute)Dritan Spahiu (Local Gas Expert)
1. Introduction2. Korean Experiences of Natural Gas Demand Modeling3. Energy Demand Forecasting Models: Bottom-up vs. Top-down4. Strategies for Updating Demand Forecasts in the Gas Master Plan5. Results and Proposals for Natural Gas Demand Promotion in Albania
C H A P T E R
02
KeywordsGas Demand, Demand Promotion, Demand Model, Sectoral Demand, Price Competitiveness

085
CHAPTER
02Long-Term
Outlook for Natural Gas Dem
and/Supply in Albania and the Strategy for Demand Drive of Natural Gas
Summary
The main goal of this chapter is to update Albania’s natural gas demand outlook, especially in the context of the Gas Master Plan (GMP), and develop a “target demand” to promote natural gas consumption in Albania. For this, we introduce natural gas demand models, including the ones based on the Korean experiences, and the structure of gas consumption in energy-intensive industries. Estimation of natural gas demand in various sectors can be more convincing and reliable by understanding the energy demand structure in each industry.
In Section 2, we present the Korean experiences of natural gas demand modeling. We briefly explain the theoretical backgrounds of energy demand models, focusing on comparing the top-down and bottom-up models in Section 3. Section 4 describes our approach to update the GMP of Albania, which is a two-step approach. The first step is updating the BaU (Business as Usual) scenario in the context of GMP based on the sectoral GDP growth, and the second is applying expected and/or planned demand according to scenarios. For the second step, we have also surveyed the major consumers of natural gas in Albania.
Based on the research results and discussions, we developed the following three possible scenarios to update the natural gas demand of the GMP in Albania: low economic feasibility, base, and active market development. The estimated natural gas demand by scenario is as follows:
Long-Term Outlook for Natural Gas Demand/Supply in Albania and the Strategy for Demand Drive of Natural GasJinsoo Kim (Hanyang University)Namjin Roh (Korea Energy Economics Institute)Dritan Spahiu (Local Gas Expert)

Gas Sector Expansion Strategy for Energy Diversification in Albania
086
We propose the following policy suggestions for the Albanian government to promote the demand of natural gas and realize the “Active market development” scenario in Albania.
- The price competitiveness of natural gas is the first thing to secure for the successful promotion of natural gas. Survey responses and theories on energy demand modeling suggest that there is evident willingness to change the energy sources and fuels if the price and infrastructure costs remain reasonable.
- Climate crisis and GHG emission reduction is a global megatrend, and the Albanian government and industries must consider the climate issues. Therefore, as evident from survey responses, electrification and power generation by natural gas and fuel substitution is not a choice; it is the only option Albania has. Renewables could be the future of power generation, but it is difficult to supply the entire electricity demand from renewables only.
- Natural gas supply infrastructure is essential for determine price competitiveness as well accessibility. We propose promising options in Section 4; however, providing clear policy directions to possible consumers, including industries, is also important.
- The estimated demand in our study has some limitations: the number of respondents of the survey is limited, the data is not sufficient to analyze the demand with econometric or bottom-up models (e.g., the price level of each energy sources), and we do not have enough resources to develop a national energy demand model, especially for electricity. We believe that the Albanian government can handle all these limitations in the future.
1. Introduction
The main goal of Chapter 2 is to update the forecast for natural gas demand in Albania, especially in the Gas Master Plan (GMP), and to develop a “target demand” to promote natural gas consumption in Albania. To this end, we introduce a natural gas demand model including our country's experience and the structure of gas consumption in energy-intensive industries. Understanding the structure of each industry's energy demand makes natural gas demand estimates for that sector more convincing and reliable. It also studies the eco-friendly business of the recent natural gas industry. If there are more stringent environmental regulations from international organizations on greenhouse gas (GHG) emissions, or if international cooperation between countries is strengthened, Albania should also strive to replace conventional energy with clean energy resources such as natural gas. In this case, potential natural gas demand could increase more than expected by GMP.

087
CHAPTER
02Long-Term
Outlook for Natural Gas Dem
and/Supply in Albania and the Strategy for Demand Drive of Natural Gas
The following section describes Korea's experience in modeling natural gas demand, particularly the experience she applied to write a long-term master plan for supply and demand for natural gas. Section 3 outlines the theoretical background of the energy demand model and Section 4 presents an approach for updating Albania's GMP. Finally, we propose updated results and proposals for facilitating demand for natural gas in Albania.
2. Korean Experiences of Natural Gas Demand Modeling
2.1. Natural Gas Demand in Korea
In the case of Korea, the supply of city gas has entered a stabilization stage, accounting for about 20% in TPES. Due to differences in industrial structure, population, and natural gas supply conditions between Albania and Korea, demand for natural gas might differ in the long-term energy projections. However, this chapter intends to provide an example depicting how the role of natural gas can change depending on the government's long-term energy policy.
In June 2019, the government (Ministry of Trade, Industry and Energy) announced the “Third Energy Master Plan.” Its basic direction was to increase the quality of life and sustainable growth through energy conversion of the public. Consequently, the role of natural gas became significant for mid- to long-term energy policy.
According to this plan, total primary energy supply in Korea is projected to increase from 244.1 million tons (toe) in 2017 to 279.9 toe in 2040, with an annual growth rate of 0.6%.
Coal will remain Korea's major energy source, accounting for 30.5% of energy production in 2040. Though coal consumption is projected to increase steadily until 2030, accounting for about 35% of energy production, consumption is expected to decrease. It is expected to reduce to about 30% in 2040. Natural gas and renewable energy are expected to become significant energy sources in the future, with growth rates of 4.3% and 1.8%, respectively, during 2017–2040. The Share (%) of hydropower in TPES is expected to increase slightly from 0.6% in 2017 to 0.8% in 2040.

Gas Sector Expansion Strategy for Energy Diversification in Albania
088
<Table 2-1> Structure of Primary Energy Supply by Source in Republic of Korea
Division 2017 2030 2040Growth Rate p.a.(%)
’17~’30 ’30~’40 ’17~’40
CoalToe (1,000) 86 97.1 85.3 0.9 △1.3 △0.0
Share (%) 35.2 34.5 30.5 - - -
OilToe (1,000) 62.9 61.8 57.8 △0.1 △0.7 △0.4
Share (%) 25.8 22.0 20.7 - - -
Natural GasToe (1,000) 47.2 58.7 71.2 1.7 2.0 1.8
Share (%) 19.3 20.9 25.4 - - -
HydroToe (1,000) 1.5 1.8 2.1 1.6 1.2 1.5
Share (%) 0.6 0.6 0.8 - - -
NuclearToe (1,000) 31.6 29.8 24 △0.4 △2.1 △1.2
Share (%) 12.9 10.6 8.6 - - -
New & RenewableToe (1,000) 15 31.8 39.4 6.0 2.2 4.3
Share (%) 6.1 11.3 14.1 - - -
Total Toe (1,000) 244.1 281.1 279.9 1.1 △0.04 0.6
Share (%) 100.0 100.0 100.0 - - -
Source: MOTIE (2019).
Korea's natural gas demand increased from 1.61 million tons in 1987 to 41.44 million tons in 2020, at an AAGR of 10.3%. Power generation is the largest sector consuming natural gas in Korea (50% in total). City gas can be classified for several uses, with the residential and industrial sectors accounting for over three-quarters of total city gas demand. The major manufacturing industries that consume a lot of natural gas in the industrial sector are energy-intensive industries such as petrochemicals, processed metals, and steel industries.

089
CHAPTER
02Long-Term
Outlook for Natural Gas Dem
and/Supply in Albania and the Strategy for Demand Drive of Natural Gas
[Figure 2-1] City Gas Demand by Use in 2019(Unit: %)
Industrial34
Commercial9
Residential42
Office6
CHP4
Transport5
Food/Tobaco10
OtherManufacturing
4
Textile/Apparel3
Pulp/Publication
4
Petro/Chemical
31
Non-Metalic7
Iron/Steel14
Non-ferrous metals4
Fabricated Metal23
Source: KESIS database (2021).
[Figure 2-2] Historical Natural Gas Demand in Korea (1992-2020)(Unit: 10,000 Tonnes)
City Gas Power Generation
0
500
1,000
1,500
2,000
2,500
3,000
3,500
4,000
4,500
1992
1993
1994
1995
1996
1997
1998
1999
2000
2001
2002
2003
2004
2005
2006
2007
2008
2009
2010
2011
2012
2013
2014
2015
2016
2017
2018
2019
2020
349
1,115
1,770
2,604
4,008
3,335
4,222 4,144
Source: MOTIE (2021).

Gas Sector Expansion Strategy for Energy Diversification in Albania
090
Natural gas demand of cities has grown significantly at a high rate of 18.9% per year. In the duration of 1987-2020, the growth of urban gas demand has been stagnant due to the saturation of urban gas penetration. Meanwhile, natural gas consumption in the industrial sector has been highly volatile due to its price level relative to LPG.
In April 2021, the Korean government announced the 14th long-term natural gas supply and demand plan. According to this plan, natural gas demand will increase from 41.7 million tons in 2021 to 48 million tons in 2034. The role of natural gas is becoming increasingly important along with transition policies in the electricity sector to ensure the management of demand. As the percentage of renewable energy increases, the issue of intermittent power generation becomes more important. The CCGT enacts as an enlarged complementary power plant in such circumstances.
<Table 2-2> Natural Gas Demand Projection in Korea(Unit: 1,000 Tonnes, %)
YearCity gas Electricity Total
Residential & Service Industry Sub Total Reference Demand
Management Reference Demand Management
2021 11,850 9,830 21,680 20,010 23,910 41,690 45,590
2027 12,610 12,190 24,800 17,680 21,720 42,480 46,520
2034 12,900 14,190 27,090 20,880 25,440 47,970 52,530
Growth Rate p.a. 0.66 2.86 1.73 0.33 0.48 1.09 1.10
Source: MOTIE (2021).
Korean gas demand is highly seasonal, due to major fluctuations in residential heating demand between the winter peak and summer off-peak. The industrial, commercial, and district heating sectors also partially confirm seasonal patterns. Consumption in the power sector has broadly followed the double-peak (summer and winter).
The Korean government is attempting to reshape the long-term power generation mix of greenhouse gas mitigation policies. Even though proportion of natural gas in power mix is expected to decrease from 25.6% in 2019 to 23.3% in 2035, the total amount of natural gas used in power sector will increase during the same period.

091
CHAPTER
02Long-Term
Outlook for Natural Gas Dem
and/Supply in Albania and the Strategy for Demand Drive of Natural Gas
[Figure 2-3] Monthly Gas Demand in Korea (2014-2020)(Unit: bcm)
Residential Commercial Industry TransportationPublic Own Use and Losses Power District Heating
2014 2015 2016 2017 2018 2019 20200.0
3.0
2.5
2.0
1.5
1.0
0.5
Source: KESIS database (2021)., IHS Markit (2021).
[Figure 2-4] Korean Outlook of Generation Output Share (Target Scenario)(Unit: TWh)
Nuclear Coal LNG Renewable Others
0
2019
2030
100 200 300 400 500 600
554.8TWh
520.5TWh25.9% 40.4% 25.6% 6.5%
25.0% 29.9% 23.3% 20.8%
Source: MOTIE (2020).
2.2. World Panel Model of Korea
Korea used both bottom-up and top-down models to produce energy projections. Starting with macroeconomic models and well-known approaches such as LEAP (Long Range Energy Alternatives Initiative) and E3ME (Cambridge's Energy-Environment-Economic Global Macroeconomic), we have been steadily developing our own prospective models. KEEI-EGMS (Energy and Greenhouse Gas Modeling System) is a representative system for

Gas Sector Expansion Strategy for Energy Diversification in Albania
092
forecasting the overall (sector) energy demand. In terms of natural gas demand, especially city gas demand, the Korean government has applied an econometric approach called the “global panel model.”
The World Panel Model uses GDP per capita and Income Coefficient of Energy Demand (ICED) of 105 countries. The functional form of the model is as follows:
............................................................. (1)
where represents energy consumption, denotes group binaries, signifies the ICED, denotes GDP per capita, and represents error term.
Based on this basic model, various estimation techniques are applied to improve forecasting power. For example, a semi-parametric approach is used to estimate the ICED to allow a flexible functional form for the coefficient and glean substantial information on functional coefficient dynamics. Chang et al. (2016) determined the details of this method. While this macro-econometric approach would be extremely accurate when demand is relatively stable, it remains significant as it provides meaningful implications if we use the other, bottom-up models.
3. Energy Demand Forecasting Models: Bottom-up vs. Top-down
3.1. Energy Demand Modeling Approaches
Energy demand forecasting is one of the major research topics of energy economics, so energy demand modeling has a long history of development. We can classify these models into two groups: bottom-up and top-down. The bottom-up model has been established from disaggregated data, such as endues or industrial activity, while the top-down approach uses aggregated, macro-economic dataset to estimate the energy demand. Bhattacharyya and Timilsina (2009) successfully organized the features of the models as follows:

093
CHAPTER
02Long-Term
Outlook for Natural Gas Dem
and/Supply in Albania and the Strategy for Demand Drive of Natural Gas
<Table 2-3> Comparison of Energy Demand Modeling Approaches
Criteria Bottom-Up,Optimisation
Bottom-UpAccounting
Top-Down,Econometric Hybrid Electricity
Planning
Geographicalcoverage
Local toglobal, but mostly
national
National but can be regional National National or
global National
Activitycoverage
Energy system,environment,
trading
Energy system and environment
Energy system,environment
Energy system,environment and
energy trading
Electricity system and environment
Level of disaggregation High High varied High Not applicable
Technology coverage Extensive
Extensive but usually predefined
Variable but normally limited
Extensive but usually pre-
definedExtensive
Data need ExtensiveExtensive butcan work with
limited dataHigh High to Extensive Extensive
Skill requirement Very high High Very high Very high Very high
Capability to analyse price-
induced policiesHigh Does not exist High Normally
available Available
Capability to analyse non-price
policies Good Very good Very good Very good Good
Rural energy Possible but normally limited Possible Possible but
normally limitedPossible but
normally limited Difficult
New technology addition Possible Possible Difficult Possible but often
limited Possible
Informal sector Difficult Possible Difficult Possible Difficult
Time horizon Medium to long-term
Medium to long-term
Short, medium or long term
Medium to long-term
Medium to long term
Computing requirement
High end, required
commercial LP solvers
Not demanding Econometric software required
Could require commercial
software
Requires commercial or
licensed software
Source: Bhattacharyya and Timilsina (2009). p.146.
The bottom-up approaches are advantageous in assessing new scenarios or technologies while developing a long-term energy demand outlook. Thus, the bottom-up model is more suitable than top-down approach if an economy is growing rapidly, with expected significant changes in the industrial and energy supply structures. However, extensive data requirements and the need for highly skilled experts pose challenges to manage sophisticated bottom-up models. Also, two approaches can be used complementarily for
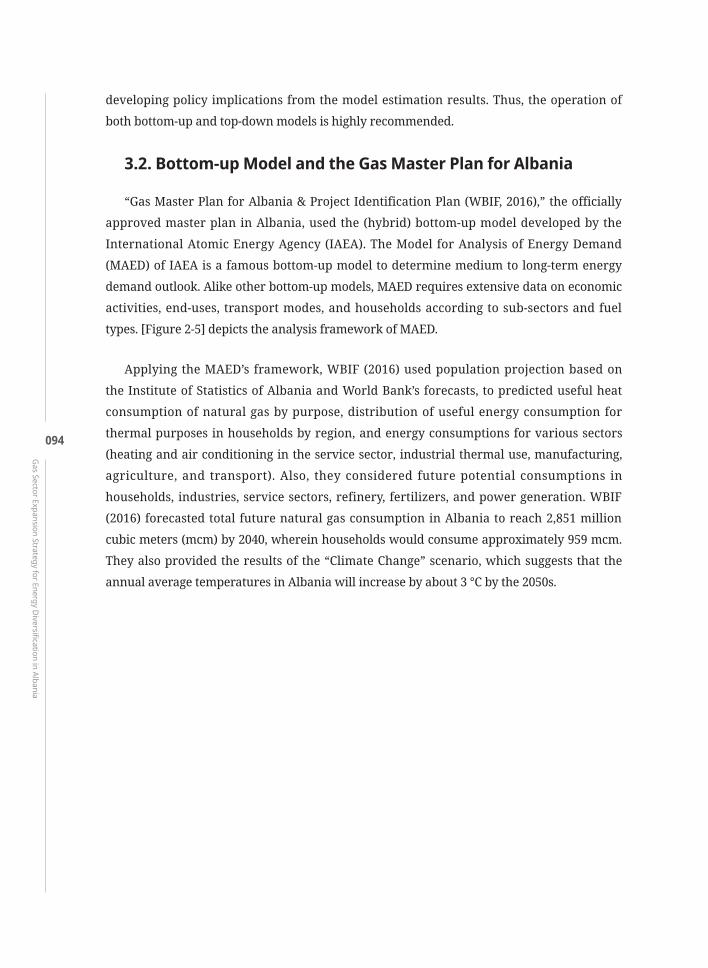
Gas Sector Expansion Strategy for Energy Diversification in Albania
094
developing policy implications from the model estimation results. Thus, the operation of both bottom-up and top-down models is highly recommended.
3.2. Bottom-up Model and the Gas Master Plan for Albania
“Gas Master Plan for Albania & Project Identification Plan (WBIF, 2016),” the officially approved master plan in Albania, used the (hybrid) bottom-up model developed by the International Atomic Energy Agency (IAEA). The Model for Analysis of Energy Demand (MAED) of IAEA is a famous bottom-up model to determine medium to long-term energy demand outlook. Alike other bottom-up models, MAED requires extensive data on economic activities, end-uses, transport modes, and households according to sub-sectors and fuel types. [Figure 2-5] depicts the analysis framework of MAED.
Applying the MAED’s framework, WBIF (2016) used population projection based on the Institute of Statistics of Albania and World Bank’s forecasts, to predicted useful heat consumption of natural gas by purpose, distribution of useful energy consumption for thermal purposes in households by region, and energy consumptions for various sectors (heating and air conditioning in the service sector, industrial thermal use, manufacturing, agriculture, and transport). Also, they considered future potential consumptions in households, industries, service sectors, refinery, fertilizers, and power generation. WBIF (2016) forecasted total future natural gas consumption in Albania to reach 2,851 million cubic meters (mcm) by 2040, wherein households would consume approximately 959 mcm. They also provided the results of the “Climate Change” scenario, which suggests that the annual average temperatures in Albania will increase by about 3 °C by the 2050s.

095
CHAPTER
02Long-Term
Outlook for Natural Gas Dem
and/Supply in Albania and the Strategy for Demand Drive of Natural Gas
[Figure 2-5] Analysis Framework of MAED
Breakdown of the economy by sector: industry, transport, service, household
Scenario assumptions
Efficiency of processes and appliances
Final energy demand
Sub-scenarios on socioeconomicdevelopment
(e.g. economic growth, life style, population...)
Sub-scenarios on technological evolution(e.g., efficiency improvement, change inenergy intensity, market penetration...)
Social needs(e.g., mobility,
space heating...)
Non-substituable energy requirements(e.g., motor fuels, specific electricity...)
Substitutable energy requirements(e.g. heat, cooking...)
Electricity demandDemand for other final energy forms
(e.g. fossil fuels, solar, district heating, traditionalfuels...)
Useful energy demand(e.g. steam for industrial processes,energy for hot water production...)
Penetration of various alternative formsof final energy
(e.g. electricity, fossil fuels. solar...)
Level of economicactivity: production
of goods and services
Technological determinants(e.g., dwelling insulation,
vehicle efficiency...)
MAED
Source: IAEA (2006).
In this subsection, we have introduced various energy demand models, including the MAED 2.0 for the 2016 Gas Master Plan of Albania. Each model has been utilized in many countries and institutions. For example, besides the MAED from IAEA, several famous bottom-up (or hybrid) models have been used to determine world energy demand outlook. For example, the World Energy Model by International Energy Agency (IEA, 2020) and the National Energy Modeling System by Energy Information Administration (EIA, 2019). Several

Gas Sector Expansion Strategy for Energy Diversification in Albania
096
state authorities and scholarly articles have been consulted to determine the projections using these models; in fact, a massive team of researchers is continuously working to improve the models. Also, recent developments in the bottom-up energy demand models, such as OSeMOSYS (2021) and TEMOA project (2021), have ensured high transparency and increased capability to handle the sector’s coupling issues.
Top-down models have also been applied in many fields. As mentioned above, the World Panel Model for the natural gas demand of Korea could be used as a representative example. Also, one can easily find several applications of top-down approaches of energy demand modeling from extant literature, for example, the Netherlands case (Koopmans et al., 1999), impact of a demand-side management (Kaufmann et al., 2010), and Western Balkan countries (Shkurti, 2018).
The Albanian government and corresponding authorities could apply the top-down, bottom-up, or a combination of both, to analyze natural gas demand. However, unfortunately, the bottom-up models require massive data inputs and highly skilled workforces to operate the model. Thus, developing a new bottom-up or hybrid model to update Albania's natural gas demand outlook is not a viable option for this KSP project. We discussed the application of a top-down model, like the World Panel Model, at the beginning of the project, and concluded that it is not a plausible option either because Albania requires an introduction of natural gas. This implies the absence of historical data, along with limited nature of available data, particularly the sectoral GDP outlook data, to estimate an econometric model. Consequently, we developed a second-best strategy to determine Albania’s natural gas outlook.
4. Strategies for Updating Demand Forecasts in the Gas Master Plan
4.1. Current Status of Gas Demand in Albania
Energy balance table of Albania was recently updated by the Albanian government using the 2019 data. Total primary energy supply (TPES) of Albania was 2,340ktoe in 2019, a record 1.4% decrease from 2013 (2,373ktoe).1
Compared to 2013, energy supply for all fuels increased, except biomass energy and electricity, which decreased by 18.7% and 16.5%, respectively. Solid fuels consumption
1 Data in 2013 were referenced from Albania Gas Master Plan p.126 (2016.11).

097
CHAPTER
02Long-Term
Outlook for Natural Gas Dem
and/Supply in Albania and the Strategy for Demand Drive of Natural Gas
increased by 21.5%, oil products increased by 11.1%, natural gas increased by 700%, while nuclear electric power decreased by 2%.
The Share (%) of natural gas in TPES increased from 0.3% in 2013 to 2.7% in 2019, which is quite a small amount. Albania’s primary energy supply still highly depends on oil products and electricity. As of 2019, natural gas demand in Albania accounted for only 64 ktoe, most of which was used in the transformation sector (oil and gas extraction plants), while the rest was used in the food and tobacco industry.
<Table 2-4> Total Primary Energy Supply in Albania(Unit: ktoe)
Year Solid Fuels
Oil Products
Natural Gas
Geothermal, Solar Etc. Biomass
Electricity Derived Heat TOTAL
Hydro Imported
2013 93(3.9%)
1,200(50.6%)
8(0.3%)
12(0.5%)
193(8.1%)
389(16.4%)
474(20.0%)
5(0.2%)
2,373(100%)
2019 113(4.8%)
1,333(57.0%)
64(2.7%)
13(0.6%)
157(6.7%)
448(19.1%)
273(11.7%)
5(0.2%)
2,340(100%)
Source: Directly obtained from the Albanian government.
<Table 2-5> GDP Growth in Albania
Indicators 2013 2014 2015 2016 2017 2018 2019
GDP (Constant 2010 Mil. US$) 12,528 12,750 13,033 13,465 13,977 14,546 14,872
Growth Rate (%) 1.0 1.8 2.2 3.3 3.8 4.1 2.2
Source: Directly obtained from the Albanian government.
Despite modest economic growth during 2013 to 2019, total final energy consumption in Albania decreased by approximately 0.2%. However, the final energy demand growth increased by approximately 28ktoe and 44ktoe for households and service, and transport sector, respectively. Currently, both the sectors together consume the largest amount of energy in Albania, accounting for 78% of the total final energy demand, followed by the industrial sector (18.3%) and agriculture sector (3.8%).
<Table 2-6> Total Final Energy Consumption by Sector in Albania(Unit: ktoe)
Year Households & Service etc. Industry Transport Agriculture TFC
2013 722 419 816 114 2,071
2019 750 378 860 79 2,067
Source: Directly obtained from the Albanian government.

Gas Sector Expansion Strategy for Energy Diversification in Albania
098
Although the Albanian natural gas demand is currently not significant, the government plans to replace a significant portion of energy consumption in the power generation, heavy industry, and refineries (anchor load) from oil-based sources to gas.
GMP projected total energy supply with the assumption that CCGT will primarily replace entire electricity imports, considering its to be 60%. It also estimated that natural gas will be utilized in heavy industry instead of oil products. Further, it assumed that natural gas will substitute 20% of wood biomass use.2
<Table 2-7> TPES by Resources in Albania, Natural Gas Scenario(Unit: ktoe)
Resources 2013 2020 2025 2030 2035 2040
Solid Fuels 93 93 79 41 34 30
Oil Products 1,200 1,424 1,697 2,054 2,302 2,393
Natural Gas incl. CCGT 8 242 458 833 1,060 1,371
Wood and Biomass 182 255 281 290 287 257
Other 16 18 19 18 18 12
Solar 6 22 31 43 55 99
Hydro Electricity 409 623 769 778 754 755
Imported Electricity 454 252 34 0 0 0
Total 2,367 2,928 3,369 4,057 4,509 4,917
Source: Gas Master Plan (2016).
[Figure 2-6] Total Primary Energy Supply in Albania, Natural Gas Scenario, 2040(Unit: %)
Solid fuels50.7
Solar17.3
Hydro electricity19.2
Natural gas incl. CCGT 7.7Oil products 0.3Wood, biomass 0.7
Other 0.3
Imported electricity 3.9
Source: Gas Master Plan (2016).
2 IFP4-WB11-ALB-ENE-01 Final Gas Master Plan (November 2016), p. 132.

099
CHAPTER
02Long-Term
Outlook for Natural Gas Dem
and/Supply in Albania and the Strategy for Demand Drive of Natural Gas
<Table 2-8> TFEC by Sector in Albania, Natural Gas Scenario(Unit: ktoe)
Sector 2013 2020 2025 2030 2035 2040
Households 546 649 721 773 827 881
Services 176 231 275 316 374 415
Industry 411 546 635 793 882 964
Transport 816 1,081 1,326 1,654 1,860 1,914
Agriculture 114 136 164 207 251 288
Construction and Mining 8 22 39 69 114 185
Total 2,071 2,666 3,160 3,812 4,307 4,647
Source: Gas Master Plan (2016).
[Figure 2-7] Total Final Energy Consumption in Albania, Natural Gas Scenario, 2040(Unit: %)
Households26.4
Transport39.4
Industry19.8
Services 8.5
Agriculture 5.5Construction and Mining 0.4
Source: Gas Master Plan (2016).
Albania is the only country which is not linked to the interstate gas transmission systems in Europe.3 The total volume of gas demand is quite less and concentrated in the southern part of the country for its refining industry. Divjaka and Frakull are existing gas field that fulfil domestic demand with limited gas. Further, a small amount of associated gas has been produced from Ballsh. Two oil refineries at Ballsh and Fier are significant. Fertilizer plants that have either shut down or reduced their production were the main consumers of natural gas in the 1970s; now, refineries in Ballsh and Fier account for the majority of natural gas consumption.
3 IFP4-WB11-ALB-ENE-01 Final Gas Master Plan (November 2016), p. 40.

Gas Sector Expansion Strategy for Energy Diversification in Albania
100
According to the GMP for Albania & Project Identification Plan, potential gas consumption in Albania is projected to reach 927 mcm in the residential, service, and industrial sectors by 2040 and is expected to reach 684 mcm to anchor demand (437.4 mcm for power plant and 247 mcm for process industry).
[Figure 2-8] Natural Gas Demand Projection in the GMP of Albania(Unit: ktoe)
Residential Sector Service Sector Industrial Sector Anchor consumers, others TPP/CCGT
6.90
16.09
37.21
84.83
190.03
5.51
19.38
67.36
186.90
222.46
14.29
65.57
230.56288.43
357.32
145.36
216.79
216.79 210.97
205.16
57.23 123.56257.30 261.01
363.27
0
200
400
600
800
1,000
1,200
1,400
1,600
2020 2025 2030 2035 2040
Source: Gas Master Plan (2016).
<Table 2-9> Potential Natural Gas Consumption in 2040 (Natural Gas Scenario)
Sector mcm ktoe
Residential Sector 228.8 190.0
Service Sector 267.8 222.5
Industrial Sector incl. Agriculture and Transport 430.2 357.3
Total for Sectors 926.8 769.8
Anchor Consumers 684.4 568.4
Total 1,611.2 1,338.2
Source: Gas Master Plan (2016).

101
CHAPTER
02Long-Term
Outlook for Natural Gas Dem
and/Supply in Albania and the Strategy for Demand Drive of Natural Gas
4.2. Our Approach to GMP in Albania
With the Korean experience to develop a natural gas target demand, we applied a two-step approach to update the GMP of Albania; the first step involved the updating of the BaU (Business as Usual) scenario in the GMP based on the sectoral GDP growth, and the second step is to apply expected and/or planned demand according to scenarios. For the latter, we have surveyed the major consumers of natural gas in Albania. The following three-page questionnaire was produced:
[Figure 2-9] A Survey for the Natural Gas Demand of Albanian Industrial Sectors

Gas Sector Expansion Strategy for Energy Diversification in Albania
102
[Figure 2-9] Continued

103
CHAPTER
02Long-Term
Outlook for Natural Gas Dem
and/Supply in Albania and the Strategy for Demand Drive of Natural Gas
Source: Authors.
[Figure 2-9] Continued

Gas Sector Expansion Strategy for Energy Diversification in Albania
104
The responses and willingness of potential consumers could be helpful in substituting the sectoral outlook data–which has not yet been developed in Albania. We selected the possible consumers from oil and gas development, cement, refinery, iron and steel, gas distribution service, and electricity sectors. With the support of the local expert and Albanian government, we identified a list of 12 potential candidates for the survey. The survey was conducted from June to July in 2021. All the corresponding practices were conducted online due to the COVID-19 restrictions.
5. Results and Proposals for Natural Gas Demand Promotion in Albania
5.1. Household & Service Sector
According to the “Gas Master Plan for Albania & Project Identification Plan,” energy demand of households can be separated into three parts. Firstly, energy use in space heating, which is considering the heated area, heat losses, degree-days, K-value. The GMP outlook assumes that the Share (%) of heated area out of the total living area (load factor) is 51% which depends on the purchasing ability of the population, availability of firewood, price of electricity, and life priorities arising from tradition and cultural heritage. Therefore, it is expected that the Share (%) of heated area out of the total housing area will increase approximately 80% by 2040. As of 2013, heat consumption for space heating area was 115 kWh/㎡, and weighted degree days based on the number of housing units in individual municipalities amounted to 1,539. The K-value was determined as 3.12 Wh/㎡/h.
Secondly, it has been assumed that energy used for cooking is equal to 1,500 kWh/household. This is in accordance with the lifestyle and is estimated to decrease by 2040 due to reduction in the number of persons per household, gradual change in daily work cycle, and higher representation of food service in the service sector. This would equate to 1,050 kWh/household. Lastly, energy use for water heating may correspond with the lower level of 450 kWh/capita (as in Croatia), which is expected to rise to 650 kWh/capita by 2040.
The GMP report considered certain a number of households from prefectures and then municipalities, and calculated potential natural gas consumption according to prefectures and by regions/zones of Albania.

105
CHAPTER
02Long-Term
Outlook for Natural Gas Dem
and/Supply in Albania and the Strategy for Demand Drive of Natural Gas
<Table 2-10> Price Level of Alternative Fuel to Natural Gas
Fuel TypePrice in All
(All/ ℓ)Price in USD
(USD/ ℓ)Gross
Calorific Value(MJ/ℓ)
Calorific price (USD/MJ)
min max min max min max
Gasoline 160 180 1.6 1.7 32.7 0.05 0.05
Diesel 150 162 1.5 1.6 37.8 0.04 0.04
LPG for Vehicle(Butane) 53 0.5 25.1 0.02
LPG for Other Use (Propane) 45 55 0.4 0.5 25.6 0.02 0.02
Source: Directly obtained from the Albanian government.
According to “the natural gas scenario of GMP report,” natural gas demand in residential sector is projected to increase from 8.3 mcm to 228.8 mcm during the period of 2020 to 2040. The demand of natural gas in the service sector is expected to increase from 6.63 mcm in 2020 to 267.8 mcm in 2040.
Despite the stable development of the production of natural gas, the lack of price competitiveness handers natural gas supply expansion. The IHS projected that natural gas would take price competitive to oil until 2050. The demand for natural gas may increase more than expected if the source of natural gas’ price competitiveness in terms of raw material price is considered. Nevertheless, demand for natural gas mat shrink as well.
<Table 2-11> Price Level of Natural Gas for Price Competitiveness(Unit: USD/m3)
Fuel TypeGas Price
Minimum Maximum
Gasoline 2.05 2.30
Diesel 1.66 1.79
LPG for Vehicle (Butane) 0.88
LPG for Other Use (Propane) 0.74 0.90
Source: Authors, recalculate using Albania government data.

Gas Sector Expansion Strategy for Energy Diversification in Albania
106
[Figure 2-10] Oil & Natural Gas Price Outlook in Europe(Unit: USD/MMbtu)
Oil (Brent) European Term European Spot (NBP)
0
15
15
15
20
25
2000 2005 2010 2015 2020 2025 2030 2035 2040 2045 2050
Source: IHS Market (2021).
5.2. Industry Sector
According to the “Gas Master Plan for Albania & Project Identification Plan,” energy demand in the industrial sector was determined in the context of GDP growth rate of Albania during 2020 to 2040. The assumed annual GDP growth rate is 4%.
The GDP/capita of Albania is estimated around $5,000 (real 2005 USD)/cap by 2020. It has been predicted to increase to about $11,000-$12,000 USD (real 2005 USD)/cap by 2040. It is suggested that Albania should use $11,110 (real 2005 USD)/cap in 2040, which corresponds to the GDP growth of 4% per year during 2020 to 2040.
[Figure 2-11] Projected GDP Growth Rate of Albania(Unit: %)
0
3
2
1
4
5
2014 2015 2016 2017 2018 2019 2020 2025 2030 2035 2040
Source: Gas Master Plan (2016).

107
CHAPTER
02Long-Term
Outlook for Natural Gas Dem
and/Supply in Albania and the Strategy for Demand Drive of Natural Gas
In 2013, the Share (%) of agriculture in Albania was relatively high, and by 2040 it will reduce from 22.5% to 12% of the total GDP. Further, the Share (%) of manufacturing was 17.5%—relatively high Share (%) compared to the economically developed countries —and is expected to increase to 22% by 2040.
<Table 2-12> Assumption for GDP Growth and Structure
Indicator and Sector 2013 2020 2025 2030 2035 2040
Total GDP(bil. USD2005) 11.35 14.8 18.01 21.91 26.66 32.44
Share in Total (%)
Agriculture 22.5 19.8 17.8 15.9 13.9 12
Mining 5.7 5.7 5.8 5.9 5.9 6
Manufacturing 17.5 18.7 19.5 20.3 21.2 22
Services 52 53.2 54 54.8 55.7 56.5
Energy sector 2.4 2.7 2.9 3.1 3.3 3.5
Total 100 100 100 100 100 100
Source: Gas Master Plan (2016).
As of 2019, the total final energy consumption (TFEC) of the industrial sector in Albania was 378.4ktoe. Construction industry accounted for more than half of total energy consumption, and the remaining came from food, ore-extraction, iron & steel, and chemical industry.
[Figure 2-12] Final Energy Consumption in Albania by Industrial Sector (2019)(Unit: %)
Glass, Pottery &Building Mat. Industry
55.5
Non-ferrous Metal Industry 1.2
Other Industries 5.1Iron & Steel Industry 7.5
Engineering & Other Metal Industry1.3
Paper and Printing 2.3
Textile, Leather & Clothing Industry4.0
Ore-extraction Industry 5.5
Food, Drink & Tobacco Industry14.2
Chemical Industry 3.6
TFEC in Industry Sector378.4ktoe
Source: Directly obtained from the Albanian government.

Gas Sector Expansion Strategy for Energy Diversification in Albania
108
As mentioned above in this chapter, the Albanian government plans to replace oil products in anchor load with natural gas. Major industries considered as anchor loads include refining (petrochemical) industries which partly contain fertilizer industries, heavy industry, and power generation.
Therefore, in addition to the GMP natural gas scenario, KSP’s objective to project scenarios was devised by reflecting on the characteristics and recent trends of some industries that belong to the anchor load. In case of heavy industry, there are many specific industries, so the focus was on steel which is the most energy-intensive industry among heavy industries.
5.2.1. Petrochemical Industry
“Oil Refining” is a key process in the petrochemical industry. Refining process refers to the process to transforming crude oil into useful products such as liquefied petroleum gas (LPG), gasoline or petrol, kerosene, jet fuel, diesel oil, and fuel oils. Natural gas consumption in the petroleum refining process can be divided roughly into fuel and feedstock.
First, natural gas can be used as a fuel in the refining process. Crude oil is heated between 340° C and 360° C in a heater to purify it. The heated oil is then fed to an Atmospheric Distillation Unit (ADU). The energy consumed in this process accounts for about 80% of the total energy consumed in the refining process. Traditionally, the main fuels for the heater were Bunker C and LPG, which are by-products of the crude oil refining process. The proportion of Bunker C and LPG as a fuel in this process was determined by the market price. Due to the high demand for LPG for heating in homes and commercial sectors during the winters, the amount of LPG use as a fuel tends to decrease in winter.
In case B-C, this fuel is much cheaper than LPG and represents high caloric value; It also causes pollutants such as smokes and cokes. To remove these pollutants, an electrostatic precipitator must be operated while the heater is running. The heater has to be cleaned periodically, which incurred additional costs. Additionally, environmental regulations regarding SOx, NOx, and particulate matter, which generated from combusting Bunker C, have been strengthened.
For these reasons, petrochemical companies have replaced Bunker C with natural gas. Natural gas has a lower calorific value than Bunker C, but it can be burned almost completely, allowing continuous operation of the heater without any additional cleaning. Moreover, it emits lesser air pollutants compared to Bunker C, so its usage is rapidly increasing.

109
CHAPTER
02Long-Term
Outlook for Natural Gas Dem
and/Supply in Albania and the Strategy for Demand Drive of Natural Gas
However, due to the low caloric value of natural gas, the use of city gas alone in the refinery heaters may lead to a decrease in the volume of processed crude oil. Therefore, city gas is currently used as a blending fuel that partially replaces Bunker C or LPG. Blending ratio of natural gas and others is different depending on the market price.
[Figure 2-13] Fractional Distillation Unit of Crude Oil
HOT (350°C)
Residue> 600°C
Fuel Oil370°C - 600°C
Lubricating Oil300°C - 370°CCrude Oil
Diesel250°C - 350°C
Large Molecules:• High boiling point• Not very volatile• Harder to ignite• Does not flow
Kerosine175°C -325°C
Naphtha60°C - 100°C
Petrol40°C - 205°C
Small Molecules: • Low boiling point• Very volatile• Easier to ignite• Flows easily
Refinery Gas < 40°CCOOL(25°C)
Source: Science-resources (2009).
Secondly, natural gas can be used as feedstock in the refining process. The consumption of natural gas as a feedstock is mainly related to the hydrogen production process. In the refining process, sulfur, nitrogen, and heavy metals materials should be removed through hydrogenation during the purification process. Methane decomposition is often utilized to produce hydrogen.
CH4+H2O ⇔ CO+3H2 CO+H2O ⇔ CO2+H2
CH4+2H2O ⇔ CO2+4H2
Major factors which determine the amount of natural demand in this refining process are: 1) industrial activity in refining industry, 2) relative price to LPG or B-C, and 3) environmental restriction by government.

Gas Sector Expansion Strategy for Energy Diversification in Albania
110
Natural gas can also be utilized for “Basic Chemical Process” in the petrochemical industry. To explain the basic chemical process, this report focuses on the naphtha cracking process (NCC, Naphtha Cracking Center) as an example. This process involves cracking naphtha (that has been separated and purified in the refining process) thermally to produce ethylene, propylene, mixed C4s, and pyrolysis gasoline.
Thermal cracking process consumes the largest Share (%) of energy in the entire naphtha cracking process. The fuel consumption of the facilities of a naphtha cracking center is about 250 giga calories per hour during normal operation. About 80% of that (200 giga calories per hour) is consumed by the furnace, while 40 giga calories per hour is consumed by the gas turbine for electricity production. The remaining 10 giga calories per hour are consumed by flare burners and other equipment. Of the total 250 giga calories per hour, 200 giga calories per hour is supplied through the combustion of the by-products, hydrogen, and methane. The remaining 50 giga calories per hour is supplemented through LPG or natural gas.
In Albania, total Final Energy Consumption of the industrial sector is estimated around 635ktoe in the whole industrial sector, and it is expected to reach about 964ktoe in 2040. To determine the total final energy consumption according to sub-sector, we considered the composition of energy consumption of sub-industry the same as non-OECD countries in 2017.
<Table 2-13> TFEC by Sector in Albania, Natural Gas Scenario(Unit: ktoe)
Sector 2020 2025 2030 2035 2040
Industry 546 635 793 882 964
Source: Gas Master Plan (2016).
Since there is no information on the change of industrial structure and industrial production growth according to specific industries, it is assumed that the Share (%) of the petrochemical industry in total energy consumption remains the same.
According to the IEA (2019) data, energy consumption by a fuel of chemical and petrochemical in non-OECD countries is about 16.9%, and the Share (%) of its coal is about 32.1%. The Share (%) of oil products is 13.4% in total.

111
CHAPTER
02Long-Term
Outlook for Natural Gas Dem
and/Supply in Albania and the Strategy for Demand Drive of Natural Gas
<Table 2-14> TFEC by Fuel Type in Chemical & Petrochemical of Non-OECD (2017)(Unit: Million toe)
Fuel Type Coal Oil Product
Natural Gas
Biofuel/Waste Electricity Heat Total
Chemical & Petrochemical 98.86 41.13 52.07 0.27 68.77 46.66 307.76
Share in Total (%) 32.1 13.4 16.9 0.1 22.3 15.2 100.0
Source: IEA (2019).
As of 2019, total final energy consumption of chemical industry in Albania was 13.5ktoe (3.5% in total industrial energy use), energy use in this sector can be divided into two resources: oil products (7.5ktoe) and electricity (6.0ktoe).
Assuming the fuel mix in the chemical and petrochemical is going to be similar to that in non-OECD countries, most of the coal and oil products would be replaced with natural gas. Total natural gas consumption of the petrochemical industry is expected to reach about 21.5ktoe (62.4% of total energy consumption in chemical and petrochemical sector) in 2040. Using the conversion factor, this value is converted into 25.9mcm.
As the issues associated with environmental pollutant become significant, B-C fuel becomes much cheaper than LPG. This represents high caloric value but also causes pollutants such as SOx, NOx, and fine dust. Therefore, petrochemical companies have replaced coal and Bunker C with natural gas.
5.2.2. Iron and Steel Industry
The steelmaking process can be divided into blast furnace steelmaking, which uses iron ore and bituminous coal, and electric furnace steelmaking, wherein iron scraps are melted and recycled. Since the two steelmaking methods differ only in their approach to produce molten steel, the subsequent processes are similar.
Blast furnace steelmaking can be roughly divided into four processing stages: ironmaking, steelmaking, continuous casting, and rolling processes. The ironmaking process involves the creation of pig iron by feeding iron ore and coke into a blast furnace. Steelmaking involves the production of molten steel by adjusting the carbon content and increasing the purity to increase the pig iron’s processability. Continuous casting signifies the process of pouring molten steel from the steelmaking process into a casting mold to cast intermediate steel products, such as billets (semi-finished products for making rebar), slabs (for making steel plates), and blooms (used to make large steel sections for construction).

Gas Sector Expansion Strategy for Energy Diversification in Albania
112
Rolling signifies a process through which the semi-finished casting products, created in the continuous casting process, are placed between two rolls to produce various types of final steel products, such as steel plates, wire rods, and steel sections.
In this process, natural gas is mainly used in the rolling process. When intermediate castings such as billets, slabs, and blooms produced in the continuous casting process more ahead toward the rolling process, their subsequent temperature is between 740° C and 800° C. In general, adequate processability is essential for rolling, which further requires a temperature of about 1000° C to 1100° C.20 Therefore, prior to rolling, casting products and semi-finished casting products are heated in a heating furnace to raise their temperature.
In the past, Bunker C and by-product gases were mainly used as heat sources for the heating furnace. However, city gas has gradually replaced Bunker C due to the government’s regulations on greenhouse gas emissions and air pollution and management issues22 regarding Bunker C-fueled boilers and storage facilities. Currently, city gas has almost entirely replaced Bunker C. Therefore, current heat sources for heating furnaces are city gas and by-product gases of iron and steel production.
[Figure 2-14] Manufacturing Process of Hot Rolled Steel Sheet and Coil
Slab
Pickled Hot Rolled Steel Coil Pickling Line
Reheating Hot Rolling
Source: iStock (2021).
As of 2019, the total final energy consumption of iron and steel industry in Albania was 28.3ktoe (7.5% in total industrial energy use). Energy use in this sector can also be divided into two resources: oil products (3.1ktoe) and electricity (25.1ktoe).

113
CHAPTER
02Long-Term
Outlook for Natural Gas Dem
and/Supply in Albania and the Strategy for Demand Drive of Natural Gas
Considering that fuel mix in the steel and iron industry in Albania is similar to that in non-OECD countries, and most of the energy resources except raw material would be replaced with natural gas, consumption of natural gas in this sector is expected to reach 21.5ktoe in 2040 (25.9 mcm).
<Table 2-15> TFEC by Fuel Type in Steel & Iron Industry of Non-OECD (2017)
Fuel Type Coal Oil Product Natural Gas Electricity Heat Total
Steel & Iron (Million toe) 277.66 4.50 28.29 68.18 13.16 395.37
Share in total (%) 70.2 1.1 7.2 17.2 3.3 100.0
Source: IEA (2019).
5.2.3. Fertilizer Industry
Although the fertilizer industry is not energy intensive, the Albanian government plans to foster it which might facilitate the emergence of natural gas demand in Albania. Modern synthetic fertilizers are composed mainly of nitrogen (N), phosphorous (K2O), and potassium (P2O5) compounds along with secondary nutrients. Ammonia (NH3) is usually used as a raw material to produce nitrogen. Natural gas is used as a raw material in the process of producing ammonia, that is, “the Haber-Bosch process.”
[Figure 2-15] Harber-Bosch Process FlowSteam
Reforming
Reactor
CO Shift
Catalystbed
CO2 Rem
oval
Heater
Cooler
Heatboiled
N2, H2, CO2
N2, H2N2, H2, CO
CH4, H2O
Air
N2, H2, NH2
N2, H2,NH3
N2, H2
NH3
Source: Manh-Hiep (2018).

Gas Sector Expansion Strategy for Energy Diversification in Albania
114
In 2015, the demand for fertilizer nutrient was 184.02 million tonnes. It is estimated that this demand will reach 201.66 million tonnes by the end of 2020. Nitrogen-based fertilizers account for 59% of the total Share (%) as of 2020.
<Table 2-16> Demand for Fertilizer Nutrient Use in the World(Unit: 1,000 Tonnes)
Fertilizer Nutrient 2015 2016 2017 2018 2019 2020
Nitrogen 110,027 111,575 113,607 115,376 117,116 118,763
Phosphate 41,151 41,945 43,195 44,120 45,013 45,858
Potash 32,838 33,149 34,048 34,894 35,978 37,042
Total 184,017 186,668 190,850 194,390 198,107 201,663
Source: FAO (2015).
According to the Food and Agriculture Organization (FAO)’s data there was no domestic production of fertilizers (nitrogen (N), phosphorous (K2O), and potassium (P2O5) compounds) in Albania during 2011–2019; however, it imported 54,535 tonnes of fertilizer as of 2019. Domestic production of N-type fertilizers is expected to increase and replace imports when the natural gas supply is invigorated.
<Table 2-17> Fertilizers Imports by Nutrient in the Albania(Unit: Tonnes)
Fertilizer Nutrients 2014 2015 2016 2017 2018 2019
Nitrogen 8,490 32,125 27,788 19,216 23,022 35,524
Phosphate 12,001 9,046 18,453 15,438 10,485 15,423
Potash 1,042 1,859 1,932 1,542 2,317 3,588
Total 21,533 43,030 48,173 36,196 35,825 54,535
Source: FAOSTAT (2021).
5.3. Transport Sector
5.3.1. Heavy-Duty Trucks
Use of fuel in the transportation sector is mostly concentrated on petroleum products (gasoline, diesel, and LPG). Consequently, an increase in the price of oil becomes a social problem. Therefore, developing alternative fuels for a stable supply of transportation energy is required. It is necessary to utilize eco-friendly energy resources that cause less pollution than oil products. Most of the commercial vehicles in the domestic transportation sector commonly use diesel which causes significant environmental damage by emitting air pollutants such as fine dust.

115
CHAPTER
02Long-Term
Outlook for Natural Gas Dem
and/Supply in Albania and the Strategy for Demand Drive of Natural Gas
Strengthening environmental regulations and oil-gas price differentials continue to drive interest in LNG as a transportation fuel. Improvements in gas-fueled engines and on-board storage have significantly decreased the incremental cost versus a conventional diesel truck.
The EU mandated Regulation 2019/1242, which establishes CO2 emission standards for heavy-duty vehicles. According to the WTW (Well to Wheel) analysis by the European Natural Gas Vehicle Association (NGVA), it was found that replacing the fuel of large trucks with LNG from diesel can reduce greenhouse gas by up to 15%.
[Figure 2-16] Heavy-duty Vehicles GHG Intensity(Unit: g CO2-eq/km)
1,074
912
1,005
908
-15%
-6%
-16%
800
Diesel (FQD)
HPDI (LNG)
SI (LNG)
SI (CNG)
850 900 950 1,000 1,050 1,100
Source: EU NGVA (2017).
China is the largest market for LNG as fuel for vehicles. There were 343,933 LNG fueled vehicles in China as of 2018. One-third of the (236,265) sales are LNG Heavy Duty Truck (HDT).
[Figure 2-17] LNG Refueling Sites and LNG HDT Sales in China
200
610
1,481
1,9622,260
2,460 2,528 2,552
0
1,000
500
1,500
2,000
2,500
3,000
0
60,000
40,000
20,000
80,000
100,000
120,000
Num
ber o
f Site
HDT
Sal
es
2011 2012 2013 2014 2015 2016 2017 2018
No. of Refueling Site No. of HDT Sales
Source: Yuan (2019).

Gas Sector Expansion Strategy for Energy Diversification in Albania
116
The lower retail price of natural gas can instigate its demand, especially for HDV (Heavy Duty Vehicles) such as trucks. Updating sectoral legislation under European Green Deal Commitment by June 2021, EU Regulation 2019/1242 categorized trucks into 18 different groups.
<Table 2-18> TFEC in Transport Sector in Albania (2019)(Unit: ktoe)
Transport Sector LPG Kerosene /Jet Fuels
Gas/Diesel Oil Gasoline Bio Diesel Total
Transport 10.6 21.0 719.4 99.0 9.5 859.5
Railways - - 2.1 - - 2.1
Road Transport 10.6 - 687.9 92.2 9.5 800.2
Air Transport - 21.0 - - - 21.0
Inland Navigation - - 29.4 6.8 - 36.2
Source: Authors, recalculate using Albania government data.
The use of natural gas in heavy goods vehicles (trucks) is steadily increasing, especially in mainland China and North America. Decarbonization of HDV requires a toolbox of different instruments and main streaming into a wide range of regulatory and non-regulatory measures.
[Figure 2-18] Natural Gas Market Share in Heavy Duty Trucks(Unit: %)
0.0
0.04
0.02
0.06
0.08
0.10
0.12
0.14
0.16
0.18
2010 2015 2020 2025 2030 2035 2040 2045 2050
Rivalry Autonomy Discord History
Source: IHS Markit (2021).

117
CHAPTER
02Long-Term
Outlook for Natural Gas Dem
and/Supply in Albania and the Strategy for Demand Drive of Natural Gas
5.3.2. Inland LNG Bunkering
In October 2016, the International Maritime Organization (IMO) decided to implement a regulation to strengthen the sulfur content of ship fuel oil from 3.5% to 0.5% from 2020 onward. There are three methods to respond to the sulfur oxide emission regulations. First, using low-sulfur oil, which is about 50% to 60% more expensive than the high-sulfur oil currently being used. Second, installing a scrubber and desulfurization device, while continuing to use high-sulfur oil. Last, using LNG as the fuel for ships. The third method facilitates the demand for natural gas. Even though choosing LNG as a fuel can satisfy environmental regulation by IMO, it is difficult to adopt without cost effectiveness compared to other means.
Although natural gas retains a commodity price advantage even at low oil prices, the higher fixed costs of producing and delivering LNG erode and can reverse that advantage. Capex costs for LNG-fueled vessels are significantly higher than those of conventionally fueled vessels. For the largest vessels, LNG emerges as the most attractive marine fuel in the long term for the total cost of ownership. However, low-sulfur fuels, scrubbers, and other options can be more attractive for medium and smaller vessels.
As of 2019, there are 162 LNG fueled vessels in operation, and 114 vessels are ready to use LNG.4 The number of fleets using LNG as a fuel in is expected to increase to 546 in 2027.
[Figure 2-19] Yearly Development of LNG Fueled Fleet
0
100
200
300
400
500
600
2000 2003 2006 2007 2008 2009 2010 2011 2012 2013 2014 2015 2016 2017 2018 2019 2020 2021 2022 2023 2024 2025 2026 2027
In Operation On Order LNG Ready
221818 32 43 53 7070 8888
3434
105105
5353
130130
8080
162162
114114
173173
57
126126
173173 173173 173173 173173 173173 173173 173173
130130
142142
195195 218218 222222 225225 226226 227227
146146146146 146146 146146 146146 146146
Source: DNV GL (2020).
4 LNG ready stage means the vessels still utilize heavy fuel oil but planned to be retrofitted with equipment that allows LNG use.

Gas Sector Expansion Strategy for Energy Diversification in Albania
118
As of 2016, there were 53 ports that were equipped with LNG bunkering facilities, many of them were located in Europe including Norway. Of these, 35 ports are in decided stage, and most of the ports will be operational in Europe.
[Figure 2-20] Number of Port for LNG Bunkering by Stage and Region
Under Discussion
Decided
In Operation
Source: Globallnghub (2017).
As mentioned above, LNG price is expected to be competitive compared to petroleum based on the same calorific value, but the price gap between the two fuels is projected to reduce gradually. Therefore, to form the LNG bunkering market in Albania, the government has to prepare a plan to support the fuel cost for LNG fueled vessels and consider establishing a subsidy policy for LNG bunkering infrastructure expansion.
According to the major research organization, World LNG bunkering Demand is expected to reach 8–17 million LNG ton in 2025, which will keep increasing to 37–49 to become 52.6 million LNG ton in 2040.
<Table 2-19> World LNG Bunkering Demand Outlook(Unit: LNG million ton)
Demand Outlook 2025 2030 2035 2040 2045
IEA (2019)
Current Policies 3.5 7 11.4 16.5 -
Stated Policies 7.8 15.8 25.1 37 -
Sustainable Development 6.3 10.2 11.9 10.8 -
IHS (2020)
Rivalry 17.1 24.8 35.1 49.2 60.3
Autonomy 19.3 31.2 45.7 65.7 80.4
Discord 14.5 21.9 33.9 56.6 70.1
Source: IEA (2020)., IHS (2020)., Long-term LNG Market Outlook (2019).

119
CHAPTER
02Long-Term
Outlook for Natural Gas Dem
and/Supply in Albania and the Strategy for Demand Drive of Natural Gas
In 2018, the amount of oil bunkering for inland use in Albania was 33.6 thousand tones5 which accounted for about 0.015% of the total amount of oil bunkering in the world. Assuming that Albania's inland LNG bunkering amount also account for about 0.015% of the World LNG bunkering demand, inland LNG bunkering in Albania is expected to reach 1,706 tonnes in 2025 and 6,307 in 2040.
<Table 2-20> Inland LNG Bunkering Demand in Albania(Unit: LNG million ton)
Bunkering Unit 2025 2030 2035 2040
LNG Bunkering(Inland)
LNG ton 2,320 3,961 5,936 8,577
mcm 2.32 3.96 5.94 8.58
Source: Authors, based on the Albanian government’s data.
5.4. Survey Results
5.4.1. Survey Pool
With support from the local expert, we gathered the following survey data that could be considered as representative of natural gas consumers. The survey was conducted during June 2021, and three of 12 responses were received.
<Table 2-21> Survey Pool for the Natural Gas Demand Analysis
Company Personnel Sector Response(as of 18th June)
Bankers Petroleum Albania
Mr. Qing Fang(CEO)
Oil and Gas(upstream) O
Kruja CEM - Cement X
Elbasan CementFactory - Cement X
Al Global(Refinery of Fier)
Mr. Endri Pema(Director) Refinery X
Bitex Refinery(Refinery of Elbasan)
Mr. Rebani Likometa (Director) Refinery X
ANIO OIL & GAS(Ballsh)
Mr.Alban Peza(Director)
Oil and Gas(upstream) X
Terra Oil (Visoke)
Mr. Shefqet Dizdari(Director)
Oil and Gas(upstream) X
Antea Cement Mario Bracci(CEO) Cement O
5 Data from Albania Government.

Gas Sector Expansion Strategy for Energy Diversification in Albania
120
Company Personnel Sector Response(as of 18th June)
KurumInternational SA
Mr. Yusuf Kurum(Director) Iron and Steel X
Albgaz Mr. Arber Avrami(CEO)
Oil and Gas(downstream) O
Albpetrol Mr. Flamur Mato(CEO)
Oil and Gas (up & downstream) X
KESH Mr. Besjan Kadiu(CEO) Electricity X
Source: Authors.
5.4.2. Responses
The survey results indicate that the anticipated energy demand growth of three companies by 2040 is substantial (see the following table). In particular, the increase in the electricity sector is noticeable. Since the electricity supply from hydropower is limited in Albania, natural gas power plants and other clean power sources, such as renewables, are essential to support the sustainable growth of Albanian industries.
<Table 2-22> Anticipated Demand Increase by 2040
Source Amount Unit
Natural gas 80,000 M3
Electricity 245,446,446 kWh
Diesel 2,000,000 liter
Propane 1,500,500 liter
Petcoke 10,000 kton
Bituminous Gravel 10,000 kton
Source: Authors.
In the survey, we also tried to identify the respondents’ willingness to switch to natural gas assuming that the infrastructure to supply natural gas is completely ready. However, many respondents reserved their positions because the “price competitiveness” of natural gas is an essential factor to determine the change; therefore, they could not make a decision. For example, one company answered that “we are willing to assess the possibility on natural gas energy source in case there is enough capacity, commercial rationale and in case all the facilities will be ready to facilitate the project, with an assumption that all cost of facilities
<Table 2-22> Continued

121
CHAPTER
02Long-Term
Outlook for Natural Gas Dem
and/Supply in Albania and the Strategy for Demand Drive of Natural Gas
preparation will be handled by Gas Distribution company.” Another company stated, “we have ambitious targets for the reduction of CO2 emissions and the replacement of traditional fuels with natural gas and/or alternative fuels is considered our priority. The emissions target combined with cost competitiveness of natural gas will allow fully replacement of the traditional fuels.” These responses can facilitate the promotion of natural gas consumption in Albania.
Albgaz Sh.a., the 100% state-owned public company and licensed transmission system operator (TSO) and distribution system operator (DSO) of Albania, has just one notable customer, Albpetrol Sh.a.. Currently, it does not have data on the future demand for natural gas within the industrial sectors, but they provided rough estimates. These are as follows:
<Table 2-23> Rough Estimation for Future Natural Gas Demand in Albanian Industries
Project (PIP) Capacity (mcm) Energy Production (MWh/h) End-user Expected
Commissioning
TPP Vlora 150-450 100-300 TPP Vlora (Gas-to-Power) 2025
PRMS Vlora 250 - SME & Residents 2024
PRMS Fier 250 - SME & Residents 2024
PRMS Korça 250 - SME & Residents 2024
TPP Korça 300 200 TPP Korça (Gas-to-Power) 2026
Source: Authors, from Albgaz’s response.
5.5. Conclusion and Suggestions
Based on the previous research and discussions, we developed three possible scenarios to update the natural gas demand through the GMP of Albania. The assumptions underlying each scenario can be organized as follows:

Gas Sector Expansion Strategy for Energy Diversification in Albania
122
<Table 2-24> Assumptions for the Scenarios to Update the GMP
Scenario Assumptions
Low Economic Feasibility
Plans in the GMP (2016) will be partly realized (e.g., 100MW/h TPP Vlora only).
Natural gas fails to have price competitiveness so that there is no new, additional demand from all sectors.
Base
All plans in the GMP (2016) will be realized.The price of natural gas in Albania stays reasonable, but not so attractive
to change the conventional fuels.No other new demand from households and industries.
Active Market Development
All plans in the GMP (2016) will be realized.All demands from the survey will also be realized.
The natural gas demand will increase following the growth of Albanian industrial outputs.
The price of natural gas in Albania is attractive enough to change the fuels.New anchor demand by the supply from FSRU (or SSLNG) will be realized.
Source: Authors.
The Low Economic Feasibility scenario denotes that natural gas in Albania could not have price competitiveness. As discussed in the previous sections, price competitiveness is a critical factor for the successful introduction of natural gas. Determining the price of natural gas is currently impossible due to lack of prior experience with it. Policy price will regulate its market price. Thus, we developed a pessimistic “low price competitiveness” scenario for future natural gas demand. In this scenario, all sectoral demand is limited, and only TPP Vlora gas-fired power plant is considered among the power plants planned in the GMP 2016.
The base scenario is a reference, business-as-usual scenario. We assumed that all plans in the GMP 2016 will be realized with reasonable natural gas prices. “The Active Market Development” scenario represents the demand for natural gas following the materialization of most suggestions in this report. We assume an attractive natural gas price level, which can change the potential consumers’ fuel preference, and the growth of Albanian industrial outputs, including a new introduction of transportation fuel. Additionally, a new anchor demand by the supply from FSRU, which will be introduced in the following chapters, will be realized. We can say that the Active Market Development is an optimistic scenario for the natural gas market in Albania. The estimated natural gas demand according to each scenario is as follows:

123
CHAPTER
02Long-Term
Outlook for Natural Gas Dem
and/Supply in Albania and the Strategy for Demand Drive of Natural Gas
<Table 2-25> Estimated Natural Gas Demand in Albania(Unit: Million m3)
Scenario 2025 2030 2035 2040
Low Economic Feasibility 526.4 797.7 1,050.3 1,285.2
Base 531.4 974.3 1,242.7 1,611.3
Active Market Development 568.2 1,183.9 1,623.3 2,000.5
Source: Authors.
Therefore, we propose the following policy suggestions for the Albanian government to promote the demand for natural gas and realize the “Active Market Development” scenario in Albania.
- The price competitiveness of natural gas is the first thing to secure for the successful promotion of natural gas. As evident from the survey responses and theories on energy demand modeling, there is evident willingness to change the energy sources and fuels if the price and infrastructure costs remain reasonable. In Albania, due to the need for massive infrastructure investments, including pipelines, it is not easy to secure the price competitiveness of natural gas against other fossil fuels or some cheap renewables, such as hydropower. A policy price―with subsidy or tax-free price―would be necessary for the initial dissemination of natural gas. The price will eventually become competitive with the appearance of economy of scale in the Albanian natural gas market. As suggested by the Korean experience, intentional demand creation and strategic dissemination are essential for its successful introduction.
- Climate crisis and GHG emission reduction is a global megatrend, and the Albanian government and industries must consider the climate issues. Therefore, the survey responses suggest that electrification and power generation by natural gas and fuel substitution is not a choice but the only viable option. Renewables could be the future of power generation, but it is difficult to supply all electricity demand from them alone.
- Besides its role as a clean energy source, natural gas could enhance the “stability” of Albania’s energy supply system. Like Korea and other countries used gas-fired power generation as a major power source, the natural gas power plant in Albania could respond to the “peak demand (peak load)” of natural gas. Further, we can easily control the generation outputs in a (combined) gas power plant, whereas this is not possible in the case of renewables, such as hydropower, solar PV, and wind. It is essential to have a controllable room (capability) in the power sector to improve energy security. Furthermore, in Albania, the existence of gas-fired power plants can

Gas Sector Expansion Strategy for Energy Diversification in Albania
124
mitigate energy emergencies, such as extensive drought. - Natural gas supply infrastructure is essential for price competitiveness as well
accessibility. We propose promising options in Section 4, but providing clear policy directions to possible consumers, including industries, is also important.
Our analysis has some limitations.
- The number of respondents was limited. We tried to contact potential consumers multiple times and asked for help from the local expert and Albanian government, but the final number of respondents was only three. We believe that there could be more natural gas demand in Albania’s industries, and it needs to be accounted in demand.
- As discussed above, natural gas competes with other fossil fuels and renewable energy sources. Thus, the demand and supply analysis of the entire energy system, including the electricity sector, is necessary to analyze the demand for natural gas. However, doing so was beyond the scope of this project.
- Due to data limitation, e.g., the price level of each energy source, we could not apply econometric or bottom-up models for Albania’s natural gas outlook. We believe that the Albanian government can handle all these limitations in correspondence with our suggestions.
- Hydrogen would become a promising energy alternative in the near future. Although we discuss hydrogen in the following chapter, we have not determined it as a competing or complementary energy source in the analysis. Recently, Korea has started researching on the incorporation of hydrogen in a national energy model. Therefore, it would be better for Albania to handle hydrogen from the beginning of energy demand analysis.

125
CHAPTER
02Long-Term
Outlook for Natural Gas Dem
and/Supply in Albania and the Strategy for Demand Drive of Natural Gas
Bhattacharyya, Subhes and Govinda Timilsina, Energy Demand Models for Policy Formula-tion: a Comparative Study of Energy Demand Models, The World Bank, 2009.
Chang, Yoosoon et al., “Disentangling Temporal Patterns in Elasticities: A Functional Coeffi-cient Panel Analysis of Electricity Demand,” Energy Economics, Vol. 60, 2016, 232~243.
DNV·GL, LNG Statistics 2019, accessed August 28, 2020, https://afi.dnvgl.com/ Statistics?rep-Id=1.
Doosan Encyclopedia. https://terms.naver.com/entry.nhn?docId=1130011&cid=40942& cate-goryId=32387.
Energy Greenhouse Gas Total Information Platform Service Website. http://tips.energy.or.kr/overconsector/overconsector_view_01.do?code_num=MI&ch_code_num=MI01.
EIA, The National Energy Modeling System: An Overview 2018, Energy Information Admin-istration, 2019.
EU NGVA. Greenhouse Gas Intensity of Natural Gas. 2017.
FAO of UN. World fertilizer trends and outlook to 2020. 2015.
FAOSTAT, accessed May 31, 2021, http://www.fao.org/faostat/en/#data/RFN.
Global LNG Hub, https://globallnghub.com/will-lng-bunkering-transform-the-lng-market.html.
IAEA, Model for Analysis of Energy Demand (MAED-2) User’s Manual, International Atomic Energy Agency, 2006.
IEA, World Energy Balances 2019 edition, International Energy Agency, 2019.
IEA, World Energy Model Documentation, International Energy Agency, 2020.
IFP4-WB11-ALB-ENE-01, Final Gas Master Plan, European Western Balkans Joint Fund, 2016.
IHS, Long-term LNG Market Outlook. 2020.
IHS Markit. “LNG Capability, Long-Term LNG Outlook in three scenarios: Rivalry, Autonomy, and Discord.”
References

Gas Sector Expansion Strategy for Energy Diversification in Albania
126
Kang, Byunguk. “Structural Changes in the City Gas Consumption of Energy-Intensive Indus-tries.” Korea Energy Economics Institute, 2019.
Kaufmann, Larry, Lullit Getachew, Matt Makos, “Top Down” Estimation of DSM Program Im-pacts on Natural Gas Usage, Pacific Economics Group Research, 2010.
KESIS, accessed May 31, 2021, http://www.kesis.net.
Koopmans, Carl et al., Netherlands Energy Demand Model: A Top-Down Model Based on Bot-tom-Up Information, Netherlands Bureau for Economic Policy Analysis, 1999.
Manh-Hiep, Vu, “Insights into the Recent Progress and Advanced Materials for Photocatalyt-ic Nitrogen Fixation for Ammonia (NH3) Production,” Catalysts, 2018.
MOTIE, The 3rd Energy Master Plan, Ministry of Trade, Industry and Energy, 2019.
MOTIE, The 9th Basic Plan for Long-term Electricity Supply and Demand, Ministry of Trade, Industry and Energy, 2020.
MOTIE, The 13th Basic Plan for Long-term Natural gas Supply and Demand, Ministry of Trade, Industry and Energy, 2018.
MOTIE, The 14th Basic Plan for Long-term Natural gas Supply and Demand, Ministry of Trade, Industry and Energy, 2021.
OSeMOSYS, Open Source Energy Modelling System, accessed June 30, 2021, http://www.ose-mosys.org.
Science-resources. http://science-resources.co.uk/KS3/Chemistry/ Chemical_Reactions /Hydro-carbons/Distillation.htm.
Serra, Carlos. “Heavy-duty vehicles CO2 emissions: EU policy context.” Road transport DG CLIMA, European Commission (https://ec.europa.eu/clima/ policies/transport/vehicles/heavy_en).
Shkurti, Aranit, “Energy Consumption Modeling in the Western Balkan Countries Using a Top-Down Approach,” Academic Journal of Interdisciplinary Studies 7, No. 3, 2018.
TEMOA, Tools for Energy Model Optimization and Analysis, accessed June 30, 2021, https://temoacloud.com/.
WBIF, Gas Master Plan for Albania, Western Balkans Investment Framework, 2016.
Yuan, Yuan. China – The ‘Move’ To LNG, 19TH International Conference & Exhibition on Liq-uefied Natural Gas, 2019.


National Policy Establishment for Natural Gas Industrial Structure and Market Design in AlbaniaSungkyu Lee (Korea Energy Economics Institute)Eunmyung Lee (Hanyang University)Stavri Dhima (Ministry of Infrastructure and Energy)
1. Introduction 2. Strategy and Tasks for Development of Natural Gas Industry of Albania3. Overview of Korea's Natural Gas Industry4. Development of Korea’s Natural Gas Industry5. Comparison of Laws and Regulations on Natural Gas in Albania and Korea6. Recommendation: The Establishment of a Natural Gas-Related Agency
C H A P T E R
03
KeywordsLNG Introduction, Long-term Plan, Gas Facilities Safety, KOGAS, KEEI

129
CHAPTER
03N
ational Policy Establishment for N
atural Gas Industrial Structure and Market Design in Albania
Summary
This chapter introduces Korea’s experience of introducing LNG and developing the natural gas industry. It encompasses the role played by the government and energy corporations for market formation, and successful energy mix improvement with diversification of energy sources including natural gas. First, this chapter studies and discusses the current situation and restructuring process of the energy industry (especially, electricity and natural gas) in Albania, including the tasks and obstacles to increase gas supply and develop its natural gas industry. All these reform measures aim to overcome the imbalance in the energy supply of Albania through diversification of energy sources, precisely through gasification. These measures are implemented on the basis of the "National Energy Strategy 2018 - 2030" and the "Gas Master Plan for Albania" established by the Albanian government. Diversification of energy sources through the development of the gas sector begins as the completion and operationalization of the Trans Adriatic Pipeline project (TAP Project) toward the end of 2020. This project will be further promoted in the Albanian energy market. The further development of interconnection projects, such as the Ionian Adriatic Pipeline project (IAP project) and Albania-Kosovo Gas Pipeline project (ALKOGAP project), will be ensured through discussions with neighboring countries. The Albanian government is also reviewing the possibility of entering in the Albanian gas market of LNG from the United States. The development of a national and regional grid infrastructure offers Albania more options for building its natural gas supply portfolio, expanding its role as a trading hub in the region.
The following section discusses the conception and growth of the natural gas industry in the Korean economy. The introduction of LNG and development of the gas industry led by the government and energy corporations were formidable tasks to improve energy security and diversify energy sources including natural gas and nuclear energy. The
National Policy Establishment for Natural Gas Industrial Structure and Market Design in AlbaniaSungkyu Lee (Korea Energy Economics Institute)Eunmyung Lee (Hanyang University)Stavri Dhima (Ministry of Infrastructure and Energy)

Gas Sector Expansion Strategy for Energy Diversification in Albania
130
Korean government and energy corporations had to construct a nationwide network of gas infrastructure and to secure financial support during chronic balance of payment deficit. Natural gas was an agent for modernization for the Korean energy industry. KOGAS (Korea Gas Corporation) was established in 1983 through the relevant law. It was financed by the central government, local autonomous governments, electric power corporation, and general public. The Gas Business Act was enacted on December 5, 1978, and then revised as the City Gas Business Act (or Urban Gas Business Act, enacted on December 31, 1983) to regulate the city gas business more effectively and rationally. In this act, city gas refers to natural gas supplied via pipelines. Korea’s experience of establishing a long-term electricity/natural gas supply plan and developing natural gas industry will be useful for the Albanian government.
Further, this chapter also compares laws and regulations Korea and Albania on natural gas. Energy-related laws and regulations of Albania, including natural gas, have been well enacted and revised in line with the EU's legal framework, backed by EU’s policy consulting support. Restructuring of the energy industry is also being implemented within the guideline of the EU. However, because Albania is still in the early stages of development the market for natural gas, laws and organizations to regulate facilities operations/management and supply activities of natural gas, and companies and organizations to ensure safe and stable supply of natural gas have not been developed compared to advanced countries including Korea. Korea has more than 40 years of experiences in the development of the gas industry and safety management. In Albania, as the natural gas industry develops and market expands, the need for establishing related laws, regulations, and organization to ensure business activities and safety management sectors will increase significantly.
Lastly, this chapter recommends the necessity of establishing energy policy and technology think tanks as government-affiliated research institutes and their active and effective role for energy security improvement and energy industry development. It proposes the establishment of organizations related to gas safety and technology such as the Korea Gas Safety Corporation (KGS) and the Korea Gas Technology Corporation (KOGAS-Tech). Government-funded research institutes such as Korea Energy Economics Institute (KEEI), Korea Institute of Energy Research (KIER), Korea Institute of Geoscience and Mineral Resources (KIGAM), and Korea Institute of Energy Technology Evaluation and Planning (KETEP), are conducting research to propose various policy and investment alternatives to the government and energy businesses to swiftly respond to changing international energy landscape and develop new technologies. In Korea, certain public enterprises are in charge of ensuring the safety of natural gas supply and technology development. KGS is an energy corporation that tests, inspects, and educates in matters related to the safety sector

131
CHAPTER
03N
ational Policy Establishment for N
atural Gas Industrial Structure and Market Design in Albania
of natural gas supply. KOGAS-Tech was established to install reliable and safe natural gas supply facility and reduce the industry’s reliance on foreign technology through technical development in the engineering sector as a subsidiary of Korea Gas Corporation (KOGAS). The development of similar policies and organizations would benefit the stable development of the natural gas industry in Albania.
1. Introduction
The main content of this chapter is the following: Strategy and tasks for development of natural gas industry of Albania including current situation of energy industry and restructuring policy of the government, energy pricing system, and EU’s new European Green Deal and future constraint role of natural gas; Overview of Korea’s natural gas industry including exploration, production, consumption and import, and biogas and hydrogen; Development process of Korea’s natural gas industry including effort for stable energy supply for economic development, implementation process of LNG introduction and natural gas market development, support via natural gas tariff, financial aids to LNG Business, and mid/long-term energy supply and demand plan; Comparison of laws and regulations on natural gas of Korea and Albania; and lastly, recommendation for development of Albanian natural gas industry and institution about establishment of energy policy and technology think tank and public organizations related to safety management and technology development.
For Albania, the natural gas industry is developing and market is expanding rapidly with the operation of TAP project and aggressive efforts to introduce the EU legal system and guideline by the Albanian government. So, the need for establishing laws, regulations and organizations that support active business activities, safety management and technology development will be greatly increased in the future.
In the last section of this chapter, we recommended several suggestions for Albania the necessity of establishment of energy policy and technology think tank as government-affiliated research institute and introduced their active and effective role for energy security improvement and energy industry development. And it proposes establishing organizations related to gas safety management and technology development such as the Korea Gas Safety Corporation (KGS) and the Korea Gas Technology Corporation (KOGAS-Tech) as a subsidiary of Korea Gas Corporation (KOGAS).

Gas Sector Expansion Strategy for Energy Diversification in Albania
132
2. Strategy and Tasks for Development of Natural Gas Industry of Albania
2.1. Current Situation of Energy Industry and Restructuring Policy of Government
Since 1992, the Albanian economy has experienced a transformation from being a centralized economy to a market economy. Over the past two decades, the value of Gross Domestic Product (GDP) per capita has increased due to a number of factors, including an ambitious economic development program, donor-supported development program, and a geographically favorable position of a bridge connecting the Balkans with Western Europe. However, despite these significant developments, the Albanian energy sector continues to face a number of challenges:
- Meeting the demand for energy according to economic development in various sectors and the growing demand for energy consumption per capita.
- Diversification of energy supply sources, by increasing the contribution of renewable energy sources and other conventional energy sources, as well as increasing cooperation and regional integration.
- Improving the energy intensity indicator. - Increasing the security of energy supply by significantly improving energy efficiency.
Thus, important challenges for Albania are to increase energy consumption per capita, reduce the high level of energy intensity, secure stability of energy supply and demand, and diversify energy supply sources with natural gas. The self-sufficiency of primary energy sources has decreased from 97% in 1990 to about 41.2% in 2016. In addition to the above-mentioned challenges, the Albanian energy system must meet the renewable energy sources (RES) target in 2020, the energy efficiency (EE) target and the Nationally Determined Contribution (NDC) for the reduction of greenhouse gas (GHG) emission.
Energy market reforms and liberalization will go beyond the implementation of the Third Energy Package of EU within the Albanian economy. Albania is a member of the Berlin Process or the Western Balkans 6 Initiative (WB-6) and is engaged in regional integration of the electricity market as an intermediate step toward the targeted European electricity model. In addition, Albania has established the first gas transmission system operator, TAP (Trans Adriatic Pipeline) AG, certified under the Third Energy Package procedures, which has established the foundation for the development of a gas market through. The ERE (Energy Regulatory Authority) certified the second operator of the gas transmission system, Albgaz

133
CHAPTER
03N
ational Policy Establishment for N
atural Gas Industrial Structure and Market Design in Albania
Sh.a., on November 8, 2017.
To reform the electricity industry, one of the main directions was to legally and functionally unbundle the Distribution System Operator (OSHEE Sh.a.) to disrupt the distribution from the supply activity. The electricity corporation has registered three daughter companies with the National Business Center (NBC), in 2018. These companies are:
- Universal Service Supplier Sh.a. (FSHU) for the electricity supply of End-customers operating in the regulated market.
- Free Market Supplier Sh.a. (FTL) to purchase and manage electricity and operation in the free market.
- Distribution System Operator Sh.a. (OSSH) to distribute electricity, construct, operate, and maintain electricity distribution network for the supply of electricity to customers, ensure the connection of customers and users of the network electricity distribution, and install and manage electricity metering services.
Initially, these reforms allowed the emergence of a large number of customers in the free market (the so-called eligible customers). An increasing number of consumers are being considered as privileged (i.e., having the right to choose their supplier). Therefore, an important challenge is transition management for the implementation of the new market model, including the protection of low-income (household) consumers. Electricity customers connected to all voltage levels (above 110 kV, 35 kV, 20 kV, 10 kV and 0.6 kV) are considered to have entered the liberalized market.
Following the government’s 2019 decision on the establishment of a power exchange, an open tender for the selection of other shareholders was offered in 2020. The establishment and registration of the power exchange company, ALPEX, was finalized in October 2020. According to the plan, the operation of ALPEX and market coupling of Kosovo and Albania should be launched simultaneously in the first half of 2021. In the context of reforming the energy sector, legal and institutional reforms for the petroleum sector have been extremely significant since they clearly define responsibilities and policies of this sector.
To oversee and share functional responsibilities effectively on the oil and natural gas sectors, the government has ensured the following:
- The Ministry of Infrastructure and Energy (MIE) will continue to develop mechanisms for appropriate hydrocarbon sector policies and strategies.
- National Agency of Natural Resources (AKBN) and public companies, such as

Gas Sector Expansion Strategy for Energy Diversification in Albania
134
Albpetrol Sh.a. and Albgaz Sh.a., are responsible for organizing the structures to supervise and implement policies in an acceptable manner and ensure their compliance with existing laws, regulations and contractual agreements.
- The law “On petroleum (Exploration and Production)” (No. 7746, dated 28.7.1993) was amended in February 2017 and the relevant legal documents reflect policies and practices in line with international conditions and EU standards for the development of the oil sector.
- To increase the inspection capacities of the relevant structures that will monitor the implementation of the regulatory framework in the field of research and production.
- Consolidation of the legal framework for the gas sector in accordance with the Third Energy Package of EU will create a solid basis for supporting policies and projects for the development of the gas sector in Albania, as well as its regional integration in accordance with the practices and standards of the EU.
- Transposition of legislation on pollution and management of minimum emergency oil stock reserves of crude oil and its by-products in line with Albania's commitments as a member of the Energy Community Treaty and the relevant EU directive.
- Preparations for the importation of natural gas through the TAP network, enabling the integration and diversification of supply with energy sources.
These reform measures aim to overcome the imbalance in the energy supply of Albania through the diversification of energy sources, precisely through gasification. These measures are in accordance with the "National Energy Strategy 2018 -2030" (approved by Decision of the Council of Ministers No. 480, dated 31.07.2018 "On the approval of the national energy strategy for the period 2018–2030") and the "Gas Masterplan for Albania" (approved by the Decision of the Council of Ministers No. 87, dated 14.2.2018 "On the approval of the plan of development of the natural gas sector in Albania and the identification of priority projects”). They involve the creation of a complete legal and institutional framework for the sector.
The process of restructuring government policy in the oil and gas sectors began in 2016 through the approval of the establishment of Albgaz Sh.a. Based on the provisions of "On the natural gas sector" and "On procedures and deadlines for issuing, modifying, transferring, renewing and revoking licenses in the natural gas sector," the ERE approved licensing of the public petroleum company Albpetrol Sh.a. for engaging in activities related to natural gas supply. However, the reform and restructuring of the energy sector is an ongoing process as Albania does not yet have a functioning sector and market for natural gas. However, it already has a complete legal and institutional framework for the gas sector and functional companies for the main transmission, distribution, and supply of gas.

135
CHAPTER
03N
ational Policy Establishment for N
atural Gas Industrial Structure and Market Design in Albania
The cornerstone of the diversification of energy sources through the development of the gas sector is the option of initiating the operation of the Trans Adriatic Pipeline (the TAP Project) by the end of 2020, in conjunction with the consolidated activities of the Albanian public gas company Albgaz Sh.a. the Albanian public petroleum company Albpetrol Sh.a..
However, the Albanian government signed the Paris Agreement on April 22, 2016, ushering in the new era of international climate policy process. In fact, Albania acceded to the United Nations Framework Convention on Climate Change (UNFCCC) in 1995 and the Kyoto Protocol in 2005. This is an integral part of the EU’s integration process that includes capacity development at the national level for annual greenhouse gas (GHG) monitoring and reporting, formulation and implementation of policies to reduce GHG emission and adapt to climate change, and transposing and implementing the EU acquis on climate change. The Nationally Determined Contributions (NDC) level has been revised and further elaborated in the Integrated Energy and Climate Plan which has been developed completely and is expected to be adopted soon. In line with EU 20–20–20 targets, Albania introduced its Targeted National Contribution within the Paris Agreement in September 2015, committing to reduce CO2 emissions, compared to the baseline scenario mandated for 2016. It aims for an 11.5% reduction by 2030.
2.2. Energy Pricing System in Electricity and Natural Gas Markets
The establishment of the electricity and gas market and its corresponding policies for pricing have followed the legislation, specifically "On the electric power sector,” "On the natural gas sector,” and “On the promotion of the use of energy from renewable sources.” The ERE is responsible for establishing tariffs and prices for regulated activities and has reviewed applications for approval of tariffs and prices of electricity and natural gas.
2.2.1. Pricing System for Electricity
Based on the legal and institutional framework, electricity markets are divided into wholesale markets and retail markets. Wholesale market participants are generators, electricity suppliers, and large industrial consumers. Retail market participants are suppliers, who offer electricity contracts approved by the competent regulator, and consumers, who have the right to choose their supplier. Based on who establishes the price of electricity, electricity prices are divided into regulated prices and free market prices.
Consequently, all the activities related to production, transmission, distribution, and trade were conducted by KESH Sh.a. (before the basic reform in this sector). The price in the

Gas Sector Expansion Strategy for Energy Diversification in Albania
136
production of electricity and price of its transmission have been calculated and established by the ERE.
Given that Albania is a member of the Energy Community (year 2005) and with the expansion of the market economy in Albania, the Albanian electricity sector must match the standards of the electricity market in the member countries of the EU. The reform in the electricity sector initially allowed a large number of consumers in the free market (the so-called privileged customers).
According to “On the electric power sector,” based on the Third Energy Package of the EU, electricity customers connected to all voltage levels (above 110 kV, 35 kV, 20 kV, 10 kV and 0.6 kV) are considered to have entered the liberalized market. Customers connected to the 0.4 kV voltage have the right to freely choose their supplier. The ERE esatblished the price (tariff) for access to transport or the possibility of switching to transmission and distribution networks. At present, electricity consumers have two supply options:
- Universal Service Provider (FSHU Sh.a.), a company in the state market (or regulated market). It is a part of the state parent company OSHEE Sh.a.. FSHU Sh.a. buys electricity from KESH Sh.a. in the free market, adds the cost of transportation (tariff for access to the transmission network and distribution network) and earns profit. The state market was and is attractive because it is supplied mainly by the state company KESH Sh.a., which produces electricity from large hydropower plants (HPPs) with inherited dams at a very low cost. Currently KESH Sh.a. sells electricity to the public company FSHU Sh.a. at a regulated price of 1.5 ALL/kWh.
- In the private market, prices are established by the private parties. Part of the price includes the costs of electricity transport (tariff for access to the transmission network and distribution network) set by the ERE.
Based on this, a significant part of the final selling price comprises tariffs for access to the transmission network and distribution network owned by OST Sh.a. and OSHEE Sh.a. Distribution System Operator and Supplier of Universal Service could conduct the activity that they have a license for with the effective division of “Electricity Distribution Operator (OSHEE)” from January 1, 2020.
The electricity and natural gas sectors in each country, generally constitute an integrated system at the regional level and beyond. Consequently, tariff of both electricity natural gas reflect the regional price system of these energy products (especially in the wholesale market). However, these prices differ from country to country since they are based on the

137
CHAPTER
03N
ational Policy Establishment for N
atural Gas Industrial Structure and Market Design in Albania
country’s specific policies and contexts. Thus, in terms of the price of electricity, specifically in the SSE countries, there is a significant change in terms of the price level for both household and non-household consumers. Based on the EUROSTAT publications’ data, the average price of electricity before taxation (VAT) for household customers in the region was 11.96 ALL/kWh in 2019.
[Figure 3-1] Electricity Prices for Household Customers in the Regional Countries (2019)
Familjare Lek/kWhFamiljare EURO CENT/kWh
20
15
10
5
25
0
KosovoSerbia
Albania
North Maced
oniaTukey
Bosnie Hercego
vina
HungariaKroatia
Rumania
SloveniaGreece
Source: EUROSTAT (2021)., ERE(2019).
The average price of electricity before taxation (VAT) for non-household customers in the region is 9.84 ALL/kWh for 2019.
[Figure 3-2] Electricity Prices for Non-Household Customers in the Regional Countries (2019)
Jo - Familjare Lek/kWhJo - Familijare EURO CENT/kWh
0
2
4
6
8
10
12
14
Kosovo
Bosnie Hercegovina
Maqedonia e Veriut
TurqiaSerbia
Sllovenia
Hungaria
RumaniaKroacia
ShqiperiaGreqia
16
Source: EUROSTAT (2021)., ERE (2019).

Gas Sector Expansion Strategy for Energy Diversification in Albania
138
2.2.2. Price System for the Natural Gas and Other Energy Sources
In Albania, the price of natural gas is subject to the legislation and determined by referring to the transmission tariffs in the network of Albgaz Sh.a. which includes production and transportation costs. This is because the country produces and uses limited natural gas.
Albgaz Sh.a. carries out its activity in accordance with "On the natural gas sector" and the EU’s directives/regulations related to natural gas. Since the transmission tariff is necessary for Albgaz Sh.a. to the conduct the activity, it is important to guarantee free network access for the users of the transmission.
The petroleum product market is completely liberalized and relies mainly on the price of these energy products according to the conjunctures of the international market. Petroleum products are subject to excise, carbon and turnover taxes, VAT, and so on. What is specific about the price of fuel in Albania is the inclusion of some taxes that are not included in the price of fuel in other countries and regions. One such tax is the "Vehicle circulation tax," which accounts for the price of transport. It is 27 ALL / liter, which is about 17% of the retail price of fuel for vehicles.
2.3. The EU’s New “European Green Deal” and the Future Constraint Role of Natural Gas for Europe’s Energy Supply
2.3.1. The European Green Deal and the Global Cost Decline of Renewables and Batteries
In December 2019, the European Commission announced a “European Green Deal” (EGD), which would make Europe the first carbon-neutral continent by 2050. The EU plans to decrease its Greenhouse Gas (GHG) emissions up to 50-55% (compared with 1990 levels) by 2030, compared to the previously decided value of 40%. In March 2020, the European Council of EU governments agreed to make EGD as a new climate law (codifying the new emission goal for 2030) and the “next generation fund” with its € 750 bn economic recovery
program in the wake of the COVID-19 pandemic in 2020.1
1 See Frank Umbach, “Der European Green Deal. Strategische Perspektiven und Auswirkungen der Corona-Pandemie (The European Green Deal. Strategic Perspectives and the Impacts of the Corona-Pandemic),” Politische Studien, no. 494 (November-December 2020): 50-59; idem “The European Green Deal Faces Huge Challenges,” GIS, February 10, 2020.

139
CHAPTER
03N
ational Policy Establishment for N
atural Gas Industrial Structure and Market Design in Albania
[Figure 3-3] Previous EU Energy and Climate Policy Goals prior to the EGD
Greenhouse GasEmissions
2020
-20%
2030
-40%
RenewableEnergy
2020
20%
2030
32%
EnergyEfficiency
2020
-20%
2030
-40%
Climate in EU-FundedPrograms 2014-2020
2020
20%
2030
25%
Interconnection of MemberStates’ Energy Infrastructure
2020
20%
2030
15%
CO2 From:
Vans
2030
Cars Trucks
-31%-37.5% -30%
Source: GIS (2020).
It is the only region which has offered an ambitious mid-term perspective by 2030 and a pathway, including strategies, for implement ing its new targets along with using 30% of its € 750 bn “Next Generation Fund” for green projects.
The goal of the “man on the moon moment” (so President Ursula von der Leyen) is based on a comprehensive growth and innovation strategy for all economic sectors in Europe, supporting its ambition for reducing the greenhouse gas (GHG) emissions to zero by 2050. The EGD and its emission goal has been enshrined as a binding legal obligation in the new climate law of March 2020. It is a binding long-term plan and the key strategy for reconciling “the economy with our planet” by subordinating the EU’s economic, energy, and finance policies to the objectives of its climate policies and emission reduction targets. It currently includes 50 specific policy initiatives, though most of them are not new.

Gas Sector Expansion Strategy for Energy Diversification in Albania
140
[Figure 3-4] The European Green Deal (Dec. 2019)
A zero-pollution ambitionfor a toxic-freeenvironment
Preserving and restoringecosystems
and biodiversity
Form “Farm to Fork”: a fair,healthy and environmentally
friendly food system
Accelerating the shiftto sustainable and smart
mobilityFinancing
the transitionLeave no one behind
(Just Transition)
Increasing the EU’sclimate amition
for 2030 and 2050
Supplying clean,affordable
and secure energy
Mobilizing industryfor a clean and circular
economy
Building and renovatingin an energy- and
resource-efficient way
Transforming the EU’seconomy for a
sustainable future
The EuropeanGreen Deal
Source: GIS 2020, www.GISreportsonline.com; European Commission, “The European Green Deal,” Brussels, 11.12.2019, COM(2019)
640 final.
The EU seeks to use the COVID-19 pandemic as an opportunity for a global green recovery and has materialized its “European Green Deal (EGD)” by detailing concrete pathways for achiev ing its new mid-term target of cutting down emission by 55% (previously 40%) by 2030 and by devoting 30% (some € 225 billion) of its € 750 bn “Next Generation Recovery Fund” to green objectives and programs. Few other countries have followed Europe’s example.2
President von der Leyen has also proposed a “Sustainable Europe Investment Plan” of the EIB to unlock €1 trillion of private and public green investments until 2030. The European Commission has also increased funding for climate change efforts by more than 30% (€ 350 bn) of its proposed “Multiannual Financial Framework for 2021-2027” budget compared to 20% (€ 206 bn) over the previous budget in 2014-2020. The EU affiliated countries will be supported or allowed to avail national subsidies to compensate for the increasing carbon costs for its societies. Just for meeting the previous climate and energy targets before the declared EGD, the Commission estimated the additional annual investments up to € 260 bn for the EU by 2030.
2 See Frank Umbach, “The European Green Deal Faces Huge Challenges”; and idem, “Europas Plan für Klima und Umwelt (Europe’s Plan for Climate and Environment),” Internationale Politik (July 2020): 78-82.

141
CHAPTER
03N
ational Policy Establishment for N
atural Gas Industrial Structure and Market Design in Albania
[Figure 3-5] Next Generation Fund of the EU(Unit: Billion €)
Recovery and Resilience Facility (RRF) 672.5of which, loans 360
of which, grants 312.5
RescEU 1.9
Horizon Europe 5InvestEU 5.6
Rural Development 7.5Just Transition Funds (JTF) 10
ReactEU 47.5
750
Source: GIS (2021).
A successful implementation of the new emission target demands a much more systemic transformation of the EU’s energy and other economic sectors, which depends on sufficient funding, international support, and public acceptance at home.
France and some of the CEE countries will also be allowed to include nuclear power as a clean energy source for meeting the target, which is currently still opposed by Germany, Austria, and Luxembourg. A new rule book, that includes nuclear power as an essential energy source to achieve the 50-55% reduction by 2030 in GHG emission, is important because this ambitious target cannot be achieved without it over the next 10 years. In this context, the future role of natural gas remains ambiguous (see next chapter). Originally, the European Parliament did not want to allow any new financing and investment in new fossil fuel projects, including natural gas. However, the debate seemed to have achieved a compromise that will allow member states to build new gas-related projects for replacing dirty coal-plants when the gas infrastructure will be still used after 2030, when the EU will increasingly replace conventional gas with “green gas.” However, the debate continues (see next chapter) and is influenced not just by political factors and climate policy factors, but also by the rising competitiveness of renewables toward fossil fuels and technology innovations such as batteries for electricity storage.
Electrification and digitalization of the transport and heating sectors as well as the “industry 4.0” revolution—based on automation, robotics, and artificial intelligence systems—will significantly increase the role and demand of electricity in final energy
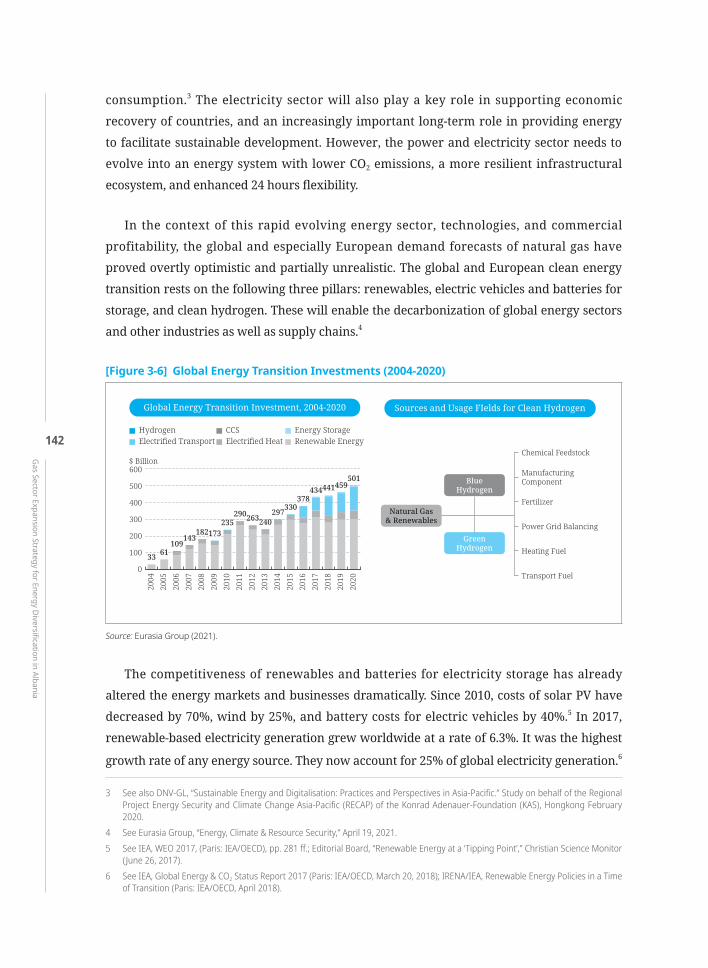
Gas Sector Expansion Strategy for Energy Diversification in Albania
142
consumption.3 The electricity sector will also play a key role in supporting economic recovery of countries, and an increasingly important long-term role in providing energy to facilitate sustainable development. However, the power and electricity sector needs to evolve into an energy system with lower CO2 emissions, a more resilient infrastructural ecosystem, and enhanced 24 hours flexibility.
In the context of this rapid evolving energy sector, technologies, and commercial profitability, the global and especially European demand forecasts of natural gas have proved overtly optimistic and partially unrealistic. The global and European clean energy transition rests on the following three pillars: renewables, electric vehicles and batteries for storage, and clean hydrogen. These will enable the decarbonization of global energy sectors and other industries as well as supply chains.4
[Figure 3-6] Global Energy Transition Investments (2004-2020)
Global Energy Transition Investment, 2004-2020 Sources and Usage FIelds for Clean Hydrogen
$ Billion
Hydrogen CCSElectrified Heat Renewable Energy
Energy StorageElectrified Transport
0
300
200
100 33 61109
143182173
235290263240
297330378
434441459501
2004
2005
2006
2007
2008
2009
2010
2011
2012
2013
2014
2015
2016
2017
2018
2019
2020
400
500
600
Chemical Feedstock
ManufacturingComponent
Fertilizer
Power Grid Balancing
Heating Fuel
Transport Fuel
BlueHydrogen
GreenHydrogen
Natural Gas& Renewables
Source: Eurasia Group (2021).
The competitiveness of renewables and batteries for electricity storage has already altered the energy markets and businesses dramatically. Since 2010, costs of solar PV have decreased by 70%, wind by 25%, and battery costs for electric vehicles by 40%.5 In 2017, renewable-based electricity generation grew worldwide at a rate of 6.3%. It was the highest
growth rate of any energy source. They now account for 25% of global electricity generation.6
3 See also DNV-GL, “Sustainable Energy and Digitalisation: Practices and Perspectives in Asia-Pacific.” Study on behalf of the Regional Project Energy Security and Climate Change Asia-Pacific (RECAP) of the Konrad Adenauer-Foundation (KAS), Hongkong February 2020.
4 See Eurasia Group, “Energy, Climate & Resource Security,” April 19, 2021.5 See IEA, WEO 2017, (Paris: IEA/OECD), pp. 281 ff.; Editorial Board, “Renewable Energy at a ‘Tipping Point’,” Christian Science Monitor
( June 26, 2017).6 See IEA, Global Energy & CO2 Status Report 2017 (Paris: IEA/OECD, March 20, 2018); IRENA/IEA, Renewable Energy Policies in a Time
of Transition (Paris: IEA/OECD, April 2018).

143
CHAPTER
03N
ational Policy Establishment for N
atural Gas Industrial Structure and Market Design in Albania
By 2040, renewables could account for at least 34% of the worldwide electricity generation,7 potentially leading up to 50% by 2050. According to Bloomberg New Energy Finance (BNEF), solar and wind costs might drop further by 71% and 58%, respectively by 2050.8 The rapid decline in the cost of technology is a factor that affects the overall investment. Each year, investment required to install the same capacity is decreasing.9
[Figure 3-7] Renewables - Declining Levelised Cost of Electricity (2010-2019)(Unit: $ per kWh, 2019 prices)
0
0.10
0.20
0.30
0.40
2010 2011 2012 2013 2014 2015 2016 2017 2018 2019
Solar Offshore wind Onshore wind Hydro
Source: IRENA (2021).
It has been estimated that Solar PV will account for the largest share of global installed capacity. The expansion of generation from wind and solar PV has been anticipated to overtake coal in by the mid-2020s. Renewables will satisfy 80% of the worldwide electricity demand growth during the next decade. They might overtake coal by 2025 as the primary energy source of producing electricity ahead of fossil fuels. By 2030, renewables might provide nearly 40% of the electricity supply. Renewables have become consistently cheaper than coal- and gas-fired plants and might satisfy 80% of growth in the worldwide electricity consumption by 2030.
In addition, flexibility from power plants, energy storage and demand-side resources are becoming the cornerstone of electricity supply security and resilience in modern
7 See Ed Crooks, “Wind and Solar Expected to Supply Third of Global Power by 2040,” FT, June 15, 2017; Tim Buckley, “Cheap Renew-ables Are Transforming the Global Electricity Business,” Energypost.eu, February 14, 2018.
8 See Robert Walton, “World on Track for 50% Renewables by 2050, Says Bloomberg Energy Outlook,” Utilitydrive.com (please include the URL instead), June 19, 2018.
9 See IRENA, “Renewable Capacity Highlights,” March 31, 2020.

Gas Sector Expansion Strategy for Energy Diversification in Albania
144
power as well as electricity ecosystems. The forthcoming technology innovations and their implementation in other sectors will be facilitated by the accelerating digitalization. The development of a new generation of batteries does not just matter for the electrification of the worldwide transport sector.
Energy utilities have started using utility grade lithium-ion batteries for large industry storage systems and grid-scale energy storage applications. Battery storage systems are suitable for short-duration storage that involves charging and discharging over a span of hours or days. This makes them a fit for variable renewables. Battery storage is increasingly paired with solar PV and wind energy generation. In addition, battery storage is also the fastest growing source of power flexibility costs. It can also reduce the need for coal and gas-fired peaking plants. Declining battery costs are both a challenge as well as an opportunity for energy utilities. If batteries are emerging as a cheap storage option for private and industrial consumers, as an integrated part build-in retrofitted storage option, countries and utilities will no longer require the same amount of conventional backup capacity as traditional coal and gas power plants.10
Specifically, modular battery storage systems allow a wide range of industry applications beyond the transport sector. They also offer a storage for power generators because it enhances overall utilization of power system assets based on intermittent renewable energy sources. Therefore, future electricity supply must evolve toward flexibility to adapt to a rapidly changing power supply and demand. Batteries decrease the risks of overcapacities and offer higher average revenues. The availability of second-use batteries (such as from EVs after the end of their regular lifecycle) are widespread. They have increased three times during the last three years, largely driven by lithium-ion batteries for providing short-term storage. They account for just over 80% of all battery capacity. But for longer-term storage, different batteries are required. It suggests various battery developments, including build-in units for solar PV and wind power as they increase their dispatchability.11
The increasingly wide range of applications also enhances the overall industry competition and decreases the price of batteries. Between 2010 and 2018, battery production costs decreased by 45%. By 2040, cost reduction by large-scale production and intensive research could make batteries up to 70% less expensive than today.12
10 See IEA, WEO 2020 (Paris, 2020), p. 246 f.; Frank Umbach, “New Opportunities 2021: Energy Megatrends and the Challenges of De-carbonization,” GIS, March 5, 2021.
11 See Frank Umbach, “Europe’s Battery Strategy,” GIS, September 16, 2020. 12 See ibid.; idem, “Strengthening Energy Security and Building Resilience in the Asia–Pacific”; idem, ”Energy Security in a Digitalized
World and its Geostrategic Implications,” Study of the Konrad Adenauer Foundation (KAS)/Regional Project: Energy Security and Climate change Asia-Pacific (RECAP) (Hongkong, September 2018), pp. 144 ff. and 113 ff.

145
CHAPTER
03N
ational Policy Establishment for N
atural Gas Industrial Structure and Market Design in Albania
[Figure 3-8] Declining Battery Costs(Unit: $)
0
400
200
600
800
1,000
Forecast
2010 2015 2020 2025 2030
Source: GIS (2020).
The present expansion of renewables has already transformed energy markets and broken traditional business models and strategies, inflicting significant damages to the European fossil-fuel based utilities. Batteries and hydrogen will further undermine the fossil fuel demand.13 However, a faster transition will also increase uncertainties for investment decisions, political governance, and geopolitics.
However, the declining costs of renewables do not include a number of hidden (or “systemic”) extra costs, such as the modernization of grids, rising grid interventions, subsidized back-up of conventional power plant capacities for grid stabili zation, and baseload stability due to the rising intermittency problems of renewables evident through the example of the German “Energiewende” highlights.14 Thus, an expanded use of batteries is required to guarantee stable electricity supply and grids, and boost flexibility to supplement renewables for peaking capacity. Therefore, the sole reference to declining costs of renewables and batteries is slightly misleading as the expansion of renewables is accompanied by higher overall costs and investments into the entire (changing) energy system. The huge systemic investments along with the expansion of renewables are often overlooked. They need to be carefully reviewed to formulate affordable ambitious energy transition strategies.
13 See also Eurasia Group, “Batteries and Hydrogen will Undermine Fossil Fuel Demand and Forge new Supply Chains,” Gas, Power & Infrastructure Monthly (August 31, 2020).
14 Jonathan Ford, “The Hidden Costs of Renewable Power,” FT, August 21, 2018.

Gas Sector Expansion Strategy for Energy Diversification in Albania
146
A wider expansion of renewables in the energy and electricity mix demands massive investments in other energy infrastructures (such as smart grids and smart metering) as well as subsidizing fossil fuel power plants, since they will not operate 24 hours a day but required for peak-times for a continuous electricity supply around the clock. The expansion of renewables is ultimately changing the entire energy system, which needs to be modernized. The often overlooked hidden (or systemic) costs of expanding renewables are particularly challenging for developing countries, because they need access to electricity and modern energy sources. By advancing their economies, they are becoming increasingly dependent on a stable supply of electricity throughout the day. Thus, the storage of electricity, along with flexibility, energy forecasting, and cross border exchanges of power, becomes an important solution for expanding renewables. Declining battery costs have addressed at least the short-term challenges of storage in the power sector. However, since batteries cannot store electricity in for a longer duration, gas power plants and natural gas for heating remain significant.
2.3.2. The Continuous EU Debate on the Constrained Future role of Natural Gas
While the IEA and others have forecasted a moderate, stagnant, or even a declining global oil demand by 2040, it has been determined that the worldwide natural gas demand experienced substantial growth by 45% prior to the outbreak of the COVID-19 pandemic.15 The United States could theoretically add some 300 bcm over the next 25 years, followed by China with 200 bcm, and Russia as well as Iran with 145 bcm each. The present gas oversupply on the world’s largest gas market will last for a few years as another 140 bcm of LNG capacity is currently under construction and will enter the markets (the COVID-19 pandemic causes its delay). Thus, the world is not facing natural gas scarcity, unlike in 2010 before the United States fracking revolution.
Meanwhile, due to the needs and dynamics of the global climate mitigation efforts and new directions of the United States’ energy and climate policies, along with China’s leading technological role in expanding and financing renewables worldwide, the global energy transition and decarbonization will move away from fossil fuels–particularly after 2030. Even in the United States, the adoption of solar, wind, and battery storage have made renewables as the cheapest in the power market. A new forecast has projected that it will be cost competitive with coal and gas by 2023/2024.16
15 See IEA, WEO 2017, Paris, 2017, pp. 333 ff.16 See Dennis Wamsted/Seth Feaster/David Schlissel, “Outlook USA: even with Battery Costs, Wind and Solar can Undercut Coal and
Gas by 2023-24,” Energypost.eu, April 13, 2021.

147
CHAPTER
03N
ational Policy Establishment for N
atural Gas Industrial Structure and Market Design in Albania
In 2020, gas power plants overtook lignite to become the EU’s single largest source of emissions in the power sector due to a more rapid coal phase-out and high carbon prices. At the same time, the phasing-out of gas in power generation has already started in Europe. Emission-wary investors and utilities are suspicious of gas even more than they were with coal. European companies are already struggling to sell-gas power plants.17 A new report warned that Europe’s gas import capacity is increasing by another 35% with a standard asset risk of € 87 bn.18
The carbon pricing and the EU’s Emission Trading System are one of the most important instruments for its clean energy transition and decarbonization. In April 2021, European carbon permit prices have already reached record levels of € 45 per metric tonne. At this price, coal fired power generation is highly unprofitable. At around € 50 per barrel, gas-fired generation will start losing its profitability for baseload supply. The economics of Europe’s gas power supply chain is being challenged due to the cheaper and environmentally friendly nature of renewables plus battery storage solutions.19
The EU’s natural gas consumption declined from 406 bcm in 2019 to 394 bcm in 2020 mainly as the result of the COVID-19 pandemic. Domestic gas production decreased even further from 70 bcm/y to 54 bcm/y (nearly -23%). Total net gas imports decreased by 9% from 358 bcm in 2019 to 326 bcm in 2020. The total EU LNG imports accounted for 84 bcm/y compared to 88 bcm/ in 2019.20 Prior to the outbreak of the pandemic, the EU’s natural gas forecasts had estimated a decrease and predicted a stagnant gas demand by 2030, followed by continuous depletion.21 Since the official support of the EGD, the EU is now officially obliged to decarbonization quickly. The Green parties in the European Parliament and NGOs have also increased their lobbying and political pressure to fasten the energy transition by expanding renewables even more rapidly. The European Commission has already argued, prior to the EGD, that it cannot achieve its long-term emission reduction by 2050 by relying only on natural gas though a national gas-to-coal switching is delivering significant GHG-emission reductions (but only when life-cycle emission analyses and transport ways are not considered).
17 See Rachel Morison, “Gas Is the new Coal with Risk of 100 Billion in Stranded Assets,” Bloomberg.com (please include the URL in-stead), April 17, 2021.
18 See Masin Inman, Greig Aitken, and Scott Zimmerman, “Europe Gas Tracker Report,“ April 2021.19 See Eurasia Group, “Energy, Climate & Resources Briefing,” 19 April 2021.20 See European Commission, “Quarterly Report on European Gas Markets,” DG Energy, Volume 13, Issue 4, Fourth Quarterly 2020,
Brussels 2021. To global gas developments see IEA, ‘Gas Market Report,’ Q1-2021, Paris 2021.21 See also IEA, “European Union 2020. Energy Policy Review,” Paris 2020, pp. 256-264.

Gas Sector Expansion Strategy for Energy Diversification in Albania
148
In 2020, the IEA had revised its gas consumption forecast for Europe. In its major Step-scenario, it predicted a declining gas consumption from 606 bcm in 2019 to 598 bcm in 2025, 570 bcm in 2030, and 536 bcm in 2040.22 In the light of the EGD, the European Commission projected that the EU’s natural gas consumption must be reduced by 36% from 2020 to 2030.23
In 2020, European critics of fossil fuels and vested interests were focusing critically on natural gas, as the phase-out of coal in the EU and Europe was being agreed on though it was not fast enough (such as Germany’s coal phase-out by 2038). According to them, the EU is already oversupplied with gas import capacity, with another 22% expansion of gas generation capacity under development. New fossil fuel gas transmission projects have been rejected since 2017 as solar and wind are now the cheapest source of newly installed electricity generation.24
The European Parliament and the European Council reached a provisional agreement which envisaged the removal of fossil fuels from financial support in the EU’s “Just Transition Funding (JTF)” until 2025. The JTF has a fund of € 15 bn and the Regional Development Fund (so-called cohesion fund) of € 400 bn. Under the latter, projects need to fulfil a taxonomy-criteria of “do no significant harm,” which include a mandate to reduce emissions below 250g CO2e/kWh. District heating will be eligible for regional funding only if it is based on renewables. However, biomass has not been included in this project. The most efficient power plants running on “unabated” natural gas achieve only 350gCO2e/kWh.25 The sustainable finance taxonomy may have loopholes. Poland and some other EU member states have insisted on balancing sustainability with economic competitiveness and security of supply. Last year, Bulgaria, Czechia, Greece, Hungary, Lithuania, Poland, Romania, and Slovakia published a common position paper and called for maintaining EU support and financing for natural gas infrastructure during the transition period because they lack zero-emission technologies that “could be developed at the necessary scale with socially and economically acceptable costs.”26 Later Cyprus and Malta also joined the position paper.
However, their position has been largely ignored by the European Commission when it published the taxonomy rules in November 2020. The EU summit held last December, repeated the right of each country “to decide on its own energy mix and to choose the most
22 See IEA, WEO 2020 (Paris, 2020), pp. 156 ff.23 See Karel Beckman, “Energy Transition or Energy Collapse?” Gas in transition 1, no. 1 (April 19, 2021).24 See also Esther Bollendorff, ”Europe has enough Gas Infrastructure. Why Build more?” Energypost.eu, 29 October 2020; Friends of
the Earth Europe, “Pipe Dream. Debunking the Myths of Croatia’s Krk Gas Terminal,” December 2018.25 See Karel Beckman, “EU Fight over Role of Natural Gas Ends in Compromises,” Gas Transition 2, no. 1 (January 2021). 26 See Euractive.com, “Role of Natural Gas in Climate-Neutral Europe. Position Paper of Bulgaria, Czechia, Greece, Hungary, Lithuania,
Poland, Romania and Slovakia,” May 2020.

149
CHAPTER
03N
ational Policy Establishment for N
atural Gas Industrial Structure and Market Design in Albania
appropriate technologies to achieve collectively the 2030 target, including transitional technologies such as gas.”27 As a result, the final taxonomy of rules has been postponed to this year and is expected to come into force from 2022. Should the current threshold of 250g CO2e/kWh of the European Commission for funding new projects remain, new gas-fired power plants will no longer have any place in the European power mix.28 On the other hand, the European Commission has still supported 32 gas projects in its last list of PCIs for energy in 2019 (though decreasing from 53 in 2017), including new LNG import terminals.29 Symptomatically, for the controversial policies, the EU’s Ombudsman, criticized the proposed list for lacking a proper sustainability assessment for gas projects (by taking into account CO2 and methane emissions) and launched an inquiry in the Commission’s approving process for PCI projects.30
The current situation is also ambiguous as most of the submitted “National Energy and Climate Plans” (NECPs) of the EU member states for achieving the 2030 targets had been submitted to the European Commission before the announcement of the EGD in December 2020 or at the beginning of 2021. Consequently, the translation of the EGD, its targets and strategies as well as funding options for new energy infrastructures must be defined by the secretariat of the European Community. These uncertainties make any investments in the gas sector of Albania much more difficult. Furthermore, by granting natural gas some transition role, governments and private investors must rethink and re-define their planned investments in natural gas infrastructures for commerciality and profitability because new gas infrastructure projects require several years of concrete planning before operation. Furthermore, any new pipeline must be operated at least 20-30 years to make them commercially viable. However, given the dynamics of the disruptive technologies and changing global and European energy and electricity markets, even natural gas projects are at a risk to become “stranded assets” sometime after 2030. All countries in Europe, whether they are already members of the EU or of the Energy Community are now forced to review their previous NECPs as well as energy strategies in the light of the EGD, the forthcoming taxonomy of investment rules, as well as the changing market conditions and commerciality of natural gas versus renewables and batteries.
The European Investment Bank, the EU’s major lending arm, argued last January that “gas is over,” otherwise the climate targets cannot be achieved. In fact, 50% of its activity will support climate and environmental sustainability by unlocking €1 trillion for green
27 See Dave Keating, “Gas Wins Recognition as 'Transitional Technology' to Climate Neutrality,” Euractiv.com, 14.12.2020.28 See also Charles Ellinas, “Europe’s Just Transition (2): The Politics of Change,” Natural Gas World, Vol. 6, Issue 5, 1 March 2021.29 See Florence Schulz, “EU’s List of Energy Projects Includes 32 Gas Facilities,” Euractiv.com, 6 November 2019.30 See Kira Taylor, “EU Failed to Properly Assess Climate Risk of Gas Projects Watchdog Says,” Euractiv.com, 20 November 2019.

Gas Sector Expansion Strategy for Energy Diversification in Albania
150
funding by 2030. Only power plants emitting less than 250ge/kWh are currently allowed to access this fund. It mandated the abandonment of all traditional gas infrastructure and fossil fuel projects by the end of this year.31 During the last months, nine EU-member countries have increased their political pressure to ensure that natural gas will be still classified as a “sustainable investment.” Another group of seven EU-member states has insisted that nuclear power should be included into the EU’s green finance rule taxonomy.32 The European Commission’s Vice-President Frans Timmermans clarified in March that fossil fuels and fossil gas “has no viable future” and will only play a “marginal role” and “for a limited period of time.”33 On April 18, 2021, the European Commission postponed its decision whether to include nuclear power and natural gas in its classifica tion of green energy and green finance.34
The present battles of revising the EU’s “Projects of Common Interests (PCIs)” and transna tio nal network projects for financial support from the EU’s dedicated funds (such as “Connecting Europe Facility”) has reached the point of defining what “clean gases” or “low carbon gases” are, particularly various hydrogen options.35 In the view of climate campaigners, only “green hydrogen” projects should be allowed in the EU which would exclude “blue hydrogen” (based on natural gas in combination with carbon capture and storage/CCS).
2.3.3. The EU’s Focus on Hydrogen Projects
Hydrogen is being viewed as a clean, secure, and affordable energy carrier (like electricity rather than an energy source) and an industrial raw material, which can play a key role and would form the “missing link” as feedstock in hard-to-abate sectors such as steel-making and refineries, ammonia production and chemical industry in decarbonized energy systems. In the future, it can also fuel buses, trains, and trucks and even ships and planes.
Existing technologies allow hydrogen to be produced, stored, moved, and used in different ways and for various purposes. Hydrogen can be produced by renewables, biomass, and nuclear as well as fossil fuels (oil, gas, coal). It is seen as the leading und currently only realistic option for storing electricity from renewables for a longer time. In
31 See Kira Taylor, “’Gas is Over’, EU Bank Chiefs Says,” Euractiv.com, 21 January 2021.32 See Editorial “Poland, others Step up Push for Gas in EU Green Finance Rules: Document,” Euractiv.com, 30 March 2021, and Freder-
ic Simon, “Macron, Orban Urge EU to ‘actively Support’ Nuclear Power, ibid., 25 March 2021.33 See Frederic Simon, “Fossil Gas ‘has no viable Future,’ EU’s Timmermans Says,” Euractiv.com, 26 March 2021.34 See Mehreen Khan, “EU Split over Delay to Decision on Classifying Gas as Green Investment,” FT, 18 April 2021.35 See also Janet Wood, “Gas in the EU Energy Transition,” Natural Gas World, Vol. 6, Issue 1, 4 January 2021.

151
CHAPTER
03N
ational Policy Establishment for N
atural Gas Industrial Structure and Market Design in Albania
Europe, the focus is particularly on green hydrogen – though it is also the most expensive option.36
While bridging the cost gap with competing fuels is a key near-term challenge, the gap is projected to narrow considerably by 2030. While low-carbon hydrogen is expensive today, costs are expected to decline as production expands and as the necessary infrastructure is rolled out. At present, however, the cost gap between electrolysis hydrogen and merchant hydrogen from natural gas reforming has recently grown wider for key hydrogen-using sectors that could provide near-term end-uses (such as refineries, ammonia, methanol, and steel production) as a result of low natural gas prices. As a result, policies in Europe and Asia may need to ensure that a gap of $50/MBtu or more can be bridged by consumers or taxpayers to incentivize new electrolysis hydrogen. Electrolyser costs might also fall as manufacturing and installation scales up and efficiencies are expected to increase.37
Natural gas is currently used for three-quarters of the global hydrogen production of some 70mt per year with amount of 205 bcm/y (or 6 per cent of global natural gas consumption). Coal currently accounts for 23 per cent of global hydrogen production with some 107mt (or 2 per cent of global coal use). Only 4 per cent of the worldwide hydrogen production in 2018 was based on renewable energy sources (renewables). By 2050, clean hydrogen could meet some 24 per cent of the global energy demand with annual sales of around €630 according to some analytical estimates.
Unlike in the past, with the rapidly declining costs for renewables, batteries and EVs as well as other new technology innovation, hydrogen has now become a practicable option to solve the electricity storage problem and also to decarbonize the hard-to-abate sectors of the economy, such as the energy-intensive industry. ‘Power-to-X’-projects can convert electricity to other energy carriers or chemicals – generally referred to hydrogen produced by the electrolysis of water.
36 See also F. Umbach and J. Pfeiffer, “Germany and the EU’s Hydrogen Strategies in Perspective – The Need for Sober Analyses,” Periscope-Occasional Analysis Brief Series No.1, Konrad Adenauer-Foundation-Australia, Canberra, August 2020; Frank Umbach, “Hydrogen: Decarbonization’s Silver Bullet?”, GIS, 2 July 2020.
37 See IEA, WEO 2020, Paris 2020, pp. 289 ff.

Gas Sector Expansion Strategy for Energy Diversification in Albania
152
[Figure 3-9] Development of Green versus Blue and Grey Hydrogen Costs (2020-2030)(Unit: USD per kg)
0
3
2
1
4
5
6
2020 2021 2022 2023 2024 2025 2026 2027 2028 2029 2030
Green Hydrogen Production Price at 10% Annual Cost Decline
Green Hydrogen Production Price at 15% Annual Cost Decline
Green Hydrogen ProductionPrice at 5% Annual Cost Decline
Blue Hydrogen Production Price Grey Hydrogen Production Price
Source: Eurasia Group (2021).
At the beginning of July 2020, the European Commission also published its own EU hydrogen strategy38 after the EU has agreed on its newly codified target for reducing the EU-27 CO2-emissions by 50-55 per cent (instead of previously 40%) by 2030. As 75 per cent of the EU’s Greenhouse emissions result from the energy sector, the European Commission considers hydrogen to also be a central element of its newly released “Energy System Integration Strategy” and the EGD of December 2019. The latter has been viewed by the Commission as both the “motor” and “compass” of the just agreed €750bn “Next Generation” economic recovery programme of the EU. The hydrogen strategy has been designed with a phased approach and a goal to increase the hydrogen share from less than 2 per cent today up to 13-14 per cent by 2050. As for Germany’s hydrogen strategy, the priority has been accorded to the development of renewable hydrogen with a cumulative investment up to €180-470bn in Europe by 2050.
To implement a successful pathway and cost-effective integration of its long-term hydrogen strategy, the EU will introduce new energy and climate legislation as well as regulations for common standards, investor certainty, terminology and certification based on life-cycle emissions, in line with EU taxonomy for sustainable investments.
38 See European Commission, ‘A Hydrogen Strategy for a Climate-Neutral Europe’. Communication from the Commission to the Eu-ropean Parliament, the Council, The European Economic and Social Committee and the Committee of the Regions, Brussels, 8 July 2020 COM(2020) 301 final.

153
CHAPTER
03N
ational Policy Establishment for N
atural Gas Industrial Structure and Market Design in Albania
[Figure 3-10] The EU’s Hydrogen Strategy in Three Steps (July 2020)
The path towards a European hydrogen eco-system step by step :
Today - 2024 2025 - 2030 2030 -From now to 2024, we will support the
installation of at least 6GW of renewable hydrogen electrolysers in
the EU, and the production of up to 1 million tonnes of
renewable hydrogen.
From 2025 to 2030, hydrogen needs to become an intrinsic part of our
integrated energy system, with at least 40GW of renewable hydrogen electroly-
sers and the production of up to 10 million tonnes of
renewable hydrogen in the EU.
From 2030 onwards,renewable hydrogen will be
deployed at a largescale across all
hard-to-decarbonisesectors.
Source: European Commission (2020).
11 European gas companies from 9 EU member states unveiled in the early summer of 2020 a hydrogen pipeline network of 6,800 km by 2030 and almost 23,000 km by 2040, which could be used in parallel to the natural gas grid. It could transport more than the expected 1,130 TWh of the annual hydrogen demand in Europe by 2040 with relatively limited costs between €27-64bn of the overall EU decarbonization. It is based on the assumption that 75 per cent of the network will consist of retrofitted natural gas pipelines.39 In April this year, the gas network operators from 11 countries have joined this initiative and presented an updated version for a pure hydrogen network of almost 40,000 km by 2040. 60 per cent of this proposed hydrogen network could consist of repurposed existing natural gas pipelines, which significantly lowers the overall cost of the needed hydrogen infrastructure. The total investment has been estimated at €43-81 bn.40
The EU considers hydrogen to be a central element of its EGD and its new “Energy System Integration Strategy.” The priority has been accorded to the development of clean, renewable hydrogen with a cumulative investment up to €180-470bn in Europe by 2050. Brussels hopes that a green hydrogen economy could create 1 million new jobs for highly qualified personnel in the EU by 2030 and up to 5.4 million by 2050 across the entire value chain.
39 See also Frank Umbach, “Hydrogen: Decarbonization’s Silver Bullet?,” GIS, 2 July, 2020.40 See Frederic Simon, “Gas Grid Operators Outline Plans for EU Hydrogen Highway,” Euractiv.com, 14 April 2021.

Gas Sector Expansion Strategy for Energy Diversification in Albania
154
“Hydrogen Europe” has initiated a “2x40 GW Green Hydrogen Initiative” in April 2020, which promotes the build-up of 40GW (4.4mt or 173TWh) green hydrogen production in the EU and another very cheap one of 40GW (3mt or 118TWh) in Ukraine (10GW) and North Africa (30GW). The total investments have been estimated at €430bn with support of €145bn of grants and subsidies.
[Figure 3-11] Hydrogen Options Based on Energy Resources
Green Hydrogen Produced without CO2 emissions (by nuclear or renewable electricity basedon solar and wind)
Blue HydrogenCommonly used term for the production of hydrogen from fossil fuels (mostlyfrom natural gas) with CO2 emissions reduced by the use of Carbon Capture,Use and Storage (CCUS)
Turquoise Hydrogen Made by pyrolysis with carbon black as a by-product
Gray (or Brown)Hydrogen Produced with fossil fuels (hard or lignite coal or natural gas) without CCUS
White (or Natural)Hydrogen
Discovered by chance, when wells were dilled for oil and gas in Mali. It isestimated that its cost of exploitation is much cheaper than manufacturedhydrogen from fossil fuels or from electrolysis
Note: the environmental effects cannot only vary considerably due to the energy source used for hydrogen production, but also due to production routes and supply chains, as well as the type of CCUS applied.
Source: GIS (2019).
Germany’s national hydrogen-strategy of June 2020 envisages the funding of green hydrogen projects with €9 billion (bn). €7bn is invested on its own national market and further €2bn has been envisaged for hydrogen projects in Ukraine and North Africa (Morocco) in forging partnerships, as future green hydrogen production might be more cost-efficient outside of Europe than in Germany itself. Up to 5GW of electrolyser capacity are planned by 2030 in Germany.41 But it is still the most expensive option. Many experts still see hydrogen from intermittent renewable sources as fundamentally inefficient and an uneconomic illusion.42
The EU seeks actively to enhance an “open strategic autonomy”. This does not mean complete self-sufficiency or isolating itself from the world through economic protectionism. Rather, it means having alternatives, introducing more competition, and avoiding “unwanted dependencies both economically and geopolitically” - particularly from authoritarian countries such as Russia, China, Saudi Arabia, and others.
41 See The Federal Government of Germany, “The National Hydrogen Strategy,” Berlin, June 2020.42 See also Karel Beckmann, “Second Thoughts on Green Hydrogen,” Gas in Transition, Vol. 1, Issue 1, 19 April 2021, and idem, “Energy
Transition or Energy Collapse?,” ibid., p. 49 f.

155
CHAPTER
03N
ational Policy Establishment for N
atural Gas Industrial Structure and Market Design in Albania
Hydrogen certainly offers new possibilities for cooperation between democratic countries of the G20 group. Australia, for instance, has unique conditions for becoming a renewable energy and hydrogen superpower. However, the long maritime transport routes for hydrogen exports to Europe might prove rather costly and are linked to various maritime security risks, such as blockades of choke points as currently experienced in the Suez Canal. While Mali in Africa can produce natural hydrogen (white hydrogen), the widespread political instabilities have hampered any larger foreign investments during the last years. Morocco has been identified by the EU and Germany as one of the first and potentially most important hydrogen partner countries given its ambitious plans for solar plants and its potential yield of PV, which are twice as high. However, presently, the bilateral diplomatic relations between Morocco and Germany have dramatically deteriorated for the German government due to different positions regarding the West-Sahara and a perceived new national(nationalistic) self-confidence in Morocco.
By summarizing the European plans and debates on hydrogen, the present European and worldwide hydrogen hype needs to be downgraded to encompass practicality.43
3. Overview of Korea's Natural Gas Industry
3.1. Supply and Demand of Natural Gas44
Natural gas is the third-largest energy source in Korea’s total primary energy supply (TPES) after oil and coal. In 2019, it accounted for 17.7% of Korea’s TPES. Korea’s gas self-sufficiency is 0.6%; the rest is imported as liquefied natural gas (LNG) because the country has no cross-border pipeline connections. With a share of 11.6%, natural gas was the third-largest fuel in Korea’s total final consumption (TFC) in 2019, after oil (50.2%) and electricity (23.2%, including renewables). The share of gas in TFC has been stable over the past decade. In 2019, natural gas was mainly used in city gas manufacturing (45.9%) and electricity generation (43.8%). The importance of natural gas in Korea’s energy supply is increasing. Therefore, Korea needs to ensure long-term access to a competitive gas supply from diverse sources.
43 See also Frank Umbach and Joachim Peiffer, “Künftiger Energieträger Wasserstoff. Geraten wir in neue Abhängigkeiten?“ (“Future Energy Carrier: Do We Will Fall back in new Depen den cies?“), in: Europäische Sicherheit&Technik (ES&T), March 2021, pp. 33-37.
44 See DOE/EIA, “Country Analysis Executive Summary - South Korea,“ October 2020; KEEI, Korea Energy Demand Outlook, First Half, 2021.

Gas Sector Expansion Strategy for Energy Diversification in Albania
156
[Figure 3-12] Growth Rate of TPES and Contributions of Natural Gas in Korea(Unit: %p, %)
-6.0
-3.0
0.0
3.0
6.0
2011 2012 2013 2014 2015 2016 2017 2018 2019 2020p
Nuclear (%p) LNG (%p) Petroleum (%p) Coal (%p)New·Renewable (%p) TPED
Source: KESIS (2021).
The offshore gas field of Dong-Hae 1 started production in 2004. Korea’s domestic natural gas production accounted for 0.3 bcm in 2018, covering only 0.5% of the total gas consumption. The production of gas was managed by two offshore gas fields located off the east coast. The field operator, that is, the Korea National Oil Corporation (KNOC), plans to continue operations until 2021, till the resources deplete.
Demand for natural gas largely depends on competition with coal power generation, the availability of nuclear plant, and government policy to reduce air pollution. Since 2000, gas consumption has steadily increased. It peaked at 52.6 bcm in 2013, following which gas consumption declined sharply in 2014 and 2015 due to nuclear plants restarts over 2015-2018. Nevertheless, since 2016, gas consumption in Korea has recovered, reaching 54.1 bcm in 2018. This increase was mostly driven by more stringent emission regulation related to coal-fired power generation. The Korean government mandated that power generators must cap coal-fired power plant utilization to 80%, and older, less efficient coal plants must cease operation during the spring months. In addition, some nuclear generators underwent extended maintenance throughout 2018. Due to the decrease in the generation of power from coal and nuclear sources, power producers turned to natural gas. Further, Korea’s extreme heat wave during the summer of 2018 caused a spike in the demand for natural gas for cooling.
In recent years, tackling the COVID-19 pandemic is expected to adversely affect the growth of Korea’s natural gas demand, especially for the industrial sector. The coal-to-gas switching policies in the power sector, to be implemented in the winter of 2019-20 helped manage the decline of natural gas demand from other sectors during the first quarter of 2020. Several new coal and nuclear plants, scheduled to come on line by 2024, are likely to

157
CHAPTER
03N
ational Policy Establishment for N
atural Gas Industrial Structure and Market Design in Albania
constrain natural gas demand until the mid-2020s. However, over the longer term, natural gas may prove to be more advantageous over coal based on Korea’s current plans to close older and less efficient coal-fired power plants or convert them to natural gas-fired units. Natural gas will continue to contribute to the energy transition, notably in the electricity sector, and reduce air pollution in large cities.
Heat and power generation is the largest gas-consuming sector, accounting for 54% of the total consumption in 2018, followed by the residential (20%) and industrial sectors (16%). In 2020, 56% of natural gas was used in power plants, 28% in buildings, and 14% in the industrial sector. Since 2010, buildings have lost 4% points, mainly in favor of power plants (+10% points). The industrial sector is expected to maintain this share, as iron and steel and chemical/petrochemical companies continue to dominate consumption.
Natural gas demand in Korea follows a seasonal pattern, with the highest demand occurring during the winter for heating and power generation. Winter peak demand has surpassed summer peak since 2009. Gas demand during the coldest period of the year, that is, from November to February accounts for 45% of the annual consumption. Meanwhile, the total LNG storage capacity of 7.15 bcm was theoretically able to cover approximately 24 days of winter peak gas demand in 2018.
Korea’s gas price for industry was the third highest among IEA member countries. The gas price for households is higher than that for industry in Korea. The average gas price was US $4c/kWh for industry and US $5.5c/kWh for households (2020). Prices have remained relatively stable since 2016, following a significant decrease during 2014-2016.
[Figure 3-13] Korea’s Natural Gas Consumption, 2008-2018(Unit: bcm)
-10.0
0.0
10.0
20.0
30.0
40.0
50.0
60.0
2008 2010 2012 2014 2016 2018
Stock ChangesImports Inland Consumption
Source: KESIS (2021)., IEA (2021).

Gas Sector Expansion Strategy for Energy Diversification in Albania
158
3.2. Import of LNG and Supply Infrastructure
The Korean government is actively trying to diversify sources to import gas from. Korea started importing LNG in 1986. The volume of LNG imports have grown quickly from 3 bcm in 1990 to 53 bcm in 2020. Korea ranks as the third-largest global importer of LNG following Japan and China. It purchased almost half of its 2019 LNG imports from Qatar and Australia. However, the share of imports from Qatar has declined during the past few years, while those from the United States have risen dramatically since 2017, after KOGAS (Korea Gas Corporation) signed a long-term contract with the United States firm Cheniere to purchase LNG from the Sabine Pass terminal. LNG shares from the United States increased from 0.11% in 2016 to 12.8% in 2019.
[Figure 3-14] Korea’s LNG Imports by Source, 2008-2018(Unit: bcm)
0
10
20
30
40
50
60
70
80
2008 2009 2010 2011 2012 2013 2014 2015 2016 2017 2018
Russian Federation Indonesia Malaysia OmanOtherAustralia QatarUnited States Total net imports
Source: KESIS (2021)., IEA (2021).
Higher domestic natural gas demand, new long-term LNG contracts, higher volumes imported by private-sector natural gas companies, and storage refilling by KOGAS contributed to the robust growth of LNG imports in 2017 and 2018. Korea currently has seven LNG-regasification facilities. The LNG regasification capacity has been steady since 2016 at 121 Mt/year (2020). It is distributed across seven terminals: Incheon (42 Mt/year, commissioned in 1996), Pyeong Taek (38 Mt/year, 1986), Tongyeong (25 Mt/year, 2002), Gwangyang (2.3 Mt/year, 2005), Samcheok, (7.3 Mt/year in 2014, expanded to 11 Mt/year in 2016), Boryeong (3 Mt/year, 2016), and Jeju (0.15 Mt/year, 2019). KOGAS operates five of these facilities, which account for most of the current capacity. The other two terminals are privately owned (POSCO Energy, GS Energy and SK E&S) and have a smaller capacity. However, these private operators were key contributors to ensure the increase of LNG imports since 2017. Private industries have a greater incentive to invest in regasification

159
CHAPTER
03N
ational Policy Establishment for N
atural Gas Industrial Structure and Market Design in Albania
capacity and purchase less expensive LNG on the global market because of KOGAS’s monopoly power and high LNG retail prices.
There are no underground gas storage facilities in Korea; therefore, LNG tanks are used to store natural gas. The Korean government previously explored the possibility of constructing an underground storage facility in a gas field off the east coast, but the project was abandoned due to its low economic feasibility. Since the domestic gas fields (Dong-Hae 1) will be depleted by 2021, the government might have to search for another opportunity to study the feasibility of underground storage.
Korea is also seeking to diversify gas supplies and have flexible LNG contracts. The KOGAS participates in natural gas projects around the world. As of mid-2020, KOGAS possessed investments in 25 projects in 13 countries, including exploration, production, LNG assets, and downstream facilities.
Korea does not have cross-border gas pipelines. Its gas transmission network spans across 4,854 km. The gas pipeline network connects the LNG receiving terminals, storage tanks, and large consuming areas. Most of the gas pipelines were constructed to form a circle-shaped network to improve security of supply. KOGAS operates the gas transport network. To supply natural gas to new power plants, KOGAS intends to expand this transmission network. The transmission pipelines are bidirectional, which is extremely important to tackle the disruption of direct flows.
The distribution is carried out by 30 private local companies that monopolize distribution in their region. They are supplied by KOGAS. All the gas companies are grouped together in an association, called KGU (Korean Gas Union). Most of the municipalities are connected to the pipeline network.
Security of natural gas supply can also be improved by establishing cross-border interconnections with neighboring countries. KOGAS and Gazprom (Russian gas corporation) signed an MOU in 2008 to investigate the construction of a transnational pipeline via North Korea (the Democratic People’s Republic of Korea, DPRK) to supply Russian gas to Korea. However, this idea was suspended in 2013, as the international community strengthened sanctions against the DPRK. KOGAS and Gazprom are currently conducting a joint study on the possibility of a pipeline project. However, progress for this project is subject to geopolitical developments without a time-time for completion.

Gas Sector Expansion Strategy for Energy Diversification in Albania
160
3.3. Hydrogen45
Korea is one of the world leaders in the development of hydrogen and has ambitious targets to achieve for 2030. The country sees hydrogen as a means of managing environmental concerns cause by the use of diesel in the transportation sector without weakening energy security. The Hydrogen Economy Roadmap of Korea includes 2022 and 2040 as targets for buses, fuel cell electric vehicles, and charging stations. It has expressed a vision to shift all commercial vehicles–including trucks and construction machinery–to run on fuel cell energy by 2035 (MOTIE, 2019). The hydrogen roadmap focuses on three key areas: i) more hydrogen powered vehicles on the roads; ii) more fuel cells for household and industrial use; and iii) infrastructure building for the distribution, storage, and production of hydrogen.
In 2018, Korea had only 14 hydrogen fueling stations for 2,000 hydrogen vehicles. In order to promote the development of hydrogen, the government established a special purpose corporation called the Hydrogen Energy Network, in association with industrial companies such as KOGAS and Hyundai, to build 1,200 hydrogen-fueling stations across the country.
4. Development of Korea’s Natural Gas Industry
4.1. Efforts towards Stable Energy Supply for Economic Development
In the early stages of economic development in Korea in the 1960s, Korea had no choice but to pursue government-led industrialization, to construct energy supply facilities, and to diversify energy supply sources. The energy supply structure in Korea at the time depended on domestic coal. However, coal productivity gradually deteriorated in the late 1960s. The Korean government therefore began switching its main energy source from coal to oil, and then to natural gas.
45 See IEA, Korea 2020 Energy Policy Review, November 2020.

161
CHAPTER
03N
ational Policy Establishment for N
atural Gas Industrial Structure and Market Design in Albania
[Figure 3-15] Overview of Changes in the Korean Economy and Energy SectorEc
onom
y
· Launchingeconomicdevelopment
- Rapid growth oflight industry
※ Undeveloped industrialstructure (mainly focusedon the agricultural sector)
· Industrialization- Rapid growth of
heavy & chemicalindustry
· Industrialdiversification
· Rapid economicgrowth
· Development ofhigh-techindustries suchas IT, ICT
· OECD menber· Liberalization ofindustry
· Development oflow-carbonindustry andknowledge-based industry
Ener
gy
· Efforts to securestale energysupply foreconomicdevelopment
· Establishmentof oil-orientedenergy supplysystem
· Diversificationof energy supply
· Liberalization ofenergy industry
· Toward low-carbon energygrowth
1960’s 1970’s 1980’s 1990’s 2000’s
Source: KEEI (2014).
Via the establishment of an oil-oriented energy supply system in the 1970s, Korea tried to grow light industry and promoted heavy chemical industries. However, all the crude oil consumed in Korea was imported from foreign countries. As a result, the Korean economy became very vulnerable to oil supply disruptions and the external environment, especially during the oil crisis period. During the second oil crisis, economic difficulties mounted owing to huge foreign debts and high inflation and interest rates.
The government began to actively implement diversification of energy supply sources, including natural gas and nuclear energy. The proportion of oil in total energy consumption decreased from 58.1 percent in 1981 to 43.7 percent in 1987. In particular, the proportion of oil-fired power generation sharply decreased to 3.0 percent in 1987. The share of natural gas in primary energy supply increased from 0.1 percent in 1986 to 6% in 1995 and to 13 percent in 2005. In the 1990s, the government implemented liberalization and openness measures in the energy industry to introduce competition and improve energy consumption efficiency. The Korean oil industry was successful liberalized and opened u[, but this is still in progress for the electric power and gas industries.

Gas Sector Expansion Strategy for Energy Diversification in Albania
162
[Figure 3-16] Energy Industry Structure of Korea
Oil Companies· Importers· 4 Refiners· Distributors
City Gas Companies· Retailers· Territorial Monopolies
Coal Companies· Importers· Producers· Distributors
Public Private
Government
KEPCO· Power generator· Transmitter· Distributor
KOGAS· Overseas gas developer· LNG Importer· Wholesaler
KNOC· Strategic Oil Stockpiling· Overseas & domesticoil developer
KDHC· District Heat Supplier
Source: KEEI (2014).
[Figure 3-17] Changes in Total Primary Energy Supply of Korea(Unit: Million ton)
0
50
100
150
200
250
300
0%10%20%30%40%50%60%70%80%90%
100%
1971 1975 1980 1985 1990 1995 2000 2005 2010 2018p 2018p1973
Oil Gas Nuclear Biofuels/WasteHydro/OtherCoal
Source: IEA (2019).
After the Fukushima nuclear accident, the Korean government, as well as the Paris agreement on climate change in the 2010s, paid particular focus to a future energy and electric power generation diversification, based on carbon neutrality, improvement of energy efficiency, and expansion of new and renewable energy. In the case of Korea, where energy-intensive industries account for a significant portion of the overall domestic industry, the national competitiveness could be seriously damaged in case of reducing emissions of greenhouse gas.
Changes or improvements in the energy mix are influenced by economic factors, industrial structure, domestic and regional (neighboring countries) status of energy resources, and recently, environmental factors related to response to climate changes.

163
CHAPTER
03N
ational Policy Establishment for N
atural Gas Industrial Structure and Market Design in Albania
4.2. Implementation of the Introduction of LNG and Development of the Gas Market
4.2.1. Establishment of the Basic Plan for LNG Business in the 1980s
Due to the oil price hike caused by the first oil shock in 1973, electric power corporations like the current KEPCO, which depended on oil for most of its feedstock for electric power generation, began to study the economic feasibility of importing LNG. Owing to the effects of two global oil crises in the 1970s, however, the Korean government accelerated its policy to diversify energy sources, and due to this diversification policy as well as to rising concerns with regard to pollution and problems with briquette supply, interest LNG import was renewed.
In the planning stage of the introduction of natural gas into the market, until the establishment of an exclusive organization to spearhead LNG business, such as KOGAS (Korea Gas Corporation), the electric power corporation (KEPCO), which uses the highest proportion of the imported LNG, played an important role in processes such as selecting foreign natural gas suppliers and negotiating with them. KEPCO drew up a procedural plan to import LNG for the first time. The LNG business was classified into two areas: import and other supply businesses. Detailed procedures and tasks were noted that were to be performed by each organization involved for about ten years thereafter, encompassing the preparatory investigation to trial runs, including the construction of a receiving terminal, remodeling and construction of gas-fired power stations, and importation of LNG.
In 1980, KEPCO decided to form the Gas Business Promotion Committee (later renamed the “LNG Business Promotion Committee” by the government) comprising comprehensive planning, facility development, and resource procurement divisions. Following the decision to organize the Gas Business Promotion Committee, all LNG related works were turned over the Committee, and more comprehensive and systematic implementation of the LNG project became possible. First, the committee within the electric power corporation established a tentative plan for LNG import, the synthesizing policy of the electricity corporation on LNG business, and the necessary measures for import. The basic directions were to lessen the nation's oil dependency, to gradually expand city gas business, and to secure gas for feedstock for the petrochemical industry.
Economic and technical feasibility studies for LNG import and use and LNG terminal and pipeline construction were simultaneously completed. The joint task force was organized by governmental directive to assess the economic and technical feasibility of the LNG business.

Gas Sector Expansion Strategy for Energy Diversification in Albania
164
Electric power corporation, university, and energy-related institutes such as KEEI and the Korea Institute of Energy Research (KIER) participated in the joint task force. Both institutes are government-funded research institute. KEEI is in charge of energy economic policy, while KIER is in charge of energy technology policy and technology development.
<Table 3-1> LNG Demand Forecast by Sector in the Basic Plan(Unit: Million LNG ton)
Usage 1985 1987 1991
Power GenerationResidentialIndustrial
1,400 (93%)100 (7%)
-
2,550 (85%)284 (9%)166 (6%)
1,914 (64%)613 (20%)473 (16%)
Import 1,500 (100%) 3,000 (100%) 3,000 (100%)
Note: For power generation, the figure for 1985 is the amount of usage for Pyongtaek power station alone; the Inchon power station usage is added for 1987 figure.
Source: Government of the Republic of Korea (1986).
The government with the committee, and electricity corporation confirmed the Basic Policy on LNG import and LNG Business Implementation Plan. Main contents of the LNG Business Implementation plan included:
- LNG supply and demand plan; - Facility plan: receiving terminal, main pipelines, construction plan for city gas
distribution pipeline, modification to power plant to accommodate LNG; - Procurement of revenue resources: Investment details, details of the foreign capital
loans.
In the initial stages of the introduction and supply of natural gas in Korea, demand for natural gas in the electric sector was projected to increase rapidly. This was owing to the advancement of construction of gas-fired power plants and cogeneration plants in large cities such as Seoul. For electric power generation, as much natural gas as possible was to be consumed in off-peak periods of gas demand for the purpose of evening out seasonal variations. Based on this forecast, a long-term natural gas supply and demand plan was made by the government with KOGAS, KEPCO, KEEI, KIER and expert academic groups.
4.2.2. Establishment of Participants in Natural Gas Market
Natural gas business operators stipulated in the City Gas Business Act (or Urban Gas Business Act) are wholesale business operators, general city gas business operators (retail business operators), city gas filling business operators, naphtha off-gas/bio gas manufacturers and synthetic natural gas manufacturers, “natural gas importers and

165
CHAPTER
03N
ational Policy Establishment for N
atural Gas Industrial Structure and Market Design in Albania
exporters” registered pursuant to Article 10-2 (1) of the Act, and “direct importers for self-consumption”.
[Figure 3-18] Natural Gas Business Flow Chart
Ministry of Trade,Industry & Energy
Cooperation on policies
· Approval of retail prices· Administrative guidelines &supervision
· Approval of wholesale prices· Administrative guidelines &supervision
Power generation, Tank lorries
Governors & Mayors
City Gas CompaniesKOGAS
ConsumersLarge ScaleConsumers
Gassupply
Gassupply
Gassupply
RetailWholesales
Source: KOGAS (2021).
KOGAS was established in 1983 by the LNG public corporation establishment law Korea Gas Corporation Act (enacted on December 31, 1982). Its financiers were the central government, local autonomous governments, electric power corporations, and the general public. KOGAS exclusively supplies natural gas to power plants or local city gas companies in the Korean wholesale market, and private city gas companies engage in retail business (termed as the general city gas business) and have exclusive rights with regard to the supply of natural gas through local distribution pipelines within their respective areas. KOGAS imports LNG and distributes it to consumers across the nation. Seventeen power generation plants run by ten power generation companies supply gas to their end users within their respective regions.
At the time of preparing to import LNG, the city gas business was being regulated by the ‘Gas Business Act’ enacted on December 5, 1978. This law regulated overall businesses on gas fuel, including city gas, LPG collective supply, LPG filling, LPG sales and gas products businesses.
The Gas Business Act was wholly revised to the City Gas Business Act on December 31, 1983. According to this law, the business of supplying gas through a pipeline was

Gas Sector Expansion Strategy for Energy Diversification in Albania
166
distinguished into two business areas, wholesale and general city gas business (local distribution), and an approval from the city mayor or provincial governor was required before engaging in gas supply business. Based on this distinction by the law, a dual system was adopted for the domestic LNG supply business at the 4th LNG Business Promotion Committee Meeting. That is, the domestic LNG business would be divided into the wholesale and local city gas areas.
In terms of the distribution structure of natural gas, retail business (city gas company) refers to the stage of supplying natural gas supplied from the Korea Gas Corporation, a wholesale business, to general consumers (household, industrial, commercial, business, transportation, etc.) within the permitted area. As of March 2021, 34 city gas companies have regional monopoly rights and supply natural gas, mainly in major cities across the country. The total city gas supply in 2020 is 23.6 bcm, and the proportion of supply by main use is 45.4% for household use, 32.6% for industrial use, 8.4% for commercial use, 5.3% for business use, 4.6% for transportation, and 3.7% for other uses.
The LNG Business Promotion Committee Meeting also agreed in principle to publicly manage the principal entity for the wholesale business by making it into a law within the year. Thereupon, the Korean natural gas industry has come to be operated in a way that is vertically separated as wholesale and retail parts. The areas of the wholesale business spanning from importing LNG to supplying to local city gas companies by way of receiving terminals (unloading, storage, regasification and transmission) and national transmission network came under the business domain of the public firm, the Korea Gas Corporation (KOGAS).
In parallel with the construction of the existing gas transmission and distribution system, the initial framework for a regulatory system has been developed by the Korea Gas Safety Corporation (KGS). This framework provides for safety codes, defining minimum standards for the gas supply system and end-use equipment, engineering standards for the design and construction of the gas supply system and end-use equipment, and the legislative basis for regulating the operations of public and private entities involved in the sector. The review and development of codes and standards could follow the four-step approach:
- Identification and prioritization of issues via a risk analysis of designs and operational procedures for supply systems and end-use equipment installation and use;
- Operational and environmental research in design criteria, materials, installation techniques, and operational parameters accounting for consumer know-how and public exposure;

167
CHAPTER
03N
ational Policy Establishment for N
atural Gas Industrial Structure and Market Design in Albania
- Development of relevant Korean codes and standards; and - Amendments, if required, of enforcement procedures.
4.2.3. Establishment of Natural Gas related Laws and Regulations
The Korean gas market is regulated by the ‘City Gas Business Act’ (or Urban Gas Business Act). There is no independent gas regulator in Korea. The City Gas Business Act was prepared after a significant amendment to the existing ‘Gas Business Act’ to more effectively and rationally regulate the city gas business. At the time of enactment of the ‘City Gas Business Act’, the authority to approve the wholesale business still belonged to city mayors or provincial governors, as the supply territory of natural gas was confined only to Seoul Metropolitan areas, except that for matters related to supply conditions, including gas rates, an approval from the government was required. As the natural gas supply business expanded to areas outside the capital region, the authority of approval was transferred to the Ministry of Trade and Industry by the amendment to the ‘City Gas Business Act (Urban Gas Business)’ on August 4, 1995.
The Ministry of Trade, Industry and Energy of Korea (MOTIE) is the central administrative body that oversees and enforces Korea’s natural gas policies. It also sets wholesale prices of natural gas provided by KOGAS, as well as retail prices, and is the arbitrator for third-party access to transmission and distribution networks. The government has gradually liberalized natural gas imports. As a result, any company that meets the requirements of the Urban Gas Business Act and the Urban Gas Business Act Presidential Decree is allowed to import natural gas for its own use.
‘Gas wholesale business’ means business in which a person, other than a general urban gas business entity or a producer of byproduct gas from naphtha or biogas, supplies urban gas to general urban gas business entities, urban gas filling business entities, or large-quantity users prescribed by Ordinance of the government. As a wholesaler, KOGAS can supply natural gas directly to large customers, with the extent to which this can be done being defined by the government. In Clause 2 of Article 2 of the ‘City Gas Business Act’, such large customers are defined to be those that meet one of the following qualifications, among the customers whose monthly consumption is greater than or equal to 100,000 m3, and who are being supplied via natural gas pipelines.
The retail portion entails the business of supplying natural gas via pipeline or LPG-air to end-users within a specified territorial unit, and is termed as the general city gas business in the ‘City Gas Business Act’. The general city gas business is given a territorial monopoly

Gas Sector Expansion Strategy for Energy Diversification in Albania
168
whose main functions include the supply of gas, construction of gas supply facilities, and customer safety management. Owing to geographical characteristics, general city gas business entities are not equipped to handle the daily or seasonal balancing of supply and demand. Hence, the wholesaler, KOGAS, does most of this balancing work. As of 2020, there are 34 city gas companies, and those who currently supply LPG-air are expected to supply natural gas when the pipeline network expands to accommodate such transmission.
4.2.4. Development of the Nationwide Natural Gas Supply
KOGAS and the government tried to establish nationwide natural gas supply as soon as possible in the early stage of LNG introduction. An important recommendation was included in the results of a study by expert groups and engineering companies—that natural gas be supplied to the densely populated Metropolitan Seoul area first, and then expanded to the whole country. This recommendation was based on a natural gas demand projection in the study that the economical scale of LNG demand across the country would be about 12 million tons around the year 2000.
The Nationwide Supply Plan set up a goal of supplying natural gas in phases with a view to achieving balanced regional development. To secure supply stability, the trunk line was to take the form of a loop. A double-loop trunk line network was scheduled to be completed by 1993 in the Metropolitan Seoul area, and more pipelines were to be laid in newly developed satellite cities.
City gas companies outside the Metropolitan Seoul area supplied city gas made from LPG or naphtha; gas distribution was inefficient owing to limitations of pipeline pressure. This made their gas price higher than that in the capital city area by more than 30%. The desirability of supplying natural gas to local cities and towns was therefore acknowledged. Because the nationwide supply project was one that would incur a huge amount of capital, an economic assessment was also undertaken as part of the feasibility study, with a conclusion that the project would be viable once the role of LNG had been changed. Initially, gas-fired power plants were to act as swing-consumers of imported natural gas. That is, it had been planned to supply natural gas mainly to the city gas sector and to have the electric power sector absorb surpluses as secondary consumer.
The advantage, in preventing air pollution, of supplying natural gas to large buildings and factories was also considered. Supplying natural gas across the country was regarded as enabling an efficient response to uncertainties in the world oil market with respect to the diversification of energy sources and long-term supply security of energy and resources. The

169
CHAPTER
03N
ational Policy Establishment for N
atural Gas Industrial Structure and Market Design in Albania
continued increase in the welfare of urban households owing to energy consumption was also taken into consideration.
In the short term, the Pyongtaek terminal was planned to be expanded to meet the increasing demand in the Metropolitan Seoul area. To facilitate long-term supply stability, the second LNG terminal was planned to be constructed in Inchon by the end of 1996, and the third terminal was planned to be developed after 2000 with consideration of supply and demand in the southern part of the country.
4.3. Support via Natural Gas Tariff
The natural gas tariff (rate) structure of Korea has a dual system, owing to its characteristic dual business system, in terms of wholesale and retail rates. Wholesale rates refer to the rates applied to power generating customers directly supplied by KOGAS, and to the transfer price applied to the city gas companies for retail. Retail rates differ by supply territory and refer to the end-user prices charged by city gas companies for natural gas supplied via pipeline of city gas companies.
According to the City Gas Business Act, wholesale rates and retail rates of city gas companies require approval from the government and from the relevant city mayor or provincial governor, respectively.
4.3.1. Adjustment of Wholesale Rate
The wholesale natural gas rate consists of feedstock cost and supply cost. To reflect the changing LNG import price in accordance with oil prices and exchange rates, the feedstock cost applicable to KEPCO is adjusted on a monthly basis. In contrast, the feedstock cost for city gas companies reflects fluctuations in import price only on a need basis owing to concerns regarding consumer price stability.
Direct subsidies for natural gas by the government were absent, but backing came in the form of preferential tax treatment. The tax rate applicable to natural gas was much lower than for its alternative fuels (petroleum products, LPG). Other charges levied on petroleum products and LPG, such as imports surcharge, special excise tax, and safety management charge, were not introduced for LNG until after 1994, enabling natural gas to attain competitiveness against other fuels during the early periods of import. Moreover, the revenue from imports surcharge was set aside as petroleum business fund and loaned out for the construction of natural gas pipeline networks at a low rate interest. This also

Gas Sector Expansion Strategy for Energy Diversification in Albania
170
contributed to keeping the supply cost of natural gas lower than that of other fuels.
Initially, the supply cost assessment period was taken to be three years, and the return on equity for the three years was set at zero percent, in order to supply the natural gas as cheaply as possible on the premise that the total supply cost would be recovered through the wholesale supply rate. The government, however, modified the basis of assessing supply cost to more quickly spread natural gas usage. The city gas rate was to be gradually adjusted to a competitive level relative to that for other fuels. To that end, the amount of supply cost to be recovered was adjusted downward and all the benefit of the lower supply cost was applied to the city gas rate only. Applying zero percent of return on equity for this period led to lower supply costs both for city gas and for power generation customers.
As the demand for natural gas from city gas usage rose sharply, the supply cost of city gas companies was curtailed, and their financial strength improved. This led to the adoption of corrective measures for distortions in wholesale rates. Several adjustments were implemented that aimed to alleviate the burden borne by the power generation for the cost that ought to be imposed on city gas sector. Thus, the supply cost for power generation was partly lowered and that for city gas usage was raised to equate the costs for both sectors. As the LNG supply began to expand to its full scale, difficulties arose in raising revenue sources for investment. This led to the inclusion of reinvestment revenue sources, besides supply cost, in the rate base, to account for own procurement ability of funds relative to the investment cost during a cost assessment period.
4.3.2. Adjustment of Retail Rate
The determination of retail natural gas rates was confined to the capital area at the early stage of LNG introduction. Rates for commercial use were classified into two. That is, whereas the cooking rate, which is the highest rate among the city gas rates, was applied for general business, use for business building was addressed separately, and a new rate was decided. This aimed to establish appropriate order in the city gas market and to maintain an appropriate price margin with the substitute fuel (LPG). The application of the supply cost reduction to city gas rate was deferred as it could be used as a revenue source for reinvestment, with consideration of the supply cost increase in the wholesale business portion and to encourage investment in the city gas pipeline.
Through many rate adjustments, the natural gas rate was determined on the basis of competitiveness in relation to its substitute fuels, rather than on a cost basis. In the early stages of the natural gas business, there was an acute need to make its use more widespread,

171
CHAPTER
03N
ational Policy Establishment for N
atural Gas Industrial Structure and Market Design in Albania
since demand was outstripped by the minimum supply scale. Thus, the basis of the rate determination that followed was due in part to the difficulty in achieving high penetration were the cost-based rates applied independent of the substitute fuel prices. Another contributing factor for this rate determination practice came from the need to alleviate customer burden following heightened environmental regulations regarding the use of fuels.
In contrast, a system of facility cost sharing, in which customers bear a portion of the pipeline construction cost, was in effect to reduce the supply cost via alleviation of the burden on city gas entities in the early stages. Although this cost-sharing system could have presented an obstacle in securing new customers, this did not transpire, as the burden on customers was not viewed as severe.
4.4. Financial Aids to LNG Business
Three types of fund sources were mobilized to meet requirements: about 60% of the capital requirements was met by contributions from KOGAS’s shareholders including government, and by short-term high-interest funds like the infrastructure funds of national bank and investment funds, the rest being financed with foreign credit. However, KOGAS suffered from difficulties with its projects owing to insufficient contributions from shareholders and interest costs during construction.
Thus, having realized that mobilizing financing sources with favorable terms and conditions was essential to the efficient development of the project, the Korean government established several energy-specific funds to support the development of the energy industry and stable energy supply. Financial aid from the fund that started in 1986 was carefully deliberated and awarded in accordance with the laws and regulations. The Petroleum Enterprise Fund, the Coal Industry Development Fund, the Coal Industry Stability Fund, the Energy Utilization and Rationalization Fund, and the Overseas Resource Development Fund played a key role in establishing the infrastructure for energy supply in addition to attracting overseas loans and investment in the 1980s. In particular, the government established the Petroleum Enterprise Fund by using oil import levies to efficiently pursue oil development projects. The Petroleum Enterprise Fund was an effective system that played a supporting role in LNG introduction. These funds were integrated into the Special Accounts for Energy and Resource Projects in 1995.
Energy-specific funds were integrated into Special Accounts for Energy & Resource Projects and the Electric Power Industry Infrastructure Fund, newly started to restructure

Gas Sector Expansion Strategy for Energy Diversification in Albania
172
the electric power industry. A large share of the energy-specific funds was earmarked for the construction of receiving terminal and trunk pipelines.
[Figure 3-19] Structure of Energy Specific Funds in Korea
1980s 1990s -
Oil Enterprise Fund(1979)
Coal Industry Stability Fund,Coal Industry Development Fund (1987)
Electric Power Industry Infrastructure Fund(2000)
Special Accounts for Energy and Resource Projects(1987)Energy Utilization and Rationalization Fund
(1979)
Overseas Resource Development Fund(1979)
Gas Safety Fund(1984)
1997
Source: KEEI (2014).
To supply capital with low cost, the government paid in capital contribution to KOGAS. Moreover, KOGAS and city gas companies benefited from the government’s tax relief schemes, for example being exempted from corporation tax, acquisition tax, registration tax, and real estate tax. One of the most important reasons for the introduction of natural gas was to supply quality fuel to the general public in a stable manner. However, raising internal funds for investing in city gas distribution facilities turned out to be difficult because of the petty funds within the city gas companies. Moreover, potential residential consumers hesitated to install facilities.
4.5. Long-Term Energy Supply and Demand Plan
4.5.1. Structure of National Energy Plan by Sector
In the case of Korea, in 1998, the government established the first Energy Master Plan for a 20-year period plan, which is re-established and implemented every five years. The Energy Master Plan is a medium/long-term plan with a long establishment period. Thus, because it is difficult to consider changes in policy, related plans must reflect conditions at the time of their establishment. Related plans are established autonomously, reflecting changes in policy within the scope of compliance with the principles and direction of the Energy Master Plan. The Master plan can be understood as comprising the top level of national plan governing principles and directions for other plans, including the Basic plan for long-term electricity supply and demand, the basic plan for long-term supply of natural gas, the national basic

173
CHAPTER
03N
ational Policy Establishment for N
atural Gas Industrial Structure and Market Design in Albania
plan for new and renewable energy, the basic plan for the rationalization of energy use, and
the basic plan for energy technology development.
[Figure 3-20] Structure of National Energy Plan by Sector
Master Plan for National Energy
Plan for technology development ofnational energy resources
Stategy for climate change (MasterPlan for reducing greenhouse gas)
Plan forratlonallzatlonof energy use
Plan foroversearesource
development
Plan forunderwater
mineralresources
Plan foroll reserve
Plan forpower supplyand demand
Plan fornatural gasLong-term
supply
Long-termPlan for
coal Industry
Plan forTechnology
developmentand distributionof renewable
energy
Demand Supply
Source: KEEI (2014).
The Energy Master Plan is based on the Law on Low-Carbon Green Growth. The scope of the Plan is as follows: i) trends and forecast of domestic and overseas energy supply and demand; ii) measures to secure, introduce, supply, and manage energy; iii) Energy demand targets, energy source composition, and energy conservation and efficiency improvement; iv) measures to supply and use environmentally friendly energy (e.g. renewable energy); v) measures for energy safety management; vi) Technology development, cultivation of expert talent, international cooperation, resource development, and energy welfare.
The First National Energy Plan (1997-2006) was established pursuant to the Rational Energy Utilization Act, and the Second Plan (2002-2011) was announced in 2002. Korea accomplished, in the First Planning term, the following energy policy tasks: i) expansion of energy supply facilities and networking of the energy infrastructure, ii) development of domestic and international resources, iii) successful stabilization of energy demand, and vi) restructuring of the energy industry (electricity, natural gas and district heating sectors). The share of energy consumption and the energy consumption per value-added for the top 3 energy-intensive industries (steel, cement and petrochemicals industries) are trending downward since reaching their peak in 1998 as a result of the government’s industrial energy efficiency policies. Moreover, despite the rapid increase of energy consumption, a stable energy supply can be obtained through the expansion of energy supply facilities. Our dependence on oil as a primary energy source has steadily decreased since the mid

Gas Sector Expansion Strategy for Energy Diversification in Albania
174
1990's, while LNG imports and power generation by nuclear energy and bituminous coals have increased, contributing to the security of the energy supply. The introduction of the market system into the energy industry was actively promoted to reduce monopolistic and regulative inefficiencies.
The major policy tasks of the Second Energy Master Plan are i) to enable the transition to demand management energy policy, ii) to build distributed power generation systems, iii) to meet environment and safety demands, iv) to strengthen energy security and providing a stable supply, v) to establish stable supply systems by source, and vi) to promote energy policy considering people’s interest. The Second Planning term saw increased awareness of the importance of demand management, harmony with environment and safety, and distributed power generation systems in energy policy. While the first plan emphasized the importance of a stable energy supply to meet demand, subsequent plans emphasize the importance of demand management. The Korean government has also met environment and safety demands (application of GHG reduction technology to respond to climate change, prioritization of safety in nuclear plant operation, and so on), built distributed power generation systems to minimize the side effects of large-scale supply facilities, and expanded energy welfare to improve quality of life. In particular, the supply of renewable energy was expanded and the qualitative capacity of public resource development enterprises was improved in the Second Planning term.
The main components of the 3rd Energy Master Plan (2019-2040) announced in 2019 are the outline of the Energy Master Plan and Assessment of the 2nd Energy Master Plan, changes in domestic and foreign conditions, standard demand and target demand, the basic direction, major task 1 (energy consumption structure innovation), major task 2 (conversion to clean and safe energy mix), major task 3 (expand distributed and participatory energy system), major task 4 (strengthen global competitiveness of energy industry), major task 5 (establish foundation for energy conversion), and future plans. The vision and key tasks of the Third Plan are i) shifting of the energy policy stance to innovation in consumption structure, including reinforcement of demand management by sector and revitalizing of the demand management market, ii) conversion to a clean and safe energy mix with gradual reduction of nuclear power use and drastic reduction of coal power use, iii) expansion of distributed and participatory energy system, vi) strengthening of the global competitiveness of the energy industry in sectors such as renewable energy, hydrogen, and efficiency-linked industries, and v) expansion of the foundation for energy conversion, encompassing the improvement of the market system of electricity, gas, and heat and establishment of big data platforms for energy.

175
CHAPTER
03N
ational Policy Establishment for N
atural Gas Industrial Structure and Market Design in Albania
The Energy Master Plan is established by the following procedures.
[Figure 3-21] Promotion Results of the 3rd Energy Master Plan
Research Services
(Purpose) Preliminary research on basic analysis results, such as demand forecast(Participation) Korea Energy Economics Institute (General), Korea DevelopmentInstitute, Korea Institute for Industrial Economics & Trade, Korea Energy Agency,Korea Power Exchange(Period) Nov. 2017 - Aug. 2018
Composition andOperation of Private
Working Group
(Purpose) Draft Energy Master Plan centered on private experts(Composition) 5 sections and 75 participants(Period) Mar. 2018 - Nov. 2018 (Nov. 7th, 2018 working group submitsrecommendations to government)
Feedback Gathering(Overview) Internal review of recommendations (Ministry of Industry and relatedministries) and gathering of a wide range of feedback(Main content) Open forums, stakeholder meetings, etc.(Period) Nov. 2018 - Apr. 2019
Announcement ofGovernmentProposal andDeliberationConfirmation
(Decision Procedure) Public Hearing National Assembly Report Deliberationof the National Energy Committee Deliberation of the Committee on GreenGrowth Deliberation of the State Council*Clause 2 of Article 41 of the Basic Law on Low Carbon Green Growth(Period) Apr. 2019 - May. 2019
Source: Ministry of Trade.
The government forms and operates a working group to establish the Third Energy Master Plan to collect various opinions from experts including academic, industry, and civic groups. The working group consisted of 5 divisions: General, Demand, Supply, Conflict management and communication, and Industrial jobs. The working group holds regular meetings by division to perform in-depth review by policy task, and collect opinions from local governments, civil societies, and industry groups through briefing sessions by region for 10 months. Intermediate briefing sessions are also held to gather opinions on the progress of working group discussions in the process of establishment of the 3rd Energy Master Plan. The recommendations of the working group for the 3rd Plan are submitted to the government. After receiving the recommendations, the government first holds an open forum and discussions on them. In the open forum, expert panel presentations and discussion held for each key agenda point: Innovation in Consumption Structure, Energy Conversion tasks, 4th Industrial Revolution and Future Energy Industries, and Renewable Energy Vision.

Gas Sector Expansion Strategy for Energy Diversification in Albania
176
<Table 3-2> Major Discussion Topics by Working Group Division
General• Establishment of the basic direction of the Third Energy Master Plan (vision, policy
objectives, etc.)• Overall coordination of the 4 divisions, such as supply and demand
Demand • Demand outlook, target demand setting, demand management, and price and tax policies
Supply• Energy supply systems, energy market and governance systems• Energy international cooperation, energy safety (e.g. cooperation with northern and
southern nations)
Conflict Management & Communication
• Energy conflict prevention and coordination, resolution mechanism formation• Promotion of public participation and enhancement of local government responsibilities
and roles
Industrial Jobs• Identifies and fosters future energy industries and creates quality jobs• Innovation and human resource development, energy conversion infrastructure
construction plan, etc.
Source: Ministry of Trade, Industry and Energy of Korea (2020).
4.5.2. Long-term Plan for Supply and Demand of Electricity and Natural Gas
The Basic Plan of the Electricity Supply and Demand (BPLE) is drawn up on a biennial basis by the government and the Electricity Policy Review Board (EPRB) pursuant to the Electricity Business Act that forecast least 15 years ahead. The main contents of the Basic Plan are as follows: evaluation of the previous basic plan; long-term forecast for electricity demand; goals for the management of electricity demand; plans for facilities for electric power generation, electric power transmission; and efforts to reduce greenhouse gas emissions in electricity sector. The establishing procedures are as follows: working-level plan → consultation among ministries → government draft → report to the National Assembly Standing Committee on Trade, Industry, Energy, and so on. → public hearing (open forum) → review by the Electricity Policy Review Board. Working subcommittees are formed under the basic direction of the Basic Plan. The Integrated Supply-Demand Committee, working subcommittees, and working specialized groups by sector are operated during the period of establishment of the Basic Plan.46
46 See MOTIE (2020), “The 9th Basic Plan of the Electricity Supply and Demand.“

177
CHAPTER
03N
ational Policy Establishment for N
atural Gas Industrial Structure and Market Design in Albania
[Figure 3-22] Promotion of the Basic Plan for Electricity Supply and Demand
Electricity Supply-DemandCommittee Meeting (May, previous year)
Prepare Demand Outlook &Capacity Plan
(Sep.~Dec. previous year)
Electricity Policy Review BoardReview, Announcement
(Feb. current year)
Reveive Intents for Construction(~Oct. previous year)
Disclosure of Evaluation Criteria(Aug. previous year)
Evaluate Construction Intents(Jan. current year)
· Discuss directions of the plan· Consists of two subcommittees (Demand Planning,Capacity Planning)
· Receive intents for evaluation from all generationcompanies
· Finalize evaluation criteria, hearings, and discloseevaluation criteria
· Forecast mid- & long-term demande· Set fuel type for generation capacity
· Verify required docs for evaluation, re-evaluateobjections raised
· Electricity Supply-Demand Committee Meeting Public Hearing EPRB Review Announcement by the government
Source: Ministry of Trade, Industry and Energy of Korea (2020).
The Korea Power Exchange (KPE), with KEEI, projects maximum national electricity demand using mid-term and long-term forecast models. To meet electricity demand, the government and the Korea Power Exchange conduct surveys on utilities companies to determine whether they have a plan to construct generation facilities. Facilities expansion plans are then formulated according to year and generation source, including natural gas. Generation companies pursue facilities construction projects based on outlook and capacity plans in the BPLE.
The basic directions of the BPLE are to minimize the requirements for new power plants with active demand side management, to secure stable reserve suitable for economy scale, and to expand power plants with regional acceptance and transmission system condition in consideration.
In 1993, the government announced a Long-term Natural Gas Supply and Demand Plan (“Natural Gas Plan”), as the realized volumes of city gas supply grew faster than expected, and as it was also anticipated that the natural gas demand for power generation would grow rapidly due to the revision of the Long-term Electricity Supply and Demand Plan 1993. In the Long-term Natural Gas Supply and Demand Plan announced in January 1996, the demand forecast was revised again owing to higher-than-expected demand, as was also the case for

Gas Sector Expansion Strategy for Energy Diversification in Albania
178
the plan announced in 1993. With the outbreak of the financial crisis in late 1997 in Korea and Asian countries, a considerable change has been made to the Long-term Natural Gas Supply and Demand Plan as well as the facility construction plan. Difficulties in mobilizing capital for facility construction compelled the construction plan to change to a great degree.
The government draws up the Natural Gas Plan every two years, based on the Energy Master Plan and the Basic Plan of the Electricity Supply and Demand and a city gas demand projection model. The Natural Gas Plan is designed to secure the stability of the natural gas supply/demand relationship and the efficient utilization of facilities in the entire country over 15 years. The Natural Gas Plan is compared and evaluated in light of the previous plan, a long-term natural gas supply/demand outlook, a natural gas import plan, and a supply equipment investment plan. Promotion procedures for establishing the Natural Gas Plan are similar to that for the BPLE (Electricity). The establishment procedure for the installed capacity plan is as follows:
- Forecasting mid- and long-term target demand and investigating the construction intentions of companies;
- Deducting proper facility scale and supply mix; - Deciding evaluation standards for construction intentions; - Evaluating construction intentions; and - Establishing an installed capacity plan.
5. Comparison of Laws and Regulations on Natural Gas in Albania and Korea
5.1. Laws and Regulations on Natural Gas in Albania
The basic laws and regulations of the energy sector in Albania were prepared by the country’s main governmental and regulatory institutions. These regulations defined the organization and development of the Albanian energy sector and constituted the basis for the policies, strategies, programs, and regulations of many of the country’s main institutions, including:
- Government and regulatory organizations, which include government ministries and the regulators and agencies to which ministries delegate specific responsibilities;
- Public sector companies such as KESH Sh.a., OST Sh.a. and OSHEE Sh.a. (divided into three other companies: Universal Service Supplier SA (FSHU), Free Market Supplier

179
CHAPTER
03N
ational Policy Establishment for N
atural Gas Industrial Structure and Market Design in Albania
SA (FTL), and Distribution System Operator SA (OSSH)), which are currently the main players in the electricity sector, as well as Albpetrol Sh.a. and Albgaz Sh.a. in the oil and gas sector;
- Private sector companies, which control most of the main activity in the oil and gas sector, while staying mainly focused on electric power generation and trading activity in the electricity sector;
- Organizations involved in the line of supervision by the relevant ministry for each public sector company to meet the requirements of the acquis.
Albanian legislation on the energy sector is entirely based on the legal framework of the EU for the natural gas and electric power sector, for which the basic legislation is based on the directives and regulations of the Third Energy Package of the EU.
The main laws of the Albanian energy sector are as follows:
- Electricity sector: Law No. 43/2015, dated 30.04.2015, "On the electric power sector,” as amended (Official Gazette No. 87, dated 28.05.2015);
- Natural gas sector: Law No. 102/2015, dated 23.09.2015, "On the natural gas sector,” as amended (Official Gazette No. 178, dated 15.10.2015);
- Energy efficiency, Law No. 124/2015, dated 12.11.2015, “On energy efficiency” (Official Gazette No. 201, 24.11.2015);
- Renewable energy sector: Law No. 7/2017, dated 2.2.2017, “To promote the use of energy from renewable sources,” (Official Gazette No. 26, dated 20. 02.2017);
- Petroleum exploration and production: Law No. 7746, dated 28.7.1993, “On petroleum (exploration and production),” as amended;
- Transportation, refining, and trading of crude oil and its by-products: Law No. 8450, dated 24.2.1999, "On the refining, transportation and trade of oil, gas and their by-products," as amended; and
- Biofuels: Law No. 9876, dated 14.2.2008, "On the production, transportation, and trade of biofuels and other renewable fuels for transport."
The Energy Regulatory Authority (ERE) of Albania is the main regulatory institution in the energy sector and an independent (non-governmental) institution. In the preparation of the laws and regulations for the energy sector, Albanian authorities and institutions cooperated closely with the Secretariat of the Energy Community (established in 2005 in Athens, Greece), which brings together the EU and its neighboring countries, including Southeast European countries, to create an integrated energy market. The Energy Community has helped bring the Albanian legislation for the energy sector closer to that of the EU’s.

Gas Sector Expansion Strategy for Energy Diversification in Albania
180
The organization of the Albanian electricity market is based on the Decision of the Council of Ministers of Albania "On the approval of the electricity market model" (No. 519, dated 13.07.2016), the implementation of which is related to the effectiveness of the trading market and the establishment of the Electricity Exchange. In 2019, the electricity market functioned on the basis of the Decision of the Council of Ministers of Albania "On the approval of the conditions for establishing the public service obligation" (No. 244, dated 30.03.2016, amended), which will be applied to licensees in the energy sector. The regulatory authority, with the decision of the ERE Board, has approved the "Rules of the Albanian Electricity Market as well as the agreement for participation in the Albanian Electricity Exchange" (No. 214, dated 28.12.2017).
The organization of the Albanian electricity market is based on the Decision of the Council of Ministers "On the approval of the electricity market model" (No. 519, dated 13.07.2016), the implementation of which is related to the effectiveness of the trading market and the establishment of the Electricity Exchange. In 2019, the electricity market functioned based on the Decision of the Council of Ministers "On the approval of the conditions for establishing the public service obligation" (No. 244, dated 30.03.2016, amended), which will be applied to licensees in the energy sector. The regulatory authority, with the decision of the ERE Board, has approved the "Rules of the Albanian Electricity Market as well as the agreement for participation in the Albanian Electricity Exchange" (No. 214, dated 28.12.2017).
The organization of the Albanian gas market is based on the Decision of the Council of Ministers "On the approval of the natural gas market model" (No. 590, dated 9.10.2018). The regulatory framework established so far in Albania is at a much higher level than the progress of its infrastructure development. A major step in this direction will be the adoption of the Albgaz Sh.a. network code for its future transmission system and the adoption of the TAP network code, the latter being in line with the exemption decision of ERE and Italian and Greek national regulatory authorities (the regulatory authority ERE transposed the network codes for gas in Albania).
5.2. Laws and Regulations on Natural Gas in Korea
5.2.1. Natural Gas-related Legal Structure and Functions
The laws and regulations related to Korea’s natural gas business are the City Gas Business Act (or Urban Gas Business Act), High-pressure Gas Safety Control Act, and Korea Gas Corporation (KOGAS) Act. The purpose of the City Gas Business Act is to protect gas users'

181
CHAPTER
03N
ational Policy Establishment for N
atural Gas Industrial Structure and Market Design in Albania
interests and promote the sound development of the city gas business by rationally adjusting and fostering it. It also aims to secure public safety by determining matters such as the installation, maintenance, and safety management of facilities for gas supply and use (Article 1: Purpose). The purpose of the High-pressure Gas Safety Control Act is to govern on matters pertaining to the production, storage, transportation, sale, and use of high-pressure gas; aspects such as the manufacturing and inspection of containers, refrigerators, and specific equipment for high-pressure gas; ensuring the basic aspects of gas safety to prevent hazards caused by high-pressure gas; and to secure public safety (Article 1). The Safety Control and Business of Liquefied Petroleum Gas Act ensures public safety by governing on matters concerning the export and import, filling, storage, sale, and use of liquefied petroleum gas; safety control of gas appliances; and ensuring the proper supply and use of liquefied petroleum gas through rational regulation (Article 1).47
The main contents of the High-pressure Gas Safety Control Act of Korea are as follows:
- Purpose, scope of application, definitions; - Development of master plans for safety control; - Research and development projects on safety technologies and standards for high-
pressure gas; - Permission for production of high-pressure gas; registration of manufacturers,
importers, and transporters; grounds for disqualification; reporting on the commencement or succession of business; revocation of permission or registration; obligations of suppliers; penalty surcharges;
- Safety control regulations, maintaining safety, safety evaluation/managers, inspections, conduct of close safety examinations, quality guarantee/maintenance/inspections, certification of safety equipment, usage reports, import declarations, transportation, detailed standards, safety education;
- Information support on pipelines, verification of status of underground pipelines, consultation on excavation works, compliance with standards for prevention of damage to pipelines, safety measures for pipelines;
- Purchase of insurance policies, notification of accidents, investigation board for accident, overall guidance and supervision;
- Establishment of the Korea Gas Safety Corporation and its operations, executive officers, and supervision;
- Gas technical standards committee; - Fees, safety control charges, entrustment of collection of charges and surcharges;
47 See “City Gas Business Act (amended on 27.12.2016),” “High-pressure Gas Safety Control Act (amended on 24.03.2020),” and “Korea Gas Corporation Act (amended on 31.12.2018),” The Korean Law Information Center.

Gas Sector Expansion Strategy for Energy Diversification in Albania
182
- Designation of inspection agencies, revocation of designations; - Entrustment of affairs, requests for disposition, relationship to other statutes; - Penalty provisions, administrative fines.
Major secondary legislations related to the natural gas business are the presidential enforcement decree and ministerial ordinance of the above-mentioned three acts, public notice of the ministry, and the internal regulations of KOGAS. The public notices of the ministry are as follows:
- Integrated public notice of urban gas safety control standards; - Public notice of procedures and methods for the precise safety diagnosis of urban gas
medium-pressure pipelines; - Public notice of urban gas quality standards; - Public notice of procedures and methods for the precise safety diagnosis of the LNG
receiving terminal and LNG storage tanks; - Special standards for installation and safety management of temperature-pressure
compensator; - Public notice of the obligation to stockpile natural gas; - Criteria for the separation of city gas business accounting; - Criteria for calculating the supply costs for city gas companies; - Integrated public notice of high-pressure gas safety control standards; - Special standards for hydrogen vehicle charging station facilities and technical
standards; - Public notice of the imposition and collection of safety control charges; - Public notice of the quality standards and quality inspection methods for high-
pressure gas; - Operational guidelines for the pipeline network supply business of liquefied
petroleum gas, etc.; - Integrated public notice of liquefied petroleum gas safety control standards; and - Public notice of the fulfillment of obligations of persons obligated to stockpile
liquefied petroleum gas.
Further, internal regulations of KOGAS are as follows:
- Regulations on the natural gas business; - Regulations on using gas pipeline facilities; - Guidelines for using gas-producing facilities; - Regulations on support projects related to the construction of natural gas supply

183
CHAPTER
03N
ational Policy Establishment for N
atural Gas Industrial Structure and Market Design in Albania
facilities; - Regulations on support projects related to the construction and operation of natural
gas producing facilities; - Regulations on natural gas supply and demand management; and - Regulations on natural gas supply.
5.2.2. Gas Emergency Response and Safety Management48
In Korea, gas emergency responses are implemented as follows: i) emergency response measures, ii) fuel switching and storage, and iii) network resilience.
For gas emergency response measures, the Korean government promulgated the enforcement ordinance on Article 10-10 of the City Gas Business Act in 2016. Outside of commercial stocks, KOGAS is required to hold two types of stocks: i) mandatory inventory volume, and ii) preventive reserve volume. The volumes are 7 days and 3 days, respectively, based on the average daily domestic sales volume of the last 24 months. If the gas stock level is forecasted to stay below the natural gas inventory for 7 or more consecutive days over the subsequent 60 days, emergency measures will be put in place to balance supply and demand. KOGAS leads the emergency assessment to determine the stage of the emergency alert system and reports to the government (MOTIE), which is in charge of the alert announcement.
The emergency response plan envisages gradual response measures depending on the severity of the crisis. To address a light-level disruption, KOGAS can secure an additional gas volume by purchasing spot cargoes and undertaking cargo swaps or cargo rescheduling, although it could take several days to bring an additional cargo to the market. Demand restraint measures are part of the emergency response measures to address a severe gas supply disruption. However, there is no volumetric assessment of savings from the gas demand restraint measures available.
In 2011, the Korean government implemented gas supply and demand stabilization measures, as there was a shortfall in gas supply owing to an extraordinarily cold winter. The government set up the Supply and Demand Task Force and implemented gas emergency response actions, such as securing additional volumes of gas and undertaking cargo rescheduling. Planning of power and city gas demand control was also put in place. There has not been any other supply disruption since 2011.
48 IEA, Korea 2020 Energy Policy Review, November, 2020.

Gas Sector Expansion Strategy for Energy Diversification in Albania
184
The second gas emergency response is fuel switching and storage. As part of its 13th Plan for Long-term Natural Gas Supply and Demand published in April 2018, the Korean government has introduced fuel-switching contracts to encourage the use of alternative fuels instead of natural gas during a gas supply disruption. Currently, city gas companies are pursuing fuel-switching contracts for industries with dual boiler facilities. Despite this positive improvement, the government has not seen significant growth of fuel-switching capacity in the short term. KOGAS performs regular surveys to check inventories of alternative fuels at power generation companies. Co-generation power plants are required to include a mandatory provision to secure alternative fuels in their gas procurement contracts. Owing to the importance of storage to address supply disruptions, the Korean government established safety management measures for oil and gas storage facilities in 2019. These measures will strengthen the management system, improve security systems, streamline onsite response systems, and promote safety investment.
The final response is supply network resilience. In Korea, the nationwide gas network is composed of multiple regional networks. Those gas networks have a circular shape and a high level of redundancy in the gas transmission lines for improving the security of supply. This network shape is very specific and suitable for the country, as there are no cross-border pipelines that might be used in case of a disruption. The “N-1” standard relates to the ability of a country to meet its gas demand if there is a failure of the single largest unit/piece of gas infrastructure. For Korea, the critical pieces of infrastructure are the LNG import terminals, which are the entry points for gas imports into the country.
To reduce the risk of a supply disruption, KOGAS has been working on splitting its LNG terminals into smaller plants by implementing physical separations. Adding independent compressor units is a common practice in the global gas industry to lower the risk of failure and prevent a spread effect in the event of failure. The split aims to better contain the impacts of operation failure when it takes place in facility-clustered areas. Discussions are still ongoing to implement this concept in other LNG terminals.
5.3. Comparison of Laws and Regulations between the Two Countries
First, the deep reform of the energy sector in Albania, according to the standards of the EU, as well as its full integration at the regional and European levels is one of the strategic goals of the government and other Albanian institutions responsible for the energy sector. Over the last decade, Albania has been in the process of developing and implementing a number of laws, decisions, and key regulations that will affect the efficient reform of key

185
CHAPTER
03N
ational Policy Establishment for N
atural Gas Industrial Structure and Market Design in Albania
actors in the energy sector and the climatic change response. The main programs in the energy sector reforms are based on the basic legislation of this sector, including:
- The Energy Community Treaty (ECT), ratified by the Parliament of Albania with a law "On the ratification of the Treaty establishing the Energy Community" (No. 9501, dated Aril 3, 2006), which provides a legal framework for convergence with the energy acquis in the EU; and
- Laws "On the electric power sector," "On the natural gas sector," "On the approval of the electricity market model," "On the approval of the natural gas market model," "On the approval of the rules of the Albanian electricity market and the agreement for participation in the Albanian energy exchange," "On energy efficiency," and "On promoting the use of energy from renewable sources.”
Therefore, as explained earlier, the energy laws and regulations in Albania, including regulations on natural gas, have been well enacted and revised in line with the EU's legal framework, backed by EU’s policy consulting support. Restructuring of the energy industry is also being implemented by the Albanian government within the guideline of the EU.
As explained above, laws regarding natural gas are similar in Korea and Albania in terms of composition and basic content. The Albanian Law on Natural Gas Sector has the following structure:
- General provisions: purpose, object, scope of application, definitions; - Policies: ministry’s role, supply security, authority for overseeing, regional
cooperation, technical and safety rules, construction and use of pipelines and infrastructure, property rights);
- Regulation-regulator (regulatory authority (ERE), objectives, responsibilities, rights, cooperation and consultation with the public and other authorities;
- Regulation-licensing: procedure, conditions, publication, refusal, revocation, modification, transfer, maintaining the balance sheets, right of access to the account;
- Regulation-tariffs: regulated fee activities, setting tariffs, fees and balancing rules; - Activities-transmission/distribution/storage/LNG plants: certification, monitoring,
responsibilities, third party access, refusal of access rights, network code, principles of capacity allocation mechanisms, transparency requirements, network development and investment decisions, compliance programs, regional and international cooperation;
- Activities-production: producers, access to pipeline networks; - Activities-supply: rules, data retention;

Gas Sector Expansion Strategy for Energy Diversification in Albania
186
- Market: opening, trading, organizing, promotion measure for opening, monitoring and surveillance, rules;
- Obligations of public service: standard supply contract; - Final customer protection and settlement of disputes: end customer, supplier
liabilities, protection, dispute resolution; - Inspection, supervision, administrative offenses and sanctions: organization, duties,
measurement; and - Transitional and final provisions.
The Korean Urban (city) Gas Business Act has the following structure:
- General provisions: purpose, definitions; - Business: permission, succession, reporting, revocation, penalty surcharges,
registration for export and import; - Supply facilities and using facilities: approval of construction plan, installation of
emergency facilities, use of public land, construction and management, keeping and presentation of records, supervision, temporary use, inspections, implementation of safety inspections and evaluations, standards;
- Supply: plans, obligations to supply, expenses share/support, regulations, restrictions on use, maintenance/inspection of quality;
- Safety management: regulations, maintenance, improvement orders, management agents, measures, managers, education;
- Safety-protection of pipelines: establishment of excavation work information support center, verification of status of pipelines laid underground, impact assessment, consultation, inspections, compliance with standards, measures;
- Installers of supply facilities other than entities, joint use of facilities; - Supervision: adjustment orders, accounting, guidance and supervision, reports; - Supplementary provisions: purchasing insurance, distribution of safety devices,
investment in safety management, hearings, notification of violations, relationship to other acts; and
- Penalty provisions.
Thus, although the provisions between the two countries are similar, because Albania is in the early stages of the formation of the natural gas market, its laws and regulations on the operation and function of natural gas companies and organizations are not yet as detailed and specialized as those of countries such as Korea. Korea has more than 40 years of abundant experience in natural gas industry development, safety management of supply infrastructure, investment financing, and R&D support policy; therefore, laws and

187
CHAPTER
03N
ational Policy Establishment for N
atural Gas Industrial Structure and Market Design in Albania
organizations in these sectors in Korea are well established and efficiently operated. In particular, Korea has a well-developed institutional infrastructure that supports the stability of supply and demand and the development of the natural gas industry.
As mentioned above, in Korea, government-funded research institutes, organizations/corporations related to gas safety and technology, and KOGAS contributed greatly to the successful formation of the natural gas market in the 1980s and to the development of the natural gas industry thereafter. In addition, Korea has well-established gas emergency response measures. Thus, as the natural gas industry develops rapidly in Albania, the need for laws/regulations, establishing government policy/strategy, and securing the safety of supply facilities will greatly increase.
6. Recommendation: The Establishment of a Natural Gas-Related Agency
6.1. Needs and Steps Required to Establish a Natural Gas-Related Agency
In the early stages of the natural gas market’s formation, the government’s role is crucial to creating new demand for natural gas in terms of power generation, industry, and the residential/commercial sectors; implementing long-term plans and strategies; securing supply stability; and establishing appropriate support policies for R&D and financing. The government creates several forms of support and management institutions, such as the Korea Energy Economics Institute (KEEI), and market participants, such as KOGAS and public electrical power companies.
To stimulate fresh demand for natural gas, the government must set targets for mid/long-term natural gas demand to meet the size of the future economy and energy markets. In South Korea, government-funded, energy-related research institutes play a vital role in forecasting long-term energy demand and devising implementation plans and strategies for the stability of S&D. With regard to ensuring a stable supply, the government must found or cultivate natural gas (private or state-owned) companies, and manage and oversee them to reliably/safely supply natural gas to the market. Finally, the government should set up and implement various support policies and measures to expand the natural gas industry and to promote companies’ R&D activities.

Gas Sector Expansion Strategy for Energy Diversification in Albania
188
[Figure 3-23] Structure of National Energy Plan by Sector
Government
Government-funded lnstitutes· KEEI: policy, analysis, forecast· KIER: development and spreadof energy technologies
· KIGAM: exploration,development, utilizationof underground resources
KGS· Development ofSafety Technology
· Promotion ofSafety Control
· Testing, Inspection,Education
KOGAS· Overseas Gas Developer· LNG Importer· Wholesaler
KOGAS-Tech· Maintenance, Repair,Remodeling Constructionof Gas Facility/Pipeline
· Inspection, Consulting/Education
City Gas Companies· Retailers· Territorial Monopolies
Power Companies· KEPCO· Private GeneratorAgency
· KETEP: operation of technologypolicy program, R&D programs,education, training support
Support and Management Agency Market Participant
Source: KEEI (2014).
As explained in the previous chapter, KOGAS and Albgaz are the gas suppliers in South Korea and Albania, respectively Albgaz. However, since Albania is in the early stages of forming its natural gas market, there are no public enterprises/agencies responsible for safely supplying natural gas in Albania. Further, the country lacks research institutes to help launch energy policies, long-term plans/strategies, and R&D activities. The previous chapter explains the process of laying the foundations for a basic plan for mid- to long-term gas S&D, the role of government-funded research institutes and government organization for building plans/strategies, how to finance investments, as well as regulations and measures to guarantee a safe supply.
Hence, this section offers policy recommendations regarding the role/function and organization of government-funded research institutes, gas companies, and institutions. Initially, research institutes such as the Korea Energy Research Institute (later renamed the Korea Institute of Energy and Resources) were formed to oversee technology development, along with policy research functions by the South Korean government. Energy companies owned and operated their own technology labs or institutes. Nevertheless, since the government’s role in developing the natural gas market gradually expanded, it was necessary to establish an energy policy research institute, such as KEEI, to support policy creation, funding, and market management. Thus, KEEI, in charge of policy research, was separated from the Korea Institute of Energy and Resources. Moreover, the Korea Institute of Energy and Resources was split into the Korea Institute of Energy Research (KIER), which is responsible for new energy technology, and the Korea Institute of Geoscience and Mineral Resources (KIGAM), which is responsible for exploring, developing, and utilizing

189
CHAPTER
03N
ational Policy Establishment for N
atural Gas Industrial Structure and Market Design in Albania
underground resources and R&D in response to geological disasters. It is expected that government-funded energy institutes have been inaugurated through this process in many countries.
[Figure 3-24] Family Tree of Energy Institutes in Korea
Korea lnstitute of EnergyConservation
ResourceDevelopment Institute
Korea EnergyResearch Institute
Korea Institute ofEnergy and Resources
Korea Institute ofEnergy Research
Korea Institute of Geoscienceand Mineral Resources
Solar Energy Research Institute
Energy Economic PolicyDivision
Korea EnergyEconomics Institute
1978
1976
1979
1980
1986 1991
1978
1981
Source: KEEI (2021).
In the early stages of a natural gas company’s establishment and operation, its main tasks are to introduce and supply natural gas stably and to construct sufficient supply facilities. Notwithstanding, as the market expands significantly, the stability of S&D and supply safety becomes another critical task for gas companies. Thus, when the safe supply of gas becomes increasingly complex and specialized, a gas company (such as KOGAS) separates these functions and founds independent gas safety companies as subsidiaries (such as the Korea Gas Safety Corporation (KGS) and the Korea Gas Technology Corporation [KOGAS-Tech]).
6.2. Establishment of Energy Policy and Technology Think Tank
6.2.1. The Role and Function of KEEI
As the need for effective policy studies was recognized in the wake of the oil shocks of the 1970s, KEEI was founded in 1986; its primary task is to examine the energy market’s current status and to make mid-to-long term predictions. Based on KEEI’s analysis, the government can set a long-term vision and formulate basic plans for each energy source.

Gas Sector Expansion Strategy for Energy Diversification in Albania
190
[Figure 3-25] KEEI’s Management Vision and Strategies
Leading function as a think-tankerfor energy policies· Provision of mid- & long-termenergy policy visions
· Intensification of studies oncurrent issues
Systemized, specialized, andglobalized research work· Construction and execution of majorresearch road maps
· Enhancement of the qualitystandards of the studies
Stable foundation for researchactivities· Procurement of sufficient researchfund
· Flexible utilization of human resources· Improvement of working environment
Efficient management· Flexible restructuring to meet needs· Performance based compensation· Operation of knowledgemanagement system
Professional ResearchInstitute to Advance Changes
In Energy Policies
Source: KEEI (2021).
KEEI’s major tasks and roles are as follows:49
- Collect, analyze, and disseminate trends and information on domestic and overseas energy-related issues;
- Conduct statistical surveys on the energy balance and national energy S&D; - Research on national energy and resource policies; - Forecast the S&D of energy, as well as identify resources and research on the
rationalization of energy utilization; - Research on energy databases and the development of energy economy analysis
models; - Research on the advancement of the energy and resources industry; - Research on countermeasures to the UN Framework Convention on Climate Change
(UNFCCC) concerning energy usage and industry activities; - Develop policy and study support systems for new and renewable energy associated
with regional energy planning research on building infrastructure for “low carbon, green growth” and related policies;
- Operate joint education programs, and conduct research on energy and resources in cooperation with diverse universities, industries, and related research institutes; and
- Carry out research projects commissioned by the government, domestic/overseas public institutions, and private organizations.
49 Korea Energy Economics Institute (KEEI), “Vision,” 2019, http://www.keei.re.kr/keei/eng/eng_about_2.html#.

191
CHAPTER
03N
ational Policy Establishment for N
atural Gas Industrial Structure and Market Design in Albania
KEEI formulates a long-term development plan through economic analysis and policy studies on the energy industry, provides basic information for energy businesses and the government to make decisions, and participates in the creation of mid-to-long term energy supply plans (including for electricity, natural gas, and new and renewable energy). KEEI has also helped to build national energy strategies, including the National Green Growth Strategy, the Long-term Low Greenhouse Gas Emission Development Strategies, and the 2050 Carbon Neutral Strategy. One of KEEI’s most important roles is to collect and organize energy supply data and distribute the data to the government and businesses, as well as to conduct a nationwide census program to identify traits of energy usage and changes in patterns. Based on the statistical data, the institute also makes short-term and mid-term energy forecasts. Lastly, the institute cooperates with the international community, produces cooperation strategies, and supports the government in conceiving of overseas resource development approaches by examining the energy policies, markets, and development trends of major countries.
KEEI has two centers (the Center for Energy Information and Statistics, and the Center for International Energy Cooperation), three departments (Energy Transition Policy Research and Energy Industry Research), and two supporting departments (Research Planning, and Coordination and Administration) to perform the above roles effectively. The names and research fields of these departments, as well as of the centers, are altered flexibly to meet the government’s energy policies. Currently, the South Korean government’s central energy policy is to realize eco-friendly energy transitions based on renewable energy.
[Figure 3-26] Organization of KEEI
President
Research AdvisoryCommittee
Energy TransitionPolicy Research
Group
Energy IndustryResearch Group
Center for EnergyInformation andStatistics (CEIS)
Center forInternational EnergyCooperation (CIEC)
Department ofResearch Planningand Coordination
Department ofAdministration
Electricity PolicyResearch Team
Oil PolicyResearch Team
Energy StatisticsResearch Team
International EnergyCooperation
Research Team
Research Planning andCoordination Team
Human Resources andGeneral Affairs Team
New and RenewableEnergy Research Team
Gas PolicyResearch Team
Energy Demand andSupply Research Team
Overseas EnergyInformation
Analysis Team
Budget PlanningTeam
FinancialAccounting Team
Climate PolicyResearch Team
Nuclear EnergyPolicy Research Team
Energy DemandManagement
Research Team
District Heating andPower Research Team
Auditor
Future Strategy Team
Knowledge and InformationTechnology Team
External Cooperation Team
Auditor Office
Vice President
Source: KEEI (2021).

Gas Sector Expansion Strategy for Energy Diversification in Albania
192
KEEI’s chief sources of income come from the Office of the Prime Minister (about 43% of its total income); the fund for energy statistics, international cooperation activities, and climate change-related businesses of the Ministry of Industry, Trade and Energy (about 25%), and the fund for energy companies for individual research projects (about 32%).
6.2.2. The Role and Function of KIER
KIER was founded in 1977 to generate new national growth engines and to contribute to the national economy by creating and spreading new energy technologies. The institute conducts various R&D activities for renewable energy and greenhouse gas management technologies, including carbon capture. In addition, KIER is developing technologies to use fossil fuels in a clean manner and to improve energy efficiency. The institute supports the formulation of technology policies; provides technical support, certifies tests and evaluations; fosters talent; and commercializes technologies.
KIER also offers a post-graduate course to train science and technology professionals. KIER selects and conducts institute-level research in light of government-selected studies and technological changes both at home and abroad. The institute has forged flexible, cooperative ties with the industrial sector and other research institutes to contribute to the enhanced technology competitiveness of domestic businesses by helping companies to resolve technology-related difficulties, to acquire new technologies, and to receive technology-related information. In addition, the institute runs the KIER Energy Venture Incubation Center, which aims to foster an environment where technology-intensive start-ups specializing in energy and environmental technologies are vibrantly established. KIER selects small- and medium-sized businesses (SMEs) that focus on technology advancements, and provides them with technical assistance by capitalizing on its own technology, equipment, and experienced researchers. KIER also carries out technology transfer programs that aim to improve businesses’ technological capacity and international competitiveness to commercialize technologies. KIER allows universities and businesses to harness its state-of-the-art research and analysis equipment as well.
KIER’s major tasks and roles are as follows:
- R&D of energy efficiency improvement; - R&D of new and renewable energy; - R&D of carbon dioxide treatment and use; - R&D of the clean use of fossil fuels; - Energy-related convergence R&D;

193
CHAPTER
03N
ational Policy Establishment for N
atural Gas Industrial Structure and Market Design in Albania
- R&D cooperation with the government, the private sector, corporations, and organizations, and the entrustment of technical services;
- Cooperation and support for related industries, such as SMEs, and technology commercialization;
- Support for nurturing experts in key mission fields and devising related technology policies; and
- Projects needed to achieve KIER’s purpose, such as incidental projects, tests, evaluations, and certifications under each of the above items.
At present, the KIER has two centers (the Renewable Energy Institute and the Jeju Global Research Center), four divisions (Hydrogen Energy Research, Energy Efficiency Research, Climate Change Research, R&D Strategies), and supporting divisions (R&D Planning and Coordination and Administration). Each division operates several affiliated labs and departments, of which the Energy Efficiency Research Division contains Energy ICT Convergence Research, EMS, Thermal Energy Conversion Systems, Advanced Combustion Power, and Energy Networks.
[Figure 3-27] Organization of KIER
Public Relations Office
Audit Division
Anti-corruptionand Integrity TeamR&D Planning and
Coordination DivisionKIER School
Vice President
RenewableEnergy Institute
PhotovoltaicsResearch
Department
Renewable HeatIntegrationLaboratory
ESS Laboratory
EnergyConversion &
Storage MaterialsLaboratory
Ulsan AdvancedEnergy
Technology R&DCenter
New andRenewable
Energy ResourceMap Laboratory
Jeju GlobalResearch Center
Wind EnergyResearch Team
Marine EnergyConvergence and
IntegrationResearch Team
Electric PowerSystem Research
Team
Hydrogen EnergyResearch Division
HydrogenResearch
Department
Fuel CellLaboratory
Fuel Cell Research& Demonstration
Center
Energy MaterialLaboratory
Energy EfficiencyResearch Division
Energy ICTConvergence
ResearchDepartment
AdvancedCombustion
Power Laboratory
Energy NetworkLaboratory
Thermal EnergyConversion
SystemsLaboratory
Climate ChangeResearch Division
Fine DustResearch
Department
Greenhouse GasResearch
Laboratory
Carbon ConversionResearch
Laboratory
Energy ResourcesUpcyclingResearch
Laboratory
GwangjuBio/Energy R&D
Center
Clean FuelResearch
Laboratory
R&D StrategyDivision
Energy PolicyResearch Team
ClimateTechnology
Strategy Team
BusinessDevelopment
Team
BusinessPartnering andOutreach Team
Global StrategyTeam
Platform TechnologyLaboratory
EMS Laboratory
President
Source: KIER (2021).

Gas Sector Expansion Strategy for Energy Diversification in Albania
194
6.2.3. The Role and Function of the Korea Institute of Geoscience and Mineral Resources50
The Korea Institute of Geoscience and Mineral Resources (KIGAM) is a government-funded research institute, originally founded on May 22, 1918 as the Geological Survey of Korea. KIGAM aims to contribute to sustainable national growth by exploring, developing, and utilizing domestic underground resources; conducting R&D in response to geological disasters occurring in domestic and surrounding areas, as well as to changes in the global environment; and disseminating results. Currently, KIGAM holds priority in the Green Economy, relating geoscience as a new field in light of global climate crises.
KIGAM consists of a convergence research center that develops mineral resources, in addition to several research divisions (Geology, Mineral Research, Petroleum and Marine Life, the Geological Environment, Geoscience Platforms, and Global Cooperation). Among them, the geology division operates four centers (Geological Research, Earthquake Research, Active Tectonics, and HLW Geological Disposal). The mineral research division also operates four centers (R&D Research, Resources Recovery Research, Resources Utilization Research, and Carbon Mineralization).
50 Korea Institute of Geoscience and Mineral Resources (KIGAM), “The World’s Leading Research Institute of Geoscience,“ 2019, www.kigam.re.kr/english/.

195
CHAPTER
03N
ational Policy Establishment for N
atural Gas Industrial Structure and Market Design in Albania
[Figure 3-28] Organization of KIGAM
President
VicePresident
Auditor
Organizational Culture Change Department
Convergence Research Center forDevelopment of Mineral Resources
Auditing Office
Pollcy & Planning DivisionR&D Policy Department
Planning Department
Budget Department
R&D Project Management Department
Information Technology Department & Library
Administration & Management DivisionGeneral Affairs Department
Human Resources Management Department
Accounting & Finance Department
Purchasing Department
Facilities Management Department
Geoscience Platform DivisionGeoscience Data Center
Geo-ICT Convergence Research Team
Northern Geoscience & Mineral Resources Strategy Center
Geoanalysis Center
Geological Museum
Geology DivisionGeological Research Center
Earthquake Research Center
Earthquake Monitoring & Response Team
Center for Active Tectonics
Center for HLW Geological Disposal
Research Vessel Building Center
Global Cooperation DivisionInternational Cooperation Department
Public Reations Department
Tech-biz Center
International School for Geoscience Resources
Mineral Resources DivisionMineral Resources Development Research Center
Resources Recovery Research Center
Resources Utilization Research Center
Center for Carbon Mineralization
KIGAM Pohang BranchResources Engineering Plant Research Department
Advanced Geo-Materials Research Department
Management Department
R/V Management Department
Petroleum & Marine DivisionOil & Gas Research Center
Marine Geology & Geophysical Exploration Research Center
Center for CO2 Geological Storage
Goologic Environment Division Groundwater Research Center
Geo-Environmental Hazards Research Center
Deep Subsurface Research Center
Source: KIGAM (2020).
KIGAM’s primary tasks and roles are as follows:
- R&D of geological science, establish geo-resource-based information, and use ground and underground space efficiently;
- Mineral resource exploration and development, use, and circulation R&D; - R&D for securing underground energy resources; - R&D to respond to earthquakes and geological disasters, as well as changes in the
global environment; - R&D for exploring, developing, and conserving groundwater resources; - R&D cooperation with the government, the private sector, corporations, and

Gas Sector Expansion Strategy for Energy Diversification in Albania
196
organizations, and the entrustment of technical services; - Cooperation and support for related industries, such as SMEs, and technology
commercialization; and - Support for nurturing specialists in major mission fields and creating related
technology policies.
6.2.4. The Role and Function of the Korea Institute of Energy Technology Evaluation and Planning
The Korea Institute of Energy Technology Evaluation and Planning (KETEP) was founded in May 2009 in accordance with the Energy Act to efficiently plan, evaluate, and manage national energy R&D projects in line with the government’s goal to advance the public sector. The institute aims to realize an energy balance that is stable, efficient, and environmentally-friendly by laying the foundation for innovation and the expansion of energy technologies. KETEP is making contributions to meet South Korea’s national vision by fostering new growth engines through green energy technology innovations, formulating a strategic roadmap, developing low carbon green technologies, establishing a results-oriented framework for R&D management, and establishing a green market.
KETEP’s central function is to operate the energy technology policy development program, R&D programs, international cooperation, and to provide higher education and training support for R&D personnel. The energy technology policy development program aims to formulate a proactive response to changing global circumstances, and to craft strategies and measures to reinforce competitiveness in energy technology by analyzing global energy issues and policies, trends in technology and the energy industry, and other relevant matters. The program also supports the establishment of an energy R&D network infrastructure, mid- and long-term planning, and the creation of a roadmap for greenhouse gas reduction technologies.

197
CHAPTER
03N
ational Policy Establishment for N
atural Gas Industrial Structure and Market Design in Albania
[Figure 3-29] Organization of KETEP
President
Public Relations Division Audit Division
Public R&D Innovation
Office of R&DPlanning
Energy ConvergencePlanning Division
New and RenewableEnergy Planning Division
Energy New IndustryPlanning Division
Clean PowerPlanning Division
Energy Technology PolicyPlanning Division
Office of R&D Evaluationand Management
Evaluation SupervisingDivision
New and Renewable EnergyEvaluation Division
Energy New IndustryEvaluation Division
Clean PowerEvaluation Division
Program ManagementDivision
Office of Energy Technology Diffusion
Technology MarketDivision
International CooperationDivision
Human Resources Development Division
Office of Administrationand Management
Management InnovationDivision
Budget ManagementDivision
Personnel andAdministration Division
Source: KETEP (2021).
KETEP operates numerous R&D programs: energy demand side management, ESS technology, a smart grid, a multi-terminal HVDC transmission system, energy safety technology, research on an ESS program for managing peak electricity demands, renewable energy, clean thermal power, nuclear power, high-efficiency gas turbines to generate electricity, energy resource recycling, the R&D of natural resources development technology, radioactive waste management, the enhancement of energy technology acceptance, and the promotion of commercialization.
Based on strategic cooperation with developed and emerging economies, KETEP runs an international joint R&D energy program to obtain advanced energy technologies, and to lay the foundation for domestic technologies to enter overseas markets. Further, KETEP operates a higher education and training support program for R&D personnel that aims to help transform the energy industry into a new growth engine, expand the workforce related to energy technology, and foster R&D specialists.

Gas Sector Expansion Strategy for Energy Diversification in Albania
198
6.3. Establishment of Organizations Related to Gas Safety and Technology
6.3.1. Korea Gas Safety Corporation
In South Korea, KGS, mentioned earlier, is a public enterprise that tests, inspects, and provides education about natural gas business activities, as well as about the safety and use of the gas supply under government control. KGS was created in January 1974 in accordance with Article 28 of the High-pressure Gas Safety Control Act to prevent hazards caused by high-pressure gas, to develop gas safety technology, and to promote gas safety control businesses efficiently and systematically. At the time of its founding, it was called the High Pressure Gas Security Association, and in February 1979, the name was changed to Korea Gas Safety Corporation.
KGS’s main tasks and roles are as follows:
- Prepare drafts of gas laws: KGS prepares and submits drafts of gas-related laws to the government after surveying public opinion, the workplace, and various data. KGS also creates standards and publishes manuals to assist companies;
- Inspect gas facilities: KGS carries out legal inspections of, and provides technical instruction on, gas facilities and petrochemical complexes;
- Safety check-ups and diagnostic services: KGS occasionally carries out special safety inspections for businesses vulnerable to safety control issues;
- Inspect and examine gas appliances: KGS inspects and examines gas appliances, equipment, and safety devices;
- Certification and testing: KGS conducts examinations and provides approval services. KGS also offers certification services for quality control systems;
- Investigate gas incidents: KGS promotes the ability to cope with gas incidents and prevents them from recurring through full investigations of previous ones and by publishing incident data;
- Safety education and training: KGS carries out safety education and training for the industry and nurtures gas safety specialists by awarding qualifications to operators so that they are engaged in the safety control of the gas industry;
- R&D: KGS established the Institute of Gas Safety Technology as a subsidiary lab and research center aimed at improving gas safety technology; and
- Information and advisory services: KGS provides information on statistics, data, laws, codes, and standards related to gas and offers technical advice, suggestions, and consulting services to clients.

199
CHAPTER
03N
ational Policy Establishment for N
atural Gas Industrial Structure and Market Design in Albania
[Figure 3-30] Organization of KGS
President & CEOStanding Auditor
Office of the Standing AuditorOffice of the Management
Executive Director,Planning, Management
2 Affiliated organizations 14 District Head Offices& 15 Branches
Executive Director,Gas Safety Management
Executive Director,Gas Technology
Planning & CoordinationDivision
Human ResourcesManagement Division
Management SupportDivision
Public Relations &International Affairs Division
Technical Inspection &Advisory Service Division
Technical Standards Division
Disaster Management Division
Test & Inspection Division
Institute of HydrogenSafety Technology
Institute of Gas SafetyTechnology Training,
Institute of Gas Safety R & D
Petrochemical Diagnosis Division
Industrial Facility Diagnosis Division
Pipeline Diagnosis Division
Institute of Industrial Gas SafetyTechnology
Chemical Material SafetyDivision
Source: KGS (2021).
As of 2020, the KGS’s organizational structure comprises three departments under 14 divisions and two affiliated organizations. The three departments (Planning/Management, Gas Safety Management, and Gas Technology) contain the following divisions: Planning and Coordination, Human Resources Management Support, Public Relations and International Affairs (Department of Planning and Management), Technical Inspection and Advisory Services, Technical Standards, Disaster Management, Testing and Inspection, the Institute of Hydrogen Safety Technology (Department of Gas Safety Management), Petrochemical Diagnostics, Industrial Facility Diagnostics, Pipeline Diagnostics, the Institute of Industrial Gas Safety Technology, and Chemical Materials Safety (Department of Gas Technology). KGS also operates the Institute of Gas Safety Technology Training, as well as the Institute of Gas Safety R&D, as affiliated organizations.
The Institute of Gas Safety Research is an affiliated organization of KGS; its major activities encompass innovative R&D on gas safety technology, the safety testing of gas equipment, and comprehensive safety management. The institute, consisting of 11 teams in each department, includes excellent researchers. The institute has advanced testing equipment needed to carry out research, conduct collaborative/entrusted research through a related domestic company, and greatly reinforce R&D to improve gas safety technology. In addition, the institute runs a technical cooperation and information exchange program with domestic/overseas researchers and organizations in the field of gas safety.

Gas Sector Expansion Strategy for Energy Diversification in Albania
200
6.3.2. Korea Gas Technology Corporation
KOGAS-Tech, mentioned earlier, is a subsidiary of KOGAS. Established in 1993, it is financed by KOGAS to provide a reliable and safe natural gas supply facility. KOGAS-Tech has reduced the industry’s reliance on foreign technology to construct LNG terminals through technical development in the engineering sector, including the localization of LNG storage tank designs.
Since its founding, KOGAS-Tech has become the foremost company in the natural gas sector, helping to expand the use of natural gas as fuel for the nation. By doing so, KOGAS-Tech has realized preventive inspections and maintenance of natural gas production and supply facilities. Further, KOGAS-Tech succeeded in domestically designing LNG storage facilities, which contain a high value-added technology, not to mention the maintenance know-how related to natural gas facilities.
KOGAS-Tech’s chief tasks and roles are as follows:
- Gas facility maintenance/repairs, as well as construction for remodeling; - Safety inspections and maintenance of gas pipelines; - Engineering consulting service for plant projects; - Any project relevant to the maintenance/repair of a plant facility, as well as
construction for remodeling (including gas facilities); - Construction supervision; and - Overseas projects, R&D, incidental projects, and investments in subsidiary companies.
KOGAS-Tech comprises the departments of Strategy and Planning, Personnel and Labor Relations, Maintenance Technology Businesses, Engineering Businesses, Plant Businesses, and Business Development. In the natural gas facility maintenance sector, its central tasks are (i) gas facility test-drive, operational, and preventive maintenance, as well as status diagnostics; (ii) gas facility life span extension and performance improvement construction; and (iii) facility improvements, inspections, and maintenance of storage tanks. KOGAS-Tech carries out optimal operations through four branches in Pyeongtaek, Incheon, Tongyeong and Samcheok, and Jeju through the rigorous prevention, inspection, and maintenance of LNG production facilities. KOGAS-Tech establishes efficient maintenance systems for LNG production facilities, carries out standard preventive maintenance regarding status to predict the time of malfunction, as well as to ensure proper maintenance before a malfunction for economic and efficient preservation, which maximizes a facility’s operation rate.

201
CHAPTER
03N
ational Policy Establishment for N
atural Gas Industrial Structure and Market Design in Albania
[Figure 3-31] Organization of KOGAS-Tech
Management SupportDivision
Maintenance BusinessDivision
Safety & QualityManagement Dept. Social Value Dept. Internal Audit Dept.
Technological Sales Dept.
Technological BusinessDivision
Strategy & Planning Dept. Maintenance TechnologyBusiness Dept. Engineering Business Dept.
Management Support Dept. 14 Branch offices Plant Business Dept.
Personnel & LaborRelations Dept. Business Development Dept.
CEO AuditorBoard ofDiectors
Source: KOGAS-Tech (2021).
In the supply facility maintenance sector, KOGAS-Tech runs a 24-h emergency-ready system for stable operation of the main piping of 4,931 km and 412 supply stations for the nationwide supply of natural gas, 10 piping branches, 12 offices, and 14 branch offices. The key tasks in this sector are (i) inspection and maintenance of machines, electricity, telecommunications, and relay, as well as carrying out measurements and calculations for facilities in terms of the national natural gas supply and supplemental facilities; (ii) inspection and maintenance of the central command room and local control rooms; (iii) disassembly, inspection, and maintenance of primary facilities; and (iv) recovery during emergencies.
As for inspecting the pipeline network, the principal tasks are (i) open year-round inspection involving two sessions per day; (ii) checking for problems around the pipes, gas leaks, and cover safety for buried pipes; (iii) checking and maintaining facilities attached to the piping and anti-corrosion facilities for buried piping; (iv) special inspections of the weather forecast and the change in seasons; and (v) preventing situations from escalating and ensuring immediate recovery during emergencies. When problems are detected, KOGAS-Tech takes immediate and efficient steps to guarantee safety and prevent accidents. To protect supply piping and enable safety during various forms of construction carried out around natural gas supply piping, the excavation staff members of KOGAS-Tech are responsible for providing technical guidance to reflect safety management policies from the early/developing stages of construction. For large scale construction, such as subways, KOGAS-Tech is dedicated to using special management to realize a stable natural gas supply.

Gas Sector Expansion Strategy for Energy Diversification in Albania
202
KOGAS-Tech operates several businesses: an LNG storage tank business, an LNG production base business, a natural gas main piping/supply station business, and other engineering businesses. KOGAS-Tech is the only company in the country that designs LNG storage tanks. KOGAS-Tech creates and oversees cargo, process, and utility facilities (which are the chief facilities in a production station), and establishes engineering capabilities for gas plant facilities to grow, which provides an overall solution for energy design. KOGAS-Tech supervises piping, supply stations, and facilities for high pressure natural gas to extend the natural gas supply and to enable the use of natural gas. The company invests in eco-friendly alternative and renewable energies by building production facilities for the next generation of alternative energy—including dimethyl ether (DME), natural gas hydrate (NGH), CNG, and LCNG—and designs hydrogen charging stations. Hence, KOGAS-Tech is a future-oriented energy company.
In the overseas maintenance sector, KOGAS-Tech has established a technology cooperation system with PLE of Germany and TGE of Japan to exchange gas technologies and to train engineers. KOGAS-Tech has two major activities in gas facility operation and maintenance: one is to distinguish storage, vaporization, delivery, and measurement facilities from unloading facilities of liquefied natural gas in LNG terminals. The other is to carry out maintenance services on utilities that include mechanical, electrical, communication, and distributed control system (DCS) facilities. KOGAS-Tech is currently implementing Commissioning and O&M successfully in Nigeria, Qatar, China, Thailand, Singapore, Iraq, Saudi Arabia, and Panama.
KOGAS-Tech has first-class hot tapping technology and experience in implementing various types of projects, and is extending diverse businesses in the domestic and foreign markets. KOGAS-Tech provides a stable natural gas supply with excellent facilities, as well as piping shifting construction as the demand for natural gas increases.
Lastly, in the R&D sector, KOGAS-Tech focuses on advanced asset management technologies of gas facilities, LNG plant technology, and new and renewable energy technology to create future growth engines and enhance the competitiveness of technology. KOGAS-Tech is leading LNG bunkering technology, developed for land/marine environments, to improve LNG bunkering EPC and O&M business. KOGAS-Tech develops domestic technology for biogas pretreatment and upgrading, and conducts research to enhance biogas plant EPC and O&M projects for future biogas plants. The company develops LNG facility management/maintenance technologies and advanced technologies for better reliability and stability to contribute to a stable natural gas supply.

Beckman, Karel. “Energy Transition or Energy Collapse?” Gas in Transition 1, no. 1 (April 19, 2021).
Beckmann, Karel. “Second Thoughts on Green Hydrogen.” Gas in Transition 1, no. 1 (April 19, 2021).
Beckman, Karel. “EU Fight over Role of Natural Gas Ends in Compromises.” Gas in Transition 2, no. 1 (January 2021).
Bollendorff, Esther. ”Europe has Enough Gas Infrastructure. Why Build more?” October 29, 2020. energypost.eu. accessed April 8, 2021, https://energypost.eu/europe-has-enough-gas-infrastructure-why-build-more.
Buckley, Tim. “Cheap Renewables Are Transforming the Global Electricity Business.” Febru-ary 14, 2018. energypost.eu. Accessed April 8, 2021. https://energypost.eu/how-cheap-re-newables-are-transforming-the-global-electricity-business.
Council on Energy & Environment Korea. The Korean Natural Gas Industry in Historical Per-spective. 1999.
DNV-GL. “Sustainable Energy and Digitalization: Practices and Perspectives in Asia-Pacific” Study on behalf of the Regional Project Energy Security and Climate Change Asia-Pacific (RECAP) of the Konrad Adenauer-Foundation (KAS), Hongkong February 2020.
DOE (Department of Energy) /EIA (U.S. Energy Information Administration). “Country Analy-sis Executive Summary - South Korea.” October 2020.
Ed Crooks, “Wind and Solar Expected to Supply Third of Global Power by 2040.” FT, 15.6.2017
Ellinas, Charles. “Europe’s Just Transition (2): The Politics of Change.” Natural Gas World 6, no. 5 (1 March 2021).
ERE (Energy Regulatory Authority of Albania). Annual report 2019. 2019.
EURACTIV.com. “Role of Natural Gas in Climate-Neutral Europe.” Position Paper of Bulgaria, Czechia, Greece, Hungary, Lithuania, Poland, Romania and Slovakia. May, 2020. https://www.euractiv.com/wp-content/uploads/sites/2/2020/05/Non-paper-Role-of-gas-in-climate-neutral-Europe-Final.pdf.
EURACTIV.com. “Poland, Others Step up Push for Gas in EU Green Finance Rules: Document.” Accessed March 30, 2021. https://www.euractiv.com/section/energy-environment/news/
References
203
CHAPTER
03N
ational Policy Establishment for N
atural Gas Industrial Structure and Market Design in Albania

Gas Sector Expansion Strategy for Energy Diversification in Albania
204
poland-others-step-up-push-for-gas-in-eu-green-finance-rules-document.
Eurasia Group. Energy, Climate & Resource Briefing. April 19, 2021.
Eurasia Group. “Batteries and Hydrogen will Undermine Fossil Fuel Demand and Forge new Supply Chains.” Gas, Power & Infrastructure Monthly (August 31, 2020).
Eurasia Group. Singapore at the Heart of Asia’s Green Energy Revolution. April 30, 2021.
European Commission. “Quarterly Report on European Gas Markets.” DG Energy 13, no. 4 (Fourth Quarterly 2020). Brussels 2021.
European Commission. “A Hydrogen Strategy for a Climate-Neutral Europe.” Communication from the Commission to the European Parliament, the Council, The European Economic and Social Committee and the Committee of the Regions, Brussels, 8 July 2020, COM(2020) 301 final.
European Commission. “The European Green Deal.” Brussels, December 11, 2019, COM(2019) 640 final.
European Commission. “Next Generation EU: Commission presents next steps for €672.5 bil-lion Recovery and Resilience Facility in 2021 Annual Sustainable Growth Strategy.” Sep-tember 17, 2020.
Fair Trade Commission. Natural Gas Market Analysis Report of Korea. 2014.
Ford, Jonathan. “The Hidden Costs of Renewable Power.”, FT, August 21, 2018. Accessed April 13, 2021. https://www.ft.com/content/6c9a53f4-8597-11e7-8bb1-5ba57d47eff7.
Friends of the Earth Europe. “Pipe-Dream Debunking the Myths of Croatia’s KRK Gas Ter-minal.” December 2018. Accessed April 8, 2021. https://friendsoftheearth.eu/wp-content/uploads/2018/12/pipedream-debunking-myths-croatias-krk-gas-terminal.pdf.
Gerdes, Justin. “Reducing battery cost is essential for a clean energy future.” ENERGY MON-ITOR, October 5, 2020. Accessed April 8, 2021. https://energymonitor.ai/tech/energy-stor-age/reducing-battery-cost-is-essential-for-a-clean-energy-future.
Government of the Republic of Korea. The Basic Plan for LNG Business of Korea. 1986.
IEA. “European Union 2020.” Energy Policy Review (Paris 2020).
IEA. Korea 2020 Energy Policy Review. November 2020.
IEA. World Energy Outlook (WEO). 2017, 2020.
IEA. Global Energy & CO2 Status Report 2017. Paris: IEA/OECD, March 20, 2018.

205
CHAPTER
03N
ational Policy Establishment for N
atural Gas Industrial Structure and Market Design in Albania
IEA. IEA World Energy Statistics and Balances (Database). www.iea.org/statistics.
IEA. Energy Balances of OECD Countries 2019. 2019.
Inman, Masin, Greig Aitken, and Scott Zimmerman. Europe Gas Tracker Report. April 2021.
IRENA/IEA. Renewable Energy Policies in a Time of Transition. Paris: IEA/OECD, April 2018.
IRENA. “Renewable Capacity Highlights.” March 31, 2020.
IRENA. “Hydrogen: A Renewable Energy Perspective.” September 2019.
Janet Wood, “Gas in the EU Energy Transition.”, Natural Gas World, Vol. 6, Issue 1, 4 January, 2021.
Keating, Dave. “Gas Wins Recognition as 'Transitional Technology' to Climate Neutrality.”, EURACTIV.com, December 14, 2020. Accessed April 8, 2021, https://www.euractiv.com/sec-tion/energy/news/gas-wins-recognition-as-transitional-technology-to-climate-neutrality.
KEEI. KEEI 30 Years History. 2016.
KEEI. Korea Energy Sector and Green Economy Review. 2014.
KEEI. History of Energy Policy. 2006.
KEEI. Korea Energy Demand Outlook. First Half. 2021.
KEEI. Yearbook of Energy Statistics. 2020.
KIGAM. Annual Report 2019. April 2020.
KOGAS. Korea Gas Corporation 30 Years History. 2014.
Ministry of Infrastructure and Energy of Albania. “National Energy Strategy 2018-2030.” 2018.
MOER. “LNG introduction negotiation policy.” 1982.
MOTIE (Ministry of Trade, Industry and Energy of Korea). “The 13th Long-term Natural Gas Supply and Demand Plan.” 2018.
MOTIE. “Leap into the World’s Leading Hydrogen Economy.” 2019.
MOTIE. “The 3rd Energy Master Plan.” 2020.
MOTIE. “The 9th Basic Plan of the Electricity Supply and Demand.” 2020.
Morison, Rachel. “Gas Is the New Coal with Risk of 100 Billion in Stranded Assets.” Bloomberg.com. April 17, 2021. Accessed May 8, 2021. https://www.bloomberg.com/news/

Gas Sector Expansion Strategy for Energy Diversification in Albania
206
articles/2021-04-17/gas-is-the-new-coal-with-risk-of-100-billion-in-stranded-assets.
Schulz, Florence. “EU’s List of Energy Projects Includes 32 Gas Facilities.”, EURACTIV.com, 6 November, 2019. Accessed April 13, 2021. https://www.euractiv.com/section/climate-envi-ronment/news/eus-new-list-of-energy-projects-includes-32-gas-facilities.
Simon, Frederic. “Macron, Orban Urge EU to ‘actively Support’ Nuclear Power.”, EURACTIV.com, 25 March, 2021. Accessed April 13, 2021. https://www.euractiv.com/section/ener-gy-environment/news/macron-orban-urge-eu-to-actively-support-nuclear-power.
Simon, Frederic. “Gas Grid Operators Outline Plans for Expanded EU Hydrogen Highway.”, EURACTIV.com, 14 April, 2021. Accessed May 8, 2021. https://www.euractiv.com/section/energy/news/gas-grid-operators-outline-plans-for-expanded-eu-hydrogen-highway.
Taylor, Kira. “EU Failed to Properly Assess Climate Risk of Gas Projects Watchdog Says.” Reu-ters, November 20, 2019. Accessed April 8, 2021. https://www.reuters.com/article/climate-change-eu-gas/eu-failed-to-properly-assess-climate-risk-of-gas-projects-watchdog-says-idINL4N2I538Z.
Taylor, Kira. “’Gas is Over’, EU Bank Chief Says.” EURACTIV.com. January 21, 2021. Accessed April 8, 2021. https://www.euractiv.com/section/energy-environment/news/gas-is-over-eu-bank-chief-says.
The Federal Government of Germany. “The National Hydrogen Strategy.” Berlin. June 2020.
Umbach, Frank. “Energy Security in a Digitalized World and its Geostrategic Implications.” In KAS (Konrad Adenauer Foundation)/RECAP (Regional Project: Energy Security and Cli-mate Change Asia-Pacific). Hongkong, September 2018.
Umbach, Frank. “Der European Green Deal. Strategische Perspektiven und Auswirkungen der Corona-Pandemie (The European Green Deal. Strategic Perspectives and the Impacts of the Corona-Pandemic).” Politische Studien, no. 494 (November-December 2020).
Umbach, Frank. “The European Green Deal Faces Huge Challenges.” GIS (Geopolitical Intelli-gence Services), February 10, 2020.
Umbach, Frank. “New Opportunities 2021: Energy Megatrends and the Challenges of Decar-bonization.” GIS, March 5, 2021.
Umbach, Frank. “Hydrogen: Decarbonization’s Silver Bullet?” GIS, July 2, 2020.
Umbach, Frank. “Europe’s Battery Strategy.” GIS, September 16, 2020.
Umbach, Frank and Joachim Pfeiffer. “Germany and the EU’s Hydrogen Strategies in Per-spective – The Need for Sober Analyses.” Periscope-Occasional Analysis Brief Series, no. 1,

207
CHAPTER
03N
ational Policy Establishment for N
atural Gas Industrial Structure and Market Design in Albania
Konrad Adenauer-Foundation-Australia. Canberra, August 2020.
Umbach, Frank and Joachim Pfeiffer. “Künftiger Energieträger Wasserstoff. Geraten wir in neue Abhängigkeiten? (Future Energy Carrier: Do We Will Fall back in new Dependen-cies?).” Europäische Sicherheit&Technik (ES&T). March 2021.
Walton, Robert. “World on Track for 50% Renewables by 2050, Says Bloomberg Energy Out-look.” Utilitydrive.com. June 19, 2018. Accessed April 8, 2021. https://www.utilitydive.com/news/world-on-track-for-50-renewables-by-2050-says-bloomberg-energy-outlook/526052.
Wamsted, Dennis, Seth Feaster and David Schlissel, “Outlook USA: even with Battery Costs, Wind and Solar can Undercut Coal and Gas by 2023-24.”, energypost.eu, April 13, 2021. Accessed May 7, 2021. https://energypost.eu/outlook-usa-even-with-battery-costs-wind-and-solar-can-undercut-coal-and-gas-by-2023-24.
Wood, Janet. “Gas in the EU Energy Transition.” Natural Gas World 6, no. 1 (January 4, 2021).
Websites
Eurasia Group Homepage (https://www.eurasiagroup.net).
EUROSTAT Homepage (https://ec.europa.eu/eurostat).
GIS (Geopolitical Intelligence Services) Homepage (https:// www.GISreportsonline.com).
IRENA Data & Statistics (https://www.irena.org/statistics).
KEEI Homepage (http://www.keei.re.kr/main.nsf/index_en.html).
KESIS (Korea Energy Statistical Information System) Homepage (http://www.kesis.net/main/mainEng.jsp.
KETEP Homepage (https://www.ketep.re.kr/eng/).
KGS Homepage (http://www.kgs.or.kr/kgsmain_eng/index.do).
KIER Homepage (https://www.kier.re.kr/eng).
KOGAS Homepage (https://www.kogas.or.kr:9450/eng).
KOGAS-Tech Homepage (https://www.kogas-tech.co.kr/eng/index.do).
Korean Law Information Center Homepage (https://www.law.go.kr/LSW/eng/engMain.do?eventGubun=060124).

Albania’s Natural Gas Infrastructure Build-out and Technical CooperationYounkyoo Kim (Hanyang University)Young Doo Kim (Jeonbuk National University)Wonbae Kim (Hanyang University)Artan Leskoviku (National Agency of Natural Resources)
1. Introduction2. Albania’s National Natural Gas Infrastructure Build-out3. Albania’s Natural Gas Infrastructure Interconnection with Neighboring Countries4. Comparative Assessment of LNG Introduction Methods 5. Recommendations for Albania 6. Sharing Korea’s Knowledge & Experience in Natural Gas & LNG Infrastructure 7. Technical Cooperation between South Korea and Albania 8. Recommendations for the Development of Albgaz Sh.a. with Benchmarks on KOGAS
C H A P T E R
04
KeywordsLNG, FSRU, SSLNG, Gas Pipeline Safety, KOGAS

209
CHAPTER
04Albania’s N
atural Gas Infrastructure Build-out and Technical Cooperation
Summary
Currently, the construction of gas pipelines in Albania is mainly developed around large gas consumers, and considering the geographical characteristics of Albania, it is expected that it will take a lot of investment and time to build a nationwide pipeline network.
In Chapter 1 on the Long-Term Energy Demand Outlook for 2040, gas consumption in Albania is expected to increase from various fields other than the power generation sector, such as industry, transportation, and bunkering. As such, LNG imports should be considered in order to meet the newly increasing gas consumption for Albania in the future.
The main argument of this chapter is that it is necessary to understand the current status and problems of the gas pipeline-centered construction of gas pipelines in Albania, and to promote gas pipeline supply in parallel with LNG. To this end, this chapter first reviews and identifies the status of gas supply chain construction specified in the Gas Master Plan. In addition to the introduction of gas pipelines, the current status of domestic oil and gas field development in Albania and possible future gas and oil production and domestic use will be reviewed.
The most important purpose of this chapter is to understand the recent changes and trends in the global LNG market, and to analyze why the traditional large LNG supply is changing to FSRU or SSLNG. For this purpose, technical and economic comparative analysis of traditional LNG, FSRU, and SSLNG is conducted. This chapter shows that FSRU or SSLNG supply is realistic for Albania's increasing gas supply in the future through technical and economic analysis of FSRU and SSLNG.
In Albania, it will likely take a long time for TAP to install the national main pipeline.
Albania’s Natural Gas Infrastructure Build-out and Technical CooperationYounkyoo Kim (Hanyang University)Young Doo Kim (Jeonbuk National University)Wonbae Kim (Hanyang University)Artan Leskoviku (National Agency of Natural Resources)

Gas Sector Expansion Strategy for Energy Diversification in Albania
210
Further, natural gas interconnection transmission facilities will probably be connected with neighboring countries. In addition, industrial, vehicle fuel conversion, and bunkering demand in areas not connected to main pipelines are continuously required, so it is necessary to review policies.
In Albania, the use of SSLNG has become a solution to feed isolated areas not connected to the gas grid where the residential, industrial, and commercial sectors are present. LNG could be supplied from a future LNG terminal or via a small liquefaction facility connected to the grid or from a small- scale barge. Given the current scarcity of gas pipeline infrastructure, the country has the following alternatives. Small liquefaction facilities could be arranged in the gas pipeline layout. The small quantity facilities, between 0.05 and 0.1 mtpa, could feed the industrial regions, creating virtual gas pipelines with a fleet of tank trucks to transport the fuel from the liquefaction facilities to the end-users’ market where there are some satellite plants.
1. Introduction
It takes a lot of investment and time to build a gas supply system, including a main pipeline to use natural gas. Because Albania has geographically dispersed community living areas (versus being a densely populated country with large cities), LNG is transported via tank lorries to power plants, factories, and densely populated zones that require LNG before a gas supply system using pipes is established.
After centuries of gas experiments, the idea of LNG appeared as a solution to bring consumers large volumes of gas in an economical way. The volume of natural gas can be reduced approximately 600 times by using LNG. LNG provides:
- Long distance gas transport where pipelines are too expensive or not feasible; - Gas importation flexibility; and - Supply security from different suppliers.
Traditionally, the LNG chain was composed of three elements: liquefaction plants, transport by ship, and receiving terminals. However, due to increasing gas distribution flexibility and reaching new consumers through small scale facilities, LNG distribution by truck, and LNG refueling stations, attention is now being paid to diversifying LNG.
The following SSLNG solutions have been implemented:

211
CHAPTER
04Albania’s N
atural Gas Infrastructure Build-out and Technical Cooperation
• Restrictions on infrastructure: - US: To solve pipeline network restrictions or deficient storage capacity, peak
shaving was used. - China: The required infrastructure development (gas transportation and
transmission) could not be matched with domestic gas demand, which witnessed a boom. A transitional solution, the LNG virtual chain, was provided to solve the gap.
- Demand did not reach the minimum volume required to invest in traditional gas infrastructure transportation.
• Emissions reduction policies (implemented in China and expected in the US in the future).
• More competitive natural gas prices in the transportation sector against petroleum derivatives.
2. Albania’s National Natural Gas Infrastructure Build-out
The gasification and infrastructure build-out of Albania started from the TAP pipeline as the primary infrastructure for gasification. The project is currently in its implementation phase; construction of the pipeline began in 2016.
TAP’s shareholders consist of BP (20%), SOCAR (20%), Snam S.p.A. (20%), which acquired a stake in the project from Statoil, Fluxys (19%), Enagás (16%), and Axpo (5%). The pipeline runs through the western section of the Southern Gas Corridor, a complex value chain of energy projects that links natural gas supplies from the second development stage of the Shah Deniz field in Azerbaijan to Europe.
TAP chose the pipeline’s route with great care to ensure the best commercial and technical possibilities and cause minimum environmental and social impact. Approximately 870 km in length, TAP’s highest elevation will be 1,800 m in the mountains of Albania, while its lowest depth offshore will be 820 m beneath the Adriatic Sea.
In anticipating future needs, TAP’s developers integrated flexibility into the pipeline’s design to accommodate future gas volumes. TAP’s initial capacity of 10 bcm of gas per year equals the energy consumption of approximately seven million households in Europe. In the future, the addition of two extra compressor stations could double throughput to more than 20 bcm as additional energy supplies come on stream in the wider Caspian region.

Gas Sector Expansion Strategy for Energy Diversification in Albania
212
The pipeline will also have the possibility of “physical reverse flow,” allowing gas from Italy to be diverted to SEE if energy supplies are disrupted, or if more pipeline capacity is required to bring additional gas to the region.1
TAP’s route through Albania is approximately 211 km onshore and 37 km offshore in the Adriatic Sea. It starts at Bilisht Qendër in Korçë, a region on the Adriatic coast 17 km northwest of Fier, 400 m inland from the shoreline, and on the Albanian border with Greece.
An additional compressor is planned near Bilisht should capacity be extended to 20 bcm, and a compressor station will be built near Fier. Nine block valve stations will be built along its route.
[Figure 4-1] TAP Route and Strategic Partnership Projects
Source: Gas Master Plan (2016).
ТАP project advantages:
- TAP allows for the development of activities of EGL in Italy and SEE via supply from the Caspian Region, Russia, and the Near East;
- TAP increases the security of the gas supply to Italy; - TAP deepens the diversification and security of the gas supply to Europe; - Virtual reverse flow is possible; and - The new gas infrastructure should provide an economic stimulus, growth potential,
1 The Western Balkans Investment Framework (WBIF) Infrastructure Projects’ Facility Technical Assistance 4 (IPF 4) Infrastructures: Energy, Environment, Transport, and Social WB11-ALB-ENE-0, p. 48.

213
CHAPTER
04Albania’s N
atural Gas Infrastructure Build-out and Technical Cooperation
stability, and unity in SEE, and should satisfy the need for energy in the region.
The project has the potential for the enlargement of new and additional projects:
- An LNG terminal; - The production of electricity from gas in Vlora (300 МW); - A return stream from Italy/SEE (a supply of LNG from North Africa); - TAP opens a new (forth) corridor for supply to Europe; - TAP allows for the development of the gas market and should satisfy future requests
for energy in SEE; - TAP is independent, non-discriminatory, and open for third parties and private
investments; - Yearly output growth of 10–20 m3/year; - Built-in concept of flexibility by constructing storage in Albania; and - Strong political support from the EU, and a priority project for trans-European
networks.
Based on the above, a realistic potential area for developing the gas transmission and distribution pipeline system includes 85 LGUs, and is presented in the map below:
[Figure 4-2] Municipalities and LGUs Viable for Further Screening for Gasification
Source: Gas Master Plan (2016).

Gas Sector Expansion Strategy for Energy Diversification in Albania
214
This is why development of the Albanian national gas transmission system is inextricably linked via international pipelines to Kosovo, North Macedonia, Montenegro, and some parts of Croatia. After the development of the gas transmission network in Fier, Vlora, Ballsh, Elbasan, and Tirana, it is assumed that the gas pipeline toward Kosovo and North Macedonia will be constructed.
Croatia’s existing and planned gas transmission system with TAP was to be interconnected with the Ionian-Adriatic Pipeline (IAP). The governments of Albania, Bosnia and Herzegovina, Croatia, and Montenegro agreed to support the proposed IAP.
A portion of the planned IAP runs through the territory, where it was once considered the backbone of the Albanian gas transmission system. Higher consumption LGUs are located in the coastal, western part of Albania. It is assumed that the gas pipeline toward Montenegro and Croatia will be built in the short term along with Albania’s national transmission system. However, no firm decisions have been made yet concerning its development. There is little indication as to who will provide the funds or when a final investment decision (FID) might be expected. Delay in the IAP’s development is impacting the entire extension of the Albanian transmission network.
Regarding the transmission and distribution systems inside Albania, the supply of gas to two primary gas consumption centers is of utmost importance. There are two primary consumption centers, the area of Fier, Vlora and Ballsh and the area of Tirana and Durres, with adequate gas consumptions in Albania.
The Gas Master Plan estimates gas consumption for the year 2030 to be 1.5 –1.8 bcm/year, with the main consumers being:
- First priority: the power generation sector and industrial consumers; - Second priority: service sectors, which will use natural gas for heating; and - Third priority: the residential sector, which will use natural gas for heating, cooking,
and hot water.

215
CHAPTER
04Albania’s N
atural Gas Infrastructure Build-out and Technical Cooperation
<Table 4-1> Design Gas Quantities for Supply of Consumers on an Annual Basis in 2040
Albania Anchor
Consumers (mcm/year)
Residential Sector
(mcm/year)
Service Sector
(mcm/year)
Industrial Sector(mcm/year)
Total Consumption (mcm/year)
Total Capacity
(m3/h)
CTMS/PRMS - 2.6 1.5 5.2 9.3 3,439
PRMS BALLSH 72.0 2.1 1.5 3.8 79.4 21,908
PRMS BERAT 125.0 15.6 12.6 12.2 165.4 58,438
PRMS DUMRE - 1.7 1.7 7.8 11.2 4,732
PRMS DURRES - 62.1 26.4 119.4 207.9 74,325
PRMS ELBASAN1 28.0 11.4 9.6 40.9 89.9 26,048
PRMS ELBASAN2 - 12.0 8.9 34.9 55.8 18,716
PRMS FIER 147.0 27.0 16.3 37.6 227.9 65,949
PRMS FUSHË-KRUJË - 15.6 6.6 29.8 52.0 18,593
PRMS GJIROKASTËR - 3.7 4.5 12.7 21.0 7,764
PRMS KAVAJË - 12.3 7.0 3.1 22.4 12,233
PRMS KORÇË 125.0 23.3 14.9 14.2 177.4 64,043
PRMS KUKES - 3.2 2.3 4.9 10.3 4,163
PRMS LEZHË - 10.3 3.9 4.2 18.4 8,447
PRMS LUSHNJE - 9.1 6.2 15.3 30.6 12,010
PRMS MAMURRAS - 12.4 6.1 11.0 29.6 12,526
PRMS POGRADEC - 10.0 5.9 5.3 21.2 9,931
PRMS SARANDË - 5.2 4.4 2.5 12.1 6,007
PRMS SHKODËR - 27.0 16.9 32.6 76.5 31,689
PRMS TEPELENE - 0.9 0.9 2.8 4.6 1,695
PRMS TIRANA 1 - 154.8 97.6 44.3 296.7 149,528
PRMS TIRANA 2 - 119.2 71.4 32.3 222.9 112,160
PRMS VLORA 187.0 20.2 20.2 11.6 239.0 82,769
TOTAL 684.0 561.7 347.4 488.6 2,081.6 807,113
Neighboring Countries
KOSOVO (Scenario 1, 3) 1,000.0 - 1,000.0 120,000
FYR of MACEDONIA (Scenario 1,3) 756.0 - 756.0 86,000
MNE, BiH, CRO (Scenario 1, 2) 4,000.0 - 4,000.0 480.000
Scenarios
Scenario 1 - - - - 7,837.6 1,493,113
Scenario 2 - - - - 6,081.6 1,287,113

Gas Sector Expansion Strategy for Energy Diversification in Albania
216
Albania Anchor
Consumers (mcm/year)
Residential Sector
(mcm/year)
Service Sector
(mcm/year)
Industrial Sector(mcm/year)
Total Consumption (mcm/year)
Total Capacity
(m3/h)
Scenario 3 - - - - 3,837.6 1,013,113
Scenario 4 - - - - 2,081.6 807,113
Source: Gas Master Plan (2016).
The short-term (2021–2025) goals to develop the transmission and distribution systems are:
1. Extend the transmission pipeline from TAP to TPP at Vlora, if it is feasible to develop a gas distribution system in Vlora.
2. Extend the transmission system to supply anchor consumers in Fier and Ballsh, if it is feasible to develop gas distribution systems in those two places.2
The table below shows the potential natural gas consumption by prefecture and by region/zone in Albania by 2040.
<Table 4-2> Total Potential Natural Gas Consumption in Albania by 2040(Unit: m3)
Zone County 2013 2020 2025 2030 2035 2040
1
Durres 127,210,344 166,847,180 201,441,483 242,050,662 288,244,654 339,936,818
Fier 103,461,562 122,363,344 140,042,831 160,674,937 183,018,210 206,758,196
Tirana 275,096,286 362,979,026 438,214,527 523,003,507 615,635,099 712,976,104
Vlora 53,978,207 66,805,060 77,418,254 89,466,735 102,462,221 115,787,331
Total 559,746,399 718,994,610 857,117,094 1,015,195,842 1,189,360,184 1,375,458,450
2
Berat 36,047,216 41,031,501 46,374,644 52,506,962 58,830,278 65,302,144
Elbasan 101,268,707 125,031,126 148,512,351 176,099,693 207,114,072 241,532,455
Gjirokastar 26,863,404 31,964,841 36,922,886 42,812,354 49,312,092 56,526,621
Lezhe 37,863,568 43,469,656 50,061,834 57,512,605 65,150,059 73,024,314
Shkoder 67,886,046 81,242,359 93,653,654 107,675,561 122,351,507 137,404,213
Total 269,928,941 322,739,483 375,525,369 436,607,176 502,758,007 573,789,746
2 Ibid., pp. 136-137.
<Table 4-1> Continued

217
CHAPTER
04Albania’s N
atural Gas Infrastructure Build-out and Technical Cooperation
Zone County 2013 2020 2025 2030 2035 2040
3
Diber 25,449,287 30,348,419 34,759,819 39,651,838 44,632,616 49,675,313
Korca 62,892,482 78,566,509 91,796,074 106,293,248 121,612,807 136,811,309
Kukes 16,559,119 18,910,951 21,712,966 24,762,073 27,848,571 30,944,617
Total 104,900,888 127,825,879 148,268,860 170,707,159 194,093,994 217,431,239
Anchorconsumers Total - 243,902,007 409,760,331 570,779,614 568,244,045 684,355,372
Albania Total 934,576,228 1,413,461,978 1,790,671,654 2,193,289,790 2,454,456,230 2,851,034,807
Source: Gas Master Plan (2016).
The total potential natural gas consumption in Albania by sector is shown, as follows:
[Figure 4-3] Total Potential Natural Gas Consumption in Albania by Consumption Sector(Unit: mcm)
0
500
1,000
1,500
2,000
2,500
3,000
2020 2025 2030 2035 2040
661737
2922
30320410
818
3615
38400
571
893
4382047
489
568
2340
22253244
661
234
2222
253
244
1,413
1,791
2,1932,454
2,851
Households Services Transport Agriculture Industry Anchor consumers Total
Source: Gas Master Plan (2016).
Regarding power generation, 3 CCGT of 200 MW each are expected to be put into operation until 2040. The timing and locations of those have been assumed as follows: CCGT-1 (Vlora) in 2025, CCGT-2 (Korce) in 2030, and CCGT-3 Kucove in 2040. This will result in 700 MW of natural gas fire capacity in 2040. The assumption is that the lifetime of existing TPP Vlora would be extended, or that it would be replaced with an equivalent unit.3
3 Western Balkans Investment Framework (WBIF) Infrastructure Projects Facility Technical Assistance 4 (IPF 4) Infrastructures: Energy, Environment, Transport, and Social WB11-ALB-ENE-0, p. 34.
<Table 4-2> Continued

Gas Sector Expansion Strategy for Energy Diversification in Albania
218
[Figure 4-4] Locations of Anchor Consumers
Source: Gas Master Plan (2016).
<Table 4-3> List of Potential Anchor Loads with Indicated Natural Gas Consumption(Unit: mcm)
Consumer 2020 2025 2030 2035 2040
Vlora TPP 69 50 62 63 62
CCGT 1 (Vlore) - 99 124 126 125
CCGT 2 (Korce) - - 124 126 125
CCGT 3 (Kucove) - - - - 125
Ballsh refinery 66 83 83 78 72
Fier refinery 16 20 20 18 17
Bankers Petroleum 75 130 130 130 130
Kurum 18 28 28 28 28
Total 244 410 571 568 684
Source: Gas Master Plan (2016).
In such a development, natural gas would contribute 15% to the overall electricity supply mix in 2040. Natural gas power generation is complementary for systems with a high percentage of hydro and other types of renewable energy. CCGT have relatively low fixed costs and are hence feasible, even as non-baseload plants, producing power to balance intermittent output from renewable energies or hydro power plants, providing peak-load electricity, as well as secondary services to electrical system via balancing.

219
CHAPTER
04Albania’s N
atural Gas Infrastructure Build-out and Technical Cooperation
The Western Balkan Investment Facility, funded by the European Commission, has provided €17,483,504 for the TAP Exit Point via the Vlora TPP gas pipeline project. The project entails building an approximately 40 km natural gas pipeline, which will connect the Vlora TPP with the TAP. Additionally, the Vlora TPP will be converted to use natural gas as fuel for electricity in lieu of oil. The Albanian electricity distribution system would benefit significantly from the addition of a generation capacity that would be available on-demand in order to supplement hydro production in periods of poor hydrological conditions.
The Fier region is also expected to see development from the TAP project. Its vicinity with the TAP pipeline, the concentration of traditional gas consumption industries, and the practical and household culture of using gas for historical reasons make it possible to expand the city’s industrial and residential markets. The Korça region is expected to be part of natural gas market growth, considering the passage of the TAP pipeline in this area, as well as building additional energy resources, such as the Korça TPP.
The current limited gas production is mostly chanelled toward oil and refining operations to fulfill the technological needs of two oil companies, ARMO and Albpetrol. The LPG annual consumption, in terms of households and services, is nearly 100,000 tons/year. Natural gas in refineries is used to produce hydrogen and as an energy source.
<Table 4-4> Forecasted Natural Gas Consumption in Refineries in Albania(Unit: m3)
2020 2025 2030 2035 2040
82,000,000 103,000,000 103,000,000 96,000,000 89,000,000
Source: Gas Master Plan (2016).
In the 1970s and 1980s, Albania had a significant fertilizer industry, but due to lack of spare parts and raw materials, especially natural gas, production halted in mid 1991; 900 mcm of natural gas is forecasted for the fertilizer plant near Fier.
The medium-term (2026–2030) goals for developing the transmission and distribution systems are:
- To extend the transmission system, mainly supplying industrial areas in Elbasan, as well as to build gas storage facilities in Dumrea (if feasible).
- To extend the transmission system, mostly supplying industrial/commercial consumers in the areas of Durres and Tirana.

Gas Sector Expansion Strategy for Energy Diversification in Albania
220
The cement industry, with its significant heat demand in the cement production process, was evaluated. Currently, cement plants in Albania use a mix of solid fuels (petcoke, coal, and bitumen). The costs of these fuels (measured in equivalent energy) are roughly 40% lower than natural gas. Therefore, even though it would be technically possible, switching cement plants to natural gas does not seem commercially justified. In the future, if emissions from cement plants with the current fuel mix in Albania become an issue, it is likely that these will be switched to refuse-derived fuel (RDF), which is a common practice in EU countries and around the world.
A gradual increase in the share of CNG domestic cars, CNG foreign cars, CNG domestic buses, and CNG foreign buses is expected (1.5% of CNG domestic cars and 0.5% of CNG foreign cars in terms of total car split; 2% of CNG domestic buses and 0.01% of CNG foreign buses in terms of modal public split).
The total consumption of 48.2 mcm of natural gas in 2040 is expected in the transportation sector (20.9 mcm in freight transport, 19.4 mcm in urban transport, and 7.9 mcm in intercity transport).4
Another industry with significant heat consumption in Albania is the metals industry, with several smelters and metallurgic plants. However, these plants use electric arc technology for the smelting process. Hence, according to available information, the metals industry in Albania does not seem to be a prospective significant natural gas consumer.
The long-term goals for developing the transmission and distribution systems are:
- To extend the transmission system for the interconnector to Kosovo. - To extend the transmission system near Korça to supply the planned CCGT in Korça,
and further to Pogradec. - To extend the transmission system to Shkodra. - To extend the transmission system from Ballsh to Tepelena and Gjirokastra. - To extend the transmission system from Pogradec to Prrenjas and further to FYROM. - To extend the transmission system for the planned CCGT in Kuçova.
4 Ibid., p. 27.

221
CHAPTER
04Albania’s N
atural Gas Infrastructure Build-out and Technical Cooperation
2.1. Domestic Resources
Albania’s existing gas pipeline network is 498 km long and connects all existing operating gas fields, which are now nearly depleted. In the past, Albania had a significant gas sector, but there is virtually no gas now. Domestic gas production has declined from 1 bcm in 1982 to 0.01 bcm in recent years; almost entirely new or rebuilt gas transmission and distribution systems are required.5 In any case, the existing gas networks are in poor technical condition, since most of them are unused and only a few are employed for gas transport, but the pressure is low.
Due to its geographic location and past political isolation, Albania today, along with Montenegro and Kosovo, is the only state in Europe that is not linked to an interstate gas transmission system. Albania has a completely isolated national gas distribution system, which was founded between 1967 and 1985 to deliver gas from its own sources (gas and oil fields) to consumers; it is largely located in the southern part of the country.
In the southern part of the state, supplying the oil refinery industry with limited volumes of domestically produced gas from the fields of Divjaka and Frakull, the very small remaining gas activity comes from the oil fields near Ballsh. The two oil refineries at Ballsh and Fier, with a combined capacity 1 Mt/y, are presently running at 40%–50% capacity.
The use of gas was once focused on the area of Fier, representing about 70% of the gas market in the country in recent years, due to the location of the gas and oil fields and the availability of pipeline infrastructure.
From Durres to Delvina, there is already some pipeline infrastructure in place. The 498 km pipeline network connects all previously operational gas fields (Povelca, Divjaka, Frakulla, Panaja, and Delvina) with consumers located in Fier, Vlora, Elbasan, Lushnja, Ballsh, and Durres.
Other industries, such as the Fier fertilizer plant, which used to be a major natural gas consumer in the 1970s, have either shut down or reduced their production volume.6
The total length of these local gas transmission and distribution systems comprises about 400 km, sized from 4” to 12.” The system design pressure was originally 40 barg, but due to poor mainte nance, parts of the system have been cut off. For the remaining parts, an operating pressure of 16–25 barg may be considered.
5 European Western Balkans Joint Fund, Western Balkans Investment Framework Infrastructure Project Facility Technical Assistance 4 (IPF 4), WB11-ALB-ENE-01, Gas Master Plan For Albania & Project Identification Plan, 2016, p. 15 Gas Master Plan for Albania, p. 40.
6 Ibid., p. 40.

Gas Sector Expansion Strategy for Energy Diversification in Albania
222
Albania’s oil sector is small based on international capacity, but it is important for the Albanian economy; there are still large undiscovered petroleum reserves. Albania is one of the transit countries for the TAP project, which will transport Azerbaijani gas through Albania to Italy.
Albania has a large untapped reserve of oil and natural gas. The local oil sector has grown in recent years through private exploration and exploitation initiatives. Currently, modest natural gas reserves remain untapped.
The oil sector was strategically critical and the main contributor to the country’s economic growth before the 1990s. The exploration of oil in Albania began in 1918. The production of crude oil there began in 1929, with 750 tons of crude oil. After World War II, production increased steadily and peaked in 1974, with an annual output of 2.25 million tons (equivalent to 38,408 bbl/day). In the 1980s, oil production fell below 1 million tons a year, which continued until 2012.
According to studies conducted by foreign companies and Albpetrol S.A. between 1985 and 1990, geological oil reserves in existing wells amounted to about 437.6 million tons. However, due to the extraction methods used at the time, the recoverable (extractable) reserves are estimated to have been only 81 million tons. Geological reserves from the estimated sand structures constituted 77.4% of the total geological reserves; however, their recovery is estimated at 13%. Recovery of geological reserves from limestone formations ranged from 24%–53%. The oil extracted from the Marinza and Bubullima reserves exceeded what the above studies assessed as “recoverable oil.”
The associated gas reserves are estimated at 14,132.1 million Nm3, of which 10,186.1 million Nm3 have been recovered. Domestically produced gas is primarily associated gas, most of which is not used commercially; the infrastructure needed to exploit the reserve is not present on site, so the majority of the gas produced is released.
Oil generated by private licensees operating in the oil sector represented 90% of all oil produced in the reporting years. This production was chiefly extracted from the Patos-Marinza field, operated by Bankers Petroleum, which generated 87% of all oil production in 2017 (ALL 23,370 million, about US $222,571,000) and 2018 (ALL 29,857 million, about US $284,352,000). These figures are based on the average export price; 29,434 ALL/ton (about 280 USD/ton) in 2017 and 35,687 ALL/ton in 2018 (about US $340/ton).
Albpetrol reported a production of 93.1 thousand tons of crude oil in 2017, and 89.5 thousand tons in 2018, reaching 10% of overall production for the two reporting years.

223
CHAPTER
04Albania’s N
atural Gas Infrastructure Build-out and Technical Cooperation
[Figure 4-5] Production by Oil Field(Unit: 1,000 tons)
0
1500
2000
3000Patos-Marinza Others
2011 2013 20152012 2014 2016 2017 2018
761761 8791,061
1,212 1,132931
844
150
143
174148
103111134134
800800
111111
Source: EITI (2020).
Albpetrol reported an associated gas production of 3 million Nm3 in 2017 and 2018. The associated gas production did not lead to commercial material benefits for Albpetrol or private oil companies. Albpetrol reported a profit of ALL 10.5 million and ALL 7.6 million in 2017 and 2018, respectively, in revenue from gas sales, which accounted for less than 1% of their total revenue (0.11% in 2017 and 0.17% in 2018).
Local oil production for 2019 amounted to 1,005,088 tons, with an increase of 94,418 tons (9.4%) compared to 2018 due to bigger sales markets. In 2019, crude oil from petroleum agreements was 929,674 tons; domestic sales added up to 335,273 tons, and exports to 631,216 tons. For 2019, Albpetrol had a crude oil production of 75,413.9 tons; of these, 26,823.0 tons were generated from sand fields, and 48,591.8 tons from limestone fields. For 2018, crude oil sales from Albpetrol in the domestic market amounted to 79,644.0 tons.
Local oil refineries have historically focused on producing bitumen, petroleum coke, and 10 ppm gas oil, as well as virgin nafta (semiproduct), which needs to be further refined in order to be consumed. ARMO Sh.a. (“ARMO”) was once the only refining company operating in Albania.
Gas exploitation for industrial use in Albania dates back to 1963, when the extent of condensed gas in Bubullima (the Kallm Zone) was launched. The reserves saw a decrease starting in 1985, reaching a minimum level in the 1990s.
The total geological reserves of gas, estimated during exploration from 1985—1990, are 18.16 bcm, out of which 13.25 bcm is associated petroleum gas (in sand and lime deposits) and

Gas Sector Expansion Strategy for Energy Diversification in Albania
224
4.91 bcm is natural gas (in sand deposits). Until 2013, approximately 12.50 bcm was extracted.
Two concessionary companies—Phoenix Petroleum and TransAtlantic (previously Stream Oil)—own and manage natural gas extraction from several gas oil fields. However, the gas flow from their sources has been halted for various reasons.
Phoenix Petroleum owns the gas fields in the Frakull area. These sources are presently closed due to a lack of connection with the collection-delivery center in Patos. Currently, the Cakran oil fields produce sufficient natural gas to cover present industrial and private consumers’ demands; as a result, there is no incentive to use gas from Frakull at the moment.
The fields at Frakull could deliver up to 4,000 Nm³/day (based on previous data) when they were not owned by Phoenix Petroleum. However, continuous pumping at these sources leads to water intrusion. These gas sources are within Pliocene geologic formations, which are situated 500–550 m below ground, and are susceptible to water intrusion. Consequently, it is necessary to suspend pumping for a while every 2–3 months to allow the gas to build up and minimize water intrusion. This leads to a non-constant flow in a given time span.
The gas fields in Povelce and Divjaka are owned by Phoenix Petroleum and are presently closed because of no available demand, as well as significant damage to the pipeline linking them to the network.
TransAtlantic has a concessionary agreement with Albpetrol for the gas field in the Delvina area, which is a proven gas condensate field. The company acquired this concessionary agreement in November 2014 from Stream Oil Company, which had owned it previously. TransAtlantic provides Albpetrol with 50% of the gas for free, which Albpetrol transports and sells to the refinery in Ballsh. The gas from these fields contains 5%–10% impurities (H2S gas), which means it has to go through a few additional purification operations in order to become usable.
Two gas wells are presently capped; one because of technical problems, and the other because the pipeline network for extracting gas is being refurbished by Albpetrol. A third well is being prepared for operations (horizontal drilling), but work has been suspended until the pipeline to the refinery in Ballsh is refurbished. Completion of the refurbishment was planned for January 2016, which would have created conditions for supplying the refinery in Ballsh with 60,000–70,000 Nm³/day.

225
CHAPTER
04Albania’s N
atural Gas Infrastructure Build-out and Technical Cooperation
[Figure 4-6] Albanian Exploration Blocks
Source: Authors.
The Albanian Agency of Natural Resources (AKBN) promotes oil and gas exploration bids. In May 2015, the Ministry of Energy and Industry ordered procedures to be initiated to enter into hydrocarbon agreements; AKBN published a map of free blocks for exploration, which included Joni-5 (offshore), Rodoni (offshore), Panaja, and Block C.
The free zones are administered by AKBN or Albpetrol, which have been contacted by interested entities. The Ministry of Energy and Industry has provided the approval for the commencement of negotiations and the final agreement. After fiscal and legal revisions, the agreement must receive final approval from the Council of Ministers.
2.2. National Infrastructure Build-out
When one is thinking about laying out a pipeline in Albania, it is not just about burying the pipes. Governor stations must be involved, and it will be necessary to establish a central control center. One must also have all of these supplementary facilities that go with different types of incentives for stations.
Safety is a top priority because there is a lot of pressure involved in the operation. Further, the gas supply must be stable, without any interruptions. Natural gas is a long-term project or business and entails very high costs. Depending on the purpose and time of day, one may need to change the pressure and control the flow. Moreover, the life expectancy of a pipeline is about 20–30 years.

Gas Sector Expansion Strategy for Energy Diversification in Albania
226
In the case of the Korea Gas Corporation, a pipeline was initially laid out in the 1980s. People are still using that pipeline, which means that capacity and management must be considered in order to ensure the proper life expectancy. Further, although future demand is unpredictable, appropriate and sufficient preparation is still required. In 1987, the initial demand was 2 million. However, that increased approximately 11 fold to about 43 million tons. There is a high demand for natural gas because there was a nationwide supply network, so the usage rate was about 90%; around 10% is now LPG.
2.2.1. Safety Construction Plan for a Natural Gas Piping Network
The most important point in promoting natural gas business is safety. Natural gas is lighter than air in its gaseous state, so it dissipates easily; even if it leaks, there is little risk of explosion due to high ignition temperature. However, large-scale explosions and fires may occur due to ignition sources when natural gas stays in an enclosed space. In addition, natural gas pipeline network construction is carried out in dense urban areas and narrow underground spaces where various obstacles are buried: therefore, qualified, trained workers, strict safety management, and quality control according to numerous manuals that specify construction procedures are required.
In order to safely supply natural gas to consumers (power plants; the industrial, heating, commercial, and business sectors; home, etc.) after completing construction of the pipeline network system, further facilities (supply management offices, a central control office) in addition to the pipeline network equipment must be built simultaneously and operated when supplying natural gas to completely secure and control safety. In the case of Albania, in addition to LNG import, PNG must be supplied through the TAP line. Therefore, it is necessary to thoroughly prepare for safety by checking the compatibility and quality of Calories.
South Korea’s management system for natural gas projects, which operate at high pressure and require safety as the top priority, is comprised of the following:
- Ministry of Trade, Industry and Energy: General energy policies and related work. - KGSC: Enacts and revises gas-related laws and regulations, and inspects gas-related
facilities. - Korea Gas Corporation: Introduces natural gas, builds and operates LNG terminals
and transmission lines, sells natural gas (to power generation and city gas companies), and runs subsidiary natural gas businesses.
- Korea Gas Technology Corporation: Maintains natural gas facilities, patrols

227
CHAPTER
04Albania’s N
atural Gas Infrastructure Build-out and Technical Cooperation
transmission lines, and runs subsidiary natural gas businesses. - City gas companies: Build and operate distribution lines by region, and sell natural
gas to customers.
The laws and regulations applied to the promotion of natural gas businesses are as follows. KGC has its own manuals and construction procedures for each stage of building and each field; relevant employees continuously check to see if the construction, safety, quality, and environment are implemented properly.
- Occupational Safety and Health Act. - Urban Gas Business Act. - High-Pressure Gas Safety Control Act. - Fire Services Act.
2.2.2. Safety Review According to the Characteristics of Natural Gas
● LNG
The main component of LNG is methane; LNG contains ethane, propane, and highly refined hydrocarbons. Since LNG is handled and stored as a liquid at -160℃, the storage tank’s inner material is of a membrane type or 9% Ni steel. The total calorific value varies depending on the production area, but is introduced in the range of 9800~10,600 Kcal/Nm3. In the case of KOGAS, the calorific value range system is being operated. Compared to 4–5 years ago, LNG is now imported at a lower rate, from 10,400 Kcal/Nm3, compared to 10,100~10,200 Kcal/Nm3 in the past due to the trend of low-calorie imports.
● NG
NG is vaporized LNG gas and has the same composition. When it is vaporized into NG, its volume expands by 600 times. When it leaks in an enclosed space and comes into contact with an ignition source, a gas explosion occurs within the explosion range (5%~15%).
● PNG
Methane is the central element; ethane, propane, and other components are removed. Since the total calorific value is in the range of 9200–9,800 Kcal/Nm3, when mixed with LNG, it is necessary to check whether the Weber index belongs to the same group or not. In addition, since PNG is of different quality, when used to generate power, it is necessary to

Gas Sector Expansion Strategy for Energy Diversification in Albania
228
review the impact on facilities in advance. If the amount of heat does not match with the imported LNG, measures should be established for a separate supply or operation of heat control facilities.
2.2.3. Safety Review for Establishing a Piping Network System
● Pipeline (Pipe Design)
The useful life of piping material varies depending on quality control, but since it can be used for more than 20–30 years, it is efficient and economical in the mid- to long-term to design and bury pipes with a generous diameter in light of the increase in demand due to future demand forecasts. According to the Gas Master Plan report (November 2016), the demand base year is 2040. Designs include the following:
- Fier~PRMS Vlora (31 km): 12". - Fier~Ballish (23.1 km): 8".
Taking the example of the first phase of the South Korean project (1982–1986),
- Demand base year: 2002 - Predicted gas demand: 2 million tons
Piping diameters of 26", 24", and 20" were designed, but the demand for natural gas surged during operation, so pipe reinforcement work was implemented before the base year. Due to the nature of natural gas, when supplying the demand area through long-distance pipeline transport, the pressure drops depending on the supply flow rate or supply pressure. Therefore, a network analysis for each request for gas is performed to determine the supply pressure in the natural gas production area, and to fully consider the supply flow for a stable supply.
It is necessary to loop major pipelines for an uninterrupted gas supply in case urgent repairs of the pipeline network, or for when urgent pipeline replacements, become unavoidable during operation.
2.2.4. Pipe Construction
The pipe material is a high-tensile steel pipe of the American Petroleum Institute (API Gr X70, X65, X42) coated with polyethylene. For urban roads, the pipe should be buried at a depth of 1.5 m or more from the ground’s surface; for out-of-town roads, it should be buried

229
CHAPTER
04Albania’s N
atural Gas Infrastructure Build-out and Technical Cooperation
at a depth of 1.2 m or more from the ground’s surface. In principle, to improve the efficiency of pipe management, it should be buried on the road’s shoulder.
To safeguard a pipe against other kinds of construction (e.g., unauthorized excavations), a protective steel plate and a landmark to protect the pipe must be buried at the top of it, and the pipe must be flagged as a natural gas supply pipe. After welding the pipe, the welding part should be wrapped with cold tape to prevent corrosion, and thoroughly checked and managed so that foreign substances do not enter the inside of it. After piping work, the proof test should be safely carried out with a medium such as water, air, or nitrogen, according to the procedure, and water should be completely removed from the inside.
2.2.5. Supply Management Offices
A supply management office is installed on the pipeline at a certain distance in line with the installation standards for emergency shutoff devices, gas supply shutoff devices, and vent stacks in accordance with the standards for auxiliary facilities. However, G/S should be installed at the gas supply points, and V/S and B/V should be placed given the site’s conditions and based on the vent stack installation standards.
Installation standards for the supply management office: Class location (II, III, IV) is determined according to the regional division (density) of the pipeline’s buried part, and the installation distance is determined according to the regional classification standard (8 km, 16 km, 24 km), but can be adjusted.
Installation standards for vent stacks: For the installation height, the landing concentration of the emitted gas must be less than the lower explosive limit, and the time required to discharge to atmospheric pressure must be within 60 minutes.
For KOGAS: The shut-off valves are installed at major points as an electric type and are operated so that manual/electrical operation is possible at the site and in the control room. In the case of G/S, a worker is on-site 24 hours a day to check, monitor, and record the equipment status, as well as to detect equipment abnormalities. After implementing emergency measures upon detection, the worker requests dispatch of the maintenance team to the regional control center.
Major facilities (gas filters, gas heaters, static pressure facilities, and metering facilities) installed in the supply management office must be run stably by establishing a reserve heat system in the case of sudden stoppage during operation or for regular overhauls.

Gas Sector Expansion Strategy for Energy Diversification in Albania
230
In preparation for power outages, a UPS is installed in the control room and is put into operation.
2.2.6. Central Control Center
The operation status of major equipment installed at production bases and supply management offices should be remotely monitored and operated, and the central control center should be run to enable control (telemetering/telecontrol) during an emergency. Therefore, the main facilities should be able to perform triple operations (site/control room/central control center).
The central control center primarily monitors and determines the pipeline system’s production and supply status through scientific analysis of gas supply capacity. Further, it monitors and regulates the pressure, flow rate, and facility operation status of the supply management office in the relevant area. The role of the gas system situation room is to supervise accident prevention and crisis management.
The main facilities installed in the central control center entail supervisory control and data acquisition (SCADA) equipment for remote monitoring and control, relational database management (RDBMS) server equipment for performance data management, network equipment, and security equipment.
It is desirable to operate the central control center simultaneously with natural gas facilities. The central control center is installed and run as a regional control center in the area where the pipe network is installed in the initial stage of the project. When a business is expanded to provide supply nationwide in the future, a central control center will be installed at the Albgaz headquarters, and regional control centers will be installed and operated for each region (KOGAS currently runs a single central control center and nine regional control offices).
2.2.7. The Construction Supervisor’s Duties to Ensure Safety
The construction supervisor oversees all matters such as confirmation of the implementation of contract clauses, witnessing of construction status according to construction-related documents, supervision and instructions, on-site quality control, safety and environmental management, and process management. Additionally, they check the conditions of the material, whether it has been properly installed, and whether it has been installed according to the quantity of the design document.

231
CHAPTER
04Albania’s N
atural Gas Infrastructure Build-out and Technical Cooperation
The construction supervisor must be fully aware of the construction’s contents, review whether the design documents and site conditions were different before construction, and record and preserve the major parts of the construction process. The construction supervisor oversees construction based on the design document, contract, construction specifications, and other related documents, and must keep and organize the following documents and materials:
- Construction instruction.. - Daily construction supervision log. - Drawing management ledger. - Progress schedule. - Construction-related drawings and photo ledger for the burial process. - Materials testing/inspection/release management data.
2.2.8. Preparation Related to the Start of Construction
After completing a construction contract, a storage yard should be secured at the pipeline route’s midpoint to install a temporary office, and to store various kinds of heavy equipment and materials necessary for construction.
To ensure that there are no setbacks at the start of construction, major materials (such as clad pipes and 3D-BEND) must be secured in light of the delivery period. Construction drawings for the planned section must also be secured at the site in advance so that construction can be carried out in a timely manner.
Guidelines for pipe welding work must be established, WPS and PQR must be approved, and welders must be secured. Only welders who have passed the skills test can perform welding operations.
Regarding the point where pipe bending of 11 degrees or less is required in the construction, it is necessary to secure a cold bending foundry M/C in the yard so that cold bending can be used through a foundry.
What are the safety measures involved?
- Prevent hazards caused by machinery; equipment; facilities; electricity; heat; energy; and explosive, ignitable, and flammable substances.
- Prevent risks due to poor working methods when performing excavations, quarrying,

Gas Sector Expansion Strategy for Energy Diversification in Albania
232
transportation, and handling heavy objects. - Prevent dangers such as falls, collapses, and objects flying.
We hope that the Albanian natural gas pipeline system project will be an accident-free endeavor by checking and taking the steps outlined above in advance. Upon request, we will be ready to provide the necessary support.
3. Albania’s Natural Gas Infrastructure Interconnection with Neighboring Countries
3.1. Ionian Adriatic Pipeline
The IAP would connect Croatia’s existing gas transmission system via Montenegro and Albania with the TAP system or a similar project. The total length of the gas pipeline from the Croatian city of Split to the Albanian town of Fier is 511 km.
Construction of the IAP would enable the gasification of southern Croatia, Bosnia and Herzegovina, Albania, and Montenegro, as well as diversify supply routes in the region. This transmission pipeline is estimated to be 511 km long and would create the preconditions for the forecasted annual level of 5 bcm to develop the natural gas markets of Albania, Montenegro, Bosnia and Herzegovina, and Croatia. It is predicted that 1 bcm would be for Albania, 0.5 bcm for Montenegro, 1 bcm for Bosnia and Herzegovina, and 2.5 bcm for Croatia.
The Croatian section of the IAP pipeline will be 32” in diameter (with an approximate capacity of 6.6 bcm) and will connect to the Croatian transmission system in Split to the Bosiljevo–Split pipeline, which is 20”' diameter (with a capacity of 2 bcm). The Bosiljevo–Split pipeline’s capacity is sufficient to transport the expected Croatia IAP demand (up to 2 bcm in 2040).
Plinacro Ltd. is planning to develop the new Bosiljevo–Karlovac–Lučko–Zabok–Rogatec pipeline system, with total length of 150 km. The pipeline’s capacity is planned to be 5.5 bcm which should, with the existing pipeline’s capacity, allow IAP gas to be transmitted to the major gas consumption centers in Croatia and Slovenia. Expected investment in this pipeline system is estimated at €107 million. For gas to be transported to consumption centers in Croatia through IAP, only the Bosiljevo-Karlovac section should be extended (70 km of a 28” [DN 700] pipeline with an investment of €27 million).7
7 Western Balkans Investment Framework (WBIF) Infrastructure Projects Facility Technical Assistance 4 (IPF 4) Infrastructures: Energy,

233
CHAPTER
04Albania’s N
atural Gas Infrastructure Build-out and Technical Cooperation
To enable transmission of IAP gas to Slovenia or Hungary, or in the reverse flow case (supplying IAP countries from Croatia), the capacity of the Bosiljevo-Split pipeline should be expanded as well. To reach adequate capacity and expected gas pressure conditions, an additional pipeline at least 28” in diameter should be built. The length of this pipeline should be 290 km, which would result in an investment of €270 million.
The pipeline’s route crosses diverse landscapes, varying from flat and arable land to mountainous, rocky regions. The pipeline crosses several rivers, railways, seas, highways, and smaller roads. The suitability of each crossing location for the proposed crossing technique has been assessed and confirmed.
The IAP route starts in Fier, Albania, runs north to Tirana, and continues toward the border with Montenegro near Štodra. At the border, the pipeline crosses the Buna River and runs toward Bar. From Bar the route runs offshore at a length of 33.1 km, reaches the coast near Budva, continues toward Kotor and across a peninsula, continues toward the border with Croatia, crosses the Bokokotorska bay, and reaches peninsular Croatian territory. The route runs parallel to the coastline toward Dubrovnik across the Konavle field. After passing Dubrovnik, the route crosses the bay at Rijeka Dubrovačka, reaches Dubrovačko primorje, and via the Pelješac Peninsula crosses the sea toward Ploče. The route passes the city of Ploče on its western side. Finally, from Ploče, the route moves northwest, reaching Dugopolje near the city of Split.
[Figure 4-7] Albanian Section of IAP Route
Source: Gas Master Plan (2016).
Environment, Transport, and Social WB11-ALB-ENE-0, p. 53.

Gas Sector Expansion Strategy for Energy Diversification in Albania
234
The gas pipeline is, in its entire length, set as an underground installation, with the exception of aboveground facilities such as block valve stations (BVS), metering and reduction stations (MRS), custody transfer metering stations (CTMS), pig trap stations (PTS), and compressor stations. Along its southern route, between Budva and Bar, the pipeline is set offshore under the sea, as well as in Boka Kotorska bay, bypasses Cavtat Bay, and runs on to Peljesac to Ploce.
<Table 4-5> IAP Summary
IAP Croatia Montenegro Albania Total
Pipeline Length (km) 249 94 168 511
Average Transmission Volumes (bcm) 2.3 1.9 1.6 2.3
Investment (mil. EUR) 355.2 127.8 178.5 661.5
Source: Gas Master Plan (2016).
Advantages of the IAP:
- Allows for possible gasification in Albania; - Allows for possible gasification in Montenegro; - Allows possible gasification in an important part of Bosnia and Herzegovina; - Provides assistance for the gasification of Southern Croatia; - Allows for possible gasification in Macedonia and Kosovo; - Diversifies the natural gas supply; - Provides access to Croatian and Albanian gas storage; - Enables a significant amount of transmission fees and profits in Albania, Montenegro
and Croatia; and - Stimulates regional economies.
This regional energy project corresponds to all five criteria of the Trans-European Networks for Energy (TEN-E):
- Priority activities; - Economic sustainability; - Trans-border; - Approval; and - Appropriateness.

235
CHAPTER
04Albania’s N
atural Gas Infrastructure Build-out and Technical Cooperation
3.2. LNG Krk
Potential key users of LNG Krk are Central and Western European states (Austria, Slovenia, Hungary, Slovakia, and the Czech Republic) as well as Western Balkan countries (Serbia, Bosnia and Herzegovina, Montenegro, Northern Macedonia, Albania, and Kosovo). The LNG receiving terminal will be located in Omišalj County on the island of Krk in Croatia in the North Adriatic.
[Figure 4-8] Location of LNG Krk
Source: Gas Master Plan (2016).
Technical parameters of the terminal:
- Terminal configuration: Onshore tanks and vaporizers; - Planned capacity: 4-6 bcm/year; - Tank capacity (full containment): 2 x 180,000 m³; and - Size of LNG supply ships: 75,000–265,000 m³.
Project benefits:
- Provides a diverse supply of natural gas; - Provides security for the supply of natural gas; - Introduces an ecologically sound energy source in the region; - Reduces CO2 emissions in the region; and - Facilitates economic growth.

Gas Sector Expansion Strategy for Energy Diversification in Albania
236
3.3. LNG Revithoussa
The Revithoussa LNG terminal is currently the only LNG terminal in Greece, and serves as the entry point of LNG for the Hellenic gas transmission system, although there are plans for two additional LNG projects. The terminal is located on the island of Revithoussa, 500 m from the shores of Agia Triada in the Pachi Gulf of Megara, 45 km west of Athens.
[Figure 4-9] Revithoussa LNG Terminal
Source: Gas Master Plan (2016).
The LNG is stored in two tanks with a total capacity 130,000 cm3, and is re-gasified in the terminal’s gasification installations, supplying the National Natural Gas transmission system. The maximum LNG unloading rate is 7,250 m3/h. Two cryogenic storage tanks of 65,000 m3 each are used to temporarily accommodate the LNG before it is re-gasified and exported to the gas network.
Two submarine gas pipelines (2 x 24”) that are 510 m and 620 m long, respectively, connect the LNG terminal sendout pipe with the Agia Triada metering station, which is the entry point to the Hellenic gas transmission system.
The operator provides users with LNG services (access to the LNG facility on the island of Revithoussa in the gulf of Megara), which include:
• LNG cargo unloading, including the mooring of an LNG vessel, the discharge of LNG cargo, and the detachment of an LNG vessel;
• The provision, to the LNG user, of storage space at the LNG facility for the interim storage of LNG cargo (temporary LNG storage);

237
CHAPTER
04Albania’s N
atural Gas Infrastructure Build-out and Technical Cooperation
• The re-gasification of LNG cargo and its subsequent discharge into the transmission system via the LNG entry point; and
• The execution of the necessary measurements, as well as any action needed for the effective, secure, and cost-effective operation of the LNG facility, in the framework of the provision of the services stated above.
Technical data for the Revithoussa LNG terminal:
• Sustained maximum sendout rate (SMSR): 1,000 m3/h;• Peak sendout rate (peak): 1,250 m3/h;• Minimum sendout rate: 85 m3/h; and• Yearly average sendout rate: 365 days x 24 h x 1,000 m3/h.
The LNG terminal also has a highly efficient co-generation power plant that supplies the necessary power to the terminal. Two gas engines are combined with two generators, producing 6.5 MW of power at 6 kV each. Each generator can work alone or together, supplying total power for the LNG terminal’s operation, giving high reliability to the vaporization process. Further, each generator or both can be synchronized and parallelized to the national power grid.
In addition to the power supply, heat recovered from the plant provides the terminal with a high thermal energy benefit for vaporizing LNG. The heat recovery system, from the exhaust gases and cooling water of the power plant, provides almost 13 MW of thermal energy to the LNG terminal.
Following the proposal of DESFA, which owns and operates the terminal, and the corresponding approval of RAE, the Greek regulator, the Revithoussa LNG terminal has been undergoing a profound upgrade of its capacity since 2014. The upgrade includes the construction of additional storage capacity (almost double that of the existing one), the addition of new vaporizers, and enhancement of the terminal’s ability to receive the largest available LNG vessels. The terminal’s total import capacity was expected to reach circa 7 bcm and was supposed to become available by the end of 2016.
3.4. Eagle LNG
Eagle LNG is being developed by Gruppo Falcione. The gas and LNG infrastructure is planned not only for Albania, but also for neighboring countries and Italy as it diversifies its sources of gas supply. Italy currently depends on imports from Russia and North Africa for

Gas Sector Expansion Strategy for Energy Diversification in Albania
238
more than 80% of its gas supply.
Eagle LNG import terminal is planned as a floating FSRU vessel for the importation and re-gasification of LNG; it is located off of the Albanian coast, near Fier, with an annual capacity of 4–8 bcm. A subsea gas pipeline with an annual capacity of 10 bcm, which would connect Italy and Albania, is planned alongside the terminal, spanning 110 km from Levan in Albania to Brindisi in Italy. The total investment is around €700 million.
The project has been selected as a Project of Energy Community Interest (PECI) and is included in ENTSOG’s Ten Year Network Development Plan.
[Figure 4-10] Location of Eagle LNG Terminal
Source: Gas Master Plan (2016).
The project is expected to provide the following benefits:
• Support the development of Albania’s economic and gas market;• Increase the security of the region’s gas supply;• Bring a competitive source of gas;• Increase the gas integration of the SEE region;

239
CHAPTER
04Albania’s N
atural Gas Infrastructure Build-out and Technical Cooperation
• Minimal environmental impact (a floating vessel 5 km offshore in Albania); and • An offshore gas pipeline in the Adriatic, as well as gas pipelines in Italy and Albania.
Before reaching a final investment decision, which was expected in 2016, the remaining activities are expected:
• Basic and FEED engineering for the offshore pipeline and connection to the Italian grid;
• Authorization to build the pipeline and connect it to the grid from • MSE, inclusive of approval from the EIA and local approval;• Formal TPA exemption from Albanian and Italian authorities;• A final safety study on an FSRU vessel;• A tender EPC contract (detailed engineering and construction of the subsea pipeline
and connection to the Italian grid);• Chartering and an O&M contract for the FSRU; and• Secure long-medium term tolling contracts.
4. Comparative Assessment of LNG Introduction Methods
The lack of proper gas pipeline infrastructure would be a major roadblock; setting up a pipeline in a remote location, if required, would become even costlier. The development of pipeline transmission and distribution systems alone would not ensure a supply of gas to the two major natural gas consumption centers: the triangle of Fier-Vlora-Ballsh, and the region of Durres and Tirana.
LNG is a versatile fuel. In its liquid state, LNG is a highly cost-competitive substitute for refined oil products and PNG in diverse sectors, including the industrial, commercial, transport, and even power generation sectors. Because of this flexibility and versatility, the global LNG market is growing rapidly and completely transforming the world’s energy landscape.
LNG import options could expedite and facilitate the gas supply to priority gas consumption regions. LNG has typically been transported in sizeable volumes by large, double-hulled ships to numerous destinations, where it is re-gasified for use along with other sources of natural gas at power plants, industrial facilities, and in commercial and residential communities, usually via pipelines.

Gas Sector Expansion Strategy for Energy Diversification in Albania
240
An FSRU is an offshore structure that stores and re-gasifies LNG, similar to an onshore LNG import terminal. FSRUs offer a faster, more flexible way to import LNG to power-constrained places. FSRUs have been a game changer for the LNG market. They have enabled far more countries to become LNG importers, and enabled them to enter the market more quickly and at a substantially lower cost compared with building a conventional onshore receiving terminal.8
As of 2020, there are 25 LNG importing countries that only use onshore terminals, and 13 importing countries that only use FSRUs. Seven countries use both kinds of facilities. As of the end of 2020, the re-gasification capacity of the FSRU project in operation is about 96.5 million tons/year, which is about 18% of the total re-gasification capacity.
In 2016, an increasing oversupply, generated by a new supply in different regions, Russia, the US, and Australia, emerged without incremental demand, particularly in Asia. This situation completely shifted the market toward becoming increasingly complex, with a growing number of participants. This allowed the market to expand beyond its traditional pattern of deliveries under long-term fixed destination contracts over the last decade, which generated an increasing portion of LNG sold under shorter contracts, or on-the-spot market shippers, than traditional legacy contracts. This global commoditization of SSLNG businesses has provided a solid base for the emergence of new LNG applications and markets, such as a small-scale solution.9
With the era of sizable floating E&P gas projects coming to an end, FSRU players are expanding LNG activity by tapping into small- and medium-scale markets. The business case for supplying LNG on a small scale is drawing more attention. In 2019, six small-scale facilities of less than 0.1 mtpa were commissioned (two for production, and four as re-gasification units). Globally, LNG businesses are moving in a direction that favors the development of SSLNGs. A rising number of new countries adopting LNG are smaller states whose requirements might be better suited by smaller size projects. However, the use of gas as a transport fuel, both for marine and surface transport applications, is growing due to rising air quality concerns and new policies that ban the use of heavy fuels for maritime transport.10 Today, the SSLNG segment is between 28 and 30 MTPA, which is approximately 8.5% of the global LNG market.11
SSLNG refers to the use of LNG directly in its liquefied form, in contrast to the original
8 Sylvie Cornot-Gandolphe, “New and Emerging LNG Markets: The Demand Shock,” IFRI Report, June, 2018, p. 24.9 Ufm Gas Platform, “An Assessment of Small Scale LNG Applications in the Mediterranean Region,” May 2020, p. 4.10 Ibid., p. 6.11 Ibid.

241
CHAPTER
04Albania’s N
atural Gas Infrastructure Build-out and Technical Cooperation
model of re-gasifying LNG and introducing it into the gas transmission grid. SSLNG is capable of off-grid power generation for the residential and industrial sectors in a country’s remote areas where traditionally produced LNG cannot be supplied due to the lack of a proper pipeline network. These plants produce less than 1 million metric tons of LNG per year and are scalable, which makes them suitable for coping with small fluctuations in demand.12
Virtual pipelines offer an alternative way of transporting natural gas to places without pipeline networks. Communities, industries, gas stations, and other stakeholders can use gas based on a modular system of compression or liquefaction, transport and decompression, and/or the re-gasification of natural gas. Through various modes (highways, railways, waterways, and the sea), compressed/liquefied natural gas is transported via virtual pipelines.
The shift toward LNG as a kind of fuel gained momentum after the IMO 2020 0.50% sulfur cap was implemented, and the European Green Deal was announced, with more LNG-fueled vessels and road vehicles supported by LNG re-fueling infrastructure.
Although the SSLNG market is still in its nascent stage, it may represent a revolution in the gas sector, which is primarily driven by increasing power and fuel demand and new regulations. The novel global emissions cap reduces sulfur emissions limits from 3.5% to 0.5% in emissions-controlled areas. This is one reason that will lead to an increase in SSLNG businesses in the maritime industry.13 The attractiveness of SSLNGs, as well as their rapid growth and maturity, is attributable to the adoption of LNG as the fuel of choice in many sectors (e.g., power generation, industrial applications, household gas, and the transportation sector).14
The use of small-scale, containerized LNG could significantly benefit Albania in the short term (2–3 years) where new pipeline investments are not economical in the near to mid- term. Given the scale of demand, SSLNG could address this market. In Tunisia, the use of SSLNG has emerged as a solution to supply isolated areas not connected to the gas grid where the residential, industrial, and commercial sectors are present. LNG could be supplied from a future LNG terminal, through a small liquefaction facility connected to the grid, or from a small-scale barge. Given the country’s current scarcity of gas pipeline infrastructure, the following alternatives are proposed. Small liquefaction facilities could be set up in the gas pipeline layout. Small quantity facilities of between 0.05 and 0.1 mtpa could supply
12 Santosh Nair, “Small Scale LNG: The Future of Energy Transition,” December 2, 2020. https://www.gep.com/blog/mind/the-fu-ture-of-energy-transition.
13 Ibid.14 US Department of Energy, “Opportunities for Small Scale LNG in Central & Eastern Europe” December 2020, p. 26.

Gas Sector Expansion Strategy for Energy Diversification in Albania
242
industrial regions, creating virtual gas pipelines, with a fleet of tank trucks to transport fuel from liquefaction facilities to end users, where there are some satellite plants.
FSRUs can meet demand in Albania where there is limited infrastructure investment. It is not necessary to build a re-gasification terminal or gas pipeline network to connect Albania to the global LNG market. Strong interest in SSLNG is growing in markets where demand for natural gas is not great enough to support the economies of scale required to justify large volumes of LNG imports via conventional LNG tankers.
This section includes an economic and technical assessment of LNG’s introduction into the otherwise TAP pipeline-supplied regions of Fier-Vlora-Ballsh and Tirana-Durres. LNG could be introduced into the converted CCGT in Vlora and distribution networks for industries and households in the areas of Fier and Ballsh.
In terms of economic feasibility, small-scale LNG terminals appear to be the most profitable option: A conventional LNG import terminal capable of handling 6 MTPA of LNG would likely cost over a billion euros, while FSRU-based import terminals would be significantly cheaper, at approximately €300 million. Smaller-scale LNG and bunkering terminals can be built far less expensively, as well as more quickly compared to onshore, baseload re-gasification terminals.15
4.1. FSRU Technical & Economic Assessment
LNG receiving terminals can largely be divided into onshore LNG re-gasification terminals, FSRUs, and small-scale facilities such as FSUs.The onshore LNG receiving base is the most common LNG receiving and natural gas production terminal; it entails building a re-gasification facility and a storage facility together on an onshore base. Related technologies have been verified through a number of projects and demonstrations.
However, an FSRU is an offshore terminal that stores and re-gasifies natural gas in the LNG state by unloading LNG from LNGC at sea. Currently, the market is growing, along with the development of FSRU technology worldwide.
The form of an onshore re-gasification facility + FSU exists, which offers an intermediate method between an onshore LNG receiving base and an FSRU. The biggest difference between FSRU and FSU facilities is whether the re-gasification facility is located on land or on a floating unit. Seasonal demand encourages the use of floating LNG storage units, rather
15 US Energy Association, “Opportunities for Small-Scale LNG in Central and Eastern Europe,” December 2020, p. 66.

243
CHAPTER
04Albania’s N
atural Gas Infrastructure Build-out and Technical Cooperation
than complete FSRUs. A simple solution is to have the re-gasification take place onshore, or on the jetty, and to use an LNGC for storage.
A fast-growing segment of the market entails using barges as re-gasification units for small and mid-scale segments. Units with a typical storage volume of 10,000–25,000 cu m are becoming increasingly popular, can serve as smaller power stations for an island nation or other remote location, and can be easily served by SSLNGCs.
Finally, a concept that is gaining momentum is combining an FSRU with a floating power generation plant. Very often, LNG demand is driven by the need for clean power generation. Hence, rather than having to build a power plant onshore, a floating LNG-fueled power plant could offer a fully integrated solution, with clear advantages regarding project schedule and flexibility.
The type of facility should be determined by judging the amount of natural gas consumption and the size of storage facilities, the construction conditions of onshore re-gasification facilities, and the possibility of conversion to an LNG receiving base in the long term.
[Figure 4-11] Comparison between FSRU and FSU
LNGC FSRU LNGC FSU
JRU GasPipeline
GasPipeline
Typical FSRU Project Typical FSU Project
Source: KEEI (2021).
4.1.1. LNG Re-gasification Terminal Trend
FSRU businesses began in the US. The El Paso Global LNG Group’s project to install a floating re-gasification facility at Gulf Gateway Deepwater Port off the coast of Louisiana was the first to utilize the FSRU concept. In 2001, El Paso was hired by Excelerate Energy to build the first FSRU vessel for a project to install and operate a floating LNG re-gasification facility off the coast of Louisiana. The terminal was shut down in 2011 due to reduced LNG demand.

Gas Sector Expansion Strategy for Energy Diversification in Albania
244
The actual application started in 2005. Excelerate Energy acquired the technology in 2003 and put the facility into operation. In the past 20 years, the number of LNG importing countries has increased from 11 to 39, and the re-gasification capacity of import terminals has increased by 3.3 times. As of the end of 2020, the number of LNG importing countries is 39, and the re-gasification capacity is estimated to be about 890 million tons/year. As of the end of 2020, the country with the largest amount of operating re-gasification capacity is Japan, accounting for 23% of all capacity. South Korea is the second largest country with the greatest capacity (16%).
[Figure 4-12] Import Terminal Construction and Capacity Change
No.
of T
erm
inal
No.
of C
ounr
ies
0
16
12
8
4
0
50
38
25
13
1984
1987
1990
1993
1996
1999
2002
2005
2008
2011
2014
2017
2020
Onshore TerminalFloating Terminal No. of Importing Countries (right)
MTP
A
0
1,125
900
450
675
225225
0
80%
60
20
40
1995
1998
2001
2004
2007
2010
2013
2016
2019
2022
2025
Regasification CapacityUnder Construction Capacity Utilization Rate (right)Floating Terminal Capacity Ratio (right)
Forecast
Note: The number of cases (including new construction and expansion) is reflected, but the small capacity (500,000 tons/year) is excluded from the terminal capacity trend.
Source: IHS Market (2021).
<Table 4-6> Capacity Trend of Import Terminals by Region(Unit: MTPA)
Region 2000 2005 2010 2015 2020
Europe 44.1 54.7 119.3 147.9 183.0
North America 14.5 25.3 128.8 100.2 115.8
South America 0.3 2.1 12.2 23.6 25.8
Middle East & North Africa - - 2.6 18.0 25.9
East Asia 211.6 249.9 299.5 382.1 446.4
South Asia - 6.7 13.6 25.1 54.0
Southeast Asia - - - 22.8 39.4
Total 270.5 338.7 576.0 719.9 890.4
Source: IHS Markit (2021).

245
CHAPTER
04Albania’s N
atural Gas Infrastructure Build-out and Technical Cooperation
Among the total capacity increase in 2020, the share of floating import terminal capacity increase was about 46%; as of the end of 2020, the floating import terminal capacity accounts for about 19.5% of total import terminal capacity. The increase in the number of alternative LNG supply options, the use of flexible carriers, the improvement of the LNG S&D environment, the growth of the spot market, and the development of floating terminal technology, are leading to an increase in the number of LNG importing countries.
For the past 20 years, East Asia has led the increase in re-gasification capacity, and over the past 10 years, Europe, Southeast Asia, and Western Asia have contributed to the increase in capacity. The Middle East, South America, and Southeast Asia are actively building import terminals to solve summer electricity problems, and European nations are constructing import terminals to diversify supply sources.
In the past 10 years, the average use of the import terminal year has been 35%~41%, which is not a big enough change. Recently, the average maximum transmission capacity has been on the decline, which seems to be due to the increase in the construction of small and medium–sized terminals, including floating terminals.
The usage rate in Southwest Asia, which is mainly channeled toward power generation, is over 70%, while in other regions, it is around 30%–40%. Since 2019, in the European region, the usage rate has been close to 50% due to the increase in the share of power generation consumption.
As of early 2021, 54 terminals (including expansion projects) are under construction in 25 countries, and the total capacity of the import terminals under construction is 156.9 million tons/year.
In terms of capacity, China and India account for 39% and 17%, respectively, comprising 55% of the total. Projects underway in nine countries, including the Philippines, Vietnam, Bahrain, and Hong Kong, are to introduce new LNG. Among the projects under construction, FSRUs consist of about 23% (by capacity), of which 46% is the capacity of FSRUs under construction in new LNG importing countries.
As of early 2021, the total capacity of the proposed import terminal project is 131 million tons/year. As the international LNG market environment is favorable for buyers, plans have been announced to expand facilities in regions with low natural gas penetration or low LNG imports, such as China, Southwest Asia, Southeast Asia, and Europe.

Gas Sector Expansion Strategy for Energy Diversification in Albania
246
East Asia, including China, accounts for the highest at 35%, followed by Southwest Asia, Southeast Asia, and Europe at 19%, 17%, and 15% respectively.
4.1.2. The Concept of the FSRU and Installation Background
4.1.2.1. Differences from Land Terminals
An FSRU uses the same technology as a land terminal, except that it utilizes an LNG carrier built at a shipyard, which is suitable for operating at sea. In the case of a newly built vessel, the equipment is usually integrated into the vessel and built together with the vessel, whereas when using a vessel that was previously employed for transport and is now a converted vessel, the relevant structure is installed in the shipyard to minimize the period of modification attached to the transport. In the early days, FSRUs were incinerated in ships’ boiler rooms because they did not have facilities for re-condensing boil-off gas, but recently, it has become common to use them as fuel for FSRUs.
4.1.2.2. Cases of FSRUs
FSRUs are different from land terminals in that they vaporize and transmit LNG using ships equipped with re-gasification facilities. Therefore, the structure required for unloading and re-gasification is integrated into a ship so that it is suitable for operations at sea and manufactured in the shipyard. However, for a modified ship, a separate structure is manufactured and attached to the ship in the shipyard.
Initially, when it was difficult to promote onshore terminal projects for floating re-gasification facilities, FSRUs were started in the US. The El Paso Global LNG Group’s project, which aimed to install a floating re-gasification facility at Gulf Gateway Deepwater Port off the coast of Louisiana, was the first endeavor to utilize the FSRU concept. Interest in FSRUs entailed resolving complaints about the construction of onshore terminals. Hence, FSRUs may be recognized as businesses for utilizing LNG carriers.
Initially, the use of gravity-based structures at sea or retrofitting production platforms were considered. The Adriatic LNG terminal in Italy (2009) is currently in operation. The Adriatic LNG is not classified as a floating facility because it is a fixed facility at sea.
Recently, LNG re-gasification vessels (FSRUs) that can load, store, and re-gasify LNG have been installed at certain protected coastal points to respond to changes in external conditions, rather than on the open sea.

247
CHAPTER
04Albania’s N
atural Gas Infrastructure Build-out and Technical Cooperation
● Italy Adriatic LNG Terminal
[Figure 4-13] Italy Adriatic LNG Terminal
Source: CH-IV (2021).
The installation and operation methods of the operated floating regasification facilities can be divided into five types.
First, an FSU equipped with a space to store LNG is fixed to a jetty and used as a (floating) LNG storage facility. The LNG re-gasification facility, installed on land, will be used to vaporize and transmit LNG. The Sungai Udang (Lekas) LNG project (Malaysia, 2013) is a case in point, where LNG is unloaded from an LNG carrier berthed at the pier. In addition to the Sungai Udang (Lekas) LNG project, there are facilities in three other countries: Gibraltar, Malta, and Myanmar (imported as an SSLNG carrier from Malaysia in 2020).
● Malaysia Sungai Udang Terminal
[Figure 4-14] Malaysia Sungai Udang Terminal
Note: FSU fixed to the pier (left), and the re-gasification facility (right).Source: PETRONAS (2020).
The second method involves unloading LNG from the LNG carrier berthed at the pier and transferring it to the FSRU fixed to the onshore pier, then re-gasifying it at the FSRU and
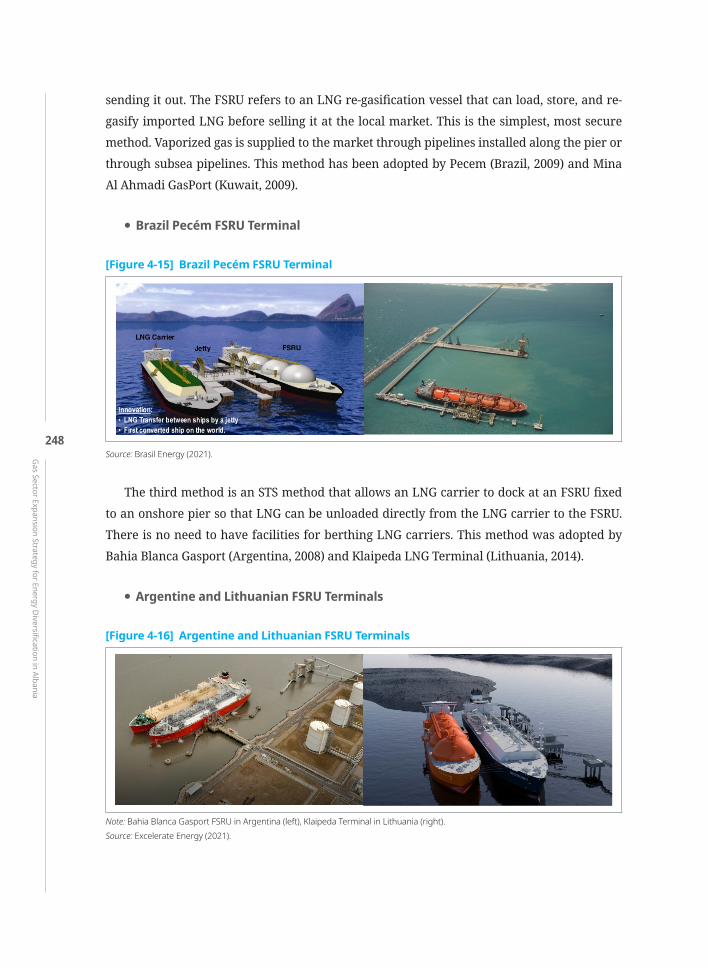
Gas Sector Expansion Strategy for Energy Diversification in Albania
248
sending it out. The FSRU refers to an LNG re-gasification vessel that can load, store, and re-gasify imported LNG before selling it at the local market. This is the simplest, most secure method. Vaporized gas is supplied to the market through pipelines installed along the pier or through subsea pipelines. This method has been adopted by Pecem (Brazil, 2009) and Mina Al Ahmadi GasPort (Kuwait, 2009).
● Brazil Pecém FSRU Terminal
[Figure 4-15] Brazil Pecém FSRU Terminal
Source: Brasil Energy (2021).
The third method is an STS method that allows an LNG carrier to dock at an FSRU fixed to an onshore pier so that LNG can be unloaded directly from the LNG carrier to the FSRU. There is no need to have facilities for berthing LNG carriers. This method was adopted by Bahia Blanca Gasport (Argentina, 2008) and Klaipeda LNG Terminal (Lithuania, 2014).
● Argentine and Lithuanian FSRU Terminals
[Figure 4-16] Argentine and Lithuanian FSRU Terminals
Note: Bahia Blanca Gasport FSRU in Argentina (left), Klaipeda Terminal in Lithuania (right).Source: Excelerate Energy (2021).

249
CHAPTER
04Albania’s N
atural Gas Infrastructure Build-out and Technical Cooperation
The fourth method involves fixing the FSRU at sea, then unloading the LNG via an STS method, and sending the gas vaporized from the FSRU to land through an undersea pipeline. It is necessary to build a facility to fix the FSRU at sea and subsea pipelines, as the safe transport of LNG between ships may be affected by weather or sea conditions. LNG Toscana (Italy, 2013), Dubai FSRU (UAE, 2010), Nusantara Regas Satu (Indonesia 2012), and Lampung LNG (Indonesia, 2014) are applied.
● Toscana FSRU Terminal, Italy
[Figure 4-17] Toscana FSRU Terminal, Italy
Note: Toscana FSRU schematic (left), Toscana SSLNG STS shipment (right).Source: OLT Offshore LNG (2017).
FSRUs and land power plants would be the most suitable for Albania and provide fuel for power generation by building a floating storage and regasification facility together (FSRU) and supplying gas to an onshore natural gas power plant. Full-scale FSRU-based power generation for land power plants in the Vlora region fits the Albanian case. Power and heating needs are too large to be cost-competitive when served by SSLNG in the Vlora region.
<Table 4-7> FSRU and Land Power Plants
Division FSRU (National ship) Land Power Plant Remarks
Supply Immediately Within 30 Months Based on 300MW Construction in Korea
Facility Scale 56,000 tons/ship 50 ~ 1,000MW Supply of LNG 1 Million tons/year
Investment Cost - KRW 60 Billion ~ KRW 1.1 Trillion KRW 1.1 Billion /MW
Berthing Facility Berthing Facilities Required
Excluding Land Compensation Fee -
Source: KEEI (2021).

Gas Sector Expansion Strategy for Energy Diversification in Albania
250
In October 2020, Italian authorities gave the green light to OLT Offshore LNG Toscana, the operator of FSRU Toscana, to load SSLNG carriers at the floating terminal 22 km off the Italian coast. Moored off the Tuscan coast between Livorno and Pisa, FSRU Toscana would become an important source of SSLNG in the Mediterranean.16
The LNG terminal off Krk island began operating commercially on January 1, 2021 after the FSRU was commissioned and overall LNG terminal infrastructure activities took place in December 2020. Its full storage capacity is booked for the next three years, with 84% booked until 2027.
The terminal uses a permanently moored FSRU, LNG Croatia, with a maximum yearly sendout capacity of 2.6 bcm. The facility enables natural gas to be delivered to the Croatian national transmission network, connected with Hungary, Slovenia, and Italy, as well as with other non-EU member states like Serbia and Montenegro.
In May 2021, Croatia’s first LNG import terminal, located on the island of Krk, completed its first small-scale reloading operation.
● Nusantara and Lampung FSRU Terminal, Indonesia
[Figure 4-18] Nusantara and Lampung FSRU Terminal, Indonesia
Note: Nusantara FSRU (left), Lampung FSRU (right). Source: NrgEdge Pte Ltd (2021).
The fifth method entails using an LNG RV or an LNG shuttle re-gasfication vessel (LNG SRV) equipped with facilities that can re-gas while operating like a traditional LNG carrier. There are two techniques: one in which an LNG SRV is moored at sea to send gas to land through an undersea pipeline, and one in which the LNG SRV is moored at a pier to send gas to land. The Neptune project, Northeast Gateway (US), and Hadera Gateway (Israel) belong
16 John Snyder, “Green light for small-scale loadings at FSRU Toscana,” Riviera, October 26, 2020, https://www.rivieramm.com/news-content-hub/news-content-hub/green-light-for-small-scale-loadings-at-fsru-toscana-61415.

251
CHAPTER
04Albania’s N
atural Gas Infrastructure Build-out and Technical Cooperation
to the former, while Teeside GasPort (UK) belongs to the latter.
In addition to the above five cases, new technologies are applied. These are cases with a power generation facility at an FSRU, or a system (Universal Transfer System, UTS) that can directly transfer LNG to land or sea. A UTS reinforces the FSRU’s functions so that various supply methods (e.g., self-regasification, onshore re-gasification, STS transfer, and LNG supply to floating power plants) can be utilized.
- New Technology 1
The first new technology involves using an FSU as an LNG storage tank and building a natural gas power plant (a barge-mounted power plant, or BMPP) via barges at sea. In the post-BMPP stage, natural gas pipelines for a city’s gas supply are built.
[Figure 4-19] FSU and BMPP
LNG Transport LNG Storage Gas Generation
BMPP
Gas Distribution
LNGC FSU
LNG NG Electricity
LNGC FSU BMPP Power Transmission
For Industry
Source: KEEI, 2021.
<Table 4-8> Comparison of FSU and BMPP
Division FSU (National Ship) BMPP (Power Plant) Remarks
Supply Immediately Within 2 YearsSimultaneous
Construction of Power Generation Facilities
Facility Scale 56,000 tons/ship 50 ~ 500MW Supply of LNG 500,000 tons/year
Investment Cost - KRW 500 ~ KRW 500 Billion KRW 1 Billion/MW
Berthing Facility Berthing Facilities Required -
Source: KEEI (2021).

Gas Sector Expansion Strategy for Energy Diversification in Albania
252
[Figure 4-20] LNGC and FSPP
LNG Transport Gas Generation
Gas Distribution
LNGC FSPP
LNG NG Electricity
LNGC FSPP (Electricity) Transmission
(Gas) Industry
Source: KEEI (2021).
- New Technology 2
New technology 2 entails building an offshore gas power plant and an LNG re-gasification facility in a single vessel in an LNG carrier (LNGC; a floating storage power plant, or FSPP), and transmiting power directly to land. It is a system that sends out vaporized gas by connecting a natural gas pipe directly from the FSPP.
[Figure 4-21] LNGC, FSU, and BMPP
LNG Transport LNG Storage Gas Generation
BMPP
Gas Distribution
LNGC FSU
LNG NG Electricity
LNGC FSU BMPP Power Transmission
For Industry
Source: KEEI (2021).

253
CHAPTER
04Albania’s N
atural Gas Infrastructure Build-out and Technical Cooperation
[Figure 4-22] Components
GCU OTSG
FenderManifolds Re-gas Unit
Gas Turbine
Steam Turbine
Electric & InstrumentBuilding
AccommodationBuilding
LNG ContainmentSystem
Compressor& Motor Room Mooring System
Source: KEEI (2021).
<Table 4-9> FSPP Ship Structure
Division FSPP Remarks
Supply Within 30 ~ 3 months -
Facility Scale Storage capacity: 40,000 tons of LNGGeneration capacity: ~ 900MW No commercial use case
Investment Cost KRW 504 billion (based on 300MW) KRW 1.68 billion /MW
Berthing Facility Berthing Facilities Required -
Source: KEEI, 2021.
- Configuration of Supply Facilities
The detailed facility composition of an FSRU for natural gas supply is largely divided into storage facilities (LNG tankers), jetty facilities, piping facilities, and onshore receiving facilities (ORFs).
For storage tanks used in FSRUs, it is common to employ LNGC-based storage technology. Therefore, it is possible to consider a new FSRU and converting an aging LNGC into an FSRU. LNGC-based storage tanks are largely divided into the moss and membrane types. However, the membrane type cannot be used if the sloshing caused by waves is severe.
Recently, the use of FSUs and FSRUs by remodeling aging LNGCs has been increasing worldwide. This method has the advantage of shortening the construction period and reducing costs. The construction period differs depending on the surrounding conditions and the size of the storage facility, but in general, it takes about 4–5 years to build a traditional

Gas Sector Expansion Strategy for Energy Diversification in Albania
254
onshore re-gasification facility, 2–3 years for a new FSRU, and 1–1.5 years for a renovation.
In this study, it is assumed that the LNGC already owned by KGC has been converted into an FSRU; the storage facility size is estimated to be about 150,000 m3, considering the annual consumption of around 836,000 tons.
The appropriate storage facility size is estimated to be about 30 days’ worth of average annual consumption. According to the domestic city gas business law, the minimum amount of storage facility secured for import/export business registration is 30 days of annual and planned consumption (City Gas Business Act Enforcement Decree Article 3 ① No. 2).
The demand for 30 days is estimated at about 69,000 tons, equivalent to about 151,000 m3 in volume. It is assumed that about 1 cargo (65,000 tons) of LNG is consumed uniformly every month. The consumption of 1 cargo per month (65,000 tons) falls short of the estimated annual consumption of 780,000 tons per year.
Re-gasification facility technologies used worldwide are categorized under about 7 technologies; the technologies applied in South Korea are submerged combustion vaporizers (SCVs) and seawater vaporization (open rack vaporizers, or ORVs).
<Table 4-10> Classification and Characteristics of Regasification Facilities
Facility Classification Heat Exchange Method Heat Source
Submerged Combustion Vaporiser (SCV) Combustion Gas combustion
Open Rack Vaporiser (ORV) Direct Seawater
Ambient Air Vaporizers (AAV) Direct Air
Shell and Tube Vaporisers (STV) Direct or indirect Seawater or air
Intermediate Fluid Vaporiser (IFV) Indirect Intermediate Fluid +seawater
Intermediate Fluid Ambient Air Vaporizers (IFAAV) Indirect Intermediate Fluid +air
Reverse Cooling Tower (RCT) Indirect Intermediate Fluid +air
Source: Delloitte (2016).
The combustion type vaporizer is used when there is a restriction on the use of a seawater vaporizer in the winter at an LNG receiving base located in the West Sea region of South Korea. The combustion of fuel gas is used as a heat source, and is primarily employed when seawater or air cannot be harnessed as a heat source due to the low ambient temperature.

255
CHAPTER
04Albania’s N
atural Gas Infrastructure Build-out and Technical Cooperation
Although it is possible to employ a seawater type vaporizer, a combustion opportunist is used as an auxiliary means for re-gasification in winter. OPEX is high, but relatively low CAPEX is required, and the efficiency is high since almost all (about 98%) of the gas heat is utilized.
In the case of a seawater vaporizer, it is applied to all LNG receiving bases in South Korea. In particular, the ORV is used exclusively in the East Sea area (Samcheok) and the southeast region (Tongyeong) where the seawater temperature does not drop rapidly in winter.
The ORV gasification plant is a relatively simple but robust technology that induces re-gasification by moving seawater over open aluminum panels on which the LNG moves. ORV has the advantages of a small equipment area, low OPEX, and high reliability.
However, there is a risk of seawater contamination, and periodic shutdowns are required for facility maintenance (re-coating). In the case of the port, it is expected that a seawater type vaporizer can be applied as it is located in the East Sea area. In the case of FSRUs, re-gasification facilities are included in the upper part of the ship; storage and re-gasification facilities are also included in the calculation of costs. As shown in the figure, onboard facilities encompass storage facilities and seawater pumps for use of seawater type vaporizers. It is assumed that the maximum vaporization transmission capacity is more than 130 tons per hour. Changes occur in the investment cost according to vaporization transmission capacity. The size of the re-gasification facility is assumed to increase in proportion to the size of the storage facility; the FSRU storage tank, hull, and re-gasification facility are all included without calculating a separate expense for the FSRU re-gasification facility.
[Figure 4-23] Structure of FSRU Superstructure
REGASIFICATION TRAINSTRANSFORMING LNGAT-160 CELSIUS TO GASAT HIGH PRESSURE
STORAGE TANKS LOADING ARMSFOR RECEIVING LNG
EXPORT MANIFOLD
SEAWATER PUMPS FORPUMPING SEAWATER TOREGAS TRAINS IN ORDER TOHEAT UP THE LNG
Source: RBN Energy LLC (2021).

Gas Sector Expansion Strategy for Energy Diversification in Albania
256
To implement an FSRU project, it is necessary to reinforce the jetty to build berthing and mooring facilities and natural gas transport pipelines. The jetty should be designed to support stable mooring of the FSRU and horizontal berthing of the LNGC and FSRU for LNG unloading. It is necessary to build a pipeline to transport natural gas to the power plant, and it is assumed that the site of the power plant is farmland about 5.4 km away from the port of the relevant area.
Natural gas, vaporized from the FSRU, is transported to the onshore receiving facility (ORF) for a stable supply to the land through the offshore jetty and onshore pipeline network. The general composition of the ORF is the inlet ESD valve station, pig receiver, filter skid, pressure let down skid, high integrity pressure protection system (HIPPS), metering skid, and outlet ESD valve station. The individual functions are as follows.
- Inlet ESD Valve Station: The ESD valve, operated by the fire and gas/ESD system, separates the pipe network from the ORF in case a fire occurs in the ORF.
- Pipeline inspection gauge (PIG) receiver: The PIG is injected into the direction of the gas flow from the starting point of the pipe network for maintenance and repair of the onshore pipe network, and comes out at the opposite end of the pipe network. At this time, a pig receiver is used to receive the PIG.
- Filter skid: This is continuously operated during the initial supply phase after the initial gas supply, and removes particles that can damage the ORF, such as the flow meter. The filter skid is separated after a few days of initial gas supply and can continue its role through a bypass.
- Pressure let down skid: This serves to lower the tip pressure according to the required pressure of the power plant. It requires two 100% pressure let down stations for high efficiency.
- HIPPS: This system increases stability when two or more of the three pressure transmitters send overpressure signals in the pipe network. If there is overpressure in the gas pipeline, the shut-off valve operates to protect the equipment and pipeline in the lower stage from overpressure.
- Metering skid: A gas measurement system is required to determine the sendout and usage of gas more accurately, which can facilitate the measurement of gas usage in all directions and design for future expansion.
- Outlet ESD valve station: This serves to separate the ORF from the power plant in case of a fire or excessive pressure in the gas pipe network within the ORF.

257
CHAPTER
04Albania’s N
atural Gas Infrastructure Build-out and Technical Cooperation
4.1.2.3. FSRU Installation Background
The initial FSRU project was promoted as an alternative to the flexible LNG re-gasification project, such as solving the NIMBY (“not in my backyard”) phenomenon, participating in the gas trading market, and responding to seasonal demand patterns. The world’s first FSRU (Gulf Gateway), installed in the eastern part of the US in March 2005, is a floating import terminal using an LNG RV. It was created to solve the difficulty of constructing an onshore LNG import terminal (the NIMBY phenomenon).
Since mid-2006, North East Gateway in the US and Teesside Gasport in the UK have used floating re-gasification facilities to participate in the highly liquid gas trading market. In 2007, the FSRU project (transporter retrofit) agreed upon between Golar LNG and Petrobras of Brazil was used to respond to seasonal demand, and also as a short-term response to supply shortages.
The Bahia Blanca project, promoted by Excelerate Energy in Argentina in 2008, is considered the first initiative to take into account the advantages of an FSRU project, such as lower investment costs, a shorter construction period, environmental benefits, and the resolution of difficulties in land terminal construction compared to onshore terminals.
4.1.2.4. Advantages of FSRUs
• Reductions in Initial Investment Costs
One of the growth drivers of the FSRU sector is that the initial investment cost is lower than that of an onshore terminal. The fact that an FSRU can be used as an alternative method (transport ship) is also an economic advantage. The recently ordered 170,000 m3 of FSRU construction is estimated to cost between $250 million and $300 million. The expense of converting a ship formerly used for transport to an FSRU is estimated to be between $85 million and $150 million. The period required to build a new vessel is about 36 months, whereas the period needed to remodel a vessel is estimated to be about 18 months.
In addition to ship remodelling or new construction costs, it is necessary to build offshore/land infrastructure, which is estimated to cost between $5 million and $10 million, but may vary depending on subsea pipeline construction, dredging, and tugboat and financing conditions. Even including the cost of ancillary facilities, the expense is lower than the construction cost of an onshore terminal of a similar size (about $500 million to $1 billion).

Gas Sector Expansion Strategy for Energy Diversification in Albania
258
Since a ship is built based on a contract, there is little risk of the construction cost exceeding the planned expenses, and when the terminal usage rate is low, the ship can be employed as an LNG carrier. In addition, since an FSRU is used through a charter method, major energy companies that can secure low-cost capital will be in charge of installation and operation, so that there is no initial investment cost. It becomes possible to procure natural gas.
• Shorter Construction Lead Time
Due to the difficulty of securing the economic feasibility of onshore terminals, operators who cannot enter the gas market can do so by importing LNG in a short period of time. If there is no need to build ancillary facilities such as piers, it takes 1–3 years to convert an existing ship into an FSRU or to build a new FSRU.
• The Diversification of Gas Supply Sources
FSRU (Klaipeda LNG) projects in Eastern European countries such as Lithuania are known to respond to the supply uncertainty of pipeline gas.
• The NIMBY Response
FSRU projects can help solve the NIMBY phenomenon related to the construction of land terminals. If the port facilities necessary for mooring and unloading an FSRU are in place, it is less likely to face problems such as installation-related complaints or permit delays. On the one hand, the risks associated with construction can be minimized because there is no need to purchase or move materials related to building the FSRU. In addition, an FSRU can be relocated to another area, so it can flexibly respond to the decline in facility usage.
4.1.2.5. Weaknesses of FSRUs
• Requires Prior Inspection of Appropriate Size
It is possible to provide a storage space of 263,000 m3, which is Qmax, but this is only possible if specifically ordered. A standard-sized FSRU is suitable for projects that supply the natural gas needed to generate electricity in power plants with a combined cycle of 800–1,000 MW.

259
CHAPTER
04Albania’s N
atural Gas Infrastructure Build-out and Technical Cooperation
• Limitation of Capacity Expansion
Unlike land terminals, an FSRU is composed of units built in shipyards according to general industry standards in terms of storage and capacity, so capacity expansion after completion is difficult. Storage shortages can be mitigated by adding FSUs.
However, the re-gasification capacity must be replaced by the capacity of the FSRU itself, and it is necessary to remodel it in the shipyard. Dubai Explorer uses three FSRUs.
• Storage Capacity Constraint Problem According to Transport Capacity
In general, an FSRU storage capacity of 135,000–173,000 m3 does not provide sufficient buffer storage space necessary for the unloading of 173,000 m3 class transport ships. Accordingly, if the usage rate is low, demurrage costs may occur due to the LNG carrier having to wait.
• Climate and the Environment
FSRUs in open water are sensitive to conditions affecting LNG transmission or gas pipeline connections. This requires consideration of climatic and environmental factors when determining whether an FSRU is a viable alternative to land terminals.
• The Effects of Hiring Local Manpower and Economic Imposition
Since an FSRU is built at an overseas shipyard, it might not help create local jobs or added value.
• Correction Control Problem
There is a disadvantage in that an FSRU cannot accommodate LNG of various components. Although it is possible to adjust the calorific value of gases (such as nitrogen co-firing) by expanding auxiliary facilities (calorific value control facilities), the FSRU terminal has limitations in using calorific value control facilities.
4.1.2.6. FSRU Project Trend:
• The Trend of Import Terminal Businesses Using FSRUs
As of the end of 2020, there are 32 FSRU terminals in operation, but 25 facilities have

Gas Sector Expansion Strategy for Energy Diversification in Albania
260
actually introduced LNG. There are 10 projects under construction, and 21 proposed projects are expected to be promoted by 2030.
As of 2020, there are 25 LNG importing countries that only use onshore terminals, and 13 importing countries that only use FSRUs. Seven countries use both facilities. As of the end of 2020, the re-gasification capacity of the FSRU projects in operation is about 96.5 million tons/year, which is about 18% of total re-gasification capacity.
Given the capacity under construction, the FSRU re-gasification capacity is expected to increase by 58.3 million tons/year from 2021–2025. Accordingly, in 2025, about 20% of the total re-gasification capacity is expected to be the re-gasification capacity of FSRUs (1.73 billion). It is expected that 14 countries, including Croatia and Ghana, will import LNG for the first time from 2021–2025 using an FSRU terminal.
As of 2020, the amount of LNG imported to FSRU terminals is 38.5 million tons, accounting for 11% of total trade volume. Imports were stagnant compared to the previous year, presumably due to the impact of Covid-19.
LNG imports through FSRUs have been stagnant since 2017 due to fluctuations in import volume by region. In other words, imports from the Middle East (UAE) and North Africa (Egypt) decreased, while imports from West Asia and Europe increased.
South America and the Middle East account for a high proportion of total imports. Asia is a region with a large capacity of land terminals, and the share of imports of FSRUs is less than 6%.
The usage rate of floating terminals varies greatly by region, depending on the terminals’ technical traits and demand patterns. In South Asia (Pakistan and Bangladesh), which imports LNG as fuel for power generation, the usage rate is approaching 70%. However, in East Asia, there were no LNG imports through FSRUs in 2020, as demand for FSRUs fell due to the operation of the land terminal in Tianjin, China. In the Middle East, where floating terminals are used to meet demand for natural gas for power generation in the summer, the average annual usage rate exceeds 45%. Unlike North America, where imports have become stagnant due to increased surplus LNG absorption, FSRU usage in Europe rose to about 35% in 2020. In the past, Argentina’s winter (summer in the Northern Hemisphere) heating demand and Brazil’s demand for power generation led to an increase in the usage rate, but as the region’s natural gas supply capacity expanded, the usage rate of FSRUs declined significantly.

261
CHAPTER
04Albania’s N
atural Gas Infrastructure Build-out and Technical Cooperation
[Figure 4-24] FRSU Income Trend
0
12
24
36
48
0
4
8
12
16%
MTP
A
FSRU
Impo
rt/T
otal
Tra
de
2011 2012 2013 20142010 2015 2016 2017 2018 2019 2020
EuropeAsia
North AmericaSouth America
Middle East & North AfricaFSRU import ratio (right)
5% 5%6%
7%8%
11%
13%12%
10% 11% 11%
Source: IHS Markit (2021).
As of the end of 2020, the number of proposed FSRU projects is estimated to be 21. There are 4 locations each in South America and Africa, and 3 locations each in the Middle East and South Asia. In addition, Europe (2), Southeast Asia (2), East Asia, North America, and Oceania have one each.
[Figure 4-25] Floating Regasification Terminal Installation Trend
No.
of P
roje
ct
0
20
40
60
80
100
120
All
Prop
osed
Unde
rco
nstr
uctio
n
Exist
ing
Exist
ing
(no
perm
anen
tFS
RU)
Deco
m-
miss
ione
d
112 67
1024
83
No.
of P
roje
ct
SouthAmerica
NorthAmerica
Europe Sub-SaharanAfrica
MENA SouthAsia
SoutheastAsia
EastAsia
Oceania
Existing (no permanent FSRU)Under construction
ExistingDecommissioned
Proposed
0
16
24
32
8
Note: Existing (not permanent) FSRUs: FSRUs that are not used on a regular basis were imported using FSRUs in the past. It is still possible to import LNG using FSRUs, but with regular FSRUs. This applies to cases where LNG is not imported.
Source: IHS Markit (2021).

Gas Sector Expansion Strategy for Energy Diversification in Albania
262
<Table 4-11> FSRU Project Status (As of the End of 2020)
Project Name CountryVolume(Million
Tons/year)Ship Form Year of
Operation Related Ships, etc.
Pecem Brazil 1.9 FSRU 2009 Experience / Golar Winter
Mina al-Ahmadi Kuwait 5.8 FSRU 2009 Golar Igloo
Dubai United Arab Emirates 6.0 FSRU 2010 Explorer
Escobar Argentina 3.8 FSRU 2011 Expedient
Nusantara Indonesia 3.8 FSRU 2012 Nusantara Regas Satu
Hadera Gateway Israel 1.8 LNG SRV 2013 Excelsior
Tianjin (PipeChina Offshore) China (Mainland) 2.2 FSRU 2013 Hoegh Esperanza
FSRU Toscana Italy 2.7 FSRU 2013 FSRU Toscana
Lampung Indonesia 1.8 FSRU 2014 PGN FSRU Lampung
Klaipeda Lithuania 3.0 FSRU 2014 Independence
Bahia Brazil 5.3 FSRU 2014 Experience / Golar Winter
Elengy Pakistan 4.8 FSRU 2015 Exquisite / Excelerate Sequoia
Aqaba Jordan 3.8 FSRU 2015 Golar Eskimo
Tanjung Benoa Indonesia 0.4 FSRU 2016 Karunia Dewata
Abu Dhabi United Arab Emirates 3.8 FSRU 2016 Express
Cartagena (Colombia) Colombia 3.0 FSRU 2016 Hoegh Grace
Etki Turkey 7.4 FSRU 2017 Turquoise P
Sumed BW Egypt 5.7 FSRU 2017 BW Singapore
PGPC Port Qasim Pakistan 5.7 FSRU 2017 BW Integrity
Dortyol Turkey 4.1 FSRU 2018 Ertugrul Gazi
Moheshkhali (Petrobangla) Bangladesh 3.8 FSRU 2018 Excellence
Old Harbour Jamaica 3.6 FSRU 2019 Golar Freeze
Moheshkhali (Summit) Bangladesh 3.8 FSRU 2019 Summit LNG
Kaliningrad Russia 3.5 FSRU 2019 Marshal Vasilevskiy
Sergipe Brazil 5.6 FSRU 2020 Golar Nanook
FSRU Amurang Indonesia 0.1 Floating Power 2020 Hua Xiang 8

263
CHAPTER
04Albania’s N
atural Gas Infrastructure Build-out and Technical Cooperation
Project Name CountryVolume(Million
Tons/year)Ship Form Year of
Operation Related Ships, etc.
Krk Croatia 1.9 FSRU 2021 LNG Croatia
Port of Acu Brazil 5.6 FSRU 2021 BW Magna
Jaigarh India 6.0 FSRU 2021 Hoegh Giant
GNPC Tema Ghana 1.7FSU/
floating regas2)
2021 Torman (FRU)
Dakar Senegal 1.8 FSRU 2021 Karmol LNGT Powership Africa
Jawa Satu Indonesia 2.4 FSRU 2022 Jawa Satu
Jafrabad LNG Port India 5.0 FSRU 2022 Vasant 1
Vasilikos Cyprus 0.7 FSRU 2022 ETYFA Prometheas
Hong Kong Offshore Hong Kong 4.0 FSRU 2022 MOL FSRU Challenger
Energia del Pacifico El Salvador 2.1 FSRU 2022 BW Tatiana
Nacala Mozambique 1.8 FSRU 2023 Karmol LNGT Powership Asia
Notes: (1) Shaded areas are projects under construction or in progress. (2) Floating storage and floating re-gasification facilities are installed at sea, and the vaporized gas is sent to land through a submarine pipeline.
Source: IHS Markit (2021).
[Figure 4-26] Floating Terminal Facility Capacity Trend(Unit: MTPA)
0
50
100
150
200
2007 2009 2011 20132005 2015 2017 2019 20232021 20272025 2029
Proposed ProjectsExisting Projects
Under-construction ProjectsExisting (No Permanent FSRU) Projects
Decommissioned Projects
Source: IHS Markit (2021).
<Table 4-11> Continued

Gas Sector Expansion Strategy for Energy Diversification in Albania
264
4.1.2.7. FSRU Vessel Trend
At the end of 2020, a total of 45 ships could be put toward FSRU projects worldwide: 33 for floating re-gasification terminal businesses, 8 modified vessels, 3 small vessels, and 1 FSU.
● New Vessels in 2020
Excelerate Sequoia (which replaced Exquisite in Elengy, Pakistan), Vasant 1 (used at Jafrabad LNG port in India), Jawa Satu (Jawa Satu in Indonesia), LNG Croatia (a modified FSRU used at Krk in Croatia), and 4 FSRU vessels joined in 2020. One small refurbished FSRU, Hua Xiang 8 (FSRU Amurang terminal, Indonesia) and a small FRU Torman (to be used at GNPC Tema in Ghana) were also delivered in 2020.
By the end of 2021, one FSRU using a new vessel and three FSRUs using an existing vessel will also be provided. If all ships are completed as scheduled, the number of ships that can be put toward FSRU projects by the end of 2021 is expected to rise to 49 (34 newly built ones, 11 modified ones, 3 small ones, and 1 FRU).
The new FSRU Ertugrul Gazi (replacing the MOL FSRU Challenger in Dortyol, Turkey) and the converted FSRU Karmol LNGT Powership Africa (to be used in Dakar, Senegal) are expected to be available in Q1 2021.
[Figure 4-27] Trend of FSRU Ships
Num
ber o
f FSR
US
0
8
6
4
2
2005
2006
2007
2008
2009
2010
2011
2012
2013
2014
2015
2016
2017
2018
2019
2020
2021
2022
Num
ber o
f FSR
US
0
60
45
30
15
2005
2006
2007
2008
2009
2010
2011
2012
2013
2014
2015
2016
2017
2018
2019
2020
2021
2022
FSRU (purpose-built)Converted FSRUSmall-scale / FRU
Note: FSUs, SRVs included, 2021 and 2022 ships are included.Source: IHS Markit (2021).

265
CHAPTER
04Albania’s N
atural Gas Infrastructure Build-out and Technical Cooperation
After the delivery of the 138,000 m3 class ships Excelsior and Excellence in 2005, the number of FSRU ships showed a trend of ups and downs until 2016. The number of ships increased especially during 2009 and 2014, but in other years, the number rose by one or two. Thanks to changes in the international LNG market, the number of FSRU vessels grew significantly from 2017–2020.
Along with the increase in the delivery of new ships, the number of available ships is expanding due to the expiration of the FSRU contract period. Currently, about 11–12 ships are available as FSRUs; these ships are either put into the transport market or are in layup.
Of the 32 existing terminals with a track record of using FSRUs, 25 ports that can import LNG through FSRUs imported LNG in the first quarter of 2020 or 2021.
As of April 2021, out of 45 available FSRU ships, 30~31 have been put into the import terminal; the rest are being used as transporters, waiting partners, or are not chartered. Vessels due for delivery in 2021 are already linked to specific projects, but some of these projects will probably not be operational until 2022 due to downstream infrastructure or demand issues.
Most of the FSRU vessels that are not connected to LNG import projects are transport vessels, and are operated as short-term charter vessels. This means that there is not enough demand for FSRU charters. There was an incentive to put ships into the transport market due to the rise in charter rates during the winter season of 2020–2021, but FSRU operators prefer to use them as import terminals in the form of long-term charters, rather than the short-term transport market. In particular, it is estimated that surplus FSRU vessels will face short-term competition at a time when an excess of carrier capacity is expected.
Regarding the S&D environment of FSRUs, the period required for installation and operation is brief. There are alternative uses (transporters); the fluctuations in the charter fees of LNG carriers are severe, as well as changes in ships’ contract and order status.
Although the FSRU market is expected to expand in the future, some projects have been delayed or canceled due to lack of demand or difficulties in securing terminals.
In March 2021, the construction of the Crib Point terminal (Victoria, Australia) was not approved due to environmental concerns, and ExxonMobil abandoned its Energas LNG terminal project in Pakistan in October 2020 due to demand-securing issues.

Gas Sector Expansion Strategy for Energy Diversification in Albania
266
Brazil’s Sergipe terminal went into operation in 2020 after a one-year delay, and the first FSRU in El Salvador was postponed until mid-2022 due to the delay in the completion of auxiliary facilities. Bangladesh began importing LNG via FSRUs in April 2018, and the second FSRU went into commercial operation in 2019. However, the Bangladeshi government has announced a plan to build an onshore terminal, rather than a floating type in the future, in light of the harsh climate and marine environment.
India’s H-Energy’s Jaigarh FSRU is expected to begin operating in 2021 following delays due to commercial and technical issues related to the construction of the connecting pipeline. India’s Jafrabad LNG port terminal has also suspended operations due to Covid-19 and the poor climate, and the FSRU Vasant 1, to be put into operation, was delivered long before the terminal started running again.
4.1.2.8. FSRU Operator Trends
Major operators of FSRU projects include Golar LNG, Hoegh LNG, and Excelerate Energy, which are companies engaged in the LNG carrier sector. Businesses that have recently entered the market include BW Gas, Mitsui OSK Lines (MOL), and Maran Gas Maritime.
● Excelerate Energy
As the first company to apply the FSRU concept, it manages 9 FSRUs (8 have been installed and operated, and 1 has been licensed) as FSRUs or LNG tanks.
● New Fortress Energy
This company acquired FSRUs from Norway’s Golar LNG and operates 7 FSRUs. New Fortress Energy acquired seven FSRUs (one from Hygo and six from Golar LNG’s partner) in April 2021 to strengthen its position as a gas and power supplier. Golar LNG retains control of the Golar Tundra (used as a transport vessel).
New Fortress Energy is mainly pursuing LNG and power projects in the Americas, and is already participating in LNG marketing and power projects in Jamaica and Puerto Rico, as well as projects under development in Mexico and Nicaragua. Built in 2018, the Golar Nanook is located at the Sergipe terminal in Brazil and has been operational since 2020.
● Hoegh LNG
The Norwegian company Hoegh LNG owns 10 FSRUs, two of which are part of a joint

267
CHAPTER
04Albania’s N
atural Gas Infrastructure Build-out and Technical Cooperation
venture partnership involving Mitsui OSK Lines (MOL) and Tokyo LNG Tanker. Like Excelerate Energy, Hoegh LNG was considered to enter the floating liquefaction business, but withdrew and is focusing on FSRU and LNG carrier businesses.
Höegh LNG has secured four new FSRUs in the past three years. Currently, there are 5 FSRU terminals in operation. The other five are being used as transport ships. With a re-gasification capacity of 7.5 MMtpa and a storage capacity of 170,000 m3, Höegh Giant (2017) is the largest FSRU in the world and the first FSRU in India (April 2021).
Höegh Esperanza (2018) was installed at the Tianjin terminal in mainland China during the peak winter season, and serves as a traditional transport vessel during the rest of the year. The company’s most recent FSRU, the Höegh Galleon (2019), is currently chartered to Cheniere and traded as a regular tanker.
● BW Gas
BW Gas is a Norwegian company, one of the FPSO operators, and has 25 years of experience. It operates 17 LNG carriers and has 4 FSRUs. Of the four FSRUs, three are being used at import terminals in Egypt, Pakistan, and Brazil, and one (BW Paris, a modified vessel) is being used for transport.
[Figure 4-28] Number of FSRU Ship Ownership by Operator
# of
FSR
US
0
60
45
30
15
2005
2006
2007
2008
2009
2010
2011
2012
2013
2014
2015
2016
2017
2018
2019
2020
2021
2022
Excelerate Energy New Fortress Energy Hoegh LNG BW LNG Other
Note: Hoegh LNG includes two vessels owned by MOL/Tokyo LNG Tanker/Hoegh LNG; others include 19 operators, including Golar LNG.
Source : IHS Markit (2021).
● MOL
MOL is a Japanese shipping company that carries out maritime transportation business.

Gas Sector Expansion Strategy for Energy Diversification in Albania
268
It operates 18 LNG carriers and has one FSRU (Punta de Sayago, Uruguay). The project is the largest FSRU facility using Qmax LNG carriers, with a storage capacity of 263,000m3.
KARMOL, a joint venture between Karpowership and MOL, will secure a converted FSRU, Karmol LNGT Powership Africa, in early 2021, which will be used in cooperation with the Senegalese powership. A similar model, the Karmol LNGT Powership Asia, currently under construction, will be used with a Mozambique-powered ship.
4.1.2.9. Treatment Costs Compared to Land Base
● The Cost of Capital
The capital cost of new FSRU-based terminals is estimated to be about 60% of that of land terminals. It is predicted that an onshore terminal with a capacity of 180,000m3 and a storage tank with an annual processing capacity of 3 million tons will cost $700–$800 million, although there are some differences, depending on the difference in labor cost by region. A similar capacity of the facility’s FSRU capital cost is 4~5, and the money already spent is estimated to be $100 million.
<Table 4-12> Capacity Comparison for Land Terminal and FSRU(Unit: Million dollars)
ComponentAnnual Processing Capacity of 3 Million Tons and Storage
Capacity of 180,000m3 (liquid cp)
Land terminal FSRU (New)
Berthing facilities including pipelines 80 80
Unloading line 100 -
Storage tank 180,000m3 180 in FSRU
FSRU ships - 250
Processing plant 100 in FSRU
Utilities 60 in FSRU
Land connection/infrastructure - 30
Capital cost 520 360
Reserve Athletics: 30%. FSRU: 10% 156 36
Overhead cost 74 54
Total cost of capital 750 450
Source: Songhurst (2017).

269
CHAPTER
04Albania’s N
atural Gas Infrastructure Build-out and Technical Cooperation
● Vessel Cost
It is possible to secure the necessary FSRU vessels through new construction or modification of existing LNG carriers.
● New Construction Purchase Costs
The price of an FSRU vessel with a tank capacity of 173,000 m3 and a vaporization capacity of 6 MTPA is currently estimated to be in the range of $2.4–$280 million.
● A Renovated Ship Purchase
This cost is estimated to be $230 million, including $150 million for the purchase of used transport and $80 million for remodeling. It is similar to the cost of a newly built FSRU, but it takes 36 months to secure a newly built vessel, while it takes 18 months to secure a retrofitted one. Further, the price of a used carrier is variable.
When FSRUs were first introduced, modified ships were preferred, but there has been a recent preference for new ships because the tank capacity of a used ship (130,000–140,000m3) is smaller than that of a newly built FSRU (173,000m3).
● Infrastructure Cost
This consists of the cost of securing inland-linked facilities and the cost of building offshore berthing facilities.
● Land-Linked Infrastructure
Coastal infrastructure consists of quay structures for ship mooring, the transport of LNG from supply tanks, and piping systems required to connect re-gasified LNG to customers or gas networks. The investment cost varies according to the need for infrastructure construction required to secure the connected facilities. In general, it is estimated that the investment cost of land-linked infrastructure is about $50–100 million. When a new port is built or a breakwater needs to be secured, the investment cost rises significantly. In addition, the investment cost may increase in proportion to the extension of the connecting pipe.

Gas Sector Expansion Strategy for Energy Diversification in Albania
270
● Marine Facilities
The ship’s cost is associated with the construction of the facilities required for mooring. Offshore infrastructure costs are entirely based on location and highly dependent on the length of offshore and onshore pipelines required to connect to the customer or gas network.
● The Owner’s Cost
Overhead expenses refer to the costs of providing operational and support services for the project team, which manages and oversees all aspects of the project, both technically and commercially, from project initiation to start-up.
This amount encompasses all professional technical contractors and consultants involved in the final investment decision (i.e., in all stages of work, including a feasibility study, conceptual design, and environmental impact assessment). It also includes the cost of contract preparation (i.e., the cost of preparatory work, such as project scope and material procurement, LNG supply and gas sales contracts, project financing, and government and other permitting tasks).
● Operating Costs
Operational costs include wages paid to personnel who work on ships or onshore facilities, the administrative expenses of headquarters to support operations, fuel use costs for power and heat production, maintenance and inspection, and consumables costs (spare parts, chemical and lubricating oil, etc.), insurance, port usage fees, vessel usage fees for towing an LNG carrier, service boats for FSRUs at sea, dredging facilities, and financial costs.
Boil-off gas can be used as fuel gas to vaporize LNG. Since this is the gas buyer’s gas, post-payment is required. When using the rental method, financial expenses are usually included in the rate. There is a separate cost item for FSRUs that are directly owned by the terminal operator and purchased through a loan.
● A Comparison with Land Import Terminals
- Charter CostThe FSRU leasing charge is based on a daily rate calculated to enable recovery of the vessel’s capital cost, interest cost, and other expenses borne by the vessel owner.

271
CHAPTER
04Albania’s N
atural Gas Infrastructure Build-out and Technical Cooperation
<Table 4-13> Comparison between Onshore Terminal, FSRU and Covered FSRUs(Unit: Million dollars)
Division Onshore Terminal New-Build FSRU Covered FSRUs
Capacity (MTPA) 3.0 3.0 2.5
Maneuver Rate 50% 50% 50%
Conversion Factor (MMBtu/ton) 52.0 52.0 52.0
Annual Throughput (MTPA) 1.50 1.50 1.25
Berth with Pipeline 80.0 80.0 80.0
Unloading Lines 100.0 - -
Storage Facility (180,000m3) 180.0 - -
FSRU Ships - 250.0 165.0
Processing Facility 100.0 - -
Utilities 60.0 - -
Onshore Treatment Facility - 30.0 30.0
Capital Cost 520.0 360.0 275.0
Reserve 156.0 36.0 27.5
Overhead 78.0 54.0 41.3
Total Investment 754.0 450.0 343.8
Discount Rate 8.0% 8.0% 8.0%
Project Period (year) 20 20 20
CRF 0.10185 0.10185 0.10185
Variable Ratio 2.50% 1.22% 1.70%
Annualized CAPEX 76.8 45.8 35.0
Annualized OPEX 15.1 5.5 5.8
Total Annual Cost 91.9 51.3 40.9
Daily Cost (US$/day) 251,717 140,612 111,933
Cost per Unit (US$/MMBtu) 1.18 0.66 0.63
Source: APEC Energy Working Group (2020).

Gas Sector Expansion Strategy for Energy Diversification in Albania
272
- Estimated CostAccording to the 2013 USAID data of the USAID Energy Policy Program, the FSRU Tariff Paper, the rental rate is usually between $110,000 and $160,000/day (based on 170,000m3).The operating cost is US $20~$45,000/day; the total is estimated to be US $130,000~$205,000/day. Assuming a load factor of 50%, an operating cost of 2.5%/year of capital expenses, a discount rate of 10%, and a payback period of 10 years, the usage fee is estimated to be US $0.60∼$0.94/MMBtu.
- Performance CostThe usage fee of the Puerto Rico FSRU Aguirre terminal in 2014 was US $0.47/MMBtu, and the usage fee of the Bangladesh terminal in 2013 was US $0.45~0.47/MMBtu.
- FSRU Estimated CostsIt is estimated that the FSRU rental cost does not include expenses related to developing the terminal and connecting with the local pipeline network. Hence, reflecting these costs and assuming that the usage rate is 50%, the actual usage fee is estimated to exceed US $1.00/MMBtu.
- A Comparison of Costs with Onshore Import TerminalsIt is estimated that the cost of building and operating a standardized onshore terminal (18,000 m3 tank, 3 million tons/year output capacity) is $92 million annually.
However, the annual cost of building and operating an FSRU using a new or modified ship is estimated to be between $41 and $51.3 million. Assuming the terminal investment and operating costs, a discount rate of 8%, a payback period of 20 years, and a usage rate of 50%, the cost per unit of the land terminal is estimated to be US $1.18/MMBtu. However, the cost per unit of FSRU is estimated to be US $0.63/MMBtu for a retrofitted ship, and US $0.66/MMBtu for a newly built one.
These estimated costs are based on a fairly rigid premise. In fact, depending on the conditions of the port, the investment and operating costs of ancillary facilities (other than the vessel rental) may vary. Further, depending on the demand pattern, if the storage facility needs to be built on land or the extension of the subsea pipeline is prolonged, the investment costs may increase significantly.

273
CHAPTER
04Albania’s N
atural Gas Infrastructure Build-out and Technical Cooperation
● Example of an Estimated Performance Cost Review
- Tianjin, China, 2012With an annual processing capacity of 2.2 million tons, the investment cost is $900 million, including investments in connected facilities (US $1.65/MMBtu).
- Uruguay, 2013With an annual processing capacity of 7.3 million tons, the investment cost is $1.125 billion, including onshore storage facilities, and a usage rate of 50% (US $1.25/MMBtu).
- Ukraine, 2014With an annual processing capacity of 3 million tons, the investment cost is $1 billion, including onshore storage facilities and a usage rate of 50% (US $1.20/MMBtu).
- Commercial Use of FSRUsIn general, the business model of LNG import terminals includes a commercial model and a service/tolling model contract. These business models are also applied to FSRUs; the tolling model is the most widely used because it can be implemented by signing a contract with an energy company relatively simply, and provides a rental alternative that fits well with a short-term contract.
As a model applied by Gazprom of Russia to the Kaliningrad FSRU project, there is also a business model that forms a consistent system from the upstream sector to the terminal sector.
- Commercial Transaction ModelAn import terminal developer purchases LNG, re-gasifies it, and sells it to the buyer, who owns the terminal. In the commercial transaction model, the import terminal developer makes a profit from the difference between the purchase price and the sale price of the purchased LNG.
Buyers of natural gas can avoid the risks associated with the construction and operation of facilities and the procurement of natural gas, but the costs associated with purchasing natural gas may increase as they need to compensate for the risks.

Gas Sector Expansion Strategy for Energy Diversification in Albania
274
- Usage Fee ModelThis is a method in which the entity procuring natural gas enters into a usage contract with the terminal owner and uses the import terminal. There are two types of usage fee models.
- A Model Similar to a Traditional Charter ContractThis is a model in which the facility user rents the FSRU, and the charterer is responsible for all other infrastructure costs (such as pipelines and port construction) and pays variable costs (such as port usage fees, and fuel and boil-off gas [BOG]).
- Terminal Usage Contract ModelThis is a way in which the project developer is responsible for FSRUs, variable costs, and all other necessary capital expenses (such as ports or pipelines) required to deliver re-gasified LNG to customers. Recently, the second alternative has been increasing.
In the terminal usage contract model, facility users utilize the terminal according to the terminal usage contract, and usually pay a fee in the form of a two-part rate system (variable rates are linked to appropriate indicators). The entity procuring natural gas does not bear the risks related to building and running the facility, but the entity using the facility bears the risk related to using it (observance of the usage schedule, etc.).
- Contract Term The initial lease period of an FSRU is 10–15 years to ensure that the capital and financial costs of the vessel are recovered during the rental period. According to the analysis of an initial FSRU, 10 years is the minimum lease period. The first 8 years involve recovering capital and financial expenses. The remaining 2 years are the period for securing profits.
Recently, the rental period has diversified from 5–20 years. To meet short-term demand, there are cases where a short contract is signed for the time it takes to procure gas via the terminal building. Such a contract is possible because one can put the utilized FSRU toward an alternative use (LNG transportation).
Recently, FSRU providers have disclosed the contract period in order to provide a time when ships that can be used as FSRUs can be put into service.

275
CHAPTER
04Albania’s N
atural Gas Infrastructure Build-out and Technical Cooperation
4.1.2.10 The FSRU Promotion Phase
The schedule of an FSRU project consists of three activities: (1) preliminary discussion and feasibility studies, (2) engineering research for project approval, and (3) construction.
- Pre-discussion and Preliminary Feasibility StudyThis is the process of initial discussion and negotiation between various stakeholders such as gas customers, LNG suppliers, possible FSRU suppliers, regional authorities (including port authorities), and project financing, among others.
The discussion aims to verify that the project is feasible, usually ending with a feasibility report, along with actions outlined for next step s. This stage includes preliminary conceptual design work to ensure technical feasibility.
Permits and pre-engineering to achieve project approval (FID) include preparing contracts between stakeholders, developing concepts, locating the exact project location, obtaining the necessary permits, and determining the project budget and schedule (FID) as the basis for project approval. Discussions with the necessary permitting authorities are included to ensure that all required permits for construction and subsequent operation are issued.
- ConstructionThis includes the time it takes to acquire the FSRU vessel and build the infrastructure (i.e., docks and interconnecting gas pipelines). The two activities are independent and can run in parallel. The installation schedules of projects promoted in the past varied from five months 2–3 years.
The FSRU installation schedule will depend on whether the vessel has been released for another project, or whether it is possible to use a new vessel to be delivered from the shipyard. When using a modified ship, it can be carried out within 18 months, but this period can be shortened to 12 months if equipment that takes a long time to manufacture is ordered.
4.1.2.11. Preliminary Survey Requirements for FSRU Projects
There are special matters to be considered for each project, but there are generally major factors to be taken into account when selecting the type of import terminal (FSRU or land terminal).

Gas Sector Expansion Strategy for Energy Diversification in Albania
276
- Short-Term Demand From the MarketIt is necessary to check whether the rent is cheaper than the sunk cost, and whether the market is feasible to put the FSRU toward an alternative use.
- When a Supply of Gas is Required within a Short Period of TimeSince the construction period of land terminals is about 3– 5 years, it is possible to supply gas after a considerable period of time has elapsed.
- Situations Requiring Less than 6 Million tons of Capacity Per YearNormally, FSRUs have a re-gasification capacity of 3 MMTPA. Two FSRUs may be required when demand exceeds 3 MMTPA; this is possible in the short term, but not the long term.
- When Transmission Capacity is Unlikely to IncreaseOnshore facilities are more advantageous to secure additional capacity.
- When Strategic Storage is not RequiredApplication may be considered when a large vessel (e.g., Qmax 266,000 m3) is not required. The reasons for favoring FSRUs over other land terminals are as follows:
- Situations that require a fairly complex and difficult approval process to secure an onshore terminal.
- If dredging is required to anchor in a port, one may need to consider an offshore FSRU (considering that maintenance costs are required for dredging).
- An FSRU can be viewed as an alternative to be used by independent power plants that have difficulty in equipping facilities that require a lot of initial investments due to insufficient financial resources or a poor financial situation.
We should remember that FSRUs project may face licensing problems, as they are not conducive to regional economies.
4.1.2.12. Major Issues Related to FSRU Projects
- The Need to Build an Efficient Value ChainTo successfully implement an FSRU project, securing demand, building the FSRU facility, and ensuring the necessary quantity must be properly linked technically, operationally, and commercially.

277
CHAPTER
04Albania’s N
atural Gas Infrastructure Build-out and Technical Cooperation
In general, FSRU project proponents prefer small, annual LNG purchases for a short period of time, while LNG suppliers prefer long-term, high volume sales. In order for a project to be successful, the gas demand, for which one is willing to pay a reasonable price, must be premised. In addition, after securing the FSRU facility and thoroughly examining supply-related costs, it is necessary to obtain the required amount of LNG at an appropriate cost to guarantee the cost competitiveness of gas.
Although the initial investment cost is low, to lower the re-gasification cost per unit quantity, the lease period (or period of use) of an FSRU must be at least 10 years. If the cost of building a new FSRU (about $250 million) and the cost of ancillary facilities (more than $100 million) are recovered in a short period, the re-gasification unit price will rise significantly.
4.1.2.13. Technical and Operational Issues
FSRUs do not provide operational flexibility, unlike land terminals, in relation to the unloading of LNG loaded on transport vessels. In addition, there may be insufficient capacity to make up for a sharp rise in demand due to abnormal temperatures or delays in the arrival of transport ships. This is why the construction of large-capacity ships is preferred.
It is necessary to have the technical skills to properly respond to safety issues related to the transport of cryogenic gas between ships. Unlike land re-gasification terminals, use is limited to destinations equipped with ancillary facilities that can mix various gases or inject nitrogen. Otherwise, the composition must be adjusted at the point of supply, where the LNG is shipped to meet the composition requirements of the market downstream after the FSRU facility.
There are risks that may follow. FSRU suppliers and operators may enter liquidation. Most operators are major shipping companies with large asset bases. However, some new, small players wish to enter the market and need to check their financial health. There is a threat that the shipyard will be liquidated, which should also be confirmed.
Since the ship was built in a foreign shipyard, there is a risk that the project will not be approved by local authorities due to the low contribution to the local economy. Conversely, land terminals are major civil engineering projects that provide key job opportunities for local businesses in terms of goods, materials, and services.
Such a facility is flexible in nature and can be easily removed, unlike land terminals. This can lead to the perception that a safe gas supply is not provided. This becomes more of a concern for strategic gas supply.

Gas Sector Expansion Strategy for Energy Diversification in Albania
278
The high cost of developing port infrastructure is another possible threat. Most FSRU developments offset costs, as they are located in existing ports or ones that are part of the country’s overall development plan. Ports must be specially built and require major facilities such as breakwaters, which add significant costs and can make a project uneconomical. This is one reason why UAE LNG has canceled its proposed terminal in Fujairah and is looking for other possible locations.
4.2. SSLNG Technical & Economic Assessment
The global LNG sector is moving in a direction that favors SSLNG development. An increasing number of new countries adopting LNG are smaller states whose requirements are better suited by small- scale projects. SSLNG growth within the LNG industry for 2019 was intense. Today the SSLNG segment is between 28 and 30 MTPA, which is approximately 8.5% of the global LNG market.17
<Table 4-14> World SSLNG Market, 2020–2025(Unit: Million tons per year)
Organisation Sector 2020 2025 2030 2035
Internationa Gas Union
Total
30 - - -
Engie - - 75-96 -
PwC - - - -
IEA (New Policies Scenario)
Marine
- 12 19 27
IEA (Sustainable Development
Scenario)- 24 30 36
Engie - - 24-30 -
Engie Land - - 32-40 -
Engie Remote - - 20-25 -
Source: APEC (2019).
When demand centers are located in remote areas, it becomes more costly to lay out pipeline networks. This constitutes an opportunity for SSLNG. Despite its higher supply cost, gas can be supplied using small LNG tankers and LNG trucks to remote areas. Compared with conventional LNG infrastructure, infrastructure development and initial capital investments are shorter and smaller. There is a lower hurdle to introduction, especially
17 Ufm Gas Platform, “An Assessment of Small Scale LNG Applications in the Mediterranean Region,” May 2020, p. 4.

279
CHAPTER
04Albania’s N
atural Gas Infrastructure Build-out and Technical Cooperation
in regions with insufficient capital, even though the investment per unit of supply may be higher.
There are places where the introduction of SSLNG is progressing because of geographic conditions. For example, in economies with many outlying islands, such as Indonesia and the Philippines, electric power is provided by thermal power generation using diesel and other petroleum products, but due to higher demand and deteriorating power generation facilities, there is an opportunity for increasing gas-fired power generation.18
For emerging economies where energy demand is growing fast and there is a need to rapidly develop energy infrastructure, SSLNG can be an effective energy supply option.
4.2.1. The Definition of SSLNG
Liquefaction plants, transportation by ship, and receiving terminals are three elements that have traditionally comprised the LNG chain. However, by increasing gas distribution flexibility and reaching new consumers through small- scale facilities, LNG distribution by truck, and LNG refueling stations, the diversification of LNG is now receiving attention.
The natural gas liquefaction process involves several steps: As shown in the block flow diagram below, the various feed gas pretreatments are followed by liquefaction.
[Figure 4-29] Natural Gas Liquefaction Process
Acid GasRemoval Dehydration Mercury
Removal
Ship/truckLoading Lng Storage Liquefaction
NglExtraction
Carbon Dioxide
Feed Gas
LNG Loading
Water
NGL
Source: APEC (2019).
At the receiving end, facilities have to store the received LNG. Consumers need to reconvert the LNG to gas for use.
18 APEC, “Small-scale LNG in the Asia-Pacific Region,” p. 7.

Gas Sector Expansion Strategy for Energy Diversification in Albania
280
[Figure 4-30] Natural Gas Liquefaction Process at the Receiving End
Ship/Truck
Unloading
LngStorage
Bog Handling
LngVaporization
LngVaporization
LNGUnloading To Grid
Source: APEC (2019).
Supplying LNG satellite stations with annual LNG provided by mini/micro LNG facilities mainly consists of LNG liquefaction plants volumes of up to 0.2 mtpa. These LNG quantities correspond to the yearly LNG demand of up to approximately 100 MW for a power plant. Differing only in scale, the mini-LNG chain is virtually identical to the conventional LNG chain. One difference is that for small gas volumes, rather than large marine carriers, LNG transport is feasible using barges (offshore) or trucks (onshore).
SSLNG refers to the use of LNG directly in its liquefied form, in contrast to the original model of re-gasifying LNG and introducing it into the gas transmission grid. SSLNG is capable of off- grid power generation for the residential and industrial sectors in the remote parts of a country, where traditionally produced LNG cannot be supplied due to the lack of a proper pipeline network.
SSLNG is broadly defined to include mini, micro, and containerized LNG segments, and is centered on serving specific end-use markets including heavy-duty trucking, rail, marine, peak shaving power, and industrial activities. In terms of volume, SSLNG encompasses all plants with capacities lower than 1 MTPA or 100 MMCFD8, while mini- or micro-plants are typically much smaller at less than 0.2 MTPA. Finally, LNG can be shipped in ISO containers, which are typically 10,000 gallons in volume each. Containerized LNG requires finding an application in small industrial plants, farming activities, and road paving, as well as power generation in small, remote communities.19
19 US Department of Energy, “Opportunities for Small Scale LNG in Central & Eastern Europe,” December 2020, p. 11.

281
CHAPTER
04Albania’s N
atural Gas Infrastructure Build-out and Technical Cooperation
[Figure 4-31] Value Chain of Conventional LNG and SSLNG
Barge or Small LNG TankerLNG Truck
Conventional LNG
Small Scale LNG
Liquefaction Plant(Large)
Receiving/RegasTerminal (Large)
Liquefaction Plant(Small)
Receiving/RegasTerminal (Small)
Gas FieldGas Fired Power
Generation(Large)
City Gas Network(Large)
LNG for LandTransportation Fuel
LNG for LandTransportation Fuel
Gas Fired PowerGeneration
(Remote Area)
City Gas Network(Remote)
Source: APEC (2019).
[Figure 4-32] Definition of SSLNG
3-8 1-2 <1 <0.2
0.008-0.022 0.002-0.005 <0.002 <0.001
3-8300-1,000 100-300 <100 <26
4-10 1.4-2.7 <1.4 <0.27
1,875-5,000 625-1,250 <625 <125
5.15-13.70 1.71-342 <1.71 <0.34
16 Tons or 10,000Gallons per Container
Million Tonsper Year
Large-Scale Mid-Scale Small-Scale Mini / Micro Containerized
Million Tonsper Day
Million cu. ft.per Day
Billion cu. m.per Year
Million Gallonsper Year
Million Gallonsper Day
Source: US DoE (2020). p.24.
Factors driving greater adoption of SSLNG activities are as follows:
• The switch from coal- fired power generation to natural gas;• The replacement of diesel gensets in remote areas to cleaner burning fossil fuels; • The replacement of heavy commercial vehicles and public transit systems toward
cleaner burning fuels;

Gas Sector Expansion Strategy for Energy Diversification in Albania
282
• Offshore supply vessels (OSVs), utilities for rig ops (etc.); • Driven by the IMO ruling, all marine vessels plying in the ECA have to comply with
stringent SOx and NOx commitments, and LNG offers the best choice from among other options;
• Driven mainly by air quality and environmental considerations.
4.2.2. Differences between SSLNG and Standard LNG
According to the International Gas Union (IGU) methodology and classification, a liquefaction plant of 1 MTPA size constitutes a standard LNG. SSLNG has been classified primarily by size/limitation criteria. A differentiation between a mid and mini/micro SSLNG scale is also emerging. The definition of SSLNG relates to the size or limitation of the technology and the equipment specifications of the value chain, not in connection to destination market size.
Facilities with a capacity between 0.2 and 1 mtpa are referred to as SSLNG facilities. LNG satellite stations with capacities below 0.2 mtpa and the LNG liquefaction plants are the mini/micro LNG facilities. These mini/micro LNG quantities correspond up to 100 MW to the yearly power plant LNG demand.
As illustrated in the figure below, to capture economies of scale, the LNG industry has historically developed import/export projects of increasing capacity. However, the maturity of the technology now allows for the development of other LNG applications to reach new consumers, which increases gas distribution flexibility, often on a smaller scale.
[Figure 4-33] Standard LNG and SSLNG
Standard LNG Small Scale LNG
Source: World Bank (2015).
With the number of projects in progress set to rise as demand for LNG increases, the business case for the supply of LNG on a small scale is drawing more attention. The concept

283
CHAPTER
04Albania’s N
atural Gas Infrastructure Build-out and Technical Cooperation
of supplying smaller, more remote locations is one that has seen projects attract FIDs for deployment in similar regions like their bigger counterparts.
In technical terms, there is not a huge difference between classing a full scale FSRU and a small- scale unit, although smaller units can be more complex in execution.
For small- scale units, designers need to think more closely about hazards, since there is far less space that can be used for escape routes or blast walls, so comprehensive safety studies are essential.
<Table 4-15> Defining SSLNG and Comparisons with Standard LNGUpstreamLiquefaction
Mid-StreamShipping
Down-StreamRegasification Storage
Standard LNG3-7 MTPA Qmax 244,000 m3
Qflex 220,000 m3
Standard 145,000 m3
1.5 MTPA 1/0,000 m3
Mid/SS-LNG
<1 MTPA 7,500-20,000 m3 0.5-1.2 MTPA
50,000 m3
<10,000 m3
Vacuum Insulated Tanks
>15,000 m3
Flat Bottomed Tanks Preferred
Mini/Micro LNG <3000 TPA Barges/ ISO Containers
760 m3 (bullets) Bullets and ISO Container
Source: Ufm Gas Platform (2020). p.6.
[Figure 4-34] Standard LNG Value Chain
Base LoadPlant
LNGCarrier
ReceivingTerminal
Gas HeatedVaporizer
TransitPipeline
Source: Abdalla Altayeb Abdalla (2015).
For SSLNG projects, a sensible approach to marine infrastructure is crucial as these projects are not able to absorb CAPEX-heavy infrastructure costs. It is critical to pay attention to site selection and not to over-scale the installation, as this will significantly add

Gas Sector Expansion Strategy for Energy Diversification in Albania
284
to the costs and damage project economics. Further, the concept of the project needs to be adapted to the limitations set by LNG suppliers. To mitigate the risks involved, a number of studies are required, such as:
• A conceptual study; • A check on requirements from relevant authorities; • A maneuvering study ; • A mooring study; • A metocean study; • A bathymetric study ; • Navigational studies; and• Off-shore soil investigations.
In order of priority, the below options are suitable for berthing small LNG carriers:
• Berthing at a pier or quay; • Berthing at a jetty; and• Off-shore berthing (or mooring).
4.2.3. SSLNG Technology and the Value Chain
The LNG and SSLNG value chain ranges from the natural gas upstream to the consumption of natural gas by the final end-users. It encompasses the gas upstream, liquefaction, re-gasification, storage, and end-user applications.
[Figure 4-35] LNG Value Chain
1 2 3 4 5Lng Production
or SourcingSupplierLogistics
Transfer andTransportation
CustomerLogistics
LNGUtilization
LNG is produced orsourced from an LNG
import terminal
LNG is stored andmonitored in tanks or
loaded for transfer
LNG is transferred viavessels, trucks, rails,and ISO containers
LNG is received andstored in tanks withsafety equipment
LNG can be used intrucking, marine, or
industrial applications
Source: US DoE (2020). p.52.

285
CHAPTER
04Albania’s N
atural Gas Infrastructure Build-out and Technical Cooperation
[Figure 4-36] SSLNG Value Chain
Base LoadPlant
LngCarrier
ReceivingTerminal
Gas HeatedVaporizer
TransitPipeline
RoadTrailer
Satellite Plant
Satellite Plant
LNG Carrierfor Shore
Navigation
Source: Abdalla Altayeb Abdalla (2015). p.16.
It is first important to understand how the SSLNG value chain is deeply intertwined with the standard LNG supply chain and infrastructure, and how the emergence of LNG bunkering has played a role in “connecting” SSLNG activities with regular LNG supply chains globally.
SSLNG activities connect with the regular LNG supply chain in mid-stream and downstream re-gasification and storage. The SSLNG chain is identical to the standard LNG chain, the main difference being located at the distribution levels where LNG transportation is possible using small marine barges storing small quantities of fuel, ferries carrying LNG trucks, or trucks on land to carry the volumes (as opposed to the use of large LNG carriers in the case of standard LNG).
● LNG Production or Sourcing
LNG, in small volumes, can be produced by liquefying natural gas at small plants, or sourced from large-scale LNG import terminals. SSLNG plants typically need utilities such as power generation or connectivity to a power grid, feedstock and product handling infrastructure, a process steam, instruments and plant air, utility nitrogen, demineralized water, safety equipment, materials (e.g., adsorbents, chemicals, etc.), and personnel accessibility. Further, SSLNG facilities require a harbor, jetty, access roads, water treatment, workforce accommodation, and administrative buildings.

Gas Sector Expansion Strategy for Energy Diversification in Albania
286
LNG is sourced as-is from import terminals that bring LNG in large-scale ships and tankers. Such breakbulk or bunkering— depending on the application— forms of LNG supply are also viable and increasingly feasible as SSLNG demand grows. In addition to commercial and contractual arrangements, such supply of SSLNG volumes is critically dependent on the quality and capabilities of infrastructure available at an LNG import terminal. Not all LNG import terminals offer such services.
Natural gas liquefaction is a process that involves two main steps: (i) the process of feed-gas pretreatment and (ii) the process of actual liquefaction, where the gas is cooled down to -145 to -160 degrees C. When the feed-gas is ready for liquefaction, the processes to be followed in standard LNG and SSLNG are identical. The differences in technology are only a matter of scale. Many of the early SSLNG liquefaction units could simply avoid the aspect of pretreatment if they were fed by a continuous supply of “pipeline quality” gas, which would obviate the onerous pretreatment requirements.
[Figure 4-37] Small Scale Liquefaction Plant in China
Note: Small Scale LNG Liquefaction Plant, the 440 ktpa LNG Plant at Guanghui, China.Source: Ufm Gas Platform (2020). p.13.
The high pressure in pipelines is another technical benefit that SSLNG liquefaction plants could take advantage of when being supplied by pipelines. Liquefaction plants that must be fed at higher pressures could accept this pipeline quality gas compared to associated gas, which is used in the case of standard LNG and requires the necessary pretreatment, as well as additional compression. The important technological development that has shaped the development of SSLNG liquefaction plants is the standardized design of a “pretreatment train” consisting of acid gas removal, dehydration, and mercury removal units. Since many SSLNG liquefaction units are being fed, the liquefaction process that follows can be significantly different in the case of SSLNG. Regarding the post- liquefaction stage, unlike in the case of standard LNG, where the liquefied LNG is stored in large storage tanks at -160

287
CHAPTER
04Albania’s N
atural Gas Infrastructure Build-out and Technical Cooperation
degrees C ready for transfer to a LNG carrier, in the case of SSLNG, the route that is followed may include direct delivery from storage tanks to either trucks or trains.
● Supplier Logistics
The smallest FSRUs today are around 120,000 m3. There are no small LNG carriers available that can be converted to FSRUs. One solution to this problem is to design a barge containing storage tanks (7500–30,000 m3) and re-gasification systems. These can be an attractive alternative to onshore small satellite terminals. Such a barge could be equipped with processes similar to those of the land-based solution. The process can also be split between the barge and land. This can be done, for example, by locating the LNG storage on the barge and process equipment and support facilities onshore.
SSLNG terminals are smaller local terminals with a size of 100–20,000 m3, and are located by the sea shore or along rivers. They are often placed in harbors where there is easy access for supply vessels to fill tanks. Storage is mainly built in the form of bullet tanks. These terminals are not only built as bunkering facilities for ships, but entail additional facilitating distribution of LNG in liquid form. A re-gasification unit supplying a local gas pipeline can be added in larger sizes.
[Figure 4-38] Small Satellite Terminal
Source: Wartsila (2018).

Gas Sector Expansion Strategy for Energy Diversification in Albania
288
[Figure 4-39] Storage and Regasification Barge
Source: Wartsila (2018).
Medium- scale LNG terminals are 20,000–160,000 m3 in size and are located on sea shores; they serve as hubs for entire regions or larger cities. Due to the major investment and volumes involved, a group of industries and consumers are needed to make these projects possible. They are multi-use terminals with flat- bottomed tanks and can include re-gasification, pipeline distribution, ship bunkering, re-loading, and truck and container loading to facilitate re-distribution of LNG in liquid form.
[Figure 4-40] Medium Scale Terminal
Source: Wartsila (2018).
There are two main technology solutions for SSLNG storage: vertical, cylindrical, flat- bottomed tanks that are self-supporting; or vacuum- insulated, pressurized tanks known as “bullets” that can be arranged together horizontally in arrays depending upon the volume requirements. The volume of storage required determines the choice of technology.

289
CHAPTER
04Albania’s N
atural Gas Infrastructure Build-out and Technical Cooperation
Typically, the flat-bottomed cylindrical forms of storage (which are relatively easy to construct) offer an optimal solution for the higher end of storage requirements in SSLNG projects, whereas the vacuum-i nsulated bullets help to serve the lower end of the volumes.
● LNG Storage Tanks
Onshore storage for SSLNG can either be arranged using a flat- bottomed tank with a storage capacity of 7,500–160,000 m3, spherical tanks of 1,000-8,000 m3 or, for small LNG storage volumes, bullet tanks. Bullet tanks are available up to 1,200 m3, meaning that larger storage capacities (up to 20,000 m3) are arranged with multiple bullet tanks.
● Flat- Bottomed Tanks
Flat- bottomed tanks can be divided into single- container, double- container, or full- container tanks. Aboveground full- container tank technology is the preferred solution when it comes to storing large quantities of LNG with maximum safety at a limited site. However, depending on safety requirements and the free space available around the tank, the single- and double- container tanks can also be considered. Flat- bottomed tanks are produced on- site, which prolongs construction time.
When LNG is stored, heat ingress from the surrounding atmosphere causes nitrogen and methane to boil off. The boil-off rate is generally 0.1– 0.5% per day of total stored LNG volumes, with additional BOG formed during LNG loading activities. Managing BOG volumes is important to keep LNG cooler and reduce operational pressure requirements. If BOG is not removed, pressure will build up, causing either pressure relief valves to open, or making LNG heavier due to decreased methane concentrations; thus, volumes will fail to meet end-user specifications.

Gas Sector Expansion Strategy for Energy Diversification in Albania
290
[Figure 4-41] Full Containment Tank
Source: Wartsila (2018).
[Figure 4-42] Bullet Tank
Source: Wartsila (2018).
One of the main challenges of LNG storage is handling the boil-off gas. BOG is produced because LNG is stored at cryogenic conditions in a much warmer ambient environment. It forms at the top of the LNG tank and creates pressure that has to be managed or released in order to maintain the pressure within the limits of the tank’s design. For flat- bottomed tanks, during normal operation and storage, BOG is only about 0.05–0.1% of the tank’s mass per day, while it can be 8–10 times higher during ship unloading. When excess BOG is generated during a ship’s unloading, it is common to return the BOG to the LNG carrier through a vapor return line, compensating for the reduction in the liquid volume in the vessel. However, in SSLNG terminals, it is sometimes possible to eliminate the vapor return line if the LNG carrier is equipped with vaporization systems for equalizing the pressure. In bullet tanks used for smaller volumes of LNG, the boil-off gas is 0.05–0.15 % per day, but the tank is capable of handling the increased pressure for up to one month. Bullet tanks are designed and operated so that no BOG compressor is needed.

291
CHAPTER
04Albania’s N
atural Gas Infrastructure Build-out and Technical Cooperation
Options for handling BOG include the following:
• Venting (only allowed in emergency situations) • Flaring z: Returning the BOG to the LNG carrier during unloading (this is only an add-
on solution during unloading) • BOG re-condensation and pumping back to the LNG tank (this requires a constant
sendout of LNG) • Using BOG as fuel in a nearby power plant, converting it into electrical power and heat • LNG re-circulation / top spraying • Pumping it to the low pressure (LP) gas pipeline
[Figure 4-43] LNG Storage Alternatives
Tank Type
Capacity
Boil-off Gas (Holding Mode)
PressureRollover Monitoring NeededManufacturing MethodInstallation Time On Site
Bullet tank(double shell steel tanks)Single tank 100-120 m3 Multiple tanks 100-20,000 m3
0.05% per day0.05-0.15% per day, but the tank is capable ofhandling the increased pressure for up to one month 0.5-8 bargNoPre-fabricated in factoryDays to weeks
Flat bottom tank(single, double or full containment)
7500-160,000 m
AthmosphericYesOn site18-36 months
Source: Wartsila (2018).
● Transfer and Transportation
LNG transfer and transportation is the third segment of the SSLNG value chain. This is more varied for SSLNG in comparison to the value chain for traditional LNG, where transfer and transportation are restricted primarily via large ships and tankers.
In the case of SSLNG, there are multiple options for LNG transfer and transportation, including via small to medium marine vessels, trucks, railways, and ISO containers. SSLNG carriers typically have capacities less than 30,000 m3. They are regulated by the same specifications for design and safety as large-scale carriers. Small-scale carriers can be used for small inland and coastal communities, as well as intercontinental LNG transport and port-based bunkering. Other unit operations are similar to large-scale LNG practices. LNG loading is generally carried out by creating a pressure build-up from facilities or storage to trucks and vessels via hoses that are typically smaller than eight inches in diameter. Typical

Gas Sector Expansion Strategy for Energy Diversification in Albania
292
infrastructure needs include a small jetty, safety equipment ( e.g., gas and fire detectors, emergency shut-down panels, firefighting equipment), control rooms, flow meters, and LNG spill containment.20
● CNG-Virtual Pipeline
The gas is compressed from 5–250 bar and then stored in CNG Jumbo trailers (7–10 t of gas) with a volume reduction from 60– 225 at a pressure of 70–250. The trailers are driven to customers who are unconnected to the gas grid. The gas pressure is supplied to different applications where the fuel oil/LPG is used and reduced to 4 bar once the CNG trailer/jumbo trailer has arrived at the customer’s property. Before all of the gas has been consumed, a backup trailer of gas is delivered, thereby ensuring the continuity of supply disruption.
Due to the high pressure operations, the complex transport of CNG involves the risk of accidents.21
• High pressure storage on a form of transport. • Filled with a compressor placed at a pipeline. • Transported full for empty = two trailers needed. • Expansion (for full use of the trailer’s content) and recompression on site needed.• Expensive to produce, transport, and use.
[Figure 4-44] Transporting CNG
Source: Abdalla Altyeb Abdalla (2015). p.12.
20 Ibid.21 Abdalla Altayeb Abdalla.2015. “Utilizing the liquid natural gas in small scale application in power generation, industrialization and as
alternative vehicle fuel,” UNCTAD.

293
CHAPTER
04Albania’s N
atural Gas Infrastructure Build-out and Technical Cooperation
[Figure 4-45] LNG vs. CNG
A single LNG trailer is equivalent......
.......to three CNG trailers
LNG vs. CNG
Source: Abdalla Altyeb Abdalla (2015). p.12.
● LNG-Virtual Pipeline
From the terminal or small LNG liquefaction plant via an LNG semitrailer or an ISO container at 3 – 5 bar, the LNG is being transported. With MAWP of 11 bar, the LNG is unloaded into an existing LNG cryogenic storage tank. Every 2 weeks, the customized cryogenic storage tank is refilled. By using an ambient or steam- heated vaporizer, the LNG is re-gasified and supplied to different applications that require oil/LPG for fuel.
● Sources of LNG for Virtual Pipelines
• Onshore receiving terminals equipped with track offloading arms.
[Figure 4-46] Onshore Receiving Terminals
Source: World Bank (2015).
• Local liquefiers at local wells: By building local liquefiers with LNG distribution via trailers, small wells can be effectively exploited.

Gas Sector Expansion Strategy for Energy Diversification in Albania
294
• Local liquefaction plants: Sources such as stranded gas, biogas, and flare gas. • Local liquefiers on long distance pipelines: With limited possibilities of building
pipelines due to geo-morphological constraints, LNG is distributed to satellite stations at the regional level.
[Figure 4-47] Local Liquefaction Plant
Source: World Bank (2015).
● On- site Liquefaction Economic Assessment
In the case of having one’s own sources of gas, the small liquefaction of LNG is justified (small local wells, biogas, coal gas, and flare gas). From distant gas fields, the costs are compared to the costs of pipeline transport (the price of gas and transportation).
When on-site liquefaction competes with other small liquefaction operations of LNG from the transit pipeline and its branches, more expensive kinds of energy are provided as options to the end user (fuel oil, diesel, LPG).
● Road Transport
Please see the following image of an LNG trailer of 7 bar, with a non-vent holding time of 80 days, and a capacity of 56, 000 liters.

295
CHAPTER
04Albania’s N
atural Gas Infrastructure Build-out and Technical Cooperation
[Figure 4-48] LNG Trailer 49,200 Liters, 4.8 Bar
Source: World Bank (2015).
[Figure 4-49] Intermodal Transport with ISO Containers (20 ft)
Note: 20- foot ISO container with a capacity of 20, 400 liters, 10 bar, LNG or Liquid Ethane or Liquid Ethylene (and LOX, LIN, LAr) (Chart Ind., Inc. or Chart Ferox).
Source: World Bank (2015).
[Figure 4-50] Intermodal Transport with ISO Containers
Source: World Bank (2015).
Intermodal transport with ISO containers.

Gas Sector Expansion Strategy for Energy Diversification in Albania
296
[Figure 4-51] 54 ISO Containers with Capacity of 43,500 Liters
(40 foot)
Filling 84%:12991 kg LNGHolding time 81 days
Filling 92%:15534 kg LNGHolding time 30 days
Note: 40- foot ISO container with a capacity of 43, 500 liters, 10 bar, a tare weight of 12, 000 kg, a gross weight of 30, 480 kg, LNG or Liquid Ethane or Liquid Ethylene (Chart Ferox).
Source: World Bank (2015).
Advantages of ISO containers— Possibilities of intermodal transport:
• Road – railway – river – sea - ocean • Without transferring liquid from one vessel to other • Without intermediate storage • Not conflicting with national regulations
● LNG Road Transport Cost Competitiveness Against Pipelines
Some case studies from Europe show that transporting LNG to Central Europe from liquefiers and onshore terminals, about 1,500– 1,800 km from the point of use, is feasible in comparison to pipeline gas that is available on site and for which the cost is competitive.
● Customer Logistics
Customer-end logistics is the fourth segment; it is more important and varied in the SSLNG value chain relative to large-scale LNG operations. In conventional, large-scale LNG businesses, customer-end logistics are fairly simplified and embedded into re-gasification operations, where some storage is available, and natural gas (following LNG’s re-gasification) is transferred. This typically occurs via pipelines to customers that are normally large power generation facilities.
In the case of SSLNG, there is such a wide range of applications, customers, and end-use configurations that customer-side logistics becomes a critical path. For example, a large farming operation that has typically relied on the use of LPG may find conversion to LNG difficult without conducting a good assessment of the logistics at its site, and how they would

297
CHAPTER
04Albania’s N
atural Gas Infrastructure Build-out and Technical Cooperation
fit in with LNG.
● SSLNG Re-gasification or Usage
In the re-gasification process, LNG is pressurized from the storage tanks by utilizing pumps to the desired pressure levels, as specified by the consumer using one of the four possible methods of vaporization:
• Open rack vaporization (ORV), • Submerged combustion vaporizer (SCV), • Shell- and- tube vaporizer (STV), • Ambient vaporizer (AAV).
ORVs use sea or river water as a heat source, with LNG flowing upward inside finned heat tubes as water flows down from the outside of the heat tubes. While this solution entails relatively low operational expenses, the sea water system capital costs are greater, and there is a higher maintenance requirement around the ORV coatings, which must be changed every five years. Environmental compliance concerns also abound, particularly with respect to the release of cold water.
[Figure 4-52] ORV
Source: Ufm Gas Platform (2020). p.14.
SCVs comprise a fired heat source using the boil- off gas that heats the coil carrying the LNG in a water bath. This is a conventional vaporizer fitted with submerged combustion burners that heat the water.
● Submerged Combustion Vaporizer

Gas Sector Expansion Strategy for Energy Diversification in Albania
298
[Figure 4-53] Submerged Combustion Vaporizer
Source: Ufm Gas Platform (2020). p.14.
STVs use liquid as a heat medium for LNG that flows through multiple tubes. Depending on the type of loop used, the liquid may vary. In the case of open loops, the liquid is either sea or river water, and in the case of closed loops, a variety of fluids (such as glycol or water) can be used.
[Figure 4-54] Shell-and-Tube LNG Vaporizer
Source: Ufm Gas Platform (2020). p.14.
● Examples of SSLNG Applications
• LNG satellite (evaporation) station - LNG storage (20– 43.5 m3) - Evaporation skid in ISO frame (150– 700 Nm3/h) - Easy and fast installation / relocation

299
CHAPTER
04Albania’s N
atural Gas Infrastructure Build-out and Technical Cooperation
[Figure 4-55] LNG Satellite Station
Source: World Bank (2015).
• LNG Microbulk - delivery to stranded small living areas and individual family houses using small
storage tanks with a capacity of 600– 2,000 liters of LNG at a maximum of 12 bar - 306– 436 Nm3 - sufficient for a family house for heating and warm water ( 2– 4 weeks in winter; 3
months in summer) - small road tankers with easy access for on-site filling
[Figure 4-56] LNG Microbulk
Source: World Bank (2015).

Gas Sector Expansion Strategy for Energy Diversification in Albania
300
• LNG / LCNG vehicle fueling station
[Figure 4-57] LNG/LCNG Vehicle Fueling Station
Lng / Lcng Vehicle Fueling Station
LNG trailer LNG tank LNGdispenser
truckdrivenby LNG
Bus fuelled byLNG, by Chart
SaturationVaporizer
LNG pump incryo-vessel
high pressurebuffer
high-pressureLNG pump
productvaporizer
Odorizer
CNGdispenser
lorry drivenby LNG
LNG
LCNG
Source: World Bank (2015).
SSLNG can be used for power generation, residential and industrial demand in remote areas, and as fuel for marine and land transport. However, the transportation sector may be the largest demand sector for SSLNG in the future.
As short-term projects in the downstream sector, it is expected that the supply and charging of transport CNG buses, and the operation of gas-based small and medium-sized co-generation plants, will be possible.
Using SSLNG as fuel for land transport in natural gas-fired vehicles is one of its primary uses. LNG-fueled vehicles that store natural gas in a liquid state in ultra-low temperature containers, and CNG-fueled vehicles that store gas in high- pressure containers, are included under the category of natural gas vehicles (NGVs). The CNG project for transportation is expected to be promoted in the short term, centered on the city of Tirana.
There are about 4,000 large LNG trucks in Europe, about 10,000 in the US, and more than 200,000 vehicles in China. As of the end of 2016, the number of cars that use natural gas in South Korea is about 40,000, and natural gas- fueled cars are classified into four categories: CNG, CNG hybrid (CNG+electric), LNG, and LNG hybrid (LNG+electric). Most of them are CNG cars (99.6%), with buses in Seoul, and major metropolitan cities containing most of them. CNG- charging infrastructure is mostly built in garages led by transport companies that have secured stable self-consumption.

301
CHAPTER
04Albania’s N
atural Gas Infrastructure Build-out and Technical Cooperation
The use of SSLNG as fuel for marine transport has chiefly advanced in Europe and the U S. LNG bunkering projects are expected to be impossible in the short term, as they require establishing a bunkering infrastructure centered on the LNG receiving base.
However, since the infrastructure for LNG bunkering-related system maintenance and project implementation is in the completion stage, South Korea is expected to have sufficient know-how.
[Figure 4-58] Ports Engaged in LNG Bunkering or Studying It
22 Responding PortsGothenburg
StockholmCopenhagen
FrederikshavnBirunsbuettelAmsterdam
SouthamptonPortsmouth
Le HavreZeebrugge
GijonNew York
Vancouver
Los Angeles
ECA
Non-ECA
Lloyd's Register LNG Bunkering Infrastructure Survey 2014
Long Beach
Hamburg
Tenerife
Igoumenitsa
Piraeus
Singapore
Yokohama
Busan
Source: APEC (2019).
The construction of small and medium-sized natural gas-based co-generation facilities is expected to help resolve power and heating/ heat supply problems in a distributed manner. It is expected that small and medium-sized natural gas co-generation facilities or fuel cells will be available as alternatives to the circumstances of poor power grid construction and a lack of heating fuel.
Small and micro-scale combined heat and power (co-generation) is a system that supplies electricity and heat needed by small-scale consumers in industries, buildings and homes, unlike large-scale co-generation facilities, which supply heat and electricity using a wide area network.
Electrical and thermal energy, required for industries and buildings, is not dependent on boiler operations or a power supply from an external power company. Instead, such energy relies on its own power generation facility to produce electricity; afterward, the energy is recovered, and the heat emitted is utilized. Electrical and thermal energy has the advantage of achieving an energy- saving effect of 30–40%.

Gas Sector Expansion Strategy for Energy Diversification in Albania
302
Cold-heat projects are mid-to-long-term endeavors in the downstream sector. A cold-heat project harnesses the cold heat generated during the vaporization process of importing LNG that has been liquefied at minus 162 °C into the main pipeline.
To promote a cold-heat business, it will likely be difficult to implement in the short term, as the construction of the receiving base and the location of the company that can utilize cold heat in the surrounding area must be established beforehand.
In South Korea, a project to supply cooling heat to CO2 capture facilities of power plants between Boryeong City and KOMIPO is being planned. Further, KOGAS and Incheon Port are promoting a cold chain cluster construction project at Incheon New Port.
The cold-heat business is expected to be applicable to various fields such as frozen food storage, food freezing/rubber crushing, other freezing methods, and the liquid hydrogen manufacturing sector.
[Figure 4-59] LNG Cold Energy Utilization
LNGCold EnergyUtilization
ElectricPower
NGL RecoveryFloating Storage
Regasification Unit
CO2, Capture
CoolingLoad
CoolingLoad
CoolingLoad
ElectricPower
Cold EnergyStorage
Water
Water
Cold ChainFood TransportationFreeze Desalination
Hydrate BasedDesalinationAir separation
PurifiedN2/O2
PurifiedNGL
PurifiedN2/O2
AirConditioning
Cryogenic PowerGeneration Cooling
Load
Source: He et al. (2019).

303
CHAPTER
04Albania’s N
atural Gas Infrastructure Build-out and Technical Cooperation
4.2.4. Global SSLNG Trends and Cases
4.2.4.1. SSLNG in the US
● Peak Shaving Plants
In the US, LNG was initially applied to “peak shave” natural gas use. The peak shaving of LNG was considered to involve the liquefaction and storage of natural gas during the offseason (summer), and its vaporization and release back into the pipeline network during high-demand periods (winter). On winter days, daily peak loads are 1–2 times higher than on regular winter days. Thus, gas demand is affected in northern states, which see extremely low temperatures in winter. The peak demand should be considered in light of distribution companies when contracting transport capacity, because it is directly related to assuring an adequate supply.
The US currently has 68 peak shaving plants where LNG is produced and stored. Their total liquefaction capacity has a range of 20 tpd– 470 t/d per plant, with around 7.75Mt/d. The total liquefaction capacity is 1,550 Mt/y regarding the fact that these plants liquefy over a period of 200 days, on average. With a provision of around 5– 15 days of storage at the maximum send-out rate, the total re-gasification capacity is 4,817 MMscf/d.
Between 1965 and 1975, the bulk of the peak shaving capacity was installed due to increasing natural gas demand, followed by capacity constraints on major US pipelines. Because of gas supply curtailments, the development of more economically attractive peaking supply options (underground storage and LNG import terminals), and the recent boom in gas availability, there was a significant reduction in peak shaving plant additions after 1980.
Heavy vehicle fleets have been supplied by peak shaving liquefaction facilities in recent years. Because the investments in plants have already been made, this supply source would appear to be an ideal (but limited) fuel for LNG vehicle s. The 14 peak shaving plants currently also supply LNG to heavy vehicles.
However, there are a number of challenges associated with dual-usage of the facilities: Other than their primary purpose of peak shaving, some peak shaving facility owners are reluctant to draw down their LNG reserves. Utility regulatory agencies take a cautious approach toward approving plans for the potential requirement of giving a partial reimbursement to ratepayers, since ratepayers originally made payments for capital investments through tariffs on gas prices. Peak shaving plants are not necessarily located in

Gas Sector Expansion Strategy for Energy Diversification in Albania
304
areas where fuel for LNG vehicles is in demand.
● LNG as a Fuel
The production and dispensing of LNG as a vehicle grade fuel is the most prevalent purpose for “new” SSLNG facilities in the US. The production-to-dispensing model mainly employs a centralized liquefaction plant, where LNG is distributed in special trailers to local storage and dispensing sites. From there, heavy-duty vehicles (directly as LNG, or via light-duty vehicles as CNG after re-gasification) are dispensed by the LNG.
Only one’s own vehicles, customer fleets, or government fleets are served by 38 additional private stations. Another 70 public and private stations are under construction or in the planning stages, according to the US Department of Energy.
A major hurdle is developing the infrastructure needed to support these new LNG trucks. The current 63 LNG public stations can be compared with 157,000 gas stations. In order to persuade operators to switch over, the LNG fuel industry needs to reach a critical mass of infrastructure. Major investors are partnering with filling station operators (conventional gas/diesel) in the trucking sector to orchestrate nationwide LNG filling networks.
Some barriers, individually or in combination, could limit the deployment of LNG facilities, such as:
• The capital costs of LNG plants• The cost and range of LNG vehicles: LNG buses and heavy-duty trucks currently cost
(more than those that are conventionally fueled) up to US $ 50,000, which is difficult to justify for vehicles that do not travel a large number of miles each day/week. Moreover, LNG trucks have a reduced resale value.
• Engine options: Since the latter is not a viable option for the provision of long distance services due to the weight of its tanks and/or the lack of travel range, as fuel for heavy-duty trucks or buses, LNG is more suitable than CNG.
• Fuel prices: With the equivalent energy content, the gap between diesel fuel and LNG prices needs to be big enough to encourage public and private fleets.
● Liquefaction projects at oil production sites
To improve North Dakota’s ability to bring new gas production to the market— including the expansion of gas treatment plants and pipelines, and the application of General Electric’s

305
CHAPTER
04Albania’s N
atural Gas Infrastructure Build-out and Technical Cooperation
CNG in a box system (GNG)— several projects have come online in recent years.
4.2.4.2. SSLNG in China
Most communities lie outside the reach of pipelines, requiring LNG/CNG storage and trailers to transport gas, as China’s natural gas pipeline infrastructure density is significantly lower than that of developed countries.
For peak-shaving purposes during winter, many industrial and urban users still have a limited supply of natural gas in eastern and southern China. Gas use in those areas, however, will tighten even more during seasonal and daily peak supply in the coming years, and there will be an increase boosted by the expansion of urban gas distribution networks. Hence, it is crucial to develop LNG storage capacity.
Mini-LNG could be a viable alternative for the gas supply in regions where it is not economically viable to build pipeline connections far from the main transmission pipeline. Moreover, natural gas serves as an alternative fuel in the transport sector. Finally, LNG could unlock the potential of stranded gas fields from the gas producer’s perspective.
In light of liquefaction infrastructure, the first liquefaction plant was installed in 2000. Currently, China has a retail liquefaction capacity of 2,100 MMscf/d (16 mtpa of LNG) spread across 120 small-scale plants.
In 2017, the country had more than 250 liquefaction facilities producing around 15 MTPA, 50% of the world’s LNG production by SSLNG plants, with more than 4,700 LNG refueling stations and 1,800 CNG. China accounts for a fleet of more than 200,000 LNG-powered trucks, and is the fifth country for natural gas-powered vehicles (NGV), with more than six million units.
● LNG as Fuel for Vehicles
Especially for LNG stations, the deployment of natural gas fueling infrastructure has been strongly encouraged by the national government. There were 1,844 LNG stations and 3,350 CNG stations in 2013. A target of 5,000 LNG stations was included in the 12th Five Year Plan (2011– 2015). In addition to LNG, the three major Chinese oil and gas state-owned enterprises are leading in terms of CNG deployment.
From total gas consumption, around 13% (or 20.6 Bcf) accounted for gas use in the

Gas Sector Expansion Strategy for Energy Diversification in Albania
306
transportation sector. The government’s gas-use policy (especially its subsidies for LNG trucks), zero value-added tax (VAT) on transport gas, favorable oil and gas price differentials, and the rapid growth of natural gas refueling stations have supported its share.
Heavy-duty, long-haul freight trucks and semi-tractors comprise an increasingly important vehicle segment for potential natural gas penetration. For the use of LNG instead of CNG, natural gas use in this segment will be possible. In 2013, an estimated 63,000 vehicles in China were LNG-fueled.
● LNG as Fuel for Vessels
China is beginning to focus on developing LNG as a vessel fuel, which should achieve coastal and inland shipping “green environmental protection.” The development trend is expected to be the Vessel power changing to LNG.
The longest and busiest river in China is the Yangtze River. In 2012, almost 1.8 billion tons of cargo were shipped on the waterway, and the Yangtze River Delta explains around 20% of China’s GDP.
The first bunkering station on the Yangtze was established in Nanjing by Haiqi Ganghua Gas Development in the last quarter of 2014. In 2015, China Gas Holding was expected to start LNG bunkering operations on the Yangtze. The station represented an investment of US $20.5 million and has a daily capacity of 4.8 MMscf.
Regarding bunkering, the Shanghai port area was declared emissions-free in 2015. Three more zones are under study in the country and, as of today, 19 bunker barges are on request, and there is a requirement for another 23 vessels.
The transportation of LNG by sea is carried out from large re-gasification plants to carry fuel to small plants along the coast, or to plants located along riverbanks, using LNG barges with a capacity of 30,000 m3. One example is the Shanghai Wuhaogou peak shaving plant, which receives these types of loads. In terms of market operators, the leading players in China’s small-scale market are Kunlun Energy (a subsidiary of PetroChina), Xinjiang Guanghui, and local distributors.
Kunlun Energy has 24 SSLNG liquefaction facilities in the country, both operating and under development, which account for approximately 6.0 MTPA of production capacity, 40% of China’s SSLNG production. The company has facilities in the major gas- producing regions:

307
CHAPTER
04Albania’s N
atural Gas Infrastructure Build-out and Technical Cooperation
the northwestern (Xinjiang), northern (Inner Mongolia, Shaanxi), and central areas (Sichuan, Hubei). It also operates three receiving LNG terminals in Hebei, Liaoning, and Jiangsu.
4.2.4.3. SSLNG in Europe
● The Nordic Countries
The genesis of SSLNG’s development in Norway goes back to the late 1980s when the Norwegian sovereign wealth fund, with the support and encouragement of the Norwegian government, urged operators in the Norwegian North Sea to reduce SOx and NOx emissions from offshore gas fields. The main driver was the implementation of energy policies to reduce emissions by switching the fuel to natural gas. Local legislation forced Norwegian shipping companies involved in operating cruise liners and fishing trawlers to move away from heavy polluting fuels to the natural gas that had started to flow from the new gas fields.
Because of those policies and the role of the Norwegian government, maritime transportation in Norway has switched to powering their ships with LNG. Today, there are more than 50 ships running on LNG, representing a market of 0.3 MTPA. The local industry also uses LNG as an alternative for fuel oil, gas oil, and LPG. Norway has two SSLNG liquefaction facilities: one in Risavika with a production capacity of 0.3 MPTA (which also serves as a bunkering facility), and one in Kollness, with a production capacity of 0.5 MTPA.
Regarding the re-gasification capacity, Norway has two SSLNG facilities: The first is Frederiksted, with a storage capacity of 5,900 m3, built in 2011, and operated by Gasum, which offers bunkering and truck loading services. The second one, Mosjøen, built in 2007 and operated by Gasnor, has a 5,000 m3 storage capacity and also offers truck loading services. Many bunkering distribution facilities provide services all around the country.
Natural gas uses in Finland are mainly channeled toward the residential sector, cooking, and heating in Helsinki. SSLNG applications in Finland began with the operation of the re-gasification terminals at Pori and Tornio Manga. The first one was commissioned in 2016 with a nominal capacity of 0.1 MTPA, and the second in 2018 with a nominal re-gasification capacity of 0.4 MTPA. Providing both bunkering services and truck loading pilot stations allowed LNG to penetrate the market for uses in the transport, land, and maritime sectors. CNG and LNG filling stations have been deployed all across the country. The fuel in marine transport has also been applied in ferry companies such as Viking Lines, which have started to run ferries powered by LNG, such as the Viking Grace.

Gas Sector Expansion Strategy for Energy Diversification in Albania
308
Sweden also has SSLNG re-gasification terminals: Nynashamn and Lysekil. The first one was commissioned in 2011 with a nominal capacity of 0.4 MTPA, is operated by AGA, offers bunkering services, and has a truck loading pilot station. The Lysekil terminal, which became operational in 2014 with a re-gasification capacity of 0.2 MTPA, is run by the Norwegian company Gasum, mentioned earlier. The facility offers bunkering and truck loading services. The port of Gothenburg also has an SSLNG distribution facility that offers bunkering services; the current capacity is about 8,000 m3.
● The European Union
With 37 SSLNG plants developing reloading operations, the EU will likely emerge as a vibrant local market for SSLNG. With more significant optionality will come greater flexibility of supply chains and more competitive pricing.
While in some countries, truck loading is just starting and rapidly growing, in other countries (e.g., Spain and Portugal), truck loading services have a been around for decades. In 2019, more than 40,000 LNG trucks were loaded at Spanish terminals, supplying more than 1 bcm to more than 1,300 small LNG receiving satellite plants not connected to the main transmission grid, both in Spain and abroad. Other EU LNG re-gasification terminals have quickly started to develop such businesses and are growing fast.
<Table 4-16> LNG Import Terminals in Europe
Country LNG Terminal Reloading Trans· Shipment
Loading of Bunkering Ships
Truck Loading Rail Loading
Belgium Zeebrugge • • • •
France
Fos Tonkin • • • under study
Montolr • • • • under study
Fos Cavaou • • •
Dunkerque • • •
Greece Revithoussa under study under study •
Italy
Panigaglia under study under study under study
Rovigo/Adriatic under study
OLT Toscana
Lithuania Klaipeda • •
Malta Delimara •
Netherlands Gate under study • • • under study

309
CHAPTER
04Albania’s N
atural Gas Infrastructure Build-out and Technical Cooperation
Country LNG Terminal Reloading Trans· Shipment
Loading of Bunkering Ships
Truck Loading Rail Loading
Poland Swinoujście under study under study under study • under study
Portugal Sines • •
Spain
Barcelona • under development • under study
Cartagena • • • •
Huelva • • under study •
Bilbao • • under study
Mugardos • under study • •
El Musel • under study under study •
Sagunto • under study •
United Kingdom
Gralin • • under study •
South Hook
Dragon
Source: King & Spalding (2018). p.4.
● The Mediterranean Region
The actual LNG infrastructure in Italy— two offshore re-gasification terminals (Livorno FSRU Toscana and Adriatic LNG)— has operational difficulties in terms of reloading small LNG carriers for re-export and bunkering, and cannot practically supply inland consumers by truck. The Italian onshore re-gasification terminal Panigaglia cannot deliver LNG by truck, mainly because of substantial constraints on the local road system. Therefore, the current Italian SSLNG northern market depends on imports by truck from France and Spain. Italy has emerged as a pioneer in the construction market of LNG trucks. Italian LNG truck production is the strongest among European countries, with 2,000 LNG trucks sold by Iveco (up to April 2019), and a new total of 500 LNG trucks sold by Scania and Volvo. The country has deployed more than 45 operational LNG road stations; the other 25 are under construction or in the authorization phase. In terms of NGVs, Italy has been leading the way in Europe, driven by the progress achieved by the national gas industry and by the gas components sector. Two small-scale terminals are under construction in Italy. The first was expected to be operational in 2020; it is called Santa Giusta, and is located on the island of Sardinia, with a tank capacity of 9,000 m3 of LNG. The second, in Ravenna with a 20,000 m3 tank capacity, will be ready in 2021.
Turkey also emerged in the transportation sector, loading more than 382,000 tons in
<Table 4-16> Continued

Gas Sector Expansion Strategy for Energy Diversification in Albania
310
2019, approximately 27,000 LNG trucks. Turkey is one of the biggest gas markets in Europe, with an annual gas consumption of around 50 bcm. It has 15 entry points, both from pipelines and from LNG. Turkey operates four conventional LNG terminals, two FSRUs and two onshore terminals. The Marmara LNG facility, operated by BOTAS, is located about 100 km southwest of Istanbul in the northern Marmara Sea, with a storage capacity of 5.9 MTPA, and a sendout rate of 13.50 bcm/y. The plant has a truck loading pilot station, allowing 75 trucks to charge in one day. The terminal is located near developing industrial facilities, persuading downstream investments.
[Figure 4-60] LNG Import Terminals Offering Small Scale Services
Offering small-scale services21
Planned, small-scaleExisting, small-scalePlanned, large-scaleExisting, large-scale
1
6
2
4
3
5
27
25
29
30
34
28
32
33
31
36
23
8
1911
522
16
17
215
25
26 1324
20
4
14
106
7
121
3 1821 9
8
9
10
Poland
Romania Serbia
Bosnia andHerzegovinaMontenegro
BulgariaKosova
North MacedoniaAlbania
Czech RepublicSlovenia
Slovenia
Croatia
GreeceAustria
Source: US DoE (2020).
In Greece, the truck loading station at the Revithoussa LNG plant has been studied since 2015 and is part of DESFA’s ten- year development plan. The project is currently under construction, but once operating, it will supply areas where the transmission system has not been developed yet, mainly the western part of Greece. The project includes a one-point truck loading pilot station with a capacity of 50 m3 and a loading rate of 100 m3 /h, which means a loading rate of 48 trucks/day. The fuel will be transported to re-gasification satellite plants, which will permit gas penetration in those areas without an existing connection to the gas grid. The estimated cost of the project is €6.0 million.
The construction of a brand-new, small-scale jetty is recommended. The project is under study and is part of the framework of the Poseidon MED II Project. The Poseidon Project encompasses 19 stakeholders from five countries (Italy, Greece, Cyprus, Slovenia, and Croatia) and aims to develop LNG as marine fuel in the Eastern Mediterranean, including

311
CHAPTER
04Albania’s N
atural Gas Infrastructure Build-out and Technical Cooperation
the entire marine chain value, from the supply to the distribution and bunkering, with a project cost of €30 million.
Given the lack of bunkering services in the area, the project has emerged as a solution to feed fuel demand. Two alternatives are shown as predominant to adapt the Revithoussa terminal to the new SSLNG service: (i) the construction of a new jetty, and (ii) the addition of an SSLNG loading arm in the current jetty, which would allow for operating SSLNG loading ships with a capacity of 1,000 m3– 20,000 m3, where a simultaneous refueling of two ships would be feasible.
<Table 4-17> Mediterranean LNG Terminals- SSLNG Services
Country Terminal FSRUReloading Small-scale
Ship Loadings Truck Loading
Capacity (m3/h) Min Ship Size Capacity Slot/D
France
Fos Cavaou NoYes Yes Yes
4000 5000 40
Fos Tonkin NoYes Yes Yes
4000 7500 34
Greece Revithoussa No Under Construction Under Study Under Construction
Israel Hadera Gateway Yes No No No
Italy
OLT LNG Toscana Yes No No No
Panigaglia No FID 2020 FID 2020 FID 2020
Adriatic LNG-Rovigo No No No No
Jordan Al-Seikh Sabah LNG Yes No No No
Malta Delimara Yes No No No
Spain
Bilbao NoYes Yes Yes
3500 1500 / 3500 15
Barcelona NoYes Yes Yes
4200 525/4000 50
Cartagena NoYes Yes Yes
7222 400/4000 52
Huelva NoYes Yes Yes
3690 2000 54
El Musel NoYes Under study Yes
6000 - 30

Gas Sector Expansion Strategy for Energy Diversification in Albania
312
Country Terminal FSRUReloading Small-scale
Ship Loadings Truck Loading
Capacity (m3/h) Min Ship Size Capacity Slot/D
Spain
Mugardos NoYes Under study Yes
2000 - 36
Sagunto NoYes Under study Yes
3000 36
Turkey
EGEGAZ Aliaga Izmir No No NoYes
100
ETKİ Aliaga Yes No No No
Marmara Ereglisi No No NoYes
75
FSRU Dortyol MOL Yes No No No
Source: Ufm Gas Platform (2020). p.14.
4.2.5. Investment Costs
The Mediterranean region will need infrastructure investments to facilitate the material adoption of small-scale and containerized LNG. These will include facilities to offer SSLNG services, such as truck loading and marine bunkering, at the upcoming Krk and Alexandroupoulis LNG terminals. A few additional LNG import terminals closer to key countries in the region could meaningfully advance the adoption of SSLNG. LNG terminal investments are capital- intensive and require significant financial investment. A much higher level of infrastructure investments will be necessary across the broader LNG supply, storage, logistics, and utilization segments of the value chain. These include LNG bunkering, truck loading and refueling, storage tanks, and end-use logistics facilities. Fortunately, a number of these projects are not too expensive, are economically viable, and do not require substantial investments.
A conventional LNG import terminal capable of handling 6 MTPA of LNG will likely cost over a billion euros, while FSRU-based import terminals are significantly cheaper at approximately €300 million. Smaller-scale LNG and bunkering terminals can be built far less expensively. Finally, FSRUs, as well as small- scale receiving and bunkering terminals, can be built far more quickly than onshore, baseload re-gasification terminals.
<Table 4-17> Continued

313
CHAPTER
04Albania’s N
atural Gas Infrastructure Build-out and Technical Cooperation
[Figure 4-61] Capital Costs of LNG Projects and Services
€ 1
€ 10,000
€ 1,000
€ 100
€ 10
€ 0
€ 2.00
€ 1.20
€ 1.60
€ 0.80
€ 0.40
High Low
Typical CAPEX for an LNG Terminal(Million €)
Typical CAPEX for Small-Scale Services(Million €)
ConventionalLNG import
terminal(6 mtpa)
ConventionalLNG import
terminal-FSRU(3.3 mtpa)
Smal-scaleLNG import
terminal(4,000 m3)
Bunkeringterminal
LNGimport
at port - ISO
Truck loadingservices at
LNGterminal
Bunkeringservices at
LNGterminal
LNG truckrefueling-
mobile
LNG truckfueling
station-LNG
LNG truckfuelingstation-LCNG
LNG storagetanks/facility
(2 tanks)
Source: US DoE (2020). p.66.
The specific characteristics of each project include: gas volume and composition, distance to consumers, storage and infrastructure requirements, geographic location (which depends on the cost and sizing of the chain’s various elements), and total unit costs (capital plus operations) for mini/micro LNG projects, which range from US $12– 6 /MMBTU for gas volumes between 3 and 10 MMscf/d, and for distances of up to 800 MN/1,000 miles, where specific circumstances do not adversely affect cost.
<Table 4-18> Capital and Operating Cost of SSLNGTransport
Method Short Distance
Offshore
Capital & Operating Cost, USD2015/MMBTU
Item Marine 3 MMSCFD / 55-150 MN Marine 10 MMSCFD / 55-150 MN
Gas Treatment 0.42 0.21
Liquefaction 4.71 3.71
Transport 2.36 1.86
Delivery 1.56 1.06
Total 9.05 6.84

Gas Sector Expansion Strategy for Energy Diversification in Albania
314
TransportMethod Short Distance
Onshore
Capital & Operating Cost, USD2015/MMBTU
Item Truck 3 MMSCFD / 0-250 Mi Truck 10 MMSCFD / 0-250 Mi
Gas Treatment 0.42 0.21
Liquefaction 4.71 3.71
Transport 1.43 1.18
Delivery 1.56 1.06
Total 8.12 6.16
TransportMethod Long distance
Offshore
Capital & Operating Cost, USD2015/MMBTU
Item Marine 3 MMSCFD / 55-150 MN Marine 10 MMSCFD / 55-150 MN
Gas Treatment 0.42 0.21
Liquefaction 4.71 3.71
Transport 3.36 2.86
Delivery 1.56 1.06
Total 10.05 7.84
Onshore
Capital & Operating Cost, USD2015/MMBTU
Item Truck 3 MMSCFD / 0-250 Mi Truck 10 MMSCFD / 0-250 Mi
Gas Treatment 0.42 0.21
Liquefaction 4.71 3.71
Transport 4.93 4.68
Delivery 1.56 1.06
Total 11.62 9.66
Source: World Bank (2015).
<Table 4-18> Continued

315
CHAPTER
04Albania’s N
atural Gas Infrastructure Build-out and Technical Cooperation
[Figure 4-62] SSLNG-Based Gas Supply to a Power Plant
Transport distance1000km
LNG LNG LNGLNG
Lng Terminal Lng Small Tanker Lng SmallTerminal
Power Plant(Gtcc)
Capacitiy 150MWCapacity 8,000m3
Efficiency 50%(GHV)LNG demand 175kton/yr
Source: APEC (2019). p.18.
<Table 4-19> Main Assumptions
Small LNG Tanker
Capacity8,000 m3
3,680 ton
Speed 26 km/hr
CAPEX 40,000,000 USD
OPEX 2,500,000 USD/yr
Fuel ConsumptionSailing 18.4 kL/day
Anchoring 4.9 kL/day
Fuel price (Heavy Oil) 533 USD/kL
Harbor Cost 10,000 USD/visit
Source: APEC (2019). p.19.
[Figure 4-63] Diesel Replacement in Power Generation
Transport Distance
LNG LNG
Diesel Diesel Diesel
LNG
Diesel
LNG
Before
After
Capacitiy 14 ton 4,000kW * 1 unitEfficiency 42%
1,000kW * 4 unit
Refinery Diesel Oil Diesel Oil Diesel Engine
Lng Terminal Lng Tank Truck Lng Satellite Base Gas Engine
Source: APEC (2019). p.18.

Gas Sector Expansion Strategy for Energy Diversification in Albania
316
<Table 4-20> Assumptions for Diesel Replacement in Power Generations
Equipment Operation
Operating Days 300 day/yr
Operating Time 24 hr/day
Operater 2 person
Diesel Engine Power Generater (Replace Target)
Generation Capacity 1,000 kW
Generation Efficiency (Ghv Base) 37.0 %
Number 4 unit
Total Generation Capacity 4,000 kW
Maintenance Cost 0.020 USD/kWh
Gas Engine Power Generater (Planned Equipment)
Generation Capacity 4,000 kW
Generation Efficiency(Ghv Base) 42.0 %
Number 1 unit
Total Generation Capacity 4,000 kW
Capex 7,300,000 USD
Maintenance Cost 0.017 USD/kWh
LNG Satellite Base
Lng Strage Tank 140 KL
Vaporization Capacity 1,000 kg/hr
Capex 900,000 USD
Source: APEC (2019). p.23.
[Figure 4-64] SSLNG-Based Gas Supply to Industries
Transport Distance100km
LNG LNGLNG LNG
Lng Terminal Lng Tank Truck Lng Satellite Base Industry Plant
LNG Demand 4,000 ton/yrCapacity 14 ton
Source: APEC (2019). p.20.

317
CHAPTER
04Albania’s N
atural Gas Infrastructure Build-out and Technical Cooperation
4.3. Site Assessment
Regarding potential geographic locations for LNG terminals in Albania, in 2006, national specialists considered the area stretching from north Vlora to north Durres (some 90 km in total) to represent an appropriate locale for LNG facilities, expressly excluding the Bay of Vlora due to the region’s political and environmental sensitivity.22
However, they based their investigation on the assumption of realizing a large LNG terminal, with a capacity of 10 bcm/y, which met the energy requirements from 15 years ago. That said, at present, a similar project does not seem suitable given current energy needs and the post-pandemic energy scenario, which require different conditions (among them, the extension of exclusion and safety zones) compared to projects based on SSLNG.
After an analysis that considered environmental issues and the economic impact of the tourism industry, four areas were selected:
Porto Romano (north of Durres) was designed by the Albanian government as a storage site for petrochemicals arriving via tanker ships. In the vicinity of Spille beach, roads and routes of communication need to be better connected to the main national road. Further, the land area between the Vjosa and Seman rivers is an attractive tourist area with environmental significance. Sazan or Sazanit’s small island is strategically located at the entrance to Bay of Vlora. The Soviet Union built a submarine installation on the island; the base is now an Albanian reserve base and is used by the Ministry of Public Order to monitor and stop illegal drug trafficking coming from and going to Italy.
Albanian analysts have recommended the Vjose/Seman river area and the island of Sazan, but Porto Romano could be an attractive place as well, given its proximity to Durres, a populated city that is also an important commercial and communication hub serving central Albania, hosting a power plant and production factories.23
At present, one of the most promising areas to realize an SSLNG terminal along the Albanian coast lies in proximity to Fier, given that ( as we mentioned above) this area will be the key focal point of gas distribution in the country. Moreover, this zone is a landing point of the overland segment of the TAP, and a future starting point of the Ionian Adriatic pipeline. Fier is one corner of the so-called gas consumption triangle (Fier–Vlora and Ballsh) where most anchor gas consumers are located: This potential terminal could supply the TPPs
22 LNG Possibility Location in Albania. Unpublished document.23 Ibid.

Gas Sector Expansion Strategy for Energy Diversification in Albania
318
in Vlora and industrial facilities in Elbasan’s prospective industrial park, which represent two main relevant anchor-consumers. Further, in addition to the oil refineries at Ballsh and Fier, other industries (such as the Fier fertilizer plant, which used to be a major natural gas consumer in the 1970s) could be reconverted to use natural gas.
In the original version of the Eagle LNG project, the area of Levan ( in the south of the country, near Fier) was identified to host a floating FSRU vessel for import and re-gasification of LNG, as well as the starting point of the subsea pipeline to Italy.
Since most LGUs with higher consumption are located in the country’s coastal, western region, Fier and the surrounding area should be used as the primary backbone of Albania’s gas transmission system. This geographic site of an SSLNG terminal appears perfectly suitable with the gas corridors identified in Albania’s Gas Master Plan, because three of them (Fier to Elbasan; Fier to Vlora; Fier to Ballsh) were conceived of to deliver a gas supply from Fier ( also the national hub of TAP) to the main consumer- anchors in the country.
This report aims to identify potential LNG terminal sites only and to rank them. A site will need to be further assessed on an individual basis in greater detail, including a geological, geotechnical, and geohazard review. This report describes the desktop study and site visits carried out, and the conclusions drawn based on physical, environmental, and marine aspects in order to identify potential LNG terminal locations.
From a social/environmental angle:
- Archaeological and sensitive environmental areas (including wildlife and forests), land use, existing and planned infrastructure, exploration and mining licenses, military zones, contamination, landfill, etc.
Regarding physical aspects:
- Difficult topography, sufficient area, adequate access, sensitive areas, existing infrastructure, populated areas (etc.)
From a marine perspective:
- Water depths, fishing areas, shipping lanes, military zones, hazardous areas (etc.)
The following assumption was made regarding the size and sendout capacity of the proposed LNG terminal required, and is based on a typical Word-ClaSSLNG re-gasification

319
CHAPTER
04Albania’s N
atural Gas Infrastructure Build-out and Technical Cooperation
terminal with a send out capacity of up to 10 bcm and a total of three 160,000 m3 LNG storage tanks.
The actual site required for such a terminal will be approximately 50– 60 hectares, plus an exclusion and safety zone, with a radius of about 800 m in all directions from designated LNG impoundment areas. The total onshore area, including exclusion and safety zones, is most likely above 160 ha, equivalent to an area of 1,000 by 1,600m.
The actual radius for the exclusion and safety zones must be determined using a variety of safety calculations and models of possible accidents or LNG spill scenarios. The LNG storage tanks will each be around 80 m in diameter, 60 m high, and weigh approximately 1,200,000 tons. This study also assumed that the site will need to cater to the possibility of accommodating LNG vessels in the range of 70,000 m3 up to 265,000 m3.
The area between Vlora and Durres typically comprises low- lying flatlands, several rivers, wetlands, agricultural land, and low- lying hills. Some wetlands are environmentally protected zones. Hence, they cannot be considered potential locations for LNG terminals, and must be excluded as potential locations.
The land areas around where the rivers meet the sea contain alluvial deposits that have been laid down over long periods of time; these have been used where possible for agricultural land. These areas are fertile regions in which corn, grain, sugar beets, and tobacco are grown and livestock is raised.
[Figure 4-65] Map Showing the Area of Investigation
Area ofStudy
Source: Study Location LNG Terminal North of Vlora (2021).

Gas Sector Expansion Strategy for Energy Diversification in Albania
320
The coastline in this section is becoming increasingly popular with tourists due to its relatively unspoiled nature and beaches. The tourism industry is still in its infancy, but is growing rapidly. The coastline in Durres Bay is the most well-developed for tourists, whereas the remaining coastline is only intermittently scattered with tourist facilities, with poor access being a major contributor to slow growth.
The only major developed area is in and around Durres Bay. The city of Durres is a developed city with a population of approximately 115,000. Durres is an important commercial and communications center serving central Albania; the city has a power plant, a dockyard, and factories that produce bricks, cigarettes, leather products, and soap. Exports include grain, hides, minerals, and tobacco.
The low- lying flat lands running along the coastline can be described as typical: beach front; naturally formed sand dunes; deliberately planted forest (for onshore wind protection) and scattered wetlands; and canal systems and agricultural land. The canal systems are equipped with pump stations and barrages to regulate the onshore-offshore water flow.
The first step of the desk study was to identify a sufficient water depth for LNG tankers and protected environmental zones.
Land use maps were used to identify the environmental areas protected under governmental legislation.
The future trend is for LNG ships to produce at a capacity of 265,000 m3. These vessels will have loaded drafts of around 12– 13 m. As a general indication of good water, depth, and suitability for all future LNG vessels, the coastline was assessed to see which areas achieved a depth of 15 m of water the quickest.
The following map (not drawn to scale) shows the areas identified as described above. The green parts represent protected areas, the black arrows depict water depths achieved within reason, and the light yellow areas indicate where locations have been identified.

321
CHAPTER
04Albania’s N
atural Gas Infrastructure Build-out and Technical Cooperation
[Figure 4-66] Identified Locations
Location 1
Location 2
Location 3
Location 4
Durres
Vlore
Source: Study Location LNG Terminal North of Vlora (2021).

Gas Sector Expansion Strategy for Energy Diversification in Albania
322
4.3.1. Descriptions of Identified Locations
The following descriptions of the locations identified above are based on the desktop study and site visits carried out by IFL staff.
4.3.1.1. Location 1 (North of Durres)
A sparsely vegetated hill chain to the west between Durres and Porto Romano delineates the sea and the land from north to south. The area belongs to the administrative division of Durres.
[Figure 4-67] Satellite Image of Location 1
Navel Base
New Petrochemical Storage area
Porto Romano
Hill Chain
Durres
Source: Study Location LNG Terminal North of Vlora (2021).

323
CHAPTER
04Albania’s N
atural Gas Infrastructure Build-out and Technical Cooperation
The study area has a length of approximately 13.5 km from north to south. In the figure above, the major developed parts of Durres and other scattered infrastructure are outlined in red.
Porto Romano, on the outskirts of Durres, is an old leather tanning and pesticide- producing complex that has not been in use since 1990. Following the end of the Cold War, waves of rural migrants from northeast Albania looking for economic prosperity settled there. More recently, refugees from the Kosovo conflict have made their homes here, bringing the population to an estimated 6,000 – 10,000.
The abandoned chemical plants have provided squatters with building materials for new homes, as well as access to water and electricity. The ground and many of the buildings are highly contaminated with toxic chemicals such as lindane, a banned nerve agent and carcinogen, and chromium, a chemical used in tanning known to cause kidney and liver damage and lung cancer.
The area is so toxic that in 2001, the United Nations Environmental Programme (UNEP) declared it a “disaster area.” Also of concern are nearby sites that have been used as toxic dumps. A wetland zone close to the plant is thought to contain up to 20,000 tons of lindane and chromium waste. According to UN reports, the city of Durres plans to convert this place into a residential neighborhood. A third site, about 1.5 km from the plant, houses 370 tons of chemicals in three abandoned buildings. The chemicals include lindane, sodium dichromate (used in leather tanning), monomethylamine, dimethylamine, and methylamine.
[Figure 4-68] Arial View of Location 1
Source: Study Location LNG Terminal North of Vlora (2021).

Gas Sector Expansion Strategy for Energy Diversification in Albania
324
In March 2004, the Albanian Geology Institute began remediating the Porto Romano site. It is not known to what the extent the cleanup has gone and how it is progressing. In 2002, squatters who refused to vacate the area because they had no other place to go hampered previous efforts led by UNEP and the World Bank.
The Albanian government has designated Porto Romano as a storage site for petrochemicals arriving via tanker ships. The tank farm within the port area of Durres will be moved up to Porto Romano as soon the necessary infrastructure has been built.
One tank farm has already been erected, and an LNG jetty, including storage facilities, is under construction; a further tank farm is in early construction storage.
[Figure 4-69] View from the North to Porto Romano
Note: New tank farm and LNG facility in the background.Source: Study Location LNG Terminal North of Vlora (2021).
In the northeastern section in Figure 5 above, the flat agricultural zone is used for mainly herbaceous crops. To the north of Porto Romano lies a harbor belonging to the Albanian Navy at Bishti I Palles (Cape).
Based on the information above, the LNG terminal would not be suited to the south section below Porto Romano due to the close proximity to the city of Durres. This leaves either the Northern Cape, where the naval base is situated, or the industrial area just north of Porto Romano.

325
CHAPTER
04Albania’s N
atural Gas Infrastructure Build-out and Technical Cooperation
4.3.1.2. Location 2 (Spille Beach Area)
The region of Spille beach is delineated in the north from Kalaja I Turres (Cape), and in the south by the Shkumbini river. The area belongs to the administrative division of Kavaja. At the northern end of Spille beach, a hill strip runs in a north-northwest direction and meets the sea.
[Figure 4-70] Satellite Image of Location 2
NNW running hill chain
Spille Beach
Villages
Shkumbini River anddelta area
Source: Study Location LNG Terminal North of Vlora (2021).
To the north of the Shkumbini delta, there is a coniferous woodland that typically follows after the beach and sand dune area in a west- to- east direction. Behind the woodland lies agricultural land.
The southern part of Spille beach around the Shkumbini river mouth consists of lagoons and aquatic vegetation. Broadleaf forests follow to the north of the delta. Today the Shkumbini delta is constantly flooded and is an important area for wildlife and water fowl. An environmentally protected area around the Karavasta lagoon lies to the south of the Shkumbini river.
Local fishermen have established themselves on the Shkumbini river; their catch brings

Gas Sector Expansion Strategy for Energy Diversification in Albania
326
in a small income. Two villages are located around Spille beach: Spille, which is also the name of the beach, and Domer.
The northern half of Spille beach already shows well developed tourist infrastructure, with recently built hotels and apartment homes lying behind the dividing forest. The beach in the far northern section is regularly cleared of scattered waste, which is more or less typical for unused Albanian beaches.
In the middle section of Spille beach lies a small Albanian army base.
[Figure 4-71] Newly Built Tourist Hotels behind Spille Beach
Source: Study Location LNG Terminal North of Vlora (2021).
The area of Spille is difficult to reach from the main roads as road conditions are very narrow. This is the chief reason for the slow growth of tourism in the area. The distance from the main national road is approximately 15 km.
Based on the information above, the LNG terminal would not be suitable for the southern delta zone due to the environmental significance of flood lands and wildlife. The northern hilly section rises very quickly to over 100 m from the coastline and would prove a difficult site to facilitate a large LNG terminal. Only one location would be appropriate here and should be reviewed further. The middle section around Spille beach has the two small villages with growing tourism. A proposed terminal would have to be situated far enough to the south of these locations. Therefore, the above two sites should be examined in greater depth.

327
CHAPTER
04Albania’s N
atural Gas Infrastructure Build-out and Technical Cooperation
4.3.1.3. Location 3 (Vjose-Seman River Area)
The land between the Vjosa and Seman rivers is made up of alluvial deposits laid down over a long period of time. The locations of the river mouths have varied over time, moving hundreds of meters in the last 20– 30 years. This area used to consist of low- lying wetlands before recent agriculture was implemented. The study area has a length of approximately 20 km from north to south.
Today the lower delta at Vjose is constantly flooded and is an important area for wildlife and water fowl. A section slightly south of the Seman river is environmentally protected.
The region can be described from west to east as follows: beach front; naturally formed sand dunes; deliberately planted forest (for onshore wind protection) and scattered wetlands; and canal systems and agricultural land. Two main canals running east-west, and one canal running north-south, pass through the site under consideration; the first two are equipped with barrages to regulate the onshore-offshore water flow. Local fishermen have established themselves on both rivers; their produce brings in a small income.
Infrastructure is small and localized. The only established section is the village of Dorezeza e Re, approximately mid-way between the two rivers and located in the vicinity of the first canal barrage. The search for gas over the years has resulted in many deep boreholes in the area, some of which are used to generate gas.
Tourism is minimal and not well structured. The largest complex consists of a new hotel and various new beach huts, both located near Dorezeza e Re. Small beach huts are scattered along the coastline and are run by locals. The closest settlements are about 3 km in the northeast direction and about 3.5 km in the southeast direction.

Gas Sector Expansion Strategy for Energy Diversification in Albania
328
[Figure 4-72] Satellite Image of Location 3
Seman River and delta
Derezeza e Re village
Vjose River and delta
Protected area(outlined in red)
Source Study Location LNG Terminal North of Vlora (2021).
[Figure 4-73] Newly Built Hotel near the Village of Dorezeza e Re
Source: Study Location LNG Terminal North of Vlora (2021).
Based on the information above, the LNG terminal would not be suitable for either the north or south delta areas due to the environmental significance of the flood lands and wildlife. The middle section would be the best location, but would have to be situated away from the small village of Dorezeza e Re.

329
CHAPTER
04Albania’s N
atural Gas Infrastructure Build-out and Technical Cooperation
4.3.1.4. Location 4 (The Island of Sazan)
Sazan or Sazanit is a small island, strategically located at the entrance to the Bay of Vlora. It has an area of 5 sq km, and a population of about 1,000 (unconfirmed). The island has a length of approximately 4.5 km from north to south. The Soviet Union built a submarine installation on the island; the base is now an Albanian reserve base and is used by the Ministry of Public Order to monitor and stop illegal drug trafficking coming from and going to Italy. The island is very rocky and hilly; its steep slopes quickly reach 350 m in elevation. The northern, southern, and western coastlines have very steep slopes. The only easily accessible part of the island is in the northeast where the military base is situated.
[Figure 4-74] View of Sazan Island Looking West
Source: Study Location LNG Terminal North of Vlora (2021).
[Figure 4-75] Satellite Image of Location 4
Naval Base
The only low lying areas on the island
Source: Study Location LNG Terminal North of Vlora (2021).

Gas Sector Expansion Strategy for Energy Diversification in Albania
330
Due to its relative inaccessibility and military importance, it was not possible to carry out a site visit without special permission. Based on the information above, the LNG terminal would not be suitable for the steep coastal sections in the north, west. and south. Only three locations would be suitable on this island; they are in the vicinity of the naval base, as shown in the dark outlined areas above.
4.3.2. Ranking of Locations
The following table shows how each location is ranked. The maximum score for each criterion is also displayed.
<Table 4-21> Table of Rankings
CriteriaLocation 1 Location 2a Location 2b Location 3 Location 4
Durres Spille Beach, North
Spille Beach, mid-section
Vlose/Seman Rivers Sazan Island
Difficult topography (10) 6 4 10 10 2
Length of required LNG jetty (10) 7 7 3 3 8
Probable need for breakwater (5) 2 0 0 0 2
Coastal stability (5) 5 4 3 3 5
Adequate land available (10) 5 5 10 10 5
Site access (5) 4 3 3 3 0
Nearby populated areas (10) 6 6 4 7 10
Contaminated land (10) 0 10 9 10 7
Soil bearing capacity (5) 3 5 3 3 5
Flood risk (10) 7 8 5 5 8
Environmental sensitivity (10) 8 7 5 3 6
Connection to offshore pipeline (10)(Landfall of Albania between Vjose and Seman rivers)
0 3 4 10 7
Points 53 62 59 67 65
Ranking 5 3 4 1 2
Source: Study Location LNG Terminal North of Vlora (2021).

331
CHAPTER
04Albania’s N
atural Gas Infrastructure Build-out and Technical Cooperation
Based on the above ranking, we would recommend that locations 3 and 4 (the Vjose/Seman river areas and the island of Sazan ) should be looked at in more detail. Special permission will be needed to gain access to Location 4, the island of Sazan.
5. Recommendations for Albania
5.1. Status of Albania’s Gas Supply System
Albania is a mountainous country where it is not easy to establish a national gas distribution network, as it takes the form of about 3,000 communities in which small-scale units live. Even in SEE, Albania, Kosovo, and Montenegro are isolated from the natural gas supply chain because Russia’s PNG Network is not connected.
Albania has been producing natural gas since the 1960s and generated about 1 bcm of gas in 1982, but it is currently producing 0.01 bcm and using it for industrial purposes, so there is virtually no use of natural gas as fuel. It has a 498 km pipeline network centered on mass demanders that was buried and used in the 1990s, but except for some sections, it has not been operated, so its condition requires review and reconstruction before putting it into operation.
Currently outdated gas pipelines, the pipelines connecting gas fields (such as those of Divjaka, Frakulla, Povelca, and Delvina), and the fertilizer plant and refinery and chemical plant near Fier (which are major consumers) are being used normally. The new gas pipeline network and technical specifications are different and cannot be integrated and used. In other words, it is necessary to build a new gas supply network across the country.
Regarding the transmission and distribution systems inside Albania, the supply of gas to two critical gas consumption centers is of utmost importance. With adequate gas consumption in Albania, there are two primary consumption centers:
- The area of Fier, Vlora, and Ballsh represents a gas consumption triangle where the anchor- gas consumers are mostly located.
- The area of Tirana and Durres represents the key gas zone in Albania with potential gas consumption. While the industrial sector takes up the largest amount at 37%, each sector involved in total gas consumption accounts for 32%. Hence, this area should be a single gas distribution center.
The Gas Master Plan estimates that gas consumption through 2030 will be at the level of

Gas Sector Expansion Strategy for Energy Diversification in Albania
332
1.5– 1.8 bcm/year, with the main consumers expected to be:24
- First priority: the power generation sector and industrial consumers; - Second priority: service sectors, which will use natural gas for heating; and - Third priority: the residential sector, which will use natural gas for heating, cooking,
and hot water.
The short-term (2021–2025) goals for developing the transmission and distribution systems are:
- To extend the transmission pipeline from TAP to TPP Vlora, if it is feasible to develop a gas distribution system in Vlora;
- To develop the transmission system to supply anchor- consumers in Fier ; and - Ballsh, if it is feasible to develop gas distribution systems in those two places.
The medium-term (2026–2030) goals for developing the transmission and distribution systems are:
- To develop the transmission system to supply industrial regions in Elbasan, and gas storage facilities in Dumrea (if considered feasible); and
- To develop the transmission system to supply industrial and commercial consumers in the Tirana and Durres region.
The long-term goals for developing the transmission and distribution systems are:
- To extend the transmission system for the interconnector to Kosovo; - To build the transmission system near Korça to supply the planned CCGT in Korça,
and further on to Pogradec; - To develop the transmission system to Shkodra; - To extend the transmission system from Ballsh to Tepelena and Gjirokastra; - To expand the transmission system from Pogradec to Prrenjas and further on to
FYROM; and - To develop the transmission system for the planned CCGT in Kuçova.
24 The development priorities of gas consumption through 2030 regarding the short, medium, and long term goals for the transmis-sion and distribution systems were retrieved from WBIF (2016). Gas Master Plan for Albania. Western Balkans Investment Frame-work.

333
CHAPTER
04Albania’s N
atural Gas Infrastructure Build-out and Technical Cooperation
The demographic features of Albania settlements are very unfavorable for the expansion of gas distribution networks. It was assumed that the gas pipeline toward Montenegro and Croatia would be built in the short term along with the construction of Albania’s national transmission system. However, no firm decisions have been made at the moment. There is little indication as to who will provide the funds or when an FID might be expected. Delay in the IAP development is impacting the expansion of the entire Albanian transmission network. The Albanian national gas transmission system’s development is inextricably linked to international pipelines to Kosovo, North Macedonia, Montenegro, and some parts of Croatia. It was assumed that the gas pipeline toward Kosovo and North Macedonia would be constructed after the gas transmission network was developed in Fier, Vlora, Ballsh, Elbasan, Tirana, and Durres.
It takes a lot of investment and time to build a gas supply system, including a main pipeline to use natural gas. Because Albania is a geographically dispersed community living area (versus a densely populated city), tank lorries are used to transport LNG near power plants, factories, and densely populated zones that require LNG before a gas supply system using pipes is established.
To expedite and facilitate the gasification of Albania, the Government of Albania recommended considering LNG import options in complementing and paralleling pipeline infrastructure growth. The LNG provides:
- Long distance gas transport where pipelines are too expensive or not feasible; - Gas importation flexibility; and - Supply security from different suppliers.
The key then is to import the necessary LNG into Albania in some way.
There are three LNG import methods.
1. On shore LNG import (re-gasification) terminal2. FSRUs and FSUs (etc.)3. SSLNG: On shore small-scale LNG
Option 1) On shore LNG Import (Re-gasification) Terminal
LNG has traditionally been imported through the onshore LNG import terminal method, but it takes a lot of time (about 5 years or more) and cost (about 500 mm–1B$) to build the

Gas Sector Expansion Strategy for Energy Diversification in Albania
334
import infrastructure. Although the amount of processing is varied, the LNG carrier is 140,000–230,000 Kl, which is approximately 1-10 mmtpa.
[Figure 4-76] Typical LNG Supply Chain
Onshore Export Terminal
Onshore Export Terminal
Onshore Export Terminal
Conventional LNGC FSU + FRU (or Regas Facility)
FLNG
LNG Flow
Source: 2021 Annual Report of GIIGNL (2021).
Recently, a number of producers (20 countries as of 2020) and importers (43 countries as of 2020) participating in the LNG business have emerged. The stabilization of prices occurred through LNG exports and a share of short-term and on-the-spot transactions (from 10–20% in the past to 40% as of the end of 2020).
The flexibility of the contract for introduction has improved, and the conditions for introduction are diversifying. For example, in the past, a long-term contract was 10–20 years, a rigid import contract was 1–2 million tons/year, a mid- to long-term contract was 5–20 years, and the contract volume was tens of thousands of tons-millions of tons/year.
Option 2) FSRUs and FSUs
If one wants to import LNG in a short period of time, the case of using offshore FSRUs and FSUs as an alternative has recently increased because onshore terminal facilities require a lot of costs and time to build the infrastructure. This method installs an import terminal on the sea, and it requires a short period (2–3 years) and low cost. Further, the size and period can be selected according to the conditions of the importing country. Floating terminals can be newly manufactured or used by remodeling old LNG carriers, so they are being widely adopted in countries that have recently introduced LNG, or in nations that require peak demand and supply in winter.

335
CHAPTER
04Albania’s N
atural Gas Infrastructure Build-out and Technical Cooperation
Recently, in developing countries such as Pakistan and Bangladesh, LNG gas power generation using FSRUs has been widely used as an alternative to supply insufficient electricity.
[Figure 4-77] FSRU LNG Unloading Type
Ship to Ship Transfer
Single Berth Mooring
Double Berth Mooring
Source: 2021 Annual Report of GIIGNL (2021).
Option 3) SSLNG
The SSLNG value chain is deeply intertwined with the standard LNG supply chain and infrastructure. The development of SSLNG is intertwined with the activity of larger terminals in close proximity. This also shows how SSLNG projects have a close symbiotic fit with larger terminals. In addition to providing re-gasification services, FSRUs can act as hubs for SSLNG deliveries. FSRUs can serve as central hubs for LNG storage and unload LNG to a small- scale LNG carrier using STS transfer technology. The ability to break down bulks and reload large cargo, and to distribute that cargo, efficiently to newer customer segments, is at the heart of this symbiotic relationship.
Liquefaction plants, transportation by ship, and receiving terminals are the three elements that have traditionally composed the LNG chain. However, by increasing gas distribution flexibility and reaching new consumers through small- scale facilities, LNG distribution by truck, and LNG refueling stations, attention is now being given to the diversification of LNG.

Gas Sector Expansion Strategy for Energy Diversification in Albania
336
[Figure 4-78] SSLNG Applications
Power
•Off-grid power•Peak shaving
•Vehicle carriers•Cruise ships•Boats
•Manufacturing•Mining•Agriculture
•Freight rail•Passenger rail
•Heavy-duty trucking
•Commercial buses
Trucking Marine Rail Industrial
Source: US DoE (2020). p.10.
It is an urgent method, but in the case of LNG, supply through pipes is limited, so most of them have no choice but to supply the demanding place using cryogenic containers.
The installation of LNG refueling facilities for the supply of LNG vehicles, and the construction of LNG bunkering facilities for supplying LNG to ships, are essential according to the supply of LNG-powered ships. In this case, to supply LNG to LNG refueling or bunkering facilities, a large LNG carrier cannot be an appropriate means of LNG transportation, and there is no choice but to use a small LNG transport vessel for sea transport, or an LNG tank lorry for land transport. The LNG transportation method can be called an SSLNG business. The recently developed ISO LNG tank container was created to transport LNG exclusively; because it can transport LNG in a variety of ways using trucks, railroads or ships, it can be used as a key facility when SSLNG logistics businesses are activated in the future.
Among SSLNG businesses, those that use LNG ISO tanks actively are based in the US and China.
In the US, as small-scale gas production has occurred due to the boom in the development of sail gas, Shell and others have come to use SSLNG liquefaction technology to produce LNG, and have then used tank lorries to supply a lot of fuel for vehicles near the production site.
In China, there are many LNG import terminals on the west coast. Russia, Central Asia, and Myanmar (among others) import it as PNG or produce their own gas inland, but the gas supply pipeline network is not connected inland. These PNGs are used to operating small

337
CHAPTER
04Albania’s N
atural Gas Infrastructure Build-out and Technical Cooperation
liquefaction facilities, and the produced LNG is being used in nearby factories or cities. The volume exceeds 30 mmtpa, and in order to import insufficient LNG, it is exported from South Korea to China via an LNG-only container method.
SSLNG solutions have enabled Albania to solve the following problems:
• Restrictions on pipeline infrastructure: - peak shaving can be used to solve pipeline network restrictions or deficient
storage capacity. - rising domestic gas demand cannot be matched by the required infrastructure
development (gas transportation and transmission). An LNG virtual chain provides a transitional solution to solve the gap.
- Demand does not reach the minimum volume required to invest in traditional gas infrastructure transport.
• Emissions reduction policies • More competitive prices of natural gas in the transport (surface and marine) and
industrial sectors and power generation against petroleum derivatives.
5.2. How to Start the LNG Business in Albania?
Albania has the geographic advantage of being able to receive PNG from TAP. If the main pipeline is built at Fier, the transit point of TAP, it is a condition to receive a stable gas supply in the long term. However, since the population is not large and the population density is not high, it seems difficult to secure the economic feasibility of natural gas pipeline construction. In particular, since it is not easy to supply gas in the short term to scattered mountainous areas, it is necessary to consider the policy aspects of promoting gas usage until the main pipeline is built, creating gas demand, reducing energy costs, and contributing to environmental improvements.
Although South Korea has a high population density and urban concentration, it took more than 30 years to build a nationwide pipeline network, but there are areas where natural gas is not supplied because the pipeline network is still incomplete. There are many places that supply LNG through tank lorries.
The development of the pipeline transmission and distribution systems alone does not ensure a supply of gas to the two major natural gas consumption centers: the triangle of Fier-Vlora-Ballsh and the region of Durres and Tirana.

Gas Sector Expansion Strategy for Energy Diversification in Albania
338
LNG technologies are readily possible for “fast-track” implementation of mini LNG facilities, with relatively low investments (compared to pipelines or large- scale onshore LNG facilities). Areas limited by a lack of pipeline infrastructure in Albania can be enabled by SSLNG, which can facilitate the rapid establishment of power plants or industries (oil and gas exploration and refining, fertilizers, the food industry, ceramics, etc.). Stimulated by the rising cost of conventional fuel and environmental concerns, using SSLNG as fuel for the transport sector could also be prospective. Only storage and a loading facility are required, because the LNG will be used as fuel directly.
In light of these points, the LNG import policy is presented as three alternatives.
Option 1) Import LNG using ISO tanks
The use of small-scale and containerized LNG could significantly benefit Albania in the short term (2–3 years). Where new pipeline investments are not economical in the near to mid- term given the scale of demand, SSLNG could address this market.
Among SSLNG methods, it is proposed to import LNG using ISO tanks. Since the initial demand source has not been developed, if a thermal power plant in Vlora is converted and used for LNG gas power generation, the portfolio of power sources that are concentrated in hydropower (98%) will also be improved, and will serve as an anchor consumer of LNG, thereby increasing the demand for LNG for surrounding industries. This can also be used for residential and business purposes in the vicinity.
In South Korea’s experience, when importing LNG for the first time in 1986, 80~90% of the imported LNG was used by converting heavy oil thermal power generation to LNG.
Regions that import LNG using ISO tanks can review nearby LNG import terminals to reduce the burden of transportation costs. It is a plan to receive a supply from Krk terminal in Croatia and import terminals in Italy and Greece. Recently, China has also imported LNG from nearby South Korea using ISO tanks.
Diesel to LNG, CNG : Natural gas is compressed through high pressure after vaporizing LNG to improve air quality in Albania.
Fuel conversion for passenger cars (gasoline to LNG), bunkering, a fuel conversion business for ships, and gas supply to fuel cells that require hydrogen can be implemented with priority. It is also necessary to review a pilot project to convert a thermal power plant

339
CHAPTER
04Albania’s N
atural Gas Infrastructure Build-out and Technical Cooperation
in Vlora for natural gas power generation using this method.
ISO tanks should be transported to the required place using tank lorries, and a small satellite terminal that can be used by vaporizing, gasifying, and compressing the transported LNG should be installed near the consumption site. Major facilities that are required include an LNG storage tank, a primary pump, a secondary pump, a vaporizer, a high-pressure CNG storage vessel, and a supply charger to supply it to vehicles.
[Figure 4-79] LNG Import Terminals Surrounding Albania
Onshore Liquefaction Plants
Floating Liquefaction Plants (FLNG)
Onshore Regasification Terminals
Floating Regasification Terminals (FSRU/FRU)
Source: GIIGNL (2021).
Option 2) FSRU Installation
As shown in the table below (FSRU Fleet at the end of 2020), 43 locations around the world are in operation as of the end of 2020. Turkey’s 263,000 m3 storage capacity is the largest, and Indonesia’s 14,000 m3 is the smallest, with most of them occupying 150,000~170,000m3. As for the annual processing volume, 6 mmtpa is the largest in the UAE and China, and 0.1 mmtpa and 0.4 mmtpa are operated in Indonesia’s island area as a small-scale processing case of interest to Albania.
The neighboring country, Croatia Krk FSRU, started operations in 2020 at a scale of 1.9 mmtpa.
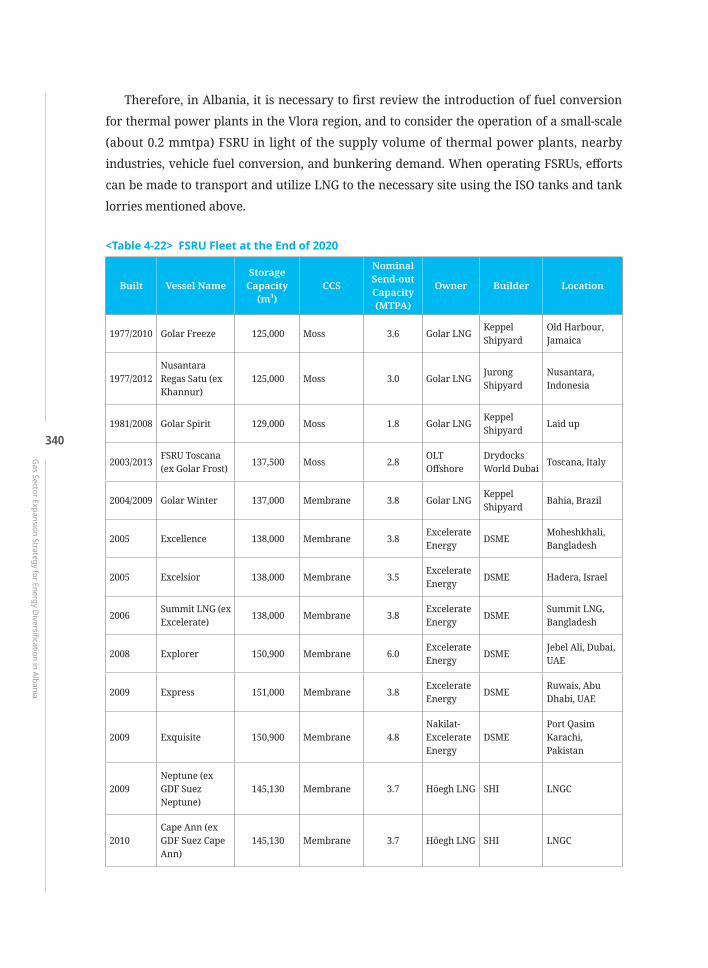
Gas Sector Expansion Strategy for Energy Diversification in Albania
340
Therefore, in Albania, it is necessary to first review the introduction of fuel conversion for thermal power plants in the Vlora region, and to consider the operation of a small-scale (about 0.2 mmtpa) FSRU in light of the supply volume of thermal power plants, nearby industries, vehicle fuel conversion, and bunkering demand. When operating FSRUs, efforts can be made to transport and utilize LNG to the necessary site using the ISO tanks and tank lorries mentioned above.
<Table 4-22> FSRU Fleet at the End of 2020
Built Vessel NameStorage
Capacity (m3)
CCS
Nominal Send-outCapacity(MTPA)
Owner Builder Location
1977/2010 Golar Freeze 125,000 Moss 3.6 Golar LNG Keppel Shipyard
Old Harbour, Jamaica
1977/2012Nusantara Regas Satu (ex Khannur)
125,000 Moss 3.0 Golar LNG Jurong Shipyard
Nusantara, Indonesia
1981/2008 Golar Spirit 129,000 Moss 1.8 Golar LNG Keppel Shipyard Laid up
2003/2013 FSRU Toscana (ex Golar Frost) 137,500 Moss 2.8 OLT
OffshoreDrydocks World Dubai Toscana, Italy
2004/2009 Golar Winter 137,000 Membrane 3.8 Golar LNG Keppel Shipyard Bahia, Brazil
2005 Excellence 138,000 Membrane 3.8 Excelerate Energy DSME Moheshkhali,
Bangladesh
2005 Excelsior 138,000 Membrane 3.5 Excelerate Energy DSME Hadera, Israel
2006 Summit LNG (ex Excelerate) 138,000 Membrane 3.8 Excelerate
Energy DSME Summit LNG, Bangladesh
2008 Explorer 150,900 Membrane 6.0 Excelerate Energy DSME Jebel Ali, Dubai,
UAE
2009 Express 151,000 Membrane 3.8 Excelerate Energy DSME Ruwais, Abu
Dhabi, UAE
2009 Exquisite 150,900 Membrane 4.8Nakilat-Excelerate Energy
DSMEPort Qasim Karachi, Pakistan
2009Neptune (ex GDF Suez Neptune)
145,130 Membrane 3.7 Höegh LNG SHI LNGC
2010Cape Ann (ex GDF Suez Cape Ann)
145,130 Membrane 3.7 Höegh LNG SHI LNGC

341
CHAPTER
04Albania’s N
atural Gas Infrastructure Build-out and Technical Cooperation
Built Vessel NameStorage
Capacity (m3)
CCS
Nominal Send-outCapacity(MTPA)
Owner Builder Location
2010 Exemplar 150,900 Membrane 4.8 Excelerate Energy DSME LNGC
2010 Expedient 150,900 Membrane 5.2 Excelerate Energy DSME GNL Escobar,
Argentina
2014 Experience 173,400 Membrane 6.0 Excelerate Energy DSME Pecem, Brazil
2014 Golar Eskimo 160,000 Membrane 3.8 Golar LNG SHI Aqaba, Jordan
2014 Golar Igloo 170,000 Membrane 5.8 Golar LNG SHI Mina Al Ahmadi, Kuwait
2014 Höegh Gallant 170,000 Membrane 2.8 Höegh LNG HHI LNGC
2014 Independence 170,000 Membrane 4.0 Höegh LNG HHI Klaipeda, Lithuania
2014 PGN FSRU Lampung 170,000 Membrane 2.9 Höegh LNG HHI Lampung LNG,
Indonesia
2015 BW Singapore 170,000 Membrane 5.7 BW Gas SHI Sumed, Egypt
2015 Golar Tundra 170,000 Membrane 5.5 Golar LNG SHI LNGC
2016 Höegh Grace 170,000 Membrane 4.0 Höegh LNG HHI Cartagena, Colombia
2017 BW Integrity 170,000 Membrane 5.0 BW Gas SHIPort Qasim GasPort, Pakistan
2017 Höegh Giant 170,000 Membrane 3.7 Höegh LNG HHI Jaigarh, India
2017 MOL FSRU Challenger 263,000 Membrane 4.1 MOL DSME Dörtyol, Turkey
2017 S188 (ex Exmar FSRU) 25,000 Other 4.6 Exmar
OffshoreWison Zhoushan Laid up
2018 Golar Nanook 170,000 Membrane 5.5 Golar LNG SHI Sergipe, Brazil
2018 Höegh Esperanza 170,000 Membrane 6.0 Höegh LNG HHI Tianjin, China
2018 Höegh Gannet 170,000 Membrane 5.5 Höegh LNG HHI LNGC
2018 Karunia Dewata 26,000 Other 0.4 JSK Group PaxOcean Zhoushan
Benoa, Indonesia
2018 Marshal Vasilevskiy 174,000 Membrane 2.0 Gazprom HHI Kaliningrad,
Russia
<Table 4-22> Continued

Gas Sector Expansion Strategy for Energy Diversification in Albania
342
Built Vessel NameStorage
Capacity (m3)
CCS
Nominal Send-outCapacity(MTPA)
Owner Builder Location
2009/2019BW Paris (ex BW GDF Suez Paris)
171,793 Membrane 4.2 BW Gas Keppel Shipyard LNGC
2019 BW Magna 173,400 Membrane 5.7 BW Gas DSME Port Açu, Brazil
2019 Höegh Galleon 170,000 Membrane 3.7 Höegh LNG SHI LNGC
2019 Turquoise (ex Turkey FSRU) 170,000 Membrane 5.7 Kolin
Construction HHI Etki, Turkey
2020 Excelerate Sequoia 173,400 Membrane 6.0 Maran Gas
Maritime DSME LNGC
2016/2020FSRU Hua Xiang(ex. Hua Xiang 8)
14,000 Other 0.1 Zhejiang Huaxiang
Fengshun Ship Hvy
Amurang, Indonesia
2020 FSRU Jawa Satu 170,000 Membrane 2.4 PT Jawa Satu Regas SHI Java, Indonesia
2005/2020 LNG Croatia (ex Golar Viking) 140,208 Membrane 1.9 LNG
HrvatskaHudong Zhonghua Krk, Croatia
2020 Torman 28,000 Other 2.0 Gasfin Development
Jiangnan SY Group
Tema LNG, Ghana
2020 Vasant 1 180,000 Membrane 5.0 Swan Energy HHI Jafrabad, India
Source: GIIGNI (2020).
FSRUs and land power plants could also be suitable for Albania and provide fuel for power generation by building an FSRU and supplying gas to an onshore natural gas power plant. Full-scale FSRU-based power generation for land power plants in the Vlora region might fit the Albanian case. Power and heating needs are too large to be cost competitively served by SSLNG in the Vlora region.
In the case of receiving a PNG supply from the Vlora area by connecting the TAP and the main pipe in the future, the FSRU will be moved to the sea near Tirana, the capital, and operated to induce demand in the vicinity of Tirana and the northern area so that reasonable demand can be created when connecting the main pipe in the future. Preemptive policy review is a good option.
When examining the surrounding conditions in Albania, there are LNG import terminals in Italy or Greece, and LNG export terminals in Egypt or Algeria, so it is a good condition to
<Table 4-22> Continued

343
CHAPTER
04Albania’s N
atural Gas Infrastructure Build-out and Technical Cooperation
secure LNG at a short distance. In particular, the US is pushing to export LNG to the world on the basis of abundant sail gas, so the LNG import conditions are positive.
Option 3) Onshore SSLNG
Option 1, ISO tanks, and Option 2, FSRUs, provide transitional facilities for LNG import. Onshore SSLNG operation could be considered a permanent facility.
This method is mainly used to supply to islands in South Korea (Jeju Island), many islands in Japan, and Southeast Asian islands such as those in Indonesia and Malaysia. LNG is transported via a small LNG carrier (3,000~8,000 m3) from a traditional LNG terminal nearby; the LNG storage tank is also operated at a small size to meet demand. The annual throughput varies depending on the conditions, but 0.1~0.5 mmtpa is suitable.
6. Sharing Korea’s Knowledge & Experience in Natural Gas & LNG Infrastructure
6.1. Korea’s Knowledge & Experience in LNG
Natural gas was once regarded as the fuel of choice for space and water heating in cold-climate regions such as in South Korea. The technology typically consisted of household-based boilers, on the basis of both cost and convenience; with a few exceptions, district heating schemes were considered expensive to install and inefficient. It is only since the beginning of the 21st century that heat-pump technology has provided an economic and sustainable alternative to distributed gas-fired boilers for space heating, and solar water-heating has been adopted on a large scale.
South Korea has become the second largest LNG importer in the world, second only to Japan (and KOGAS is the world’s largest LNG importing entity). In 2015, it imported some 33.4 million tons of LNG (equivalent to around 46 billion m3 of natural gas), representing about 13.4% of the global LNG market. KOGAS’ website lays out the history of the initial development of South Korea’s LNG import terminals and high-pressure gas transmission system. South Korea’s first LNG import/re-gasification terminal at Pyeongtaek became operational in 1986. In 2016, South Korea had five operating LNG import/re-gasification terminals.
Through KOGAS, the government pursued a policy of continuing to develop a high-

Gas Sector Expansion Strategy for Energy Diversification in Albania
344
pressure, national gas transportation system until around 2015, when it was deemed uneconomical to extend the system to smaller communities. At that point, the high-pressure gas transmission system amounted to some 4,065 km.
Communities that were deemed too remote for economic connection to the national transmission system would be supplied using LPG but, as elsewhere, are of interest to those offering renewable energy solutions. The government’s choice to commit to long-term LNG imports was made easier by the existence of city gas networks distributing manufactured gas to households, as well as commercial and smaller industrial consumers.
Indonesia supplied more than half of South Korea’s LNG imports before 2000, and was South Korea’s first source of LNG. As South Korea diversified its LNG imports to secure more sources of natural gas to meet growing demand, Indonesia lost a market share to other
countries including Qatar, Oman, Nigeria, Russia, and Australia.
South Korea currently has seven LNG re-gasification facilities, with a peak capacity of 6.1 trillion cubic feet (Tcf) per year and an average estimated usage rate of 31%. KOGAS operates five of these facilities (Pyongtaek, Incheon, Tong-Yeong, Samcheok, and a new small-scale terminal on Jeju Island), which account for most of the current capacity. The other two terminals are privately owned. The Gwangyang re-gasification facility, located along the southern coast, came online in 2005, and the Boryeong, located in the northwest, came online at the beginning of 2017.
Both of these privately owned terminals have very small capacities compared to the capacity of KOGAS. However, these private operators have been key contributors to the rise in South Korea’s LNG imports in 2017. Because of KOGAS’s monopoly and high LNG-resale prices, private industries have a greater incentive to invest in re-gasification capacity and purchase less expensive LNG on the global market.
South Korea has a large natural gas storage capacity at its LNG terminals, and the country held about 19% of the world’s LNG storage, or 440 billion cubic feet (Bcf), of LNG in 2019.21 KOGAS is building more LNG storage terminals at a proposed LNG terminal, to be completed by 2031, in response to the country’s expected reliance on natural gas in the long term.
6.2. Korea’s Knowledge & Experience in SSLNG
Over the past few years, Chinese companies have carried out trial runs with LNG exporters in Australia, Canada, and the US, opening up potential import routes for SSLNG. China Energy

345
CHAPTER
04Albania’s N
atural Gas Infrastructure Build-out and Technical Cooperation
Reserve and Chemicals Group, or CERCG, received roughly 100,000 mt of LNG through ISO tank containers from the US, Canada, and Australia between May 2017 and May 2018.
Canadian natural gas utility FortisBC has a two-year agreement with Top Speed Energy Corp. to send 53,000 mt/year of LNG, or 60 ISO containers a week, shipped from its small-scale liquefaction facility Tilbury LNG. While these longer distance deliveries have been tested for operational viability, their economic viability remains to be tested.
Looking to cut logistics expenses and delivery time, buyers in China have started importing reloaded LNG from Japan’s Shimizu terminal and South Korea’s Gwangyang terminal, signing a number of deals in 2019.
China received its first containerized LNG from KOGAS through BKLNG on November 15, 2019. The two ISO tanks, containing 28.8 mt of LNG in total, were reloaded and shipped from the Gwangyang LNG terminal to Qingdao port. Reloaded LNG from Gwangyang terminal, shipped through ISO containers, took only 24 hours to arrive at Qingdao port. PetroChina International (East China) Co. Ltd. also started receiving imported LNG via ISO tank containers in early November of 2019 from Japan’s Shizuoka Gas.
Five ISO tanks of containerized LNG, each of around 20 mt, were discharged at a regular port in Shanghai on November 8, 2019. Those LNG containers were understood to have been sent from Shizuoka Gas’ Shimizu LNG terminal.
In January, the city gas distributor signed an agreement with China’s Clean Energy (a subsidiary of Dalian Inteh Holdings Co. Ltd.) to supply 1,600 mt/year of reloaded LNG over the period of 2019–2021. The LNG was to be reloaded from its Shimizu terminal, a company release said.
Jusda Energy Technology, an associated company of IDG Energy Investment, signed a deal with a Japanese gas company to receive LNG through ISO containers, with an annual target volume of at least 200,000 mt, a company release said.
While Japanese and South Korean end-users are trying to ramp up terminal usage through such small- scale reload opportunities, buyers in China are facing challenges of obtaining a competitively priced supply.
Expensive logistics, the small- scale nature of seaborne- containerized LNG, and high procurement costs at Asian reload facilities are concerns that could impede this trade flow.

Gas Sector Expansion Strategy for Energy Diversification in Albania
346
A government-based project is developing LNG bunkering facilities along the South Korean coast, including an LNG bunker barge that should be operational by 2022. Further, with LNG bunkering infrastructure in place by 2022, South Korea will be able to serve a domestic LNG bunker market that is expected to grow to 1.36M tons of LNG by 2030.
South Korea has revised legislation governing the development of its urban gas business to include LNG business for vessel use, as part of an effort to promote its domestic LNG bunkering sector.
The revised Urban Gas Business Act takes effect on August 5, 2020 and will also see the LNG bunkering sector classified separately from the existing gas market, with businesses wishing to engage in LNG bunkering subject to separate regulations.
The government expects the separation of LNG bunkering from the existing gas market, coupled with relaxations on import volumes and price regulation, to create new demand for LNG and to revitalize the domestic LNG market.
The revised legislation is aimed at opening up the fledgling LNG bunkering market to more LNG suppliers to ensure robust, competitive supplies. Interested LNG bunker fuel suppliers will no longer be required to seek government approval on the price and volume of LNG imports, although the government must still be notified of any import plans.
The government has lowered the minimum requirement for private-sector firms to enter the bunkering market as LNG fuel suppliers. Firms must have an LNG storage tank, an LNG tank attached to a vehicle or an LNG supply vessel, as well as a minimum of 100 mn won ($84,000) in capital. LNG bunkering involves the supply of fuel from a truck to a ship, or from a ship to a ship, or a storage tank to a ship.
South Korea has been promoting LNG bunkering by encouraging the development and distribution of “environmentally friendly” vessels, which could support demand for the use of LNG in bunkering operations, as well as vessels powered by LNG. It will order 140 LNG-powered vessels over the next six years to support its small and medium-sized shipbuilding industry. South Korea’s LNG bunkering demand is expected to rise to 1.23 mn–1.36 mn t in 2030 and 3.37 mn–3.43 mn t in 2040, according to KEEI.
The move to foster the growth of LNG bunkering is in line with stricter restrictions on vessel emissions by the International Maritime Organisation (IMO), which came into force in 2020. The IMO has capped the sulfur content in marine fuels at less than 0.5 pc as of January

347
CHAPTER
04Albania’s N
atural Gas Infrastructure Build-out and Technical Cooperation
1, 2020 from 3.5 pc previously, accelerating the shift away from heavy fuel oil to cleaner bunker fuels like LNG.
KOGAS signed a deal in July 2020 to set up an LNG bunkering joint venture by October 2020 with steel producer Posco, shipowner Hyundai Glovis, refiner S-Oil, Busan Port Corporation, and Daewoo Logistics. KOGAS plans to acquire three LNG bunkering vessels as part of the venture, two of which are expected to operate in the East Sea and South Sea, and another to operate in the West Sea/Yellow Sea.
KOGAS also plans to develop an LNG bunkering facility in Dangjin on South Korea’s northwest coast, with a new LNG receiving facility expected to be completed in 2025. In 2018, it planned to build a new LNG bunkering facility in the southeast of the country by 2022.
The firm owns and operates five of the country’s seven terminals, with a combined nameplate import capacity of 103 mn t/yr. The remaining two terminals are the 3mn t/yr Boryeong, which is jointly owned by GS Energy and SK, and Posco’s Gwangyang.
KOGAS has completed the construction of its small-scale re-gasification terminal at the Aewol port on Jeju Island. The LNG terminal has two LNG storage tanks with a capacity of 45,000 m3 each, and re-gasification facilities with a capacity of 0.4 MTPA. The terminal received its first cargo, which was reloaded at KOGAS’ Tongyoung terminal, in September 2020.
The South Korean government recently launched a Tongyeong SSLNG Hub Construction Project to build an SSLNG export base on 210,000 square meters of the old Seongdong Shipbuilding 3 yard site at the Tongyeong Ansan Industrial Complex in the Province of Gyeongnam-do. Existing LNG export bases require large LNG liquefaction plants and large LNG carriers. This project uses an LNG ISO tank container (hereinafter referred to as an LNG TC).
An LNG TC can be delivered from the export base to the final consumer through a general container logistics system, making it possible to supply LNG without building a large-scale infrastructure.
After implementing the pilot project in 2021, the project is to be promoted with the goal of producing LNG TCs capable of exporting 1 million tons of LNG per year by 2024, establishing LNG logistics infrastructure, and building LNG TC transport vessels.
Since about 15 tons of LNG can be supplied per LNG TC, a plant for mass production and the production of more than 5,000 LNG TCs is required to export 1 million tons of LNG per

Gas Sector Expansion Strategy for Energy Diversification in Albania
348
year. Although it is possible to send LNG TC using a general container ship, there is a limit to the amount of handling, so it will be necessary to build a ship dedicated to transporting LNG TC for a large-scale supply and to build a berthing facility.
Accordingly, large tanks for storing LNG (more than 200,000 m3), shipping facilities for charging LNG to LNG TCs, and stockyards for storing and managing LNG TCs, must be secured. It is expected to become a business model that generates profits by leasing SSLNG export infrastructure, including LNG TC.
In South Korea, since domestic LNG demand growth has slowed or declined, LNG re-export and intermediary trade demand using the existing LNG infrastructure is expected to occur. China’s LNG imports are increasing, but small and medium-sized cities and inland regions are building large-scale import infrastructure. In many places, there is not enough economic feasibility to do so, so demand for LNG TC is occurring.
The KGC LNG base in Tongyeong, Gyeongnam has 17 LNG storage tanks, which implies ample surplus storage capacity, and is equipped with LNG TC charging facilities, so it is expected that a supply of LNG will be possible without additional facility investments until the first phase of the main project. In addition, as it is 2 km away from the Tongyeong base and the LNG hub project site, it has advantages such as reducing logistics costs. The Tongyeong base’s peak demand for heating in winter is also lower than that of the Pyeongtaek, Incheon, and Samcheok bases, so it has ample capacity for external rentals.
Repair shipyards and trading ports are also located in the vicinity, so the ecosystem for LNG export projects (such as LNG refueling, LNG ISO TC loading/unloading, and ship maintenance/repairs) has been established. Hence, initial investments and operating costs can be minimized.
Recently, KOGAS-Tech developed a container-type mobile LNG liquefaction plant engineering package and demonstration technology for the first time in South Korea in September, with support from the Ministry of Trade, Industry and Energy, and the Korea Institute of Industrial Technology Evaluation.
Unlike the “stick built” type plant, the mobile LNG liquefaction plant developed this time can produce 15 tons of LNG per day in a form that can be easily moved. It can be used to develop small gas fields and small power generation facilities. In addition, it can easily increase the LNG production capacity by expanding the plant.

349
CHAPTER
04Albania’s N
atural Gas Infrastructure Build-out and Technical Cooperation
For the mobile LNG liquefaction plant, as part of the Ministry of Trade, Industry and Energy’s engineering core technology development project, Gas Technology Corporation was in charge of designing the liquefaction process. Research projects were successfully carried out through organic linkages with research institutes, SMEs, and large corporations such as GS E&C and GS E&C.
7. Technical Cooperation between South Korea and Albania
Natural gas is supplied to end consumers through pipes after undergoing the production process at an LNG terminal. This supply process necessitates various supply facilities, including a flow control facility to supply an adequate gas flow based on gas consumption in each region, and corresponding changes in pressure. In addition, a transmission network must be established to provide a stable supply of gas by determining the size and thickness of pipes based on an estimation of increases in future demand, and installing block valves and vent stacks in anticipation of potential emergencies.
KOGAS possesses advanced technologies and capabilities with 40 years of experience in designing, constructing, and operating natural gas infrastructure, based on which it has carried out numerous technical projects targeting overseas LNG plants and natural gas supply systems. By applying KOGAS’s superior natural gas technology to natural gas projects— which requires the use of high pressure in its operation and focuses on safety as the top priority— Albania will be able to ensure the stable operation of natural gas projects within a short period of time, expand business projects that utilize natural gas, and build a safe and efficient system that complies with international standards.
In terms of technical cooperation, the following areas of cooperation are advised in light of Albania’s domestic circumstances.
7.1. Transmission
• Supervising Design Services for the Fier-Vlora Pipeline
The design service for the pipeline network is crucial. It is essential to install various safety facilities that satisfy international standards, in addition to determining the pipe diameter, supply pressure, PID, PFD, process management, and optimal route to ensure the stable supply of gas demand based on the year of design. Therefore, it is advisable to hire

Gas Sector Expansion Strategy for Energy Diversification in Albania
350
professionals from KOGAS to supervise the design service across the areas of processing, machinery and pipes, electricity and instrumentation, engineering and construction, and safety and quality control (five persons in total). They may also take charge of reviewing or drawing up the purchase specifications for key materials.
• Supervision and Key Materials Supply for Building the Fier-Vlora Pipeline
Since pipeline construction will take place in narrow and complex spaces on the road, it requires the management of safety and the construction process, in addition to strict quality control on account of the necessary lifespan of 30 years or more. Therefore, it is advisable to hire professionals from KOGAS to supervise pipeline construction in the same areas outlined above for design services. In addition, it is also recommended to procure a supply from KOGAS for coated pipes and coated 3D bends, which are key materials for pipeline construction.
7.2. Equipment
• Transition to Natural Gas Buses in Major Cities (CNG Charging Project)
This report proposes to convert diesel buses into CNG buses upon the commencement of a natural gas supply in order to improve air quality conditions in major cities, such as the town of Fier. The charging system consists of stationary charging stations that charge CNG buses using natural gas compressed to 25 Mpa, and portable CNG trailers installed at bus depots that charge CNG directly into buses. KOGAS has the capacity to handle the design, material supply processes, and installation.
• Conversion of the Vlora Power Plant into a Gas Power Plant
It is essential to convert the Vlora power plant into a gas power plant to improve the atmospheric environment, and to satisfy the demand for natural gas (serving a base-load role). It is also necessary to apply the same conversion to other power plants where it is feasible to do so. This report proposes that KOGAS, based on its robust experience, should carry out the project to convert the Vlora power plant into a gas power plant. With approval from the Albanian government, related materials can be supplied by KOGAS.
• Construction or Conversion of Fuel-Cell Power Plants, Construction of Hydrogen Gas- Charging Stations, and Operation Projects

351
CHAPTER
04Albania’s N
atural Gas Infrastructure Build-out and Technical Cooperation
A fuel cell not only contributes to GHG reduction through its high usage rate, energy density, and heat usage efficiency, but generates electricity, facilitates district heating with medium-temperature hot water, and allows for the manufacturing and production of hydrogen through fuel- cell reactions when operating a fuel-cell power plant supplied with natural gas. At the request of the Albanian government, KOGAS may engage in technological cooperation for natural gas projects to provide related technology and to participate in the field installation process.
7.3. LNG Technologies
As a recent global trend, we propose a container-type SSLNG plant that can supply low-cost energy to islands and mountainous regions. As a finished product, a short installation period, economic feasibility, scalability, portability, and easy maintenance are advantages.
It is mainly used for bunkering for LNG buses and ships, or in areas where it is difficult to supply natural gas through pipelines because it is far away from the transmission line.
If the Albanian authorities wish to carry out this project in parallel with the pipeline network project, they should cooperate with a demonstration company for each specialized technical field, and contract with the Korea Gas Technology Corporation (the main operator) in charge of the project to provide design, equipment manufacturing, operations, and manual technology transfer; facility installation work can be carried out locally.
8. Recommendations for the Development of Albgaz Sh.a. with Benchmarks on KOGAS
The development plan for Albgaz, which is modeled after KOGAS, aims to present cases that have been improved by KOGAS throughout approximately 40 years of facility construction and operations, in addition to aspects whereby Albania must prepare in advance for implementing and completing construction projects, and transitioning to the operations phase in order to ensure a safe, efficient construction process and the establishment of a stable operating system.
According to the ERE Annual Report, Albgaz is responsible for managing the operations of both the transmission system operator (TSO) line and the distribution system operator (DSO) line. However, in light of the expected expansion of the distribution network, it is recommended that Albgaz manage the TSO line, while independent gas companies

Gas Sector Expansion Strategy for Energy Diversification in Albania
352
established in each region receiving the natural gas supply should take charge of the DSO line to ensure safe, stable, and efficient operations and adapt to increasing demand.
In the case of South Korea, KOGAS is responsible for running the TSO line with a length of 4,954 km, while 34 regional gas companies are responsible for managing the DSO line. According to the ERE Annual Report, Albgaz plans to build the Albgaz Maintenance Center in the southeast region of Albania, and has signed an agreement to establish the Albanian Gas Service Company in partnership with the SNAM.
As soon as construction of supply facilities is completed, natural gas should be supplied to customers following the transition to the operations phase. In anticipation of equipment trouble or gas leaks that may occur during the gas supply process, a maintenance team should be stationed in close proximity to each facility site in order to ensure rapid actions. The maintenance team should perform preventive, precautionary, emergency, and regular inspections and corrective maintenance. In addition, a patrol team should be organized to patrol the transmission network on a daily basis, as well as monitoring other works that take place near the transmission network, and protecting gas pipelines.
KOGAS established KOGAS-Tech as its subsidiary to draw up and implement comprehensive inspections and maintenance plans for each piece of equipment and to independently apply improvements. Moreover, through regular patrols conducted twice a day to directly monitor and inspect the distribution network, it keeps track of other construction taking place near the distribution network, and examines possible gas leaks. The construction and operation of gas supply facilities requires the establishment of the following organizations and systems:
- A dedicated trial operations team is required during construction periods. After the construction process and the demonstration test, an NG injection must be carried out in a careful and safe process.
- It is important for Albgaz to select core personnel for each procedure and to dispatch them to South Korea to receive training. KOGAS is a key benchmark for Albgaz, as it is currently managing both construction and operations simultaneously.
- An R&D center should be created for the following purposes: Compatibility between PNG imported directly via TAP and LNG imported from foreign companies, management and inspection for internal corrosion in pipes, technologies to allow for the replacement of pipes without interrupting the gas supply, a repair center for valves that fail frequently, and the latest technologies.
- It is necessary for Albgaz to train experts and operate a dedicated organization in

353
CHAPTER
04Albania’s N
atural Gas Infrastructure Build-out and Technical Cooperation
natural gas imports: The technical proficiency of related personnel is crucial in ensuring stable and economical imports amidst exclusionary energy policies that are being implemented at the national and regional levels, and the integration of industrial value chains.

Abdalla Altayeb Abdalla.2015. “Utilizing the liquid natural gas in small scale application in power generation, industrialization and as alternative vehicle fuel,” UNCTAD (https://unc-tad.org/system/files/non-official-document/17OILGASMINE% 20Abdalla %20Abdalla%20S8.pdf).
Ali, Ozair. 2013. “Revitalizing the Albanian Electricity Sector,” Center for International Devel-opment.
APEC. 2018. Small-scale LNG in Asia-Pacific.
Bechev, Dimitar, “The Trans Adriatic Pipeline: Why it Matters and What Comes Next?” De-cember 2, 2020, https://www.mei.edu/publications/trans-adriatic-pipeline-why-it-matters-and-what-comes-next.
Bowden, Julian. 2019. “SE Europe gas markets: towards integration,” OIES Paper Ng. 150, Ox-ford Institute for Energy Studies.
Bresciani, Giorgio, Sven Heiligtag, Peter Lambert, and Matt Rogers. 2020. “The Future of Liquefied Natural Gas: Opportunities for Growth.” Mckinsey & Company, September 21, 2020, https://www.mckinsey.com/industries/oil-and-gas/our-insights/the-future-of-lique-fied-natural-gas-opportunities-for-growth.
Cha, Joniel. 2018. “Can Russia Maintain European Demand Of Natural Gas in a Changing World?” SAIS Review of International Affairs.
Dhima, Stavri. 2018. “Recent Developments on The Albanian Gas Sector and its Integration on Regional Level,” Tirana International Energy Charter Forum.
DuPaul, Jason & Mehrun Etebari. 2019. LNG FSRU demand volatility evident in 2018. LNG Insight. IHS Markit.
Energy Community Secretariat. 2019. Annual Implementation Report 2018/2019. 1 Novem-ber 2019.
European Commission. 2019. Albania should urgently diversify away from hydropower, properly conduct environmental assessments (https://balkangreenenergynews.com/ eu-ropean-commission-albania-should-urgently-diversify-away-from-hydropower-proper-ly-conduct-environmental-assessments/).
References
Gas Sector Expansion Strategy for Energy Diversification in Albania
354

355
CHAPTER
04Albania’s N
atural Gas Infrastructure Build-out and Technical Cooperation
European Union. 2016. Renewable energy potentials of Albania. (https://cordis. europa.eu/article/id/124474-renewable-energy-potentials-of-albania).
Gas and LNG Supplies in the European Union amid the Covid-19 Outbreak.” GECF Secretari-at.
Henderson, James and Vitaly Yermakov. 2019. Russian LNG: Becoming a Global Force. Ox-ford Institute for Energy Studies, November.
Johnston, Robert, Reed, Blakemore, Randolph, Bell. 2020. The Role of Oil and Gas Companies in the Energy Transition. Atlantic Council.
Kim, Younkyoo. 2019. “Obstacles to the Creation of Gas Trading Hubs and a Price Index in Northeast Asia,” Geosystem Engineering, 22(2), pp. 59-71.
Kovacevic, Aleksandar. 2017. “Towards a Balkan gas hub: the interplay between pipeline gas, LNG and renewable energy in South East Europe,” OIES paper, NG 115, The Oxford Insti-tute for Energy Studies.
Kravtsova, Ekaterina. 2020. “Europe's LNG Imports Expected to Soar to 100 mln tons in 2020,” Reuters, January 31.
Laruelle, Marlene. 2020. “Russia’s Arctic Policy: A Power Strategy and Its Limits,” Russie.Nei.Visions, No.117, IFRI.
Meidan, Michael. 2020. “China’s Oil Demand in the Wake of COVID-19,” Oxford Institute for Energy Studies, July.
Ozawa, Marc, Ion Alexander Iftimie. 2020. Russia’s Energy Policy: Dependence, Networks, and Special Relationships, NATO Research Paper, No. 13, Research Division NATO De-fense College.
Qin, Yan. 2020. Natural gas in China’s power sector: Challenges in the road ahead. Energy In-sight 80. The Oxford Institute for Energy Studies.
Rapier, Robert. 2020. “The Oil & Gas Sector Could Already Be In Terminal Decline.” Oil Price, June 17.
Risteska, Sonja., Vedad, Suljić., Aida, Hanjalić,. 2020. “Position Paper: Energy and climate Planning Albania 2030.”
Sen, Gong., Leach, Melissa. and Gu and Jing (2019). “The Belt and Road Initiative and the SDGs: Towards Equitable, Sustainable Development.”

Gas Sector Expansion Strategy for Energy Diversification in Albania
356
Shakirov, Aydar & Mahdjouba Belaifa. 2020. “The Growing Competition between Pipeline Gas and LNG Supplies in the European Union amid the Covid-19 Outbreak.” GECF Secre-tariat.
Snoeck, Matthias. “The viability of importing US LNG to Europe,” E&C Consultants, 2020, https://www.eecc.eu/blog/the-viability-of-importing-us-lng-to-europe.
Soldatkin, Vladimir. 2020. “Gazpro’s Natural Gas Exports Slump 19% in First Quarter,” Reu-ters, May 14.
Songhurst, Brian. 2017. “The Outlook for Floating Storage and Regasification Units (FSRUs),” Oxford Institute for Energy Studies.
Stern, Jonathan. 2020. “Methane Emissions from Natural Gas and LNG Imports: an increas-ingly urgent issue for the future of gas in Europe,” OIES Paper, NG 165, The Oxford Insti-tute for Energy Studies.

Ministry of Economy and Finance (MOEF) Sejong Government Complex, 477, Galmae-ro, Sejong-si 30109, Republic of KoreaTel. 82-44-215-7747 www.moef.go.kr
Korea Development Institute (KDI)Namsejong-ro, 263, Sejong-si 30149, Republic of KoreaTel. 82-44-550-4114 www.kdi.re.kr
Hanyang University (HYU)Wangsimni-ro 222, Seongdong-gu, Seoul, 04763, Republic of KoreaTel. 82-2-2220-0114 www.hanyang.ac.kr
Knowledge Sharing Program (KSP)www.ksp.go.kr
ISBN 979-11-5932-658-5ISBN 979-11-5932-641-7 (set)
9 791159 325762
9 4 3 2 0