2020 developer fee justification study washington unified ...
46
2020 DEVELOPER FEE JUSTIFICATION STUDY WASHINGTON UNIFIED SCHOOL DISTRICT LINDA LUNA, SUPERINTENDENT SCHOOLWORKS, INC. 8331 Sierra College Blvd., #221 Roseville, CA 95661 PHONE: 916-733-0402 WWW.SCHOOLWORKSGIS.COM APRIL 2020
-
Upload
khangminh22 -
Category
Documents
-
view
0 -
download
0
Transcript of 2020 developer fee justification study washington unified ...

2020 DEVELOPER FEE JUSTIFICATION STUDY WASHINGTON UNIFIED SCHOOL DISTRICT
LINDA LUNA, SUPERINTENDENT
SCHOOLWORKS, INC. 8331 Sierra College Blvd., #221
Roseville, CA 95661
PHONE: 916-733-0402 WWW.SCHOOLWORKSGIS.COM
APRIL 2020

Washington Unified School District
2020 Developer Fee Justification Study April 2020
TABLE OF CONTENTS
Executive Summary ......................................................................................................1
Background ....................................................................................................................2
Purpose and Intent ........................................................................................................3
Burden Nexus .....................................................................................................3
Cost Nexus ..........................................................................................................3
Benefit Nexus ......................................................................................................3
Enrollment Projections .................................................................................................4
Student Generation Factor ..................................................................................5
New Residential Development Projections .........................................................6
Existing Facility Capacity .............................................................................................7
Classroom Loading Standards ...........................................................................7
Existing Facility Capacity ....................................................................................8
Unhoused Students by State Housing Standards ..............................................9
Calculation of Development’s Fiscal Impact on Schools .........................................11
Reconstruction/Modernization Costs ..................................................................11
Impact of New Residential Development ............................................................13
Impact of Other Residential Development ..........................................................14
Impact of Commercial/Industrial Development ...................................................15
Employees per Square Foot of Commercial Development ................................15
Students per Employee .......................................................................................16
School Facilities Cost per Student ......................................................................16
Residential Offset ................................................................................................16
Net Cost per Square Foot ...................................................................................18
Verifying the Sufficiency of the Development Impact .........................................18
District Map ....................................................................................................................19
Conclusion .....................................................................................................................20
Burden Nexus .....................................................................................................20
Cost Nexus ..........................................................................................................20
Benefit Nexus ......................................................................................................20

Washington Unified School District
2020 Developer Fee Justification Study April 2020
Appendices
SAB 50-01 - Enrollment Certification/Projection
Facility Master Plan Executive Summary
Census Data
Use of Developer Fees
Site Development Costs
Index Adjustment on the Assessment for Development – State Allocation Board Meeting of January 22, 2020
Annual Adjustment to School Facility Program Grants

Washington Unified School District
2020 Developer Fee Justification Study April 2020
Page 1
Executive Summary
This Developer Fee Justification Study demonstrates that the Washington Unified School
District requires the full statutory impact fee to accommodate impacts from development
activity.
A fee of $3.79 per square foot for residential construction and a fee of $0.61 per square foot
for commercial/industrial construction is currently assessed on applicable permits pulled in
the District. The new fee amounts are $4.08 per square foot for residential construction and
$0.66* per square foot for commercial/industrial construction. This proposed increase
represents $0.29 per square foot and $0.05 per square foot for residential and commercial/
industrial construction, respectively.
The following table shows the impacts of the new fee amounts:
Table 1
Washington Unified
Developer Fee Collection Rates
Totals Previous New Change
Residential $3.79 $4.08 $0.29
Commercial/Ind. $0.61 $0.66 $0.05
*except for Rental Self Storage facilities in which a fee of $0.13 per square foot is justified.
The total projected number of housing units to be built over the next five years is 1,330. The
average square feet per unit is 1,259. This Study demonstrates a need of $9.55 per square
foot for residential construction.

Washington Unified School District
2020 Developer Fee Justification Study April 2020
Page 2
Background
Education Code Education Code Section 17620 allows school districts to assess fees on
new residential and commercial construction within their respective boundaries. These fees
can be collected without special city or county approval, to fund the construction of new
school facilities necessitated by the impact of residential and commercial development
activity. In addition, these fees can also be used to fund the reconstruction of school facilities
to accommodate students generated from new development projects. Fees are collected
immediately prior to the time of the issuance of a building permit by the City or the County.
As enrollment increases, additional school facilities will be needed to house the growth in the
student population. Because of the high cost associated with constructing school facilities
and the District’s limited budget, outside funding sources are required for future school
construction. State and local funding sources for the construction and/or reconstruction of
school facilities are limited.
The authority sited in Education Code Section 17620 states in part “… the governing board
of any school district is authorized to levy a fee, charge, dedication or other form of
requirement against any development project for the construction or reconstruction of school
facilities.” The legislation originally established the maximum fee rates at $1.50 per square
foot for residential construction and $0.25 per square foot for commercial/industrial
construction. Government Code Section 65995 provides for an inflationary increase in the
fees every two years based on the changes in the Class B construction index. As a result of
these adjustments, the fees authorized by Education Code 17620 are currently $4.08 per
square foot of residential construction and $0.66 per square foot of commercial or industrial
construction.

Washington Unified School District
2020 Developer Fee Justification Study April 2020
Page 3
Purpose and Intent
Prior to levying developer fees, a district must demonstrate and document that a reasonable
relationship exists between the need for new or reconstructed school facilities and
residential, commercial and industrial development. The justification for levying fees is
required to address three basic links between the need for facilities and new development.
These links or nexus are:
Burden Nexus: A district must identify the number of students anticipated to be generated by
residential, commercial and industrial development. In addition, the district shall identify the
school facility and cost impact of these students.
Cost Nexus: A district must demonstrate that the fees to be collected from residential,
commercial and industrial development will not exceed the cost of providing school facilities
for the students to be generated from the development.
Benefit Nexus: A district must show that the construction or reconstruction of school facilities
to be funded by the collection of developer fees will benefit the students generated by
residential, commercial and industrial development.
The purpose of this Study is to document if a reasonable relationship exists between
residential, commercial and industrial development and the need for new and/or modernized
facilities in the Washington Unified School District.
Following in this Study will be figures indicating the current enrollment and the projected
development occurring within the attendance boundaries of the Washington Unified School
District. The projected students will then be loaded into existing facilities to the extent of
available space. Thereafter, the needed facilities will be determined and an estimated cost
will be assigned. The cost of the facilities will then be compared to the area of residential,
commercial and industrial development to determine the amount of developer fees justified.

Washington Unified School District
2020 Developer Fee Justification Study April 2020
Page 4
Enrollment Projections
In 2019/2020 the District’s total enrollment (CBEDS) was 7,644 students. The enrollment by
grade level is shown here in Table 2.
Table 2
Washington Unified
CURRENT ENROLLMENT
Grade 2019/2020
TK/K 675
1 576
2 552
3 556
4 550
5 555
6 587
TK-6 Total 4,051
7 590
8 639
7-8 Total 1,229
9 597
10 587
11 652
12 528
9-12 Total 2,364
TK-12 Total 7,644
This data will be the basis for the enrollment projections which will be presented later after a
review of the development projections and the student generation factors.

Washington Unified School District
2020 Developer Fee Justification Study April 2020
Page 5
Student Generation Factor
In determining the impact of new development, the District is required to show how many
students will be generated from the new developments. In order to ensure that new
development is paying only for the impact of those students that are being generated by new
homes and businesses, the student generation factor is applied to the number of new
housing units to determine development-related impacts.
The student generation factor identifies the number of students per housing unit and
provides a link between residential construction projects and projections of enrollment. The
State-wide factor used by the Office of Public School Construction is 0.70 for grades TK-12.
For the purposes of this Study we will use the local factors to determine the students
generated from new housing developments. This was done by comparing the number of
housing units in the school district to the number of students in the school district as of the
2010 Census. Table 3 shows the student generation factors for the various grade groupings.
Table 3
Washington Unified
STUDENT GENERATION FACTORS
Grades Students per Household
TK-6 0.2346
7-8 0.0668
9-12 0.1255
Total 0.4268
When using the Census data to determine the average district student yield rate, it is not
possible to determine which students were living in multi-family units versus single family
units. Therefore, only the total average yield rate is shown. The Census data does indicate
that 65.2% of the total housing units within the district boundaries are single family units. It is
reasonable to assume that the construction of new housing units would be similar to the
current housing stock, which was confirmed by the various planning departments within the
school district boundaries, and therefore the overall student generation rate will be used to
determine student yields from the projected developments.

Washington Unified School District
2020 Developer Fee Justification Study April 2020
Page 6
New Residential Development Projections
The Washington Unified School District has experienced an average new residential
construction rate of approximately 266 units per year over the past four years. This was
determined by reviewing the residential permits pulled and school development impact fees
paid to the District. After contacting the various city planning departments within the school
district boundaries, it was determined that the residential construction rate over the next five
years will average 266 units per year. Projecting the average rate forward, we would expect
that 1,330 units of residential housing will be built within the District boundaries over the next
five years.
To determine the impact of residential development, a student projection is done. Applying
the student generation factor of 0.4268 to the projected 1,330 units of residential housing, we
expect that 568 students will be generated from the new residential construction over the
next five years. This includes 312 elementary school students, 89 middle school students,
and 167 high school students.
The following table shows the projected impact of new development. The students generated
by development will be utilized to determine the facility cost impacts to the school district.
Table 4
Washington Unified
DEVELOPMENT IMPACT ANALYSIS
Current Development Projected
Grades Enrollment Projection Enrollment
TK to 6 4,051 312 4,363
7 to 8 1,229 89 1,318
9 to 12 2,364 167 2,531
Totals 7,644 568 8,212

Washington Unified School District
2020 Developer Fee Justification Study April 2020
Page 7
Existing Facility Capacity
To determine the need for additional school facilities, the capacity of the existing facilities must
be identified and compared to current and anticipated enrollments. The District’s existing
building capacity will be calculated using the State classroom loading standards shown in
Table 6. The following types of “support-spaces” necessary for the conduct of the District’s
comprehensive educational program, are not included as “teaching stations,” commonly known
as “classrooms” to the public:
Table 5
List of Core and Support Facilities
Library Resource Specialist Multipurpose Room Gymnasium Office Area Lunch Room Staff Workroom P.E. Facilities
Because the District requires these types of support facilities as part of its existing facility and
curriculum standards at its schools, new development’s impact must not materially or
adversely affect the continuance of these standards. Therefore, new development cannot
require that the District house students in these integral support spaces.
Classroom Loading Standards
The following maximum classroom loading-factors are used to determine teaching-station
“capacity,” in accordance with the State legislation and the State School Building Program.
These capacity calculations are also used in preparing and filing the baseline school capacity
statement with the Office of Public School Construction.
Table 6
State Classroom Loading Standards
TK/Kindergarten 25 Students/Classroom
1st-3rd Grades 25 Students/Classroom
4th-6th Grades 25 Students/Classroom
7th-8th Grades 27 Students/Classroom
9th-12th Grades 27 Students/Classroom
Non Severe Special Ed 13 Students/Classroom

Washington Unified School District
2020 Developer Fee Justification Study April 2020
Page 8
Existing Facility Capacity
The State determines the baseline capacity by either loading all permanent teaching stations
plus a maximum number of portables equal to 25% of the number of permanent classrooms or
by loading all permanent classrooms and only portables that are owned or have been leased
for over 5 years. As allowed by law and required by the State, facility capacities are calculated
by identifying the number of teaching stations at each campus. All qualified teaching stations
were included in the calculation of the capacities at the time the initial inventory was
calculated. To account for activity and changes since the baseline was established in 1998/99,
the student grants (which represent the seats added either by new schools or additions to
existing schools) for new construction projects funded by OPSC have been added. Using
these guidelines the District’s current State calculated capacity is shown in Table 7.
Table 7
Washington Unified
Summary of Existing Facility Capacity
Total State State Total
Permanent Portable Chargeable Chargeable Loading Funded State
School Facility Classrooms Classrooms Portables Classrooms Factor Projects Capacity
Grades TK-6 112 28 21 133 25 2,039 5,364
Grades 7-8 30 21 16 46 27 702 1,944
Grades 9-12 49 19 14 63 27 915 2,616
Special Ed 13 0 0 13 13 69 238
Totals 204 68 51 255 3,725 10,162
OPSC Funded Projects
Name Project # TK-6 Grants 7-8 Grants 9-12 Grants Special Ed CR
Bridgeway Island El 1 450 0 0 9 19
River City Sen High 2 0 0 162 0 6
Withdrawn 3 0 0 0 0 0
Stonegate Elem 4 675 108 0 26 33
Stonegate Elem 5 75 0 0 0 3
River City Sen High 6 472 0 753 34 84
Elkhorn Village Elem 7 0 297 0 0 11
Southport Elem 8 100 162 0 0 10
Bridgeway Island El 9 100 135 0 0 9
Stonegate Elem 10 92 0 0 0 4
Riverbank Elem 11 75 0 0 0 3
Totals 2,039 702 915 69 182
This table shows a basic summary of the form and procedures used by OPSC (Office of Public
School Construction) to determine the capacity of a school district. There were a total of 204

Washington Unified School District
2020 Developer Fee Justification Study April 2020
Page 9
permanent classrooms in the District when the baseline was established. In addition, there
were 68 portable classrooms. However, OPSC regulations state that if the number of portables
exceeds 25% of the permanent classrooms, then the maximum number of portables to be
counted in the baseline capacity is 25% of the permanent classrooms. Therefore, the chart
shows the chargeable portables as 51 which is 25% of the permanent classroom count. This
results in a total classroom count of 255 and is referred to as the chargeable classrooms since
it accounts for the fact that some of the portable were not included in the total. This is done to
account for the fact that portables are typically considered to be temporary, especially when
the total number exceeds 25% of the permanent classrooms.
To determine the total capacity based on State standards, the capacity of the chargeable
classrooms are multiplied by the State loading standards and then the capacity of the projects
completed since 1998/99 (when the baseline was established) are added based on the State
funded new construction projects. As Table 7 shows, the total State capacity of the District
facilities is 10,162 students.
Unhoused Students by State Housing Standards
This next table compares the facility capacity with the space needed to determine if there is
available space for new students from the projected developments. The space needed was
determined by reviewing the historic enrollments over the past four years along with the
projected enrollment in five years to determine the number of seats needed to house the
students within the existing homes. The seats needed were determined individually for each
grade grouping. The projected enrollment in this analysis did not include the impact of any
new housing units.
Table 8
Washington Unified
Summary of Available District Capacity
State Space Available
School Facility Capacity Needed Capacity
Grades TK-6 5,364 4,232 1,132
Grades 7-8 1,944 1,200 744
Grades 9-12 2,616 2,309 307
Special Ed 238 186 52
Totals 10,162 7,927 2,235

Washington Unified School District
2020 Developer Fee Justification Study April 2020
Page 10
The District capacity of 10,162 is more than the space needed of 7,927, assuming the existing
facilities remain in sufficient condition to maintain existing levels of service. The difference is
2,235 students.

Washington Unified School District
2020 Developer Fee Justification Study April 2020
Page 11
Calculation of Development’s Fiscal Impact on Schools
This section of the Study will demonstrate that a reasonable relationship exists between
residential, commercial/industrial development and the need for school facilities in the
Washington Unified School District. To the extent this relationship exists, the District is
justified in levying developer fees as authorized by Education Code Section 17620.
Reconstruction/Modernization Costs
In addition to any new facilities needed, there is also a need to reconstruct or modernize
existing facilities in order to maintain the existing levels of service as students from new
development continue to arrive in the District’s facilities. In order to generate capacity, it may
also be necessary to reopen closed school facilities. Such reopening often requires
reconstruction in order to provide the District’s existing level of service. For purposes of this
report, the analysis of modernization/reconstruction includes the possible reopening and
refurbishing of closed or unused school facilities.
California has made a significant investment in school facilities through grants provided to help
extend the useful life of public schools. The State’s largest funding source for public school
modernization projects, the School Facilities Program (SFP), requires a minimum local funding
contribution of 40% of SFP-eligible costs. The State may provide up to 60% of the eligible
costs at those times that State funding is available. However, SFP modernization grants
frequently, if not usually, fall short of providing 60% of the actual costs for major
modernizations. In the best cases, developer fees can help meet the District’s required 40%
local share. In many cases, developer fees may be necessary to supplement both the State’s
and the school district’s contribution to a project.
Buildings generate eligibility for State reconstruction/modernization funding once they reach
an age of 25 years old for permanent buildings and 20 years old for portables.
The usable life of school facilities is an important consideration in determining district facility
needs into the future. The specific time when the projected residential developments will be
built cannot be precisely predicted. Some new homes may be immediately occupied by
families with school aged children, while others may be immediately occupied who will have
school-aged children in five to ten years. As a result of these variables, for each new home,
the District must be prepared to house the students residing there for an extended period of
time. Students generated by the next five years of development will need to be

Washington Unified School District
2020 Developer Fee Justification Study April 2020
Page 12
accommodated in District schools for a significant amount of time that could exceed twenty
years. Thus, the District will need to ensure that it has facilities in place for future decades.
As evidenced by the State Building program’s use of the criteria that buildings older than
twenty-five years (and portables older than twenty years) are eligible for modernization
funds, school buildings require reconstruction/modernization to remain in use for students
beyond the initial twenty to twenty-five years of life of those buildings. To the extent that the
District has buildings older than twenty to twenty-five years old, the point will be reached
without reconstruction/modernization that those buildings will no longer be able to provide
the existing level of service to students, and may, in some circumstances, need to be closed
entirely for health and safety reasons. However, because of the new development,
reconstruction/modernization must occur in order to have available school housing for the
new students from development.
The following table shows the District’s eligibility for modernization/reconstruction funding in
the State Building Program.
Table 9
Modernization Project Needs
State District Project
School Elem Middle High Spec Ed Funding Share Total
Bridgeway Island Elem 125 0 0 0 $653,359 $435,573 $1,088,931
Evergreen Elem 406 0 0 0 $2,045,115 $1,363,410 $3,408,526
Westfield Village Elem 452 0 0 0 $2,276,828 $1,517,885 $3,794,713
Elkhorn Village K-8 383 114 0 0 $2,535,559 $1,690,373 $4,225,932
Riverbank K-8 873 261 0 0 $5,785,609 $3,857,073 $9,642,682
Westmore Oaks K-8 936 279 0 0 $6,198,686 $4,132,458 $10,331,144
Fallbrook Site 430 128 0 0 $2,846,767 $1,897,844 $4,744,611
BCCT and WMCH 0 0 368 0 $2,545,070 $1,696,713 $4,241,783
Southport K-8 364 109 0 0 $2,413,260 $1,608,840 $4,022,099
TOTALS 3,969 891 368 0 $27,300,253 $18,200,168 $45,500,421
Eligible Modernization Grants

Washington Unified School District
2020 Developer Fee Justification Study April 2020
Page 13
Table 10
New Development Share of Modernization Costs
Eligible
Modernization
Grade Grants Students $/Student Amount
TK-6 3,969 312 $25,350 $7,909,200
7-8 891 89 $26,874 $2,391,786
9-12 368 167 $34,096 $5,694,032
Totals 5,228 568 $15,995,018
Includes students from new developments not housed in new facilities.
Amounts based on State OPSC budgets for new construction projects.
New Development
This data is used to show that there are significant needs within the school District to invest
in its existing facilities. Without modernizing its schools, the District could be forced to begin
closing some of its buildings and schools.
To accurately account for the amount of the modernization projects attributed to the impact
of new developments, only the students from new developments that were not already
housed in new facilities are included in the net needs for modernization projects. As can be
seen in the charts, the net modernization needs due to new development impacts are much
less than the total District modernization needs.
Impact of New Residential Development
This next table compares the development-related enrollment to the available district
capacity for each grade level and then multiplies the unhoused students by the new school
construction costs to determine the total school facility costs related to the impact of new
residential housing developments.
The modernization needs are included for the students not housed in new facilities but who
would be housed in existing facilities that are eligible for and need to be modernized to
provide adequate housing and to maintain the existing level of service for the students
generated by development.

Washington Unified School District
2020 Developer Fee Justification Study April 2020
Page 14
Table 11
Washington Unified
Summary of Residential Impact
Total
School Development Available Net Construction Cost Facility
Facility Projection Space Unhoused Per Student Costs
Elementary 312 1,132 0 $25,350 $0
Middle 89 744 0 $26,874 $0
High & Cont. 167 307 0 $34,096 $0
Site Purchase: 0.0 acres $0
Site Development: $0
New Construction Needs: $0
Modernization Needs: $15,995,018
TOTAL NEEDS: $15,995,018
Average cost per student: $28,160
Total Residential Sq Ft: 1,674,470
Residential Fee Justified: $9.55
The total need for school facilities based solely on the impact of the 1,330 new housing units
projected over the next five years totals $15,995,018. To determine the impact per square
foot of residential development, this amount is divided by the total square feet of the
projected developments. As calculated from the historic Developer Fee Permits, the average
size home built has averaged 1,259 square feet. The total area for 1,330 new homes would
therefore be 1,674,470 square feet. The total residential fee needed to be able to collect
$15,995,018 would be $9.55 per square foot.
Impact of Other Residential Development
In addition to new residential development projects that typically include new single family
homes and new multi-family units, the District can also be impacted by additional types of
new development projects. These include but are not limited to redevelopment projects,
additions to existing housing units, and replacement of existing housing units with new
housing units.

Washington Unified School District
2020 Developer Fee Justification Study April 2020
Page 15
These development projects are still residential projects and therefore it is reasonable to
assume they would have the same monetary impacts per square foot as the new residential
development projects. However, the net impact is reduced due to the fact that there was a
previous residential building in its place. Therefore, the development impact fees should only
be charged for other residential developments if the new building(s) exceed the square
footage area of the previous building(s). If the new building is larger than the existing
building, then it is reasonable to assume that additional students could be generated by the
project. The project would only pay for the development impact fees for the net increase in
assessable space generated by the development project. Education Code allows for an
exemption from development impacts fees for any additions to existing residential structures
that are 500 square feet or less. As of January 1, 2020, ADU’s (accessory dwelling units) are
only charged if they are more than 750 square feet according to Senate Bill 13.
Impact of Commercial/Industrial Development
There is a correlation between the growth of commercial/industrial firms/facilities within a
community and the generation of school students within most business service areas. Fees for
commercial/industrial can only be imposed if the residential fees will not fully mitigate the cost
of providing school facilities to students from new development.
The approach utilized in this section is to apply statutory standards, U.S. Census employment
statistics, and local statistics to determine the impact of future commercial/industrial development
projects on the District. Many of the factors used in this analysis were taken from the U.S.
Census, which remains the most complete and authoritative source of information on the
community in addition to the “1990 SanDAG Traffic Generators Report”.
Employees per Square Foot of Commercial Development
Results from a survey published by the San Diego Association of Governments “1990 San
DAG Traffic Generators” are used to establish numbers of employees per square foot of
building area to be anticipated in new commercial or industrial development projects. The
average number of workers per 1,000 square feet of area ranges from 0.06 for Rental Self
Storage to 4.79 for Standard Commercial Offices. The generation factors from that report are
shown in the following table.

Washington Unified School District
2020 Developer Fee Justification Study April 2020
Page 16
Table 12
Commercial/Industrial Average Square Foot Employees Per Average
Category Per Employee Square Foot
Banks 354 0.00283
Community Shopping Centers 652 0.00153
Neighborhood Shopping Centers 369 0.00271
Industrial Business Parks 284 0.00352
Industrial Parks 742 0.00135
Rental Self Storage 15541 0.00006
Scientific Research & Development 329 0.00304
Lodging 882 0.00113
Standard Commercial Office 209 0.00479
Large High Rise Commercial Office 232 0.00431
Corporate Offices 372 0.00269
Medical Offices 234 0.00427
Source: 1990 SanDAG Traffic Generators report
Students per Employee
The number of students per employee is determined by using the 2008-2012 American
Community Survey 5-Year Estimates and the 2010 QT-H1 Summary File for the District. There
were 20,582 employees and 17,415 homes in the District. This represents a ratio of 1.1819
employees per home.
There were 7,433 school age children attending the District in 2010. This is a ratio of 0.3611
students per employee. This ratio, however, must be reduced by including only the percentage
of employees that worked in their community of residence (30.6%), because only those
employees living in the District will impact the District’s school facilities with their children. The
net ratio of students per employee in the District is 0.1105.
School Facilities Cost per Student
Facility costs for housing commercially generated students are the same as those used for
residential construction. The cost factors used to assess the impact from commercial
development projects are contained in Table 11.
Residential Offset
When additional employees are generated in the District as a result of new
commercial/industrial development, fees will also be charged on the residential units
necessary to provide housing for the employees living in the District. To prevent a commercial
or industrial development from paying for the portion of the impact that will be covered by the
residential fee, this amount has been calculated and deducted from each category. The

Washington Unified School District
2020 Developer Fee Justification Study April 2020
Page 17
residential offset amount is calculated by multiplying the following factors together and dividing
by 1,000 (to convert from cost per 1,000 square feet to cost per square foot).
Employees per 1,000 square feet (varies from a low of 0.06 for rental self storage to a
high of 4.79 for office building).
Percentage of employees that worked in their community of residence (30.6 percent).
Housing units per employee (0.8461). This was derived from the 2008-2012 ACS 5
Year Estimates data for the District, which indicates there were 20,582 employees, and
the 2010 QT-H1 Summary File data for the District, which indicates there were 17,415
housing units.
Percentage of employees that will occupy new housing units (75 percent).
Average square feet per dwelling unit (1,259).
Residential fee charged by the District ($4.08 per square foot).
Average cost per student was determined in Table 11.
The following table shows the calculation of the school facility costs generated by a square foot
of new commercial/industrial development for each category of development.
Table 13
Washington Unified
Summary of Commercial and Industrial Uses
Employees Students Students Average Cost Residential Net Cost
per 1,000 per per Cost per per offset per per
Type Sq. Ft. Employee 1,000 Sq. Ft. Student Sq. Ft. Sq. Ft. Sq. Ft.
Banks 2.83 0.1105 0.313 $28,160 $8.81 $2.82 $5.98
Community Shopping Centers 1.53 0.1105 0.169 $28,160 $4.76 $1.53 $3.24
Neighborhood Shopping Centers 2.71 0.1105 0.299 $28,160 $8.43 $2.70 $5.73
Industrial Business Parks 3.52 0.1105 0.389 $28,160 $10.95 $3.51 $7.44
Industrial Parks 1.35 0.1105 0.149 $28,160 $4.20 $1.35 $2.85
Rental Self Storage 0.06 0.1105 0.007 $28,160 $0.19 $0.06 $0.13
Scientific Research & Development 3.04 0.1105 0.336 $28,160 $9.46 $3.03 $6.43
Lodging 1.13 0.1105 0.125 $28,160 $3.52 $1.13 $2.39
Standard Commercial Office 4.79 0.1105 0.529 $28,160 $14.91 $4.78 $10.13
Large High Rise Commercial Office 4.31 0.1105 0.476 $28,160 $13.41 $4.30 $9.11
Corporate Offices 2.69 0.1105 0.297 $28,160 $8.37 $2.68 $5.69
Medical Offices 4.27 0.1105 0.472 $28,160 $13.29 $4.26 $9.03
*Based on 1990 SanDAG Traffic Generator Report

Washington Unified School District
2020 Developer Fee Justification Study April 2020
Page 18
Net Cost per Square Foot
Since the State Maximum Fee is now $0.66 for commercial/industrial construction, the District
is justified in collecting the maximum fee for all categories with the exception of Rental Self
Storage. The District can only justify collection of $0.13 per square foot of Rental Self Storage
construction.
Verifying the Sufficiency of the Development Impact
Education Code Section 17620 requires districts to find that fee revenues will not exceed the
cost of providing school facilities to the students generated by the development paying the
fees. This section shows that the fee revenues do not exceed the impact of the new
development.
The total need for school facilities resulting from new development totals $15,995,018. The
amount the District would collect over the five year period at the maximum rate of $4.08 for
residential and $0.66 for commercial/industrial development would be as follows:
$4.08 x 1,330 homes x 1,259 sq ft per home = $6,831,838 for Residential
$0.66 x 450,389 sq ft per year x 5 years = $1,486,284 for Commercial/Industrial
Total projected 5 year income: $8,318,122
The estimated income is less than the projected facility needs due to the impact of new
development projects.

Washington Unified School District
2020 Developer Fee Justification Study April 2020
Page 19
District Map
The following map shows the extent of the areas for which development fees are applicable
to the Washington Unified School District.
WASHINGTON UNIFIEDWASHINGTON UNIFIEDWASHINGTON UNIFIEDWASHINGTON UNIFIEDWASHINGTON UNIFIEDWASHINGTON UNIFIEDWASHINGTON UNIFIEDWASHINGTON UNIFIEDWASHINGTON UNIFIED
SCHOOL DISTRICTSCHOOL DISTRICTSCHOOL DISTRICTSCHOOL DISTRICTSCHOOL DISTRICTSCHOOL DISTRICTSCHOOL DISTRICTSCHOOL DISTRICTSCHOOL DISTRICT
Sta
te H
wy
84
Sta
te H
wy
84
Sta
te H
wy
84
Sta
te H
wy
84
Sta
te H
wy
84
Sta
te H
wy
84
Sta
te H
wy
84
Sta
te H
wy
84
Sta
te H
wy
84
I 80I 80I 80I 80I 80I 80I 80I 80I 80

Washington Unified School District
2020 Developer Fee Justification Study April 2020
Page 20
Conclusion
Based on the data contained in this Study, it is found that a reasonable relationship exists
between residential, commercial/industrial development and the need for school facilities in
the Washington Unified School District. The following three nexus tests required to show
justification for levying fees have been met:
Burden Nexus: New residential development will generate an average of 0.4268 TK-12
grade students per unit. Because the District does not have adequate facilities for all the
students generated by new developments, the District will need to build additional facilities
and/or modernize/reconstruct the existing facilities in order to maintain existing level of
services in which the new students will be housed.
Cost Nexus: The cost to provide new and reconstructed facilities is an average of $9.55 per
square foot of residential development. Each square foot of residential development will
generate $4.08 in developer fees resulting in a shortfall of $5.47 per square foot.
Benefit Nexus: The developer fees to be collected by the Washington Unified School District
will be used for the provision of additional and reconstructed or modernized school facilities.
This will benefit the students to be generated by new development by providing them with
adequate educational school facilities.
The District’s planned use of the fees received from development impacts will include the
following types of projects, each of which will benefit students from new developments.
1) New Schools: When there is enough development activity occurring in a single
area, the District will build a new school to house the students from new
developments.
2) Additions to Existing Schools: When infill development occurs, the District will
accommodate students at existing schools by building needed classrooms and/or
support facilities such as cafeterias, restrooms, gyms and libraries as needed to
increase the school capacity. Schools may also need upgrades of the technology
and tele-communication systems to be able to increase their capacity.

Washington Unified School District
2020 Developer Fee Justification Study April 2020
Page 21
3) Portable Replacement Projects: Some of the District’s capacity is in temporary
portables and therefore may not be included in the State’s capacity calculations.
These portables can be replaced with new permanent or modular classrooms to
provide adequate space for students from new developments. These projects
result in an increase to the facility capacity according to State standards. In
addition, old portables that have reached the end of their life expectancy, will need
to be replaced to maintain the existing level of service. These types of projects are
considered modernization projects in the State Building Program. If development
impacts did not exist, the old portables could be removed.
4) Modernization/Upgrade Projects: In many cases, students from new developments
are not located in areas where new schools are planned to be built. The District
plans to modernize or upgrade older schools to be equivalent to new schools so
students will be housed in equitable facilities to those students housed in new
schools. These projects may include updates to the building structures to meet
current building standards, along with upgrades to the current fire and safety
standards and any access compliance standards.
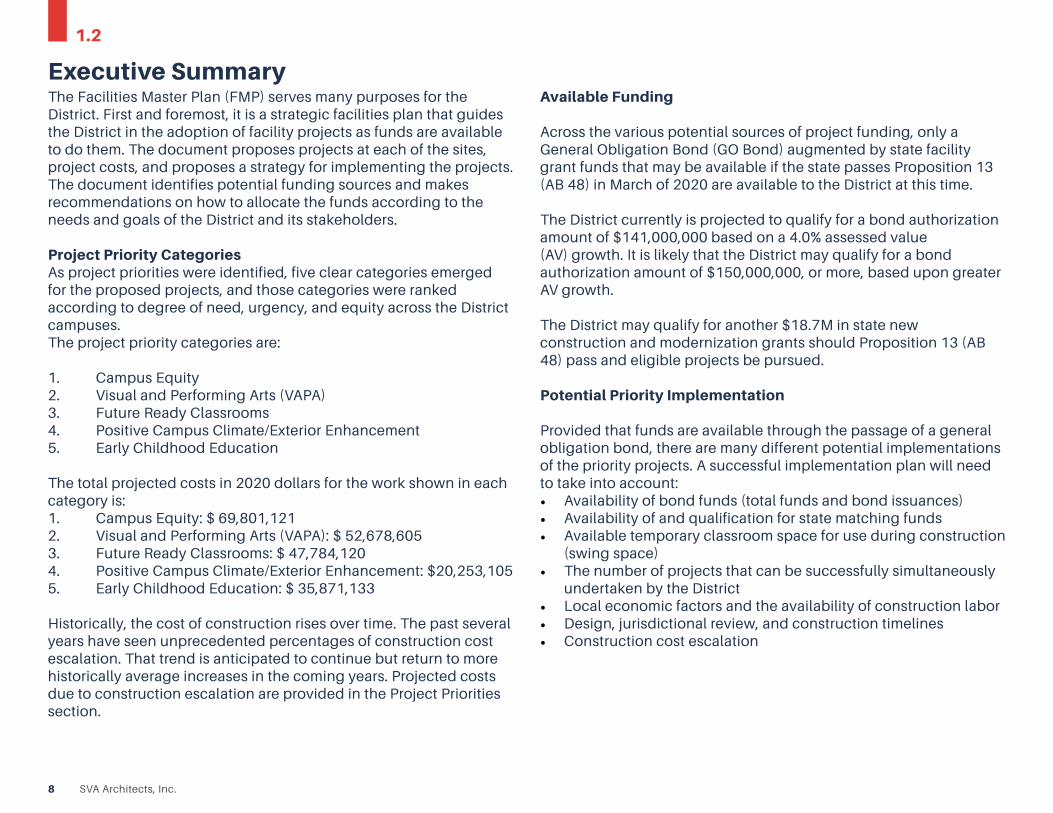
The District plans to use the developer fees on items listed in its 2020 Facilities Master Plan.
The Executive Summary shows total projected costs in 2020 dollars by category. This is
included in the appendices.
The reasonable relationship identified by these findings provides the required justification for
the Washington Unified School District to levy the maximum fees of $4.08 per square foot for
residential construction and $0.66 per square foot for commercial/industrial construction,
except for Rental Self Storage facilities in which a fee of $0.13 per square foot is justified as
authorized by Education Code Section 17620.

Appendices2020 Developer Fee Justification Study Washington Unified School District

STATE OF CALIFORNIA STATE ALLOCATION BOARDENROLLMENT CERTIFICATION/PROJECTION OFFICE OF PUBLIC SCHOOL CONSTRUCTIONSAB 50-01 (REV 05/09) Page 6 of 6 SCHOOL DISTRICT FIVE DIGIT DISTRICT CODE NUMBER (see California Public School Directory )
COUNTY HIGH SCHOOL ATTENDANCE AREA (HSAA) OR SUPER HSAA ( if applicable )
Check one: Fifth-Year Enrollment Projection Tenth-Year Enrollment Projection Part G. Number of New Dwelling UnitsHSAA Districts Only - Check one: Attendance Residency (Fifth-Year Projection Only)
Residency - COS Districts Only - (Fifth Year Projection Only)Modified Weighting (Fifth-Year Projection Only) Part H. District Student Yield FactorAlternate Weighting - (Fill in boxes to the right): (Fifth-Year Projection Only)
Part I. Projected Enrollment Part A. K-12 Pupil Data 1. Fifth-Year Projection
7th Prev. 6th Prev. 5th Prev. 4th Prev. 3rd Prev. 2nd Prev. Previous Current Enrollment/Residency - (except Special Day Class pupils)Grade / / / / / / / / K-6 7-8 9-12 TOTAL
K12 Special Day Class pupils only - Enrollment/Residency3 TOTAL4 Non-Severe
5 Severe
6 TOTAL78 2. Tenth-Year Projection9 Enrollment/Residency - (except Special Day Class pupils)
10 K-6 7-8 9-12 TOTAL1112
TOTAL Special Day Class pupils only - Enrollment/ResidencyTOTAL
Part B. Pupils Attending Schools Chartered By Another District Non-Severe
7th Prev. 6th Prev. 5th Prev. 4th Prev. 3rd Prev. 2nd Prev. Previous Current Severe
TOTAL
Part C. Continuation High School Pupils - (Districts Only)Grade 7th Prev. 6th Prev. 5th Prev. 4th Prev. 3rd Prev. 2nd Prev. Previous Current
9101112
TOTAL
Part D. Special Day Class Pupils - (Districts or County Superintendent of Schools)TOTAL
Non-Severe
Severe
TOTAL
Part E. Special Day Class Pupils - (County Superintendent of Schools Only)7th Prev. 6th Prev. 5th Prev. 4th Prev. 3rd Prev. 2nd Prev. Previous Current NAME OF DISTRICT REPRESENTATIVE (PRINT OR TYPE)
/ / / / / / / /SIGNATURE OF DISTRICT REPRESENTATIVE
Part F. Birth Data - (Fifth-Year Projection Only) DATE TELEPHONE NUMBER
County Birth Data Birth Data by District ZIP Codes Estimate Estimate Estimate8th Prev. 7th Prev. 6th Prev. 5th Prev. 4th Prev. 3rd Prev. 2nd Prev. Previous Current E-MAIL ADDRESS
3rd Prev. to 2nd Prev.
2nd Prev. to Prev.
Previous to Current
SecondaryElementary
Elementary Secondary
Elementary Secondary
I certify, as the District Representative, that the information reported on this form and, when applicable, the High School Attendance Area Residency Reporting Worksheet attached, is true and correct and that: • I am designated as an authorized district representative bythe governing board of the district. • If the district is requesting an augmentation in the enrollmentprojection pursuant to Regulation Section 1859.42.1 (a), thelocal planning commission or approval authority has approvedthe tentative subdivision map used for augmentation of theenrollment and the district has identified dwelling units in thatmap to be contracted. All subdivision maps used foraugmentation of enrollment are available at the district forreview by the Office of Public School Construction (OPSC).• This form is an exact duplicate (verbatim) of the formprovided by the Office of Public School Construction. In theevent a conflict should exist, then the language in the OPSCform will prevail.
SVA Architects, Inc.8
Executive Summary
1.2
The Facilities Master Plan (FMP) serves many purposes for the District. First and foremost, it is a strategic facilities plan that guides the District in the adoption of facility projects as funds are available to do them. The document proposes projects at each of the sites, project costs, and proposes a strategy for implementing the projects. The document identifies potential funding sources and makes recommendations on how to allocate the funds according to the needs and goals of the District and its stakeholders.
Project Priority CategoriesAs project priorities were identified, five clear categories emerged for the proposed projects, and those categories were ranked according to degree of need, urgency, and equity across the District campuses.The project priority categories are:
1. Campus Equity2. Visual and Performing Arts (VAPA)3. Future Ready Classrooms4. Positive Campus Climate/Exterior Enhancement5. Early Childhood Education
The total projected costs in 2020 dollars for the work shown in each category is:1. Campus Equity: $ 69,801,1212. Visual and Performing Arts (VAPA): $ 52,678,6053. Future Ready Classrooms: $ 47,784,1204. Positive Campus Climate/Exterior Enhancement: $20,253,1055. Early Childhood Education: $ 35,871,133
Historically, the cost of construction rises over time. The past several years have seen unprecedented percentages of construction cost escalation. That trend is anticipated to continue but return to more historically average increases in the coming years. Projected costs due to construction escalation are provided in the Project Priorities section.
Available Funding
Across the various potential sources of project funding, only a General Obligation Bond (GO Bond) augmented by state facility grant funds that may be available if the state passes Proposition 13 (AB 48) in March of 2020 are available to the District at this time.
The District currently is projected to qualify for a bond authorization amount of $141,000,000 based on a 4.0% assessed value (AV) growth. It is likely that the District may qualify for a bond authorization amount of $150,000,000, or more, based upon greater AV growth.
The District may qualify for another $18.7M in state new construction and modernization grants should Proposition 13 (AB 48) pass and eligible projects be pursued.
Potential Priority Implementation
Provided that funds are available through the passage of a general obligation bond, there are many different potential implementations of the priority projects. A successful implementation plan will need to take into account:• Availability of bond funds (total funds and bond issuances)• Availability of and qualification for state matching funds• Available temporary classroom space for use during construction
(swing space)• The number of projects that can be successfully simultaneously
undertaken by the District• Local economic factors and the availability of construction labor• Design, jurisdictional review, and construction timelines• Construction cost escalation

DP04 SELECTED HOUSING CHARACTERISTICS
2008-2012 American Community Survey 5-Year Estimates
Supporting documentation on code lists, subject definitions, data accuracy, and statistical testing can be found on the American Community Surveywebsite in the Data and Documentation section.
Sample size and data quality measures (including coverage rates, allocation rates, and response rates) can be found on the American CommunitySurvey website in the Methodology section.
Although the American Community Survey (ACS) produces population, demographic and housing unit estimates, it is the Census Bureau's PopulationEstimates Program that produces and disseminates the official estimates of the population for the nation, states, counties, cities and towns andestimates of housing units for states and counties.
Subject Washington Unified School District (Yolo County), California
Estimate Margin of Error Percent Percent Margin ofError
HOUSING OCCUPANCY
Total housing units 18,695 +/-496 18,695 (X) Occupied housing units 17,390 +/-447 93.0% +/-1.6 Vacant housing units 1,305 +/-311 7.0% +/-1.6
Homeowner vacancy rate 1.3 +/-0.8 (X) (X) Rental vacancy rate 4.8 +/-2.3 (X) (X)
UNITS IN STRUCTURE
Total housing units 18,695 +/-496 18,695 (X)1-unit, detached 12,192 +/-506 65.2% +/-2.21-unit, attached 906 +/-220 4.8% +/-1.2
2 units 465 +/-182 2.5% +/-1.0 3 or 4 units 695 +/-167 3.7% +/-0.9 5 to 9 units 1,456 +/-346 7.8% +/-1.8 10 to 19 units 607 +/-217 3.2% +/-1.2 20 or more units 1,103 +/-228 5.9% +/-1.2 Mobile home 1,196 +/-229 6.4% +/-1.2 Boat, RV, van, etc. 75 +/-78 0.4% +/-0.4
YEAR STRUCTURE BUILT
Total housing units 18,695 +/-496 18,695 (X) Built 2010 or later 14 +/-22 0.1% +/-0.1 Built 2000 to 2009 6,568 +/-410 35.1% +/-2.0 Built 1990 to 1999 1,146 +/-228 6.1% +/-1.2 Built 1980 to 1989 1,866 +/-285 10.0% +/-1.5 Built 1970 to 1979 1,797 +/-349 9.6% +/-1.9 Built 1960 to 1969 1,740 +/-273 9.3% +/-1.5 Built 1950 to 1959 3,577 +/-403 19.1% +/-2.0 Built 1940 to 1949 1,367 +/-233 7.3% +/-1.2 Built 1939 or earlier 620 +/-163 3.3% +/-0.9
ROOMS
Total housing units 18,695 +/-496 18,695 (X) 1 room 296 +/-151 1.6% +/-0.8 2 rooms 797 +/-217 4.3% +/-1.1
1 of 5 04/01/2014

Subject Washington Unified School District (Yolo County), California
Estimate Margin of Error Percent Percent Margin ofError
3 rooms 1,950 +/-308 10.4% +/-1.6 4 rooms 3,076 +/-383 16.5% +/-2.1 5 rooms 4,671 +/-493 25.0% +/-2.5 6 rooms 3,417 +/-409 18.3% +/-2.2 7 rooms 2,199 +/-329 11.8% +/-1.8 8 rooms 1,253 +/-238 6.7% +/-1.3 9 rooms or more 1,036 +/-225 5.5% +/-1.2 Median rooms 5.2 +/-0.1 (X) (X)
BEDROOMS
Total housing units 18,695 +/-496 18,695 (X) No bedroom 345 +/-151 1.8% +/-0.8 1 bedroom 2,394 +/-384 12.8% +/-2.0 2 bedrooms 4,740 +/-531 25.4% +/-2.7 3 bedrooms 6,817 +/-560 36.5% +/-2.8 4 bedrooms 3,171 +/-399 17.0% +/-2.3 5 or more bedrooms 1,228 +/-279 6.6% +/-1.5
HOUSING TENURE
Occupied housing units 17,390 +/-447 17,390 (X) Owner-occupied 10,268 +/-504 59.0% +/-2.7 Renter-occupied 7,122 +/-523 41.0% +/-2.7
Average household size of owner-occupied unit 2.77 +/-0.11 (X) (X) Average household size of renter-occupied unit 2.75 +/-0.16 (X) (X)
YEAR HOUSEHOLDER MOVED INTO UNIT
Occupied housing units 17,390 +/-447 17,390 (X) Moved in 2010 or later 2,200 +/-358 12.7% +/-2.0 Moved in 2000 to 2009 11,410 +/-477 65.6% +/-2.6 Moved in 1990 to 1999 1,805 +/-270 10.4% +/-1.6 Moved in 1980 to 1989 844 +/-203 4.9% +/-1.2 Moved in 1970 to 1979 490 +/-131 2.8% +/-0.7 Moved in 1969 or earlier 641 +/-170 3.7% +/-1.0
VEHICLES AVAILABLE
Occupied housing units 17,390 +/-447 17,390 (X) No vehicles available 1,473 +/-273 8.5% +/-1.5 1 vehicle available 6,035 +/-518 34.7% +/-2.8 2 vehicles available 6,878 +/-514 39.6% +/-2.7 3 or more vehicles available 3,004 +/-343 17.3% +/-2.0
HOUSE HEATING FUEL
Occupied housing units 17,390 +/-447 17,390 (X) Utility gas 12,133 +/-579 69.8% +/-2.6 Bottled, tank, or LP gas 240 +/-92 1.4% +/-0.5 Electricity 4,795 +/-463 27.6% +/-2.7 Fuel oil, kerosene, etc. 0 +/-27 0.0% +/-0.2 Coal or coke 0 +/-27 0.0% +/-0.2 Wood 150 +/-89 0.9% +/-0.5 Solar energy 12 +/-19 0.1% +/-0.1 Other fuel 17 +/-27 0.1% +/-0.2 No fuel used 43 +/-45 0.2% +/-0.3
SELECTED CHARACTERISTICS
Occupied housing units 17,390 +/-447 17,390 (X) Lacking complete plumbing facilities 153 +/-93 0.9% +/-0.5 Lacking complete kitchen facilities 119 +/-86 0.7% +/-0.5 No telephone service available 359 +/-147 2.1% +/-0.8
2 of 5 04/01/2014

Subject Washington Unified School District (Yolo County), California
Estimate Margin of Error Percent Percent Margin ofError
OCCUPANTS PER ROOM
Occupied housing units 17,390 +/-447 17,390 (X) 1.00 or less 16,329 +/-550 93.9% +/-1.5 1.01 to 1.50 799 +/-235 4.6% +/-1.4 1.51 or more 262 +/-130 1.5% +/-0.7
VALUE
Owner-occupied units 10,268 +/-504 10,268 (X) Less than $50,000 848 +/-186 8.3% +/-1.7 $50,000 to $99,999 337 +/-160 3.3% +/-1.5 $100,000 to $149,999 1,078 +/-226 10.5% +/-2.2 $150,000 to $199,999 1,307 +/-229 12.7% +/-2.1 $200,000 to $299,999 3,220 +/-380 31.4% +/-3.3 $300,000 to $499,999 2,937 +/-326 28.6% +/-3.0 $500,000 to $999,999 479 +/-139 4.7% +/-1.4 $1,000,000 or more 62 +/-82 0.6% +/-0.8 Median (dollars) 253,300 +/-10,205 (X) (X)
MORTGAGE STATUS
Owner-occupied units 10,268 +/-504 10,268 (X) Housing units with a mortgage 8,123 +/-454 79.1% +/-2.6 Housing units without a mortgage 2,145 +/-301 20.9% +/-2.6
SELECTED MONTHLY OWNER COSTS (SMOC)
Housing units with a mortgage 8,123 +/-454 8,123 (X) Less than $300 0 +/-27 0.0% +/-0.5 $300 to $499 152 +/-105 1.9% +/-1.3 $500 to $699 113 +/-53 1.4% +/-0.6 $700 to $999 370 +/-122 4.6% +/-1.4 $1,000 to $1,499 1,200 +/-226 14.8% +/-2.6 $1,500 to $1,999 1,962 +/-243 24.2% +/-2.8 $2,000 or more 4,326 +/-343 53.3% +/-3.4 Median (dollars) 2,082 +/-82 (X) (X)
Housing units without a mortgage 2,145 +/-301 2,145 (X) Less than $100 102 +/-78 4.8% +/-3.5 $100 to $199 255 +/-124 11.9% +/-5.2 $200 to $299 478 +/-126 22.3% +/-5.6 $300 to $399 355 +/-114 16.6% +/-5.1 $400 or more 955 +/-205 44.5% +/-6.8 Median (dollars) 372 +/-38 (X) (X)
SELECTED MONTHLY OWNER COSTS AS APERCENTAGE OF HOUSEHOLD INCOME (SMOCAPI) Housing units with a mortgage (excluding units whereSMOCAPI cannot be computed)
8,123 +/-454 8,123 (X)
Less than 20.0 percent 1,751 +/-323 21.6% +/-3.6 20.0 to 24.9 percent 1,392 +/-260 17.1% +/-3.2 25.0 to 29.9 percent 1,027 +/-260 12.6% +/-3.1 30.0 to 34.9 percent 905 +/-233 11.1% +/-2.9 35.0 percent or more 3,048 +/-422 37.5% +/-4.6
Not computed 0 +/-27 (X) (X)
Housing unit without a mortgage (excluding unitswhere SMOCAPI cannot be computed)
2,024 +/-297 2,024 (X)
Less than 10.0 percent 1,030 +/-224 50.9% +/-8.7 10.0 to 14.9 percent 402 +/-144 19.9% +/-6.5 15.0 to 19.9 percent 130 +/-71 6.4% +/-3.3
3 of 5 04/01/2014

Subject Washington Unified School District (Yolo County), California
Estimate Margin of Error Percent Percent Margin ofError
20.0 to 24.9 percent 116 +/-68 5.7% +/-3.2 25.0 to 29.9 percent 20 +/-33 1.0% +/-1.6 30.0 to 34.9 percent 77 +/-53 3.8% +/-2.5 35.0 percent or more 249 +/-123 12.3% +/-5.5
Not computed 121 +/-92 (X) (X)
GROSS RENT
Occupied units paying rent 6,829 +/-557 6,829 (X) Less than $200 23 +/-28 0.3% +/-0.4 $200 to $299 101 +/-68 1.5% +/-1.0 $300 to $499 661 +/-214 9.7% +/-3.0 $500 to $749 1,842 +/-313 27.0% +/-4.1 $750 to $999 1,324 +/-298 19.4% +/-4.1 $1,000 to $1,499 1,857 +/-349 27.2% +/-4.8 $1,500 or more 1,021 +/-276 15.0% +/-3.7 Median (dollars) 878 +/-64 (X) (X)
No rent paid 293 +/-144 (X) (X)
GROSS RENT AS A PERCENTAGE OF HOUSEHOLDINCOME (GRAPI) Occupied units paying rent (excluding units whereGRAPI cannot be computed)
6,818 +/-557 6,818 (X)
Less than 15.0 percent 594 +/-219 8.7% +/-3.1 15.0 to 19.9 percent 758 +/-223 11.1% +/-3.2 20.0 to 24.9 percent 757 +/-245 11.1% +/-3.5 25.0 to 29.9 percent 714 +/-189 10.5% +/-2.5 30.0 to 34.9 percent 787 +/-216 11.5% +/-3.1 35.0 percent or more 3,208 +/-463 47.1% +/-5.8
Not computed 304 +/-144 (X) (X)
Data are based on a sample and are subject to sampling variability. The degree of uncertainty for an estimate arising from sampling variability isrepresented through the use of a margin of error. The value shown here is the 90 percent margin of error. The margin of error can be interpretedroughly as providing a 90 percent probability that the interval defined by the estimate minus the margin of error and the estimate plus the margin oferror (the lower and upper confidence bounds) contains the true value. In addition to sampling variability, the ACS estimates are subject tononsampling error (for a discussion of nonsampling variability, see Accuracy of the Data). The effect of nonsampling error is not represented in thesetables.
The median gross rent excludes no cash renters.
In prior years, the universe included all owner-occupied units with a mortgage. It is now restricted to include only those units where SMOCAPI iscomputed, that is, SMOC and household income are valid values.
In prior years, the universe included all owner-occupied units without a mortgage. It is now restricted to include only those units where SMOCAPI iscomputed, that is, SMOC and household income are valid values.
In prior years, the universe included all renter-occupied units. It is now restricted to include only those units where GRAPI is computed, that is, grossrent and household Income are valid values.
The 2007, 2008, 2009, 2010, 2011, and 2012 plumbing data for Puerto Rico will not be shown. Research indicates that the questions on plumbingfacilities that were introduced in 2008 in the stateside American Community Survey and the 2008 Puerto Rico Community Survey may not have beenappropriate for Puerto Rico.
Median calculations for base table sourcing VAL, MHC, SMOC, and TAX should exclude zero values.
Telephone service data are not available for certain geographic areas due to problems with data collection. See Errata Note #93 for details.
4 of 5 04/01/2014

While the 2008-2012 American Community Survey (ACS) data generally reflect the December 2009 Office of Management and Budget (OMB)definitions of metropolitan and micropolitan statistical areas; in certain instances the names, codes, and boundaries of the principal cities shown inACS tables may differ from the OMB definitions due to differences in the effective dates of the geographic entities.
Estimates of urban and rural population, housing units, and characteristics reflect boundaries of urban areas defined based on Census 2000 data.Boundaries for urban areas have not been updated since Census 2000. As a result, data for urban and rural areas from the ACS do not necessarilyreflect the results of ongoing urbanization.
Source: U.S. Census Bureau, 2008-2012 American Community Survey
Explanation of Symbols:
1. An '**' entry in the margin of error column indicates that either no sample observations or too few sample observations were available tocompute a standard error and thus the margin of error. A statistical test is not appropriate.
2. An '-' entry in the estimate column indicates that either no sample observations or too few sample observations were available to compute anestimate, or a ratio of medians cannot be calculated because one or both of the median estimates falls in the lowest interval or upper interval of anopen-ended distribution.
3. An '-' following a median estimate means the median falls in the lowest interval of an open-ended distribution.4. An '+' following a median estimate means the median falls in the upper interval of an open-ended distribution.5. An '***' entry in the margin of error column indicates that the median falls in the lowest interval or upper interval of an open-ended distribution. A
statistical test is not appropriate.6. An '*****' entry in the margin of error column indicates that the estimate is controlled. A statistical test for sampling variability is not appropriate.7. An 'N' entry in the estimate and margin of error columns indicates that data for this geographic area cannot be displayed because the number of
sample cases is too small.8. An '(X)' means that the estimate is not applicable or not available.

S0802 MEANS OF TRANSPORTATION TO WORK BY SELECTED CHARACTERISTICS
2008-2012 American Community Survey 5-Year Estimates
Supporting documentation on code lists, subject definitions, data accuracy, and statistical testing can be found on the American Community Surveywebsite in the Data and Documentation section.
Sample size and data quality measures (including coverage rates, allocation rates, and response rates) can be found on the American CommunitySurvey website in the Methodology section.
Although the American Community Survey (ACS) produces population, demographic and housing unit estimates, it is the Census Bureau's PopulationEstimates Program that produces and disseminates the official estimates of the population for the nation, states, counties, cities and towns andestimates of housing units for states and counties.
Subject Washington Unified School District (Yolo County), California
Total Car, truck, or van -- drove alone Car, truck, or van-- carpooled
Estimate Margin of Error Estimate Margin of Error EstimateWorkers 16 years and over 20,582 +/-1,008 15,624 +/-981 3,054AGE
16 to 19 years 3.7% +/-1.3 3.4% +/-1.3 5.3% 20 to 24 years 8.8% +/-1.9 7.7% +/-2.0 13.6% 25 to 44 years 53.0% +/-2.5 54.7% +/-2.9 51.4% 45 to 54 years 21.4% +/-1.9 22.1% +/-2.4 17.5% 55 to 59 years 6.5% +/-1.1 5.3% +/-1.2 8.4% 60 years and over 6.6% +/-1.1 6.9% +/-1.3 3.9%
Median age (years) 38.5 +/-0.8 38.6 +/-0.9 35.5
SEX
Male 48.9% +/-2.3 49.0% +/-2.6 54.3% Female 51.1% +/-2.3 51.0% +/-2.6 45.7%
RACE AND HISPANIC OR LATINO ORIGIN
One race 93.9% +/-1.6 93.9% +/-1.8 96.2% White 68.1% +/-2.8 70.5% +/-3.1 64.5% Black or African American 4.8% +/-1.3 4.6% +/-1.3 3.4% American Indian and Alaska Native 1.5% +/-0.8 1.1% +/-0.7 2.0% Asian 8.5% +/-1.4 7.3% +/-1.4 12.1% Native Hawaiian and Other Pacific Islander 1.4% +/-0.6 1.2% +/-0.6 2.0% Some other race 9.6% +/-1.9 9.3% +/-2.3 12.1% Two or more races 6.1% +/-1.6 6.1% +/-1.8 3.8%
Hispanic or Latino origin (of any race) 29.3% +/-2.6 28.2% +/-2.8 34.7%White alone, not Hispanic or Latino 51.9% +/-2.5 54.9% +/-2.8 44.2%
NATIVITY AND CITIZENSHIP STATUS
Native 73.4% +/-3.0 75.0% +/-3.2 62.9% Foreign born 26.6% +/-3.0 25.0% +/-3.2 37.1% Naturalized U.S. citizen 14.9% +/-2.1 14.3% +/-2.5 17.8% Not a U.S. citizen 11.7% +/-2.0 10.7% +/-2.0 19.3%
1 of 7 04/01/2014

Subject Washington Unified School District (Yolo County), California
Total Car, truck, or van -- drove alone Car, truck, or van-- carpooled
Estimate Margin of Error Estimate Margin of Error EstimateLANGUAGE SPOKEN AT HOME AND ABILITY TOSPEAK ENGLISH Speak language other than English 35.2% +/-3.3 32.4% +/-3.4 46.8% Speak English "very well" 17.9% +/-2.5 16.1% +/-2.5 25.3% Speak English less than "very well" 17.2% +/-2.5 16.3% +/-2.6 21.5%
EARNINGS IN THE PAST 12 MONTHS (IN 2012INFLATION-ADJUSTED DOLLARS) FOR WORKERS Workers 16 years and over with earnings 20,570 +/-1,009 15,612 +/-983 3,054 $1 to $9,999 or loss 12.6% +/-1.9 9.2% +/-1.9 24.6% $10,000 to $14,999 8.0% +/-1.5 7.1% +/-1.8 10.9% $15,000 to $24,999 12.3% +/-1.7 13.0% +/-1.8 8.0% $25,000 to $34,999 14.2% +/-2.0 13.5% +/-2.3 15.0% $35,000 to $49,999 16.0% +/-2.0 17.2% +/-2.2 11.6% $50,000 to $64,999 15.4% +/-2.0 17.8% +/-2.7 9.3% $65,000 to $74,999 4.4% +/-1.2 4.5% +/-1.4 4.5% $75,000 or more 17.0% +/-2.3 17.6% +/-2.5 16.2%
Median earnings (dollars) 37,132 +/-2,409 40,720 +/-2,805 27,347
POVERTY STATUS IN THE PAST 12 MONTHS
Workers 16 years and over for whom poverty status isdetermined
20,582 +/-1,008 15,624 +/-981 3,054
Below 100 percent of the poverty level 6.9% +/-1.7 5.9% +/-1.9 10.3% 100 to 149 percent of the poverty level 6.4% +/-1.6 5.0% +/-1.4 11.5% At or above 150 percent of the poverty level 86.6% +/-2.5 89.0% +/-2.2 78.3%
Workers 16 years and over 20,582 +/-1,008 15,624 +/-981 3,054OCCUPATION
Management, business, science, and arts occupations 37.0% +/-2.6 38.8% +/-2.7 32.4%
Service occupations 19.9% +/-2.5 17.6% +/-2.6 16.5% Sales and office occupations 24.0% +/-2.5 24.5% +/-3.1 23.5% Natural resources, construction, and maintenanceoccupations
9.0% +/-1.7 9.1% +/-2.0 13.3%
Production, transportation, and material movingoccupations
9.9% +/-1.9 10.0% +/-2.1 13.1%
Military specific occupations 0.2% +/-0.2 0.0% +/-0.2 1.2%
INDUSTRY
Agriculture, forestry, fishing and hunting, and mining 1.3% +/-0.6 1.1% +/-0.6 3.4%
Construction 6.1% +/-1.3 6.5% +/-1.5 8.0% Manufacturing 4.7% +/-1.1 5.2% +/-1.3 4.6% Wholesale trade 3.2% +/-1.1 3.1% +/-1.3 5.4% Retail trade 8.2% +/-1.6 8.7% +/-1.8 5.2% Transportation and warehousing, and utilities 6.3% +/-1.8 6.3% +/-2.1 6.1% Information and finance and insurance, and real estateand rental and leasing
7.2% +/-1.6 7.1% +/-1.8 4.9%
Professional, scientific, management, andadministrative and waste management services
11.9% +/-1.9 11.4% +/-2.1 15.7%
Educational services, and health care and socialassistance
22.2% +/-2.1 21.6% +/-2.4 18.4%
Arts, entertainment, and recreation, andaccommodation and food services
8.6% +/-1.6 7.7% +/-1.8 13.4%
Other services (except public administration) 5.6% +/-1.4 5.7% +/-1.5 1.0% Public administration 14.3% +/-2.2 15.4% +/-2.7 12.6% Armed forces 0.4% +/-0.3 0.3% +/-0.2 1.2%
CLASS OF WORKER
Private wage and salary workers 66.1% +/-2.8 67.7% +/-3.3 58.6% Government workers 27.2% +/-2.5 26.8% +/-3.0 32.2%
2 of 7 04/01/2014

Subject Washington Unified School District (Yolo County), California
Total Car, truck, or van -- drove alone Car, truck, or van-- carpooled
Estimate Margin of Error Estimate Margin of Error Estimate Self-employed workers in own not incorporatedbusiness
6.1% +/-1.4 5.3% +/-1.4 7.8%
Unpaid family workers 0.5% +/-0.5 0.2% +/-0.3 1.4%
PLACE OF WORK
Worked in state of residence 99.4% +/-0.4 99.6% +/-0.3 99.3% Worked in county of residence 37.9% +/-3.4 34.4% +/-3.4 34.1% Worked outside county of residence 61.4% +/-3.4 65.2% +/-3.3 65.3% Worked outside state of residence 0.6% +/-0.4 0.4% +/-0.3 0.7%
Workers 16 years and over who did not work at home 19,665 +/-1,049 15,624 +/-981 3,054
TIME LEAVING HOME TO GO TO WORK
12:00 a.m. to 4:59 a.m. 5.2% +/-1.4 6.1% +/-1.6 2.4% 5:00 a.m. to 5:29 a.m. 4.4% +/-1.1 3.8% +/-1.1 8.5% 5:30 a.m. to 5:59 a.m. 3.9% +/-1.0 4.3% +/-1.3 2.6% 6:00 a.m. to 6:29 a.m. 9.3% +/-1.4 9.1% +/-1.8 11.7% 6:30 a.m. to 6:59 a.m. 10.9% +/-2.0 10.6% +/-2.0 12.8% 7:00 a.m. to 7:29 a.m. 13.6% +/-1.9 13.6% +/-2.2 13.9% 7:30 a.m. to 7:59 a.m. 15.4% +/-2.4 15.0% +/-2.8 18.5% 8:00 a.m. to 8:29 a.m. 10.6% +/-2.1 10.3% +/-2.1 9.4% 8:30 a.m. to 8:59 a.m. 4.3% +/-1.0 4.5% +/-1.1 2.9% 9:00 a.m. to 11:59 p.m. 22.5% +/-2.5 22.9% +/-2.6 17.4%
TRAVEL TIME TO WORK
Less than 10 minutes 12.5% +/-2.1 11.2% +/-2.3 17.7% 10 to 14 minutes 18.1% +/-2.7 19.7% +/-3.1 10.3% 15 to 19 minutes 19.5% +/-2.4 20.0% +/-2.5 15.7% 20 to 24 minutes 17.6% +/-2.4 18.2% +/-2.7 18.5% 25 to 29 minutes 6.4% +/-1.7 5.9% +/-1.7 9.9% 30 to 34 minutes 13.6% +/-2.0 13.5% +/-2.2 17.4% 35 to 44 minutes 3.2% +/-0.9 2.9% +/-0.9 3.9% 45 to 59 minutes 3.5% +/-1.0 3.1% +/-1.2 0.6% 60 or more minutes 5.6% +/-1.4 5.5% +/-1.4 6.0% Mean travel time to work (minutes) N N N N N
Workers 16 years and over in households 20,557 +/-1,010 15,622 +/-980 3,054HOUSING TENURE
Owner-occupied housing units 64.1% +/-3.5 63.7% +/-4.0 67.3% Renter-occupied housing units 35.9% +/-3.5 36.3% +/-4.0 32.7%
VEHICLES AVAILABLE
No vehicle available 2.9% +/-1.0 1.0% +/-0.5 7.0% 1 vehicle available 20.6% +/-2.8 20.0% +/-3.0 19.2% 2 vehicles available 45.3% +/-3.8 46.8% +/-3.9 44.8% 3 or more vehicles available 31.1% +/-3.3 32.3% +/-3.5 28.9%
PERCENT IMPUTED
Means of transportation to work 7.5% (X) (X) (X) (X) Time leaving home to go to work 11.9% (X) (X) (X) (X) Travel time to work 9.7% (X) (X) (X) (X) Vehicles available 0.6% (X) (X) (X) (X)
3 of 7 04/01/2014

Subject Washington Unified School District (Yolo County),California
Car, truck, or van-- carpooled
Public transportation (excludingtaxicab)
Margin of Error Estimate Margin of ErrorWorkers 16 years and over +/-530 268 +/-119AGE
16 to 19 years +/-3.0 20.1% +/-15.9 20 to 24 years +/-5.6 5.6% +/-9.8 25 to 44 years +/-6.8 45.5% +/-22.2 45 to 54 years +/-5.9 20.9% +/-15.3 55 to 59 years +/-4.2 5.2% +/-7.5 60 years and over +/-2.4 2.6% +/-4.4
Median age (years) +/-3.0 27.7 +/-8.5
SEX
Male +/-6.5 35.8% +/-22.6 Female +/-6.5 64.2% +/-22.6
RACE AND HISPANIC OR LATINO ORIGIN
One race +/-2.4 76.1% +/-19.8 White +/-7.2 41.0% +/-19.4 Black or African American +/-2.8 11.9% +/-13.3 American Indian and Alaska Native +/-2.3 3.4% +/-6.1 Asian +/-4.7 13.4% +/-20.9 Native Hawaiian and Other Pacific Islander +/-2.6 6.3% +/-7.7 Some other race +/-6.1 0.0% +/-13.0 Two or more races +/-2.4 23.9% +/-19.8
Hispanic or Latino origin (of any race) +/-8.7 18.7% +/-14.7White alone, not Hispanic or Latino +/-8.0 34.7% +/-21.0
NATIVITY AND CITIZENSHIP STATUS
Native +/-8.3 94.8% +/-6.5 Foreign born +/-8.3 5.2% +/-6.5 Naturalized U.S. citizen +/-5.8 0.0% +/-13.0 Not a U.S. citizen +/-7.4 5.2% +/-6.5
LANGUAGE SPOKEN AT HOME AND ABILITY TOSPEAK ENGLISH Speak language other than English +/-9.2 24.3% +/-16.6 Speak English "very well" +/-7.5 20.9% +/-17.5 Speak English less than "very well" +/-8.2 3.4% +/-6.1
EARNINGS IN THE PAST 12 MONTHS (IN 2012INFLATION-ADJUSTED DOLLARS) FOR WORKERS Workers 16 years and over with earnings +/-530 268 +/-119 $1 to $9,999 or loss +/-6.3 33.2% +/-18.7 $10,000 to $14,999 +/-4.1 7.8% +/-7.7 $15,000 to $24,999 +/-4.1 5.6% +/-9.8 $25,000 to $34,999 +/-6.1 0.0% +/-13.0 $35,000 to $49,999 +/-4.8 20.5% +/-22.0 $50,000 to $64,999 +/-3.6 19.8% +/-13.0 $65,000 to $74,999 +/-2.9 5.6% +/-11.5 $75,000 or more +/-7.0 7.5% +/-8.8
Median earnings (dollars) +/-4,618 38,750 +/-41,684
POVERTY STATUS IN THE PAST 12 MONTHS
Workers 16 years and over for whom poverty status isdetermined
+/-530 268 +/-119
Below 100 percent of the poverty level +/-4.8 3.7% +/-6.0
4 of 7 04/01/2014

Subject Washington Unified School District (Yolo County),California
Car, truck, or van-- carpooled
Public transportation (excludingtaxicab)
Margin of Error Estimate Margin of Error 100 to 149 percent of the poverty level +/-7.1 11.9% +/-13.0 At or above 150 percent of the poverty level +/-8.6 84.3% +/-14.2
Workers 16 years and over +/-530 268 +/-119OCCUPATION
Management, business, science, and arts occupations +/-8.6 22.4% +/-15.9
Service occupations +/-6.8 31.7% +/-22.1 Sales and office occupations +/-5.8 39.6% +/-19.8 Natural resources, construction, and maintenanceoccupations
+/-6.1 0.0% +/-13.0
Production, transportation, and material movingoccupations
+/-5.3 6.3% +/-9.5
Military specific occupations +/-1.4 0.0% +/-13.0
INDUSTRY
Agriculture, forestry, fishing and hunting, and mining +/-2.8 0.0% +/-13.0
Construction +/-4.6 0.0% +/-13.0 Manufacturing +/-4.0 3.7% +/-11.8 Wholesale trade +/-3.6 0.0% +/-13.0 Retail trade +/-2.6 13.8% +/-12.7 Transportation and warehousing, and utilities +/-3.6 1.9% +/-3.2 Information and finance and insurance, and real estateand rental and leasing
+/-3.6 25.4% +/-19.6
Professional, scientific, management, andadministrative and waste management services
+/-4.8 6.0% +/-7.9
Educational services, and health care and socialassistance
+/-5.8 9.0% +/-9.8
Arts, entertainment, and recreation, andaccommodation and food services
+/-5.5 7.8% +/-9.2
Other services (except public administration) +/-1.0 22.0% +/-21.6 Public administration +/-4.6 10.4% +/-9.9 Armed forces +/-1.4 0.0% +/-13.0
CLASS OF WORKER
Private wage and salary workers +/-8.5 89.6% +/-9.9 Government workers +/-8.5 10.4% +/-9.9 Self-employed workers in own not incorporatedbusiness
+/-4.5 0.0% +/-13.0
Unpaid family workers +/-2.3 0.0% +/-13.0
PLACE OF WORK
Worked in state of residence +/-1.1 100.0% +/-13.0 Worked in county of residence +/-7.3 24.3% +/-22.5 Worked outside county of residence +/-7.3 75.7% +/-22.5 Worked outside state of residence +/-1.1 0.0% +/-13.0
Workers 16 years and over who did not work at home +/-530 268 +/-119
TIME LEAVING HOME TO GO TO WORK
12:00 a.m. to 4:59 a.m. +/-3.0 0.0% +/-13.0 5:00 a.m. to 5:29 a.m. +/-3.7 3.7% +/-11.8 5:30 a.m. to 5:59 a.m. +/-2.0 0.0% +/-13.0 6:00 a.m. to 6:29 a.m. +/-5.4 17.2% +/-21.6 6:30 a.m. to 6:59 a.m. +/-6.0 29.1% +/-16.0 7:00 a.m. to 7:29 a.m. +/-6.4 6.0% +/-7.9 7:30 a.m. to 7:59 a.m. +/-6.1 9.7% +/-12.8 8:00 a.m. to 8:29 a.m. +/-5.0 5.6% +/-9.3 8:30 a.m. to 8:59 a.m. +/-2.2 6.7% +/-10.5 9:00 a.m. to 11:59 p.m. +/-5.4 22.0% +/-18.3
5 of 7 04/01/2014

Subject Washington Unified School District (Yolo County),California
Car, truck, or van-- carpooled
Public transportation (excludingtaxicab)
Margin of Error Estimate Margin of ErrorTRAVEL TIME TO WORK
Less than 10 minutes +/-5.7 0.0% +/-13.0 10 to 14 minutes +/-4.2 0.0% +/-13.0 15 to 19 minutes +/-5.5 5.6% +/-11.5 20 to 24 minutes +/-6.2 3.7% +/-6.0 25 to 29 minutes +/-4.7 3.4% +/-6.1 30 to 34 minutes +/-7.0 17.9% +/-15.6 35 to 44 minutes +/-2.5 22.0% +/-21.6 45 to 59 minutes +/-0.9 36.9% +/-17.7 60 or more minutes +/-3.4 10.4% +/-14.3 Mean travel time to work (minutes) N N N
Workers 16 years and over in households +/-530 268 +/-119HOUSING TENURE
Owner-occupied housing units +/-9.6 61.6% +/-23.6 Renter-occupied housing units +/-9.6 38.4% +/-23.6
VEHICLES AVAILABLE
No vehicle available +/-5.4 1.9% +/-3.5 1 vehicle available +/-8.1 21.6% +/-20.9 2 vehicles available +/-9.6 32.5% +/-23.0 3 or more vehicles available +/-8.1 44.0% +/-25.3
PERCENT IMPUTED
Means of transportation to work (X) (X) (X) Time leaving home to go to work (X) (X) (X) Travel time to work (X) (X) (X) Vehicles available (X) (X) (X)
Data are based on a sample and are subject to sampling variability. The degree of uncertainty for an estimate arising from sampling variability isrepresented through the use of a margin of error. The value shown here is the 90 percent margin of error. The margin of error can be interpretedroughly as providing a 90 percent probability that the interval defined by the estimate minus the margin of error and the estimate plus the margin oferror (the lower and upper confidence bounds) contains the true value. In addition to sampling variability, the ACS estimates are subject tononsampling error (for a discussion of nonsampling variability, see Accuracy of the Data). The effect of nonsampling error is not represented in thesetables.
Foreign born excludes people born outside the United States to a parent who is a U.S. citizen.
Workers include members of the Armed Forces and civilians who were at work last week.
Industry codes are 4-digit codes and are based on the North American Industry Classification System 2007. The Industry categories adhere to theguidelines issued in Clarification Memorandum No. 2, "NAICS Alternate Aggregation Structure for Use By U.S. Statistical Agencies," issued by theOffice of Management and Budget.
While the 2008-2012 American Community Survey (ACS) data generally reflect the December 2009 Office of Management and Budget (OMB)definitions of metropolitan and micropolitan statistical areas; in certain instances the names, codes, and boundaries of the principal cities shown inACS tables may differ from the OMB definitions due to differences in the effective dates of the geographic entities.
Estimates of urban and rural population, housing units, and characteristics reflect boundaries of urban areas defined based on Census 2000 data.Boundaries for urban areas have not been updated since Census 2000. As a result, data for urban and rural areas from the ACS do not necessarilyreflect the results of ongoing urbanization.
Source: U.S. Census Bureau, 2008-2012 American Community Survey
Explanation of Symbols:
6 of 7 04/01/2014

1. An '**' entry in the margin of error column indicates that either no sample observations or too few sample observations were available tocompute a standard error and thus the margin of error. A statistical test is not appropriate.
2. An '-' entry in the estimate column indicates that either no sample observations or too few sample observations were available to compute anestimate, or a ratio of medians cannot be calculated because one or both of the median estimates falls in the lowest interval or upper interval of anopen-ended distribution.
3. An '-' following a median estimate means the median falls in the lowest interval of an open-ended distribution.4. An '+' following a median estimate means the median falls in the upper interval of an open-ended distribution.5. An '***' entry in the margin of error column indicates that the median falls in the lowest interval or upper interval of an open-ended distribution. A
statistical test is not appropriate.6. An '*****' entry in the margin of error column indicates that the estimate is controlled. A statistical test for sampling variability is not appropriate.7. An 'N' entry in the estimate and margin of error columns indicates that data for this geographic area cannot be displayed because the number of
sample cases is too small.8. An '(X)' means that the estimate is not applicable or not available.

SchoolWorks, Inc. 8331 Sierra College Blvd., Suite 221 Roseville, CA 95661 916.733.0402
Use of Developer Fees:
A School District can use the revenue collected on residential and commercial/industrial construction for the purposes listed below:
Purchase or lease of interim school facilities to house students generated by newdevelopment pending the construction of permanent facilities.
Purchase or lease of land for school facilities for such students. Acquisition of school facilities for such students, including:
o Constructiono Modernization/reconstructiono Architectural and engineering costso Permits and plan checkingo Testing and inspectiono Furniture, Equipment and Technology for use in school facilities
Legal and other administrative costs related to the provision of such new facilities Administration of the collection of, and justification for, such fees, and Any other purpose arising from the process of providing facilities for students
generated by new development.
Following is an excerpt from the Education Code that states the valid uses of the Level 1 developer fees. It refers to construction and reconstruction. The term reconstruction was originally used in the Leroy Greene program. The term modernization is currently used in the 1998 State Building Program and represents the same scope of work used in the original reconstruction projects.
Ed Code Section 17620. (a) (1) The governing board of any school district is authorized to levy a fee, charge, dedication, or other requirement against any construction within the boundaries of the district, for the purpose of funding the construction or reconstruction of school facilities, subject to any limitations set forth in Chapter 4.9 (commencing with Section 65995) of Division 1 of Title 7 of the Government Code. This fee, charge, dedication, or other requirement may be applied to construction only as follows: …
The limitations referred to in this text describe the maximum amounts that can be charged for residential and commercial/industrial projects and any projects that qualify for exemptions. They do not limit the use of the funds received.

SchoolWorks, Inc. 8331 Sierra College Blvd, Suite 221 Roseville, CA 95661 916.733.0402
Determination of Average State allowed amounts for Site Development Costs
Elementary Schools Original 2009 Adjusted
OPSC Site Inflation Site Project 2009
District Project # Acres Development Factor Development Year Cost/Acre
Davis Jt Unified 3 9.05 $532,282 38.4% $1,473,469 2004 $162,814
Dry Creek Jt Elem 2 8.5 $516,347 46.2% $1,509,322 2002 $177,567
Dry Creek Jt Elem 5 11.06 $993,868 20.1% $2,387,568 2006 $215,874
Elk Grove Unified 5 12.17 $556,011 48.2% $1,648,316 2001 $135,441
Elk Grove Unified 10 11 $690,120 48.2% $2,045,888 2001 $185,990
Elk Grove Unified 11 10 $702,127 48.2% $2,081,483 2001 $208,148
Elk Grove Unified 14 10 $732,837 46.2% $2,142,139 2002 $214,214
Elk Grove Unified 16 9.86 $570,198 46.2% $1,666,733 2002 $169,040
Elk Grove Unified 17 10 $542,662 46.2% $1,586,243 2002 $158,624
Elk Grove Unified 20 10 $710,730 43.2% $2,034,830 2003 $203,483
Elk Grove Unified 25 10 $645,923 38.4% $1,788,052 2004 $178,805
Elk Grove Unified 28 10.03 $856,468 24.4% $2,130,974 2005 $212,460
Elk Grove Unified 39 9.91 $1,007,695 20.1% $2,420,785 2006 $244,277
Folsom-Cordova Unified 1 9.79 $816,196 20.1% $1,960,747 2006 $200,281
Folsom-Cordova Unified 4 7.5 $455,908 46.2% $1,332,654 2002 $177,687
Folsom-Cordova Unified 5 8 $544,213 46.2% $1,590,776 2002 $198,847
Folsom-Cordova Unified 8 8.97 $928,197 11.2% $2,063,757 2007 $230,073
Galt Jt Union Elem 2 10.1 $1,033,044 38.4% $2,859,685 2004 $283,137
Lincoln Unified 1 9.39 $433,498 46.2% $1,267,148 2002 $134,947
Lodi Unified 3 11.2 $555,999 46.2% $1,625,228 2002 $145,110
Lodi Unified 10 11.42 $1,245,492 46.2% $3,640,669 2002 $318,798
Lodi Unified 19 9.93 $999,164 11.2% $2,221,545 2007 $223,721
Lodi Unified 22 10 $1,416,212 7.7% $3,051,426 2008 $305,143
Natomas Unified 6 8.53 $685,284 46.2% $2,003,138 2002 $234,834
Natomas Unified 10 9.83 $618,251 43.2% $1,770,061 2003 $180,067
Natomas Unified 12 9.61 $735,211 24.4% $1,829,275 2005 $190,351
Rocklin Unified 8 10.91 $593,056 46.2% $1,733,548 2002 $158,895
Stockton Unified 1 12.66 $1,462,232 7.7% $3,150,582 2008 $248,861
Stockton Unified 2 10.5 $781,675 43.2% $2,237,946 2003 $213,138
Stockton Unified 6 12.48 $1,136,704 20.1% $2,730,703 2006 $218,806
Tracy Jt Unified 4 10 $618,254 46.2% $1,807,204 2002 $180,720
Tracy Jt Unified 10 10 $573,006 38.4% $1,586,202 2004 $158,620
Washington Unified 1 8 $446,161 46.2% $1,304,163 2002 $163,020
Washington Unified 4 10.76 $979,085 7.7% $2,109,575 2008 $196,057 2020
Adjustment
Totals 341.16 $68,791,833 Average $201,641 $267,920
Middle and High Schools Original 2009 Adjusted
OPSC Site Inflation Site Project 2009
District Project # Acres Development Factor Development Year Cost/Acre
Western Placer Unified 4 19.3 $5,973,312 24.4% $7,431,085 2005 $385,030
Roseville City Elem 2 21.6 $1,780,588 48.2% $2,639,311 2000 $122,190
Elk Grove Unified 4 66.2 $8,659,494 48.2% $12,835,704 2000 $193,893
Elk Grove Unified 13 76.4 $9,791,732 48.2% $14,513,986 2001 $189,974
Elk Grove Unified 18 84.3 $13,274,562 43.2% $19,002,626 2003 $225,417
Grant Jt Union High 2 24 $2,183,840 48.2% $3,237,039 2000 $134,877
Center Unified 1 21.2 $1,944,310 46.2% $2,841,684 2002 $134,042
Lodi Unified 2 13.4 $1,076,844 46.2% $1,573,849 2002 $117,451
Lodi Unified 6 13.4 $2,002,164 46.2% $2,926,240 2002 $218,376
Galt Jt Union Elem 1 24.9 $2,711,360 46.2% $3,962,757 2002 $159,147
Tahoe Truckee Unified 2 24 $2,752,632 43.2% $3,940,412 2003 $164,184
Davis Unified 5 23.3 $3,814,302 43.2% $5,460,199 2003 $234,343
Woodland Unified 3 50.2 $8,664,700 46.2% $12,663,792 2002 $252,267
Sacramento City Unified 1 35.2 $4,813,386 46.2% $7,034,949 2002 $199,856
Lodi Unified 4 47 $7,652,176 46.2% $11,183,950 2002 $237,956
Stockton Unified 3 49.1 $8,959,088 43.2% $12,824,996 2003 $261,202
Natomas Unified 11 38.7 $3,017,002 38.4% $4,175,850 2004 $107,903
Rocklin Unified 11 47.1 $11,101,088 24.4% $13,810,282 2005 $293,212 2020
Totals 679.3 $142,058,711 Average $209,125 Adjustment
Middle Schools: 260.7 $49,447,897 Middle $189,704 $252,060
High Schools: 418.6 $92,610,814 High $221,217 $293,931