2020 07 03 Boekje 1.0.indd
220
University of Groningen Altered lipid and bile acid metabolism in Glycogen Storage Disease type 1a: pathophysiological mechanisms and therapeutic opportunities Hoogerland, Joanne DOI: 10.33612/diss.131695607 IMPORTANT NOTE: You are advised to consult the publisher's version (publisher's PDF) if you wish to cite from it. Please check the document version below. Document Version Publisher's PDF, also known as Version of record Publication date: 2020 Link to publication in University of Groningen/UMCG research database Citation for published version (APA): Hoogerland, J. (2020). Altered lipid and bile acid metabolism in Glycogen Storage Disease type 1a: pathophysiological mechanisms and therapeutic opportunities. University of Groningen. https://doi.org/10.33612/diss.131695607 Copyright Other than for strictly personal use, it is not permitted to download or to forward/distribute the text or part of it without the consent of the author(s) and/or copyright holder(s), unless the work is under an open content license (like Creative Commons). The publication may also be distributed here under the terms of Article 25fa of the Dutch Copyright Act, indicated by the “Taverne” license. More information can be found on the University of Groningen website: https://www.rug.nl/library/open-access/self-archiving-pure/taverne- amendment. Take-down policy If you believe that this document breaches copyright please contact us providing details, and we will remove access to the work immediately and investigate your claim. Downloaded from the University of Groningen/UMCG research database (Pure): http://www.rug.nl/research/portal. For technical reasons the number of authors shown on this cover page is limited to 10 maximum. Download date: 07-07-2022
-
Upload
khangminh22 -
Category
Documents
-
view
2 -
download
0
Transcript of 2020 07 03 Boekje 1.0.indd

University of Groningen
Altered lipid and bile acid metabolism in Glycogen Storage Disease type 1a:pathophysiological mechanisms and therapeutic opportunitiesHoogerland, Joanne
DOI:10.33612/diss.131695607
IMPORTANT NOTE: You are advised to consult the publisher's version (publisher's PDF) if you wish to cite fromit. Please check the document version below.
Document VersionPublisher's PDF, also known as Version of record
Publication date:2020
Link to publication in University of Groningen/UMCG research database
Citation for published version (APA):Hoogerland, J. (2020). Altered lipid and bile acid metabolism in Glycogen Storage Disease type 1a:pathophysiological mechanisms and therapeutic opportunities. University of Groningen.https://doi.org/10.33612/diss.131695607
CopyrightOther than for strictly personal use, it is not permitted to download or to forward/distribute the text or part of it without the consent of theauthor(s) and/or copyright holder(s), unless the work is under an open content license (like Creative Commons).
The publication may also be distributed here under the terms of Article 25fa of the Dutch Copyright Act, indicated by the “Taverne” license.More information can be found on the University of Groningen website: https://www.rug.nl/library/open-access/self-archiving-pure/taverne-amendment.
Take-down policyIf you believe that this document breaches copyright please contact us providing details, and we will remove access to the work immediatelyand investigate your claim.
Downloaded from the University of Groningen/UMCG research database (Pure): http://www.rug.nl/research/portal. For technical reasons thenumber of authors shown on this cover page is limited to 10 maximum.
Download date: 07-07-2022

Altered lipid and bile acid metabolism in Glycogen Storage Disease type Ia:
pathophysiological mechanisms and therapeutic opportunities
Joanne A. Hoogerland
2020 07 03 Boekje 1.0.indd 12020 07 03 Boekje 1.0.indd 1 24/07/2020 21:1324/07/2020 21:13

The work described in this thesis was performed at the Department of Pediatrics, Center for Liver, Digestive, and Metabolic Diseases, University Medical Center Groningen, University of Groningen, Groningen, The Netherlands. This work was supported by an unrestricted research grant from DSM Nutritional Products (Kaiseraugst, Switzerland).
Printing of this thesis was financially supported by:University of GroningenUniversity Medical Center Groningen (UMCG)Groningen University Institute for Drug Exploration (GUIDE)
Cover design by Jan Freark de Boer and Joanne HoogerlandLayout by Joanne Hoogerland
Printed by Ridderprint | www.ridderprint.nl
© 2020 Joanne A. Hoogerland. All rights reserved. No part of this thesis may be reproduced, distributed, stored in a retrieval system, or transmitted in any form or by any means, without prior permission of the author.
2020 07 03 Boekje 1.0.indd 22020 07 03 Boekje 1.0.indd 2 24/07/2020 21:1324/07/2020 21:13

2020 07 03 Boekje 1.0.indd 32020 07 03 Boekje 1.0.indd 3 24/07/2020 21:1324/07/2020 21:13

PromotorProf. dr. F. Kuipers
CopromotorDr. M.H. Oosterveer
BeoordelingscommissieProf. dr. M. Brouwers Prof. dr. K. Schoonjans Prof. dr. J.A. Kuivenhoven
2020 07 03 Boekje 1.0.indd 42020 07 03 Boekje 1.0.indd 4 24/07/2020 21:1324/07/2020 21:13

Table of contents
Chapter 1 General Introduction 7
Chapter 2 Hypoglycemia aggravates dyslipidemia in GSD Ia via 33 enhanced adipocyte lipolysis and impaired VLDL catabolism
Chapter 3 Hepatic ChREBP activation limits NAFLD development in a 69 mouse model for Glycogen Storage Disease type Ia
Chapter 4 Pharmacological FXR activation redirects pyruvate towards 105 glucose-6-phosphate and only slightly reduces hepatic steatosis in a mouse model for Glycogen Storage Disease type 1a
Chapter 5 Glucose-6-phosphate regulates hepatic bile acid synthesis 143 in mice
Chapter 6 General Discussion 177
Chapter 7 English summary 199
Nederlandse samenvatting 205
Curriculum Vitae 211
List of publications 213
Acknowledgements 215
2020 07 03 Boekje 1.0.indd 52020 07 03 Boekje 1.0.indd 5 24/07/2020 21:1324/07/2020 21:13

2020 07 03 Boekje 1.0.indd 62020 07 03 Boekje 1.0.indd 6 24/07/2020 21:1324/07/2020 21:13

1CHAPTERGeneral Introduction
2020 07 03 Boekje 1.0.indd 72020 07 03 Boekje 1.0.indd 7 24/07/2020 21:1324/07/2020 21:13
Chapter 1
8
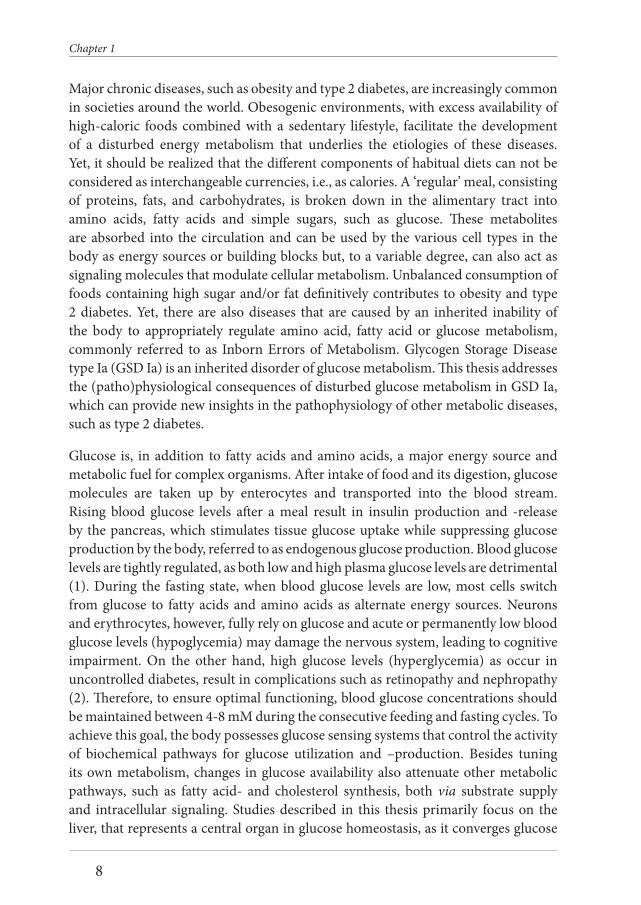
Major chronic diseases, such as obesity and type 2 diabetes, are increasingly common in societies around the world. Obesogenic environments, with excess availability of high-caloric foods combined with a sedentary lifestyle, facilitate the development of a disturbed energy metabolism that underlies the etiologies of these diseases. Yet, it should be realized that the different components of habitual diets can not be considered as interchangeable currencies, i.e., as calories. A ‘regular’ meal, consisting of proteins, fats, and carbohydrates, is broken down in the alimentary tract into amino acids, fatty acids and simple sugars, such as glucose. These metabolites are absorbed into the circulation and can be used by the various cell types in the body as energy sources or building blocks but, to a variable degree, can also act as signaling molecules that modulate cellular metabolism. Unbalanced consumption of foods containing high sugar and/or fat definitively contributes to obesity and type 2 diabetes. Yet, there are also diseases that are caused by an inherited inability of the body to appropriately regulate amino acid, fatty acid or glucose metabolism, commonly referred to as Inborn Errors of Metabolism. Glycogen Storage Disease type Ia (GSD Ia) is an inherited disorder of glucose metabolism. This thesis addresses the (patho)physiological consequences of disturbed glucose metabolism in GSD Ia, which can provide new insights in the pathophysiology of other metabolic diseases, such as type 2 diabetes.
Glucose is, in addition to fatty acids and amino acids, a major energy source and metabolic fuel for complex organisms. After intake of food and its digestion, glucose molecules are taken up by enterocytes and transported into the blood stream. Rising blood glucose levels after a meal result in insulin production and -release by the pancreas, which stimulates tissue glucose uptake while suppressing glucose production by the body, referred to as endogenous glucose production. Blood glucose levels are tightly regulated, as both low and high plasma glucose levels are detrimental (1). During the fasting state, when blood glucose levels are low, most cells switch from glucose to fatty acids and amino acids as alternate energy sources. Neurons and erythrocytes, however, fully rely on glucose and acute or permanently low blood glucose levels (hypoglycemia) may damage the nervous system, leading to cognitive impairment. On the other hand, high glucose levels (hyperglycemia) as occur in uncontrolled diabetes, result in complications such as retinopathy and nephropathy (2). Therefore, to ensure optimal functioning, blood glucose concentrations should be maintained between 4-8 mM during the consecutive feeding and fasting cycles. To achieve this goal, the body possesses glucose sensing systems that control the activity of biochemical pathways for glucose utilization and –production. Besides tuning its own metabolism, changes in glucose availability also attenuate other metabolic pathways, such as fatty acid- and cholesterol synthesis, both via substrate supply and intracellular signaling. Studies described in this thesis primarily focus on the liver, that represents a central organ in glucose homeostasis, as it converges glucose
2020 07 03 Boekje 1.0.indd 82020 07 03 Boekje 1.0.indd 8 24/07/2020 21:1324/07/2020 21:13
General introduction
9
1
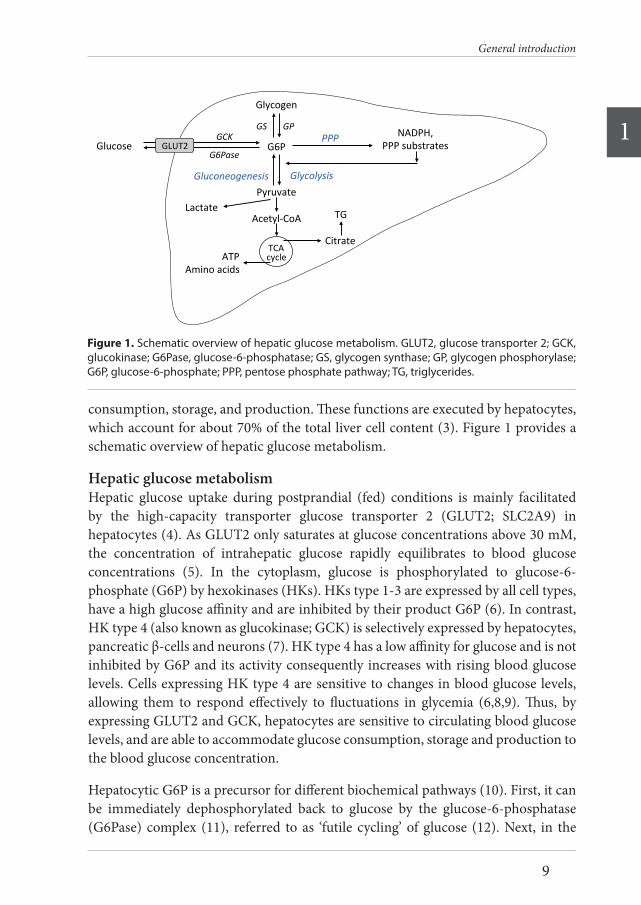
consumption, storage, and production. These functions are executed by hepatocytes, which account for about 70% of the total liver cell content (3). Figure 1 provides a schematic overview of hepatic glucose metabolism.
Hepatic glucose metabolismHepatic glucose uptake during postprandial (fed) conditions is mainly facilitated by the high-capacity transporter glucose transporter 2 (GLUT2; SLC2A9) in hepatocytes (4). As GLUT2 only saturates at glucose concentrations above 30 mM, the concentration of intrahepatic glucose rapidly equilibrates to blood glucose concentrations (5). In the cytoplasm, glucose is phosphorylated to glucose-6-phosphate (G6P) by hexokinases (HKs). HKs type 1-3 are expressed by all cell types, have a high glucose affinity and are inhibited by their product G6P (6). In contrast, HK type 4 (also known as glucokinase; GCK) is selectively expressed by hepatocytes, pancreatic β-cells and neurons (7). HK type 4 has a low affinity for glucose and is not inhibited by G6P and its activity consequently increases with rising blood glucose levels. Cells expressing HK type 4 are sensitive to changes in blood glucose levels, allowing them to respond effectively to fluctuations in glycemia (6,8,9). Thus, by expressing GLUT2 and GCK, hepatocytes are sensitive to circulating blood glucose levels, and are able to accommodate glucose consumption, storage and production to the blood glucose concentration.
Hepatocytic G6P is a precursor for different biochemical pathways (10). First, it can be immediately dephosphorylated back to glucose by the glucose-6-phosphatase (G6Pase) complex (11), referred to as ‘futile cycling’ of glucose (12). Next, in the
Acetyl-CoA
Glycolysis
TG
Glucose GLUT2G6Pase
GCKG6P
Glycogen
GS GP
Pyruvate
ATPAminoacids
Citrate
NADPH,PPPsubstrates
PPP
TCAcycle
Gluconeogenesis
Lactate
Figure1.Schematicoverviewofhepaticglucosemetabolism.GLUT2,glucosetransporter2;GCK,glucokinase;G6Pase,glucose-6-phosphatase;GS,glycogensynthase;GP,glycogenphosphorylase;G6P,glucose-6-phosphate;PPP,pentosephosphatepathway;TG,triglycerides
Figure 1. Schematic overview of hepatic glucose metabolism. GLUT2, glucose transporter 2; GCK, glucokinase; G6Pase, glucose-6-phosphatase; GS, glycogen synthase; GP, glycogen phosphorylase; G6P, glucose-6-phosphate; PPP, pentose phosphate pathway; TG, triglycerides.
2020 07 03 Boekje 1.0.indd 92020 07 03 Boekje 1.0.indd 9 24/07/2020 21:1324/07/2020 21:13

Chapter 1
10
postprandial state, G6P is partly converted by glycogen synthase (GYS) into glycogen and stored in the liver. G6P can also be metabolized into pyruvate through glycolysis. The last step in this pathway is catalyzed by liver pyruvate kinase (PKLR). Pyruvate can subsequently be used as a substrate in the tricarboxylic acid (TCA) cycle to generate adenosine triphosphate (ATP) or it can be converted into lactate which is then released into the circulation. Lastly, G6P can be metabolized via the pentose phosphate pathway (PPP) to generate 6-phosphogluconate, ribulose 5-phosphate and NADPH. The PPP contributes to glycolysis, gluconeogenesis and DNA synthesis as ribulose 5-phosphate serves as a precursor for glyceraldehyde 3-phosphate (G3P) and nucleotide synthesis. NADPH, on the other hand, supports lipogenesis as reducing equivalent, and is protective against oxidative damage by reducing hydrogen peroxide via the glutathione system. G6P is thus an important crossroad molecule, as it is a substrate for several metabolic pathways.
To maintain blood glucose levels in the post-absorptive (fasted) state, the body switches from glucose consuming and storing pathways towards glucose producing pathways. In cases of prolonged fasting, hepatic glycogen stores are depleted to produce G6P and glucose via glycogen phosphorylase (PYGL) and glycogen debranching enzyme (AGL). In addition, glucose can be synthesized de novo from gluconeogenic precursors in liver and, to a lesser extent, in kidney and intestine. During gluconeogenesis, pyruvate is converted to oxaloacetate by pyruvate carboxylase (PC), and subsequently to phosphoenolpyruvate by phosphoenolpyruvate carboxykinase (PEPCK). Via multiple steps phosphoenolpyruvate is converted into G3P. Aldolase B catalyzes the reaction of G3P to fructose-1,6-phosphate and the irreversible reaction of fructose-1,6-phosphate to fructose-6-phosphate (F-6-P) is catalyzed by fructose-1,6-biphosphatase (F1,6bisPase). Finally, F-6-P is isomerized to G6P. Gluconeogenesis and glycogenolysis both result in the formation of G6P, which is then hydrolyzed to glucose and phosphate by the glucose-6-phosphatase (G6Pase) complex (11). This complex, located in the endoplasmic reticulum (ER), consists of the glucose-6-phosphate transporter (SLC37A1; G6PT) and the glucose-6-phosphatase (G6PC) enzyme. G6PC1 (G6Pase-α) is exclusively expressed in the liver, kidney and intestine, and is coupled to G6PT in order to import G6P into the ER, to hydrolyze it to glucose, and to export it to the bloodstream via a membrane traffic-based pathway (13–15). Paralogs of G6PC1 are G6PC2 and G6PC3 (G6Pase-β). G6PC2 is solely expressed in pancreatic islets and has no phosphohydrolase activity. In contrast to G6PC1 and G6PC2, G6PC3 is ubiquitously expressed. Coupled to G6PT, G6PC3 acts in a similar manner as the G6PC1/G6PT complex by hydrolyzing G6P to glucose, although with an approximately 6-fold lower reaction rate (16). G6PC3 is required for adequate neutrophil function, as its deficiency leads to neutrophil dysfunction and malformations (14,17–19). G6PC3 deficiency has no impact on glucose homeostasis (19,20), thus G6PC1 is the key enzyme that catalyzes the final step in gluconeogenesis
2020 07 03 Boekje 1.0.indd 102020 07 03 Boekje 1.0.indd 10 24/07/2020 21:1324/07/2020 21:13

General introduction
11
1
and glycogenolysis hence ensuring adequate glycemic control during fasting.
Intrahepatic glucose-sensing systemsIn order to ensure proper switching between glucose producing or –consuming pathways and maintain blood glucose within its physiological range, glycemia is monitored by extra- and intrahepatic glucose-sensing systems. Extrahepatic, hormonal regulation of glucose metabolism by insulin and glucagon shifts the balance between glycolysis and gluconeogenesis, and between glycogen production and breakdown in the liver. An overview of these extrahepatic glucose sensing systems can be found elsewhere (1,21,22). Intrahepatic glucose-sensing systems comprise allosteric regulation, transcriptional regulation, as well as post-translational modifications (10), as will be explained in detail below.
Glucose-sensitive transcription factor ChREBPThe transcription factor carbohydrate response element binding protein (ChREBP; MLXIPL) is a major glucose sensor expressed in hepatocytes (23). It is activated by intermediates of glucose metabolism and it exerts a signaling function by regulating the expression of enzymes involved in glycolysis (i.e., GLUT2, PKLR), gluconeogenesis (i.e., G6PC), de novo lipogenesis (i.e., fatty acid synthase; FASN, acetyl-CoA carboxylase; ACC1) (24–26) and very low-density lipoprotein (VLDL) assembly (i.e., microsomal triglyceride transfer protein; MTTP) (27,28). In addition, in vitro studies in human hepatoma cells showed that ChREBP controls the expression of genes involved in transport, development and cell motility, although the physiological relevance for hepatocytes in vivo remains to be established (29). ChREBP, consisting of a low glucose inhibitory domain (LID), and a glucose response conserved element (GRACE) has two isoforms; ChREBPα and ChREBPβ. ChREBPα represents the full-length protein, whereas the ChREBPβ protein is a shorter isoform, lacking the LID domain (30,31). As the LID domain is responsible for inhibiting ChREBP activity under low glucose concentrations, ChREBPβ can act independently of glucose concentrations once it is activated (30,31). ChREBP regulates its own expression through a carbohydrate response element (ChoRE) on the proximal promotor of ChREBPβ, thus generating a potent feed forward loop (31,32). Although ChREBPβ is considered to be the most transcriptionally active isoform, isoform-specific differences between ChREBPα and –β concerning activation and transcriptional targets remain as yet elusive.
ChREBP activation is complex and involves several mechanisms (33). Firstly, ChREBP is activated by posttranslational modifications, e.g., phosphorylation/dephosphorylation, acetylation and O-linked β-N-acetylglucosaminylation (O-GlcNAcylation). According to the classical view, cytosolic ChREBPα is dephosphorylated by protein phosphorylase 2A (PP2A) upon stimulation by glucose
2020 07 03 Boekje 1.0.indd 112020 07 03 Boekje 1.0.indd 11 24/07/2020 21:1324/07/2020 21:13

Chapter 1
12
and is subsequently translocated to the nucleus. Here, ChREBP binds to ChoREs in the promotor regions of glucose-sensitive genes, while also promoting the transcription of ChREBPβ. Under low glucose conditions, ChREBPα translocation and activity are inhibited by phosphorylation via cAMP-dependent protein kinase (PKA) and AMP-activated protein kinase (AMPK) (34–36). Next to phosphorylation/dephosphorylation, nuclear acetylation of ChREBP and association with histone acetyltransferase (HAT) coactivator p300 promote its recruitment and binding to the DNA (37). In addition, O-GlcNAcylation stimulates ChREBP by increasing its protein levels and transactivation (38–40). Secondly, ChREBP is activated by glycolytic and PPP intermediates. X5P, a PPP intermediate, stimulates PP2A-mediated ChREBP dephosphorylation, promoting its nuclear translocation and transcriptional activity (35). In addition, glycolytic metabolites G6P and fructose-2,6-bisphosphate (F2,6bisP) promote ChREBP transactivation (41–43). Although activation of ChREBP by G6P and F2,6bisP likely involves allosteric regulation and post-transcriptional modifications, the exact mechanisms are still unknown. Thirdly, ChREBP expression and activity are regulated by other nuclear receptors. Both liver X receptor (LXR) and thyroid hormone (TR) can bind to the ChREBP gene promotor and activate its transcription and activity (44–47). Farnesoid X receptor (FXR), on the other hand, interacts with the ChREBP protein, thereby modulating transcription of ChREBP genes involved in glycolysis and lipogenesis (48).
Hepatic GCK-ChREBP signalingThe glucose-sensitive enzyme GCK controls the flux of glucose into hepatocytes (49,50). Its activity and expression increases with rising blood glucose levels, which has been proposed to be mediated by the insulin-activated transcription factor sterol regulatory element binding protein (SREBP1c) (51,52). However, discrepancies between findings in vivo and in vitro concerning insulin-mediated GCK transcription by SREBP1c have challenged this view. Other transcription factors, i.e., PPARγ, LXR, and LRH-1 have been proposed to contribute to GCK expression and activation (52–56). Glycolytic metabolites fructose-1-phosphate and F-6-P, respectively, inhibit and stimulate release of GCK from the nucleus to the cytosol by binding to glucokinase regulatory protein (GCKR) (8,57). As GCK-dependent synthesis of glycolytic metabolites (G6P, X5P, F2,6bisP) is crucial for ChREBP activation, the GCK-ChREBP axis is considered as the major hepatic glucose-sensing system (53,58,59).
Glucose-sensitive post-translational modificationsPost-translational modifications allow for rapid adaptive response of regulatory proteins to environmental changes. The metabolic state of the cell is reflected by intracellular intermediates, such as acetyl-CoA, which can modify metabolic enzymes (60,61). Importantly, post-transcriptional modifications of metabolic enzymes allow for feed-forward and feed-back regulation of biochemical pathways in response to
2020 07 03 Boekje 1.0.indd 122020 07 03 Boekje 1.0.indd 12 24/07/2020 21:1324/07/2020 21:13

General introduction
13
1
the metabolic state (62). Modification of histone proteins alters the accessibility of the chromatin for transcription factors, hence altering transcriptional activity.
Two glucose-sensitive post-translational modifications that likely contribute to hepatic glucose sensing are acetylation and O-GlcNAcylation (63–67). In case of protein acetylation, the acetyl group of acetyl-CoA is transferred to specific lysine residues of the protein. This process is facilitated by lysine acetyltransferases (KATs) and the reverse reaction is mediated by either histone deacetylases (HDACs) or sirtuins. Interestingly, glucose metabolism and availability is involved in histone acetylation via ATP-citrate lyase (ACLY), the enzyme that converts glucose-derived citrate into acetyl-CoA (61). Although fatty acid oxidation also results in production of acetyl-CoA, it was at first suggested that only nucleocytoplasmic, and not mitochondrial, acetyl-CoA promotes histone acetylation (61). However, this view was recently challenged as lipid-derived carbons were found to be used for histone acetylation, as shown by a stable isotope tracing technique (68). In vitro, ACLY-dependent production of acetyl-CoA determines the total amount of histone acetylation and contributes to post-translational regulation of genes involved in glucose metabolism (61,69–72). Future work will reveal how different metabolic pathways and protein acetylation interact/converge to optimize cellular responses.
The substrate for O-GlcNAcylation, UDP-N-acetylglucosamine (UDP-GlcNAc), is synthesized by the hexosamine biosynthesis pathway from F-6-P, glutamine, acetyl-CoA and uridine triphosphate (UTP). UDP-GlcNAc is added or removed from serine and threonine residues by O-GlcNAc transferase (OGT) or O-GlcNAcase (OGA), respectively (73). O-GlcNAcylation plays a role in regulation of glucose metabolism, for instance by regulating gluconeogenic transcription factors forkhead box O1 (FOXO1) and PGC-1α (74,75). In addition, O-GlcNAcylation is important in hepatic glucose sensing, as it activates ChREBP (38). The biology of O-GlcNAcylation is largely unexplored and exact molecular mechanisms and subsequent physiological functions are still unknown.
Interactions between glucose and other metabolic pathwaysGlucose sensing is essential for an adequate regulation of its own metabolism in order to maintain glycemia. Importantly, glucose also signals to other metabolic pathways via both substrate availability and transcriptional regulation by ChREBP. A series of metabolic processes that closely interact with glucose metabolism are those involved in hepatic lipid metabolism. Glucose metabolites activate ChREBP, which is involved in regulation of the expression of genes involved in de novo lipogenesis and VLDL assembly. Circumstantial evidence suggests that glucose signaling also impacts hepatic bile acid metabolism (76–82), although the exact mechanisms remain to be investigated.
2020 07 03 Boekje 1.0.indd 132020 07 03 Boekje 1.0.indd 13 24/07/2020 21:1324/07/2020 21:13

Chapter 1
14
Hepatic fatty acid metabolismThe liver plays a central role in fat homeostasis via de novo lipogenesis, as well as fatty acid uptake, storage, catabolism, and lipid secretion (83) (Fig. 2). In the postprandial state, dietary fatty acids are taken up by the intestine, assembled into chylomicrons and transported to the circulation via the lymphatic system. Lipoprotein lipase (LPL) mediates hydrolysis of chylomicron-associated triglycerides (TGs), which subsequently enter the liver via fatty acid transporters FATP4 and FATP5 and CD36 (83–86). CD36 is a fatty acid translocase that is expressed in heart, skeletal muscle, adipose tissue and by hepatic resident macrophages (Kupffer cells). Although its hepatic expression is very low, mRNA levels positively correlate with liver TG content in rats with hepatic steatosis (87) and patients with non-alcoholic fatty liver disease (NAFLD) exhibit higher CD36 protein levels (88). In mice, CD36 protein levels were shown to be increased in response to high fat diet and to contribute to hepatic fatty acid uptake and dyslipidemia (89). CD36 is a gene target of the lipogenic transcription factors LXR, PXR, and PPARγ, indicating that CD36 plays a role in the development and promotion of hepatic steatosis (88,90).
In addition to hepatic uptake, fatty acids can also be synthesized from excess glucose in the liver. De novo lipogenesis starts with the conversion of acetyl-CoA into malonyl-CoA, which, together with co-factor NADPH, is used as precursor for the synthesis of palmitic acid (C16:0). C16:0 synthesis from acetyl-CoA is catalyzed by ACC1 and FASN. Next, C16:0 is elongated by, amongst others, ELOVL6, to generate long chain fatty acids (LCFAs), which can subsequently be desaturated to form mono- and poly-unsaturated LCFAs by stearoyl-CoA desaturase-1 (SCD1). Importantly, glucose-sensitive transcription factor ChREBP induces the expression of lipogenic enzymes ACC1, FASN, ELOVL6 and SCD1, thus promoting lipogenesis upon activation by
Adiposetissue
Acetyl-CoA
Glycolysis
FATP4/5
CD36NEFA
Denovolipogenesis
TGStorage
TG
Uptake
VLDL-TG
VLDLsecretion
β-oxidationKetonebodies
NEFA
Lipolysis
PL
BiliaryPLexcretion
Chylomicrons
Figure2.Schematicoverviewofhepaticfattyacidmetabolism.FATP4/5,fattyacidtransporter4/5;NEFA,non-esterifiedfattyacids;TG,triglycerides;PL,phospholipids;VLDL,verylow-densitylipoprotein
Figure 2. Schematic overview of hepatic fatty acid metabolism. FATP4/5, fatty acid transporter 4/5; NEFA, non-esterified fatty acids; TG, triglycerides; PL, phospholipids; VLDL, very low-density lipoprotein.
2020 07 03 Boekje 1.0.indd 142020 07 03 Boekje 1.0.indd 14 24/07/2020 21:1324/07/2020 21:13

General introduction
15
1
glycolytic metabolites. On the other hand, in vitro ChREBP inhibition in primary mouse hepatocytes showed that ChREBP is required for the induction of glycolytic and lipogenic genes in response to glucose (22). Moreover, similar results were demonstrated in ChREBP knockout mice where ChREBP was shown to be required for the lipogenic response to a high-carbohydrate diet (56).
Newly synthesized fatty acids are subsequently esterified with G3P to form TGs, which can be either stored in lipid droplets, or secreted into the circulation as TG-rich VLDL particles. Under normal conditions, only a small amount of TGs is stored in the liver and the majority of TGs are packaged into VLDL particles. Assembly of VLDL starts in the lumen of the ER with the lipidation of a single apolipoprotein B 100 (apoB100) molecule by MTTP (91) and transmembrane 6 superfamily 2 (TM6SF2) (92). Next, additional TGs are packed into the nascent apoB100-containing particle when it travels from the ER to the Golgi, to form VLDL particles which are secreted into the circulation for energy supply to peripheral organs and energy storage in adipose tissue (93).
Fatty acids are also excreted from the liver via the bile. Bile contains mixed micelles, consisting of bile acids, phospholipids – mainly phosphatidylcholine (PC) – and cholesterol. Phospholipids are composed of a phosphate head group and two fatty acids (94). Biliary PC mostly contains palmitate, stearate, oleic acid, linoleic acid or arachidonic acid (95,96). Its secretion is influenced by biliary bile acid concentration, bile acid composition, biliary concentration of hydrophilic organic anions, and the exposure time of the bile acids to the bile canalicular membrane (95,97–102). Overall, hydrophobic bile acids are more potent enhancers of biliary phospholipid secretion as compared to hydrophilic ones (97,99,100). Once in the bile canalicular lumen, biliary phospholipids and bile acids together form mixed micelles to solubilize cholesterol and dietary lipids upon arrival in the intestinal lumen.
In the post-absorptive state, low insulin-to-glucagon ratios promote non-esterified fatty acids (NEFAs) release from the adipose tissue by triacylglycerol lipase and hormone-sensitive lipase (HSL). These NEFAs are secreted into the circulation to enable their use as energy substrate by for instance heart, skeletal muscle, and liver, hence contributing to ‘glucose sparing’ under these conditions. After uptake by the liver via FATP4 and FATP5 and CD36, fatty acids can undergo β-oxidation resulting in the production of acetyl-CoA, FADH2 and NADPH. Co-enzymes FADH2 and NADH are used in the electron transport chain to produce ATP. Part of the acetyl-CoA generated via β-oxidation is used to produce ketone bodies (β-hydroxybutyrate, acetoacetate, and acetone); which serve as important metabolic fuels. As fatty acids cannot cross the blood-brain barrier, the brain is forced to use ketone bodies as an energy source when blood glucose levels drop. Thus under fasting conditions
2020 07 03 Boekje 1.0.indd 152020 07 03 Boekje 1.0.indd 15 24/07/2020 21:1324/07/2020 21:13

Chapter 1
16
particularly the brain relies on ketone bodies for its energy supply. Because of the risk of seizures/coma associated with extremely high ketone body concentration in blood, referred to as ketoacidosis, ketone bodies can only be used as a metabolic fuel for a limited period of time without causing damage.
Hepatic bile acid metabolismBile acids facilitate absorption of dietary lipids and fat-soluble vitamins in the intestine, and also act as signaling molecules that control lipid and energy metabolism (103). Synthesis of bile acids from cholesterol is believed to occur exclusively in the liver and comprises multiple biochemical reactions initiated by cholesterol 7α-hydroxylase (CYP7A1), the rate-controlling enzyme in the ‘classic’ pathway of primary bile acid synthesis (104). Sterol 12α-hydroxylase (CYP8B1) subsequently generates 3α,7α,12α-trihydroxy-5β-cholan-24-oic acid (cholic acid; CA) as end product. As a consequence, hepatic CYP8B1 activity determines the contribution of CA produced in the ‘classic’ pathway relative to 3α,7α-dihydroxy-5β-cholan-24-oic acid (chenodeoxycholic acid; CDCA). CDCA, in contrast to CA, can also be generated via an ‘alternative’ pathway starting with 27-hydroxylation of cholesterol (104). CDCA is efficiently converted to hydrophilic C6-hydroxylated muricholic acids (MCAs) in rodents but not in humans (104). Primary bile acid species are secreted into the intestine where they can be converted by microbial actions to secondary bile acids with distinct physicochemical properties (104) that determine their efficacy to promote fat and cholesterol absorption as well as their signaling functions (103).
By signaling through two major receptor pathways; i.e., farnesoid X receptor (FXR) and Takeda G protein-coupled receptor 5 (TGR5, also known as G Protein-Coupled Bile Acid Receptor 1; GPBAR1), bile acids act as ‘hormones’ that control hepatic glucose and lipid metabolism (103,105,106). Bile acid-induced FXR activation interferes with glucose metabolism by inhibiting glycolysis through L-PK expression (48). Moreover, FXR interacts with glucose-sensitive transcription factor ChREBP to modulate its activity (48,107). In the liver, TGR5 is expressed in Kupffer cells and sinusoidal endothelial cells (108). Intestinal TGR5 activation stimulates secretion of GLP-1, which in turn enhances insulin secretion from pancreatic β-cells and subsequently stimulates glucose uptake by various organs (109,110).
In mice, FXR regulates hepatic and plasma lipid levels by interfering with de novo lipogenesis via the transcription factor sterol regulatory element binding protein (SREBP-1c) (111). SREBP-1c induces the transcription of ACC1, FASN, and SCD1 (112). Bile acid- or pharmacological ligand-induced FXR activation reduces hepatic SREBP-1c expression via small heterodimer protein (SHP; NR0B2), resulting in reduced hepatic triglyceride levels (111). Moreover, FXR activation lowers plasma triglyceride levels by improving VLDL-TG catabolism, presumably by induction of
2020 07 03 Boekje 1.0.indd 162020 07 03 Boekje 1.0.indd 16 24/07/2020 21:1324/07/2020 21:13

General introduction
17
1
apolipoprotein C2 (apoC2), an established FXR target and activator of lipoprotein lipase (113). Thus, bile acids not only facilitate dietary fat absorption, but also regulate glucose and lipid metabolism via FXR and TGR5 activation.
Metabolic consequences of disturbed hepatic glucose sensing in human diseasesDysregulation of hepatic glucose sensing has consequences for glycemia as well as for hepatic glucose- and lipid metabolism. Chronically activated glucose-sensitive transcription factors may contribute to the development and pathophysiology of diseases with abnormal glucose sensing, such as type 2 diabetes and glycogen storage disease type Ia.
Type 2 diabetesType 2 diabetes is an age-related disease with an increasing prevalence of 10% of the total population, and is characterized by a decrease in pancreatic β-cell mass and -function (114). Fasting plasma glucose levels subsequently rise, which is compensated for by increased insulin secretion to maintain normoglycemia. High insulin levels and insulin resistance in type 2 diabetes (T2D) are thus generally associated with hyperglycemic episodes and enhanced intrahepatic glucose metabolism (10,115), leading to sustained activation of hepatic glucose sensors (81,116,117). Dysregulation of glycemia in T2D results in hepatic TG accumulation, referred to as hepatic steatosis (118), and is associated with cardiovascular disease and non-alcoholic steatohepatitis (NASH) (119). Several studies investigated the role of glucose-sensitive transcription factor ChREBP in the pathophysiology of dysregulated glycemia and insulin resistance. In ob/ob mice, sustained ChREBP activation results in increased gluconeogenesis, enhanced lipogenesis, and hepatic TG accumulation (118). On the other hand, liver-specific inhibition of ChREBP in ob/ob mice improved hyperlipidemia, hyperglycemia, and hyperinsulinemia (24,118). In T2D patients, increased hepatic ChREBP expression associates with hepatic steatosis and insulin resistance (116).
Besides the signaling effects of bile acids on glucose and lipid metabolism, disturbed glucose homeostasis in T2D is also associated with an increase in 12-hydroxylated bile acids (80–82). In vitro studies have shown that both insulin and glucose induce the expression of CYP7A1 (76,120), while insulin suppresses and glucose induces the expression of CYP8B1 (76,121). The insulin sensitive transcription factor FOXO1 induces the suppression of CYP8B1 (81) and under insulin-resistant conditions, constitutive FOXO1 activation shifts the composition of the bile acid pool towards an increased contribution of CA and its hydrophobic microbial metabolite deoxycholic acid (DCA) (81). Insulin resistance is therefore associated with an increase in CA synthesis (80–82,122), a more hydrophobic bile acid pool in humans (80), as well as
2020 07 03 Boekje 1.0.indd 172020 07 03 Boekje 1.0.indd 17 24/07/2020 21:1324/07/2020 21:13

Chapter 1
18
an increase in total plasma bile acid levels (80,122,123).
Changes in bile acid levels and -composition associated with insulin resistance may alter the activation of FXR and/or TGR5. Besides, a more hydrophobic bile acid pool promotes the absorption of dietary cholesterol and fat (124,125). On the other hand, treatment with bile acids or synthetic FXR agonists improves glycemic control (126) and bile acid sequestrants are used as glucose- and lipid lowering drugs in T2D patients (127). Obeticholic acid (OCA), a synthetic bile acid derivative, is a potent FXR agonist and improves insulin sensitivity in rats with hepatic steatosis (128). Overall, bile acid metabolism is an attractive therapeutic target for type 2 diabetes and NAFLD (122).
Glycogen storage disease type IGlycogen storage diseases (GSDs) represent a group of ultra-rare inherited metabolic disorders of carbohydrate metabolism, caused by enzyme deficiencies in glucose transport, glycogen synthesis, glycogen breakdown or glycolysis (129). The 12 types of GSDs, with an overall incidence of 1 in 20,000 to 43,000 live births, are characterized by the accumulation G6P and/or glycogen in different tissues, with mainly liver, heart and muscles affected (130). Glycogen Storage Disease type 1 (GSD I; Von Gierke disease) has an incidence of 1:100,000 and is caused by mutations in the catalytic subunit (G6PC) of the glucose-6-phophatase (G6Pase) complex (GSD Ia) or in the glucose-6-phosphate transporter SLC37A4 (G6PT) (GSD Ib) (131–133). It is characterized by G6P and glycogen accumulation in liver, kidney and intestine. Because of impaired G6Pase activity in hepatocytes, disturbed glucose metabolism in GSD I results in constitutive activation of hepatic glucose sensors and development of fatty liver and dyslipidemia, similar to T2D (134). In contrast to T2D, blood glucose and insulin levels are low, while, similar to T2D, intrahepatic glucose (G6P) and glycogen levels are high (1,10,135,136). This unique feature of GSD makes it a unique model disease to selectively investigate the pathophysiological consequences of enhanced intrahepatic glucose signaling, independent of insulin.
As the hydrolysis of G6P by G6PC is essential for glucose production, GSD Ia patients present with severe fasting hypoglycemia, which can occur as early as 2-3 hours after a meal. During infancy, perturbed glucose homeostasis leads to failure to thrive and hepatomegaly. Biochemically, patients display hypoglycemia, hyperlipidemia, hyperlactatemia and hyperuricemia. To prevent hypoglycemia, patients have to adhere to a strict diet with frequent intake of uncooked cornstarch and/or nasogastric tube feeding (137,138). Although dietary adherence generally reduces hypoglycemic episodes and largely corrects secondary metabolic derangements, long-term complications of GSD Ia still frequently occur (137–139). Among these complications are nephropathy, osteopenia and osteoporosis, severe hepatic steatosis
2020 07 03 Boekje 1.0.indd 182020 07 03 Boekje 1.0.indd 18 24/07/2020 21:1324/07/2020 21:13

General introduction
19
1
and the development of liver adenomas in young adulthood. GSD Ib patients show similar symptoms and complications as compared to GSD Ia, and furthermore develop neutropenia and neutrophil dysfunction over time (137,140–142).
Hypertriglyceridemia and hepatic steatosis in GSD Ia are commonly attributed to an increase in hepatic fatty acid synthesis (143,144). In clinical practice, serum triglyceride levels are considered the most reliable marker for metabolic control in GSD Ia patients (138,145). Moreover, hypertriglyceridemia and poor metabolic control are associated with long-term complications such as liver adenoma progression (146–148). Yet, it is unknown what the mechanistic link is between glycemic control and pathophysiological mechanisms that underlie symptoms and complications. Understanding of the relationship between metabolic control and hyperlipidemia is of great importance to further improve and personalize GSD Ia patient care. Investigation of disease mechanisms of GSD I and its consequences is however challenging because of the limited number of patients and the inaccessibility of organs involved.
Scope and outline of this thesisThe studies described in this thesis address the (patho)physiological consequences of excessive hepatic glucose signaling in GSD Ia. The work focuses on the effects of disturbed glucose sensing on lipid and bile acid metabolism, the contribution of hepatic ChREBP to GSD Ia-associated NAFLD development, and the therapeutic potential of FXR activators to reduce NAFLD in GSD Ia. It is commonly assumed that hepatic steatosis and hypertriglyceridemia in GSD Ia result from an increase in hepatic de novo lipogenesis and VLDL secretion driven by the prevailing high glycolytic flux, but the exact mechanisms linking circulating glycemia and hyperlipidemia in GSD
Bloodglucose
G6PC G6PT
L-G6pc-/-S4048
G6P
Glycogen
TG
TCAcycle
VLDL
Citrate
Figure 3. Hepatocyte specific G6PC knockout (L-G6pc-/-) mice and mice receiving the pharmacologicalG6PT inhibitor S4048 are used in this thesis to study altered lipid and bile metabolism in GSD Ia.
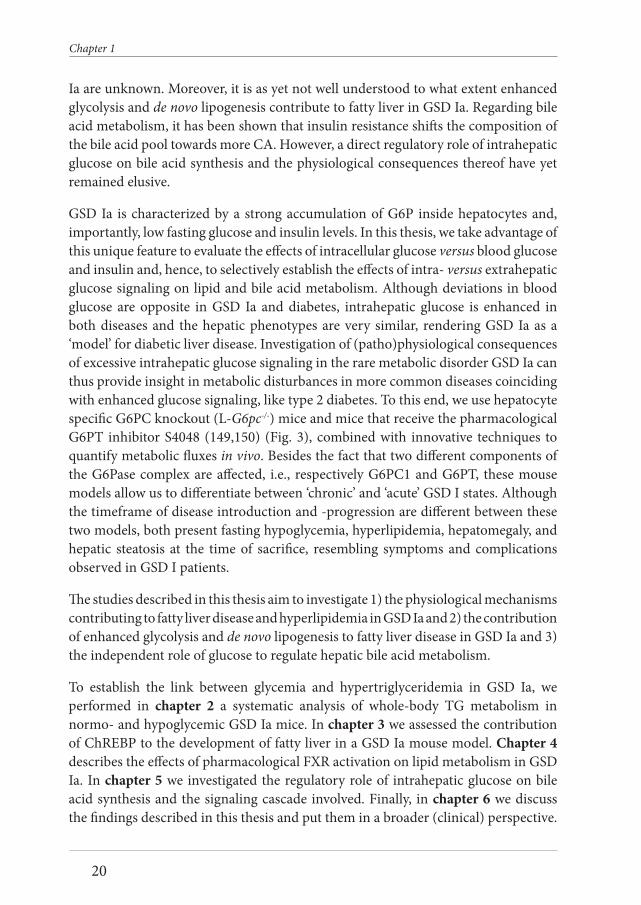
Figure 3. Hepatocyte specific G6PC knockout (L-G6pc-/-) mice and mice receiving the pharmacological G6PT inhibitor S4048 are used in this thesis to study altered lipid and bile metabolism in GSD Ia. G6PC, glucose-6-phosphatase; G6PT, glucose-6-phosphate transporter; G6P, glucose-6-phosphate; TG, triglycerides; VLDL, very low-density lipoprotein.
2020 07 03 Boekje 1.0.indd 192020 07 03 Boekje 1.0.indd 19 24/07/2020 21:1324/07/2020 21:13
Chapter 1
20
Ia are unknown. Moreover, it is as yet not well understood to what extent enhanced glycolysis and de novo lipogenesis contribute to fatty liver in GSD Ia. Regarding bile acid metabolism, it has been shown that insulin resistance shifts the composition of the bile acid pool towards more CA. However, a direct regulatory role of intrahepatic glucose on bile acid synthesis and the physiological consequences thereof have yet remained elusive.
GSD Ia is characterized by a strong accumulation of G6P inside hepatocytes and, importantly, low fasting glucose and insulin levels. In this thesis, we take advantage of this unique feature to evaluate the effects of intracellular glucose versus blood glucose and insulin and, hence, to selectively establish the effects of intra- versus extrahepatic glucose signaling on lipid and bile acid metabolism. Although deviations in blood glucose are opposite in GSD Ia and diabetes, intrahepatic glucose is enhanced in both diseases and the hepatic phenotypes are very similar, rendering GSD Ia as a ‘model’ for diabetic liver disease. Investigation of (patho)physiological consequences of excessive intrahepatic glucose signaling in the rare metabolic disorder GSD Ia can thus provide insight in metabolic disturbances in more common diseases coinciding with enhanced glucose signaling, like type 2 diabetes. To this end, we use hepatocyte specific G6PC knockout (L-G6pc-/-) mice and mice that receive the pharmacological G6PT inhibitor S4048 (149,150) (Fig. 3), combined with innovative techniques to quantify metabolic fluxes in vivo. Besides the fact that two different components of the G6Pase complex are affected, i.e., respectively G6PC1 and G6PT, these mouse models allow us to differentiate between ‘chronic’ and ‘acute’ GSD I states. Although the timeframe of disease introduction and -progression are different between these two models, both present fasting hypoglycemia, hyperlipidemia, hepatomegaly, and hepatic steatosis at the time of sacrifice, resembling symptoms and complications observed in GSD I patients.
The studies described in this thesis aim to investigate 1) the physiological mechanisms contributing to fatty liver disease and hyperlipidemia in GSD Ia and 2) the contribution of enhanced glycolysis and de novo lipogenesis to fatty liver disease in GSD Ia and 3) the independent role of glucose to regulate hepatic bile acid metabolism.
To establish the link between glycemia and hypertriglyceridemia in GSD Ia, we performed in chapter 2 a systematic analysis of whole-body TG metabolism in normo- and hypoglycemic GSD Ia mice. In chapter 3 we assessed the contribution of ChREBP to the development of fatty liver in a GSD Ia mouse model. Chapter 4 describes the effects of pharmacological FXR activation on lipid metabolism in GSD Ia. In chapter 5 we investigated the regulatory role of intrahepatic glucose on bile acid synthesis and the signaling cascade involved. Finally, in chapter 6 we discuss the findings described in this thesis and put them in a broader (clinical) perspective.
2020 07 03 Boekje 1.0.indd 202020 07 03 Boekje 1.0.indd 20 24/07/2020 21:1324/07/2020 21:13

General introduction
21
1
References1. Klover PJ, Mooney RA. Hepatocytes: critical for glucose homeostasis. Int. J. Biochem.
Cell Biol. 2004;36:753–758. 2. López-Gambero AJ, Martínez F, Salazar K, Cifuentes M, Nualart F. Brain Glucose-
Sensing Mechanism and Energy Homeostasis. Mol. Neurobiol. 2019;56:769–796. 3. Si-Tayeb K, Dé F, Lemaigre RP, Duncan SA. Developmental Cell Organogenesis and
Development of the Liver. DEVCEL. 2010;18:175–189. 4. Thorens B. GLUT2, glucose sensing and glucose homeostasis. Diabetologia. 2015;58:221–
232. 5. Mueckler M, Thorens B. The SLC2 (GLUT) family of membrane transporters. Mol.
Aspects Med. 2013;34:121–138. 6. Cárdenas ML, Cornish-Bowden A, Ureta T. Evolution and regulatory role of the
hexokinases. Biochim. Biophys. Acta - Mol. Cell Res. 1998;1401:242–264. 7. Wilson JE. Isozymes of mammalian hexokinase: structure, subcellular localization and
metabolic function. J. Exp. Biol. 2003;206:2049–57. 8. Schaftingen E van, Detheux M, Veiga da Cunha M. Short-term control of glucokinase
activity: role of a regulatory protein. FASEB J. 1994;8:414–9. 9. Postic C, Shiota M, Magnuson MA. Cell-specific roles of glucokinase in glucose
homeostasis. Recent Prog. Horm. Res. 2001;56:195–217. 10. Oosterveer MH, Schoonjans K. Hepatic glucose sensing and integrative pathways in the
liver. Cell. Mol. Life Sci. 2014;71:1453–1467. 11. Schaftingen E van, Gerin I. The glucose-6-phosphatase system. Biochem. J. 2002;362:513. 12. Katz J, Rognstad R. Futile cycling in glucose metabolism. Trends Biochem. Sci.
1978;3:171–174. 13. Hutton JC, O’Brien RM. Glucose-6-phosphatase catalytic subunit gene family. J. Biol.
Chem. 2009;284:29241–5. 14. Cappello AR, Curcio R, Lappano R, Maggiolini M, Dolce V. The Physiopathological Role
of the Exchangers Belonging to the SLC37 Family. Front. Chem. 2018;6. 15. Stümpel F, Burcelin R, Jungermann K, Thorens B. Normal kinetics of intestinal glucose
absorption in the absence of GLUT2: evidence for a transport pathway requiring glucose phosphorylation and transfer into the endoplasmic reticulum. Proc. Natl. Acad. Sci. U. S. A. 2001;98:11330–5.
16. Shieh J-J, Pan C-J, Mansfield BC, Chou JY. A Glucose-6-phosphate Hydrolase, Widely Expressed Outside the Liver, Can Explain Age-dependent Resolution of Hypoglycemia in Glycogen Storage Disease Type Ia. J. Biol. Chem. 2003;278:47098–47103.
17. Chou JY, Jun HS, Mansfield BC. Glycogen storage disease type I and G6Pase-β deficiency: etiology and therapy. Nat. Rev. Endocrinol. 2010;6:676–88.
18. Banka S, Newman WG. A clinical and molecular review of ubiquitous glucose-6-phosphatase deficiency caused by G6PC3 mutations. Orphanet J. Rare Dis. 2013;8:84.
19. Veiga-da-Cunha M, Chevalier N, Stephenne X, Defour J-P, Paczia N, Ferster A, et al. Failure to eliminate a phosphorylated glucose analog leads to neutropenia in patients
2020 07 03 Boekje 1.0.indd 212020 07 03 Boekje 1.0.indd 21 24/07/2020 21:1324/07/2020 21:13

Chapter 1
22
with G6PT and G6PC3 deficiency. Proc. Natl. Acad. Sci. U. S. A. 2019;116:1241–1250. 20. Jun HS, Cheung YY, Lee YM, Mansfield BC, Chou JY. Glucose-6-phosphatase-β,
implicated in a congenital neutropenia syndrome, is essential for macrophage energy homeostasis and functionality. Blood. 2012;119:4047–4055.
21. Taniguchi CM, Emanuelli B, Kahn CR. Critical nodes in signalling pathways: insights into insulin action. Nat. Rev. Mol. Cell Biol. 2006;7:85–96.
22. Ramnanan CJ, Edgerton DS, Kraft G, Cherrington AD. Physiologic action of glucagon on liver glucose metabolism. Diabetes, Obes. Metab. 2011;13:118–125.
23. Yamashita H, Takenoshita M, Sakurai M, Bruick RK, Henzel WJ, Shillinglaw W, et al. A glucose-responsive transcription factor that regulates carbohydrate metabolism in the liver. Proc. Natl. Acad. Sci. 2001;98:9116–9121.
24. Iizuka K, Bruick RK, Liang G, Horton JD, Uyeda K. Deficiency of carbohydrate response element-binding protein (ChREBP) reduces lipogenesis as well as glycolysis. Proc. Natl. Acad. Sci. U. S. A. 2004;101:7281–6.
25. Ishii S, IIzuka K, Miller BC, Uyeda K. Carbohydrate response element binding protein directly promotes lipogenic enzyme gene transcription. Proc. Natl. Acad. Sci. 2004;101:15597–15602.
26. Filhoulaud G, Guilmeau S, Dentin R, Girard J, Postic C. Novel insights into ChREBP regulation and function. Trends Endocrinol. Metab. 2013;24:257–68.
27. Niwa H, Iizuka K, Kato T, Wu W, Tsuchida H, Takao K, et al. ChREBP Rather Than SHP Regulates Hepatic VLDL Secretion. Nutrients. 2018;10:321.
28. Ma L, Robinson LN, Towle HC. ChREBP*Mlx is the principal mediator of glucose-induced gene expression in the liver. J. Biol. Chem. 2006;281:28721–30.
29. Jeong Y-S, Kim D, Lee YS, Kim H-J, Han J-Y, Im S-S, et al. Integrated expression profiling and genome-wide analysis of ChREBP targets reveals the dual role for ChREBP in glucose-regulated gene expression. PLoS One. 2011;6:e22544.
30. Baraille F, Planchais J, Dentin R, Guilmeau S, Postic C. Integration of ChREBP-Mediated Glucose Sensing into Whole Body Metabolism. Physiology. 2015;30:428–437.
31. Herman MA, Peroni OD, Villoria J, Schön MR, Abumrad NA, Blüher M, et al. A novel ChREBP isoform in adipose tissue regulates systemic glucose metabolism. Nature. 2012;484:333–338.
32. Sae-Lee C, Moolsuwan K, Chan L, Poungvarin N. ChREBP Regulates Itself and Metabolic Genes Implicated in Lipid Accumulation in β-Cell Line. PLoS One. 2016;11:e0147411.
33. Iizuka K. Recent progress on the role of ChREBP in glucose and lipid metabolism. Endocr. J. 2013;60:543–555.
34. Kawaguchi T, Osatomi K, Yamashita H, Kabashima T, Uyeda K. Mechanism for Fatty Acid “Sparing” Effect on Glucose-induced Transcription. J. Biol. Chem. 2002;277:3829–3835.
35. Kabashima T, Kawaguchi T, Wadzinski BE, Uyeda K. Xylulose 5-phosphate mediates glucose-induced lipogenesis by xylulose 5-phosphate-activated protein phosphatase in rat liver. Proc. Natl. Acad. Sci. U. S. A. 2003;100:5107–12.
2020 07 03 Boekje 1.0.indd 222020 07 03 Boekje 1.0.indd 22 24/07/2020 21:1324/07/2020 21:13

General introduction
23
1
36. Kawaguchi T, Takenoshita M, Kabashima T, Uyeda K. Glucose and cAMP regulate the L-type pyruvate kinase gene by phosphorylation/dephosphorylation of the carbohydrate response element binding protein. Proc. Natl. Acad. Sci. U. S. A. 2001;98:13710–5.
37. Bricambert J, Miranda J, Benhamed F, Girard J, Postic C, Dentin R. Salt-inducible kinase 2 links transcriptional coactivator p300 phosphorylation to the prevention of ChREBP-dependent hepatic steatosis in mice. J. Clin. Invest. 2010;120:4316–31.
38. Guinez C, Filhoulaud G, Rayah-Benhamed F, Marmier S, Dubuquoy C, Dentin R, et al. O-GlcNAcylation increases ChREBP protein content and transcriptional activity in the liver. Diabetes. 2011;60:1399–413.
39. Sakiyama H, Fujiwara N, Noguchi T, Eguchi H, Yoshihara D, Uyeda K, et al. The role of O-linked GlcNAc modification on the glucose response of ChREBP. Biochem. Biophys. Res. Commun. 2010;402:784–9.
40. Ido-Kitamura Y, Sasaki T, Kobayashi M, Kim H-J, Lee Y-S, Kikuchi O, et al. Hepatic FoxO1 integrates glucose utilization and lipid synthesis through regulation of Chrebp O-glycosylation. PLoS One. 2012;7:e47231.
41. Dentin R, Tomas-Cobos L, Foufelle F, Leopold J, Girard J, Postic C, et al. Glucose 6-phosphate, rather than xylulose 5-phosphate, is required for the activation of ChREBP in response to glucose in the liver. J. Hepatol. 2012;56:199–209.
42. Li M V., Chen W, Harmancey RN, Nuotio-Antar AM, Imamura M, Saha P, et al. Glucose-6-phosphate mediates activation of the carbohydrate responsive binding protein (ChREBP). Biochem. Biophys. Res. Commun. 2010;395:395–400.
43. Arden C, Tudhope SJ, Petrie JL, Al-Oanzi ZH, Cullen KS, Lange AJ, et al. Fructose 2,6-bisphosphate is essential for glucose-regulated gene transcription of glucose-6-phosphatase and other ChREBP target genes in hepatocytes. Biochem. J. 2012;443:111–23.
44. Fan Q, Nørgaard RC, Bindesbøll C, Lucas C, Dalen KT, Babaie E, et al. LXRα Regulates Hepatic ChREBPα Activity and Lipogenesis upon Glucose, but Not Fructose Feeding in Mice. Nutrients. 2017;9:678.
45. Cha J-Y, Repa JJ. The Liver X Receptor (LXR) and Hepatic Lipogenesis. J. Biol. Chem. 2007;282:743–751.
46. Hashimoto K, Ishida E, Matsumoto S, Okada S, Yamada M, Satoh T, et al. Carbohydrate response element binding protein gene expression is positively regulated by thyroid hormone. Endocrinology. 2009;150:3417–24.
47. Gauthier K, Billon C, Bissler M, Beylot M, Lobaccaro J-M, Vanacker J-M, et al. Thyroid Hormone Receptor β (TRβ) and Liver X Receptor (LXR) Regulate Carbohydrate-response Element-binding Protein (ChREBP) Expression in a Tissue-selective Manner. J. Biol. Chem. 2010;285:28156–28163.
48. Caron S, Huaman Samanez C, Dehondt H, Ploton M, Briand O, Lien F, et al. Farnesoid X Receptor Inhibits the Transcriptional Activity of Carbohydrate Response Element Binding Protein in Human Hepatocytes. Mol. Cell. Biol. 2013;33:2202–2211.
49. Massa ML, Gagliardino JJ, Francini F. Liver glucokinase: An overview on the regulatory
2020 07 03 Boekje 1.0.indd 232020 07 03 Boekje 1.0.indd 23 24/07/2020 21:1324/07/2020 21:13

Chapter 1
24
mechanisms of its activity. IUBMB Life. 2011;63:1–6. 50. Iynedjian PB. Molecular Physiology of Mammalian Glucokinase. Cell. Mol. Life Sci.
2009;66:27–42. 51. Foretz M, Guichard C, Ferré P, Foufelle F. Sterol regulatory element binding protein-
1c is a major mediator of insulin action on the hepatic expression of glucokinase and lipogenesis-related genes. Proc. Natl. Acad. Sci. U. S. A. 1999;96:12737–42.
52. Kim T-H, Kim H, Park J-M, Im S-S, Bae J-S, Kim M-Y, et al. Interrelationship between liver X receptor alpha, sterol regulatory element-binding protein-1c, peroxisome proliferator-activated receptor gamma, and small heterodimer partner in the transcriptional regulation of glucokinase gene expression in liver. J. Biol. Chem. 2009;284:15071–83.
53. Oosterveer MH, Mataki C, Yamamoto H, Harach T, Moullan N, van Dijk TH, et al. LRH-1-dependent glucose sensing determines intermediary metabolism in liver. J. Clin. Invest. 2012;122:2817–26.
54. Bechmann LP, Gastaldelli A, Vetter D, Patman GL, Pascoe L, Hannivoort RA, et al. Glucokinase links Krüppel-like factor 6 to the regulation of hepatic insulin sensitivity in nonalcoholic fatty liver disease. Hepatology. 2012;55:1083–93.
55. Roth U, Jungermann K, Kietzmann T. Modulation of glucokinase expression by hypoxia-inducible factor 1 and upstream stimulatory factor 2 in primary rat hepatocytes. Biol. Chem. 2004;385:239–47.
56. Ganjam GK, Dimova EY, Unterman TG, Kietzmann T. FoxO1 and HNF-4 are involved in regulation of hepatic glucokinase gene expression by resveratrol. J. Biol. Chem. 2009;284:30783–97.
57. Futamura M, Hosaka H, Kadotani A, Shimazaki H, Sasaki K, Ohyama S, et al. An Allosteric Activator of Glucokinase Impairs the Interaction of Glucokinase and Glucokinase Regulatory Protein and Regulates Glucose Metabolism. J. Biol. Chem. 2006;281:37668–37674.
58. Dentin R, Pégorier J-P, Benhamed F, Foufelle F, Ferré P, Fauveau V, et al. Hepatic glucokinase is required for the synergistic action of ChREBP and SREBP-1c on glycolytic and lipogenic gene expression. J. Biol. Chem. 2004;279:20314–26.
59. Postic C, Shiota M, Niswender KD, Jetton TL, Chen Y, Moates JM, et al. Dual roles for glucokinase in glucose homeostasis as determined by liver and pancreatic beta cell-specific gene knock-outs using Cre recombinase. J. Biol. Chem. 1999;274:305–15.
60. Metallo CM, Vander Heiden MG. Metabolism strikes back: metabolic flux regulates cell signaling. Genes Dev. 2010;24:2717–2722.
61. Wellen KE, Hatzivassiliou G, Sachdeva UM, Bui T V, Cross JR, Thompson CB. ATP-citrate lyase links cellular metabolism to histone acetylation. Science. 2009;324:1076–80.
62. Wellen KE, Thompson CB. A two-way street: reciprocal regulation of metabolism and signalling. Nat. Rev. Mol. Cell Biol. 2012;13:270–276.
63. Kaelin WG, McKnight SL. Influence of metabolism on epigenetics and disease. Cell. 2013;153:56–69.
64. Lu C, Thompson CB. Metabolic regulation of epigenetics. Cell Metab. 2012;16:9–17.
2020 07 03 Boekje 1.0.indd 242020 07 03 Boekje 1.0.indd 24 24/07/2020 21:1324/07/2020 21:13

General introduction
25
1
65. Donohoe DR, Bultman SJ. Metaboloepigenetics: Interrelationships between energy metabolism and epigenetic control of gene expression. J. Cell. Physiol. 2012;227:3169–3177.
66. Katada S, Imhof A, Sassone-Corsi P. Connecting Threads: Epigenetics and Metabolism. Cell. 2012;148:24–28.
67. Hart GW. Nutrient regulation of signaling and transcription. J. Biol. Chem. 2019;294:2211–2231.
68. McDonnell E, Crown SB, Fox DB, Kitir B, Ilkayeva OR, Olsen CA, et al. Lipids Reprogram Metabolism to Become a Major Carbon Source for Histone Acetylation. Cell Rep. 2016;17:1463–1472.
69. Takahashi H, McCaffery JM, Irizarry RA, Boeke JD. Nucleocytosolic Acetyl-Coenzyme A Synthetase Is Required for Histone Acetylation and Global Transcription. Mol. Cell. 2006;23:207–217.
70. Madiraju P, Pande S V, Prentki M, Madiraju SRM. Mitochondrial acetylcarnitine provides acetyl groups for nuclear histone acetylation. Epigenetics. 2009;4:399–403.
71. Tu BP, Kudlicki A, Rowicka M, McKnight SL. Logic of the Yeast Metabolic Cycle: Temporal Compartmentalization of Cellular Processes. Science (80-. ). 2005;310:1152–1158.
72. Cai L, Sutter BM, Li B, Tu BP. Acetyl-CoA induces cell growth and proliferation by promoting the acetylation of histones at growth genes. Mol. Cell. 2011;42:426–37.
73. Hanover JA, Krause MW, Love DC. The hexosamine signaling pathway: O-GlcNAc cycling in feast or famine. Biochim. Biophys. Acta - Gen. Subj. 2010;1800:80–95.
74. Housley MP, Rodgers JT, Udeshi ND, Kelly TJ, Shabanowitz J, Hunt DF, et al. O -GlcNAc Regulates FoxO Activation in Response to Glucose. J. Biol. Chem. 2008;283:16283–16292.
75. Housley MP, Udeshi ND, Rodgers JT, Shabanowitz J, Puigserver P, Hunt DF, et al. A PGC-1α-O-GlcNAc Transferase Complex Regulates FoxO Transcription Factor Activity in Response to Glucose. J. Biol. Chem. 2009;284:5148.
76. Li T, Chanda D, Zhang Y, Choi H-S, Chiang JYL. Glucose stimulates cholesterol 7alpha-hydroxylase gene transcription in human hepatocytes. J. Lipid Res. 2010;51:832–42.
77. Li T, Francl JM, Boehme S, Ochoa A, Zhang Y, Klaassen CD, et al. Glucose and insulin induction of bile acid synthesis: mechanisms and implication in diabetes and obesity. J. Biol. Chem. 2012;287:1861–73.
78. van Waarde WM, Verkade HJ, Wolters H, Havinga R, Baller J, Bloks V, et al. Differential effects of streptozotocin-induced diabetes on expression of hepatic ABC-transporters in rats. Gastroenterology. 2002;122:1842–1852.
79. Herrema H, Meissner M, van Dijk TH, Brufau G, Boverhof R, Oosterveer MH, et al. Bile salt sequestration induces hepatic de novo lipogenesis through farnesoid X receptor- and liver X receptorα-controlled metabolic pathways in mice. Hepatology. 2010;51:806–816.
80. Haeusler RA, Astiarraga B, Camastra S, Accili D, Ferrannini E. Human insulin resistance is associated with increased plasma levels of 12α-hydroxylated bile acids. Diabetes.
2020 07 03 Boekje 1.0.indd 252020 07 03 Boekje 1.0.indd 25 24/07/2020 21:1324/07/2020 21:13

Chapter 1
26
2013;62:4184–91. 81. Haeusler RA, Pratt-Hyatt M, Welch CL, Klaassen CD, Accili D. Impaired generation of
12-hydroxylated bile acids links hepatic insulin signaling with dyslipidemia. Cell Metab. 2012;15:65–74.
82. Brufau G, Stellaard F, Prado K, Bloks VW, Jonkers E, Boverhof R, et al. Improved glycemic control with colesevelam treatment in patients with type 2 diabetes is not directly associated with changes in bile acid metabolism. Hepatology. 2010;52:1455–64.
83. Alves-Bezerra M, Cohen DE. Triglyceride Metabolism in the Liver [Internet]. In: Comprehensive Physiology. Hoboken, NJ, USA: John Wiley & Sons, Inc.; 2017. p. 1–22.
84. Stremmel W, Pohl L, Ring A, Herrmann T. A new concept of cellular uptake and intracellular trafficking of long-chain fatty acids. Lipids. 2001;36:981–9.
85. Doege H, Baillie RA, Ortegon AM, Tsang B, Wu Q, Punreddy S, et al. Targeted Deletion of FATP5 Reveals Multiple Functions in Liver Metabolism: Alterations in Hepatic Lipid Homeostasis. Gastroenterology. 2006;130:1245–1258.
86. Seeßle J, Liebisch G, Schmitz G, Stremmel W, Chamulitrat W. Palmitate activation by fatty acid transport protein 4 as a model system for hepatocellular apoptosis and steatosis. Biochim. Biophys. Acta - Mol. Cell Biol. Lipids. 2015;1851:549–565.
87. Buqué X, Martínez MJ, Cano A, Miquilena-Colina ME, García-Monzón C, Aspichueta P, et al. A subset of dysregulated metabolic and survival genes is associated with severity of hepatic steatosis in obese Zucker rats. J. Lipid Res. 2010;51:500–13.
88. Miquilena-Colina ME, Lima-Cabello E, Sánchez-Campos S, García-Mediavilla MV, Fernández-Bermejo M, Lozano-Rodríguez T, et al. Hepatic fatty acid translocase CD36 upregulation is associated with insulin resistance, hyperinsulinaemia and increased steatosis in non-alcoholic steatohepatitis and chronic hepatitis C. Gut. 2011;60:1394–402.
89. Koonen DPY, Jacobs RL, Febbraio M, Young ME, Soltys C-LM, Ong H, et al. Increased Hepatic CD36 Expression Contributes to Dyslipidemia Associated With Diet-Induced Obesity. Diabetes. 2007;56:2863–2871.
90. Zhou J, Febbraio M, Wada T, Zhai Y, Kuruba R, He J, et al. Hepatic Fatty Acid Transporter Cd36 Is a Common Target of LXR, PXR, and PPARγ in Promoting Steatosis. Gastroenterology. 2008;134:556-567.e1.
91. Gordon DA, Wetterau JR, Gregg RE. Microsomal triglyceride transfer protein: a protein complex required for the assembly of lipoprotein particles. Trends Cell Biol. 1995;5:317–21.
92. Smagris E, Gilyard S, BasuRay S, Cohen JC, Hobbs HH. Inactivation of Tm6sf2, a Gene Defective in Fatty Liver Disease, Impairs Lipidation but Not Secretion of Very Low Density Lipoproteins. J. Biol. Chem. 2016;291:10659–76.
93. Kawano Y, Cohen DE. Mechanisms of hepatic triglyceride accumulation in non-alcoholic fatty liver disease. J. Gastroenterol. 2013;48:434–41.
94. Reshetnyak VI. Physiological and molecular biochemical mechanisms of bile formation. World J. Gastroenterol. 2013;19:7341.
95. Alvaro D, Cantafora A, Attili AF, Ginanni Corradini S, De Luca C, Minervini G, et al.
2020 07 03 Boekje 1.0.indd 262020 07 03 Boekje 1.0.indd 26 24/07/2020 21:1324/07/2020 21:13

General introduction
27
1
Relationships between bile salts hydrophilicity and phospholipid composition in bile of various animal species. Comp. Biochem. Physiol. B. 1986;83:551–4.
96. Kawamoto T, Okano G, Akino T. Biosynthesis and turnover of individual molecular species of phosphatidylcholine in liver and bile. Biochim. Biophys. Acta. 1980;619:20–34.
97. Hardison W, Apter J. Micellar theory of biliary cholesterol excretion. Am. J. Physiol. Content. 1972;222:61–67.
98. Carulli N, Loria P, Bertolotti M, Ponz de Leon M, Menozzi D, Medici G, et al. Effects of acute changes of bile acid pool composition on biliary lipid secretion. J. Clin. Invest. 1984;74:614–24.
99. Eaton DL, Klaassen CD. Effects of Acute Administration of Taurocholic and Taurochenodeoxycholic Acid on Biliary Lipid Excretion in the Rat. Exp. Biol. Med. 1976;151:198–202.
100. O’Maille ER, Kozmary S V., Hofmann AF, Gurantz D. Differing effects of norcholate and cholate on bile flow and biliary lipid secretion in the rat. Am. J. Physiol. Liver Physiol. 1984;246:G67–G71.
101. Apstein MD. Inhibition of biliary phospholipid and cholesterol secretion by bilirubin in the Sprague-Dawley and Gunn rat. Gastroenterology. 1984;87:634–8.
102. Verkade HJ, Wolters H, Gerding A, Havinga R, Fidler V, Vonk RJ, et al. Mechanism of biliary lipid secretion in the rat: a role for bile acid-independent bile flow? Hepatology. 1993;17:1074–80.
103. Lefebvre P, Cariou B, Lien F, Kuipers F, Staels B. Role of bile acids and bile acid receptors in metabolic regulation. Physiol. Rev. 2009;89:147–91.
104. Chiang JYL. Bile acids: regulation of synthesis. J. Lipid Res. 2009;50:1955–66. 105. Chiang JYL. Bile acid metabolism and signaling. Compr. Physiol. 2013;3:1191–212. 106. Kuipers F, Bloks VW, Groen AK. Beyond intestinal soap—bile acids in metabolic control.
Nat. Rev. Endocrinol. 2014;10:488–498. 107. Benhamed F, Filhoulaud G, Caron S, Lefebvre P, Staels B, Postic C. O-GlcNAcylation
Links ChREBP and FXR to Glucose-Sensing. Front. Endocrinol. (Lausanne). 2014;5:230. 108. Chiang JYL, Pathak P, Liu H, Donepudi A, Ferrell J, Boehme S. Intestinal Farnesoid X
Receptor and Takeda G Protein Couple Receptor 5 Signaling in Metabolic Regulation. Dig. Dis. 2017;35:241–245.
109. Brighton CA, Rievaj J, Kuhre RE, Glass LL, Schoonjans K, Holst JJ, et al. Bile Acids Trigger GLP-1 Release Predominantly by Accessing Basolaterally Located G Protein-Coupled Bile Acid Receptors. Endocrinology. 2015;156:3961–70.
110. Katsuma S, Hirasawa A, Tsujimoto G. Bile acids promote glucagon-like peptide-1 secretion through TGR5 in a murine enteroendocrine cell line STC-1. Biochem. Biophys. Res. Commun. 2005;329:386–390.
111. Watanabe M, Houten SM, Wang L, Moschetta A, Mangelsdorf DJ, Heyman RA, et al. Bile acids lower triglyceride levels via a pathway involving FXR, SHP, and SREBP-1c. J. Clin. Invest. 2004;113:1408–18.
112. Horton JD, Goldstein JL, Brown MS. SREBPs: activators of the complete program of
2020 07 03 Boekje 1.0.indd 272020 07 03 Boekje 1.0.indd 27 24/07/2020 21:1324/07/2020 21:13

Chapter 1
28
cholesterol and fatty acid synthesis in the liver. J. Clin. Invest. 2002;109:1125–1131. 113. Kast HR, Nguyen CM, Sinal CJ, Jones SA, Laffitte BA, Reue K, et al. Farnesoid X-Activated
Receptor Induces Apolipoprotein C-II Transcription: a Molecular Mechanism Linking Plasma Triglyceride Levels to Bile Acids. Mol. Endocrinol. 2001;15:1720–1728.
114. Weir GC, Bonner-Weir S. Five stages of evolving beta-cell dysfunction during progression to diabetes. Diabetes. 2004;53 Suppl 3:S16-21.
115. Bandsma RHJ, Grefhorst A, van Dijk TH, van der Sluijs FH, Hammer A, Reijngoud D-J, et al. Enhanced glucose cycling and suppressed de novo synthesis of glucose-6-phosphate result in a net unchanged hepatic glucose output in ob/ob mice. Diabetologia. 2004;47:2022–2031.
116. Kursawe R, Caprio S, Giannini C, Narayan D, Lin A, D’Adamo E, et al. Decreased transcription of ChREBP-α/β isoforms in abdominal subcutaneous adipose tissue of obese adolescents with prediabetes or early type 2 diabetes: associations with insulin resistance and hyperglycemia. Diabetes. 2013;62:837–44.
117. Eissing L, Scherer T, Tödter K, Knippschild U, Greve JW, Buurman WA, et al. De novo lipogenesis in human fat and liver is linked to ChREBP-β and metabolic health. Nat. Commun. 2013;4:1528.
118. Dentin R, Benhamed F, Hainault I, Fauveau VR, Foufelle F, Dyck JRB, et al. Liver-Specific Inhibition of ChREBP Improves Hepatic Steatosis and Insulin Resistance in ob/ob Mice. Diabetes. 2006;55:2159–2170.
119. Stefan N, Haring H-U. The Metabolically Benign and Malignant Fatty Liver. Diabetes. 2011;60:2011–2017.
120. Li T, Kong X, Owsley E, Ellis E, Strom S, Chiang JYL. Insulin Regulation of Cholesterol 7α-Hydroxylase Expression in Human Hepatocytes. J. Biol. Chem. 2006;281:28745–28754.
121. Ishida H, Yamashita C, Kuruta Y, Yoshida Y, Noshiro M. Insulin Is a Dominant Suppressor of Sterol 12α-Hydroxylase P450 (CYP8B) Expression in Rat Liver: Possible Role of Insulin in Circadian Rhythm of CYP8B. J. Biochem. 2000;127:57–64.
122. Chávez-Talavera O, Haas J, Grzych G, Tailleux A, Staels B. Bile acid alterations in nonalcoholic fatty liver disease, obesity, insulin resistance and type 2 diabetes. Curr. Opin. Lipidol. 2019;30:244–254.
123. Sun W, Zhang D, Wang Z, Sun J, Xu B, Chen Y, et al. Insulin Resistance is Associated With Total Bile Acid Level in Type 2 Diabetic and Nondiabetic Population: A Cross-Sectional Study. Medicine (Baltimore). 2016;95:e2778.
124. Bertaggia E, Jensen KK, Castro-Perez J, Xu Y, Di Paolo G, Chan RB, et al. Cyp8b1 ablation prevents Western diet-induced weight gain and hepatic steatosis because of impaired fat absorption. Am. J. Physiol. Endocrinol. Metab. 2017;313:E121–E133.
125. Bonde Y, Eggertsen G, Rudling M. Mice Abundant in Muricholic Bile Acids Show Resistance to Dietary Induced Steatosis, Weight Gain, and to Impaired Glucose Metabolism. PLoS One. 2016;11:e0147772.
126. Claudel T, Staels B, Kuipers F. The Farnesoid X Receptor. Arterioscler. Thromb. Vasc.
2020 07 03 Boekje 1.0.indd 282020 07 03 Boekje 1.0.indd 28 24/07/2020 21:1324/07/2020 21:13

General introduction
29
1
Biol. 2005;25:2020–2030. 127. Hansen M, Sonne DP, Mikkelsen KH, Gluud LL, Vilsbøll T, Knop FK. Effect of bile acid
sequestrants on glycaemic control: protocol for a systematic review with meta-analysis of randomised controlled trials. BMJ Open. 2012;2:e001803.
128. Cipriani S, Mencarelli A, Palladino G, Fiorucci S. FXR activation reverses insulin resistance and lipid abnormalities and protects against liver steatosis in Zucker (fa/fa) obese rats. J. Lipid Res. 2010;51:771–84.
129. Weinstein DA, Steuerwald U, De Souza CFM, Derks TGJ. Inborn Errors of Metabolism with Hypoglycemia. Pediatr. Clin. North Am. 2018;65:247–265.
130. Özen H. Glycogen storage diseases: New perspectives. World J. Gastroenterol. 2007;13:2541.
131. Froissart R, Piraud M, Boudjemline A, Vianey-Saban C, Petit F, Hubert-Buron A, et al. Glucose-6-phosphatase deficiency. Orphanet J. Rare Dis. 2011;6:27.
132. Bali DS, Chen Y-T, Austin S, Goldstein JL. Glycogen Storage Disease Type I [Internet]. Seattle: University of Washington, Seattle; 1993.
133. Chou JY, Matern D, Mansfield BC, Chen Y-T. Type I glycogen storage diseases: disorders of the glucose-6-phosphatase complex. Curr. Mol. Med. 2002;2:121–43.
134. Chou JY, Mansfield BC. Mutations in the glucose-6-phosphatase-alpha (G6PC) gene that cause type Ia glycogen storage disease. Hum. Mutat. 2008;29:921–930.
135. Rajas F, Labrune P, Mithieux G. Glycogen storage disease type 1 and diabetes: Learning by comparing and contrasting the two disorders. Diabetes Metab. 2013;39:377–387.
136. Rajas F, Gautier-Stein A, Mithieux G. Glucose-6 Phosphate, A Central Hub for Liver Carbohydrate Metabolism. Metabolites. 2019;9.
137. Rake JP, Visser G, Labrune P, Leonard J V., Ullrich K, Smit GPA. Glycogen storage disease type I: diagnosis, management, clinical course and outcome. Results of the European study on glycogen storage disease type I (ESGSD I). Eur. J. Pediatr. 2002;161:S20–S34.
138. Rake J, Visser G, Labrune P, Leonard J, Ullrich K, Smit P, et al. Guidelines for management of glycogen storage disease type I - European Study on Glycogen Storage Disease Type I (ESGSD I). Eur. J. Pediatr. 2002;161:S112–S119.
139. Chen Y-T, Bazzarre CH, Lee MM, Sidbury JB, Coleman RA. Type I glycogen storage disease: Nine years of management with cornstarch. Eur. J. Pediatr. 1993;152:56–59.
140. Howell RR, Stevenson RE, Ben-Menachem Y, Phyliky RL, Berry DH. Hepatic Adenomata With Type 1 Glycogen Storage Disease. JAMA J. Am. Med. Assoc. 1976;236:1481.
141. Franco LM, Krishnamurthy V, Bali D, Weinstein DA, Arn P, Clary B, et al. Hepatocellular carcinoma in glycogen storage disease type Ia: A case series. J. Inherit. Metab. Dis. 2005;28:153–162.
142. Chen Y-T, Kishnani PS, Koeberl D. Glycogen Storage Diseases [Internet]. In: Beaudet AL, Vogelstein B, Kinzler KW, Antonarakis SE, Ballabio A, Gibson KM, et al., editors. The Online Metabolic and Molecular Bases of Inherited Disease. New York, NY: The McGraw-Hill Companies, Inc.; 2014.
143. Bandsma RHJ, Rake J-P, Visser G, Neese RA, Hellerstein MK, van Duyvenvoorde W, et
2020 07 03 Boekje 1.0.indd 292020 07 03 Boekje 1.0.indd 29 24/07/2020 21:1324/07/2020 21:13

Chapter 1
30
al. Increased lipogenesis and resistance of lipoproteins to oxidative modification in two patients with glycogen storage disease type 1a. J. Pediatr. 2002;140:256–260.
144. Bandsma RHJ, Prinsen BH, de Sain-van der Velden M, Rake J-P, Boer T, Smit GPA, et al. Increased de novo Lipogenesis and Delayed Conversion of Large VLDL into Intermediate Density Lipoprotein Particles Contribute to Hyperlipidemia in Glycogen Storage Disease Type 1a. Pediatr. Res. 2008;63:702–707.
145. Derks TGJ, van Rijn M. Lipids in hepatic glycogen storage diseases: pathophysiology, monitoring of dietary management and future directions. J. Inherit. Metab. Dis. 2015;38:537–43.
146. Wang DQ, Fiske LM, Carreras CT, Weinstein DA. Natural history of hepatocellular adenoma formation in glycogen storage disease type I. J. Pediatr. 2011;159:442–6.
147. Matern D, Starzl TE, Arnaout W, Barnard J, Bynon JS, Dhawan A, et al. Liver transplantation for glycogen storage disease types I, III, and IV. Eur. J. Pediatr. 1999;158 Suppl 2:S43-8.
148. Parker P, Burr I, Slonim A, Ghishan FK, Greene H. Regression of hepatic adenomas in type Ia glycogen storage disease with dietary therapy. Gastroenterology. 1981;81:534–6.
149. Mutel E, Abdul-Wahed A, Ramamonjisoa N, Stefanutti A, Houberdon I, Cavassila S, et al. Targeted deletion of liver glucose-6 phosphatase mimics glycogen storage disease type 1a including development of multiple adenomas. J. Hepatol. 2011;54:529–537.
150. Grefhorst A, Schreurs M, Oosterveer MH, Cortés VA, Havinga R, Herling AW, et al. Carbohydrate-response-element-binding protein (ChREBP) and not the liver X receptor α (LXRα) mediates elevated hepatic lipogenic gene expression in a mouse model of glycogen storage disease type 1. Biochem. J. 2010;432:249–54.
2020 07 03 Boekje 1.0.indd 302020 07 03 Boekje 1.0.indd 30 24/07/2020 21:1324/07/2020 21:13

2020 07 03 Boekje 1.0.indd 312020 07 03 Boekje 1.0.indd 31 24/07/2020 21:1324/07/2020 21:13

2020 07 03 Boekje 1.0.indd 322020 07 03 Boekje 1.0.indd 32 24/07/2020 21:1324/07/2020 21:13

Joanne A. Hoogerland1, Fabian Peeks1,2, Brenda S. Hijmans1, Justina C. Wolters1, Sander Kooijman4,5, Trijnie Bos1, Aycha Bleeker1, Theo H. van Dijk3, Henk Wolters1, Albert Gerding1,3, Rick Havinga1, Amanda C.M. Pronk4,5, Patrick C.N. Rensen4,5, Gilles Mithieux6,7,8, Fabienne Rajas6,7,8, Folkert Kuipers1,3, Dirk-Jan Reijngoud1, Terry G.J. Derks1,2 and Maaike H. Oosterveer1
1Department of Pediatrics, University of Groningen, University Medical Center Groningen, 9713 GZ Groningen, The Netherlands. 2Department of Metabolic Diseases, Beatrix Children’s Hospital, University Medical Center Groningen, University of Groningen, 9713 GZ Groningen, The Netherlands. 3Department of Laboratory Medicine, University of Groningen, University Medical Center Groningen, 9713 GZ Groningen, The Netherlands. 4Department of Medicine, Division of Endocrinology, and 5Einthoven Laboratory for Experimental Vascular Medicine, Leiden University Medical Center, Leiden, the Netherlands. 6Institut National de la Santé et de la Recherche Médicale, U1213, Lyon, F-69008, 7Université de Lyon, Lyon, F-69008 and 8Université Lyon 1, Villeurbanne, F-69622, France.
Submitted
2CHAPTERHypoglycemia aggravates dyslipidemia
in GSD Ia via enhanced adipocyte lipolysis and impaired VLDL
catabolism
2020 07 03 Boekje 1.0.indd 332020 07 03 Boekje 1.0.indd 33 24/07/2020 21:1324/07/2020 21:13

Chapter 2
34
AbstractGlycogen Storage Disease type Ia (GSD Ia) is an inborn error of metabolism that causes severely elevated triglyceride (TG) levels in liver and plasma. Although hypertriglyceridemia is used as a marker for glycemic control in GSD Ia patients it is unclear how hypoglycemia further increased TG levels. Here we analyzed whole-body TG metabolism in normoglycemic (fed) and hypoglycemic (fasted) hepatocyte-specific glucose-6-phosphatase deficient (L-G6pc-/-) mice. De novo fatty acid synthesis contributed substantially to hepatic TG accumulation in normoglycemic L-G6pc-/- mice. In hypoglycemic conditions enhanced adipose tissue lipolysis was the main driver of liver steatosis, which was further supported by elevated free fatty acid levels in GSD Ia mice and -patients. Plasma VLDL-TG and VLDL-cholesterol levels were increased in GSD Ia patients and in normoglycemic L-G6pc-/- mice, and further increased by hypoglycemia in L-G6pc-/- mice. VLDL-TG secretion rates doubled in normo- and hypoglycemic L-G6pc-/- mice, while VLDL-TG catabolism was selectively inhibited in hypoglycemic L-G6pc-/- mice. These data show that fasting-induced hypoglycemia in L-G6pc-/- mice promotes adipose tissue lipolysis and arrests VLDL catabolism. This mechanism likely contributes to aggravated liver steatosis and dyslipidemia in GSD Ia patients with poor glycemic control, and may explain clinical heterogeneity in hypertriglyceridemia between GSD Ia patients.
2020 07 03 Boekje 1.0.indd 342020 07 03 Boekje 1.0.indd 34 24/07/2020 21:1324/07/2020 21:13

Hypoglycemia aggravates dyslipidemia in GSD Ia via enhanced lipolysis and impaired VLDL catabolism
35
2
IntroductionGlycogen storage disease type Ia (GSD Ia) is an inborn error of carbohydrate metabolism caused by a deficiency of the catalytic subunit (G6PC) of the glucose-6-phosphatase (G6Pase) complex (1). G6PC, selectively expressed in liver, kidney and intestine (1), catalyzes the final step in gluconeogenesis and glycogenolysis by hydrolyzing glucose-6-phosphate to glucose and is the key enzyme for glucose homeostasis during fasting. GSD Ia patients clinically present with severe fasting intolerance and hepatomegaly, biochemically characterized by nonketotic hypoglycemia, hyperlactacidemia, hyperuricemia, hypercholesterolemia, hepatic steatosis, and hypertriglyceridemia (2,3). To prevent hypoglycemia, patients have to adhere to a strict diet, consisting of frequent meals with restriction of simple sugars, relatively small doses of uncooked cornstarch (UCCS) during the day and either UCCS doses or continuous (naso)gastric drip feeding through the night (3–5). Although dietary adherence generally markedly reduces hypoglycemic episodes and largely corrects secondary metabolic derangements (6–8), long-term complications of GSD Ia still frequently occur (4,9). Among these complications are hyperlipidemia and the development of liver adenomas in young adulthood (9–12).
In clinical practice, triglyceride (TG) concentrations in GSD Ia patients are currently regarded as an important biomarker for glycemic control (4,13,14). In GSD Ia patients, serum TG levels can go up to 100 mmol/L (15), posing major health risk given that TG concentrations >11.3 mmol/L are associated with acute pancreatitis (16). Serum TG concentrations <6.0 mmol/L are amongst the biomedical targets for GSD I patients (4) and a recent single center retrospective cohort study showed a significant increase in adenoma progression in GSD Ia subjects between 5-year mean TG concentration >5.6 mmol/L versus < 5.6 mmol/L groups (14). The American College of Medical Genetics and Genomics GSD I guidelines state that “elevated triglycerides and cholesterol above the normal ranges may persist in some patients with GSD I, despite appropriate dietary treatment” (13). ‘Uncertainties regarding optimal glycemic control in hepatic GSDs’ is included in the top list of research priorities, as recently reported by the international GSD priority setting partnership (Peeks et al. submitted).
Hypertriglyceridemia and hepatic steatosis in GSD Ia patients are commonly attributed to an increase in hepatic fatty acid synthesis (17,18). We have previously reported that circulating TG levels show large heterogeneity between GSD Ia patients (15,19). Although hyperlipidemia is related to glycemic control, the underlying mechanisms are poorly understood. Because hypertriglyceridemia and poor glycemic control are associated with long-term complications such as liver adenoma progression (14,20–22), understanding of the mechanistic link between glycemic control and hyperlipidemia will be of great importance to further improve
2020 07 03 Boekje 1.0.indd 352020 07 03 Boekje 1.0.indd 35 24/07/2020 21:1324/07/2020 21:13

Chapter 2
36
and personalize GSD Ia patient care. Therefore, in the current study we performed a systematic analysis of whole-body TG metabolism in normoglycemic (fed) and in hypoglycemic (fasted) L-G6pc-/- mice, a liver-specific preclinical model for GSD Ia (23). Our findings indicate that severe hypertriglyceridemia in GSD Ia patients with poor glycemic control is most likely due to impaired catabolism of TG-rich lipoproteins.
ResultsHyperlipidemia and fatty liver disease are aggravated in hypoglycemic L-G6pc-/- miceHeterogeneity between individual GSD Ia patients is increasingly recognized (15,19). FPLC analysis revealed that excess TGs and cholesterol in serum of normoglycemic GSD Ia patients were mainly associated with VLDL/chylomicrons (Fig. 1A, Table S1). Since hypoglycemia and hyperlipidemia in GSD Ia are caused by the loss of G6PC activity in hepatocytes (24), we characterized TG metabolism in hepatocyte-specific glucose-6-phosphatase deficient (L-G6pc-/-) mice (23). Like in the patients, plasma TG and cholesterol levels were increased in fed (normoglycemic; median blood glucose 6.5 mmol/L) L-G6pc-/- mice as compared to wildtype (L-G6pc-/-) littermates (Fig. 1B, Table 1). Overnight fasting resulted in hypoglycemia in L-G6pc-/- mice (median blood glucose 2.1 mmol/L), with additional increases in plasma TG levels (Fig. 1B, Table 1). Under both conditions, L-G6pc-/- mice exhibited a fatty liver as compared to wildtype controls (Fig. 1C and 1E), due to the hepatic accumulation of TGs and cholesterol esters (CEs; Fig. 1E and S1A, B). Similar to what was observed for plasma TG levels, the largest increase in hepatic TG and CE content was observed in hypoglycemic L-G6pc-/- mice (Fig. 1C, 1E, S1B). Hepatic G6P and glycogen contents were most markedly increased in hypoglycemic L-G6pc-/- mice as compared to wildtype controls (Table 1). The exacerbated liver steatosis of hypoglycemic L-G6pc-/- mice was associated with an increase in hepatic lipid droplet area (Fig. 1D). Among the fatty acids measured, oleate (C18:1) was the most abundant hepatic fatty acid in both normo- and hypoglycemic L-G6pc-/- mice, with threefold increases in its content in hypo- compared to normoglycemic L-G6pc-/- mice (Fig. 1F, Table S2), reflecting the higher degree of TG and CE accumulation under hypoglycemic conditions. Linoleate (C18:2), an essential fatty acid that cannot be synthesized de novo, was selectively
Table 1. Plasma and liver characteristics in male L-G6pc-/- mice and wildtype littermates in fed state or after an overnight fast Parameter L-G6pc+/+ fed L-G6pc-/- fed L-G6pc+/+ fasted L-G6pc-/- fasted Median (Range) Median (Range) p-value Median (Range) Median (Range) p-value Plasma
Glucose (mmol/L) 8.6 (6.8 – 9.5) 6.5 (5.6 – 9.9) 0.126 5.0 (3.7 – 8.4) 2.1 (1.1 – 2.4) <0.001 Insulin (ng/mL) 0.4 (0.3 – 0.6) 0.2 (0.1 – 0.4) 0.009 0.3 (0.1 – 0.6) 0.2 (0.1 – 0.4) 0.328 Glucagon (pg/mL) 113 (55 – 163) 148 (73 – 320) 0.429 113 (86 – 132) 236 (137 – 582) <0.001 Insulin/Glucagon ratio 3.5 (2.6 – 5.8) 1.1 (0.5 – 3.2) 0.017 3.0 (1.1 – 4.7) 0.9 (0.3 – 1.8) 0.003 Lactate (mmol/L) 3.2 (2.5 – 4.0) 4.4 (3.7 – 4.7) 0.052 1.8 (1.2 – 3.3) 2.1 (0.9 – 3.9) 0.328 Triglycerides (mmol/L) 0.6 (0.4 – 0.7) 1.7 (0.3 – 2.7) 0.082 0.5 (0.4 – 0.6) 3.5 (2.3 – 8.3) <0.001 Cholesterol (mmol/L) 2.1 (1.6 – 2.8) 3.7 (1.7 – 4.3) 0.030 2.3 (2.0 – 3.8) 2.9 (1.6 – 3.8) 0.195
Liver G6P (nmol/g) 406 (339 – 505) 1675 (819 – 2306) 0.004 422 (265 – 483) 2586 (1981 – 3457) <0.001 Glycogen (mg/g) 51 (44 – 57) 66 (53 – 77) 0.017 18 (12 – 30) 54 (46 – 62) <0.001
2020 07 03 Boekje 1.0.indd 362020 07 03 Boekje 1.0.indd 36 24/07/2020 21:1324/07/2020 21:13

Hypoglycemia aggravates dyslipidemia in GSD Ia via enhanced lipolysis and impaired VLDL catabolism
37
2
Figure 1. Hyperlipidemia and fatty liver disease are aggravated in hypoglycemic L-G6pc-/-
mice. (A) Triglyceride and total cholesterol concentrations in lipoprotein profi les of GSD Ia patients (n = 3) and control (n = 1) and (B) L-G6pc-/- mice and wildtype littermates in fed and fasted conditions (n = 1). (C) Representative pictures of Oil-red-O staining and (D) quantifi cation of lipid droplet area in livers of L-G6pc-/- mice and wildtype littermates in fed and fasted conditions (n = 6-8). (E) Hepatic triglyceride levels and (F) absolute values of hepatic total fatty acids in L-G6pc-/- mice and wildtype littermates in fed and fasted conditions (n = 6-8). Data represent Tukey boxplots and Kruskal-Wallis H-test followed by post-hoc Conover pairwise comparisons was used. ***p < 0.001, **p <0.01 indicates signifi cance compared to wildtype littermates. ###p < 0.001 indicates signifi cance compared to fed condition.
2020 07 03 Boekje 1.0.indd 372020 07 03 Boekje 1.0.indd 37 24/07/2020 21:1324/07/2020 21:13

Chapter 2
38
increased in hypoglycemic L-G6pc-/- mice, while hepatic palmitate (C16:0) content was similar in L-G6pc+/+ mice and L-G6pc-/- mice (Fig. 1F). This already suggests that part of the hepatic fatty acids accumulated in hypoglycemic L-G6pc-/- mice is derived from other tissues, and not from de novo lipogenesis.
Differential contribution of de novo lipogenesis in normo- and hypoglycemic L-G6pc-/- miceIt is generally assumed that increased glycolysis and de novo lipogenesis have major contributions to hepatic lipid accumulation in GSD Ia (17,18,25,26). The enzymatic activities of the glycolytic enzymes GPI, ALD, GAPDH, L-PK, and LDH were significantly increased in the liver of L-G6pc-/- mice, irrespective of feeding state (Fig. 2A, Table S3). To relate the activity of de novo lipogenesis to hepatic steatosis in normo- and hypoglycemic L-G6pc-/- mice, we quantified the hepatic mRNA levels of lipogenic transcription factors Srebp1c and Chrebpβ as well as of their lipogenic target genes (Fig. 2B). Hepatic Srebp1c mRNA expression was lower in the hypoglycemic state but not affected by genotype, while Chrebpβ expression was 3-fold induced in normoglycemic L-G6pc-/- mice and 7-fold in hypoglycemic L-G6pc-/- mice compared to fed wildtype controls. Similarly, the hepatic expression levels of L-pk, Acaca, Fas, Elovl5, Elovl6 and Scd1, enzymes involved in glycolysis and fatty acid synthesis, were increased under both conditions in L-G6pc-/- mice as compared to wildtype controls, with largest increments in hypoglycemic L-G6pc-/- mice (Fig. 2B).
To establish the contribution of lipogenesis to the fatty liver phenotype of L-G6pc-/- mice, we quantified hepatic de novo lipogenic fluxes using 13C-acetate administered via drinking water during 24 hours prior to sacrifice. This method allowed to distinguish between fatty acids derived from de novo synthesis or by chain elongation of pre-existing fatty acids (27). A significant reduction in acetyl-CoA precursor pool enrichment was observed in normoglycemic L-G6pc-/- mice, indicating an increase in acetyl-CoA turnover compatible with enhanced glycolysis (Fig. 2C) (18,25). As expected, hepatic fractional de novo fatty acid synthesis of palmitate (C16:0) and oleate (C18:1), the two major non-essential TG-associated fatty acids (28), was significantly higher in fed compared to fasted wildtype mice (Fig. 2D). The accumulation of hepatic lipids in normo- and hypoglycemic L-G6pc-/- mice was accompanied by an increase in fractional synthesis of oleate, while fractional synthesis of palmitate remained unchanged (Fig. 2D). Absolute hepatic oleate synthesis via elongation of pre-existing palmitate was increased in both normo- and hypoglycemic L-G6pc-/- mice (Fig. 2E), from which the latter was more pronounced. Similarly, fractional and absolute de novo synthesis of stearate (C18:0) were significantly increased in normoglycemic L-G6pc-/- mice compared to wildtype controls, while chain elongation was significantly increased in hypoglycemic L-G6pc-/- mice only (Table S4). In terms of absolute hepatic fatty acid synthesis, lipid accumulation in normoglycemic L-G6pc-/- mice
2020 07 03 Boekje 1.0.indd 382020 07 03 Boekje 1.0.indd 38 24/07/2020 21:1324/07/2020 21:13

Hypoglycemia aggravates dyslipidemia in GSD Ia via enhanced lipolysis and impaired VLDL catabolism
39
2
Figure 2. Differential contribution of de novo lipogenesis in fed and fasted L-G6pc-/- mice. (A) Heatmaps presenting z-score normalized hepatic enzymatic activities and (B) hepatic gene expression levels in L-G6pc-/- mice and wildtype littermates in fed and fasted conditions (n = 4-8). (C) Acetyl-CoA pool enrichment and (D) fractional and (E) absolute de novo synthesis and chain elongation of palmitate (C16:0), oleate (C18:1) in L-G6pc-/- mice and wildtype littermates in fed and fasted conditions (n = 5-7). (F) Hepatic palmitate (C16:0), oleate (C18:1) and linoleate (C18:2) derived from old fat in L-G6pc-/- mice and wildtype littermates in fed and fasted conditions (n = 5-8). Data represent Tukey boxplots and Kruskal-Wallis H-test followed by post-hoc Conover pairwise comparisons was used. ***p < 0.001, **p <0.01, *p < 0.05 indicates significance compared to wildtype littermates. ###p < 0.001, ##p < 0.01, #p < 0.05 indicates significance compared to fed condition. Table S3 contains raw values and statistics for data presented in heatmaps.
2020 07 03 Boekje 1.0.indd 392020 07 03 Boekje 1.0.indd 39 24/07/2020 21:1324/07/2020 21:13

Chapter 2
40
mainly resulted from de novo synthesis of oleate (Fig. 2E). In contrast, elongation of pre-existing palmitate to oleate was a major contributor of lipid accumulation in hypoglycemic L-G6pc-/- mice (Fig. 2E). The contribution of de novo lipogenesis to hepatic lipid accumulation in normoglycemic L-G6pc-/- mice accounted for up to 20% (Fig. 2D), while in hypoglycemic L-G6pc-/- mice about 10% of the excess oleate synthesis was derived from elongation of pre-existing palmitate (Fig. 2D). Yet, the majority of excess hepatic fatty acids in both normo- and hypoglycemic L-G6pc-/- mice was derived from ‘old fat’ (Fig. 2F, Table S2).
Adipose tissue lipolysis is enhanced in hypoglycemic L-G6pc-/- miceTo investigate the origin of old fat accumulation in the liver of hypoglycemic L-G6pc-/- mice we analysed alternative sources of hepatic TG input and output, i.e., adipose tissue lipolysis, hepatic mitochondrial β-oxidation and VLDL-TG secretion and –remnant uptake. Circulating non-esterified fatty acids (NEFAs), including oleate, were increased in both normo- and hypoglycemic L-G6pc-/- mice compared to wildtype controls, with highest concentrations in hypoglycemic L-G6pc-/- mice (Fig. 3A, Table S5). In normoglycemic GSD Ia patients, the concentrations of circulating NEFAs were also increased (Fig. 3B, Table S5). Ex vivo glycerol release from adipose tissue was enhanced in hypoglycemic L-G6pc-/- mice only (Fig. 3C, S2A) and the phosphorylation of hormone sensitive lipase (HSL) on serine 563, but not on serine 565 and 560, was also increased in hypoglycemic L-G6pc-/- mice compared to wildtype littermates (Fig. 3D, S2B, S2C). Under fasting conditions, ex vivo glycerol release from adipose tissue positively correlated to pHSL S563 protein expression levels (Fig. S2D). Adipose triglyceride lipase (ATGL) and perilipin (PLIN) protein levels in adipose tissue, essential for lipid mobilisation, were not altered in L-G6pc-/- mice (Fig. 3D). We did confirm that plasma levels of fibroblast growth factor 21 (FGF21), a proposed stimulator of adipose tissue lipolysis (29), were increased in normo- and hypoglycemic L-G6pc-/- mice as compared to wildtype controls (Fig. 3E).
Plasma ketone body concentrations were increased in both normo- and hypoglycemic L-G6pc-/- mice as compared to wildtype littermates, while total ketone body levels were significantly higher in hypo- versus normoglycemic L-G6pc-/- mice (Fig. 3F). Ex vivo hepatic mitochondrial β-oxidation capacity was significantly increased in normo- and hypoglycemic L-G6pc-/- mice (Fig. 3G, S2E). Total hepatic acylcarnitine levels were not different between genotypes in fed or fasted state, however C2 levels, the end product of β-oxidation, were increased in hypoglycemic L-G6pc-/- mice (Fig. 3H, Table S6). Amino acid-derived acylcarnitines C4 and C5 were increased in both normo- and hypoglycemic L-G6pc-/- mice, while medium- and long-chain acylcarnitines were not different (Table S6).
To investigate whether altered hepatic VLDL-TG secretion contributed to exacerbated
2020 07 03 Boekje 1.0.indd 402020 07 03 Boekje 1.0.indd 40 24/07/2020 21:1324/07/2020 21:13
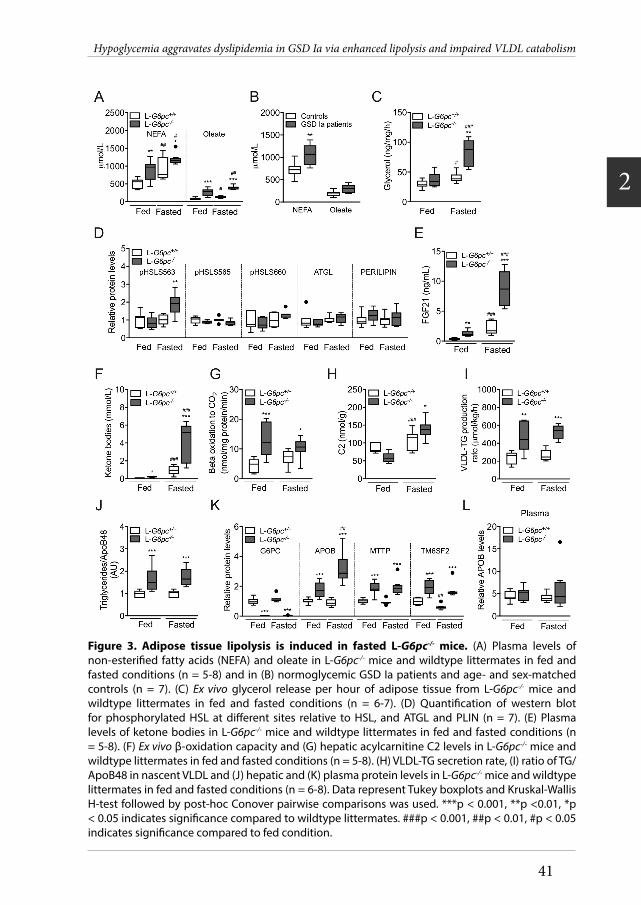
Hypoglycemia aggravates dyslipidemia in GSD Ia via enhanced lipolysis and impaired VLDL catabolism
41
2
Figure 3. Adipose tissue lipolysis is induced in fasted L-G6pc-/- mice. (A) Plasma levels of non-esterifi ed fatty acids (NEFA) and oleate in L-G6pc-/- mice and wildtype littermates in fed and fasted conditions (n = 5-8) and in (B) normoglycemic GSD Ia patients and age- and sex-matched controls (n = 7). (C) Ex vivo glycerol release per hour of adipose tissue from L-G6pc-/- mice and wildtype littermates in fed and fasted conditions (n = 6-7). (D) Quantifi cation of western blot for phosphorylated HSL at diff erent sites relative to HSL, and ATGL and PLIN (n = 7). (E) Plasma levels of ketone bodies in L-G6pc-/- mice and wildtype littermates in fed and fasted conditions (n = 5-8). (F) Ex vivo β-oxidation capacity and (G) hepatic acylcarnitine C2 levels in L-G6pc-/- mice and wildtype littermates in fed and fasted conditions (n = 5-8). (H) VLDL-TG secretion rate, (I) ratio of TG/ApoB48 in nascent VLDL and (J) hepatic and (K) plasma protein levels in L-G6pc-/- mice and wildtype littermates in fed and fasted conditions (n = 6-8). Data represent Tukey boxplots and Kruskal-Wallis H-test followed by post-hoc Conover pairwise comparisons was used. ***p < 0.001, **p <0.01, *p < 0.05 indicates signifi cance compared to wildtype littermates. ###p < 0.001, ##p < 0.01, #p < 0.05 indicates signifi cance compared to fed condition.
2020 07 03 Boekje 1.0.indd 412020 07 03 Boekje 1.0.indd 41 24/07/2020 21:1324/07/2020 21:13

Chapter 2
42
Figure 4. VLDL catabolism is impaired in fasted L-G6pc-/- mice. (A) Plasma clearance and plasma elimination rate of glycerol tri-[3H]oleate-labeled VLDL-like particles in L-G6pc-/- mice and wildtype littermates in fed and fasted conditions (n = 6-8). (B) 3H activity in various organs and expressed as percentage of the injected dose of glycerol tri[3H]oleate-labeled VLDL-like particles per gram wet tissue weight (n = 7-8). (C) Hepatic gene expression, (D) hepatic protein levels and (E) APOC2/APOC3 protein ratio in L-G6pc-/- mice and wildtype littermates in fed and fasted conditions (n = 5-8). Data represent means ± SEM or Tukey boxplots. Diff erences between two or multiple groups were tested by Mann-Whitney U-test or Kruskal-Wallis H-test followed by post-hoc Conover pairwise comparisons, respectively. ***p < 0.001, **p <0.01, *p < 0.05 indicates signifi cance compared to wildtype littermates. ###p < 0.001, ##p < 0.01, #p < 0.05 indicates signifi cance compared to fed condition.
2020 07 03 Boekje 1.0.indd 422020 07 03 Boekje 1.0.indd 42 24/07/2020 21:1324/07/2020 21:13

Hypoglycemia aggravates dyslipidemia in GSD Ia via enhanced lipolysis and impaired VLDL catabolism
43
2
fatty liver disease or to hypertriglyceridemia in L-G6pc-/- mice, we quantified hepatic VLDL-TG secretion rates. VLDL-TG secretion was doubled in L-G6pc-/- mice as compared to controls, independent of feeding status (Fig. 3I). The enhanced VLDL-TG secretion rate in L-G6pc-/- mice was associated with similar increases in the amount of TGs per Apolipoprotein B (ApoB) (Fig. 3J, S2F), the primary apolipoprotein of VLDL. Hepatic apoB protein and mRNA levels were elevated in normo- and hypoglycemic L-G6pc-/- mice as compared to wildtype controls (Fig. 3K, S2G). Hepatic ApoB protein levels were further increased in hypo- compared to normoglycemic L-G6pc-/- mice (Fig. 3K), while plasma ApoB levels were similar in L-G6pc+/+ and L-G6pc-/- mice under both conditions (Fig. 3L). mRNA and protein levels of MTTP and TM6SF2, both involved in VLDL assembly, were increased in L-G6pc-/- versus L-G6pc+/+ mice, but unaffected by fasting (Fig. 3K, S2G). Altogether, these data indicate that in acutely fasted L-G6pc-/- mice, exacerbated hepatic steatosis was paralleled by enhanced adipose tissue lipolysis, but not by an impaired β-oxidation or reduced VLDL-secretion.
VLDL catabolism is impaired in hypoglycemic L-G6pc-/- miceBecause VLDL-TG levels were increased in hypo- versus normoglycemic L-G6pc-/- mice in the absence of additional increase in VLDL-TG secretion, we quantified VLDL catabolism in fed and fasted L-G6pc-/- and L-G6pc+/+ mice. In the fed state, the plasma decay of glycerol tri[3H]oleate-labeled VLDL-like particles was not different between L-G6pc-/- mice and wildtype littermates (Fig. 4A, B). However, in the fasted state, elimination rate of labelled VLDL-like particles was decreased by about 50% in L-G6pc-/- mice compared to controls (Fig. 4A). In the fasted state, uptake of TG-derived fatty acids by muscle, epididymal white adipose tissue and brown adipose tissue depots was significantly reduced (Fig. 4B). VLDL-TG catabolism is largely dependent on the activity of lipoprotein lipase (LPL), which is in turn controlled by apolipoproteins and angiopoietin-like proteins (30,31). Hepatic protein levels of APOC1, a potential inhibitor of LPL (32,33), were slightly reduced in hypoglycemic L-G6pc-/- mice as compared to controls (Fig. 4C, D). Hepatic mRNA and protein levels of APOC2, an LPL activator, were increased in normoglycemic L-G6pc-/- mice compared to controls, while APOC2 protein levels were decreased in hypoglycemic L-G6pc-/- mice (Fig. 4C, E). Protein levels of APOC3, ANGPTL3 and ANGPTL4, and APOC2/APOC3 ratios were not affected by genotype or feeding state (p = 0.152 in fasted state) (Fig. 4D, 4E).
DiscussionIn the current study we investigated the physiological mechanisms that link glycemic control to hyperlipidemia in GSD Ia, by comparing fed (normoglycemic) to acutely fasted (hypoglycemic) L-G6pc-/- mice, a hepatocyte-specific model for GSD Ia. We found that excess TGs and cholesterol in GSD Ia patient serum were specifically
2020 07 03 Boekje 1.0.indd 432020 07 03 Boekje 1.0.indd 43 24/07/2020 21:1324/07/2020 21:13

Chapter 2
44
associated with VLDLs/chylomicrons. Subsequent characterization of whole-body TG metabolism in L-G6pc-/- mice revealed that hepatic de novo fatty acid synthesis partly contributed to hepatic lipid accumulation in the normoglycemic state. In hypoglycemic L-G6pc-/- mice liver steatosis was mainly associated with enhanced adipose tissue lipolysis and hepatic fatty acid elongation. VLDL-TG levels and secretion rates were increased in L-G6pc-/- mice under both normo- and hypoglycemic conditions, and VLDL-TG levels were markedly higher in hypo- versus normoglycemic L-G6pc-/- mice. Interestingly, VLDL-TG clearance was selectively inhibited in hypoglycemic L-G6pc-/- mice. Our findings indicate that more severe liver steatosis and hypertriglyceridemia in hypoglycemic L-G6pc-/- mice result from enhanced adipose tissue lipolysis and impaired VLDL-TG catabolism, respectively (Fig. 5). Altogether, the data suggest that increased VLDL-TG secretion by the liver contributes to elevated TG concentrations in GSD Ia patients (15,19), and that impaired catabolism of TG-rich lipoproteins explains the severe hyperlipidemia in patients with poor glycemic control (17,18,34).
It is commonly assumed that fatty liver disease and hypertriglyceridemia in GSD Ia result from an increase in hepatic de novo lipogenesis and VLDL secretion driven by a high glycolytic flux (17,18,25,26). We confirmed that glycolytic enzyme activities are increased in L-G6pc-/- mice in both normo- and hypoglycemic conditions. Our findings furthermore indicate that hepatic TG accumulation mainly, but not exclusively, results from increased de novo lipogenesis in normoglycemic L-G6pc-/- mice. It should be noted that the contribution of lipogenesis was quantified over a 24 hour period and reached up to 20%, a value comparable to that observed in humans in the postprandial state (35). On the other hand, enhanced adipose tissue lipolysis and a subsequent uptake and elongation of fatty acids released by the adipose tissue were the most predominant cause of fatty liver in fasted, hypoglycemic L-G6pc-/- mice. The increased contribution of adipose tissue-derived circulating NEFAs to liver steatosis was further supported by the accumulation of linoleate (an essential fatty acid) that only occurred in livers of hypoglycemic L-G6pc-/- mice.
Adipose tissue lipolysis is mainly controlled by ATGL, PLIN, monoglyceride lipase (MGL), Comparative Gene Identification 58 (CGI-58) and HSL (36). HSL is regulated by different circulating factors (36,37) and can be phosphorylated in response to cAMP signaling by protein kinase A (38,39), causing its activation and translocation to lipid droplets. Our data show increased phosphorylation of HSL at Ser-563 and a tendency for increased phosphorylation at Ser-660 in hypoglycemic L-G6pc-/- mice. The phosphorylation of serine 565, which is mediated by AMPK and reduces HSL activity (39,40), remained unaffected in L-G6pc-/- mice (Fig. 3C). Elevated plasma levels of hepatokine FGF21 (Fig. 3E) may contribute to enhanced adipose tissue lipolysis in hypoglycemic L¬-G6pc-/- mice, although there are conflicting reports on
2020 07 03 Boekje 1.0.indd 442020 07 03 Boekje 1.0.indd 44 24/07/2020 21:1324/07/2020 21:13

Hypoglycemia aggravates dyslipidemia in GSD Ia via enhanced lipolysis and impaired VLDL catabolism
45
2
whether FGF21 promotes or inhibits lipolysis (41–43). Glucagon is a well-established enhancer of adipose tissue lipolysis via cAMP signaling (36,44,45). In hypoglycemic L-G6pc-/- mice, plasma glucagon levels were significantly increased and the insulin to glucagon ratio was reduced (Table 1). We therefore hypothesize that a lower insulin-to-glucagon ratio in fasted hypoglycemic L-G6pc-/- mice increases adipose tissue lipolysis via cAMP-PKA mediated HSL phosphorylation.
Our data highly indicate that enhanced VLDL-TG secretion in L-G6pc-/- mice was mainly due to an increase in VLDL lipidation, rather than to an increase in VLDL particle number. TM6SF2 is required for lipidation of VLDL particles in the liver, but not for ApoB secretion (46). Consistently, we observed that hepatic MTTP and TM6SF2 protein levels were increased (46–48) and that circulating ApoB levels remained unchanged in L-G6pc-/- mice. Importantly, our data also show that the increase in VLDL-TG secretion in hypoglycemic L-G6pc-/- mice coincided with impaired VLDL-TG clearance. This suggests that the activity of lipolytic enzymes such as LPL or hepatic lipase (HL) was reduced by a circulating factor (49) that is specifically altered under fasted, hypoglycemic conditions. Amongst others (30,50–54), LPL and HL activities are regulated by apolipoproteins (30,32). It has been reported that the apoC2/C3 ratio is reduced in GSD Ia VLDL (55), which may contribute to reduced LPL activity (56,57). However, the data presented in the current study do not confirm a solid relationship between feeding state, apoC2/C3 ratios and VLDL levels or -catabolism. Interestingly, it has been proposed that circulating NEFAs inhibit LPL, hence exerting product inhibition on its activity (49,58–65). Moreover, in vitro studies have shown that the rate of LPL-mediated TG hydrolysis is reduced upon saturation of the NEFA binding sites on albumin (61). Oleate, one of the most prevalent NEFAs (66), dose-dependently inhibits LPL activity (63), probably by binding to ApoC2 and thereby preventing ApoC2-LPL interaction (60,67). Increased NEFA and oleate concentrations in hypoglycemic L-G6pc-/- mice may hence contribute to impaired VLDL catabolism independent of changes in ApoC2 and/or ApoC3 levels. This mechanism also likely explains previous findings from our laboratory in which plasma TG levels were increased in hypoglycemic rats acutely treated with the pharmacological glucose-6-phosphate transporter inhibitor. In that study, VLDL-TG secretion was not enhanced upon glucose-6-phosphate transporter inhibition (25), yet NEFA concentrations were increased and presumably led to a rapid inhibition of VLDL catabolism, resulting in hypertriglyceridemia.
It should be noted that some differences exist between our preclinical findings and studies in GSD Ia patients. These may be related to multiple factors, such as (1) the use of a hepatocyte-specific GSD Ia mouse model instead of whole body G6pc knockout mice, with intact enzyme activity in kidney and intestine, (2) species differences between mice and humans, and (3) the experimental setup. In our study,
2020 07 03 Boekje 1.0.indd 452020 07 03 Boekje 1.0.indd 45 24/07/2020 21:1324/07/2020 21:13

Chapter 2
46
hepatic G6pc deletion was induced during adulthood and analysis of TG metabolism was performed within two weeks after gene deletion, which provides insights into an early disease stage and does not account for (changes in) metabolic derangements occurring over a longer time period. Our finding that adipose tissue lipolysis was enhanced in hypoglycemic L-G6pc-/- mice confirms what has been described in hypoglycemic GSD I patients (68,69). However, in contrast to what has been proposed previously (70,71), we did not collect evidence that hepatic fatty acid oxidation is reduced in L-G6pc-/- mice. Instead, in hypoglycemic L-G6pc-/- mice we observed enhanced β-oxidation capacity and increased levels of ketone bodies as well as hepatic C2 acylcarnitines, the end products of β-oxidation, suggesting that fatty acid oxidation was increased under hypoglycemic conditions. Based on these findings, we hypothesize that enhanced hepatic NEFA influx in hypoglycemic L-G6pc-/- mice promoted hepatic fatty acid elongation, β-oxidation and ketogenesis. In contrast, hepatic C2 acylcarnitine levels were modestly reduced and plasma ketone body levels were only slightly increased in normoglycemic L-G6pc-/- mice, despite an increase in hepatic β-oxidation capacity ex vivo. These data suggest that in vivo β-oxidation was not increased under fed conditions, consistent with findings in normoglycemic GSD Ia patients (18). Previous studies have shown enhanced adipose tissue lipolysis in both normo- and hypoglycemic patients (69), while lipase activities were reduced under normoglycemia (49,55,72–74) and not studied under fasting conditions. Our current study shows a selective increase in adipose tissue lipolysis and a selective inhibition of VLDL catabolism in fasted hypoglycemic L-G6pc-/- mice. The fact that adipocyte lipolysis and VLDL catabolism are also altered in well-controlled patients is most likely explained by the presence of insulin resistance (75) which also enhances adipose tissue lipolysis and circulating NEFA levels that, in turn, inhibit VLDL catabolism (49,58–65). Altogether, to translate our findings to humans, we propose that increased adipocyte lipolysis and elevated NEFA levels in GSD Ia arrest the catabolism of TG-rich lipoproteins, leading to hypertriglyceridemia, and that these changes are most marked in patients with poor glycemic control.
Experimental data in GSD Ia patients suggest that altered VLDL metabolism may contribute to hypertriglyceridemia in GSD Ia (17,18,49,55,72,76). It has been reported that VLDL secretion is unchanged in GSD Ia patients in normoglycemic state, as analyzed by ApoB turnover (55,76). Bandsma et al. also quantified ApoB100 turnover and found reduced VLDL secretion in two GSD Ia patients, and a higher VLDL secretion in another patient as compared to healthy controls (18). We now show that hepatic VLDL particle secretion remains (largely) unaffected in L-G6pc-/- mice and, consequently, assessment of ApoB turnover rates may not reveal increased VLDL-TG secretion in GSD Ia. The (seemingly) conflicting published findings on VLDL secretion in GSD Ia patients are therefore most likely explained by methodological differences (17,18,55,76). Our finding that excess TGs and cholesterol in patients
2020 07 03 Boekje 1.0.indd 462020 07 03 Boekje 1.0.indd 46 24/07/2020 21:1324/07/2020 21:13

Hypoglycemia aggravates dyslipidemia in GSD Ia via enhanced lipolysis and impaired VLDL catabolism
47
2
are almost exclusively associated with TG-rich lipoproteins is in agreement with our conclusion that impaired VLDL catabolism is a major determinant of hyperlipidemia in GSD Ia. Moreover, our data are in line with previous work showing that adiponectin levels correlate with both the severity of hypertriglyceridemia in GSD Ia (19) and with VLDL-apoB catabolism (77).
In conclusion, by showing a concomitant increase in VLDL-TG secretion and reduction in VLDL-TG catabolism in fasted, hypoglycemic L-G6pc-/- mice, our study identifi es the physiological mechanism via which acute hypoglycemia is linked
Figure 5. Schematic overview of physiological mechanisms linking glycemia to hyperlipidemia in normo- and hypoglycemic GSD Ia mice. In normoglycemic L-G6pc-/- mice, mainly hepatic de novo fatty acid synthesis contributes to hepatic lipid accumulation. In hypoglycemic L-G6pc-/-
mice, enhanced adipose tissue lipolysis and hepatic fatty acid elongation contribute to hepatic lipid accumulation. VLDL-TG levels and –secretion rates are increased in L-G6pc-/- mice under both normo- and hypoglycemic conditions. VLDL catabolism is selectively inhibited in hypoglycemic L-G6pc-/- mice, associated with higher NEFA levels compared to normoglycemic L-G6pc-/- mice.Abbreviations: G6P, glucose-6-phosphate; G6PC, glucose-6-phosphatase; IDL, intermediate density lipoproteins; LDL, low density lipoprotein; LPL, lipoprotein lipase; NEFA, non-esterifi ed fatty acids; TG, triglycerides; VLDL, very low density lipoprotein.
2020 07 03 Boekje 1.0.indd 472020 07 03 Boekje 1.0.indd 47 24/07/2020 21:1324/07/2020 21:13

Chapter 2
48
to hypertriglyceridemia in a liver-specific mouse model for GSD Ia (Figure 5). Moreover, our work reveals a marked difference in the origin of hepatic steatosis in normoglycemic versus hypoglycemic hepatocyte-specific GSD Ia mice (Figure 5). In GSD Ia patients, strict dietary management aims to maintain normoglycemia and to prevent secondary complications such as hyperlipidemia. Frequent small meals are part of the dietary management in GSD Ia patients and during regular follow-up parameters of metabolic control can only be analyzed within the maximal time interval between two meals. In contrast, mouse models for GSD Ia are commonly investigated under more extreme and controlled fasting conditions. Our current findings stress the impact of glycemic state in GSD Ia research and we therefore propose that systemic investigation of GSD Ia mouse models in normo- versus hypoglycemia will provide clinically relevant insights into the pathophysiological events that may occur in GSD Ia patients. Because in clinical practice plasma TG levels are used to monitor glycemic control, and considering the association between plasma TG levels and long-term complications, detailed mechanistic understanding of the factors that link glycemic control and hyperlipidemia will likely contribute to improved and personalized care for GSD Ia patients.
MethodsHuman subjectsFor FPLC profiles, plasma samples from 3 GSD Ia patients (age range 32-79 years) and 1 control subject were collected in fed state. For plasma NEFA profiles, plasma from 7 GSD Ia patients (3 female, 4 male; age range 22-51 years) and age- and sex-matched controls were randomly collected during the day in fed state. For patient demographics, see Table S1. Plasma samples were stored at -20°C until further analysis.
AnimalsMale B6.G6pclox/lox and B6.G6pclox/lox.SAcreERT2/w mice mice (23) (10-16 weeks old) were housed in a light (lights on: 7:00 AM-7:00 PM) and temperature (21°C)-controlled facility and fed a standard laboratory chow diet (RMH-B, ABdiets, Woerden, The Netherlands). Animals received i.p. injections of tamoxifen for five consecutive days to generate liver-specific G6pc-deficient mice (L-G6pc-/-) and wildtype littermates (L-G6pc+/+) by deletion of exon 3 of the G6pc gene, as described previously (23). Ten days after the last tamoxifen injection, mice were sacrificed by heart puncture (8:00 AM) in either a fed or a 9 hour fasted (11:00 PM - 8:00 AM) state. Tissues were quickly excised and stored at -80°C. Blood was centrifuged (4.000 rpm for 10 minutes at 4°C), and plasma was stored at -20°C.
In vivo determination of de novo lipogenesis and chain elongation In order to measure lipogenesis in the liver, mice received a sodium [1-13C]-
2020 07 03 Boekje 1.0.indd 482020 07 03 Boekje 1.0.indd 48 24/07/2020 21:1324/07/2020 21:13

Hypoglycemia aggravates dyslipidemia in GSD Ia via enhanced lipolysis and impaired VLDL catabolism
49
2
acetate solution (241 mM; 99 atom %, Isotec/Sigma- Aldrich, St. Louis, MO, USA) as drinking water during the final 24 hours before sacrifice. Liver homogenates were prepared and fatty acids were measured using a Agilent 5975 series GC/MSD (Agilent Technologies, Santa Clara, CA). Normalized mass isotopomer distributions (78) were used in MIDA algorithms to calculate the acetyl-CoA precursor pool enrichment, fractional synthesis rate, and chain elongation rates, as described before (27). Hepatic fatty acid composition was analyzed by gas chromatography after transmethylation (79).
In vivo plasma decay and organ uptake of VLDL-like particlesVLDL-like particles (80 nm) labelled with glycerol tri[3H]oleate were prepared as previously described (80). L-G6pc-/- mice and wildtype littermates in fed or 9 hours fasted state received i.v. injections via the tail of the VLDL-like particles (1 mg TG in 200 µl PBS). Blood samples were taken 2, 5, 10, and 15 minutes after injection to determine plasma decay of glycerol tri[3H]oleate. Total plasma volumes were calculated as 0.04706 x body weight (g) as previously described (81). Mice were sacrificed after the last blood sample was taken by cervical dislocation and were perfused with ice-cold heparin solution (0.1% v/v in PBS). Organs and tissues were dissolved in Solvable (PerkinElmer, Waltham, MA, USA) overnight at 56⁰C. 3H radioactivity was determined and expressed as percentage of injected dose per gram wet tissue weight.
VLDL-TG secretionIn order to quantify hepatic VLDL-TG secretion, L-G6pc-/- mice and wildtype littermates in fed or 9 hours fasted state received i.p. injections of 1 mg/g Poloxamer 407 (P-407) (82). Blood samples were taken 30, 60, 120, and 240 minutes after injection to determine plasma TG levels using commercially available kits (Roche, Mannheim, Germany). Mice were sacrificed by heart puncture and chylomicrons were isolated from the plasma by centrifuging at 10.000 g for 15 minutes at 10°C. Next, nascent VLDL particles (0.15 M NaCl; d<1.006) were isolated from the remaining sample by centrifuging at 508.000 g for 125 min at 18°C. Volumes of nascent VLDL containing equal amounts of TG (125 nmol) were pooled, and lipids were extracted with methanol and cold ether. The remaining VLDL proteins were incubated at 100 °C for 5 minutes in loading buffer, subsequently subjected to SDS-PAGE, and 15 nmol TG was loaded per lane. Apolipoprotein (apo)B48 and apoB100 were determined using antibodies against anti-mouse apoB raised in rabbit (Biodesign, Saco, ME, USA). Horseradish peroxidase-conjugated anti-rabbit antibodies from donkey (Amersham Pharmacia Bioscience, GE Healthcare) were used as a secondary antibody for all immunoblots. Protein bands were detected using SuperSignal West Pico Chemiluminescent Substrate System (Thermo Fisher Scientific, Rockford, IL, USA). Band densities were determined using a Gel Doc XR system (Biorad, Hercules, CA, USA).
2020 07 03 Boekje 1.0.indd 492020 07 03 Boekje 1.0.indd 49 24/07/2020 21:1324/07/2020 21:13

Chapter 2
50
Biochemical analysesBlood glucose was measured using a One Touch Ultra glucose meter (Life-Scan Inc., Milpitas, CA, USA). Plasma insulin and glucagon were analysed using commercially available ELISA kits (Chrystal Chem, Downers Grove, IL, USA and Alpco Diagnostics, Salem, NH, USA respectively). Plasma levels of lactate, ketone bodies (3-hydroxybutyrate and total ketone bodies) and free fatty acids were enzymatically determined using commercially available kits (Instruchemie, Delfzijl, The Netherlands; Wako, Mountain View, CA, USA; DiaSys, Holzheim, Germany, respectively) and analyzed by Selectra Pro M (ELITechGroup). Plasma levels of uric acid were measured using a commercially available kit (Abnova, Taiwan). Liver lipids were extracted according to Bligh and Dyer (83). Commercially available kits were used to measure hepatic and plasma levels of triglycerides (Roche, Mannheim, Germany), total and free cholesterol levels (Roche, Mannheim, Germany and DiaSys, Holzheim, Germany, respectively). Hepatic glycogen and G6P content was determined as previously described (84). Hepatic acylcarnitine profiles were analyzed as previously described (85).
Ex vivo adipose tissue lipolysisEpididymal WAT was removed and pieces of around 20 mg were cut and kept on ice in Krebs buffer (12 mM HEPES, 4.9mM KCl, 121mM NaCl, 1.2 mM MgSO4, 0.33 mM CaCl2 and 0.1% glucose, pH 7.4) until further processing. WAT pieces were transferred to Eppendorf tubes with pre-warmed (37°C) Krebs buffer supplemented with 3.5% FFA-free BSA (100 µl Krebs buffer per 10 mg tissue). Every hour for four hours one sample per animal was spinned down at maximum speed and buffer was stored at -20°C until further analysis. Glycerol concentrations were measured according to manufacturer’s protocol using a commercially available kit (Cayman Chemical, Ann Arbor, MI, USA).
Ex vivo fatty acid β-oxidation ratesFatty acid β-oxidation capacity was determined in liver homogenates according to Hirschey et al. (86). Briefly, tissue was homogenized in sucrose/Tris/EDTA buffer, and incubated for 30 min in a reaction mixture (pH 8.0) containing [1-14C]palmitic acid. Trapped [14C]CO2 on a filter paper was quantified for complete β-oxidation, and [14C]CO2 in homogenates was quantified for incomplete β-oxidation.
Glycolytic enzyme capacities (Vmax)10% liver homogenates were prepared in cold PBS with phosphate inhibitor cocktail 2 and 3 (P5726 and P0044, resp., Sigma) and Complete Protease Inhibitor Cocktail (Sigma). Homogenates were centrifuged and supernatant was used for determining glycolytic enzyme capacities. Protein levels were measured using the Bicinchoninic Acid kit (BCA™ Protein Assay kit, Pierce). Vmax assays were performed with freshly
2020 07 03 Boekje 1.0.indd 502020 07 03 Boekje 1.0.indd 50 24/07/2020 21:1324/07/2020 21:13

Hypoglycemia aggravates dyslipidemia in GSD Ia via enhanced lipolysis and impaired VLDL catabolism
51
2
prepared extracts in assay medium via NAD(P)H-linked assays at 37°C by adding 0.15 mM NADH or 0.4 mM NADP+, 1 mM ATP or ADP, and enzyme-specific substrates. Assay medium contained 150 mM potassium (87–90), 5 mM phosphate (87,91), 15 mM sodium (87,92), 155 mM chloride (93,94), 0.5 mM calcium, 0.5 mM free magnesium (87,95,96) and 0.5-10.5 mM sulfate, pH 7.0.
Gene expression analysisTotal RNA was extracted from liver using TRI-Reagent (Sigma-Aldrich Corp., St. Louis, MO, USA). cDNA was obtained by reverse transcription and amplified using primers and probe sequences listed in Table S7. mRNA levels were calculated relative to the expression of 36b4 for liver and normalized to expression levels in fed L-G6pc+/+ mice.
Targeted proteomicsTargeted proteomics was applied to quantify G6PC, APOB, MTTP, TM6SF2, APOC1, APOC2, APOC3, ANGPTL3 and ANGPTL4 in homogenized liver tissue via the isotopically labeled peptide standards (Table S8), containing 13C-labeled lysine/arginine (PolyQuant GmbH, Bad Abbach, Germany) according to the workflow previously described (97). Prior to the proteomics workflow, lipids were extracted from the liver homogenates with diethyl ether. The peptide concentrations were related to the total peptide content, which was determined by a colorimetric peptide assay after tryptic digestion and SPE cleanup (Thermo Scientific, Waltham, MA, USA). The concentrations of endogenous peptides were calculated from the known concentration of the standard and expressed in fmol/µg of total peptide and expressed relative to the values in fed L-G6pc+/+ mice.
Western blotWestern blotting was performed on epididymal white adipose tissue and isolated VLDL particles. Protein concentrations were determined with the bichinchoninic acid (BCA) assay (Thermo Scientific, Waltham, MA, USA). Equal amounts of protein (5 µg) were separated by SDS-PAGE and blotted on nitrocellulose membranes (BioRad Laboratories, Hercules, CA, USA) using semi-dry transfer (Trans-Blot Turbo Transfer System, BioRad Laboratories, Hercules, CA, USA). Membranes were incubated overnight at 4°C with the primary antibody. Proteins were visualized using horseradish-peroxidase-conjugated goat anti-rabbit (Agilent Technologies, Santa Clara, CA, USA) and SuperSignal West Dura substrate (Thermo Scientific, Waltham, MA, USA). The following antibodies were used: HSL (#4107), phosphoHSL Ser660 (#4126), phosphoHSL Ser565 (#4137), phosphoHSL Ser563 (#4139), Perilipin (#9349), Atgl (#2138), HRP-linked anti-rabbit IgG (#7074) (Cell Signaling Technology, Danvers, MA, USA), and ApoB (H-300) (sc-25542) (Santa Cruz Biotechnology, Inc., Heidelberg, Germany).
2020 07 03 Boekje 1.0.indd 512020 07 03 Boekje 1.0.indd 51 24/07/2020 21:1324/07/2020 21:13

Chapter 2
52
Plasma lipoprotein analysis Human and mouse plasma lipoproteins were separated by fast protein liquid chromatography (FPLC) gel filtration using a Superose 6 column (GE Healthcare, Uppsala, Sweden) as described earlier (98). Triglyceride content of the collected fractions was determined using a commercially available kit (Roche Diagnostics, Mannheim, Germany), and total cholesterol was determined using a commercially available kit (Diasys, Holzheim, Germany).
Immunohistochemical analysisFrozen liver sections were stained with Oil Red O (ORO). Photomicrographs of five areas per section of liver were made at 200x magnification using the Olympus DP26 camera with Olympus cellSensTM Standard software (v1.18). To perform digital image analysis, an imageJ (v1.50, National Institutes of Health, Bethesda, MD) macro script was created to assess the extent of lipid staining (total area and lipid droplet area). Histopathologic examination and lipid droplet area quantification was performed blindly by a board certified veterinary pathologist.
StatisticsStatistical analysis was performed using BrightStat software. Differences between two or multiple groups were tested by Mann-Whitney U-test or Kruskal-Wallis H-test followed by post-hoc Conover pairwise comparisons, respectively. P-values <0.001 (***), 0.001 to 0.01 (**), and 0.01 to 0.05 (*) were considered significant. Correlations were analyzed by Spearman’s correlations coefficient using SPSS24.0 for Windows software (SPSS, Chicaco, IL, USA).
Study approvalThe study with human materials was performed in accordance with the Declaration of Helsinki and the institutional rules for studying biological rest materials and thereby approved for waived consent as it concerned retrospective, anonymous data. The Medical Ethical Committee of the University Medical Center Groningen stated that the Medical Research Involving Human Subjects Act was not applicable and that official study approval by the Medical Ethical Committee was not required (METc 2019/119).
All animal procedures were approved by the Dutch Central Committee Animal Experiments (Centrale Commissie Dierproeven) under permit number AVD105002015245 and DEC 6246 and adhered to guidelines set out in the 2010/63/EU directive.
2020 07 03 Boekje 1.0.indd 522020 07 03 Boekje 1.0.indd 52 24/07/2020 21:1324/07/2020 21:13

Hypoglycemia aggravates dyslipidemia in GSD Ia via enhanced lipolysis and impaired VLDL catabolism
53
2
Author contributionsDesigning research studies, J.A.H., B.S.H., S.K., F.K., F.R., G.M., D.R., T.G.J.D., and M.H.O.; Conducting experiments, J.A.H., B.S.H., F.P., J.C.W., S.K., T.B., A.B., H.W., R.H., and A.C.M.P.; Analyzing data, J.A.H., B.S.H., F.P., J.C.W., T.H.D., F.K., T.G.J.D., and M.H.O.; Writing the first draft of the manuscript, J.A.H., F.P., F.K., and M.H.O.; Critical revisions of the manuscript, F.P., S.K., P.C.N.R., T.H.D., H.W., F.R., G.M., F.K., T.G.J.D., and M.H.O., Material support, F.R., and G.M.
AcknowledgementsWe thank Y. Lei, M.H. Koster, I.A. Martini, A. Jurdinski, K. Tholen, Y. van der Veen, T. Boer, M. Koehorst, and F.G. Perton for excellent technical assistance. F.P. is appointed as MD-PhD by the UMCG, rewarded by the UMCG Junior Scientific Masterclass to F.P. and T.G.J.D. (MD-PhD 16-24), M.H.O is the recipient of a VIDI grant from the Dutch Scientific Organization, and holds a Rosalind Franklin Fellowship from the University of Groningen. P.C.N.R. is supported by the Netherlands Cardiovascular Research Initiative: an initiative with support of the Dutch Heart Foundation (CVON2017 GENIUS-II).
2020 07 03 Boekje 1.0.indd 532020 07 03 Boekje 1.0.indd 53 24/07/2020 21:1324/07/2020 21:13

Chapter 2
54
References1. Lei KJ et al. Genetic basis of glycogen storage disease type 1a: prevalent mutations at the
glucose-6-phosphatase locus. Am J Hum Genet. 1995;57(4):766-71.2. Bali DS, Chen Y-T, Austin S, Goldstein JL. Glycogen Storage Disease Type I. (Adam M,
Ardinger M, Pagon R, Al E, eds.). Seattle: University of Washington, Seattle; 1993.3. Froissart R et al. Glucose-6-phosphatase deficiency. Orphanet J Rare Dis. 2011;6(1):27.4. Rake J et al. Guidelines for management of glycogen storage disease type I - European Study
on Glycogen Storage Disease Type I (ESGSD I). Eur J Pediatr. 2002;161(0):S112-S119.5. Weinstein D, Wolfsdorf J. Effect of continuous glucose therapy with uncooked cornstarch
on the long-term clinical course of type 1a glycogen storage disease. Eur J Pediatr. 2002;161(0):S35-S39.
6. Chen Y-T, Bazzarre CH, Lee MM, Sidbury JB, Coleman RA. Type I glycogen storage disease: Nine years of management with cornstarch. Eur J Pediatr. 1993;152(S1):56-59.
7. Dambska M, Labrador E, Kuo C, Weinstein D. Prevention of complications in glycogen storage disease type Ia with optimization of metabolic control. Pediatr Diabetes. 2017;18(5):327-331.
8. Okechuku GO, Shoemaker LR, Dambska M, Brown LM, Mathew J, Weinstein DA. Tight metabolic control plus ACE inhibitor therapy improves GSD I nephropathy. J Inherit Metab Dis. 2017;40(5):703-708.
9. Rake JP, Visser G, Labrune P, Leonard J V., Ullrich K, Smit GPA. Glycogen storage disease type I: diagnosis, management, clinical course and outcome. Results of the European study on glycogen storage disease type I (ESGSD I). Eur J Pediatr. 2002;161(1):S20-S34.
10. Howell RR, Stevenson RE, Ben-Menachem Y, Phyliky RL, Berry DH. Hepatic Adenomata With Type 1 Glycogen Storage Disease. JAMA J Am Med Assoc. 1976;236(13):1481.
11. Franco LM et al. Hepatocellular carcinoma in glycogen storage disease type Ia: A case series. J Inherit Metab Dis. 2005;28(2):153-162.
12. Chen Y-T, Kishnani PS, Koeberl D. Glycogen Storage Diseases. In: Beaudet AL et al., eds. The Online Metabolic and Molecular Bases of Inherited Disease. New York, NY: The McGraw-Hill Companies, Inc.; 2014.
13. Kishnani PS et al. Diagnosis and management of glycogen storage disease type I: a practice guideline of the American College of Medical Genetics and Genomics. Genet Med. 2014;16(11):e1-e1.
14. Wang DQ, Fiske LM, Carreras CT, Weinstein DA. Natural history of hepatocellular adenoma formation in glycogen storage disease type I. J Pediatr. 2011;159(3):442-6.
15. Peeks F et al. Clinical and biochemical heterogeneity between patients with glycogen storage disease type IA: the added value of CUSUM for metabolic control. J Inherit Metab Dis. 2017;40(5):695-702.
16. Berglund L et al. Evaluation and treatment of hypertriglyceridemia: an Endocrine Society clinical practice guideline. J Clin Endocrinol Metab. 2012;97(9):2969-89.
17. Bandsma RHJ et al. Increased lipogenesis and resistance of lipoproteins to oxidative modification in two patients with glycogen storage disease type 1a. J Pediatr.
2020 07 03 Boekje 1.0.indd 542020 07 03 Boekje 1.0.indd 54 24/07/2020 21:1324/07/2020 21:13
Hypoglycemia aggravates dyslipidemia in GSD Ia via enhanced lipolysis and impaired VLDL catabolism
55
2
2002;140(2):256-260.18. Bandsma RHJ et al. Increased de novo Lipogenesis and Delayed Conversion of Large
VLDL into Intermediate Density Lipoprotein Particles Contribute to Hyperlipidemia in Glycogen Storage Disease Type 1a. Pediatr Res. 2008;63(6):702-707.
19. Bandsma RHJ, Smit GPA, Reijngoud D-J, Kuipers F. Adiponectin levels correlate with the severity of hypertriglyceridaemia in glycogen storage disease Ia. J Inherit Metab Dis. 2009;32 Suppl 1(S1):S27-31.
20. Matern D et al. Liver transplantation for glycogen storage disease types I, III, and IV. Eur J Pediatr. 1999;158 Suppl 2(Suppl 2):S43-8.
21. Parker P, Burr I, Slonim A, Ghishan FK, Greene H. Regression of hepatic adenomas in type Ia glycogen storage disease with dietary therapy. Gastroenterology. 1981;81(3):534-6.
22. Beegle RD, Brown LM, Weinstein DA. Regression of Hepatocellular Adenomas with Strict Dietary Therapy in Patients with Glycogen Storage Disease Type I. In: ; 2014:23-32.
23. Mutel E et al. Targeted deletion of liver glucose-6 phosphatase mimics glycogen storage disease type 1a including development of multiple adenomas. J Hepatol. 2011;54(3):529-537.
24. Rajas F, Clar J, Gautier-Stein A, Mithieux G. Lessons from new mouse models of glycogen storage disease type 1a in relation to the time course and organ specificity of the disease. J Inherit Metab Dis. 2015;38(3):521-527.
25. Bandsma RH et al. Acute inhibition of glucose-6-phosphate translocator activity leads to increased de novo lipogenesis and development of hepatic steatosis without affecting VLDL production in rats. Diabetes. 2001;50(11):2591-7.
26. Rajas F, Labrune P, Mithieux G. Glycogen storage disease type 1 and diabetes: Learning by comparing and contrasting the two disorders. Diabetes Metab. 2013;39(5):377-387.
27. Oosterveer MH et al. High fat feeding induces hepatic fatty acid elongation in mice. PLoS One. 2009;4(6):e6066.
28. van der Veen JN, Havinga R, Bloks VW, Groen AK, Kuipers F. Cholesterol feeding strongly reduces hepatic VLDL-triglyceride production in mice lacking the liver X receptor alpha. J Lipid Res. 2007;48(2):337-47.
29. Abdul-Wahed A et al. A link between hepatic glucose production and peripheral energy metabolism via hepatokines. Mol Metab. 2014;3:531-543.
30. Kersten S. Physiological regulation of lipoprotein lipase. Biochim Biophys Acta - Mol Cell Biol Lipids. 2014;1841(7):919-933.
31. Connelly PW. The role of hepatic lipase in lipoprotein metabolism. Clin Chim Acta. 1999;286(1-2):243-255.
32. Larsson M, Vorrsjö E, Talmud P, Lookene A, Olivecrona G. Apolipoproteins C-I and C-III Inhibit Lipoprotein Lipase Activity by Displacement of the Enzyme from Lipid Droplets. J Biol Chem. 2013;288(47):33997-34008.
33. Berbée JFP, van der Hoogt CC, Sundararaman D, Havekes LM, Rensen PCN. Severe hypertriglyceridemia in human APOC1 transgenic mice is caused by apoC-I-induced
2020 07 03 Boekje 1.0.indd 552020 07 03 Boekje 1.0.indd 55 24/07/2020 21:1324/07/2020 21:13

Chapter 2
56
inhibition of LPL. J Lipid Res. 2005;46(2):297-306.34. Derks TGJ, van Rijn M. Lipids in hepatic glycogen storage diseases: pathophysiology,
monitoring of dietary management and future directions. J Inherit Metab Dis. 2015;38(3):537-43.
35. Timlin MT, Parks EJ. Temporal pattern of de novo lipogenesis in the postprandial state in healthy men. Am J Clin Nutr. 2005;81(1):35-42.
36. Duncan RE, Ahmadian M, Jaworski K, Sarkadi-Nagy E, Sul HS. Regulation of Lipolysis in Adipocytes. Annu Rev Nutr. 2007;27(1):79-101.
37. Frühbeck G, Méndez-Giménez L, Fernández-Formoso J-A, Fernández S, Rodríguez A. Regulation of adipocyte lipolysis. Nutr Res Rev. 2019;27(1):63-93.
38. Kim S-J, Tang T, Abbott M, Viscarra JA, Wang Y, Sul HS. AMPK Phosphorylates Desnutrin/ATGL and Hormone-Sensitive Lipase To Regulate Lipolysis and Fatty Acid Oxidation within Adipose Tissue. Mol Cell Biol. 2016;36(14):1961-1976.
39. Anthonsen MW, Rönnstrand L, Wernstedt C, Degerman E, Holm C. Identification of novel phosphorylation sites in hormone-sensitive lipase that are phosphorylated in response to isoproterenol and govern activation properties in vitro. J Biol Chem. 1998;273(1):215-21.
40. Garton AJ, Yeaman SJ. Identification and role of the basal phosphorylation site on hormone-sensitive lipase. Eur J Biochem. 1990;191(1):245-50.
41. Li X et al. Inhibition of lipolysis may contribute to the acute regulation of plasma FFA and glucose by FGF21 in ob/ob mice. FEBS Lett. 2009;583(19):3230-3234.
42. Arner P, Pettersson A, Mitchell PJ, Dunbar JD, Kharitonenkov A, Rydén M. FGF21 attenuates lipolysis in human adipocytes - A possible link to improved insulin sensitivity. FEBS Lett. 2008;582(12):1725-1730.
43. Inagaki T et al. Endocrine Regulation of the Fasting Response by PPARα-Mediated Induction of Fibroblast Growth Factor 21. Cell Metab. 2007;5(6):415-425.
44. Liljenquist JE et al. Effects of glucagon on lipolysis and ketogenesis in normal and diabetic men. J Clin Invest. 1974;53(1):190-7.
45. Perea A, Clemente F, Martinell J, Villanueva-Peñacarrillo ML, Valverde I. Physiological effect of glucagon in human isolated adipocytes. Horm Metab Res. 1995;27(8):372-5.
46. Smagris E, Gilyard S, BasuRay S, Cohen JC, Hobbs HH. Inactivation of Tm6sf2 , a Gene Defective in Fatty Liver Disease, Impairs Lipidation but Not Secretion of Very Low Density Lipoproteins. J Biol Chem. 2016;291(20):10659-10676.
47. Wetterau JR et al. Absence of microsomal triglyceride transfer protein in individuals with abetalipoproteinemia. Science. 1992;258(5084):999-1001.
48. Atzel A, Wetterau JR. Mechanism of Microsomal Triglyceride Transfer Protein Catalyzed Lipid Transport. Biochemistry. 1993;32:10444-10450.
49. Muller DPR, Gamlen TR. The Activity of Hepatic Lipase and Lipoprotein Lipase in Glycogen Storage Disease: Evidence for a Circulating Inhibitor of Postheparin Lipolytic Activity. Pediat Res. 1984;18(9):881-885.
50. Jansen H, van Tol A, Auwerx J, Skretting G, Staels B. Opposite regulation of hepatic lipase
2020 07 03 Boekje 1.0.indd 562020 07 03 Boekje 1.0.indd 56 24/07/2020 21:1324/07/2020 21:13
Hypoglycemia aggravates dyslipidemia in GSD Ia via enhanced lipolysis and impaired VLDL catabolism
57
2
and lecithin: cholesterol acyltransferase by glucocorticoids in rats. Biochim Biophys Acta - Lipids Lipid Metab. 1992;1128(2-3):181-185.
51. Neve BP, Verhoeven AJM, Jansen H. Acute effects of adrenaline on hepatic lipase secretion by rat hepatocytes. Metabolism. 1997;46(1):76-82.
52. Staels B et al. Development, food intake, and ethinylestradiol influence hepatic triglyceride lipase and LDL-receptor mRNA levels in rats. J Lipid Res. 1990;31(7):1211-8.
53. Lichtenstein L et al. Angptl4 Upregulates Cholesterol Synthesis in Liver via Inhibition of LPL- and HL-Dependent Hepatic Cholesterol Uptake. Arterioscler Thromb Vasc Biol. 2007;27(11):2420-2427.
54. Nakajima K et al. Association of angiopoietin-like protein 3 with hepatic triglyceride lipase and lipoprotein lipase activities in human plasma. Ann Clin Biochem. 2010;47(5):423-431.
55. Levy E, Thibault LA, Roy CC, Bendayan M, Lepage G, Letarte J. Circulating lipids and lipoproteins in glycogen storage disease type I with nocturnal intragastric feeding. J Lipid Res. 1988;29(2):215-26.
56. Jong MC, Hofker MH, Havekes LM. Role of ApoCs in Lipoprotein Metabolism Functional Differences Between ApoC1, ApoC2, and ApoC3. Arterioscler Thromb Vasc Biol. 1999;19(3):472-84.
57. Carlson LA, Ballantyne D. Changing relative proportions of Apolipoproteins CII and CIII of very low density lipoproteins in hypertriglyceridaemia. Atherosclerosis. 1976;23:563-568.
58. Goodman DS. The Interaction of Human Serum Albumin with Long-chain Fatty Acid Anions. Am Chem Soc. 1958;80:3892.
59. Kirkland JL, Hollenberg CH, Kindler S, Roncari DAK. Long-chain fatty acids decrease lipoprotein lipase activity of cultured rat adipocyte precursors. Metabolism. 1994;43(2):144-151.
60. Jackson RL, Shirai K, Harmony JAK, Quinn D. Mechanism of Action of Lipoprotein Lipase: Role of Apolipoprotein C-II. Prog Lipid Res. 1983;22:35-78.
61. Scow RO, Olivercrona T. Effect of albumin on products formed from chylomicron triacylclycerol by lipoprotein lipase in vitro. Biochim Biophys Acta. 1977;487:472-486.
62. Scow RO, Desnuelle P, Verger R. Lipolysis and Lipid Movement in a Membrane Model. J Biol Chem. 1979;254(14):6456-6463.
63. Bengtsson G, Olivecrona T. Apolipoprotein CII enhances hydrolysis of monoglycerides by lipoprotein lipase, but the effect is abolished by fatty acids. FEBS Lett. 1979;106(2):345-8.
64. Bengtsson G, Olivecrona T. Lipoprotein lipase. Mechanism of product inhibition. Eur J Biochem. 1980;106(2):557-62.
65. Saxena U, Goldberg IJ. Interaction of lipoprotein lipase with glycosaminoglycans and apolipoprotein C-II: effects of free-fatty-acids. Biochim Biophys Acta. 1990;1043(2):161-8.
66. Walker CG et al. Fatty acid profile of plasma NEFA does not reflect adipose tissue fatty
2020 07 03 Boekje 1.0.indd 572020 07 03 Boekje 1.0.indd 57 24/07/2020 21:1324/07/2020 21:13

Chapter 2
58
acid profile. Br J Nutr. 2015;114(5):756-62.67. Quinn D, Shirai K, Jackson RL. Lipoprotein lipase: mechanism of action and role in
lipoprotein metabolism. Prog Lipid Res. 1982;22:35-78.68. Havel RJ, Balasse EO, Williams HE, Kane JP, Segel N. Splanchnic metabolism in von
Gierke’s disease (glycogenosis type I). Trans Assoc Am Physicians. 1969;82:305-23.69. Ockerman PA. Glucose, glycerol and free fatty acids in glycogen storage disease type
1. Blood levels in the fasting and non-fasting state. Effect of glucose and adrenalin administration. Clin Chim Acta. 1965;12:370-382.
70. Monteillet L et al. Intracellular lipids are an independent cause of liver injury and chronic kidney disease in non alcoholic fatty liver disease-like context. Mol Metab. 2018;16:100-115.
71. Farah BL et al. Hepatic mitochondrial dysfunction is a feature of Glycogen Storage Disease Type Ia (GSDIa). Sci Rep. 2017;7:44408.
72. Forget PP, Fernandes J, Begemann PH. Triglyceride Clearing in Glycogen Storage Disease. Pediatr Res. 1974;8(2):114-119.
73. Asayama K, Kato K, Anemiya S, Nozaki Y. Postheparin Plasma Lipases in Patients with Hepatic Glycogenosis. Horm Metab Res. 1982;14(10):555-555.
74. Fernandes J, Jansen H, Jansen TC. Nocturnal gastric drip feeding in glucose-6-phosphatase deficient children. Pediat Res. 1979;13(4):225-9.
75. Bhattacharya K. Dietary dilemmas in the management of glycogen storage disease type I. J Inherit Metab Dis. 2011;34(3):621-9.
76. Wierzbicki AS, Watt GF, Lynas J, Winder AF, Wray R. Very low-density lipoprotein apolipoprotein B-100 turnover in glycogen storage disease type Ia (von Gierke disease). J Inherit Metab Dis. 2001;24(5):527-34.
77. Ng TWK, Watts GF, Farvid MS, Chan DC, Barrett PHR. Adipocytokines and VLDL metabolism: independent regulatory effects of adiponectin, insulin resistance, and fat compartments on VLDL apolipoprotein B-100 kinetics? Diabetes. 2005;54(3):795-802.
78. Lee W-NP, Byerley LO, Bergner EA, Edmond J. Mass isotopomer analysis: Theoretical and practical considerations. Biol Mass Spectrom. 1991;20(8):451-458.
79. Muskiet FA, van Doormaal JJ, Martini IA, Wolthers BG, van der Slik W. Capillary gas chromatographic profiling of total long-chain fatty acids and cholesterol in biological materials. J Chromatogr. 1983;278(2):231-44.
80. Rensen PC, Herijgers N, Netscher MH, Meskers SC, van Eck M, van Berkel TJ. Particle size determines the specificity of apolipoprotein E-containing triglyceride-rich emulsions for the LDL receptor versus hepatic remnant receptor in vivo. J Lipid Res. 1997;38(6):1070-84.
81. Jong MC, Rensen PC, Dahlmans VE, van der Boom H, van Berkel TJ, Havekes LM. Apolipoprotein C-III deficiency accelerates triglyceride hydrolysis by lipoprotein lipase in wild-type and apoE knockout mice. J Lipid Res. 2001;42(10):1578-85.
82. Millar JS, Cromley DA, McCoy MG, Rader DJ, Billheimer JT. Determining hepatic triglyceride production in mice: comparison of poloxamer 407 with Triton WR-1339. J
2020 07 03 Boekje 1.0.indd 582020 07 03 Boekje 1.0.indd 58 24/07/2020 21:1324/07/2020 21:13

Hypoglycemia aggravates dyslipidemia in GSD Ia via enhanced lipolysis and impaired VLDL catabolism
59
2
Lipid Res. 2005;46(9):2023-8.83. Bligh EG, Dyer WJ. A rapid method of total lipid extraction and purification. Can J
Biochem Physiol. 1959;37(8):911-917.84. Bergmeyer HU. Methods of enzymatic analysis. In: Bergmeyer HU, ed. Methods of
Enzymetic Analysis. Weinheim Germany: Verlag Chemie; 1974:1089-1204.85. Derks TGJ et al. Neonatal screening for medium-chain acyl-CoA dehydrogenase
(MCAD) deficiency in The Netherlands: the importance of enzyme analysis to ascertain true MCAD deficiency. J Inherit Metab Dis. 2008;31(1):88-96.
86. Hirschey MD et al. SIRT3 regulates mitochondrial fatty-acid oxidation by reversible enzyme deacetylation. Nature. 2010;464(7285):121-125.
87. Guynn RW, Veloso D, Lawson JW, Veech RL. The concentration and control of cytoplasmic free inorganic pyrophosphate in rat liver in vivo. Biochem J. 1974;140(3):369-75.
88. Kristensen LO. Associations between transports of alanine and cations across cell membrane in rat hepatocytes. Am J Physiol. 1986;251(5 Pt 1):G575-84.
89. Rorsman P, Trube G. Glucose dependent K+-channels in pancreatic beta-cells are regulated by intracellular ATP. Pflugers Arch. 1985;405(4):305-9.
90. Tschopp J, Schroder K. NLRP3 inflammasome activation: The convergence of multiple signalling pathways on ROS production? Nat Rev Immunol. 2010;10(3):210-5.
91. Conley KE, Blei ML, Richards TL, Kushmerick MJ, Jubrias SA. Activation of glycolysis in human muscle in vivo. Am J Physiol Physiol. 1997;273(1):C306-C315.
92. Lidofsky SD, Xie MH, Sostman A, Scharschmidt BF, Fitz JG. Vasopressin increases cytosolic sodium concentration in hepatocytes and activates calcium influx through cation-selective channels. J Biol Chem. 1993;268(20):14632-6.
93. Breitwieser GE, Altamirano AA, Russell JM. Osmotic stimulation of Na(+)-K(+)-Cl- cotransport in squid giant axon is [Cl-]i dependent. Am J Physiol. 1990;258(4 Pt 1):C749-53.
94. Janssen LJ, Sims SM. Acetylcholine activates non-selective cation and chloride conductances in canine and guinea-pig tracheal myocytes. J Physiol. 1992;453:197-218.
95. Ingwall JS. Phosphorus nuclear magnetic resonance spectroscopy of cardiac and skeletal muscles. Am J Physiol Circ Physiol. 1982;242(5):H729-H744.
96. Murphy E, Steenbergen C, Levy LA, Raju B, London RE. Cytosolic free magnesium levels in ischemic rat heart. J Biol Chem. 1989;264(10):5622-7.
97. de Boer JF et al. Intestinal Farnesoid X Receptor Controls Transintestinal Cholesterol Excretion in Mice. Gastroenterology. 2017;152(5):1126-1138.e6.
98. Tietge UJ et al. Overexpression of secretory phospholipase A(2) causes rapid catabolism and altered tissue uptake of high density lipoprotein cholesteryl ester and apolipoprotein A-I. J Biol Chem. 2000;275(14):10077-84.s
2020 07 03 Boekje 1.0.indd 592020 07 03 Boekje 1.0.indd 59 24/07/2020 21:1324/07/2020 21:13

Chapter 2
60
Supplementary Figure 1. (A) Hepatic free cholesterol and (B) cholesteryl esters in L-G6pc-/- mice and wildtype littermates in fed and fasted conditions (n = 6-8). Data represent Tukey boxplots and Kruskal-Wallis H-test followed by post-hoc Conover pairwise comparisons was used. ***p < 0.001, **p <0.01 indicates signifi cance compared to wildtype littermates. ###p < 0.001 indicates signifi cance compared to fed condition.
Supplemental Material
2020 07 03 Boekje 1.0.indd 602020 07 03 Boekje 1.0.indd 60 24/07/2020 21:1324/07/2020 21:13

Hypoglycemia aggravates dyslipidemia in GSD Ia via enhanced lipolysis and impaired VLDL catabolism
61
2
Supplementary Figure 2. (A) Ex vivo glycerol release of adipose tissue expressed as a function of time in L-G6pc-/- mice and wildtype littermates in fed and fasted conditions (n = 6-8). (B) Representative western blots for adipose tissue of fed and (C) fasted L-G6pc-/- mice (-) and wildtype littermates (+) for indicated proteins (n = 7). (D) Correlation between pHSL Ser563 and ex vivo adipose glycerol release under fasted conditions (n = 6-7). (E) Ex vivo incomplete β-oxidation capacity in L-G6pc-/-
mice and wildtype littermates in fed and fasted conditions (n = 5-8). (F) Western blot for ApoB100 and ApoB48 in nascent VLDL of fed and fasted L-G6pc-/- mice (-) and wildtype littermates (+) (n = 3) with 125 nmol of TG loaded in each lane. (G) Hepatic gene expression in L-G6pc-/- mice and wildtype littermates in fed and fasted conditions (n = 7-8).Data represent means ± SEM or Tukey boxplots. Diff erences between two or multiple groups were tested by Mann-Whitney U-test or Kruskal-Wallis H-test followed by post-hoc Conover pairwise comparisons, respectively. Correlations were analyzed by Spearman’s correlations. ***p < 0.001, **p <0.01, *p < 0.05 indicates signifi cance compared to wildtype littermates. ###p < 0.001, ##p < 0.01, #p < 0.05 indicates signifi cance compared to fed condition.
2020 07 03 Boekje 1.0.indd 612020 07 03 Boekje 1.0.indd 61 24/07/2020 21:1324/07/2020 21:13

Chapter 2
62
2020 07 03 Boekje 1.0.indd 622020 07 03 Boekje 1.0.indd 62 24/07/2020 21:1324/07/2020 21:13

Hypoglycemia aggravates dyslipidemia in GSD Ia via enhanced lipolysis and impaired VLDL catabolism
63
2
2020 07 03 Boekje 1.0.indd 632020 07 03 Boekje 1.0.indd 63 24/07/2020 21:1324/07/2020 21:13

Chapter 2
64
2020 07 03 Boekje 1.0.indd 642020 07 03 Boekje 1.0.indd 64 24/07/2020 21:1324/07/2020 21:13

Hypoglycemia aggravates dyslipidemia in GSD Ia via enhanced lipolysis and impaired VLDL catabolism
65
2
2020 07 03 Boekje 1.0.indd 652020 07 03 Boekje 1.0.indd 65 24/07/2020 21:1324/07/2020 21:13

Chapter 2
66
2020 07 03 Boekje 1.0.indd 662020 07 03 Boekje 1.0.indd 66 24/07/2020 21:1324/07/2020 21:13

Hypoglycemia aggravates dyslipidemia in GSD Ia via enhanced lipolysis and impaired VLDL catabolism
67
2
2020 07 03 Boekje 1.0.indd 672020 07 03 Boekje 1.0.indd 67 24/07/2020 21:1324/07/2020 21:13

2020 07 03 Boekje 1.0.indd 682020 07 03 Boekje 1.0.indd 68 24/07/2020 21:1324/07/2020 21:13

Yu Lei1, Joanne A. Hoogerland1, Vincent W. Bloks1, Trijnie Bos2, Aycha Bleeker1, Henk Wolters1, Justina C. Wolters1, Brenda S. Hijmans1, Theo H. van Dijk2, Rachel Thomas3, Michel van Weeghel4,5, Gilles Mithieux6,7,8, Riekelt H. Houtkooper4, Alain de Bruin1,3, Fabienne Rajas6,7,8, Folkert Kuipers1,2 and Maaike H. Oosterveer1
Departments of 1Pediatrics and 2Laboratory Medicine, University of Groningen, University Medical Center Groningen, The Netherlands. 3Dutch Molecular Pathology Center, Faculty of Veterinary Medicine, Utrecht University, 3584 CL Utrecht, The Netherlands. 4Laboratory Genetic Metabolic Diseases, Amsterdam Gastroenterology and Metabolism, Amsterdam Cardiovascular Sciences, and 5Core Facility Metabolomics, Amsterdam UMC, University of Amsterdam, Meibergdreef 9, Amsterdam, The Netherlands. 6Institut National de la Santé et de la Recherche Médicale, U1213, Lyon, F-69008, 7Université de Lyon, Lyon, F-69008 and 8Université Lyon 1, Villeurbanne, F-69622, France.
Hepatology (2020): doi: 10.1002/hep.31198
3CHAPTERHepatic ChREBP activation limits
NAFLD development in a mouse model for Glycogen Storage Disease
type Ia
2020 07 03 Boekje 1.0.indd 692020 07 03 Boekje 1.0.indd 69 24/07/2020 21:1324/07/2020 21:13
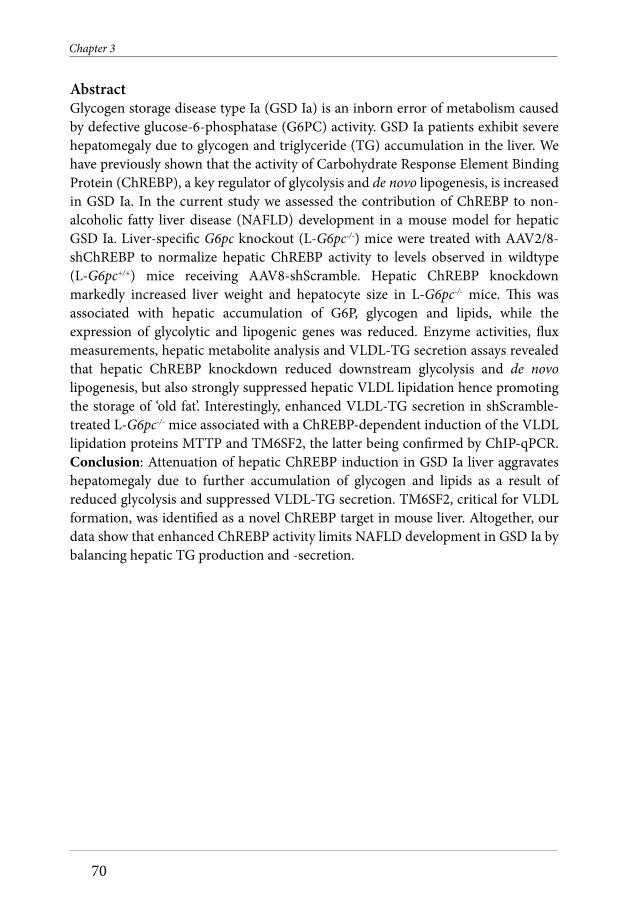
Chapter 3
70
AbstractGlycogen storage disease type Ia (GSD Ia) is an inborn error of metabolism caused by defective glucose-6-phosphatase (G6PC) activity. GSD Ia patients exhibit severe hepatomegaly due to glycogen and triglyceride (TG) accumulation in the liver. We have previously shown that the activity of Carbohydrate Response Element Binding Protein (ChREBP), a key regulator of glycolysis and de novo lipogenesis, is increased in GSD Ia. In the current study we assessed the contribution of ChREBP to non-alcoholic fatty liver disease (NAFLD) development in a mouse model for hepatic GSD Ia. Liver-specific G6pc knockout (L-G6pc-/-) mice were treated with AAV2/8-shChREBP to normalize hepatic ChREBP activity to levels observed in wildtype (L-G6pc+/+) mice receiving AAV8-shScramble. Hepatic ChREBP knockdown markedly increased liver weight and hepatocyte size in L-G6pc-/- mice. This was associated with hepatic accumulation of G6P, glycogen and lipids, while the expression of glycolytic and lipogenic genes was reduced. Enzyme activities, flux measurements, hepatic metabolite analysis and VLDL-TG secretion assays revealed that hepatic ChREBP knockdown reduced downstream glycolysis and de novo lipogenesis, but also strongly suppressed hepatic VLDL lipidation hence promoting the storage of ‘old fat’. Interestingly, enhanced VLDL-TG secretion in shScramble-treated L-G6pc-/- mice associated with a ChREBP-dependent induction of the VLDL lipidation proteins MTTP and TM6SF2, the latter being confirmed by ChIP-qPCR. Conclusion: Attenuation of hepatic ChREBP induction in GSD Ia liver aggravates hepatomegaly due to further accumulation of glycogen and lipids as a result of reduced glycolysis and suppressed VLDL-TG secretion. TM6SF2, critical for VLDL formation, was identified as a novel ChREBP target in mouse liver. Altogether, our data show that enhanced ChREBP activity limits NAFLD development in GSD Ia by balancing hepatic TG production and -secretion.
2020 07 03 Boekje 1.0.indd 702020 07 03 Boekje 1.0.indd 70 24/07/2020 21:1324/07/2020 21:13

Hepatic ChREBP activation limits NAFLD development in Glycogen Storage Disease type Ia
71
3
IntroductionGlycogen storage disease type Ia and Ib (GSD Ia/Ib) are rare, monogenetic disorders of carbohydrate metabolism. GSD Ia is caused by mutations in the glucose-6-phoshatase (G6PC) gene, while the glucose-6-phosphate (G6P) transporter (SLC37A4) gene is affected in GSD Ib (1). Impaired G6PC activity in hepatocytes, kidney cells and enterocytes of GSD Ia patients reduces endogenous glucose production, primarily contributing to fasting hypoglycemia. The intracellular accumulation of G6P, in turn, promotes glycogen synthesis, glycolysis and de novo lipogenesis. As a consequence, GSD Ia patients suffer from severe hepatomegaly and non-alcoholic fatty liver disease (NAFLD) and, strikingly, more than two-thirds of the patients develop liver tumors as young adults (2).
Carbohydrate Response Element Binding Protein (ChREBP, also known as MONDOB, MLXIPL or WBSCR14) is the main glucose-sensitive transcription factor in hepatocytes (3-5). ChREBP is activated in response to increased intracellular glucose metabolism, partly via glucose-dependent O-linked glycosylation and/or acetylation (6-8). In addition, nuclear localization of ChREBP is regulated by phosphorylation (6, 9) and its interaction with 14-3-3 proteins and importins (10, 11). The glucose-mediated activation of the canonical ChREBP isoform (ChREBP-α) induces the expression of ChREBP-β, a transcriptionally highly active isoform, hence generating a potent feed forward loop (12). In hepatocytes, ChREBP targets genes encoding enzymes involved in glycolysis, the pentose phosphate pathway (PPP), de novo lipogenesis as well as very-low density lipoprotein (VLDL) assembly (3, 4, 13). Thus, hepatic ChREBP allows for proper accommodation of glucose availability to its intracellular fates in metabolism, storage and redistribution in the form of lipids.
Previous work from our groups and others has shown that G6P accumulation in the liver of GSD Ia and GSD Ib mouse models strongly promotes hepatic ChREBP activity (14-16). Moreover, we have shown that the induction of glycolytic and lipogenic genes in acute GSD Ib critically depends on hepatic ChREBP expression (14). It has been reported that hepatic ChREBP is also activated in type 2 diabetic mice and that hepatic ChREBP knockdown in these animals protects against NAFLD (17, 18). In light of the association between hepatic ChREBP activity and NAFLD and the link between NAFLD and advanced liver disease risk, in the current study we evaluated the metabolic consequences of enhanced hepatic ChREBP activity in GSD Ia. For this purpose, we aimed to normalize hepatic ChREBP activity in a hepatocyte-specific model for GSD Ia. Surprisingly, our data show that attenuation of hepatic ChREBP induction in GSD Ia liver aggravated hepatomegaly as a result of reduced downstream glycolysis and lower VLDL-TG secretion, indicating that enhanced ChREBP activity limits hepatomegaly and NAFLD development in GSD Ia.
2020 07 03 Boekje 1.0.indd 712020 07 03 Boekje 1.0.indd 71 24/07/2020 21:1324/07/2020 21:13

Chapter 3
72
Experimental proceduresAnimalsMale adult (13-18 weeks) G6pc floxed Alb-Cre negative (B6.G6pclox/lox) and G6pc floxed Alb-Cre positive (B6.G6pclox/lox.SAcreERT2/w mice) (19) on a C57BL/6J background were housed in a light- and temperature-controlled facility (lights on 7AM-7PM) and fed a standard laboratory chow diet (RMH-B, Abdiets, Woerden). They were infected with shRNAs directed against ChREBP (AAV-ChREBP) or a scrambled control (AAV-Scramble) AAV-shScramble viruses (1 x 10¹² particles per mouse) by intravenous injection into the retro-orbital plexus under isoflurane anesthesia. For a detailed description of the production, purification and titration of the AAV2/8 viruses, see the Supplementary Material. Twelve days after AAV-shRNA administration, all mice received i.p. injections of tamoxifen for 5 consecutive days to excise G6pc exon 3 (19), hence generating liver-specific G6pc-deficient mice (L-G6pc-/-) and wildtype littermates (L-G6pc+/+). Nonfasted animals were either sacrificed for tissue collection, or subjected to VLDL-TG secretion experiments, starting at 8AM 10 days after the last tamoxifen injection. Animals were sacrificed by cardiac puncture under isoflurane anesthesia and tissues were rapidly excised and stored.
Ex vivo lipolysisEpididymal white adipose tissue was removed and stored on ice in Krebs buffer (12 mM HEPES, 4.9 mM KCl, 121 mM NaCl, 1.2 mM MgSO4, 0.33 mM CaCl2, 0.1% glucose and 3.5% fatty acid free BSA, pH 7.4) until further processing. Tissue samples were incubated in Krebs buffer (10% w/v) at 37°C. After 1, 2, 3 and 4 hours of incubation, independent samples were centrifuged at maximum speed, and supernatants were collected for glycerol analysis using a commercially available kit (Cayman Chemical, Ann Arbor, MI, USA).
Histological and pathological analysis of the liverFor microscopic examination, tissues were fixed in 4% (wt/v) formaldehyde in PBS, embedded in paraffin, sectioned at 4 μm, and stained with Hematoxilin&Eosin and Periodic Acid Schiff (PAS). Liver steatosis was visualized by Oil red O staining of liver cryosections. Photomicrographs of five areas per section of liver were made at 200x magnification using the Olympus DP26 camera with Olympus cellSensTM Standard software (v1.18). To perform digital image analysis, an imageJ (v1.50, National Institutes of Health, Bethesda, MD) macro script was created to assess the extent of lipid staining (total area and lipid droplet size). Hepatic steatosis was assessed blindly and graded in H&E-stained liver sections using an adapted version of the NAFLD activity scoring (NAS) system developed by Kleiner et al (20).
Biochemical assaysBlood glucose was measured using a One Touch Ultra glucose meter (Life-Scan Inc.).
2020 07 03 Boekje 1.0.indd 722020 07 03 Boekje 1.0.indd 72 24/07/2020 21:1324/07/2020 21:13

Hepatic ChREBP activation limits NAFLD development in Glycogen Storage Disease type Ia
73
3
Plasma insulin, glucagon, lactate, ketone bodies, free fatty acids, triglycerides and cholesterol were analyzed using commercially available ELISA kits (Chrystal Chem, Alpco Diagnostics, Instruchemie, Wako, DiaSys and Roche respectively). Hepatic glycogen and G6P content was determined as previously described (14).
Hepatic lipid, acylcarnitine and metabolome analysisThe procedures for quantification of lipid, acylcarnitine and metabolome profiles in liver homogenates are described in the Supplementary Material.
Glycolytic enzyme capacities (Vmax)The hepatic activities of glyceraldehyde 3-phosphate dehydrogenase (GAPDH), phosphoglucose isomerase (GPI), aldolases (ALDO; in liver mainly ALDO A&B), enolases (ENO; in liver mainly ENO1&3) and pyruvate kinase (LPK) were determined ex vivo in liver homogenates as described in the Supplementary Material.
Quantification of acetyl-CoA precursor pool enrichments, de novo lipogenesis, fatty acid elongation and cholesterol synthesis These procedures are described in the Supplementary Material.
Gene expression analysisThe procedures for quantification of hepatic RNA expression levels are described in the Supplementary Material.
Targeted proteomicsThe procedures for targeted proteomics are described in the Supplementary Material.
In silico predictions These procedures are described in the Supplementary Material.
ChIP-qPCR on the mouse Tm6sf2 promoterIn order to acutely induce hepatic GSD Ib, male C57BL/6J mice were equipped with a permanent catheter in the right jugular vein for infusions and were allowed a recovery period of at least 4 days. Animals were kept in experimental cages during the experiment and the preceding fasting period, allowing frequent collection of tail blood samples. After overnight fasting, mice were infused for 6 hours with S4048 (a generous gift from Sanofi-Aventis, Germany, 5.5 mg/mL PBS with 6% DMSO at 0.135 mL/h) or vehicle. After 6 hours, mice were sacrificed by cardiac puncture. For fasting/feeding studies, male C57BL/6J mice were sacrificed by cardiac puncture (8:00 AM) in either a fed or a 9-hour fasted (11:00 PM - 8:00 AM) state. Livers from S4048 or vehicle-treated as well as fasted/fed mice were harvested for ChIP-qPCR analysis which was performed as described in the Supplementary Material.
2020 07 03 Boekje 1.0.indd 732020 07 03 Boekje 1.0.indd 73 24/07/2020 21:1324/07/2020 21:13

Chapter 3
74
VLDL-TG secretion rates and nascent VLDL analysisMice were injected intraperitoneally with Poloxamer 407 (1 g/kg body weight). Blood samples (50 mL) were drawn under isoflurane anesthesia by retro-orbital bleeding into heparinized tubes at 0, 30, 60, 120, and 240 minutes after injection. After sampling the bleeding was immediately stopped upon slight compression with sterile gauze to minimize additional blood loss. Plasma was isolated by centrifugation after which TG levels and TG secretion rates were determined as described (4). For isolation and analysis of nascent VLDL, see Supplementary Material.
Cell reporter assaysThe cell reporter assays are described in the Supplementary Material.
StatisticsData in figures is presented as box and-whisker plots indicating the sample minimum, lower quartile, median, upper quartile, and sample maximum, or in some cases data is presented as mean ± SEM. Data in heatmaps represent z-score normalized values. Statistical analysis was performed using BrightStat software. Differences between two or multiple groups were tested by Mann-Whitney U-test or Kruskal-Wallis H-test followed by post-hoc Conover pairwise comparisons, respectively. p-values <0.001 (*** or ^^^), 0.001 to 0.01 (**, ^^ or ##), and 0.01 to 0.05 (*, ^ or #) were considered significant.
ResultsHepatic ChREBP knockdown reduces downstream glycolysis and increases hepatic G6P and glycogen storage in L-G6pc-/- miceTo evaluate the consequences of normalized hepatic ChREBP activity in L-G6pc-/- mice, we administered a short hairpin (sh)RNA against ChREBPα/β or a scrambled shRNA to L-G6pc+/+ and L-G6pc-/- mice by means of adeno-associated virus delivery. Hepatic Chrebpα mRNA levels remained unaffected upon shRNA administration in L-G6pc+/+ mice, but were reduced by ~40% in L-G6pc-/- mice (Fig. 1A). The hepatic mRNA expression levels of Chrebpβ, the key marker of ChREBP activity (12, 21), were similarly (~40%) reduced in in L-G6pc+/+ and L-G6pc-/- mice, hence normalizing its expression in L-G6pc-/- mice to the levels observed in L-G6pc+/+ controls receiving scrambled shRNA (Fig. 1A). Hepatic G6PC protein abundance was strongly reduced in L-G6pc-/- mice receiving either of the two shRNAs (Fig. 1A). ChREBPα/β protein abundance was reduced by about 50% in shChREBP as compared to scramble shRNA-treated mice of either genotype (Fig. 1A). Consistent with reduced hepatic ChREBP activity, the mRNA expression (Fig. 1B; upper panel) and enzymatic activities (Fig. 1C) of the established glycolytic ChREBP targets (3-5, 22) G6P isomerase (Gpi), aldolase B (Aldob) and pyruvate kinase (Pklr), were normalized by shChREBP in L-G6pc-/- mice. These reductions in glycolytic enzyme activities were paralleled by
2020 07 03 Boekje 1.0.indd 742020 07 03 Boekje 1.0.indd 74 24/07/2020 21:1324/07/2020 21:13

Hepatic ChREBP activation limits NAFLD development in Glycogen Storage Disease type Ia
75
3
a more pronounced accumulation of the glycolytic intermediates G6P, fructose-6/1-phosphate (F6P/F1P) and fructose-1,6-bisphosphate (F1,6bisP) in the liver of shChREBP versus shScramble-treated L-G6pc-/- mice, while there was no significant accumulation of hepatic triose phosphates (DHAP/GAP), phosphoenolpyruvate (PEP), pyruvate or lactate between these groups (Fig. 1D; upper panel). On the contrary, hepatic ChREBP knockdown did further increase hepatic 6-phosphogluconolactone, gluconate-6P, xylulose-5-phosphate and sedoheptulose-7P content in L-G6pc-/- mice, showing that shChREBP also resulted in more pronounced accumulation of oxidative PPP intermediates as compared to shScramble treated mice while ribose-5-phosphate/ribulose-5-phosphate, ribose-1,5-disphosphate and 2-dehydrogluconate-6-phosphate were not affected (Fig. 1D; lower panel). Moreover, we observed that ChREBP knockdown increased relative and total hepatic glycogen contents in L-G6pc-/- versus L-G6pc+/+ mice (Fig. 1E). Body weight and food intake were similar in all groups (Table 1). Liver weight was significantly increased in shChREBP- versus shScramble-treated L-G6pc+/+ and L-G6pc-/- mice, although hepatic water content was reduced upon ChREBP knockdown in both genotypes and hepatic protein content was specifically reduced in shChREBP-treated L-G6pc-/- mice as compared to shScramble-treated mice with the same genotype (Table 1). Plasma ALT and AST levels were elevated in shScramble-treated L-G6pc-/- as compared to L-G6pc+/+ mice and further increased upon hepatic ChREBP knockdown in L-G6pc-/- mice (Table 1). Blood glucose and plasma insulin concentrations were reduced in shChREBP treated L-G6pc-/- mice, while plasma lactate concentrations were not affected by hepatic G6pc deficiency and/or ChREBP knockdown (Table 1).
Hepatic ChREBP knockdown promotes hepatic lipid storage but reduces fractional de novo lipogenesis in L-G6pc-/- miceHematoxylin and eosin (H&E) staining of the livers showed that hepatic ChREBP knockdown resulted in marked hepatocyte vacuolation in both L-G6pc-/- and L-G6pc+/+ mice (Fig. 2A). Besides glycogen accumulation, cytoplasmic vacuolation can result from excess lipid storage. Oil-red-O (ORO) staining for neutral lipids indeed showed increased deposition of neutral lipids in shChREBP versus shScramble-treated groups of both genotypes (Fig. 2A). Quantification of the lipid droplet size showed that the droplets in shChREBP-treated groups were enlarged (Fig. 2A). Accordingly, the NAFLD activity scores (NAS; (20)) indicated that hepatic ChREBP knockdown induced fatty liver disease in L-G6pc+/+ mice, while it aggravated the existing fatty liver in L-G6pc-/- mice (Fig. 2B). Biochemical analysis of the hepatic lipids revealed that hepatic ChREBP knockdown resulted in substantial increases in the contents and total amounts of hepatic TGs and cholesteryl esters (CEs) (Fig. 2B), while total hepatic free cholesterol (FC) and phospholipid content were similarly increased in shScramble and shChREBP-treated L-G6pc-/- mice as compared to their wildtype controls (Fig. S1A). As expected, hepatic ChREBP
2020 07 03 Boekje 1.0.indd 752020 07 03 Boekje 1.0.indd 75 24/07/2020 21:1324/07/2020 21:13

Chapter 3
76
2020 07 03 Boekje 1.0.indd 762020 07 03 Boekje 1.0.indd 76 24/07/2020 21:1324/07/2020 21:13

Hepatic ChREBP activation limits NAFLD development in Glycogen Storage Disease type Ia
77
3
Figure 1: Hepatic ChREBP knockdown reduces downstream enzymes of glycolysis and increases hepatic G6P and glycogen storage in L-G6pc-/- mice. (A) Box and-whisker plots presenting relative hepatic mRNA levels of Chrebpα and Chrebpβ and relative protein abundance of G6PC and ChREBP in L-G6pc+/+ and L-G6pc-/- treated with either shChREBP or scrambled shRNA (shSCR) (n = 7-9). (B) Heatmaps presenting z-core normalized mRNA expression levels of hepatic glycolysis and pentose phosphate pathway (PPP) enzymes in L-G6pc+/+ and L-G6pc-/- mice treated with shChREBP or shSCR (n = 8-9). (C) Heatmaps presenting z-score normalized hepatic activities of glycolytic enzymes in L-G6pc+/+ and L-G6pc-/- mice treated with shChREBP or shSCR (n = 6). (D) Heatmaps presenting z-score normalized hepatic levels of glycolytic and PPP intermediates in L-G6pc+/+ and L-G6pc-/- mice treated with shChREBP or shSCR (n = 7-9). (E) Box and-whisker plots presenting relative and absolute hepatic glycogen content in L-G6pc+/+ and L-G6pc-/- mice treated with shChREBP or shSCR (n = 7-9). *p < 0.05, **p <0.01, ***p < 0.001 indicates significance compared to scrambled shRNA. ^p < 0.05, ^^^p <0.001 indicates significance compared to L-G6pc+/+ mice. Table S2 contains raw values and statistics for data presented in heatmaps.
Table 1. General characteristics and plasma metabolic parameters in L-G6pc+/+ and L-G6pc-/- mice treated with either shChREBP or scrambled shRNA (shSCR). Data represent median values (range). *p < 0.05, **p <0.01, ***p < 0.001 indicates significance compared to scrambled shRNA. ^p < 0.05, ^^p <0.01, ^^^p <0.001 indicates significance compared to wildtype littermates.
L-G6pc+/+ shSCR
L-G6pc+/+ shChREBP
L-G6pc-/- shSCR
L-G6pc-/- shChREBP
Body weight (g) 30.0 (28.7 - 35.2) 29.6 (28.5 - 31.4) 30.9 (28.2 - 34.0) 31.3 (28.5 - 34.9) Food intake (g/day) 3.8 (2.8 - 4.8) 4.3 (3.1 - 5.2) 4.3 (3.2 - 6.0) 4.6 (3.7 - 5.6) Liver weight (g) 1.6 (1.4 - 2.0) 1.7 (1.6 - 1.9)*** 2.4 (1.5 - 2.5)^^^ 2.9 (2.7 - 3.5)^^^*** Hepatic protein (mg/g) 138 (113 - 172) 136 (130 - 142) 127 (120 - 141) 112.9 (105.5 -
125.7)^^^*** Hepatic water (%) 68.7 (67.3 - 71.6) 67.5 (65.8 - 69.8)* 67.2 (65.4 - 69.1)^^^ 64.9 (62.5 - 65.2)^***
Blood glucose (mmol/L) 9.2 (7.6 - 10.0) 9.4 (8.1 - 10.5) 8.4 (5.2 - 10.7) 6.0 (5.6 - 8.7)** Plasma insulin (ng/mL) 0.4 (0.2 - 1.1) 0.3 (0.2 - 0.5) 0.4 (0.2 - 1.1) 0.2 (0.1 - 0.3)* Plasma lactate (mmol/L) 4.4 (4.2 - 5.2) 4.8 (3.3 - 5.6) 6.0 (4.6 - 7.2)^^^ 6.2 (5.3 - 7.5)^^^ Plasma ketones (mmol/L) 0.2 (0.1 - 0.2) 0.1 (0.1 - 0.2) 0.2 (0.1 - 0.3) 0.2 (0.1 - 0.3) Plasma NEFA (µmol/L) 150 (106 - 168) 145 (101 - 190) 247 (141 - 457)^^^ 306 (205 - 359)^^^
Plasma TG (mmol/L) 1.2 (1.0 - 1.5) 0.7 (0.5 - 0.9)** 4.3 (1.7 - 5.3)^^^ 1.9 (0.2 - 3.3)^^^*** Plasma ALT (U/L) 6 (1 - 10) 3 (1 - 20) 14 (7 - 25)^^ 58 (20 - 161)^^^** Plasma AST (U/L) 25 (19 - 34) 24.(15 - 37) 29 (23 - 48) 46 (28 - 89)^^^*
knockdown reduced the mRNA expression of hepatic fatty acid synthesis genes as well as that of acylCoA:diacylglycerol acetyltransferase 1 and 2 (Dgat1/2) (Fig. 2C) hence normalizing their expression levels in L-G6pc-/- mice to values observed in shScramble-treated L-G6pc+/+ mice. On the other hand, neither hepatic G6PC deficiency nor Chrebp knockdown consistently altered the mRNA levels of the other TG synthesis enzymes (Fig. 2C). 13C-labeled acetate was administered to quantify de novo lipogenesis and fatty acid elongation (23). Fractional acetyl-CoA pool enrichments, determined from 13C-incorporation in hepatic palmitate (C16:0) and palmitoleate (C16:1), were reduced in both groups of L-G6pc-/- mice as well as in shChREBP-treated L-G6pc+/+ mice (Fig. 2D), indicating changes in acetyl-CoA pool turnover under these conditions. Moreover, subsequent quantification of lipogenic fluxes revealed that hepatic ChREBP knockdown reduced fractional de novo
2020 07 03 Boekje 1.0.indd 772020 07 03 Boekje 1.0.indd 77 24/07/2020 21:1324/07/2020 21:13
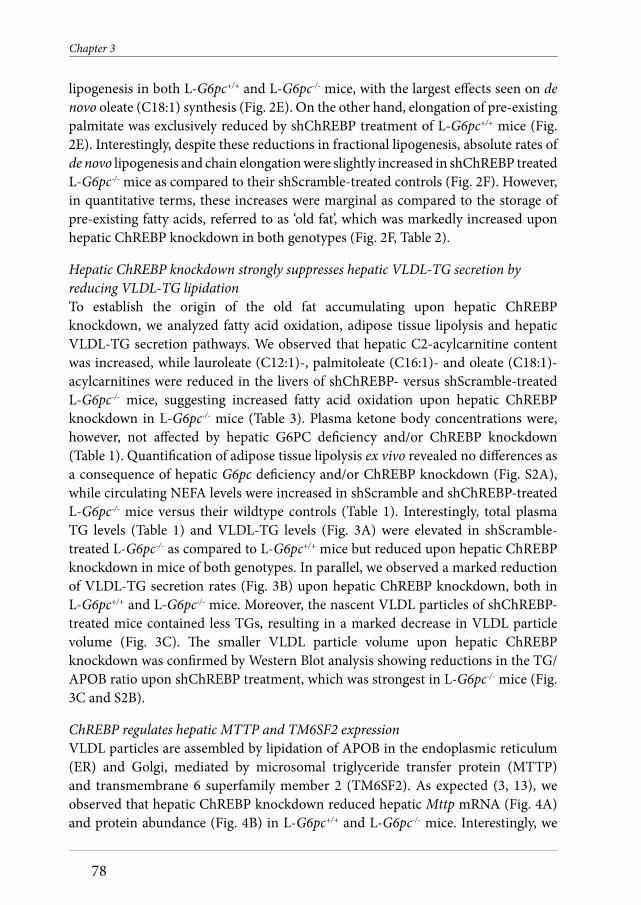
Chapter 3
78
lipogenesis in both L-G6pc+/+ and L-G6pc-/- mice, with the largest effects seen on de novo oleate (C18:1) synthesis (Fig. 2E). On the other hand, elongation of pre-existing palmitate was exclusively reduced by shChREBP treatment of L-G6pc+/+ mice (Fig. 2E). Interestingly, despite these reductions in fractional lipogenesis, absolute rates of de novo lipogenesis and chain elongation were slightly increased in shChREBP treated L-G6pc-/- mice as compared to their shScramble-treated controls (Fig. 2F). However, in quantitative terms, these increases were marginal as compared to the storage of pre-existing fatty acids, referred to as ‘old fat’, which was markedly increased upon hepatic ChREBP knockdown in both genotypes (Fig. 2F, Table 2).
Hepatic ChREBP knockdown strongly suppresses hepatic VLDL-TG secretion by reducing VLDL-TG lipidationTo establish the origin of the old fat accumulating upon hepatic ChREBP knockdown, we analyzed fatty acid oxidation, adipose tissue lipolysis and hepatic VLDL-TG secretion pathways. We observed that hepatic C2-acylcarnitine content was increased, while lauroleate (C12:1)-, palmitoleate (C16:1)- and oleate (C18:1)-acylcarnitines were reduced in the livers of shChREBP- versus shScramble-treated L-G6pc-/- mice, suggesting increased fatty acid oxidation upon hepatic ChREBP knockdown in L-G6pc-/- mice (Table 3). Plasma ketone body concentrations were, however, not affected by hepatic G6PC deficiency and/or ChREBP knockdown (Table 1). Quantification of adipose tissue lipolysis ex vivo revealed no differences as a consequence of hepatic G6pc deficiency and/or ChREBP knockdown (Fig. S2A), while circulating NEFA levels were increased in shScramble and shChREBP-treated L-G6pc-/- mice versus their wildtype controls (Table 1). Interestingly, total plasma TG levels (Table 1) and VLDL-TG levels (Fig. 3A) were elevated in shScramble-treated L-G6pc-/- as compared to L-G6pc+/+ mice but reduced upon hepatic ChREBP knockdown in mice of both genotypes. In parallel, we observed a marked reduction of VLDL-TG secretion rates (Fig. 3B) upon hepatic ChREBP knockdown, both in L-G6pc+/+ and L-G6pc-/- mice. Moreover, the nascent VLDL particles of shChREBP-treated mice contained less TGs, resulting in a marked decrease in VLDL particle volume (Fig. 3C). The smaller VLDL particle volume upon hepatic ChREBP knockdown was confirmed by Western Blot analysis showing reductions in the TG/APOB ratio upon shChREBP treatment, which was strongest in L-G6pc-/- mice (Fig. 3C and S2B).
ChREBP regulates hepatic MTTP and TM6SF2 expression VLDL particles are assembled by lipidation of APOB in the endoplasmic reticulum (ER) and Golgi, mediated by microsomal triglyceride transfer protein (MTTP) and transmembrane 6 superfamily member 2 (TM6SF2). As expected (3, 13), we observed that hepatic ChREBP knockdown reduced hepatic Mttp mRNA (Fig. 4A) and protein abundance (Fig. 4B) in L-G6pc+/+ and L-G6pc-/- mice. Interestingly, we
2020 07 03 Boekje 1.0.indd 782020 07 03 Boekje 1.0.indd 78 24/07/2020 21:1324/07/2020 21:13

Hepatic ChREBP activation limits NAFLD development in Glycogen Storage Disease type Ia
79
3
Figure 2 continues at the next page
2020 07 03 Boekje 1.0.indd 792020 07 03 Boekje 1.0.indd 79 24/07/2020 21:1324/07/2020 21:13

Chapter 3
80
Figure 2: Hepatic ChREBP knockdown promotes hepatic lipid storage but reduces fractional de novo lipogenesis in L-G6pc-/- mice. (A) Representative photos of hematoxylin and eosin (H&E) and oil-red-o (ORO) stainings in L-G6pc+/+ and L-G6pc-/- mice treated with either shChREBP or scrambled shRNA (shSCR). (B) Box and-whisker plots presenting hepatic NAFLD Activity Scores (NAS), hepatic lipid droplet sizes and relative and absolute hepatic triglyceride (TG) and cholesteryl ester (CE) contents in L-G6pc+/+ and L-G6pc-/- mice treated with shChREBP or shSCR (n = 6-9). (C) Heatmaps presenting z-score normalized mRNA expression levels of hepatic fatty acid synthesis and TG synthesis enzymes in L-G6pc+/+ and L-G6pc-/- mice treated with shChREBP or shSCR (n = 8-9). (D) Box and-whisker plots presenting fractional acetyl-CoA pool 13C-enrichments in L-G6pc+/+ and L-G6pc-/- mice treated with shChREBP or shSCR (n = 7-9). (E) Box and-whisker plots presenting fractional hepatic de novo lipogenesis and fatty acid elongation of pre-existing palmitate in L-G6pc+/+ and L-G6pc-/- mice treated with shChREBP or shSCR (n = 7-9). (F) Box and-whisker plots presenting absolute fatty acid synthesis from de novo lipogenesis, chain elongation and the content of old fat in L-G6pc+/+ and L-G6pc-/- mice treated with shChREBP or shSCR (n = 7-9). *p < 0.05, **p <0.01, ***p < 0.001 indicates significance compared to scrambled shRNA. ^p < 0.05, ^^p < 0.01, ^^^p <0.001 indicates significance compared to L-G6pc+/+ mice. Table S2 contains raw values and statistics for data presented in heatmaps.
2020 07 03 Boekje 1.0.indd 802020 07 03 Boekje 1.0.indd 80 24/07/2020 21:1324/07/2020 21:13

Hepatic ChREBP activation limits NAFLD development in Glycogen Storage Disease type Ia
81
3
Figure 3: Hepatic ChREBP knockdown strongly suppresses hepatic VLDL-TG secretion by reducing VLDL-TG lipidation. (A) Plasma lipoprotein profi les in L-G6pc+/+ and L-G6pc-/- mice treated with either shChREBP or scrambled shRNA (shSCR). (B) Plasma TG concentrations after P407 injection and box and-whisker plots presenting VLDL-TG secretion rates in L-G6pc+/+ and L-G6pc-/-
mice treated with shChREBP or shSCR (n = 4-7). (C) Box and-whisker plots presenting VLDL particle diameter, VLDL particle volume and ratio of TG/apoB48 in L-G6pc+/+ and L-G6pc-/- mice treated with shChREBP or shSCR (n = 3-8). ***p < 0.001 indicates signifi cance compared to scrambled shRNA. ^p < 0.05, ^^p < 0.01 indicates signifi cance compared to L-G6pc+/+ mice.
observed that also Tm6sf2 mRNA levels and -protein abundance were induced in shScramble treated L-G6pc-/- mice as compared to wildtype controls, and normalized in shChREBP-treated L-G6pc-/- mice (Fig. 4A and 4B). We confi rmed that Tm6sf2mRNA levels were also ChREBP-dependently induced in mice treated with the G6P transporter SLC37A4 inhibitor S4048 (Fig. 4C), an acute model for hepatic GSD Ib (14). Publicly available liver ChREBP ChIP-seq data (4) indicated potential regulation of Tm6sf2 by ChREBP, and computational analysis revealed four putative ChREBP binding sites in the mouse Tm6sf2 promoter (Fig. 4D). ChIP-qPCR analysis showed specifi c recruitment of ChREBP to these binding sites upon S4048 treatment, indicating that hepatic ChREBP directly controls murine Tm6sf2 transcription (Fig. 4D). Moreover, analysis of publicly available gene expression data (GSE61576, (24)) revealed that hepatic ChREBP overexpression induced Tm6sf2 expression in mouse liver (Fig. S3A). Cell reporter assays indicated that ChREBPa/MLX and ChREBPb/MLX further enhanced the transactivation of the mouse Tm6sf2 gene reporter by hepatocyte nuclear factor 4 alpha (HNF-4a), while they did not transactivate the reporter in the absence of HNF-4a (Fig. 4E). Finally, ChIP-qPCR analysis of mouse liver indicated that both ChREBP and HNF-4a are associated with the Tm6sf2promoter, and that these interactions are signifi cantly higher in fed versus fasted mice (Fig. 4F).
2020 07 03 Boekje 1.0.indd 812020 07 03 Boekje 1.0.indd 81 24/07/2020 21:1324/07/2020 21:13

Chapter 3
82
Figure 4: Hepatic ChREBP regulates hepatic Mttp and Tm6sf2 expression. (A) Box and-whisker plots presenting hepatic relative levels of VLDL assembly genes in L-G6pc+/+ and L-G6pc-/- mice treated with either shChREBP or scrambled shRNA (shSCR; n = 7-9). (B) Box and-whisker plots presenting hepatic relative abundance of VLDL assembly proteins in L-G6pc+/+ and L-G6pc-/- mice treated with shChREBP or shSCR (n = 6-9). (C) Box and-whisker plots presenting hepatic relative mRNA levels of Tm6sf2 in L-G6pc+/+ and S4048 treated mice treated with shChREBP or shSCR (n = 6-7). (D) Schematic presentation of putative ChREBP (#1-4, dark grey) and HNF-4a (DR-1, light grey) response elements within the murine Tm6sf2 promoter. Box and-whisker plots presenting in vivo ChIP analysis of the putative ChREBP response elements in the hepatic Tm6sf2 promoter in mice treated with shChREBP or shSCR and infused with S4048 or vehicle (n = 5-7). (E) Box and-whisker plots presenting fi refl y-to-renilla luciferase activities for the murine Tm6sf2 gene reporter after transfection with HNF-4α, MLX, ChREBPα and ChREBPβ plasmids (n = 3-4 independent experiments, each experiment performed in triplicate). (F) Box and-whisker plots presenting in vivo ChIP analysis of the putative ChREBP response elements in the hepatic Tm6sf2 promoter in overnight fasted or fed C57BL/6J mice (n = 5). *p < 0.05, **p <0.01, ***p < 0.001 indicates signifi cance compared to shSCR for panels A-D, compared to pcDNA3.1 for panel E, and compared to fasted for panel F. ^p < 0.05, ^^p < 0.01, ^^^p <0.001 indicates signifi cance compared to L-G6pc+/+ mice for panels A-D, compared to control for panel E, and compared to ChREBP for panel F. #p < 0.05, ##p < 0.01 indicates signifi cance compared to pcDNA3.1+HNF-4α for panel E, and compared to fasted for panel F.
2020 07 03 Boekje 1.0.indd 822020 07 03 Boekje 1.0.indd 82 24/07/2020 21:1324/07/2020 21:13

Hepatic ChREBP activation limits NAFLD development in Glycogen Storage Disease type Ia
83
3
Table 2. Hepatic fatty acid profile in L-G6pc+/+ and L-G6pc-/- mice treated with either shChREBP or scrambled shRNA (shSCR). Data represent median values (range). *p < 0.05, **p <0.01, ***p < 0.001 indicates significance compared to scrambled shRNA. ^p < 0.05, ^^p <0.01, ^^^p <0.001 indicates significance compared to wildtype littermates.
nmol/g liver
L-G6pc+/+ shSCR
L-G6pc+/+ shChREBP
L-G6pc-/- shSCR
L-G6pc-/- shChREBP
C14:0 0.4 (0.2 - 0.5) 0.7 (0.4 - 0.8)*** 0.6 (0.5 - 0.7)^^^ 1.3 (1.0 - 1.4)^^^*** C16:1 2.5 (1.5 - 4.7) 4.0 (1.5 - 5.7) 2.8 (2.3 - 3.6) 6.7 (4.9 - 8.1)^^^*** C16:0 23.3 (15.4 - 29.8) 34.1 (23.8 - 38.0)*** 25.8 (19.4 - 29.2) 47.0 (36.4 - 53.0) ^^^*** C18:3ω6 0.1 (0.1 - 0.2) 0.3 (0.2 - 0.4)*** 0.2 (0.1 - 0.2) 0.4 (0.3 - 1.0)*** C18:2ω6 14.7 (10.1 - 16.1) 25.3 (15.3 - 29.8)*** 16.4 (12.5 - 18.5) 30.7 (21.6 - 38.3)*** C18:3ω3 0.4 (0.3 - 0.5) 0.9 (0.5 - 1.2)*** 0.5 (0.3 - 0.7) 1.3 (0.9 - 1.6)^^*** C18:1ω9 24.7 (11.6 - 33.8) 45.2 (21.8 - 49.4)*** 46.4 (35.9 - 63.0)^^^ 89.8 (64.2 - 111.0)^^^*** C18:1ω7 4.1 (2.2 - 6.6) 5.5 (2.8 - 7.2) 5.7 (4.6 - 6.2)^ 9.3 (7.8 - 11.6)^^^*** C18:0 10.2 (6.5 - 12.5) 13.1 (9.5 - 13.9)* 13.7 (12.2 - 15.0)^^^ 14.6 (11.8 - 16.4)^^^ C20:4ω6 9.8 (5.7 - 10.3) 10.6 (8.8 - 12.0) 9.3 (8.4 - 11.1) 9.2 (7.9 - 10.7) C20:5ω3 0.3 (0.2 - 0.3) 0.4 (0.3 - 0.5)* 0.2 (0.2 - 0.4) 0.4 (0.3 - 0.6)*** C20:3ω9 0.3 (0.1 - 0.5) 0.4 (0.2 - 0.6) 0.9 (0.5 -1.1)^^^ 0.9 (0.7 - 1.1)^^^ C20:3ω6 1.1 (0.6 - 1.5) 1.4 (1.0 - 1.7) 1.6 (1.3 - 2.0)^^^ 2.2 (1.7 - 2.5)^^^** C20:2ω6 0.2 (0.2 - 0.3) 0.5 (0.3 - 0.5)*** 0.3 (0.2 - 0.5)^^ 0.7 (0.4 - 0.9)^^*** C20:1ω9 0.4 (0.2 - 0.6) 0.9 (0.5 - 1.2)*** 0.9 (0.7 - 1.5)^^^ 1.9 (1.4 - 2.7)^^^*** C20:0 0.1 (0.1 - 0.2) 0.2 (0.1 - 0.4)*** 0.1 (0.1 - 0.1) 0.2 90.1 - 0.4)*** C22:5ω6 0.2 (0.1 - 0.2) 0.4 (0.2 - 0.5)*** 0.4 (0.2 - 0.8)^^^ 0.6 (0.3 - 0.8)^* C22:6ω3 4.3 (2.3 - 5.1) 6.2 (3.9 - 7.0)*** 5.3 (3.8 - 5.9) 5.9 (4.3 - 7.6) C22:4ω6 0.2 (0.1 - 0.3) 0.5 (0.3 - 0.6)*** 0.3 (0.2 - 0.5)^ 0.7 (0.5 - 0.9)^^^*** C22:5ω3 0.3 (0.1 - 0.4) 0.6 (0.4 - 1.0)*** 0.3 (0.2 - 0.4) 1.1 (0.7 - 1.3)^^^*** C22:0 0.3 (0.2 - 0.3) 0.3 (0.2 - 0.4) 0.3 (0.2 - 0.3) 0.3 (0.2 - 0.6) C24:1ω9 0.4 (0.2 - 0.4) 0.4 (0.4 - 0.5)** 0.4 (0.4 - 0.5)^^ 0.4 (0.3 - 0.5)^** C24:0 0.3 (0.2 - 0.3) 0.3 (0.3 - 0.4)** 0.2 (0.2 - 0.3)^ 0.3 (0.3 - 0.3)^^**
Table 3. Hepatic acylcarnitine profile in L-G6pc+/+ and L-G6pc-/- mice treated with either shChREBP or scrambled shRNA (shSCR). Data represent median values (range). *p < 0.05, **p <0.01 indicates significance compared to scrambled shRNA. ^p < 0.05, ^^p <0.01, ^^^p <0.001 indicates significance compared to wildtype littermates.
µmol/g liver L-G6pc+/+ shSCR
L-G6pc+/+ shChREBP
L-G6pc-/- shSCR
L-G6pc-/- shChREBP
Free carnitine 209 (163 - 324) 241 (172 - 289) 245 (175 - 331) 255 (184 - 289) C2 35 (12 - 79) 43 (24 - 79) 36 (7 -74) 91 (29 - 122)^* C3 1.1 (0.7 - 1.9) 1.7 (0.5 - 3.3) 0.5 (0.2 - 0.8)^^^ 0.4 (0.0 - 0.9)^^^ C4 0.07 (0.07 -0.33) 0.07 (0.00 - 0.13) 0.37 (0.07 - 1.33)^^^ 0.20 (0.07 - 0.40)^^^ C5 0.13 (0.13 - 0.20) 0.23 (0.07 -0.33) 0.23 (0.13 - 0.40)^ 0.33 (0.13 - 0.80) C8 0.13 (0.07 - 0.13) 0.13 (0.07 - 0.13) 0.13 (0.07 - 0.13) 0.13 (0.07 - 0.13) C10 0.00 (0.00 - 0.07) 0.07 (0.00 - 0.07) 0.07 (0.00 - 0.07) 0.07 (0.00 - 0.07) C12:1 0.20 (0.07 - 0.33) 0.13 (0.13 - 0.20) 0.17 (0.13 - 0.20) 0.07 (0.07 - 0.13)^^** C16:1 0.07 (0.00 - 0.07) 0.07 (0.00 -0.07) 0.07 (0.00 - 0.07) 0.00 (0.00 - 0.07)* C16:0 0.07 (0.07 - 0.20) 0.07 (0.00 - 0.13) 0.07 (0.07 - 0.07) 0.07 (0.00 - 0.07) C18:2 0.07 (0.07 - 0.13) 0.07 (0.07 - 0.13) 0.07 (0.00 - 0.07) 0.07 (0.00 - 0.07) C18:1 0.20 (0.07 - 0.33) 0.17 (0.07 - 0.33) 0.13 (0.07 - 0.33) 0.07 (0.07 - 0.13)^^** C18:0 0.07 (0.07 - 0.13) 0.07 (0.07 - 0.13) 0.07 (0.07 - 0.07) 0.07 (0.00 - 0.07)
2020 07 03 Boekje 1.0.indd 832020 07 03 Boekje 1.0.indd 83 24/07/2020 21:1324/07/2020 21:13

Chapter 3
84
DiscussionPatients with glycogen storage disease type Ia (GSD Ia) experience severe hepatomegaly and develop NAFLD. We have previously shown that hepatic activity of the glucose-sensitive transcription factor ChREBP is increased in mouse models for GSD Ia and GSD Ib and ChREBP mediates the induction of glycolytic and lipogenic genes in acute GSD Ib (14, 15). As enhanced glycolysis and lipogenesis promote hepatic lipid storage, these findings prompted us to evaluate the contribution of enhanced ChREBP activity to the development of NAFLD in GSD Ia mice. We found that normalization of hepatic ChREBP activity in L-G6pc-/- mice by shRNA-mediated knockdown, as validated by the expression of the key marker gene Chrebpβ (12, 21), further promoted hepatomegaly, hepatocyte vacuolation and NAFLD development due to additional accumulation of glycogen and lipids in the liver. Notably, aggravation of NAFLD in shChREBP-treated L-G6pc-/- mice occurred despite a reduction in fractional de novo lipogenesis, and was associated with a marked suppression of hepatic VLDL-TG secretion. These changes were paralleled by a ChREBP-dependent reduction in hepatic expression of MTTP and TM6SF2, proteins that are both involved in VLDL lipidation (25). Interestingly, we also observed that ChREBP was recruited to the murine Tm6sf2 promoter in response to hepatic G6P accumulation, thereby identifying TM6SF2 as a transcriptional target of ChREBP in mouse liver under conditions of increased intracellular glucose signaling. Altogether, our data indicate that enhanced hepatic ChREBP activity limits hepatomegaly, hepatocyte vacuolation and NAFLD development in GSD Ia, and should therefore be considered as a ‘protective’ response under these conditions of excessive intrahepatic glucose metabolism.
NAFLD results from an imbalance between hepatic TG input and –output, and ‘snapshot’ hepatic TG content is therefore determined by hepatic FFA influx rates, the activities of de novo lipogenesis and fatty acid oxidation pathways as well as VLDL-TG secretion (26). The activities and relative contributions of these processes may change under different physiological (e.g. feeding and fasting conditions) and disease states (e.g. obesity and diabetes). As ChREBP exerts transcriptional control on the expression of key genes involved in de novo lipogenesis, fatty acid oxidation and VLDL-TG secretion (3-5, 13, 27), the consequence of altered hepatic ChREBP activity for NAFLD development is likely dependent on the prevailing (patho)physiological condition. Previous research has shown that partial or complete ablation of ChREBP reduces hepatic lipid content in type 2 diabetic mice (17, 18), a well as in some (28, 29), but not all (30, 31) studies in which rodents were fed carbohydrate or fructose-rich diets. On the other hand, ChREBP inactivation did not lower hepatic lipid content under conditions of chow or high-fat feeding (13, 28, 32). In the current study, we demonstrate that normalization of ChREBP activity in GSD Ia hepatocytes suppresses fractional de novo lipogenesis while elevated hepatic C2-acylcarnitine
2020 07 03 Boekje 1.0.indd 842020 07 03 Boekje 1.0.indd 84 24/07/2020 21:1324/07/2020 21:13

Hepatic ChREBP activation limits NAFLD development in Glycogen Storage Disease type Ia
85
3
levels under these conditions are indicative of enhanced hepatic fatty acid oxidation. Yet hepatic accumulation of ‘old fat’ was increased in shChREBP-treated mice, due to a strong suppression of VLDL-TG secretion. Thus, the reduction in de novo fatty acid synthesis and the increase in fatty acid catabolism were insufficient to compensate for reduced VLDL lipidation and –secretion in ‘our disease context’, i.e., (non-fasted) normoglycemic L-G6pc-/- mice. The fractional contribution of hepatic de novo fatty oleate synthesis in L-G6pc-/- mice was limited and reduced from ~20% to ~10% upon hepatic ChREBP knockdown (Fig. 2E). As a consequence, total hepatic de novo oleate synthesis was reduced by 5 μmoles in shChREBP versus shScramble treated L-G6pc-/- mice within the 48 hours of 13C-acetate administration. On the other hand, VLDL-TG secretion was reduced by about 350 μmol/kg/h upon hepatic ChREBP knockdown (Fig. 3B), corresponding to a reduction in hepatic oleate export of about 10 μmol per hour. Thus, indeed, the amount of excess fatty acids stored in liver due to impaired VLDL-TG secretion massively exceeded the shChREBP-mediated reduction in de novo fatty acid synthesis. In contrast to L-G6pc-/- mice, which show a ~60% increase in VLDL-TG secretion rate as compared to wildtype controls (Fig. 3B), our laboratory has previously shown that VLDL-TG secretion is unchanged in type 2 diabetic mice compared to controls (33). As a result, the excess storage of ‘old fat’ due to suppression of VLDL-TG secretion in response to hepatic ChREBP knockdown is likely of less quantitative importance in type 2 diabetes as compared to L-G6pc-/- mice. Moreover, fractional palmitate synthesis accounts for ~50% in chow-fed type 2 diabetic mice (33) versus 30% in L-G6pc-/- mice (Fig. 2E), while the contribution of hepatic NEFA influx may be larger in obese insulin-resistant mice as compared to L-G6pc-/- mice (26, 34). Therefore the differential contributions of de novo lipogenesis and VLDL-TG secretion to hepatic lipid content likely explain most of the opposing effects of hepatic ChREBP inhibition on lipid accumulation in type 2 diabetic (17, 18) versus hepatocyte-specific GSD Ia mice. Besides the variable efficacies of hepatic ChREBP knockdown between studies, we propose that differences in the contribution of de novo lipogenesis, VLDL-TG secretion and fatty acid oxidation pathways explain the reported divergent effects of hepatic ChREBP knockdown on NAFLD (13, 17, 18, 22, 28-31). Along similar lines, the observed increase in hepatic cholesterol synthesis and ER stress in high-fructose fed whole-body ChREBP knockout mice (29) is likely also context-dependent, as was proposed by Kim et al. (30). In contrast to what has been reported (29), hepatic ChREBP knockdown did not alter the expression of cholesterol biosynthesis genes (Fig. S1B) or fractional cholesterol synthesis rates in the livers of L-G6pc-/- mice in the current study (Fig. S1C). Absolute cholesterol synthesis was only slightly increased in these animals (Fig. S1C). On the other hand, consistent with Zhang et al., (29) we did observe increased mRNA levels of ER stress markers Bbc3 and Ddit3 in shChREBP-treated L-G6pc-/- mice (Fig. S1D). Combined, published data and our current findings indicate that the relationship between hepatic ChREBP activity and NAFLD development is disease context-dependent.
2020 07 03 Boekje 1.0.indd 852020 07 03 Boekje 1.0.indd 85 24/07/2020 21:1324/07/2020 21:13

Chapter 3
86
Our study shows that ChREBP plays a key role in hepatic VLDL lipidation and –secretion in GSD Ia and is essential for proper regulation of hepatic TG balance and, consequently, NAFLD development under conditions of high intrahepatic glucose availability. Besides confirming the regulatory role of ChREBP in VLDL-TG production and -secretion (13, 31, 32), our work mechanistically supports genetic studies in humans that have linked ChREBP expression to plasma lipid levels (35-39). Our findings also establish the contribution of ChREBP activity to enhanced VLDL-TG secretion and hypertriglyceridemia in GSD Ia (Hoogerland et al., unpublished). Importantly, our study identifies G6P-ChREBP signaling as a regulatory axis that controls TM6SF2 abundance in the liver under conditions of excessive intrahepatic glucose metabolism. Our molecular in vivo and in vitro studies indicate that HNF-4a contributes to regulation of basal Tm6sf2 transcription in mouse liver, while ChREBP mediates a glucose/G6P-induced induction of Tm6sf2. This potential mechanism is supported by strongly reduced hepatic Tm6sf2 levels in hepatocyte-specific Hnf-4a knockout mice, and slightly lower in Tm6sf2 expression in ChREBP null mice as compared to their wildtype littermates (Fig. S3E). TM6SF2 function was originally linked to human NAFLD in an exome-wide association study (40). Subsequent research has shown that its activity is essential for VLDL lipidation and maintenance of hepatic TG balance (40-44). However, to the best of our knowledge, this is the first study to report a HNF-4a/ChREBP-dependent induction of TM6SF2 abundance in response to G6P accumulation in mouse liver. Thus, besides regulating MTTP abundance (13), hepatic ChREBP also appears to regulate VLDL lipidation via TM6SF2. The impaired hepatic VLDL lipidation and suppression of hepatic TG secretion with comcomitant increases in hepatic TG content and lipid droplet size in shChREBP-treated L-G6pc+/+ and L-G6pc-/- mice in the current study actually phenocopies what has been observed upon hepatic Tm6sf2 knockdown and in Tm6sf2 knockout mice (40-42). In contrast to synergistic effect of ChREBP and HNF-4a on murine Tm6sf2 reporter activation, ChREBPa and -b did not promote HNF-4a-induced transactivation of the human TM6SF2 gene reporter (Fig. S3D). However, the reporter gene used does not cover all predicted ChREBP and HNF-4a binding sites in the human TM6SF2 gene (Fig. S3B). Whether or not ChREBP and HNF-4a also cooperatively regulate of hepatic TM6SF2 expression in human hepatocytes can therefore not be concluded from our studies. Yet, in view of the similarities in liver pathophysiology between GSD Ia and type 2 diabetes (45, 46), it is tempting to speculate that a ChREBP-dependent induction of hepatic TM6SF2 potentially also contributes to hypertriglyceridemia in type 2 diabetics (47, 48). Follow-up research will be essential to assess the translational value to our newly identified regulatory mechanism.
In conclusion, our study shows that hepatic ChREBP maintains TG balance in GSD Ia liver by concomitantly regulating hepatic lipogenesis, fatty acid oxidation and
2020 07 03 Boekje 1.0.indd 862020 07 03 Boekje 1.0.indd 86 24/07/2020 21:1324/07/2020 21:13
Hepatic ChREBP activation limits NAFLD development in Glycogen Storage Disease type Ia
87
3
particularly VLDL-TG secretion (3-5, 13, 27), thereby limiting NAFLD development. Our work identifies hepatic G6P-ChREBP signaling as a novel regulatory axis that controls murine TM6SF2 expression, hence controlling VLDL-lipidation and -secretion. Enhanced ChREBP activity also likely protects against NAFLD progression to advanced liver disease under conditions of excessive hepatic glucose metabolism, such as GSD Ia and type 2 diabetes.
AcknowledgementsWe thank W. Liu, N.L, Mulder, W. Bin Obaid, I.A. Martini, M. H. Koster, K. van Eunen, A. Gerding, A. Jurdinski, R. Havinga for excellent technical assistance and D-J Reijngoud for scientific discussion. We thank A. Herling and D. Schmoll (Sanofi) for providing S4048, L. Chan for sharing the ChREBP ChIP-seq data set and Johan W. Jonker and Mark Herman for sharing HNF-4a and ChREBPa/b/Mlx expression plasmids.
Financial supportThis work was supported by The Abel Tasman Talent Program (ATTP) of the University of Groningen to Y. Lei. M. H. Oosterveer is the recipient of a VIDI grant from the Dutch Scientific Organization, and holds a Rosalind Franklin Fellowship from the University of Groningen. F. Kuipers is supported by CardioVasculair Onderzoek Nederland (IN-CONTROL II, CVON2018-27). J.C. Wolters is supported by Transcard (FP7-603091). F. Rajas and G. Mithieux are supported by the French National Research Agency (ANR-11-BSV1-009).
2020 07 03 Boekje 1.0.indd 872020 07 03 Boekje 1.0.indd 87 24/07/2020 21:1324/07/2020 21:13

Chapter 3
88
References1. Chou JY, Jun HS, Mansfield BC. Type I glycogen storage diseases: disorders of the
glucose-6-phosphatase/glucose-6-phosphate transporter complexes. J Inherit Metab Dis 2014.
2. Rake JP, Visser G, Labrune P, Leonard JV, Ullrich K, Smit GP. Glycogen storage disease type I: diagnosis, management, clinical course and outcome. Results of the European Study on Glycogen Storage Disease Type I (ESGSD I). Eur J Pediatr 2002;161 Suppl 1:S20-34.
3. Ma L, Robinson LN, Towle HC. ChREBP center dot Mlx is the principal mediator of glucose-induced gene expression in the liver. Journal of Biological Chemistry 2006;281:28721-28730.
4. Poungvarin N, Chang B, Imamura M, Chen J, Moolsuwan K, Sae-Lee C, Li W, et al. Genome-Wide Analysis of ChREBP Binding Sites on Male Mouse Liver and White Adipose Chromatin. Endocrinology 2015;156:1982-1994.
5. Dentin R, Pegorier JP, Benhamed F, Foufelle F, Ferre P, Fauveau V, Magnuson MA, et al. Hepatic glucokinase is required for the synergistic action of ChREBP and SREBP-1c on glycolytic and lipogenic gene expression. Journal of Biological Chemistry 2004;279:20314-20326.
6. Dentin R, Tomas-Cobos L, Foufelle F, Leopold J, Girard J, Postic C, Ferre P. Glucose 6-phosphate, rather than xylulose 5-phosphate, is required for the activation of ChREBP in response to glucose in the liver. Journal of Hepatology 2012;56:199-209.
7. Guinez C, Filhoulaud G, Rayah-Benhamed F, Marmier S, Dubuquoy C, Dentin R, Moldes M, et al. O-GlcNAcylation increases ChREBP protein content and transcriptional activity in the liver. Diabetes 2011;60:1399-1413.
8. Bricambert J, Miranda J, Benhamed F, Girard J, Postic C, Dentin R. Salt-inducible kinase 2 links transcriptional coactivator p300 phosphorylation to the prevention of ChREBP-dependent hepatic steatosis in mice. J Clin Invest 2010;120:4316-4331.
9. Kawaguchi T, Takenoshita M, Kabashima T, Uyeda K. Glucose and cAMP regulate the L-type pyruvate kinase gene by phosphorylation/dephosphorylation of the carbohydrate response element binding protein. Proc Natl Acad Sci U S A 2001;98:13710-13715.
10. Sato S, Jung H, Nakagawa T, Pawlosky R, Takeshima T, Lee WR, Sakiyama H, et al. Metabolite Regulation of Nuclear Localization of Carbohydrate-response Element-binding Protein (ChREBP): ROLE OF AMP AS AN ALLOSTERIC INHIBITOR. J Biol Chem 2016;291:10515-10527.
11. Nakagawa T, Ge Q, Pawlosky R, Wynn RM, Veech RL, Uyeda K. Metabolite regulation of nucleo-cytosolic trafficking of carbohydrate response element-binding protein (ChREBP): role of ketone bodies. J Biol Chem 2013;288:28358-28367.
12. Herman MA, Peroni OD, Villoria J, Schon MR, Abumrad NA, Bluher M, Klein S, et al. A novel ChREBP isoform in adipose tissue regulates systemic glucose metabolism. Nature 2012;484:333-338.
13. Wu W, Tsuchida H, Kato T, Niwa H, Horikawa Y, Takeda J, Iizuka K. Fat and carbohydrate
2020 07 03 Boekje 1.0.indd 882020 07 03 Boekje 1.0.indd 88 24/07/2020 21:1324/07/2020 21:13

Hepatic ChREBP activation limits NAFLD development in Glycogen Storage Disease type Ia
89
3
in western diet contribute differently to hepatic lipid accumulation. Biochem Biophys Res Commun 2015;461:681-686.
14. Grefhorst A, Schreurs M, Oosterveer MH, Cortes VA, Havinga R, Herling AW, Reijngoud DJ, et al. Carbohydrate-response-element-binding protein (ChREBP) and not the liver X receptor alpha (LXRalpha) mediates elevated hepatic lipogenic gene expression in a mouse model of glycogen storage disease type 1. Biochem J 2010;432:249-254.
15. Abdul-Wahed A, Gautier-Stein A, Casteras S, Soty M, Roussel D, Romestaing C, Guillou H, et al. A link between hepatic glucose production and peripheral energy metabolism via hepatokines. Mol Metab 2014;3:531-543.
16. Cho JH, Kim GY, Pan CJ, Anduaga J, Choi EJ, Mansfield BC, Chou JY. Downregulation of SIRT1 signaling underlies hepatic autophagy impairment in glycogen storage disease type Ia. PLoS Genet 2017;13:e1006819.
17. Iizuka K, Miller B, Uyeda K. Deficiency of carbohydrate-activated transcription factor ChREBP prevents obesity and improves plasma glucose control in leptin-deficient (ob/ob) mice. Am J Physiol Endocrinol Metab 2006;291:E358-364.
18. Dentin R, Benhamed F, Hainault I, Fauveau V, Foufelle F, Dyck JRB, Girard J, et al. Liver-specific inhibition of ChREBP improves hepatic steatosis and insulin resistance in ob/ob mice. Diabetes 2006;55:2159-2170.
19. Mutel E, Abdul-Wahed A, Ramamonjisoa N, Stefanutti A, Houberdon I, Cavassila S, Pilleul F, et al. Targeted deletion of liver glucose-6 phosphatase mimics glycogen storage disease type 1a including development of multiple adenomas. J Hepatol 2011;54:529-537.
20. Kleiner DE, Brunt EM, Van Natta M, Behling C, Contos MJ, Cummings OW, Ferrell LD, et al. Design and validation of a histological scoring system for nonalcoholic fatty liver disease. Hepatology 2005;41:1313-1321.
21. Kim MS, Krawczyk SA, Doridot L, Fowler AJ, Wang JX, Trauger SA, Noh HL, et al. ChREBP regulates fructose-induced glucose production independently of insulin signaling. J Clin Invest 2016;126:4372-4386.
22. Iizuka K, Bruick RK, Liang G, Horton JD, Uyeda K. Deficiency of carbohydrate response element-binding protein (ChREBP) reduces lipogenesis as well as glycolysis. Proc Natl Acad Sci U S A 2004;101:7281-7286.
23. Oosterveer MH, van Dijk TH, Tietge UJ, Boer T, Havinga R, Stellaard F, Groen AK, et al. High fat feeding induces hepatic fatty acid elongation in mice. PLoS One 2009;4:e6066.
24. Benhamed F, Denechaud PD, Lemoine M, Robichon C, Moldes M, Bertrand-Michel J, Ratziu V, et al. The lipogenic transcription factor ChREBP dissociates hepatic steatosis from insulin resistance in mice and humans. J Clin Invest 2012;122:2176-2194.
25. Alves-Bezerra M, Cohen DE. Triglyceride Metabolism in the Liver. Compr Physiol 2017;8:1-8.
26. Donnelly KL, Smith CI, Schwarzenberg SJ, Jessurun J, Boldt MD, Parks EJ. Sources of fatty acids stored in liver and secreted via lipoproteins in patients with nonalcoholic fatty liver disease. J Clin Invest 2005;115:1343-1351.
27. Pashkov V, Huang J, Parameswara VK, Kedzierski W, Kurrasch DM, Tall GG, Esser V,
2020 07 03 Boekje 1.0.indd 892020 07 03 Boekje 1.0.indd 89 24/07/2020 21:1324/07/2020 21:13

Chapter 3
90
et al. Regulator of G Protein Signaling (RGS16) Inhibits Hepatic Fatty Acid Oxidation in a Carbohydrate Response Element-binding Protein (ChREBP)-dependent Manner. Journal of Biological Chemistry 2011;286:15116-15125.
28. Jois T, Chen W, Howard V, Harvey R, Youngs K, Thalmann C, Saha P, et al. Deletion of hepatic carbohydrate response element binding protein (ChREBP) impairs glucose homeostasis and hepatic insulin sensitivity in mice. Mol Metab 2017;6:1381-1394.
29. Zhang D, Tong X, VanDommelen K, Gupta N, Stamper K, Brady GF, Meng Z, et al. Lipogenic transcription factor ChREBP mediates fructose-induced metabolic adaptations to prevent hepatotoxicity. J Clin Invest 2017;127:2855-2867.
30. Kim M, Astapova, II, Flier SN, Hannou SA, Doridot L, Sargsyan A, Kou HH, et al. Intestinal, but not hepatic, ChREBP is required for fructose tolerance. JCI Insight 2017;2.
31. Erion DM, Popov V, Hsiao JJ, Vatner D, Mitchell K, Yonemitsu S, Nagai Y, et al. The role of the carbohydrate response element-binding protein in male fructose-fed rats. Endocrinology 2013;154:36-44.
32. Niwa H, Iizuka K, Kato T, Wu W, Tsuchida H, Takao K, Horikawa Y, et al. ChREBP Rather Than SHP Regulates Hepatic VLDL Secretion. Nutrients 2018;10.
33. Wiegman CH, Bandsma RH, Ouwens M, van der Sluijs FH, Havinga R, Boer T, Reijngoud DJ, et al. Hepatic VLDL production in ob/ob mice is not stimulated by massive de novo lipogenesis but is less sensitive to the suppressive effects of insulin. Diabetes 2003;52:1081-1089.
34. Bosy-Westphal A, Braun W, Albrecht V, Muller MJ. Determinants of ectopic liver fat in metabolic disease. Eur J Clin Nutr 2019;73:209-214.
35. Kooner JS, Chambers JC, Aguilar-Salinas CA, Hinds DA, Hyde CL, Warnes GR, Perez FJG, et al. Genome-wide scan identifies variation in MLXIPL associated with plasma triglycerides. Nature Genetics 2008;40:149-151.
36. Willer CJ, Sanna S, Jackson AU, Scuteri A, Bonnycastle LL, Clarke R, Heath SC, et al. Newly identified loci that influence lipid concentrations and risk of coronary artery disease. Nat Genet 2008;40:161-169.
37. Shaikh S, Waxler JL, Lee H, Grinke K, Garry J, Pober BR, Stanley TL. Glucose and lipid metabolism, bone density, and body composition in individuals with Williams syndrome. Clin Endocrinol (Oxf) 2018;89:596-604.
38. Palacios-Verdu MG, Segura-Puimedon M, Borralleras C, Flores R, Del Campo M, Campuzano V, Perez-Jurado LA. Metabolic abnormalities in Williams-Beuren syndrome. J Med Genet 2015;52:248-255.
39. Ortega-Azorin C, Sorli JV, Estruch R, Asensio EM, Coltell O, Gonzalez JI, Martinez-Gonzalez MA, et al. Amino acid change in the carbohydrate response element binding protein is associated with lower triglycerides and myocardial infarction incidence depending on level of adherence to the Mediterranean diet in the PREDIMED trial. Circ Cardiovasc Genet 2014;7:49-58.
40. Kozlitina J, Smagris E, Stender S, Nordestgaard BG, Zhou HH, Tybjaerg-Hansen A, Vogt TF, et al. Exome-wide association study identifies a TM6SF2 variant that confers
2020 07 03 Boekje 1.0.indd 902020 07 03 Boekje 1.0.indd 90 24/07/2020 21:1324/07/2020 21:13

Hepatic ChREBP activation limits NAFLD development in Glycogen Storage Disease type Ia
91
3
susceptibility to nonalcoholic fatty liver disease. Nat Genet 2014;46:352-356.41. Smagris E, Gilyard S, BasuRay S, Cohen JC, Hobbs HH. Inactivation of Tm6sf2, a Gene
Defective in Fatty Liver Disease, Impairs Lipidation but Not Secretion of Very Low Density Lipoproteins. J Biol Chem 2016;291:10659-10676.
42. Ehrhardt N, Doche ME, Chen S, Mao HZ, Walsh MT, Bedoya C, Guindi M, et al. Hepatic Tm6sf2 overexpression affects cellular ApoB-trafficking, plasma lipid levels, hepatic steatosis and atherosclerosis. Hum Mol Genet 2017;26:2719-2731.
43. O’Hare EA, Yang R, Yerges-Armstrong LM, Sreenivasan U, McFarland R, Leitch CC, Wilson MH, et al. TM6SF2 rs58542926 impacts lipid processing in liver and small intestine. Hepatology 2017;65:1526-1542.
44. Mahdessian H, Taxiarchis A, Popov S, Silveira A, Franco-Cereceda A, Hamsten A, Eriksson P, et al. TM6SF2 is a regulator of liver fat metabolism influencing triglyceride secretion and hepatic lipid droplet content. Proc Natl Acad Sci U S A 2014;111:8913-8918.
45. Rajas F, Labrune P, Mithieux G. Glycogen storage disease type 1 and diabetes: learning by comparing and contrasting the two disorders. Diabetes Metab 2013;39:377-387.
46. Oosterveer MH, Schoonjans K. Hepatic glucose sensing and integrative pathways in the liver. Cellular and Molecular Life Sciences 2014;71:1453-1467.
47. Kursawe R, Caprio S, Giannini C, Narayan D, Lin A, D’Adamo E, Shaw M, et al. Decreased transcription of ChREBP-alpha/beta isoforms in abdominal subcutaneous adipose tissue of obese adolescents with prediabetes or early type 2 diabetes: associations with insulin resistance and hyperglycemia. Diabetes 2013;62:837-844.
48. Eissing L, Scherer T, Todter K, Knippschild U, Greve JW, Buurman WA, Pinnschmidt HO, et al. De novo lipogenesis in human fat and liver is linked to ChREBP-beta and metabolic health. Nat Commun 2013;4:1528.
49. Holloway MG, Miles GD, Dombkowski AA, Waxman DJ. Liver-specific hepatocyte nuclear factor-4alpha deficiency: greater impact on gene expression in male than in female mouse liver. Mol Endocrinol 2008;22:1274-1286.
50. Oosterveer MH, Grefhorst A, van Dijk TH, Havinga R, Staels B, Kuipers F, Groen AK, et al. Fenofibrate simultaneously induces hepatic fatty acid oxidation, synthesis, and elongation in mice. J Biol Chem 2009;284:34036-34044.
2020 07 03 Boekje 1.0.indd 912020 07 03 Boekje 1.0.indd 91 24/07/2020 21:1324/07/2020 21:13

Chapter 3
92
Supplementary Material
Public mouse liver transcriptomics datasetsThe hepatic ChREBP overexpression data in C57BL/6J mice were extracted from (GSE61576, (1)) and the data on hepatocyte-specific Hnf-4a knockout mice and wildtype controls were extracted from (GSE10390, (2)).
Construction and production of shRNAs using self-complementary AAV vectorsTo construct the self-complementary AAV (scAAV) 2/8-U6-ChREBP, the scAAV2-LP1-hFIXco backbone vector (3) was restricted with BamHI and BbsI and the 3493 bp fragment was isolated and ligated. Restriction with BamHI removed hFIXco and partially deleted the LP1 promoter. The U6 promoter driving the expression of the construct was cloned into the vector in antisense orientation. shRNA construct directed against ChREBP and scramble construct were ordered as oligonucleotides (shRNA; 5’-aat tcA AAA AAT GTA GTT TGA AGA TGT GGG TCT CGA GAC CCA CAT CTT CAA ACT ACA TC-3’ and 3’-ggc caG ATG TAG TTT GAA GAT GTG GGT CTC GAG ACC CAC ATC TTC AAA CTA CAT TTT TT-5’, scramble; 5’-aat tcG TTG TAA GTG GAG GTT TAA GTC TCG AGA CTT AAA CCT CCA CTT ACA ACA CCG GT-3’ and 3’-ggc caA CCG GTG TTG TAA GTG GAG GTT TAA GTC TCG AGA CTT AAA CCT CCA CTT ACA AC-5’), denatured at 99 °C for 10 min and annealed by cooling down to RT. The duplex oligonucleotides were cloned into the vector using EcoRI and AgeI. Production, purification and titration of the AAV2/8 viruses encoding the shRNA directed against ChREBP (AAV-ChREBP) and the scrambled control (AAV-Scramble) were performed as described (4, 5).
Hepatic lipid and acylcarnitine profilesFrozen liver was homogenized in ice-cold PBS. Hepatic lipid contents were assessed using commercial available kits (Roche Diagnostics, Basel, Switzerland) after lipid extraction (6). Hepatic fatty acid and acylcarnitine profiles were analyzed as previously described (7, 8).
Hepatic metabolome analysisFreeze-dried liver (2 mg) was collected in a 2 mL tube followed by adding 1 mL ice-cold methanol:water (1:1) containing the following internal standards: D3-aspartic acid, D3-serine, D5-glutamine, D3-glutamate, 13C3-pyruvate, 13C6-isoleucine, 13C6-glucose, 13C6-fructose-1,6-biphosphate, 13C6-G6P, adenosine-15N5-monophosphate and guanosine-15N5-monophosphate (5 μM). For the extraction of metabolites 1 mL of chloroform was added and the samples were needle sonicated (8 watt, 40 joule). The homogenate was centrifuged for 5 minutes at 14.000 rpm at 4 degrees Celsius. The “polar” top layer was transferred to a new 1.5 mL tube and dried to dryness in a vacuum concentrator. Dried samples were dissolved in 100 µL methanol/water
2020 07 03 Boekje 1.0.indd 922020 07 03 Boekje 1.0.indd 92 24/07/2020 21:1324/07/2020 21:13

Hepatic ChREBP activation limits NAFLD development in Glycogen Storage Disease type Ia
93
3
(6/4; v/v). The metabolomics analysis was performed as described previously (9, 10). Interpretation of the data was performed in the Xcalibur software (Thermo scientific). Statistical analysis of the acquired data were done in an R environment using the ggplot2, ropls and mixOmics packages (11-13).
Glycolytic enzyme capacities (Vmax)Liver tissue was homogenized in ice-old PBS containing Phosphatase Inhibitor Cocktail 2 & 3 (1:100; P5726 P0044, Sigma-Aldrich) and Protease Inhibitor Cocktail (1:25, 11697498001, Sigma-Aldrich), centrifuged for 10 minutes at 600xg, after which the supernatant was collected. Vmax assays on these lysates were carried out using NAD(P)H-linked assays at 37 degrees Celsius in a Synergy H4 plate reader (BioTek™) using different (0, 2x, 4x and 8x) dilutions. The reported Vmax values represent total capacity of all isoenzymes in the cell at saturating concentrations of all substrates and expressed per extracted cell protein. Four different dilutions of extract were used to check for linearity. In nearly all cases at least 2 dilutions were proportional to each other and these were used for further calculation. All enzymes were expressed as µmoles of substrate converted per minute per mg of extracted protein. Protein determination was carried out using the Bicinchoninic Acid kit (BCA™ Protein Assay kit, Pierce). Based on the cytosolic concentrations described in literature, we have designed an assay medium that was as close as possible to the in vivo situation, whilst at the same time experimentally feasible. The standardized in vivo-like assay medium contained 150 mM potassium (14-17), 5 mM phosphate (14, 18), 15 mM sodium (14, 19), 155 mM chloride (20, 21), 0.5 mM calcium, 0.5 mM free magnesium (14, 22, 23) and 0.5-10.5 mM sulfate. For the addition of magnesium, it was taken into account that ATP and ADP bind magnesium with a high affinity. The amount of magnesium added equalled the concentration of either ATP or ADP plus 0.5 mM, such that the free magnesium concentration was 0.5 mM. Since the sulfate salt of magnesium was used the sulfate concentration in the final assay medium varied in a range between 0.5 and 10.5 mM. The assay medium was buffered at a pH of 7.0 (24-29) by using a final concentration of 100 mM TRIS-HCl (pH 7.0). To this end an assay mixture containing 100 mM Tris-HCl (pH 7.0), 15 mM NaCl, 0.5 mM CaCl2, 140 mM KCl, and 0.5-10.5 mM MgS04 was prepared. In addition to the assay medium, the concentrations of the coupling enzymes, allosteric activators and substrates for each enzyme were as follows: Phosphoglucose isomerase (GPI; EC 5.3.1.9) – 0.4 mM NADP+, 1.8 U/mL G6P dehydrogenase (EC 1.1.1.49), and 2 mM fructose 6-phosphate as start reagent. Aldolase (ALD; EC 4.1.2.13) – 0.15 mM NADH, 0.6 U/mL glycerol-3P-dehydrogenase (EC 1.1.1.8), 1.8 U/mL triosephosphate isomerase (EC 5.3.1.1), and 2 mM fructose 1,6-bisphosphate as start reagent. Glyceraldehyde-3-phosphate dehydrogenase (GAPDH; EC 1.2.1.12) – 0.15 mM NADH, 1 mM ATP, 24 U/mL 3-phosphoglycerate kinase (EC 2.7.2.3), and 5 mM 3-phosphoglyceric acid as start reagent. Enolase (ENO; EC 4.2.1.11) – 0.15 mM NADH, 1 mM ADP, 50 U/ml
2020 07 03 Boekje 1.0.indd 932020 07 03 Boekje 1.0.indd 93 24/07/2020 21:1324/07/2020 21:13

Chapter 3
94
pyruvate kinase (EC 2.7.1.40), 15 U/mL L-lactate dehydrogenase (EC 1.1.1.27), and 1 mM 2-phosphoglyceric acid as start reagent. Pyruvate kinase (PK) – 0.15 mM NADH, 1 mM ADP, 1 mM fructose 1,6-bisphosphate, 60 U/mL L-lactate dehydrogenase (EC 1.1.1.27) and 2 mM phosphoenolpyruvate as start reagent.
Quantification of acetyl-CoA precursor pool enrichments, de novo lipogenesis, fatty acid elongation and cholesterol synthesis Mice received sodium 1-13C-acetate (99 atom %, Isotec/Sigma- Aldrich, St. Louis, MO, USA) via the drinking water (2%) during the 48 hours prior to sacrifice. Hepatic lipids were hydrolyzed and derivatized as described (30). The fatty acid and cholesterol-mass isotopomer distributions were determined by gas chromatography mass spectrometry (GCMS) and used in mass isotopomer distribution analysis algorithms to calculate acetyl-CoA precursor pool enrichments, de novo fractional fatty acid and cholesterol synthesis rates, as well as the fraction of oleate and stearate generated by chain elongation of pre-existing palmitate (30). Absolute fatty acid and cholesterol synthesis were calculated from the fractional synthesis rates and hepatic fatty acid and cholesterol contents, and expressed per liver. The amount of ‘old fat’ was calculated by deducting the amount of fatty acids synthesized by de novo lipogenesis and chain elongation from the total amount of hepatic fatty acids.
Gene expression analysisTotal RNA from liver was isolated using TRI-Reagent (Sigma-Aldrich Corp.). For qPCR, cDNA was obtained by reverse transcription and amplified using primers and probes listed in Table S1. mRNA levels were calculated based on a calibration curve, expressed relative to the expression of 36b4 (Taqman) or rpl32 (SYBR green) and normalized to expression levels in L-G6pc+/+ shScramble-treated mice. For RNA sequencing, initial quality check and RNA quantification of the samples was performed by capillary electrophoresis using the LabChip GX (Perkin Elmer). Non-degraded RNA-samples were used for subsequent sequencing analysis. Sequence libraries were generated using the 3’QuantSeq sample preparation kits (LeXogen). The obtained cDNA fragment libraries were sequenced on an Illumina HiSeq2500 using default parameters (single read 1x50bp) in pools of multiple samples. The fastQ files where aligned to build Mus_musculus GRCm38 Ensemble Release 82 reference genome using HISAT (31) with default settings. Before gene quantification SAMtools was used to sort the aligned reads (32). The gene level quantification was performed by HTSeq-count (33). The extracted raw count file (ENSG, counts) was analyzed in the MADMAX (34). After transformation (log2CPM), normalization (Voom) (35) was performed to generate the differentially expressed genes. Additional RNA-seq data can be made available upon reasonable request to the corresponding author.
Targeted proteomics
2020 07 03 Boekje 1.0.indd 942020 07 03 Boekje 1.0.indd 94 24/07/2020 21:1324/07/2020 21:13
Hepatic ChREBP activation limits NAFLD development in Glycogen Storage Disease type Ia
95
3
Targeted proteomics was used to quantify G6PC, ChREBP, APOB, MTTP and TM6SF2 in homogenized liver tissue using isotopically labeled peptide standards (GLGVDLLWTLEK for G6PC, LGFDTLHGLVSTLSAQPSLK for ChREBP, VQGVEFSHR for APOB, ATSVTTYK and SDSSIILQER for MTTP, and TPFTYR for TM6SF2), containing 13C-labeled lysine/arginine (PolyQuant GmbH, Bad Abbach, Germany) as described previously (36). The following alterations were made: lipids were extracted from the liver homogenates with diethyl ether prior to the proteomics workflow and the concentrations were related to the total peptide content, which was determined by a colorimetric peptide assay after tryptic digestion and SPE cleanup (Thermo Scientific). The concentrations of endogenous peptides were calculated from the known concentration of the standard and expressed in fmol/µg of total peptide and expressed relative to the values in the control group.
In silico predictions In order to identify potential ChREBP and HNF-4α binding sites in the TM6SF2 gene a combination of computational analysis was performed and publicly available ChIP-seq datasets were evaluated. Putative HNF-4α (DR-1) sites in the mouse and human gene were derived from (37). Putative ChREBP sites in the mouse and human gene were derived from (38) and (39) respectively.
ChIP-qPCR on the mouse Tm6sf2 promoterLivers were homogenized in PBS and cross-linked with 0.5M Di (N-succinimidyl) glutarate (DSG) for 45 min at room temperature. The pellet was resuspended in PBS and cross-linked with 1% formaldehyde for 15 min at room temperature. 0.125M glycine was added and the samples were incubated 5 min at room temperature. The pellets were homogenized in 500 µL lysis buffer (5 mM Pipes, 85 mM KCL, 1% Nonidet P-40 with protease inhibitors) and incubated on ice for 10 min. Cell pellets were lysed in 300 µL nuclear lysis buffer (50 mM Tris-HCl pH 8.1, 10 mM EDTA, 1% SDS with protease inhibitors) and sonicated at 30% maximum power eight times for 10 seconds. The supernatant was diluted in IP-dilution buffer (0.01% SDS, 1.1% Trition X 100, 1.2 mM EDTA, 16.7 mM Tris-Cl pH 8.1, 167 mM NaCl with protease inhibitors) to a volume of 3 mL. The supernatant was precleared with 50% Protein A agarose/salmon sperm DNA beads (Santa Cruz) 100 µL of the supernatant was removed and used for direct amplification of DNA (input sample). The remaining sample was immunoprecipitated overnight at 4°C with 3 µg ChREBP (Novus), HNF4A (Santa Cruz) or normal rabbit IgG antibody (Santa Cruz). On the following day IPs were precleared with 50% Protein A agarose/salmon sperm DNA beads. Subsequently, the beads were washed in low salt buffer (0.1% SDS, 1% Triton X 100, 2 mM EDTA, 20 mM Tris-HCl pH 8, 150 mM NaCl), high salt buffer (0.1% SDS, 1% Triton X 100, 2 mM EDTA, 20 mM Tris-HCl pH 8, 500 mM NaCl) and LiCl buffer (1% Nonidet P-40, 24.1 mM sodium deoxycholate, 1 mM EDTA, 10 mM Tris-
2020 07 03 Boekje 1.0.indd 952020 07 03 Boekje 1.0.indd 95 24/07/2020 21:1324/07/2020 21:13

Chapter 3
96
HCl pH 8, 250 mM LiCl). The beads and input were boiled in 10% chelex followed by incubation with 10 µg/mL proteinase K at 55° C for 30 min. DNA was purified using the PCR Clean-up Extraction Kit (Macherey-Nagel), after which qPCR was performed. Primers for ChIP-PCR are listed in Table S1.
Nascent VLDL isolation and -analysisChylomicrons were isolated from the fresh final plasma samples using an Optima TM LX tabletop ultracentrifuge (Beckman Instruments Inc., Palo Alto, CA, USA) at 100.000xg for 15 minutes at 10 degrees Celsius (40) and stored separately. Nascent VLDL particles (0.15M NaCl; d<1.006) were isolated from the remaining samples using an Optima TM LX tabletop ultracentrifuge (Beckman Instruments Inc., Palo Alto, CA, USA) at 625.000xg for 100 minutes at 18 degrees Celsius (41). TG, cholesterol and phospholipid concentrations of nascent VLDLs were determined using commercially available kits (Roche Diagnostics and Wako Chemicals, Neuss, Germany). VLDL particle diameter was estimated using the following formula: diameter (nm) = 60 x ((0.211 x TG/phospholipid in mg/dL) + 0.27)) (24). VLDL particle volume was derived from the calculated diameter using the following formula: particle volume = 4/3 x π x (0,5 x particle diameter)3. Volumes of nascent VLDL containing equal amounts of TG (125 nmol) were pooled, and lipids were extracted with methanol and cold ether. The remaining VLDL proteins were incubated at 100 degrees Celsius for 5 minutes in loading buffer, subsequently subjected to SDS-PAGE with 15 nmol TG loaded per lane. Apolipoprotein (apo)B was determined using antibodies against anti-mouse apoB raised in rabbit (Biodesign, Saco, ME). Horseradish peroxidase-conjugated anti-rabbit antibodies from donkey (Amersham Pharmacia Bioscience, GE Healthcare) were used as a secondary antibody for all immunoblots. Protein bands were detected using SuperSignal West Pico Chemiluminescent Substrate System (Thermo Fisher Scientific, Rockford, IL, USA). Band densities were determined using a Gel Doc XR system (Biorad, Hercules, CA, USA).
Cell reporter assaysCV1 cells (ATCC) cultured in 48-wells plates in DMEM (Gibco 31966-021) were transiently transfected using FuGENE HD Transfection Reagent (Promega). Human and mouse Tm6sf2 promoter constructs (-1500/+100 bp; Thermo Fisher) were ligated into pGL3-Basic using restriction enzymes XhoI and KpnI. The human or mouse PGL3/Tm6sf2 promoter luciferase reporters (100 ng of each) or empty pGL3-Basic luciferase construct (Promega; 100 ng) were co-transfected with pcDNA3.1/ murine ChREBPα, pcDNA3.1/ murine ChREBPβ, pcDNA3.1/murine MLX (kind gifts from M. Herman, 50 ng of each, for shuttling see (42)), pcDNA3.1/murine HNF-4α (a kind gift from J.W. Jonker, 50 ng), or a combination, and filled up with pcDNA3.1 to achieve a total amount of 150 ng. After 48 hours cells were lysed and firefly-to-renilla
2020 07 03 Boekje 1.0.indd 962020 07 03 Boekje 1.0.indd 96 24/07/2020 21:1324/07/2020 21:13

Hepatic ChREBP activation limits NAFLD development in Glycogen Storage Disease type Ia
97
3
luciferase activities were assessed using a Dual-Luciferase Reporter Assay System (Promega). Within one experiment transfections were performed in triplicate, and experiments were repeated at least three times.
2020 07 03 Boekje 1.0.indd 972020 07 03 Boekje 1.0.indd 97 24/07/2020 21:1324/07/2020 21:13

Chapter 3
98
Figure S1: Related to Figure 2. (A) Box and-whisker plots presenting concentration and total content of hepatic free cholesterol (FC) and phospholipid (PL) in L-G6pc+/+ and L-G6pc-/- mice treated with either shChREBP or scrambled shRNA (shSCR; n = 7-9). (B) Heatmaps presenting z-score normalized mRNA expression of genes involved in cholesterol biosynthesis in L-G6pc+/+
and L-G6pc-/- mice treated with shChREBP or shSCR (n = 8-9). (C) Box and-whisker plots presenting fractional cholesterol synthesis rates and absolute cholesterol synthesis in L-G6pc+/+ and L-G6pc-/-
mice, treated with shChREBP or shSCR (n = 6-8). (D) Heatmaps presenting z-score normalized hepatic mRNA levels of ER stress markers in L-G6pc+/+ and L-G6pc-/- mice treated with shChREBP or shSCR (n = 8-9). *p < 0.05, **p <0.01 indicates signifi cance compared to shSCR. ^^^p <0.001 indicates signifi cance compared to L-G6pc+/+ mice. Table S2 contains raw values and statistics for data presented in heatmaps.
2020 07 03 Boekje 1.0.indd 982020 07 03 Boekje 1.0.indd 98 24/07/2020 21:1324/07/2020 21:13

Hepatic ChREBP activation limits NAFLD development in Glycogen Storage Disease type Ia
99
3Figure S2: Related to Figure 3. (A) ex vivo adipocyte lipolysis at diff erent time points and box and-whisker plots presenting lipolysis rate in L-G6pc+/+ and L-G6pc-/- mice treated with either shChREBP or scrambled shRNA (shSCR; n = 7-9). (B) Western Blot of apoB48 protein in nascent VLDL samples of L-G6pc+/+ and L-G6pc-/- mice treated with either shChREBP or shSCR. Equal amounts of TG were loaded onto the gel for all groups (n = 3).
Figure S3: Related to Figure 4. (A) Hepatic gene expression levels in C57BL/6J mice treated with GFP-expressing (Ad-GFP) or ChREBP-expressing (Ad-ChREBP) (n = 4-5, GSE 61576, (24)). (B) Schematic presentation of putative ChREBP (#1-2, dark grey) and HNF-4a (DR-1, light grey) response elements within the human TM6SF2 promoter. The solid line represents the part of the promoter that was covered by the human reporter gene while the dashed line represents a region further downstream. (C) Box and-whisker plots presenting fi refl y-to-renilla luciferase activities for the empty pGL3-Basic reporter after transfection with HNF-4α, MLX, ChREBPα and ChREBPβ plasmids (n = 3 independent experiments, each experiment performed in triplicate). (D) Box and-whisker plots presenting fi refl y-to-renilla luciferase activities for the human Tm6sf2 gene reporter after transfection with HNF-4α, MLX, ChREBPα and ChREBPβ plasmids (n = 3 independent experiments, each experiment performed in triplicate). (E) Box and-whisker plots presenting hepatic Tm6sf2 mRNA levels in hepatocyte-specifi c Hnf-4α knockout mice (data of 4 pooled knockout samples expressed relative to a pooled wildtype control sample, GSE10390, (49)) and in chow-fed full-body ChREBP null mice (n = 4-5, (50)) in comparison to their respective wildtype controls. *p < 0.05, **p <0.01, ***p < 0.001 indicates signifi cance compared to Ad-GTP for panel A (at FDR= 5%), compared to pcDNA3.1 for panels C-D, and compared to wildtype for panel E. ^p < 0.05, ^^p < 0.01 indicates signifi cance compared to control for panels C-D. #p < 0.05, ##p < 0.01 indicates signifi cance compared to pcDNA3.1+HNF-4α for panels C-D.
2020 07 03 Boekje 1.0.indd 992020 07 03 Boekje 1.0.indd 99 24/07/2020 21:1324/07/2020 21:13
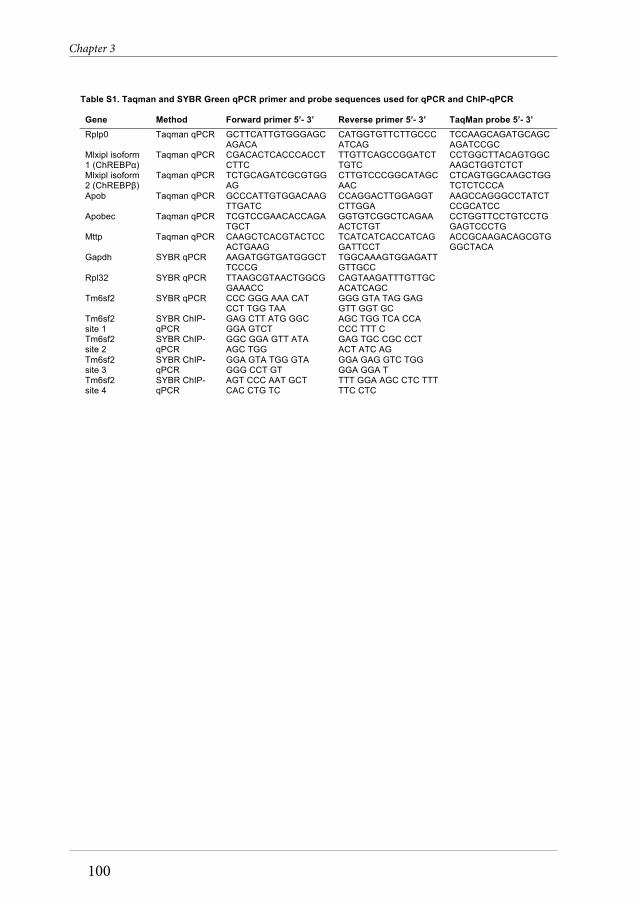
Chapter 3
100
Table S1. Taqman and SYBR Green qPCR primer and probe sequences used for qPCR and ChIP-qPCR
Gene Method Forward primer 5’- 3’ Reverse primer 5’- 3’ TaqMan probe 5’- 3’ Rplp0 Taqman qPCR GCTTCATTGTGGGAGC
AGACA CATGGTGTTCTTGCCCATCAG
TCCAAGCAGATGCAGCAGATCCGC
Mlxipl isoform 1 (ChREBPα)
Taqman qPCR CGACACTCACCCACCTCTTC
TTGTTCAGCCGGATCTTGTC
CCTGGCTTACAGTGGCAAGCTGGTCTCT
Mlxipl isoform 2 (ChREBPβ)
Taqman qPCR TCTGCAGATCGCGTGGAG
CTTGTCCCGGCATAGCAAC
CTCAGTGGCAAGCTGGTCTCTCCCA
Apob Taqman qPCR GCCCATTGTGGACAAGTTGATC
CCAGGACTTGGAGGTCTTGGA
AAGCCAGGGCCTATCTCCGCATCC
Apobec Taqman qPCR TCGTCCGAACACCAGATGCT
GGTGTCGGCTCAGAAACTCTGT
CCTGGTTCCTGTCCTGGAGTCCCTG
Mttp Taqman qPCR CAAGCTCACGTACTCCACTGAAG
TCATCATCACCATCAGGATTCCT
ACCGCAAGACAGCGTGGGCTACA
Gapdh SYBR qPCR AAGATGGTGATGGGCTTCCCG
TGGCAAAGTGGAGATTGTTGCC
Rpl32 SYBR qPCR TTAAGCGTAACTGGCGGAAACC
CAGTAAGATTTGTTGCACATCAGC
Tm6sf2 SYBR qPCR CCC GGG AAA CAT CCT TGG TAA
GGG GTA TAG GAG GTT GGT GC
Tm6sf2 site 1
SYBR ChIP-qPCR
GAG CTT ATG GGC GGA GTCT
AGC TGG TCA CCA CCC TTT C
Tm6sf2 site 2
SYBR ChIP-qPCR
GGC GGA GTT ATA AGC TGG
GAG TGC CGC CCT ACT ATC AG
Tm6sf2 site 3
SYBR ChIP-qPCR
GGA GTA TGG GTA GGG CCT GT
GGA GAG GTC TGG GGA GGA T
Tm6sf2 site 4
SYBR ChIP-qPCR
AGT CCC AAT GCT CAC CTG TC
TTT GGA AGC CTC TTT TTC CTC
2020 07 03 Boekje 1.0.indd 1002020 07 03 Boekje 1.0.indd 100 24/07/2020 21:1324/07/2020 21:13

Hepatic ChREBP activation limits NAFLD development in Glycogen Storage Disease type Ia
101
3
Supplemental references1. Benhamed F, Denechaud PD, Lemoine M, Robichon C, Moldes M, Bertrand-Michel J,
Ratziu V, et al. The lipogenic transcription factor ChREBP dissociates hepatic steatosis from insulin resistance in mice and humans. J Clin Invest 2012;122:2176-2194.
2. Holloway MG, Miles GD, Dombkowski AA, Waxman DJ. Liver-specific hepatocyte nuclear factor-4alpha deficiency: greater impact on gene expression in male than in female mouse liver. Mol Endocrinol 2008;22:1274-1286.
3. Nathwani AC, Gray JT, McIntosh J, Ng CY, Zhou J, Spence Y, Cochrane M, et al. Safe and efficient transduction of the liver after peripheral vein infusion of self-complementary AAV vector results in stable therapeutic expression of human FIX in nonhuman primates. Blood 2007;109:1414-1421.
4. Hermens WT, ter Brake O, Dijkhuizen PA, Sonnemans MA, Grimm D, Kleinschmidt JA, Verhaagen J. Purification of recombinant adeno-associated virus by iodixanol gradient ultracentrifugation allows rapid and reproducible preparation of vector stocks for gene transfer in the nervous system. Hum Gene Ther 1999;10:1885-1891.
5. Seppen J, Bakker C, de Jong B, Kunne C, van den Oever K, Vandenberghe K, de Waart R, et al. Adeno-associated virus vector serotypes mediate sustained correction of bilirubin UDP glucuronosyltransferase deficiency in rats. Mol Ther 2006;13:1085-1092.
6. Bligh EG, Dyer WJ. A rapid method of total lipid extraction and purification. Can J Biochem Physiol 1959;37:911-917.
7. Muskiet FA, van Doormaal JJ, Martini IA, Wolthers BG, van der Slik W. Capillary gas chromatographic profiling of total long-chain fatty acids and cholesterol in biological materials. J Chromatogr 1983;278:231-244.
8. Derks TG, Boer TS, van Assen A, Bos T, Ruiter J, Waterham HR, Niezen-Koning KE, et al. Neonatal screening for medium-chain acyl-CoA dehydrogenase (MCAD) deficiency in The Netherlands: the importance of enzyme analysis to ascertain true MCAD deficiency. J Inherit Metab Dis 2008;31:88-96.
9. Koenis DS, Medzikovic L, van Loenen PB, van Weeghel M, Huveneers S, Vos M, Evers-van Gogh IJ, et al. Nuclear Receptor Nur77 Limits the Macrophage Inflammatory Response through Transcriptional Reprogramming of Mitochondrial Metabolism. Cell Rep 2018;24:2127-2140 e2127.
10. Baardman J, Verberk SGS, Prange KHM, van Weeghel M, van der Velden S, Ryan DG, Wust RCI, et al. A Defective Pentose Phosphate Pathway Reduces Inflammatory Macrophage Responses during Hypercholesterolemia. Cell Rep 2018;25:2044-2052 e2045.
11. Rohart F, Gautier B, Singh A, Le Cao KA. mixOmics: An R package for ‘omics feature selection and multiple data integration. PLoS Comput Biol 2017;13:e1005752.
12. Thevenot EA, Roux A, Xu Y, Ezan E, Junot C. Analysis of the Human Adult Urinary Metabolome Variations with Age, Body Mass Index, and Gender by Implementing a Comprehensive Workflow for Univariate and OPLS Statistical Analyses. J Proteome Res 2015;14:3322-3335.
2020 07 03 Boekje 1.0.indd 1012020 07 03 Boekje 1.0.indd 101 24/07/2020 21:1324/07/2020 21:13

Chapter 3
102
13. Wickham H. ggplot2. In: Use R!; 2009.14. Guynn RW, Veloso D, Lawson JW, Veech RL. The concentration and control of cytoplasmic
free inorganic pyrophosphate in rat liver in vivo. Biochem J 1974;140:369-375.15. Kristensen LO. Associations between transports of alanine and cations across cell
membrane in rat hepatocytes. Am J Physiol 1986;251:G575-584.16. Tschopp J, Schroder K. NLRP3 inflammasome activation: The convergence of multiple
signalling pathways on ROS production? Nat Rev Immunol 2010;10:210-215.17. Rorsman P, Trube G. Glucose dependent K+-channels in pancreatic beta-cells are
regulated by intracellular ATP. Pflugers Arch 1985;405:305-309.18. Conley KE, Blei ML, Richards TL, Kushmerick MJ, Jubrias SA. Activation of glycolysis in
human muscle in vivo. Am J Physiol 1997;273:C306-315.19. Lidofsky SD, Xie MH, Sostman A, Scharschmidt BF, Fitz JG. Vasopressin increases
cytosolic sodium concentration in hepatocytes and activates calcium influx through cation-selective channels. J Biol Chem 1993;268:14632-14636.
20. Breitwieser GE, Altamirano AA, Russell JM. Osmotic stimulation of Na(+)-K(+)-Cl- cotransport in squid giant axon is [Cl-]i dependent. Am J Physiol 1990;258:C749-753.
21. Janssen LJ, Sims SM. Acetylcholine activates non-selective cation and chloride conductances in canine and guinea-pig tracheal myocytes. J Physiol 1992;453:197-218.
22. Ingwall JS. Phosphorus nuclear magnetic resonance spectroscopy of cardiac and skeletal muscles. Am J Physiol 1982;242:H729-744.
23. Murphy E, Steenbergen C, Levy LA, Raju B, London RE. Cytosolic free magnesium levels in ischemic rat heart. J Biol Chem 1989;264:5622-5627.
24. Bárány M. Biochemistry of Smooth Muscle Contraction. In: Academic Press; 1996.25. Bruch P, Schnackerz KD, Gracy RW. Matrix-bound phosphoglucose isomerase.
Formation and properties of monomers and hybrids. Eur J Biochem 1976;68:153-158.26. Civelek VN, Hamilton JA, Tornheim K, Kelly KL, Corkey BE. Intracellular pH in
adipocytes: effects of free fatty acid diffusion across the plasma membrane, lipolytic agonists, and insulin. Proc Natl Acad Sci U S A 1996;93:10139-10144.
27. Groen AK, Vervoorn RC, Van der Meer R, Tager JM. Control of gluconeogenesis in rat liver cells. I. Kinetics of the individual enzymes and the effect of glucagon. J Biol Chem 1983;258:14346-14353.
28. Ishibashi H, Cottam GL. Glucagon-stimulated phosphorylation of pyruvate kinase in hepatocytes. J Biol Chem 1978;253:8767-8771.
29. Oudard S, Arvelo F, Miccoli L, Apiou F, Dutrillaux AM, Poisson M, Dutrillaux B, et al. High glycolysis in gliomas despite low hexokinase transcription and activity correlated to chromosome 10 loss. Br J Cancer 1996;74:839-845.
30. Oosterveer MH, van Dijk TH, Tietge UJ, Boer T, Havinga R, Stellaard F, Groen AK, et al. High fat feeding induces hepatic fatty acid elongation in mice. PLoS One 2009;4:e6066.
31. Kim D, Langmead B, Salzberg SL. HISAT: a fast spliced aligner with low memory requirements. Nat Methods 2015;12:357-360.
32. Li H, Handsaker B, Wysoker A, Fennell T, Ruan J, Homer N, Marth G, et al. The Sequence
2020 07 03 Boekje 1.0.indd 1022020 07 03 Boekje 1.0.indd 102 24/07/2020 21:1324/07/2020 21:13

Hepatic ChREBP activation limits NAFLD development in Glycogen Storage Disease type Ia
103
3
Alignment/Map format and SAMtools. Bioinformatics 2009;25:2078-2079.33. Anders S, Pyl PT, Huber W. HTSeq--a Python framework to work with high-throughput
sequencing data. Bioinformatics 2015;31:166-169.34. Lin K, Kools H, de Groot PJ, Gavai AK, Basnet RK, Cheng F, Wu J, et al. MADMAX -
Management and analysis database for multiple ~omics experiments. J Integr Bioinform 2011;8:160.
35. Law CW, Chen Y, Shi W, Smyth GK. voom: Precision weights unlock linear model analysis tools for RNA-seq read counts. Genome Biol 2014;15:R29.
36. de Boer JF, Schonewille M, Boesjes M, Wolters H, Bloks VW, Bos T, van Dijk TH, et al. Intestinal Farnesoid X Receptor Controls Transintestinal Cholesterol Excretion in Mice. Gastroenterology 2017;152:1126-1138 e1126.
37. Yevshin I, Sharipov R, Kolmykov S, Kondrakhin Y, Kolpakov F. GTRD: a database on gene transcription regulation-2019 update. Nucleic Acids Res 2019;47:D100-D105.
38. Poungvarin N, Chang B, Imamura M, Chen J, Moolsuwan K, Sae-Lee C, Li W, et al. Genome-Wide Analysis of ChREBP Binding Sites on Male Mouse Liver and White Adipose Chromatin. Endocrinology 2015;156:1982-1994.
39. Jeong YS, Kim D, Lee YS, Kim HJ, Han JY, Im SS, Chong HK, et al. Integrated expression profiling and genome-wide analysis of ChREBP targets reveals the dual role for ChREBP in glucose-regulated gene expression. PLoS One 2011;6:e22544.
40. Kendrick JS, Chan L, Higgins JA. Superior role of apolipoprotein B48 over apolipoprotein B100 in chylomicron assembly and fat absorption: an investigation of apobec-1 knock-out and wild-type mice. Biochem J 2001;356:821-827.
41. Pietzsch J, Subat S, Nitzsche S, Leonhardt W, Schentke KU, Hanefeld M. Very fast ultracentrifugation of serum lipoproteins: influence on lipoprotein separation and composition. Biochim Biophys Acta 1995;1254:77-88.
42. Hoogerland JA, Lei Y, Wolters JC, de Boer JF, Bos T, Bleeker A, Mulder NL, et al. Glucose-6-Phosphate Regulates Hepatic Bile Acid Synthesis in Mice. Hepatology 2019;70:2171-2184.
2020 07 03 Boekje 1.0.indd 1032020 07 03 Boekje 1.0.indd 103 24/07/2020 21:1324/07/2020 21:13

2020 07 03 Boekje 1.0.indd 1042020 07 03 Boekje 1.0.indd 104 24/07/2020 21:1324/07/2020 21:13
Joanne A. Hoogerland1, Vincent W. Bloks1, Trijnie Bos2, Theo H. van Dijk2, Justina C. Wolters1, Jan Freark de Boer1, Fabienne Rajas3, Gilles Mithieux3, Michel van Weeghel4,5, Riekelt H. Houtkooper4, Folkert Kuipers1,2, and Maaike H. Oosterveer1
1Departments of Pediatrics and 2Laboratory Medicine, University of Groningen, University Medical Center Groningen, 9713 GZ Groningen, The Netherlands. 3Institut National de la Santé et de la Recherche Médicale, U1213, Université Claude Bernard Lyon, 69100 Villeurbanne, France. 4Laboratory Genetic Metabolic Diseases, Amsterdam Gastroenterology and Metabolism, Amsterdam Cardiovascular Sciences and 5Core Facility Metabolomics, Amsterdam UMC, University of Amsterdam, 1105 AZ Amsterdam, The Netherlands.
Manuscipt in preparation
4CHAPTERPharmacological FXR activation
redirects pyruvate towards glucose-6-phosphate and only slightly reduces
hepatic steatosis in a mouse model for Glycogen Storage Disease type 1a
2020 07 03 Boekje 1.0.indd 1052020 07 03 Boekje 1.0.indd 105 24/07/2020 21:1324/07/2020 21:13

106
Chapter 4
AbstractGlycogen storage disease type 1a (GSD Ia), caused by a defect in glucose-6-phosphatase (G6PC) activity, is characterized by hypertriglyceridemia, hypercholesterolemia and non-alcoholic fatty liver disease (NAFLD). These biochemical symptoms are commonly attributed to enhanced intrahepatic glycolysis. FXR is a key transcription factor controlling bile acid, lipid and glucose metabolism and a known repressor of glycolysis and de novo lipogenesis. FXR agonists are currently being clinically evaluated for treatment of NAFLD and non-alcoholic steatohepatitis (NASH). In the current study we aimed to characterize the consequence of pharmacological FXR activation by PX20606 (PX) on hypertriglyceridemia, NAFLD and hypercholesterolemia in L-G6pc-/- mice, a liver-specific model for GSD Ia. PX treatment increased the already elevated hepatic glucose-6-posphate (G6P) content in L-G6pc-/- mice by 35%, while hepatic triglyceride (TG) content was reduced by 40%. These changes were associated with increased pyruvate carboxylase (PCX) abundance, lower acetyl-CoA turnover rate, suppression of lipogenic gene expression, and reduction of de novo oleate synthesis. PX treatment did not reduce plasma TG levels, yet, it did normalize the increase in large HDL-associated cholesterol in L-G6pc-/- mice. In parallel, fecal neutral sterol loss was increased in PX-treated L-G6pc+/+ and L-G6pc-/- mice, associated with a more hydrophilic bile acid pool. In conclusion, our data indicate that a redirection of glycolytic pyruvate towards G6P in PX-treated L-G6pc-/- mice diminishes substrate availability for de novo lipogenesis which, however, only partially reduces hepatic TG content. These findings indicate a limited therapeutic effectiveness of PX20606 for the treatment of NAFLD in GSD Ia.
2020 07 03 Boekje 1.0.indd 1062020 07 03 Boekje 1.0.indd 106 24/07/2020 21:1324/07/2020 21:13

107
Pharmacological FXR activation in a mouse model for Glycogen Storage Disease type 1a
4
IntroductionGlycogen Storage Disease type 1a (GSD Ia; Von Gierke disease) is an inborn error of metabolism that is caused by mutations in the catalytic subunit (G6PC) of the glucose-6-phophatase (G6Pase) complex (1–3). As hydrolysis of G6P by G6PC in hepatocytes, kidney cells, and enterocytes is essential for endogenous glucose production, GSD Ia patients present with severe fasting hypoglycemia. Intracellular accumulation of G6P promotes glycogen synthesis, glycolysis, and de novo lipogenesis (4–7), resulting in hepatomegaly and non-alcoholic fatty liver disease (NAFLD) (7–10). Moreover, patients suffer from hypertriglyceridemia and hypercholesterolemia (11,12), which may result from enhanced de novo lipogenesis and/or impaired catabolism of triglyceride-rich lipoproteins (5,13,14, Hoogerland et al., unpublished).
Nuclear receptor Farnesoid X Receptor (NR1H4; FXR) is activated by bile acids and it controls several aspects of lipid- and glucose metabolism (15–21) as well as cholesterol- and bile acid metabolism (22–30). In mice, FXR has been shown to regulate hepatic and plasma lipid levels by interfering with de novo lipogenesis via the transcription factor sterol regulatory element binding protein (SREBP-1c) (31–35). Moreover, FXR activation lowers plasma triglyceride (TG) levels by improving very low density lipoprotein (VLDL)-TG catabolism, presumably by induction of apolipoprotein C2 (Apoc2), an established FXR target and activator of lipoprotein lipase (33,34) and repression of microsomal triglyceride transfer protein (Mttp) and apolipoprotein B (Apob) gene expression (35). FXR modulates glucose homeostasis by inhibition of hepatic pyruvate kinase (Pklr) (36) expression via interference with the glucose-sensitive transcription factor Carbohydrate Response Element Binding Protein (ChREBP) (36,37). Under fasted conditions, activation of the glucagon/cAMP/PKA/FXR axis increases FXR DNA binding to fructose-bisphosphatase 1 (Fbp1) and phosphoenolpyruvate carboxykinase 1 (Pck1) in mouse liver, thereby directing substrate towards de novo G6P synthesis and hepatic glucose production (38).
Pharmacological FXR activation in mice has been proposed to reduce NAFLD by inhibiting de novo lipogenesis and promoting fatty acid oxidation and VLDL clearance (39). Clinical trials with the FXR agonist obeticholic acid (OCA) showed improvements of histological NAFLD Activity Score (NAS) and liver fibrosis (40). Considering the role of FXR in regulating glycolysis, fatty acid and cholesterol metabolism, and the beneficial effects of FXR activation on liver steatosis (41–45), in the current study we investigated the potential therapeutic effectiveness of pharmacological FXR activation on hepatic glucose metabolism, NAFLD and hyperlipidemia in GSD Ia. To this end, hepatocyte-specific G6PC knockout (L-G6pc-/-) mice (46) and their L-G6pc+/+ littermates were treated with the pharmacological FXR activator PX20606 (47) after which we quantitatively evaluated various pathways of
2020 07 03 Boekje 1.0.indd 1072020 07 03 Boekje 1.0.indd 107 24/07/2020 21:1324/07/2020 21:13

108
Chapter 4
hepatic glucose, lipid, and cholesterol metabolism.
ResultsEffects of pharmacological FXR activation on intrahepatic glucose metabolism in L-G6pc-/- mice We confirmed that pharmacological FXR activation by PX20606 (PX) significantly reduced hepatic mRNA levels of Cyp7a1 and Cyp8b1, encoding key enzymes in bile acid synthesis, as well as CYP8B1 protein levels, in livers of L-G6pc-/- mice and wildtype littermates (Fig. 1A, 1B) (30). Moreover, the expression of the established FXR target gene Abcb11 (Bsep) and its protein levels were induced by PX while Cyp27a1 and Nr0b2 (Shp) mRNA levels and CYP27A1 protein levels remained unaltered (Fig. 1A, 1B). Liver weight was significantly increased by PX treatment (Fig. S1A) while the expression of inflammatory genes Il1b and Cd68 remained unaffected (Fig. S1B). Hepatic induction of CYP8B1 in L-G6pc-/- mice was paralleled by an increase in the relative abundance of cholic acid-derived bile acids and thus with increased hydrophobicity of biliary bile acids (48) (Fig. 1C). Consistent with its effects on the expression of bile acid synthesis genes (Fig. 1A), PX treatment altered bile acid composition, resulting in a more hydrophilic bile acid pool (Fig. 1C, Table S1) (30). It was previously reported that liver pyruvate kinase (Pklr; L-PK) is inhibited by pharmacological FXR activation via FXR-mediated transrepression and interference with ChREBP transcriptional activity (36). Although PX treatment did not significantly alter Pklr mRNA and protein levels, its enzymatic activity was reduced by about 30% in L-G6pc-/- mice (Fig. 1D). Analysis of glycolytic protein expression showed no consistent changes in L-G6pc-/- mice upon PX treatment (Fig. 1E, Table S2). However, the abundance of the TCA enzymes dihydrolipoamide dehydrogenase (DLD; E3 component of pyruvate dehydrogenase complex), dihydrolipoamide S-Acetyltransferase (DLAT; E2 component of pyruvate dehydrogenase complex), pyruvate carboxylase (PCX), and succinate-CoA ligase GDP-forming beta subunit (SUCLG2) were significantly increased at the protein level upon PX treatment in L-G6pc-/- mice (Fig. 1E, Table S2). Compared to their untreated controls, PX-treated L-G6pc-/- mice showed lower ATP citrate lyase (ACLY) protein expression (Fig. 1E) and hepatic oxaloacetate and citrate levels (Fig. 1F, Table S3), in parallel with increased hepatic glucose-6-phosphate (G6P) content (Fig. 1G), while blood glucose levels were not changed (data not shown). Moreover, the levels of pentose phosphate pathway intermediates 6-phosphogluconolatone and gluconate-6-phosphate levels were reduced upon PX treatment (Fig. 1F) and protein levels of 6-phosphogluconate dehydrogenase (PGD) were significantly increased (Fig. 1E). Together, these results indicate a redirection of pyruvate towards G6P synthesis upon pharmacological FXR activation in L-G6pc-/- mice, resulting in a lower contribution of glycolysis to citrate synthesis. Total hepatic glycogen content was further increased upon PX treatment in L-G6pc-/- mice, which was attributed to the increase in liver size (Fig. 1H, S1A).
2020 07 03 Boekje 1.0.indd 1082020 07 03 Boekje 1.0.indd 108 24/07/2020 21:1324/07/2020 21:13

109
Pharmacological FXR activation in a mouse model for Glycogen Storage Disease type 1a
4
Figure 1: Effects of pharmacological FXR activation on intrahepatic glucose metabolism in L-G6pc-/- mice. (A) Hepatic mRNA and (B) protein levels of FXR target genes and bile acid synthesis genes in L-G6pc+/+ and L-G6pc-/- mice treated with PX or control diet. (C) Composition and hydrophobicity index of biliary bile acids from L-G6pc+/+ and L-G6pc-/- mice treated with PX or control diet. (D) Hepatic mRNA levels, protein abundance and enzymatic activity of PKLR in L-G6pc+/+ and L-G6pc-/- mice treated with PX or control diet. (E) Heatmaps presenting z-score normalized hepatic abundance of proteins and (F) metabolites of glycolysis/gluconeogenesis, TCA cycle and pentose phosphate pathway (PPP) in L-G6pc+/+ and L-G6pc-/- mice treated with PX or control diet. (G) Hepatic G6P and (H) glycogen content L-G6pc+/+ and L-G6pc-/- mice treated with PX or control diet. Data represent Tukey boxplots. ***p < 0.001, **p <0.01, *p < 0.05 indicates significance compared to control diet. ###p < 0.001, ##p < 0.01 indicates significance compared to wildtype littermates.
2020 07 03 Boekje 1.0.indd 1092020 07 03 Boekje 1.0.indd 109 24/07/2020 21:1324/07/2020 21:13

110
Chapter 4
Hepatic de novo lipogenesis and triglyceride content are reduced in L-G6pc-/- mice upon pharmacological FXR activationTo investigate whether redirection of pyruvate was associated with a lower lipogenic flux, we administered 13C-acetate via the drinking water during 24 hours prior to sacrifice. This method allows to quantify de novo lipogenic flux and to distinguish between fatty acids derived from de novo synthesis or from chain elongation of pre-existing fatty acids (49). As expected, a significant reduction in acetyl-CoA precursor pool enrichment was observed in L-G6pc-/- mice compared to wildtype mice, compatible with an increase in acetyl-CoA turnover through enhanced glycolysis under these conditions (Fig. 2A). PX treatment slightly increased acetyl-CoA precursor pool enrichment in both genotypes, suggesting a diminished contribution of glycolysis to acetyl-CoA synthesis (Fig. 2A). Hepatic mRNA levels of lipogenic transcription factors Srebf1 (Srebp1c) and ChREBPβ, and oxysterol binding protein (Osbp), which induces Srebp1c expression and controls hepatic lipogenesis (50), were not changed upon PX treatment (Fig. 2B). Interestingly, mRNA levels of the lipogenic genes Acaca and Elovl6 were decreased upon FXR activation in L-G6pc-/- mice only (Fig. 2B). De novo fatty acid synthesis of oleate (C18:1) was decreased in L-G6pc-/- mice treated with PX, while de novo synthesis of palmitate (C16:0) and elongation of pre-existing palmitate to oleate remained unchanged (Fig. 2C). Fractional synthesis of palmitoleate (C16:1), a minor monounsaturated fatty acid was also significantly decreased upon PX treatment (Table S4). These changes in de novo fatty acid synthesis were accompanied by a decrease in hepatic TG content in L-G6pc-/- mice only, mainly caused by a reduction in oleate synthesis (Fig. 2C, 2D, S2A, Table S5). The hepatic TG/phospholipid ratio was significantly reduced upon PX treatment in L-G6pc-/- mice (Fig. 2E), indicating that PX treatment decreased hepatic lipid droplet size. Hepatic cholesterol ester and phospholipid contents were not changed upon FXR activation (Fig. S2B). Enrichment analysis of lipidomics data revealed that PX mainly affected composition of hepatic TG species and ceramide phosphocholines in L-G6pc-/- mice (Fig 2F, Table S6). In L-G6pc+/+ mice, composition of TG species was not affected, while ceramide phosphocholines were significantly decreased after PX treatment (Fig. 2F). In the liver, fatty acids are esterified with glycerol-3-phosphate (G3P) to form TGs. GPAM (glycerol-3-phosphate acyltransferase, mitochondrial) catalyzes the acylation of G3P, whereas DGAT1 (diacylglycerol O-Acyltransferase 1) and DGAT2 (diacylglycerol O-Acyltransferase 2) convert diacylglycerol and fatty acyl-CoA to TGs. Subsequently, the core apolipoprotein APOB is lipidated by MTTP and TM6SF2 to form VLDL particles which are subsequently secreted by the liver. Although de novo lipogenesis was somewhat decreased and hepatic TG composition was altered in L-G6pc-/- mice, pharmacological FXR activation in L-G6pc-/- mice did not affect mRNA and protein levels of the genes involved in TG esterification and VLDL secretion (Fig. 2G, S2C, S2D). Pharmacological FXR activation did not alter plasma TG levels in L-G6pc-/- mice, which are mainly confined to VLDL-sized
2020 07 03 Boekje 1.0.indd 1102020 07 03 Boekje 1.0.indd 110 24/07/2020 21:1324/07/2020 21:13

111
Pharmacological FXR activation in a mouse model for Glycogen Storage Disease type 1a
4
fractions (Fig. S2E, S2F), and hepatic protein levels of apolipoproteins C1, C2, and C3, and ANGPTL3 were also not changed (Fig. S2D).
PX treatment reduces ketogenesis in L-G6pc-/- miceInterestingly, we observed that elevated plasma free fatty acids (FFA) levels in L-G6pc-/- mice were further increased by PX (Fig. 3A). mRNA levels of Cd36 and liver specific Fabp1, facilitating hepatic uptake of FFA, were not significantly different between the groups, while that of Slc27a5 (Fatp-5) appeared to be slightly induced by PX (Fig. 3B). We therefore investigated whether increased FFA levels in PX-treated L-G6pc-/-
Figure 2: Hepatic de novo lipogenesis and triglyceride content are reduced in L-G6pc-/- mice upon pharmacological FXR activation. (A) Acetyl-CoA precursor pool enrichment in L-G6pc+/+ and L-G6pc-/- mice treated with PX or control diet. (B) Hepatic mRNA levels of genes involved in lipogenesis and (C) absolute de novo lipogenesis and chain elongation of palmitate (C16:0) and oleate (C18:1) in L-G6pc+/+ and L-G6pc-/- mice treated with PX or control diet. (D) Hepatic triglyceride content and (E) triglyceride/phospholipid ratio in L-G6pc+/+ and L-G6pc-/- mice treated with PX or control diet. (F) Enrichment analysis of hepatic lipid fractions, top 5 in ranking mode. The gray vertical lines indicate the cut-off value of significant enrichments using a false discovery rate (FDR) of 5% (q-value < 0.05). (G) Hepatic mRNA levels of genes involved in triglyceride esterification in L-G6pc+/+ and L-G6pc-/- mice treated with PX or control diet. Data represent Tukey boxplots. ***p < 0.001, *p < 0.05 indicates significance compared to control diet. ###p < 0.001, ##p < 0.01, #p < 0.05 indicates significance compared to wildtype littermates. See also Table S4, Table S5 and Table S6.
2020 07 03 Boekje 1.0.indd 1112020 07 03 Boekje 1.0.indd 111 24/07/2020 21:1324/07/2020 21:13

112
Chapter 4
mice associated with changes in β-oxidation makers. Acacb, synthesizing the Cpt1inhibitory metabolite malonyl-CoA (51), and Acadl (Lcad) mRNA expression were not aff ected by PX treatment (Fig. 3B). Moreover, the expression of proteins involved in β-oxidation remained unchanged (Fig. 3C). In contrast, Hmgcs2 mRNA levels and plasma levels of ketone bodies were slightly decreased upon FXR activation in L-G6pc-/- mice, indicating lower ketogenesis (Fig. 3B, 3D).
Pharmacological FXR activation alters cholesterol metabolism in L-G6pc-/- miceFecal neutral sterol loss and cholesterol synthesis were increased by PX treatment in both genotypes (Fig. 4A, 4B, S3A), while dietary cholesterol intake and total hepatic cholesterol content were not diff erent between groups (Fig. S3B, S3C). Srebf2 (Srebp2) mRNA levels were indeed only signifi cantly induced in PX-treated wildtype mice and not in L-G6pc-/- mice, while the expression of Hmgcr, involved in cholesterol biosynthesis, remained unchanged by PX (Fig. 4C). Biliary cholesterol excretion was only signifi cantly increased in L-G6pc+/+ mice, despite increases in Abcg5/g8mRNA levels in L-G6pc-/- mice (Fig. S3D, S3E). Although total plasma cholesterol levels were not altered, PX treatment did reduce the amount of large HDL-associated cholesterol in L-G6pc-/- mice (Fig. 4D). Interestingly, HDL particles of L-G6pc-/- mice
Figure 3: PX treatment reduces ketogenesis in L-G6pc-/- mice. (A) Free fatty acid levels in plasma of L-G6pc+/+ and L-G6pc-/- mice treated with PX or control diet. (B) Hepatic mRNA levels of genes involved in fatty acid uptake and β-oxidation in L-G6pc+/+ and L-G6pc-/- mice treated with PX or control diet. (C) Heatmap presenting z-score normalized hepatic abundance of proteins involved in β-oxidation in L-G6pc+/+ and L-G6pc-/- mice treated with PX or control diet. (D) Ketone body concentrations of 3-beta-hydroxybutyrate (3HB) and acetoacetate (ACA) in plasma of L-G6pc+/+
and L-G6pc-/- mice treated with PX or control diet. Data represent Tukey boxplots. **p < 0.01, *p < 0.05 indicates signifi cance compared to control diet. ###p < 0.001, ##p < 0.01 indicates signifi cance compared to wildtype littermates. See also Table S2.
2020 07 03 Boekje 1.0.indd 1122020 07 03 Boekje 1.0.indd 112 24/07/2020 21:1324/07/2020 21:13

113
Pharmacological FXR activation in a mouse model for Glycogen Storage Disease type 1a
4
showed a relative increase in APOC1 levels, while PX treatment normalized APOC1 levels to wildtype levels (Fig. 4E). No marked diff erences were found for other HDL-associated apolipoproteins (e.g. APOA4, APOB, APOC3, APOE and APOM) (Fig. S3F). PX treatment did not modulate hepatic Ldlr expression, down-regulated hepatic Vldlr expression and resulted in increased mRNA levels of Scarb1 (Srb1) (Fig. 4F), suggestive of increased hepatic HDL cholesterol uptake in both genotypes.
Figure 4: Pharmacological FXR activation alters cholesterol metabolism in L-G6pc-/- mice. (A) Fecal neutral sterol excretion and (B) cholesterol synthesis of L-G6pc+/+ and L-G6pc-/- mice treated with PX or control diet. (C) Hepatic mRNA levels in L-G6pc+/+ and L-G6pc-/- mice treated with PX or control diet. (D) Total plasma cholesterol concentrations and cholesterol concentrations in lipoprotein fractions and (E) relative protein abundance in selected lipoprotein fractions of L-G6pc+/+
and L-G6pc-/- mice treated with PX or control diet. (F) Hepatic mRNA levels of genes involved in lipoprotein uptake in L-G6pc+/+ and L-G6pc-/- mice treated with PX or control diet. Data represent Tukey boxplots. ***p < 0.001, **p < 0.01, *p < 0.05 indicates signifi cance compared to control diet. ###p < 0.001, ##p < 0.01, #p < 0.05 indicates signifi cance compared to wildtype littermates.
2020 07 03 Boekje 1.0.indd 1132020 07 03 Boekje 1.0.indd 113 24/07/2020 21:1324/07/2020 21:13

114
Chapter 4
DiscussionIn the current study we investigated the consequences of pharmacological FXR activation on hepatic glucose, fatty acid and cholesterol metabolism in a mouse model for GSD Ia. Our results indicate that PX20606 treatment in L-G6pc-/- mice redirected pyruvate towards G6P synthesis, hence further promoting the hepatic accumulation of G6P while limiting substrate availability for de novo lipogenesis. Although these metabolic adaptations were associated a partial protection against hepatic steatosis, the effects were rather modest, suggesting a limited therapeutic potential for FXR agonists for the treatment of NAFLD in GSD Ia.
Previous studies evaluating the effect of PX20606 in rodents mainly focused on cholesterol homeostasis (30,47) and portal hypertension in liver fibrosis (52) but so far its effect on hepatic glucose metabolism had not been addressed. Pharmacological FXR activation by GW4064 has previously been reported to inhibit ChREBP transcriptional activity (36). Although hepatic L-PK activity tended to decrease in L-G6pc+/+ mice upon PX treatment, we did not observe a reduction in its mRNA or protein levels in L-G6pc-/- mice. We hypothesize that the ChREBP-mediated induction of L-pk in L-G6pc-/- mice overrules its FXR-mediated suppression. In addition, we observed that acetyl-CoA pool enrichment was increased upon PX treatment in both L-G6pc+/+ and L-G6pc-/- mice while hepatic citrate content was strongly reduced and PC and MDH2 protein levels were increased. Moreover, hepatic oxaloacetate levels were reduced, presumably reflecting in a shift from TCA cycle anaplerosis to cataplerosis. Combined, these findings suggest redirection of glycolytic pyruvate towards de novo G6P synthesis (i.e., gluconeogenesis) upon PX treatment. Follow-up stable isotope studies will be essential to confirm that PX redirects hepatic glycolysis towards gluconeogenesis.
Previous research has shown that the hepatic expression of murine Pcx is induced upon pharmacological FXR activation (53). The physiological consequences of Pcx regulation by FXR have, however, not been investigated in vivo. It has also been reported that intestinal FXR inhibition reduced hepatic PCX activity without affecting its hepatic mRNA expression levels (54), a phenomenon that was explained by reduced intestinal ceramide synthesis signaling to the liver to suppress PCX (54). In line with these previous studies, in the current study we observed an induction of hepatic PCX protein abundance and an increase in hepatic ceramide content in PX-treated L-G6pc+/+ and L-G6pc-/- mice (data not shown). Follow-up studies are warranted to establish whether these changes were paralleled with an induction of intestinal genes involved in ceramide production, increase in circulating ceramide levels, and enhanced hepatic PCX activity in PX-treated L-G6pc-/- mice. PCX is a key regulator of gluconeogenesis that exerts ~80% flux control over this process (55), while Pck1 and Fbp1, which are also subject to transcriptional regulation by FXR
2020 07 03 Boekje 1.0.indd 1142020 07 03 Boekje 1.0.indd 114 24/07/2020 21:1324/07/2020 21:13

115
Pharmacological FXR activation in a mouse model for Glycogen Storage Disease type 1a
4
(38), exhibit lower flux control over gluconeogenesis (55,56). We therefore propose that increased PCX activity is the major contributor to enhanced gluconeogenesis in response to pharmacological activation by PX20606, and potentially also during fasting (38). In the absence of hepatic G6PC activity in L-G6pc-/- mice (57), a PX-mediated redirection of pyruvate towards gluconeogenesis presumably resulted in further accumulation of hepatic G6P, while excess G6P was disposed into the circulation via G6PC in L-G6pc+/+ mice. Surprisingly, the increment in G6P in PX-treated L-G6pc-/- mice did not result in further accumulation of hepatic glycogen, although G6P is a well-known allosteric activator of glycogen synthase 2 (GYS2) in the liver (58).
Rerouting of pyruvate towards gluconeogenesis in response to FXR activation reduced the amount of acetyl-CoA available for de novo lipogenesis, as illustrated by an increase in acetyl-CoA pool enrichment and a reduction in hepatic citrate content in PX-treated L-G6pc+/+ and L-G6pc-/- mice. Besides limiting lipogenic substrate supply, PX treatment presumably also reduced the lipogenic flux in L-G6pc-/- mice via a reduction in lipogenic enzyme expression. It has been previously reported that FXR activation lowers hepatic TG levels via a FXR-SHP-SREBP-1c signaling cascade (31). Activation of FXR by natural and synthetic agonists increased Nr0b2 mRNA levels which, in turn, inhibited Srebf1 expression. On the other hand, FXR-/- mice showed reduced L-pk, Fasn and Acaca mRNA levels, without changes in Srebp-1c or Mlxipl (encoding ChREBP) expression, suggesting that FXR may interfere with the transcriptional activity, rather than the expression of SREBP-1c and ChREBP (21). In the current study we observed a reduction in de novo oleate synthesis in parallel to lower Acaca and Elovl6 mRNA levels in PX-treated L-G6pc-/- mice while hepatic Shp, Srebp-1c, Fasn and Chrebpβ mRNA levels remained unchanged. Our findings are compatible with a model in which pharmacological FXR activation in L-G6pc-/- mice interferes with SREBP-1c and/or ChREBP-mediated lipogenic gene induction via post-translational mechanisms. Dedicated molecular studies are warranted to directly establish the underlying mechanism(s).
Pharmacological FXR activation in L-G6pc-/- mice resulted in a modest reduction in de novo oleate synthesis and lowered hepatic TG content. Moreover, the TG/PL ratio was significantly reduced in livers of PX-treated in L-G6pc-/- mice, likely reflecting reduced lipid droplet size under these conditions (Fig. 2E, S2A). Our current finding that hepatic steatosis was not normalized upon PX treatment is in agreement with our previous work indicating that de novo lipogenesis only partially contributes to NAFLD in GSD Ia (59) (Hoogerland JA et al., unpublished; chapter 2). As de novo fatty acid synthesis only contributes for up to ~20% of liver fat in L-G6pc-/- mice, hepatic TG accumulation does not exclusively result from enhanced lipogenesis. Moreover, in hypoglycemic L-G6pc-/- mice, hepatic steatosis was associated with
2020 07 03 Boekje 1.0.indd 1152020 07 03 Boekje 1.0.indd 115 24/07/2020 21:1324/07/2020 21:13

116
Chapter 4
enhanced adipose tissue lipolysis and hepatic fatty acid elongation (Hoogerland et al., unpublished; chapter 2), suggesting that the glycemic state modulates the origin of hepatic lipid accumulation in GSD Ia. Our results furthermore imply a limited effectiveness of FXR agonist PX20606 for the treatment of NAFLD in GSD Ia. There is as yet no evidence for lipogenic inhibition in NAFLD patients treated with the currently available FXR agonists (40,60). In contrast, ACC and FASN inhibitors have proven efficacy to inhibit lipogenesis and to prevent hepatic steatosis in animal models as well as in humans (61–67). The side effect of ACC inhibitors, i.e. hyperlipidemia, can be controlled with fibrates (68). Recent preclinical studies indicate that fibrates reduce hepatic steatosis GSD Ia via increased lipid oxidation and induction of autophagy, suggesting that combined ACC inhibitor/fibrate treatment may provide a potential therapy for NAFLD in GSD Ia (69–71).
Interestingly, we observed that plasma FFA levels in L-G6pc-/- mice were further increased upon PX treatment. In agreement with previous work (41), we found that hepatic Hmgcs2 mRNA expression and plasma ketone body levels were reduced upon pharmacological FXR activation in L-G6pc+/+ and L-G6pc-/- mice. We did not observe indications that this reduction in ketogenesis was paralleled by reduced hepatic fatty acid oxidation, as mRNA and protein levels of β-oxidation enzymes remained unchanged upon PX treatment. Moreover, we did not observe a reduction in fatty acid transporter expression. These observations suggest that the increases in circulating FFA levels were most likely related to PX-mediated changes in extrahepatic tissues. FXR activity is known to affect adipose tissue architecture and function (72–74). Overexpression of human FXR in adipocytes from FXR null mice results in elevated plasma FFA levels, suggesting an increase in adipocyte lipolysis and/or a limited adipocyte lipid storage capacity when adipose FXR is activated. Alternatively, a potential induction of hepatic FGF21 secretion upon PX treatment (75) may have enhanced adipose tissue lipolysis, hence increasing FFA levels. Previously, it was shown that suppression of adipocyte lipolysis reduces hepatic PC activity and -flux (76). Although we did not specifically evaluate the effect of PX treatment on adipose tissue in L-G6pc-/- mice, we speculate that PX enhanced adipose tissue lipolysis, leading to elevated FFA levels (72). Enhanced hepatic influx of FFA upon PX treatment may in turn also contribute to increased hepatic PC expression and -activity (76–78).
Surprisingly, FXR activation by PX did not alter plasma TG or apolipoprotein levels in L-G6pc+/+ and L-G6pc-/- mice. Hepatic FXR is known to induce Apoc2 transcription while suppressing Apoc3 expression, resulting in decreased plasma TG levels (33,34). The fact that plasma TG concentrations and protein levels of APOC2 and APOC3 were not altered by PX treatment may be related to a potential isoform-specificity of the PX compound used (79), intrahepatic energy status, or to the efficacy of PX
2020 07 03 Boekje 1.0.indd 1162020 07 03 Boekje 1.0.indd 116 24/07/2020 21:1324/07/2020 21:13

117
Pharmacological FXR activation in a mouse model for Glycogen Storage Disease type 1a
4
to activate hepatic FXR (79). In agreement with our previous work (Hoogerland et al., unpublished; chapter 2) VLDL- and large HDL-cholesterol contents were increased in L-G6pc-/- mice. PX-treated L-G6pc-/- mice showed a normalization of large HDL-associated cholesterol content to values observed in L-G6pc+/+ mice. Amongst other tissues, large HDL particles can be formed by the intestine (80,81). This process is mediated by ABCA1, which is transcriptionally controlled by LXR and hence is sensitive to intestinal cholesterol availability (80). Our previous work (48) and the current study show that L-G6pc-/- mice exhibit a hydrophobic bile acid pool. Moreover, these animals display reduced fecal sterol excretion, which is compatible with enhanced intestinal cholesterol absorption (48). This presumably results in activation of enterocytic LXR, hence inducing Abca1 expression, resulting in enhanced intestinal large HDL production. PX treatment in turn normalized hydrophobicity of biliary bile acids and enhanced fecal sterol excretion in L-G6pc-/- mice, thereby potentially also normalizing intestinal ABCA1-mediated production of large HDL particles. Interestingly, in L-G6pc-/- mice the presence of large HDL and its normalization upon PX treatment coincided with respectively higher and lower relative abundances of HDL-associated APOC1. The mechanism underlying these changes in APOC1 remains to be elucidated.
In conclusion, we report that pharmacological FXR activation by PX20606 in a liver-specific mouse model for GSD Ia redirects hepatic glycolysis towards G6P synthesis, suppresses lipogenic gene expression and reduces lipogenic flux. We speculate that these adaptations are mediated by the induction of hepatic PCX in response to pharmacological FXR activation. The concomitant reduction in acetyl-CoA and citrate production from glycolysis, in conjunction with lower lipogenic enzyme expression likely contribute to the reduction in hepatic triglyceride accumulation in PX-treated L-G6pc-/- mice. Importantly, the relative modest effects of PX-treatment on hepatic lipid content confirm that de novo lipogenesis only partially contributes to hepatic steatosis, and suggest a limited therapeutic effectiveness of FXR agonists for the treatment of NAFLD in GSD Ia.
Experimental ProceduresAnimalsMale adult (10-14 weeks) B6.G6pclox/lox and B6.G6pclox/lox.SAcreERT2/w mice (46) were housed in a light- and temperature-controlled facility and fed a standard laboratory chow diet (RMH-B, AB-diets, Woerden, The Netherlands). Excision of exon 3 of the G6pc gene was induced by i.p. injections of tamoxifen for 5 consecutive days in the B6.G6pclox/lox.SAcreERT2/w mice expressing a hepatocyte-specific tamoxifen-inducible Cre-recombinase, as described previously (46). Immediately after the last tamoxifen injection, liver-specific G6pc-deficient mice (L-G6pc-/-) and wildtype littermates (L-G6pc+/+) either received 10 mg/kg/day PX20206 (kindly provided by Dr. Claus
2020 07 03 Boekje 1.0.indd 1172020 07 03 Boekje 1.0.indd 117 24/07/2020 21:1324/07/2020 21:13

118
Chapter 4
Kremoser, Phenex Pharmaceuticals AG, Heidelberg, Germany) (PX) (47) via the diet, or a control diet without PX. After 10 days, mice were anesthetized by i.p. injection of Hypnorm (10 ml/kg) (Janssen Pharmaceuticals, Tilburg, The Netherlands) and diazepam (10mg/kg) (Actavis, Baarn, The Netherlands), after which the bile duct was ligated and the gallbladder was cannulated. Body temperature was stabilized in a humidified incubator and bile was collected for 30 minutes. Mice were sacrificed by cardiac puncture and tissues were rapidly excised and stored at -80°C.
Biochemical analysisBlood glucose was analyzed using a One Touch Ultra glucose meter (Life-Scan Inc., Milpitas, CA, US). Plasma levels of lactate, ketone bodies (3-hydroxybutyrate, acetoacetate and total ketone bodies) and free fatty acids were enzymatically determined using commercially available kits (Instruchemie, Delfzijl, The Netherlands; Wako, Mountain View, CA, USA; DiaSys, Holzheim, Germany, respectively) and analyzed by Selectra Pro M (ELITechGroup). Liver lipids were extracted according to Bligh and Dyer (82) and commercially available kits were used to quantify hepatic and plasma levels of triglycerides (Roche, Mannheim, Germany), as well as hepatic cholesterol levels (Roche and DiaSys, respectively). Hepatic phospholipid levels were quantified in liver extracts as previously described (83). Hepatic fatty acid composition was analyzed by gas chromatography after transmethylation using C17:0 as internal standard (84). Hepatic glucose-6-phosphate and glycogen content was measured as previously described (85). Biliary bile acid composition was quantified using liquid chromatography-mass spectrometry, fecal bile acid composition was quantified using capillary gas chromatography as described (86). The hydrophobicity index of biliary bile acids was calculated according to Heuman (87). In order to measure biliary phospholipids and cholesterol, lipids were extracted according to Bligh and Dyer (82). Biliary phospholipids were determined as previously described (83). Biliary and fecal cholesterol and its derivatives were trimethylsilylated with pyridine, N,O-Bis(trimethylsilyl) trifluoroacetaminde, and trimethylchlorosilane (ratio 50:50:1) and quantified by gas chromatography.
In vivo determination of de novo lipogenesis, chain elongation and cholesterol synhesisIn order to quantify fractional lipogenesis fluxes in the liver, mice received 2% sodium [1-13C]-acetate solution (241 mmol/L; 99 atom %, Isotec/Sigma-Aldrich, St. Louis, MO, US) via the drinking water during the final 48 hours before sacrifice. Hepatic lipids were hydrolyzed and derivatized as described (49). Fatty acids and cholesterol isotopomers were analyzed in hepatic lipid extracts using a Agilent 5975 series GC/MSD (Agilent Technologies, Santa Clara, CA, US). Normalized mass isotopomer distributions (88) were used in MIDA algorithms to calculate the acetyl-CoA precursor pool enrichments, fractional synthesis rate, chain elongation rates, and cholesterol synthesis rates in liver as described (49). Absolute fatty acid and
2020 07 03 Boekje 1.0.indd 1182020 07 03 Boekje 1.0.indd 118 24/07/2020 21:1324/07/2020 21:13

119
Pharmacological FXR activation in a mouse model for Glycogen Storage Disease type 1a
4
cholesterol synthesis were calculated from the fractional synthesis rates and hepatic fatty acid and cholesterol contents, and expressed per liver.
Plasma lipoprotein analysis Human and mouse plasma lipoproteins were separated by fast protein liquid chromatography (FPLC) gel filtration using a Superose 6 column (GE Healthcare, Uppsala, Sweden) as described earlier (89). Triglyceride and cholesterol contents of the collected fractions was determined using commercially available kits (Roche Diagnostics, Mannheim, Germany and Diasys, Holzheim, Germany).
L-PK enzyme capacities (Vmax)10% liver homogenates were prepared in cold PBS with phosphate inhibitor cocktail 2 and 3 (P5726 and P0044 resp., Sigma) and Complete Protease Inhibitor Cocktail (Sigma). Homogenates were centrifuged and supernatant was used for determining glycolytic enzyme capacities. Protein levels were measured using the Bicinchoninic Acid kit (BCA™ Protein Assay kit, Pierce). Vmax assays were performed with freshly prepared extracts in assay medium via NAD(P)H-linked assays at 37°C by adding 0.15 mM NADH or 0.4 mM NADP+, 1 mM ATP or ADP, and enzyme-specific substrates. Assay medium contained 150 mM potassium (90–93), 5 mM phosphate (90,94), 15 mM sodium (90,95), 155 mM chloride (96,97), 0.5 mM calcium, 0.5 mM free magnesium (90,98,99) and 0.5-10.5 mM sulfate, pH 7.0.
Gene expression analysisTotal RNA was isolated from liver tissue using TRI-Reagent (Sigma-Aldrich Corp., St. Louis, MO, US). cDNA was obtained by reverse transcription and amplified using primers and probes listed in Table S5. mRNA levels were calculated based on a dilution curve, normalized to the expression of the housekeeping gene 36b4 and further normalized to the mean expression in untreated L-G6pc+/+ mice.
Hepatic metabolome profiling and analysisFreeze-dried liver (2 mg) was collected in a 2 mL tube followed by the addition of 1 mL ice-cold methanol:water (1:1) containing the following internal standards: D3-aspartic acid, D3-serine, D5-glutamine, D3-glutamate, 13C3-pyruvate, 13C6-isoleucine, 13C6-glucose, 13C6-fructose-1,6-biphosphate, 13C6-G6P, adenosine-15N5-monophosphate and guanosine-15N5-monophosphate (5 μM). For the extraction of metabolites 1 mL of chloroform was added and the samples were needle sonicated (8 watt, 40 joule). The homogenate was centrifuged for 5 min at 14,000 rpm at 4 degrees Celsius. The “polar” top layer was transferred to a new 1.5 mL tube and dried in a vacuum concentrator. Dried samples were dissolved in 100 µL methanol:water (6:4; v/v). The metabolomic analysis was performed as described previously. Interpretation of the data was performed in the Xcalibur software (Thermo scientific). Statistical analysis of the acquired data were done in an R
2020 07 03 Boekje 1.0.indd 1192020 07 03 Boekje 1.0.indd 119 24/07/2020 21:1324/07/2020 21:13

120
Chapter 4
environment using the ggplot2, ropls and mixOmics packages (100–102). Statistical values are given in Table S3.
Hepatic lipidome profiling and analysisLipidomics was performed on homogenized, freeze dried liver tissue. Sample preparation, semi-quantitative analysis of the lipidome, and statistical analysis of the lipidomics data were performed as previously described (103–105). All used internal standards are listed in Table S8 (all lipid standards were purchased from Avanti Polar Lipids, Alabaster, AL, USA). The statistical programming language R and the mixOmics package (100) were used for statistical analysis of the lipid classes. Data was sorted by VIP score and the enrichment of top 50 (VIP>1) relative to the whole dataset was calculated by LION-enrichment analysis (106). Statistical values are given in Table S6.
Targeted proteomicsTargeted proteomics was applied to quantify protein levels in homogenized liver tissue and FPLC fractions via the isotopically labeled peptide standards (Table S9), containing 13C-labeled lysine/arginine (PolyQuant GmbH, Bad Abbach, Germany) according to the workflow described previously (30). Prior to the proteomics workflow, lipids were extracted from the liver homogenates using diethyl ether. The peptide concentrations were related to the total peptide content, which was determined by a colorimetric peptide assay after tryptic digestion and SPE cleanup (Thermo Scientific, Waltham, MA, USA). The levels of endogenous peptides were calculated from the known concentrations of the standards and expressed relative to the values in fed L-G6pc+/+ mice. Statistical values are given in Table S2.
Immunohistochemical analysisFrozen liver sections were stained with Oil Red O (ORO). Photomicrographs of five areas per section of liver were made at 200x magnification using the Olympus DP26 camera with Olympus cellSensTM Standard software (v1.18).
StatisticsStatistical analysis was performed using SPSS and BrightStat software (107). Differences between two or multiple groups were tested by Mann-Whitney U test or one-way ANOVA followed by post-hoc Bonferroni analysis, respectively. p-values < 0.05 were considered significant.
AcknowledgementsWe thank M. Koster, R. Havinga, I. Martini, A. Bleeker, N. Kloosterhuis, T. Boer, M. Koehorst, R. Boverhof, Y. van der Veen and K. Tholen for excellent technical assistance. Dr. Claus Kremoser (Phenex Pharmaceuticals AG) is kindly acknowledged for providing PX20606. This study was supported by an unrestricted research grant
2020 07 03 Boekje 1.0.indd 1202020 07 03 Boekje 1.0.indd 120 24/07/2020 21:1324/07/2020 21:13

121
Pharmacological FXR activation in a mouse model for Glycogen Storage Disease type 1a
4
from DSM Nutritional Products (Kaiseraugst, Switzerland) and co-financed by the Ministry of Economic Affairs and Climate Policy by means of the PPP-allowance made available by the Top Sector Life Sciences & Health to stimulate public private partnerships.
Disclosures PX20606 was used under conditions of a MTA with Gilead Inc.
2020 07 03 Boekje 1.0.indd 1212020 07 03 Boekje 1.0.indd 121 24/07/2020 21:1324/07/2020 21:13
122
Chapter 4
References1. Froissart R, Piraud M, Boudjemline A, Vianey-Saban C, Petit F, Hubert-Buron A, et al.
Glucose-6-phosphatase deficiency. Orphanet J. Rare Dis. 2011;6:27. 2. Bali DS, Chen Y-T, Austin S, Goldstein JL. Glycogen Storage Disease Type I [Internet].
Seattle: University of Washington, Seattle; 1993. 3. Chou JY, Matern D, Mansfield BC, Chen Y-T. Type I glycogen storage diseases: disorders
of the glucose-6-phosphatase complex. Curr. Mol. Med. 2002;2:121–43. 4. Bandsma RHJ, Rake J-P, Visser G, Neese RA, Hellerstein MK, van Duyvenvoorde W, et
al. Increased lipogenesis and resistance of lipoproteins to oxidative modification in two patients with glycogen storage disease type 1a. J. Pediatr. 2002;140:256–260.
5. Bandsma RHJ, Prinsen BH, de Sain-van der Velden M, Rake J-P, Boer T, Smit GPA, et al. Increased de novo Lipogenesis and Delayed Conversion of Large VLDL into Intermediate Density Lipoprotein Particles Contribute to Hyperlipidemia in Glycogen Storage Disease Type 1a. Pediatr. Res. 2008;63:702–707.
6. Derks TGJ, van Rijn M. Lipids in hepatic glycogen storage diseases: pathophysiology, monitoring of dietary management and future directions. J. Inherit. Metab. Dis. 2015;38:537–43.
7. Rake JP, Visser G, Labrune P, Leonard J V., Ullrich K, Smit GPA. Glycogen storage disease type I: diagnosis, management, clinical course and outcome. Results of the European study on glycogen storage disease type I (ESGSD I). Eur. J. Pediatr. 2002;161:S20–S34.
8. McAdams AJ, Hug G, Bove KE. Glycogen storage disease, types I to X: criteria for morphologic diagnosis. Hum. Pathol. 1974;5:463–87.
9. Bandsma RHJ, Peter AG, Smit A, Kuipers F. Disturbed lipid metabolism in glycogen storage disease type 1. Eur. J. Pediatr. 2002;161:S65–S69.
10. Postic C, Girard J. Contribution of de novo fatty acid synthesis to hepatic steatosis and insulin resistance: lessons from genetically engineered mice. J. Clin.Invest. 2008;118:829–38.
11. Peeks F, Steunenberg TAH, de Boer F, Rubio-Gozalbo ME, Williams M, Burghard R, et al. Clinical and biochemical heterogeneity between patients with glycogen storage disease type IA: the added value of CUSUM for metabolic control. J. Inherit. Metab. Dis. 2017;40:695–702.
12. Bandsma RHJ, Smit GPA, Reijngoud D-J, Kuipers F. Adiponectin levels correlate with the severity of hypertriglyceridaemia in glycogen storage disease Ia. J. Inherit. Metab. Dis. 2009;32 Suppl 1:S27-31.
13. Wierzbicki AS, Watt GF, Lynas J, Winder AF, Wray R. Very low-density lipoprotein apolipoprotein B-100 turnover in glycogen storage disease type Ia (von Gierke disease). J. Inherit. Metab. Dis. 2001;24:527–34.
14. Levy E, Thibault LA, Roy CC, Bendayan M, Lepage G, Letarte J. Circulating lipids and lipoproteins in glycogen storage disease type I with nocturnal intragastric feeding. J. Lipid Res. 1988;29:215–26.
15. Chávez-Talavera O, Tailleux A, Lefebvre P, Staels B. Bile Acid Control of Metabolism and
2020 07 03 Boekje 1.0.indd 1222020 07 03 Boekje 1.0.indd 122 24/07/2020 21:1324/07/2020 21:13

123
Pharmacological FXR activation in a mouse model for Glycogen Storage Disease type 1a
4
Inflammation in Obesity, Type 2 Diabetes, Dyslipidemia, and Nonalcoholic Fatty Liver Disease. Gastroenterology. 2017;152:1679-1694.e3.
16. Makishima M, Okamoto AY, Repa JJ, Tu H, Learned RM, Luk A, et al. Identification of a nuclear receptor for bile acids. Science. 1999;284:1362–5.
17. Kobayashi M, Ikegami H, Fujisawa T, Nojima K, Kawabata Y, Noso S, et al. Prevention and Treatment of Obesity, Insulin Resistance, and Diabetes by Bile Acid-Binding Resin. Diabetes. 2007;56:239–247.
18. Sinal CJ, Tohkin M, Miyata M, Ward JM, Lambert G, Gonzalez FJ. Targeted Disruption of the Nuclear Receptor FXR/BAR Impairs Bile Acid and Lipid Homeostasis. Cell. 2000;102:731–744.
19. Ma K, Saha PK, Chan L, Moore DD. Farnesoid X receptor is essential for normal glucose homeostasis. J. Clin. Invest. 2006;116:1102–9.
20. Cariou B, van Harmelen K, Duran-Sandoval D, van Dijk T, Grefhorst A, Bouchaert E, et al. Transient impairment of the adaptive response to fasting in FXR-deficient mice. FEBS Lett. 2005;579:4076–4080.
21. Duran-Sandoval D, Cariou B, Percevault F, Hennuyer N, Grefhorst A, van Dijk TH, et al. The Farnesoid X Receptor Modulates Hepatic Carbohydrate Metabolism during the Fasting-Refeeding Transition. J. Biol. Chem. 2005;280:29971–29979.
22. Lu TT, Makishima M, Repa JJ, Schoonjans K, Kerr TA, Auwerx J, et al. Molecular Basis for Feedback Regulation of Bile Acid Synthesis by Nuclear Receptors. Mol. Cell. 2000;6:507–515.
23. Goodwin B, Jones SA, Price RR, Watson MA, McKee DD, Moore LB, et al. A Regulatory Cascade of the Nuclear Receptors FXR, SHP-1, and LRH-1 Represses Bile Acid Biosynthesis. Mol. Cell. 2000;6:517–526.
24. Kong B, Wang L, Chiang JYL, Zhang Y, Klaassen CD, Guo GL. Mechanism of tissue-specific farnesoid X receptor in suppressing the expression of genes in bile-acid synthesis in mice. Hepatology. 2012;56:1034–43.
25. Song K-H, Li T, Owsley E, Strom S, Chiang JYL. Bile acids activate fibroblast growth factor 19 signaling in human hepatocytes to inhibit cholesterol 7α-hydroxylase gene expression. Hepatology. 2009;49:297–305.
26. Yu C, Wang F, Jin C, Huang X, McKeehan WL. Independent Repression of Bile Acid Synthesis and Activation of c-Jun N-terminal Kinase (JNK) by Activated Hepatocyte Fibroblast Growth Factor Receptor 4 (FGFR4) and Bile Acids. J. Biol. Chem. 2005;280:17707–17714.
27. Inagaki T, Choi M, Moschetta A, Peng L, Cummins CL, McDonald JG, et al. Fibroblast growth factor 15 functions as an enterohepatic signal to regulate bile acid homeostasis. Cell Metab. 2005;2:217–225.
28. Lambert G, Amar MJA, Guo G, Brewer HB, Gonzalez FJ, Sinal CJ. The farnesoid X-receptor is an essential regulator of cholesterol homeostasis. J. Biol. Chem. 2003;278:2563–70.
29. Berge KE, Tian H, Graf GA, Yu L, Grishin N V, Schultz J, et al. Accumulation of dietary cholesterol in sitosterolemia caused by mutations in adjacent ABC transporters. Science
2020 07 03 Boekje 1.0.indd 1232020 07 03 Boekje 1.0.indd 123 24/07/2020 21:1324/07/2020 21:13

124
Chapter 4
(80-. ). 2001;290:1771–1775. 30. de Boer JF, Schonewille M, Boesjes M, Wolters H, Bloks VW, Bos T, et al. Intestinal
Farnesoid X Receptor Controls Transintestinal Cholesterol Excretion in Mice. Gastroenterology. 2017;152:1126-1138.e6.
31. Watanabe M, Houten SM, Wang L, Moschetta A, Mangelsdorf DJ, Heyman RA, et al. Bile acids lower triglyceride levels via a pathway involving FXR, SHP, and SREBP-1c. J. Clin. Invest. 2004;113:1408–18.
32. Horton JD, Goldstein JL, Brown MS. SREBPs: activators of the complete program of cholesterol and fatty acid synthesis in the liver. J. Clin. Invest. 2002;109:1125–1131.
33. Kast HR, Nguyen CM, Sinal CJ, Jones SA, Laffitte BA, Reue K, et al. Farnesoid X-Activated Receptor Induces Apolipoprotein C-II Transcription: a Molecular Mechanism Linking Plasma Triglyceride Levels to Bile Acids. Mol. Endocrinol. 2001;15:1720–1728.
34. Claudel T, Inoue Y, Barbier O, Duran-Sandoval D, Kosykh V, Fruchart J, et al. Farnesoid X receptor agonists suppress hepatic apolipoprotein CIII expression. Gastroenterology. 2003;125:544–555.
35. Hirokane H, Nakahara M, Tachibana S, Shimizu M, Sato R. Bile acid reduces the secretion of very low density lipoprotein by repressing microsomal triglyceride transfer protein gene expression mediated by hepatocyte nuclear factor-4. J. Biol. Chem. 2004;279:45685–92.
36. Caron S, Huaman Samanez C, Dehondt H, Ploton M, Briand O, Lien F, et al. Farnesoid X Receptor Inhibits the Transcriptional Activity of Carbohydrate Response Element Binding Protein in Human Hepatocytes. Mol. Cell. Biol. 2013;33:2202–2211.
37. Benhamed F, Filhoulaud G, Caron S, Lefebvre P, Staels B, Postic C. O-GlcNAcylation Links ChREBP and FXR to Glucose-Sensing. Front. Endocrinol. (Lausanne). 2014;5:230.
38. Ploton M, Mazuy C, Gheeraert C, Dubois V, Berthier A, Dubois-Chevalier J, et al. The nuclear bile acid receptor FXR is a PKA- and FOXA2-sensitive activator of fasting hepatic gluconeogenesis. J. Hepatol. 2018;69:1099–1109.
39. Zhang Y, Edwards PA. FXR signaling in metabolic disease. FEBS Lett. 2008;582:10–18. 40. Neuschwander-Tetri PBA, Loomba R, Sanyal PAJ, Lavine PJE, Natta ML Van, Abdelmalek
MF, et al. Farnesoid X nuclear receptor ligand obeticholic acid for non-cirrhotic, non-alcoholic steatohepatitis (FLINT): a multicentre, randomised, placebo-controlled trial. Lancet. 2015;385:956.
41. Zhang Y, Lee FY, Barrera G, Lee H, Vales C, Gonzalez FJ, et al. Activation of the nuclear receptor FXR improves hyperglycemia and hyperlipidemia in diabetic mice. Proc. Natl. Acad. Sci. U. S. A. 2006;103:1006–11.
42. Cariou B. The farnesoid X receptor (FXR) as a new target in non-alcoholic steatohepatitis. Diabetes Metab. 2008;34:685–691.
43. Zhang S, Wang J, Liu Q, Harnish DC. Farnesoid X receptor agonist WAY-362450 attenuates liver inflammation and fibrosis in murine model of non-alcoholic steatohepatitis. J. Hepatol. 2009;51:380–388.
44. Cipriani S, Mencarelli A, Palladino G, Fiorucci S. FXR activation reverses insulin
2020 07 03 Boekje 1.0.indd 1242020 07 03 Boekje 1.0.indd 124 24/07/2020 21:1324/07/2020 21:13

125
Pharmacological FXR activation in a mouse model for Glycogen Storage Disease type 1a
4
resistance and lipid abnormalities and protects against liver steatosis in Zucker (fa/fa) obese rats. J. Lipid Res. 2010;51:771–84.
45. Comeglio P, Cellai I, Mello T, Filippi S, Maneschi E, Corcetto F, et al. INT-767 prevents NASH and promotes visceral fat brown adipogenesis and mitochondrial function. J. Endocrinol. 2018;238:107–127.
46. Mutel E, Abdul-Wahed A, Ramamonjisoa N, Stefanutti A, Houberdon I, Cavassila S, et al. Targeted deletion of liver glucose-6 phosphatase mimics glycogen storage disease type 1a including development of multiple adenomas. J. Hepatol. 2011;54:529–537.
47. Hambruch E, Miyazaki-Anzai S, Hahn U, Matysik S, Boettcher A, Perović-Ottstadt S, et al. Synthetic farnesoid X receptor agonists induce high-density lipoprotein-mediated transhepatic cholesterol efflux in mice and monkeys and prevent atherosclerosis in cholesteryl ester transfer protein transgenic low-density lipoprotein receptor (-/-) mice. J. Pharmacol. Exp. Ther. 2012;343:556–567.
48. Hoogerland JA, Lei Y, Wolters JC, de Boer JF, Bos T, Bleeker A, et al. Glucose‐6‐phosphate regulates hepatic bile acid synthesis in mice. Hepatology. 2019;hep.30778.
49. Oosterveer MH, van Dijk TH, Tietge UJF, Boer T, Havinga R, Stellaard F, et al. High fat feeding induces hepatic fatty acid elongation in mice. PLoS One. 2009;4:e6066.
50. Yan D, Lehto M, Rasilainen L, Metso J, Ehnholm C, Ylä-Herttuala S, et al. Oxysterol Binding Protein Induces Upregulation of SREBP-1c and Enhances Hepatic Lipogenesis. Arterioscler. Thromb. Vasc. Biol. 2007;27:1108–1114.
51. Saggerson D. Malonyl-CoA, a Key Signaling Molecule in Mammalian Cells. 2008;52. Schwabl P, Hambruch E, Seeland BA, Hayden H, Wagner M, Garnys L, et al. The FXR
agonist PX20606 ameliorates portal hypertension by targeting vascular remodelling and sinusoidal dysfunction. J. Hepatol. 2017;66:724–733.
53. Chong HK, Infante AM, Seo Y-K, Jeon T-I, Zhang Y, Edwards PA, et al. Genome-wide interrogation of hepatic FXR reveals an asymmetric IR-1 motif and synergy with LRH-1. Nucleic Acids Res. 2010;38:6007–17.
54. Xie C, Jiang C, Shi J, Gao X, Sun D, Sun L, et al. An Intestinal Farnesoid X Receptor-Ceramide Signaling Axis Modulates Hepatic Gluconeogenesis in Mice. Diabetes. 2017;66:613–626.
55. Groen AK, van Roermund CW, Vervoorn RC, Tager JM. Control of gluconeogenesis in rat liver cells. Flux control coefficients of the enzymes in the gluconeogenic pathway in the absence and presence of glucagon. Biochem. J. 1986;237:379–89.
56. Burgess SC, He TT, Yan Z, Lindner J, Sherry AD, Malloy CR, et al. Cytosolic Phosphoenolpyruvate Carboxykinase Does Not Solely Control the Rate of Hepatic Gluconeogenesis in the Intact Mouse Liver. Cell Metab. 2007;5:313–320.
57. Hijmans BS, Boss A, van Dijk TH, Soty M, Wolters H, Mutel E, et al. Hepatocytes contribute to residual glucose production in a mouse model for glycogen storage disease type Ia. Hepatology. 2017;66:2042–2054.
58. Von Wilamowitz-Moellendorff A, Hunter RW, García-Rocha M, Kang L, López-Soldado I, Lantier L, et al. Glucose-6-phosphate-mediated activation of liver glycogen synthase
2020 07 03 Boekje 1.0.indd 1252020 07 03 Boekje 1.0.indd 125 24/07/2020 21:1324/07/2020 21:13

126
Chapter 4
plays a key role in hepatic glycogen synthesis. Diabetes. 2013;62:4070–4082. 59. Lei Y, Hoogerland JA, Bloks VW, Bos T, Bleeker A, Wolters H, et al. Hepatic ChREBP
activation limits NAFLD development in a mouse model for Glycogen Storage Disease type Ia Author names. Hepatology. 2020;0–2.
60. Mudaliar S, Henry RR, Sanyal AJ, Morrow L, Marschall H, Kipnes M, et al. Efficacy and Safety of the Farnesoid X Receptor Agonist Obeticholic Acid in Patients With Type 2 Diabetes and Nonalcoholic Fatty Liver Disease. Gastroenterology. 2013;145:574-582.e1.
61. Mao J, DeMayo FJ, Li H, Abu-Elheiga L, Gu Z, Shaikenov TE, et al. Liver-specific deletion of acetyl-CoA carboxylase 1 reduces hepatic triglyceride accumulation without affecting glucose homeostasis. Proc. Natl. Acad. Sci. 2006;103:8552–8557.
62. Harada N, Oda Z, Hara Y, Fujinami K, Okawa M, Ohbuchi K, et al. Hepatic De Novo Lipogenesis Is Present in Liver-Specific ACC1-Deficient Mice. Mol. Cell. Biol. 2007;27:1881–1888.
63. Loomba R, Kayali Z, Noureddin M, Ruane P, Lawitz EJ, Bennett M, et al. GS-0976 Reduces Hepatic Steatosis and Fibrosis Markers in Patients With Nonalcoholic Fatty Liver Disease. Gastroenterology. 2018;155:1463-1473.e6.
64. Lawitz EJ, Coste A, Poordad F, Alkhouri N, Loo N, McColgan BJ, et al. Acetyl-CoA Carboxylase Inhibitor GS-0976 for 12 Weeks Reduces Hepatic De Novo Lipogenesis and Steatosis in Patients With Nonalcoholic Steatohepatitis. Clin. Gastroenterol. Hepatol. 2018;16:1983-1991.e3.
65. Syed‐Abdul MM, Parks EJ, Gaballah AH, Bingham K, Hammoud GM, Kemble G, et al. First‐in‐class fatty acid synthase inhibitor TVB‐2640 reduces hepatic de novo lipogenesis in males with metabolic abnormalities. Hepatology. 2019;
66. Stiede K, Miao W, Blanchette HS, Beysen C, Harriman G, Harwood HJ, et al. Acetyl-coenzyme A carboxylase inhibition reduces de novo lipogenesis in overweight male subjects: A randomized, double-blind, crossover study. Hepatology. 2017;66:324–334.
67. Goedeke L, Bates J, Vatner DF, Perry RJ, Wang T, Ramirez R, et al. Acetyl-CoA Carboxylase Inhibition Reverses NAFLD and Hepatic Insulin Resistance but Promotes Hypertriglyceridemia in Rodents. Hepatology. 2018;68:2197–2211.
68. Kim C-W, Addy C, Kusunoki J, Anderson NN, Deja S, Fu X, et al. Acetyl CoA Carboxylase Inhibition Reduces Hepatic Steatosis but Elevates Plasma Triglycerides in Mice and Humans: A Bedside to Bench Investigation. Cell Metab. 2017;26:394-406.e6.
69. Monteillet L, Gjorgjieva M, Silva M, Verzieux V, Imikirene L, Duchampt A, et al. Intracellular lipids are an independent cause of liver injury and chronic kidney disease in non alcoholic fatty liver disease-like context. Mol. Metab. 2018;16:100–115.
70. Yavarow ZA, Kang H-R, Waskowicz LR, Bay B-H, Young SP, Yen PM, et al. Fenofibrate rapidly decreases hepatic lipid and glycogen storage in neonatal mice with glycogen storage disease type Ia. Hum. Mol. Genet. 2019;
71. Waskowicz LR, Zhou J, Landau DJ, Brooks ED, Lim A, Yavarow ZA, et al. Bezafibrate induces autophagy and improves hepatic lipid metabolism in glycogen storage disease type Ia. Hum. Mol. Genet. 2019;28:143–154.
2020 07 03 Boekje 1.0.indd 1262020 07 03 Boekje 1.0.indd 126 24/07/2020 21:1324/07/2020 21:13

127
Pharmacological FXR activation in a mouse model for Glycogen Storage Disease type 1a
4
72. van Zutphen T, Stroeve JHM, Yang J, Bloks VW, Jurdzinski A, Roelofsen H, et al. FXR overexpression alters adipose tissue architecture in mice and limits its storage capacity leading to metabolic derangements. J. Lipid Res. 2019;60:1547–1561.
73. Abdelkarim M, Caron S, Duhem C, Prawitt J, Dumont J, Lucas A, et al. The farnesoid X receptor regulates adipocyte differentiation and function by promoting peroxisome proliferator-activated receptor-gamma and interfering with the Wnt/beta-catenin pathways. J. Biol. Chem. 2010;285:36759–67.
74. Cariou B, van Harmelen K, Duran-Sandoval D, van Dijk TH, Grefhorst A, Abdelkarim M, et al. The Farnesoid X Receptor Modulates Adiposity and Peripheral Insulin Sensitivity in Mice.
75. Cyphert HA, Ge X, Kohan AB, Salati LM, Zhang Y, Hillgartner FB. Activation of the farnesoid X receptor induces hepatic expression and secretion of fibroblast growth factor 21. J. Biol. Chem. 2012;287:25123–38.
76. Perry RJ, Camporez J-PG, Kursawe R, Titchenell PM, Zhang D, Perry CJ, et al. Hepatic acetyl CoA links adipose tissue inflammation to hepatic insulin resistance and type 2 diabetes. Cell. 2015;160:745–758.
77. Kumashiro N, Beddow SA, Vatner DF, Majumdar SK, Cantley JL, Guebre-Egziabher F, et al. Targeting pyruvate carboxylase reduces gluconeogenesis and adiposity and improves insulin resistance. Diabetes. 2013;62:2183–94.
78. White HM, Koser SL, Donkin SS. Differential regulation of bovine pyruvate carboxylase promoters by fatty acids and peroxisome proliferator-activated receptor-α agonist. J. Dairy Sci. 2011;94:3428–36.
79. Correia JC, Massart J, de Boer JF, Porsmyr-Palmertz M, Martínez-Redondo V, Agudelo LZ, et al. Bioenergetic cues shift FXR splicing towards FXRα2 to modulate hepatic lipolysis and fatty acid metabolism. Mol. Metab. 2015;4:891–902.
80. Brunham LR, Kruit JK, Iqbal J, Fievet C, Timmins JM, Pape TD, et al. Intestinal ABCA1 directly contributes to HDL biogenesis in vivo. J. Clin. Invest. 2006;116:1052–62.
81. Kruit J-K, Groen AK, van Berkel TJ, Kuipers F. Emerging roles of the intestine in control of cholesterol metabolism. World J. Gastroenterol. 2006;12:6429–39.
82. Bligh EG, Dyer WJ. A rapid method of total lipid extraction and purification. Can. J. Biochem. Physiol. 1959;37:911–917.
83. Bottcher C, van Gent C, Pries C. A rapid and sensitive sub-micro-phosphorus determination. Anal. Chim. Acta. 1961;24:203–204.
84. Muskiet FA, van Doormaal JJ, Martini IA, Wolthers BG, van der Slik W. Capillary gas chromatographic profiling of total long-chain fatty acids and cholesterol in biological materials. J. Chromatogr. 1983;278:231–44.
85. Bergmeyer HU. Methods of enzymatic analysis [Internet]. In: Bergmeyer HU, editor. Methods of enzymetic analysis. Weinheim Germany: Verlag Chemie; 1974. p. 1089–1204.
86. Out C, Patankar J V, Doktorova M, Boesjes M, Bos T, de Boer S, et al. Gut microbiota inhibit Asbt-dependent intestinal bile acid reabsorption via Gata4. J. Hepatol. 2015;63:697–704.
87. Heuman DM. Quantitative estimation of the hydrophilic- hydrophobic balance of mixed
2020 07 03 Boekje 1.0.indd 1272020 07 03 Boekje 1.0.indd 127 24/07/2020 21:1324/07/2020 21:13

128
Chapter 4
bile salt solutions. J. Lipid Res. 1989;30:719–30. 88. Lee W-NP, Byerley LO, Bergner EA, Edmond J. Mass isotopomer analysis: Theoretical
and practical considerations. Biol. Mass Spectrom. 1991;20:451–458. 89. Tietge UJ, Maugeais C, Cain W, Grass D, Glick JM, de Beer FC, et al. Overexpression
of secretory phospholipase A(2) causes rapid catabolism and altered tissue uptake of high density lipoprotein cholesteryl ester and apolipoprotein A-I. J. Biol. Chem. 2000;275:10077–84.
90. Guynn RW, Veloso D, Lawson JW, Veech RL. The concentration and control of cytoplasmic free inorganic pyrophosphate in rat liver in vivo. Biochem. J. 1974;140:369–75.
91. Kristensen LO. Associations between transports of alanine and cations across cell membrane in rat hepatocytes. Am. J. Physiol. 1986;251:G575-84.
92. Rorsman P, Trube G. Glucose dependent K+-channels in pancreatic beta-cells are regulated by intracellular ATP. Pflugers Arch. 1985;405:305–9.
93. Tschopp J, Schroder K. NLRP3 inflammasome activation: The convergence of multiple signalling pathways on ROS production? Nat. Rev. Immunol. 2010;10:210–5.
94. Conley KE, Blei ML, Richards TL, Kushmerick MJ, Jubrias SA. Activation of glycolysis in human muscle in vivo. Am. J. Physiol. Physiol. 1997;273:C306–C315.
95. Lidofsky SD, Xie MH, Sostman A, Scharschmidt BF, Fitz JG. Vasopressin increases cytosolic sodium concentration in hepatocytes and activates calcium influx through cation-selective channels. J. Biol. Chem. 1993;268:14632–6.
96. Breitwieser GE, Altamirano AA, Russell JM. Osmotic stimulation of Na(+)-K(+)-Cl- cotransport in squid giant axon is [Cl-]i dependent. Am. J. Physiol. 1990;258:C749-53.
97. Janssen LJ, Sims SM. Acetylcholine activates non-selective cation and chloride conductances in canine and guinea-pig tracheal myocytes. J. Physiol. 1992;453:197–218.
98. Ingwall JS. Phosphorus nuclear magnetic resonance spectroscopy of cardiac and skeletal muscles. Am. J. Physiol. Circ. Physiol. 1982;242:H729–H744.
99. Murphy E, Steenbergen C, Levy LA, Raju B, London RE. Cytosolic free magnesium levels in ischemic rat heart. J. Biol. Chem. 1989;264:5622–7.
100. Rohart F, Gautier B, Singh A, Lê Cao KA. mixOmics: An R package for ‘omics feature selection and multiple data integration. PLoS Comput. Biol. 2017;13.
101. Thévenot EA, Roux A, Xu Y, Ezan E, Junot C. Analysis of the Human Adult Urinary Metabolome Variations with Age, Body Mass Index, and Gender by Implementing a Comprehensive Workflow for Univariate and OPLS Statistical Analyses. J. Proteome Res. 2015;14:3322–35.
102. Hadley W. ggplot2. 1st ed. New York: Springer-Verlag; 2009. 103. Herzog K, Pras-Raves ML, Vervaart MAT, Luyf ACM, Van Kampen AHC, Wanders
RJA, et al. Lipidomic analysis of fibroblasts from Zellweger spectrum disorder patients identifies disease-specific phospholipid ratios. J. Lipid Res. 2016;57:1447–1454.
104. Houtkooper RH, Rodenburg RJ, Thiels C, Lenthe H van, Stet F, Poll-The BT, et al. Cardiolipin and monolysocardiolipin analysis in fibroblasts, lymphocytes, and tissues using high-performance liquid chromatography-mass spectrometry as a diagnostic test
2020 07 03 Boekje 1.0.indd 1282020 07 03 Boekje 1.0.indd 128 24/07/2020 21:1324/07/2020 21:13

129
Pharmacological FXR activation in a mouse model for Glycogen Storage Disease type 1a
4
for Barth syndrome. Anal. Biochem. 2009;387:230–237. 105. Koop AMC, Hagdorn QAJ, Bossers GPL, van Leusden T, Gerding A, van Weeghel M, et
al. Right ventricular pressure overload alters cardiac lipid composition. Int. J. Cardiol. 2019;287:96–105.
106. Molenaar MR, Jeucken A, Wassenaar TA, Van De Lest CHA, Brouwers JF, Helms JB. LION/web: A web-based ontology enrichment tool for lipidomic data analysis. Gigascience. 2019;8.
107. Stricker D. BrightStat.com: Free statistics online. Comput. Methods Programs Biomed. 2008;92:135–143.
2020 07 03 Boekje 1.0.indd 1292020 07 03 Boekje 1.0.indd 129 24/07/2020 21:1324/07/2020 21:13

130
Chapter 4
Supplemental Material
Figure S1: (A) Representative pictures of livers and of H&E stained livers sections of L-G6pc+/+ and L-G6pc-/- mice treated with PX or control diet. (B) Liver weight and (C) hepatic mRNA levels in L-G6pc+/+ and L-G6pc-/- mice treated with PX or control diet. Data represent Tukey boxplots. ***p < 0.001, *p < 0.05 indicates significance compared to control diet. ###p < 0.001 indicates significance compared to wildtype littermates.
Figure S2: (A) Representative pictures of Oil-red-O stained liver sections and (B) hepatic cholesterol esters and phospholipids in L-G6pc+/+ and L-G6pc-/- mice treated with PX or control diet. (C) Hepatic gene expression levels and (D) protein abundances in L-G6pc+/+ and L-G6pc-/- mice treated with PX or control diet. (E) Plasma triglyceride levels and (F) triglyceride concentrations in lipoprotein fractions of L-G6pc+/+ and L-G6pc-/- mice treated with PX or control diet. Data represent Tukey boxplots. ###p < 0.001, ##p < 0.01, #p < 0.05 indicates significance compared to wildtype littermates.
2020 07 03 Boekje 1.0.indd 1302020 07 03 Boekje 1.0.indd 130 24/07/2020 21:1324/07/2020 21:13

131
Pharmacological FXR activation in a mouse model for Glycogen Storage Disease type 1a
4
Figure S3: (A) Fecal neutral sterol excretion and (B) dietary cholesterol intake in L-G6pc+/+ and L-G6pc-/- mice treated with PX or control diet. (C) Total hepatic cholesterol content and (D) biliary cholesterol concentrations in L-G6pc+/+ and L-G6pc-/- mice treated with PX or control diet. (E) Hepatic gene expression levels in L-G6pc+/+ and L-G6pc-/- mice treated with PX or control diet. (F) Relative protein abundance in lipoprotein fractions of L-G6pc+/+ and L-G6pc-/- mice treated with PX or control diet. Data represent Tukey boxplots. ***p < 0.001, **p < 0.01, *p < 0.05 indicates signifi cance compared to control diet. ###p < 0.001, ##p < 0.01, #p < 0.05 indicates signifi cance compared to wildtype littermates.
2020 07 03 Boekje 1.0.indd 1312020 07 03 Boekje 1.0.indd 131 24/07/2020 21:1324/07/2020 21:13

132
Chapter 4
Tabl
e S1
. Bile
cha
ract
eris
tics
in L
-G6p
c-/- m
ice
and
wild
type
litte
rmat
es u
pon
FXR
act
ivat
ion
with
PX
2060
6
L-G
6pc+/
+ con
trol
L-G
6pc+/
+ PX
L-
G6p
c-/- c
ontro
l L-
G6p
c-/- P
X
M
edia
n (R
ange
) M
edia
n (R
ange
) p-
valu
e M
edia
n (R
ange
) M
edia
n (R
ange
) p-
valu
e Bo
dy w
eigh
t (g)
28
.5 (2
7.4-
30.4
) 29
.3 (2
7.6-
31.0
) 0.
000
28.4
(27.
4-30
.5)
29.5
(27.
4-32
.2)
0.31
8 Bi
le fl
ow (µ
l/min
/100
g BW
) 11
.6 (6
.4-1
0.0)
14
.2 (1
0.3-
19.4
) 0.
018
15.8
(11.
7-17
.7)
22.8
(14.
2-24
.7)
0.07
2 Ph
osph
olip
id s
ecre
tion
(nm
ol/m
in/1
00g
BW)
92.7
(41.
4-10
2.5)
63
.8 (3
7.3-
91.2
) 0.
164
116.
4 (8
2.1-
139.
1)
49.3
(14.
4-72
.9)
0.00
0
Cho
lest
erol
sec
retio
n (n
mol
/min
/100
g BW
) 5.
9 (4
.4-7
.6)
10.0
(7.3
-18.
5)
0.00
2 6.
3 (3
.6-6
.8)
6.3
(2.0
-7.7
) 0.
902
Bilia
ry b
ile a
cid
secr
etio
n (n
mol
/min
/100
g BW
) 58
0.5
(189
.5-8
91.7
) 28
4.7
(219
.0-3
87.4
) 0.
208
542.
7 (3
68.6
-626
.3)
242.
7 (1
09.6
-410
.6)
0.00
2
Bile
aci
d sp
ecie
s se
cret
ion
(nm
ol/m
in/1
00g
BW)
CA
4.
88 (0
.39-
29.1
9)
n.d.
0.
000
2.82
(1.1
5-4.
57)
0.79
(0.6
3-0.
94)
0.05
6 G
CA
0.
47 (0
.20-
0.65
) n.
d.
0.00
0 0.
67 (0
.31-
0.71
) n.
d.
0.00
0 TC
A 19
4.04
(53.
94-2
58.8
8)
8.00
(4.9
1-16
.14)
0.
000
242.
43 (1
79.2
6-32
2.83
) 46
.47
(24.
17-9
1.83
) 0.
000
TUD
CA
5.
55 (1
.73-
7.20
) 5.
28 (3
.67-
7.30
) 0.
804
3.11
(1.3
3-4.
40)
3.21
(1.4
1-7.
00)
0.71
0 TC
DC
A
2.64
(1.6
2-4.
44)
1.82
(1.2
2-2.
99)
0.16
4 3.
07 (1
.33-
4.68
) 2.
09 (0
.65-
3.26
) 0.
260
TDC
A
8.43
(0.3
6-16
.52)
0.
52 (0
.39-
1.76
) 0.
384
9.68
(1.5
7-24
.99)
0.
67 (0
.43-
1.62
) 0.
002
THD
CA
1.
09 (0
.34-
2.56
) 0.
55 (0
.26-
0.98
) 0.
352
1.03
(0.3
9-1.
97)
0.77
(0.6
7-0.
88)
0.57
2 α-
MC
A
0.58
(0.5
1-5.
56)
n.d.
0.
000
n.d.
n.
d.
β-
MC
A
2.06
(1.2
6-12
.06)
0.
67 (0
.28-
0.87
) 0.
000
n.d.
n.
d.
Tα
-MC
A 17
.56
(6.8
9-29
.63)
17
.48
(10.
57-2
6.44
) 1.
000
12.6
1 (7
.13-
16.9
8)
18.6
1 (6
.94-
34.5
4)
0.16
4 Tβ
-MC
A
71.7
1 (3
0.45
-193
.00)
10
0.93
(66.
22-1
61.4
4)
0.26
0 22
.74
(12.
39-3
2.98
) 73
.80
(15.
50-1
26.5
5)
0.01
8 ω
-MC
A
3.69
(0.8
2-6.
56)
0.75
(0.5
0-0.
85)
0.00
0 n.
d.
n.d.
Feca
l bile
aci
d se
cret
ion
(µm
ol/d
ay/1
00g
BW)
10.0
(6.9
-14.
9)
6.4
(3.2
-11.
9)
0.16
4 10
.5 (7
.4-1
6.4)
3.
0 (2
.3-9
.2)
0.00
0
n.d.
; not
det
ecte
d
2020 07 03 Boekje 1.0.indd 1322020 07 03 Boekje 1.0.indd 132 24/07/2020 21:1324/07/2020 21:13

133
Pharmacological FXR activation in a mouse model for Glycogen Storage Disease type 1a
4
Tabl
e S2
. Sta
tistic
al v
alue
s of
pro
tein
s of
gly
coly
sis/
gluc
oneo
gene
sis,
TC
A c
ycle
, PP
P a
nd β
-oxi
datio
n in
L-G
6pc-/-
mic
e an
d w
ildty
pe li
tterm
ates
upo
n FX
R a
ctiv
atio
n w
ith P
X206
06
L-
G6p
c+/+
chow
vs
L-G
6pc+/
+ PX
L-
G6p
c-/- c
how
vs
L-G
6pc-/-
PX
L-G
6pc+/
+ ch
ow v
s L-
G6p
c-/- c
how
L-
G6p
c+/+
PX
vs
L-G
6pc-/-
PX
Fo
ld c
hang
e p-
valu
e Fo
ld c
hang
e p-
valu
e Fo
ld c
hang
e p-
valu
e Fo
ld c
hang
e p-
valu
e G
lyco
lysi
s/G
luco
neog
enes
is
GC
K
0,89
0,
233
0,94
0,
541
1,26
0,
030
1,34
0,
881
GP
I1
0,84
0,
098
1,14
0,
241
4,24
0,
000
5,72
0,
000
ALD
OB
0,
94
0,54
7 1,
08
0,65
3 3,
30
0,00
2 3,
77
0,00
0 G
AP
DH
0,
86
0,13
1 1,
27
0,06
1 1,
63
0,00
6 2,
39
0,00
0 P
GK
1 1,
05
0,46
3 1,
06
0,65
6 1,
17
0,23
0 1,
17
0,07
9 P
GM
1 0,
95
0,67
9 1,
22
0,12
4 0,
69
0,01
4 0,
88
0,26
4 E
NO
1 1,
00
0,97
3 1,
14
0,28
3 1,
68
0,00
3 1,
90
0,00
1 P
CK
1 0,
77
0,05
5 1,
06
0,70
7 1,
03
0,86
0 1,
41
0,00
7 TC
A c
ycle
D
LD
1,09
0,
393
1,54
0,
002
0,74
0,
011
1,04
0,
697
DLA
T 0,
98
0,81
5 1,
28
0,03
7 0,
82
0,08
2 1,
08
0,44
7 P
CX
1,
23
0,07
0 1,
59
0,00
2 1,
01
0,91
1 1,
31
0,01
7 M
DH
2 1,
09
0,50
9 1,
19
0,24
3 0,
82
0,15
1 0,
89
0,41
0 C
S
0,98
0,
868
1,19
0,
152
1,03
0,
759
1,25
0,
060
AC
O2
0,98
0,
807
1,04
0,
733
1,00
0,
999
1,06
0,
536
FH
0,93
0,
534
0,90
0,
286
1,22
0,
063
1,18
0,
147
LDH
2 1,
04
0,72
8 1,
24
0,15
0 0,
63
0,00
2 0,
76
0,03
6 LD
H3A
1,
02
0,84
0 1,
03
0,75
1 0,
97
0,74
5 0,
99
0,89
2 S
UC
LA2
1,07
0,
457
1,49
0,
003
0,73
0,
006
1,02
0,
854
SU
CLG
1 1,
48
0,00
3 1,
23
0,22
5 0,
82
0,12
4 0,
68
0,01
6 S
UC
LG2
1,27
0,
024
1,60
0,
001
0,72
0,
010
0,91
0,
324
AC
LY
1,19
0,
096
0,83
0,
051
4,56
0,
000
3,20
0,
000
PPP
G
6PD
X 0,
84
0,08
6 1,
11
0,51
5 1,
09
0,45
3 1,
44
0,06
5 P
GD
1,
16
0,13
7 1,
22
0,04
6 2,
47
0,00
0 2,
59
0,00
0 Β
-oxi
datio
n
CP
T2
1,07
0,
559
1,01
0,
922
1,08
0,
543
1,02
0,
881
AC
AD
S
1,05
0,
568
1,08
0,
390
0,80
0,
057
0,82
0,
014
AC
AD
M
0,87
0,
264
1,07
0,
579
0,72
0,
033
0,88
0,
258
AC
AD
VL
0,96
0,
765
0,96
0,
696
1,22
0,
137
1,22
0,
066
EC
HS
1 1,
56
0,00
1 1,
11
0,41
8 1,
11
0,36
0 0,
79
0,05
3 H
AD
H
0,96
0,
809
0,90
0,
611
0,62
0,
049
0,58
0,
001
HA
DH
B
0,85
0,
172
0,94
0,
538
1,17
0,
182
1,28
0,
029
2020 07 03 Boekje 1.0.indd 1332020 07 03 Boekje 1.0.indd 133 24/07/2020 21:1324/07/2020 21:13

134
Chapter 4
Tabl
e S3
. Sta
tistic
al v
alue
s of
met
abol
ites
of g
lyco
lysi
s, T
CA
cyc
le a
nd P
PP
in L
-G6p
c-/- m
ice
and
wild
type
litte
rmat
es u
pon
FXR
act
ivat
ion
with
PX2
0606
L-G
6pc+/
+ ch
ow v
s L-
G6p
c+/+
PX
L-G
6pc-/-
cho
w v
s L-
G6p
c-/- P
X L-
G6p
c+/+
chow
vs
L-G
6pc-/-
cho
w
L-G
6pc+/
+ P
X v
s L-
G6p
c-/- P
X
Fold
cha
nge
p-va
lue
FDR
Fo
ld c
hang
e p-
valu
e FD
R
Fold
cha
nge
p-va
lue
FDR
Fo
ld c
hang
e p-
valu
e FD
R
Gly
coly
tic m
etab
olite
s
Fr
ucto
se-6
P_o
r_Fr
ucto
se-1
P
(F6P
/F1P
) 1,
23
0,28
3 0,
628
1,09
0,
503
0,73
5 10
,88
0,00
0 0,
000
9,59
0,
000
0,00
2
Fruc
tose
-1,6
-dip
hosp
hate
(F
1,6b
isP
) 0,
00
0,35
6 0,
628
0,29
0,
173
0,47
5 0,
01
0,36
0 0,
487
1,93
0,
222
0,36
3
Dih
ydro
xyac
eton
e-P
/Gly
cera
ldeh
yde-
3P
(DH
AP
/GA
P)
0,98
0,
931
0,96
6 0,
81
0,24
1 0,
534
2,68
0,
000
0,00
0 2,
21
0,02
1 0,
075
Pho
spho
enol
pyru
vate
0,
76
0,35
7 0,
628
1,00
0,
993
0,99
7 0,
93
0,75
2 0,
844
1,21
0,
455
0,55
0 P
yruv
ate
1,11
0,
853
0,93
4 0,
88
0,51
1 0,
735
0,37
0,
285
0,45
8 0,
30
0,02
2 0,
075
Lact
ate
0,93
0,
614
0,77
4 1,
04
0,77
8 0,
927
1,33
0,
072
0,19
5 1,
48
0,00
7 0,
041
TCA
cyc
le m
etab
olite
s
C
itric
aci
d 0,
67
0,01
5 0,
143
0,72
0,
002
0,09
7 1,
10
0,37
5 0,
493
1,19
0,
133
0,23
5 O
xalo
acet
ate
0,52
0,
033
0,22
1 0,
41
0,02
2 0,
238
0,68
0,
150
0,30
0 0,
54
0,07
8 0,
167
Mal
ate
1,42
0,
131
0,40
2 1,
35
0,13
0 0,
413
1,39
0,
078
0,20
0 1,
32
0,19
6 0,
329
Alp
ha-K
etog
lute
rate
0,
89
0,34
2 0,
628
0,85
0,
363
0,64
0 1,
00
0,98
2 0,
996
0,96
0,
777
0,85
1 S
ucci
nate
0,
83
0,47
9 0,
711
1,94
0,
016
0,21
2 0,
59
0,11
4 0,
269
1,39
0,
131
0,23
5 Fu
mar
ate
0,98
0,
957
0,96
6 0,
29
0,06
0 0,
274
1,83
0,
226
0,40
8 0,
55
0,04
8 0,
122
PPP
met
abol
ites
6-P
hosp
hogl
ucon
olac
tone
0,
52
0,03
5 0,
221
0,73
0,
053
0,27
4 1,
17
0,39
4 0,
510
1,64
0,
057
0,13
6 G
luco
nate
-6P
0,50
0,
038
0,22
1 0,
67
0,02
8 0,
238
0,90
0,
612
0,72
6 1,
19
0,49
7 0,
587
Xyl
ulos
e-5P
0,
59
0,28
2 0,
628
0,90
0,
462
0,71
4 1,
49
0,18
5 0,
346
2,25
0,
009
0,04
8 R
ibos
e-5P
/ribu
lose
-5P
0,80
0,
345
0,62
8 0,
84
0,37
7 0,
642
1,55
0,
022
0,07
3 1,
63
0,08
3 0,
171
Sed
ohep
tulo
se-7
P 1,
38
0,05
6 0,
234
1,16
0,
161
0,47
5 6,
91
0,00
0 0,
000
5,80
0,
000
0,00
1 R
ibos
e-1,
5-di
phos
phat
e 0,
00
0,35
6 0,
628
0,41
0,
332
0,62
3 0,
00
0,35
7 0,
487
1,16
0,
775
0,85
1 2-
Deh
ydro
gluc
onat
e-6P
0,
88
0,47
8 0,
711
1,12
0,
411
0,67
5 0,
83
0,11
1 0,
269
1,05
0,
795
0,85
5
2020 07 03 Boekje 1.0.indd 1342020 07 03 Boekje 1.0.indd 134 24/07/2020 21:1324/07/2020 21:13

135
Pharmacological FXR activation in a mouse model for Glycogen Storage Disease type 1a
4Ta
ble
S4. F
ract
iona
l fat
ty a
cid
synt
hesi
s (%
) in
L-G
6pc-/-
mic
e an
d w
ildty
pe li
tterm
ates
upo
n FX
R a
ctiv
atio
n w
ith P
X20
606
L-
G6p
c+/+ c
ontro
l L-
G6p
c+/+ P
X
L-G
6pc-/-
con
trol
L-G
6pc-/-
PX
Med
ian
(Ran
ge)
Med
ian
(Ran
ge)
p-va
lue
Med
ian
(Ran
ge)
Med
ian
(Ran
ge)
p-va
lue
C16
:0
21.2
(17.
5 - 2
7.4)
22
.4 (1
8.3
- 29.
1)
0.69
4 25
.6 (1
9.2
- 28.
9)
22.4
(18.
0 - 2
8.2)
0.
097
C16
:1
16.7
(11.
4 - 2
2.1)
16
.4 (1
3.7
- 23.
7)
0.86
7 19
.2 (1
5.8
- 23.
9)
15.7
(11.
9 - 1
7.6)
0.
007
C18
:0 D
NL
18.3
(13.
8 - 2
3.3)
20
.7 (1
4.6
- 24.
8)
0.09
4 26
.0 (2
0.0
- 28.
3)
21.5
(18.
4 - 2
9.1)
0.
318
C18
:0 C
E 12
.6 (8
.1 -
16.7
) 13
.4 (9
.1 -
14.7
) 0.
779
13.5
(10.
8 - 1
6.8)
10
.4 (6
.4 -
19.0
) 0.
073
C18
:1 D
NL
9.3
(7.6
- 11
.8)
11.7
(8.2
- 18
.5)
0.07
2 20
.9 (1
6.1
- 25.
0)
19.1
(14.
9 - 2
1.9)
0.
097
C18
:1 C
E 6.
1 (2
.1 -
9.2)
8.
9 (6
.4 -
13.1
) 0.
021
4.2
(0.2
- 10
.9)
5.1
(0.1
- 8.
5)
0.53
4
2020 07 03 Boekje 1.0.indd 1352020 07 03 Boekje 1.0.indd 135 24/07/2020 21:1324/07/2020 21:13

136
Chapter 4
Tabl
e S5
. Hep
atic
fatty
aci
ds (µ
mol
/g li
ver)
in li
ver o
f L-G
6pc-/-
mic
e an
d w
ildty
pe li
tterm
ates
upo
n FX
R a
ctiv
atio
n w
ith P
X20
606
L-
G6p
c+/+ c
ontro
l L-
G6p
c+/+ P
X
L-G
6pc-/-
con
trol
L-G
6pc-/-
PX
Med
ian
(Ran
ge)
Med
ian
(Ran
ge)
p-va
lue
Med
ian
(Ran
ge)
Med
ian
(Ran
ge)
p-va
lue
14:0
0.
20 (0
.16
- 0.4
0)
0.29
(0.1
4 - 0
.40)
0.
613
0.43
(0.3
3 - 0
.84)
0.
39 (0
.26
- 0.6
9)
0.90
2 16
:1
1.39
(0.6
7 - 2
.10)
1.
72 (0
.88
- 2.6
2)
0.23
2 1.
42 (1
.06
- 2.1
4)
1.28
(0.7
0 - 2
.28)
0.
710
18:3ω
6 0.
18 (0
.10
- 0.2
0)
0.15
(0.1
2 - 0
.24)
0.
779
0.13
(0.0
8 - 0
.27)
0.
10 (0
.06
- 0.1
4)
0.05
3 18
:2ω
6 15
.81
(14.
13 -1
7.80
) 12
.41
(8.9
7 - 2
1.77
) 0.
094
17.1
3 (1
0.35
- 30
.30)
15
.09
(9.1
5 - 2
1.69
) 0.
209
18:3ω
3 0.
48 (0
.35
- 0.6
5)
0.36
(0.1
5 - 0
.64)
0.
152
0.69
(0.4
0 - 1
.08)
0.
49 (0
.27
- 0.7
4)
0.07
3 18
:1ω
9 10
.37
(7.7
1 - 1
1.93
) 11
.08
(6.7
0 - 1
5.96
) 0.
397
33.7
4 (1
9.97
- 61
.76)
22
.96
(13.
90 -
34.0
5)
0.07
3 18
:1ω
7 1.
60 (1
.20
- 2.8
4)
1.97
(1.4
2 - 2
.47)
0.
397
2.63
(2.3
1 - 4
.41)
2.
45 (1
.53
- 3.9
0)
0.31
8 20
:4ω
6 8.
83 (6
.53
- 10.
38)
7.66
(6.3
8 - 1
1.28
) 0.
613
6.42
(5.8
1 - 1
3.66
) 7.
90 (5
.80
- 11.
46)
0.90
2 20
:5ω
3 0.
48 (0
.42
- 0.6
6)
0.40
(0.2
3 - 0
.85)
0.
232
0.46
(0.2
9 - 0
.81)
0.
29 (0
.16
- 0.4
8)
0.09
7 20
:3ω
9 0.
11 (0
.07
- 0.2
6)
0.17
(0.1
3 - 0
.22)
0.
121
0.47
(0.2
9 - 0
.62)
0.
43 (0
.30
- 0.5
2)
0.38
3 20
:3ω
6 0.
84 (0
.67
- 1.3
8)
1.01
(0.9
2 - 1
.27)
0.
613
1.46
(1.1
1 - 2
.75)
1.
35 (1
.04
- 2.1
0)
0.62
0 20
:2ω
6 0.
26 (0
.21
- 0.4
9)
0.28
(0.2
3 - 0
.38)
0.
779
0.44
(0.3
5 - 0
.74)
0.
41 (0
.28
- 0.6
1)
0.80
5 20
:1ω
9 0.
23 (0
.13
- 0.3
2)
0.24
(0.1
5 - 0
.30)
0.
779
0.80
(0.5
3 - 1
.42)
0.
51 (0
.04
- 0.9
7)
0.12
8 20
:0
0.07
(0.0
5 - 0
.09)
0.
06 (0
.03
- 0.1
1)
0.46
3 0.
07 (0
.05
- 0.1
3)
0.08
(0.0
4 - 0
.11)
0.
805
22:5ω
6 0.
11 (0
.07
- 0.1
8)
0.22
(0.1
6 - 0
.37)
0.
002
0.14
(0.0
9 - 0
.25)
0.
29 (0
.15
- 0.4
0)
0.00
4 22
:6ω
3 7.
04 (4
.64
- 7.9
0)
6.75
(4.8
2 - 1
0.96
) 1.
000
6.23
(4.5
1 - 1
3.19
) 7.
17 (4
.52
- 12.
06)
0.62
0 22
:4ω
6 0.
22 (0
.13
- 0.2
6)
0.24
(0.1
9 - 0
.35)
0.
189
0.19
(0.1
5 - 0
.39)
0.
27 (0
.17
- 0.4
7)
0.09
7 22
:5ω
3 0.
41 (0
.34
- 0.5
1)
0.46
(0.2
9 - 0
.93)
0.
189
0.48
(0.2
6 - 0
.72)
0.
42 (0
.20
- 0.7
2)
0.38
3 22
:0
0.20
(0.1
6 - 0
.23)
0.
18 (0
.13
- 0.3
5)
0.77
9 0.
14 (0
.12
- 0.3
0)
0.20
(0.1
1 - 0
.29)
0.
456
24:1ω
9 0.
38 (0
.33
- 0.5
8)
0.39
(0.3
2 - 0
.58)
0.
867
0.34
(0.2
6 - 0
.60)
0.
45 (0
.33
- 0.5
8)
0.31
8 24
:0
0.23
(0.1
9 - 0
.28)
0.
19 (0
.12
- 0.3
0)
0.28
1 0.
15 (0
.12
- 0.2
5)
0.13
(0.0
9 - 0
.21)
0.
456
2020 07 03 Boekje 1.0.indd 1362020 07 03 Boekje 1.0.indd 136 24/07/2020 21:1324/07/2020 21:13

137
Pharmacological FXR activation in a mouse model for Glycogen Storage Disease type 1a
4
Tabl
e S6
. Top
5 o
utpu
t of e
nric
hmen
t ana
lysi
s of
live
r lip
ids
in L
-G6p
c-/- m
ice
and
wild
type
litte
rmat
es u
pon
FXR
act
ivat
ion
with
PX
2060
6 Te
rm ID
D
escr
iptio
n
Anno
tate
d
Sign
ifica
nt
Expe
cted
p-
valu
e
FDR
q-v
alue
L-
G6p
c+/+ c
how
ver
sus
L-G
6pc+/
+ PX
LI
ON
:000
0084
ce
ram
ide
phos
phoc
holin
es (s
phin
gom
yelin
s) [S
P03
01]
74
19
2.57
2,
70E-
13
3,70
E-11
LI
ON
:001
2086
en
doso
me/
lyso
som
e
243
30
8.44
2,
70E-
12
1,85
E-10
LI
ON
:000
0004
sp
hing
olip
ids
[SP]
15
1 24
5.
24
6,30
E-12
2,
88E-
10
LIO
N:0
0120
82
plas
ma
mem
bran
e
148
23
5.14
3,
60E-
11
1,23
E-09
LI
ON
:000
0095
he
adgr
oup
with
pos
itive
cha
rge
/ zw
itter
-ion
40
8 34
14
.17
3,
50E-
09
9,59
E-08
L-
G6p
c-/- c
how
ver
sus
L-G
6pc-/-
PX
LI
ON
:000
0622
tri
acyl
glyc
erol
s [G
L030
1]
387
29
13.4
5
2,30
E-06
3,
15E-
04
LIO
N:0
0000
84
cera
mid
e ph
osph
ocho
lines
(sph
ingo
mye
lins)
[SP
0301
] 74
11
2.
57
2,30
E-05
1,
58E-
03
LIO
N:0
0006
04
trira
dylg
lyce
rols
[GL0
3]
501
29
17.4
1
5,50
E-04
2,
51E-
02
LIO
N:0
0120
11
lipid
sto
rage
63
0 33
21
.89
1,
06E-
03
2,90
E-02
LI
ON
:001
2084
lip
id d
ropl
et
630
33
21.8
9
1,06
E-03
2,
90E-
02
2020 07 03 Boekje 1.0.indd 1372020 07 03 Boekje 1.0.indd 137 24/07/2020 21:1324/07/2020 21:13

138
Chapter 4
Table S7. Taqman and SYBR Green qPCR primer and probe sequences
Gene Forward primer 5’-3’ Reverse primer 5’-3’ TaqMan probe 5’-3’
Rplp0 (36b4) GCT TCA TTG TGG GAG CAG ACA CAT GGT GTT CTT GCC CAT CAG TCC AAG CAG ATG CAG CAG ATC CGC
Srebf1 GGA GCC ATG GAT TGC ACA TT CCT GTC TCA CCC CCA GCA TA CAG CTC ATC AAC AAC CAA GAC AGT GAC TTC C
Chrebpβ TCT GCA GAT CGC GTG GAG CTT GTC CCG GCA TAG CAA C CTC AGT GGC AAG CTG GTC TCT CCC A
Pklr CGT TTG TGC CACf ACA GAT GCT CAT TGG CCA CAT CGC TTG TCT AGC ATG ATC ACT AAG GCT CGA CCA ACT CGG
Acaca CCA TCC AAA CAG AGG GAA CAT C
CTA CAT GAG TCA TGC CAT AGT GGT T ACG CTA AAC AGA ATG TCC TTT GCC TCC AAC
Fasn GGC ATC ATT GGG CAC TCC TT GCT GCA AGC ACA GCC TCT CT CCA TCT GCA TAG CCA CAG GCA ACC TC
Elovl6 ACA CGT AGC GAC TCC GAA GAT AGC GCA GAA AAC AGG AAA GAC T TTT CCT GCA TCC ATT GGA TGG CTT C
Scd1 ATG CTC CAA GAG ATC TCC AGT TCT
CTT CAC CTT CTC TCG TTC ATT TCC CCA CCA CCA CCA TCA CTG CAC CTC
Abcb11 CTG CCA AGG ATG CTA ATG CA CGA TGG CTA CCC TTT GCT TCT TGC CAC AGC AAT TTG ACA CCC TAG TTG G
Nr0b2 AAG GGC ACG ATC CTC TTC AA CTG TTG CAG GTG TGC GAT GT ATG TGC CAG GCC TCC GTG CC
Cyp7a1 CAG GGA GAT GCT CTG TGT TCA AGG CAT ACA TCC CTT CCG TGA TGC AAA ACC TCC AAT CTG TCA TGA GAC CTC C
Cyp27a1 GCC TTG CAC AAG GAA GTG ACT CGC AGG GTC TCC TTA ATC ACA CCC TTC GGG AAG GTG CCC CAG
Cyp8b1 AAG GCT GGC TTC CTG AGC TT AAC AGC TCA TCG GCC TCA TC CGG CTA CAC CAA GGA CAA GCA GCA AG
Il1b ACC CTG CAG CTG GAG AGT GT TTG ACT TCT ATC TTG TTG AAG ACA AAC C
CCC AAG CAA TAC CCA AAG AAG AAG ATG GAA
Cd68 CAC TTC GGG CCA TGT TTC TC AGG ACC AGG CCA ATG ATG AG CAA CCG TGA CCA GTC CCT CTT GCT G
Osbp TCA CAA GAC AGG AGA CAA GTG TAA TC
CCT GAT GGG TCT GTC ACT TCA C CAC CTT TCT TGC TAC ATC CCG AGA GAA GTA GC
Gpam GCT ATC ATG TCC ACC CAC ATT G ACT TCC TCC TTC ATC ACA AAG AAG TC
CTC CTC TAC AGA CAC AGG CAG GGA ATC C
Dgat1 GGT GCC CTG ACA GAG CAG AT CAG TAA GGC CAC AGC TGC TG CTG CTG CTA CAT GTG GTT AAC CTG GCC A
Dgat2 GGG TCC AGA AGA AGT TCC AGA AG
CCC AGG TGT CAG AGG AGA AGA G CCC CTG CAT CTT CCA TGG CCG
Cd36 GAT CGG AAC TGT GGG CTC AT GGT TCC TTC TTC AAG GAC AAC TTC AGA ATG CCT CCA AAC ACA GCC AGG AC
Fabp1 GAA CTT CTC CGG CAA GTA CCA A TGT CCT TCC CTT TCT GGA TGA G CCA TTC ATG AAG GCA ATA GGT CTG CCC
Slc27a5 GTG CTG ATT GTG GAT CCA GAC GAA TGT TCT CAG CTA GCA GCT TG CCA GGA GAA CCT GGA AGA AGT CCT TCC
Acacb CAT ACA CAG AGC TGG TGT TGG ACT
CAC CAT GCC CAC CTC GTT AC CAG GAA GCC GGT TCA TCT CCA CCA G
Acadl TAC GGC ACA AAA GAA CAG ATC G
CAG GCT CTG TCA TGG CTA TGG CAC TTG CCC GCC GTC ATC TGG
Hmgcs2 TGG TGG ATG GGA AGC TGT CTA TTC TTG CGG TAG GCT GCA TAG CCA AGG CCC GCA GGT AGC ACT G
Srebf2 CTG CAG CCT CAA GTG CAA AG CAG TGT GCC ATT GGC TGT CT CCA TCC AGC AGC AGG TGC AGA CG
Hmgcr CCG GCA ACA ACA AGA TCT GTG ATG TAC AGG ATG GCG ATG CA TGT CGC TGC TCA GCA CGT CCT CTT C
Ldlr GCA TCA GCT TGG ACA AGG TGT GGG AAC AGC CAC CAT TGT TG CAC TCC TTG ATG GGC TCA TCC GAC C
Vldlr CCA CAG CAG TAT CAG AAG TCA GTG T
CAC CTA CTG CTG CCA TCA CTA AGA CAG CTG CCT GGG CCA TCC TTC C
Scarb1 TCA GAA GCT GTT CTT GGT CTG AAC
GTT CAT GGG GAT CCC AGT GA ACC CAA AGG AGC ATT CCT TGT TCC TAG ACA
Apoa1 CCC AGT CCC AAT GGG ACA CAG GAG ATT CAG GTT CAG CTG TT CAA ACT GGG ACA CAT AGT CTC TGC CGC T
Abcg5 TCA GGA CCC CAA GGT CAT GAT AGG CTG GTG GAT GGT GAC AAT CCA CAG GAC TGG ACT GCA TGA CTG CA
Abcg8 CTG CTC GCC TAC GTG CTA CA GAT ACA AGC CCA GAG TCC AAT AAC A
TCA GCG TCA TCG CCA CGG TCA
Mttp CAA GCT CAC GTA CTC CAC TGA AG
TCA TCA TCA CCA TCA GGA TTC CT ACC GCA AGA CAG CGT GGG CTA CA
Apob GCC CAT TGT GGA CAA GTT GAT C CCA GGA CTT GGA GGT CTT GGA AAG CCA GGG CCT ATC TCC GCA TCC
Tm6sf2A CCC GGG AAA CAT CCT TGG TAA GGG GTA TAG GAG GTT GGT GC ASybr Green method used
2020 07 03 Boekje 1.0.indd 1382020 07 03 Boekje 1.0.indd 138 24/07/2020 21:1324/07/2020 21:13

139
Pharmacological FXR activation in a mouse model for Glycogen Storage Disease type 1a
4
Table S8. Lipid standards Standard Added to tissue (pmol) DAG(14:0)2 500 TAG(14:0)3 500 CE(16:0)-D7 2500 CL(14:0)4 100 BMP(14:0)2 200 PC(14:0)2 2000 PG(14:0)2 100 PS(14:0)2 5000 PE(14:0)2 500 PA(14:0)2 500 PI(8:0)2 500 SM(12:0) 2125 LPG(14:0) 20 LPE(14:0) 100 LPC(14:0) 500 LPA(14:0) 100 SPH(d17:1) 125 SPH(d17:0) 125 S1P(d17:1) 125 S1P(d17:0) 125 LacCer(d18:1/12:0) 125 GlcCer(d18:1/12:0) 125 Cer(d18:1/12:0) 125 C1P(d18:1/12:0) 125 Cer(d18:1/25:0) 125
2020 07 03 Boekje 1.0.indd 1392020 07 03 Boekje 1.0.indd 139 24/07/2020 21:1324/07/2020 21:13

140
Chapter 4
Table S9. Sequence of peptide standards Protein Peptide sequence ABCB11 GSYQDSLR CYP27A1 LYPVVPTNSR CYP7B1 YITFVLNPFQYQYVTK CYP8B1 VVQEDYVLK PKLR STSIIATIGPASR GCK ITVGVDGSVYK GPI1 VFEGNRPTNSIVFTK ALDOB ALQASALAAWGGK GAPDH GAAQNIIPASTGAAK PGK1 ALESPERPFLAILGGAK PGM1 IALYETPTGWK ENO1 VNQIGSVTESLQACK PCK1 TGLSQLGR DLD ALTGGIAHLFK DLAT ILVPEGTR PCX HYFIEVNSR MHDH2 VAVLGASGGIGQPLSLLLK MHDH2 VNVPVIGGHAGK CS ALGVLAQLIWSR ACO2 NAVTQEFGPVPDTAR FH IYELAAGGTAVGTGLNTR LDH2 LNEHFLNTTDFLDTIK LDH3A TPYTDVNIVTIR SUCLA2 ALIADSGLK SUCLG1 LIGPNCPGVINPGECK SUCLG2 VPLVVR ACLY EAYPEEAYIADLDAK GPDX LFYLALPPTVYEAVTK PGD AGQAVDDFIEK MTTP SDSSIILQER TM6SF2 TPFTYR APOB VQGVEFSHR APOC1 AWFSEAFGK APOC2 TYPISMDEK APOC3 TVQDALSSVQESDIAVVAR CTP2 QYGQTVATYESCSTAAFK ACADS ITEIYEGTSEIQR ACADM ANWYFLLAR ACADVL IFEGANDILR ECHS1 AQFGQPEILLGTIPGAGGTQR HADH LLVPYLIEAVR HADHB DQLLLGPTYATPK APOA1 DFWDNLEK APOA4 ALVQQLEQFR APOE FWDYLR APOM FLLYNR
2020 07 03 Boekje 1.0.indd 1402020 07 03 Boekje 1.0.indd 140 24/07/2020 21:1324/07/2020 21:13

2020 07 03 Boekje 1.0.indd 1412020 07 03 Boekje 1.0.indd 141 24/07/2020 21:1324/07/2020 21:13

2020 07 03 Boekje 1.0.indd 1422020 07 03 Boekje 1.0.indd 142 24/07/2020 21:1324/07/2020 21:13

Joanne A. Hoogerland1, Yu Lei1, Justina C. Wolters1, Jan Freark de Boer1,2, Trijnie Bos1, Aycha Bleeker1, Niels L. Mulder1, Theo H. van Dijk2, Jan A. Kuivenhoven1, Fabienne Rajas3, Gilles Mithieux3, Rebecca A. Haeusler4, Henkjan J. Verkade1, Vincent W. Bloks1, Folkert Kuipers1,2 and Maaike H. Oosterveer1
1Departments of Pediatrics and 2Laboratory Medicine, University of Groningen, University Medical Center Groningen, 9713 GZ Groningen, The Netherlands. 3Institut National de la Santé et de la Recherche Médicale, U1213, Université Claude Bernard Lyon, 69100 Villeurbanne, France. 4Department of Pathology and Cell Biology, Columbia University College of Physicians and Surgeons, New York, New York 10032, USA.
Hepatology (2019): 70(6):2171-2184
5CHAPTERGlucose-6-phosphate regulates hepatic
bile acid synthesis in mice
2020 07 03 Boekje 1.0.indd 1432020 07 03 Boekje 1.0.indd 143 24/07/2020 21:1324/07/2020 21:13

144
Chapter 5
AbstractIt is well-established that, besides facilitating lipid absorption, bile acids act as signaling molecules that modulate glucose and lipid metabolism. Bile acid metabolism, in turn, is controlled by several nutrient-sensitive transcription factors. Altered intrahepatic glucose signaling in type 2 diabetes associates with perturbed bile acid synthesis. However, an independent role of glucose in regulation of bile acid metabolism has as yet not been established. We aimed to characterize the regulatory role of the primary intracellular metabolite of glucose, glucose-6-phosphate (G6P), on bile acid metabolism. Hepatic gene expression patterns and bile acid composition were analyzed in mice that accumulate G6P in the liver, i.e., liver-specific glucose-6-phosphatase knockout (L-G6pc-/-) mice, and mice treated with a pharmacological inhibitor of the G6P-transporter. Hepatic G6P accumulation induces Cyp8b1 expression, which is mediated by the major glucose-sensitive transcription factor Carbohydrate Response Element Binding Protein (ChREBP). Activation of the G6P-ChREBP-CYP8B1 axis increases the relative abundance of cholic acid-derived bile acids and induces physiologically relevant shifts in bile composition. The G6P-ChREBP-dependent change in bile acid hydrophobicity associates with elevated plasma campesterol/cholesterol ratio and reduced fecal neutral sterol loss, compatible with enhanced intestinal cholesterol absorption. Conclusion: We report that G6P, the primary intracellular metabolite of glucose, controls hepatic bile acid synthesis. Our work identifies hepatic G6P-ChREBP-CYP8B1 signaling as a regulatory axis in control of bile acid and cholesterol metabolism.
2020 07 03 Boekje 1.0.indd 1442020 07 03 Boekje 1.0.indd 144 24/07/2020 21:1324/07/2020 21:13

145
Glucose-6-phosphate regulates hepatic bile acid synthesis in mice
5
IntroductionBile acids facilitate absorption of dietary lipids and fat-soluble vitamins in the intestine but also act as signaling molecules that control glucose, lipid and energy metabolism (1). Bile acid metabolism is known to be perturbed in conditions of uncontrolled hyperglycemia and insulin resistance (2,3). Bile acid synthesis from cholesterol occurs exclusively in the liver and comprises multiple biochemical reactions initiated by cholesterol 7α-hydroxylase (CYP7A1), the rate-controlling enzyme in the ‘classic’ pathway of primary bile acid synthesis. Sterol 12α-hydroxylase (CYP8B1) subsequently generates 3α,7α,12α-trihydroxy-5β-cholan-24-oic acid (cholic acid; CA) as endproduct (2,4,5). As a consequence, hepatic CYP8B1 activity determines the contribution of CA produced in the ‘classic’ pathway relative to 3α,7α-dihydroxy-5β-cholan-24-oic acid (chenodeoxycholic acid; CDCA). CDCA, in contrast to CA, can also be generated via an ‘alternative’ pathway starting with 27-hydroxylation of cholesterol (6). CDCA is efficiently converted to hydrophilic C6-hydroxylated muricholic acids (MCAs) in rodents but not in humans (6). Primary bile acid species are secreted into the intestine where they can be converted by microbial actions to secondary bile acids with distinct physicochemical properties (6) that determine their efficacy to promote fat and cholesterol absorption as well as their signaling functions (1).
Bile acid synthesis is increased during postprandial periods and reduced upon fasting (7). Insulin and glucose have both been reported to induce the expression of CYP7A1 in cultured hepatocytes (8,9). Moreover, insulin suppresses while glucose induces the expression Cyp8b1 (9,10). Insulin-induced suppression of Cyp8b1 is mediated by the transcription factor Forkhead box protein O1 (FOXO1) (4). Under insulin-resistant conditions, constitutive FOXO1 activation shifts the composition of the bile acid pool towards an increased contribution of CA and its hydrophobic microbial metabolite 3α,12α-dihydroxy-5β–cholan-24-oic acid (deoxycholic acid; DCA) (4). Accordingly, we and others have shown that insulin resistance is associated with an increase in CA synthesis (2,4,5) and a more hydrophobic bile acid pool in humans (2). Insulin resistance is generally associated with hyperglycemic episodes, enhancing intrahepatic glucose metabolism (11,12). However, the contribution of increased intrahepatic glucose availability to hepatic Cyp8b1 induction and the physiological consequences thereof have remained elusive.
Here we characterized the direct regulatory role of intrahepatic glucose on bile acid synthesis. After being taken up by hepatocytes, glucose is immediately converted into glucose-6-phosphate (G6P), the primary intracellular metabolite of glucose that acts as a signaling molecule (12). Glycogen Storage Disease type 1 (GSD I) is an inborn error of carbohydrate metabolism caused by mutations in the glucose-6-phosphatase (G6PC) gene (GSD Ia) or the glucose-6-phosphate transporter SLC37A4 (GSD Ib).
2020 07 03 Boekje 1.0.indd 1452020 07 03 Boekje 1.0.indd 145 24/07/2020 21:1324/07/2020 21:13

146
Chapter 5
GSD I is characterized by a strong accumulation of G6P inside hepatocytes and, importantly, low fasting glucose and insulin levels (13). We took advantage of this unique feature to evaluate the effects of intracellular glucose versus blood glucose and insulin and, hence, to selectively establish the effects of intra- versus extrahepatic glucose on bile acid metabolism. Our data show that, in mice, intrahepatic G6P regulates bile acid metabolism via a Carbohydrate Response Element Binding Protein (ChREBP, also known as Mlxipl)-dependent induction of CYP8B1, resulting in an increased hydrophobicity of the biliary bile acids and reduced fecal cholesterol loss. On the other hand, hepatic CYP7A1 expression was regulated by extrahepatic (blood) glucose rather than intrahepatic G6P.
Materials and methodsAnimalsMale adult (8-12 weeks) B6.G6pclox/lox and B6.G6pclox/lox.SAcreERT2/w mice (14), male L-FoxO1,3,4-/- and L-FoxO1,3,4+/+ mice (18-20 weeks old) (15) and C57BL/6 mice (12-13 weeks old, local breeding) were housed in a light- and temperature-controlled facility and fed a standard laboratory chow diet (RMH-B, AB-diets, Woerden). Liver-specific G6pc-deficient mice (L-G6pc-/-) and wildtype littermates (L-G6pc+/+) were generated as described previously (14). For tissue collection, mice were sacrificed by cardiac puncture 10 days after the last tamoxifen injection in non-fasted conditions, unless stated otherwise. In separate experiments requiring bile collection, mice were anesthetized by i.p. injection of Hypnorm (10 ml/kg) (Janssen Pharmaceuticals, Tilburg, The Netherlands) and diazepam (10mg/kg) (Actavis, Baarn, The Netherlands), the bile duct was ligated, the gallbladder was cannulated and bile was collected for 30 minutes.
Male L-FoxO1,3,4-/-, L-FoxO1,3,4+/+ mice and C57BL/6 mice were equipped with a permanent catheter in the right jugular vein for infusions and were allowed a recovery period of at least 4 days. Mice were kept in experimental cages during the experiment and the preceding fasting period, allowing frequent collection of tail blood samples. After overnight fasting, mice were infused for 6 hours with S4048 (a generous gift from Sanofi-Aventis, Germany, 5.5 mg/ml PBS with 6% DMSO at 0.135 ml/h) or vehicle. Blood glucose concentrations were measured in tail blood every 30 minutes during the experiment. All experimental procedures were approved by the Institutional Animal Care and Use Committee of the University of Groningen.
Construction, production and in vivo transduction of shRNAs using self-complemen-tary AAV vectorsTo construct the self-complementary AAV (scAAV) 2/8-U6-shChREBP, the scAAV2-LP1-hFIXco backbone vector was restricted with BamHI and BbsI and the 3493 bp fragment was isolated and ligated. Restriction with BamHI and Bbsl removed
2020 07 03 Boekje 1.0.indd 1462020 07 03 Boekje 1.0.indd 146 24/07/2020 21:1324/07/2020 21:13

147
Glucose-6-phosphate regulates hepatic bile acid synthesis in mice
5
hFIXco and partially deleted the LP1 promoter and the U6 promoter driving the expression of the construct was cloned into the vector in antisense orientation. shRNA construct directed against ChREBPα/β and scramble construct were ordered as oligonucleotides (shRNA; 5’-aat tcA AAA AAT GTA GTT TGA AGA TGT GGG TCT CGA GAC CCA CAT CTT CAA ACT ACA TC-3’ and 3’-ggc caG ATG TAG TTT GAA GAT GTG GGT CTC GAG ACC CAC ATC TTC AAA CTA CAT TTT TT-5’, scramble; 5’-aat tcG TTG TAA GTG GAG GTT TAA GTC TCG AGA CTT AAA CCT CCA CTT ACA ACA CCG GT-3’ and 3’-ggc caA CCG GTG TTG TAA GTG GAG GTT TAA GTC TCG AGA CTT AAA CCT CCA CTT ACA AC-5’) and cloned into the vector using EcoRI and AgeI. Production, purification and titration of these AAV2/8 viruses encoding the shRNA directed against ChREBPα and ChREBPβ and the scrambled control were performed as described (16). Mice were injected with 5 x 10¹² virus particles per mouse and sacrificed 30 days after virus administration.
IHH glucose stimulation and transient transfection assaysFor glucose stimulation, IHH cells (17) were glucose-deprived in Dulbecco’s Modified Eagle Medium (DMEM) (Invitrogen) without glucose, supplemented with 1% penicillin/streptomycin, 0.1% fatty acid-free bovine serum albumin (BSA), 16 mU/mL insulin, 2 mM GlutaMAX (Gibco) and 1 mM glucose for 16 h. Cells were subsequently incubated with low (1 mM) or high (11 mM) glucose concentrations for 24 h. For transient transfection assays, IHH cells were transfected for 48 h using Lipofectamine RNAiMAX Reagent (Invitrogen) according to the manufacturer’s protocol with 50 nM ChREBP small interfering RNAs (siChREBP) (18) or control siRNA (#12935-100) (Invitrogen) in Williams E medium containing 2 mM glutamine and supplemented with 2% FCS, 20 mU/mL insulin and 50 nM dexamethasone.
Analytical proceduresBlood glucose was measured using a One Touch Ultra glucose meter (Life-Scan Inc.). Plasma insulin and glucagon were analyzed using commercially available ELISA’s (Chrystal Chem and Alpco Diagnostics, respectively). To quantify plasma plant sterols, plasma lipids were extracted according to Folch lipid extraction (19), methanolyzed, silylated and analyzed with gas chromatography. Commercially available kits were used to analyze plasma levels of triglycerides (Roche) and plasma levels of total and free cholesterol (Roche and DiaSys, respectively). Hepatic glycogen and G6P content was determined as previously described (20). Plasma and biliary bile acid composition were quantified using liquid chromatography-mass spectrometry, fecal bile acid composition was quantified using capillary gas chromatography as described (21). The hydrophobicity index of biliary bile acids was calculated according to Heuman (22). Fecal cholesterol and its derivatives were trimethylsilylated with pyridine, N,O-Bis(trimethylsilyl) trifluoroacetaminde and
2020 07 03 Boekje 1.0.indd 1472020 07 03 Boekje 1.0.indd 147 24/07/2020 21:1324/07/2020 21:13

148
Chapter 5
trimethylchlorosilane (ratio 50:50:1) and quantified by gas chromatography.
Gene expression analysisTotal RNA was isolated using TRI-Reagent (Sigma-Aldrich Corp.). cDNA was obtained by reverse transcription and amplified using primers and probes listed in Table S6. mRNA levels were calculated based on a dilution curve, expressed relative to 36b4 for liver and 18S for IHH cells, and normalized to their controls.
Targeted proteomicsTargeted proteomics was applied in homogenized liver tissue via the isotopically labeled peptide standards (G6PC; GLGVDLLWTLEK, CYP8B1; VFGYQSVDGDHR, ChREBP; LGFDTLHGLVSTLSAQPSLK, CYP7A1; LSSASLNIR, CYP7B1; YITFVLNPFQYQYVTK, CYP27A1; LYPVVPTNSR, CYP2C70; TDSSLLSR,), containing 13C-labeled lysine/arginine (PolyQuant GmbH, Bad Abbach, Germany) according to the workflow described previously (21). The following alterations were made: lipids were extracted from the liver homogenates with diethyl ether prior to the proteomics workflow and the concentrations were related to the total peptide content, which was determined by a colorimetric peptide assay after tryptic digestion and SPE cleanup (Thermo Scientific). The concentrations of endogenous peptides were calculated from the known concentration of the standard and expressed in fmol/µg of total peptide and expressed relative to the values in the control group.
Cell reporter assaysCV1 cells (ATCC) were transiently transfected using FuGENE 6 Transfection Reagent (Promega). pCMVS4/ChREBPα, pCMVS4/ChREBPβ and pCMVS4/Mlx (kind gifts from M. Herman) were shuttled to pcDNA3.1 using cloning PCR. Primers are listed in Table S6. The human or mouse PGL3/Cyp8b1 promoter luciferase reporter (-623/+364 bp and -1582/+115 bp respectively, kind gifts from J. Chiang) or minimal promoter PGL3/ChREBP luciferase reporter (-40/+12) (kind gift from H. Towle) was co-transfected with pcDNA3.1/ChREBPα, pcDNA3.1/ChREBPβ, pcDNA3.1/Mlx, pcDNA3.1/Hnf4α or a combination for 48 h. Cell lysis and luciferase assays were performed using a Dual-Luciferase Reporter Assay System (Promega).
ChIP-qPCRChIP analysis was performed as previously described (23) with the following modifications. Before crosslinking with 1% formaldehyde, livers were homogenized in PBS and cross-linked with 0.5M Di(N-succinimidyl) glutarate (DSG) for 45 min at room temperature. Immunoprecipitation of the samples was performed overnight at 4°C with 3 µg ChREBP (Novus), Ac-H4 (Millipore), Ac-H3 (Millipore), HNF4A (Santa Cruz) or normal rabbit IgG antibody (Santa Cruz). DNA was purified using the PCR Clean-up Extraction Kit (Macherey-Nagel), after which qPCR was performed. Primers are listed in Table S7.
2020 07 03 Boekje 1.0.indd 1482020 07 03 Boekje 1.0.indd 148 24/07/2020 21:1324/07/2020 21:13
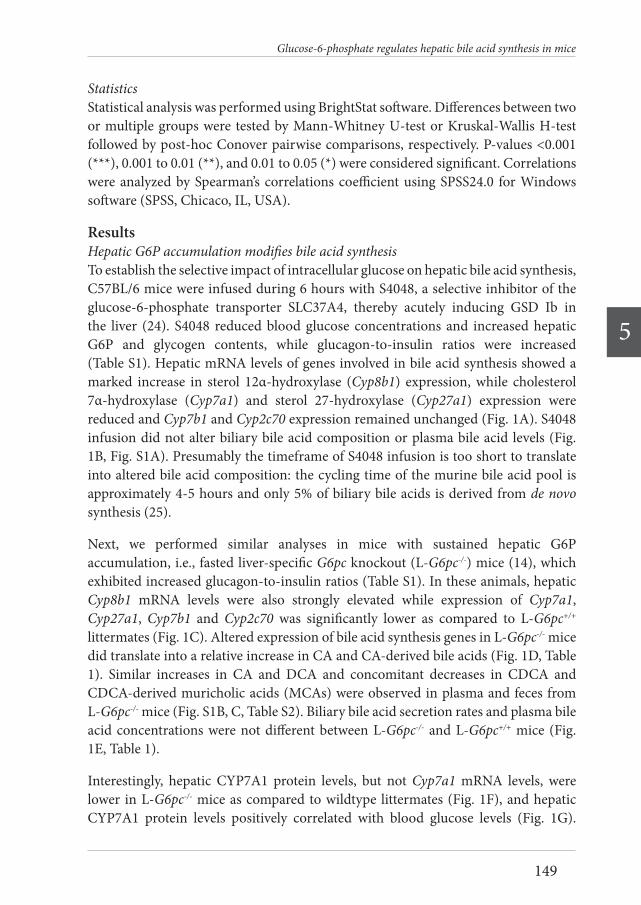
149
Glucose-6-phosphate regulates hepatic bile acid synthesis in mice
5
StatisticsStatistical analysis was performed using BrightStat software. Differences between two or multiple groups were tested by Mann-Whitney U-test or Kruskal-Wallis H-test followed by post-hoc Conover pairwise comparisons, respectively. P-values <0.001 (***), 0.001 to 0.01 (**), and 0.01 to 0.05 (*) were considered significant. Correlations were analyzed by Spearman’s correlations coefficient using SPSS24.0 for Windows software (SPSS, Chicaco, IL, USA).
ResultsHepatic G6P accumulation modifies bile acid synthesisTo establish the selective impact of intracellular glucose on hepatic bile acid synthesis, C57BL/6 mice were infused during 6 hours with S4048, a selective inhibitor of the glucose-6-phosphate transporter SLC37A4, thereby acutely inducing GSD Ib in the liver (24). S4048 reduced blood glucose concentrations and increased hepatic G6P and glycogen contents, while glucagon-to-insulin ratios were increased (Table S1). Hepatic mRNA levels of genes involved in bile acid synthesis showed a marked increase in sterol 12α-hydroxylase (Cyp8b1) expression, while cholesterol 7α-hydroxylase (Cyp7a1) and sterol 27-hydroxylase (Cyp27a1) expression were reduced and Cyp7b1 and Cyp2c70 expression remained unchanged (Fig. 1A). S4048 infusion did not alter biliary bile acid composition or plasma bile acid levels (Fig. 1B, Fig. S1A). Presumably the timeframe of S4048 infusion is too short to translate into altered bile acid composition: the cycling time of the murine bile acid pool is approximately 4-5 hours and only 5% of biliary bile acids is derived from de novo synthesis (25).
Next, we performed similar analyses in mice with sustained hepatic G6P accumulation, i.e., fasted liver-specific G6pc knockout (L-G6pc-/-) mice (14), which exhibited increased glucagon-to-insulin ratios (Table S1). In these animals, hepatic Cyp8b1 mRNA levels were also strongly elevated while expression of Cyp7a1, Cyp27a1, Cyp7b1 and Cyp2c70 was significantly lower as compared to L-G6pc+/+ littermates (Fig. 1C). Altered expression of bile acid synthesis genes in L-G6pc-/- mice did translate into a relative increase in CA and CA-derived bile acids (Fig. 1D, Table 1). Similar increases in CA and DCA and concomitant decreases in CDCA and CDCA-derived muricholic acids (MCAs) were observed in plasma and feces from L-G6pc-/- mice (Fig. S1B, C, Table S2). Biliary bile acid secretion rates and plasma bile acid concentrations were not different between L-G6pc-/- and L-G6pc+/+ mice (Fig. 1E, Table 1).
Interestingly, hepatic CYP7A1 protein levels, but not Cyp7a1 mRNA levels, were lower in L-G6pc-/- mice as compared to wildtype littermates (Fig. 1F), and hepatic CYP7A1 protein levels positively correlated with blood glucose levels (Fig. 1G).
2020 07 03 Boekje 1.0.indd 1492020 07 03 Boekje 1.0.indd 149 24/07/2020 21:1324/07/2020 21:13
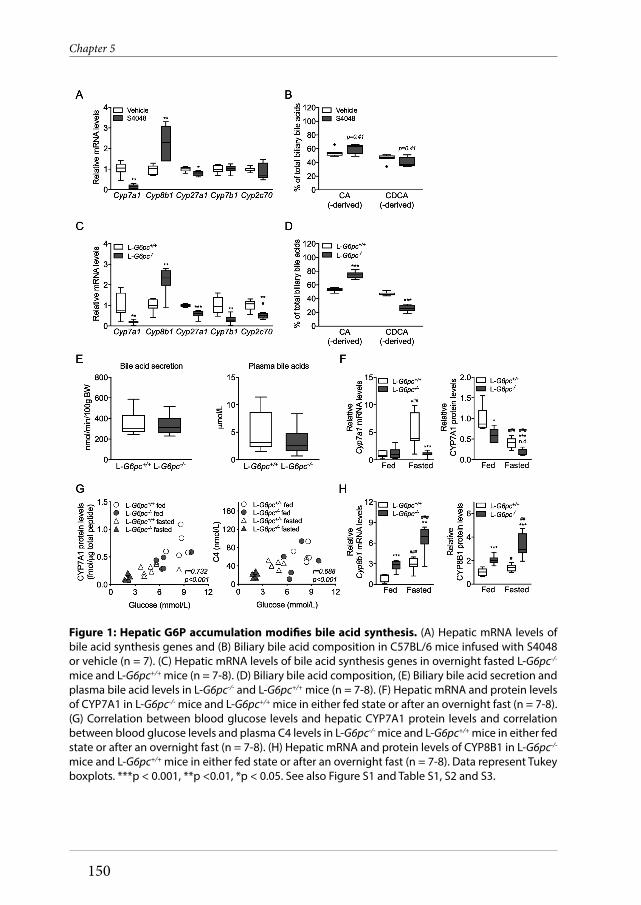
150
Chapter 5
Figure 1: Hepatic G6P accumulation modifi es bile acid synthesis. (A) Hepatic mRNA levels of bile acid synthesis genes and (B) Biliary bile acid composition in C57BL/6 mice infused with S4048 or vehicle (n = 7). (C) Hepatic mRNA levels of bile acid synthesis genes in overnight fasted L-G6pc-/-
mice and L-G6pc+/+ mice (n = 7-8). (D) Biliary bile acid composition, (E) Biliary bile acid secretion and plasma bile acid levels in L-G6pc-/- and L-G6pc+/+ mice (n = 7-8). (F) Hepatic mRNA and protein levels of CYP7A1 in L-G6pc-/- mice and L-G6pc+/+ mice in either fed state or after an overnight fast (n = 7-8). (G) Correlation between blood glucose levels and hepatic CYP7A1 protein levels and correlation between blood glucose levels and plasma C4 levels in L-G6pc-/- mice and L-G6pc+/+ mice in either fed state or after an overnight fast (n = 7-8). (H) Hepatic mRNA and protein levels of CYP8B1 in L-G6pc-/-
mice and L-G6pc+/+ mice in either fed state or after an overnight fast (n = 7-8). Data represent Tukey boxplots. ***p < 0.001, **p <0.01, *p < 0.05. See also Figure S1 and Table S1, S2 and S3.
2020 07 03 Boekje 1.0.indd 1502020 07 03 Boekje 1.0.indd 150 24/07/2020 21:1324/07/2020 21:13

151
Glucose-6-phosphate regulates hepatic bile acid synthesis in mice
5
Similar correlations were observed for plasma 7α-hydroxy-4-cholesten-3-one (C4) levels, the product of CYP7A1 and a marker of its activity (26) (Fig. 1G). C4 levels were significantly lower in fasted L-G6pc-/- mice compared to wildtype littermates (Fig. S1D). On the other hand, hepatic CYP8B1 mRNA and protein levels were significantly increased in L-G6pc-/- mice irrespective of the feeding state (Fig. 1H).
ChREBP mediates the induction of Cyp8b1 in response to hepatic G6P accumulationTo elucidate the mechanism of G6P-dependent control of Cyp8b1, we performed S4048 infusions in mice lacking Forkhead Box O (FoxO) 1,3,4 expression in hepatocytes and in mice with reduced hepatic expression of the G6P-sensitive transcription factor Carbohydrate responsive element binding protein (ChREBP), which is activated in GSD Ia and GSD Ib (12,24,27). We confirmed that FoxOs control basal Cyp8b1 expression (4), and found that the S4048-mediated induction of Cyp8b1 was absent in L-FoxO1,3,4-/- mice (Fig. 2A). Interestingly, the induction of Cyp8b1 upon S4048 infusion was also abolished in mice with reduced hepatic Chrebpα and Chrebpβ expression (Fig. 2A, Fig. S2B). Similar effects were observed on Cyp8b1 mRNA and protein levels upon hepatic ChREBP knockdown in L-G6pc-/- mice (Fig. 2B, C). As shown above, S4048 infusion and hepatic G6pc deficiency caused reductions in Cyp7a1 expression. However, these reductions were not reversed by knockout of FoxOs or knockdown of hepatic ChREBP (Fig. S2A, C, D). Thus ChREBP mediates the induction of hepatic Cyp8b1 but not the repression of Cyp7a1 in liver-specific GSD Ia and GSD Ib mice.
We also tested whether established transcriptional regulators of Cyp8b1 are altered in response to hepatic G6P-ChREBP signaling. The hepatic expression of Nr1h4 (Fxr),
HEP-18-1737
Table 1. Bile characteristics in chow-fed male L-G6pc-/- mice and wildtype littermates L-G6pc+/+ L-G6pc-/- Median (Range) Median (Range) p-value Body weight (g) 28.4 (21.5 - 29.9) 27.5 (25.3 - 32.5) 0.645 Bile flow (µL/min/100g BW) 12.2 (8.5 - 15.0) 14.6 (12.3 - 18.5) 0.021 Bile acid secretion (nmol/min/100g BW) 305.1 (244.3 - 587.5) 313.3 (229.7 - 514.5) 0.878 Phospholipid secretion (nmol/min/100g BW) 81.1 (75.3 - 164.9) 109.7 (93.2 - 159.4) 0.038 Cholesterol secretion (nmol/min/100g BW) 11.6 (9.5 - 17.1) 12.7 (10.7 - 18.6) 0.161 Bile acid species secretion (nmol/min/100g BW) CA 3.88 (1.18 - 7.15) 3.13 (0.86 - 6.07) 0.959 GCA 0.58 (0.21 - 1.21) 0.45 (0.31 - 0.75) 0.279 TCA 150.17 (124.91 - 292.16) 226.74 (164.34 - 344.06) 0.028 TUDCA 5.11 (3.86 - 11.26) 3.92 (2.58 - 7.33) 0.105 TCDCA 2.01 (1.61 - 4.98) 2.63 (1.32 - 5.84) 0.645 TDCA 6.59 (3.40 - 13.85) 9.18 (2.14 - 15.74) 0.442 THDCA 2.27 (0.56 - 3.89) 1.40 (0.79 - 2.17) 0.279 α-MCA 0.40 (0.14 - 1.48) 0.31 (0 - 1.18) 0.279 Tα-MCA 11.37 (9.18 - 36.33) 12.48 (6.9 - 29.22) 0.878 β-MCA 2.65 (0.52 - 5.13) 0.42 (0 - 1.17) 0.007 Tβ-MCA 117.01 (87.53 - 212.07) 52.38 (30.24 - 117.05) 0.002 ω-MCA 2.61 (0.84 - 7.07) 0.84 (0.38 - 1.78) 0.005
2020 07 03 Boekje 1.0.indd 1512020 07 03 Boekje 1.0.indd 151 24/07/2020 21:1324/07/2020 21:13

152
Chapter 5
Nr5a2 (Lrh-1), Hnf4a (Hnf4α), and Mafg, remained largely unaff ected upon hepatic G6P accumulation (Fig. S2E, F), indicating that these factors cannot explain the induction of Cyp8b1 in response to G6P accumulation. We noted that the expression of some of these factors were reduced exclusively when ChREBP was knocked down in S4048-treated or L-G6pc-/- mice (Fig. S2E, F), though the biological signifi cance of this is unclear. Hepatic Nr0b2 (Shp) mRNA levels were lower in S4048-treated and L-G6pc-/- mice as compared to their controls, and were further reduced in response to hepatic ChREBP knockdown in L-G6pc+/+ and L-G6pc-/- mice (Fig. S2E, F). Th us
Figure 2: ChREBP mediates the induction of Cyp8b1 in response to hepatic G6P accumulation.(A) Hepatic mRNA levels of Cyp8b1 in L-FoxO1,3,4-/- and L-FoxO1,3,4+/+ mice and in C57BL/6 mice treated with either shChREBP or scrambled shRNA, infused with S4048 or vehicle (n = 7-8). (B) Hepatic mRNA levels in L-G6pc-/- and L-G6pc+/+ mice, treated with either shChREBP or scrambled shRNA (n = 4-6). (C) Hepatic protein levels in L-G6pc-/- and L-G6pc+/+ mice, treated with either shChREBP or scrambled shRNA (n = 3). (D) mRNA expression in IHH cells transfected with siChREBP or scramble after high (11 mM) glucose exposure for 24 hours (n = 6). (E) Biliary bile acid composition in L-G6pc-/-
and L-G6pc+/+ mice treated with either shChREBP or scrambled shRNA (n = 4-5). Data represent Tukey boxplots. ***p < 0.001, **p <0.01, *p < 0.05 indicates signifi cance compared to scrambled shRNA. #p < 0.05 indicates signifi cance compared to wildtype littermates. See also Figure S2 and Table S4 and S5.
2020 07 03 Boekje 1.0.indd 1522020 07 03 Boekje 1.0.indd 152 24/07/2020 21:1324/07/2020 21:13

153
Glucose-6-phosphate regulates hepatic bile acid synthesis in mice
5
Fxr, Shp, Lrh-1, Hnf4α, and Mafg mRNA levels did not consistently follow the pattern of CYP8B1 expression in response to hepatic G6P-ChREBP signaling (Fig. 2A-C and S2E-F).
Cyp8b1 induction by G6P-ChREBP is cell-autonomous and occurs in human cellsTo assess whether this G6P-ChREBP dependent modulation of CYP8B1 is conserved in human hepatocytes, we exposed immortalized human hepatocyte (IHH) cells, that are glucose-responsive (17), to high and low glucose culture media. We also transfected them with siChREBP or scrambled siRNAs under conditions of high glucose exposure. As expected, high glucose induced CHREBPα mRNA levels, as well as the expression of its target genes CHREBPβ, L-PK and APOC3 (Fig. S2G) while siChREBP reduced all of these (Fig. 2D). Combined with the in vivo data shown above, these in vitro findings demonstrate that ChREBP activity is necessary and sufficient for CYP8B1 induction by intracellular glucose metabolism, in a cell-autonomous manner.
On the other hand, CYP7A1 expression in IHHs was not similarly regulated. Consistent with published data (9) CYP7A1 mRNA levels were induced upon high glucose exposure (Fig. S2G). However, siChREBP did not reverse this effect, in fact, it amplified it (Fig. S2G). Thus CYP7A1 mRNA levels are induced in response to glucose exposure in IHHs, but not via ChREBP. CYP7B1 was not regulated by glucose or siChREBP (Fig. S2G) and CYP27A1 is not expressed by IHH cells.
Hepatic G6P-ChREBP signaling regulates bile acid compositionThen we evaluated whether the G6P-ChREBP dependent induction of Cyp8b1 translated into qualitative changes in biliary and plasma bile acids. Hepatic G6P accumulation increased the contribution of biliary CA and DCA and increased plasma CA and DCA levels in L-G6pc-/- mice while administration of shChREBP had the opposite effect (Fig. 2E, S2H, Table S3, S4, S5), consistent with the observed decrease in hepatic Cyp8b1 expression (Fig. 2B, 2C, S2B). Combined, these data indicate that G6P-ChREBP induce qualitative changes in biliary and plasma bile acid composition via the induction of hepatic Cyp8b1 expression.
ChREBP does not directly regulate hepatic Cyp8b1 transcriptionWe next investigated whether ChREBP directly regulates Cyp8b1 transcription. Analysis of a hepatic ChREBP ChIP-seq data set (28) indicated potential regulation of Cyp8b1 by ChREBP. Computational analysis revealed three putative ChREBP response elements similar to the ChREBP consensus sequence (CAYGYGnnnnnCRCRTG), and one element with an alternative sequence (GGGGGYGGGC) in the mouse Cyp8b1 promoter (Fig. 3A). Cell reporter assays did not show transactivation of the murine or human Cyp8b1 promoter by ChREBPα or ChREBPβ, while both Cyp8b1 reporters used were transactivated by Hnf4α (Fig. 3B) (29), and the minimal Acaca
2020 07 03 Boekje 1.0.indd 1532020 07 03 Boekje 1.0.indd 153 24/07/2020 21:1324/07/2020 21:13

154
Chapter 5
Figure 3: ChREBP does not directly regulate hepatic Cyp8b1 transcription. (A) Schematic presentation of putative consensus and alternative ChREBP response elements within the murine Cyp8b1 promoter. (B) Luciferase activity for the murine and human CYP8B1 promoter reporter, and minimal promoter ACC/chore after transfection with Hnf4α, ChREBPα and ChREBPβ plasmids (n = 5-6). (C) In vivo ChIP analysis of the putative ChREBP response elements in the hepatic Cyp8b1 and L-pk gene and (D) of acetylated histone H4 around the hepatic Cyp8b1 gene in mice treated with either shChREBP or scrambled shRNA and infused with S4048 or vehicle (n = 7). (E) Hepatic mRNA levels of Acly in C57BL/6 mice treated with either shChREBP or scrambled shRNA, infused with S4048 or vehicle (n = 7-8). Data are represented as means ± SEM. ***p < 0.001, **p <0.01, *p < 0.05 indicates significance compared to vehicle controls. ##p < 0.01, #p < 0.05 indicates significance compared to controls treated with scrambled shRNA. See also Figure S3.
2020 07 03 Boekje 1.0.indd 1542020 07 03 Boekje 1.0.indd 154 24/07/2020 21:1324/07/2020 21:13

155
Glucose-6-phosphate regulates hepatic bile acid synthesis in mice
5
(Acc) promoter (30) did show ChREBP responsiveness (Fig. 3B). In agreement with these findings, in vivo ChIP analysis did not show a strong interaction of ChREBP with the putative response elements in the mouse Cyp8b1 promoter while S4048 treatment promoted ChREBP recruitment to the Pklr (L-pk) promoter (Fig. 3A, C) (31). Moreover, HNF4α recruitment to the Cyp8b1 and L-pk promoter regions was not altered upon ChREBP knockdown, indicating that the effect of ChREBP was likely not mediated by increased HNF4α binding to Cyp8b1 (Fig. S3A). We confirmed that acetylated histone 3 and 4 (H3/4) mainly interacted with the transcribed region of the Cyp8b1 promoter (Fig. S3B, Fig. 3D) (32). Interestingly, the recruitment of acetylated H4 in the promoter region (-1500 bp) and further downstream (+5000 bp) in the Cyp8b1 gene was induced upon hepatic G6P accumulation and reduced upon ChREBP knockdown in S4048-treated mice, while we did not observe clear changes in binding of acetylated H3 under conditions of combined hepatic ChREBP knockdown and G6P accumulation (Fig. 3D). Altogether, these findings demonstrate that the induction of Cyp8b1 expression by G6P-ChREBP is associated with increased recruitment of acetylated H4, but not of ChREBP, HNF4α or acetylated H3 to the Cyp8b1 locus. These effects were paralleled by a ChREBP-dependent induction of ATP citrate lyase (Acly) expression (Fig. 3E and 2D), the essential enzyme for glucose-induced histone acetylation in vitro (33).
G6P-ChREBP increases biliary bile acid hydrophobicity and reduces fecal sterol lossA shift in the contribution of CA versus CDCA-derived bile acids alters the hydrophobicity of the bile acid pool (22) and, in turn, changes the capacity for intestinal lipid solubilization and –uptake (1,7,34–36). The induction of hepatic Cyp8b1 expression and relative increase in CA and DCA in L-G6pc-/- mice (Fig. 1C, D) increased the hydrophobicity index of the biliary bile acids entering the intestine (Fig. 4A) while hepatic ChREBP knockdown reduced this index (Fig. 4B). We confirmed that hepatic Cyp8b1 expression was positively correlated to biliary bile acid hydrophobicity in L-G6pc-/- mice (37) (Fig. S4A) and hypothesized that altered hydrophobicity in response to G6P-ChREBP-CYP8B1 signaling impacts intestinal sterol absorption (34,36). Hepatic Cyp8b1 expression indeed negatively correlated with fecal neutral sterol excretion (36) (Fig. S4B). Fecal neutral sterol excretion was reduced in L-G6pc-/- mice (Fig. 4C, Fig. S4C) and, as expected, increased upon hepatic ChREBP knockdown (Fig. 4D, Fig. S4C). The plasma campesterol/cholesterol ratio, a marker of intestinal cholesterol absorption (38), showed similar patterns (Fig. 4E). Bile acid hydrophobicity and fecal neutral sterol excretion were found to be negatively correlated (Fig. 4F) and hepatic Chrebpβ mRNA expression showed a positive correlation to hydrophobicity index (Fig. 4G) while it was negatively correlated with fecal neutral sterol excretion (Fig 4H). Fecal energy and -fatty acid excretion remained unchanged in response to hepatic G6P accumulation or ChREBP knockdown (Fig. S4D, E).
2020 07 03 Boekje 1.0.indd 1552020 07 03 Boekje 1.0.indd 155 24/07/2020 21:1324/07/2020 21:13

156
Chapter 5
DiscussionIn the current study we characterized an important regulatory role of glucose, independent of insulin, in the control of hepatic bile acid synthesis. Using the monogenetic disease GSD I as a model to establish the contribution of intrahepatic glucose, we are the fi rst to show that G6P controls hepatic bile acid synthesis viaChREBP-dependent induction of Cyp8b1 in mice. Our fi ndings furthermore indicate that the G6P-ChREBP axis regulates hepatic CYP8B1 expression via histone
Figure 4: G6P-ChREBP increases biliary bile hydrophobicity and reduces fecal sterol loss.(A) Bile hydrophobicity index of bile from L-G6pc-/- and L-G6pc+/+ mice and (B) mice treated with either shChREBP or scrambled (scr) shRNA (n = 7-8). (C) Fecal neutral sterol excretion of L-G6pc-/- and L-G6pc+/+ mice (n = 8) and (D) mice treated with either shChREBP or scrambled shRNA (n = 14). (E) Plasma campesterol/cholesterol ratios in L-G6pc-/- and L-G6pc+/+ mice treated with either shChREBP or scrambled shRNA (n = 3). (F) Correlation between bile hydrophobicity index and normalized fecal neutral sterol excretion and between (G) Chrebpβ mRNA levels and bile hydrophobicity index in L-G6pc-/- and L-G6pc+/+ mice, and mice treated with either shChREBP or scrambled shRNA (n = 7-8). (H) Correlation between Chrebpβ mRNA levels and fecal neutral sterol excretion in L-G6pc-/- and L-G6pc+/+ mice (n = 8). Data represent Tukey boxplots. ***p < 0.001, **p <0.01, *p < 0.05 indicates signifi cance compared to wildtype littermates or controls treated with scrambled shRNA. ##p < 0.01 indicates signifi cance compared wildtype littermates. See also Figure S4.
2020 07 03 Boekje 1.0.indd 1562020 07 03 Boekje 1.0.indd 156 24/07/2020 21:1324/07/2020 21:13

157
Glucose-6-phosphate regulates hepatic bile acid synthesis in mice
5
4 acetylation dynamics. As a consequence, G6P-ChREBP signaling increases the relative abundance of CA-derived bile acids and induces physiologically relevant shifts in bile composition. We confirmed that the human CYP8B1 gene is regulated via a similar mechanism. Importantly, our work also demonstrates the physiological relevance of this novel regulatory mechanism: the G6P-ChREBP-dependent change in bile acid hydrophobicity in mice associates with reduced fecal neutral sterol loss and lower plasma campesterol/cholesterol ratios, compatible with enhanced intestinal cholesterol absorption (Fig. 5).
Besides the novel G6P-dependent regulation of CYP8B1, we found that hepatic levels of CYP7A1 protein, the supposedly rate-controlling enzyme in bile acid synthesis (6), as well as the plasma concentrations of its product C4 correlated with circulating glucose levels. Several studies have reported altered hepatic Cyp7a1 mRNA expression in response to changes in hepatic glucose availability (9,39). We and others have shown that type 1 and type 2 diabetic rodents exhibit increased hepatic expression of Cyp7a1 (39) and an enlarged bile acid pool (40,41). On the other hand, prolonged fasting decreases hepatic Cyp7a1 mRNA expression in mice, with a concomitant reduction of the total bile acid pool size (39), consistent with our finding that hypoglycemia is associated with lower hepatic CYP7A1 protein levels. These data indicate that the blood glucose level regulates CYP7A1 protein levels independently of hepatic G6P accumulation, possibly via its effect on the insulin-to-glucagon ratio (8,9), but independently of hepatic FOXO1,3,4 or ChREBP expression (Fig. S2A-D).
We thus show that hepatic CYP7A1 expression is partly controlled by circulating glucose levels, while intrahepatic glucose (G6P) appears to be the major regulator of CYP8B1 expression. Previous studies have reported an induction of Cyp8b1 by glucose in vitro (9) and an insulin-mediated suppression of the gene in vivo (2,4). We now show, in insulin-sensitive mice, that the glucose-mediated induction of Cyp8b1 requires hepatic ChREBP. Importantly, we observed that the ChREBP-dependent regulation of Cyp8b1 expression in response to intracellular glucose signaling was rapid (i.e., within 6 hours in S4048-exposed mouse liver) and also occurred in cultured human hepatocytes (IHH cells). Thus, the observed reduction of CYP8B1 mRNA levels upon ChREBP knockdown in IHH cells indicates a cell-autonomous relationship between ChREBP and CYP8B1 expression that is independent of circulating factors or potential changes in hepatic inflammation or injury.
Although we did not identify a direct transcriptional regulation of the CYP8B1 promoter by ChREBP, the G6P-ChREBP dependent changes in hepatic Cyp8b1 expression were paralleled by altered histone 4 acetylation patterns in the CYP8B1 promoter and more downstream in the gene. Increased histone 4 acetylation levels
2020 07 03 Boekje 1.0.indd 1572020 07 03 Boekje 1.0.indd 157 24/07/2020 21:1324/07/2020 21:13

158
Chapter 5
in response to hepatic G6P-ChREBP signaling likely promoted chromatin relaxation in these regions, resulting in an induction of Cyp8b1 transcription. ChREBP is a key determinant of glycolysis and a direct transcriptional regulator of ATP-citrate lyase (ACLY) (28,42), the essential enzyme for glucose-induced histone acetylation (9,33). In the current study we observed consistent changes in Acly expression, histone 4 acetylation patterns and CYP8B1 expression in response to G6P-ChREBP signaling. In contrast, the expression of other potential mediators of the G6P-ChREBP dependent Cyp8b1 regulation, i.e., FXR, SHP, LRH-1, HNF4α and MAFG, did not consistently follow the pattern of Cyp8b1 expression in response to G6P-ChREBP signaling. We therefore propose that the G6P-ChREBP axis controls the CYP8B1-mediated pathway in bile acid synthesis via histone 4 acetylation dynamics.
Hydrophobic bile acids eff ectively promote the absorption of dietary lipids and sterols (34–36) while a more hydrophilic bile acid pool is associated with enhanced intestinal cholesterol excretion (21). Our data strongly suggest that ChREBP activity contributes to cholesterol homeostasis in mice via its eff ect on CYP8B1 and, hence,
Figure 5: Working model of the mechanism by which intrahepatic glucose controls bile acid synthesis and intestinal cholesterol handling in mice. Intrahepatic glucose (G6P) controls bile acid synthesis via a ChREBP-dependent induction of Cyp8b1 via histone 4 acetylation, while hepatic Cyp7a1 expression is regulated by blood glucose levels. Hepatic G6P-ChREBP-CYP8B1 hence induces corresponding shifts in bile composition, which subsequently and promotes intestinal cholesterol absorption. Abbreviations: G6P, glucose-6-phosphate; Ac, histone 4 acetylation; ChREBP, Carbohydrate Response Element Binding Protein (Mlxipl); Cyp7a1, cholesterol 7α-hydroxylase; Cyp8b1, sterol 12α-hydroxylase, Cyp27a1, sterol 27-hydroxylase, Cyp7b1, oxysterol 7α-hydroxylase; Cyp2c70, cytochrome P450, family 2, subfamily c, polypeptide 70; CA, cholic acid (3α,7α,12α-trihydroxy-5β-cholan-24-oic acid); CDCA, chenodeoxycholic acid (3α,7α-dihydroxy-5β-cholan-24-oic acid); MCA, muricholic acid (3α,6β,7α-trihydroxy-5β-cholanoic acid and 3α,6β,7β-trihydroxy-5β-cholanoic acid).
2020 07 03 Boekje 1.0.indd 1582020 07 03 Boekje 1.0.indd 158 24/07/2020 21:1324/07/2020 21:13

159
Glucose-6-phosphate regulates hepatic bile acid synthesis in mice
5
on bile acid composition. The ChREBP-mediated increase in CA and decrease in β-MCA synthesis resulted in more hydrophobic bile that was paralleled by reduced fecal neutral sterol excretion. Because dietary cholesterol intake (data not shown), biliary cholesterol excretion (Table 1) and jejunal and ileal mRNA expression of Npc1l1, Abcg5, Abcg8 and Acat2 (data not shown) were similar in L-G6pc-/- mice and wildtype littermates, the reduction in neutral sterol excretion is most likely related to enhanced fractional cholesterol absorption as a consequence of the more hydrophobic bile acid pool in L-G6pc-/- mice. We also show that normalization of bile composition upon hepatic ChREBP knockdown reverses reduced fecal neutral sterol excretion, consistent with the phenotype of Cyp8b1-/- mice and with the effect of Cyp8b1 inhibition in mice (34,36,43). However, in contrast to what was reported for Cyp8b1-/- mice fed a high-fat diet (34,36), fecal fatty acid and energy loss remained unaltered in the current study. In accordance with our findings, Cyp8b1 heterozygous knockout mice displaying an intermediate phenotype with regard to bile acid pool composition also did not present changes in fecal calorie loss (34). The absence of a change in fecal excretion of non-sterol dietary fat could furthermore be due to the relatively low fat content of the chow diet used, the high efficiency of intestinal fatty acid absorption under normal conditions (44), and the fact that intestinal sterol absorption shows a larger dependency on bile acid hydrophobicity as compared to dietary fatty acids (35). Therefore, we conclude that activation of the hepatic G6P-ChREBP-CYP8B1 axis selectively reduces fecal cholesterol excretion in chow-fed mice.
A major difference in bile acid metabolism between mouse and human is the presence of MCAs in murine bile, due to rodent-specific C6-hydroxylation (45). As MCAs are very hydrophilic (22), the human bile acid pool is more hydrophobic as compared to mice. The G6P-ChREBP-mediated induction of Cyp8b1, promoting CA synthesis at the expense of dihydroxylated CDCA, would result in a more hydrophilic rather than a more hydrophobic bile acid pool in humans, with a potentially opposite effect on intestinal cholesterol absorption. There are no reports focusing on disturbed bile acid metabolism in GDS Ia patients, yet it is well-known that bile acid metabolism is perturbed in type 2 diabetes (2,4,5). Although deviations in blood glucose are opposite in GSD Ia and diabetes, intrahepatic glucose metabolism is enhanced in both diseases and the hepatic phenotypes are very similar, rendering GSD Ia a ‘model’ for diabetic liver disease (10–15). Type 2 diabetic mice exhibit elevated hepatic Cyp8b1 expression and a corresponding increase in 12-hydroxylated bile acids (4,41), which has been attributed to insulin resistance and consequent FOXO activation (4). As hepatic ChREBP is also activated in type 2 diabetic mice and humans (46–48), increased G6P-ChREBP signaling potentially contributes to perturbed bile acid metabolism in type 2 diabetes. Therefore, our current data underscore the need to establish the impact of intrahepatic G6P-ChREBP signaling on bile acid pool composition in mice
2020 07 03 Boekje 1.0.indd 1592020 07 03 Boekje 1.0.indd 159 24/07/2020 21:1324/07/2020 21:13

160
Chapter 5
with a humanized bile acid pool (45) and GSD I patients, as well as its contribution to perturbed bile acid metabolism in type 2 diabetes.
In conclusion, we present a novel mechanism by which intracellular glucose controls hepatic bile acid synthesis and intestinal cholesterol handling. The G6P-ChREBP-CYP8B1 signaling cascade that we have identified likely contributes to altered bile acid metabolism and its (patho)physiological consequences in conditions coinciding with excessive intrahepatic glucose signaling such as GSD I and type 2 diabetes.
AcknowledgementsWe thank A. Jurdinski, R. Havinga, T. Boer, M. Koehorst, R. Boverhof, Y. van der Veen, K. Tholen, C. van der Leij, S.X. Lee and Z. Unal for excellent technical assistance. We are thankful for receiving plasmids from M. Herman (pcDNA3.1/ChREBPα, pcDNA3.1/ChREBPβ, pcDNA3.1/Mlx), J.W. Jonker (pcDNA3.1/Hnf4α), H. Towle (minimal promoter PGL3/ChREBP luciferase reporter) and J. Chiang (human and mouse PGL3/Cyp8b1 promoter luciferase reporters). We thank A. Herling and D. Schmoll (Sanofi) for providing S4048 and L. Chan for sharing the ChREBP ChIP-seq data set.
Author ContributionsStudy concept and design, J.A.H., J.C.W., J.F.B., T.H.D., J.A.K., H.J.V., V.W.B., F.K., and M.H.O.; Acquisition of data, J.A.H., Y.L., J.C.W., T.B., A.B., and N.L.M.; Analysis and interpretation of data, J.A.H., T.H.D., H.J.V., V.W.B., F.K., and M.H.O., Drafting of the manuscript, J.A.H. and M.H.O.; Critical revision of the manuscript, J.F.B., H.J.V., V.W.B., F.K., and M.H.O., Material support, F.R., G.M., and R.A.H.
Grant supportThis work was supported by an unrestricted research grant from DSM Nutritional Products (Kaiseraugst, Switzerland). M.H.O. is the recipient of a VIDI grant from the Dutch Scientific Organization, and holds a Rosalind Franklin Fellowship from the University of Groningen. R.A.H. is supported by R01HL125649 from the National Institutes of Health. F.K. is supported by CardioVasculair Onderzoek Nederland (CVON2012-03).
2020 07 03 Boekje 1.0.indd 1602020 07 03 Boekje 1.0.indd 160 24/07/2020 21:1324/07/2020 21:13

161
Glucose-6-phosphate regulates hepatic bile acid synthesis in mice
5
References1. Lefebvre P, Cariou B, Lien F, Kuipers F, Staels B. Role of Bile Acids and Bile Acid Receptors
in Metabolic Regulation. Physiol. Rev. 2009;89:147–91. 2. Haeusler RA, Astiarraga B, Camastra S, Accili D, Ferrannini E. Human insulin resistance
is associated with increased plasma levels of 12α-hydroxylated bile acids. Diabetes. 2013;62:4184–91.
3. Bennion LJ, Grundy SM. Effects of Diabetes Mellitus on Cholesterol Metabolism in Man. N. Engl. J. Med. 1977;296:1365–1371.
4. Haeusler RA, Pratt-Hyatt M, Welch CL, Klaassen CD, Accili D. Impaired generation of 12-hydroxylated bile acids links hepatic insulin signaling with dyslipidemia. Cell Metab. 2012;15:65–74.
5. Brufau G, Stellaard F, Prado K, Bloks VW, Jonkers E, Boverhof R, et al. Improved glycemic control with colesevelam treatment in patients with type 2 diabetes is not directly associated with changes in bile acid metabolism. Hepatology. 2010;52:1455–64.
6. Chiang JYL. Bile acids: regulation of synthesis. J. Lipid Res. 2009;50:1955–66. 7. Gälman C, Angelin B, Rudling M. Bile acid synthesis in humans has a rapid diurnal
variation that is asynchronous with cholesterol synthesis. Gastroenterology. 2005;129:1445–53.
8. Li T, Kong X, Owsley E, Ellis E, Strom S, Chiang JYL. Insulin Regulation of Cholesterol 7α-Hydroxylase Expression in Human Hepatocytes. J. Biol. Chem. 2006;281:28745–28754.
9. Li T, Chanda D, Zhang Y, Choi H-S, Chiang JYL. Glucose stimulates cholesterol 7alpha-hydroxylase gene transcription in human hepatocytes. J. Lipid Res. 2010;51:832–42.
10. Ishida H, Yamashita C, Kuruta Y, Yoshida Y, Noshiro M. Insulin Is a Dominant Suppressor of Sterol 12α-Hydroxylase P450 (CYP8B) Expression in Rat Liver: Possible Role of Insulin in Circadian Rhythm of CYP8B. J. Biochem. 2000;127:57–64.
11. Bandsma RHJ, Grefhorst A, van Dijk TH, van der Sluijs FH, Hammer A, Reijngoud D-J, et al. Enhanced glucose cycling and suppressed de novo synthesis of glucose-6-phosphate result in a net unchanged hepatic glucose output in ob/ob mice. Diabetologia. 2004;47:2022–2031.
12. Oosterveer MH, Schoonjans K. Hepatic glucose sensing and integrative pathways in the liver. Cell. Mol. Life Sci. 2014;71:1453–1467.
13. Chou JY, Mansfield BC. Mutations in the glucose-6-phosphatase-alpha (G6PC) gene that cause type Ia glycogen storage disease. Hum. Mutat. 2008;29:921–930.
14. Mutel E, Abdul-Wahed A, Ramamonjisoa N, Stefanutti A, Houberdon I, Cavassila S, et al. Targeted deletion of liver glucose-6 phosphatase mimics glycogen storage disease type 1a including development of multiple adenomas. J. Hepatol. 2011;54:529–537.
15. Haeusler RA, Kaestner KH, Accili D. FoxOs function synergistically to promote glucose production. J. Biol. Chem. 2010;285:35245–8.
16. Hermens WTJMC, Brake O Ter, Dijkhuizen PA, Sonnemans MAF, Grimm D, Kleinschmidt JA, et al. Purification of Recombinant Adeno-Associated Virus by Iodixanol
2020 07 03 Boekje 1.0.indd 1612020 07 03 Boekje 1.0.indd 161 24/07/2020 21:1324/07/2020 21:13

162
Chapter 5
Gradient Ultracentrifugation Allows Rapid and Reproducible Preparation of Vector Stocks for Gene Transfer in the Nervous System. Hum. Gene Ther. 1999;10:1885–1891.
17. Samanez CH, Caron S, Briand O, Dehondt H, Duplan I, Kuipers F, et al. The human hepatocyte cell lines IHH and HepaRG: models to study glucose, lipid and lipoprotein metabolism. Arch. Physiol. Biochem. 2012;118:102–11.
18. Tong X, Zhao F, Mancuso A, Gruber JJ, Thompson CB. The glucose-responsive transcription factor ChREBP contributes to glucose-dependent anabolic synthesis and cell proliferation. Proc. Natl. Acad. Sci. U. S. A. 2009;106:21660–5.
19. Folch J, Lees M, Sloane GH. A Simple Method for the Isolation and Purification of Total Lipids from Animal Tissues. J. Biol. Chem. 1957;266:497–509.
20. Bergmeyer HU. Methods of enzymatic analysis [Internet]. In: Bergmeyer HU, editor. Methods of enzymetic analysis. Weinheim Germany: Verlag Chemie; 1974. p. 1089–1204.
21. de Boer JF, Schonewille M, Boesjes M, Wolters H, Bloks VW, Bos T, et al. Intestinal Farnesoid X Receptor Controls Transintestinal Cholesterol Excretion in Mice. Gastroenterology. 2017;152:1126–1138.e6.
22. Heuman DM. Quantitative estimation of the hydrophilic- hydrophobic balance of mixed bile salt solutions. J. Lipid Res. 1989;30:719–30.
23. Duggavathi R, Volle DH, Mataki C, Antal MC, Messaddeq N, Auwerx J, et al. Liver receptor homolog 1 is essential for ovulation. Genes Dev. 2008;22:1871–6.
24. Grefhorst A, Schreurs M, Oosterveer MH, Cortés VA, Havinga R, Herling AW, et al. Carbohydrate-response-element-binding protein (ChREBP) and not the liver X receptor α (LXRα) mediates elevated hepatic lipogenic gene expression in a mouse model of glycogen storage disease type 1. Biochem. J. 2010;432:249–54.
25. Kok T, Hulzebos C V, Wolters H, Havinga R, Agellon LB, Stellaard F, et al. Enterohepatic circulation of bile salts in farnesoid X receptor-deficient mice: efficient intestinal bile salt absorption in the absence of ileal bile acid-binding protein. J. Biol. Chem. 2003;278:41930–7.
26. Gälman C, Arvidsson I, Angelin B, Rudling M. Monitoring hepatic cholesterol 7alpha-hydroxylase activity by assay of the stable bile acid intermediate 7alpha-hydroxy-4-cholesten-3-one in peripheral blood. J. Lipid Res. 2003;44:859–66.
27. Abdul-Wahed A, Gautier-Stein A, Casteras S, Soty M, Roussel D, Romestaing C, et al. A link between hepatic glucose production and peripheral energy metabolism via hepatokines. Mol. Metab. 2014;3:531–543.
28. Poungvarin N, Chang B, Imamura M, Chen J, Moolsuwan K, Sae-Lee C, et al. Genome-Wide Analysis of ChREBP Binding Sites on Male Mouse Liver and White Adipose Chromatin. Endocrinology. 2015;156:1982–94.
29. Inoue Y, Yu A-M, Yim SH, Ma X, Krausz KW, Inoue J, et al. Regulation of bile acid biosynthesis by hepatocyte nuclear factor 4alpha. J. Lipid Res. 2006;47:215–27.
30. O’Callaghan BL, Koo SH, Wu Y, Freake HC, Towle HC. Glucose regulation of the acetyl-CoA carboxylase promoter PI in rat hepatocytes. J. Biol. Chem. 2001;276:16033–9.
31. Hasegawa J, Osatomi K, Wu RF, Uyeda K. A novel factor binding to the glucose
2020 07 03 Boekje 1.0.indd 1622020 07 03 Boekje 1.0.indd 162 24/07/2020 21:1324/07/2020 21:13

163
Glucose-6-phosphate regulates hepatic bile acid synthesis in mice
5
response elements of liver pyruvate kinase and fatty acid synthase genes. J. Biol. Chem. 1999;274:1100–7.
32. Yamada A, Honma K, Mochizuki K, Goda T. BRD4 regulates fructose-inducible lipid accumulation-related genes in the mouse liver. Metabolism. 2016;65:1478–1488.
33. Wellen KE, Hatzivassiliou G, Sachdeva UM, Bui T V, Cross JR, Thompson CB. ATP-citrate lyase links cellular metabolism to histone acetylation. Science. 2009;324:1076–80.
34. Bertaggia E, Jensen KK, Castro-Perez J, Xu Y, Di Paolo G, Chan RB, et al. Cyp8b1 ablation prevents Western diet-induced weight gain and hepatic steatosis because of impaired fat absorption. Am. J. Physiol. Endocrinol. Metab. 2017;313:E121–E133.
35. Wang DQ-H, Tazuma S, Cohen DE, Carey MC. Feeding natural hydrophilic bile acids inhibits intestinal cholesterol absorption: studies in the gallstone-susceptible mouse. Am. J. Physiol. Gastrointest. Liver Physiol. 2003;285:G494-502.
36. Bonde Y, Eggertsen G, Rudling M. Mice Abundant in Muricholic Bile Acids Show Resistance to Dietary Induced Steatosis, Weight Gain, and to Impaired Glucose Metabolism. PLoS One. 2016;11:e0147772.
37. Pandak WM, Bohdan P, Franklund C, Mallonee DH, Eggertsen G, Bjorkhem I, et al. Expression of sterol 12α-hydroxylase alters bile acid pool composition in primary rat hepatocytes and in vivo. Gastroenterology. 2001;120:1801–1809.
38. Stellaard F, von Bergmann K, Sudhop T, Lütjohann D. The value of surrogate markers to monitor cholesterol absorption, synthesis and bioconversion to bile acids under lipid lowering therapies. J. Steroid Biochem. Mol. Biol. 2017;169:111–122.
39. Li T, Francl JM, Boehme S, Ochoa A, Zhang Y, Klaassen CD, et al. Glucose and insulin induction of bile acid synthesis: mechanisms and implication in diabetes and obesity. J. Biol. Chem. 2012;287:1861–73.
40. Van Waarde WM, Verkade HJ, Wolters H, Havinga R, Baller J, Bloks V, et al. Differential effects of streptozotocin-induced diabetes on expression of hepatic ABC-transporters in rats. Gastroenterology. 2002;122:1842–1852.
41. Herrema H, Meissner M, van Dijk TH, Brufau G, Boverhof R, Oosterveer MH, et al. Bile salt sequestration induces hepatic de novo lipogenesis through farnesoid X receptor- and liver X receptorα-controlled metabolic pathways in mice. Hepatology. 2010;51:806–816.
42. Ma L, Robinson LN, Towle HC. ChREBP*Mlx is the principal mediator of glucose-induced gene expression in the liver. J. Biol. Chem. 2006;281:28721–30.
43. Chevre R, Trigueros-Motos L, Castaño D, Chua T, Corlia M, Patankar J V, et al. Therapeutic modulation of the bile acid pool by Cyp8b1 knockdown protects against nonalcoholic fatty liver disease in mice. FASEB J. 2018;32:3792–3802.
44. Werner A, Minich DM, Havinga R, Bloks V, Van Goor H, Kuipers F, et al. Fat malabsorption in essential fatty acid-deficient mice is not due to impaired bile formation. Am J Physiol Gastrointest Liver Physiol. 2002;283:900–908.
45. Takahashi S, Fukami T, Masuo Y, Brocker CN, Xie C, Krausz KW, et al. Cyp2c70 is responsible for the species difference in bile acid metabolism between mice and humans. J. Lipid Res. 2016;57:2130–2137.
2020 07 03 Boekje 1.0.indd 1632020 07 03 Boekje 1.0.indd 163 24/07/2020 21:1324/07/2020 21:13

164
Chapter 5
46. Dentin R, Benhamed F, Hainault I, Fauveau VR, Foufelle F, Dyck JRB, et al. Liver-Specific Inhibition of ChREBP Improves Hepatic Steatosis and Insulin Resistance in ob/ob Mice. Diabetes. 2006;55:2159–2170.
47. Kursawe R, Caprio S, Giannini C, Narayan D, Lin A, D’Adamo E, et al. Decreased transcription of ChREBP-α/β isoforms in abdominal subcutaneous adipose tissue of obese adolescents with prediabetes or early type 2 diabetes: associations with insulin resistance and hyperglycemia. Diabetes. 2013;62:837–44.
48. Eissing L, Scherer T, Tödter K, Knippschild U, Greve JW, Buurman WA, et al. De novo lipogenesis in human fat and liver is linked to ChREBP-β and metabolic health. Nat. Commun. 2013;4:1528.
2020 07 03 Boekje 1.0.indd 1642020 07 03 Boekje 1.0.indd 164 24/07/2020 21:1324/07/2020 21:13

165
Glucose-6-phosphate regulates hepatic bile acid synthesis in mice
5
Figure S1. (A) Plasma bile acid levels in C57BL/6 mice infused with S4048 or vehicle (n = 7). (B) Plasma and (C) Fecal bile acid composition in L-G6pc-/- and L-G6pc+/+ mice (n = 7-8). (D) Plasma C4 levels in L-G6pc-/- and L-G6pc+/+ mice in either fed state or after an overnight fast (n = 7-8). (E) mRNA expression in IHH cells after low (1 mM) or high (11 mM) glucose exposure for 24 hours (n = 6). Data represent Tukey boxplots. ***p < 0.001, ** p < 0.01 indicates signifi cance compared to wildtype littermates or low glucose exposure.
Supplemental Material
2020 07 03 Boekje 1.0.indd 1652020 07 03 Boekje 1.0.indd 165 24/07/2020 21:1324/07/2020 21:13

166
Chapter 5
Figure S2. (A) Hepatic Cyp7a1 mRNA levels in L-FoxO1,3,4+/+ and L-FoxO1,3,4-/- mice treated with S4048 or vehicle (n = 7-9). (B) Hepatic mRNA levels in C57BL/6 mice treated with either shChREBP or scrambled shRNA and infused with S4048 or vehicle (n = 6-7). (C) Hepatic mRNA and (D) Protein levels of bile acid synthesis enzymes in L-G6pc+/+ and L-G6pc-/- mice treated with either shChREBP or scrambled shRNA (n = 3-6). Hepatic mRNA levels of transcriptional regulators of Cyp8b1 in (E) S4048 or vehicle-infused C57BL/6 mice or (F) L-G6pc-/- and L-G6pc+/+ mice treated with either shChREBP or scrambled shRNA (n = 4-7). (G) mRNA expression in IHH cells exposed to low glucose (1 mM) or high glucose (11 mM) or transfected with siChREBP or scramble after high glucose exposure for 24 hours (n = 6). (H) Biliary bile acid composition in mice treated with either shChREBP or scrambled shRNA and infused with S4048 or vehicle (n = 3-7). Data represent Tukey boxplots. ***p < 0.001, **p < 0.01, *p < 0.05 indicates signifi cance compared to scrambled shRNA. ###p < 0.001, ##p < 0.01, #p < 0.05 indicates signifi cance compared to vehicle controls or wildtype littermates.
2020 07 03 Boekje 1.0.indd 1662020 07 03 Boekje 1.0.indd 166 24/07/2020 21:1324/07/2020 21:13
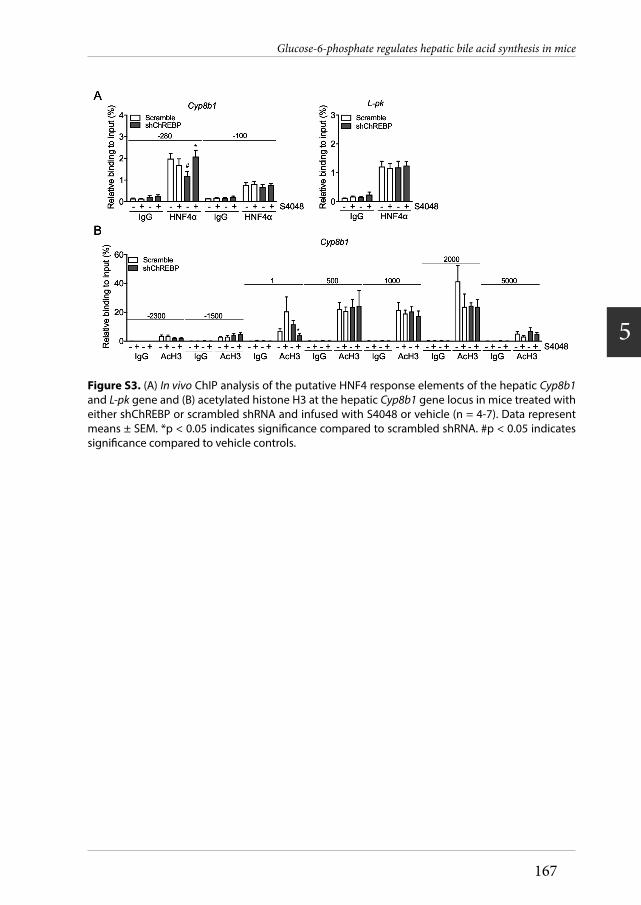
167
Glucose-6-phosphate regulates hepatic bile acid synthesis in mice
5
Figure S3. (A) In vivo ChIP analysis of the putative HNF4 response elements of the hepatic Cyp8b1and L-pk gene and (B) acetylated histone H3 at the hepatic Cyp8b1 gene locus in mice treated with either shChREBP or scrambled shRNA and infused with S4048 or vehicle (n = 4-7). Data represent means ± SEM. *p < 0.05 indicates signifi cance compared to scrambled shRNA. #p < 0.05 indicates signifi cance compared to vehicle controls.
2020 07 03 Boekje 1.0.indd 1672020 07 03 Boekje 1.0.indd 167 24/07/2020 21:1324/07/2020 21:13

168
Chapter 5
Figure S4. (A) Correlation between Cyp8b1 mRNA levels and bile hydrophobicity index and (B) correlation between Cyp8b1 mRNA levels and fecal neutral sterol excretion in L-G6pc-/- and L-G6pc+/+
mice (n = 8). (C) Fecal excretion of coprostanol (Copr), cholesterol (Chol) and dihydroxy-cholesterol (DiH-Col) in L-G6pc-/- and L-G6pc+/+ mice and C57BL/6 mice treated with either shChREBP or scrambled shRNA (n = 7-14). (D) Fecal energy excretion and (E) fecal fatty acid excretion in L-G6pc-/-
and L-G6pc+/+ mice and C57BL/6 mice treated with either shChREBP or scrambled shRNA (n = 7-14). Data represent Tukey boxplots. ***p < 0.001, *p < 0.05 indicates signifi cance compared to wildtype littermates or scrambled shRNA.
2020 07 03 Boekje 1.0.indd 1682020 07 03 Boekje 1.0.indd 168 24/07/2020 21:1324/07/2020 21:13

169
Glucose-6-phosphate regulates hepatic bile acid synthesis in mice
5
Tabl
e S1
. Met
abol
ic pa
ram
eter
s in
mal
e C5
7BL/
6 m
ice tr
eate
d w
ith S
4048
or v
ehicl
e an
d in
fast
ed L-
G6pc
-/- m
ice a
nd w
ildty
pe li
tter
mat
es
C5
7BL/
6 Ve
hicle
C5
7BL/
6 S4
048
L-G6
pc+/+
L-G6
pc-/-
Med
ian
(Ran
ge)
Med
ian
(Ran
ge)
p-va
lue
Med
ian
(Ran
ge)
Med
ian
(Ran
ge)
p-va
lue
Body
wei
ght (
g)
21.3
(20.
1 –
23.4
) 22
.1 (1
8.7 –
24.9
) 0.
902
28.4
(21.
5 –
29.9
) 27
.5 (2
5.3 –
32.5
) 0.
645
Liver
wei
ght (
g)
1.0
(0.8
– 1
.0)
1.3
(1.0
– 1
.4
0.00
9 1.
3 (0
.8 –
1.5
) 1.
8 (1
.6 –
2.0
) <0
.001
Liv
er to
bod
y w
eigh
t rat
io (%
) 4.
3 (3
.5 –
5.0
) 5.
6 (4
.8 –
6.2
) 0.
009
4.4
(3.5
– 5
.1)
6.7
(6.0
– 7
.1)
<0.0
01
Bloo
d gl
ucos
e (m
mol
/L)
6.4
(4.1
– 6
.9)
2.4
(1.7
– 2
.9)
0.00
1 5.
0 (3
.7 –
8.4
) 2.
1 (1
.7 –
2.4
) <0
.001
He
patic
G6P
(nm
ol/g
live
r)
67.1
(59.
2 –
83.7
) 12
8.9
(60.
6 –
241.
0)
0.05
1 42
1.7
(264
.5 –
483
.3)
2585
.5 (1
980.
9 –
3457
.3)
<0.0
01
Hepa
tic g
lyco
gen
(mg/
g liv
er)
2.2
(1.3
– 2
.7)
39.8
(31.
3 –
44.4
) 0.
004
17.7
(12.
4 –
29.5
) 54
.2 (4
6.4 –
62.1
) <0
.001
Gl
ucag
on (p
g/m
L)
138.
4 (7
8.8 –
200.
1)
225.
4 (1
35.2
– 6
49.9
) 0.
017
112.
7 (8
6.2 –
132.
3)
235.
9 (1
36.8
– 5
81.8
) <0
.001
In
sulin
(ng/
mL)
0.
2 (0
.1 –
0.3
) 0.
2 (0
.1 –
0.3
) 0.
343
0.3
(0.1
– 0
.6)
0.2
(0.1
– 0
.4)
0.13
0
2020 07 03 Boekje 1.0.indd 1692020 07 03 Boekje 1.0.indd 169 24/07/2020 21:1324/07/2020 21:13

170
Chapter 5
Table S2. Plasma and fecal bile acid profiles in L-G6pc-/- mice and wildtype littermates Bile acid species L-G6pc+/+ L-G6pc-/- Median (Range) Median (Range) p-value Plasma (µmol/L)
CA 0.41 (0.14 – 2.39) 0.46 (0.08 – 3.19) 1.000 TCA 0.26 (0.08 – 0.35) 0.65 (0.14 – 1.29) 0.281 DCA 0.62 (0.33 – 1.43) 0.30 (0.06 – 1.11) 0.232 TDCA 0.11 (0.06 – 0.18) 0.26 (0.09 – 0.34) 0.021 UDCA 0.14 (0.03 – 0.36) 0.09 (0.05 – 0.16) 0.497 TUDCA 0.04 (0.03 – 0.05) 0.05 (0.04 – 0.05) 1.000 CDCA 0.06 (0.02 – 0.14) 0.06 (0.02 – 0.10) 0.648 HDCA 0.07 (0.03 – 0.17) 0.05 (0.03 – 0.14) 0.921 THDCA 0.03 (0.03 – 0.03) 0.03 (0.03 – 0.03) 1.000 α-MCA 0.10 (0.05 – 0.19) 0.04 (0.03 – 0.09) 0.114 Tα-MCA 0.05 (0.01 – 0.07) 0.08 (0.01 – 0.12) 0.106 β-MCA 0.56 (0.14 – 2.63) 0.16 (0.03 – 0.89) 0.093 Tβ-MCA 0.10 (0.04 – 0.26) 0.06 (0.01 – 0.33) 0.649 ω-MCA 1.00 (0.48 – 4.25) 0.43 (0.11 – 1.75) 0.040 Total 3.14 (1.51 – 11.41) 2.62 (0.67 – 8.36) 0.232
Feces (µmol/day/100g BW) CA 0.57 (0.38 – 0.97) 1.01 (0.49 – 1.69) 0.028 UDCA 0.31 (0.19 – 0.51) 0.29 (0.20 – 0.36) 0.645 DCA 2.24 (1.61 – 3.99) 3.22 (1.92 – 4.54) 0.050 HDCA 0.23 (0.15 – 0.55) 0.20 (0.11 – 0.26) 0.161 α-MCA 0.66 (0.41 – 1.05) 0.74 (0.44 – 1.16) 0.574 β-MCA 0.96 (0.74 – 1.97) 0.61 (0.43 – 1.05) 0.005 ω-MCA 2.61 (1.84 – 4.03) 1.64 (0.78 – 2.00) 0.001 Total 7.71 (6.44 – 11.88) 8.14 (4.81 – 9.45) 0.878
2020 07 03 Boekje 1.0.indd 1702020 07 03 Boekje 1.0.indd 170 24/07/2020 21:1324/07/2020 21:13

171
Glucose-6-phosphate regulates hepatic bile acid synthesis in mice
5
Tabl
e S3
. Bili
ary
and
plas
ma
bile
acid
pro
files
in m
ale
C57B
L/6
mice
inje
cted
with
eith
er sh
ChRE
BP o
r scr
ambl
e AA
V2/8
and
trea
ted
with
S40
48 o
r veh
icle
Bile
acid
spec
ies
Scra
mbl
e ve
hicle
Sc
ram
ble
S404
8
ShCh
REBP
veh
icle
ShCh
REBP
S40
48
Med
ian
(Ran
ge)
Med
ian
(Ran
ge)
p-va
lue
Med
ian
(Ran
ge)
Med
ian
(Ran
ge)
p-va
lue
Bile
(% o
f tot
al)
CA
0.56
(0.2
2 –
3.16
) 2.
95 (2
.35
– 3.
10)
0.07
3 0.
75 (0
.09
– 3.
78)
1.38
(0.1
8 –
3.03
) 0.
833
GCA
0.13
(0.1
1 –
0.18
) 0.
18 (0
.16
– 0.
26)
0.10
9 0.
08 (0
.05
– 0.
180
0.11
(0.0
9 –
0.12
) 0.
833
TCA
48.6
5 (4
6.70
– 6
2.57
) 53
.93
(43.
28 –
56.
99)
0.52
7 38
.15
(24.
71 –
47.
28)
38.3
7 (3
2.47
– 4
5.77
) 1.
000
TDCA
2.
17 (1
.35
– 3.
66)
3.80
(2.6
0 –
4.99
) 0.
024
0.58
(0.4
9 –
0.74
) 0.
83 (0
.68
– 1.
23)
0.06
7 TU
DCA
1.00
(0.8
7 –
1.14
) 1.
00 (0
.96
– 1.
41)
0.64
8 1.
09 (0
.68
– 1.
30)
1.09
(0.5
9 –
1.20
) 0.
833
TCDC
A 0.
98 (0
.68
– 1.
27)
1.10
(1.0
2 –
1.76
) 0.
315
1.57
(1.1
8 –
1.94
) 1.
79 (0
.63
– 2.
23)
0.83
3 TH
DCA
0.71
(0.2
8 –
1.58
) 2.
65 (0
.77
– 3.
25)
0.02
4 0.
79 (0
.16
– 1.
69)
0.91
(0.1
9 –
1.15
) 0.
833
α-M
CA
0.03
(0.0
0 –
0.38
) 0.
37 (0
.21
– 0.
38)
0.02
4 0.
05 (0
.00
– 0.
39)
0.20
(0.0
0 –
0.64
) 0.
833
Tα-M
CA
6.80
(5.3
2 –
8.16
) 7.
82 (6
.96
– 8.
55)
0.16
4 7.
26 (5
.65
– 9.
15)
10.1
4 (4
.61
– 10
.88)
0.
517
β-M
CA
0.30
(0.0
8 –
0.85
) 0.
43 (0
.25
– 0.
75)
0.64
8 0.
41 (0
.14
– 1.
58)
0.65
(0.1
8 –
0.99
) 0.
833
Tβ-M
CA
35.8
4 (2
6.48
– 4
2.43
) 23
.65
(20.
66 –
39.
14)
0.07
3 45
.12
(43.
05 –
56.
81)
46.8
9 (3
7.42
– 4
9.76
) 1.
000
ω-M
CA
0.34
(0.2
3 –
1.09
) 1.
06 (0
.59
– 1.
72)
0.04
2 0.
47 (0
.22
– 1.
81)
0.64
(0.1
8 –
2.75
) 1.
000
Plas
ma
(µm
ol/L
) CA
0.
24 (0
.14
– 0.
71)
0.35
(0.1
1 –
10.1
0)
0.71
0 2.
37 (0
.21
– 44
.60)
0.
68 (0
.25
– 4.
65)
0.44
5 GC
A 0.
04 (0
.04
– 0.
16)
0.05
(0.0
3 –
0.09
) 0.
686
0.05
(0.0
3 –
0.24
) 0.
04 (0
.04
– 0.
05)
0.85
7 TC
A 13
.30
(0.1
7 –
65.2
0)
1.80
(0.1
4 –
37.0
0)
0.62
0 3.
94 (0
.94
– 31
.70)
1.
95 (0
.47
– 17
.30)
0.
165
DCA
0.11
(0.0
7 –
0.57
) 0.
21 (0
.10
– 3.
08)
0.12
8 0.
26 (0
.06
– 0.
99)
0.12
(0.0
5 –
0.46
) 0.
534
TDCA
0.
24 (0
.05
– 2.
86)
0.14
(0.0
5 –
2.16
) 0.
805
0.14
(0.0
3 –
0.52
) 0.
12 (0
.05
– 0.
64)
1.00
0 UD
CA
0.03
(0.0
3 –
0.05
) 0.
04 (0
.03
– 0.
26)
0.25
0 0.
10 (0
.05
– 0.
52)
0.04
(0.0
3 –
0.07
) 0.
015
TUDC
A 0.
23 (0
.03
– 0.
87)
0.09
(0.0
3 –
0.48
) 0.
662
0.10
(0.0
4 –
0.63
) 0.
07 (0
.04
- 0.3
3)
0.31
8 CD
CA
0.05
(0.0
3 –
0.06
) 0.
09 (0
.04
– 0.
29)
0.40
0 0.
12 (0
.03
– 1.
44)
0.06
(0.0
3 –
0.14
) 0.
394
TCDC
A 0.
20 (0
.05
– 0.
79)
0.17
(0.0
3 –
0.36
) 0.
730
0.08
(0.0
3 –
1.35
) 0.
05 (0
.03
– 0.
33)
0.38
3 HD
CA
0.04
(0.0
3 –
0.06
) 0.
04 (0
.04
– 0.
16)
0.26
7 0.
07 (0
.03
– 0.
32)
0.06
(0.0
3 –
0.16
) 0.
589
THDC
A 0.
07 (0
.03
– 0.
41)
0.10
(0.0
4 –
0.51
) 0.
445
0.14
(0.0
5 –
0.45
) 0.
06 (0
.03
– 0.
15)
0.10
1 α-
MCA
0.
04 (0
.04
– 0.
13)
0.14
(0.0
4 –
0.43
) 0.
229
0.22
(0.0
4 –
3.83
) 0.
05 (0
.03
– 0.
39)
0.83
6 Tα
-MCA
1.
36 (0
.25
– 5.
62)
0.28
(0.0
3 –
3.56
) 0.
295
0.83
(0.2
1 –
7.40
) 0.
17 (0
.07
– 1.
68)
0.07
3 β-
MCA
0.
22 (0
.12
– 1.
01)
0.26
(0.0
6 –
6.88
) 0.
805
1.53
(0.0
3 –
18.5
0)
0.69
(0.3
5 –
5.28
) 0.
165
Tβ-M
CA
9.66
(0.0
7 –
52.6
0)
0.64
(0.1
1 –
39.8
0)
0.53
5 4.
52 (1
.56
– 59
.00)
1.
37 (0
.31
– 26
.50)
0.
097
ω-M
CA
0.51
(0.2
5 –
2.46
) 0.
89 (0
.42
– 6.
88)
0.31
8 1.
42 (0
.10
– 5.
97)
1.03
(0.3
9 –
4.15
) 0.
535
Tota
l 26
.32
(1.2
7 –
133.
43)
4.46
(1.3
0 –
98.5
0)
0.62
0 13
.67
(3.8
0 –
166.
63)
6.69
(3.1
8 –
51.0
0)
0.38
3
2020 07 03 Boekje 1.0.indd 1712020 07 03 Boekje 1.0.indd 171 24/07/2020 21:1324/07/2020 21:13

Table S4. Fecal bile acid profile in chow-fed C57BL/6 mice injected with either shChREBP or scramble AAV2/8 Bile acid species Scramble shChREBP Median (Range) Median (Range) p-value Feces (µmol/day/100g BW)
CA 1.48 (0.36 – 2.54) 1.03 (0.22 – 2.02) 0.210 DCA 1.55 (0.81 – 2.04) 0.92 (0.49 – 1.27) <0.001 CDCA 0.07 (0.00 – 0.15) 0.00 (0.00 – 0.13) 0.743 α-MCA 0.40 (0.29 – 0.53) 0.31 (0.21 – 0.41) 0.002 β-MCA 0.83 (0.47 – 1.40) 0.93 (0.35 – 1.67) 0.210 ω-MCA 1.15 (0.66 – 1.58) 1.11 (0.52 – 1.78) 0.946 Total 5.31 (3.61 – 7.01) 4.61 (2.54 – 5.57) 0.085
2020 07 03 Boekje 1.0.indd 1722020 07 03 Boekje 1.0.indd 172 24/07/2020 21:1324/07/2020 21:13

173
Glucose-6-phosphate regulates hepatic bile acid synthesis in mice
5
Tabl
e S5
. Bili
ary
and
plas
ma
bile
acid
pro
files
in ch
ow-fe
d L-G6
pc-/- m
ice a
nd w
ildty
pe li
tter
mat
es, i
njec
ted
with
eith
er sh
ChRE
BP o
r scr
ambl
e AA
V2/8
L-G6
pc+/+ S
cram
ble
L-G6
pc+/+ s
hChR
EBP
L-G6
pc-/- S
cram
ble
L-G6
pc-/- s
hChR
EBP
Med
ian
(Ran
ge)
Med
ian
(Ran
ge)
p-va
lue
Med
ian
(Ran
ge)
Med
ian
(Ran
ge)
p-va
lue
Bile
(% o
f tot
al)
CA
5.69
(1.9
7 –
7.32
) 0.
53 (0
.00
– 3.
46)
0.05
7 4.
47 (3
.64
– 7.
80)
0.04
(0.
00 –
0.2
2)
0.01
6 GC
A 0.
27 (0
.11
– 0.
30)
0.00
(0.0
0 –
0.11
) 0.
029
0.23
(0.2
1 –
0.39
) 0.
01 (0
.00
– 0.
09)
0.01
6 TC
A 52
.81
(46.
69 –
59.
94)
16.5
7 (1
0.70
– 2
9.58
) 0.
029
64.5
4 (5
0.90
– 6
8.52
) 30
.42
(25.
20 –
41.
08)
0.01
6 TU
DCA
1.77
(1.0
1 –
2.35
) 0.
61 (0
.21
– 1.
19)
0.05
7 1.
71 (0
.46
– 2.
10)
0.10
(0.0
0 –
0.22
) 0.
016
TCDC
A 1.
20 (0
.48
– 1.
79)
0.83
(0.4
5 –
1.11
) 0.
686
1.70
(0.3
8 –
1.94
) 0.
06 (0
.00
– 0.
13)
0.01
6 TD
CA
1.83
(0.9
2 –
2.79
) 0.
06 (0
.00
– 0.
60)
0.02
9 1.
22 (0
.62
– 2.
19)
0.01
(0.0
0 –
0.04
) 0.
016
THDC
A 0.
67 (0
.45
– 1.
16)
0.14
(0.0
0 –
0.39
) 0.
029
0.43
(0.2
4 –
0.68
) 0.
03 (0
.00
- 0.0
7)
0.01
6 α-
MCA
0.
22 (0
.06
– 0.
53)
0.14
(0.0
0 –
0.34
) 0.
486
0.33
(0.1
4 –
0.72
) 0.
00 (0
.00
– 0.
01)
0.01
6 Tα
-MCA
5.
34 (3
.30
– 8.
70)
2.54
(0.7
6 –
4.80
) 0.
114
7.26
(2.7
1 –
7.98
) 0.
50 (0
.42
– 0.
68)
0.01
6 β-
MCA
1.
08 (0
.31
– 1.
74)
2.22
(0.0
0 –
4.40
) 0.
686
0.41
(0.3
2 –
1.07
) 0.
05 (0
.00
– 0.
49)
0.11
1 Tβ
-MCA
26
.41
(24.
28 –
36.
30)
75.6
6 (5
3.19
– 8
6.35
) 0.
029
19.3
7 (1
3.24
– 2
4.00
) 68
.67
(58.
49 –
72.
89)
0.01
6 ω
-MCA
0.
73 (0
.25
- 2.1
9)
0.91
(0.0
0 –
1.93
) 0.
886
0.35
(0.2
3 –
0.77
) 0.
01 (0
.00
– 0.
13)
0.01
6 Pl
asm
a (µ
mol
/L)
CA
2.48
(1.5
1 –
3.44
) 0.
19 (0
.19
– 0.
19)
0.22
1 2.
78 (2
.03
– 3.
28)
0.84
(0.8
2 –
24.0
0)
0.51
3 TC
A 2.
63 (0
.73
– 4.
54)
6.75
(6.7
4 –
6.76
) 0.
121
4.19
(1.6
3 –
5.14
) 15
9.00
(39.
20 –
250
.00)
0.
050
GCA
0.03
(0.0
2 –
0.03
) 0.
03 (0
.02
– 0.
04)
0.68
3 0.
03 (0
.02
– 0.
04)
0.69
(0.2
7 –
1.42
) 0.
083
DCA
0.71
(0.4
2 –
1.00
) 0.
02 (0
.01
– 0.
03)
0.12
1 0.
33 (0
.29
– 0.
52)
0.03
(0.0
2 –
0.03
) 0.
050
TDCA
0.
14 (0
.07
– 0.
21)
0.03
(0.0
3 –
0.03
) 0.
121
0.11
(0.0
9 –
0.14
) 0.
11 (0
.08
– 0.
29)
1.00
0 UD
CA
0.35
(0.2
7 –
0.43
) 0.
03 (0
.03
– 0.
03)
0.22
1 0.
24 (0
.17
– 0.
33)
0.03
(0.0
3 –
0.03
) 0.
180
TUDC
A 0.
09 (0
.05
– 0.
14)
0.12
(0.1
1 –
0.14
) 0.
439
0.08
(0.0
6 –
0.10
) 0.
58 (0
.35
– 0.
82)
0.05
0 CD
CA
0.13
(0.0
9 –
0.17
) 0.
04 (0
.04
– 0.
04)
0.22
1 0.
13 (0
.10
– 0.
15)
0.01
(0.0
1 –
0.01
) 0.
037
TCDC
A 0.
05 (0
.01
– 0.
08)
0.21
(0.2
1 –
0.22
) 0.
121
0.07
(0.0
5 –
0.11
) 0.
53 (0
.32
– 0.
84)
0.05
0 GC
DCA
0.01
(0.0
1 –
0.01
) 0.
01 (0
.01
– 0.
01)
0.12
1 0.
01 (0
.01
– 0.
01)
0.02
(0.0
1 –
0.04
) 0.
050
HDCA
0.
14 (0
.10
– 0.
17)
0.01
(0.0
1 –
0.01
) 0.
221
0.10
(0.0
8 –
0.11
) 0.
01 (0
.01
– 0.
03)
0.04
6 GH
DCA
0.00
(0.0
0 –
0.00
) 0.
01 (0
.01
– 0.
010
0.12
1 0.
00 (0
.00
– 0.
00)
0.10
(0.0
7 –
0.21
) 0.
050
THDC
A 0.
05 (0
.03
– 0.
06)
0.04
(0.0
4 –
0.04
) 1.
000
0.03
(0.0
2 –
0.07
) 0.
26 (0
.17
– 0.
35)
0.08
3 α-
MCA
0.
20 (0
.07
– 0.
32)
0.02
(0.0
2 –
0.02
) 0.
221
0.20
(0.1
7 –
0.21
) 0.
05 (0
.02
– 0.
08)
0.08
3 Tα
-MCA
0.
41 (0
.14
– 0.
68)
0.45
(0.3
5 –
0.55
) 1.
000
0.41
(0.1
4 –
0.42
) 2.
06 (1
.41
– 4.
28)
0.05
0 β-
MCA
1.
81 (1
.27
– 2.
35)
0.87
(0.1
5 –
1.60
) 0.
439
0.93
(0.9
3 –
1.62
) 4.
46 (1
.43
– 18
.70)
0.
121
Tβ-M
CA
1.24
(0.2
3 –
2.24
) 36
.80
(21.
30 –
52.
30)
0.12
1 0.
93 (0
.23
– 1.
02)
322.
00 (1
30.0
0 –
353.
00)
0.05
0 ω
-MCA
2.
15 (1
.46
– 2.
84)
0.56
(0.0
9 –
1.04
) 0.
121
1.04
(0.8
7 –
1.16
) 1.
24 (0
.38
– 8.
58)
0.51
3 Tω
-MCA
10
.09
(3.7
8 –
16.4
0)
97.2
5 (7
0.50
– 1
24.0
0)
0.12
1 4.
73 (2
.48
– 5.
77)
524.
00 (1
68.0
0 –
1110
.00)
0.
050
Tota
l 22
.68
(10.
26 –
35.
09)
143.
28 (1
02.5
1 –
187.
05)
0.12
1 17
.55
(10.
11 –
18.
20)
1012
.28
(346
.47
– 17
72.2
2)
0.05
0
2020 07 03 Boekje 1.0.indd 1732020 07 03 Boekje 1.0.indd 173 24/07/2020 21:1324/07/2020 21:13

174
Chapter 5
a Sybr
Gre
en m
etho
d us
ed
Tabl
e S6
. Taq
man
and
SYB
R Gr
een
qPCR
prim
er a
nd p
robe
sequ
ence
s Ge
ne
Spec
ies
Forw
ard
prim
er 5
’-3’
Reve
rse
prim
er 5
’-3’
TaqM
an p
robe
5’-3
’ Pr
imer
s for
qPC
R 36
b4
Mou
se
GCT
TCA
TTG
TGG
GAG
CAG
ACA
CAT
GGT
GTT
CTT
GCC
CAT
CAG
TCC
AAG
CAG
ATG
CAG
CAG
ATC
CGC
18S
Hum
an
CGG
CTA
CCA
CAT
CCA
AGG
A CC
A AT
T AC
A GG
G CC
T CG
A AA
CG
C GC
A AA
T TA
C CC
A CT
C CC
G A
Cyp8
b1
Mou
se
AAG
GCT
GGC
TTC
CTG
AGC
TT
AAC
AGC
TCA
TCG
GCC
TCA
TC
CGG
CTA
CAC
CAA
GGA
CAA
GCA
GCA
AG
CYP8
B1
Hum
an
CCT
GAG
CTT
GTT
CGG
CTA
CAC
TGC
GGA
ACT
CCA
TGA
ATA
ACT
CTC
CCT
GTA
GCA
GGT
CCT
GCT
CCT
TGT
CCT
T Cy
p7a1
M
ouse
CA
G GG
A GA
T GC
T CT
G TG
T TC
A AG
G CA
T AC
A TC
C CT
T CC
G TG
A TG
C AA
A AC
C TC
C AA
T CT
G TC
A TG
A GA
C CT
C C
CYP7
A1
Hum
an
TCA
GCT
TGG
AAG
GCA
ATC
CTA
T AG
C CT
C AG
C GA
T TC
C TT
G AT
T A
CTG
GCA
GGT
CAT
TCA
GTT
CTG
CTT
GAC
TC
Cyp7
b1
Mou
se
TGA
AAT
AGG
AGC
ACA
TCA
TCT
TGG
AAT
ACA
TTG
CCC
AGA
ACA
TAG
CTG
CTC
TGG
GCC
TCT
CTA
GCA
AAC
ACC
ATT
C CY
P7B1
Hu
man
CT
T GA
A AT
A GG
A GC
A CA
T CA
T TT
A GG
GA
T AA
T AC
A TT
G CC
C AG
A AC
A TA
G TT
G CT
C TG
G GC
C TC
T GT
G GC
A AA
C AC
T AT
T C
Cyp2
7a1
Mou
se
GCC
TTG
CAC
AAG
GAA
GTG
ACT
CGC
AGG
GTC
TCC
TTA
ATC
ACA
CCC
TTC
GGG
AAG
GTG
CCC
CAG
Cyp2
c70a
Mou
se
CCA
CAG
TGA
AAT
ATG
GGC
TTT
T AA
T TT
A GC
T GT
G AC
T TC
T GG
ChRE
BPα
Mou
se
CGA
CAC
TCA
CCC
ACC
TCT
TC
TTG
TTC
AGC
CGG
ATC
TTG
TC
CCT
GGC
TTA
CAG
TGG
CAA
GCT
GGT
CTC
T Ch
REBP
αa Hu
man
AG
T GC
T TG
A GC
C TG
G CC
T AC
TT
G TT
C AG
G CG
G AT
C TT
G TC
ChRE
BPβ
Mou
se
TCT
GCA
GAT
CGC
GTG
GAG
CTT
GTC
CCG
GCA
TAG
CAA
C CT
C AG
T GG
C AA
G CT
G GT
C TC
T CC
C A
ChRE
BPβa
Hum
an
AGC
GGA
TTC
CAG
GTG
AGG
TTG
TTC
AGG
CGG
ATC
TTG
TC
Fx
r M
ouse
CG
C TG
A GA
T GC
T GA
T GT
C TT
G CC
A TC
A CT
G CA
C AT
C CC
A GA
T AT
G AT
C AC
A AG
T TC
A CC
C CG
C TC
C TC
T Sh
p M
ouse
AA
G GG
C AC
G AT
C CT
C TT
C AA
CT
G TT
G CA
G GT
G TG
C GA
T GT
AT
G TG
C CA
G GC
C TC
C GT
G CC
Lr
h-1
Mou
se
TGC
TGG
AGT
GAG
CTC
TTG
ATT
C GA
T GG
T GG
A GT
A GT
C CA
C GT
G T
CCT
TCC
TTC
CCA
TGC
GCC
ACT
TG
Hnf4α
Mou
se
ATG
CCA
AGG
GGC
TGA
GTG
AC
GCC
GGT
CGT
TGA
TGT
AAT
CCT
CAC
CTG
TGA
CCG
CAG
CCG
CTT
G L-
PK
Hum
an
TGT
CTG
TGC
CAC
ACA
GAT
GCT
CAT
TGG
CGA
CAT
CGC
TTG
TCT
CAT
GAT
TAC
CAA
GCC
CCG
GCC
AAC
APO
C3
Hum
an
ATG
AAG
CAC
GCC
ACC
AAG
AC
TTG
TCC
TTA
ACG
GTG
CTC
CAG
TA
CAC
CCA
GCC
CCT
GGC
CTG
CT
Maf
ga M
ouse
CA
A GG
C CT
T AA
A GG
T GA
A GC
G TT
C AA
C TC
T CG
C AC
C GA
C AT
Acly
M
ouse
GG
A GA
A GT
T GG
G AA
G AC
C AC
T G
CAA
TGG
CCG
TCA
TGT
GAG
TT
ATC
CCC
ATC
CAT
GTC
TTT
GGC
ACA
GA
Prim
ers f
or su
bclo
ning
ChREBPα
GC
G AA
A CT
T AA
G AG
A TC
T AT
G GC
G CG
C GC
G CT
GC
G AA
A GC
G GC
C GC
G CT
T GG
A AA
C TT
T CA
C CA
G G
ChREBPβ
GC
G AA
A CT
T AA
G AT
G CG
C GA
A TA
C CA
C AA
G TG
G A
GCG
AAA
GCG
GCC
GCG
CTT
GGA
AAC
TTT
CAC
CAG
G
Mlx
GC
G AA
A AA
G CT
T AT
G GC
C TA
C CC
A TA
C GA
C GT
GC
G AA
A CT
C GA
G TC
A GT
A GA
G TT
G GT
T TT
T CA
A CT
G
2020 07 03 Boekje 1.0.indd 1742020 07 03 Boekje 1.0.indd 174 24/07/2020 21:1324/07/2020 21:13

175
Glucose-6-phosphate regulates hepatic bile acid synthesis in mice
5
Table S7. SYBR Green primers used for ChIP-qPCR Region Forward primer 5’-3’ Reverse primer 5’-3’ L-pk GCT CTG CAG ACA GGC CAA AG TCT TGC CAA TGG AAG CCT TG Cyp8b1 region aa GAG ACG AGG AAA GAG ATG TG CAC CGA CTG CTC ACA TTC C Cyp8b1 region ba GAG CTG AAC CTG AAC AGT AG CAG AGG CTC GGA CGT G Cyp8b1 region ca ACC ACG TCC GAG CCT CTG GGA ATT GCT TTA TGT GGC Cyp8b1 region da GGT GGG CTC AAG GCA G GCT GAC TAG AGA GAC GAT G Cyp8b1 region -2300 CTG CAG GAC AGA TTT CAT CTT G TCA ACT GCA GAA TGT GTT AGG AC Cyp8b1 region -1500 AGG CCC CAC AGA TAG ATT CA CTG AGC ATC TGT CAG GGT GA Cyp8b1 region -280 TAA GGA GAC ACC GTC TCT AC GAG ACC TGA CAT CCC TCT AC Cyp8b1 region -100 TTG CAG AGG ACG ATA CC AAA GTG CGT GTC TGT G Cyp8b1 region 1 CAG CGC TGT AGA GCT GAC AA CAC TGT ACA CCA CAG CGT CA Cyp8b1 region 500 TCC TGA GCT TAT TCG GCT ACA CGG AAC TTC CTG AAC AGC TC Cyp8b1 region 1000 CAG CGG ACA AGA GTA CCA GA GGG GTC CAT GTG TAC TGA GAG Cyp8b1 region 2000 CGA TGC CCT TAC TCC AAA TC CTC GAT TCC ATT GAG CAA CA Cyp8b1 region 5000 TGG AAG CTG CTG AGA AAG TG CTC AGG TCC TGG CTT TTG TC aRegions are explained in the manuscript
2020 07 03 Boekje 1.0.indd 1752020 07 03 Boekje 1.0.indd 175 24/07/2020 21:1324/07/2020 21:13

2020 07 03 Boekje 1.0.indd 1762020 07 03 Boekje 1.0.indd 176 24/07/2020 21:1324/07/2020 21:13
6CHAPTERGeneral Discussion
2020 07 03 Boekje 1.0.indd 1772020 07 03 Boekje 1.0.indd 177 24/07/2020 21:1324/07/2020 21:13

Chapter 6
178
Dysregulation of hepatic glucose sensing induces several serious metabolic responses that adversely affect health. The studies described in this thesis have been focused on the (patho)physiological consequences of constitutively active hepatic glucose signaling as occurs in Glycogen Storage Disease type 1a (GSD Ia). GSD Ia is characterized by intracellular accumulation of glucose-6-phosphate (G6P, the first intracellular metabolite of glucose) in hepatocytes while fasting blood glucose and insulin levels are low. In the work presented, we took advantage of this unique feature of GSD Ia to selectively establish effects of increased intrahepatic glucose sensing on several metabolic processes in the liver. Importantly, GSD Ia provides a ‘model’ for diabetic liver disease (1,2), a major global health problem. Although deviations in blood glucose are opposite in GSD Ia and type 2 diabetes (low versus high blood glucose), intrahepatic glucose metabolism is enhanced in both conditions. Moreover, the hepatic consequences of GSD Ia and type 2 diabetes are very similar and encompass a high glycolytic rate, cellular glycogen and lipid accumulation as well as an increased risk for liver tumor development (1,3–7).
Aims of the work presented in this thesis were to establish 1) the physiological mechanisms contributing to fatty liver disease and hyperlipidemia in GSD Ia; 2) the contribution of enhanced glycolysis and de novo lipogenesis to fatty liver disease in GSD Ia; and 3) the independent regulatory role of glucose in the control of hepatic bile acid synthesis. The findings obtained contribute to a better understanding of the often overlooked contribution of enhanced intrahepatic glucose metabolism, independent of prevailing blood glucose and insulin concentrations, to the development and progression of NAFLD and hyperlipidemia in GSD Ia. Importantly, the studies described in this thesis may also contribute to novel strategies to treat type 2 diabetes complications. Figure 1 gives an overview of the main findings described in this thesis.
Advantages and limitations of the GSD Ia mouse model usedApplication of a hepatocyte-specific G6pc knockout mouse model allowed to specifically investigate the pathophysiological consequences of enhanced hepatic glucose signaling in GSD Ia. The ability to induce G6Pase-deficiency at any age desired offers several advantages over use of “conventional” knockout or liver-specific knockout mice. In the studies reported in this thesis, consequences of enhanced hepatic glucose signaling were investigated in adult mice with a fully developed liver. In the first weeks of life, activation of endogenous glucose production by the liver is critical because of the low glucose content in milk, leading to adaptations of glucose and fatty acid metabolism (8). Using adult mice, we were able to investigate the consequences of enhanced hepatic glucose signaling in a developed liver adapted to the prevailing metabolic conditions. Moreover, this model allowed defining the exact time of exposure to excessive hepatic glucose signaling. It should be noted that there
2020 07 03 Boekje 1.0.indd 1782020 07 03 Boekje 1.0.indd 178 24/07/2020 21:1324/07/2020 21:13

General Discussion
179
6
are some limitations associated with the use this mouse model and that diff erences between preclinical fi ndings reported in this thesis and those from studies in GSD Ia patients do exist. From a translational point of view, one should fi rst take into account that a hepatocyte-specifi c rather than a whole body G6pc knockout mouse model (9–11) was used. Whole body G6pc knockout mouse models cannot be used to investigate long-term complications as they rarely survive over 3 months of age, unless gene therapy is performed (12). In addition, whole body G6pc knockout mice require intraperitoneal glucose injections to prevent seizures (13). Indeed, G6pc is also expressed in kidney and intestine, and in contrast to hepatocyte-specifi c G6pcknockout mice (13), GSD Ia patients suff er also from kidney failure and infl ammatory bowel disease (12). During prolonged fasting, kidney cells and enterocytes likely contribute to residual glucose production in our mouse model (14,15). Second, hepatic G6pc deletion was induced during adulthood and for only 10 days until sacrifi ce, which may mask potential metabolic derangements and fl uxes occurring over longer periods of time. Moreover, G6pc deletion during adulthood does not aff ect liver development, as it will do in GSD Ia patients who are G6pc defi cient from birth onwards. Despite these limitations, the mouse model used does present with fasting hypoglycemia, hyperlipidemia, hepatomegaly, and hepatic steatosis, i.e., all hepatocyte-borne symptoms and complications observed in GSD I patients and thus render the hepatocyte-specifi c G6pc knockout mouse as a highly valuable pre-clinical model for GSD Ia.
Figure 1. Schematic overview of the main fi ndings described in this thesis regarding the (patho)physiological consequences of constitutively active hepatic glucose signalling in GSD Ia. GCK, glucokinase; G6PC, glucose-6-phosphatase; G6P, glucose-6-phosphate; TG, triglycerides; VLDL, very low-density lipoproteins; LDL, low-density lipoproteins; NEFA, non-esterifi ed fatty acids; ChREBP, carbohydrate response element binding protein; LPL, lipoprotein lipase; HL, hepatic lipase; Cyp7a1, cholesterol 7α-hydroxylase; Cyp8b1, sterol 12α-hydroxylase, Cyp27a1, sterol 27-hydroxylase, Cyp7b1, oxysterol 7α-hydroxylase.
2020 07 03 Boekje 1.0.indd 1792020 07 03 Boekje 1.0.indd 179 24/07/2020 21:1324/07/2020 21:13

Chapter 6
180
Glycemia and VLDL-TG metabolismIn clinical practice plasma triglyceride (TG) concentrations are currently regarded as most important biomarker for metabolic control in GSD Ia patients (16,17), although the mechanistic link between hyperlipidemia and disturbed glycemia is poorly understood. In this thesis, it is shown that blood glucose levels affect VLDL-TG catabolism (chapter 2), the origins of fatty liver (chapter 2), as well as bile acid metabolism (chapter 5), and that disturbed glycemia contributes to the hepatic GSD Ia phenotype.
Chapter 2 addresses the physiological mechanisms that link glycemic state to hyperlipidemia by performing a systemic analysis of whole-body TG metabolism in normo- and hypoglycemic L-G6pc-/- mice. A concomitant increase in VLDL-TG production and decrease in VLDL-TG catabolism in fasted, but not in fed L-G6pc-/- mice revealed, for the first time, a direct link between hypoglycemia and hypertriglyceridemia. Published data obtained in human GSD Ia patients suggested that altered VLDL production may contribute to the severity of hypertriglyceridemia in GSD Ia, although these results are not consistent (18,19). The data presented in chapter 2 suggest that the amount of VLDL particles secreted by the liver remains (largely) unaffected in L-G6pc-/- mice. Consequently, since each VLDL particle contains a single apolipoprotein B (apoB) molecule, assessment of apoB turnover rates alone, as commonly performed (20–23), is not sufficient to establish the cause(s) of altered VLDL-TG production in GSD Ia. Data in L-G6pc-/- mice show that lipidation of apoB and thus the amount of TG per VLDL was increased, resulting in the production of larger VLDL particles by the liver. Our findings indicate that, like in L-G6pc-/- mice, excess TGs of GSD Ia patients are almost exclusively associated with VLDLs. Analysis of the amount of TGs per apoB molecule in plasma of GSD Ia patients may therefore provide a more reliable indicator of the origin of hypertriglyceridemia in GSD Ia.
Studies described in chapter 2 also show that hypoglycemia inhibits VLDL catabolism in L-G6pc-/- mice. Activities of lipoprotein lipase (LPL) and hepatic lipase (HL) are regulated by apolipoproteins and angiopoietin-like proteins (20–23). It has been reported that the apoC2/C3 ratio (24–27) is reduced in VLDL particles of GSD Ia patients, which may contribute to reduced LPL activity in these patients (20). In addition to LPL regulators Angptl3, 6, and 8 (28), Angptl4 is an established inhibitor of both HL and LPL activity (29,30). However, altered expression of angiopoietin-like proteins nor changes in apoC2/C3 ratio in fasted L-G6pc-/- mice were observed. Instead, the data suggest that the activities of LPL and/or HL were reduced by a factor that is specifically altered under fasted, hypoglycemic conditions. Non-esterified fatty acids (NEFAs), and especially oleate as one of the most prevalent NEFAs, are able to inhibit LPL activity (26) and NEFAs appeared to be elevated in hypoglycemic L-G6pc-/- mice. We propose that increased NEFAs/oleate levels in fasted L-G6pc-/-
2020 07 03 Boekje 1.0.indd 1802020 07 03 Boekje 1.0.indd 180 24/07/2020 21:1324/07/2020 21:13

General Discussion
181
6
mice may contribute to impaired VLDL catabolism. Impaired VLDL catabolism has previously been suggested to contribute to hyperlipidemia in normoglycemic GSD Ia patients (31–41). No data is available for hypoglycemic GSD I patients, as GSD I patients are generally kept in a semi-fed state. However, as adipocyte lipolysis (20,22,31,42–44), circulating total NEFAs and oleate levels were shown to be increased in normoglycemic GSD Ia patients, we hypothesize that these fatty acids arrest VLDL catabolism, leading to hypertriglyceridemia, and that these effects will be even more marked in those patients that show a poor metabolic control.
Factors that might contribute to impaired VLDL-TG catabolism by increased NEFAs in GSD Ia are elevated glucagon and glucocorticoid levels (45). Glucagon levels are directly responsive to glycemia and glucagon is a well-established enhancer of adipose tissue lipolysis via cAMP signaling (1,46,47). The significantly increased glucagon levels in hypoglycemic L-G6pc-/- mice potentially contributed to enhanced adipose tissue lipolysis and increased NEFAs (chapter 2). Glucocorticoids, mainly cortisol in humans and corticosterone in rodents, increase during fasting, stimulate adipocyte lipolysis (48), and promote VLDL production and secretion (49) by inducing hepatic ACC and FASN transcription, promoting VLDL assembly (50,51), and reducing APOB degradation (51–53). A direct inhibitory effect of glucocorticoids on LPL activity is unknown, but glucocorticoids can inhibit clearance of TG-rich lipoproteins by the liver via miR-379-mediated inhibition of LDLR expression (54). Hepatic uptake of labelled VLDL-like particles was slightly reduced in L-G6pc-/- mice, however it was not affected by the glycemic state (chapter 2). Moreover, as glucocorticoids stimulate lipolysis, they also contribute to impaired VLDL-TG catabolism by increasing NEFA and particularly circulating oleate levels. Although further research is needed into the exact cause of impaired VLDL-TG catabolism, it can be speculated that elevated glucocorticoid signaling may contribute to hampered VLDL-TG catabolism in hypoglycemic GSD Ia.
Glycemia and hepatic triglyceride accumulationDyslipidemia in GSD Ia patients, i.e. the presence of both hypertriglyceridemia and NAFLD, is commonly attributed to increased hepatic fatty acid synthesis (55). The contribution of de novo lipogenesis to hepatic lipid accumulation in L-G6pc-/- mice was assessed in chapter 2, 3 and 4 using a sodium [1-13C]-acetate solution supplied via the drinking water for 48 hours. Contribution of de novo synthesis, as quantified by a mass isotopomer distribution analysis (MIDA) approach, typically accounted for up to 20% of total hepatic fat content, a value comparable to that observed in healthy humans in the postprandial state (22,23). De novo lipogenesis in humans is usually determined by labeled water (2H2O, or deuterated water) (56) incorporation, which results in similar fractional fatty acid synthesis rates as compared to[1-13C]-acetate, but is rather inexpensive and hence better applicable for long-term studies
2020 07 03 Boekje 1.0.indd 1812020 07 03 Boekje 1.0.indd 181 24/07/2020 21:1324/07/2020 21:13

Chapter 6
182
(57–59). Prolonged labeling of the acetyl-CoA pool (>48h) would presumably lead to an increased contribution of L-G6pc-/- lipogenesis (56,60). In a human study, administration of deuterated water for 3 to 5-weeks showed that de novo lipogenesis contributed for 11% up to 38.5% to the intrahepatic triglyceride content in lean and obese-NAFLD individuals, respectively (61). The data obtained in our studies with labeled acetate indicate that fatty liver in GSD Ia mice is not solely caused by an increase in de novo fatty acid synthesis, as this only maximally accounts for ~20% of liver fat. We therefore propose that storage of pre-existing ‘old fat’ has a major contribution to fatty liver disease in GSD Ia. Chapter 2 reveals an intriguing difference in the origin of hepatic steatosis in normo- versus hypoglycemic L-G6pc-/- mice. Hepatic de novo fatty acid synthesis mainly contributed to hepatic lipid accumulation in fed L-G6pc-/- mice, while in fasted L-G6pc-/- mice liver steatosis was mainly associated with enhanced adipose tissue lipolysis and hepatic fatty acid elongation. Glycemia thus (partly) determines the source of fatty acids that accumulate in the liver in L-G6pc-/- mice. Similar to what we found in fed L-G6pc-/- mice, de novo lipogenesis is increased in GSD Ia patients (22,23), but it was shown that it could only contribute for a minor part to hepatic steatosis (23). Bandsma et al. suggested that the hepatic influx of NEFAs may be the major contributor to fatty liver disease in GSD I (62). Indeed, we found that in fasted L-G6cp-/- mice enhanced adipose tissue lipolysis and subsequent uptake and elongation of fatty acids released by the adipose tissue were the most predominant cause of fatty liver, showing that hepatic steatosis occurs not solely due to enhanced de novo lipogenesis, but that enhanced NEFA influx is also a major contributor.
Intra- versus extrahepatic glucose signaling and bile acid metabolismThe study described in chapter 5 identified a novel link between hepatic glucose signaling and bile acid metabolism. Previously, it was show that insulin resistance is associated with an increase in cholic acid synthesis relative to that of chenodeoxycholic acid. This is generally attributed to constitutive activation of Forkhead box protein O1 (FOXO1) and subsequent induction of CYP8B1, the enzyme that catalyzes the crucial 12α hydroxylation reaction in cholic acid synthesis (63,64). Increased contribution of cholic acid and its metabolite deoxycholic acid result in a more hydrophobic bile acid pool in insulin resistant subjects (65–67). Insulin resistance is generally associated with hyperglycemic episodes, enhancing intrahepatic glucose metabolism similar to GSD I (65). In GSD Ia mice, hepatic accumulation of G6P resulted in ChREBP-mediated induction of Cyp8b1 and subsequent induction of cholic acid synthesis. Intrahepatic glucose thus regulates the expression of Cyp8b1, independent of insulin. As a consequence, G6P-ChREBP signaling increases the relative abundance of cholic acid-derived bile acids, resulting in a more hydrophobic bile acid pool in mice. A shift in the hydrophobicity of the bile acid pool changes the capacity for intestinal lipid solubilization and uptake (68–70). In L-G6pc-/- mice, the G6P-induced increase
2020 07 03 Boekje 1.0.indd 1822020 07 03 Boekje 1.0.indd 182 24/07/2020 21:1324/07/2020 21:13

General Discussion
183
6
in Cyp8b1 expression resulted in a more hydrophobic bile acid composition, which was consistent with a reduction in fecal neutral sterol excretion compatible with enhanced intestinal cholesterol absorption. Thus, via hepatic ChREBP-CYP8B1 signaling, intracellular glucose controls bile acid synthesis and intestinal cholesterol handling. This signaling cascade likely contributes to altered bile acid metabolism and its (patho)physiological consequences, such as altered cholesterol absorption, in conditions coinciding with excessive intrahepatic glucose signaling such as GSD I and type 2 diabetes. A major difference in bile acid metabolism between mice and humans is the presence of very hydrophilic muricholic acids in murine bile (71). The human bile acid pool is more hydrophobic as compared to mice, due to the lack of the muricholic acid-producing enzyme CYP2C70 that is specific to mice and rats (72). In humans, G6P-mediated CYP8B1 induction promotes cholic acid synthesis at the expense of dihydroxylated chenodeoxycholic acid, resulting in a more hydrophilic, rather than a more hydrophobic bile acid pool, with a potentially opposite effect on intestinal cholesterol absorption. Similar changes in the bile acid pool are seen in diabetic and insulin resistant subjects (65,67). There are no reports focusing on disturbed bile acid metabolism and the consequences for intestinal cholesterol absorption in GDS Ia patients. With respect to hypercholesterolemia in GSD Ia, future studies are needed to establish the impact of intrahepatic G6P-CYP8B1 signaling on bile acid synthesis, pool size and composition and on intestinal cholesterol absorption.
Hepatic expression levels of CYP7A1, the rate-controlling enzyme of primary bile acid synthesis (cholic acids and chenodeoxycholic acids), were decreased in hypoglycemic, but not in normoglycemic, L-G6pc-/- mice (chapter 5). Hyperglycemia, on the other hand, has been shown to induce hepatic Cyp7a1 gene expression (73,74). Circulating glucose levels and consequent changes in insulin and glucagon concentrations are major postprandial factors to regulate CYP7A1 protein levels (74). CYP7A1 protein levels and bile acid synthesis follow a circadian rhythm that is in phase with the feeding-fasting cycle (75–78). Increased production of bile acids in response to elevated blood glucose levels will facilitate intestinal fat absorption. At the same time, bile acid-mediated activation of TGR5 stimulates secretion of GLP-1 and subsequent pancreatic insulin secretion, to facilitate glucose uptake by various organs (79). Thus, attenuation of CYP7A1 expression by glycemia through insulin and glucagon, independent of hepatic G6P signaling, likely contributes to the circadian rhythm of bile acid synthesis.
Glucose sensing via the hepatic G6P-ChREBP axis, the role of posttranslational modificationsCarbohydrate response element binding protein (ChREBP) is a key glucose-sensitive transcription factor that is activated in GSD Ia and Ib, and which mediates the
2020 07 03 Boekje 1.0.indd 1832020 07 03 Boekje 1.0.indd 183 24/07/2020 21:1324/07/2020 21:13

Chapter 6
184
induction of glycolytic and lipogenic genes in GSD Ib (28,80). The results in chapter 3 confirm that ChREBP indeed fulfills a similar role in GSD Ia. Moreover, it was found that enhanced hepatic ChREBP activity limits hepatomegaly, hepatocyte vacuolation, and NAFLD development in GSD Ia, illustrating the protective role of ChREBP-dependent glucose sensing under these conditions. ChREBP is activated by glycolytic metabolites, such as glucose-6-phosphate (G6P) – a cross-road molecule in glucose metabolism – and the PPP intermediate xylulose-5-phosphate. Upon activation, ChREBP induces hepatic glycolytic and lipogenic pathways via transcriptional activation. It was recently shown that, next to acetylation (81), also O-linked β-N-acetylglucosaminylation (O-GlcNAcylation) increases the transcriptional activity of ChREBP on lipogenic promoters (82,83). Host cell factor 1 (HCF-1) interacts with ChREBP to stimulate its O-GlcNAcylation and activation, resulting in glucose-dependent epigenetic regulation of lipogenic gene promoters (83).
The potential role of ChREBP to mediate posttranscriptional modification upon enhanced glucose signaling, however, is largely unexplored. ChREBP is a key determinant of glycolysis and a direct transcriptional regulator of ATP-citrate lyase (ACLY), the essential enzyme for glucose-induced histone acetylation (84,85). Enhanced ChREBP activity thus leads to formation of glucose-derived citrate and subsequent acetyl-CoA production, the latter representing the substrate for (histone) acetylation. Based on the findings in chapter 5, we propose that ChREBP induces Cyp8b1 expression upon cellular glucose signaling via a posttranscriptional mechanism, i.e. via histone 4 acetylation dynamics. Previously, it was shown that histone acetylation increases ChREBP-ChoRE binding at the fatty acid synthase (FASN) promoter in vitro (86). ChREBP-mediated interference with histone modifications were proposed to be crucial for the enhanced transcription of FASN, as it resulted in an active chromatin structure increasing FASN transcription upon high glucose. Our findings show that the regulatory role of ChREBP upon G6P-mediated activation is not limited to enhanced transcription of its target genes by binding to a ChoRE in the promoter region, but may also involve glucose-induced posttranscriptional mechanisms to regulate the expression of genes such as Cyp8b1.
ChREBP is also known to physically interact with transcription factor HNF4α and to modulate its binding to the promoters of FASN, LPK, and ChREBPβ (87). Cell reporter assay data in chapter 3 show an additive effect of ChREBPβ/MLX on the HNF4α-mediated activation of the murine Tm6sf2 reporter. Furthermore, ChIP-qPCR analysis under fed and fasted conditions showed an increased recruitment of both ChREBP and HNF4α to the mouse TM6SF2 gene. Our results in chapter 3 suggest that HNF4α contributes to basal transcription of Tm6sf2 in mouse liver, while ChREBP mediates a glucose/G6P-induced induction. Dedicated molecular studies are needed to reveal whether ChREBP physically interacts with HNF4α
2020 07 03 Boekje 1.0.indd 1842020 07 03 Boekje 1.0.indd 184 24/07/2020 21:1324/07/2020 21:13

General Discussion
185
6
upon glucose stimulation to promote HNF4α transcriptional activity, resulting in a glucose-mediated induction of Tm6sf2.
Glucose signaling and hepatic adenoma development in GSD IDepending on the investigated age group, 22%-75% of GSD I patients develop hepatic adenomas in young adulthood (16,17), and adenomas are a main reason for hospitalization in adult patients (4,88–92). The mechanisms behind hepatic adenoma development and the risk for malignant transformation in GSD I are as yet unknown. Enhanced glucose metabolism and activation of glycolysis, glycogen storage, fatty acid synthesis, uric acid, lactate, and nucleotide production might reprogram the GSD Ia liver and generate a favorable tumorigenic environment (4,93). Earlier, it was hypothesized that disturbed fatty acid metabolism induces gene mutations via the generation of hydrogen peroxide (93). It could very well be that cellular stress, like oxidative stress and autophagy deregulation, caused by toxic accumulation of glycogen or TG plays an important role in tumor formation (7,94). Several studies have shown dysfunctional mitochondria in GSD Ia (7,95–97), which might be due to downregulation of SIRT1 (95,98). Moreover, hepatic autophagy is impaired (96), leading to accumulation of damaged mitochondria that generate reactive oxygen species (ROS) (95,97), which can subsequently contribute to oxidative DNA damage (99). In addition, enhanced glycolysis in GSD I might result in increased O-GlcNAcylation, a process that is also upregulated in cancer cells. Although O-GlcNAcylation is not known to initiate tumor development, this process is upregulated in cancer cells and promotes tumorigenesis (100). The substrate for O-GlcNAcylation, UDP-N-acetylglucosamine (UDP-GlcNAc), is derived from F-6-P, glutamine, acetyl-CoA and uridine triphosphate (UTP) via the hexosamine biosynthesis pathway (HBP). The HBP is upregulated in hyperglycemia and diabetes (101) and is considered as a nutrient sensing pathway, as it depends on the major metabolic pathways in a cell, i.e. glucose metabolism, amino acid metabolism, fatty acid metabolism and nucleotide metabolism. Because G6P is a precursor for F-6-P, acetyl-CoA and UTP, an enhanced flux through the HBP and a consequent increase in protein O-GlcNAcylation may be expected in GSD I. Although we did not collect evidence for increased UDP-GlcNAc concentrations in livers of L-G6pc-/- mice as compared to controls (data not shown), it cannot be excluded that an increased HBP flux in L-G6pc-/- mice actually occurred, as changes in fluxes do not always translate into altered metabolite concentrations (102). It was suggested that O-GlcNAcylation induces a metabolic shift towards lipid synthesis, favoring proliferation and creating a tumorigenic environment in GSD Ia (96). The role of O-GlcNAcylation in adenoma development in GSD Ia, as well as the mechanistic link between poor metabolic control and liver adenoma progression remains to be investigated.
2020 07 03 Boekje 1.0.indd 1852020 07 03 Boekje 1.0.indd 185 24/07/2020 21:1324/07/2020 21:13

Chapter 6
186
Consequences of glycemic control for GSD I symptoms and complicationsGSD I patients have to adhere to strict dietary management, including frequent meals, continuous nocturnal gastric drip feeding and/or intake of uncooked cornstarch. Although not clearly defined, ‘good metabolic control’ in GSD Ia patients, mostly achieved by strict dietary compliance, prevents hypoglycemia and largely corrects secondary metabolic derangements, such as hyperlactacidemia, hyperuricemia, and hypertriglyceridemia (103). Poor metabolic control and hypertriglyceridemia are associated with increased risk to develop hepatocellular adenomas (16,104–106), osteoporosis (6,107), and renal complications (88,108,109).
The studies described in this thesis reveal how the glycemic state contributes to GSD Ia symptoms by affecting VLDL-TG catabolism (chapter 2), fatty liver development (chapter 2), and bile acid metabolism (chapter 5). Poor metabolic control and hypoglycemic episodes in L-G6pc-/- mice coincide with more severe liver steatosis and hypertriglyceridemia, resulting from enhanced adipose tissue lipolysis and impaired VLDL-TG catabolism. Moreover, blood glucose levels regulate hepatic expression of murine Cyp7a1, the rate-controlling enzyme in bile acid synthesis, and prolonged fasting concomitantly decreases total bile acid pool size (110). Enzymes involved in bile acid synthesis show a circadian rhythm in their hepatic expression and enzyme activities, and Cyp7a1 expression peaks during food intake (111,112). It could therefore be hypothesized that poor metabolic control in GSD Ia, as well as the intake of frequent meals and continuous nocturnal gastric drip feeding, could change the circadian rhythm of bile acid synthesis, thereby affecting nutrient absorption, cholesterol turnover and activities of various bile acid-activated metabolic pathways. Future studies are needed to reveal the consequences of disturbed bile acid metabolism for intestinal cholesterol absorption in GDS Ia patients.
Therapeutic opportunities in GSD IGene therapy is the gold standard treatment for monogenetic diseases and also represents a promising treatment for GSD Ia. Correcting hepatic G6pc enzymatic activity to 3-63% of wild type values by AAV-mediated gene therapy maintains glucose homeostasis and prevents development of hepatic adenomas in mice (113). Although the first phase I/II clinical trial in humans to study safety and dosing of an adeno-associated virus serotype 8 (AAV8) with G6PC for liver-directed gene therapy is currently ongoing (ClinicalTrials.gov Identifier NCT03517085), it may still take a considerable amount of time before this therapy reaches the clinic. Importantly, gene therapy will not be available for all patients because of immunity against the viral vector used to deliver the enzyme (114–117). Furthermore, the efficacy in patients still needs to be proven and potential side effects and risks of viral delivery need to be established. Therefore, development of alternative therapeutic strategies is still warranted to reduce or prevent GSD Ia symptoms and complications.
2020 07 03 Boekje 1.0.indd 1862020 07 03 Boekje 1.0.indd 186 24/07/2020 21:1324/07/2020 21:13

General Discussion
187
6
The potential therapeutic effects of ChREBP inhibition (chapter 3) and FXR activation (chapter 4) were evaluated in the mouse model for GSD Ia. Chapter 2 describes that hepatic ChREBP maintains hepatic TG balance in GSD Ia by concomitantly regulating fatty acid synthesis, fatty acid oxidation, and VLDL-TG secretion. It has been reported that hepatic ChREBP knockdown in a mouse model for diabetes type 2 protects these animals against non-alcoholic fatty liver disease (NAFLD) (80). Although normalization of hepatic ChREBP activity in GSD Ia liver reduced glycolysis, it aggravated hepatomegaly due to further accumulation of glycogen. In addition, ChREBP knockdown decreased VLDL lipidation and –secretion by reducing Mttp and Tm6sf2 expression, resulting in increased fat storage in the liver. It can thus be concluded that enhanced ChREBP activity is actually beneficial in GSD Ia as it limits NAFLD development under these conditions. Because ChREBP-dependent VLDL lipidation is a key determinant of plasma TG levels in GSD Ia, genetic variations in MTTP, TM6SF2, or ChREBP may contribute to the clinical heterogeneity in hyperlipidemia observed in these patients (118,119). This possibility needs to be further investigated.
In view of the reported role of FXR in control of glycolysis and cholesterol- and lipid metabolism, as well as the beneficial effects of pharmacological FXR activation on NAFLD (120,121), it was investigated whether pharmacological FXR activation prevents or delays development of fatty liver disease and hyperlipidemia in GSD Ia (chapter 4). Upon FXR activation, glycolysis was redirected towards gluconeogenesis, which promoted hepatic G6P accumulation and limited the substrate availability for de novo lipogenesis. Consistent with previous studies in obese or diabetic mouse models (122–126), it was observed that pharmacological FXR activation led to a slight reduction in hepatic de novo lipogenesis in GSD Ia mice. As concluded in chapters 2, 3, and 4, de novo lipogenesis has only a minor contribution to fatty liver disease in GSD Ia, with a maximum of ~20%. Therefore, targeting this pathway may not be sufficient to achieve complete normalization in hepatic TG content. In agreement with this finding, the effects of inhibiting de novo lipogenesis by PX20606 in hepatic GSD Ia were rather modest and did not result in a complete normalization of hepatic TG content. Possibly, the stimulatory signal of G6P-ChREBP on glycolysis and lipogenesis in GSD Ia is stronger than the potential suppressive effect of FXR. Although some studies in rodents show beneficial effects of FXR activation on hepatic lipid content (122,124,125), there is still no proof for inhibition of lipogenesis by activation of FXR in humans and therefore alternative strategies are likely warranted to improve hepatic steatosis. Inhibition of acetyl-coenzyme A carboxylases (ACC1 and ACC2), enzymes critical in de novo fatty acid synthesis and fatty acid oxidation, decreased de novo lipogenesis in overweight adult males (127–129). It can be hypothesized that combined FXR and ACC inhibition may be more effective to prevent fatty liver disease in GSD Ia.
2020 07 03 Boekje 1.0.indd 1872020 07 03 Boekje 1.0.indd 187 24/07/2020 21:1324/07/2020 21:13

Chapter 6
188
Hepatic steatosis in L-G6pc-/- mice was also shown to be associated with glycemic control and enhanced adipose tissue lipolysis, which potentially also provides a more effective node for intervention. Inhibition of lipolysis might be an attractive tool to lower NEFAs and prevent hepatic steatosis and arrest of VLDL catabolism. Although glucagon receptor antagonists decrease adipose tissue lipolysis and NEFAs, they may actually increase hepatic fat content (130–132). The mechanism by which glucagon receptor antagonists increase steatosis is as yet unknown, but it was suggested that a certain level of glucagon receptor signaling in hepatocytes might be required to maintain or regulate synthesis, secretion and oxidation of lipids (131,132). Glucocorticoid receptor modulators, like CORT118335, might potentially be interesting therapeutics for hepatic steatosis in GSD Ia, as they decrease hepatic fat content via enhanced VLDL production, although plasma cholesterol levels were increased (51). The therapeutic potential of glucocorticoid receptor modulators should be further investigated in GSD Ia. Partial inhibition of lipolysis by Atglistatin, an inhibitor of adipose triglyceride lipase (Atgl), reduced hepatic TG levels by 73% in ob/ob mice (133), making it an attractive therapeutic treatment to reduce fatty liver in GSD Ia. However, LPL activity in white adipose tissue in re-fed animals was also lowered by Atglistatin, resulting in a delayed postprandial clearance of chylomicrons (133). It was suggested that Atglistatin-mediated inhibition of adipose tissue lipolysis led to suppression of adipocyte PPARγ target gene expression, causing decreased TG accumulation in white adipose tissue. In GSD Ia, however, Atglistatin may at the same time also worsen the existing hypertriglyceridemia, as hypertriglyceridemia in hypoglycemic L-G6pc-/- mice was associated with arrested VLDL catabolism (chapter 2). It would be worthwhile to study the exact mechanism of VLDL catabolism in GSD Ia, and the effect of partial inhibition of adipose tissue lipolysis, both on hepatic steatosis and hyperlipidemia. Considering the association between plasma TG levels and long-term complications such as hepatic adenoma development, detailed mechanistic understanding of the factors that link between glycemia and hypertriglyceridemia will potentially contribute to improved and personalized care for GSD Ia patients.
2020 07 03 Boekje 1.0.indd 1882020 07 03 Boekje 1.0.indd 188 24/07/2020 21:1324/07/2020 21:13

General Discussion
189
6
References1. Rajas F, Labrune P, Mithieux G. Glycogen storage disease type 1 and diabetes: Learning
by comparing and contrasting the two disorders. Diabetes Metab. 2013;39:377–387. 2. Bandsma RHJ, Grefhorst A, van Dijk TH, van der Sluijs FH, Hammer A, Reijngoud
D-J, et al. Enhanced glucose cycling and suppressed de novo synthesis of glucose-6-phosphate result in a net unchanged hepatic glucose output in ob/ob mice. Diabetologia. 2004;47:2022–2031.
3. Wang P, Kang D, Cao W, Wang Y, Liu Z. Diabetes mellitus and risk of hepatocellular carcinoma: a systematic review and meta-analysis. Diabetes. Metab. Res. Rev. 2012;28:109–122.
4. Lee PJ. Glycogen storage disease type I: pathophysiology of liver adenomas. Eur. J. Pediatr. 2002;161 Suppl 1:S46-9.
5. Rao Kondapally Seshasai S, Kaptoge S, Thompson A, Di Angelantonio E, Gao P, Sarwar N, et al. Diabetes Mellitus, Fasting Glucose, and Risk of Cause-Specific Death. N. Engl. J. Med. 2011;364:829–841.
6. Wang DQ, Fiske LM, Carreras CT, Weinstein DA. Natural history of hepatocellular adenoma formation in glycogen storage disease type I. J. Pediatr. 2011;159:442–6.
7. Gjorgjieva M, Mithieux G, Rajas F. Hepatic stress associated with pathologies characterized by disturbed glucose production. Cell Stress. 2019;3:86–99.
8. Girard J, Ferre P, Pegorier JP, Duee PH. Adaptations of glucose and fatty acid metabolism during perinatal period and suckling-weaning transition. Physiol. Rev. 1992;72:507–562.
9. Adamson AW, Suchankova G, Rufo C, Nakamura MT, Teran-Garcia M, Clarke SD, et al. Hepatocyte nuclear factor-4alpha contributes to carbohydrate-induced transcriptional activation of hepatic fatty acid synthase. Biochem. J. 2006;399:285–95.
10. Burke SJ, Collier JJ, Scott DK. cAMP opposes the glucose-mediated induction of the L-PK gene by preventing the recruitment of a complex containing ChREBP, HNF4α, and CBP. FASEB J. 2009;23:2855–2865.
11. Meng J, Feng M, Dong W, Zhu Y, Li Y, Zhang P, et al. Identification of HNF-4α as a key transcription factor to promote ChREBP expression in response to glucose. Sci. Rep. 2016;6:23944.
12. Mutel E, Abdul-Wahed A, Ramamonjisoa N, Stefanutti A, Houberdon I, Cavassila S, et al. Targeted deletion of liver glucose-6 phosphatase mimics glycogen storage disease type 1a including development of multiple adenomas. J. Hepatol. 2011;54:529–537.
13. Lei K-J, Chen H, Pan C-J, Ward JM, Mosinger B, Lee EJ, et al. Glucose-6-phosphatase dependent substrate transport in the glycogen storage disease type-1 a mouse [Internet]. 1996.
14. Rajas F, Clar J, Gautier-Stein A, Mithieux G. Lessons from new mouse models of glycogen storage disease type 1a in relation to the time course and organ specificity of the disease. J. Inherit. Metab. Dis. 2015;38:521–527.
15. Mutel E, Gautier-Stein A, Abdul-Wahed A, Amigó-Correig M, Zitoun C, Stefanutti A, et al. Control of blood glucose in the absence of hepatic glucose production during
2020 07 03 Boekje 1.0.indd 1892020 07 03 Boekje 1.0.indd 189 24/07/2020 21:1324/07/2020 21:13

Chapter 6
190
prolonged fasting in mice: induction of renal and intestinal gluconeogenesis by glucagon. Diabetes. 2011;60:3121–31.
16. Dambska M, Labrador E, Kuo C, Weinstein D. Prevention of complications in glycogen storage disease type Ia with optimization of metabolic control. Pediatr. Diabetes. 2017;18:327–331.
17. Rake JP, Visser G, Labrune P, Leonard J V., Ullrich K, Smit GPA. Glycogen storage disease type I: diagnosis, management, clinical course and outcome. Results of the European study on glycogen storage disease type I (ESGSD I). Eur. J. Pediatr. 2002;161:S20–S34.
18. Rake J, Visser G, Labrune P, Leonard J, Ullrich K, Smit P, et al. Guidelines for management of glycogen storage disease type I - European Study on Glycogen Storage Disease Type I (ESGSD I). Eur. J. Pediatr. 2002;161:S112–S119.
19. Kishnani PS, Austin SL, Abdenur JE, Arn P, Bali DS, Boney A, et al. Diagnosis and management of glycogen storage disease type I: a practice guideline of the American College of Medical Genetics and Genomics. Genet. Med. 2014;16:e1–e1.
20. Levy E, Thibault LA, Roy CC, Bendayan M, Lepage G, Letarte J. Circulating lipids and lipoproteins in glycogen storage disease type I with nocturnal intragastric feeding. J. Lipid Res. 1988;29:215–26.
21. Wierzbicki AS, Watt GF, Lynas J, Winder AF, Wray R. Very low-density lipoprotein apolipoprotein B-100 turnover in glycogen storage disease type Ia (von Gierke disease). J. Inherit. Metab. Dis. 2001;24:527–34.
22. Bandsma RHJ, Prinsen BH, de Sain-van der Velden M, Rake J-P, Boer T, Smit GPA, et al. Increased de novo Lipogenesis and Delayed Conversion of Large VLDL into Intermediate Density Lipoprotein Particles Contribute to Hyperlipidemia in Glycogen Storage Disease Type 1a. Pediatr. Res. 2008;63:702–707.
23. Bandsma RHJ, Rake J-P, Visser G, Neese RA, Hellerstein MK, van Duyvenvoorde W, et al. Increased lipogenesis and resistance of lipoproteins to oxidative modification in two patients with glycogen storage disease type 1a. J. Pediatr. 2002;140:256–260.
24. Kersten S. Physiological regulation of lipoprotein lipase. Biochim. Biophys. Acta - Mol. Cell Biol. Lipids. 2014;1841:919–933.
25. Larsson M, Vorrsjö E, Talmud P, Lookene A, Olivecrona G. Apolipoproteins C-I and C-III Inhibit Lipoprotein Lipase Activity by Displacement of the Enzyme from Lipid Droplets. J. Biol. Chem. 2013;288:33997–34008.
26. Lichtenstein L, Berbée JFP, van Dijk SJ, van Dijk KW, Bensadoun A, Kema IP, et al. Angptl4 Upregulates Cholesterol Synthesis in Liver via Inhibition of LPL- and HL-Dependent Hepatic Cholesterol Uptake. Arterioscler. Thromb. Vasc. Biol. 2007;27:2420–2427.
27. Nakajima K, Kobayashi J, Mabuchi H, Nakano T, Tokita Y, Nagamine T, et al. Association of angiopoietin-like protein 3 with hepatic triglyceride lipase and lipoprotein lipase activities in human plasma. Ann. Clin. Biochem. 2010;47:423–431.
28. Abdul-Wahed A, Gautier-Stein A, Casteras S, Soty M, Roussel D, Romestaing C, et al. A link between hepatic glucose production and peripheral energy metabolism via hepatokines. Mol. Metab. 2014;3:531–543.
2020 07 03 Boekje 1.0.indd 1902020 07 03 Boekje 1.0.indd 190 24/07/2020 21:1324/07/2020 21:13

General Discussion
191
6
29. Jong MC, Hofker MH, Havekes LM. Role of ApoCs in Lipoprotein Metabolism Functional Differences Between ApoC1, ApoC2, and ApoC3. Arterioscler. Thromb. Vasc. Biol. 1999;19:472–84.
30. Carlson LA, Ballantyne D. Changing relative proportions of Apolipoproteins CII and CIII of very low density lipoproteins in hypertriglyceridaemia. Atherosclerosis. 1976;23:563–568.
31. Muller DP, Gamlen TR. The activity of hepatic lipase and lipoprotein lipase in glycogen storage disease: evidence for a circulating inhibitor of postheparin lipolytic activity. Pediatr. Res. 1984;18:881–5.
32. Goodman DS. The Interaction of Human Serum Albumin with Long-chain Fatty Acid Anions. Am. Chem. Soc. 1958;80:3892.
33. Quinn D, Shirai K, Jackson RL. Lipoprotein lipase: mechanism of action and role in lipoprotein metabolism. Prog. Lipid Res. 1982;22:35–78.
34. Kirkland JL, Hollenberg CH, Kindler S, Roncari DAK. Long-chain fatty acids decrease lipoprotein lipase activity of cultured rat adipocyte precursors. Metabolism. 1994;43:144–151.
35. Jackson RL, Shirai K, Harmony JAK, Quinn D. Mechanism of Action of Lipoprotein Lipase: Role of Apolipoprotein C-II. Prog. Lipid Res. 1983;22:35–78.
36. Scow RO, Olivecrona T. Effect of albumin on products formed from chylomicron triacylglycerol by lipoprotein lipase in vitro. Biochim. Biophys. Acta - Lipids Lipid Metab. 1977;487:472–486.
37. Scow RO, Desnuelle P, Verger R. Lipolysis and Lipid Movement in a Membrane Model. J. Biol. Chem. 1979;254:6456–6463.
38. Bengtsson G, Olivecrona T. Apolipoprotein CII enhances hydrolysis of monoglycerides by lipoprotein lipase, but the effect is abolished by fatty acids. FEBS Lett. 1979;106:345–8.
39. Bengtsson G, Olivecrona T. Lipoprotein lipase. Mechanism of product inhibition. Eur. J. Biochem. 1980;106:557–62.
40. Saxena U, Goldberg IJ. Interaction of lipoprotein lipase with glycosaminoglycans and apolipoprotein C-II: effects of free-fatty-acids. Biochim. Biophys. Acta. 1990;1043:161–8.
41. Walker CG, Browning LM, Stecher L, West AL, Madden J, Jebb SA, et al. Fatty acid profile of plasma NEFA does not reflect adipose tissue fatty acid profile. Br J Nutr. 2015;114:756–62.
42. Alaupovic P, Fernandes J. The serum apolipoprotein profile of patients with glucose-6-phosphatase deficiency. Pediatr. Res. 1985;19:380–4.
43. Forget PP, Fernandes J, Begemann PH. Triglyceride Clearing in Glycogen Storage Disease. Pediatr. Res. 1974;8:114–119.
44. Asayama K, Kato K, Anemiya S, Nozaki Y. Postheparin Plasma Lipases in Patients with Hepatic Glycogenosis. Horm. Metab. Res. 1982;14:555–555.
45. Ockerman PA. Glucose, glycerol and free fatty acids in glycogen storage disease type 1. Blood levels in the fasting and non-fasting state. Effect of glucose and adrenalin administration. Clin. Chim. Acta. 1965;12:370–382.
2020 07 03 Boekje 1.0.indd 1912020 07 03 Boekje 1.0.indd 191 24/07/2020 21:1324/07/2020 21:13

Chapter 6
192
46. Liljenquist JE, Bomboy JD, Lewis SB, Sinclair-Smith BC, Felts PW, Lacy WW, et al. Effects of glucagon on lipolysis and ketogenesis in normal and diabetic men. J. Clin. Invest. 1974;53:190–7.
47. Perea A, Clemente F, Martinell J, Villanueva-Peñacarrillo ML, Valverde I. Physiological effect of glucagon in human isolated adipocytes. Horm. Metab. Res. 1995;27:372–5.
48. Mundy HR, Hindmarsh PC, Matthews DR, Leonard J V, Lee PJ. The regulation of growth in glycogen storage disease type 1. Clin. Endocrinol. (Oxf). 2003;58:332–9.
49. Macfarlane DP, Forbes S, Walker BR. Glucocorticoids and fatty acid metabolism in humans: fuelling fat redistribution in the metabolic syndrome. J. Endocrinol. 2008;197:189–204.
50. Vegiopoulos A, Herzig S. Glucocorticoids, metabolism and metabolic diseases. Mol. Cell. Endocrinol. 2007;275:43–61.
51. Koorneef LL, van den Heuvel JK, Kroon J, Boon MR, ’t Hoen PAC, Hettne KM, et al. Selective glucocorticoid receptor modulation prevents and reverses non-alcoholic fatty liver disease in male mice. Endocrinology. 2018;159:3925–3936.
52. Berthiaume M, Laplante M, Festuccia WT, Cianflone K, Turcotte LP, Joanisse DR, et al. 11β-HSD1 inhibition improves triglyceridemia through reduced liver VLDL secretion and partitions lipids toward oxidative tissues. Am. J. Physiol. Metab. 2007;293:E1045–E1052.
53. Han Y, Lin M, Wang X, Guo K, Wang S, Sun M, et al. Basis of aggravated hepatic lipid metabolism by chronic stress in high-fat diet-fed rat. Endocrine. 2015;48:483–492.
54. Bagdade JD, Yee E, Albers J, Pykalisfo OJ. Glucocorticoids and triglyceride transport: Effects on triglyceride secretion rates, lipoprotein lipase, and plasma lipoproteins in the rat. Metabolism. 1976;25:533–542.
55. de Guia RM, Rose AJ, Sommerfeld A, Seibert O, Strzoda D, Zota A, et al. microRNA-379 couples glucocorticoid hormones to dysfunctional lipid homeostasis. EMBO J. 2015;34:344–60.
56. Timlin MT, Parks EJ. Temporal pattern of de novo lipogenesis in the postprandial state in healthy men. Am. J. Clin. Nutr. 2005;81:35–42.
57. Duarte JAG, Carvalho F, Pearson M, Horton JD, Browning JD, Jones JG, et al. A high-fat diet suppresses de novo lipogenesis and desaturation but not elongation and triglyceride synthesis in mice. J. Lipid Res. 2014;55:2541.
58. Turner SM, Murphy EJ, Neese RA, Antelo F, Thomas T, Agarwal A, et al. Measurement of TG synthesis and turnover in vivo by 2 H 2 O incorporation into the glycerol moiety and application of MIDA. Am. J. Physiol. Metab. 2003;285:E790–E803.
59. Hellerstein MK. Synthesis of Fat in Response to Alterations in Diet: Insights from New Stable Isotope Methodologies [Internet]. 1996.
60. Softic S, Cohen DE, Kahn CR. Role of Dietary Fructose and Hepatic De Novo Lipogenesis in Fatty Liver Disease. Dig. Dis. Sci. 2016;61:1282–93.
61. Smith GI, Shankaran M, Yoshino M, Schweitzer GG, Chondronikola M, Beals JW, et al. Insulin resistance drives hepatic de novo lipogenesis in nonalcoholic fatty liver disease.
2020 07 03 Boekje 1.0.indd 1922020 07 03 Boekje 1.0.indd 192 24/07/2020 21:1324/07/2020 21:13

General Discussion
193
6
J. Clin. Invest. 2019;130. 62. Bandsma RHJ, Peter AG, Smit A, Kuipers F. Disturbed lipid metabolism in glycogen
storage disease type 1. Eur. J. Pediatr. 2002;161:S65–S69. 63. Lee WN, Bassilian S, Ajie HO, Schoeller DA, Edmond J, Bergner EA, et al. In vivo
measurement of fatty acids and cholesterol synthesis using D2O and mass isotopomer analysis. https://doi.org/10.1152/ajpendo.1994.266.5.E699. 1994;
64. Paglialunga S, Dehn CA. Clinical assessment of hepatic de novo lipogenesis in non-alcoholic fatty liver disease. Lipids Health Dis. 2016;15:159.
65. Haeusler RA, Astiarraga B, Camastra S, Accili D, Ferrannini E. Human insulin resistance is associated with increased plasma levels of 12α-hydroxylated bile acids. Diabetes. 2013;62:4184–91.
66. Haeusler RA, Pratt-Hyatt M, Welch CL, Klaassen CD, Accili D. Impaired generation of 12-hydroxylated bile acids links hepatic insulin signaling with dyslipidemia. Cell Metab. 2012;15:65–74.
67. Brufau G, Stellaard F, Prado K, Bloks VW, Jonkers E, Boverhof R, et al. Improved glycemic control with colesevelam treatment in patients with type 2 diabetes is not directly associated with changes in bile acid metabolism. Hepatology. 2010;52:1455–64.
68. Bertaggia E, Jensen KK, Castro-Perez J, Xu Y, Di Paolo G, Chan RB, et al. Cyp8b1 ablation prevents Western diet-induced weight gain and hepatic steatosis because of impaired fat absorption. Am. J. Physiol. Endocrinol. Metab. 2017;313:E121–E133.
69. Wang DQ-H, Tazuma S, Cohen DE, Carey MC. Feeding natural hydrophilic bile acids inhibits intestinal cholesterol absorption: studies in the gallstone-susceptible mouse. Am. J. Physiol. - Gastrointest. Liver Physiol. 2003;285:G494–G502.
70. Bonde Y, Eggertsen G, Rudling M. Mice Abundant in Muricholic Bile Acids Show Resistance to Dietary Induced Steatosis, Weight Gain, and to Impaired Glucose Metabolism. PLoS One. 2016;11:e0147772.
71. Heuman DM. Quantitative estimation of the hydrophilic- hydrophobic balance of mixed bile salt solutions. J. Lipid Res. 1989;30:719–30.
72. Takahashi S, Fukami T, Masuo Y, Brocker CN, Xie C, Krausz KW, et al. Cyp2c70 is responsible for the species difference in bile acid metabolism between mice and humans. J. Lipid Res. 2016;57:2130–2137.
73. Li T, Chanda D, Zhang Y, Choi H-S, Chiang JYL. Glucose stimulates cholesterol 7alpha-hydroxylase gene transcription in human hepatocytes. J. Lipid Res. 2010;51:832–42.
74. Li T, Francl JM, Boehme S, Ochoa A, Zhang Y, Klaassen CD, et al. Glucose and insulin induction of bile acid synthesis: mechanisms and implication in diabetes and obesity. J. Biol. Chem. 2012;287:1861–73.
75. Chiang JYL. Bile acids: regulation of synthesis. J. Lipid Res. 2009;50:1955–66. 76. Gälman C, Angelin B, Rudling M. Bile acid synthesis in humans has a rapid diurnal
variation that is asynchronous with cholesterol synthesis. Gastroenterology. 2005;129:1445–53.
77. Zhang Y-KJ, Guo GL, Klaassen CD. Diurnal variations of mouse plasma and hepatic bile
2020 07 03 Boekje 1.0.indd 1932020 07 03 Boekje 1.0.indd 193 24/07/2020 21:1324/07/2020 21:13

Chapter 6
194
acid concentrations as well as expression of biosynthetic enzymes and transporters. PLoS One. 2011;6:e16683.
78. Song K-H, Chiang JYL. Glucagon and cAMP inhibit cholesterol 7α-hydroxylase (CYP7a1) gene expression in human hepatocytes: Discordant regulation of bile acid synthesis and gluconeogenesis. Hepatology. 2006;43:117–125.
79. Li T, Kong X, Owsley E, Ellis E, Strom S, Chiang JYL. Insulin regulation of cholesterol 7alpha-hydroxylase expression in human hepatocytes: roles of forkhead box O1 and sterol regulatory element-binding protein 1c. J. Biol. Chem. 2006;281:28745–54.
80. Grefhorst A, Schreurs M, Oosterveer MH, Cortés VA, Havinga R, Herling AW, et al. Carbohydrate-response-element-binding protein (ChREBP) and not the liver X receptor α (LXRα) mediates elevated hepatic lipogenic gene expression in a mouse model of glycogen storage disease type 1. Biochem. J. 2010;432:249–54.
81. Bricambert J, Miranda J, Benhamed F, Girard J, Postic C, Dentin R. Salt-inducible kinase 2 links transcriptional coactivator p300 phosphorylation to the prevention of ChREBP-dependent hepatic steatosis in mice. J. Clin. Invest. 2010;120:4316–31.
82. Guinez C, Filhoulaud G, Rayah-Benhamed F, Marmier S, Dubuquoy C, Dentin R, et al. O-GlcNAcylation increases ChREBP protein content and transcriptional activity in the liver. Diabetes. 2011;60:1399–413.
83. Lane EA, Choi DW, Garcia-Haro L, Levine ZG, Tedoldi M, Walker S, et al. HCF-1 Regulates De Novo Lipogenesis through a Nutrient-Sensitive Complex with ChREBP. Mol. Cell. 2019;
84. Hart GW. Nutrient regulation of signaling and transcription. J. Biol. Chem. 2019;294:2211–2231.
85. Kaelin WG, McKnight SL. Influence of metabolism on epigenetics and disease. Cell. 2013;153:56–69.
86. Ma J, Hart GW. Protein O-GlcNAcylation in diabetes and diabetic complications. Expert Rev. Proteomics. 2013;10:365–80.
87. Cai C, Yu H, Huang G, Du X, Yu X, Zhou Y, et al. Histone modifications in fatty acid synthase modulated by carbohydrate responsive element binding protein are associated with non-alcoholic fatty liver disease. Int. J. Mol. Med. 2018;42:1215–1228.
88. Smit GP. The long-term outcome of patients with glycogen storage disease type Ia. Eur. J. Pediatr. 1993;152 Suppl 1:S52-5.
89. Lee P, Mather S, Owens C, Leonard J, Dicks-Mireaux C. Hepatic ultrasound findings in the glycogen storage diseases. Br. J. Radiol. 1994;67:1062–1066.
90. Wolfsdorf JI, Crigler JF. Effect of continuous glucose therapy begun in infancy on the long-term clinical course of patients with type I glycogen storage disease. J. Pediatr. Gastroenterol. Nutr. 1999;29:136–43.
91. Talente GM, Coleman RA, Alter C, Baker L, Brown BI, Cannon RA, et al. Glycogen storage disease in adults. Ann. Intern. Med. 1994;120:218–26.
92. Labrune P, Trioche P, Duvaltier I, Chevalier P, Odièvre M. Hepatocellular adenomas in glycogen storage disease type I and III: a series of 43 patients and review of the literature.
2020 07 03 Boekje 1.0.indd 1942020 07 03 Boekje 1.0.indd 194 24/07/2020 21:1324/07/2020 21:13

General Discussion
195
6
J. Pediatr. Gastroenterol. Nutr. 1997;24:276–9. 93. Gjorgjieva M, Oosterveer MH, Mithieux G, Rajas F. Mechanisms by Which Metabolic
Reprogramming in GSD1 Liver Generates a Favorable Tumorigenic Environment. 94. Ockner RK, Kaikaus RM, Bass NM. Fatty-acid metabolism and the pathogenesis of
hepatocellular carcinoma: review and hypothesis. Hepatology. 1993;18:669–76. 95. Cho J-H, Kim G-Y, Pan C-J, Anduaga J, Choi E-J, Mansfield BC, et al. Downregulation
of SIRT1 signaling underlies hepatic autophagy impairment in glycogen storage disease type Ia. PLoS Genet. 2017;13:e1006819.
96. Cho J-H, Kim G-Y, Mansfield BC, Chou JY. Sirtuin signaling controls mitochondrial function in glycogen storage disease type Ia. J. Inherit. Metab. Dis. 2018;41:997–1006.
97. Gjorgjieva M, Calderaro J, Monteillet L, Silva M, Raffin M, Brevet M, et al. Dietary exacerbation of metabolic stress leads to accelerated hepatic carcinogenesis in glycogen storage disease type Ia. J. Hepatol. 2018;69:1074–1087.
98. Farah BL, Sinha RA, Wu Y, Singh BK, Lim A, Hirayama M, et al. Hepatic mitochondrial dysfunction is a feature of Glycogen Storage Disease Type Ia (GSDIa). Sci. Rep. 2017;7:44408.
99. Sun Q, Zhong W, Zhang W, Zhou Z. Defect of mitochondrial respiratory chain is a mechanism of ROS overproduction in a rat model of alcoholic liver disease: role of zinc deficiency. Am. J. Physiol. Liver Physiol. 2016;310:G205–G214.
100. Nie H, Ju H, Fan J, Shi X, Cheng Y, Cang X, et al. O-GlcNAcylation of PGK1 coordinates glycolysis and TCA cycle to promote tumor growth. Nat. Commun. 2020;11.
101. Cha-Molstad H, Saxena G, Chen J, Shalev A. Glucose-stimulated expression of Txnip is mediated by carbohydrate response element-binding protein, p300, and histone H4 acetylation in pancreatic beta cells. J. Biol. Chem. 2009;284:16898–905.
102. Litsios A, Ortega ÁD, Wit EC, Heinemann M. Metabolic-flux dependent regulation of microbial physiology. Curr. Opin. Microbiol. 2018;42:71–78.
103. Hijmans BS, Boss A, van Dijk TH, Soty M, Wolters H, Mutel E, et al. Hepatocytes contribute to residual glucose production in a mouse model for glycogen storage disease type Ia. Hepatology. 2017;66:2042–2054.
104. Chou JY, Matern D, Mansfield BC, Chen Y-T. Type I glycogen storage diseases: disorders of the glucose-6-phosphatase complex. Curr. Mol. Med. 2002;2:121–43.
105. Okechuku GO, Shoemaker LR, Dambska M, Brown LM, Mathew J, Weinstein DA. Tight metabolic control plus ACE inhibitor therapy improves GSD I nephropathy. J. Inherit. Metab. Dis. 2017;40:703–708.
106. Chen Y-T, Bazzarre CH, Lee MM, Sidbury JB, Coleman RA. Type I glycogen storage disease: Nine years of management with cornstarch. Eur. J. Pediatr. 1993;152:56–59.
107. Beegle RD, Brown LM, Weinstein DA. Regression of Hepatocellular Adenomas with Strict Dietary Therapy in Patients with Glycogen Storage Disease Type I [Internet]. 2014. p. 23–32.
108. Melis D, Rossi A, Pivonello R, Del Puente A, Pivonello C, Cangemi G, et al. Reduced bone mineral density in glycogen storage disease type III: evidence for a possible connection
2020 07 03 Boekje 1.0.indd 1952020 07 03 Boekje 1.0.indd 195 24/07/2020 21:1324/07/2020 21:13

Chapter 6
196
between metabolic imbalance and bone homeostasis. Bone. 2016;86:79–85. 109. Lee PJ, Patel JS, Fewtrell M, Leonard J V, Bishop NJ. Bone mineralisation in type 1
glycogen storage disease. Eur. J. Pediatr. 1995;154:483–7. 110. Li T, Francl JM, Boehme S, Ochoa A, Zhang Y, Klaassen CD, et al. Glucose and insulin
induction of bile acid synthesis: mechanisms and implication in diabetes and obesity. J. Biol. Chem. 2012;287:1861–73.
111. Ma K, Xiao R, Tseng H-T, Shan L, Fu L, Moore DD. Circadian Dysregulation Disrupts Bile Acid Homeostasis. PLoS One. 2009;4:e6843.
112. Le Martelot G, Claudel T, Gatfield D, Schaad O, Kornmann B, Sasso G Lo, et al. REV-ERBα Participates in Circadian SREBP Signaling and Bile Acid Homeostasis. PLoS Biol. 2009;7:e1000181.
113. Baldini SF, Lefebvre T. O-GlcNAcylation and the Metabolic Shift in High-Proliferating Cells: All the Evidence Suggests that Sugars Dictate the Flux of Lipid Biogenesis in Tumor Processes. Front. Oncol. 2016;6:6.
114. Kim G-Y, Lee YM, Kwon JH, Cho J-H, Pan C-J, Starost MF, et al. Glycogen storage disease type Ia mice with less than 2% of normal hepatic glucose-6-phosphatase-α activity restored are at risk of developing hepatic tumors. Mol. Genet. Metab. 2017;120:229–234.
115. Kim G-Y, Lee YM, Cho J-H, Pan C-J, Jun HS, Springer DA, et al. Mice expressing reduced levels of hepatic glucose-6-phosphatase-α activity do not develop age-related insulin resistance or obesity. Hum. Mol. Genet. 2015;24:5115–5125.
116. Cho J-H, Lee YM, Starost MF, Mansfield BC, Chou JY. Gene therapy prevents hepatic tumor initiation in murine glycogen storage disease type Ia at the tumor-developing stage. J. Inherit. Metab. Dis. 2019;42:459–469.
117. Lee YM, Jun HS, Pan C-J, Lin SR, Wilson LH, Mansfield BC, et al. Prevention of hepatocellular adenoma and correction of metabolic abnormalities in murine glycogen storage disease type Ia by gene therapy. Hepatology. 2012;56:1719–1729.
118. Peeks F, Steunenberg TAH, de Boer F, Rubio-Gozalbo ME, Williams M, Burghard R, et al. Clinical and biochemical heterogeneity between patients with glycogen storage disease type IA: the added value of CUSUM for metabolic control. J. Inherit. Metab. Dis. 2017;40:695–702.
119. Bandsma RHJ, Smit GPA, Reijngoud D-J, Kuipers F. Adiponectin levels correlate with the severity of hypertriglyceridaemia in glycogen storage disease Ia. J. Inherit. Metab. Dis. 2009;32 Suppl 1:S27-31.
120. Iizuka K, Miller B, Uyeda K. Deficiency of carbohydrate-activated transcription factor ChREBP prevents obesity and improves plasma glucose control in leptin-deficient (ob/ob) mice. Am. J. Physiol. - Endocrinol. Metab. 2006;291.
121. Dentin R, Benhamed F, Hainault I, Fauveau VR, Foufelle F, Dyck JRB, et al. Liver-Specific Inhibition of ChREBP Improves Hepatic Steatosis and Insulin Resistance in ob/ob Mice. Diabetes. 2006;55:2159–2170.
122. Zhang Y, Lee FY, Barrera G, Lee H, Vales C, Gonzalez FJ, et al. Activation of the nuclear receptor FXR improves hyperglycemia and hyperlipidemia in diabetic mice. Proc. Natl.
2020 07 03 Boekje 1.0.indd 1962020 07 03 Boekje 1.0.indd 196 24/07/2020 21:1324/07/2020 21:13

General Discussion
197
6
Acad. Sci. U. S. A. 2006;103:1006–11. 123. Cariou B. The farnesoid X receptor (FXR) as a new target in non-alcoholic steatohepatitis.
Diabetes Metab. 2008;34:685–691. 124. Zhang S, Wang J, Liu Q, Harnish DC. Farnesoid X receptor agonist WAY-362450 attenuates
liver inflammation and fibrosis in murine model of non-alcoholic steatohepatitis. J. Hepatol. 2009;51:380–388.
125. Cipriani S, Mencarelli A, Palladino G, Fiorucci S. FXR activation reverses insulin resistance and lipid abnormalities and protects against liver steatosis in Zucker (fa/fa) obese rats. J. Lipid Res. 2010;51:771–84.
126. Comeglio P, Cellai I, Mello T, Filippi S, Maneschi E, Corcetto F, et al. INT-767 prevents NASH and promotes visceral fat brown adipogenesis and mitochondrial function. J. Endocrinol. 2018;238:107–127.
127. Stiede K, Miao W, Blanchette HS, Beysen C, Harriman G, Harwood HJ, et al. Acetyl-coenzyme A carboxylase inhibition reduces de novo lipogenesis in overweight male subjects: A randomized, double-blind, crossover study. Hepatology. 2017;66:324–334.
128. Loomba R, Kayali Z, Noureddin M, Ruane P, Lawitz EJ, Bennett M, et al. GS-0976 Reduces Hepatic Steatosis and Fibrosis Markers in Patients With Nonalcoholic Fatty Liver Disease. Gastroenterology. 2018;155:1463-1473.e6.
129. Lawitz EJ, Coste A, Poordad F, Alkhouri N, Loo N, McColgan BJ, et al. Acetyl-CoA Carboxylase Inhibitor GS-0976 for 12 Weeks Reduces Hepatic De Novo Lipogenesis and Steatosis in Patients With Nonalcoholic Steatohepatitis. Clin. Gastroenterol. Hepatol. 2018;16:1983-1991.e3.
130. Liang Y, Osborne MC, Monia BP, Bhanot S, Gaarde WA, Reed C, et al. Reduction in glucagon receptor expression by an antisense oligonucleotide ameliorates diabetic syndrome in db/db mice. Diabetes. 2004;53:410–7.
131. Guzman CB, Zhang XM, Liu R, Regev A, Shankar S, Garhyan P, et al. Treatment with LY2409021, a glucagon receptor antagonist, increases liver fat in patients with type 2 diabetes. Diabetes, Obes. Metab. 2017;19:1521–1528.
132. Guzman CB, Duvvuru S, Akkari A, Bhatnagar P, Battioui C, Foster W, et al. Coding variants in PNPLA3 and TM6SF2 are risk factors for hepatic steatosis and elevated serum alanine aminotransferases caused by a glucagon receptor antagonist. Hepatol. Commun. 2018;2:561–570.
133. Schweiger M, Romauch M, Schreiber R, Grabner GF, Hütter S, Kotzbeck P, et al. Pharmacological inhibition of adipose triglyceride lipase corrects high-fat diet-induced insulin resistance and hepatosteatosis in mice. Nat. Commun. 2017;8:14859.
2020 07 03 Boekje 1.0.indd 1972020 07 03 Boekje 1.0.indd 197 24/07/2020 21:1324/07/2020 21:13

2020 07 03 Boekje 1.0.indd 1982020 07 03 Boekje 1.0.indd 198 24/07/2020 21:1324/07/2020 21:13

7 CHAPTEREnglish summary
Nederlandse samenvattingCurriculum Vitae
List of publicationsAcknowledgements
2020 07 03 Boekje 1.0.indd 1992020 07 03 Boekje 1.0.indd 199 24/07/2020 21:1324/07/2020 21:13

2020 07 03 Boekje 1.0.indd 2002020 07 03 Boekje 1.0.indd 200 24/07/2020 21:1324/07/2020 21:13

201
English summary
7
SummaryDysregulation of intrahepatic glucose signaling induces several serious metabolic responses that adversely affect health. The studies described in this thesis focus on the (patho)physiological consequences of constitutively activated hepatic glucose signaling as occurs in type 2 diabetes and Glycogen Storage Disease type 1a (GSD Ia). GSD Ia is an inherited disorder of carbohydrate metabolism caused by mutations in the catalytic subunit (G6PC) of the glucose-6-phophatase (G6Pase) complex. G6PC is selectively expressed in liver, kidney and intestine and catalyzes the final step in gluconeogenesis and glycogenolysis by hydrolyzing glucose-6-phosphate (G6P) to glucose. G6PC is therefore critical for maintainance of systemic glucose homeostasis during fasting. GSD Ia patients clinically present with severe fasting intolerance and hepatomegaly, biochemically characterized by nonketotic hypoglycemia, hyperlactacidemia, hyperuricemia, hypercholesterolemia, hepatic steatosis, and hypertriglyceridemia. To prevent hypoglycemia, i.e. to maintain ‘glycemic control’, patients have to adhere to a strict dietary regime. This consists of frequent meals with restriction of simple sugars, regular intake of uncooked cornstarch, and/or continuous (naso)gastric drip feeding throughout the night. Dietary adherence generally markedly reduces hypoglycemic episodes and largely corrects secondary metabolic derangements. However, long-term complications of GSD Ia, like the development of liver adenomas in young adulthood, still frequently occur.
In clinical practice, triglyceride (TG) concentrations in GSD Ia patients are regarded as an important biomarker for glycemic control. Although hyperlipidemia in GSD Ia is related to glycemic control, the underlying mechanisms are poorly understood. In chapter 2 we investigated the physiological mechanisms contributing to fatty liver disease and hypertriglyceridemia in GSD Ia. Whole-body TG metabolism was studied in normoglycemic and hypoglycemic hepatocyte-specific glucose-6-phosphatase deficient (L-G6pc-/-) mice, a liver-specific mouse model for GSD Ia. Our studies revealed a marked difference in the origin of hepatic steatosis in normoglycemic versus hypoglycemic L-G6pc-/- mice. Hepatic de novo fatty acid synthesis partly contributed to hepatic lipid accumulation in the normoglycemic state, while more severe liver steatosis in hypoglycemic L-G6pc-/- mice resulted from enhanced adipose tissue lipolysis. Moreover, we observed an increase in hepatic very low-density lipoprotein (VLDL)-TG secretion and, specifically in the hypoglycemic state, a reduction in VLDL-TG catabolism. Overall, our findings indicate that impaired catabolism of TG-rich lipoproteins leads to hypertriglyceridemia in L-G6pc-/- mice. Based on our results, we hypothesize that impaired TG catabolism is also most evident in GSD Ia patients with poor metabolic control.
In chapter 3 and 4 we assessed the contribution of enhanced glycolysis and de novo lipogenesis to fatty liver disease in GSD Ia by targeting two different transcription
2020 07 03 Boekje 1.0.indd 2012020 07 03 Boekje 1.0.indd 201 24/07/2020 21:1324/07/2020 21:13

202
English summary
factors. Carbohydrate Response Element Binding Protein (ChREBP) is a key regulator of glycolysis and lipogenesis, and its activity is increased in hepatic GSD Ia. We found that attenuation of hepatic ChREBP induction in L-G6pc-/- mice aggravated hepatomegaly due to further accumulation of glycogen and lipids. These accumulations resulted from reduced glycolysis and suppressed VLDL-TG secretion. Importantly, we identified transmembrane 6 superfamily member 2 (TM6SF2), critical for VLDL formation, as a novel ChREBP target in mouse liver. In conclusion, we showed that hepatic ChREBP maintains TG balance by concomitantly regulating hepatic lipogenesis, fatty acid oxidation and particularly VLDL-TG secretion. Enhanced ChREBP activity thus limits fatty liver development in GSD Ia by balancing hepatic TG production and –secretion.
Farnesoid X Receptor (FXR) is a key transcription factor controlling bile acid, lipid and glucose metabolism, and acts as a repressor of hepatic glycolysis and de novo lipogenesis. Pharmacological FXR agonists are currently in clinical evaluation for the treatment of fatty liver disease. In chapter 4 we found that, upon treatment with the pharmacological FXR agonist PX20606, glycolytic pyruvate was directed towards G6P synthesis in the livers of L-G6pc-/- mice. This resulted in a further accumulation of hepatic G6P while it diminished substrate availability for de novo lipogenesis. However, PX20606 treatment only partially reduced hepatic TG content in L-G6pc-/- mice, which is in line with our finding in chapter 2 that de novo lipogenesis only has a minor contribution to hepatic steatosis in GSD Ia. Overall, our study suggests a limited therapeutic effectiveness of PX20606, and therefore of FXR agonists in general, for the treatment of fatty liver in GSD Ia patients.
Bile acids facilitate absorption of dietary lipids and fat-soluble vitamins in the intestine but also act as signaling molecules that control glucose, lipid and energy metabolism. Bile acid metabolism, in turn, is controlled by several nutrient-sensitive transcription factors, and is perturbed in conditions of uncontrolled hyperglycemia and insulin resistance. In chapter 5 we characterized the regulatory role of glucose, independent of insulin, in the control of hepatic bile acid synthesis. We showed that hepatic G6P regulates bile acid synthesis via ChREBP-dependent induction of CYP8B1 in mice. As a consequence, G6P-ChREBP signaling increased the relative abundance of cholic acid-derived bile acids and the bile acid composition shifted towards more hydrophobic bile. The G6P-ChREBP-dependent change in bile acid hydrophobicity in mice associated with reduced fecal neutral sterol loss and lower plasma campesterol/cholesterol ratios, compatible with enhanced intestinal cholesterol absorption. Additionally, we demonstrated in chapter 5 that hepatic expression levels of CYP7A1, the rate-controlling enzyme in bile acid synthesis, correlated with circulating glucose levels in L-G6pc-/- mice. Taken together, our findings thus indicate that blood glucose levels partly control hepatic CYP7A1
2020 07 03 Boekje 1.0.indd 2022020 07 03 Boekje 1.0.indd 202 24/07/2020 21:1324/07/2020 21:13
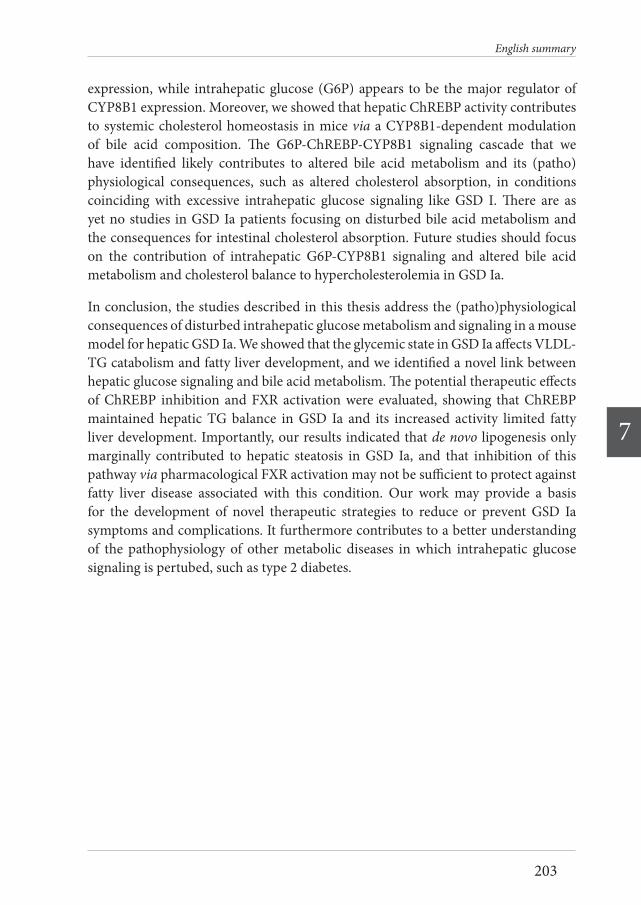
203
English summary
7
expression, while intrahepatic glucose (G6P) appears to be the major regulator of CYP8B1 expression. Moreover, we showed that hepatic ChREBP activity contributes to systemic cholesterol homeostasis in mice via a CYP8B1-dependent modulation of bile acid composition. The G6P-ChREBP-CYP8B1 signaling cascade that we have identified likely contributes to altered bile acid metabolism and its (patho)physiological consequences, such as altered cholesterol absorption, in conditions coinciding with excessive intrahepatic glucose signaling like GSD I. There are as yet no studies in GSD Ia patients focusing on disturbed bile acid metabolism and the consequences for intestinal cholesterol absorption. Future studies should focus on the contribution of intrahepatic G6P-CYP8B1 signaling and altered bile acid metabolism and cholesterol balance to hypercholesterolemia in GSD Ia.
In conclusion, the studies described in this thesis address the (patho)physiological consequences of disturbed intrahepatic glucose metabolism and signaling in a mouse model for hepatic GSD Ia. We showed that the glycemic state in GSD Ia affects VLDL-TG catabolism and fatty liver development, and we identified a novel link between hepatic glucose signaling and bile acid metabolism. The potential therapeutic effects of ChREBP inhibition and FXR activation were evaluated, showing that ChREBP maintained hepatic TG balance in GSD Ia and its increased activity limited fatty liver development. Importantly, our results indicated that de novo lipogenesis only marginally contributed to hepatic steatosis in GSD Ia, and that inhibition of this pathway via pharmacological FXR activation may not be sufficient to protect against fatty liver disease associated with this condition. Our work may provide a basis for the development of novel therapeutic strategies to reduce or prevent GSD Ia symptoms and complications. It furthermore contributes to a better understanding of the pathophysiology of other metabolic diseases in which intrahepatic glucose signaling is pertubed, such as type 2 diabetes.
2020 07 03 Boekje 1.0.indd 2032020 07 03 Boekje 1.0.indd 203 24/07/2020 21:1324/07/2020 21:13

2020 07 03 Boekje 1.0.indd 2042020 07 03 Boekje 1.0.indd 204 24/07/2020 21:1324/07/2020 21:13

205
7
Nederlandse samenvatting
SamenvattingVerstoringen van de glucose signalering in levercellen veroorzaakt verschillende ernstige metabole reacties die de gezondheid nadelig kunnen beïnvloeden. De studies die beschreven zijn in dit proefschrift richten zich op de (patho)fysiologische gevolgen van continue geactiveerde hepatische glucose signalering, zoals die optreedt bij type 2 diabetes en in glycogenstapelingsziekte type 1a (GSD Ia). GSD Ia is een erfelijke aandoening van het koolhydraat metabolisme en wordt veroorzaakt door mutaties in de katalytische subeenheid (G6PC) van het glucose-6-fosfatase (G6Pase) complex. G6PC komt selectief tot expressie in de lever, nieren en darm en katalyseert de laatste stap in gluconeogenese en glycogenolyse middels de hydrolyse van glucose-6-fosfaat (G6P) tot glucose. G6PC is het belangrijkste enzym voor handhaving van de glucose homeostase tijdens vasten. GSD Ia patiënten vertonen ernstige vasten-intoleratie en hebben daarnaast een sterk vergrote lever (hepatomegalie). Op biochemisch niveau wordt GSD Ia gekenmerkt door niet-ketotische hypoglycemie, hyperlactacidemie, hyperurikemie, hypercholesterolemie, leversteatose en hypertriglyceridemie. Om hypoglycemieën te voorkomen en een goede ‘glycemische controle’ te bewerkstelligen, moeten patiënten zich houden aan een strikt dieet. Dit dieet bestaat uit frequente maaltijden met een beperkte hoeveelheid simpele koolhydraten, reguliere inname van complexe koolhydraten (ongekookt maiszetmeel; maizena) en/of continue sondevoeding gedurende de nacht. Het strikte diet zorgt ervoor dat hypoglycemie minder vaak optreedt en dat secundaire biochemische symptomen grotendeels worden gecorrigeerd. Toch komen complicaties op lange termijn, zoals de ontwikkeling van leveradenomen op jong volwassen leeftijd, nog steeds voor.
In de kliniek worden triglyceride (TG) concentraties in het bloed van GSD Ia patiënten beschouwd als een belangrijke biomarker voor glycemische controle. Hoewel hyperlipidemie bij GSD Ia verband houdt met glycemische controle, zijn de onderliggende mechanismen van deze relatie grotendeels onbekend. In hoofdstuk 2 hebben we de fysiologische mechanismen onderzocht die bijdragen aan leververvetting en hypertriglyceridemie in GSD Ia. Het TG metabolisme werd bestudeerd in normoglycemische en hypoglycemische hepatocyt-specifieke glucose-6-fosfatase deficiënte (L-G6pc-/-) muizen, een lever-specifiek muismodel voor GSD Ia. Onze studies lieten een duidelijk verschil zien in de oorsprong van steatose in de lever van normoglycemische versus hypoglycemische L-G6pc-/- muizen. Hepatische de novo vetzuur synthese droeg maar gedeeltelijk bij aan ophoping van vetten in de lever in de normoglycemische toestand, terwijl de veel ernstigere leversteatose bij hypoglycemische L-G6pc-/- muizen het gevolg was van toevoer van vrije vetzuren door een verhoogde lipolyse in het vetweefsel. Bovendien hebben we bij L-G6pc-/- muizen een verhoogde secretie van ‘very low-density lipoprotein’ (VLDL)-TG gemeten. Daarnaast vonden we in L-G6pc-/- muizen in hypoglycemische toestand minder VLDL-TG katabolisme ten opzicht van de hypoglycemisch controle muizen.
2020 07 03 Boekje 1.0.indd 2052020 07 03 Boekje 1.0.indd 205 24/07/2020 21:1324/07/2020 21:13
206
Nederlandse samenvatting
Al met al geven onze bevindingen aan dat een verminderd katabolisme van TG-rijke lipoproteïnen leidt tot hypertriglyceridemie in hypoglycemische L-G6pc-/- muizen. Op basis van onze resultaten veronderstellen we dat een verminderd TG katabolisme ook het meest uitgesproken is in GSD Ia-patiënten met een slechte glycemische controle.
In hoofdstuk 3 en 4 hebben we de bijdrage van verhoogde glycolyse en de novo lipogenese aan leververvetting in GSD Ia muizen geëvalueerd door ons te richten op twee verschillende transcriptiefactoren. Carbohydrate Response Element Binding Protein (ChREBP) is een belangrijke regulator van glycolyse en lipogenese, en ChREBP activiteit is verhoogd in de GSD Ia lever. We vonden dat remming van hepatische ChREBP activiteit in L-G6pc-/- muizen de hepatomegalie verergerde als gevolg van verdere ophoping van glycogeen en lipiden. Deze ophopingen waren het gevolg van verminderde glycolyse en verlaagde VLDL-TG-secretie. Een belangrijke nieuwe bevinding is dat transmembraan 6 superfamilielid 2 (TM6SF2), cruciaal voor VLDL-vorming, een ChREBP target gen is in de lever van muizen. We toonden dus aan dat ChREBP het TG evenwicht in de lever bewaakt door gelijktijdig de lipogenese, de vetzuur oxidatie en met name de VLDL-TG secretie te reguleren. Verhoogde ChREBP activiteit in GSD Ia beperkt de ontwikkeling van vette lever door de hepatische TG productie en –secretie op elkaar af te stemmen.
Farnesoid X Receptor (FXR) is een belangrijke transcriptiefactor die het galzout-, lipide- en glucose metabolisme reguleert, en fungeert als een negatieve regulator van hepatische glycolyse en de novo lipogenese. Farmacologische FXR agonisten worden momenteel klinisch getest voor de behandeling van leververvetting. In hoofdstuk 4 vonden we dat behandeling van L-G6pc-/- muizen met de farmacologische FXR agonist PX20606, leidde tot een verhoogde omzetting van glycolytisch pyruvaat in G6P in de lever. Daardoor werd de ophoping van G6P in de lever verder bevorderd terwijl de substraat beschikbaarheid voor de novo lipogenese werd verminderd. Behandeling met PX20606 resulteerde echter slechts tot een gedeeltelijke verlaging van de hoeveelheid TG in de lever van L-G6pc-/- muizen. Deze bevinding is in overeenstemming met onze resultaten in hoofdstuk 2, namelijk dat de novo lipogenese slechts in geringe mate bijdraagt aan leververvetting in GSD Ia. Al met al suggereert onze studie dat PX20606, en gebruik van een FXR agonist in het algemeen, slechts een beperkte therapeutisch effect zal hebben in de behandeling van leververvetting bij GSD Ia patiënten.
Galzouten zorgen voor de opname van vetten en van vet- oplosbare vitamines uit het voedsel vanuit de darm, maar werken ook als signaalmoleculen die het metabolisme van glucose, lipiden en energie regelen. Het galzout metabolisme wordt op zijn beurt gereguleerd door verschillende transcriptiefactoren die gevoelig
2020 07 03 Boekje 1.0.indd 2062020 07 03 Boekje 1.0.indd 206 24/07/2020 21:1324/07/2020 21:13

207
7
Nederlandse samenvatting
zijn voor voedingsstoffen. Deze regulatie wordt verstoord door ongecontroleerde hyperglycemieën en insuline resistentie. In hoofdstuk 5 hebben we de regulerende rol van glucose, onafhankelijk van insuline, op de galzout synthese in de lever gekarakteriseerd. We toonden aan dat G6P in de lever de galzout synthese reguleert in muizen via een ChREBP-afhankelijke inductie van CYP8B1. Als gevolg daarvan resulteerde G6P-ChREBP signalering in een relatieve verhoging van cholaat afgeleide galzouten waardoor de galzout samenstelling hydrofober werd. De G6P-ChREBP afhankelijke verandering in galzout hydrofobiciteit bij muizen was geassocieerd met een verlaging van de fecale neutrale sterolen uitscheiding en lagere plasma campesterol/cholesterol ratio’s. Deze veranderingen duiden op een verhoogde cholesterol absorptie door de darm. Daarnaast hebben we in hoofdstuk 5 aangetoond dat het hepatische expressie niveau van CYP7A1, het enzym dat de snelheid van galzout synthese reguleert, gecorreleerd is aan de bloedsuikerspiegel in L-G6pc-/- muizen. Samengevat geven onze bevindingen dus aan dat de bloedsuikerspiegel gedeeltelijk de expressie van CYP7A1 in de lever reguleert, terwijl intrahepatisch glucose (G6P) een belangrijke regulator van de CYP8B1 expressie lijkt te zijn. Daarnaast blijkt uit ons onderzoek dat ChREBP activiteit in de lever bijdraagt aan systemische cholesterol homeostase in muizen via een CYP8B1 afhankelijke regulatie van de galzout samenstelling. In metabole aandoeningen met overmatige intrahepatische glucose signalering, zoals GSD Ia, draagt de G6P-ChREBP-CYP8B1 signaleringscascade waarschijnlijk bij aan het veranderde galzout metabolisme en de (patho)fysiologische gevolgen hiervan, zoals veranderde cholesterol absorptie. Er zijn momenteel geen studies bekend waarin het galzout metabolisme en de cholesterol opname in GSD Ia-patiënten onderzocht is. Het zou derhalve interessant zijn om in de toekomst onderzoek te doen naar de bijdrage van intrahepatische G6P-CYP8B1 signalering aan hypercholesterolemie in GSD Ia.
De studies beschreven in dit proefschrift behandelen de (patho)fysiologische gevolgen van een verstoord intrahepatisch glucose metabolisme en -signalering in een lever-specifiek muismodel voor GSD Ia. We toonden aan dat de glycemische toestand in GSD Ia het VLDL-TG katabolisme en de ontwikkeling van leververvetting beïnvloedt, en we ontdekten een nieuw verband tussen hepatische glucose signalering en het galzout metabolisme. De potentiële therapeutische effecten van ChREBP remming en FXR activatie werden geëvalueerd. Deze studies toonden aan dat ChREBP de TG balans in de lever van GSD Ia handhaaft, en dat een verhoogde ChREBP activiteit derhalve juist de ontwikkeling van leververvetting in GSD Ia muizen beperkt. Onze resultaten lieten tevens zien dat de novo lipogenese slechts in beperkte mate bijdraagt aan leververvetting in GSD Ia, en dat remming van deze route via farmacologische FXR activatie waarschijnlijk niet voldoende effectief is om leververvetting te voorkomen. Deze inzichten kunnen een basis vormen voor de ontwikkeling van nieuwe therapeutische strategieën om de symptomen en complicaties van GSD Ia
2020 07 03 Boekje 1.0.indd 2072020 07 03 Boekje 1.0.indd 207 24/07/2020 21:1324/07/2020 21:13

208
Nederlandse samenvatting
te behandelen of te voorkomen. Daast dragen zij bij aan een beter begrip van de pathofysiologie van veel voorkomende metabole ziekten waarbij de intrahepatische glucose signalering verstoord is, zoals type 2 diabetes.
2020 07 03 Boekje 1.0.indd 2082020 07 03 Boekje 1.0.indd 208 24/07/2020 21:1324/07/2020 21:13

7
2020 07 03 Boekje 1.0.indd 2092020 07 03 Boekje 1.0.indd 209 24/07/2020 21:1324/07/2020 21:13

2020 07 03 Boekje 1.0.indd 2102020 07 03 Boekje 1.0.indd 210 24/07/2020 21:1324/07/2020 21:13

211
7
Curriculum Vitae
Curriculum VitaeJohanna Anne (Joanne) Hoogerland was born on March 26th 1991 in Goes, The Netherlands. She finished her pre-university education (VWO) at the Calvijn College in 2009, and started studying Nutrition and Health at the Wageningen University. She obtained her Bachelor in 2012 and continued with the Master Nutrition and Health, specialization Molecular Nutrition and Toxicology. During her master she wrote her thesis about the cross-talk between basophils and dendritic cells upon probiotic stimulation, under supervision of prof. dr. H.F.J. Savelkoul at the department of Cell Biology and Immunology. Her Master was successfully completed by a research internship at the Erasmus MC, Rotterdam, where she studied the effect of aging and whole life probiotic intervention on the immune system in mice, supervised by dr. P.J.M. Leenen.
In 2015 she started her PhD at the department of Pediatrics, Center for Liver, Digestive, and Metabolic Diseases, at the University Medical Center Groningen, under supervision of dr. M.H. Oosterveer and prof. dr. F. Kuipers. The results of her PhD project entitled ‘Altered lipid and bile acid metabolism in Glycogen Storage Disease type Ia: pathophysiological mechanisms and therapeutic opportunities’ are summarized in this dissertation.
In September 2019 she joined the research group of prof. dr. B. Staels and dr. D. Dombrowicz at the Institut Pasteur de Lille, France, where she is working as a post-doctoral researcher.
2020 07 03 Boekje 1.0.indd 2112020 07 03 Boekje 1.0.indd 211 24/07/2020 21:1324/07/2020 21:13

2020 07 03 Boekje 1.0.indd 2122020 07 03 Boekje 1.0.indd 212 24/07/2020 21:1324/07/2020 21:13

213
7
List of publications
List of publications• Lei Y, Hoogerland JA, Bloks VW, Bos T, Bleeker A, Wolters H, Wolters JC,
Hijmans BS, van Dijk TH, Thomas R, van Weeghel M, Mithieux G, Houtkooper RH, de Bruin A, Rajas F, Kuipers F, Oosterveer MH. Hepatic ChREBP activation limits NAFLD development in a mouse model for Glycogen Storage Disease type Ia. Hepatology. 2020 Feb; doi: 10.1002/hep.31198. [Epub ahead of print]
• Saeed A, Hoogerland JA, Wessel H, Heegsma J, Derks TGJ, van der Veer E, Mithieux G, Rajas F, Oosterveer MH, Faber KN. Glycogen storage disease type 1a is associated with disturbed vitamin A metabolism and elevated serum retinol levels. Hum Mol Genet. 2020;29(2):264-273.
• Hoogerland JA, Lei Y, Wolters JC, de Boer JF, Bos T, Bleeker A, Mulder NL, van Dijk TH, Kuivenhoven JA, Rajas F, Mithieux G, Haeusler RA, Verkade HJ, Bloks VW, Kuipers F, Oosterveer MH. Glucose-6-phosphate regulates hepatic bile acid synthesis in mice. Hepatology. 2019 Dec;70(6):2171-2184.
• Van Beek AA, Sovran B, Hugenholtz F, Meijer B, Hoogerland JA, Mihailova V, van der Ploeg C, Belzer C, Boekschoten MV, Hoeijmakers JH, Vermeij WP, de Vos P, Wells JM, Leenen PJ, Nicoletti C, Hendriks RW, Savelkoul HF. Supplementation with Lactobacillus plantarum WCFS1 prevents decline of mucus barrier in colon of accelerated aging Ercc1-/Δ7 mice. Front Immunol. 2016 Oct;7:408. eCollection 2016.
• Van Beek AA, Hoogerland JA, Belzer C, De Vos P, De Vos WM, Savelkoul HF, Leenen PJ. Interaction of mouse splenocytes and macrophages with bacterial strains in vitro: the effect of age in the immune response. Benef Microbes. 2016;7(2):275-87.
• Hoogerland JA, Peeks F, Hijmans BS, Wolters JC, Kooijman S, Bos T, Bleeker A, van Dijk TH, Wolters H, Gerding A, Havinga R, Pronk ACM, Rensen PCN, Mithieux G, Rajas F, Kuipers F, Reijngoud DJ, Derks TGJ and Oosterveer MH. Hypoglycemia aggravates dyslipidemia in GSD Ia via enhanced adipocyte lipolysis and impaired VLDL catabolism Link between hypoglycemia and dyslipidemia in GSD Ia. Submitted.
• Hoogerland JA, Bloks VW, Bos T, van Dijk TH, Wolters JC, de Boer JF, Rajas F, Mithieux G, van Weeghel M, Houtkooper RH, Kuipers F and Oosterveer MH. Pharmacological FXR activation redirects pyruvate towards glucose-6-phosphate and only slightly reduces hepatic steatosis in a mouse model for Glycogen Storage Disease type 1a. In preparation.
2020 07 03 Boekje 1.0.indd 2132020 07 03 Boekje 1.0.indd 213 24/07/2020 21:1324/07/2020 21:13

2020 07 03 Boekje 1.0.indd 2142020 07 03 Boekje 1.0.indd 214 24/07/2020 21:1324/07/2020 21:13

215
7
Acknowledgements
AcknowledgementsHet past me om als eerste God dank te zeggen voor alles wat nodig was om het werk te doen en dit proefschrift te schrijven. “Looft den HEERE, want Hij is goed, want Zijn goedertierenheid is tot in eeuwigheid” (Psalm 136:1).
Graag wil ik mijn promotor prof. dr. F. Kuipers en copromotor dr. M.H. Oosterveer bedanken. Beste Folkert, dankjewel voor het delen van je kennis over het galzout-, glucose- en lipide metabolisme, wat essentieel was voor het tot stand komen van mijn proefschrift. Ik heb veel geleerd van onze discussies over de resultaten, van je input op de manuscripten, maar ook van je nuchtere kijk op alle bijkomende zaken. Beste Maaike, ook al verschillen onze karakters als dag en nacht van elkaar, ik ben erg blij dat je mijn supervisor was. Je was altijd beschikbaar voor vragen en discussies, die meestal resulteerden in het bedenken van nieuwe experimenten. Ik heb ontzettend veel geleerd van je (snelle!) manier van denken en verbanden leggen, en van de wijze waarop je onderzoek en resultaten uitlegt en presenteert. Je enthousiasme is bewonderenswaardig. Ik heb genoten van elk experiment dat ik ‘even’ moest doen en van alles dat nog ‘even’ gemeten moest worden, al verschillen we wel van mening over de tijdsduur van het begrip ‘even’. Uiteindelijk resulteerde het in mooie artikelen waar we trots op mogen zijn. Dankjewel voor je begeleiding en het stimuleren van mijn (wetenschappelijke) ontwikkeling!
De leden van de leescommissie, prof. dr. M. Brouwers, prof. dr. K. Schoonjans en prof. dr. J.A. Kuivenhoven, wil ik graag bedanken voor de tijd die zij hebben genomen om mijn proefschrift te lezen en te beoordelen. Leden van mijn PhD commissie, prof. dr. A.J.A. van de Sluis, prof. dr. T. Plösch en prof. dr. H.J. Verkade, bedankt voor jullie waardevolle input tijdens onze meetings. I would also like to thank dr. M.L. Eggersdorfer for your support and discussions during our meetings.
Graag wil ik ook alle PI’s van de afdeling bedanken: Karin, Marit, Barbara, Dirkjan, Hans, Janine, Henkjan, Kuif, Bart, Eline, Uwe, Alain, Debby, Kathrin, Klaas-Nico (MDL), Han (MDL). Bedankt voor jullie hulp, suggesties, discussies, feedback en vragen tijdens meetings. Speciale dank aan Bert voor de uitnodiging voor een sollicitatiegesprek in Groningen, nadat we elkaar hadden ontmoet bij Nutricia.
Zonder analisten geen PhD thesis. Trijnie, je hebt ontelbaar veel levers gecrusht, B&D’ers gedaan, RNA (en DNA!) samples geïsoleerd en qPCRs gepipetteerd. Zonder jouw werk was ik waarschijnlijk nog lang niet aan schrijven toegekomen. Dankjewel voor al je hulp, je rust (hoeveel samples het ook waren) en het houden van overzicht (jouw labjournaal en -80 lijst zijn eigenlijk de belangrijkste ‘referenties’ van dit proefschrift). Aycha, wat er ook gebeurt, jij blijft altijd vrolijk en behulpzaam voor iedereen. Je bent altijd in voor een grapje of een toepasselijke opmerking. Dankjewel voor je hulp in het lab en alle gezelligheid! Niels, jij weet altijd alles. Daarom kwam
2020 07 03 Boekje 1.0.indd 2152020 07 03 Boekje 1.0.indd 215 24/07/2020 21:1324/07/2020 21:13

216
Dankwoord
ik ook graag even bij je langs met een vraag, of gewoon om de laatste (lab)nieuwtjes te horen. Naast al je hulp in het lab ook bedankt voor de gezelligheid daarbuiten. Ik hoop dat we in de toekomst onze bier- (en bij mooi weer BBQ-) avondjes met nacho’s (natuurlijk uit de oven, hoe anders?!) gewoon doorzetten! Henk, zoals je zelf eens zei, zijn wij eigenlijk tweeling met een paar jaar ertussen. Je hebt een geweldig gevoel voor humor en je zorgde er vaak voor dat ik met een glimlach door het lab liep. Dankjewel voor je hulp, met name voor het doen van de luciferase assays toen ik al in Lille zat. Renze, Angelika, Martijn K, Theo B, Ingrid, Roos, Milaine, Niels K, Mirjam, Albert, Eline, Ydwine, Nicolette, Marieke, Tjasso, Jeanette, Manon en Dianne, dankjewel voor al jullie hulp en de gezelligheid op het lab.
Vincent en Theo, ‘buurmannen’, een speciaal dankwoord voor jullie. Of dit op eigen verzoek is, laten we maar even in het midden. Vincent, zoals voor de meeste PhD studenten, was statistiek ook voor mij een uitdaging en klopte ik dus regelmatig bij je aan voor uitleg. Daarnaast was het fijn dat je mee dacht met het onderzoek, wat meestal begon met een recente paper in de mailbox, en resulteerde in veel mailtjes over en weer, hypotheses, en nog meer papers. Dankjewel ook dat je me introduceerde in de wereld van MathInspector en ChIP-seq databases! Theo, natuurlijk heb je veel voor me gerekend aan de lipogenese en cholesterol data, dankjewel daarvoor. Maar wat ik eigenlijk nog meer waardeerde, waren de (voor mij vroege) ochtenden op het CDP voor de S4048 proeven. Lijnen vullen, pompen op druk brengen, muizen aansluiten, glucoses meten, en ondertussen een beetje kletsen. Zo samen de proef opstarten beviel me prima! Vincent en Theo, dank jullie wel voor jullie hulp, voor het lezen en corrigeren van de manuscripten en voor de discussies en (soms kritische) vragen. Vooral ook dank voor de gesprekjes over allerlei zaken die niet direct met het onderzoek te maken hadden. Ik vond het altijd gezellig om nog even te blijven hangen voor een praatje. Zoals het spreekwoord luidt: ‘Een goede buur is beter dan een verre vriend’.
Hilde, Paula, Evelien en Gea, bedankt voor jullie hulp bij alles wat geregeld moest worden en voor de gezelligheid tussen de regel-dingen door.
Ook wil ik graag alle medewerkers van het CDP bedanken voor jullie hulp en het verzorgen van de dieren. Ar, Gerward en Achmed Youfi (hey, hoe ist?!), dank jullie wel dat jullie vaak de tijd namen om even een praatje te maken!
A major thanks to the Oosterveer group and all other colleagues. Martijn, ik weet zeker dat zowel jij als ik het opofferen van de muizen van jouw eerste dierproef niet snel zullen vergeten! Angela, ik heb respect voor jouw doorzettingsvermogen bij al die lange programming proeven. Ik hoop dat het uiteindelijk mooie resultaten oplevert! Kishore, you are an enthousiastic and (seemingly) always happy researcher. Yu, thanks for your help and good luck with your new job! Fabian, jij doet veel
2020 07 03 Boekje 1.0.indd 2162020 07 03 Boekje 1.0.indd 216 24/07/2020 21:1324/07/2020 21:13

217
7
Acknowledgements
tegelijk, maar hebt ook altijd tijd voor een gezellig praatje. Succes met het afronden van jouw thesis. Office mates Rumei, Jing, Mengfan, Josie, Sandra, Archie, Antonio, Marcella, Marleen S, thank you for sharing the office and cookies, cakes, talks, laughter, complaints and stories. Archie, I liked making jokes with you, and I especially remember our ‘candlelight dinner’ and your facial expression when you discovered Ctrl+Shift+T. Good luck with finishing your thesis! Onne (wie had gedacht dat we op dezelfde dag zouden promoveren? Succes!), Mirjam, Rima, Congzhuo, Raphael, Dorieke, Hilde, Lori, Maaike B (sommige woorden hoorde ik voor het eerst, toen je mij een middagje hielp op het CDP…), Andrea (op naar nog veel domibo’s en biertochten!), Anna B, Anna P, Karen (jij was altijd in voor een vrijmibo), Danial (thanks for all the conversations in the lab, while I was pipetting 348-wells plates), Juifang (you were so brave to try foie gras… let’s have dinner together again, when you visit Lille!), Ivo, Ana (I always think of unicorns when I see you), Esther, Ali, Fabio (our office was almost your ‘second home’), Turu, Fan, Dicky, Tim, Alfredo, Sara, Agnieska, Anne-Claire, Stijn, Venetia, Anouk, Melinde, Andries, Christy, Chris, Frederico, Natalia, Willemien, Dyonne, Lars, Ulrike, Alex, Marti, Marcel, Mathilda en, niet te vergeten, Otto (altijd even de deur open houden), thank you all for the good times that we shared.
Beste paranimfen, beste Marleen en Rick. Marleen, onze PhD’s liepen ongeveer gelijk op, en naast elkaar helpen in het lab en op het CDP, konden we ook altijd onze ervaringen en frustraties bij elkaar kwijt. Het samen eten, sporten en ‘sporten’, en de vrijmibo waren een belangrijk onderdeel van mijn tijd in Groningen, en ik mis het nu ik in Lille zit (leuk dat je er een weekendje was)! Ik denk met veel plezier terug aan onze vakanties (al is vakantie voorafgaand aan een congres niet perse aan te raden). Foto’s maken is niet aan mij besteed, maar jij hebt dit ruimschoots gecompenseerd. Dankjewel voor de vriendschap, voor de gezelligheid en dankjewel dat je mijn paranimf wilt zijn. Succes met het afronden van jouw thesis, dat gaat je vast en zeker lukken! Rick, de planning van mijn eerste galcanulatie staat me nog vers in het geheugen (HALLO), en het was het begin van 4 jaar gezelligheid, mooie gesprekken, leerzame momenten en vele uren CDP. Ik heb genoten van alle experimenten die we samen deden, voorafgegaan door koffie, afgesloten met koffie en koekjes (vooral de koekjes zijn belangrijk), en daar tussenin veel lachen en praten en, oh ja, ook nog doorwerken. Je hebt mijn muzikale en literaire kennis wat bijgeschaafd en aangevuld met jouw favorieten, en gelukkig ben je daar niet mee gestopt nu ik in Lille zit. Dankjewel voor onze gesprekken en ‘evalulaties’ (al dan niet onder het genot van een speciaal biertje) en voor onze vriendschap. Ik weet dat ik je ermee verraste, maar ik ben blij dat je mijn paranimf wilt zijn!
Ik wil ook graag mijn vrienden en familie bedanken. Kiki, wat fijn dat we onze etentjes (en de koek en kaassoep wil ik hier ook graag even noemen) gewoon door
2020 07 03 Boekje 1.0.indd 2172020 07 03 Boekje 1.0.indd 217 24/07/2020 21:1324/07/2020 21:13

218
Dankwoord
konden zetten in Groningen omdat jij hier ook je PhD ging doen! Jouw traject had op allerlei vlak wat meer hobbels dan het mijne, en ik ben dan ook ontzettend trots op je dat je alles goed afgerond hebt. Nick, wij zijn vooral heel goed in Carcassonne spelen en dan (bijna) vergeten dat er ook andere mensen mee doen. En ik denk altijd nog lachend terug aan onze fitness sessies in Wageningen. Nick & Kiki en Lena (en Muts en Muppet), bedankt voor jullie vriendschap en nodige momenten van ontspanning tijdens mijn PhD! Astrid, jij bent altijd in voor een dagje shoppen, een etentje of uitje. Dankjewel voor je positiviteit en gezelligheid, en jij bent de volgende die promoveert! Berdien & Jakob, al we zien elkaar wat minder vaak, het is altijd gezellig!
Eline, Jojanneke, Adriaan, Emmelie, Amanda, bedankt voor jullie interesse in mijn onderzoek en de weekendjes Groningen (of Rotterdam). Iets plannen is soms ingewikkeld omdat we verspreid over Nederland wonen, maar het is altijd fijn om elkaar weer te zien!
Rick & Janke, dank jullie wel voor alle gezelligheid en mooie gesprekken tijdens de ‘domibo’s’ en HAVING A parties. Hopelijk volgen er nog veel meer!
‘Schone familie’, dank jullie wel voor het warme welkom, de ‘sappies’ en de gezelligheid. Ik hoop dat ik nog eens (West-)Fries leer praten (en verstaan)!
Lieve papa en mama, dankjewel voor alles wat jullie voor mij hebben gedaan, en nog steeds doen. Dankjewel voor jullie steun en de interesse in het hele promotietraject, jullie hebben me altijd het vertrouwen gegeven ‘dat het vast wel zou lukken’. Qua afstand kon ik niet verder van Zeeland vandaan zijn en de ritjes Groningen-Zeeland werden wat spaarzamer naarmate mijn PhD vorderde, maar ook in Groningen blijf ik toch ‘een trotse Zeeuwse’. Rinus & Anique (het is heerlijk om altijd alles met je te kunnen delen en dan jouw nuchtere antwoorden te horen), Gerard (met jou kan ik altijd lachen en een beetje ‘klieren’) & Carly, Arinda (mijn jongste zusje; ik ben ontzettend trots op jou!), Henk (na jouw geboorte kwam ik er al vrij snel achter dat er werkende flitspalen op de ring van Groningen staan), Leen, Cora en Marthe, dank jullie wel voor alle fijne momenten samen, in Zeeland of in Groningen.
Tot slot wil ik graag Jan Freark bedanken. Lieve JF, onze eerste ‘kennismaking’ was via jouw promotiefilmpje. Men zegt dat de eerste indruk bepalend is, en misschien is dat ook wel zo. Ik kon altijd bij je terecht voor lab-gerelateerde vragen, maar liever nog voor lab-ongerelateerde dingen als (steeds langere) koffiepauzes, een biertje, pizza (wanneer ik wat langer door werkte, kostte het je weinig moeite om mij over te halen) en BBQ. Je gevoel voor humor, je relativeringsvermogen en nuchtere kijk op alles was (en is) belangrijk voor me. Dat we nu alweer een tijdje samen zijn verraste nagenoeg niemand. Dankjewel voor de steun die je me gaf tijdens mijn PhD en in
2020 07 03 Boekje 1.0.indd 2182020 07 03 Boekje 1.0.indd 218 24/07/2020 21:1324/07/2020 21:13

219
7
Acknowledgements
de afrondende fase daarvan. Ook voor het voorzichtig afdwingen van onze vakantie; de Trolltunga beklimmen doen we zeker nog eens (zonder garantie, maar misschien starten we dan nog iets vroeger)! Dankjewel voor je support bij het nadenken over, en het doen van een postdoc. Deze tijd van ‘weekendjes’ komen we wel door. Ik kijk er naar uit om straks ‘echt’ samen te zijn!
2020 07 03 Boekje 1.0.indd 2192020 07 03 Boekje 1.0.indd 219 24/07/2020 21:1324/07/2020 21:13