
2019 Annual Report and Accounts - Hasbro Investor Relations
192
2019 Annual Report and Accounts creativity Unlocking the power & value of
-
Upload
khangminh22 -
Category
Documents
-
view
0 -
download
0
Transcript of 2019 Annual Report and Accounts - Hasbro Investor Relations

2019 Annual Report and Accounts
creativity
Unlocking the power & value of

We are focused on building the leading talent-driven, platform-agnostic entertainment company in the world. Through our deep creative relationships we are able to produce the highest quality content for the world’s markets.
We are powered by global reach, scale and local market knowledge to generate maximum value for this content.

Strategic Report
Governance
Financial Statements
Unlocking the power & value of creativity
02 66
04 68
06 70
10 78
8620
9022
118 24
26
122
28 127
36 131
46
51 Visit our website: entertainmentone.com
58
At a glance Corporate governance
Chairman’s statement Board of Directors
Chief Executive Officer’s review Corporate governance report
Unlocking the power Audit Committee report
& value of creativityNomination Committee report
Market ReviewDirectors’ Remuneration report
Business ModelDirectors’ report:
Strategy additional information
Key performance indicators
Independent auditor’s report
Family & Brands Consolidated financial statements
Film, Television & Music Notes to the consolidated financial
statementsFinance review
Principal risks and uncertainties
Corporate responsibility
Strategic report Governance
Financial statements
Business review
Unlocking the
value of originality
p.10
Unlocking the
power of creativity
p.12
Unlocking the
value of direction
p.14
Unlocking the
power of storytelling
p.16
Unlocking the
value of talent
p.18
SR
G
FS
1entertainmentone.com

AT A GLANCE
Strong growth in underlying EBITDA in FY19 up 21% to £198 million, with EBITDA margin up 510 basis points to 21.0%
Family & Brands continue to deliver strong growth in revenue and underlying EBITDA
Film, Television & Music earnings mix rebalancing towards television and music activities
Acquisitions during the year secure additional creative and management talent as well as global content rights
US$6msavings realised through to FY19 due to the integration of Television & Film divisions
US$2.0bnindependent valuation of the content library(FY18: US$1.7bn)
US$2.5bnFamily & Brands retail sales (FY18: US$2.4bn)
60funded television projects currently in development
Performance highlights
eOne Annual Report and Accounts 20192

Revenue Adjusted diluted Underly gin EBITDAearnings per share
Dividend Profit before tax Net debt
1
2
£941.2 million £197.6 million25.0 pence
1.5 pence £36.8 million £341.5 million
-9% (2018: £1,029.0m) +21% (2018: £163.6m)
+30% (2018: £19.3p)
+7% (2018: 1.4p) £28.1m lower (2018: £64.9m) £27.0m higher (2018: £314.5m)
Alternative performance measures
We use both statutory and adjusted measures in our strategic report. A �ull reconciliation between our reported and adjusted results is provided in our Appendix
to the Consolidated Financial Statements on page 183.
Reported 2018 amounts have been restated �or IFRS 15 , re�er to Note 1 o� the Consolidated Financial Statements �or
more details.
1. Revenue in FY15, FY16 and FY17 is presented under IAS 18. Revenue in FY18 and FY19 is presented applying IFRS 15
2. Decrease in pro�t be�ore tax driven by year-on-year increase in one-of items o� £60.9 million, mainly driven by the closure o� the Group’s physical home
entertainment operations.
Revenue from Contracts with Customers
Revenue from Contracts with Customers
15 16 17 18 19 15 16 17 18 19 15 16 17 18 19
15 16 17 18 19 15 16 17 18 19 15 16 17 18 19
7.2
80,
1
0.9
20,
1
2.1
495.
58
7
.72
08
0.5
2
.80
2
0.0
2
4.91
3.91
5.14.
13.1
.211.
1
.67
91
6.3
61
2.0
61.1
9213.
701
5.1
43
5.41
3
.94
6
9.4
22
9.7
4
.04
4
4.7
81
8.0
81
9.5
3
8.6
3
SR
G
FS
3entertainmentone.com

CHAIRMAN’S STATEMENT
Vibrant, dynamic content markets
Entertainment One is now positioned at the heart of a mid-roll, rather like linear broadcast but for premium
vibrant content ecosystem – no mean feat as we look advertisers. Other broadcasters are uniting to launch
back on a dynamic industry that has seen the pace of new subscription-based themed channels outside their
change accelerate over the last few years. There are few domestic markets, such as Britbox, a joint venture
signs that this rate of evolution will abate any time soon. between ITV and BBC for British content available
We have commented regularly on how consumers are only in North America.
increasingly taking greater control of their content
choices, demanding the very best films and television We have also seen major new entrants in the market.
shows to consume at a time and place of their In November 2019, Disney will launch its new Disney +
convenience. This is particularly true among the younger subscription service, which combines content from Walt
viewing audiences, who are using mobile handsets and Disney Studios and Walt Disney Television. As well as
tablets as their primary entertainment device. offering its catalogue of content to subscribers it will also
develop new films and television shows for the platform,
To satisfy this demand the number of new platforms continuing to work in partnership with independent
continues to rise and consumers are faced with a diverse producers such as Entertainment One. Apple is also
and often confusing range of viewing options. Linear entering the market following the announcement of
broadcasters and pay-TV networks continue to be the launch of its Apple TV+ SVOD service this autumn.
challenged as the subscription video on demand (SVOD)
platforms evolve their models from pure streaming to This is just a snapshot of the vibrancy of our marketplace.
now offer download capabilities and access to Yet, despite all the changes taking place one thing
agg gre ated channels via top-up subscriptions ( for remains constant – the demand for the best quality
example Amazon Prime Video subscribers can now content. Entertainment One remains unwaveringly
access add-on channels such as Discovery, ITV Hub, focused on satisfying this demand by continuing to build
StarzPlay and Eurosport). Google continues to develop relationships with the best content producers across
YouTube advertiser funded VOD (AVOD) and premium family, film, television and music to unlock the power
subscription-based channels. Some broadcasters, such and value of content. Our platform-agnostic approach
as UK’s Channel 4, are launching new broadcast video enables us to work with any broadcaster, network or
on demand (BVOD) services to allow users to access digital platform, with our extensive sales presence
streaming content that has advertising breaks embedded providing deep customer reach around the world.
4
Unlocking the power and value of creativity
The creative industries are going through
an unprecedented period of transition
and change, with new entrants to the
market creating attractive opportunities
and novel ways for us to do business.
Entertainment One remains focused on
developing relationships with the best
creatives in the industry, s ppu orted by
our deep customer reach.
eOne Annual Report and Accounts 2019

Operational highlightsIn this year’s Annual Report and Accounts we are pleased to report another record year of underlying EBITDA performance for our company, with strong adjusted earnings per share growth of 30%. This reflects both the dynamic market conditions we have highlighted above but also the changes management has brought about during the period to align ourselves fully with our creative talent partners, content buying customers and consumer audiences.
The Family & Brands business continues to consolidate its position as one of the leading pre-school brands businesses in the world today. Both Peppa Pig and PJ Masks have been fully launched to broadcast audiences in China across cable and SVOD networks and consumer launches for each brand have taken place. In particular, engagement around the Peppa Pig property has been enhanced through the release of the Peppa Pig Celebrates Chinese New Year film and the opening of the first Peppa Pig World of Play through our partner Merlin Entertainments with Dallas following soon after. Further Peppa Pig World of Play locations are being planned alongside other experiential formats.
Our Film, Television & Music businesses also experienced a successful year. Over the last two years we have transitioned our film operations away from distribution activities towards production as industry dynamics have changed. This process is now largely completed and the financial benefits of improved box office performance and generation of cost savings are coming through as expected. As we focus on further reducing the slate of film releases to a run-rate of 35 to 40 unique titles per annum, our strategy remains on developing a slate of high quality, lower risk titles aimed at more targeted audiences.
Our television businesses have experienced a busy period, with over 1,100 half hours of produced/acquired content delivered to our partners, making us one of the largest independent producers of content in Hollywood. Our key television series have been recommissioned for additional series and we have also developed a slate of new scripted shows that have been sold extensively into the international market, such as The Rookie. In tandem, our unscripted television business has continued its resurgence, led by shows such as Ex on the Beach, Siesta Key and Naked and Afraid. Across our television businesses we have over 60 exciting development projects in our pipeline, working with a range of
traditional and digital networks. Our music business has performed strongly and we were excited to welcome the Audio Networks team to eOne following the conclusion of the financial year.
Shareholder engagementAn active dialogue with shareholders is an important aspect to any publicly-listed company’s governance responsibilities. Following the 2018 Annual General Meeting, we have undertaken a shareholder engagement programme led by our Senior Independent Director, Mark Opzoomer. We continue to evaluate the information gathered during the process and we would like to thank our shareholders for their feedback. You can find more details in the Corporate governance report.
Our peopleMy final words, as ever, are reserved for the people at Entertainment One. The diverse range of skills, experience and knowledge across our offices around the world gives the Company its unique can-do culture. A skilled, passionate and fully-engaged workforce at all levels of the Company brings both social and economic benefits to our trading partners, our shareholders and the communities in which we operate; we work tirelessly to promote the right environment for this culture to develop and flourish. Our people are encouraged to engage in and contribute socially across our businesses – through formal activities such as our Diversity Council and Pride and Sustainability groups, as well as through smaller regional activities under the umbrella of eOne Community. eOne Gives Back initiatives support global and local charities as well as promoting environmental best practices and healthy, sustainable lifestyles. These initiatives are covered in more detail in the Corporate responsibility section of this Annual Report.
To conclude, we reflect on a period of significant change across our industries and are pleased that Entertainment One has not only remained an important creative force but has furthermore carved out new opportunities in new territories. This is testament to the strength of our creative relationships, the leadership of the senior management team and the talent of our people. We therefore look forward to the coming year and beyond with confidence and anticipate that we will continue our consistent track record of growth.
Allan LeightonNon-executive Chairman
SR
G
FS
5entertainmentone.com

CHIEF EXECUTIVE OFFICER’S REVIEW
The work and organisational shi�ts that
we have accomplished over the last �ew
years have positioned the business well
in the marketplace, as we rein�orced
our content creation and ownership
anchor and expanded our end-to-end
capabilities to ensure we maximise our
ability to unlock the power and value
o� creativity.
Operational highlights Financial highlights
Family & Brands continued to deliver strong revenue Group reported revenue of £941.2 million
up 28% and underlying EBITDA growth up 37% from (2018: £1,029.0 million) was 9% lower year-on-year (also
its key brands through a mix of high margin advertising 9% lower on a constant currency basis retranslating prior
video on demand (AVOD) and subscription video on year reported financials at current year foreign exchange
demand (SVOD) platform revenues and licensing and rates) reflecting strong growth in Family & Brands (28%
merchandising (L&M) sales. Retail sales grew by 6% higher) and lower revenue in Film, Television & Music
in the year to US$2.5 billion with a broader consumer (13% lower) expected as part of the Group’s transition to
roll out of our brands still to come. a production focus. The growth in Family & Brands was
driven by continued strong performance of ,
Film, Television & Music underlying EBITDA grew 9% with significant growth from and the delivery of new
margins improving by 300 basis points to 14.6%, due to show, . The decline in
the changing mix towards television and music and the Film, Television & Music was predominantly the result of
fewer film releases, home entertainment market decline, positive impact of cost savings. The integration of our
Film and Television Divisions is completed and is on track and scripted television slate composition, partly offset
to deliver £13-15 million in annualised cost savings by the by a 30% increase in music revenue.
end of FY20. Transition in film is now largely complete,
with a reduced slate of high quality titles delivering a 56% Group reported underlying EBITDA was 21% higher
increase in average box office revenue per release. at £197.6 million (2018: £163.6 million), driven by strong
growth in Family & Brands (37% higher) and increase
The acquisition of Audio Network, one of the world’s in Film, Television & Music (9% higher). Alongside the
largest independent creators and publishers of orig increase in revenue, the growth in Family & Brands was inal,
high quality music for use in film, television, advertising driven by improved underlying EBITDA margin as a larger
and digital media took place immediately after the year portion of revenue was generated from AVOD and SVOD
end. The business brings high growth, high margin, platforms which have higher margins. The Film, Television
recurring revenues and significant cash generation to & Music increase was driven by the improved profitability
the Group as well as attractive revenue opportunities on television shows, increased high margin royalty income
in combination with our existing music activities. from television library participations, increased music
revenue and operating costs savings of around £5 million
(approximately £6 million in aggregate through FY19).
6
Peppa Pig
PJ Masks
Cupcake & Dino: General Services
Strong earnings growth delivered, confdent outlook
eOne Annual Report and Accounts 2019

This was partly offset by the impact of the lower transactional revenue driven by fewer releases and market decline. The underlying EBITDA margin increased by 510 basis points driven by the increased margin in both Divisions and as the higher margin Family & Brands Division is a greater proportion of the Group’s underlying EBITDA than the prior year. On a constant currency basis, Group underlying EBITDA increased by 19%.
Net cash generated from operating activities amounted to £30.0 million in comparison to £14.9 million in the prior year, reflecting lower investment in content and increase in operating performance.
Adjusted diluted earnings per share were 25.0 pence (2018: 19.3 pence). On a reported basis, diluted earnings per share were 2.5 pence (2018: 12.0 pence) reflecting the higher one-off charges.
Strategic progressIn tandem with the financial performance during the period, the Group has made solid progress against its strategy.
Family & Brands:
• As Peppa Pig celebrates its 15th birthday in 2019 the brand continues to deliver a steady consumer performance in key markets like the UK and the US, where it has become evergreen
• Chinese audiences continue to embrace the Peppa Pig brand and we generated strong SVOD revenues in the year
• We continue to fully roll out the Peppa Pig consumer products programme across our markets as well as developing new revenue opportunities in SVOD and experiential initiatives. These drive incremental brand engagement
• PJ Masks is consolidating its position as a global brand following its successful consumer roll out across the US, Europe and Asia. In China, in addition to SVOD exposure, the brand is now carried on the nationwide television broadcaster CCTV and is positioned well for the upcoming broad consumer products roll out in the territory
• New content is a key driver of engagement and we continue to produce and deliver episodes of both brands globally. There are 117 new episodes of Peppa Pig in production which will air up to 2023, PJ Masks season 3 was delivered to Disney during FY19 and season 4 is in pre-production. This ensures a steady supply of fresh, high quality content over the medium term
• The Group’s next global pre-school brand, Ricky Zoom, will be launched on SVOD in China in summer 2019, followed shortly thereafter by a single global launch before the end of the year. We plan to build brand traction for the consumer products launch starting in spring/summer 2020
Adjusted profit before tax for the year was up £25.7 million to £155.9 million (2018: £130.2 million), due to the increase in underlying EBITDA, partly offset by increased net finance costs reflecting the higher average debt levels year-on-year primarily arising from the March 2018 acquisition of the remaining 49% interest in The Mark Gordon Company. Reported profit before tax for the year was £36.8 million (2018: £64.9 million), impacted by higher one-off charges of £68.0 million (2018: £7.1 million) with the increase primarily relating to the impairment of certain assets within the film distribution businesses which is detailed in the financial review section, partly offset by the increased underlying EBITDA.
Our underlying EBITDA for FY19 is testament to our future-facing strategy, the breadth of our portfolio and platform-agnostic approach and reflects our stronger position in the market. We remain focused on building the leading talent-driven entertainment company in the world and are confident that in the period ahead we will continue to attract outstanding talent and deliver the highest quality content across all areas of our business.
SR
G
FS
7entertainmentone.com

CHIEF EXECUTIVE OFFICER’S REVIEW CONTINUED
Film, Television & Music:
• Television markets worldwide remain buoyant and our strong relationships with both creative talent and content buyers have consolidated our position as a leading independent content producer in the industry delivering over 1,100 half hours of produced/acquired content in FY19
• Our focus on quality content has been unwavering during a period of rapid change across our industries. Despite the transition in film, we experienced critical acclaim with films such as Green Book, Vice and Stan & Ollie and looking ahead the slate has exciting films from creative and strategic partners including Guillermo Del Toro, Brad Weston, David Ayer and Chris Long, Annapurna and Amblin
• Our television operations continue to ramp up with fresh, new shows from established partners and up-and-coming talent ordered by networks during the year across both scripted and unscripted. The development pipeline is very active with over 60 projects set up for development across a broad range of traditional and digital networks
• Our music operations have been significantly enhanced following the acquisition of Audio Network, one of the world’s largest independent creators and publishers of original high quality music for use in film, television, advertising and digital media
• Successful release slate of music during the year, with number one albums from artists across multiple genres. Nurturing new talent alongside our established acts is also progressing with latest breakthrough talent Blueface generating global success with the hit song Thotiana
• The addition of quality content and the greater value being ascribed to rights drove a significant increase in the independent FY18 valuation of the Group’s content library to US$2.0 billion (2017: US$1.7 billion)
Corporate:
In April 2019 eOne acquired UK-based Audio Network, one of the world’s largest independent creators and publishers of original high quality music for use in film, television, advertising and digital media. The Group paid a consideration of £179 million (which included £13 million of cash and cash equivalents on Audio Network’s balance sheet), financed through a mix of new equity issuance and debt. Audio Network enhances eOne’s
presence in a rapidly growing sector within music, delivering attractive growth that is complementary to eOne’s music, film, television and family brands businesses. Audio Network’s business model is based on generating revenues through synchronisation (‘sync’) fees and music publishing royalties. This attractive mix of recurring, high margin revenues enables Audio Network to deliver underlying EBITDA margins of around 35% and to achieve a conversion rate of underlying EBITDA to free cash flow of approximately 90% in FY18.
Audio Network brings longstanding partnerships with more than 1,000 artists and composers and a high quality library of over 150,000 instrumental and orchestral tracks to eOne’s library of around 40,000 commercial songs. We are excited by the prospect of integrating these libraries together on Audio Network’s proprietary music publishing platform to simplify music rights management and to generate incremental sync placement opportunities for eOne’s commercial artists. We can also now utilise Audio Network’s music content in eOne’s own film, television and family productions, bringing this activity largely in-house.
OutlookThe Family & Brands Division is expected to continue to generate strong revenue and underlying EBITDA growth across the portfolio in FY20. It is also expected that underlying EBITDA margin will be slightly reduced due to revenue stream mix and investment in additional infrastructure necessary to facilitate continued growth and to support brand longevity.
Key operational drivers for Peppa Pig:
• Revenue mix: Peppa Pig SVOD and AVOD revenues are expected to remain at a robust level as season 7 launches
• Broader consumer roll outs: Peppa Pig L&M growth is expected from wider consumer product roll outs in China, rest of Asia and Germany. The US is expected to grow incrementally supported by retail promotions for the toy category and new clothing licensees. In the UK, the brand celebrates its 15th year anniversary in May 2019, which will create new licensing opportunities in clothing and publishing
eOne Annual Report and Accounts 20198

Key operational drivers for PJ Masks:
• Content pipeline: PJ Masks season 3 started to air on Disney Channel in North America from April 2019 and throughout the year for other territories. Season 4 has been greenlit and is now in pre-production
• New PJ Masks ancillary toy lines will build upon its popularity as #2 ranked pre-school brand in the US toy market. Following its broadcasting debut in China in FY19, a wide consumer launch will take place in China in FY20
Ricky Zoom is scheduled for its broadcast debut in China on SVOD platform Youku in summer 2019, to be followed by a global broadcast launch in autumn/winter 2019 in all other territories simultaneously. The consumer products launch of the brand is anticipated to be spring/summer 2020 with global toy partner TOMY.
New comedy shows currently in production include Ninja Express, which already has major platforms attached in multiple territories around the world, and Alien TV for a global SVOD platform. Further properties are in development, across pre-school and older demographics.
In the Film & Television Division, the integration of operations is on track to generate £13-15 million of annualised cost savings by the end of FY20, from business efficiencies and centralisation of support functions from the combined operations to form a single, streamlined operating structure. Broadcast and licensing revenue is expected to increase driven by the ramp up of the scripted and unscripted television businesses and music is also expected to continue to grow organically and through the recent acquisition of Audio Network.
Key operational drivers:
• Our slate of targeted higher quality releases including eOne productions Queen & Slim produced by Makeready; Poms starring Diane Keaton and Jacki Weaver; Scary Stories to Tell in the Dark produced by Guillermo del Toro; and Wild Rose starring Jessie Buckley
• Output partner titles will include Amblin’s 1917 directed by Sam Mendes and starring Benedict Cumberbatch; and Annapurna Pictures’ Booksmart directed by Olivia Wilde
• Scripted television slate for FY20 will include Run (HBO), a new romantic comedic thriller; Nurses (Global in Canada and sold by eOne internationally); Albedo (Vudu, expected delivery in FY21), a mystery drama series; Deputy (Fox in the US and sold by eOne internationally), a new scripted drama primetime network series; and renewals of The Rookie (season 2), You Me Her (season 5) and Cardinal (season 4). International distribution of third party television titles will reduce as the AMC output deal has now ended for new productions. FY20 will include Fear the Walking Dead season 5 and The Walking Dead season 10
• Major unscripted title renewals include Growing Up Hip Hop, Siesta Key, Ex on the Beach, Naked and Afraid and Lady Gang
• In music, there are new album releases from The Lumineers, Wu-Tang and guitar legend Zakk Wylde in FY20
Independent library valuation
US$2.0 billion+18% (2017: £1.7 billion)
Figures as of 31 March for the respective years16 17 17 1815
1.2
1.1
1.3
1.7
2.0
Darren ThroopChief Executive Officer
SR
G
FS
9entertainmentone.com

Cedar Park Entertainment
eOne has had a long and fruitful relationship with
Cedar Park Entertainment’s co-founder Chris Long.
Until November 2017, Long served as
programming chief at AT&T Audience Network,
where he worked with eOne on the
development and production of such eOne
TV series as , .
In January 2018, Long and acclaimed filmmaker
David Ayer ( , ) formed indie
production studio Cedar Park Entertainment and
soon jumped into conversations with eOne about
partnering to develop and produce world-class
original programming.
Both eOne and Cedar Park are committed to
working with the best creative minds, putting
talent first and creating world-class, engaging
programming.
This partnership has resulted in police drama
, which has received a series order
from Fox. eOne and Cedar Park demonstrated
their commitment to talent by assembling a
top-notch roster of creatives. The series is written
by Will Beall, whose most recent credits include
the global blockbuster ; the pilot was
directed by Ayer and it stars Stephen Dorff, coming
off his widely praised lead role in .
eOne and Cedar Park are also currently in
production on , a four-part limited
docuseries for Showtime, executive produced by
global superstar Drake and business manager
Future the Prince.
The docuseries hails from rising talent Nick Boak
and Andrew Renzi ( ), with Renzi set to
direct. It explores the issues of post-military
service, including deportation and PTSD.
You Me Her Call Me Fitz and Ice
Bright Suicide Squad
The Deputy
Aquaman
True Detective
Ready For War
They Fight
Given this alignment in values,
in June 2018 Cedar Park
signed a two-year, first-look
deal with eOne to develop and
produce original television
programming across
multip gle enres.
fo
eul
av
eht
g
nikc
oln
uytil
ani
ro
ig
eOne Annual Report and Accounts 201910

Cedar Park’s The Deputy produced in partnership with eOne and sold to Fox.
SR
G
FS
11entertainmentone.com
fo r
ew
oe
ht
gnik
col
nu
pyti
vita
erc
12 eOne Annual Report and Accounts 2019
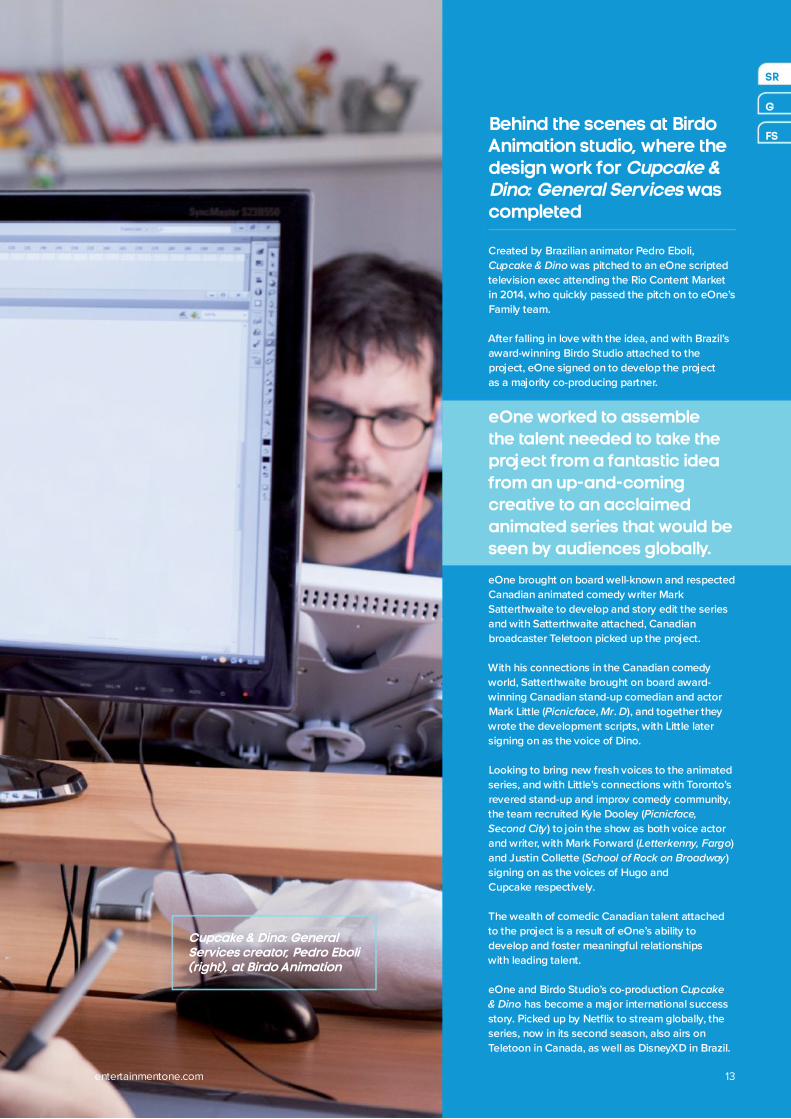
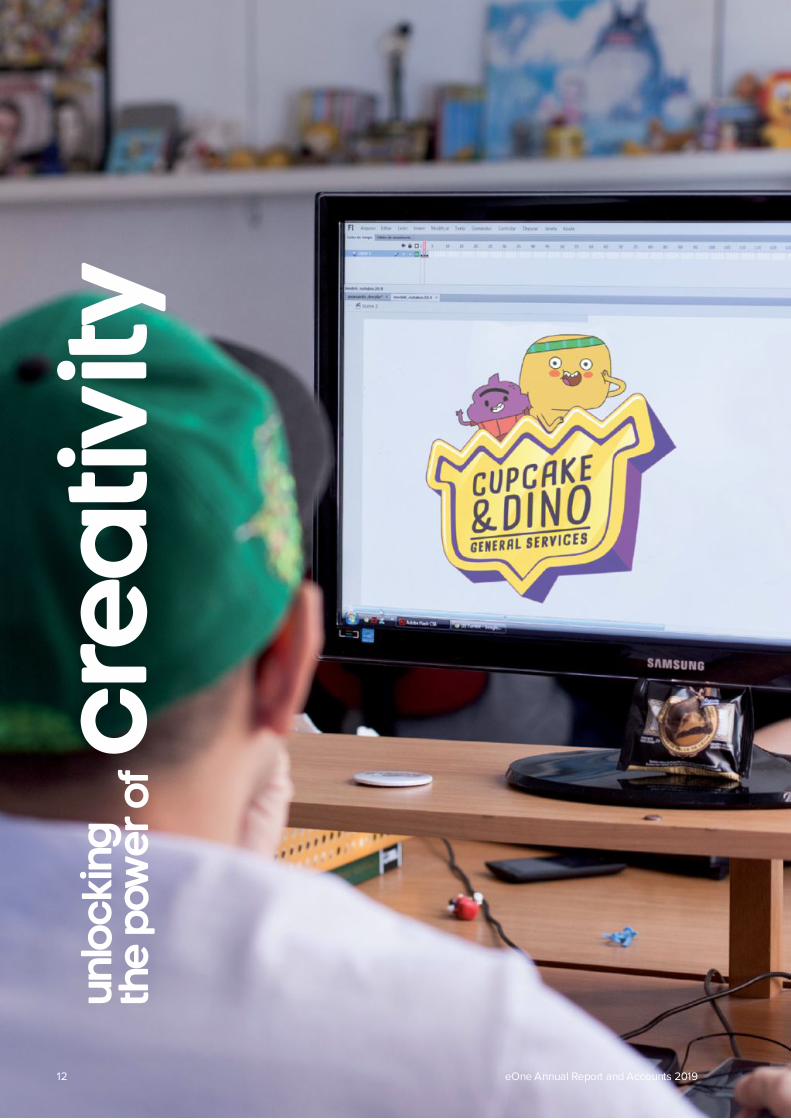
Cupcake & Dino: General Services creator, Pedro Eboli (right), at Birdo Animation
Behind the scenes at Birdo Animation studio, where the design work for
was completed
Cupcake & Dino: General Services
Created by Brazilian animator Pedro Eboli,
was pitched to an eOne scripted
television exec attending the Rio Content Market
in 2014, who quickly passed the pitch on to eOne’s
Family team.
After falling in love with the idea, and with Brazil’s
award-winning Birdo Studio attached to the
project, eOne signed on to develop the project
as a majority co-producing partner.
eOne brought on board well-known and respected
Canadian animated comedy writer Mark
Satterthwaite to develop and story edit the series
and with Satterthwaite attached, Canadian
broadcaster Teletoon picked up the project.
With his connections in the Canadian comedy
world, Satterthwaite brought on board award-
winning Canadian stand-up comedian and actor
Mark Little ( , . ), and together they
wrote the development scripts, with Little later
signing on as the voice of Dino.
Looking to bring new fresh voices to the animated
series, and with Little’s connections with Toronto’s
revered stand-up and improv comedy community,
the team recruited Kyle Dooley (
) to join the show as both voice actor
and writer, with Mark Forward ( )
and Justin Collette ( )
signing on as the voices of Hugo and
Cupcake respectively.
The wealth of comedic Canadian talent attached
to the project is a result of eOne’s ability to
develop and foster meaningful relationships
with leading talent.
eOne and Birdo Studio’s co-production
has become a major international success
story. Picked up by Netflix to stream globally, the
series, now in its second season, also airs on
Teletoon in Canada, as well as DisneyXD in Brazil.
Cupcake & Dino
Picnicface Mr D
Picnicface,
Second City
Letterkenny, Fargo
School of Rock on Broadway
Cupcake
& Dino
eOne worked to assemble the talent needed to take the project from a fantastic idea from an up-and-coming creative to an acclaimed animated series that would be seen by audiences globally.
SR
G
FS
entertainmentone.com 13
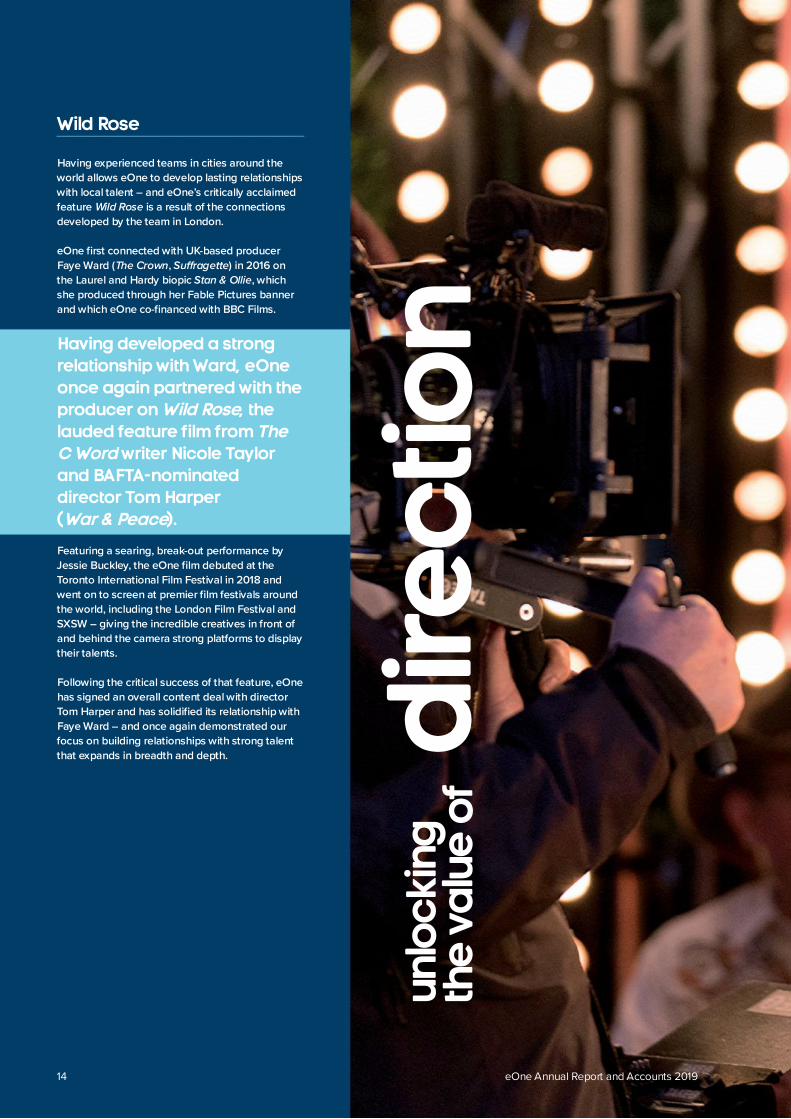
Wild Rose
Having experienced teams in cities around the
world allows eOne to develop lasting relationships
with local talent – and eOne’s critically acclaimed
feature is a result of the connections
developed by the team in London.
eOne first connected with UK-based producer
Faye Ward ( , ) in 2016 on
the Laurel and Hardy biopic , which
she produced through her Fable Pictures banner
and which eOne co-financed with BBC Films.
Featuring a searing, break-out performance by
Jessie Buckley, the eOne film debuted at the
Toronto International Film Festival in 2018 and
went on to screen at premier film festivals around
the world, including the London Film Festival and
SXSW – giving the incredible creatives in front of
and behind the camera strong platforms to display
their talents.
Following the critical success of that feature, eOne
has signed an overall content deal with director
Tom Harper and has solidified its relationship with
Faye Ward – and once again demonstrated our
focus on building relationships with strong talent
that expands in breadth and depth.
Wild Rose
The Crown Suffragette
Stan & Ollie
Having developed a strong relationship with Ward, eOne once again partnered with the producer on , the lauded feature film from
writer Nicole Taylor and BAFTA-nominated director Tom Harper ( ).
Wild Rose
War & Peace
The C Word
fo
eul
av e
ht
gni k
col
nu
noit
ceri
d
eOne Annual Report and Accounts 201914

Sophie Okonedo on the set of eOne film, Wild Rose
SR
G
FS
15entertainmentone.com

fo r
ew
oe
ht
gnik
col
nu
pg
nillet
yrots
eOne Annual Report and Accounts 201916

Peppa Pig artwork created specially for Chinese Year of the Pig, 2019
Extending into China. How we opened a new market for our biggest pre-school brand
Peppa Pig
is one of the top pre-school brands in the
world. Built on family values and early life experiences
for children, eOne believed that the brand would work
well in China and in 2014 started to prepare for the
brand’s cross-over into this important new market.
The groundwork started in June 2014 with the filing
of the copyright and trademark and then in early 2015,
the show was presented to CCTV, the national
State-operated television channel. then
debuted successfully in the autumn, and subsequently
across various digital viewing platforms such as
Youku, Tencent, iQIYI and Mango TV. eOne was able
to generate attractive, high margin SVOD deals for
exclusive bundles of episodes on these platforms.
In early 2016 eOne partnered with a local PR agency
to represent on the key WeChat platform,
launching the official WeChat channel supported by
regular bursts of animated emojis and relatable
content. We also created major PR campaigns with
WeChat, working with the British Embassy, charity
partners and digital influencers.
During this period of development, we also worked
closely with our partners in China and our legal team
to build and amplify our efforts against piracy. This is
an ongoing activity, with the appointment of a
dedicated eOne legal resource in 2017.
The global partnership with Merlin Entertainments
enabled us to open the world’s first World
of Play centre in Shanghai in October 2018, bringing
new experiences to children. Further
centres (as well as other experiential formats) are
planned both in China and in the US.
Local designers are regularly engaged to create
bespoke product and marketing assets for Chinese
audiences to ensure that key Chinese cultural
moments are represented in the show. These help
further engage audiences, consolidating the brand’s
position in the region.
Peppa Pig
Peppa Pig
Peppa Pig
Peppa Pig
Peppa Pig
More recently, we have created
brand new episodes of
specifically for our
content partners in China,
including an episode
celebrating the Chinese New
Year of the Pig in February 2019,
which introduced two new
characters, the Panda Twins.
Peppa Pig
SR
G
FS
17entertainmentone.com

Blueface
eOne strives to work with the best in their
respective fields, and eOne’s Chris Taylor (Global
President, Music and Alan Grunblatt (President,
Urban, Music) are two of the most dynamic
executives in the music business.
Having worked with such artists as Bone Thugs-N-
Harmony, Eazy-E and The Game, Grunblatt has
developed deep connections and extensive
experience in the Hip Hop arena, which is exactly
why rap manager Wack 100 came to Grunblatt
with a new discovery: Blueface.
Since signing the artist in late 2018, Grunblatt
and eOne’s global music team have helped
turn Blueface’s smash single into a
chart-topping, worldwide hit. The single’s videos
have been viewed millions of times on YouTube,
with other major artists including Cardi B. offering
their own remixes, while the single itself cracked
the Billboard Hot 100 Top 10.
In the UK, eOne’s Music team pushed to ensure
the hit got daytime airplay on BBC Radio 1 and
commercial radio stations, cementing
and Blueface’s status as pop culture mainstays.
This is just another example of how eOne, with
our global infrastructure and wealth of expertise,
can develop talent and propel them to the next
level on a global stage.
Knowing instinctively that the
artist was something special,
Grunblatt worked quickly to
sign Blueface to eOne.
Thotiana
Thotiana
fo
eul
av
eht
g
nikc
oln
ut
nel
at
eOne Annual Report and Accounts 201918

Breakthrough eOne music artist, Blueface
SR
G
FS
19entertainmentone.com

MARKET REVIEW
A changing industry value chain
New entrants and market consolidations
New entrants are both customers and competitors
Over the last decade the impact of
the SVOD p yla ers on the broadcast
industry has been profound.
Since 2007, Netflix has been the
driving force behind this growth
causing a crisis among the US
cable operators in 2010, when
cable subscription numbers shrank
for the first time and have
continued to fall by around 3% per
annum to 2018.
At the same time, the major
technology companies have grown
in scale as they have broadened
their offerings. Some, such as
Amazon and Google have started
to focus on content as drivers of
continued consumer engagement.
The traditional broadcasters and
studios are also responding by
launching their own digital-to-
consumer (D2C) services. Content
previously licensed by the studios
to the new digital entrants is now
being brought back to form the
core of these services, creating
content shortages across the
industry. As these become more
acute, there are exciting
opportunities for independent
producers to develop content to
meet this need.
Market capitalisation (US$bn)
Distribution
Content
Streaming media
31 March 2019
31 March 2010
Big tech Legacy media
US$3.3tr today
vs. US$0.5tr in 2010
05
9
09
8 82
8
78
4
161
US$1.0tr today vs. US$0.5tr in 2010
44
2
31
2
681 7
61
28
91
81 11
3
eOne Annual Report and Accounts 201920

Content spend to hit all time high
How we are responding
The SVOD p atfor s also offered l m
consumers a new content
proposition, investing billions of
dollars a year in new, exclusive
‘original’ series to feed binge-watchers
with a steady supply of new shows
to consume.
Content investment has accelerated
in recent years, and is expected
to reach US$110 billion in 2019 with
Netflix spending US$12 billion
in 2018, a number set to increase
to US$15 billion in 2019, according
to Wall Street analysts.
Entertainment One is a pure-play
content company. We have
transitioned the business away
from higher risk distribution
activities to focus on the
development and production of
global content rights, often created
in partnership with some of the
best content producers. The
Group’s sales team has deep reach
into content markets around
the world.
The launch of new D2C services
from both traditional networks and
technology companies intensifies
demand for the best quality
content. With its strong creative
relationships across the content
industry, track record of delivery
and financial scale,
Entertainment One remains
well-positioned to satisfy this
market dynamic.
Content spend (US$bn)
We are uniquely positioned to take advantage of the shifting marketplace
*
Pure-play content company Best talent in the business
More efficient allocation of capital
Risk mitigation
• •
•
• •
•
•
• •
•
• •
•
Migrate away from lower Strong relationships with some
margin distribution business of the best creatives in the film,
Increase focus on content television and music industries
Control global rights Track record of working in
Sell to all buyers partnership to produce content
Innovative deal structures
Streamlined eOne capital Source content early, ensuring
allocation processcontrol of budgets, creative,
Agnostic to film or television monetisation strategies
contentGlobal presence to maximise
Allows creative autonomythe value of content
Flexible production model,
supported by a strong balance
sheet
21
1 2
34
* Source: RBC Capital Markets
8.91
4.51
2.41
.041
.56
4.6 7.5 5.
4
4.4
0.4 7.
2
5.2
3.2 9.
0
8.0
.11
.01
.01
Expected US$107 billion spend
Netflix plans to release
700 original series, films
and specials this year.
SR
G
FS
entertainmentone.com

BUSINESS MODEL
Creating value through the power of content
What we do
eOne creates everlasting childhood memories
By carefully selecting, crafting and nurturing the very best children’s content into global brands, eOne connects with families around the world.
eOne creates winning content
Our brands and campaigns have been recognised by some of the most prestigious awards in the industry – BAFTA, International Emmy Kids Awards and The Licensing Awards, to name a few.
eOne develops, launches and rolls out products
From product development to international marketing, eOne brings brands to life from London, Toronto or Hong Kong, to Melbourne, New York and São Paolo.
Global reach, local expertise
Entertainment One develops key partnerships with top creative talent to influence every part of the movie business around the globe.
Creating world-class content with international appeal
Through strategic partnerships and a global distribution network, eOne produces and distributes premium television content across genres, platforms and territories.
Turning it up across the entire music industry
Putting talent first – musicians, writers and composers with production, talent management, licensing, publishing, distribution and live events.
Family & BrandseOne creates and develops a growing number of children’s brands, working with broadcast partners to launch these brands globally. The costs of production are typically covered by broadcast licence sales, but the bulk of the Division’s revenue and profit is generated from licensing and merchandising royalties from the sale of branded consumer products. In addition, the brands also generate a range of ancillary revenues such as advertising video on demand (AVOD) from platforms such as YouTube; subscription video on demand (SVOD) revenues from the sale of bundles of content to video streaming platforms such as Netflix or Tencent; live show revenues from ticket sales; and experiential revenues from partners such as Merlin Entertainments and Paultons Park.
Film, Television & MusiceOne is a producer of film and television content, working with creative partners to develop the best films and television shows. Using a production finance model (where films and television shows are pre-sold to distributors and broadcasters, networks and platforms) we can offset significant proportions of production risk and use third party capital and tax incentives to finance our production activities. We retain ownership of the content rights and sell them around the world through our extensive relationships with content buyers. The Group also acquires third party content. In television, we sell in-demand third party content internationally and in film we acquire territorial rights from high quality independent producers to distribute in our territories and global rights which are sold internationally. In music, we operate across recorded music, publishing, artist management and live events, generating fees and royalty revenues. The recent Audio Network acquisition adds professional music services to our capabilities, bringing us annually-recurring subscription revenues.
eOne Annual Report and Accounts 201922

Our key capabilities How we create value
Family & Brands
Family brands are leveraged into the licensing and merchandising markets through licence agreements with product manufacturers in certain consumer categories on a territory-by-territory basis to generate royalties for the Group. Ancillary revenues include advertising video on demand (AVOD) revenues from social media platforms, subscription video on demand (SVOD) licence fees from selling content to SVOD service providers globally, share of ticket revenues from live show and theme park attendances
Film
Film rights are sold to distributors in particular territories for minimum guarantees and overage participations
Television
Television rights are sold to broadcasters, networks and digital platforms for specific time periods on a territorial basis to generate broadcast licence fees
Music
Music activities generate a broad range of revenues from the sale of recorded music, digital streaming fees from subscription or advertising based content platforms, shares of artist revenues, music synchronisation fees (some of which are derived from subscriptions) and publishing royalties
Brand management
Artist management
Global content
sales
Music supervision
Licensing
Distribution
Apps
Production
Highest Quality Content
SR
G
FS
23entertainmentone.com

STRATEGY
Our strategy
The market for content rights continues to be driven by rapid changes in consumer behaviour, as audiences today expect the best content to be delivered to them in a format and at a time they dictate.
A home for talent We work in partnership with the world’s best creative talent across the film, television, family content and music industries. We work closely with them to bring the best talent-rich content to audiences around the world and share the benefits of success
High quality content creationThe combination of our relationships with talented creatives and our platform-agnostic approach propels us to develop and produce highly valued content across multiple media formats. This strategy enables us to work with all buyers of content from traditional cable television networks to digital subscription platforms
End-to-end capabiities We offer creative partners a full suite of capabilities to create opportunities to bring the best content and brands to market. Our extensive integrated infrastructure ensures projects are financed, supported and managed; and our deep broadcaster, network and platform relationships help optimise the monetisation of rights globally
Global rights ownership At the heart of everything we do is our growing library of high quality content rights that we monetise across the world. We make significant, risk-balanced investments in our content every year to drive earnings for today and to create a store of value for tomorrow
As industry participants adapt their businesses to service this demand, the ability to offer the very best content becomes
a critical success factor and plays to the Group’s strengths as a leading independent integrated platform-agnostic
content creator.
Focused on building the leading talent-driven entertainment company in the world, Entertainment One’s strategy to unlock
the power and value of content is built on four key pillars:
The successful implementation of this strategy has enabled us to create a balanced content and brand business with
sustainable revenue and underlying EBITDA growth across both of our Divisions.
eOne Annual Report and Accounts 201924

2019 STRATEGIC PROGRESS
Family & Brands Film, Television & Music
1,100 half hours of produced/acquired contentTelevision markets worldwide remain buoyant and our
strong relationships with both creative talent and content
buyers have consolidated our position as a leading
independent content producer in the industry, delivering
over 1,100 half hours of produced/acquired content in FY19
Multiple critically acclaimed filmsOur focus on quality content has been unwavering during
a period of rapid change across our industries. Despite the
transition in film, we experienced critical acclaim with films
such as Green Book and Stan & Ollie and looking ahead
the slate has exciting films from partners including
Guillermo Del Toro, Brad Weston, 21 Laps, Annapurna
and Amblin
Active pipeline with over 60 projects set upOur television operations are as busy as ever with fresh,
new television shows from both established partners and
up-and-coming talent being ordered by networks during
the year across both scripted and unscripted genres. The
development pipeline is very active with over 60 projects
set up for development across a broad range of traditional
and digital networks
Audio Network acquisitionOur music operations have been significantly enhanced
following the acquisition of Audio Network, one of the
world’s largest independent creators and publishers of
original high-quality music for use in film, television,
advertising and digital media
Global success with breakthrough talentSuccessful release slate of music during the year, with
number one albums from artists across multiple genres.
Nurturing new talent alongside our established acts is
also progressing with latest breakthrough talent Blueface
generating global success with the hit song Thotiana
15th birthday of Peppa PigAs Peppa Pig celebrates its 15th birthday in 2019 the brand
continues to deliver a steady consumer performance in
key markets like the UK and the US, where it has become
evergreen
Peppa Pig success in ChinaChinese audiences continue to embrace the Peppa Pig
brand and we have started to fully roll out the consumer
products programme in these markets as well as
developing new revenue opportunities in SVOD and
experiential initiatives. These drive incremental brand
engagement
PJ Masks global roll outPJ Masks is consolidating its position as a global brand
following its successful consumer roll out across the US,
Europe and Asia. In addition to SVOD exposure in China,
the brand is now carried on the nationwide cable
television service CCTV and is positioned well for the
upcoming broad consumer products roll out in the territory
Ensuring high quality contentNew content is a key driver of engagement and we
continue to produce and deliver episodes of both brands
globally. There are 117 new episodes of Peppa Pig in
production for delivery up to 2023 and PJ Masks season 3
was delivered to Disney during FY19. This ensures a
steady supply of fresh, high quality content over the
medium term
Ricky Zoom launch in 2019The Group’s next global pre-school brand, Ricky Zoom,
will be launched on SVOD in China in summer 2019,
followed shortly thereafter by a single global launch before
the end of the year. We plan to build brand traction for the
consumer products launch starting in spring/summer
2020
LibraryThe addition of quality content and the greater value being ascribed to rights drove a significant increase in the
independent FY18 valuation of the Group’s content library to US$2.0 billion (2017: US$1.7 billion)
SR
G
FS
25entertainmentone.com

KEY PERFORMANCE INDICATORS
Measuring our performanceeOne’s strategy is to build the leading talent-driven entertainment company in the world to enable us to unlock power and value of content. In practice this means that we work with the best creatives in the industry to develop and produce content rights that can be monetised in different ways across our global sales presence.
Our Family & Brands business has been built on developing great pre-school children’s content and then working in partnership with best-of-breed licensees in categories such as toys, apparel, footwear, stationery and publishing. Performance across the Division is a combination of the number of active licensing and marketing territories, the number of licensees operating across these territories, the number of products available for consumers to purchase in stores and the number of brands. Over the last year we have increased the number of live licensing and merchandising contracts and we look forward to the wide consumer product launches yet to come in key territories that will improve this number further in the coming year and beyond. As we launch additional global brands in the future, the number of licences should continue to increase, driving further revenue and earnings growth.
In Film, Television & Music the key driver to revenues for today and the value of our library for tomorrow is the investment we make every year to produce or acquire content rights. In line with our strategy to transition the film activities away from content acquisition and more towards content production, we have significantly reduced the amount of investment in acquired film content, whilst continuing to invest in our own production projects. This strategy will also drive a continued reduction in the number of unique film releases, this year totalling 57, compared to 85 last year.
In our television activities, the volume of production (indicated by the number of half hours of produced/acquired content) has once again increased, although the mix within this volume has shifted this year towards lower cost unscripted shows. This dynamic explains the reduction in the aggregate investment in television production in FY19, but we anticipate a return to growth for FY20 as we bring projects in our healthy development pipeline to market.
The independent valuation of the Group’s content library has increased once more, reflecting the investment we have been making in content and the value that this content attracts.
Management has developed a set of key performance indicators investors may use to track the health of the business. The key performance indicators can be summarised as follows:
eOne Annual Report and Accounts 201926

Overall Group
Family & Brands
Film, Television & Music
Underly gin EBITDA (£m) Net debt to Group underlying EBITDA leverage (£m)
Investment in acquired content and productions (£m)*
Live licensing and Retail revenue generated merchandising contracts (US$bn)
Half hours of produced/ Total investment in acquired acquired content content (£m)
Number of unique film releases
1,600 2.5
1,500 2.4
57
85
19 19
18 18
19
18
19 19
18 18
19 19
18 18
19
18
1,142 121.9**
887 144.5
* Before eliminations
** Includes investment in acquired content in music of £6.3 million (2018: £4.3 million)
197.6 1.7x
163.6 1.9x
380.6
441.9
SR
G
FS
27entertainmentone.com

Family & Brands
Olivier Dumont
President of Family & Brands
Family & Brands develops, produces and manages pre-school children’s character properties for global licensing and merchandising. Awareness of these brands is built through broadcast of the shows across traditional and, increasingly, digital platforms, with product licensing programmes launched when the brand has reached a high level of engagement with audiences.
FAMILY & BRANDS BUSINESS REVIEW
eOne Annual Report and Accounts 201928

1,600+live licensing and merchandising contracts(FY18: almost 1,500)
£158.5mFamily & Brands revenue
£97.0mFamily & Brands underlying EBITDA
US$2.5bnRetail sales across our brands(FY18 US$2.4bn)
1,100+new/renewed broadcast and licensing agreements
Contribution to Group revenueContribution to Group Revenue
Family & Brands
17%
up 39%PJ Masks licensing and merchandising total revenue in FY19 to £59.5 million
Contribution to underlying EBITDA*
Family & Brands
46%
* Before central costs
SR
G
FS
29entertainmentone.com

FAMILY & BRANDS BUSINESS REVIEW CONTINUED
Healthy licensing and merchandising marketsThe global licensed merchandise industry encompasses a number of broad categories, including apparel and footwear, toys and games, stationery and paper products, sporting goods, housewares, infant products, home furnishings, video games and software and publishing activities. The Licensing Letter in its Data Bank analysis suggests that global retail sales generated by licensed merchandise reached US$171.5 billion in 2017, up from US$167.5 billion in the previous year, growth of 2.4%.
North America remains the biggest licensing territory globally, representing 63.6% of retail sales at US$109.0 billion in 2017. Western Europe is the next largest territory, accounting for around 19.6% of global retail sales at US$33.6 billion, showing modest growth of 2.2% over 2016. Notably, Asia remains the biggest opportunity for licensed merchandise, its continued growth driven by Western brands (such as Peppa Pig) launching in the territory. Asia as a whole grew licensing retail sales by 3.4% in 2017 to reach a value of US$21.0 billion, with China representing US$7.3 billion of this total.
Analysis by product category reveals a consistent picture over the last few years. The largest category in 2017 was apparel and accessories, which accounted for 41% of global licensing retail sales, followed by toys (11%) and home furnishing (8%), similar proportions to 2016.
Entertainment One is focused on developing pre-school brands, so the most important product segments for the Company are toys, apparel and accessories and publishing. In its analysis of the pre-school market, The Licensing Letter estimates that in 2017 global retail sales in this pre-school segment totalled US$97.6 billion, up from US$95.6 billion in 2016. The revenue split by category shows that apparel and accessories is the largest category, representing about 71.4% of this total, with toys (which includes plush figures and playsets, key products for the Peppa Pig and PJ Masks brands) accounting for 19.2%.
Market backdrop
Global retail sales of licensed merchandise by territory (US$ billion)
Source: The Licensing Letter
Source: The Licensing Letter
Global retail sales of licensed merchandise by product
Apparel and accessories
41%
Toys11%
Home furnishings8%
Other25%
Stationery/paper 3%
Publishing5%
Food & beverage7%
0
20
40
60
80
100
120
140
160
180
11 12 13 14 15 16 17
US & Canada Europe Asia
Latin America Australia & New Zealand
Middle East & Africa
eOne Annual Report and Accounts 201930

A complex pre-school media market 3-4 year old age group
The UK is an important market for retail revenues from
licensed products. According to the international
Licensing Industry Merchandisers’ Association (LIMA),
the UK is the world’s second largest market on this basis
behind the US, generating revenues of US$14.0 billion
in 2017. One of the drivers to this success has been the
strength of the pre-school market, with our own
brand cited as a key ingredient. The eOne
Family & Brands model is built on creating attractive
brands that delight and entertain children, with revenue
driven by converting brand engagement to licensed
product purchases by family and friends.
The changing content consumption trends within the
dynamic media landscape support this engagement,
allowing the audiences for our brands to discover,
consume and enjoy our brands across a growing
number of platforms and formats.
A recent Ofcom Children and Parents: Media Use and
Attitudes Report, published in January 2019 by Ofcom
for the UK market, looked into the media lives of younger
consumers, discovering interesting trends in the way
different age groups use technology to access their
favourite content – often with light-touch parental control.
In the pre-school segment, Ofcom’s insights can be
summarised with snapshots:
31
Peppa Pig
Market developments
Source: Ofcom Children and Parents: Media Use and Attitudes Report 2018
19% have
their own tablet
30% watch television
shows on other devices
(typically a tablet)
52% go online for
almost 9 hours a week,
with 69% using a tablet
96% watch television
on a TV set for
14 hours a week
32% watch television
shows via
SVOD services
45% use YouTube,
with 80% citing cartoons
or funny videos as the
main reason
SR
G
FS
entertainmentone.com

FAMILY & BRANDS BUSINESS REVIEW CONTINUED
The Ofcom findings suggest that television viewing is
dominated by the television set and by tablets, driven
by a rise in the ownership of tablets across both
pre-school demographics; within the 5-7 age group 42%
had a tablet of their own in 2018, up from 35% in 2017.
As ownership has risen, the amount of content
consumed on tablets has risen – children aged 3-4 spent
around one hour less watching television shows on a TV
set in 2017 compared to 2016 and in 2017 BARB data
suggested 4-5 year old children watched just over 10
hours of television on a TV set per week. This ‘lost’ time
has been spent watching videos online or gaming.
New platforms are also claiming a share of television
viewing, with 32% of younger viewers able to access
services such as Netflix or Amazon Prime Video through
smart or connected television sets and mobile devices.
This has given them access to a broader range of
programming than on conventional broadcast television,
with older children opting to stream films as part of their
‘favourite’ content.
In addition to the SVOD platforms, YouTube has also
become a popular platform for children across all age
groups to view content. In the 3-4 year old group 45%
had visited the platform, with this proportion rising to 89%
for 12-15 year olds. Interestingly, in the 8-15 year old
segment, children prefer to go to YouTube rather than
their TV sets for content (49% versus 15%) as it allows
greater control of their viewing time and feels more
personalised to them, giving them access to content
created by producers in their own age group. Vloggers
are also an important component of the online viewing
experience for children from the older pre-schoolers
upwards, often cited as a source of inspiration to produce
similar videos, to create music or produce other content.
32
5-7 year old age group
42% have
their own tablet
44% watch television
shows on other devices
(typically a tablet)
82% go online for
around 9½ hours a week,
with 67% using a tablet
97% watch television
on a TV set for
13¼ hours a week
44% watch television
shows via
SVOD services
70% use YouTube,
with 65% citing cartoons
or funny videos as the
main reason
Source: Ofcom Children and Parents: Media Use and Attitudes
Report 2018
eOne Annual Report and Accounts 2019

Financial review
Revenue for the year was up 28% to £158.5 million (2018: £123.9 million), driven by the continued strong performance of Peppa Pig, significant growth from PJ Masks and the delivery of a new show, Cupcake & Dino: General Services.
Underlying EBITDA increased 37% to £97.0 million (2018: £71.0 million), driven by increased revenue. The underlying EBITDA margin was 390 basis points higher reflecting the larger portion of revenue generated from high margin AVOD and SVOD platforms (transactional and broadcast and licensing revenue grew 24% and 144%, respectively) which help to drive awareness of our brands.
Investment in productions of £6.4 million (2018: £9.6 million) was £3.2 million lower than the prior year due to higher spend on Cupcake & Dino: General Services and PJ Masks in the prior period. Investment spend in the current year included the new episodes of Peppa Pig, seasons 2 and 3 of PJ Masks, new property Ricky Zoom and new show Alien TV.
Licensing and merchandising revenue grew by 13% to £89.4 million (2018: £78.8 million) reflecting the US$2.52 billion of retail sales in the year (2018: US$2.38 billion). Retail sales during the year were impacted by the slower, more measured roll out of merchandise in China and the closure of Toys R Us particularly in the US. More than 1,100 new and renewed broadcast and licensing agreements were concluded in the year, an increase of 5% year-on-year. At 31 March 2019, the business had over 1,600 live licensing and merchandising contracts across its portfolio of brands (2018: almost 1,500) driven by the managed roll out.
Peppa Pig has continued to grow in the year with revenue growth of 20% at £90.2 million (2018: £75.2 million). This growth was driven by SVOD and AVOD revenues as well as TV broadcast renewals in the year. New and renewed SVOD deals for seasons 1 to 6 were signed in China with Mango TV, Youku, iQIYI and Tencent. Retail sales were up 4% at US$1.35 billion (2018: US$1.30 billion) but were impacted by the slower than anticipated roll out in China and the closure of Toys R Us in the US. The theatrical release of Peppa Pig Celebrates Chinese New Year in January 2019 generated a high level of social media buzz globally and drove strong brand awareness across the territory. Peppa Pig won the Young Property of the Year at the China Licensing Awards in October 2018.
The brand continues to be strong in key territories such as the US and the UK, remaining one of the leading pre-school brands in these markets. In the US the brand remains a top-rated show for children between 2-5 years old where it currently airs multiple times daily on Nick Jr. as well as weekdays on the Nickelodeon channel. Peppa Pig relaunched in Germany following a change in broadcaster to Super RTL and has seen growth in licensing revenue in the year. A total of 264 episodes are currently airing daily across 180 territories. Global location-based entertainment partner Merlin Entertainments opened two Peppa Pig World of Play centres during the second half of the financial year, in Shanghai and Dallas; with Michigan opening in early April 2019 on the back of very strong sales in Dallas and further launches anticipated. These developments further energise the brand awareness and reinforce Peppa Pig’s status as an evergreen property.
The Family & Brands Division develops, produces and distributes a portfolio of children’s television properties on a worldwide basis, its principal brands being Peppa Pig and PJ Masks. A significant proportion of its revenue is generated through high margin licensing and merchandising programmes across multiple retail categories.
£m 2019 2018 Change
Revenue 158.5 123.9 28%Transactional 32.2 25.9 24%Broadcast and Licensing 30.5 12.5 144%Licensing and Merchandising 89.4 78.8 13%Production and Other 6.4 6.7 (4%)
Underlying EBITDA 97.0 71.0 37%Underlying EBITDA % 61.2% 57.3% 390bpsInvestment in productions 6.4 9.6 (33%)
SR
G
FS
33entertainmentone.com

FAMILY & BRANDS BUSINESS REVIEW CONTINUED
PJ Masks has gone from strength to strength across its markets with revenue increasing by 39% to £59.5 million (2018: £42.7 million) and retail sales increasing 10% to US$1.15 billion (2018: US$1.05 billion). Licensing and merchandising revenues continued to be a fundamental growth driver with an overall increase of 37% in the year driven by further successful roll outs in all categories across all territories. Growth has been particularly strong
2020 Outlook for Family & BrandsThere is expected to be continued growth for Peppa Pig and PJ Masks in FY20 with a contribution from new brand Ricky Zoom. The business is expecting to have close to 1,800 live licensing and merchandising contracts by the end of FY20. The Division will continue to invest in its team in order to maximise the opportunities globally for existing and new brands.
Peppa Pig licensing and merchandising growth is expected from wider consumer product roll outs in China, rest of Asia and Germany. The US is expected to grow incrementally supported by retail promotions for the toy category and new clothing licensees on board. The brand has entered its 15th year anniversary in the UK which will see opportunities for new clothing lines and new publishing titles being released in FY20. The 117 episodes of Peppa Pig currently in production with the original creators of the show will air from spring 2019 through to 2023, bringing the total number of available episodes to 381, which will increase brand awareness and help maintain presence globally. Peppa Pig SVOD and AVOD revenues are expected to remain at a robust level as season 7 launches.
PJ Masks is also expected to grow licensing and merchandising revenue across most regions. Season 3 airs on Disney Channel in North America from April 2019 and throughout the year for other territories. Season 4 has been greenlit and is now in pre-production. We anticipate additional free-to-air exposure in FY20 opening a new audience segment of the market in our existing territories which will further help to drive brand penetration. Continued success is expected in the US where the brand will build upon its popularity as #2 ranked pre-school brand in the US toy market from new ancillary toy lines. In China, the property has been successfully rolled out across the major digital platforms and is now also being carried on the national free to air channel CCTV, increasing brand exposure. A wider consumer launch will take place in China in FY20 following on from the free-to-air broadcast.
in North America, Australia and Germany. PJ Masks remains the second biggest pre-school toy property in the US and the third biggest in the UK. The roll out in China has begun with an expansion anticipated for FY20.
PJ Masks is now broadcasting in all key territories on Disney Junior with excellent ratings, particularly after the launch of season 2 earlier this year. The brand also has a strong digital presence with an ongoing worldwide SVOD deal with Netflix and Mango TV in China which has provided SVOD revenue and enhanced brand exposure in addition to presence on Youku, iQIYI and Tencent.
New show Cupcake & Dino debuted globally on Netflix, Teletoon in Canada and Disney XD in Brazil during the year. All 26 episodes have been fully delivered, the first 13 episodes were aired in July 2018 with the second 13 episodes airing from May 2019.
PJ Masks is now broadcasting in all key territories on Disney Jr with excellent ratings, particularly after the launch of season 2 earlier this year.
eOne Annual Report and Accounts 201934

Ricky Zoom
Ninj a Express
Alien TV
ew pre-school vehicle-based series, , a n
is scheduled for its broadcast debut in China on SVOD
platform Youku in summer 2019, to be followed by a
global broadcast launch in autumn/winter 2019 in all
other territories simultaneously. The consumer products
launch of the brand is anticipated to be spring/summer
2020 with global toy partner TOMY.
Also in production are comedy shows
which already has major platforms attached in multiple
territories around the world and for a global
SVOD platform. Further properties are in development
across pre-school and older demographics.
The Division is expected to continue to generate strong
revenue and underlying EBITDA growth across the
portfolio in FY20. It is also expected that underlying
EBITDA margin will be slightly reduced due to revenue
stream mix and investment in additional infrastructure
which are necessary to facilitate growth and support
brand longevity.
35
Peppa Pig
PJ Masks
Cupcake & Dino
Ricky Zoom
SR
G
FS
entertainmentone.com

Film, Television & Music
Entertainment One is a major independent producer o� television content in the high-end scripted drama and non-scripted reality genres. Its shows are predominantly commissioned by US and Canadian broadcast networks and digital plat�orms but are sold around the world through the Group’s globa l sales in�rastructure. The migration o� our flm business away �rom distribution and towards production activities continue and we have experienced continued growth in our music operations, boosted by the recent acquisition o� Audio Network.
FILM, TELEVISION & MUSIC BUSINESS REVIEW
Steve Bertram
President, Film & Television
eOne Annual Report and Accounts 201936

57Unique film releases(FY18: 85)
£789.4mFilm, Television & Music revenue
£115.2mFilm, Television & Music underlying EBITDA
1,142Half hours of produced/acquired content(FY18: 887)
£121.9mInvestment in acquired content(FY18: £144.5m)
£252.3minvestment in productions(FY18: £287.8m)
Contribution to Group revenue
Contribution to Group EBITDA
Film, Television
& Music83%
Film, Television
& Music54%
Contribution to underlying EBITDA*
Contribution to Group Revenue
* Before central costs
SR
G
FS
37entertainmentone.com

FILM, TELEVISION & MUSIC BUSINESS REVIEW CONTINUED
What we doEntertainment One is a major independent producer of television content in the high-end scripted drama and non-scripted reality genres. Its shows are predominantly commissioned by US and Canadian broadcast networks and digital platforms and then distributed into global markets by our own international television sales network, which reaches over 500 broadcasters and digital platforms in more than 150 territories. This broad global presence ensures that high quality shows are brought to audiences across both traditional and digital content networks, including Netflix and Amazon Prime Instant Video. The Group also leverages its television sales infrastructure by selling in-demand third party content from producer partners, such as AMC.
Entertainment One is an independent film production and distribution business, focused on bringing the best film content to consumers across all content windows in its territories. Historically, we have acquired film rights through output deals with independent production studios, via single picture acquisitions and through production relationships with leading creative talent. Over the last two years we have transitioned our film business with a greater emphasis on production activities. In addition, we have continued to develop strong relationships with talented content creators such as Steven Spielberg and Brad Weston. This will result in a reduction in the number of releases over time but as we make this transition we anticipate reducing the level of investment in content acquisition, improving the Group’s financial profile.
In music, Entertainment One is a broadly-based, growing business. We generate recorded music revenues from distributing music in both physical formats and across digital streaming platforms such as Spotify, sharing streaming revenues and digital download fees with artists. We also leverage our content library to generate music synchronisation fees and publishing royalties based on performance. Artist management is another capability we offer our music clients, promoting and sharing in, their success across live music, publishing, recorded music and merchandise.
Television market: continued transition to subscription VOD services
As a mature industry, the global television industry continues to grow steadily year-on-year, generating modest, but steady, growth. According to the PricewaterhouseCoopers Global Entertainment and Media Outlook: 2018-2022 report, the global total television and video market revenues (made up of TV subscriptions, public licence fees, video on demand (VOD) subscriptions and transaction fees and physical home video) were estimated to be worth US$295.1 billion in 2018. These revenues are expected to grow to US$317.7 billion by 2022, a compound annual growth rate (CAGR) of 1.9%.
However, this picture of steady growth for the industry as a whole masks the continued decline of physical formats, which are forecast to drop at a compound average rate of 9.6% over this period, declining to US$11.7 billion. In contrast, the VOD component (made up of subscription video on demand and advertising video on demand – SVOD and AVOD, respectively) is anticipated to grow at a CAGR of 9.5% during this time to reach US$48.3 billion in 2022.
One of eOne’s most important television markets is the US, where revenues grew from US$35.2 billion in 2017 to US$38.2 billion in 2018 and are set to reach US$46.6 billion by 2024 according to latest data from IBISWorld. This strong growth is being driven by the continued spend on high quality content from the major SVOD platforms, who continue to pay high producers prices for the best content in order to drive subscriber growth across their platforms. This effect can be seen in the growth in subscriber numbers globally being achieved by the SVOD leaders, Netflix and Amazon Prime Video; Netflix alone had almost 140 million subscribers in 2018.
What we do & market backdrop
eOne Annual Report and Accounts 201938

Global television and video revenues Television industry: new, powerful (US$ billion) entrants create a buoyant
content market
Global SVOD subscribers (million)
Content investment by US SVOD platforms (US$ billion)
Over the last decade the impact of the SVOD players on
the broadcast industry has been profound, as the Parrot
Analytics subscriber numbers suggest. Since its inception
in 2007, Netflix has been the driving force behind this
growth, causing a crisis among the US cable operators
in 2010, when cable subscription numbers shrank for
the first time and have continued to fall by around 3%
per annum to 2018. Many former cable customers have
moved over to streaming services, allowing them to
pick and choose their favourite content through an
all-you-can-consume model.
Aside from a new pricing dynamic, the SVOD platforms
also offered consumers a new content proposition,
investing billions of dollars a year in new, exclusive
‘original’ series to feed binge-watchers with a steady
supply of new shows to consume. Looking at content
investment numbers gathered by Parrot Analytics, we
see that content investment has accelerated in recent
years, with Netflix spending US$12 billion in 2018, a
number set to increase to an indicated US$15 billion
in 2019. This is head and shoulders above Amazon,
which spent US$5 billion in 2018.
In addition to the content spend from existing SVOD
platforms, we have seen new entrants following a wave
of acquisitions across the content sector over the last
year. In March 2019, Disney acquired 21 Century Fox for
US$71.3 billion, fully unveiling its Disney+ SVOD platform
in April 2019, for US$7 per month, significantly less
expensive than the cheapest Netflix plan at US$9 per
month. This service will feature content from both Disney
and Fox catalogues including Pixar, Disney, Star Wars,
Marvel and National Geographic content, as well as 10
original films and 25 original series (including a Star Wars
television spin-off called which is
costing around US$100 million to produce 10 episodes).
Comcast acquired Sky in September 2018 for
US$39 billion to expand its content footprint into Europe
and intends to increase the number of original series
it can offer subscribers. In June 2018, AT&T merged with
Time Warner for an aggregate US$85 billion. This brings
together the ingredients for another new direct-to-
consumer service, marrying AT&T’s video streaming,
mobile and broadband services with libraries of content
from Warner Bros., HBO and Turner. New services will be
carried through AT&T’s high-speed wireless and fibre
network infrastructures.
39
st
The Mandalorian
300
250
200
150
100
50
0
20
15
10
5
0
13 14 15 16 17 18 17
13 14 15 16 17 18 17
Netflix Amazon Prime Video Hulu
Netflix Amazon Prime Video Hulu
350
300
250
200
150
100
50
0
14 15 16 17 18 19 20 21 22
CAGR: 2.6%
Subscription Licence fees Physical VOD
Source: PricewaterhouseCoopers Global Entertainment and Media Outlook: 2018-2022
Source: Global Television Demand Report, Parrot Analytics
Source: Global Television Demand Report, Parrot Analytics
SR
G
FS
entertainmentone.com

FILM, TELEVISION & MUSIC BUSINESS REVIEW CONTINUED
Other players now in the space also include Hulu, with 25 million existing US subscribers, which is preparing to move internationally out of North America with new content to be provided by the merged Disney/Fox business (which currently owns 60% of the platform and has announced plans to take full ownership). Walmart launched its streaming service, VuDu, in March 2019 and Apple’s new TV+ service was announced in the same month, with a commitment to spend around US$1 billion in its first year.
These market dynamics play to Entertainment One’s strengths, creating an environment where the world’s best content attracts high levels of interest from buyers competing to bring the highest quality shows to their platforms. This interest is at its most acute in two key eOne production sectors – scripted drama and non-scripted reality shows. We believe that there has been no better time for eOne to be a leading independent production company, able to sell any content to any platform or network anywhere in the world.
Film: global market stableThe strategy of focusing on franchise titles seems to be working for the Hollywood majors – in the US at least. The Motion Picture Association of America (MPAA) in its 2018 THEME Report highlights a return to growth in the North American box office, with revenues up 7% to a record high of US$11.9 billion in 2018 propelled by franchise titles from the majors. In fact, all of the top releases in the region were franchise titles or sequels, led by Black Panther, Avengers: Infinity War and Incredibles 2. Growth in admissions was up 5% to 1.3 billion in 2018, with an average ticket price of US$8.97, 2% higher than in 2017.
However, this performance was not matched by the international box office, which represents 71% of the total global box office. Revenues in this marketplace declined 1% in 2018 to US$29.2 billion, producing an overall 1% growth in total global box office revenues to US$41.1 billion.
The largest international region is Asia Pacific; it is the biggest market globally, having overtaken North America in 2013. Overall the region increased box office revenues by 5% to US$16.7 billion in 2018, with China being the largest single market at US$9.0 billion, up 12%. However, in Europe, Middle East and Africa (EMEA) box office revenues fell by 3% to US$9.8 billion (poor performances from Russia and Germany). Latin America reversed the 22% revenue growth experienced in 2017 to a 22% decline in 2018 to US$2.7 billion, with currency devaluations contributing to the decline in some markets.
Entertainment One’s strategy to transition our film business is largely complete this year and will mean an ongoing reduction in the number of unique film releases from our slate. We will focus on targeted, higher quality and lower profile releases, bringing the run-rate down to 35-40 releases per annum. These releases will be distributed through our own businesses in our territories but where we have no direct infrastructure we will pre-sell territorial rights to established distributors ahead of production to reduce our risk.
Music: growth characteristics underlinedOver the last few years, the music industry has undergone a period of recovery, brought back to life by the consumer adoption of subscription-based streaming services. These services promote streaming of the front list for artists but also create interest in the back catalogue, unlocking the long tail of music content.
Data from the PricewaterhouseCoopers Global Entertainment and Media Outlook: 2018-2022 report suggests that revenues from digital recorded music, which includes streaming services, are expected to grow from US$7.8 billion in 2013 to an estimated US$24.5 billion in 2022, a compound annual growth rate of over 13% over this period. By contrast, the sales of physical music are set to fall from US$10.5 billion in 2013 to US$4.8 billion in 2018, a decline of over 8% per annum on average. The chart also shows the steady growth in live music as audiences seek the live experiences to supplement their music consumption.
Entertainment One’s music businesses are a broadly-based set of operations across recorded music, music publishing, artist management and live events. The recent acquisition of Audio Network enhances our capabilities in music synchronisation and brings a well-developed music publishing platform into the Group.
eOne Annual Report and Accounts 201940

Wild Rose
Dreamland
Chromeo
Designated Survivor
Global box office revenues (US$ billion)
Global music revenues (US$ million)
45
40
35
30
25
20
15
10
5
0
14 15 16 17 18 18 17
North America EMEA Asia Pacific Latin
America
Source: Motion Picture Association of America: THEME Report 2018
Source: PricewaterhouseCoopers Global Entertainment and Media
Outlook: 2018-2022
35,000
30,000
25,000
20,000
15,000
10,000
5,000
013 14 15 16 17 18 19 20 21 22
Live music Digitally recorded music Physical music
Performance rights Music synchronisation
SR
G
FS
41entertainmentone.com

FILM, TELEVISION & MUSIC BUSINESS REVIEW CONTINUED
Revenue in the year decreased by 13% to £789.4 million (2018: £911.1 million) due to lower transactional, broadcast and licensing and production and other revenue driven by lower film release volume, home entertainment market decline and scripted television slate composition. This was partly offset by growth in theatrical and music.
Underlying EBITDA increased by 9% driven by improved profitability on television shows, increased high margin royalty income from television library participations, increased music revenue and additional operating cost savings of around £5 million (approximately £6 million in aggregate through FY19). These positive trends more than offset the impact of lower transactional revenue driven by fewer releases and significant market decline. There was an underlying EBITDA margin improvement of 300 basis points driven by the change in mix to higher margin television revenue and the impact of the operating cost savings generated from the restructuring and further integration of the Film and Television Divisions.
Film investment in acquired content reduced by £32.4 million to £72.1 million (2018: £104.5 million) due to the lower volume film slate as expected and in line with our strategy to shift investment from acquisitions to productions. Film investment in productions was lower by £23.8 million at £35.0 million (2018: £58.8 million) due to the timing of productions.
Television investment in acquired content increased by £7.8 million to £43.5 million (2018: £35.7 million) due to timing of spend on the AMC/Sundance shows. Television investment in productions was lower by £11.5 million at £213.3 million (2018: £224.8 million) due to the timing of production including a higher level of tax credits received. 1,142 half hours of new programming were acquired/produced in the year compared to 887 in the previous year of which 708 related to unscripted compared to 350 in the prior year.
Theatrical
Theatrical revenue increased by 7% to £60.9 million (2018: £57.1 million) as a result of strong box office receipts in the second half of the year driven by key titles Green Book, Vice and Stan & Ollie. Box office receipts were up 5% from US$207.6 million in 2018 to US$217.5 million in 2019. Average revenue per release was up substantially more to 56%. The total number of unique releases was 57 in the year, down from 85 in the prior year, reflecting the strategic transition from lower margin film distribution towards fewer high quality film productions distributed across the direct distribution footprint.
Academy Award® winning Green Book, from our partners DreamWorks and Participant Media, was an incredible success for eOne. The film has a worldwide box office of over US$300 million, with eOne’s territories delivering close to US$60 million of the gross box office combined. BAFTA-nominated Stan & Ollie, an eOne production, achieved UK box office revenue of over £10 million in its first eight weeks of release. Other key releases in the year included The House with a Clock in Its Walls from Amblin, Vice from Annapurna Pictures and I Feel Pretty.
Transactional
Transactional revenue decreased by 49% to £67.6 million (2018: £133.8 million) across both physical and digital, driven by lower release volume reflecting the Group’s strategy to focus on fewer high quality films that can be released across the entire theatrical distribution footprint and an accelerated decline in the industry.
Film, Television & MusicThe Film, Television & Music Division focuses on controlling high quality, premium film, television and music content rights around the world and selling this content globally.
Financial review
£m 2019 2018 Change
Revenue 789.4 911.1 (13%)Theatrical 60.9 57.1 7%Transactional 67.6 133.8 (49%)Broadcast and Licensing 380.9 448.3 (15%)Production and Other 215.6 223.1 (3%)Music 64.4 49.4 30%Eliminations – (0.6) 100%
Underlying EBITDA 115.2 105.9 9%Underlying EBITDA % 14.6% 11.6% 300bps
Investment in acquired contentFilm 72.1 104.5 (31%)Television 43.5 35.7 22%Music 6.3 4.3 47%
Investment in productionsFilm 35.0 58.8 (40%)Television 213.3 224.8 (5%)Other 4.0 4.2 (5%)
eOne Annual Report and Accounts 201942

As announced at the half year, given the accelerated home entertainment market decline the Group recorded a one-off charge primarily reflecting the impairment of certain film distribution assets. The one-off charge for the full year was £61.0 million (of which £56.1 million was non-cash).
In total, 160 DVDs and Blu-ray titles were released during the year (2018: 255), a decrease of 37%. Key titles included The House with a Clock in Its Walls, The Post, Finding Your Feet, season 9 of The Walking Dead, I Feel Pretty, A Simple Favor, Molly’s Game and The Spy Who Dumped Me.
Broadcast and licensing
Broadcast and licensing revenue decreased 15% to £380.9 million (2018: £448.3 million) due to scripted television slate composition including fewer episodes of the third season of Designated Survivor (10 episodes compared to 22) and change in timing of placement for new shows. Revenue from third party television titles also reduced due to lower revenue for the Fear the Walking Dead franchise.
Key scripted television deliveries in the year included the first season of The Rookie, which premiered in October 2018 across a number of territories and was CTV’s #1 new drama and ABC’s #3 drama for the 2018-19 season to date; Designated Survivor season 3 was sold to Netflix and will air in summer 2019; Ransom season 3; You Me Her season 4; Burden of Truth season 4; and Private Eyes season 3.
Key acquired television content included season 3 of Into the Badlands, season 4 of Fear the Walking Dead and The Walking Dead season 9.
Film broadcast and licensing revenues included the film production How It Ends sold to Netflix on a worldwide basis. Broadcast and licensing sales on theatrical titles included The BFG, The Girl on the Train, Finding Your Feet, The Death of Stalin, I Feel Pretty, A Simple Favor and Molly’s Game.
Production and other
Production and other revenue decreased by 3% to £215.6 million (2018: £223.1 million) driven by the lower number of film productions, with Stan & Ollie released in the year compared to four titles released in the prior year, and lower revenue on third party international film sales.
This was partly offset by growth in unscripted television and increased royalty income from television library participations.
Unscripted television performed very well during the year successfully led by Ex on the Beach, Siesta Key, America Says, Ladies Night and Naked and Afraid. The business acquired a majority stake in Whizz Kid Entertainment, a UK based unscripted television production company, at the start of the financial year.
The television library participations included Grey’s Anatomy which is now the longest ever running US medical drama; and Criminal Minds which is currently airing season 14. This revenue is at high margins and favourably contributes to cash generation.
Music
Revenue for the year increased by 30% to £64.4 million (2018: £49.4 million), due to higher digital revenue on recorded music reflecting the industry-wide growth of streaming, higher live and exhibition revenues and higher artist management, partly offset by lower physical revenues. Underlying EBITDA grew by 46% to £8.9 million (2018: £6.1 million).
In the recorded music business there were number one albums from artists across a number of genres including world music, gospel, metal and R&B. Key titles during the year included a mix of new and catalogue titles including continued strong performance of The Lumineers’ highly successful first and second albums, The Lumineers and Cleopatra, 2 Pac’s All Eyez On Me, Blueface’s Famous Cryp, Dr Dre’s The Chronic and Snoop Dogg’s Doggystyle. The number of albums released in the year decreased with 65 releases in the current year versus 84 in the prior year. Single releases increased significantly at 294 compared to 205 in the prior year as we continue to release digital singles due to the shift in the market from physical. Blueface’s hit song Thotiana had over 400 million streams and featured on various music charts across the world and artist DJ Kass has been certified platinum twice for streams and sales for his viral hit Scooby Doo Pa Pa.
The live events business had successful tours with PJ Masks Live! Show and the Thank You Canada tour, while successfully launching the Mandela Exhibit in London. Artist management had a good year with Jax Jones releasing his fifth consecutive hit single Play which has achieved over 13 million streams on Spotify alone since release.
SR
G
FS
43entertainmentone.com
The music business won three Grammy awards for Best Performance (High On Fire), Best World Album (Soweto Gospel Choir) and Best Dance Recording (producer Riton).
2020 Outlook for Film, Television & Music
The Film, Television & Music strategy continues to be focused on ensuring early access to high quality premium content of all types by working with the best talent in the business. Broadcast and licensing revenue is expected to increase, driven by the ramp up of the scripted and unscripted television businesses, and music is also expected to continue to grow organically and through the post year end acquisition of Audio Network.
Film operations continue to transition from distribution to owned and produced multi-territory releases. This transition will result in fewer but larger theatrical releases, with 50 unique titles expected. Unique titles are expected to decrease even further over the coming years as we aim towards a run-rate of 35-40 unique titles per annum. A greater proportion of theatrical revenue is expected to come from eOne production titles like Queen & Slim starring David Kaluuya, produced by Makeready and released by eOne in its direct territories and Universal in the US and rest of world; Poms starring Diane Keaton and Jacki Weaver, sold to STX in the US, released by eOne in the UK and Canada and sold by Sierra internationally; Scary Stories to Tell in the Dark, produced by Academy award winner Guillermo del Toro, co-produced with CBS and released by eOne in its direct territories; and Wild Rose, starring Jessie Buckley, sold to NEON in the US, released by eOne in its territories and sold by Sierra internationally. Output partner titles will include Amblin’s 1917 starring Benedict Cumberbatch and directed by Sam Mendes and A Dog’s Journey, the sequel to A Dog’s Purpose; and Annapurna Pictures’ Booksmart directed by Olivia Wilde. Key third party titles will include John Wick: Chapter 3, Blinded by the Light and Late Night.
Investment in film acquired content is expected to be lower at approximately £55 million with investment in film production expected to be higher than the current year at around £95 million reflecting the strategic shift towards content production. eOne films in production include Happiest Season, a co-production with Sony starring Kristen Stewart; and Den of Thieves 2, a sequel to the hit film starring Gerard Butler and Curtis “50 Cent” Jackson. Key development titles include Sovereign, starring
Mahershala Ali, directed by Marc Munden and produced with 21 Laps; Come From Away, based on the Tony Award winning hit musical; and Awake.
FY20 will include the sub-distribution arrangements announced in the second half of FY19. Our Australian and Benelux territories have moved to sub-distribution arrangements with Universal Pictures International and WW Entertainment respectively as we continue to focus our direct distribution effort on fewer, more targeted theatrical releases. We will also transition to Universal Pictures Home Entertainment (UPHE) in the first half of FY20 which will bring all home entertainment activities under a single global partnership, with UPHE serving as the home entertainment distributor for film, television and select family content across transactional physical and digital formats. This will allow us to streamline our business in light of declines in the transactional business and benefit from Universal’s broader portfolio of assets and related leverage at retail.
Television scripted and unscripted revenue is expected to grow in FY20, driven by both new shows and renewals. The scripted television slate for FY20 includes Run (HBO), a new romantic comedic thriller written by Vicky Jones, executive produced by Phoebe Waller-Bridge (Fleabag and Killing Eve), and stars Merritt Wever and Domhnall Gleeson; Nurses (Global in Canada and sold by eOne internationally), a new primetime medical drama executive produced by Ilana Frank (Rookie Blue) and Vanessa Piazza; Albedo (VuDu, expected delivery in FY21), a mystery drama series starring Evangeline Lilly and directed by Bill Peyton (Rampage and San Andreas); Deputy (Fox in the US and sold by eOne internationally), a new scripted drama primetime network series starring Stephen Dorff (True Detective); and renewals of The Rookie (season 2), You Me Her (season 5) and Cardinal (season 4).
The unscripted business is expected to continue to grow organically as well through Renegade 83 and Whizz Kid, and first-look deals with Tommy Mottola, MGMT.Entertainment and documentary makers Amy Ziering and Kirby Dick. Key titles include the Growing Up Hip Hop franchise, Siesta Key, Ex on the Beach, Naked and Afraid and Lady Gang. International distribution of third party television titles will reduce as the AMC output deal has now ended for new productions. FY20 will include Fear the Walking Dead season 5 and The Walking Dead season 10. The television library participations are expected to remain robust in FY20.
FILM, TELEVISION & MUSIC BUSINESS REVIEW CONTINUED
eOne Annual Report and Accounts 201944

The number of half hours of TV programming to be acquired/produced next year is expected to be over 1,200, with around 35% of the new financial year’s budgeted margins already committed or greenlit. The Division currently has more than 60 television projects in funded development with major broadcasters, cable networks and digital platforms. Investment in acquired television content is expected to be around £30 million and television production spend is expected to grow to £350 million.
The integration of the Film & Television operations (including The Mark Gordon Company and Sierra/Affinity) is on track to generate £13-15 million of annualised cost savings by the end of FY20, as previously guided, from business efficiencies and centralisation of support functions from the combined operations to form a single, streamlined operating structure.
The music business is expected to continue to grow and develop new initiatives to provide its artists and partners with an unprecedented range of services and opportunities unequalled by any independent music company. Organic growth is expected in the recorded music business through higher digital streaming revenue. Key new releases include The Lumineers’ third album III, a new album by Wu-Tang and new music from guitar legend Zakk Wylde. Artist management expects to grow through the success of its artist portfolios within its management groups. The live events business will continue to benefit from shows launched in FY19 and will have many new shows announcing for FY20.
Following the end of the financial year, in April 2019 eOne acquired UK-based Audio Network, one of the world’s largest independent creators and publishers of original high quality music for use in film, television, advertising and digital media. Audio Network enhances eOne’s presence in a rapidly growing sector within music, delivering attractive growth that is complementary to eOne’s music, film, television and family brands businesses. Audio Network’s business model is based on the monetisation of a library of owned global music rights. It generates revenues through synchronisation (‘sync’) fees paid by content creators for access to music for their shows (with 60% of these fees in the form of annual subscriptions) and music publishing royalties. This attractive mix of recurring, high margin revenues enables Audio Network to deliver underlying EBITDA margins of around 35% and achieve a conversion rate of underlying EBITDA to free cash flow of approximately 90% in FY18.
The combination of Audio Network with our existing music operations is expected to create scale, end-to-end synergies and revenue opportunities across eOne. Audio Network brings longstanding partnerships with more than 1,000 artists and composers and a high quality library of over 150,000 instrumental and orchestral tracks to eOne’s library of around 40,000 commercial songs. We are excited by the prospect of integrating these libraries together on Audio Network’s proprietary music publishing platform to simplify music rights management and to generate incremental sync placement opportunities for eOne’s commercial artists. We can also now utilise Audio Network’s music content in eOne’s own film, television and family productions, bringing this activity largely in-house.
SR
G
FS
45entertainmentone.com

FINANCIAL REVIEW
Group reported revenue at £941.2 million
(2018: £1.029.0 million), with strong growth in
Family & Brands o��set by lower Film, Television
& Music
Adjusted operating pro�it increased by 21% to Group underlying reported EBITDA up 21% at
£193.9 million (2018: £160.0 million), re�lecting the £197.6 million (2018: £163.6 million), with growth
growth in the Group’s underlying EBITDA. Adjusted in Family & Brands and higher margins in Film,
pro�it be�ore tax increased by 20% to £155.9 million television & music
(2018: £130.2 million), in line with increased adjusted Group EBITDA margins up to 21.0%
operating pro�it, partly o��set by higher underlying �inance (2018: 15.9%)
charges in the year. Reported operating pro�it o� Adjusted diluted earnings per share up by 30%
£70.7 million (2018: £100.7 million) re�lects the impact to 25.0 pence per share (2018: 19.3 pence
o� an operating one-o�� charge o� £68.0 million primarily per share)
related to the impairment o� certain assets within the Full year dividend o� 1.5 pence per share
�ilm distribution businesses and related costs. (2018: 1.4 pence per share)
1,029.0 1,029.0
163.6 163.6
Amortisation o� acquired intangibles (39.6) –
Depreciation and amortisation o� so�tware (3.6) (3.6)
Share-based payment charge (12.6) –
One-of items (7.1) –
100.7 160.0
Net �nance costs (35.8) (29.8)
64.9 130.2
Tax (charge)/credit 3.9 (24.3)
68.8 105.9
46
Strong earnings growth delivered, confdent outlook
Reported Adjusted
Restated Restated
2018 2018
Group £m £m
1. Adjusted operating pro�t excludes amortisation o� acquired intangibles, share-based payment charge and operating one-of items.
2. Reported 2018 amounts have been restated �or IFRS 15 Revenue �rom Contracts with Customers, re�er to Note 1 o� the consolidated �nancial statements �or
�urther details.
2019 2019 £m £m
2 2
Revenue 941.2 941.2
Underlying EBITDA 197.6 197.6
(39.0) –
(3.7) (3.7)
(16.2) –
(68.0) –
Operating proft¹ 70.7 193.9
(33.9) (38.0)
Proft be�ore tax 36.8 155.9
(21.5) (31.1)
Proft �or the year 15.3 124.8
Joseph
Sparacio
Chie� Financial
O��icer
Highlights
•
•
•
•
•
eOne Annual Report and Accounts 2019

Amortisation of acquired intangibles, depreciation and amortisation of softwareAmortisation of acquired intangibles, depreciation and amortisation of software is £42.7 million and is consistent with the prior year.
Share-based payment chargeThe share-based payment charge of £16.2 million has increased by £3.6 million during the year, reflecting additional awards issued in the year and also due to the fair value of the current year awards increasing as a result of the increase in the Company’s share price in the year.
One-off itemsHome entertainment
As previously announced, changes in consumer behaviour within the content industry are accelerating at an unprecedented level and in the year ending 31 March 2019, the home entertainment markets in all of the Group’s operating territories experienced significant challenges. As a result the Group has recorded a one-off charge of £61.0 million in the year which included the following:
• Impairment of investment in acquired content rights of £15.6 million resulting from the lowering of previous expectations regarding the home entertainment business driven by an acceleration of market decline;
• Write down of home entertainment related inventories of £26.1 million resulting from an assessment of the realisable value of inventory below the previous assessment of net realisable value;
• One-off bad debt expense on trade and other receivables of £14.4 million; and
• Related severance and staff costs of the home entertainment businesses of £4.9 million.
Strategy related
During the year ending 31 March 2019 the Group combined its Film Division and Television Division (which included Music) into one reporting segment, Film, Television & Music, which is in line with broader developments within the media and entertainment industry. This integration is largely complete and the costs arising from the integration have been included as a one-off charge of £8.4 million, they include the following:
• Related severance and staff costs of Film, Television & Music of £7.9 million; and
• Consultancy fees for the pre-system development of the finance transformation of £0.3 million.
Other items
Acquisition gains of £0.5 million include a cost of £0.6 million for completed deals during the year and a £1.1 million credit due to the release of Last Gang Entertainment contingent consideration which is no longer payable.
Other one-off credits of £0.9 million include a £1.7 million settlement received on a tax warranty relating to a prior year acquisition and is partially offset by £0.8 million of legal costs for certain corporate projects and aborted corporate transactions during the year.
Prior year costs
In 2018, restructuring costs were as follows:
The restructuring costs of £8.0 million comprise:
• £4.4 million of costs associated with the integration of the Film and Television Divisions and includes £3.6 million related to severance and staff costs and £0.8 million related to consultancy fees;
• £2.0 million related to the integration of the unscripted television companies within the wider Canadian television production business. The costs primarily include severance and staff costs and onerous leases; and
• £1.6 million of costs associated with completion of the 2017 strategy related restructuring programmes. The costs include additional severance, onerous leases and write-off of inventory.
Acquisition gains of £1.9 million included:
• Credit of £3.9 million on re-assessment of the liability on put options in relation to the non-controlling interests over Renegade 83 and Sierra Pictures put options;
• These gains are partially offset by banking and legal costs of £1.6 million associated with the creation and set-up of Makeready in the prior year; and
• Charge of £0.6 million on settlement of contingent consideration in relation to Renegade 83 settled in the year, partially offset by escrow of £0.2 million received in relation to the 2018 acquisition of Last Gang Entertainment.
SR
G
FS
47entertainmentone.com

Other costs of £1.0 million in 2018 primarily related to costs associated with aborted corporate projects during the prior year.
Net finance costsReported net finance costs decreased by £1.9 million to £33.9 million in the year. Excluding one-off net finance income of £4.1 million, adjusted finance costs of £38.0 million (2018: £29.8 million) were £8.2 million higher in the year, reflecting the higher average debt levels year-on-year primarily arising from the March 2018 acquisition of the remaining 49% interest in The Mark Gordon Company (refer to Note 27 for details). The weighted average interest rate for the Group’s financing was 6.5% which is consistent with the prior year.
The one-off net finance income of £4.1 million (2018: charge £6.0 million) comprises:
Put options
• Credit of £5.7 million (2018: £nil) relating to the reversal of the Sierra/Affinity put option liability following the acquisition of the remaining 49% shares on 27 June 2018;
• Credit of £1.1 million (2018: £nil) relating to the revaluation of put options issued over the non-controlling interest of subsidiary companies;
• Credits above are partly offset by a charge of £1.4 million (2018: £3.0 million) due to the unwind of discounting on liabilities relating to put options issued by the Group over the non-controlling interest of subsidiary companies.
Foreign exchange gains & losses
• Credit of £0.2 million (2018: charge of £1.6 million) in respect of fair value gains on hedge contracts;
• Charges in the prior year included £5.2 million in respect of losses on five forward currency contracts not in compliance with the Group’s hedging policy and £1.1 million in respect of fair-value loss on hedge contracts cancelled as a result of the re-negotiation of one of the Group’s larger film distribution agreements. The charges in the prior year are partly offset by a credit of £1.5 million due to the adoption of IFRS 15.
Tax provisions
• Charge of £0.1 million (2018: credit of £3.4 million) relating to interest on tax provisions incurred during the year. In the prior year there was a release of interest previously charged on tax provisions.
Deferred finance charges
• Charge of £1.4 million (2018: £nil) due to the write-off of the deferred finance charges in relation to the RCF which was refinanced in December 2018.
TaxOn a reported basis, the Group’s tax charge of £21.5 million (2018: credit of £3.9 million) represents an effective rate of 58.4% and primarily reflects the impact of the operating one-off items. On an adjusted basis, the effective rate is 20.0% compared to 18.7% in the prior year, driven by a different mix of profit by jurisdiction (with different statutory rates of tax) and by an increase in the US tax rates in the year. The FY20 effective tax rate on an adjusted basis is expected to be approximately 22%.
Cash flow & net debtThe table opposite reconciles cash flows associated with the Net Debt entities of the Group, which excludes cash flows associated with production activities which are reconciled in the Production Financing section. The Production Financing section also includes the impact of eliminations between the entities forming part of the Net Debt group and the Production Financing group.
Adjusted cash flowAdjusted cash inflow at £74.1 million was higher than prior year by £14.6 million primarily reflecting the increase in underlying EBITDA of the entities forming part of the Net Debt Group by £44.2 million during the year and reduction in investment in acquired content rights of £22.6 million. This is partially offset by an increased working capital outflow of £37.7 million in the year and increased investment in production spend of £6.8 million. The underlying EBITDA to cash flow conversion was 41% (2018: 43%).
Family & Brands
Family & Brands adjusted cash inflow increased to £84.6 million (2018: £81.3 million) representing an underlying EBITDA to adjusted cash flow conversion of 88% (2018: 113%), driven by the increase in underlying EBITDA and offset to a large extent by an increase in working capital outflow during the year. Working capital outflows increased year-on-year principally driven by the increase in receivables as a result of higher broadcast and licensing revenue associated with Peppa Pig and PJ Masks in the year. The investment in productions spend related to the new episodes of Peppa Pig, season 2 and 3 of PJ Masks, new property Ricky Zoom and new show Alien TV.
FINANCIAL REVIEW CONTINUED
eOne Annual Report and Accounts 201948

Film, Television & Music
Film, Television & Music adjusted cash inflow of £6.4 million was higher than prior year (2018: outflow £12.2 million) primarily driven by a reduction in investment in acquired content by £22.6 million. Film, Television & Music’s adjusted cash inflow represents an underlying EBITDA to adjusted cash flow conversion of 6% (2018: (15%)).
The reduced investment in acquired content rights reflects the ongoing shift towards production activities and the lower volume of theatrical releases.
2019 2018
£m (unless specified)Family
& Brands
Film, Television
& MusicCentre & Elims Total
Family & Brands
Film, Television
& MusicCentre & Elims Total
Underlying EBITDA 96.4 99.8 (14.6) 181.6 71.8 78.9 (13.3) 137.4Amortisation of investment in acquired content rights – 84.0 – 84.0 – 113.4 – 113.4Investment in acquired content rights – (121.9) – (121.9) – (144.5) – (144.5)Amortisation of investment in productions 7.4 104.7 (0.4) 111.7 3.5 86.6 (0.1) 90.0Investment in productions, net of grants (9.5) (122.6) 0.4 (131.7) (7.3) (118.6) 1.0 (124.9)Working capital (9.7) (37.6) (2.3) (49.6) 13.3 (28.0) 2.8 (11.9)Adjusted cash flow 84.6 6.4 (16.9) 74.1 81.3 (12.2) (9.6) 59.5Cash conversion (%) 88% 6% 41% 113% (15%) 43%Capital expenditure (6.9) (3.2)Tax paid (23.6) (31.8)Funds transferred between Net Debt and Production Financing 2.2 0.6Net interest paid (33.4) (25.5)Free cash flow 12.4 (0.4)One-off items (11.1) (33.4)One-off finance items (1.9) (14.1)Acquisitions, net of net debt acquired and transactions with shareholders (14.0) (118.5)Net proceeds of share issue 0.1 52.0Dividends paid (13.4) (13.0)Foreign exchange 0.9 0.3Movement (27.0) (127.1)Net debt at the beginning of the year (314.5) (187.4)Net debt at the end of the period (341.5) (314.5)
Free cash flowFree cash inflow for the Group of £12.4 million was £12.8 million higher than the previous year due to higher adjusted cash inflow as detailed above and a reduction in cash tax payments primarily on account of timing tax payments in the US and Canada. This is partially offset by an increase in net interest cost reflecting the higher average debt levels year-on-year primarily arising from the March 2018 acquisition of the remaining 49% interest in The Mark Gordon Company.
SR
G
FS
49entertainmentone.com

FINANCIAL REVIEW CONTINUED
2019 2018
£mFamily &
Brands
Film, Television
& Music Elims TotalFamily &
Brands
Film, Television
& Music Elims Total
Underlying EBITDA 0.6 15.4 – 16.0 (0.8) 27.0 – 26.2Amortisation of investment in productions 0.4 128.4 – 128.8 – 157.4 – 157.4Investment in productions, net of grants 3.1 (129.7) – (126.6) (2.2) (169.2) – (171.4)Working capital (1.2) (24.1) – (25.3) 1.1 11.5 – 12.6Adjusted cash flow 2.9 (10.0) – (7.1) (1.9) 26.7 – 24.8Capital expenditure (0.2) –Tax paid (1.3) (0.7)Funds transferred between Net Debt and Production Financing (2.2) (0.6)Net interest paid (3.9) (0.7)Free cash flow (14.7) 22.8One-off items (1.3) (3.5)Acquisitions, net of net debt acquired – –Foreign exchange (5.4) 14.3Movement (21.4) 33.6Net production financing at the beginning of the year (118.7) (152.3)Net production financing at the end of the period (140.1) (118.7)
Net debtAt 31 March 2019, overall net debt of £341.5 million was £27.0 million higher than the prior year closing balance due to dividend payments of £13.4 million, acquisition spending of £14.0 million (refer to Note 27 of the consolidated financial statements for details) and cash outflow on operating and finance one-off items of £13.0 million, partly offset by the higher free cash flow.
Refer to the Appendix to the consolidated financial statements for the definition of “adjusted cash flow”, “free cash flow”, and “net debt” and for a reconciliation to net cash from operating activities.
Production financing & otherThe Production Financing cash flows relate to non-recourse production financing which is used to fund the Group’s productions. The financing is arranged on an individual production basis by special purpose production subsidiaries which are excluded from the security of the Group’s corporate facility. It is short-term financing while the production is being made and is generally paid back once the production is delivered and
the sales receipts and tax credits are received. The Company deems this type of financing to be short term in nature and it is therefore excluded from Net Debt. Overall production financing increased by £21.4 million year-on-year to £140.1 million. The movements primarily reflect the timing of programming activities. The movement is primarily driven by working capital outflow of £24.1 million in the Film, Television & Music Division which is largely driven by the timing of deliveries of Designated Survivor season 3.
Financial position and going concern basisThe Group’s net assets increased by £48.6 million to £714.7 million at 31 March 2019 (31 March 2018: £666.1 million).
The directors acknowledge guidance issued by the Financial Reporting Council relating to going concern and consider it appropriate to prepare the consolidated financial statements on a going concern basis, as set out in Note 1 to the consolidated financial statements.
eOne Annual Report and Accounts 201950

PRINCIPAL RISKS AND UNCERTAINTIES
Managing our risks effectively
Risk management approachRisks are identified and assessed by all Business Units every three months and are measured against a defined set of criteria, considering likelihood of occurrence and potential impact to the Group before and after mitigation. The Risk & Assurance function facilitates a risk identification and assessment exercise with the Executive and Risk Management Committee members. This information is combined with a consolidated view of the Business Unit risks. The top risks (based upon likelihood and impact) form the Group Risk Profile, which is reported to the Executive Committee for review and challenge ahead of it being presented to the Board of Directors for final review and approval.
To ensure that our risk process drives continuous improvement across the business, the Risk Management Committee monitors the ongoing status and progress of key action plans against each risk on a periodic basis. Reports from the Risk Management Committee are presented to the Audit Committee and Board on a periodic basis. As part of the remit of the Audit Committee in overseeing risk, regular updates are provided by management in relation to litigation and insurance coverage to ensure that the Group is appropriately monitoring and managing such risks.
Risk remains a key consideration in all strategic decision making by the Board, incorporating a discussion of risk appetite.
Each principal risk is assigned to an appropriate member of the Risk Management Committee, who is accountable to the Risk Management Committee for that risk. The principal risks are managed at either an operational level, Group level, or a combination of both.
The Group has a well-established risk management process for identifying, assessing, evaluating and mitigating significant risks. The structure and process are summarised as follows:
The Board
• Leadership of risk management• Ownership and monitoring• Sets strategic objectives and risk appetite
Executive Committee
• Ownership and management of key risks• Assesses materiality of risks in context of the
whole Group
Risk Management Committee
• Co-ordination and review of key risks• Monitors mitigation and controls
Group functions/subsidiary companies
• Identification, assessment and management of mitigation
• Use risk as an explicit part of decision making and management of external relationships
Risk & Assurance function
• Facilitation and challenge• Monitors and validates action taken by management• Independently reviews the effectiveness of
the Group’s internal controls and risk management process
SR
G
FS
51entertainmentone.com

PRINCIPAL RISKS AND UNCERTAINTIES CONTINUED
Risk appetite
Risk categorisation
Linkage with the Group’s business planning process
Risk appetite is an expression of the types and amount of
risk that the Group is willing to take or accept to achieve
its objectives. It supports consistent, risk-informed
decision making across the Group with the aim of
ensuring that all significant risks are identified,
assessed and managed to within acceptable levels.
The Group can use one or more actions to reduce the
likelihood or impact of known risks to levels that it is
comfortable with:
choose to take or to tolerate risk;
treat risk with controls and mitigating actions;
transfer risk to third parties; or
terminate risk by ceasing particular activities
or actions.
The Group categorises risks as Strategic, Operational or
Financial. Reputational impact is considered for all risks
rather than noting a separate reputational risk category.
The Group’s business plan has been developed in the
context of the Group’s principal risks and uncertainties,
set out in the table below, being those risks and
uncertainties which could prevent the Group from
delivering on its strategy.
A number of the risks and uncertainties are qualitative in
nature and their impact cannot be easily quantified, but
they have been considered as part of the development
of the Group’s business plan. Whilst these risks cannot
be easily quantified through financial modelling, they
are monitored as part of the Group’s risk management
process and each is mitigated through the risk
management plan that the Group operates, as
noted above.
Other risks can be understood in a quantitative way and
have been included in the detailed assessment of the
Group’s viability, through financial modelling and
sensitivity analysis. Further details of this process are
provided in the Group’s Viability Statement, which is set
out on pages 55 to 57.
52
•
•
•
•
Arkells
Green Book
Lumineers
Stan & Ollie
eOne Annual Report and Accounts 2019

Risk Why How
Strategic
Strategy formulation & executionCreating and executing the best strategy for the Group
The Group faces changing markets and consumer practices and needs to be agile in responding to them and to have the right capabilities to achieve its strategic objectives. It needs to be able to execute entry into new and changing markets or consumer channels and be able to grow the business through corporate acquisitions and execution of strategic initiatives. Failure to do so could have a significant impact on the Group’s financial results.
The Group ensures that its strategy is regularly updated to reflect the constantly changing and developing entertainment industry. It also continuously considers its capability to deliver its strategic objectives in terms of people, technology, knowledge and resources. It continues to invest in new business development and to identify and convert targets for acquisition. It has developed reporting of key performance indicators to track strategic targets and initiatives.
Operational
Recruitment & retention of employeesFind the best people for the business to deliver its strategy
The performance of the Group is dependent upon its ability to attract, recruit and retain quality employees in a highly competitive labour market.eOne competes in global market for talent, in particular in North America where the market price of good talent continues to inflate, placing pressure on eOne to maintain competitive compensation and benefit packages. In addition, the Company emphasises maintaining a positive culture and working environment so it is a preferred employer and partner for talentThere are many contributory factors that affect the Group’s ability to retain key employees; some of which are in its control and some which are not (economic climate, sector growth and skill demand). The impact of failing to retain key employees can be high due to loss of key knowledge and relationships, lost productivity, hiring and training costs, and ultimately could result in lower profitability.
The Group has created a competitive remuneration and retention package including bonus and long-term incentive plans to incentivise loyalty and performance from its existing highly skilled and experienced people. A Group-wide employee Sharesave Scheme aligns employees with the measure of shareholder success and is a popular benefit for employees. Succession planning and organisational development, including leadership development, help to ensure that employee capabilities are improved, as well as broader overall employee engagement initiatives including communication, eOne Values and corporate social responsibility initiatives.Whilst competition for the right people is always challenging, the Group’s increasing profile in the industry is helping to attract and retain the best people.See page 59 for more information on how we manage our people.
Source & select the right content at the right priceBuilding a valuable content portfolio
There is a risk of significant impact on the margins of the business if the Group is unable to successfully source and select the best content or fails to effectively monetise it.Given the changing consumer appetite for shows and formats, it is important that the Group continues to develop its content sourcing and selection capabilities to ensure that the Group’s content portfolio remains diversified and valuable. The Group continues to engage with the creative community at all levels to help ensure continuing access to content. Different strategies are pursued including first look, output and production/co-production deals.
The selection of content is based upon the robust use of data and financial analysis to help drive the most optimal allocation of capital to maximise the financial return from the Group’s content portfolio.Corporate acquisitions of content-producing companies provide additional direct access to content, together with the ramping-up of in-house production capabilities. The Group has recently entered into a number of new arrangements which provide it with greater control over the content development process, including new outputs deals where the Group is able to exert more control over product (e.g. Amblin, Annapurna) and development partnerships with the best creative talent in the industry (e.g. Makeready). The Group continues to look for opportunities to secure its content pipeline – during the financial year, the acquisition of a controlling stake in Whizz Kid Entertainment was completed and immediately following year end the acquisition of Audio Network Limited was completed; the Group continues to explore corporate acquisitions that would enhance its content creation capabilities.
Protection of intellectual property (IP) rightsProtecting content and brands
There is a risk that the Group’s ability to exploit its content and brands is not optimised due to ineffective IP protection or piracy. Effective IP protection will ensure that the Group maximises the opportunity to create value. The Group proactively protects its rights, in particular its digital rights, through monitoring of the internet and selected websites, implementing its brand protection strategy and regularly monitoring its portfolio of trademark registrations. It uses tier-one service providers for digital asset management and utilises expert legal support services where required.
The Group recruited a General Counsel at the start of the year to oversee and monitor Group-wide legal activities which will facilitate a more consistent approach to IP protection.
Our principal risks and uncertaintiesPrincipal risks and the mitigating activities in place to address them are listed below. The principal risks were reviewed periodically during the year as part of the Group’s risk management process. There have been no significant changes in the risks monitored during the year and no new risk categories identified.
SR
G
FS
53entertainmentone.com

PRINCIPAL RISKS AND UNCERTAINTIES CONTINUED
Risk Why How
Operational continued
Regulatory complianceOperating within the law and seeking to optimise efficiency
The Group operates in a highly regulated environment; changes in this environment can impact the Group and its partners.The Group has to comply with statutory and other regulations that fall into the following main areas: criminal/legal, financial (including taxation), employee (including health and safety), data protection and listing regulations.Failure to do so could have a significant impact on the Group’s financial results.Data protection is considered separately below.
The Group carefully monitors the regulatory environment within which it operates and ensures that its strategies remain appropriate through its corporate planning processes. A dedicated tax department ensures that the Group’s tax compliance position is up-to-date across the Group. The Group continues to publish its tax strategy, in line with the UK requirement to do so.From an operating perspective, the Group’s international footprint ensures that its regulatory risk is spread across a number of different jurisdictions.The Group operates under a Code of Business Conduct and policies that are applicable to all employees, including a formal Anti-bribery and Corruption Policy and a Whistleblower Policy.On an annual basis all eOne employees formally acknowledge their compliance with the Group’s key policies and senior management assert that their team members have received and understood these policies.The General Counsel and Company’s HR department oversee such activities across the Group.
Information security/data protectionProtecting eOne and stakeholders’ data
Information security
There is a risk of significant impact on performance of the Group including reputational factors through not having robust information security controls, which could result in unauthorised disclosure, modification or deletion of data.Data protection
There is a risk that the Group does not process personally identifiable information (PII) in compliance with local laws or make employees aware of their obligations when processing PII on behalf of the Group. Data breaches, including losses, could result in significant fines and reputational impact depending upon the seriousness of the breach.
The Group monitors key cyber security risks and is constantly evolving its security measures and internal policies and guidance. Network and infrastructure penetration testing is performed, security patches are updated regularly and an external information security monitoring service is retained on an ongoing basis. The Company has an ongoing cyber security maturity programme investment underway to improve the resiliency of the business and systems to evolving cyber security threats. Legal and technical advice is taken on the security of any websites and data marketing requests. An Incident Response Team, made up of senior management, is in place to react to any information security incidents supported by an incident response plan that includes a data breach playbook.Sensitive and confidential data is restricted to specific user groups and policies are in place and made available to employees as required. Data protection and retention policies are reviewed regularly and enhanced as required, including response plans.Changes required to address the General Data Protection Regulation regime in the European Union have been identified and acted upon. Other than its internal employees’ and production cast and crew’s personal data, the Group retains or uses very little customer personal information; and this is typically simple contact information rather than more sensitive data.
Business continuity planning (BCP)Maintaining operations in the event of an incident or crisis
There is a risk of significant impact on the financial performance of the business through not having robust BCP and IT disaster recovery plans, processes and testing. This could also arise from a third party service provider contract not providing adequate cover should their service be interrupted.
BCPs have been implemented across the Group on a location-by-location basis, supported by the creation of local crisis management teams and a widespread IT disaster recovery programme which can recover all major systems; their recovery was tested during the year. Incident response plans have been rolled out to all major locations and form the initial response mechanism of the BCP, with smaller locations utilising simplified BCPs.
Financial
Financial riskSeeking and maintaining financing to support the delivery of the Group’s strategic objectives
There is a risk of significant impact on the financial performance of the business or its ability to trade if an adequate funding facility is not maintained to allow the Group to operate. Further, failure to adequately control financing or foreign exchange costs could have a material impact on the Group.
The Group has an established financial management system to ensure that it is able to maintain an appropriate level of liquidity and financial capacity and to manage the level of assessed risk associated with financial instruments.The Group’s Treasury department is principally responsible for managing the financial risks to which the Group is exposed. The management system also includes policies and delegation of authority controls to reasonably protect against the risk of financial fraud in the Group.The Group continues to assess and respond to the implications of Brexit and expects there to be no significant exposures.
eOne Annual Report and Accounts 201954

Viability statement1) Assessment of prospects
Context for the assessment of prospectsEntertainment One is a leading global entertainment business. For the financial year commencing 1 April 2018, the Group operated through two business segments – the Film, Television & Music Division and the Family & Brands Division.
The Group’s business model and strategy underpin eOne’s growth trajectory, supported by the Group’s business plans. The Group’s strategy has been consistently in place for a number of years, with changes to the Group’s detailed operating model evolving in line with changes to the entertainment market in which it operates. The strategy and its execution continue to be subject to ongoing monitoring and development through the Group’s long-term planning process, as described below.
The Board continues to take a conservative approach to the execution of the Group’s strategy and, from a risk perspective, a system of internal controls and an escalating system of approvals is in place. The Board receives regular updates on the Group’s financial performance via monthly management accounts and formally approves the outputs of a robust budgeting and forecasting process.
The Group’s model is to enable and create world class content and it operates a portfolio approach at all levels of the business to manage its risk profile. The Group’s balance of activities across film/television/music and family brands provides stability to the Group’s financial performance, protecting against cyclical performance in any one business area. Within each business area, the Group also benefits from a portfolio model – the Group sells television shows to over 150 countries and has a balance of scripted and non-scripted output and new and long-standing productions; the Group has over 1,600 licensing and merchandising contracts in place across different family brands in multiple territories; and the Group has multiple theatrical film releases a year across its different territories to minimise the risk of under-performance of any individual film. The Group derives a significant proportion of its in-year film, television and music revenues from library titles and family revenues from licensing contracts which are subject to minimum guarantees.
The Group has very good visibility of its short-term revenues, with a significant proportion of television
productions committed or greenlit before the start of any financial year and a large proportion of the film slate committed up to 12 months in advance. Conversely, the Group is able to manage its discretionary spend on a very short time horizon, which allows good control over short-term profitability. From a cash perspective, the Group makes cash outlays for its content acquisitions typically on delivery and its television productions are generally only greenlit on the basis that approximately 85% of the production budget is underwritten, which drives a low cash risk profile.
eOne’s capital structure aligns with delivering the Group’s strategy, with significant long-term, non-amortising, fixed-rate debt provided via senior secured notes and a term loan and short-term working capital needs being funded via a flexible revolving credit facility.
Consumer demand continues to grow in the markets in which the Group operates and eOne anticipates that audiences will increasingly focus on the quality of the content that they consume, gravitating towards premium television series, film and speciality genres. This market dynamic plays to Entertainment One’s strengths and supports the Group’s strategy, which targeted doubling the size of the business in the five years to 2020.
The assessment process and key assumptionsThe Group’s prospects are assessed primarily through its annual strategic planning process. This process culminates in the development of the Group’s three-year business plan, led by the CEO, CFO and Executive Committee. The plan, comprising a detailed budget and two plan years, is presented to, and approved/adopted by, the Board on an annual basis for each new financial year.
The planning process is led by the Divisional teams for each area of the business with the outputs comprising Divisional business plans including market, regulatory and competitive context, as well as an assessment of industry developments.
The Group Finance team consolidates the Divisional plans at a Group level, including a determination of the appropriate levels of contingency and consideration of the financing, treasury and risk management aspects of the overall business plan, as well as other corporate development activity, where appropriate. The Board participates fully in the annual strategic planning process through a full-day strategy review session at which members of the Executive Committee present detailed plans for each area of the business.
SR
G
FS
55entertainmentone.com

PRINCIPAL RISKS AND UNCERTAINTIES CONTINUED
The Board’s role is to challenge the assumptions made by executive management, consider whether the plan continues to take appropriate account of the external environment including macro-economic, regulatory, social and technological changes, and to confirm that the plan continues to meet the risk profile agreed by the Board.
The output of the annual strategic planning process is a set of detailed plans and objectives for each Division, as well as an analysis of the risks and opportunities that are perceived as relevant to the plans. The latest updates to the Group’s business plan were finalised following this year’s strategic planning process. This review considered the Group’s current position and the development of the business as a whole over the next three years to 31 March 2022.
The first year of the strategic plan forms the Group’s operating budget for the year ended 31 March 2020, which is subject to a re-forecast process in November 2019 and February 2020. The second and third years of the plan, to 31 March 2022, necessarily have a greater reliance upon assumptions than the first year of the plan.
Assumptions in the financial forecasts supporting the Group’s growth strategy reflect:
• Revenue and underlying EBITDA growth across all business areas
• Re-focusing from rights acquisition to content creation• Securing content rights for the global market whilst
maintaining greater control over budget and release slate
• Ongoing integration across the Group, adapting to the evolving entertainment market
• Continued investment in productions and content to support the growth plans
The Group completed a re-financing in December 2015, which delivered significant long-term, non-amortising, fixed-rate debt via senior secured notes (due 2022) and with short-term working capital needs being funded via a new, more flexible super senior revolving credit facility. During FY18, the Group issued an additional tranche of senior secured notes in support of the acquisitions, taking the total amount in issue to £355 million. The Group has increased the capacity of its revolving credit facility to reflect the working capital needs of the growing business on an ongoing basis, as necessary.
During the current financial year, the Group re-financed its revolving credit facility to deliver an increased facility with improved borrowing terms and a longer maturity date to December 2023. Following the end of the financial year, the Group put in place a new term loan to support the acquisition of Audio Network Limited.
The Group continues to actively monitor the debt capital markets and considers re-financing options that might further enhance its capital structure.
From a macro-economic perspective, the Group’s business plan assumes a low-growth economic environment in the territories in which it operates, and in the global economy more generally.
The Group’s business plan has been developed in the context of the Group’s principal risks and uncertainties that are set out in the table on pages 53 and 54. The purpose of the table of principal risks and uncertainties is primarily to summarise those risks and uncertainties which could prevent the Group from delivering on its strategy.
A number of the risks and uncertainties are qualitative in nature and their impact cannot be easily quantified, but they have been considered as part of the development of the Group’s business plan. Of the risks and uncertainties noted in the Annual Report, the directors have categorised the following risks and uncertainties as “qualitative risks”: recruitment & retention of employees; regulatory compliance; information security/data protection; and business continuity planning. Whilst these risks cannot be easily quantified through financial modelling, they are monitored as part of the Group’s risk management process and each is mitigated through the risk management plan that the Group operates, as summarised on page 51.
The following risks and uncertainties have been categorised as “quantitative risks”: strategy formulation & execution; source & select the right content at the right price; protection of intellectual property rights; and financial risk. These risks can be understood in a quantitative way and have been included in the detailed assessment of the Group’s viability, through financial modelling and sensitivity analysis, as noted below.
eOne Annual Report and Accounts 201956

2) Assessment of viability
The Group has selected the three-year period to 31 March 2022 as its assessment period for its viability statement on the basis that this period is consistent with prior years and reflects the Group’s regular business planning cycle for which detailed plans have been adopted by the Board.
Although the Group’s three-year plan to 31 March 2022 reflects the directors’ best estimate of the future prospects of the business, they have also tested the potential impact on the Group of a number of scenarios over and above those included in the plan, by quantifying their financial impact and overlaying this on the detailed financial forecasts in the plan.
These scenarios, which are based on the “quantitative risks” set out above, are representative of a “reasonable worst case” derived from lower than expected operational performance of the business and forecast movements in foreign exchange rates. The reasonable worst case is then tested against the Group’s financial covenants and facility headroom to ensure that sufficient headroom still exists to allow the Group to continue in operation and to continue to meet its liabilities as they fall due.
The reasonable worst case scenario tested for the Group’s assessment of viability included:
• Quarterly revenue decreases varying by segment in FY20 (varying from 1.5% to 10.0%, as visibility of performance diminishes with time) and the resulting impact on underlying EBITDA
• Annual revenue decreases varying by segment of up to 15.0% for FY21 and up to 20.0% in FY22, with decreases driven by both timing of releases/deliveries and permanent under-performance, and the resulting impact on underlying EBITDA
• Additional incremental working capital outflows over the plan period, reaching a level of £40 million by FY22
• Foreign exchange sensitivity based on forecast rates
The results of this stress testing showed that under the reasonable worst case, a good level of headroom continued to be available against the Group’s financial covenants and facility limits, which would allow the Group to continue to operate in a normal way.
The Group has experience in reacting effectively to and managing challenges to performance to ensure that the Group’s banking covenants are maintained. Management has historically demonstrated its ability to manage costs to increase underlying EBITDA and improve cash in the short term and long term, which would further mitigate the risk of a “reasonable worst case” scenario taking place in reality.
This flexibility arises due to the Group’s business model, where the most material cash outflows comprise payment of minimum guarantees/royalties to producers and advertising spend, the timing and quantum of which management are able to influence in a substantive way. Within our production businesses, the Group makes extensive use of non-recourse production facilities. Moreover, the Group has robust financial controls which continuously monitor cash requirements and the availability of funds on short, medium and long-term time horizons which enable the Group to identify any issues and plan actions to address these on a proactive basis.
Additionally, the Group considered a scenario that would represent a serious threat to its liquidity, a “forced breach” scenario, where assumptions were imposed that would result in the Group breaching its financial covenants/facility limits. Based on the changes to operating assumptions required to reach this forced breach outcome, and the ability of management to put in place mitigating actions, this scenario is considered extremely unlikely to occur.
3) Viability statement
The Audit Committee take the lead on reviewing and challenging the assumptions and methodology supporting the Group’s viability statement as part of its responsibility for the review of the Group’s consolidated financial statements and its assessment of the Group’s going concern basis of accounting.
On an annual basis, the Audit Committee carries out such an assessment of the Group’s viability over the chosen assessment period and makes a recommendation to the Board in this respect.
Based on their assessment of prospects and viability above, supported by the work of the Audit Committee, the directors confirm that they have a reasonable expectation that the Group will be able to continue in operation and meet its liabilities as they fall due over the three-year period ending 31 March 2022.
SR
G
FS
57entertainmentone.com

WE EXPECT EXCELLENCE
From each other and our partners.
WE’RE DYNAMIC
We find a way to get things done.
WE’RE PASSIONATE
We care about each other’s success.
CORPORATE RESPONSIBILITY
Maintaining close relationships with our local communitiesThe Group’s corporate responsibility framework sets global standards and supports a significant number of local initiatives in the communities in which eOne operates.
The Group recognises that the performance of its business is reliant on close relationships with a range of stakeholders, including customers, suppliers, investors, employees, the wider community and the environment. The following is a summary of the many corporate responsibility activities in which we are involved.
The Group operates a Code of Business Conduct which sets out standards of conduct and business ethics which the Group requires its employees to comply with, and which includes provisions covering the Group’s Anti-bribery and Corruption Policy and its Whistleblowing Policy.
Our valuesThe Group’s operations are guided by a set of shared values that highlight the Group’s distinctiveness and help tell the eOne story. The values communicate what is important to our business and what makes us stand out in the industry.
They influence our day-to-day interactions, how we treat each other and our partners, and help us in our decision-making processes. Our values support the recruitment and retention of our teams, shape our organisational culture and contribute to our overall success.
eOne Annual Report and Accounts 201958

430 77
273 282 65
employees in Canada employees in Europe
(38%) (7%)
employees in USA employees in UK (24%) employees in rest of world (6%)
(25%)
People
The Group recognises that the skills, motivation and regular Town Hall video-conferences to employees
energy of our internal talent are key drivers for success. from our CEO and senior leaders of each Division
The Group’s talent-driven strategy and organisational regional meetings held in four territories
structure aim to ensure that our teams are aware of our at least bi-annually
goals and are clear on how their roles help the Group regular local social events to coincide
succeed. eOne is fundamentally a people business and with major holidays
the ability to attract, recruit and retain the best people is the eOne Academy leadership development
key to our success. programme, which is available to all people
managers across the organisation
We seek to ensure we have app pro riate processes to eOne Rewards, a colleague-driven nomination
assess, manage and develop our people’s leadership and recognition programme available to all
skills, talents and experiences throughout employees globally
the organisation. our intranet site and Yammer, our Group-wide
corporate social media platform
Driven both by leadership and employee-led committees, regular local office newsletters as well as a monthly
the Group has numerous initiatives to promote employee global employee newsletter, eOne Connect
engagement, including:
59
•
•
•
•
•
•
•
SR
G
FS
entertainmentone.com

CORPORATE RESPONSIBILITY CONTINUED
Australia Benelux Brazil Canada Germany Hong Kong Shanghai Spain UK USAF
(%)M (%)
F (%)
M (%)
F (%)
M (%)
F (%)
M (%)
F (%)
M (%)
F (%)
M (%)
F (%)
M (%)
F (%)
M (%)
F (%)
M (%)
F (%)
M (%)
CEO – – – – – – 0 100 – – – – – – – – – – – –C–Suite – – – – – – 33 67 – – – – – – – – 0 100 25 75L3 – – – – – – 46 54 – – – – – – – – 27 73 21 79L4 100 0 0 100 – – 56 44 100 0 100 0 – – 0 100 66 34 40 60SVP/Head of 100 0 – – – – 67 33 – – – – – – – – 0 100 67 33VP 100 0 – – – – 50 50 0 100 100 0 – – – – 47 53 54 46Director 71 29 50 50 50 50 58 42 100 0 100 0 – – 100 0 72 28 43 57Manager 69 31 25 75 100 0 58 42 40 60 80 20 0 100 50 50 62 38 61 39Supervisor/Expert 50 50 50 50 – – 47 53 0 100 – – – – – – 67 33 40 60Analyst/Specialist 25 75 75 25 – – 46 54 – – – – – – 71 29 45 55 41 59Administrator/Assistant/Coordinator 90 10 60 40 – – 68 32 100 0 100 0 100 0 67 33 80 20 59 41Grand Total 71 29 53 47 75 25 55 45 55 45 94 6 50 50 64 36 63 37 49 51
• weekly audio message from our CEO, eOne Minute• health and well-being initiatives organised in our
office locations, including on-site fitness classes, green living and wellness workshops and complimentary healthy snacks
• various athletic teams and events, including kickball, hockey and softball teams
• team building events• frequent film screenings, premieres, concerts • access to content libraries
Through our annual succession review and internal leadership framework we also aim to nurture talent and provide our people with a framework to advance their careers and provide eOne with its future leaders. The Group continues to offer an employee share purchase programme entitled Share’d Success (formerly known as the Sharesave Scheme), which gives individual team members a direct alignment with the Company’s shareholders in driving performance of the Group. Just over 120 employees enrolled in the 2018 programme, taking the total number of employees enrolled to 394. The Group sends annual invitations to all employees, to ensure that team members are able to continue to take advantage of the benefits of the Share’d Success programme and the Group can continue to benefit from the increased engagement of its workforce.
We are committed to equality and diversity in our workforce and, in addition to employing people with a wide mix of ethnic and cultural backgrounds, we also have a balance between genders. Gender mix across the business is as per the tables below:
Diversity & InclusioneOne has always been an organisation where people feel welcome. From community groups to our many social events and communication platforms, “the people” is the common answer to why our employees join and stay at eOne. We know that our people are also our greatest asset and we have policies in place that reinforce our commitment to a culture where employees of all identities can succeed and thrive.
As we grow a more global and complex entertainment business, we recognise and value the increased creativity that comes from our diverse and dynamic employees. To support and build upon this we are formalising our diversity and inclusion efforts through the use of programmes that we believe can accelerate and strengthen our competitive advantage.
Earlier this year we surveyed our employees and asked for feedback related to the diversity of our workforce. We formed a Diversity & Inclusion Council with representation across all sections of the business, geographies, and demographics. The inputs from our employees and the council will help equip our human resource and business leaders in planning programmes that focus on our greatest opportunities to support employee excellence and address gaps in the industry and regions we work.
Diversity & Inclusion Council mandate
eOne supports and celebrates our inclusive family, be they employees, partners, suppliers or talent. eOne is committed to having a culture where all employees are valued and respected. The Diversity & Inclusion Council’s mandate is to promote a culture of diversity and inclusion at all levels, through educating, identifying, developing, and supporting initiatives which aid in the recruitment, advancement, and retention of employees, with respect and appreciation of differences in identity.
eOne Annual Report and Accounts 201960

GroupFamily
& Brands Film & TV Music Secret Location Renegade WhizzKidF (%) M (%) F (%) M (%) F (%) M (%) F (%) M (%) F (%) M (%) F (%) M (%) F (%) M (%)
CEO 0 100 – – – – – – – – – – – –C–Suite 50 50 0 100 0 100 0 100 – – – – – –L3 46 54 67 33 27 73 0 100 0 100 0 100 – –L4 70 30 73 27 39 61 40 60 33 67 100 0 – –SVP/Head of 100 0 – – 71 29 – – – – 0 100 0 100VP 25 75 50 50 59 41 40 60 – – 33 67 100 0Director 39 61 81 19 69 31 46 54 29 71 0 100 100 0Manager 53 47 82 18 58 42 50 50 67 33 0 100 – –Supervisor/Expert 69 31 – – 80 20 11 89 12 88 0 100 100 0Analyst/Specialist 44 56 – – 67 33 50 50 50 50 0 100 0 100Administrator/Assistant/Coordinator 68 32 88 13 67 33 60 40 100 0 67 33 – –Grand Total 53 47 79 21 61 39 40 60 33 67 26 74 67 33
Building a gender equal workforce
At the moment, we are focused on gender parity and we welcome regional pay reporting requirements as it forces transparency and delivers critical insights into our business. To prepare, we have invested in HR systems to deliver accurate reporting both where required and in all areas of eOne. We are organising our internal resource capabilities to explore the data and respond with meaningful guidance.
Within each of our regions we support initiatives that champion women in industry with many of our female executives acting as advocates both internally and externally for women in entertainment. People programmes are in development that support women staying in the workforce and we hope to encourage more women to consider eOne as a place to grow their careers.
Women occupy one quarter of the C-Suite at eOne which we know is considered average across all industries and we can improve. Our pipeline of female leaders is strong amongst our management levels at 52% representation and, overall, women make up close to 60% of the total employee population.
Using the data we report, we’re able to work with our Diversity & Inclusion Committee, HR, and leaders to identify barriers to gender parity. Over the next year we’ll start to formalise plans that create unobstructed paths to equality in our workforce.
Health and safetyThe Group continues to adhere to health and safety policies implemented across all of its operations. These policies meet the minimum legal requirements of the countries in which the Group operates and emphasise the principles of good safety management. The Group is committed to providing a safe working environment and to caring for the health and safety of its employees, visitors and contractors.
Regular health and safety reviews are carried out in the offices of the Group. Each location has a nominated individual responsible for health and safety and for ensuring a safe environment for our employees.
We recognise that health and safety is an integral part of our operations. Our services do not pose great risk to either our employees or our customers. However, we work to maintain a safe environment at all times.
Highlights from each Division:
• Family & Brands maintains exceptional representation with women occupying 70% of positions in senior leadership and representing 79% of all positions across the entire Division.
• Film & Television’s female representation in senior leadership levels is 35% with an overall representation of 61%.
• Music is an area where fewer women occupy senior leadership roles. Only 25% of senior leadership roles are occupied by women and 40% overall.
SR
G
FS
61entertainmentone.com

CORPORATE RESPONSIBILITY CONTINUED
Charity and communityThe Group and its employees sponsored or supported many charitable initiatives involving both professional and non-profit organisations in all of our territories during the year.
From across the Group, a donation totalling C$30,000 was made to two charities: Kiva Microfunds and Water.org on behalf of all eOne employees. Selected by a committee of eOne employees, both charities share eOne’s commitment to growing communities and championing entrepreneurial spirits around the world.
In addition, over C$182,000 of charitable donations were generated by local eOne Gives Back teams for a variety of charitable organisations around the world. eOne Gives Back is dedicated to establishing and maintaining a relationship with local and national charity/non-profit groups that are community driven and/or industry-related and have presences in each of our offices. Below are a few initiatives that took place across the globe:
In Toronto…
• Throughout the year, the Toronto eOne Gives Back community group hosted several employee events to raise funds for Nellie’s Shelter, an organisation that operates programmes and services for women and children who are experiencing oppressions such as violence, poverty and homelessness. A silent auction, a monthly bar cart, family fun day, bowling tournament, raffle and Big Bike Ride assisted in raising C$14,000 for the organisation.
• In addition to Nellie’s Shelter, eOne partnered with local organisation Moorelands, to provide much-needed gifts and necessities to 24 families in need during the holiday season; participated in a blood drive for Canadian Blood Services; ran a winter coat drive for Keep Toronto Warm; a book drive for Links Across Borders; and a donation of A/V equipment to POV 3rd Street.
• For the past five years, a team of eOne runners has participated in the Sporting Life 10k race to raise money for local charity Camp Oochigeas, which supports children and families affected by cancer. Most recently, the team raised more than C$10,000 in donations during this year’s campaign.
In Montreal…
• eOne employees raised C$600 for Fondation Tel-Jeunes, a free and confidential professional counselling service available to young people and parents in Quebec.
• Raised C$500 for Fondation Je Veux Jouer (Let Me Play Syria), an organisation that focuses on the importance of play and peace for Syrian children in refugee camps.
• Raised C$250 for Fondation Institut de Cardiologie, which raises and administers funds to support research, care, teaching, prevention, rehabilitation, and the assessment of new technologies at the Montreal Heart Institute, thereby encouraging excellence in this world-class institution at the service of Quebecers.
• Raised C$250 for Moisson Montréal, a registered charitable organisation that gathers food donations and basic products all year long and distributes them free of charge to community organisations on the Island of Montreal. In addition to fundraising, team members have volunteered in making food baskets. With eOne’s support, they have become the largest food bank in Canada.
• The team also participated in a number of events and initiatives to support the local film and television industry, including sponsoring events for Fondation de L’Inis (National Institute of Image and Sound) and Kino Montreal’s annual Gala event.
In New York…
• In November and December, the team held a food drive with Move for Hunger raising US$1,000 in funds to provide food for dozens of families.
In Nashville…
• eOne Music Nashville hosted the 2018 Creatives Day – a non-profit that connects young adult artists to resources in Music, Technology & Creative Business. Over 50 original songs were created between the Hutton Hotel’s writing studio and the space at eOne Music Nashville. 256 hours of continuing education and free studio time were given.
• The community impact of this partnership with Creatives Day created a home for more than 30 emerging Nashville songwriters in partnership with Entertainment One.
• In addition, through eOne the IndieBlue team hosted an industry retreat for up and coming independent songwriters, producers and artists with a two-day bootcamp of connecting music professionals and educating them on the best practices currently being made in the music business.
eOne Annual Report and Accounts 201962

In Los Angeles…
In the UK…
•
•
•
The team organised a number of fundraising events
including a Thanksgiving Food Drive, collecting
non-perishable food items and toiletries for the
Westside Food Bank, which distributes items to less
fortunate families; as well as a Holiday Toy Drive
supporting Toys for Tots, where gift items for infants
and teens were collected and distributed to families
in need over the holiday season.
In addition, a blood bank drive was facilitated at our
Renegade office, where people donated blood to a
local blood bank.
eOne’s UK teams continued to focus efforts on
supporting two main charities, The Cardinal Hume
Centre and Fitzrovia Youth in Action (FYA), raising a total
of £6,000 for both organisations through participation
in such events as games nights, drinks trolleys, and a
Christmas auction.
Located on Warren Street near eOne’s London office,
FYA provides support for disadvantaged young children,
engaging them in activities to promote a healthier
lifestyle, aid them in their studies and increase their
employability as well as enhancing community cohesion.
The Cardinal Hume Centre works with homeless young
people and families in need, focusing on employment,
housing, education and skills, and legal status.
-themed charity events are ongoing across the
globe, most notably in Latin America, Europe, Australia,
New Zealand, the United Kingdom and the United States
– each with impactful results in awareness and
fundraising alike. Some highlights:
A collaboration with Save the Children in the United
Kingdom has led to over £782,000 in fundraising to
date since 2001 to help save children’s lives across
the world. The annual “Muddy Puddle Walk”
campaign was embraced by 10,000 nurseries and
families across the UK and garnered two awards: a
Business Charity Award and a Progressive Preschool
Award. is also brand ambassador for Save
the Children’s Christmas Jumper Day which
encourages people to wear Christmas jumpers in
return for a donation to charity. As part of this activity,
licensees created bespoke Christmas product
with 10% donations to Save the Children. Also, in the
UK, the brand worked with Waterbabies and
Babyballet franchises to invite little swimmers and
dancers across the UK to take part in -
themed “Danceathon” and “Splashathon” events.
In addition, a partnership with Book Trust, the UK’s
largest children’s reading charity, has led to the
creation of over 1 million -themed booklets,
encouraging healthy bedtime routines across the UK.
63
Peppa
Peppa Pig
Peppa
Peppa Pig
Peppa
Ofcial Secrets
Light o� my Li�e
Late Night
The Deputy
SR
G
FS
entertainmentone.com

CORPORATE RESPONSIBILITY CONTINUED
• In the US, The Muddy Puddles Project is the official charity partner for Peppa. Its motto is “Always Jump in Muddy Puddles!” and it is the fundraising platform for The Ty Louis Campbell Foundation, which was inspired by Ty Campbell, a boy who dreamed of jumping in muddy puddles just like Peppa when his cancer was cured. The project embodies the act of kids being kids in honour of those who can’t. With Peppa’s help, hundreds of thousands of dollars have been raised to support childhood cancer research, including over US$100,000 at each of the one-day annual “Mess Fest” events held in 2016-2019. Other Peppa-supported events for The Muddy Puddles Project include a “Peppa Pig Celebrity Auction” in partnership with eBay, a national comprehensive early childhood educator campaign created with The Education Center that garnered over 1.4 million teacher impressions and focused on teaching empathy and kindness to children, and a collaboration with The Little Gym to host Peppa Pig-branded birthday parties at over 200 of their franchise locations in the US and Canada. The Muddy Puddles Project has taken part in the 2018 NY Yankees 10th Annual Hope Week, Nickelodeon’s annual Worldwide Day of Play, and Bentonville Film Festival’s Kids Fest activities, with Peppa making appearances at each and spreading the word to her vast audience about the important cause.
• Peppa has contributed to other charitable efforts in the US including the annual Good+ Foundation’s “Bedtime Bash” in Central Park, a Mothers 2 Mothers “Baby Center blog” on m2m.org, a special 2018 Movember campaign, and the “Magical Toy Store for Kids with Cancer” via the Ohr Meir Foundation.
Charity and kindness are central to the values presented in Peppa Pig, and the brand works tirelessly with our partners to put smiles on faces and spread hope across the globe with charitable efforts and activations like these.
For PJ Masks in the US, we have teamed up with the Pajama Program, a national charity that empowers families and caregivers by providing tools for bedtime so that children have the opportunity to awaken the next day, with the energy to thrive – all through the superpower of sleep! PJ Masks will help spread the word about the Pajama Program’s heroic efforts in 2019. Recent activity includes a special story time event with the PJ Masks in celebration of World Sleep Day and a special back-to-school celebration is planned for later this year as well. Additional charitable efforts include participation in the impactful and well-attended annual Hero Day and Halloween celebrations held by CandlelightersNYC, whose core mission is to support and encourage families of children battling pediatric cancer. Catboy, Owlette, and Gekko will bring some added joy to the families attending Jessica Seinfeld’s Good+ Foundations’ Halloween Bash in Los Angeles this October. The annual day of family fun, which resembles a day at the state fair, hosts over 700 guests (from low-income families to Hollywood celebrities) and last year reportedly raised more than US$300,000 for the organisation, which helps low-income families achieve financial stability.
Ben & Holly’s Little Kingdom collaborated in the UK with Global’s Make Some Noise and the Turtletots swimming franchise, joining in an annual co-branded Splash Some Noise event from 2017 and 2018, generating over £90k to date.
In addition to these fundraising initiatives, the Company has provided donations of merchandise to many charities over the year, including Cardinal Hume, the Rainbow Centre and Save the Children.
In Spain…
• The Madrid office continues to support a number of local organisations by providing gift-in-kind donations to various initiatives including Asociación Las Secuoyas, an event which raises awareness of bullying among children between the ages 3 and 12; and ATZ Association, an organisation that cares for children and young people at risk of social exclusion.
eOne Annual Report and Accounts 201964
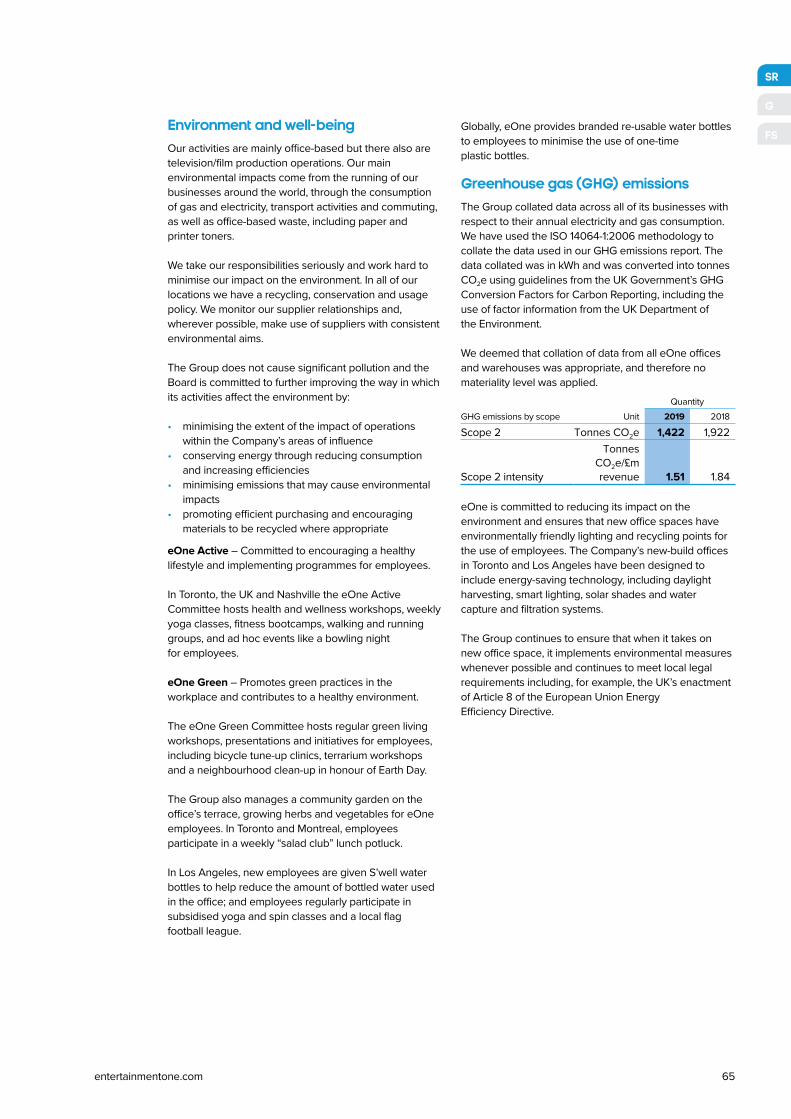
Environment and well-beingOur activities are mainly office-based but there also are television/film production operations. Our main environmental impacts come from the running of our businesses around the world, through the consumption of gas and electricity, transport activities and commuting, as well as office-based waste, including paper and printer toners.
We take our responsibilities seriously and work hard to minimise our impact on the environment. In all of our locations we have a recycling, conservation and usage policy. We monitor our supplier relationships and, wherever possible, make use of suppliers with consistent environmental aims.
The Group does not cause significant pollution and the Board is committed to further improving the way in which its activities affect the environment by:
• minimising the extent of the impact of operations within the Company’s areas of influence
• conserving energy through reducing consumption and increasing efficiencies
• minimising emissions that may cause environmental impacts
• promoting efficient purchasing and encouraging materials to be recycled where appropriate
eOne Active – Committed to encouraging a healthy lifestyle and implementing programmes for employees.
In Toronto, the UK and Nashville the eOne Active Committee hosts health and wellness workshops, weekly yoga classes, fitness bootcamps, walking and running groups, and ad hoc events like a bowling night for employees.
eOne Green – Promotes green practices in the workplace and contributes to a healthy environment.
The eOne Green Committee hosts regular green living workshops, presentations and initiatives for employees, including bicycle tune-up clinics, terrarium workshops and a neighbourhood clean-up in honour of Earth Day.
The Group also manages a community garden on the office’s terrace, growing herbs and vegetables for eOne employees. In Toronto and Montreal, employees participate in a weekly “salad club” lunch potluck.
In Los Angeles, new employees are given S’well water bottles to help reduce the amount of bottled water used in the office; and employees regularly participate in subsidised yoga and spin classes and a local flag football league.
Globally, eOne provides branded re-usable water bottles to employees to minimise the use of one-time plastic bottles.
Greenhouse gas (GHG) emissionsThe Group collated data across all of its businesses with respect to their annual electricity and gas consumption. We have used the ISO 14064-1:2006 methodology to collate the data used in our GHG emissions report. The data collated was in kWh and was converted into tonnes CO2e using guidelines from the UK Government’s GHG Conversion Factors for Carbon Reporting, including the use of factor information from the UK Department of the Environment.
We deemed that collation of data from all eOne offices and warehouses was appropriate, and therefore no materiality level was applied.
QuantityGHG emissions by scope Unit 2019 2018
Scope 2 Tonnes CO2e 1,422 1,922
Scope 2 intensity
Tonnes CO2e/£m revenue 1.51 1.84
eOne is committed to reducing its impact on the environment and ensures that new office spaces have environmentally friendly lighting and recycling points for the use of employees. The Company’s new-build offices in Toronto and Los Angeles have been designed to include energy-saving technology, including daylight harvesting, smart lighting, solar shades and water capture and filtration systems.
The Group continues to ensure that when it takes on new office space, it implements environmental measures whenever possible and continues to meet local legal requirements including, for example, the UK’s enactment of Article 8 of the European Union Energy Efficiency Directive.
SR
G
FS
65entertainmentone.com
Dear shareholders,
The reports on the following pages explain eOne’s We are committed to equality and diversity in our
governance arrangements in detail and describe how workforce and recognise the benefits to the Company
we have applied the principles of corporate governance of employing people with a wide mix of ethnic and
contained in the UK Code. cultural backgrounds, and a balance between genders.
The Company has a written policy that prohibits unequal
In terms of Board Leadership (Main Principle A of the treatment based on a prohibited ground under applicable
UK Code), eOne is headed by an experienced Board. human rights legislation, including race, ancestry, place
Each of the directors bring a skillset to the Board that, of origin, colour, ethnic origin, citizenship, record of
when taken collectively, provides strong leadership offences, creed, sex, sexual orientation, gender identity,
and stewardship for the Group. gender expression, age, marital status, family status and
disability which applies across the Group.
From the perspective of Board Effectiveness (Main
Principle B of the UK Code), the current Board has a eOne supports the conclusions and targets of both the
very broad range of skills and experience relevant Hampton-Alexander Review for women’s representation
to eOne’s operations. on boards and the Parker Review in respect of the ethnic
diversity of UK boards. At operational levels, the Group
During the year an externally facilitated evaluation of has a very well-balanced gender mix and there are a
the Board’s own performance was carried out, in line number of employee-led initiatives which promote a
with the requirements of the UK Code. culture of diversity and inclusion at all levels. Further
details in respect of our diversity policies are provided in
Our Audit Committee met six times during the financial the Corporate responsibility, Nomination Committee and
inues to operate effectively in its oversight Remuneration Committee sections of the annual report.year and cont
of the Group’s external auditor, PricewaterhouseCoopers
LLP, our internal controls and our external Our Nomination Committee carefully reviews succession
financial reporting. plans for the Board and makes recommendations on
changes to Board and Committee composition.
The Group continues to have a formal risk review Our Remuneration Committee has oversight for
process in place: the Executive Committee manages the succession planning below the Board and ensures that
risk process, reviews detailed risks and reports upwards our Remuneration Policy supports the overall succession
to the Audit Committee and the Board on a periodic planning process. The Nomination Committee continues
basis. Members of the Audit Committee also meet, to consider opportunities to add further independent
as required on an ad hoc basis, as the Company’s non-executive directors to the Board, particularly where
Disclosure Committee. this might increase the diversity of the Company’s directors.
The performance of the Group is dependent on its ability
to attract, recruit and retain quality people in a highly
competitive labour market and succession planning is
an important contributor to the long-term success of
the business.
66
Entertainment One continues to be focused on operating with high standards of corporate governance across the Group. Specifically, eOne ensures that it complies with the requirements of the UK Corporate Governance Code (“the UK Code”) with respect to the Board’s leadership of the Company and the Board’s effectiveness as a body – further details of how we achieve this goal are set out below.
CORPORATE GOVERNANCE
eOne Annual Report and Accounts 2019

The Board recognises the importance of interaction with operational management and access to senior management is achieved through regular business review presentations provided to the Board and a full-day planning meeting with executive management to review the Group’s strategy, budgets and three-year plans, as well as attendance by management at Committee meetings where appropriate.
The Internal Audit team continued with its formal internal audit programme across all of the Group’s main Business Units, building on the “baseline” reviews of the general control environment, as well as focusing on any specific risk areas highlighted by management.
Allan Leighton
Non-executive Chairman 20 May 2019
Corporate governance compliance statementThe Group fully supports the principles of corporate governance contained in the UK Code issued by the Financial Reporting Council in April 2016.
At 31 March 2019, the Group complied with the principles set out in the Code, other than in the following matter:
• the Code recommends that directors should have notice periods of one year or less; Darren Throop has an effective notice period in excess of one year (see further explanations in the Directors’ Remuneration Report on page 102, as well as details of how the Company plans to comply in future periods).
The following items required to be shown under Listing Rule 9.8.4 are disclosed as follows:
Disclosure requirement Cross-reference
Capitalised interest Note 15Long term incentive schemes Note 33Arrangements under which a director has agreed to waive emoluments
Note 35
Remuneration Committee
• Four independent non-executive directors
Nomination Committee
• Three independent non-executive directors
• One non-independent non-executive director
Disclosure Committee
• Three independent non-executive directors
Audit Committee
• Three independent non-executive directors
BoardMembershipNon-executive Chairman Six further non-executive directors Two executive directors
Key responsibilities• Determining strategy • Setting controls and Company values • Managing risk • Monitoring performance • Approving Board-reserved matters
For more information see page 78
For more information see page 86
For more information see page 90
Key responsibilities:
• Policy for remuneration of executive directors
• Implementation of Remuneration Policy, including agreeing executive director targets
• Succession planning process for senior management
• Alignment of Remuneration Policy with succession planning process
Key responsibilities:
• Composition, size and structure of the Board
• Succession planning process for executive directors
Key responsibilities:
• Ensuring the Company meets its disclosure obligations, specifically in relation to inside information
Key responsibilities:
• The integrity of financial reporting
• External auditor relationship
• Oversight of Internal Audit
• Internal controls and risk management
An overview of the Group’s corporate governance responsibilities is given below:
SR
G
FS
67entertainmentone.com

Allan Leighton Darren Throop Joseph Sparacio
Non-executive Chairman Chie� Executive Ofcer Chie� Financial Ofcer
Mark Opzoomer Michael Friisdahl Scott LawrenceSenior Independent Director Non-executive director Non-executive director
R A D N R N
Robert McFarlane Mitzi Reaugh Linda Robinson
Non-executive director Non-executive director Non-executive director
A D N R A D N R
N A
R D
Appointed March 2014 Appointed July 2003 Appointed November 2017
Appointed March 2007 Appointed November 2017 Appointed January 2016
Appointed November 2017 Appointed November 2016 Appointed March 2014
Nomination Committee Audit Committee
Remuneration Committee Disclosure Committee (as at March 2019)
BOARD OF DIRECTORS
eOne Annual Report and Accounts 201968

Allan LeightonNon-executive ChairmanBackground and experienceFormerly CEO of ASDA plc and Chairman of the Royal Mail.Formerly a non-executive director of British Sky Broadcasting plc.Doctor of Letters, York St John UniversityDate of appointmentAppointed non-executive Chairman in March 2014.External appointmentsChair of The Co-operative Group and Chairman of Element Materials Technology, The Allbright and The Canal River Trust. Non-executive director (and Senior Independent Director) of The Restaurant Group plc.Patron of Breast Cancer Care.Committee membershipNone.
Robert McFarlaneNon-executive directorBackground and experienceFormerly Chief Financial Officer of Clearnet until its acquisition by TELUS, and subsequently Chief Financial Officer of TELUS.Holds a Commerce degree from the Smith School of Business in Queen’s University, an MBA from the Ivey Business School at Western University and an ICD.D designation from the Institute of Corporate Directors.Date of appointmentAppointed non-executive director in November 2017.External appointmentsNon-executive director of HSBC Bank Canada and Deputy-Chair of Royal & Sun Alliance Insurance Company of Canada. Chair of the Information Technology Advisory Council of the University of British Columbia and serves on the Board of Trustees of Queen’s University.Committee membershipChairman of Audit Committee, Member of Disclosure Committee.
Joseph SparacioChief Financial OfficerBackground and experienceOver 30 years of executive management in the entertainment and media industry.Formerly the Chief Financial Officer of the IMAX Corporation and iN Demand LLC and, prior to that, held senior financial roles at Loews/Loews Cineplex.Certified Public Accountant with the AICPA designation of a Chartered Global Management Accountant.Joined eOne in November 2016.Date of appointmentAppointed as an executive director in November 2017.External appointmentsNon-executive director of Vydia Inc.Non-executive director of Court Appointed Special Advocates for Children of Monmouth County, Inc. (CASA)Committee membershipNone.
Mark OpzoomerSenior Independent DirectorBackground and experienceFormerly CEO of Rambler Media Ltd, regional vice-president of Yahoo! Europe, deputy CEO of Hodder Headline, commercial director of Sega Europe Ltd and Virgin Communications Ltd.Formerly non-executive director of Web Reservations International Ltd, Newbay Software Ltd, Autonomy plc and Miva Inc.Qualified, Canadian Institute of Chartered Accountants and MBA from IMD, Lausanne, Switzerland and BCom (Hons) Queen’s University, Canada.Date of appointmentAppointed non-executive director in March 2007.External appointmentsPartner Bond Capital Partners.Non-executive chairman of Somo Global Ltd and non-executive director of Ennovy Group Limited and Benross Golf Limited.Committee membershipChairman of Disclosure Committee, Chairman of Remuneration Committee, Member of Audit Committee.
Michael FriisdahlNon-executive directorBackground and experienceFormerly President and Chief Executive Officer of Air Canada’s Leisure Group, CEO of Thomas Cook North America, and President and CEO of The Holiday Network.Date of appointmentAppointed non-executive director in November 2017.External appointmentsPresident and Chief Executive Officer of Maple Leaf Sports & Entertainment and serves on the Board of SickKids Foundation.Committee membershipMember of Remuneration Committee, Member of Nomination Committee.
Scott LawrenceNon-executive directorBackground and experienceManaging Director, Head of Infrastructure at the Canada Pension Plan Investment Board.Certified member of the Canadian Institute of Corporate Directors.Date of appointmentAppointed non-executive director in January 2016.External appointmentsBoard member of TORC Oil & Gas Ltd.Committee membershipMember of Nomination Committee.
Darren ThroopChief Executive OfficerBackground and experienceOver 20 years of executive management in the entertainment industry.Formerly the owner of Urban Sound Exchange between 1991 and 1999 before it was acquired by the Group.Joined eOne in 1999.Date of appointmentAppointed Chief Executive Officer in July 2003.External appointmentsNon-executive director of IMAX Corporation.Committee membershipNone.
Mitzi ReaughNon-executive directorBackground and experienceExperienced digital media executive with previous roles at NBC Universal, Hulu, Miramax, The Chernin Group, and McKinsey & Company.Date of appointmentAppointed non-executive director in November 2016.External appointmentsCEO and President of Jaunt XR and Director of Harmonic Inc.Committee membershipMember of Audit Committee, Member of Disclosure Committee, Member of Remuneration Committee, Member of Nomination Committee.
Linda RobinsonNon-executive directorBackground and experienceA retired partner at Osler, Hoskin & Harcourt LLP.Advisory experience in broadcasting, publishing and entertainment industries.Formerly a director of a number of public and private companies.Date of appointmentAppointed non-executive director in March 2014.External appointmentsDirector of Women Lawyers Joining Hands.Formerly Chair of Infrastructure Ontario.Committee membershipChair of Nomination Committee, Member of Remuneration Committee.
SR
G
FS
69entertainmentone.com

Role Name CanadianResident
Canadian Independent Gender First appointed First elected
Non-executive Chairman Allan Leighton M Mar 2014 Sep 2014
Chief Executive Officer Darren Throop M Mar 2007 Sep 2008
Chief Financial Officer Joseph Sparacio M Nov 2017 Sep 2018
Senior Independent Director Mark Opzoomer M Mar 2007 Sep 2008
Non-executive director Michael Friisdahl M Nov 2017 Sep 2018
Non-executive director Scott Lawrence M Jan 2016 Sep 2016
Non-executive director Robert McFarlane M Nov 2017 Sep 2018
Non-executive director Mitzi Reaugh F Nov 2016 Sep 2017
Non-executive director Linda Robinson F Mar 2014 Sep 2014Total 6/9 5/9 6/9 or 5/8 (excluding Chairman)
CORPORATE GOVERNANCE REPORT
Board overviewThe aim of the Board is to promote the long-term success of the Group. On behalf of shareholders, it is responsible for creating the framework of strategy and controls within which eOne operates and for the Group’s proper management. The Board takes account of the impact of its decisions not only on its shareholders but also on a wider group of stakeholders including employees, the communities in which it operates and its financing partners.
The Board is responsible for overseeing the implementation of the strategy by the management team, setting the Group’s overall risk framework and monitoring the Group’s financial and operational performance.
A number of matters are specifically reserved for the Board’s approval: the approval of annual budgets and forecasts, the approval of interim and annual results, setting and monitoring strategy, considering major acquisitions and approving investments in content and capital expenditure in excess of pre-agreed value thresholds. Other matters are delegated to the Audit, Disclosure, Remuneration and Nomination Committees. There are terms of reference for each of these Committees specifying their responsibilities, which are available on the Group’s website.
The Board operates both formally, through Board and Committee meetings, and informally, through regular contact between directors and senior executives.
The directors can obtain independent professional advice at the Company’s expense in the performance of their duties as directors.
Board membershipAs at the date of this report, the Board comprised a non-executive Chairman, six other non-executive directors and two executive directors.
The Company’s Articles of Amendment set specific requirements with respect to the Company’s directors, as follows:
• at least two-thirds of the directors must be Canadian;• a majority of the directors must be resident
Canadians; and• a majority of the directors must be independent.
Information about the directors, including their background and experience, is given on pages 68 and 69.
The ChairmanThe role of the Chairman is to provide leadership to the Board and to ensure that the Board and its Committees operate effectively. He sets the agenda for Board meetings and chairs the meetings to facilitate open and constructive debate.
The Chairman is Allan Leighton.
The Chief Executive OfficerThe Chief Executive Officer is responsible for the day-to-day management of the business and for the development of strategy for approval by the Board.
There is a clear division of responsibility between the Chairman and the Chief Executive Officer which is formally documented and agreed by the Board.
The Chief Executive Officer is Darren Throop.
Board composition
eOne Annual Report and Accounts 201970

Senior Independent DirectorThe role of the Senior Independent Director is to act as a sounding board to the Chairman and to provide an additional point of contact for shareholders. He acts as an intermediary for other directors and is responsible for coordinating the process for the evaluation of the performance of the Chairman.
The Senior Independent Director is Mark Opzoomer.
Non-executive directorsThe non-executive directors bring a wide range of experience and expertise to the Group’s activities and provide a strong balance to the executive directors. Their role is to provide an independent element to the Board and to constructively challenge management.
Independence of non-executive directorsAs at 31 March 2019, the Board has reviewed the independence of the non-executive directors and concluded that six non-executive directors including the Company’s Chairman are independent. The independent directors are: Allan Leighton, Michael Friisdahl, Robert McFarlane, Mark Opzoomer, Mitzi Reaugh and Linda Robinson.
Scott Lawrence, who was appointed to the Board in January 2016, is not considered to be independent due to his relationship with Canada Pension Plan Investment Board, a significant shareholder of the Company, as further outlined in Note 35 to the consolidated financial statements.
The review took into account the results of the Board’s annual performance evaluation, together with the factors listed in the Code. As at March 2019, Mark Opzoomer had served on the Board for more than ten years, the date of his first appointment having been March 2007.
The Board continues to determine Mr Opzoomer as independent given his wide range of interests outside Entertainment One, because he has demonstrated consistent independence in character and has demonstrated ongoing independence in the judgements that he has made in discussions and decisions made in respect of the Group.
Robert McFarlane joined the Board in November 2017 and, after a transition period during which he has been a member of the Audit Committee, he assumed the chairmanship of the Audit Committee from September 2018. Mr McFarlane brings a wealth of financial expertise to the role of Audit Committee Chairman, both having been Chief Financial Officer of TELUS Corporation, and currently serving as a non-executive director on the board of HSBC Bank Canada (and Chair of the Audit, Risk and Conduct Committee) and Deputy-Chair of Royal & Sun Alliance Insurance Company of Canada (and Chair of the Audit & Risk Committee).
Michael Friisdahl joined the Board in November 2017 and has been appointed to the Remuneration and Nomination Committees. Mr Friisdahl is President and Chief Executive Officer of Maple Leaf Sports & Entertainment and has many years of experience in the entertainment and leisure industry, supplementing the Board’s knowledge of the live entertainment space, an area of the business which is expected to grow over the coming years.
The Company continues to look for opportunities to broaden the experience of the Board, particularly where this would increase the diversity (and expertise) of the Company’s directors, as noted in the report of the Nomination Committee on page 86.
Time commitmentThe Chairman is expected to spend approximately one day per week and other non-executive directors are expected to spend approximately one day per month on their basic duties as directors. An additional commitment of time is expected of directors to address matters on a timely basis as appropriate via ad hoc Board meetings, or for directors who chair or are members of Board Committees and this is reflected in additional fees in this respect, as set out in the Directors’ Remuneration Report. Overall time spent by directors on Group business includes attendance at Board and Committee meetings (including time travelling to and from physical meetings), preparation for meetings and the provision of advice and assistance to the Group outside of Board and Committee meetings.
SR
G
FS
71entertainmentone.com

Board meetingsThere are regular, scheduled Board and Committee meetings throughout the year and additional ad hoc meetings are held as necessary. During the current financial year, there were seven Board meetings.
There are annual work plans which list the recurring items to be dealt with at each scheduled Board and Committee meeting, as well as specific items which are addressed at different points during the year.
Board papersThe Board is supplied with detailed Board papers, in a timely manner, in a form and quality appropriate to enable it to discharge its duties. These include routine reports on the performance of the business and on any matters for Board approval. Standard formats have been developed for the reports to make it easy to track progress against targets and identify key facts. In addition to written reports, presentations are also given to the Board reviewing the performance and outlook of the Group’s Family & Brands and Film, Television & Music Divisions.
A detailed agenda is prepared for each meeting to make sure there is sufficient time allocated to deal with all issues.
Conflicts of interestThe Group has adopted and followed a procedure under which directors must declare actual or potential conflicts of interest as they arise. The Board reviews potential conflict of interest situations arising from other posts held by directors on an annual basis.
No actual conflicts of interest arising in respect of any specific arrangement or transaction have been declared to the Board during the financial year.
Board performance evaluationDuring the year, an externally facilitated evaluation of the Board, its Committees and its individual directors has been carried out by The Effective Board.
An evaluation questionnaire was sent to all directors covering the key attributes of an effective Board, the role of the Chairman, the role of the Senior Independent Director and the role of executive and non-executive directors to enable them to provide specific feedback. These questionnaires were collated into reports covering the evaluation of the Board, which were used as input to a performance discussion at the Board meeting in May 2019.
Separate questionnaires were developed for each Committee and these were completed by Committee members and collated as input to an annual performance review of each Committee. In addition, specific feedback was sought on the performance of the Audit Committee from the Group’s Chief Executive Officer, Chief Financial Officer and the Company’s external auditor.
The Chairman and the Senior Independent Director meet to evaluate the performance of individual directors and this evaluation enables the Group to confirm on an annual basis that the individual directors continue to perform their roles effectively and that non-executive directors continue to demonstrate ongoing time commitment to their roles. The evaluation also informs the Group’s determination of the independence of individual directors, as noted in this report.
The Senior Independent Director leads a discussion amongst the non-executive directors, on an annual basis, to consider the performance of the Company’s Chairman.
On the basis of this evaluation process, the Group was able to determine that its Board, Committees and individual directors had performed effectively during the year, which will enable the Company to confirm its recommendation for the re-election of its existing directors at the 2019 Annual General Meeting.
CORPORATE GOVERNANCE REPORT CONTINUED
eOne Annual Report and Accounts 201972

Board CommitteesThe Board Committees comprise the Audit Committee, the Disclosure Committee, the Remuneration Committee and the Nomination Committee, each of which operates within defined terms of reference which are displayed on the Group’s website and, taken as a whole, have the relevant competence to the sectors in which eOne operates.
The Board Committees were refreshed in September 2018.
As at 31 March 2019, the Audit Committee comprised Robert McFarlane (Chairman) with Mark Opzoomer and Mitzi Reaugh as the other independent non-executive members. Robert McFarlane and Mark Opzoomer have recent and relevant financial experience.
As at 31 March 2019, the Disclosure Committee comprised Mark Opzoomer (Chairman) with Robert McFarlane and Mitzi Reaugh as the other independent non-executive members.
As at 31 March 2019, the Remuneration Committee comprised Mark Opzoomer (Chairman) with Michael Friisdahl, Mitzi Reaugh and Linda Robinson as the other independent non-executive members.
As at 31 March 2019, the Nomination Committee comprised Linda Robinson (Chair) with Mitzi Reaugh and Michael Friisdahl as the other independent non-executive members and Scott Lawrence as a non-independent non-executive member.
The Company’s Articles of Amendment require that each of the Board’s Committees is chaired by a Canadian.
Further details of the operation of these Board Committees are given on page 67.
Board and Committee meeting attendanceThe table below sets out the attendance at Board and Committee meetings during the year, in person or by telephone, of individual directors.
Where, exceptionally, a director is unable to attend a Board or Committee meeting, papers are provided to that director and a separate briefing is arranged to enable the director to provide comments and feedback to the Chairman or Committee Chair before the meeting in question takes place.
During the financial year all directors attended all Board meetings to which they were entitled to attend.
During the financial year all directors attended all Committee meetings to which they were entitled to attend, with the exception of Mitzi Reaugh who was unable to attend one Nomination Committee meeting. The Nomination Committee meeting in question took place at a time when Ms Reaugh was travelling in respect to her other, non-Entertainment One, commitments. She received papers for the Committee meeting in question and was able to provide feedback to other Committee members.
Board and Committee meeting attendance
BoardAudit
CommitteeRemuneration
CommitteeNomination Committee
Disclosure Committee
Total held in year 7 6 5 5 1
Allan Leighton1 7 – – 1 –Darren Throop 7 – – – –Joseph Sparacio 7 – – – –Mark Opzoomer 7 6 5 – 1Michael Friisdahl1 7 – 5 4 –Scott Lawrence 7 – – 5 –Robert McFarlane 7 6 – – 1Mitzi Reaugh 7 6 5 3 1Linda Robinson2 7 3 5 5 –
Notes:1. Member of the Nomination Committee for part of the financial year only. Attended all Nomination Committee meetings entitled to attend during the year.2. Member of the Audit Committee for part of the financial year only. Attended all Audit Committee meetings entitled to attend during the year.
SR
G
FS
73entertainmentone.com

Dialogue with shareholdersThe Group maintains a regular dialogue with analysts and institutional shareholders to discuss its performance and future prospects and holds regular meetings with them. In the current financial year, the executive directors undertook an extended round of meetings with investors both in the UK and abroad – these took place at the time of the Group’s full year and interim results, and as part of specific investor programmes in Europe and North America.
The Company also undertook a significant programme of engagement with key shareholders focused on governance and remuneration matters, which is referred to in more detail in the Directors’ Remuneration Report.
In September 2018, the Group held a Capital Markets Day at its offices in Toronto, inviting investors and analysts. A number of eOne’s operational executives attended and made presentations covering their areas of the business. The event was well-received by attendees and the Company intends to hold similar events in the future.
In order to assist non-executive directors to develop an understanding of the views of major shareholders, the Board is presented with a shareholder report covering key shareholder issues, share price performance, the composition of the shareholder register and analyst expectations at each regular Board meeting.
The Company responds formally to all queries and requests for information from existing and prospective shareholders. In addition, the Company seeks to update shareholders through stock exchange announcements and wider press releases on its activities. It publishes regular trading updates as well as a full Annual Report and Accounts.
The Annual General Meeting provides an opportunity for shareholders to address questions to the Chairman or the Board directly. All the directors attend the meeting and are available to answer questions. Time is set aside after the formal business of the AGM for shareholders to talk informally with the directors.
Shareholders can access further information on the Group via the Company’s website at www.entertainmentone.com.
Annual General MeetingThe 2018 Annual General Meeting was held on 13 September 2018 at the Company’s offices in Toronto, Canada.
Resolutions were passed, with votes in favour of all resolutions of 85% or more of votes cast, except as noted below:
• the resolution in relation to the Directors’ Remuneration Report (passed with votes in favour of 61%);
• the resolution in relation to the re-appointment of Linda Robinson (passed with votes in favour of 84%);
• the resolution in relation to the re-appointment of Mark Opzoomer (passed with votes in favour of 63%); and
• the resolution in relation to the allotment of new shares (passed with votes in favour of 84%).
Following last year’s AGM and the implementation of the UK Investment Association’s Public Register, the Company noted that it intended to engage with its key shareholders to understand any feedback on governance, outside of its regular financial-focused engagement programme.
Mark Opzoomer, the Company’s Senior Independent Director, has undertaken a significant programme of engagement with a number of the Company’s key shareholders. Mr Opzoomer is based in London, the location of the Company’s listing, and this has facilitated face-to-face meetings to be scheduled more easily as part of this programme. Further details of this programme are provided in the Directors’ Remuneration Report.
The Company plans to hold its 2019 Annual General Meeting on 30 September 2019 in Toronto and intends to seek shareholder approval for the allotment of relevant securities in line with the authorities sought at the 2018 AGM, which expire at the time of the 2019 AGM.
CORPORATE GOVERNANCE REPORT CONTINUED
At 31 March 2019 the Company was aware of the following holdings representing 3% or more in its issued common shares:
31 March 2019Number of common
shares heldPercentage of voting
rights and issued shares
Canada Pension Plan Investment Board 85,597,069 18.4Capital Research and Management 46,843,952 10.5M&G Investment Management Ltd 20,029,803 4.3Kames Capital 18,989,774 4.1Standard Life Aberdeen 17,875,445 3.9Mackenzie Financial Corporation 17,793,329 3.8Blackrock Inc 14,592,948 3.1
eOne Annual Report and Accounts 201974

Risk management and internal controlsThe directors are responsible for the Group’s system of internal control and for reviewing its effectiveness, whilst the role of management is to implement Board policies on risk management and control. It should be recognised that the Group’s system of internal control is designed to manage, rather than eliminate, the risk of failure to achieve the Group’s business objectives and can only provide reasonable, and not absolute, assurance against material misstatement or loss.
The Group operates a series of controls to meet its needs. These controls include, but are not limited to, a clearly defined organisational structure, written policies, minimum financial controls and Group authority limits, a comprehensive annual strategic planning and budgeting process and detailed monthly reporting. The Group’s internal controls fall into four key areas: financial controls, operational controls, compliance and risk management.
During the financial year, the directors confirm that they have undertaken a robust assessment of the principal risks affecting the Company. Details of the principal risks and uncertainties affecting the Company, as well as the Group’s risk management processes, are shown on pages 51 to 54.
Financial controlsFinancial reporting
All operating units complete business plans and budgets for the year. The annual budget is approved by the Board as part of its normal responsibilities and the Board concurrently adopts the Group’s long range business plan. In addition, the budget figures are regularly re-forecast to facilitate the Board’s understanding of the Group’s overall position throughout the year and this re-forecasting is reported to the Board.
Each month, operating units produce written reports in a defined format on their performance against these plans and provide updated business forecasts. The reports and forecasts are reviewed by the executive directors. Reports from operating units are consolidated into monthly management accounts and presented to the Board on a regular basis, with significant issues discussed by the Board, as appropriate.
Accounting policies and procedures
The Group has written accounting policies and procedures, which are applicable to all of the Group’s operations. Divisional management is required to provide written confirmation of compliance with the policies and procedures as part of the half year and full year results process.
There is a formal review process overseen by the Audit Committee, which seeks to verify that policies and procedures have been correctly applied and to confirm that there is an effective process of management and control within the business. Compliance with internal controls is monitored on a regular basis through the Group’s internal audit programme.
Information technology security
The Group relies on financial and management information processed by, and stored on, computer systems. Controls and procedures have been established to endeavour to protect the security and integrity of data held on the systems, with disaster recovery arrangements in the event of failure of major systems. Tests are conducted on an annual basis to assess the security of the systems. This year there has been a continued focus on information and network security and the Audit Committee has been presented to by the Company’s Chief Information Officer on this issue.
Treasury
The treasury function operates under guidelines and policies approved by the Board and regular reports are made to the Board on treasury activities.
The Group’s treasury function has continued to be strengthened during the year with particular emphasis on internal controls and system enhancements.
Investments
The Group has defined procedures for the review and control of acquisitions, investment in production, investment in content and capital expenditure. Expenditure requires different levels of approval according to the level of spend. Significant expenditure requires full Board approval and all approval requests are presented in a defined format to ensure that full justification is provided, including projected financial returns on the investment.
SR
G
FS
75entertainmentone.com

Operational controlsAll Group businesses are required to operate in accordance with detailed standards and procedures which cover all material aspects of their operations. Compliance with these standards is subject to assessment by internal and external review.
As part of the Group’s half year and full year reporting processes, local management confirms by way of a Corporate Governance Statement of Compliance and a Letter of Representation that its operating units have complied with Group control requirements, and an additional Divisional-level sign-off has continued in the year to reflect the increasing oversight role taken by Divisional management.
There have been no significant operational control failures or significant weaknesses in controls identified during the year.
Compliance
There is a Group Code of Business Conduct, which sets out standards of conduct and business ethics which the Group requires its employees to comply with. All employees sign-off on the Code of Business Conduct on an annual basis, including confirmation from senior management that members of their teams understand the Code. A separate Anti-bribery and Corruption Policy and a Whistleblowing Policy are in place across the Group and are included in the annual senior management sign-off process. All Group policies are available to employees via the Group’s intranet.
There is a schedule of delegated authority designed to ensure that all material transactions are considered at the appropriate level within the Group and are subject to review by the Group Finance team.
When acquisitions are made, the Group’s controls and accounting policies are implemented during the first full year of ownership.
Risk managementThe Executive Committee continues to meet on a regular basis, generally monthly, and focuses on risk management periodically. The Audit Committee receives a risk management update at each of its standing meetings and reports to the Board on a periodic basis.
The Executive Committee is chaired by Darren Throop, the Chief Executive Officer, and, from a risk perspective, the role of the Committee is to:
• promote effective identification and management of risk throughout the Group
• maintain a risk register identifying significant risks, risk control measures and responsibility for control measures
• review and confirm that all significant risks have been identified and suitable control measures adopted
• monitor implementation of risk control measures for all significant risks
• ensure all operating units operate an effective risk management process.
In addition, the Audit Committee receives reports from management and the external auditor concerning the system of internal control and any material control weaknesses. Any significant risk issues are referred to the Board for consideration.
The Group’s Internal Audit function is led by the Group’s Director of Risk and Assurance and reports to the Chairman of the Audit Committee. The Internal Audit team continued with its formal internal audit programme across all of the Group’s main Business Units, building on the “baseline” reviews of the general control environment, as well as focusing on any specific risk areas highlighted by management.
CORPORATE GOVERNANCE REPORT CONTINUED
eOne Annual Report and Accounts 201976
Board review processThe Board conducts a review of the effectiveness of the Group’s system of internal controls, covering all material controls, including financial, operational and compliance controls, and risk management systems as part of its half year and full year financial reporting process.
The Board’s assessment of the Group’s risk framework is supported by the periodic updates it receives at Board meetings and the existence of a rolling internal audit programme that places a focus on internal controls.
As a premium-listed Company, the Group’s approach to its control environment is codified in its Financial Position and Prospects Procedures. These procedures are maintained on an ongoing basis and are formally reviewed and re-adopted by the Board on an annual basis.
The independence and objectivity of the external auditor are considered on a regular basis, with particular regard to non-audit fees, and confirmed formally at each regularly scheduled Audit Committee meeting. The split between audit and non-audit fees for the year under review appears in Note 4 to the consolidated financial statements – non-audit services provided by the Group’s external auditor during the year mainly related to work supporting financing activities, were agreed by the Board, and were determined not to compromise the auditor’s independence. Further details on the Company’s policy for the provision of non-audit services by the external auditor are provided in the Audit Committee Report.
The external auditor has processes in place to ensure independence is maintained, including safeguards to ensure that where it provides non-audit services its independence is not threatened. In this context, the Audit Committee considers that it is appropriate for the external auditor to provide other accounting and transactional services to the Group, including those in connection with supporting and reporting on financial representations in public documentation and due diligence on acquisitions, where these are permitted by the relevant independence guidelines.
Internal control and compliance statementThe directors acknowledge their overall responsibility for the system of internal control and for reviewing its effectiveness. They have established a system that is designed to provide reasonable but not absolute assurance against material misstatement or loss and to manage rather than eliminate the risk of failure to achieve business objectives.
There is a continuing process for identifying, evaluating and managing the key risks faced by the Group that has been in place for the year under review and up to the date of approval of the Annual Report and Accounts.
The process is regularly reviewed by the Board and is in accordance with the recommendations of the FRC’s Guidance on Risk Management, Internal Control and Related Financial and Business Reporting (formerly known as ‘Internal Control: Revised Guidance for Directors on the Combined Code’). Steps continue to be taken to embed internal control further into the operations of the business and to deal with any issues that come to the Board’s attention.
The directors have reviewed the effectiveness of the system of internal control and are satisfied that the Group’s internal controls are operating effectively.
SR
G
FS
77entertainmentone.com

Annual statement of the Chairman of
the Audit Committee
The Committee had a full programme of meetings The Executive Committee continues to meet regularly,
duringthe financial year, meeting six times in total. generally on a monthly basis, and focuses on risk
Four meetings dealt with the approval of the Group’s 2018 management periodically. The Audit Committee receives
financial results, matters arising from the Group’s 2018 a risk management update at each of its standing
external audit, approval of the Group’s 2019 half year meetings and reports to the Board on a periodic basis.
results and the planning of the external audit for the 2019
financial year. The Committee also met after the end of During the year, presentations were made to the
the 2018 financial year in May 2018, to address any Committee by the Company’s Chief Information Officer
matters which could form areas of judgement in the (focusing on technology infrastructure and cyber-security)
Group’s consolidated financial statements. and the CFO of the Film & Television Division (focusing
on a programme to implement new finance systems).
The Group’s Internal Audit function is led by the Group’s
Director of Risk and Assurance and reports to the Having completed an annual assessment of the external
Chairman of the Audit Committee. The Internal Audit auditor, the Committee recommended the re-
team continued with its formal internal audit programme appointment of PricewaterhouseCoopers LLP as the
across all of the Group’s main Business Units, building Company’s external auditor for the 2019 financial year.
on the “baseline” reviews of the general control
environment, as well as focusing on any specific
risk areas highlighted by management.
The Group’s risk management process continues to be
developed in operating units and specific attention has
been directed at further embedding business continuity
planning across the Group as well as data protection and
information security.
78
Robert McFarlane
Audit Committee Chairman
20 May 2019
AUDIT COMMITTEE
Robert
McFarlane
Audit Committee
Chairman
eOne Annual Report and Accounts 2019

Committee membershipAs at 31 March 2019, the Audit Committee comprised Robert McFarlane (Chairman) with Mark Opzoomer and Mitzi Reaugh as the other independent non-executive members. Robert McFarlane and Mark Opzoomer have recent and relevant financial experience and the Committee as a whole has relevant competence in relation to the sectors in which eOne operates.
Robert McFarlane joined the Board in November 2017 and, after a transition period during which he was a member of the Audit Committee, he assumed the chairmanship of the Audit Committee from September 2018. Linda Robinson was a member of the Committee until September 2018.
The CEO (Darren Throop), the CFO (Joe Sparacio), the Chairman (Allan Leighton) and the Company Secretary (Mark Trachuk) are invited to attend Audit Committee meetings, but do not participate in decisions. Additionally, the Group’s Director of Risk and Assurance attends Audit Committee meetings.
Phil Stokes is the PricewaterhouseCoopers partner responsible for the eOne audit. He has attended every Audit Committee meeting during the year to present reports and answer questions from Committee members. Senior PricewaterhouseCoopers employees who have had day-to-day involvement in the conduct of the audit also attend Audit Committee meetings.
Audit planningThe Committee oversees the plans for the Group’s external audit to ensure it is comprehensive, risk-based and cost-effective.
PricewaterhouseCoopers drafted an initial external audit plan in consultation with executive management and the Group’s Director of Risk and Assurance and presented it for review by the Committee in September 2018. The plan set out the proposed scope of its work and the approach to be taken. It also proposed the materiality levels to be used, based on forecast profit before tax, adding back non-recurring one-off items.
In order to focus the audit work on the right areas, the auditor identified particular risk areas based on its knowledge of the business, which was supplemented through enhanced walk-through procedures as part of the half year review, its deep knowledge of the entertainment industry and operating environment, as well as discussions with management and the Committee. Agreement was reached on the audit approach for different areas of the business, based on their scale and complexity. This has resulted in an audit approach which has provided for a full scope audit for the Group’s most significant business units, a risk-focused procedure scope approach on certain business units and analytical review procedures on the remaining business units.
The timeliness of the Committee meeting where year end audit planning is discussed allows an in-depth discussion on the planning process and ensures that feedback can be reflected in the year end audit approach.
There were no significant changes in audit approach in the current year, whilst the appointment of PricewaterhouseCoopers as external auditor has continued to bring a fresh perspective to the audit process.
SR
G
FS
79entertainmentone.com

AUDIT COMMITTEE CONTINUED
Review of consolidated financial statements and audit findingsThe Committee reviewed the full year and half year consolidated financial statements and the report of the auditor on these statements.
The Committee considered the following significant accounting areas of judgement and accounting estimates as part of its review:
Areas of judgement Assessment
Investment in acquired content rights/investment in productions
After careful consideration of the alternative methods of amortisation of its investment in content rights/investment in productions that could be applied under IAS 38, the Group continues to consider the best mechanism for estimating this consumption is based on the revenue generated from the individual film or television title across the various exploitation windows. The Group considers the revenue derived from and the consumption of the economic benefit via such exploitation windows to be highly correlated.Furthermore, this methodology is consistent with many of the Group’s main competitors under which the carrying value of investment in acquired content rights/investment in productions, and associated charges to the consolidated income statement, are directly linked to management estimates of future revenues. The Group believes that the utilisation of a methodology that is consistent with its peer group provides greater transparency to investors and users of eOne’s accounts.The Committee receives presentations from management, providing feedback and challenge as necessary, and requests further explanations and supporting analysis from management where necessary to support the Committee’s judgements in this area. In this way the Committee is able to satisfy itself that processes exist to ensure that the carrying value of investment in acquired content rights/investment in productions is assessed on a regular basis and that operating management has sufficient expertise to assess the recoverability of investments, based on its local market knowledge.The Group continues to develop its review processes in this area to ensure that they are robust and reflect best practice across the business.In addition, this is an area of focus for the audit and PricewaterhouseCoopers carries out detailed testing at the local operating unit level, with central oversight to provide further consistency of approach. PricewaterhouseCoopers reports on this area to the Audit Committee and reports explicitly on the matter in its audit opinion in the consolidated financial statements.
Impairment of goodwill and acquired intangible assets
The Group holds significant intangible assets including acquired intangible assets and goodwill from past acquisitions. In accordance with IFRS, management conducts an annual impairment review of intangible assets with indefinite useful economic lives to ensure that the recoverable amount of the cash generating units supports the carrying value in the financial statements.The assessment of the carrying value of intangible assets is a judgemental area and the Group has a robust process in place to support this assessment, as well as specific industry expertise and knowledge to ensure that estimates used are reasonable and based on achievable targets.Driven by the ongoing integration of the Group’s film and television businesses, the Group reassessed its cash generating units as of 1 April 2018. The Group’s cash generating units now comprise Film, Television & Music and Family & Brands. An assessment to confirm the pre-integration carrying values of the previous CGUs was made as at 31 March 2018; the assessment showed significant headroom.Bottom-up models allow estimates of future cash flows that are expected to be generated to support the carrying value of intangible assets, consistent with the business plans for the Group which are adopted by the Board on an annual basis.Given the assessment of future cash flows is subject to accounting estimates, the Group overlays sensitivities to its cash flow modelling to assess the potential impact of under-performance against its business plans. In carrying out such sensitivity analysis, the Committee is able to seek reassurance that, notwithstanding the impact of any potential under-performance, the carrying value of intangible assets remains appropriate.As a result of the analysis performed by management and provided to the Committee, it is satisfied that the assumptions made by management are reasonable, and that appropriate sensitivities are applied, to ensure that the annual impairment testing process is robust.In addition, PricewaterhouseCoopers reviews and challenges the assumptions made by management to confirm that they are reasonable in comparison to industry peers and analyst assumptions, and that they reflect current market conditions. PricewaterhouseCoopers reports on this area to the Audit Committee and reports explicitly on the matter in its audit opinion in the consolidated financial statements.
eOne Annual Report and Accounts 201980

The Committee also considered other accounting areas of judgement as part of its review, as noted below:
Areas of judgement Assessment
Presentation of one-off items
The Group records exceptional income and expenditure in respect of one-off items and transactions that fall outside the normal course of business to assist users of the accounts in understanding underlying business performance.Management provide supporting analysis and rationale to the Committee to enable it to be satisfied that management has made appropriate judgements in determining one-off items, that policies have been applied consistently and that disclosures are appropriately made in the Annual Report and Accounts.In addition, PricewaterhouseCoopers reports on this matter to the Audit Committee.
Tax The assessment of the recoverability of tax losses and the recognition of deferred tax assets in respect of such losses requires judgement, based on the tax profile of the Group and its ability to access historic losses and recognising the specific circumstances of the Group.These factors and other judgements have an impact on the effective rate of tax shown in the consolidated income statement.Management provide supporting analysis and rationale to the Committee to enable it to be satisfied that management has made appropriate judgements in determining deferred tax assets and the effective rate of tax and that disclosures are appropriately made in the Annual Report and Accounts.
Revenue recognition and management override of controls
Revenue recognition and management override of controls are items which PricewaterhouseCoopers is required to report on explicitly.The Committee receives presentations from management, providing feedback and challenge as necessary, and requests further explanations and supporting analysis from management where necessary to support the Committee’s judgements in this area. In this way the Committee is able to satisfy itself that accounting policies which set out revenue recognition policy are in place and communicated to operating units and that a robust system of internal controls exists in the Group. The Group’s internal controls are tested as part of the half and full year reporting process and are scrutinised as part of the internal audit programme.
Committee review of Annual ReportThe Committee met in May 2019 to consider the Group’s FY19 financial statements, the effectiveness of internal controls in the period and other year end related matters.
The Committee has reviewed the Annual Report and Accounts to ensure that it is fair, balanced and understandable and provides the information necessary for shareholders to assess the Group’s performance, business model and strategy. The Committee considers whether the Annual Report and Accounts contains sufficient information to enable shareholders to make this assessment. It also considers whether the information is presented in a comprehensible and balanced manner and that sufficient prominence is given to critical matters.
SR
G
FS
81entertainmentone.com

Assessment of external auditorThe Committee is required to assess the qualifications, expertise, resources and independence of the external auditor and the objectivity and effectiveness of the audit process.
The Company carried out a formal tender process for the provision of external audit services in FY18, at the conclusion of which the Company appointed PricewaterhouseCoopers as its external auditor.
At the conclusion of the FY19 audit, the Audit Committee carried out an annual assessment of PricewaterhouseCoopers on the basis of the Committee’s own appraisal of the performance of the auditor and the views of the senior management team, as well as consideration of materials provided by the auditor.
In the current financial year, the assessment of the external auditor was formalised using the Audit Quality Indicators framework published by the Chartered Professional Accountants of Canada and the Canadian Public Accountability Board.
The assessment considered the following key areas:
• independence, objectivity and professional scepticism• quality of the engagement team• communication and interaction with the external auditor• inspection findings on the audit firm
Based on the assessment carried out, the Committee was able to confirm to the Board that the external auditor was operating effectively.
Independence of external auditorThe Committee monitors arrangements to ensure that the partner in charge of the audit is changed every five years and that the relationship between the auditor and management does not affect the external auditor’s independence.
The Committee is responsible for monitoring the independence of the Group’s external auditor on an ongoing basis and ensuring that appropriate controls are in place.
A defined policy exists for the engagement of the Group’s external auditor for non-audit work, which is reviewed and approved by the Committee on an annual basis. The Committee approves the engagement of the Group’s external auditor for non-audit work in line with this policy. This policy defines services which are permitted and services which are prohibited. The Company’s Chief Financial Officer is able to approve permitted services up to a threshold that is agreed by the Committee, with amounts above such threshold requiring explicit approval from the Committee. In considering the provision of non-audit services, the Committee is mindful of the potential impact of the external auditor’s independence. PricewaterhouseCoopers also has internal processes to ensure that they do not carry out services which would affect their independence.
During the year PricewaterhouseCoopers has provided limited non-audit services, mainly in relation to corporate finance transactions. Fees paid to PricewaterhouseCoopers for non-audit services were as follows:
2019 £m
2018 £m
Services relating to corporate finance transactions £0.1m £0.2mReview of interim statements £0.1m £0.1mOther (including tax advisory) £0.1m £0.2mTotal £0.3m £0.5m
None of this work was carried out on a contingent fee basis.
The Committee considered the nature of the potential threat to independence posed by the provision of non-audit services and the safeguards applied. It concluded that the non-audit work undertaken by the external auditor did not impair independence.
The Group’s policy on the provision of non-audit services is documented in a written policy and is reviewed and re-adopted by the Audit Committee on an annual basis, taking consideration of external independence guidelines.
AUDIT COMMITTEE CONTINUED
eOne Annual Report and Accounts 201982

Internal auditThe Internal Audit team continued with its formal internal audit programme across all of the Group’s main Business Units, building on the “baseline” reviews of the general control environment, as well as focusing on any specific risk areas highlighted by management. The internal audit plan is presented to the Audit Committee for approval on an annual basis and regular update reports are presented at Committee meetings during the course of the financial year.
During the year, reviews were carried out covering activities in the following Group operating units:
• US Reality TV• TV Productions• The Mark Gordon Company (TV Production)• Renegade 83• Sierra• Features (Film Production)• UK Film• Spain Film• Canada Film
Additionally, central reviews covered the following areas:
• Governance Assertions• Ultimates Forecasting and Accounting• Revenue Recognition• IT Control Environment & General Controls• Information Security Maturity Review• Policies & Procedures• Treasury foreign exchange controls
The Group’s risk management process continues to be developed in operating units and specific attention has been directed at the further roll out of business continuity planning at the Group’s office locations.
The Director of Risk and Assurance, who heads the Internal Audit function, has a direct reporting line to the Chairman of the Committee and attends Audit Committee meetings.
The Committee Chairman maintains regular contact with the Company’s Director of Risk and Assurance to monitor the delivery of the Internal Audit plan. Based on these meetings and the formal updates provided to the Audit Committee, the Committee is able to assess the Internal Audit function to ensure that it is satisfied over the quality, experience and expertise of the function.
Risk management reviewThe Audit Committee receives reports from management and the external auditor concerning the system of internal control and any material control weaknesses.
A Risk Management Committee chaired by the Chief Executive Officer operated throughout the year monitoring the Group’s risks and risk-mitigating activities. Reports from the Risk Management Committee are presented to the Audit Committee and Board on a periodic basis.
As part of the remit of the Committee in overseeing risk, regular updates are provided by management in relation to litigation and insurance coverage to ensure that the Group is appropriately monitoring and managing such risks.
Whistleblowing PolicyThe Committee is responsible for monitoring the Group Whistleblowing Policy. Any concerns raised are reported to the Audit Committee. No whistleblowing events have taken place.
SR
G
FS
83entertainmentone.com

AUDIT COMMITTEE CONTINUED
MeetingsThe Committee met six times during the year. Committee member attendance at Committee meetings is shown on page 73.
Representatives of the external auditor, including the partner responsible for the eOne audit, also attended every Audit Committee meeting. The executive directors are invited to attend the meetings, but at each meeting the Committee also arranged to speak with the external auditor without the executive directors being present.
The Chairman of the Audit Committee meets informally, on a one-on-one basis, before every standing Audit Committee meeting with the Chief Financial Officer, the Director of Risk and Assurance and the external auditor.
The following table lists the agenda items which have been dealt with by the Committee over the course of the financial year.
Date of meeting Agenda
May 2018 (two meetings)
Year end judgement areasYear end governance matters, including:
– Review of auditor independence and fees – Evaluation of effectiveness of the Audit Committee – Audit Committee terms of reference
Standing updates: litigation, insurance and whistleblower updatesRisk and assurance update, including:
– Internal audit update – Risk review – Review of effectiveness of internal controls
Accounting update, including review of going concern basis of accounting based on the Board-approved Budget/Three Year PlanUpdate from external auditorReview of results announcement and consolidated financial statementsReview of effectiveness of external auditorAuditor’s private meeting with non-executive directors
September 2018 (two meetings)
Half year judgement areasStanding updates: litigation, insurance and whistleblower updatesRisk and assurance update, including:
– Internal audit update – Risk review
Matters arising from 2018 audit2019 external audit planAuditor’s private meeting with non-executive directors
eOne Annual Report and Accounts 201984

Date of meeting Agenda
November 2018 Half year governance mattersStanding updates: litigation, insurance and whistleblower updatesRisk and assurance update including:
– Internal audit update – Risk review – Review of effectiveness of internal controls
Accounting update, including review of going concern basis of accounting based on the Q2 ForecastUpdate from external auditorReview of interim announcement and condensed consolidated financial statementsAuditor’s private meeting with non-executive directors
January 2019 Standing updates: litigation, insurance and whistleblower updatesRisk and assurance update, including:
– Internal audit programme – Risk review
Update on Finance Transformation ProgrammeIT/cyber security updateAuditor’s private meeting with non-executive directors
External auditor tenureIn line with the FRC Audit Committees Guidance regarding the frequency of audit tenders, eOne carried out a tender process for the Group’s external audit during 2017.
PricewaterhouseCoopers were first appointed during the 2017/18 financial year, with the Group audit team led by Phil Stokes.
Terms of reference and evaluationThe Committee keeps its terms of reference under review and makes recommendations for changes to the Board. The full terms of reference are available on the Company’s website.
An externally facilitated evaluation of the Committee’s performance during the financial year took place as set out on page 72, which included feedback from the Group’s external auditor.
SR
G
FS
85entertainmentone.com

NOMINATION COMMITTEE
Annual statement of the Chair of
the Nomination Committee
The performance of the Group is dependent on its ability The Company has appointed Heidrick Struggles to
to attract, recruit and retain quality people in a highly support the Committee in its search for potential new
competitive labour market and Board succession non-executive directors to join eOne’s Board, particularly
planning is an important contributor to the long-term where such appointments would increase the diversity
success of the business. (and expertise) of the Company’s directors.
The Nomination Committee carefully reviews succession The Board operates a policy that aims to promote
plans for the executive directors, as well as evaluating diversity in its composition. Under this policy, director
the size, structure, composition and diversity of the Board appointments are evaluated against the existing balance
and its Committees on a regular basis to ensure that the of skills, knowledge and experience on the Board, with
Board is appropriately resourced to deliver the Group’s directors asked to be mindful of diversity considerations
business plans. when examining nominations to the Board.
In my 2018 statement I was pleased to confirm that two During its annual evaluation, the Board considered
additional non-executive directors had been appointed to diversity as part of the review of its performance
the Board during the year. In addition, Joseph Sparacio, and effectiveness.
who was appointed as Chief Financial Officer in May
2017, was also appointed an executive director in The Group supports the principles of the Hampton-
November 2017. Alexander Review (‘FTSE Women Leaders’) and the
Parker Review (‘Ethnic Diversity on UK Boards’), as well
Those appointments increased the representation of as the requirements of the UK Corporate Governance
independent non-executive directors on the Board and Code in this respect. At the end of FY19, there were two
allowed a refresh of the Board’s Committees, as female directors on our Board of nine directors (22% of
noted overleaf. the Board).
In my statement for the 2019 Annual Report, I am pleased
to report that the Nomination Committee continues to
look for opportunities to broaden the experience of the
Board, as the Group grows in size and expands its
global footprint.
86
Linda
Robinson
Nomination
Committee Chair
eOne Annual Report and Accounts 2019

As part of the work of the Committee in FY19, we have recommended to the Board, and the Board have confirmed, formal targets in line with the Hampton-Alexander and Parker Reviews, as follows:Metric Target Timing
Women’s representation on the Board Minimum of 33% by 2020Directors of colour on the Board Minimum of 1 by 2024
Entertainment One fully recognises the importance of diversity, including gender – at the Board and all levels of the Group – and the benefits that a diverse workforce can bring to the Group. We are committed to increasing diversity across our operations and have a wide range of activities to support the development and promotion of talented individuals, regardless of gender or social and ethnic background.
I look forward to reporting back to shareholders on our progress in achieving these targets in next year’s Annual Report.
Linda Robinson
Nomination Committee Chair 20 May 2019
Committee membershipAs at 31 March 2019, the Nomination Committee comprised Linda Robinson (Chair) with Mitzi Reaugh and Michael Friisdahl as the other independent non-executive members and Scott Lawrence as a non-independent non-executive member.
The CEO (Darren Throop), the CFO (Joe Sparacio), the Chairman (Allan Leighton) and the Company Secretary (Mark Trachuk) are invited to attend Nomination Committee meetings, but do not participate in decisions.
Board compositionThe Committee keeps the membership of the Board under review to ensure that it has the required combination of skills, knowledge and experience. The Board fully appreciates the benefits of diversity and is committed to equal opportunities for all.
The Committee carries out a review of the Board’s composition, size and structure at least annually. This review includes assessing the skills, knowledge and experience of individual directors as well as diversity, including gender, and the outputs of the Board’s own annual evaluation process. The Committee must also balance the particular requirements of the Board as set out in the Company’s Articles of Amendment, which require two-thirds of its directors to be Canadian and each of the Board’s Committees to be chaired by a Canadian.
During FY18 the Committee recommended an increase in the size of the Board and the ensuing search process resulted in the appointment of Mr McFarlane and Mr Friisdahl as two additional non-executive directors, as well as the appointment of Mr Sparacio, the Company’s CFO, to the Board as an executive director.
MeetingsThe Committee met five times during the year. Committee member attendance at Committee meetings is shown on page 73.
The following table lists the agenda items which have been dealt with by the Committee during the year.
Date of meeting Agenda
July 2018 Review of Board and Committee compositionConsideration of requirement for additional non-executive directorsBoard diversity metrics
September 2018 Review of Board and Committee compositionConsideration of requirement for additional non-executive directors
November 2018 Consideration of requirement for additional non-executive directors
January 2019 Selection of external search consultancy to support appointment of additional non-executive directors
March 2019 Update on search process for additional non-executive directors
SR
G
FS
87entertainmentone.com

Mr McFarlane has brought a wealth of financial expertise
to the role of Audit Committee Chairman, both having
been Chief Financial Officer of TELUS Corporation, and
currently serving as a non-executive director on the
board of HSBC Bank Canada and Deputy-Chair of Royal
& Sun Alliance Insurance Company of Canada.
Mr Friisdahl is President and Chief Executive Officer of
Maple Leaf Sports & Entertainment and has many years
of experience in the entertainment and leisure industry,
and has supplemented the Board’s knowledge of the live
entertainment space, an area of eOne’s business which
is expected to grow over the coming years.
Following a review of Board and Committee composition
during the current financial year, the Company appointed
Heidrick & Struggles to support the Committee in its
search for potential new non-executive directors to join
eOne’s Board, particularly where such appointments
would increase the diversity (and expertise) of the
Company’s directors.
The Committee maintains its recommendation for Mark
Opzoomer to continue to serve on the Board and Audit
Committee to provide continuity, as well as recognising
Mr Opzoomer’s financial and relevant industry
knowledge being of significant benefit to the Board.
During the year, an externally facilitated evaluation of
the Board, its Committees and its individual directors
was carried out, further details of which are set out on
page 72.
A report covering the Board and Committee evaluation
was used as input to a performance discussion at the
Board meeting in May 2019.
The Committee keeps its terms of reference under
review and makes recommendations for changes to the
Board. The full terms of reference are available on the
Company’s website.
After careful consideration by the Committee, it was
concluded that oversight of the Company’s succession
planning process beneath the Board level was best
achieved through the Remuneration Committee and
further details in respect of senior management
succession planning can be found in the Remuneration
Committee Report on page 94.
88
Board and Committee evaluation
Terms of reference
Succession planning
NOMINATION COMMITTEE CONTINUED
Composition
Gender
Tenure
Independent
6
Non
Independent
3
Male
7
Female
2
2 years or less
3
2 to 5 years
2
More than 5
4
Board composition and skills
eOne Annual Report and Accounts 2019

Remuneration Committee
Chairman:
• Mark Opzoomer
Non-executive directors:
• Michael Friisdahl• Mitzi Reaugh• Linda Robinson
Nomination Committee
Chairman:
• Linda Robinson
Non-executive
directors:
• Scott Lawrence• Mitzi Reaugh (from
14 September 2018)• Michael Friisdahl (from
14 September 2018)• Allan Leighton (until
13 September 2018)
Disclosure Committee
Chairman:
• Mark Opzoomer
Non-executive
directors:
• Robert McFarlane• Mitzi Reaugh• Linda Robinson (until
13 September 2018)
Audit CommitteeChairman:
• Robert McFarlane (from 14 September 2018)
• Mark Opzoomer (until 13 September 2018)
Non-executive
directors:
• Mark Opzoomer (from 14 September 2018)
• Robert McFarlane (until 13 September 2018)
• Mitzi Reaugh• Linda Robinson (until
13 September 2018)
Board
Name/eOne assessment
Allan Leighton - - - -
Darren Throop - - -
Joseph Sparacio - - -
Mark Opzoomer
Michael Friisdahl - - -
Scott Lawrence - -
Robert McFarlane - -
Mitzi Reaugh - - - - - -
Linda Robinson - - -
Busin
ess/
Man
agem
ent
Indu
stry
Kno
wle
dge
Inte
rnat
iona
l Mar
kets
Stra
tegi
c Pl
anni
ng
Lega
l
Acco
untin
g
Corp
orat
e Fi
nanc
e
Capi
tal M
arke
ts
List
ed C
ompa
ny
Info
rmat
ion
Tech
nolo
gy
Hum
an R
esou
rces
Exec
utiv
e Re
mun
erat
ion
Corp
orat
e G
over
nanc
e
Risk
Man
agem
ent
Executive directors:
Darren Throop Joseph Sparacio
Mark Opzoomer Mitzi Reaugh Linda Robinson
Chairman:
Allan Leighton
Non-executive directors:
Michael Friisdahl Scott Lawrence Robert McFarlane
SR
G
FS
89entertainmentone.com

DIRECTORS’ REMUNERATION REPORT
Annual statement of the Chairman of the Remuneration Committee
Context/Background
being a much more strategically important measure than On behalf of the Entertainment One Board I am pleased
revenue growth in this time of continuing changes to the to report on our continuing shareholder engagement
industry. Our key performance indicators shown in the programme, our remuneration outturns and plans,
Strategic Report have also shown strong performance improvements in reporting, and our areas of focus
over the last three years.and actions going forward in the new financial year
and beyond.Our shareholders have also benefited well over this
period with our stock price increasing steadily from 151.7p First, I want to set the background in our performance,
as at 31 March 2016 to 446.8p as at 31 March 2019. our industry and our legal structure and then explain our
Although we are not convinced that FTSE 250 total programme of shareholder engagement which has taken
shareholder return is the best indicator of our success place in 2019 so far.
(as noted later in my report), we must at least consider
relative TSR with the FTSE 250. This was also very
his period (see chart below). While we positive over t
Our key performance measure of Group underlying recognise there are areas for improvement, overall this
EBITDA has grown from £129.1 million (FY16) to has been a period of steadily improving performance for
£197.6 million (FY19), a compound annual growth rate of the Company and its shareholders.
approximately 15% on a non-organic basis. Our organic
long term planning aspiration of 6% to 12% compound At the same time our industry has faced unprecedented
annual growth has formed the basis for the vesting range challenge in all areas of our businesses, which has
we are applying to our long term incentive award this required very nimble and thoughtful action from all levels
year, as described further below of our management team to maintain this performance., and continues to be
relevant and containing an appropriate level of stretch
given the increased size of the Group and the significant In March 2016, our Group was primarily a buyer of
changes our industry is going through. distribution rights of films, some television and minimal
music, with part ownership of a single family brand.
Our leverage, a function of cash conversion, investment Between 2016 and now, we have seen the rapid growth
in content/productions and strategic acquisitions, has of new direct distribution channels (Netflix, Hulu, Amazon,
remained at reasonably conservative levels in the 1.2-2.1x Apple, Google, etc), an increasing shift in cinema takings
net debt to Group underlying EBITDA range through toward major franchises of the major studios, almost
focused and careful management. Our important complete erosion of the home entertainment DVD
underlying independent library valuation has also business, the increasing rise of high film production value
doubled from US$1 billion (2015) to US$2 billion ( 2018). television series and, finally, a return to growth of the
Return on capital employed as now better defined in the music industry through streaming services, among many
Appendix to the consolidated financial statements has other underlying shifts, evidenced also by large scale
continued to improve. For FY19, the Group’s underlying consolidation in the industry such as by Disney
EBITDA margin has continued to improve to 21%, this and Comcast.
90
Mark
Opzoomer
Senior
Independent
Director
eOne Annual Report and Accounts 2019

Our teams have produced these solid results while consolidating our previously separate Film and Television businesses, exiting home entertainment distribution activities, investing in common management platforms, investing more in direct production and IP ownership of film and particularly television, globally expanding our family brands portfolio and capabilities, growing a more material related music business and attracting more creative talent to work with our various teams. We are now more productive and profitable from a smaller employee base.
The report has been prepared, voluntarily, in accordance with the Large and Medium-Sized Companies and Groups (Accounts and Reports) (Amendment) Regulations 2013, the 2016 UK Corporate Governance Code (the Code) and the Financial Conduct Authority Listing Rules. To reflect the requirements of the remuneration reporting regulations, this report is presented in two sections: the Annual Report on Remuneration and the Directors’ Remuneration Policy.
Structurally we are headed by a Canadian parent company, subject to the Canada Business Corporations Act with its own governance requirements. In addition, we receive significant tax incentives to produce much of our original content in Canada which increases our competitiveness. Currently, to maintain these privileges, we have a number of constraints, such as requiring a majority of Canadian directors and Canadian chairs of our Board Committees, although less restrictive alternative measures are being considered.
We are premium-listed on the London Stock Exchange and subject to the Listing Rules and UK Corporate Governance Code. We are not subject to the UK Companies Act and related governance including the requirements surrounding the disclosure of, and voting on, directors pay, although we endeavour to voluntarily comply.
Over the last three years our business operations have shifted to a much higher concentration in the United States, particularly Los Angeles and New York. The United States and Canada are now over 65% of our employees, 90% of our senior management team and are where we are trying to attract further top creative talent to join us.
This plays directly into the design of our remuneration and retention programmes. We often face conflicts between what is market practice in the UK, our listing market, and North America, our key talent markets. We have now been having a much more open and constructive dialogue, in advance, with a wide range of our shareholders on how we manage these conflicts and choices. At all times our overriding concerns are to find that balance to act in the best interests of our shareholders and employees to keep driving forward value creation on all levels.
Performance plan results for FY19The outturn of the annual bonus is based on adjusted profit before tax. The adjusted profit before tax in FY19 was £155.9 million versus the constant currency amended target (minimal impact) of £152.7 million, producing an achievement of 102.1%. The impact of this for the CEO was a yield of 91% of salary out of a 150% opportunity. The impact of this for the CFO was a yield of 52% of salary out of a 60% opportunity as it has a cliff start point at target.
This outturn is broadly in line with the wider management bonus plan, the Annual Incentive Plan (AIP), which the Group operates at various levels in the organisation, although focused on a mix of Group/Divisional underlying EBITDA and personal goals. The Committee has considered these results, the overall performance of the Group together with the operating stability of the Group coming out of the year and believes these outcomes are fair and reasonable to the executive directors, the wider management, and to shareholders.
The results of the Long Term Incentive Plan (LTIP) relate only to the CEO in the current period. There are two past awards which have fallen into the reported figures for this financial year, which must be looked at separately. The first award related to a three-year performance period, granted in July 2015 for the financial years FY16, FY17 and FY18. It did not vest until the third anniversary of grant date, in July 2018, so was not included in the Annual Remuneration Report last financial year ending 31 March 2018. This award was under a previous programme based equally on EPS growth, a previous definition of ROCE and FTSE 250 TSR.
SR
G
FS
91entertainmentone.com

The award amounted to 211,491 options. EPS growth did not hit target, ROCE was hit in full and TSR was below median. This resulted in 69,792 of the options vesting with £256,695 included in the FY19 single figure tables. Frankly, we are not sure these outturns levels are consistent with the success of the business over the period, or that the arrangements were a motivating structure for management – and this is part of what is driving us to amend our plans in consultation with our shareholders.
The second was a special award for the three-year period, the financial years FY17, FY18 and FY19 – this was the controversial 3 million shares time-only option award to the CEO presented to and approved by shareholders at the September 2017 Annual General Meeting. This voting outcome was the beginning of the below-80% shareholder support on remuneration matters, at this time on the special award and the related Director’s Remuneration Report.
This award was clearly not fully explained at the time. It was intended to do two things: the first was to recognise that the CEO had not had a contract renewal for a number of years, in part due to extensive closed periods around acquisitions and results, and to reflect the ineffective incentive programmes in place at that time for the Group, shareholders and executives. The second and primary intention was to motivate and incentivise the CEO going forward. This award had the desired results which were seen in the most intensive work period concurrent with significant and continuing industry change, organisational development and change, and the best period of results to date which I outlined above. This award was accepted, and still is, by a majority of shareholders, however we have heard the disapproving feedback loud-and-clear from other shareholders, all of whom we equally respect.
The Company’s share price increased significantly over this period, as noted above, with the market capitalisation growing by about £1.4 billion. The single figure value included for the special award in this year’s report amounts to £13.2 million, representing about 0.9% of the growth in market capitalisation. This is now in the past. We have been asked by some shareholders to confirm that we will not grant additional one-off awards, as allowed under current Policy, during the remaining year of our tri-annual Remuneration Policy (this is the final year). We confirm this, and that it is our intention to remove this from the Policy going forward.
The CFO has different contractual terms which reflect arrangements agreed to prior to his appointment to the Board. He has only unvested LTIP grants from the first two years of his employment contract with the Group. These will build towards his minimum shareholding requirement of 200% of salary. The cliff aspect of the annual bonus and the time-only element of the CFO’s LTIP will be reviewed next year upon renewal of his contract, as he will be in the last year of an initial three-year term. Upon renewal we intend to have the CFO on the similar performance measures as the CEO.
We extend the LTIP to a range of senior management, at varying levels of awards, weighted with a 50% performance measure of Group underlying EBITDA, similar to the CEO, and 50% time-served to encourage longer-term retention and share ownership. The three-year performance period for FY17, FY18 and FY19 is now completed and the awards for that period will vest on 21 May 2019. The outturn based on Group underlying EBITDA performance in the period will result in participants generally vesting 83.5% of their award. The Committee considers this outturn to be fair, reasonable and in line with the remuneration profile of the executive directors.
DIRECTORS’ REMUNERATION REPORT CONTINUED
Apr 16 Jun 16 Sept 16 Dec 16 Mar 17 Jun 17 Sept 17 Dec 17 Mar 18 Jun 18 Sept 18 Dec 18 Mar 19
eOneFTSE 250FTSE 350 Media
Ind
ex
(Ap
ril 2
016
eq
ua
ls 1
00
)
50
100
150
200
250
300
Relative performance to FTSE 250/FTSE 350 Media:
eOne Annual Report and Accounts 201992

We wish to have a more unified shareholder base and positive voting outcome through concentrating on building a balanced reward structure that encourages both growth and returns, leads to increased share ownership and rewards management against measures over which they have more control and influence. We also need a remuneration framework and structure which is relevant for our business ambitions/goals in the markets where we operate and compete for talent. A one-market approach is not desirable in supporting the achievement of our ambitions and goals.
This brings us on to the 2019 Engagement Programme, feedback we have received from shareholders and the changes we intend to implement going forward to reach the objectives outlined in this report.
Shareholder Engagement ProgrammeOur 2019 Engagement Programme has been concentrated within the January to April period. This was intentional and a learning from the previous year. Our programme in 2018 stretched from February to October and was not timely enough to incorporate in our 2018 Annual Report, our DRR feedback and actions, so we received a second less than 80% vote on our DRR. This was very unsatisfying and an unnecessary blemish on our overall performance. We have set out to correct this in 2019 by completing our Shareholder Engagement Programme by May.
Our 2019 programme began with publication of a full review of feedback from the 2018 programme and the course of action we would follow in the 2019 programme. The objectives of the 2019 programme were to review a range of actions we could take to adopt more best practice remuneration governance features, to ensure our executives are rewarded fairly going forward (recognising internal and external pressures in attracting and retaining the best talent), discussing the broadening Remuneration Committee remit and preparing for approval of our tri-annual Policy which is due for renewal next year at our September 2020 Annual General Meeting. Our goal is to return to earning the support of more than 80% of our shareholders on our 2019 DRR vote.
We began the process by meeting with three of the shareholder advisory organisations to discuss our objectives in general, a range of the potential options and to get a sense of our market alignment. These were constructive and open dialogues that helped shape our specific proposals.
This was followed by invitations to meet with shareholders to provide coverage of over 70% of our share register as at 31 January 2019. Of those 88% responded, being 62% of our register. We have now met with 70% of those shareholders (50% of register) largely in person, a small number by teleconference. A further 12% (being 8% of register) requested only written submissions/dialogue. Of the responding balance, 7% acknowledged our request but did not request or confirm a meeting (being 4% of register). Finally, we were unable to get responses from 12% of those shareholders that we contacted (being 8% of register). We were persistent with not less than three attempts to meet all invited. We have concluded by reaching back to certain shareholders to summarise our findings. Through this consultative process we have agreed on a number of changes to how we implement our current Policy.
We discussed a range of LTIP performance measures and improved disclosure of targets in depth. The consensus was that there should be multiple measures for growth and returns. There was broad agreement on retaining Group underlying EBITDA as the growth measure as it is an unlevered measure, in use currently and well-understood, and widely used by analysts across the industry. This measure was preferred over EPS which reflected leverage and capital decisions, being largely Board decisions. In the body of our ARR we have set out the growth ranges/targets for the next three-year performance period and illustrated the ranges for the in-flight grants for the CEO. These are set with reference to the internal rolling mid-term plans reviewed annually by the Board.
Future target setting is challenging given the pace of industry changes and our ongoing shift to more content ownership than distribution and as the Company increases in size. The Group is on track to meet its 2015-2020 strategy of doubling the size of the business over this period through organic and targeted acquisition growth and we will measure ourselves against new targets beyond 2020.
With this background, the EBITDA organic development growth rates over the next three-year performance period have worked around compound growth rates of 6-12%. The top end of this range will challenge management, reflecting appropriate stretching targets, to balance capital returns.
SR
G
FS
93entertainmentone.com

There was also broad agreement on adding Return on Capital Employed (ROCE) as the return measure for future awards. Our cost of capital is approximately 8%, so with a premium of 25% we have set a threshold performance target of 10%. Our historic experience has generally been up to around 12% and therefore we have set a performance range of 10-14% for the application of our LTIP plan.
We also discussed TSR measures. There was no consensus with shareholders on a suitable measure (absolute or relative) and how TSR should be applied (as a direct measure, use as a modifier or as an underpin) or index against which to measure TSR. We are included in the FTSE 250 but with little direct relevance to the index other than from our listing location. This may have been more relevant when we were first admitted to the main market as we tended to attract generalist investors and were an alternative index component. As the Company has matured and increased in size and scope, we are increasingly assessed as a media investment opportunity. We have assessed nine media-related indices (including Bloomberg, FTSE, MSCI, STOXX and S&P) but all had enough flaws in the composition or breadth of companies to be unsuitable as an appropriate comparator group.
Finally, somewhat reluctantly, we constructed a bespoke index of 18 companies with criteria around business mix, range of sizes, core geographic fit and reasonable market correlation and extensively back tested it. We included companies listed in the UK/Europe, USA and Canada, media companies and some toy/licensing related companies to reflect the significance of our Family business.
Having just completed the analysis on this bespoke index, at this point it looks interesting as a reference point but it requires further analysis and testing before the Committee concludes on its appropriateness. Ultimately, based on shareholder feedback and our own experience of trying to establish a suitable index for eOne, we do not believe we should be incorporating a TSR measure formally into the LTIP plan, but we will consider the shareholder experience of the FTSE 250 and a bespoke media index in our assessment of outcomes. We intend to review this further with shareholders as we progress through our Policy review next year.
The main shareholder feedback on the annual incentive plan (our AIP) was to consider adding a second performance measure. This should be measurable and an important or related objective embodied in the financial plan for the current year. These would be retrospectively disclosed as with the main PBT measure.
The Remuneration Committee has embarked upon a more in-depth succession planning exercise in the past year, supported by the Human Resources team and with the involvement of senior management. Based on this exercise, we believe we have the strongest and broadest team in the Group’s history.
The Committee is focused on Level 1, CEO, down two levels to Level 3 being direct reports of the CEO’s direct reports, known internally as the Operating Executive. This process is reviewed annually in September each year. The development plans will continue to revolve around this assessment.
One of the primary challenges is our ability to continue to attract and retain our key management. In our externally-facilitated Board and Committee evaluation it was noted that it is particularly challenging to devise a Policy that addresses this issue yet meets the very different and often conflicting expectations of employees and shareholders in our different markets, particularly balancing our key operational market in the US and the corporate governance code in our UK listing market.
There exist significant differences, but nevertheless, we must act in the broader best interests of both our management teams and shareholders in our drive for value creation.
This challenge arises in particular with our CEO who has been carefully building our teams while endeavouring to keep fixed costs as low as practical throughout this process.
Our CEO is currently neither our highest paid executive in either base pay or in total opportunity, and has very little pay differentiation with his wider executive team. The Board is not comfortable with this position and believes it is a significant risk to the Company as it does not properly reflect the supervisory experience and complexity of the role, nor is it appropriate in the talent market where we operate.
DIRECTORS’ REMUNERATION REPORT CONTINUED
eOne Annual Report and Accounts 201994

Our view is that any replacement would highly likely be drawn from the US market where a competitive pay package is very different to a UK package both in terms of structure and quantum. We do not want to be exposed to competitive actions.
We have discussed this at length openly and constructively in our shareholder engagement programme. The proposals we have discussed and, we believe, agreed with the shareholders we engaged with are to:
• remove the fixed base pay increases from our CEO’s contract;
• increase performance pay opportunities;• provide more transparent performance measures; and• address a number of other remuneration governance
flags raised over the last two years.
I will provide more detail on these proposals below, after outlining the research we shared to determine the relevant opportunity.
To assess the relevant opportunity, we engaged with Willis Towers Watson to triangulate the relevant opportunity range. We could not just look at CEO roles at major competitors due to size and complexity. The mandate included the review of compensation practices within the entertainment industry with the objective of establishing a compensation opportunity that is relevant for comparable roles within the sector that the Group competes. The review examined multiple market perspectives including American and Canadian peers, industry competitors and broader media industry comparators, the relationship between entertainment and general industry executive pay and relationships between CEO and direct report pay. And, as one of our shareholders noted, we are also reasonably informed by our recruiting and acquisition work as a sense check. The result of this detailed work was that the direct compensation level should be around US$8-10 million in opportunity.
Working with our shareholders through the engagement programme we are proceeding on the basis of using the exceptional limits in the last year of our Policy as a means of minimising risk to the Group and shareholders, adopting a package of ‘gives and takes’ to create that balance between good governance expectations and remaining competitive in the talent markets in which we operate. As one shareholder noted, “to improve alignment and the direction of travel in both directions”, from a UK-listed and US-talent market perspective.
This package will include:
• reduction in contracted salary increase for the CEO from 7% to those applicable to the broader workforce (3% this year);
• increase annual bonus opportunity from 150% to 200%, with the addition of a second quantified performance measure;
• reduction of compensation upon termination for the CEO from 24 months to 12 months (excluding specific provisions in the event of a change of control) which reflects standard practice in North America;
• increase LTIP opportunity from 200% to 300%, with the addition of a second quantified performance measure covering capital efficiency (ROCE);
• reduction in LTIP threshold vesting performance level from 30% to 25%;
• introduction of a two-year holding period on new LTIP grants from May 2019; and
• an increased minimum shareholding level from 300% to 500% for the CEO in line with the increase in variable opportunity.
The net result will be a small increase in opportunity at threshold of 3.8% (from US$2.5 million to US$2.6 million), to 18.4% at target (from US$4.3 million to US$5.1 million) and 28.2% at maximum (from US$5.9 million to US$7.6 million).
Target is the more likely outcome area; however, shareholders should also see significant rewards if maximum is achieved, which has rarely been achieved due to the stretch element.
Other areas that we have also discussed and will be part of our Remuneration Policy review and engagement programme for 2020 include a review of malus and clawback provisions (currently 12 months), use of discretion by the Remuneration Committee and post-employment shareholding guidelines. We have discussed the latter with the higher 500% guideline (declining over two years) and, as suggested by one shareholder, expect this largely to be made up of LTIP awards in hold periods and in-flight awards.
In addition, as we have noted above we will remove the unfettered ability to make one-off awards from Remuneration Policy on review and we will aim to have our highly-respected CFO move to performance measures similar to the CEO upon contract renewal.
SR
G
FS
95entertainmentone.com

DIRECTORS’ REMUNERATION REPORT CONTINUED
The Committee also intend to review our progress on gender and wider diversity measures below the Board in numbers, roles and pay relationships through the coming year in line with a number of regulatory requirements emerging in our various markets. CEO pay ratio will be reported on in our FY20 Annual Report. We first look to Group-wide application and then local application, as required.
Our intention is to publish Group measurements in our Annual Report and local measurements on our website.
ConclusionWe received consistently positive feedback for the depth of work, analysis and proposals in our shareholder engagement programmes. The entire Board is strongly supportive of the work that has been carried out by the Committee this financial year. We have engaged with and listened to shareholders representing a significant proportion of our share register and believe that the proposals that we have outlined are in the best interests of the Company, our employees and our shareholders as a whole.
There is a fine balance between respecting and motivating our executive directors and other team members, primarily in North America, and meeting best practice in our UK listing market. We have diligently endeavoured to find this balance and will continue to work progressively with our shareholders in this area.
We will be looking for our shareholders to support our hard working and delivering management teams across our Group with a positive vote on our Remuneration Committee Report for FY19.
Mark Opzoomer
Chairman of Remuneration Committee and Senior Independent Director
eOne Annual Report and Accounts 201996

This section of the Directors’ Remuneration Report contains details of how the Company’s Remuneration Policy for directors was implemented during the year ended 31 March 2019.
1. Single total figure of remunerationThe information in this section has been audited.
Executive directors
The table below sets out the single total figure of remuneration and breakdown for each executive director earned in the years ended 31 March 2019 and 2018. Figures provided have been calculated in accordance with the remuneration disclosure regulations (The Large and Medium-sized Companies and Groups (Accounts and Reports) (Amendment) Regulations 2013).
Salary £000
Taxable benefits
£000Annual bonus
£000LTIP3 £000
Pension £000
Total £000
Special Award4 £000
Total including Special Award
£000
FY19 FY18 FY19 FY18 FY19 FY18 FY19 FY18 FY19 FY18 FY19 FY18 FY19 FY18 FY19 FY18
D Throop1 933 866 5 5 846 802 257 172 15 15 2,056 1,860 13,182 – 15,238 1,860J Sparacio2 418 132 9 2 218 69 – – 15 – 660 203 – – 660 203Total 1,351 998 14 7 1,064 871 257 172 30 15 2,716 1,063 13,182 – 15,898 2,063
1. Darren Throop received and retained total annual compensation of US$182,499 (FY18: US$182,492) in relation to his service as a non-executive director of IMAX Corporation, which is not included in the table above.
2. Appointed on 20 November 2017. Amounts shown for FY18 reflect remuneration for the period for which services were performed as a director.3. The CEO was granted awards over 211,491 nil cost options in FY16, of which 69,792 options vested on 31 July 2018. These awards have been included in the
single figure table based on the share price on the vest date (367.8 pence).4. The CEO was granted awards over 3 million nil cost options in September 2017. These vested on 1 April 2019 as fully disclosed to shareholders when approval
for the award was sought. As these awards vested effectively with respect of FY19 they have been included in the single figure table based on the share price on the vest date (439.4 pence). Of the amount disclosed in the single figure table, £5,532k relates to increase in share price growth from the date of the award to the date of vesting.
2. Notes to the single total figure of remunerationThe information in this section has been audited.
Salary and fees
The table below sets out the base salaries of the executive directors from 1 April 2018 together with the increase from the prior year.Base salary
from 1 April 2018 (per annum)
Increase (per annum)
Darren Throop US$1,225,000 US$75,000Joseph Sparacio US$550,000 US$50,000
Increases to the executive directors’ base salaries were approved by the Remuneration Committee in line with the Directors’ Remuneration Policy.
Taxable benefits
Taxable benefits in the years ended 31 March 2019 and 2018 consist of costs relating to the provision of a motor vehicle, private medical insurance, health insurance, dental insurance, income protection insurance and payments in lieu of pension contributions.
Annual bonus plan awards
For the financial year ending 31 March 2019, the annual bonus depended on the achievement of Group adjusted profit before tax targets. The performance against this measure in relation to the CEO and CFO is set out below. Payout at stretch target reflects the high level of challenge within the bonus targets.
ANNUAL REPORT ON REMUNERATIONSR
G
FS
97entertainmentone.com

ANNUAL REPORT ON REMUNERATION CONTINUED
CEO:
Maximum opportunity for the year ending 31 March 2019 was 150% of salary.
Weighting
Threshold performance
(20% of maximum)
Stretch target performance
(50% of maximum)
Maximum performance
(100% of maximum)Actual
performanceBonus award
(% of salary)
Group adjusted profit before tax 100% £137.4m £152.7m £168.0m £155.9m 90.7%
Annual bonus is calculated on a straight-line basis between these points.
CFO:
Maximum opportunity for the year ending 31 March 2019 was 60% of salary. The vesting range for the CFO operates such that 50% of salary is delivered for stretch target performance and 100% of maximum (60% of salary) for maximum performance. There is no bonus earned below stretch target. This differs to the CEO’s bonus arrangement but is consistent with the structure in place for a number of other senior executives.
Weighting
Stretch target performance
(83.3% of maximum)
Maximum performance
(100% of maximum)Actual
performanceBonus award
(% of salary)
Group adjusted profit before tax 100% £152.7m £168.0m £155.9m 52.1%
Annual bonus is calculated on a straight-line basis between these points.
The bonus is subject to a clawback provision which extends for a period of 12 months following payment of the bonus.
Long-term incentive disclosure in the single figure table for the current year
The LTIP award disclosed in the single figure table is in respect of the LTIP granted in FY15. The award vested on 31 July 2018. Details of this vesting are provided below:
WeightingThreshold performance1
(30% of maximum)Maximum performance1
(100% of maximum) Actual performanceAward vesting
(% of maximum)
EPS2 33% 10% 15% 1.7% 0%Relative TSR3 34% Median Upper quartile Below Median 0%ROCE4 33% 11.2% 12.7% 12.7% 33%Total vesting outcome (% achievement) 33%Total vesting outcome (shares) 69,792
1. Awards vest on a straight-line basis for performance between threshold and maximum performance. No vesting occurs if performance is below threshold.2. Adjusted fully diluted EPS is calculated before one-off operating and finance items, share-based payments and amortisation of acquired assets (net of any
related tax effects) and is as disclosed in the relevant Annual Report and Accounts. The measure is calculated after adjusting the weighted average number of shares in issue for a year to assume conversion of all potentially dilutive shares.
Vesting of this portion of the award was determined by an assessment of the annualised adjusted fully diluted EPS growth over the three consecutive years ending 31 March 2018 as set out above.
3. The comparator group comprises those companies constituting the FTSE 250 Index on 1 April 2015 (excluding investment trusts). For these purposes, a company with a more negative TSR will rank lower than a company with a less negative TSR. If any member of the comparator group ceases to exist, its shares cease to be listed on a recognised stock exchange, or otherwise is so changed as to make it, in the opinion of the Board, unsuitable as a member of the comparator group, the Board will exclude that company unless it decides to (a) in the event of a takeover of that company, replace that company with the acquiring company; (b) include a substitute for that company; (c) track the future performance of that company by reference to an index; or (d) treat the company in any other way it decides is appropriate.
Vesting of this portion of the award was determined by TSR growth versus the comparator group over the three consecutive years ending 31 March 2018 as set out above.
An underpin also applies to this portion of the award, such that if the Company’s TSR is less than 5% no vesting of this portion of the award will occur.4. ROCE is calculated by dividing adjusted net operating profit (adjusted NOP) by net operating assets, where adjusted NOP is calculated before one-off
operating and finance items, share-based payments and amortisation of acquired assets (net of any related tax effects) and is stated before adjusted finance costs (after tax). Adjusted NOP can be derived from the audited consolidated financial statements. Net operating assets means, for any financial year, the average of opening and closing total assets as shown in the audited consolidated financial statements less current liabilities (excluding current debt balances). The calculation will also take into account any of the adjustments which the Committee determines are required to ensure it is consistent with the calculation of adjusted NOP.
Vesting of this portion of the award was determined by an assessment of the average ROCE over the three consecutive years ending 31 March 2018 as set out above.
5. This was the final award under this combination of performance measures which, in their overall composition, were judged by the Committee to not be effective for the Company, shareholders or executives.
eOne Annual Report and Accounts 201998

Special Award disclosure in the single figure table for the current year
Date of award Date of vestingNumber of shares
under award
Face value of awards (based on share price
on award date) £000
Increase in value due to share price increase over
the performance period £000
Total value shown in single figure table
£000
27 September 2017 1 April 2019 3,000,000 7,650 5,532 13,182
As set out in the Chairman’s statement, share awards were granted to the CEO in September 2017 following shareholder approval at the 2017 AGM. The awards vested under the terms approved by shareholders. A significant proportion of the value disclosed in the single figure table is derived from share price growth over the performance period, during which time the Company increased in market capitalisation by £1.4 billion.
Pension entitlements
The information in this section has been audited.
The Group does not operate any defined benefit retirement plans.
In the year ended 31 March 2019, Darren Throop received pension RRSP contributions amounting to £15,000 (the maximum RRSP contribution permitted for 2019 being C$26,500), in line with other eOne Canadian employees.
In the year ended 31 March 2019, Joe Sparacio received standard 401k pension contributions amounting to £15,000 (the maximum 401k contribution permitted for 2019 being US$19,000), in line with other eOne US employees.
3. Long-term incentivesLong-term incentives awarded in the financial year
The information in this section has been audited.
During the year, the CEO and CFO were granted an LTIP award equivalent to 200% of salary.
In line with the contractual arrangements agreed with the CFO before his appointment to the Board and which are line with the Group’s remuneration policy for senior management below Board level, only half of the award granted to the CFO is subject to performance conditions. The other half is subject to continued employment only. The CFO also has an alternative performance structure which is in line with LTIP grants for all employees other than the CEO.
LTIP awards for the CEO
Details of the LTIP awards granted are set out in the table below.Date of award Form of award Number of LTIP shares awarded Value of awards at date of grant1 Performance period
21 May 2018 Nil-cost options 631,350 £1,819,802 1 Apr 18 – 31 Mar 21
1. Award value based on the three-day volume weighted average share price to the date of award (288.2 pence).
The CEO’s LTIP award is subject to cumulative Group underlying EBITDA targets measured for the three years to 31 March 20211:Unaudited Threshold (30% vest)
Unaudited Stretch Target (75% vests)
Unaudited Maximum (100% vests)
£567m £630m £693m
1. Performance will be assessed on a like-for-like basis taking into consideration, for example, material acquisitions (such as Audio Network Limited in FY20) and disposals, and the impact of significant accounting changes not included in the original targets (e.g. IFRS 16).
LTIP awards for the CFODate of award Form of award Number of LTIP shares awarded Value of awards at date of grant1 Performance period
21 May 2018 Nil-cost options 283,463 £817,054 1 Apr 18 – 31 Mar 21
1. Award value based on the three-day volume weighted average share price to the date of award (288.2 pence).
As noted above, half of the CFO’s LTIP award is subject to performance, with the other half subject to continued employment only. The performance related structure for the CFO is in line with LTIP participants below Board level. Under this structure Group underlying EBITDA targets are set at the commencement of each year of the three-year plan and one third of the award accrues if the target is met. There is no threshold or maximum performance.
SR
G
FS
99entertainmentone.com
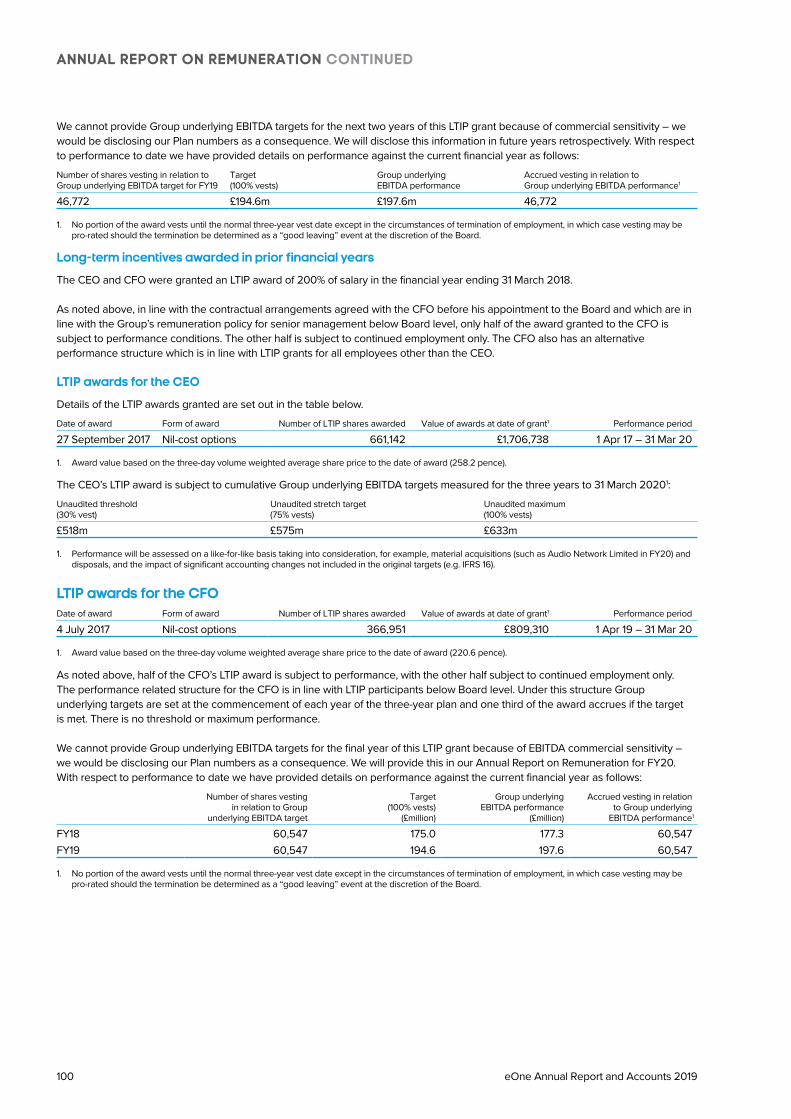
ANNUAL REPORT ON REMUNERATION CONTINUED
We cannot provide Group underlying EBITDA targets for the next two years of this LTIP grant because of commercial sensitivity – we would be disclosing our Plan numbers as a consequence. We will disclose this information in future years retrospectively. With respect to performance to date we have provided details on performance against the current financial year as follows:Number of shares vesting in relation to Group underlying EBITDA target for FY19
Target (100% vests)
Group underlying EBITDA performance
Accrued vesting in relation to Group underlying EBITDA performance1
46,772 £194.6m £197.6m 46,772
1. No portion of the award vests until the normal three-year vest date except in the circumstances of termination of employment, in which case vesting may be pro-rated should the termination be determined as a “good leaving” event at the discretion of the Board.
Long-term incentives awarded in prior financial years
The CEO and CFO were granted an LTIP award of 200% of salary in the financial year ending 31 March 2018.
As noted above, in line with the contractual arrangements agreed with the CFO before his appointment to the Board and which are in line with the Group’s remuneration policy for senior management below Board level, only half of the award granted to the CFO is subject to performance conditions. The other half is subject to continued employment only. The CFO also has an alternative performance structure which is in line with LTIP grants for all employees other than the CEO.
LTIP awards for the CEO
Details of the LTIP awards granted are set out in the table below.Date of award Form of award Number of LTIP shares awarded Value of awards at date of grant1 Performance period
27 September 2017 Nil-cost options 661,142 £1,706,738 1 Apr 17 – 31 Mar 20
1. Award value based on the three-day volume weighted average share price to the date of award (258.2 pence).
The CEO’s LTIP award is subject to cumulative Group underlying EBITDA targets measured for the three years to 31 March 20201:Unaudited threshold (30% vest)
Unaudited stretch target (75% vests)
Unaudited maximum (100% vests)
£518m £575m £633m
1. Performance will be assessed on a like-for-like basis taking into consideration, for example, material acquisitions (such as Audio Network Limited in FY20) and disposals, and the impact of significant accounting changes not included in the original targets (e.g. IFRS 16).
LTIP awards for the CFODate of award Form of award Number of LTIP shares awarded Value of awards at date of grant1 Performance period
4 July 2017 Nil-cost options 366,951 £809,310 1 Apr 19 – 31 Mar 20
1. Award value based on the three-day volume weighted average share price to the date of award (220.6 pence).
As noted above, half of the CFO’s LTIP award is subject to performance, with the other half subject to continued employment only. The performance related structure for the CFO is in line with LTIP participants below Board level. Under this structure Group underlying targets are set at the commencement of each year of the three-year plan and one third of the award accrues if the target is met. There is no threshold or maximum performance.
We cannot provide Group underlying EBITDA targets for the final year of this LTIP grant because of EBITDA commercial sensitivity – we would be disclosing our Plan numbers as a consequence. We will provide this in our Annual Report on Remuneration for FY20. With respect to performance to date we have provided details on performance against the current financial year as follows:
Number of shares vesting in relation to Group
underlying EBITDA target
Target (100% vests)
(£million)
Group underlying EBITDA performance
(£million)
Accrued vesting in relation to Group underlying
EBITDA performance1
FY18 60,547 175.0 177.3 60,547FY19 60,547 194.6 197.6 60,547
1. No portion of the award vests until the normal three-year vest date except in the circumstances of termination of employment, in which case vesting may be pro-rated should the termination be determined as a “good leaving” event at the discretion of the Board.
eOne Annual Report and Accounts 2019100

4. Payments to past directorsThe information in this section has been audited.
No payments were made to past directors during the year.
5. Payments for loss of officeThe information in this section has been audited.
There were no payments for loss of office during the year.
6. Non-executive directorsSingle total figure of remuneration
The information in this section has been audited.
The table below sets out the single total figure of remuneration and breakdown for each non-executive director earned in the years ended 31 March 2019 and 2018.
Fees £000
Taxable benefits £000
Total £000
FY19 FY18 FY19 FY18 FY19 FY18
Allan Leighton 221 246 – – 221 246Ronald Atkey1 – 12 – – – 12Michael Friisdahl2 61 21 – – 61 21Scott Lawrence3 57 58 – – 57 58Robert McFarlane2 63 21 – – 63 21Mark Opzoomer 117 132 – – 117 132Mitzi Reaugh 66 90 – – 66 90Linda Robinson 65 105 – – 65 105Total 650 685 – – 650 685
1. The Company was informed of Ron Atkey’s death on 15 May 2017.2. Appointed on 20 November 2017.3. Scott Lawrence is an employee of Canada Pension Plan Investment Board (CPPIB). The Company pays no fee to Scott Lawrence in connection with his
appointment. The Company pays CPPIB an annual fee equivalent to the annual fee paid by the Company to its other non-executive directors in consideration for CPPIB allowing Scott Lawrence to allocate time to his role as a non-executive director of the Company. The fee payable to CPPIB in respect of Scott Lawrence’s services for the year ended 31 March 2019 was C$98,500 (FY18: C$98,500).
4. Non-executive directors are paid a per-meeting fee of £1,000/C$1,700 for attending Committee meetings.5. Mr Opzoomer was paid a fee of £30,000 during FY19 in consideration of the extensive shareholder engagement programme carried out in 2018 and 2019.
7. Statement of directors’ shareholdingThe information in this section has been audited.
Shares (without performance measures)
Unexercised share options1,2
(with performance measures)
Executive director 31 March 2019 31 March 2018 31 March 2019 31 March 2018
Darren Throop 7,170,141 8,670,141 4,362,284 3,730,934Joseph Sparacio 40,000 40,000 700,414 416,951
1. LTIP awards made prior to the Company’s rights issue have been adjusted in line with the LTIP rules, to reflect the dilutive effect of the rights issue, and as noted in the Company’s Prospectus dated 30 September 2015.
2. Further to the above, Darren Throop has vested, unexercised share options without performance measures totalling 367,893 relating to grants in made in FY14 and FY15.
To promote alignment with the interests of our shareholders, executive directors are expected to build up and maintain significant holdings of eOne shares as follows:
• CEO: 3 times base salary• Other executive directors: 2 times base salary
SR
G
FS
101entertainmentone.com

ANNUAL REPORT ON REMUNERATION CONTINUED
The table below summarises the executive directors’ interests in shares and the extent to which the shareholding expectation applicable to executive directors has been achieved as at 31 March 2019.
Executive director
Value of sharesto be held1
£000Beneficial interests
in shares2
Value of beneficialinterests in shares3
£000Shareholding
expectation met?
Darren Throop 2,820 7,170,141 32,071 YesJoseph Sparacio 844 40,000 179 No
1. This has been calculated based on the salaries of the executives set out in the table under 2, above. US dollar salaries have been translated at the 31 March 2019 US$:£ rate of 1.303.
2. Beneficial interests include shares held directly or indirectly by connected persons.3. Based on the closing share price at 29 March 2019 of 446.8p.
At 31 March 2019, the shareholding expectation has been achieved for the CEO and is in line with the transitional requirements for the CFO, as set out in the Group’s Remuneration Policy. Going forward the shareholding requirement will be increased to 5 times base salary for the CEO.
There is no shareholding expectation for non-executive directors, including the Chairman, but the following non-executive directors held shares, as noted:
• Robert McFarlane had a beneficial interest in 26,724 shares at 31 March 2019• Mark Opzoomer had a beneficial interest in 25,000 shares at 31 March 2019• Mitzi Reaugh had a beneficial interest in 7,000 shares at 31 March 2019
No other non-executive director had any beneficial interests in shares at 31 March 2019.
8. Service contractsExecutive directors
The executive directors have service contracts as follows:Executive director Effective term Notice period
D Throop 24 months No notice by the Company, 6 months by the executive directorJ Sparacio 12 months No notice by the Company, 90 days by the executive director
During the year, as part of the changes made to the remuneration framework, a number of changes were made to the CEO’s service contract. These included:
• Removal of the expected increase in salary of 7% per annum beyond FY19• A reduction in the compensation receivable for dismissal without cause from 24 to 12 months’ pay, except in certain change of
control situations.
As noted elsewhere, under the CFO’s service contract his LTIP entitlement of 200% of salary is structured such that half of the award is based on performance, whilst the other half is subject to continued employment only. This contractual arrangement was agreed prior to the appointment of Mr Sparacio as an executive director and reflects the policy on LTIP grants across the business.
Non-executive directors’ service under letters of appointmentMost recent letter of appointment effective Notice from the Company Notice from director
Allan Leighton 1 October 2016 6 months 6 monthsMichael Friisdahl 20 November 2017 6 months 6 monthsScott Lawrence 1 October 2016 6 months No noticeRobert McFarlane 20 November 2017 6 months 6 monthsMark Opzoomer 1 October 2016 6 months 6 monthsMitzi Reaugh 22 November 2016 6 months 6 monthsLinda Robinson 1 October 2016 6 months 6 months
As required, service contracts and letters of appointment for all directors are on display prior to and during the Company’s Annual General Meeting.
eOne Annual Report and Accounts 2019102

9. Outside directorships
10. Performance and pay
The Board may permit executive directors to serve in a non-executive capacity on the boards o� other companies where this is
bene�icial to the individual, in terms o� development, and the Company, and where there is no con�lict o� interest created.
During the year, Darren Throop served as a non-executive director o� IMAX Corporation.
Mr Throop received and retained total annual compensation o� US$182,499 in relation to his service as a non-executive director o�
IMAX Corporation.
The �ollowing graph shows the Company’s per�ormance, measured by TSR, compared with the per�ormance o� the FTSE 250 Index
and the FTSE 350 Media sector also measured by TSR, since 1 April 2013. The FTSE 250 Index is a use�ul comparator �rom 1 April 2013
as that is the start o� the three-year per�ormance period o� the �irst LTIP and the Company became a constituent member o� the FTSE
UK Index Series on 23 September 2013.
The table below shows the single �igure o� total remuneration and the levels o� pay-out under the annual bonus plan and LTIP �or the
CEO over the past six years, being the period over which the Company has been a constituent member o� the FTSE UK Index Series.
CEO single fgure o� total remuneration 10,269 8976 718 1,680 1,860 15,23
Annual bonus pay-out (% o� salary) 84.4 82.8 40.4 39.6 92.6 90.7
LTIP vesting outcome (% o� maximum) n/a n/a n/a 64% 33% 96.3%
103
2019 (including
2014 2015 2016 2017 2018 Special Award)
2019
(excluding
Special Award)
2,056
90.7
33%
Apr 13 Jun 13 Sept 13 Dec 13 Mar 14 Jun 14 Sept 14 Dec 14 Mar 15 Jun 15 Sept 15 Dec 15 Mar 16 Jun 16 Sept 16 Dec 16 Mar 17 Jun 17 Sept 17 Dec 17 Mar 18 Jun 18 Sept 18 Dec 18 Mar 19
)0
0 1
lsa
uq
e31
0l 2
rip
A (
xe
dIn
eOne
FTSE 250
FTSE 350 Media
300
250
200
150
100
50
SR
G
FS
entertainmentone.com

ANNUAL REPORT ON REMUNERATION CONTINUED
11. Percentage increase in the CEO’s remunerationThe table below compares the percentage increase in the Chief Executive Officer’s pay (salary, taxable benefits and annual bonus) with the average for the employees of the Group taken as a whole (excluding amounts for the Chief Executive Officer).
2019 £000
2018 £000
% change
Chief Executive Officer
Salary 933 866 +7%Taxable benefits 5 5 –Annual bonus 846 802 +5%
Employees of the Group taken as a whole
Salary 67 62 +9%Taxable benefits 1 1 +3%Annual bonus 7 6 +17%
It should be noted that the percentage changes shown above are impacted by the year-on-year differences in local currency exchange rates used to translate salaries to pounds sterling, given the international locations of the Group’s employees.
12. Relative importance of spend on payThe table below sets out the relative importance of spend on pay in the years ended 31 March 2019 and 2018.
Dividend (pence per share)
Remuneration paid to or receivable by all
employees of the GroupTotal investment in
production and content
Year ended 31 March 2019 1.5 £116.2m £380.2mYear ended 31 March 2018 1.4 £108.2m £443.8mPercentage change +7% +7% -14%
Total investment in content represents the total cash outflow relating to investment in acquired content rights (2019: £121.9 million; 2018: £144.5 million) and investment in productions, net of grants received (2019: £258.3 million; 2018: £299.3 million), as set out in the consolidated cash flow statement on page 130. This metric has been included in the table above due to its size and strategic importance to the Group.
13. Shareholder contextThe table below shows the voting outcome on the resolutions for the 2017 Remuneration Policy and Remuneration Report at the AGM on 14 September 2018:
Votes for % Votes against % Votes withheld
2017 Remuneration Policy 184,022,847 52.64 165,540,770 47.36 –
2018 Remuneration Report 212,767,205 61.30 134,333,367 38.70 2,015,282
The Board was disappointed with these voting outcomes and, as set out in the Remuneration Committee Chairman’s Letter, has completed an extensive programme of shareholder consultation, as well as having made disclosure improvements, with the objective of improving the positive vote to greater than 80% at the 2019 Annual General Meeting.
eOne Annual Report and Accounts 2019104

14. Implementation for financial year ending 31 March 2020As detailed earlier in the Directors’ Remuneration Report, the Committee is proposing to make a number of changes to the implementation of the Remuneration Policy for the financial year ending 31 March 2020. Details of these are provided on page 94, however, for ease of reference a summary is also provided below.
Executive DirectorsBase salary
from 1 April 2018 (per annum)
from 1 April 2019 (per annum) Change
D Throop US$1,225,000 US$1,261,750 +3%/+US$36,750J Sparacio US$550,000 US$575,000 +4.5%/+US$25,000
The salary increase for the CEO is in line with the average increase across the wider workforce and is an adjustment to his contractual entitlement of 7%. The increase for the CFO reflects the contractual terms agreed prior to his appointment to the Board.
Pension and benefitsCEO: Pension contributions will be in line with the current RRSP provision, being the maximum permitted for the year (the maximum RRSP contribution permitted for 2019 was C$26,500), in line with other eOne Canadian employees.
CFO: Pension contributions will be in line with the current standard 401k pension contributions, being the maximum permitted for the year (the maximum 401k contribution permitted for 2019 was US$19,000), in line with other eOne US employees.
Benefits will continue to be provided in line with the Remuneration Policy.
Annual bonusAnnual bonus for the CFO will be maintained at 60% of salary.
The annual bonus for the CEO will be 200% of salary. 150% will continue to be linked to adjusted Group PBT, with stretch targets being set for the target payout of 75% of salary. The incremental 50% of bonus will be driven by performance against metrics linked to the delivery of the Company’s recently announced strategy and the integration of the recent acquisitions. Each year they will be set around key lead indicators for the long-term creation of sustainable shareholder value. The metric for FY20 will be operating margin as the maintenance of our margins as we seek growth in a more challenging market will be a key area of focus throughout the business. Targets will be disclosed in full in the Annual Report on Remuneration for FY20.
Long-term incentiveFollowing an in-depth review of the current measures and structure of the LTIP, new performance measures will apply to the LTIP for the CEO. As part of this review, the CEO’s LTIP grant will be increased to 300% of salary.
These measures reflect the critical long-term KPIs for the business, of Group underlying EBITDA (targeted on a compound annual growth rate over the three-year period) and return on capital employed (targeted on the average return over the three-year period) and the targets reflect genuine stretch in performance to support the incremental LTIP award:Vesting schedule (% of maximum)
Group underlying EBITDA (50%)
ROCE (50%)
100% 12% 14%75% 9% 12%25% 6% 10%
Performance will be assessed on a like-for-like basis taking into consideration, for example, material acquisitions (such as Audio Network Limited in FY20) and disposals, and the impact of significant accounting changes not included in the original targets (e.g. IFRS 16).
The terms of the current structure for the CFO are in place for this final year and whilst the Committee recognises the unusual nature of these, it is not in a position to renegotiate these terms. Accordingly, the arrangements will form part of the Policy review and new contractual terms considered during the coming year.
SR
G
FS
105entertainmentone.com
Additional governance features introduced for the financial year ending 31 March 2020
Shareholding policy Shareholding policy for the CEO to be increased to 500% of salary, being the combined value of the proposed variable pay opportunities for the financial year ending 31 March 2020.
Post-employment shareholding guidelines
Introduction of a post-employment shareholding policy with the next policy year. The level being discussed is 100% of their guideline (being 500% of salary for the CEO) for the first year post-cessation of employment, reducing to 50% of their guideline (being 250% of salary for the CEO) for the second year post-cessation of employment.
Service contracts Compensation for dismissal without cause reduced from 24 to 12 months’ pay for the CEO, except in certain change of control situations.
Non-executive directors’ fees
Current non-executive directors’ fees are shown in the table belowfrom 1 April 2019
(per annum)from 1 April 2018
(per annum)from 1 April 2017
(per annum)
Allan Leighton1 £220,000 £220,000 £240,000Michael Friisdahl2 C$90,000 C$90,000 C$90,000Scott Lawrence3 – – –Robert McFarlane2,4 C$107,000 C$98,500 C$90,000Mark Opzoomer1,5 £71,000 £106,000 £111,000Mitzi Reaugh1 £52,000 £52,000 £72,000Linda Robinson1 C$90,000 C$90,000 C$124,000
1. Received a fee in FY18 in relation to membership of the Special Committee.2. Appointed on 20 November 2017.3. Scott Lawrence is an employee of Canada Pension Plan Investment Board (CPPIB). The Company pays no fee to Scott Lawrence in connection with his
appointment. The Company pays CPPIB an annual fee equivalent to the annual fee paid by the Company to its other non-executive directors in consideration for CPPIB allowing Scott Lawrence to allocate time to his role as a non-executive director of the Company. The basic fee payable to CPPIB in respect of Scott Lawrence’s services for FY19 was C$90,000.
4. As Chairman of the Audit Committee, Robert McFarlane was paid C$8,500 during FY19 and will be paid an annualised amount of C$17,000 for FY20.5. For being the Senior Independent Director, Mark Opzoomer is paid £10,000 per annum. As Chairman of the Remuneration Committee, he is paid £9,000 per
annum. As Chairman of the Audit Committee, he was paid £5,000 during FY19. Mr Opzoomer was paid a fee of £30,000 during FY19 in consideration of the extensive shareholder engagement programme carried out during 2018 and 2019.
6. Non-executive directors are paid a per-meeting fee of £1,000/C$1,700 for attending Committee meetings, which is included in the single total remuneration table.
7. Canadian dollar amounts in the above table have been translated into pounds sterling amounts in the single total figure of remuneration table on page 97.
ANNUAL REPORT ON REMUNERATION CONTINUED
eOne Annual Report and Accounts 2019106

This section of the Remuneration Report sets out the Directors’ Remuneration Policy which was approved by shareholders by a binding vote at the 2017 Annual General Meeting and applies for the three financial years ending 31 March 2020.
The Company’s Remuneration Policy is designed to provide the executive directors a level of remuneration which enables eOne to attract and retain talented individuals who have the necessary skills and experience to support the continued development of the Company and motivate them to deliver the Company’s strategy. The Policy intends to incentivise management to provide long-term value growth for the Company’s shareholders whilst taking account of internal and external risks.
Remuneration packages have been designed based on the following key principles:
Principle Explanation
Reward package to attract and retain the best talent
To ensure that the Company is in a position to attract and retain the best executive directors the total remuneration package will target to pay at an upper quartile level, based on meeting relevant performance criteria.
Relevant comparator The principal external comparator group (which is used for reference group purposes only) comprises North American sector-specific companies, given the competitive environment for talent in the entertainment sector. Reference is also made to the constituents of the FTSE 250 Index (as the Company is a constituent member of the Index), UK sector-specific companies and other Canadian listed companies (against which the Company competes to attract and retain executive talent).
Reward assessed on a total compensation basis
The remuneration package provided to the executive directors is reviewed annually on a total compensation basis (i.e. single elements of the package are not reviewed in isolation). Packages are reviewed in the context of individual and Group performance, internal relativities, criticality of the individual to the business, experience, and the scarcity or otherwise of executives with the relevant skill set.
Pay for performance The Remuneration Committee consistently aims to set stretching targets, and ensure that maximum or near maximum pay-outs are only delivered for achievement against these.
Incentive target measures aligned with business strategy
When designing the incentive packages for executives the Board has considered performance measures and targets that support delivery of the Group’s strategic objectives.
Alignment with shareholder interests
The package is designed to align the interests of the executives with those of shareholders, with an appropriate proportion of total remuneration dependent upon sustained long-term performance.Share ownership is a key cornerstone of the Group’s reward policy and is designed to help maintain commitment over the long-term, and to ensure that the interests of the executive are aligned with those of shareholders.
DIRECTORS’ REMUNERATION POLICYSR
G
FS
107entertainmentone.com

DIRECTORS’ REMUNERATION POLICY CONTINUED
1. Remuneration policy table(i) Executive directors
The table below provides an overview of each element of the approved remuneration for the Chief Executive Officer (CEO) and the Chief Financial Officer (CFO). To the extent that additional executive directors are employed in the future by the Company, this policy will apply on a consistent basis.
Component
Description and link to Group strategy and objectives
Operation
Maximum opportunity
Framework used to assess performance
Base salary Core element of fixed remuneration that provides the basis to recruit and retain talent necessary to deliver the business strategy.Reflects individual experience, skill and scope of responsibility.Takes into account wider contribution to the Group.The Group competes for talent in North American and global markets and base salary levels are considered by the Remuneration Committee to ensure that the Group remains competitive.
Usually reviewed annually (but may be reviewed more frequently) with any changes generally effective from the start of each financial year. The review process considers a range of factors including, but not limited to:
– role, experience and performance
– changes in remuneration for other executives and for the broader workforce
– increases in size and complexity of the Group
– market and competitive factors, including external benchmark data against companies of similar size and complexity.
Consistent with the previous policy, no maximum base salary increase has been set under the current Remuneration Policy.To the extent base salary increases are awarded, these are considered on a case-by-case basis and will generally be based on the factors set out.
N/A
Annual bonus To motivate and reward superior performance measured against annual financial targets of the Group.
Usually a cash payment.Awards approved by the Remuneration Committee after the year end, based on performance against annual targets set at the start of the financial year.Subject to a clawback provision which extends for a period of 12 months following payment of the bonus.
Up to 150% of base salary at maximum in normal circumstances, with target and threshold pay-out levels at 75% and 30% of base salary, respectively.Up to 200% of base salary at maximum in exceptional circumstances subject to approval by the Remuneration Committee and where the rationale for such an award is clearly articulated.
The Remuneration Committee will determine annual bonus performance measures, weighting, leverage and targets based on the specific business circumstances that are extant at the time of a bonus award being agreed for an executive director.A minimum of 50% of the total award will be based on key financial measures and will generally be referenced to the annual budget approved by the Board.Performance measures may include (but are not limited to):
– Group adjusted profit before tax – Group underlying EBITDA
Further details of the measures and weightings used this year are set out in the Annual Report on Remuneration.
eOne Annual Report and Accounts 2019108

Component
Description and link to Group strategy and objectives
Operation
Maximum opportunity
Framework used to assess performance
Long Term Incentive Plan (LTIP)
To reinforce the alignment of the interests of executives and shareholders.To motivate long-term shareholder value creation and the delivery of exceptional share price growth.To help the Group retain its key executive director talent.
LTIP awards are made annually to the executive directors.They are usually an award of shares granted as nil-cost options (but may be settled in another form, e.g. cash) and are generally subject to performance conditions to be met over a three-year performance period.As needed, the Remuneration Committee may make one-off awards of shares under the LTIP (or outside the LTIP) for retention/incentive purposes (including but not limited to the renewal of an executive director’s service contract). Such awards would be subject to shareholder approval where appropriate.The LTIP is subject to clawback and malus provisions which extend for a period of 12 months following the vesting of the LTIP.
Maximum potential annual grant of 200% of base salary in a financial year.In exceptional circumstances, the Remuneration Committee may exercise discretion and grant awards of up to 300%.Rationale and circumstances surrounding such special awards shall be clearly explained by the Remuneration Committee upon grant.
LTIP awards will normally vest, subject to continued employment with a Group company and any applicable performance and other conditions, on the later of the third anniversary of the date of award and the date on which the Remuneration Committee determines that the performance and other conditions have been satisfied (in whole or in part).The Remuneration Committee will determine annual LTIP performance measures, weighting, leverage and targets based on the specific business circumstances that are extant at the time of a LTIP award being agreed for an executive director, which may include (but are not limited to) the following measures:
– Adjusted fully diluted EPS growth – Total shareholder return (TSR) – Average ROCE – Share price performance – Group underlying EBITDA
The Committee retains the discretion to adopt other performance measures based on the specific circumstances at the time of the grant.When more than one performance measure is used, performance and pay-out are determined independently for each measure.For threshold performance, 30% of the award will vest. For target performance, 75% of the award will vest, and for maximum or above performance, 100% of the award will vest. Vesting will operate on a straight-line basis between threshold, target and maximum.The Committee retains the right to discretionarily adjust the final pay-out, in exceptional circumstances, based on an assessment of overall circumstances critical to business performance but otherwise not captured in the performance measure selected at grant. Any adjustment applied will be clearly explained by the Committee at vesting.
Pension contributions
Part of a competitive package to help the Group retain its key executive talent.Provide a market competitive level of retirement benefit.
The Company may make payments into a pension scheme for the benefit of the executive director (by reference to pensionable pay) and/or pay a salary supplement in lieu of a pension contribution.Where agreed pension contributions for an individual exceed relevant limits for a tax free pension accrual, executive directors have the option to receive excess contributions as a salary supplement (which may be subject to tax and national insurance or equivalent contributions).Bonus and other benefits received by executive directors are excluded from pensionable pay.
Overall maximum contribution will be determined by the Remuneration Committee by reference to the markets in which an executive director is appointed and would be aligned with the relevant regulatory limits and/or prevailing market practice.
N/A
SR
G
FS
109entertainmentone.com

DIRECTORS’ REMUNERATION POLICY CONTINUED
Component
Description and link to Group strategy and objectives
Operation
Maximum opportunity
Framework used to assess performance
Benefits Part of a competitive package to help the Group retain its key executive talent.
Base salary is supplemented with a range of benefits based on the role and individual circumstances.These benefits include, but are not limited to, car allowance, payments in lieu of pension, life and disability assurance and healthcare arrangements.Other benefits may be provided based on individual circumstances, such as, but not limited to, housing or relocation allowances, travel allowances or other expatriate benefits.Benefits are reviewed by the Remuneration Committee in the context of market practice from time-to-time.Executive directors are also eligible to participate in all employee share plans (e.g. Sharesave) operated by the Company on the same basis as the other employees.
While the Remuneration Committee has not set a formal maximum on the level of benefits executive directors may receive, the value of benefits is set to a level which the Committee considers to be appropriately positioned, taking into account relevant market levels based on the nature and location of the role and individual circumstances.Participation in all employee share plans is subject to statutory limits.
N/A
Shareholding policy
Share ownership is a key cornerstone of the Group’s reward policy and is designed to help maintain commitment over the long-term, and to ensure that the interests of the executive are aligned with those of shareholders.
Executives are expected to build and maintain a significant shareholding in eOne shares, with expected holdings valued at:
– CEO: 3 times base salary – CFO: 2 times base salary
New executive directors are expected to reach such targets over a period of five years.
N/A N/A
(ii) Non-executive Chairman and non-executive directors
The table below sets out the approved Remuneration Policy for the non-executive Chairman and non-executive directors.
Element Approach of the Company
Non-executive Chairman fees
The remuneration of the Chairman is set by the executive directors. Fees are set at a level which reflects the skills, knowledge and experience of the individual, whilst taking into account appropriate market data. The fee is set as a fixed annual fee (with additional fees payable for membership of a committee or other additional responsibilities where appropriate) and may be paid wholly or partly in cash or Company shares. Fees are ratified by the Board.
Non-executive director fees
The executive directors are responsible for deciding non-executive directors’ fees. Fees are set taking into account several factors including the size and complexity of the business, fees paid to non-executive directors of UK-listed companies of a similar size and complexity and the expected time commitment and contribution for the role. Fees are structured as a basic fee with additional fees payable for chairing or membership of a committee or other additional responsibilities where appropriate. The fee is set as a fixed annual fee and may be paid wholly or partly in cash or Company shares. Fees are ratified by the Board.
In setting the Remuneration Policy, the Group reserves the right to make any remuneration payments and payments for loss of office (including exercising any discretions available to it in connection with such payments) notwithstanding that they are not in line with the Policy set out above where the terms of the payment were agreed (i) before the Policy came into effect or (ii) at a time when the relevant individual was not a director of the Group and, in the opinion of the Group, the payment was not in consideration for the individual becoming a director of the Group. For these purposes “payments” includes the Group satisfying awards of variable remuneration and, in relation to an award over shares, the terms of the payment are agreed at the time the award is granted.
The Group may make minor amendments to the Policy set out above (for regulatory, exchange control, tax or administrative purposes or to take account of a change in legislation) without obtaining shareholder approval for that amendment.
In exceptional circumstances, the Group may make share awards to non-executive directors to facilitate the recruitment or retention of individuals that are judged to be important in delivering the Group’s strategic goals, the awards being subject to shareholder approval where appropriate.
eOne Annual Report and Accounts 2019110

2. Explanation of chosen performance measures and how targets are setAnnual bonus
The annual bonus is assessed against the Group’s adjusted profit before tax or Group underlying EBITDA targets determined by the Remuneration Committee, based on the annual financial plan approved by the Board. This motivates and rewards performance with increasing profit before tax and Group underlying EBITDA achievement, and is linked to delivery of our strategic goals which are aligned closely to those of shareholders.
LTIP
Performance conditions Reason for selecting measure
Adjusted fully diluted EPS growth
Adjusted fully diluted EPS growth is considered to be an appropriate long-term measure as it reflects the recognised measure of shareholder earnings. Typical adjustments to reported EPS would be the add-back of amortisation of acquired intangibles, and would be consistent with the treatment adopted by the Company since listing in 2007, and in line with the approach taken by equity analysts and other relevant comparator groups.
TSR growth TSR growth (share price growth plus dividends) is a commonly used metric for measuring the relative performance of companies. This approach will directly link the reward of executives to that of the absolute return for the shareholder, including the setting of a minimum threshold, and allows the Company to be viewed on a relative basis by comparing the performance of the Company to an appropriate comparator index (for example the FTSE 250).
Average ROCE Average ROCE growth provides a measure that ensures the executives are seeking to deliver improved returns from the investment decisions being made each year. It therefore complements the adjusted fully diluted EPS measure (which is income statement focused) as it ensures that the executives are also managing the efficiency of the assets on the balance sheet which are used to generate the earnings of the Company. ROCE is a commonly used metric to measure return on investment and can be easily derived from the audited consolidated financial statements each year.
Share price performance Awards made under a share price performance condition will be made when the Remuneration Committee deems that such a measure best aligns the interests of the award holder to those of shareholders.
Group underlying EBITDA Group underlying EBITDA is the key profitability measure in the consolidated income statement that the Group targets as a performance measure and is disclosed in the audited consolidated financial statements each year. It is the measure that is utilised most widely to measure the performance of members of senior management.
The Remuneration Committee carefully considers the target ranges to be attached to bonus and long-term incentive awards, taking into account a number of factors which could include future growth expectations, the market environment and the requirement to set stretching but achievable targets.
The Committee retains the ability to adjust or set different performance measures if events occur (such as a change in strategy, a material acquisition and/or a divestment of a Group business or a change in prevailing market conditions) which cause the Committee to determine that the measures are no longer appropriate and that an adjustment is required so that they achieve their original purpose.
Awards under the LTIP may be adjusted in the event of a variation of capital in accordance with the scheme rules.
3. Pay policy for other employeesThe Remuneration Policy for senior management is similar to the Policy for the executive directors in that salary and benefit packages are linked to performance. Key management participates in the Group’s LTIP with performance measures focused on Group profitability targets and share price growth to ensure alignment of individual performance with Group performance and shareholder metrics. The key principles of the remuneration philosophy are applied consistently across the Group below this level, taking account of seniority and local market practice. The Remuneration Policy for all employees is designed to provide a level of remuneration which enables eOne to attract and retain talented individuals who have the necessary skills and experience to support the continued development of the Group.
SR
G
FS
111entertainmentone.com

DIRECTORS’ REMUNERATION POLICY CONTINUED
4. Remuneration policy for new appointmentsIn the case of recruiting/appointing a new executive director, the Remuneration Committee will typically align the remuneration package with the above Remuneration Policy (and will therefore generally consider base salary, pension, benefits, annual bonus and LTIP awards). However, the Remuneration Committee retains the discretion to make payments or awards which are outside the Policy to facilitate the recruitment of candidates of the appropriate calibre required to implement the Group’s strategy, subject to the principles and limits set out below. The individual would be expected to move, over time, onto a remuneration package that is consistent with the Policy set out in the table on the previous page.
In determining appropriate remuneration, the Remuneration Committee will take into consideration all relevant factors (including the quantum and nature of remuneration) to ensure that arrangements are in the best interests of both eOne and its shareholders. This may, for example, include (but is not limited to) the following circumstances:
• an interim appointment is made to fill an executive director role on a short-term basis• exceptional circumstances require that the non-executive Chairman or a non-executive director takes on an executive function on
a short-term basis• an executive director is recruited at a time in the year when it would be inappropriate to provide a bonus or long-term incentive
award for that year as there would not be sufficient time to assess performance (subject to the limit on variable remuneration set out below, the quantum in respect of the months employed during the year may be transferred to the subsequent year so that reward is provided on a fair and appropriate basis)
• the executive director received benefits at his/her previous employer which the Committee considers it appropriate to offer• buy-out of previous employer benefits
The Committee may also alter the performance measures, performance period and vesting period of the annual bonus or LTIP (subject to the rules of the scheme) if the Committee determines that the circumstances of the recruitment merit such alteration in these situations. If such circumstances were to arise, the rationale would be clearly explained.
The Remuneration Committee may make an award in respect of recruitment to buy out remuneration arrangements forfeited on leaving a previous employer. In doing so the Remuneration Committee will take account of relevant factors regarding the forfeited arrangements which may include any performance conditions attached to awards forfeited (and the likelihood of meeting those conditions), the time over which they would have vested and the form of the awards (e.g. cash or shares). The Committee will generally seek to structure buy-out awards on a comparable basis to remuneration arrangements forfeited.
These payments or awards are excluded from the maximum level of variable remuneration referred to below; however, the Remuneration Committee’s intention is that the value awarded would be no higher than the expected value of the forfeited arrangements. Where considered appropriate, buy-out awards will be subject to forfeiture or clawback on early departure.
Where necessary, the Company will pay appropriate benefits in line with those provided to other executive directors. Relocation costs and expatriate benefits may be paid on a case-by-case basis. The Remuneration Committee will seek to ensure that no more is paid than is reasonable and required.
The maximum level of variable remuneration (excluding buy-out awards) which may be awarded to a new executive director is 400% of base salary, comprising:
• annual bonus 200% (in exceptional circumstances only, a typical award would be up to 150%)• LTIP award 200% (in exceptional circumstances only, a typical award would be up to 150%).
Subject to this overall maximum variable remuneration, incentive awards may be granted within the first 12 months of appointment above the normal maximum annual award opportunities. The Remuneration Committee will ensure that such awards are linked to the achievement of appropriate and challenging performance measures and will be forfeited if performance or continued employment conditions are not met.
Any share awards referred to in this section will be granted as far as possible under the Company’s existing share plans. If necessary, and subject to the limits referred to above, in order to facilitate the awards mentioned above, the Committee may rely on exemption 9.4.2 of the Listing Rules which allows for the grant of awards to facilitate the recruitment of a director, in certain circumstances.
Where a vacant position is filled internally, any ongoing remuneration obligations or outstanding variable pay elements shall be allowed to continue according to the original terms.
Contractual rights in the event of the termination of a new appointment will be determined based on market practice in the location where the new appointment is expected to be based and will not exceed an effective notice period of more than 12 months except in exceptional circumstances and where a clear rationale is provided by the Remuneration Committee.
Fees payable to a newly appointed non-executive Chairman or non-executive director will be in line with the fee policy in place at the time of appointment, subject to any deviation in policy permitted under Listing Rule 9.4.2.
eOne Annual Report and Accounts 2019112

5. Payments for loss of office
Obligation Policy
Base salary, pension and benefits
Based on service contracts.
Annual bonus The Remuneration Committee has the discretion to determine appropriate bonus amounts taking into consideration the circumstances in which an executive director leaves. Typically for “good leavers”, bonus amounts (as estimated by the Remuneration Committee) will be pro-rated for time in service to termination and will be, subject to performance, paid at the usual time. “Good leavers” typically include leavers due to death, illness, injury, disability, redundancy, retirement with the consent of the Group or any other reason as determined by the Remuneration Committee. “Bad leavers” will not receive any annual bonus payments.The bonus will be subject to a clawback provision which extends for a period of 12 months following payment of the bonus. This will entitle the Company, on the recommendation of the Board, to clawback up to 100% of the bonus payment where there is evidence of personal misconduct on behalf of the executive director which results in a misstatement of the Group’s financial results which subsequently materially reduces the Company’s share price or results in significant reputational damage to the Group.
LTIP Options awarded under the LTIP will normally lapse immediately upon an executive director ceasing to be employed by or to hold office with a Group company. However, if an executive director is deemed by the Remuneration Committee to be a “good leaver” and has completed at least 12 months’ service from the date of grant, the LTIP award will vest on the date when it would have vested if he had not so ceased to be an employee or director of a Group company, subject to: (i) the satisfaction of any applicable performance conditions measured over the original performance period, (ii) the satisfaction of any other relevant conditions, (iii) the operation of any malus or clawback provisions; and (iv) pro-rating to reflect the reduced period of time between grant and the executive director’s cessation of employment as a proportion of the normal vesting period. “Good leavers” typically include leavers due to death, illness, injury, disability, redundancy, retirement with the consent of the Group or any other reason as determined by the Remuneration Committee.If an executive director ceases to be an employee or director of a Group company for a “good leaver” reason having completed at least 12 months’ service from the date of grant, the Remuneration Committee may decide that his LTIP award will vest early when he leaves, subject to an assessment of performance against the relevant conditions for that shortened period.To the extent that LTIP awards vest in accordance with the above provisions, they may be exercised for a period of six months following vesting and will otherwise lapse at the end of that period. To the extent that a participant who leaves for a “good leaver” reason held vested options, they may be exercised for a period of six months following the date of cessation and will otherwise lapse at the end of that period.LTIP awards will be subject to the operation of malus or clawback provisions. The Remuneration Committee will have the ability to clawback up to 50% of vested LTIP awards within 12 months of the vesting date where there is evidence of personal misconduct on behalf of the executive director which results in a misstatement of the Group’s financial results which subsequently materially reduces the Company’s share price or results in significant reputational damage to the Group. The malus/clawback may be satisfied by way of the vesting of any existing share options/awards, or the number of shares under any vested but unexercised option. In addition, the employee (or former employee) may be required to make a cash payment to the Company.Should an event as set out above occur during the vesting period of an LTIP award, the Remuneration Committee shall have the discretion to reduce the proportion of the award that vests by up to 100% regardless of the extent to which the performance conditions attaching to the award are met.
It is the Company’s policy to set notice periods for executive and non-executive directors to be in line with the recommendations of the UK Corporate Governance Code. In exceptional circumstances, where notice periods of more than a year are required, these are considered by the Board on a case-by-case basis.
Under the terms of their engagement, the notice period to be given by the non-executive directors to the Company is not more than six months and the Company is obliged to give notice of not more than six months, as set out above.
Discretion is retained to terminate with or without due notice or paying any payment in lieu of notice dependent on what is considered to be in the best interests of the Company in the particular circumstances. The Committee reserves the right to make additional exit payments where such payments are made in good faith in discharge of an existing legal obligation (or by way of damages for breach of such an obligation) or by way of settlement or compromise of any claim arising in connection with the termination of a director’s office or employment.
SR
G
FS
113entertainmentone.com

DIRECTORS’ REMUNERATION POLICY CONTINUED
6. Illustration of application of the Remuneration PolicyThe graph below seeks to demonstrate how pay varies with performance for the executive directors based on the current implementation of our stated Remuneration Policy.
Element Description
Fixed Total amount of base salary, pension and benefits.
Annual variable Remuneration where performance measures or targets relate to one financial year (i.e. annual bonus payments). Maximum annual bonus opportunity is 150% of base salary for the CEO and 60% for the CFO.
Long-term variable Remuneration where performance measures or targets relate to more than one financial year (i.e. LTIP payments). LTIP opportunity is up to 200% of base salary for executive directors (excluding signing awards).
Chief Executive Officer (£000) Chief Financial Officer (£000)
0
1000
2000
3000
4000
5000
6000
98
1
3,8
65
5,3
07
100
%
25
%5
6%
19%
18%
27
%5
4%
Minimum On-target Maximum
Long-term variable
Annual variable
Fixed
Long-term variable
Annual variable
Fixed
0
200
400
600
800
1000
1200
1400
1600
44
0
1,3
16
1,5
79
100
%
33
%5
0%
17%
28
%17
%5
5%
Long-term variable
Annual variable
Fixed
Minimum On-target Maximum
eOne Annual Report and Accounts 2019114

Assumptions used in determining the level of pay-out under the given scenarios are as follows:
Scenario Description
Minimum performance Fixed elements of remuneration only – comprising base salary, benefits and pension.
On-target performance Total fixed pay as above, plus:CEO:
– Assumes 50% of maximum pay-out under the annual bonus scheme (i.e. 75% of base salary) based on the Group achieving budgeted adjusted profit before tax
– Assumes 75% of maximum pay-out under the LTIPCFO:
– Assumes on-target pay-out under the annual bonus scheme (i.e. 50% of base salary) based on the Group achieving budgeted adjusted profit before tax
– Assumes 75% of maximum pay-out under the LTIP
Maximum performance Total fixed pay as above, plus:CEO:
– Assumes 100% of maximum pay-out under the annual bonus scheme (i.e. 150% of base salary) based on the Group achieving 110% or more of budgeted adjusted profit before tax
– Assumes 100% of maximum pay-out under the LTIP based on the Group achieving the maximum performance for each performance condition
CFO:
– Assumes 100% of maximum pay-out under the annual bonus scheme (i.e. 60% of base salary) based on the Group achieving 110% or more of budgeted adjusted profit before tax
– Assumes 100% of maximum pay-out under the LTIP based on the Group achieving the maximum performance for each performance condition
As required by the regulations, the scenarios do not include any share price growth assumptions or take into account any dividends that may be paid. The special share award to the CEO has been excluded from the above calculations as it was one-off in nature.
Base salary is the latest known salary (i.e. the salary effective from 1 April 2018) and the value for pension and benefits has been assumed to be equivalent to that included in the single total figure of remuneration on page 97.
7. Wider workforce remunerationWhen determining the remuneration arrangements for executive directors, the Remuneration Committee takes into consideration, as a matter of course, the pay and conditions of employees throughout the Group. In particular, the Remuneration Committee is kept informed of:
• salary increase for the general employee population• overall spend on annual bonus• participation levels in the annual bonus and share plans.
Although no consultation with employees takes place in relation to determining the Remuneration Policy for executive directors, the Group has various ways of engaging employees collectively, as teams and one-to-one.
8. Consideration of shareholder viewsThe Company engages in regular dialogue with key shareholders to discuss and seek feedback on its Remuneration Policy and governance matters and, in particular, the Company discusses any significant changes to policy or measures used to assess performance.
During the year, key shareholders were consulted in relation to proposed updates to the executive director Remuneration Policy. As noted elsewhere in the Annual Report, the Company will continue to actively engage with and seek to incorporate the views of its shareholders in any major changes to executive director Remuneration Policy.
SR
G
FS
115entertainmentone.com

REMUNERATION COMMITTEE
Remuneration Committee terms of reference and evaluationThe Remuneration Committee is responsible for overseeing the policy regarding executive remuneration and approving the remuneration packages for the Group’s executive directors and senior managers over agreed thresholds, and its terms of reference include:
• the framework or broad policy regarding executive remuneration and individual remuneration and incentive packages• participation in any discretionary employee share schemes operated by the Group• targets for any performance-related payments• participation in any discretionary incentive schemes and bonus arrangements operated by the Group• the policy for and scope of any pension arrangements• the policy for and scope of any termination payments and the severance terms• the provision of benefits
The Remuneration Committee is responsible for recommending and monitoring the level and structure of senior management remuneration and also determines the issue and terms of all share schemes operated by the Group for the benefit of certain Group employees. In addition, the Remuneration Committee will review a succession plan prepared by the Group that sets out details in relation to succession planning for senior management, as well as to consider an appropriate remuneration framework to fit with the succession plan.
The executive directors determine the remuneration of the non-executive directors with the support of external professional advice, if required, and ratification by the Board. No director participates in any discussion regarding his or her own remuneration.
The Committee keeps its terms of reference under review and makes recommendations for changes to the Board. The full terms of reference are available on the Company’s website. A externally facilitated evaluation of the Committee’s performance during the financial year was undertaken as set out on page 72.
Diversity
We are committed to equality and diversity in our workforce and recognise the benefits to the Company of employing people with a wide mix of ethnic and cultural backgrounds, and a balance between genders. The Company has a written policy that prohibits unequal treatment based on a prohibited ground under applicable human rights legislation, including race, ancestry, place of origin, colour, ethnic origin, citizenship, record of offences, creed, sex, sexual orientation, gender identity, gender expression, age, marital status, family status and disability which applies across the Group.
When considering the recruitment of new employees, the Company is an equal-opportunity employer and operates under a written hiring policy. In respect of existing employees, the Company has a formal appraisal process that is implemented across the Group to ensure that we are making employment-related decisions informed on performance-based, rather than other, factors.
Whilst the Company has a good balance of male and female employees overall, we are implementing a number of initiatives aimed at improving the gender balance at senior levels, including the strengthening of maternity and paternity benefits across the Group.
The Company continues to operate an all-employee Sharesave Scheme, approved by shareholders at the 2015 Annual General Meeting, which gives individual team members a direct alignment with the Company’s shareholders in driving performance of the Group. Around a third of our employees are now enrolled in Sharesave and the Company expects a continued interest from employees in the 2019 Scheme, which is expected to be launched in summer 2019.
Committee membershipAs at 31 March 2019, the Remuneration Committee comprised Mark Opzoomer (Chairman) with Michael Friisdahl, Mitzi Reaugh and Linda Robinson as the other independent non-executive members.
The Chairman (Allan Leighton), the CEO (Darren Throop), the CFO (Joe Sparacio) and the Group’s General Counsel (Mark Trachuk) are invited to attend Remuneration Committee meetings but do not participate in decisions.
These attendees were present when the Remuneration Committee considered matters relating to the executive directors’ remuneration for the year ended 31 March 2019, but decisions in this respect were made in private meetings of the Committee.
For more information see pages 60 and 61.
eOne Annual Report and Accounts 2019116

MeetingsThe Committee met five times during the year. Committee member attendance at Committee meetings is shown on page 73.
The Committee’s activities for the year ended 31 March 2019 have included:
Date of meeting Agenda
May 2018 – Approval of executive director bonuses for the year ended 31 March 2018 – Approval of executive director bonus targets for the year ended 31 March 2019 – Year end matters including LTIP vesting – Succession planning – Terms of reference and Committee self-evaluation
August 2018 – Shareholder engagement programme – Senior management approvals
September 2018 – Shareholder engagement programme – HR projects – Annual incentive plan proposals
November 2018 – Shareholder engagement programme – Senior management approvals – HR projects – CEO remuneration
March 2019 – Shareholder engagement programme – Senior management approvals – HR projects – CEO remuneration
The Remuneration Committee adopts the principles of good governance as set out in the UK Corporate Governance Code and complies with the Listing Rules of the Financial Conduct Authority, and Schedule 8 of The Large and Medium-sized Companies and Groups (Accounts and Reports) Regulations 2008 (as amended in 2013) on a voluntary basis.
Advisers to the Remuneration CommitteeDuring 2019, advice on the competitiveness and appropriateness of compensation programmes for the Company’s Chief Executive Officer was provided by Willis Towers Watson. The Company is satisfied that the advice received was independent.
During the current year, Deloitte LLP have provided general market updates to the Committee and advised on UK market practices. Deloitte LLP is a founding member of the Remuneration Consulting Group in the UK. The Company is satisfied that the advice received was independent.
SR
G
FS
117entertainmentone.com

DIRECTORS’ REPORT: ADDITIONAL INFORMATION
The directors present their report and audited consolidated financial statements for the year ended 31 March 2019.
Principal activitiesEntertainment One Ltd. is a leading independent entertainment group focused on the acquisition, production and distribution of family, television, film and music content rights across all media throughout the world.
Strategic ReportThe Strategic Report on pages 2 to 65 sets out a comprehensive review of the development and performance of the business for the year ended 31 March 2019.
Results and dividendsDuring the year the Group made a profit after tax of £15.3 million (2018 restated: £68.8 million). The Company did not pay an interim dividend during the year ended 31 March 2019; however, the directors have declared the payment of a final dividend in respect of 2019 of 1.5 pence per share (2018: 1.4 pence per share).
Risk management and internal controlsDisclosures can be found in Note 28 to the consolidated financial statements and in the risk management section on pages 51 to 54.
Capital structureThe Company has one class of shares. These common shares carry the right to one vote at general meetings of the Company. They have no par value and the authorised number of common shares is unlimited. There are no specific restrictions on the size of a holding nor on the transfer of shares, which are both governed by the general provisions of the Articles of the Company and prevailing legislation. Further information regarding the capital structure, together with details of new share issues during the year, are shown in Note 32 to the consolidated financial statements.
DirectorsDetails for all present directors are listed, together with their biographical details, on pages 68 and 69. The Company has agreed to indemnify the directors as permitted by law against liabilities they may incur in the execution of their duties as directors of the Company. The Company may, by ordinary resolution, appoint or remove a director to the Board. The responsibilities of the directors are detailed in the Corporate governance section on pages 66 to 77.
Directors’ interestsThe beneficial interests of the directors and their families in the shares of the Company are shown below. Options granted under the Company’s employee share plans are shown in the Remuneration Report on pages 90 to 116.
Number of common shares at 31 March 2019
Robert McFarlane 26,724Mark Opzoomer 25,000Mitzi Reaugh 7,000Joseph Sparacio 40,000Darren Throop 7,170,141
eOne Annual Report and Accounts 2019118

Substantial shareholdingsAt 31 March 2019 the Company was aware of the following holdings representing 3% or more in its issued common shares:
31 March 2019Number of common
shares heldPercentage of voting rights
and issued shares
Canada Pension Plan Investment Board 85,597,069 18.4Capital Research and Management 46,843,952 10.5M&G Investment Management Ltd 20,029,803 4.3Kames Capital 18,989,774 4.1Standard Life Aberdeen 17,875,445 3.9Mackenzie Financial Corporation 17,793,329 3.8Blackrock Inc 14,592,948 3.1
Corporate responsibilityThe Group has an open, honest and responsible approach towards its stakeholders which include employees, suppliers, customers, investors and the wider community. Ethical and responsible practices and a commitment to minimise our impact on the environment are key motivators behind the Group’s corporate responsibility framework. Further details of the Group’s approach to such matters are set out in the Corporate responsibility section on pages 58 to 65.
Disabled employeesApplications for employment by disabled persons are always fully considered, bearing in mind the aptitudes of the applicant concerned. In the event of employees becoming disabled, every effort is made to ensure that their employment with the Group continues and that appropriate training is arranged. It is the policy of the Group that the training, career development and promotion of disabled persons should, as far as possible, be identical to that of other employees.
Going concernThe directors continue to adopt the going concern basis in preparing the Annual Report and Accounts. Further details are set out in Note 1 to the consolidated financial statements.
Disclosure of information to AuditorThe following applies to each of those persons who were directors at the time this report was approved:
• so far as the director is aware, there is no relevant audit information of which the Company’s auditor is unaware; and• he/she has taken all the steps that he/she ought to have taken as a director in order to make himself/herself aware of any relevant
audit information and to establish that the Company’s auditor is aware of that information.
During the year, PricewaterhouseCoopers LLP served as the Company’s external auditor. A resolution to re-appoint PricewaterhouseCoopers LLP as the Company’s external auditor for the year ended 31 March 2020 will be included in the Company’s AGM Circular.
Annual General MeetingThe Annual General Meeting of the Company will be held on 30 September 2019.
By order of the Board
Joseph Sparacio
Director 20 May 2019
SR
G
FS
119entertainmentone.com

STATEMENT OF DIRECTORS’ RESPONSIBILITIES
The directors are responsible for preparing the Annual Report and Accounts in accordance with applicable law and regulations.
The directors are required to prepare the consolidated financial statements in accordance with International Financial Reporting Standards (IFRSs) as adopted by the European Union and Article 4 of the IAS Regulation. The directors must not approve the accounts unless they are satisfied that they give a true and fair view of the state of affairs of the Group and of the profit or loss of the Group for that period. In preparing these consolidated financial statements, International Accounting Standard 1 requires that directors:
• select suitable accounting policies and then apply them consistently;• state whether applicable IFRSs as adopted by the European Union have been followed, subject to any material departures
disclosed and explained in the financial statements;• make judgements and accounting estimates that are reasonable and prudent; and• prepare the consolidated financial statements on the going concern basis unless it is inappropriate to presume that the Group will
continue in business.
The directors are responsible for keeping adequate accounting records that are sufficient to show and explain the Group’s transactions and disclose with reasonable accuracy at any time the financial position of the Group. They are also responsible for safeguarding the assets of the Group and hence for taking reasonable steps for the prevention and detection of fraud and other irregularities.
The directors are responsible for the maintenance and integrity of the corporate and financial information included on the Company’s website. Legislation in the United Kingdom governing the preparation and dissemination of financial information differs from legislation in other jurisdictions.
Responsibility statementWe confirm that to the best of our knowledge:
• the consolidated financial statements, prepared in accordance with IFRSs as adopted by the European Union, give a true and fair view of the assets, liabilities, financial position and profit of the Group as a whole;
• the Strategic Report includes a fair review of the development and performance of the business and the position of the Group, together with a description of the principal risks and uncertainties that it faces; and
• the Annual Report and Accounts and the consolidated financial statements, taken as a whole, are fair, balanced and understandable and provide the information necessary for shareholders to assess the Group’s performance, business model and strategy.
By order of the Board
Joseph Sparacio
Director 20 May 2019
eOne Annual Report and Accounts 2019120

CONSOLIDATED FINANCIAL STATEMENTSIndependent auditor’s report to the members of Entertainment One Ltd............................... 122Consolidated income statement ........................................................................................................... 127Consolidated statement of comprehensive income ...................................................................... 127Consolidated balance sheet .................................................................................................................. 128Consolidated statement of changes in equity .................................................................................. 129Consolidated cash flow statement ....................................................................................................... 130
NOTES TO THE CONSOLIDATED FINANCIAL STATEMENTS1. Nature of operations and basis of preparation .................................................................... 131
Annual results2. Operating segments ..................................................................................................................... 1373. Revenue from contracts with customers ............................................................................... 1394. Operating profit .............................................................................................................................. 1415. Key management compensation and directors’ emoluments ........................................ 1426. Staff costs ......................................................................................................................................... 1427. One-off items .................................................................................................................................. 1438. Finance income and finance costs .......................................................................................... 1449. Tax ...................................................................................................................................................... 14610. Deferred tax assets and liabilities ............................................................................................ 14711. Dividends ......................................................................................................................................... 14912. Earnings per share ........................................................................................................................ 149
Assets and liabilities relating to operating items13. Goodwill ............................................................................................................................................ 15114. Other intangible assets ................................................................................................................ 15415. Investment in productions .......................................................................................................... 15516. Property, plant and equipment .................................................................................................. 15617. Inventories ....................................................................................................................................... 15718. Investment in acquired content rights .................................................................................... 15719. Trade and other receivables ...................................................................................................... 15820. Cash and cash equivalents ........................................................................................................ 16021. Trade and other payables ........................................................................................................... 16022. Provisions ......................................................................................................................................... 162
Assets and liabilities relating to capital items23. Interest-bearing loans and borrowings .................................................................................. 16324. Production financing ..................................................................................................................... 16525. Financial instruments .................................................................................................................... 16626. Fair Value Measurement ............................................................................................................. 16827. Business combinations and transactions with equity holders ........................................ 16928. Financial risk management......................................................................................................... 17129. Subsidiaries ..................................................................................................................................... 17430. Interests in joint ventures ............................................................................................................ 17431. Interests in partly-owned subsidiaries .................................................................................... 17532. Stated capital, own shares and other reserves ................................................................... 17733. Share-based payments ................................................................................................................ 178
Other notes34. Commitments and contingencies ............................................................................................ 18035. Related party transactions .......................................................................................................... 18136. Post balance sheet events ......................................................................................................... 182
Appendix Reconciliation of additional performance measures.......................................................... 183
Contents
121entertainmentone.com
SR
G
FS
entertainmentone.com 121

INDEPENDENT AUDITOR’S REPORTTo the members of Entertainment One Ltd.
Report on the Audit of the Consolidated Financial StatementsOpinion
In our opinion, Entertainment One Ltd.’s Group financial statements (the “financial statements”):
• give a true and fair view of the state of the Group’s affairs as at 31 March 2019 and of its profit and cash flows for the year then ended; and
• have been properly prepared in accordance with International Financial Reporting Standards (IFRSs) as adopted by the European Union.
We have audited the financial statements, included within the Annual Report and Accounts (the “Annual Report”), which comprise: the consolidated balance sheet as at 31 March 2019; the consolidated income statement and consolidated statement of comprehensive income, the consolidated cash flow statement, and the consolidated statement of changes in equity for the year then ended; and the notes to the financial statements, which include a description of the significant accounting policies.
Basis for opinion
We conducted our audit in accordance with International Standards on Auditing (UK) (“ISAs (UK)”) and applicable law. Our responsibilities under ISAs (UK) are further described in the Auditors’ responsibilities for the audit of the financial statements section of our report. We believe that the audit evidence we have obtained is sufficient and appropriate to provide a basis for our opinion.
Independence
We remained independent of the Group in accordance with the ethical requirements that are relevant to our audit of the financial statements in the UK, which includes the FRC’s Ethical Standard, as applicable to listed public interest entities, and we have fulfilled our other ethical responsibilities in accordance with these requirements.
Our audit approachOverview
Materiality Overall Group materiality: £5.0 million (2018: £4.2 million), based on 5% of profit before tax adjusted for one off items.
Audit scope We identified six reporting units across two countries which, in our view, required an audit of their complete financial information due to their size: Canada (three), the UK (two) and the US (one).The reporting units where we performed a full scope audit, specific financial statement line items audits and the consolidation adjustment entities accounted for 76% of Group revenue and 56% of Group PBT.We identified six reporting units in two countries which, in our view, were not significant enough contributors to Group PBT to have a full scope audit, but for which certain specific financial statement line items were audited. The reporting units for which we performed specific financial statement line item audits were located in: the US (one) and the UK (one). We also identified certain Head Office reporting units (four) where an audit of specific financial statement line items was required.Further specific audit procedures over central functions and areas of significant judgement, including goodwill and other intangible assets and treasury, were performed at the Group level.
Key audit matters Valuation of investment in acquired content rights and investment in productions (film & television).Carrying values of goodwill and other intangible assets (Film, Television & Music).
The scope of our audit
As part of designing our audit, we determined materiality and assessed the risks of material misstatement in the financial statements. In particular, we looked at where the directors made subjective judgements, for example in respect of significant accounting estimates that involved making assumptions and considering future events that are inherently uncertain. As in all of our audits we also addressed the risk of management override of internal controls, including evaluating whether there was evidence of bias by the directors that represented a risk of material misstatement due to fraud.
eOne Annual Report and Accounts 2019122

Key audit matters
Key audit matters are those matters that, in the auditors’ professional judgement, were of most significance in the audit of the financial statements of the current period and include the most significant assessed risks of material misstatement (whether or not due to fraud) identified by the auditors, including those which had the greatest effect on: the overall audit strategy; the allocation of resources in the audit; and directing the efforts of the engagement team. These matters, and any comments we make on the results of our procedures thereon, were addressed in the context of our audit of the financial statements as a whole, and in forming our opinion thereon, and we do not provide a separate opinion on these matters. This is not a complete list of all risks identified by our audit.
Key audit matter How our audit addressed the key audit matter
Valuation of investment in acquired content rights and investment in productions (Film & Television)
Refer to page 80 of the Audit Committee areas of assessment and Notes 15 and 18. At 31 March 2019, the Group has recognised £259.8 million (2018: £206.1 million) of investment in productions and £254.0 million (2018: £248.0 million) of investment in acquired content rights on the consolidated balance sheet.Ultimate revenues (ultimates) are estimated based on assumptions related to expected future revenues generated from the ongoing exploitation of the content through the various exploitation windows (i.e. through theatrical release, transactional, broadcast and licensing). Forecasting these ultimates that support the valuation of the investment in acquired content rights and investment in productions is judgemental and is dependent upon management estimates.There is a risk in respect of the accuracy of the ultimate forecasts and that inappropriate assumptions are made in respect of the forecast future revenues that would mean that the valuation of the related investment in productions and investment in acquired content rights balances is incorrect.
Our audit procedures included understanding and evaluating the controls and systems related to the ultimates and investment in acquired content rights/investment in productions models, together with performing substantive audit procedures.We performed substantive testing, using sampling techniques that were specific to each component based upon the nature of the content or title.The procedures performed included the following:
– discussing the expectations of the selected films and shows with key personnel, including those outside of finance, to ensure consistency of expected performance with key assumptions;
– where comparable titles existed, we assessed the key assumptions for consistency;
– evaluating key assumptions in the analysis through historic sales data, contracts or available market data;
– assessing management’s historical forecasting accuracy by comparing past assumptions to actual outcomes;
– performing downward sensitivity analysis to identify if there were any ultimate revenues forecasts and associated investment in acquired content rights/investment in productions balances that were sensitive to change; and
– testing the mathematical accuracy of the investment in acquired content rights and investment in productions models and associated amortisation charge and tested a sample of additions to third party supporting documents.
As the Group engagement team, we were specifically involved in assessing the appropriateness of the audit approach for each component in this area. This satisfied us that the area was well understood and that sufficient focus was placed on the risk area with no significant errors identified.
Carrying values of goodwill and other intangible assets (Film, Television & Music)
Refer to page 80 of the Audit Committee areas of assessment and Notes 13 and 14. At 31 March 2019, the Group’s carrying value of goodwill is £397.2 million (2018: £375.2 million) and other intangibles is £219.9 million (2018: £248.9 million) respectively across two cash generating units (CGUs).The recoverable amounts of these CGUs are dependent on certain key assumptions, including the weighted average cost of capital (WACC) rate and future cash flows which are dependent upon management judgements and estimates. There is a risk that significant changes to assumptions or underperformance could give rise to an impairment.We have identified a risk in respect of the valuation for the Film, Television & Music CGU, which has the largest carrying value, has been undergoing a transition, has lower revenues year-on-year, and is most sensitive to changes in assumptions.
The audit procedures, performed by the Group engagement team, focused towards the Film, Television & Music CGU, included the following:
– testing the mathematical integrity of management’s impairment model; – evaluating the process by which management prepared their cash flow forecasts and comparing them against the latest Board adopted plans;
– assessing the historical accuracy of management’s forecasting; – evaluating and challenging the reasonableness of management’s key assumptions including the long and short-term growth rates and the WACC rate. We benchmarked against the industry/peers, external sources and country inflation rates; and
– performing our own sensitivity analysis to understand the impact of reasonable changes in the key assumptions. Consequently, no impairment charge was considered necessary, although the estimate of recoverable amount remains sensitive to changes in these assumptions.
SR
G
FS
123entertainmentone.com
INDEPENDENT AUDITOR’S REPORT CONTINUEDTo the members of Entertainment One Ltd.
How we tailored the audit scope
We tailored the scope of our audit to ensure that we performed enough work to be able to give an opinion on the financial statements as a whole, taking into account the structure of the Group, the accounting processes and controls, and the industry in which it operates.
The Group has two reporting segments being Family & Brands and Film, Television & Music. Within these reporting segments are a number of different Business Units that are primarily split across the geographic locations of Canada, the US and the UK. The Group consolidated financial statements are a consolidation of approximately 90 reporting units, representing these operating business units and certain centralised functions and consolidation units.
The reporting units vary in size and we identified six reporting units which, in our view, required an audit of their complete financial information due to their individual size. These reporting units where we performed a full audit of their financial information were in Canada (three reporting units), the UK (two reporting units) and the US (one reporting unit). These reporting units, together with the specific financial statement line items audits and Group consolidation adjustments accounted for 76% of revenue and 56% of Group profit before tax.
Audits of specific financial statement line items, including revenue, intangibles and the associated amortisation and external borrowings were performed on additional reporting units. These reporting units were in the US (one reporting unit), the UK (one reporting unit) and certain head office entities (four reporting units). We also performed specific audit procedures over central functions such as the consolidation, and certain key areas of focus, including goodwill, other intangible assets and treasury, at the Group level.
The Canadian and US reporting units were audited by our Canadian component audit team and the UK and head office reporting units were audited by the Group team. The Group engagement team attended the year end audit clearance meeting of the component team, maintained regular contact with the component team and were involved in the oversight of work in respect of significant/judgemental areas. Finally, the Group audit team performed a detailed review of the working papers of the component team to ensure the work performed was appropriate.
Materiality
The scope of our audit was influenced by our application of materiality. We set certain quantitative thresholds for materiality. These, together with qualitative considerations, helped us to determine the scope of our audit and the nature, timing and extent of our audit procedures on the individual financial statement line items and disclosures and in evaluating the effect of misstatements, both individually and in aggregate on the financial statements as a whole.
Based on our professional judgement, we determined materiality for the financial statements as a whole as follows:
Overall group materiality £5.0 million (2018: £4.2 million).
How we determined it 5% of profit before tax adjusted for operating one-off items.
Rationale for benchmark applied Overall materiality has been set based on a Group profit before tax, adjusted for one-off items relating to restructuring costs, acquisition related costs and costs associated with aborted corporate projects and non-recurring finance costs. We believe that this is an appropriate benchmark as it removes volatility in order to present results on a more consistent basis and is a key performance measure for the Group.
For each component in the scope of our Group audit, we allocated a materiality that is less than our overall Group materiality. The range of materiality allocated across components was £2.5 million to £3.8 million.
We agreed with the Audit Committee that we would report to them misstatements identified during our audit above £0.2 million (2018: £0.2 million) as well as misstatements below that amount that, in our view, warranted reporting for qualitative reasons.
eOne Annual Report and Accounts 2019124

Going concern
In accordance with ISAs (UK) we report as follows:
Reporting obligation Outcome
We are required to report if we have anything material to add or draw attention to in respect of the directors’ statement in the financial statements about whether the directors considered it appropriate to adopt the going concern basis of accounting in preparing the financial statements and the directors’ identification of any material uncertainties to the Group’s ability to continue as a going concern over a period of at least twelve months from the date of approval of the financial statements.
We have nothing material to add or to draw attention to.However, because not all future events or conditions can be predicted, this statement is not a guarantee as to the Group’s ability to continue as a going concern. For example, the terms on which the United Kingdom may withdraw from the European Union are not clear, and it is difficult to evaluate all of the potential implications on the Group’s trade, customers, suppliers and the wider economy.
We are required to report if the directors’ statement relating to Going Concern in accordance with Listing Rule 9.8.6R(3) is materially inconsistent with our knowledge obtained in the audit.
We have nothing to report.
Reporting on other informationThe other information comprises all of the information in the Annual Report other than the financial statements and our auditors’ report thereon. The directors are responsible for the other information. Our opinion on the financial statements does not cover the other information and, accordingly, we do not express an audit opinion or, except to the extent otherwise explicitly stated in this report, any form of assurance thereon.
In connection with our audit of the financial statements, our responsibility is to read the other information and, in doing so, consider whether the other information is materially inconsistent with the financial statements or our knowledge obtained in the audit, or otherwise appears to be materially misstated. If we identify an apparent material inconsistency or material misstatement, we are required to perform procedures to conclude whether there is a material misstatement of the financial statements or a material misstatement of the other information. If, based on the work we have performed, we conclude that there is a material misstatement of this other information, we are required to report that fact. We have nothing to report based on these responsibilities.
Based on the responsibilities described above and our work undertaken in the course of the audit, ISAs (UK) and the Listing Rules of the Financial Conduct Authority (FCA) require us also to report certain opinions and matters as described below (required by ISAs (UK) unless otherwise stated).
The directors’ assessment of the prospects of the Group and of the principal risks that would threaten the solvency or liquidity of the group
We have nothing material to add or draw attention to regarding:
• The directors’ confirmation on page 55 of the Annual Report that they have carried out a robust assessment of the principal risks facing the Group, including those that would threaten its business model, future performance, solvency or liquidity.
• The disclosures in the Annual Report that describe those risks and explain how they are being managed or mitigated.• The directors’ explanation on page 55 of the Annual Report as to how they have assessed the prospects of the Group, over what
period they have done so and why they consider that period to be appropriate, and their statement as to whether they have a reasonable expectation that the Group will be able to continue in operation and meet its liabilities as they fall due over the period of their assessment, including any related disclosures drawing attention to any necessary qualifications or assumptions.
We have nothing to report having performed a review of the directors’ statement that they have carried out a robust assessment of the principal risks facing the Group and director’s voluntary statement in relation to the longer-term viability of the Group. Our review was substantially less in scope than an audit and only consisted of making inquiries and considering the directors’ process supporting their statements; checking that the statements are in alignment with the relevant provisions of the UK Corporate Governance Code (the “Code”); and considering whether the statements are consistent with the knowledge and understanding of the Group and its environment obtained in the course of the audit. (Listing Rules)
SR
G
FS
125entertainmentone.com

Other code provisions
We have nothing to report in respect of our responsibility to report when:
• The statement given by the directors, on page 81 that they consider the Annual Report taken as a whole to be fair, balanced and understandable, and provides the information necessary for the members to assess the Group’s position and performance, business model and strategy is materially inconsistent with our knowledge of the Group obtained in the course of performing our audit.
• The section of the Annual Report on page 78 to 85 describing the work of the Audit Committee does not appropriately address matters communicated by us to the Audit Committee.
• The directors’ statement relating to the parent company’s compliance with the Code does not properly disclose a departure from a relevant provision of the Code specified, under the Listing Rules, for review by the auditors.
Responsibilities for the Financial statements and the auditResponsibilities of the directors for the Financial statements
As explained more fully in the Statement of Directors’ Responsibilities set out on page 120, the directors are responsible for the preparation of the financial statements in accordance with the applicable framework and for being satisfied that they give a true and fair view. The directors are also responsible for such internal control as they determine is necessary to enable the preparation of financial statements that are free from material misstatement, whether due to fraud or error.
In preparing the financial statements, the directors are responsible for assessing the Group’s ability to continue as a going concern, disclosing as applicable, matters related to going concern and using the going concern basis of accounting unless the directors either intend to liquidate the Group or to cease operations, or have no realistic alternative but to do so.
Auditor’s responsibilities for the audit of the financial statements
Our objectives are to obtain reasonable assurance about whether the financial statements as a whole are free from material misstatement, whether due to fraud or error, and to issue an auditors’ report that includes our opinion. Reasonable assurance is a high level of assurance, but is not a guarantee that an audit conducted in accordance with ISAs (UK) will always detect a material misstatement when it exists. Misstatements can arise from fraud or error and are considered material if, individually or in the aggregate, they could reasonably be expected to influence the economic decisions of users taken on the basis of these financial statements.
A further description of our responsibilities for the audit of the financial statements is located on the FRC’s website at: www.frc.org.uk/auditorsresponsibilities. This description forms part of our auditors’ report.
Uses of this report
This report, including the opinions, has been prepared for and only for the parent company’s members as a body to enable the directors to meet obligations under the Disclosure Guidance and Transparency Rules sourcebook of the UK Financial Conduct Authority and for no other purpose. We do not, in giving these opinions, accept or assume responsibility for any other purpose or to any other person to whom this report is shown or into whose hands it may come save where expressly agreed by our prior consent in writing.
Other voluntary reportingDirectors’ remuneration report
The Company voluntarily prepares a Directors’ Remuneration Report in accordance with the provisions of the Companies Act 2006. The directors requested that we audit the part of the Directors’ Remuneration Report specified by the Companies Act 2006 to be audited as if the Company were a quoted company subject to the Companies Act 2006.
In our opinion, the part of the Directors’ Remuneration Report to be audited has been properly prepared in accordance with the Companies Act 2006.
Philip Stokes
For and on behalf of PricewaterhouseCoopers LLP Chartered Accountants
London 20 May 2019
INDEPENDENT AUDITOR’S REPORT CONTINUEDTo the members of Entertainment One Ltd.
eOne Annual Report and Accounts 2019126

Note
Year ended 31 March 2019
£m
Restated1
Year ended 31 March 2018
£m
Revenue 3 941.2 1,029.0Cost of sales (617.4) (731.8)Gross profit 323.8 297.2Administrative expenses (253.1) (196.5)Operating profit 4 70.7 100.7Finance income 8 7.5 4.9Finance costs 8 (41.4) (40.7)Profit before tax 36.8 64.9Income tax (charge)/credit 9 (21.5) 3.9Profit for the year 15.3 68.8
Attributable to:
Owners of the Company 11.7 53.9Non-controlling interests 3.6 14.9
Operating profit analysed as:Underlying EBITDA 2 197.6 163.6Amortisation of acquired intangibles 14 (39.0) (39.6)Depreciation and amortisation of software 14, 16 (3.7) (3.6)Share-based payment charge 33 (16.2) (12.6)One-off items (includes impairment losses on financial assets of £14.4m (2018: £nil)) 7 (68.0) (7.1)
Operating profit 70.7 100.7
Earnings per share (pence)
Basic 12 2.5 12.4Diluted 12 2.5 12.0
1. See Note 1 ‘Prior period restatements’ for details.
CONSOLIDATED STATEMENT OF COMPREHENSIVE INCOMEfor the year ended 31 March 2019
Year ended 31 March 2019
£m
Restated1
Year ended 31 March 2018
£m
Profit for the year 15.3 68.8Items that may be reclassified subsequently to profit or loss:
Exchange differences on foreign operations 32.5 (55.0)Hedging reserve movements:
Fair value movements on cash flow hedges 7.0 (5.0)Reclassification adjustments for movements on cash flow hedges (3.1) 1.4
Tax (charge)/credit related to components of other comprehensive income/(loss) (0.8) 2.7Total other comprehensive income/(loss) for the year 35.6 (55.9)
Total comprehensive income for the year 50.9 12.9
Attributable to:
Owners of the Company 46.5 2.8Non-controlling interests 4.4 10.1
1. See Note 1 ‘Prior period restatements’ for details.
CONSOLIDATED INCOME STATEMENTfor the year ended 31 March 2019 SR
G
FS
127entertainmentone.com

CONSOLIDATED BALANCE SHEETat 31 March 2019
Note31 March 2019
£m
Restated1
31 March 2018 £m
Restated1
31 March 2017 £m
ASSETS
Non-current assets
Goodwill 13 397.2 375.2 406.9Other intangible assets 14 219.9 248.9 302.9Interest in joint ventures 30 1.2 1.0 1.1Investment in productions 15 259.8 206.1 200.1Property, plant and equipment 16 12.9 10.6 11.9Trade and other receivables 19 46.9 77.0 60.9Deferred tax assets 10 37.5 34.3 35.2Total non-current assets 975.4 953.1 1,019.0Current assets
Inventories 17 11.7 39.6 48.6Investment in acquired content rights 18 254.0 248.0 265.5Trade and other receivables 19 548.4 439.4 424.5Cash and cash equivalents 20 107.4 119.2 133.4Current tax assets 0.8 3.5 1.5Financial instruments 25, 26 4.1 1.9 10.6Total current assets 926.4 851.6 884.1Total assets 1,901.8 1,804.7 1,903.1
LIABILITIES
Non-current liabilities
Interest-bearing loans and borrowings 23 392.2 375.2 276.6Production financing 24 110.2 86.7 91.2Other payables 21 15.6 28.0 35.4Provisions 22 0.4 0.4 1.5Deferred tax liabilities 10 32.5 33.0 52.2Total non-current liabilities 550.9 523.3 456.9Current liabilities
Interest-bearing loans and borrowings 23 0.9 0.4 0.5Production financing 24 85.7 90.1 104.8Trade and other payables 21 529.3 501.4 542.7Provisions 22 4.2 5.9 30.6Current tax liabilities 12.6 14.8 32.8Financial instruments 25, 26 3.5 2.7 15.4Total current liabilities 636.2 615.3 726.8Total liabilities 1,187.1 1,138.6 1,183.7Net assets 714.7 666.1 719.4
EQUITY
Stated capital 32 610.6 594.6 503.8Other reserves 32 (11.4) (23.6) (22.7)Currency translation reserve 62.7 29.8 80.0Retained earnings 15.3 19.0 75.7Equity attributable to owners of the Company 677.2 619.8 636.8Non-controlling interests 31 37.5 46.3 82.6Total equity 714.7 666.1 719.4Total liabilities and equity 1,901.8 1,804.7 1,903.1
1. See Note 1 ‘Prior period restatements’ for details.
These consolidated financial statements were approved by the Board of Directors on 20 May 2019.
Joseph Sparacio
Director
eOne Annual Report and Accounts 2019128

CONSOLIDATED STATEMENT OF CHANGES IN EQUITYfor the year ended 31 March 2019
Stated capital (net of own
shares) £m
Other reserves
£m
Currency translation
reserve £m
Retained earnings
£m
Equity attributable to the owners of the Company
£m
Non-controlling
interests £m
Total equity
£m
At 1 April 2017 restated1 503.8 (22.7) 80.0 75.7 636.8 82.6 719.4Income for the year restated1 – – – 53.9 53.9 14.9 68.8Other comprehensive (loss) – (0.9) (50.2) – (51.1) (4.8) (55.9)Total comprehensive (loss)/income for the year – (0.9) (50.2) 53.9 2.8 10.1 12.9
Issue of common shares net of transaction costs 51.8 – – – 51.8 – 51.8Credits in respect of share-based payments – – – 11.9 11.9 – 11.9Deferred tax movement arising on share options – – – 0.3 0.3 – 0.3Exercise of share options 4.2 – – (4.2) – – –Distribution of shares to beneficiaries of the Employee Benefit Trust 1.3 – – (1.3) – – –Acquisition of subsidiaries (Note 27) 1.8 – – – 1.8 – 1.8Transactions with equity holders (Note 27) 31.7 – – (111.7) (80.0) (39.0) (119.0)Dividends paid (Note 11, 31) – – – (5.6) (5.6) (7.4) (13.0)Total transactions with equity holders 90.8 – – (110.6) (19.8) (46.4) (66.2)At 31 March 2018 restated1 594.6 (23.6) 29.8 19.0 619.8 46.3 666.1
At 1 April 2018 restated1 594.6 (23.6) 29.8 19.0 619.8 46.3 666.1
Adjustments on initial application of IFRS 9 (net of tax) – – – (2.2) (2.2) – (2.2)
Income for the year – – – 11.7 11.7 3.6 15.3
Other comprehensive income – 3.1 31.7 – 34.8 0.8 35.6
Total comprehensive income for the year – 3.1 31.7 11.7 46.5 4.4 50.9
Issue of common shares net of transaction costs 0.1 – – – 0.1 – 0.1
Credits in respect of share-based payments – – – 14.9 14.9 – 14.9
Deferred tax movement arising on share options – – – 0.9 0.9 – 0.9
Exercise of share options 9.4 – – (9.4) – – –
Distribution of shares to beneficiaries of the Employee Benefit Trust 0.1 – – (0.1) – – –
Acquisition of subsidiaries (Note 27) 1.9 (3.1) – – (1.2) 0.4 (0.8)
Transactions with equity holders (Note 27) 4.5 12.2 1.2 (12.9) 5.0 (6.8) (1.8)
Dividends paid (Note 11, 31) – – – (6.6) (6.6) (6.8) (13.4)
Total transactions with equity holders 16.0 9.1 1.2 (13.2) 13.1 (13.2) (0.1)
At 31 March 2019 610.6 (11.4) 62.7 15.3 677.2 37.5 714.7
1. See Note 1 ‘Prior period restatements’ for details.
SR
G
FS
129entertainmentone.com

CONSOLIDATED CASH FLOW STATEMENTfor the year ended 31 March 2019
Note
Year ended 31 March 2019
£m
Restated1
Year ended 31 March 2018
£m
Operating activities
Operating profit 70.7 100.7Adjustment for:
Depreciation of property, plant and equipment 16 2.4 2.0Loss on disposal of property, plant and equipment 16 0.1 –Amortisation of software 14 1.2 1.6Amortisation of acquired intangibles 14 39.0 39.6Amortisation of investment in productions 15 240.5 247.4Investment in productions, net of grants received 15 (258.3) (296.3)Amortisation of investment in acquired content rights 18 84.0 113.4Investment in acquired content rights 18 (121.9) (144.5)Impairment of investment in acquired content rights 18 15.6 –Put option movements 21 – (3.9)Share-based payment charge 33 16.2 12.6
Operating cash flows before changes in working capital and provisions 89.5 72.6Decrease in inventories 30.3 5.0Increase in trade and other receivables (79.9) (43.7)Increase in trade and other payables 17.0 37.8Decrease in provisions (2.0) (24.3)Cash generated from operations 54.9 47.4Income tax paid (24.9) (32.5)Net cash generated from operating activities 30.0 14.9Investing activities
Transactions with equity holders 27 (9.7) (114.8)Acquisition of subsidiaries and joint ventures, net of cash acquired 27 (2.0) (3.7)Purchase of financial instruments 26 (2.3) –Purchase of property, plant and equipment 16 (4.4) (1.7)Purchase of software 14 (2.7) (1.5)Net cash used in investing activities (21.1) (121.7)Financing activities
Net proceeds on issue of shares 32 0.1 52.0Drawdown of interest-bearing loans and borrowings 23 372.8 374.7Repayment of interest-bearing loans and borrowings 23 (357.2) (269.7)Drawdown of production financing 24 225.3 234.7Repayment of production financing 24 (214.3) (233.9)Interest paid (37.3) (26.2)Dividends paid to shareholders and to non-controlling interests of subsidiaries 11, 31 (13.4) (13.0)Fees paid in relation to the Group’s bank facility, premium received on notes and one-off finance costs 8, 23 (2.0) (11.5)Net cash from financing activities (26.0) 107.1Net (decrease)/increase in cash and cash equivalents (17.1) 0.3Cash and cash equivalents at beginning of the year 20 119.2 133.4Effect of foreign exchange rate changes on cash held 5.3 (14.5)Cash and cash equivalents at end of the year 20 107.4 119.2
1. See Note 1 ‘Prior period restatements’ for details.
eOne Annual Report and Accounts 2019130

NOTES TO THE CONSOLIDATED FINANCIAL STATEMENTSfor the year ended 31 March 2019
1. Nature of operations and basis of preparationEntertainment One is a leading independent entertainment group focused on the acquisition, production and distribution of family, television, music and film content rights across all media throughout the world. Entertainment One Ltd. (the Company) is the Group’s ultimate parent company and is incorporated and domiciled in Canada, and is limited by shares. The registered office of the Company is 134 Peter Street, Suite 700, Toronto, Ontario, Canada, M5V 2H2.
Entertainment One Ltd. presents its consolidated financial statements in pounds sterling. These consolidated financial statements were approved for issue by the directors on 20 May 2019.
Statement of compliance
These consolidated financial statements have been prepared under the historical cost convention, except for the revaluation of financial instruments that have been measured at fair value at the end of the reporting period as explained in the accounting policies, and in accordance with applicable International Financial Reporting Standards (IFRS) as adopted by the EU and IFRS Interpretations Committee (IFRIC) interpretations. The Group’s consolidated financial statements comply with Article 4 of the EU IAS Regulation.
Going concern
The Group’s activities, together with the factors likely to affect its future development, are set out in the Strategic Report.
In addition to its senior secured notes (due 2022), the Group meets its day-to-day working capital requirements and funds its investment in production and investment in acquired content rights through its cash in hand and through a revolving credit facility which matures in December 2023 and is secured on certain assets held by the Group. Under the terms of this facility the Group can draw down in the local currencies of its operating businesses. The amounts drawn down by currency at 31 March 2019 are shown in Note 23. The facility is subject to a series of covenants including interest cover charge, and net debt against underlying EBITDA.
The Group has a track record of cash generation and is in full compliance with its bank facility and bond covenant requirements. At 31 March 2019, the Group had £51.6 million of cash and cash equivalents (excluding cash held by production subsidiaries) (refer to Note 20), £393.1 million of gross debt and undrawn amounts under the revolving credit facility of £156.8 million (refer to Note 23).
The Group is exposed to uncertainties arising from the economic climate and uncertainties in the markets in which it operates. Market conditions could lead to lower than anticipated demand for the Group’s products and services and exchange rate volatility could also impact reported performance. The directors have considered the impact of these and other uncertainties and factored them into their financial forecasts and assessment of covenant headroom.
The Group’s forecasts and projections, taking account of reasonable possible changes in trading performance (and available mitigating actions), show that the Group will be able to operate within the expected limits of its bank facility and provide headroom against the covenants for the foreseeable future. The forecasts and projections include the impact of the Group’s acquisition of Audio Network Limited which was completed on 18 April 2019. See Note 36 for details. For these reasons the directors continue to adopt the going concern basis of accounting in preparing the consolidated financial statements.
Basis of consolidation
The consolidated financial statements comprise the financial statements of the Company and its subsidiaries (the Group). Subsidiaries are entities that are directly or indirectly controlled by the Group. Control of the Group’s subsidiaries is achieved when the Group is exposed, or has rights, to variable returns from its involvement with the investee and has the ability to affect those returns through its power over the investee.
The financial statements of the subsidiaries are generally prepared for the same reporting periods as the parent company, using consistent accounting policies. Subsidiaries are fully consolidated from the date of acquisition and continue to be consolidated until the date of disposal or at the point in the future when the Group ceases to have control of the entity. All intra-group balances, transactions, income and expenses, and unrealised profits and losses resulting from intra-group transactions that are recognised in assets, are eliminated in full.
A joint venture is a type of joint arrangement whereby the parties that have joint control of the arrangement have rights to the net assets of the joint venture. Joint control is the contractually agreed sharing of control of the arrangement, which exists only when decisions about the relevant activities require unanimous consent of the parties sharing control. The Group accounts for its interests in joint ventures using the equity method. Under the equity method the investment in the entity is stated as one line item at cost plus the investor’s share of retained post-acquisition profits and other changes in net assets.
SR
G
FS
131entertainmentone.com

NOTES TO THE CONSOLIDATED FINANCIAL STATEMENTS CONTINUEDfor the year ended 31 March 2019
1. Nature of operations and basis of preparation continuedAn associate is an entity, other than a subsidiary or joint venture, over which the Group has significant influence. Significant influence is the power to participate in, but not control or jointly control, the financial and operating decisions of an entity. These investments are accounted for using the equity method.
Investments where the Group does not have significant influence are held on the balance sheet as a financial asset and are recorded at fair value. See Note 26 for additional details.
Foreign currencies
Within individual companiesThe individual financial statements of each Group company are recorded in the currency of the primary economic environment in which it operates (its functional currency). For the consolidated financial statements, the results and financial position of each Group company are expressed in pounds sterling, which is the functional currency of the Company and the presentation currency for the consolidated financial statements.
In preparing the financial statements of the individual companies, transactions in currencies other than the entity’s functional currency are recorded at the rates of exchange prevailing on the dates of the transactions. Foreign exchange differences arising on the settlement of such transactions and from translating monetary assets and liabilities denominated in foreign currencies at year end exchange rates are recognised in the consolidated income statement.
Retranslation within the consolidated financial statementsIn the consolidated financial statements, the assets and liabilities of the Group’s foreign operations are translated at exchange rates prevailing on the balance sheet date. Income and expense items are translated at the exchange rate ruling at the date of each transaction during the period. Foreign exchange differences arising, if any, are recognised in other comprehensive income as a separate component of equity and transferred to the Group’s translation reserve. Such translation differences are subsequently recognised as income or expenses in the period in which the operation is disposed of.
Use of additional performance measures
The Group uses a number of non-IFRS financial measures that are not specifically defined under IFRS or any other generally accepted accounting principles, including underlying EBITDA, one-off items, adjusted profit before tax, adjusted diluted earnings per share, adjusted cash flow, free cash flow, net debt, adjusted net debt and production financing. These non-IFRS financial measures are presented because they are among the measures used by management to measure operating performance and as a basis for strategic planning and forecasting, and the Group believes that these measures are frequently used by investors in analysing business performance. Refer to the Appendix to the consolidated financial statements for definitions of these terms.
Accounting judgements and sources of estimation uncertainty
The preparation of consolidated financial statements under IFRS requires the Group to make estimates and assumptions that affect the amounts reported for assets and liabilities at the balance sheet date and amounts reported for revenues and expenses during the year. The nature of estimation means that actual outcomes could differ from those estimates.
Estimates and judgements are reviewed on an ongoing basis. Revisions to accounting estimates are recognised in the period in which the estimate is revised if the revision affects that period only, or in the period of the revision and future periods if the revision affects both current and future periods.
Key sources of estimation uncertainty:
• The Group’s annual impairment test. See Note 13 for details.• Investment in productions and investment in acquired content rights. See Notes 15 and 18 for details.
eOne Annual Report and Accounts 2019132

Prior period reclassifications
Reclassification of investments in productions and investment in acquired content rightsDuring the year, the Group concluded that the investment in acquired content rights of the Family & Brands Division was appropriate to be included within investment in productions, as the Group owns the underlying intellectual property and has perpetual rights to the Family & Brands content. As such the comparative balance sheets have been restated by £5.9 million as at 31 March 2018 and £2.9 million at 31 March 2017.
New standards and amendments, revisions and improvements to standards adopted during the year
The Group has adopted, for the first time, IFRS 15 Revenue from Contracts with Customers and IFRS 9 Financial Instruments that require restatement of previous financial statements. As required by IAS 8 Accounting Policies, Changes in Accounting Estimates and Errors, the nature and effect of these changes are disclosed below.
IFRS 15 Revenue from Contracts with Customers was effective for reporting periods commencing after 1 January 2018. The Group adopted IFRS 15 on 1 April 2018 on a fully retrospective basis, and comparative periods have been restated.
• The cumulative impact of applying IFRS 15 on the year ended 31 March 2017 was a £31.9 million reduction in equity. Family & Brands Division was impacted by £12.0 million and the remaining £19.9 million fell within the Film, Television & Music Division.
• In the Family & Brands Division, the Group recognised contractual minimum guarantees from licensing arrangements when the licence terms had commenced and collection of the fee was reasonably assured. Under IFRS 15, minimum guarantees are recognised over the consumption of the intellectual property. The impact of applying IFRS 15 to the year ended 31 March 2018 is a reduction in licensing and merchandising revenue of £14.7 million and underlying EBITDA of £11.3 million.
• There are timing differences from the way the Group recognises revenue for content licensing in the Film, Television & Music Division. IFRS 15 includes additional requirements that revenue cannot be recognised before the beginning of the period in which the customer can begin to use and benefit from the licence; and revenue dependent on customers’ sales or usage cannot be recognised until the sale or usage occurs. The impact of applying IFRS 15 to the year ended 31 March 2018 is an increase in production and other revenue of £17.3 million and a decrease in broadcast and licensing revenue of £18.1 million. The corresponding decrease in underlying EBITDA is £2.4 million.
IFRS 15 does not have any impact on the cash flows generated. The Group has presented a restatement of the comparative periods below.
IFRS 9 Financial Instruments is effective for reporting periods commencing after 1 January 2018. The Group has applied IFRS 9 prospectively, with the initial application date of 1 April 2018. The Group has applied the limited exemption in IFRS 9 and has elected not to restate comparative information in the year of initial adoption. As a result, the comparative information provided will continue to be measured in accordance with the Group’s previous accounting policy. The impact was focused on the following items:
• Classification and measurement of financial assets – there was no material change in the classification of financial assets and there were no changes to the measurement of financial assets.
• Impairment of financial assets – for trade receivables and contract assets, the Group applied the simplified approach permitted by IFRS 9, which requires the use of the lifetime expected loss provision for all receivables. Based on the application of the Group’s credit history as a methodology, the impact of the change to the IFRS 9 basis of provision was a £2.2 million charge at adoption which has been recorded to retained earnings. See Note 19 for details.
• Hedge accounting – the Group has continued to apply IAS 39 Financial Instruments: Recognition and Measurement and additional disclosures under IFRS 7 Financial Instruments: Disclosures have been provided in Note 25.
Several other amendments and interpretations apply for the first time in FY19, but do not have an impact on the consolidated financial statements of the Group.
SR
G
FS
133entertainmentone.com

1. Nature of operations and basis of preparation continuedImpact of prior period restatements on previously presented financial statements
Reported 31 March 2018
£mIFRS 15
£m
IIC/IIP reclassification
£m
Restated 31 March 2018
£m
Group’s consolidated income statement for the year ended 31 March 2018
Revenue 1,044.5 (15.5) – 1,029.0
Cost of sales (733.6) 1.8 – (731.8)
Gross profit 310.9 (13.7) – 297.2
Administrative expenses (196.5) – – (196.5)
Operating profit 114.4 (13.7) – 100.7
Finance income 3.9 1.0 – 4.9
Finance costs (40.7) – – (40.7)
Profit before tax 77.6 (12.7) – 64.9
Income tax credit 0.6 3.3 – 3.9
Profit for the year 78.2 (9.4) – 68.8
Attributable to:
Owners of the Company 64.5 (10.6) – 53.9
Non-controlling interests 13.7 1.2 – 14.9
Operating profit analysed as:Underlying EBITDA 177.3 (13.7) – 163.6
Amortisation of acquired intangibles (39.6) – – (39.6)
Depreciation and amortisation of software (3.6) – – (3.6)
Share-based payment charge (12.6) – – (12.6)
One-off items (7.1) – – (7.1)
Operating profit 114.4 (13.7) – 100.7
Earnings per share (pence)
Basic 14.8 (2.4) – 12.4
Diluted 14.4 (2.4) – 12.0
Reported 31 March 2018
£mIFRS 15
£m
IIC/IIP reclassification
£m
Restated 31 March 2018
£m
Group’s consolidated statement of comprehensive income for the year ended 31 March 2018 (extracts)
Profit for the year 78.2 (9.4) – 68.8
Items that may be reclassified subsequently to profit or loss:
Exchange differences on foreign operations (56.6) 1.6 – (55.0)
Total other comprehensive loss for the year (57.5) 1.6 – (55.9)
Total comprehensive income for the year 20.7 (7.8) – 12.9
Attributable to:
Owners of the Company 12.3 (9.5) – 2.8
Non-controlling interests 8.4 1.7 – 10.1
NOTES TO THE CONSOLIDATED FINANCIAL STATEMENTS CONTINUEDfor the year ended 31 March 2019
eOne Annual Report and Accounts 2019134

Reported 31 March 2018
£mIFRS 15
£m
IIC/IIP reclassification
£m
Restated 31 March 2018
£m
Group’s consolidated balance sheet at 31 March 2018 (extracts)
ASSETS
Non-current assets
Investment in productions 181.5 18.7 5.9 206.1
Trade and other receivables 93.7 (16.7) – 77.0
Deferred tax assets 26.2 8.1 – 34.3
Total non-current assets 937.1 10.1 5.9 953.1
Current assets
Investment in acquired content rights 253.4 0.5 (5.9) 248.0
Trade and other receivables 481.5 (42.1) – 439.4
Total current assets 899.1 (41.6) (5.9) 851.6
Total assets 1,836.2 (31.5) – 1,804.7
LIABILITIES
Non-current liabilities
Deferred tax liabilities 34.7 (1.7) – 33.0
Total non-current liabilities 525.0 (1.7) – 523.3
Current liabilities
Trade and other payables 491.3 10.1 – 501.4
Total current liabilities 605.2 10.1 – 615.3
Total liabilities 1,130.2 8.4 – 1,138.6
Net assets 706.0 (39.9) – 666.1
EQUITY
Currency translation reserve 28.5 1.3 – 29.8
Retained earnings 58.4 (39.4) – 19.0
Equity attributable to owners of the Company 657.9 (38.1) – 619.8
Non-controlling interests 48.1 (1.8) – 46.3
Total equity 706.0 (39.9) – 666.1
Total liabilities and equity 1,836.2 (31.5) – 1,804.7
Reported 31 March 2018
£mIFRS 15
£m
IIC/IIP reclassification
£m
Restated 31 March 2018
£m
Group’s consolidated cash flow statement for the year ended 31 March 2018 (extracts)
Operating activities
Operating profit 114.4 (13.7) – 100.7
Adjustment for:Amortisation of investment in productions 230.4 16.0 1.0 247.4
Investment in productions, net of grants received (292.6) – (3.7) (296.3)
Amortisation of investment in acquired content rights 113.9 0.5 (1.0) 113.4
Investment in acquired content rights (148.2) – 3.7 (144.5)
Operating cash flows before changes in working capital and provisions 69.8 2.8 – 72.6
Increase in trade and other receivables (65.5) 21.8 – (43.7)
Increase in trade and other payables 62.4 (24.6) – 37.8
Cash inflow from operations 47.4 – – 47.4
Income tax paid (32.5) – – (32.5)
Net cash inflow from operating activities 14.9 – – 14.9
SR
G
FS
135entertainmentone.com

1. Nature of operations and basis of preparation continuedReported
31 March 2017 £m
IFRS 15 £m
IIC/IIP reclassification
£m
Restated 31 March 2017
£m
Group’s consolidated balance sheet at 31 March 2017 (extracts)
ASSETS
Non-current assets
Investment in productions 160.8 36.4 2.9 200.1
Deferred tax assets 28.2 7.0 – 35.2
Total non-current assets 972.7 43.4 2.9 1,019.0
Current assets
Investment in acquired content rights 269.8 (1.4) (2.9) 265.5
Trade and other receivables 464.4 (39.9) – 424.5
Total current assets 928.3 (41.3) (2.9) 884.1
Total assets 1,901.0 2.1 – 1,903.1
LIABILITIES
Non-current liabilities
Deferred tax liabilities 53.1 (0.9) – 52.2
Total non-current liabilities 457.8 (0.9) – 456.9
Current liabilities
Trade and other payables 507.8 34.9 – 542.7
Total current liabilities 691.9 34.9 – 726.8
Total liabilities 1,149.7 34.0 – 1,183.7
Net assets 751.3 (31.9) – 719.4
EQUITY
Currency translation reserve 79.8 0.2 – 80.0
Retained earnings 104.2 (28.5) – 75.7
Equity attributable to owners of the Company 665.1 (28.3) – 636.8
Non-controlling interests 86.2 (3.6) – 82.6
Total equity 751.3 (31.9) – 719.4
Total liabilities and equity 1,901.0 2.1 – 1,903.1
New, amended and revised standards issued but not adopted during the year
IFRS 16 Leases is effective for reporting periods commencing after 1 January 2019. IFRS 16 requires lessees to recognise a lease liability reflecting future lease payments and a right of use asset for lease contracts, subject to limited exceptions for short-term leases and leases of low-value assets. Lease costs (primarily for the Group’s rental properties) will be recognised in the form of depreciation and interest rather than as an operating cost.
The Group adopted IFRS 16 on 1 April 2019 using the modified retrospective approach with the right of use asset equal to the lease liability at transition date, less any lease incentives received. The Group has elected not to recognise right of use assets and lease liabilities for short-term leases or low-value assets. The Group will continue to expense the lease payments associated with these leases on a straight-line basis over the lease term.
The impact of adopting IFRS 16 at 1 April 2019 has been the recognition of non-current assets relating to right of use asset and total lease liability of approximately £55.0 million.
The estimated impacts to the consolidated income statement for the year ending 31 March 2020 are that the lease payments currently recorded as operating expenses will be replaced by depreciation on the right of use asset and interest expense on the lease liability. This change is presently estimated to result in a reduction in rent expense of £8 million to £10 million which will lead to an increase in EBITDA. There will be a corresponding increase in depreciation of £8 million to £10 million resulting in no material change in operating profit. Furthermore, there will be an increase in interest expense of £2.5 million to £3 million resulting in a decrease in profit before tax of the same magnitude.
IFRS 16 will not have any impact on cash flows.
NOTES TO THE CONSOLIDATED FINANCIAL STATEMENTS CONTINUEDfor the year ended 31 March 2019
eOne Annual Report and Accounts 2019136

2. Operating segmentsAccounting policies
For internal reporting and management purposes, the Group is organised into two main reportable segments based on the types of products and services from which each segment derives its revenue – Family & Brands and Film, Television & Music. The Group’s operating segments are identified based on internal reports that are regularly reviewed by the chief operating decision maker to allocate resources to the segment and to assess its performance. The Chief Executive Officer has been identified as the chief operating decision maker.
On 1 April 2018 the Group combined its Film Division and Television Division (which included Music) into one reporting segment, Film, Television & Music which is in line with broader developments within the media and entertainment industry. The Group is now organised for internal reporting and management purposes into:• Family & Brands – the production, acquisition and exploitation, including licensing and merchandising, of family content rights
across all media.• Film, Television & Music – the production, acquisition, exploitation and trading of television, film and music content rights across
all media.
Inter-segment revenues are charged at prevailing market prices.
Segment information for the year ended 31 March 2019 is presented below:
Family & Brands
£m
Film, Television &
Music £m
Eliminations £m
Consolidated £m
Segment revenue
External revenue 152.8 788.4 – 941.2
Inter-segment revenue 5.7 1.0 (6.7) –
Total segment revenue 158.5 789.4 (6.7) 941.2
Segment results
Segment underlying EBITDA 97.0 115.2 (0.5) 211.7
Group costs (14.1)
Underlying EBITDA 197.6
Amortisation of acquired intangibles (39.0)
Depreciation and amortisation of software (3.7)
Share-based payment charge (16.2)
One-off items (68.0)
Operating profit 70.7
Finance income 7.5
Finance costs (41.4)
Profit before tax 36.8
Income tax charge (21.5)
Profit for the year 15.3
Segment assets
Total segment assets 257.5 1,643.6 – 1,901.1
Unallocated corporate assets 0.7
Total assets 1,901.8
Other segment information
Amortisation of acquired intangibles (12.5) (26.5) – (39.0)
Depreciation and amortisation of software – (3.7) – (3.7)
One-off items – (68.0) – (68.0)
SR
G
FS
137entertainmentone.com

2. Operating segments continuedSegment information for the year ended 31 March 2018 is presented below:
Family & Brands
£m
Film, Television &
Music £m
Eliminations £m
Restated Consolidated
£m
Segment revenue
External revenue 118.5 910.5 – 1,029.0Inter-segment revenue 5.4 0.6 (6.0) –Total segment revenue 123.9 911.1 (6.0) 1,029.0Segment results
Segment underlying EBITDA 71.0 105.9 (0.4) 176.5Group costs (12.9)Underlying EBITDA 163.6Amortisation of acquired intangibles (39.6)Depreciation and amortisation of software (3.6)Share-based payment charge (12.6)One-off items (7.1)Operating profit 100.7Finance income 4.9Finance costs (40.7)Profit before tax 64.9Income tax credit 3.9Profit for the year 68.8
Segment assets
Total segment assets 256.5 1,535.0 – 1,791.5Unallocated corporate assets 13.2Total assets 1,804.7
Family & Brands
£m
Film, Television &
Music £m
Eliminations £m
Restated Consolidated
£m
Other segment information
Amortisation of acquired intangibles (12.3) (27.3) – (39.6)Depreciation and amortisation of software (0.2) (3.4) – (3.6)One-off items (0.2) (6.9) – (7.1)
Geographical information
The Group’s operations are located in the US, Canada, the UK, Australia, the Benelux, Germany and Spain. Family & Brands Division operations are located in the UK. Film, Television & Music Division operations are located in the US, Canada, the UK, Australia, the Benelux, Germany and Spain.
The following table provides an analysis of the Group’s carrying amount of segment non-current assets by the geographical area in which the assets are located for the years ended 31 March 2019 and 2018.
Non-current assets
2019 £m
Restated Non-current
assets 2018
£m
US 318.2 284.6Canada 303.1 290.1UK 279.8 306.3Rest of Europe 28.2 28.6Other 7.4 8.2Total 936.7 917.8
Non-current assets by location exclude amounts relating to interests in joint ventures and deferred tax assets.
NOTES TO THE CONSOLIDATED FINANCIAL STATEMENTS CONTINUEDfor the year ended 31 March 2019
eOne Annual Report and Accounts 2019138

3. Revenue from contracts with customersThe Group’s revenue is predominantly derived from the licensing of intellectual property.
These licences transfer to a customer either a right to use an entity’s intellectual property as it exists at the point in time at which the licence is granted (static licence), or a right to access an entity’s intellectual property as it exists throughout the licence period (dynamic licence). Revenues are accounted for when (static licence) or as (dynamic licence) the performance obligation promised in the contract is satisfied, i.e. when the seller transfers the risks and rewards of the right to use/access the intellectual property and the customer obtains control of the use/access of that licence. Consequently, revenues from static licences are recognised at the point in time when the licence is transferred, and the customer can use and benefit from the licence. Revenues from dynamic licences are accounted for over time, over the licence period as from the date the customer can use and benefit from the licence. The specific policies by key streams of revenue are as follows:
Licensing and merchandising
The Group enters into licensing contracts with customers which allows them to produce merchandise and household goods portraying the Group’s intellectual property. These licences are dynamic as the licensees are exposed to the Group’s activities to maintain the intellectual property and benefit is derived over the licence period.
The consideration due from licensees is variable as the contract price is a function of merchandise sales over and above the contracts’ minimum guarantee. The Group records revenue (including minimum guarantee) as sales or usage occurs based on the amount to which the Group can reliably estimate the extent the amounts are recoverable.
Sales of exploitation rights of film and television content (broadcast and digital, theatrical, digital transactional and international sales within production and other)
These sales are intellectual property licences granted by the Group to licensees and which give them certain rights over its audio-visual works. These licences are static licences because they transfer a right to use the audio-visual content as they exist at the point in time at which the licences are granted.
Revenues from the licensing of the exploitation rights are accounted for, from the moment when the customer is able to use them and obtain the remaining benefits. When the consideration paid by the customer is a fixed price, revenues from the sales of exploitation rights are accounted for at the later of the delivery or the opening of the exploitation window. When the consideration paid by the customer is variable in the form of a sales-based royalty to the end customer, royalty revenues are recognised as the subsequent sale occurs or is estimated to have occurred.
The Group includes certain content on free to consumer, video on demand services for which it earns a portion of advertising revenue earned by the service provider. The performance obligation is met when the user accesses the Group’s content on the service providers infrastructure. The transaction price is dependent on arrangements made with the service provider within a specific territory and is unique to each title and revenue is recognised as the content is consumed.
Transactional
Revenues from physical sales (i.e. DVDs and Blu-rays), net of a provision for estimated returns and rebates if any, are accounted for, either upon the point at which goods are despatched or upon the sale to the ultimate customer for consignment sales.
Licence sales to customers via digital download are recognised at the point of transmission.
Production royalties, participation fees and producer fees and other
The Group can be contracted to create video content for a commissioning broadcaster and earns revenue through either a fixed fee or ongoing royalty payments attached to the broadcaster’s revenue. The customer simultaneously receives and consumes the benefits of these services, as such the Group recognises revenue over the period of production. Further royalty revenue is recognised as statements are received or royalty amounts can be reliably estimated and are recoverable.
Licence fee revenue from trading of film and television content is recognised when notice of delivery is provided to customers and collection of the fee is reasonably assured.
In the following table, revenue is disaggregated by major service lines and primary geographical markets. The table also includes a reconciliation of the disaggregated revenue with the Group’s reportable segments. See Note 2.
SR
G
FS
139entertainmentone.com

3. Revenue from contracts with customers continuedDisaggregation of revenue
Family & Brands Film, Television & Music Consolidated2019
£m2018
£m2019
£m2018
£m2019
£m2018
£m
Primary geographical markets
US 54.5 40.9 364.7 429.5 419.2 470.4Canada 5.7 3.1 112.3 143.3 118.0 146.4UK 19.0 18.9 78.2 78.7 97.2 97.6China 20.6 13.1 4.0 1.9 24.6 15.0Rest of Europe 27.7 22.4 138.2 164.3 165.9 186.7Rest of world 25.3 20.1 91.0 92.8 116.3 112.9
152.8 118.5 788.4 910.5 941.2 1,029.0
Major revenue streams
Theatrical – – 60.9 57.1 60.9 57.1Transactional1 32.2 25.9 125.8 183.3 158.0 209.2Broadcast and licensing 30.6 12.6 381.0 448.1 411.6 460.7Licensing and merchandising 89.4 78.8 – – 89.4 78.8Production and other1 0.6 1.2 220.7 222.0 221.3 223.2
152.8 118.5 788.4 910.5 941.2 1,029.0
Timing of revenue recognition
Products transferred at a point in time 63.4 39.7 691.1 835.5 754.5 875.2Products transferred over time 89.4 78.8 97.3 75.0 186.7 153.8
152.8 118.5 788.4 910.5 941.2 1,029.0
1. Transactional revenue of the Film, Television & Music Division includes £58.3 million (2018: £49.4 million) relating to Music, Production & other includes £6.0 million (2018: £nil) relating to Music.
Contract balances
Year ended 31 March 2019
£m
Restated Year ended
31 March 2018 £m
Receivables (which are included in ‘Trade and other receivables’) 164.2 117.6Contract assets previously accrued income (included within ‘Trade and other receivables’) 263.9 239.2Contract liabilities previously deferred income (included within ‘Trade and other payables’) (93.4) (68.2)
Set out below is the amount of revenue recognised from:Year ended
31 March 2019 £m
Year ended 31 March 2018
£m
Amount included in contract liabilities at the beginning of the year 68.0 86.4Performance obligations satisfied in the previous years 6.7 9.2
Performance obligations satisfied in the previous years primarily represents the additional revenue received from the actualisation of prior year estimates and overages received on the Group’s library titles recognised within production and other.
NOTES TO THE CONSOLIDATED FINANCIAL STATEMENTS CONTINUEDfor the year ended 31 March 2019
eOne Annual Report and Accounts 2019140

Forward bookings
The transaction price allocated to the remaining performance obligations (unsatisfied or partially unsatisfied) as at year end are as follows:
Within one year
£m
More than one year
£m
Broadcast and licensing 153.0 9.3
Production and other 10.6 –
163.6 9.3
The above table does not include revenues from theatrical or transactional, as by their nature these revenues are not committed or measurable in advance of their occurrence. Similarly, revenues from licensing and merchandising are committed at year end, but the timing of the consumption of benefit by customers cannot be reliably measured. Revenues from unscripted productions are also excluded from production and other as the expected duration is less than 12 months.
The Group also has contracted future performance obligations for the licensing of content in relation to agreements for films and television content which has not yet been produced. The transaction price allocated to these performance obligations will only be known once the content has been produced.
4. Operating profitOperating profit for the year is stated after charging:
Note
Year ended 31 March 2019
£m
Restated Year ended
31 March 2018 £m
Amortisation of investment in productions 15 240.5 247.4Amortisation of investment in acquired content rights 18 84.0 113.4Amortisation of acquired intangibles 14 39.0 39.6Amortisation of software 14 1.2 1.6Depreciation of property, plant and equipment 16 2.4 2.0Impairment of investment in acquired content rights 18 15.6 –Staff costs 6 116.2 108.2Inventory costs – costs of inventory disposed of 17 22.2 2.7Inventory costs – costs of inventory recognised as expense 17 37.9 47.1Net operating foreign exchange losses 0.1 2.7Operating lease rentals 34 11.3 10.8
The total remuneration during the year of the Group’s auditor was as follows:Year ended
31 March 2019 £m
Year ended 31 March 2018
£m
Audit fees
– Fees payable for the audit of the Group’s annual financial statements 0.6 0.6 – Fees payable for the audit of the Group’s subsidiaries 0.2 0.2 – Fees payable for the review of the Group’s interim financial statements 0.1 0.1
Other services – Services relating to corporate finance transactions 0.1 0.2 – Other 0.1 0.2
Total 1.1 1.3
SR
G
FS
141entertainmentone.com

5. Key management compensation and directors’ emolumentsKey management compensation
The directors consider the key management of the Group in the years ended 31 March 2019 and 2018 are as follows:
• Darren Throop, Group Chief Executive Officer and executive director in the years ended 31 March 2019 and 2018.• Joseph Sparacio, Group Chief Financial Officer and executive director in the years ended 31 March 2019 and 2018.• Margaret O’Brien, executive director from 18 May 2017 to 20 November 2017. Margaret O’Brien stepped down as an executive
director from 20 November 2017 but continues to be the Group’s Chief Corporate Development and Administrative Officer. The below table includes all payments made to Margaret from 1 April 2017 to 20 November 2017. Payments after 20 November 2017 have not been included in the table as she is not considered to be a key management person from that date.
These persons had authority and responsibility for planning, directing and controlling the activities of the Group, directly or indirectly. The aggregate amounts of key management compensation are set out below:
Year ended 31 March 2019
£m
Year ended 31 March 2018
£m
Short-term employee benefits 2.5 2.7Share-based payment benefits 3.8 5.7Total 6.3 8.4
Short-term employee benefits comprise salary, taxable benefits, annual bonus and pensions and include employer social security contributions of £nil (2018: £nil).
Directors’ emoluments
Full details of directors’ emoluments can be found in the Remuneration Report.
6. Staff costsAccounting policy
Payments to defined contribution retirement benefit plans are charged as an expense as they fall due. Any contributions unpaid at the reporting date are included as a liability within the consolidated balance sheet.
Analysis of results for the year
The average numbers of employees, including directors, are presented below:Year ended
31 March 2019Year ended
31 March 2018
Average number of employees
Canada 488 630US 287 271UK 270 232Australia 46 46Rest of world 99 80Total 1,190 1,259
The table below sets out the Group’s staff costs (including directors’ remuneration):
Note
Year ended 31 March 2019
£m
Year ended 31 March 2018
£m
Wages and salaries 91.0 87.9Share-based payment charge 33 16.2 12.6Social security costs 6.3 6.0Pension costs 2.7 1.7Total staff costs 116.2 108.2
Included within total staff costs is £12.3 million (2018: £6.0 million) of staff-related payments in respect to the restructuring costs as described in further detail in Note 7.
NOTES TO THE CONSOLIDATED FINANCIAL STATEMENTS CONTINUEDfor the year ended 31 March 2019
eOne Annual Report and Accounts 2019142

7. One-off itemsAccounting policy
One-off items are items of income and expenditure that are non-recurring and, in the judgement of the directors, should be disclosed separately on the basis that they are material, either by their nature or their size, to provide a better understanding of the Group’s underlying financial performance and enable comparison of underlying financial performance between years.
The one-off items recorded in the consolidated income statement include items such as significant restructuring, the costs incurred in entering into business combinations, and the impact of the sale, disposal or impairment of an investment in a business or an asset.
Analysis of results for the year
Items of income or expense that are considered by management for designation as one-off are as follows:
Year ended 31 March 2019
£m
Restated Year ended
31 March 2018 £m
Restructuring costs
Home entertainment 61.0 –Strategy-related 8.4 8.0Total restructuring costs 69.4 8.0 Other items
Acquisition gains (0.5) (1.9)Other (0.9) 1.0Total other items (1.4) (0.9) Total one-off costs 68.0 7.1
Home entertainment
Changes in consumer behaviour within the content industry are accelerating at an unprecedented level and in the year ending 31 March 2019, the home entertainment markets in all of the Group’s operating territories experienced significant challenges. As a result the Group has recorded a one-off charge of £61.0 million in the period which included the following:• Impairment of investment in acquired content rights of £15.6 million resulting from the lowering of previous expectations
regarding the home entertainment business driven by an acceleration of market decline;• Write down of home entertainment related inventories of £26.1 million resulting from an assessment of the realisable value
of inventory below the previous assessment of net realisable value;• One-off bad debt expense on trade and other receivables of £14.4 million; and• Related severance, staff costs and other costs of the home entertainment businesses of £4.9 million.
Strategy-related
On 1 April 2018 the Group combined its Film Division and Television Division (which included Music) into one reporting segment, Film, Television & Music, which is in line with broader developments within the media and entertainment industry. The integration which commenced in September 2017 is largely complete and the costs arising from the integration have been included as a one-off charge of £8.4 million; they include the following:• Related severance and staff costs of Film, Television & Music of £7.9 million;• Consultancy fees for the pre-system development of the finance transformation of £0.5 million.
Other items
Acquisition gains of £0.5 million include a cost of £0.6 million for completed deals during the year and a £1.1 million credit due to the release of Last Gang Entertainment contingent consideration which is no longer payable.
Other one-off credits of £0.9 million include a £1.7 million settlement received on a tax warranty relating to a prior year acquisition and is partially offset by £0.8 million of legal costs for certain corporate projects and aborted corporate transactions during the year.
SR
G
FS
143entertainmentone.com

7. One-off items continuedPrior year costs
In 2018, restructuring costs were as follows:
The strategy related restructuring costs of £8.0 million comprised:• £4.4 million of costs associated with the integration of the Television and Film Divisions and includes £3.6 million related to
severance and staff costs and £0.8 million related to consultancy fees;• £2.0 million related to the integration of the unscripted television companies within the wider Canadian television production
business. The costs primarily include severance and staff costs and onerous leases; and• £1.6 million of costs associated with completion of the 2017 strategy related restructuring programmes. The costs include additional
severance, onerous leases and write-off of inventory.
Acquisition gains of £1.9 million included:• Credit of £3.9 million on re-assessment of the liability on put options in relation to the non-controlling interests over Renegade 83
and Sierra Pictures;• These gains are partially offset by banking and legal costs of £1.6 million associated with the creation and set-up of Makeready in
the prior year; and• Charge of £0.6 million on settlement of contingent consideration in relation to Renegade 83 settled in the year, partially offset by
escrow of £0.2 million received in relation to the 2018 acquisition of Last Gang Entertainment.
Other costs of £1.0 million in 2018 primarily related to costs associated with aborted corporate projects.
8. Finance income and finance costsAccounting policies
Interest costsBorrowing costs, including finance costs, are recognised in the consolidated income statement in the period in which they are incurred. Borrowing costs are accounted for using the effective interest rate method.
Deferred finance chargesAll costs incurred by the Group that are directly attributable to the issue of debt are initially capitalised and deducted from the amount of gross borrowings. Such costs are then amortised through the consolidated income statement over the term of the instrument using the effective interest rate method. Should there be a material change to the terms of the underlying instrument, any remaining unamortised deferred finance charges are immediately written off to the consolidated income statement as a one-off finance item. Any new costs incurred as a result of the change to the terms of the underlying instrument are capitalised and then amortised over the term of the new instrument, again using the effective interest rate method.
During the year, the Group refinanced its Revolving Credit Facility (“RCF”) with an available limit of US$260 million (equivalent to £199.5 million at 31 March 2019). All directly attributable costs have been capitalised within deferred finance charges and are being amortised through the consolidated income statement over the term of the facility using the effective interest rate method. Deferred finance charges associated with the previous credit facility were written off.
Premium on senior secured notesIn 2018, the Group issued an additional £70.0 million of senior secured notes at a premium to face value. The premium has been netted off from the amount of deferred finance charges and is then amortised through the consolidated income statement over the term of the instrument using the effective interest rate method.
One-off finance itemsOne-off finance items are items of income and expenditure that do not relate to underlying activities of the Group, that in the judgement of the directors should be disclosed separately on the basis that they are material, either by their nature or their size, in order to provide a better understanding of the Group’s underlying finance costs and enable comparison of underlying financial performance between years.
NOTES TO THE CONSOLIDATED FINANCIAL STATEMENTS CONTINUEDfor the year ended 31 March 2019
eOne Annual Report and Accounts 2019144

Analysis of results for the year
Note
Year ended 31 March 2019
£m
Restated Year ended
31 March 2018 £m
Finance income
Gain on cancellation of financial instruments 27 5.7 –Other finance income 1.8 4.9Total finance income 7.5 4.9 Finance costs
Interest cost (33.6) (26.8)Amortisation of deferred finance charges and premium on senior secured notes (1.6) (1.9)Other accrued interest charges (2.0) –Write-off of deferred finance charges (1.4) –Losses on fair value of derivative instruments – (7.9)Unwind of discounting on financial instruments (1.5) (3.0)Net foreign exchange losses on financing activities (1.3) (1.1)Total finance costs (41.4) (40.7)Net finance costs (33.9) (35.8)Comprised of:Adjusted net finance costs (38.0) (29.8)One-off net finance income/(costs) 4.1 (6.0)
The one-off net finance income of £4.1 million (2018: charge £6.0 million) comprises:
Put options• Credit of £5.7 million (2018: £nil) relating to the reversal of the Sierra/Affinity put option liability following the acquisition of the
remaining 49% shares on 27 June 2018;• Credit of £1.1 million (2018: £nil) relating to the revaluation of put options issued over the non-controlling interest of other
subsidiary companies;• Credits above are partly offset by a charge of £1.4 million (2018: £3.0 million) due to the unwind of discounting on liabilities relating
to put options issued by the Group over the non-controlling interest of subsidiary companies.
Foreign exchange gains & losses• Credit of £0.2 million (2018: charge of £1.6 million) in respect of fair value gains on hedge contracts;• Charges incurred in the prior period included £5.2 million in respect of losses on five forward currency contracts not in compliance
with the Group’s hedging policy and £1.1 million in respect of fair-value loss on hedge contracts cancelled as a result of the re-negotiation of one of the Group’s larger film distribution agreements. The charges in the prior year are partly offset by credit of £1.5 million due to the adoption of IFRS 15.
Tax provisions• Charge of £0.1 million (2018: credit of £3.4 million) relating to interest on tax provisions incurred during the year. In the prior year
there was a release of interest previously charged on tax provisions.
Deferred finance charges• Charge of £1.4 million (2018: £nil) due to the write-off of the deferred finance charges in relation to the RCF which was refinanced
in December 2018.
SR
G
FS
145entertainmentone.com

9. TaxAccounting policy
The income tax charge/credit represents the sum of the current income tax payable and deferred tax.
The current income tax payable is based on taxable profit for the year. Taxable profit differs from profit as reported in the consolidated income statement because it excludes items of income or expense that are taxable or deductible in other years and it further excludes items that are never taxable or deductible. The Group’s asset or liability for current tax is calculated using tax rates that have been enacted or substantively enacted by the balance sheet date.
Deferred tax is the tax expected to be payable or recoverable in the future arising from temporary differences between the carrying amounts of assets and liabilities in the consolidated financial statements and the corresponding tax bases used in the computation of taxable profit. It is accounted for using the balance sheet liability method.
Provisions for open tax issues are based on management’s interpretation of tax law as supported, where appropriate, by the Group’s external advisers, and reflect the single best estimate of likely outcome for each liability.
The level of current and deferred tax recognised in the consolidated financial statements is dependent on subjective judgements as to the interpretation of complex international tax regulations and, in some cases, the outcome of decisions by tax authorities in various jurisdictions around the world, together with the ability of the Group to utilise tax attributes within the limits imposed by relevant tax legislation.
The actual tax on the result for the year is determined according to complex tax laws and regulations. Where the effect of these laws and regulations is unclear, estimates are used in determining the liability for tax to be paid on past profits which are recognised in the consolidated financial statements. The Group considers the estimates, assumptions and judgements to be reasonable but this can involve complex issues which may take several years to resolve. The final determination of prior year tax liabilities could be different from the estimates reflected in the consolidated financial statements.
Analysis of charge for the year
Year ended 31 March 2019
£m
Restated Year ended
31 March 2018 £m
Current tax charge – in respect of current year (32.1) (15.4) – in respect of prior years 8.1 2.2
Total current tax charge (24.0) (13.2)
Deferred tax credit/(charge) – in respect of current year 12.0 20.0 – in respect of prior years (9.5) (2.9)
Total deferred tax credit 2.5 17.1Income tax (charge)/credit (21.5) 3.9Of which:Adjusted tax charge on adjusted profit before tax (31.1) (24.3)One-off net tax credit 9.6 28.2
The one-off tax credit comprises tax credits of £3.2 million (2018: £1.8 million) in relation to the operating and financing one-off items described in Notes 7 and 8, £0.7 million (2018: £12.6 million) in relation to the release of the certain tax provisions, £5.1 million (2018: £6.6 million) on amortisation of acquired intangibles described in Note 14, £0.5 million (2018: £0.4 million) on share-based payments as described in Note 33, and £0.1 million on other discrete tax items. The prior year also included a credit of £7.5 million on impact of the US Federal rate reduction and a tax charge of £0.7 million relating to prior period current tax and deferred tax adjustments.
NOTES TO THE CONSOLIDATED FINANCIAL STATEMENTS CONTINUEDfor the year ended 31 March 2019
eOne Annual Report and Accounts 2019146

The charge for the year can be reconciled to the profit in the consolidated income statement as follows:
Year ended 31 March 2019 £m
Restated Year ended 31 March 2018
£m£m % £m %
Profit before tax (including joint ventures) 36.8 64.9Deduct share of results of joint ventures – –Profit before tax (excluding joint ventures) 36.8 64.9
Taxes at applicable domestic rates (7.2) (19.6) (18.1) (27.9)Effect of income that is exempt from tax 4.2 11.4 3.8 5.9Effect of expenses that are not deductible in determining taxable profit (11.1) (30.2) (3.3) (5.1)Effect of losses/temporary differences not recognised in deferred tax (7.8) (21.2) (2.8) (4.3)Effect of decrease in tax provisions 0.7 1.9 13.5 20.8Effect of non-controlling interests 1.4 3.8 0.9 1.4Effect of tax rate changes (0.3) (0.8) 7.3 11.2Effect of changes in accounting standard1 – – 3.3 5.1Prior year items (1.4) (3.8) (0.7) (1.1)Income tax charge and effective tax rate for the year (21.5) (58.4) 3.9 6.0
1. IFRS 15 Revenue from Contracts with Customers was adopted by the Group on 1 April 2018 on a fully retrospective basis which requires the restatement of comparative periods. With the restatement of these balances affecting the Group’s profit before tax, restatement was also required for the Group’s current and deferred tax balances as at 31 March 2018. The change has been isolated in the above line.
Income tax is calculated at the rates prevailing in respective jurisdictions. The standard tax rates in each jurisdiction are 26.5% in Canada (2018: 26.5%), 26.0% in the US (2018: 30.6% – 32.8%), 19.0% in the UK (2018: 19.0%), 25.0% in the Netherlands (2018: 25.0%), 30.0% in Australia (2018: 30.0%) and 25.0% in Spain (2018: 25.0%).
Analysis of tax on items taken directly to other comprehensive income and equity
Note
Year ended 31 March 2019
£m
Year ended 31 March 2018
£m
Deferred tax (charge)/credit on cash flow hedges (0.8) 2.7Deferred tax credit on share options 0.9 0.3Total credit taken directly to equity 10 0.1 3.0
10. Deferred tax assets and liabilitiesAccounting policy
Deferred tax is the tax expected to be payable or recoverable on differences between the carrying amounts of assets and liabilities in the consolidated financial statements and the corresponding tax bases used in the computation of taxable profit, and is accounted for using the balance sheet liability method. Deferred tax liabilities are generally recognised for all taxable temporary differences and deferred tax assets are recognised to the extent that it is probable that taxable profits will be available against which deductible temporary differences can be utilised. Such assets and liabilities are not recognised if the temporary difference arises from the initial recognition of goodwill or from the initial recognition of other assets and liabilities in a transaction (other than in a business combination) that affects neither the tax profit nor the accounting profit.
Deferred tax liabilities are recognised for taxable temporary differences arising on investments in subsidiaries, except where the Group can control the reversal of the temporary difference and it is probable that the temporary difference will not reverse in the foreseeable future.
The carrying amount of deferred tax assets is reviewed at each balance sheet date and reduced to the extent that it is no longer probable that sufficient taxable profits will be available to allow all or part of the asset to be recovered.
SR
G
FS
147entertainmentone.com

10. Deferred tax assets and liabilities continuedDeferred tax assets and liabilities are measured on an undiscounted basis at the tax rates that are expected to apply in the period when the asset is realised or the liability is settled, based on tax rates (and tax laws) that have been enacted or substantively enacted by the balance sheet date. Deferred tax is charged or credited in the consolidated income statement, except when it relates to items charged or credited directly to equity, in which case the deferred tax is also dealt with in equity.
Deferred tax assets and liabilities are offset when there is a legally enforceable right to offset current tax assets against current tax liabilities. This applies when they relate to income taxes levied by the same tax authority and the Group intends to settle its current assets and liabilities on a net basis.
In the UK and the US, the Group is entitled to a tax deduction for amounts treated as compensation on exercise of certain employee share options or vesting of share awards under each jurisdiction’s tax rules. The deferred tax asset arising is calculated by comparing the estimated amount of tax deduction to be obtained in the future (based on the Company’s share price at the balance sheet date) with the cumulative amount of the share-based payment charge recorded in the consolidated income statement. If the amount of estimated future tax deduction exceeds the cumulative amount of the compensation expense at the statutory rate, the excess is recorded directly in equity, against retained earnings.
Deferred tax assets require the directors’ judgement in determining the amounts to be recognised. In particular, judgement is used when assessing the extent to which deferred tax assets should be recognised with consideration to the timing and level of future taxable income.
Utilisation of deferred tax assets is dependent on the future profitability of the Group. In certain jurisdictions, the Group has recognised net deferred tax assets relating to tax losses and other short-term temporary differences carried forward as the Group considers that, on the basis of the most recent forecasts, there will be sufficient taxable profits in the future against which these items will be offset.
Analysis of amounts recognised by the Group
The following are the major deferred tax assets and liabilities recognised by the Group and movements thereon during the year:
Note
Other intangible
assets £m
Unused tax losses
£m
Financing items
£mOther
£mTotal
£m
At 1 April 2017 (63.9) 38.0 0.8 8.1 (17.0)Credit/(charge) to income restated 17.6 (6.1) (0.4) 6.0 17.1Credit to equity 9 – – 2.7 0.3 3.0Exchange differences restated 3.3 (3.1) (0.5) (0.5) (0.8)Effect of change in accounting standard – – – (1.0) (1.0)At 31 March 2018 restated (43.0) 28.8 2.6 12.9 1.3Acquisition of subsidiaries 27 (2.0) (1.2) 3.2 – –
Credit/(charge) to income 5.3 7.3 0.3 (10.4) 2.5
(Charge)/credit to equity 9 – – (0.8) 0.9 0.1
Exchange differences (1.0) 1.0 0.1 – 0.1
Effect of change in accounting standard – – – 1.0 1.0
At 31 March 2019 (40.7) 35.9 5.4 4.4 5.0
The category “Other” includes temporary differences on share options, accrued liabilities, certain asset valuation provisions, foreign exchange gains, investment in productions and investment in acquired content rights.
The deferred tax balances have been reflected in the consolidated balance sheet as follows:
31 March 2019 £m
Restated 31 March 2018
£m
Deferred tax assets 37.5 34.3Deferred tax liabilities (32.5) (33.0)Total 5.0 1.3
NOTES TO THE CONSOLIDATED FINANCIAL STATEMENTS CONTINUEDfor the year ended 31 March 2019
eOne Annual Report and Accounts 2019148

At the balance sheet date, the Group has unrecognised unused tax losses of £226.8 million (2018: £156.3 million), the majority of which will expire in the years ending 2028 to 2039.
The Group also has unrecognised deferred tax assets of £3.4 million (2018: £4.8 million) in connection with the put and call options that were granted over the remaining 35% in Renegade 83. During the year the put option in relation to the non-controlling interest of 49% in Sierra Pictures was cancelled as a result of the Group’s acquisition of the remaining 49% upon which there was no longer a non-controlling interest (see Note 27).
At the balance sheet date, the aggregate amount of temporary differences associated with undistributed earnings of subsidiaries for which deferred tax liabilities have not been recognised was £83.6 million (2018: £70.1 million).
It is estimated that deferred tax liabilities of approximately £1.9 million will reverse during the next financial year.
During the year ended 31 March 2018, the corporate income tax rate reduced from 35% to 21% in the US. During the year ended 31 March 2017, the corporate income tax rate in the UK reduced from 18% to 17% effective from 1 April 2020. These rates are reflected in the deferred tax calculations as appropriate.
11. DividendsAccounting policy
Distributions to equity holders are not recognised in the consolidated income statement under IFRS, but are disclosed as a component of the movement in total equity. A liability is recorded for a dividend when the dividend is declared by the Company’s directors.
Amounts recognised by the Group
On 20 May 2019 the directors declared a final dividend in respect of the financial year ended 31 March 2019 of 1.5 pence (2018: 1.4 pence) per share which will absorb an estimated £7.4 million of total equity (2018: £6.6 million including withholding tax, 2017: £5.6 million including withholding tax). It will be paid on or around 6 September 2019 to shareholders who are on the register of members on 12 July 2019 (the record date).
This dividend is expected to qualify as an eligible dividend for Canadian tax purposes.
The dividend will be paid net of withholding tax based on the residency of the individual shareholder.
12. Earnings per shareBasic earnings per share is calculated by dividing earnings for the year attributable to the owners of the Company by the weighted average number of shares in issue during the year, fully vested employee share awards exercisable for no further consideration and excluding own shares held by the Employee Benefit Trust (EBT) which are treated as cancelled.
Adjusted basic earnings per share is calculated by dividing adjusted earnings for the year attributable to the owners of the Company by the weighted average number of shares in issue during the year, fully vested employee share awards exercisable for no further consideration and excluding own shares held by the EBT which are treated as cancelled. Adjusted earnings are the profit for the year attributable to the owners of the Company adjusted to exclude amortisation of acquired intangibles, share-based payment charge, tax, finance costs and depreciation related to joint ventures, operating one-off items, finance one-off items and one-off tax items.
Diluted earnings per share and adjusted diluted earnings per share are calculated after adjusting the weighted average number of shares in issue during the year to assume conversion of all potentially dilutive shares. In April 2019, the Group completed a private placement and acquired 100% of the share capital of Audio Network Limited (including the issue of consideration shares). These transactions led to the issue of 28,900,000 and 2,112,428 additional shares of Entertainment One Ltd., respectively. A further 198,000 shares were issued on exercise of share options and the total number of shares in issue at 1 May 2019 was 495,997,548. Refer to Note 36 for additional details. There have been no other transactions involving common shares or potential common shares between the reporting date and the date of authorisation of these consolidated financial statements.
SR
G
FS
149entertainmentone.com

12. Earnings per share continuedEarnings per share
Year ended 31 March 2019
Pence
Restated Year ended
31 March 2018 Pence
Basic earnings per share 2.5 12.4Diluted earnings per share 2.5 12.0Adjusted basic earnings per share 25.6 19.8Adjusted diluted earnings per share 25.0 19.3
The weighted average number of shares used in the earnings per share calculations are set out below:Year ended
31 March 2019 Million
Year ended 31 March 2018
Million
Weighted average number of shares for basic earnings per share and adjusted basic earnings per share 462.9 436.3Effect of dilution for basic and adjusted:
Employee share awards 10.7 10.9Contingent consideration with option in cash or shares – 0.4
Weighted average number of shares for diluted earnings per share and adjusted diluted earnings per share 473.6 447.6
As noted above, shares held by the EBT, classified as own shares, are excluded from earnings per share and adjusted earnings per share. Refer to Note 33 for details on employee share awards.
At 31 March 2018, the Group held an option to settle the contingent consideration payable in relation to the acquisition of Last Gang Entertainment which has been reversed during the year ended 31 March 2019. See Note 21 for details.
Adjusted earnings per share
The directors believe that the presentation of adjusted earnings per share, being the fully diluted earnings per share adjusted for amortisation of acquired intangibles, share-based payment charge, tax, finance costs and depreciation related to joint ventures, operating one-off items, finance one-off items and one-off tax items, helps to explain the underlying performance of the Group. A reconciliation of the earnings used in the fully diluted earnings per share calculation to earnings used in the adjusted earnings per share calculation is set out below:
Year ended 31 March 2019Restated
Year ended 31 March 2018
Note £mPence per
share £mPence per
share
Profit for the year attributable to the owners of the Company 11.7 2.5 53.9 12.0Add back amortisation of acquired intangibles 14 39.0 8.2 39.6 8.9Add back share-based payment charge 33 16.2 3.4 12.6 2.8Add back one-off items 7 68.0 14.4 7.1 1.6Add back one-off net finance (income)/costs 8 (4.1) (0.9) 6.0 1.3Deduct tax effect of above items and discrete tax items (9.6) (2.0) (28.2) (6.3)Deduct non-controlling interests’ share of above items (2.9) (0.6) (4.6) (1.0)Adjusted earnings attributable to the owners of the Company 118.3 25.0 86.4 19.3Adjusted earnings attributable to non-controlling interests 6.5 19.5Adjusted profit for the year 124.8 105.9
NOTES TO THE CONSOLIDATED FINANCIAL STATEMENTS CONTINUEDfor the year ended 31 March 2019
eOne Annual Report and Accounts 2019150

Profit before tax is reconciled to adjusted profit before tax and adjusted earnings as follows:
Note
Year ended 31 March 2019
£m
Restated Year ended
31 March 2018 £m
Profit before tax 36.8 64.9Add back one-off items 7 68.0 7.1Add back amortisation of acquired intangibles 14 39.0 39.6Add back share-based payment charge 33 16.2 12.6Add back one-off net finance (income)/costs 8 (4.1) 6.0Adjusted profit before tax 155.9 130.2Adjusted tax charge 9 (31.1) (24.3)Deduct profit attributable to non-controlling interests (3.6) (14.9)Deduct non-controlling interests’ share of adjusting items above (2.9) (4.6)Adjusted earnings attributable to the owners of the Company 118.3 86.4
13. GoodwillAccounting policy
Goodwill arising on a business combination is recognised as an asset and initially measured at cost, being the excess of the aggregate of the consideration transferred and the amount recognised for non-controlling interests over the fair value of net identifiable assets acquired (including other intangible assets) and liabilities assumed. Transaction costs directly attributable to the acquisition form part of the acquisition cost for business combinations prior to 1 January 2010, but from that date such costs are written off to the consolidated income statement and do not form part of goodwill. Following initial recognition, goodwill is measured at cost less any accumulated impairment losses.
Goodwill is allocated to cash generating units (CGUs) which are tested for impairment annually or more frequently if there are indications that goodwill might be impaired. The CGUs identified are the smallest identifiable group of assets that generate cash flows that are largely independent of the cash flows from other groups of assets. Gains or losses on the disposal of an entity include the carrying amount of goodwill relating to the entity sold.
Key source of estimation uncertainty
The Group determines whether goodwill is impaired on at least an annual basis. This requires an estimation of the recoverable amount, which is the higher of the fair value less cost of disposal and value-in-use of the CGUs to which the goodwill is allocated. Estimating a value-in-use amount requires the directors to make an estimate of the expected future cash flows from the CGU and to choose a suitable discount rate to calculate the present value of those cash flows.
SR
G
FS
151entertainmentone.com
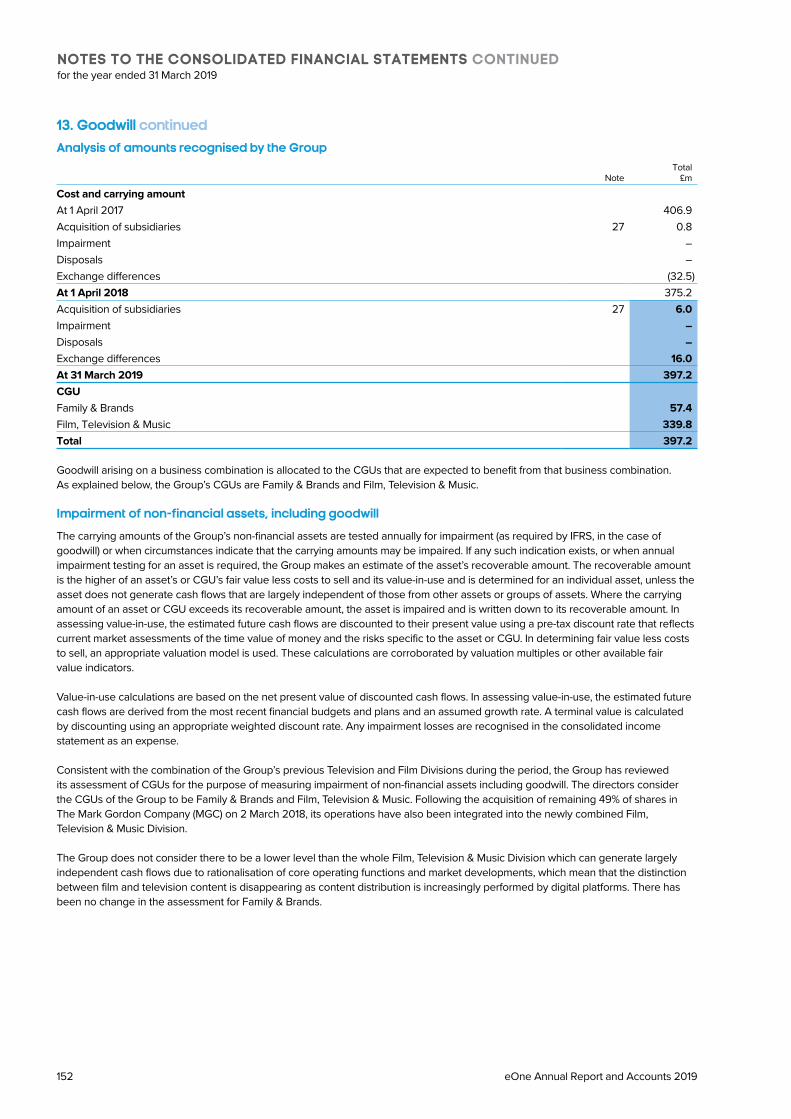
13. Goodwill continuedAnalysis of amounts recognised by the Group
NoteTotal
£m
Cost and carrying amount
At 1 April 2017 406.9Acquisition of subsidiaries 27 0.8Impairment –Disposals –Exchange differences (32.5)At 1 April 2018 375.2Acquisition of subsidiaries 27 6.0
Impairment –
Disposals –
Exchange differences 16.0
At 31 March 2019 397.2
CGU
Family & Brands 57.4
Film, Television & Music 339.8
Total 397.2
Goodwill arising on a business combination is allocated to the CGUs that are expected to benefit from that business combination. As explained below, the Group’s CGUs are Family & Brands and Film, Television & Music.
Impairment of non-financial assets, including goodwill
The carrying amounts of the Group’s non-financial assets are tested annually for impairment (as required by IFRS, in the case of goodwill) or when circumstances indicate that the carrying amounts may be impaired. If any such indication exists, or when annual impairment testing for an asset is required, the Group makes an estimate of the asset’s recoverable amount. The recoverable amount is the higher of an asset’s or CGU’s fair value less costs to sell and its value-in-use and is determined for an individual asset, unless the asset does not generate cash flows that are largely independent of those from other assets or groups of assets. Where the carrying amount of an asset or CGU exceeds its recoverable amount, the asset is impaired and is written down to its recoverable amount. In assessing value-in-use, the estimated future cash flows are discounted to their present value using a pre-tax discount rate that reflects current market assessments of the time value of money and the risks specific to the asset or CGU. In determining fair value less costs to sell, an appropriate valuation model is used. These calculations are corroborated by valuation multiples or other available fair value indicators.
Value-in-use calculations are based on the net present value of discounted cash flows. In assessing value-in-use, the estimated future cash flows are derived from the most recent financial budgets and plans and an assumed growth rate. A terminal value is calculated by discounting using an appropriate weighted discount rate. Any impairment losses are recognised in the consolidated income statement as an expense.
Consistent with the combination of the Group’s previous Television and Film Divisions during the period, the Group has reviewed its assessment of CGUs for the purpose of measuring impairment of non-financial assets including goodwill. The directors consider the CGUs of the Group to be Family & Brands and Film, Television & Music. Following the acquisition of remaining 49% of shares in The Mark Gordon Company (MGC) on 2 March 2018, its operations have also been integrated into the newly combined Film, Television & Music Division.
The Group does not consider there to be a lower level than the whole Film, Television & Music Division which can generate largely independent cash flows due to rationalisation of core operating functions and market developments, which mean that the distinction between film and television content is disappearing as content distribution is increasingly performed by digital platforms. There has been no change in the assessment for Family & Brands.
NOTES TO THE CONSOLIDATED FINANCIAL STATEMENTS CONTINUEDfor the year ended 31 March 2019
eOne Annual Report and Accounts 2019152

Key assumptions used in value-in-use calculations
Key assumptions used in the value-in-use calculations for each CGU are set out below:31 March 2019
CGU
Pre-tax discount rate
%
Terminal growth rate
%
Period of specific cash
flows
Family & Brands 8.4 2.0 3 years
Film, Television & Music 8.6 2.0 3 years
The calculations of the value-in-use for all CGUs are most sensitive to the operating profit, discount rate and terminal growth rate assumptions.
Operating profits – Operating profits are based on budgeted/planned growth in revenue resulting from new investment in acquired content rights, investment in productions and growth in the relevant markets.
Discount rates – The post-tax discount rate is based on the Group weighted average cost of capital of 7.2% (2018: 7.2%). The discount rate is adjusted where specific country and operational risks are sufficiently significant to have a material impact on the outcome of the impairment test. A pre-tax discount rate is applied to calculate the net present value of the CGUs as shown in the table above.
Terminal growth rate estimates – The terminal growth rates do not exceed the long-term projected growth rates for the relevant market.
Period of specific cash flows – Specific cash flows reflect the period of detailed forecasts prepared as part of the Group’s annual planning cycle. The period of specific cash flows has been aligned with the Group’s annual strategic planning process, which underpins the conclusions made within the viability statement.
The carrying value of goodwill, translated at year end exchange rates, is allocated as follows:
CGU
Year ended 31 March 2019
£m
Year ended 31 March 2018
£m
Family & Brands 57.4 57.4Film, Television & Music 339.8 –Television – 58.6The Mark Gordon Company – 69.0Film – 190.2Total 397.2 375.2
Sensitivity to change in assumptions
Family & Brands – The Family & Brands calculations show that there is significant headroom when compared to carrying values of non-current assets at 31 March 2019. As part of the impairment review, sensitivity was applied to the main assumptions with no impairment identified (10% reduction in budgeted/planned operating profit, 1.5% increase in pre-tax discount rate and 0% terminal growth rate). A 652.4% (54.8 percentage point) increase in the pre-tax discount rate would reduce the recoverable amount to the carrying amount. Consequently, the directors believe that no reasonable change in the above key assumptions would cause the carrying value of this CGU to exceed its recoverable amount.
Film, Television & Music – The Film, Television & Music calculations show that there is significant headroom when compared to carrying values of non-current assets at 31 March 2019. As part of the impairment review, sensitivity was applied to the main assumptions with no impairment identified (10% reduction in budgeted/planned operating profit, 1.5% increase in pre-tax discount rate and 0% terminal growth rate). A 39.3% (3.3 percentage point) increase in the pre-tax discount rate would reduce the recoverable amount to the carrying amount. Consequently, the directors believe that no reasonable change in the above key assumptions would cause the carrying value of this CGU to exceed its recoverable amount.
SR
G
FS
153entertainmentone.com

14. Other intangible assetsOther intangible assets acquired by the Group are stated at cost less accumulated amortisation. Amortisation is charged to administrative expenses in the consolidated income statement on a straight-line basis over the estimated useful life of intangible fixed assets unless such lives are indefinite.
Other intangible assets mainly comprise amounts arising on consolidation of acquired subsidiaries such as exclusive content agreements and libraries, trade names and brands, exclusive distribution agreements, customer relationships and non-compete agreements. Other intangible assets also include amounts relating to costs of software.
Other intangible assets are generally amortised over the following periods:Exclusive content agreements and libraries 3–14 yearsTrade names and brands 1–15 yearsExclusive distribution agreements 9 yearsCustomer relationships 9–10 yearsNon-compete agreements 2–5 yearsSoftware 3 years
Analysis of amounts recognised by the GroupAcquired intangibles
Note
Exclusive content
agreements and libraries
£m
Trade names and brands
£m
Exclusive distribution agreements
£m
Customer relationships
£m
Non-compete agreements
£mSoftware
£mTotal
£m
Cost
At 1 April 2017 231.0 202.8 29.0 51.0 18.5 14.3 546.6Additions – – – – – 1.5 1.5Disposals (0.8) (6.8) (14.7) – (15.4) (0.1) (37.8)Exchange differences (19.9) (2.7) (2.0) (4.7) (1.1) (1.2) (31.6)At 31 March 2018 210.3 193.3 12.3 46.3 2.0 14.5 478.7Acquisition of subsidiaries 27 0.7 – – 0.3 – – 1.0
Additions – – – – – 2.7 2.7
Disposals (0.3) (3.5) (9.6) (20.0) – (8.7) (42.1)
Exchange differences 11.4 1.0 0.4 1.7 0.1 0.5 15.1
At 31 March 2019 222.1 190.8 3.1 28.3 2.1 9.0 455.4
Amortisation
At 1 April 2017 (96.2) (50.1) (28.6) (38.7) (18.5) (11.6) (243.7)Amortisation charge for the year 4 (23.4) (11.9) (0.3) (4.0) – (1.6) (41.2)Disposals 0.8 6.8 14.7 – 15.4 0.1 37.8Exchange differences 7.3 2.0 2.1 3.8 1.1 1.0 17.3At 31 March 2018 (111.5) (53.2) (12.1) (38.9) (2.0) (12.1) (229.8)Amortisation charge for the year 4 (23.3) (12.0) (0.2) (3.5) – (1.2) (40.2)
Disposals 0.3 3.5 9.6 19.9 – 8.7 42.0
Exchange differences (4.5) (0.7) (0.4) (1.4) (0.1) (0.4) (7.5)
At 31 March 2019 (139.0) (62.4) (3.1) (23.9) (2.1) (5.0) (235.5)
Carrying amount
At 31 March 2018 98.8 140.1 0.2 7.4 – 2.4 248.9At 31 March 2019 83.1 128.4 – 4.4 – 4.0 219.9
The amortisation charge for the year ended 31 March 2019 comprises £39.0 million (2018: £39.6 million) in respect of acquired intangibles.
The Group acquired a 70.1% stake in Whizz Kid Entertainment Limited (Whizz Kid), a UK based unscripted television production company, on 9 April 2018. £0.7 million was recognised relating to the value placed on the television shows and back end royalties following the end of a series production, which has been included within exclusive content agreements and libraries.
The Group acquired 100% of Magnolia Record Club LLC on 26 July 2018 for a consideration of £0.3 million. Acquired intangibles of £0.3 million were identified on the acquisition relating to existing customer lists and brand names. Refer to Note 27 for further details.
NOTES TO THE CONSOLIDATED FINANCIAL STATEMENTS CONTINUEDfor the year ended 31 March 2019
eOne Annual Report and Accounts 2019154

The additions to software of £2.7 million relates to an ongoing finance system project. These assets are still in development and amortisation will commence once the project has been completed.
Disposals in the current and prior year represent intangible assets that have been derecognised as no future economic benefits are expected from their use or disposal. These assets were fully amortised at 31 March 2019.
15. Investment in productionsAccounting policy
Investment in productions that are in development and for which the realisation of expenditure can be reasonably determined are capitalised as productions in progress within investment in productions. On delivery of a production, the cost of investment is reclassified as productions delivered. Also included within investment in productions are television and films programmes acquired on the acquisition of subsidiaries.
Production financing interest directly attributable to the acquisition or production of a qualifying asset (such as investment in productions) forms part of the cost of that asset and is capitalised.
Amortisation of investment in productions, net of government grants, is charged to cost of sales using a model that reflects the consumption of the asset as it is released through different exploitation windows (e.g. theatrical release, home entertainment, and broadcast licences) and the expected revenue earned in each of those stages of release over a period not exceeding 10 years from the date of its initial release, unless it arises from revaluation on the acquisition of subsidiaries in which case it is charged to administrative expenses. Amounts capitalised are reviewed at least quarterly and any portion of the unamortised amount that appears not to be recoverable from future net revenues is written off to cost of sales during the period the loss becomes evident.
A government grant is recognised and credited as part of investment in productions when there is reasonable assurance that any conditions attached to the grant will be satisfied and the grants will be received and the programme has been delivered. Government grants are recognised at fair value.
Key source of estimation uncertainty
The Group is required to exercise judgement in estimating future revenue forecasts for its underlying productions. These forecasts are based on the revenue generated from other similar productions, actual performance to date of the production and the expectation of future revenue generated over the remaining useful life. The future revenue forecasts are reviewed at least quarterly and any changes to forecasts are treated prospectively as of the beginning of the financial year during which the forecasts are revised. Sensitivities are considered as part of the respective production level forecasts.
Due to the varied nature of the productions, a sensitivity analysis on the overall balance of investment in productions is not considered to be meaningful.
Amounts recognised by the Group
Note
Year ended 31 March 2019
£m
Restated Year ended
31 March 2018 £m
Cost
Balance at 1 April 1,033.1 850.2Additions 285.0 278.0Disposals – (0.5)Exchange differences 57.8 (94.6)Balance at 31 March 1,375.9 1,033.1Amortisation
Balance at 1 April (827.0) (650.1)Amortisation charge for the year 4 (240.5) (247.4)Exchange differences (48.6) 70.5Balance at 31 March (1,116.1) (827.0)Carrying amount 259.8 206.1
Borrowing costs of £8.2 million (2018: £6.9 million) related to television, film and family production financing have been included in the additions during the year.
Included within the carrying amount as at 31 March 2019 is £89.7 million (2018: £71.5 million) of productions in progress.
SR
G
FS
155entertainmentone.com

16. Property, plant and equipmentAccounting policy
Property, plant and equipment are stated at original cost less accumulated depreciation. Depreciation is charged to write-off cost less estimated residual value of each asset over their estimated useful lives using the following methods and rates:
Leasehold improvements Over the term of the leaseFixtures, fittings and equipment 3–10 years
The carrying amounts of property, plant and equipment are reviewed for impairment when events or changes in circumstances indicate that the carrying amounts may not be recoverable. The Group reviews residual values and useful lives on an annual basis and any adjustments are made prospectively.
An item of property, plant and equipment is derecognised upon disposal or when no future economic benefits are expected to arise from the continued use of the asset. Any gain or loss arising on derecognition of the asset (determined as the difference between the sales proceeds and the carrying amount of the asset) is recorded in the consolidated income statement in the period of derecognition.
Analysis of amounts recognised by the Group
Note
Leasehold improvements
£m
Fixtures, fittings and equipment
£mTotal
£m
Cost
At 1 April 2017 12.2 9.8 22.0Additions 0.3 1.4 1.7Disposals (0.2) (0.6) (0.8)Exchange differences (1.0) (0.8) (1.8)At 31 March 2018 11.3 9.8 21.1Additions 2.4 2.0 4.4
Disposals (0.2) (3.6) (3.8)
Exchange differences 0.4 0.4 0.8
At 31 March 2019 13.9 8.6 22.5
Depreciation
At 1 April 2017 (3.2) (6.9) (10.1)Depreciation charge for the year 4 (1.1) (0.9) (2.0)Disposals 0.2 0.6 0.8Exchange differences 0.3 0.5 0.8At 31 March 2018 (3.8) (6.7) (10.5)Depreciation charge for the year 4 (1.1) (1.3) (2.4)
Disposals 0.2 3.5 3.7
Exchange differences (0.2) (0.2) (0.4)
At 31 March 2019 (4.9) (4.7) (9.6)
Carrying Amount
At 31 March 2018 7.5 3.1 10.6At 31 March 2019 9.0 3.9 12.9
NOTES TO THE CONSOLIDATED FINANCIAL STATEMENTS CONTINUEDfor the year ended 31 March 2019
eOne Annual Report and Accounts 2019156

17. InventoriesAccounting policy
Inventories are stated at the lower of cost, including direct expenditure and other appropriate attributable costs incurred in bringing inventories to their present location and condition, and net realisable value. The cost of inventories is calculated using the weighted average method. Net realisable value is the estimated selling price in the ordinary course of business, less estimated costs of completion and the estimated costs necessary to make the sale.
Amounts recognised by the Group31 March 2019
£m31 March 2018
£m
Finished good
At cost 7.5 34.6At net realisable value 4.2 5.0
Total 11.7 39.6
During the period the Group recorded a £26.1 million write down of inventory associated with the home entertainment business. Refer to Note 7 for further details.
18. Investment in acquired content rightsAccounting policy
In the ordinary course of business the Group contracts with television and film programme producers to acquire content rights for exploitation. Some of these agreements require the Group to pay minimum guaranteed advances (MGs). MGs are recognised in the consolidated balance sheet when a liability arises, usually on delivery of the television or film programme to the Group.
Investments in acquired content rights are recorded in the consolidated balance sheet if such amounts are considered recoverable against future revenues. These amounts are amortised to cost of sales using a model that reflects the consumption of the asset as it is released through different exploitation windows (e.g. broadcast licences, theatrical release and home entertainment) and the expected revenue earned in each of those stages of release over a period not exceeding 10 years from the date of its initial release, unless it arises from revaluation on acquisition of subsidiaries in which case it is charged to administrative expenses. Acquired libraries are amortised over a period not exceeding 20 years. Amounts capitalised are reviewed at least quarterly and any portion of the unamortised amount that appears not to be recoverable from future net revenues is written off to cost of sales during the period the loss becomes evident.
Balances are included within current assets as they are expected to be realised within the normal operating cycle of the Family & Brands and Film, Television & Music businesses. The normal operating cycle of these businesses can be greater than 12 months. In general 65%-75% of television and film programme content is amortised within 12 months of theatrical release/delivery.
Key source of estimation uncertainty
The Group is required to exercise judgement in estimating future revenue forecasts for its underlying programmes. These forecasts are based on the revenue generated from other similar programmes, actual performance to date of the programmes and the expectation of future revenue generated over the remaining useful life. The future revenue forecasts are reviewed at least quarterly and any changes to forecasts are treated prospectively as of the beginning of the financial year during which the forecasts are revised. Sensitivities are considered as part of the respective programme level forecasts.
Due to the varied nature of the productions, a sensitivity analysis on the overall balance of investment in acquired content rights is not considered to be meaningful.
SR
G
FS
157entertainmentone.com

18. Investment in acquired content rights continuedAmounts recognised by the Group
Note
Year ended 31 March 2019
£m
Restated Year ended
31 March 2018 £m
Balance at 1 April 248.0 265.4Additions 99.5 107.0Amortisation charge for the year 4 (84.0) (113.4)Impairment charge for the year 4 (15.6) –Exchange differences 6.1 (11.0)Balance at 31 March 254.0 248.0
There was an impairment charge recognised during the year ended 31 March 2019 of £15.6 million (2018: £nil) in relation to our home entertainment business. Refer to Note 7 for details.
19. Trade and other receivablesAccounting policy
Trade receivables are generally not interest-bearing and are stated initially at their fair value as reduced by appropriate allowances for estimated irrecoverable amounts. Due to the short-term nature of the current receivables, their carrying amount is considered to be the same as their fair value.
Amounts are recognised as non-current when the balance is recoverable in a period of greater than 12 months from the reporting date.
Contract assets represent amounts for which the Group has a right to consideration in respect of unbilled amounts from contracts with customers where the performance obligations have been satisfied at the balance sheet date.
The Group measures the provision at an amount equal to lifetime expected credit losses, estimated by reference to past experiences and relevant forward looking factors.
Analysis of amounts recognised by the Group
Non-current Note31 March 2019
£m
Restated 31 March 2018
£m
Financial assets
Trade receivables 3, 28 13.4 7.9Contract assets 3, 28 31.4 67.2Other receivables 28 1.1 1.1Less: Provision for doubtful debts 28 (0.2) –
Net receivables 28 45.7 76.2Prepayments 1.2 0.8Total 46.9 77.0
Current
Financial assets
Trade receivables 3, 28 156.4 112.7Contract assets 3, 28 232.5 172.0Amounts owed from joint ventures 0.1 0.2Other receivables 28 91.9 47.6Less: Provision for doubtful debts 28 (5.4) (3.0)
Net receivables 28 475.5 329.5Prepayments 28.3 32.8Tax credits receivable 44.6 77.1Total 548.4 439.4
NOTES TO THE CONSOLIDATED FINANCIAL STATEMENTS CONTINUEDfor the year ended 31 March 2019
eOne Annual Report and Accounts 2019158

The loss allowance as at 31 March 2019 and 1 April 2018 (on adoption of IFRS 9) was determined as follows:
31 March 2019Current
£m
Less than 60 days
£m
Between 60 and 90 days
£m
More than 90 days
£mTotal
£m
Gross carrying amount Trade receivables 82.6 43.7 5.8 37.7 169.8
Contract assets 263.9 – – – 263.9
Amounts owed from joint ventures 0.1 – – – 0.1
Other receivables 87.5 0.7 0.3 4.5 93.0
Loss allowance (1.8) (0.4) (0.1) (3.3) (5.6)
31 March 2018Current
£m
Less than 60 days
£m
Between 60 and 90 days
£m
More than 90 days
£mTotal
£m
Gross carrying amountTrade receivables 96.5 8.0 5.7 10.4 120.6Contract assets 239.2 – – – 239.2Amounts owed from joint ventures 0.2 – – – 0.2Other receivables 46.7 – – 2.0 48.7
Loss allowance (2.5) (0.2) (0.3) (2.2) (5.2)
The closing loss allowances for trade receivables and contract assets as at year end reconcile to the opening loss allowances as follows:
Year ended 31 March 2019
£m
Year ended 31 March 2018
£m
Balance at 1 April (3.0) (2.3)Amounts restated through opening retained earnings (2.2) –Opening loss allowance calculated under IFRS 9 (5.2) (2.3)Provision recognised in the year (1.9) (1.7)Provision reversed in the year 0.2 0.2Utilisation of provision 1.4 0.6Exchange differences (0.1) 0.2Balance at 31 March (5.6) (3.0)
There was an impairment charge recognised during the year ended 31 March 2019 of £14.4 million (2018: £nil) in relation to our home entertainment business. Refer to Note 7 for details. This has not been included in the table above.
Management has credit policies in place and the exposure to credit risk is monitored by individual operating businesses on an ongoing basis. Refer to Note 28 for further details on the Group’s exposure to credit risk.
Trade and other receivables are held in the following currencies at year end. Amounts held in currencies other than pounds sterling have been converted at their respective exchange rates ruling at the balance sheet date.
Pounds sterling
£meuros
£m
Canadian dollars
£mUS dollars
£mOther
£mTotal
£m
Current 55.4 61.2 79.2 329.9 22.7 548.4
Non-current 5.4 1.5 3.6 33.6 2.8 46.9
At 31 March 2019 60.8 62.7 82.8 363.5 25.5 595.3
Current 51.2 29.4 126.7 216.3 15.8 439.4Non-current 4.6 4.3 7.8 60.3 – 77.0At 31 March 2018 restated 55.8 33.7 134.5 276.6 15.8 516.4
SR
G
FS
159entertainmentone.com

20. Cash and cash equivalentsAccounting policy
Cash and cash equivalents in the consolidated balance sheet comprise cash at bank and in hand. Bank overdrafts are shown within borrowings in current liabilities on the consolidated balance sheet.
Analysis of amounts recognised by the Group
Production financing facilities are secured by the assets and future revenue of the individual production subsidiaries and are non-recourse to other Group companies or assets. Until the loans are repaid, cash held only for production financing relates to cash at bank and in hand held by production subsidiaries and can only be used for investment in the specified productions and repayment of the specific production financing facility.
Cash and cash equivalents are held in the following currencies at 31 March 2019 and 2018. Amounts held in currencies other than pounds sterling have been converted at their respective exchange rates ruling at the balance sheet date. The directors consider the carrying amount of cash and cash equivalents is the same as their fair value.
Note31 March 2019
£m31 March 2018
£m
Cash:Pounds sterling 7.6 4.7euros 5.1 3.4Canadian dollars 14.0 14.4US dollars 78.8 94.5Australian dollars 1.7 2.0Other 0.2 0.2
Cash and cash equivalents per the consolidated balance sheet 28 107.4 119.2
Held repayable only for production financing 55.8 58.1Other 51.6 61.1Cash and cash equivalents 107.4 119.2
The Group had no cash equivalents at either 31 March 2019 or 2018.
21. Trade and other payablesAccounting policy
Trade payables are generally not interest-bearing and are stated at amortised cost.
Contract liabilities represent the obligation to transfer goods or services to a customer for which consideration has been received, or consideration is due from the customer.
The potential cash payments related to put options issued by the Group over the non-controlling interest of subsidiary companies are accounted for as financial liabilities. The amount that may become payable under the option on exercise is initially recognised on acquisition at present value with a corresponding charge directly to equity. Such options are subsequently measured at amortised cost, using the effective interest rate method, to accrete the liability up to the amount payable under the option at the date at which it first becomes exercisable; the charge arising is recorded as a financing cost. If the option expires unexercised, the liability is derecognised with a corresponding adjustment to equity.
Amounts are recognised as non-current when the Group has an unconditional right to defer settlement of the balance in a period of greater than 12 months from the reporting date.
NOTES TO THE CONSOLIDATED FINANCIAL STATEMENTS CONTINUEDfor the year ended 31 March 2019
eOne Annual Report and Accounts 2019160

Analysis of amounts recognised by the Group
Current Note31 March 2019
£m
Restated 31 March 2018
£m
Trade payables 28 74.9 49.7Accruals 345.1 369.5Contract liabilities 3 92.9 67.8Payable to joint ventures 0.2 0.2Contingent consideration payable 28 5.3 2.5Other payables 28 10.9 11.7Total 529.3 501.4
Non-current
Accruals 0.5 0.5Contract liabilities 3 0.5 0.4Put liabilities on partly owned subsidiaries 28 14.6 27.1Total 15.6 28.0
Trade and other payables principally comprise amounts outstanding for trade purchases and ongoing costs. For most suppliers no interest is charged, but for overdue balances interest may be charged at various interest rates.
The movements in contingent consideration payable during the year ended 31 March 2019 were as follows:Sierra Affinity
£mDualtone
£mLast Gang
£mMGC
£mTotal
£m
At 1 April 2018 0.1 0.2 1.1 1.1 2.5Additions during the year – – – 4.1 4.1
Utilised during the year – (0.3) – – (0.3)
Reversed during the year (0.1) – (1.1) – (1.2)
Exchange differences – 0.1 – 0.1 0.2
At 31 March 2019 – – – 5.3 5.3
Expected payment period N/A N/A N/A 2019/20Total maximum consideration £m N/A N/A N/A 28.4
Shown in the consolidated balance sheet as:Current – – – 5.3Non-current – – – –
The maximum contractual consideration payable is calculated undiscounted and using the foreign exchange rates prevailing as at year end.
Trade and other payables are held in the following currencies. Amounts held in currencies other than pounds sterling have been converted at their respective exchange rates ruling at the balance sheet date.
Pounds sterling
£meuros
£m
Canadian dollars
£mUS dollars
£mOther
£mTotal
£m
Current 104.8 29.8 71.7 315.2 7.8 529.3
Non-current 1.0 – 0.3 14.3 – 15.6
At 31 March 2019 105.8 29.8 72.0 329.5 7.8 544.9
Current 100.5 26.5 92.2 275.2 7.0 501.4Non-current – – – 27.9 0.1 28.0At 31 March 2018 restated 100.5 26.5 92.2 303.1 7.1 529.4
The directors consider that the carrying amount of trade and other payables approximates to their fair value.
SR
G
FS
161entertainmentone.com

22. ProvisionsAccounting policy
Provisions are recognised when the Group has a present obligation, legal or constructive, as a result of a past event, where the obligation can be estimated reliably, and where it is probable that an outflow of economic benefits will be required to settle that obligation. Provisions are measured at the directors’ best estimate of the expenditure required to settle the obligation at the balance sheet date, and are discounted to present value where the effect is material. Where discounting is used, the increase in the provision due to unwinding the discount is recognised as a finance expense.
Amounts recognised by the GroupOnerous
contracts £m
Restructuring and redundancy
£mOther
£mTotal
£m
At 1 April 2017 1.6 30.4 0.1 32.1Provisions recognised in the year 0.2 7.0 – 7.2Provisions reversed in the year – (0.3) – (0.3)Utilisation of provisions (1.0) (30.1) – (31.1)Exchange differences (0.2) (1.4) – (1.6)At 31 March 2018 0.6 5.6 0.1 6.3Acquisitions of subsidiaries – – 0.1 0.1
Provisions recognised in the year – 6.1 0.6 6.7
Utilisation of provisions (0.5) (8.2) (0.1) (8.8)
Exchange differences 0.1 0.3 (0.1) 0.3
At 31 March 2019 0.2 3.8 0.6 4.6
Shown in the consolidated balance sheet as:Non-current – 0.4 – 0.4
Current 0.2 3.4 0.6 4.2
Onerous contractsOnerous contracts represent provisions in respect of onerous leasehold property leases which comprise onerous commitments on leasehold properties that were expected to be utilised over the remaining contract period. These provisions are expected to be utilised within one year (2018: two years) from the balance sheet date.
Restructuring and redundancyRestructuring and redundancy provisions represent future cash flows related to the cost of redundancy plans, outplacement, supplementary unemployment benefits and senior staff benefits. Such provisions are only recognised when restructuring or redundancy programmes are formally adopted and announced publicly and the general recognition criteria of IAS 37 Provisions, Contingent Liabilities and Contingent Assets are met. These provisions are expected to be utilised within two years (2018: two years) from the balance sheet date.
OtherOther primarily includes provisions for inventory destruction arising from the impairments recorded in relation to our home entertainment business. These provisions are expected to be utilised within one year.
NOTES TO THE CONSOLIDATED FINANCIAL STATEMENTS CONTINUEDfor the year ended 31 March 2019
eOne Annual Report and Accounts 2019162

23. Interest-bearing loans and borrowingsAccounting policy
All interest-bearing loans and borrowings are initially recognised at the fair value of the consideration received less directly attributable transaction costs, with subsequent measurement at amortised cost using the effective interest rate method. Under the amortised cost method, the difference between the amount initially recognised and the redemption value is recorded in the income statement over the period of the borrowing on an effective interest rate basis.
The combination of the Group’s non-amortising, fixed-rate debt financing and revolving credit facility provides the Group with a long-term capital structure appropriate for its strategic ambitions. In addition, the financing structure permits flexibility when undertaking acquisitions and other corporate activity, and allows the Group to react swiftly to commercial opportunities.
Amounts recognised by the Group31 March 2019
£m31 March 2018
£m
Bank borrowings 42.7 23.8Senior secured notes 355.0 355.0Bank overdrafts 0.3 –Deferred finance charges net of premium on senior secured notes (5.9) (5.7)Other 1.0 2.5Interest bearing loans and borrowings 393.1 375.6Cash and cash equivalents (other than those held by production subsidiaries) (51.6) (61.1)Net debt 341.5 314.5
Shown in the consolidated balance sheet as:Non-current 392.2 375.2Current 0.9 0.4
Fair value considerations for the senior secured notes are disclosed in Note 26. The weighted average interest rates on all bank borrowings are not materially different from their nominal interest rates. The weighted average interest rate on all interest-bearing loans and borrowings is 6.5% (2018: 6.5%).
Bank borrowings
During the year the Group refinanced its super senior revolving credit facility (“RCF”). The new facility matures in December 2023. Any amounts still outstanding at such date must be repaid in full provided that some or all of the lenders under the RCF may elect to extend their commitments subject to terms and conditions to be agreed among the relevant parties.
The RCF is subject to a number of financial covenants including interest cover charge, and net debt against underlying EBITDA.
At 31 March 2019, the Group had available £156.8 million of undrawn committed bank borrowings under the RCF (2018: £134.4 million), consisting of funds available in Canadian dollars, euros, pounds sterling and US dollars. The directors consider that the carrying amount of the drawn bank borrowings at 31 March 2019 approximates its fair value.
The RCF is secured against the assets of various Group subsidiaries which make up the ‘Restricted group’.
Subsequent to the financial year end the Group entered into a term loan maturing on 31 December 2020 to support the acquisition of Audio Network Limited. The term loan is subject to the same covenants as the Group’s RCF. Refer to Note 36.
SR
G
FS
163entertainmentone.com

23. Interest-bearing loans and borrowings continuedSenior secured notes
The Group has issued £355.0 million senior secured notes (Notes) bearing interest at a rate of 6.875% per annum which mature in December 2022.
The Notes are subject to a number of financial covenants including interest cover charge and gross debt against underlying EBITDA.
The fair value of the Notes as at 31 March 2019 is £366.3 million (2018: £377.6 million).
The Notes are secured against the assets of various Group subsidiaries which make up the ‘Restricted group’ and rank pari passu with the revolving credit facility.
Deferred finance charges
The Group capitalised fees of £2.3 million during the year associated with the refinancing of the RCF. The fees were capitalised to the consolidated balance sheet and are amortised using the effective interest rate method. The remaining value of deferred finance changes from the previous RCF of £1.4 million have been written off and a charge has been recorded as a financing one-off costs, refer Note 8.
Premium on senior secured notes
During the prior year ended 31 March 2018 the Group issued £70.0 million of Notes for a premium of £4.0 million. The premium has been netted off from deferred finance charges in the table above and will be amortised using the effective interest rate method.
Foreign currencies
The carrying amounts of the Group’s gross borrowings at year end are denominated in the following currencies. Amounts held in currencies other than pounds sterling are converted at their respective exchange rates ruling at the balance sheet date.
Pounds sterling
£m
Canadian dollars
£mUS dollars
£meuros
£mTotal
£m
Bank borrowings – 6.5 24.1 12.1 42.7
Senior secured notes 355.0 – – – 355.0
Other 0.3 0.5 0.5 – 1.3
At 31 March 2019 355.3 7.0 24.6 12.1 399.0
Bank borrowings – 7.6 16.2 – 23.8Senior secured notes 355.0 – – – 355.0Other – 0.4 2.1 – 2.5At 31 March 2018 355.0 8.0 18.3 – 381.3
The following are the movements in the Group’s financing liabilities during the year.
Bank borrowings
£m
Senior secured notes
£m
Other loans including
overdrafts £m
Total £m
At 1 April 2017 – 285.0 0.5 285.5Drawdowns 302.6 70.0 2.1 374.7Repayments (269.7) – – (269.7)Exchange differences (9.1) – (0.1) (9.2)At 31 March 2018 23.8 355.0 2.5 381.3Drawdowns 372.0 – 0.8 372.8
Repayments (355.1) – (2.1) (357.2)
Exchange differences 2.0 – 0.1 2.1
At 31 March 2019 42.7 355.0 1.3 399.0
NOTES TO THE CONSOLIDATED FINANCIAL STATEMENTS CONTINUEDfor the year ended 31 March 2019
eOne Annual Report and Accounts 2019164

24. Production financingAccounting policy
Production financing relates to short-term financing for the Group’s productions. Interest on production finance which is directly attributable to the acquisition or production of a qualifying asset forms part of the cost of that asset and is capitalised.
Amounts recognised by the Group
Production financing is used to fund the Group’s productions. The financing is arranged on an individual production basis by special purpose production subsidiaries which are excluded from the security of the Group’s corporate facility.
Production financing facilities are secured by the assets and future revenue of the individual production subsidiaries and are non-recourse to other Group companies or assets.
It is short-term financing, typically having a maturity of less than two years, whilst the title is in production and is repaid once delivered and the government subsidies, tax credits, broadcaster pre-sales and international sales have been received.
The Company considers this type of financing to be short term in nature and it is excluded from net debt. The Company therefore shows the cash flows associated with these activities separately. In connection with the production of a television or film programme, the Group typically records initial cash outflows due to its investment in the production and concurrently records initial positive cash inflows from the production financing it normally obtains.
Note31 March 2019
£m31 March 2018
£m
Production financing held by production subsidiaries 192.4 171.9Other loans 3.5 4.9Production financing 195.9 176.8Cash and cash equivalents (held by production subsidiaries) 20 (55.8) (58.1)Production financing (net of cash) 140.1 118.7
Production financing shown in the consolidated balance sheet as:Non-current 110.2 86.7Current 85.7 90.1
Fair value considerations are disclosed in Note 26. Interest is charged at bank prime rate plus a margin. The weighted average interest rate on all production financing is 5.0% (2018: 3.9%).
The Group has Canadian dollar and US dollar production credit facilities with various banks. Amounts held in currencies other than pounds sterling have been converted at their respective exchange rates ruling at the balance sheet date. The carrying amounts are denominated in the following currencies:
Pounds sterling
£m
Canadian dollars
£mUS dollars
£mTotal
£m
At 31 March 2019 – 85.6 110.3 195.9
At 31 March 2018 10.2 64.6 102.0 176.8
The following are the movements in the Group’s production financing and other loans during the year.Production
financing £m
Other loans £m
Total £m
At 1 April 2017 190.8 5.2 196.0Drawdowns 234.4 0.3 234.7Repayments (233.9) – (233.9)Exchange differences (19.4) (0.6) (20.0)At 31 March 2018 171.9 4.9 176.8Drawdowns 224.5 0.8 225.3
Repayments (211.8) (2.5) (214.3)
Exchange differences 7.8 0.3 8.1
At 31 March 2019 192.4 3.5 195.9
SR
G
FS
165entertainmentone.com

25. Derivative financial instruments & hedgingAccounting policy
The Group may use derivative financial instruments to reduce its exposure to foreign exchange and interest rate movements. The Group does not hold or issue derivative financial instruments for financial trading purposes.
Derivative financial assets and liabilities are recognised when the Group becomes a party to the contractual provisions of the instrument.
Derivative financial instruments are classified as fair value through profit and loss and recognised in the consolidated balance sheet at fair value. Derivatives designated as hedging instruments are classified within their intended hedging relationship as either a cash flow hedge, net investment hedge or fair value hedge. Changes in the fair value of derivatives designated as cash flow hedges are recognised in other comprehensive income to the extent that they are deemed effective. Ineffective portions are immediately recognised in the consolidated income statement. When the hedged item affects profit or loss, then the amounts deferred in equity are recycled to the consolidated income statement when the highly probable forecast transaction has occurred. Where the hedged item results in an asset, the fair value change in the hedge instrument is included in the cost of the asset.
Hedge instruments designated within a fair value hedge record the change in the fair value in the consolidated income statement, along with the changes in the fair value of the hedged asset or liability. Changes in the fair value of any derivative instruments that do not qualify for hedge accounting are immediately recognised in the consolidated income statement.
Analysis of amounts recognised by the Group
Note31 March 2019
£m31 March 2018
£m
Derivative financial assets 26 0.9 1.1Derivative financial liabilities 26 (3.5) (2.7)
(2.6) (1.6)
Hedging activities and derivatives
The Group is exposed to certain risks relating to its ongoing business operations. The primary risk managed using derivative instruments is foreign currency risk.
The Group’s risk management strategy and how it is applied is explained in Note 28.
Cash flow hedgesForeign exchange forward contracts are designated as hedging instruments in cash flow hedges of forecast purchases in the Group’s operating currencies. Most of these contracts are denominated in the subsidiaries’ functional currency and primarily cover minimum guaranteed advances (MOS) payments in the US, Canada, the UK, Australia, the Benelux, Germany and Spain. These forecast transactions are highly probable, and they comprise payments of minimum guarantees. The foreign exchange forward contract balances vary with the level of expected foreign currency purchases and changes in foreign exchange forward rates.
The hedge ineffectiveness can arise from:• Differences in the timing of the cash flows of the hedged items and the hedging instruments• Different indexes (and accordingly different curves) linked to the hedged risk of the hedged items and hedging instruments• The counterparties’ credit risk differently impacting the fair value movements of the hedging instruments and hedged items• Changes to the forecasted amount of cash flows of hedged items and hedging instruments
There is an economic relationship between the hedged items and the hedging instruments as the terms of the foreign exchange forward contracts match the terms of the expected highly probable forecast transactions (i.e. notional amount and expected payment date). The Group has established a hedge ratio of 1:1 for the hedging relationships as the underlying risk of the foreign exchange forward contracts are identical to the hedged risk components. To test the hedge effectiveness, the Group uses the critical terms comparison method and compares the changes in the fair value of the hedging instruments against the changes in fair value of the hedged items attributable to the hedged risks.
NOTES TO THE CONSOLIDATED FINANCIAL STATEMENTS CONTINUEDfor the year ended 31 March 2019
eOne Annual Report and Accounts 2019166

The impact of the hedging instruments on the statement of financial position is as follows:
Weighted average
hedged rate
Change in value of the hedging
instrumentssince inception1
£m
Change in value of the hedge items
since inception1
£m
Notional amount
CCYm
As at 31 March 2019
Buy/(Sell) foreign exchange contracts:CAD:AUD 1.05 – – (0.1)
CAD:HUF 210.33 – – 6.2
GBP:CAD 1.76 – – 3.4
GBP:USD 1.26 (0.3) (0.3) 17.7
EUR:CAD 1.51 – – 0.5
EUR:USD 1.16 0.2 0.2 9.5
USD:AUD 1.40 – – (0.8)
USD:CAD 1.32 0.3 0.4 (1.4)
As at 31 March 2018
Buy/(Sell) foreign exchange contracts:CAD:HUF 196.04 – – 0.2GBP:CAD 1.82 (0.2) (0.2) 4.0GBP:EUR 1.14 – – 14.0GBP:USD 1.37 (1.0) (1.0) 52.9EUR:CAD 1.62 – – (0.8)EUR:USD 1.24 (0.1) (0.1) 1.9USD:AUD 1.30 – – (3.6)USD:CAD 1.29 0.2 0.2 (13.9)USD:ZAR 12.50 (0.1) (0.1) (0.4)1. The above table is rounded to the nearest £0.1 million, therefore where the aggregate of the fair value of the open derivative assets or liabilities is below
£50,000 it has been present as £nil.
Other derivativesThe following table provides the fair values of derivatives, at 31 March 2019, where the Group’s operating units have monetary assets and liabilities denominated in currencies other than their respective functional currency. To remove the profit and loss volatility from this mismatch the Group has a programme of entering into currency derivatives to limit the revaluation exposure in the profit and loss.
31 March 2019 31 March 2018Notional
CCYmFair value1
£mAverage FX
rateNominal
CCYmFair value1
£mAverage FX
rate
Buy/(Sell) foreign exchange contracts:
CAD:AUD – – – (23.1) – 1.01GBP:AUD 9.0 (0.2) 1.87 (10.6) (0.1) 1.84GBP:CAD 53.5 (1.1) 1.78 (27.0) (0.2) 1.82GBP:CNY 4.2 (0.1) 8.93 (0.6) – 8.91GBP:EUR (37.1) (0.4) 1.18 (18.4) (0.1) 1.08GBP:USD 54.6 (1.0) 1.33 (27.4) (0.1) 1.28EUR:CAD 14.3 0.1 1.51 10.9 – 1.59EUR:USD 13.2 – 1.13 0.6 – 1.23USD:AUD (2.6) – 1.41 (0.8) – 1.31USD:CAD 34.7 (0.1) 1.33 0.1 0.1 1.291. The above table is rounded to the nearest £0.1 million, therefore where the aggregate of the fair value of the open derivative assets or liabilities is below
£50,000 it has been present as £nil.
Impact of hedging on equityRefer to Note 32 for the movements in the cash flow hedge reserve.
SR
G
FS
167entertainmentone.com

26. Fair value measurementUnder IFRS, fair value measurements are categorised into Level 1, 2 or 3 based on the degree to which the inputs to the fair value measurements are observable and the significance of the inputs to the fair value measurement in its entirety, which are described as follows:
Level 1 Fair value measurements are derived from unadjusted quoted prices in active markets for identical assets or liabilities.
Level 2Fair value measurements are derived from inputs, other than quoted prices included within Level 1, that are observable for the asset or liability, either directly (as prices) or indirectly (derived from prices).
Level 3Fair value measurements are derived from valuation techniques that include inputs for the asset or liability that are not based on observable market data.
The following table provides the fair value measurement hierarchy of the Group’s assets and liabilities.
Note
Year ended 31 March 2019
£m
Year ended 31 March 2018
£m
Assets measured at fair valueDerivative financial assets 25 Level 2 0.9 1.1Non-listed equity instruments 25 Level 3 3.2 0.8
Liabilities measured at fair valueDerivative financial liabilities 25 Level 2 (3.5) (2.7)Contingent consideration payable 21 Level 3 – (2.5)
Liabilities for which fair values are disclosedSenior secured notes 23 Level 1 366.3 377.6Total 366.9 374.3
The key assumptions taken into consideration when measuring the value of contingent consideration payable are the performance expectations of the acquisition and a discount rate that reflects the size and nature of the new business. There is no reasonable change in discount rate or performance targets that would give rise to a material change in the liability in these consolidated financial statements.
The key assumption in measuring the value of the non-listed equity instruments is the long-term performance of the investment. There is no reasonable change in the performance of the investments that would give rise to a material change in the assets in these consolidated financial statements.
During the year the Group subscribed to shares in WCI One, LLC (trading as NewTV) for a total of £2.1 million. Under the purchase agreement the Group is committed to contribute total equity of US$10 million (equivalent to £7.6 million at 31 March 2019). An additional £0.2 million was paid to acquire an equity interest of 6.9% in Creative Labs L.P. and the total commitment is for US$1 million (equivalent to £0.8 million at 31 March 2019).
Valuation techniques and inputs
The following methods and assumptions were used to estimate the above fair values:Valuation technique and key inputs
Level 1:
Senior secured noteThere is an active market for the Group’s quoted debt instruments.
Level 2:
Derivative financial instruments
Discounted cash flow – future cash flows are estimated based on forward exchange rates (from observable forward exchange rates at the end of the reporting period) and contract forward rates, discounted at a rate that reflects the credit risk of various counterparties.
NOTES TO THE CONSOLIDATED FINANCIAL STATEMENTS CONTINUEDfor the year ended 31 March 2019
eOne Annual Report and Accounts 2019168

The significant unobservable inputs used in the fair value measurements categorised with Level 3, together with qualitative sensitivity analysis, are shown below:
Valuation technique and key inputs Significant unobservable inputRelationship of unobservable inputs to fair value
Level 3:
Non-listed equity instruments
Income approach – in this approach, the discounted cash flow method was used to capture the present value of the expected future economic benefits to be derived from the ownership of these investees.
Long-term performance of the non-listed equity instruments, taking into account management’s experience and knowledge of market conditions of the specific industries.
The greater the cash generation of the investment over time, the higher the fair value.
27. Business combinations and transactions with equity holdersAccounting policy
Business combinations are accounted for using the acquisition method. The consideration transferred in a business combination is measured at fair value, which is calculated as the sum of the acquisition-date fair values of assets transferred by the Group, liabilities incurred by the Group to the former owners of the acquiree and the equity interest issued by the Group in exchange for control of the acquiree. Acquisition-related costs are written off in the consolidated income statement as incurred.
Goodwill arising on a business combination is recognised as an asset and initially measured at cost, being the excess of the aggregate of the consideration transferred and the amount recognised for non-controlling interests over the fair value of net identifiable assets acquired (including other intangible assets) and liabilities assumed. If this consideration is lower than the fair value of the net assets of the subsidiary or business acquired, any negative goodwill is recognised immediately in the consolidated income statement.
Any contingent consideration to be transferred by the acquirer is recognised at fair value at the acquisition date. Subsequent changes to the fair value of the contingent consideration which is deemed to be an asset or liability are recognised either in the consolidated income statement or as a change to the consolidated income statement.
Contingent payments made to selling shareholders, to the extent they are linked to continuing service conditions, are treated as remuneration and expensed within the consolidated income statement. The Group considers such payments to be capital in nature and they are recognised as an adjustment to the Group’s underlying EBITDA.
When a business combination is achieved in stages, the Group’s previously-held interest in the acquired entity is remeasured to its acquisition date fair value and the resulting gain or loss, if any, is recognised in the consolidated income statement. Amounts arising from interests in the acquiree prior to the acquisition date that have previously been recognised in other comprehensive income are reclassified to the consolidated income statement, where such treatment would be appropriate if that interest were disposed of.
Transactions that result in changes in ownership interests while retaining control are accounted for as transactions with equity holders in their capacity as equity holders. As a result, no gain or loss on such changes is recognised in profit or loss; instead, it is recognised in equity. Also, no change in carrying amount of assets (including goodwill) or liabilities is recognised as a result of such transactions.
Year ended 31 March 2019
AcquisitionsThe Group acquired 70.1% stake in Whizz Kid Entertainment Limited (“Whizz Kid”), a UK based unscripted television production company, on 9 April 2018 for a total consideration of £6.9 million settled by a cash payment of £5.0 million and by issuing 637,952 shares in Entertainment One Ltd. amounting to £1.9 million. Acquired intangibles of £0.7 million were identified which represent the value of television show concepts and back-end royalties following the end of a series production. The resultant goodwill represents the value placed on the opportunity to grow the content and formats produced by the company. None of the goodwill is expected to be tax deductible for income tax purposes.
The Group acquired 100% of Magnolia Record Club LLC (“Magnolia”) on 26 July 2018 for a consideration of £0.3 million. Acquired intangibles were identified on the acquisition relating to existing customer lists and brand names.
The results of both acquisitions have been presented within the Film, Television & Music segment, and contributed £6.8 million to segment revenue and £0.2 million to underlying EBITDA for the period since acquisition.
SR
G
FS
169entertainmentone.com

27. Business combinations and transactions with equity holders continuedThe following table summarises the fair values, as at the acquisition date, of the assets acquired, the liabilities assumed and the total consideration transferred as part of the acquisitions made during the year.
Final Whizz Kid
£m
Final Magnolia
£mTotal
£m
Acquired intangibles 0.7 0.3 1.0
Trade and other receivables 1.3 – 1.3
Cash and cash equivalents 3.6 – 3.6
Trade and other payables (3.8) – (3.8)
Current tax liabilities (0.4) – (0.4)
Provisions (0.1) – (0.1)
Total net assets acquired 1.3 0.3 1.6
Group’s proportionate interest of fair value of net assets acquired 70.1% 100.0%
Group’s share of fair value of net assets acquired 0.9 0.3 1.2
Goodwill 6.0 – 6.0
Net assets acquired 6.9 0.3 7.2
Satisfied by:Cash 5.0 0.3 5.3
Shares in Entertainment One Ltd. 1.9 – 1.9
Total consideration transferred 6.9 0.3 7.2
The net cash outflow arising in the period from the acquisition was made up of:Cash consideration settled during the year 5.0 0.3 5.3
Less: Cash and cash equivalents acquired (3.6) – (3.6)
Total net cash outflow 1.4 0.3 1.7
Non-controlling interests’ proportionate interest of fair value of net assets 0.4 – 0.4
Total non-controlling interests 0.4 – 0.4
Settlement of contingent considerationDuring the year, contingent consideration payable relating to the prior year acquisition of Dualtone Music Group a payment of £0.3 million was settled. See Note 21 for details on movements in contingent consideration payable.
Transactions with equity holders
Sierra PicturesOn 27 June 2018, the Group acquired the remaining 49% in Sierra Pictures, LLC (“Sierra/Affinity”) for a total consideration of £14.2 million settled by a cash payment of £9.7 million and by issuing 1,231,768 shares in Entertainment One Ltd. amounting to £4.5 million.
The carrying value of the non-controlling interest in Sierra/Affinity on 27 June 2018 amounting to £8.6 million was de-recognised and transaction costs of £0.1 million were recorded as a charge to the Group’s retained earnings. The currency translation reserve relating to the previous non-controlling interest of £1.2 million has been transferred to the Group. The difference of £6.7 million has been recognised as a charge to the Group’s retained earnings.
As a result of the acquisition, the put and call options granted over the 49% shares have been cancelled. The carrying value of the liability as at 27 June 2018 of £17.9 million has been reversed with the corresponding adjustment to the put option reserve of £12.2 million. The difference has been credited to a one-off finance income of £5.7 million, see Note 8.
The Mark Gordon CompanyAs part of the Group’s acquisition of the remaining 49% in The Mark Gordon Company on 2 March 2018 the vendors were entitled to receive a pro-rata share of certain pre-acquisition contingent receipts where these could be recovered. Due to this arrangement the Group recognised a further £4.1 million in consideration for the transaction during the year.
NOTES TO THE CONSOLIDATED FINANCIAL STATEMENTS CONTINUEDfor the year ended 31 March 2019
eOne Annual Report and Accounts 2019170

Year ended 31 March 2018
AcquisitionsThe Group acquired 60% of Round Room Entertainment, LLC on 31 January 2018 for a consideration of £0.5 million. No acquired intangibles were identified on the acquisition.
Settlement of contingent considerationDuring the year, contingent consideration payable relating to the prior year acquisition of Renegade Entertainment, LLC was settled by issuing 778,516 shares in Entertainment One Ltd. amounting to £1.8 million and a cash payment of £2.7 million. A payment of £0.5 million was also made in part settlement of contingent consideration payable relating to the prior year acquisition of Dualtone Music group. See Note 21 for details on movements in contingent consideration payable in the year ended 31 March 2018.
Transactions with equity holdersOn 2 March 2018, the Group acquired the remaining 49% in The Mark Gordon Company (“MGC”) for a total consideration of £146.5 million settled by a cash payment of £114.8 million and by issuing 10,826,566 shares in Entertainment One Ltd. amounting to £31.7 million. In addition, the seller will be entitled to a maximum aggregate amount of £26.6 million (US$37.5 million) in respect of its pro-rata share of certain pre-acquisition contingent receipts, if actually received by MGC.
The carrying value of the non-controlling interest in MGC on 2 March 2018 of £37.0 million was de-recognised, contingent consideration of £1.1 million was recognised and transaction costs of £0.7 million were recorded and the difference of £111.3 million has been recognised as a charge to the Group’s retained earnings.
28. Financial risk managementThe Group’s overall risk management programme seeks to minimise potential adverse effects on its financial performance and focuses on mitigation of the unpredictability of financial markets as they affect the Group.
The Group’s activities expose it to certain financial risks including interest rate risk, foreign currency risk, credit risk and liquidity risk. These risks are managed by the Chief Financial Officer under policies approved by the Board, which are summarised below.
Interest rate risk management
When the Group is exposed to fluctuating interest rates the Group considers whether to fix portions of debt using interest rate swaps, in order to optimise net finance costs and reduce excessive volatility in reported earnings. Requirements for interest rate hedging activities are monitored on a regular basis.
Interest rate sensitivityThe Group holds £355.0 million in aggregate principal amount of 6.875% senior secured notes (Notes), due December 2022, and a super senior revolving credit facility (RCF), which matures in December 2023.
At 31 March 2019, the Group’s fixed rate debt represented 89% of total gross debt (2018: 93%). Consequently, a 1% movement in interest rates on floating rate debt would impact the 2019 post-tax profit for the year by less than £0.4 million (2018: £0.3 million).
For financial assets and liabilities classified at fair value through profit or loss, the movements in the year relating to changes in fair value and interest are not separated.
Foreign currency risk management
The Group is exposed to exchange rate fluctuations because it undertakes transactions denominated in foreign currency and it is exposed to foreign currency translation risk through its investment in overseas subsidiaries.
The Group manages transactions with foreign exchange exposures by undertaking foreign currency hedging using forward foreign exchange contracts for significant transactions (principally minimum guaranteed advanced payments). The implementation of these forward contracts is based on highly probable forecast transactions and qualifies for cash flow hedge accounting. The Group further manages its transactional exposure to fair value movements on foreign currency denominated monetary assets and liabilities through using forward foreign exchange contracts.
The majority of the Group’s operations are domestic within their country of operation. The Group seeks to create a natural hedge of this exposure through its policy of aligning approximately the currency composition of its net borrowings with its forecast operating cash flows.
The Group does not hedge net investment in operations with non-GBP functional currencies.
SR
G
FS
171entertainmentone.com

28. Financial risk management continuedForeign exchange rate sensitivityThe following table illustrates the Group’s sensitivity to foreign exchange rates on its derivative financial instruments. Sensitivity is calculated on financial instruments at 31 March 2019 denominated in non-functional currencies for all operating units within the Group. The sensitivity analysis includes only unhedged foreign currency denominated monetary items. The percentage movement applied to each currency is based on management’s measurement of foreign exchange rate risk.
Percentage movement
31 March 2019 Impact on
consolidated income
statement +/- £m
31 March 2018 Impact on
consolidated income
statement +/- £m
10% appreciation of the US dollar 5.9 9.410% appreciation of the Canadian dollar 0.1 (0.9)10% appreciation of the euro 0.4 0.310% appreciation of the Australian dollar 0.1 0.2
Credit risk management
Credit risk arises from cash and cash equivalents, deposits with banks and financial institutions, as well as credit exposures to customers, including outstanding receivables and committed transactions. The Group manages credit risk on cash and deposits by entering into financial instruments only with highly credit-rated, authorised counterparties which are reviewed and approved regularly by management. Counterparties’ positions are monitored on a regular basis to ensure that they are within the approved limits and there are no significant concentrations of credit risk. Trade receivables consist of a large number of customers spread across diverse geographical areas. Ongoing credit evaluation is performed on the financial condition of counterparties.
As at 31 March 2019 the Group had three customers (2018: two) that owed the Group more than 5% of the Group’s total amounts receivable. These three customers accounted for approximately 42% of the total amounts receivable (2018: 32%).
The Group considers its maximum exposure to credit risk as follows:
Note
Year ended 31 March 2019
£m
Restated Year ended
31 March 2018 £m
Cash and cash equivalents 20 107.4 119.2Net trade receivables 19 521.2 405.7Total 628.6 524.9
Liquidity risk management
The Group maintains an appropriate liquidity risk management position by having sufficient cash and availability of funding through an adequate level of committed credit facilities. Management continuously monitors rolling forecasts of the Group’s liquidity reserve on the basis of expected cash flows in the short, medium and long term. At 31 March 2019, the undrawn committed borrowings under the RCF are equivalent to £156.8 million (2018: £134.4 million). The facility was entered into in December 2018 and matures in 2023 (see Note 23).
NOTES TO THE CONSOLIDATED FINANCIAL STATEMENTS CONTINUEDfor the year ended 31 March 2019
eOne Annual Report and Accounts 2019172

Analysis of the maturity profile of the Group’s financial liabilities including interest payments, which will be settled on a net basis at the balance sheet date, is shown below:
Trade and other payables
£m
Interest bearing
loans andborrowings¹
£m
Production financing
£mTotal
£m
Amounts due for settlement at 31 March 2019
Within one year 91.1 25.2 85.7 202.0
One to two years – 24.3 110.2 134.5
Two to five years 14.6 446.8 – 461.4
After five years – 0.7 – 0.7
Total 105.7 497.0 195.9 798.6
Amounts due for settlement at 31 March 2018
Within one year 63.9 24.7 90.1 178.7One to two years – 24.3 86.7 111.0Two to five years 27.1 454.1 – 481.2After five years – – – –Total 91.0 503.1 176.8 770.91. Amounts for interest-bearing loans and borrowings include interest payments.
Capital risk management
The Group manages its capital to ensure that entities in the Group will be able to continue to trade on a going concern basis while maximising the return to shareholders through the optimisation of its debt to equity ratio. The Group’s overall strategy remains unchanged from previous periods.
The capital structure of the Group consists of net debt, being the interest bearing loans and borrowings disclosed in Note 23 after deducting cash and bank balances which are not held repayable only for production financing (disclosed in Note 20), and equity of the Group (comprising issued capital and reserves disclosed in Note 32 and retained earnings and non-controlling interests).
The Group’s objectives when managing capital are to safeguard its ability to continue as a going concern in order to grow the business, provide returns for shareholders, provide benefits for other stakeholders and optimise the weighted average cost of capital and other capital efficiencies.
The objectives are subject to maintaining sufficient financial flexibility to undertake its investment plans. There are no externally imposed capital requirements. The management of the Group’s capital is performed by the Board. In order to maintain or adjust the capital structure, the Group may issue new shares or sell assets to reduce debt.
SR
G
FS
173entertainmentone.com

29. SubsidiariesThe Group’s principal wholly-owned subsidiary undertakings are as follows:Name Country of incorporation Principal activity
Entertainment One Films Canada Inc. Canada Content ownership and distributionEntertainment One Television International Ltd. Canada Sales and distribution of films and television programmesEntertainment One Television Productions Ltd. Canada Production of television programmesAlliance Films (UK) Limited England and Wales Content ownershipEntertainment One UK Limited England and Wales Content ownership and distributionDeluxe Pictures d/b/a The Mark Gordon Company US Production of film and television programmesEntertainment One Television USA Inc. US Sales and distribution of films and television programmeseOne Features LLC US Content ownershipSierra Pictures, LLC * US Production and international sales of films* As a result of the purchase of the remaining 49% of Sierra Pictures, LLC, it is a wholly owned subsidiary from 27 June 2018. Refer to Note 27 for details.
All of the above subsidiary undertakings are 100% owned and are owned through intermediate holding companies. The proportion held is equivalent to the percentage of voting rights held. See Note 36 for details of post balance sheet reorganisation of operating subsidiaries incorporated in Canada.
All of the above subsidiary undertakings have been consolidated in the consolidated financial statements under the acquisition method of accounting.
Production special purpose entities are not classified as principal subsidiaries.
30. Interest in joint venturesAccounting policy
A joint venture is a type of joint arrangement whereby the parties that have joint control of the arrangement have rights to the net assets of the joint venture. Joint control is the contractually agreed sharing of control of the arrangement, which exists only when decisions about the relevant activities require unanimous consent of the parties sharing control.
The Group’s interests in its joint ventures are accounted for using the equity method. The investment is initially recognised at cost and is subsequently adjusted to recognise changes in the Group’s share of net assets of the associate or joint venture since the acquisition date. The share of results of its joint ventures are shown within single line items in the consolidated balance sheet and consolidated income statement, respectively.
The financial statements of the Group’s joint ventures are generally prepared for the same reporting period as the Group. Where necessary, adjustments are made to bring the accounting policies in line with those of the Group.
Year ended 31 March 2019
Details of the Group’s joint ventures at 31 March 2019 are as follows:Name Country of incorporation Proportion held Principal activity
eOne/Fox Home Ent Distribution Canada Ltd. Canada 50% Home entertainment distributionCreative England-Entertainment One Global Television Initiative Limited
England and Wales 50% Development of television shows
Suite Distribution Limited England and Wales 50% Production of filmsAutomatik Entertainment LLC US 40% Film developmentSquid Distribution LLC US 50% Production of filmsThe Girlaxy LLC US 50% Content ownership and distribution
Contractual arrangements establish joint control over each joint venture listed above. No single venturer is in a position to control the activity unilaterally.
NOTES TO THE CONSOLIDATED FINANCIAL STATEMENTS CONTINUEDfor the year ended 31 March 2019
eOne Annual Report and Accounts 2019174

The movement in the carrying amount of interests in joint ventures in the year was as follows:31 March 2019
£m31 March 2018
£m
Carrying amount of interests in joint ventures 1.0 1.1Group’s share of results of joint ventures for the year – –Foreign exchange 0.2 (0.1)Carrying amount of interests in joint ventures 1.2 1.0
The Group’s share of results of joint ventures for the year of £nil charge (2018: £nil) includes a charge of £nil (2018: £nil charge) relating to the Group’s share of tax, finance costs and depreciation.
The following presents, on a condensed basis, the effects of including joint ventures in the consolidated financial statements using the equity method. Each joint venture is considered individually immaterial to the Group’s consolidated financial statements.
31 March 2019 £m
31 March 2018 £m
Revenue 2.2 2.4Profit for the year 0.2 0.1Profit attributable to the Group – –
Dividends received from interests in joint ventures – –
31. Interest in partly-owned subsidiariesAccounting policy
The consolidated financial statements comprise the financial statements of the Company and its subsidiaries (the Group). Control of the Group’s subsidiaries is achieved when the Group is exposed, or has rights, to variable returns from its involvement with the investee and has the ability to affect those returns through its power over the investee.
The financial statements of the subsidiaries are generally prepared for the same reporting periods as the parent company, using consistent accounting policies. Subsidiaries are fully consolidated from the date of acquisition and continue to be consolidated until the date of disposal or at the point in the future in which the Group ceases to have control of the entity. All intra-group balances, transactions, income and expenses, and unrealised profits and losses resulting from intra-group transactions that are recognised in assets, are eliminated in full.
Principal subsidiaries with non-controlling interests
The Group’s principal subsidiaries that have non-controlling interests are set out below:Name Country of incorporation Proportion held Principal activity
Astley Baker Davies Limited England and Wales 70% Ownership of IPWhizz Kid Entertainment Limited England and Wales 70% Production of television programmesMR Productions Holdings, LLC (Makeready) US 85% Film developmentRenegade Entertainment, LLC (Renegade 83) US 65% Production of television programmesRound Room Live, LLC US 60% Production of live events
As a result of the purchase of the remaining 49% of Sierra Pictures, LLC, it became a wholly owned subsidiary from 27 June 2018 and as a result Sierra Pictures, LLC entities are not included in the table above.
SR
G
FS
175entertainmentone.com

31. Interest in partly-owned subsidiaries continuedThe following presents, on a condensed basis, the effects of including partly-owned subsidiaries in the consolidated financial statements for the years ended:
Year ended 31 March 2019
Astley Baker Davies Limited
£m
SierraPictures¹
£mRenegade 83
£mRound Room
£mMakeready2
£mWhizz Kid3
£mTotal
£m
Revenue 22.1 15.6 36.9 6.1 0.2 6.8 87.7
Profit for the year 9.0 (0.5) 4.9 (0.7) (2.8) (0.1) 9.8
Profit attributable to the Group 6.3 (0.3) 3.2 (0.4) (2.5) (0.1) 6.2
Dividends paid to non-controlling interests 5.0 – 1.8 – – – 6.8
Non-current assets 124.7 – 2.0 (0.1) 24.0 0.5 151.1
Current assets 10.3 – 11.0 1.6 1.7 1.5 26.1
Non-current liabilities (21.5) – – – – (0.1) (21.6)
Current liabilities (2.5) – (4.8) (2.5) (16.2) (0.8) (26.8)
Net assets of partly owned subsidiaries 111.0 – 8.2 (1.0) 9.5 1.1 128.8
Non-controlling interests (33.3) – (2.9) 0.4 (1.4) (0.3) (37.5)
1. As a result of the purchase of the remaining 49% of Sierra Pictures, LLC on 27 June 2018, the above table relating to partly-owned subsidiaries is calculated for the period up to 27 June 2018.
2. Makeready became a partly-owned subsidiary on 17 May 2018 due to the vesting of options held by Brad Weston. The vesting of these options occurred in several tranches, the results presented above reflect the performance attributable to the owners of the Company.
3. The Group’s 70.1% interest in Whizz Kid was acquired on 9 April 2018, the performance in above table is calculated from acquisition date onwards.
Restated Year ended 31 March 2018
Astley Baker Davies Limited
£m
Sierra Pictures
£mRenegade 83
£mRound Room
£m
The Mark Gordon
Company4
£mTotal
£m
Revenue 18.3 88.7 41.8 – 120.5 269.3Profit for the year 6.2 6.3 5.0 (0.2) 16.9 34.2Profit attributable to the Group 4.3 3.2 3.3 (0.1) 8.6 19.3
Dividends paid to non-controlling interests 5.6 0.3 1.5 – – 7.4
Non-current assets 135.6 35.0 2.1 – – 172.7Current assets 8.7 36.6 10.2 – – 55.5Non-current liabilities (22.2) (5.6) – – – (27.8)Current liabilities (3.4) (49.2) (4.6) (0.6) – (57.8)Net assets of partly owned subsidiaries 118.7 16.8 7.7 (0.6) – 142.6Non-controlling interests (35.6) (8.2) (2.7) 0.2 – (46.3)
4. As a result of the purchase of the remaining 49% of The Mark Gordon Company on 2 March 2018, the above table relating to partly-owned subsidiaries is calculated for the period up to 2 March 2018.
NOTES TO THE CONSOLIDATED FINANCIAL STATEMENTS CONTINUEDfor the year ended 31 March 2019
eOne Annual Report and Accounts 2019176

32. Stated capital, own shares and other reservesAccounting policy
Equity instrumentsAn equity instrument is any contract that evidences a residual interest in the assets of an entity after deducting all of its liabilities. Equity instruments issued by the Company are recorded at the proceeds received, net of direct issue costs.
Own sharesThe Entertainment One Ltd. shares held by the Trustees of the Company’s Employee Benefit Trust (EBT) are classified in total equity as own shares and are recognised at cost. Consideration received for the sale of such shares is also recognised in equity, with any difference between the proceeds from sale and the original cost being taken to reserves. No gain or loss is recognised on the purchase, sale, issue or cancellation of equity shares.
Analysis of amounts recognised by the Group
Stated capital, net of own sharesYear ended 31 March 2019 Year ended 31 March 2018
Number of shares
‘000Value
£m
Number of shares
‘000Value
£m
Balance at 1 April 460,112 594.8 429,647 505.3Shares issued on exercise of share options (Note 33) 2,805 9.5 1,384 4.2Shares issued as part-consideration for acquisitions (Note 27) 638 1.9 – –Shares issued as part-consideration for acquisitions of non-controlling interests (Note 27) 1,232 4.5 10,827 31.7Shares issued on settlement of contingent consideration (Note 21) – – 779 1.8Shares issued as part of equity raise – – 17,475 51.8Balance at 31 March 464,787 610.7 460,112 594.8Own shares (87) (0.1) (195) (0.2)Net balance at 31 March 464,700 610.6 459,917 594.6
During the year ended 31 March 2019, the Group issued the following stated capital:• 2,805,181 common shares were issued to employees (or former employees) exercising share options granted under the Long Term
Incentive Plan. The total consideration received by the Company on the exercise of these options was £nil.• On 9 April 2018, 637,952 common shares (equivalent to £1.9 million) were issued as part consideration for the acquisition of Whizz
Kid Entertainment Limited (see Note 27).• On 27 June 2018, 1,231,768 common shares (equivalent to £4.5 million) were issued as part consideration for the purchase of the
remaining 49% share in Sierra Pictures, LLC (see Note 27).
During the year ended 31 March 2018, the Group issued the following stated capital:• 1,384,360 common shares were issued to employees (or former employees) exercising share options granted under the Long Term
Incentive Plan. The total consideration received by the Company on the exercise of these options was £nil.• On 4 July 2017, 778,516 common shares (equivalent to £1.8 million) were issued as part consideration for the settlement of
contingent consideration relating to the prior year acquisition of Renegade Entertainment, LLC (see Note 21).• On 1 February 2018, the Group completed a private placement of 17,475,000 new common shares at 305.0 pence per new
common share. Net of expenses, the total amount raised was £51.8 million. The fees in relation to the equity raise of £1.6 million have been capitalised to equity.
• On 2 March 2018, 10,826,566 new common shares (equivalent to £31.7 million) were issued as part consideration for the purchase of the remaining 49% share in The Mark Gordon Company (see Note 27).
At 31 March 2019 the Company’s stated capital comprised 464,786,220 common shares (2018: 460,111,319). See Note 36 for details of shares issued post year end.
SR
G
FS
177entertainmentone.com

32. Stated capital, own shares and other reserves continuedOther reserves
Cash flow hedge reserve
£m
Put options over NCI
£m
Restructuring reserve
£mTotal
£m
At 1 April 2017 (1.1) (30.9) 9.3 (22.7)Other comprehensive loss (0.9) – – (0.9)Total comprehensive loss for the year (0.9) – – (0.9)At 31 March 2018 (2.0) (30.9) 9.3 (23.6)
Other comprehensive income (net of tax) 3.1 – – 3.1
Total comprehensive income for the year 3.1 – – 3.1
Acquisition of subsidiaries – (3.1) – (3.1)
Transactions with equity holders – 12.2 – 12.2
Total transactions with equity holders – 9.1 – 9.1
At 31 March 2019 1.1 (21.8) 9.3 (11.4)
Other reserves comprise the following:• A cash flow hedging reserve.• A put option over non-controlling interests of subsidiaries reserve, which represent the potential cash payments related to put
options issued by the Group over the non-controlling interest in subsidiary companies and are accounted for as financial liabilities. The amount that may become payable under the option on exercise is initially recognised on acquisition at present value within other payables with a corresponding charge directly to equity.
• A permanent restructuring reserve which arose on completion of the Scheme of Arrangement in 2010 (‘the Scheme’) and represents the difference between the net assets and share capital and share premium in the ultimate parent company immediately prior to the Scheme.
33. Share-based paymentsAccounting policy
The Group issues equity-settled share-based payments to certain employees. Equity-settled share-based payments are measured at fair value at the date of grant of equity-settled share-based payments. The fair value is expensed on a straight-line basis over the vesting period, based on the Group’s estimate of shares that will eventually vest. Fair value is measured by means of a binomial or Monte Carlo valuation model with the assistance of external advisers. The expected life used in the model has been adjusted, based on management’s best estimate, for the effect of non-transferability, exercise restrictions and behavioural considerations.
Equity-settled share schemes
At 31 March 2019, the Group had four equity-settled share-based payment schemes approved for its employees (including the executive directors). These are the Long Term Incentive Plan (LTIP), the Executive Share Plan (ESP), the Executive Incentive Scheme (EIS) and the Employee Save-As-You-Earn scheme (SAYE).
The ESP is now closed and no further awards will be made from the scheme. The EIS was approved at the Group’s AGM on 16 September 2015. No awards have been granted during the year under the EIS.
The total charge in the year relating to the Group’s equity-settled schemes was £16.2 million (2018: £12.6 million), inclusive of a charge of £1.3 million (2018: charge of £0.7 million) relating to movements in associated social security liabilities.
NOTES TO THE CONSOLIDATED FINANCIAL STATEMENTS CONTINUEDfor the year ended 31 March 2019
eOne Annual Report and Accounts 2019178

Long Term Incentive Plan (LTIP)On 28 June 2013, an LTIP for the benefit of employees (including executive directors) of the Group was approved by the Company’s shareholders. A summary of the arrangements is set out below:
Nature Grant of £nil cost options or conditional awardsPerformance period Up to five yearsPerformance conditions (examples of existing performance conditions shown)
(i) Group underlying EBITDA targets(ii) 50% vesting over the three-year performance period and 50% vesting dependent on performance against annual Group underlying EBITDA targets;(iii) Time only.
Maximum term 10 years
During the year, grants were made under the LTIP. The fair value of each grant was measured at the date of grant using the binomial model. The assumptions used in the model were as follows:
Grant date
Fair value at measurement
date (pence)
Number of options
grantedPerformance period
(period ending)
Share price on date of grant
(pence)Exercise
priceExpected volatility
Expected life
2 March 20181, 2 289.4 1,138,772 Mar 2021 – May 2024 294.4 £nil N/A 10 years12 March 2018 292.0 458,023 Mar 2021 297.0 £nil N/A 10 years15 March 2018 293.0 305,000 Mar 2021 298.0 £nil N/A 10 years5 April 2018 280.1 104,174 May 2024 280.0 £nil N/A 10 years7 May 2018 287.4 202,248 Mar 2021 292.2 £nil N/A 10 years22 May 2018 280.1 3,572,328 Mar 2021 285.4 £nil N/A 10 years22 May 20182 280.1 1,035,547 Mar 2021 285.4 £nil N/A 10 years27 June 2018 364.0 434,359 Mar 2021 – May 2024 369.6 £nil N/A 10 yearsOther ad hoc Grants3 292.1 425,334 Mar 2021 – May 2025 £nil N/A 10 years
1. These options were approved at the March 2018 Remuneration Committee and have a vesting start date of 1 April 2018.2. These are special grants which follow the LTIP rules except for certain specific conditions.3. The options were granted on various days between 15 August 2018 and 15 October 2018. The information presented has been calculated using the weighted
average for the individual grants.
Details of share option movements during the year are as follows:2019 2018
Number Million
Weighted average
exercise price Pence
Number Million
Weighted average
exercise price Pence
Outstanding at 1 April 13.3 – 8.4 –Exercised (2.7) – (2.8) –Granted 7.7 – 8.3 –Forfeited (0.2) – (0.6) –Outstanding at 31 March 18.1 – 13.3 –Exercisable 1.6 – 2.8 –
The weighted average contractual life remaining of the LTIP options in existence at the end of the year was 7.2 years (2018: 6.4 years).
SR
G
FS
179entertainmentone.com

33. Share-based payments continuedEmployee Save-As-You-Earn scheme (SAYE)On 30 September 2016, an SAYE for the benefit of employees (including executive directors) of the Group was approved by the Company’s shareholders. Employees make a monthly contribution, depending on jurisdiction, for up to three years. At the end of the savings period the employee has the opportunity to retain their savings, in cash, or to buy shares in eOne at a price fixed at the date of grant. A summary of the arrangement is set out below:
2019 2018 2017Nature Grant of options, 286.0 pence Grant of options, 241.0 pence Grant of options, 151.9 pence
Fair value at grant date 81.0 pence 84.4 pence 54.8 pencePerformance period Up to three yearsPerformance conditions 100% of the options vest on the completion of three years’ service in every territory with the
exception of the US which vest on the completion of two years’ service.Maximum term Three years. The options expire six months after vesting.
During the year, 184,779 options were granted under the SAYE (2018: 177,368). The fair value of each grant was 81.0 pence per share and the assumptions are consistent with prior year. The resulting charge for the options granted in the year is not significant and the total charge in respect of all outstanding SAYE options is £0.1 million (2018: £0.4 million).
The movement in options in the year is presented below:2019 2018
Number Million
Weighted average
exercise price Pence
Number Million
Weighted average
exercise price Pence
Outstanding at 1 April 2.4 159.3 2.2 151.9Granted 0.2 286.0 0.2 241.0Exercised (0.1) 226.2 – –Forfeited (1.0) 157.8 – –Outstanding at 31 March 1.5 175.4 2.4 159.3Exercisable 1.2 151.9 – –
The weighted average contractual life remaining of the SAYE options in existence at the end of the year was 0.5 years (2018: 1.2 years).
MakeReadyOn 17 May 2017, the Group incorporated MR Productions Holdings LLC (MakeReady), a new global content creation company. On that date, MakeReady issued to Brad Weston 500,000 B shares, at £nil cost, which incrementally vest over a three-year period. The fair value of the share awards granted has been determined as at the grant date as required by IFRS 2 Share based Payments and a charge of £0.2 million has been recorded in the year ended 31 March 2019 (2018: £0.4 million).
34. Commitments and contingenciesAccounting policy
The determination of whether an arrangement is, or contains, a lease is based on the substance of the arrangement at inception date, whether fulfilment of the arrangement is dependent on the use of a specific asset or assets or the arrangement conveys a right to use the asset, even if that right is not explicitly specified in an arrangement. Rentals payable under operating leases are charged to the consolidated income statement on a straight-line basis over the lease term.
NOTES TO THE CONSOLIDATED FINANCIAL STATEMENTS CONTINUEDfor the year ended 31 March 2019
eOne Annual Report and Accounts 2019180

Operating lease commitments
The Group operates from properties in respect of which commercial operating leases have been entered into.
At the balance sheet date, the Group had outstanding commitments for future minimum lease payments under non-cancellable operating leases, which fall due as follows:
31 March 2019 £m
31 March 2018 £m
Within one year 8.8 10.7Later than one year and less than five years 34.4 26.6After five years 23.4 26.8Total 66.6 64.1
Future commitments31 March 2019
£m31 March 2018
£m
Investment in acquired content rights contracted for but not provided 104.0 143.6
35. Related party transactionsTransactions between the Company and its subsidiaries, which are related parties, have been eliminated on consolidation and are not disclosed in this Note. The nature of related parties disclosed in the consolidated financial statements for the Group as at and for the year ended 31 March 2019 has not changed.
Transactions with significant shareholders
Canadian Pension Plan Investment Board (CPPIB) held 85,597,069 common shares in the Company at 31 March 2019 (2018: 85,597,069), amounting to 18.42% (2018: 18.60%) of the issued capital of the Company. CPPIB is deemed to be a related party of Entertainment One Ltd. by virtue of this significant shareholding. The Group pays CPPIB an annual fee equivalent to the annual fee paid by the Group to its other non-executive directors in consideration for CPPIB allowing Scott Lawrence to allocate time to his role as a non-executive director of the Company. The fee payable to CPPIB in respect of Scott Lawrence’s services for the year ended 31 March 2019 was C$98,500 (2018: C$98,500).
At 31 March 2019 the amount outstanding payable to CPPIB is C$8,500 (2018: C$17,700).
Transactions with joint ventures
The Group owns 50% shares in the joint venture eOne/Fox Home Ent Distribution Canada Ltd. During the year the Group made purchases of £532,544 from eOne/Fox Home Ent Distribution Canada Ltd. At 31 March 2019 the amount outstanding payable to eOne/Fox Home Ent Distribution Canada Ltd. is £53,887.
The Group owns 50% shares in the joint venture Suite Distribution Limited. During the year the Group made purchases of £nil from Suite Distribution Limited. At 31 March 2019 the amount outstanding payable to Suite Distribution Limited is £155,000 (2018: £157,000).
The Group owns 50% of the shares in the joint venture Creative England-Entertainment One Global Television Initiative Limited. During the year the Group received income of £nil from Creative England-Entertainment One Global Television Initiative Limited. At 31 March 2019 the amount receivable from Creative England-Entertainment One Global Television Initiative Limited is £189,933 (2018: £nil).
SR
G
FS
181entertainmentone.com
36. Post balance sheet eventsCanadian holding company
On 1 April 2019 the Group reorganised its operating subsidiaries domiciled in Canada under a single holding company, Entertainment One Canada Ltd. (EOCL). The Group owns 25% of voting rights and 100% of the economic interest in EOCL, with the remaining 75% held by three independent directors of EOCL who are Canadian citizens.
The Group remains the only shareholder of EOCL exposed to variable returns due to its ownership of 100% of the economic interest and the shareholders’ agreement gives it the ability to affect those returns through its involvement in EOCL. As such, the Group continues to consolidate EOCL and its operating subsidiaries as it meets the requirements of consolidation under IFRS 10 Consolidated Financial Statements.
Audio Network Limited
On 12 April 2019 the Group completed a private placement for 28,900,000 new common shares raising net proceeds of £127.4 million. The placement funds were partly used to pay the cash consideration on the acquisition of Audio Network Limited (Audio Network).
On 18 April 2019 the Group acquired a 100% controlling stake in Audio Network which is an independent creator and publisher of original high-quality music for use in film, television, advertising and digital media, with streamlined owned rights. The transaction enhances the Group’s presence in music, a rapidly growing sector, with attractive growth that is complementary to eOne’s music, film, and television and family brands businesses.
The total consideration of £178.8 million has been satisfied as follows:• Payment in cash of £168.9 million using proceeds from the private placement of shares and £52.0 million through a term loan
maturing on 31 December 2020. The term loan is subject to same covenants as the Group’s revolving credit facility.• The issuance of 2,112,428 Entertainment One Ltd. common shares.
The provisional acquisition accounting for Audio Network will be included in the Group’s condensed consolidated financial statements for the six months ended 30 September 2019.
NOTES TO THE CONSOLIDATED FINANCIAL STATEMENTS CONTINUEDfor the year ended 31 March 2019
eOne Annual Report and Accounts 2019182
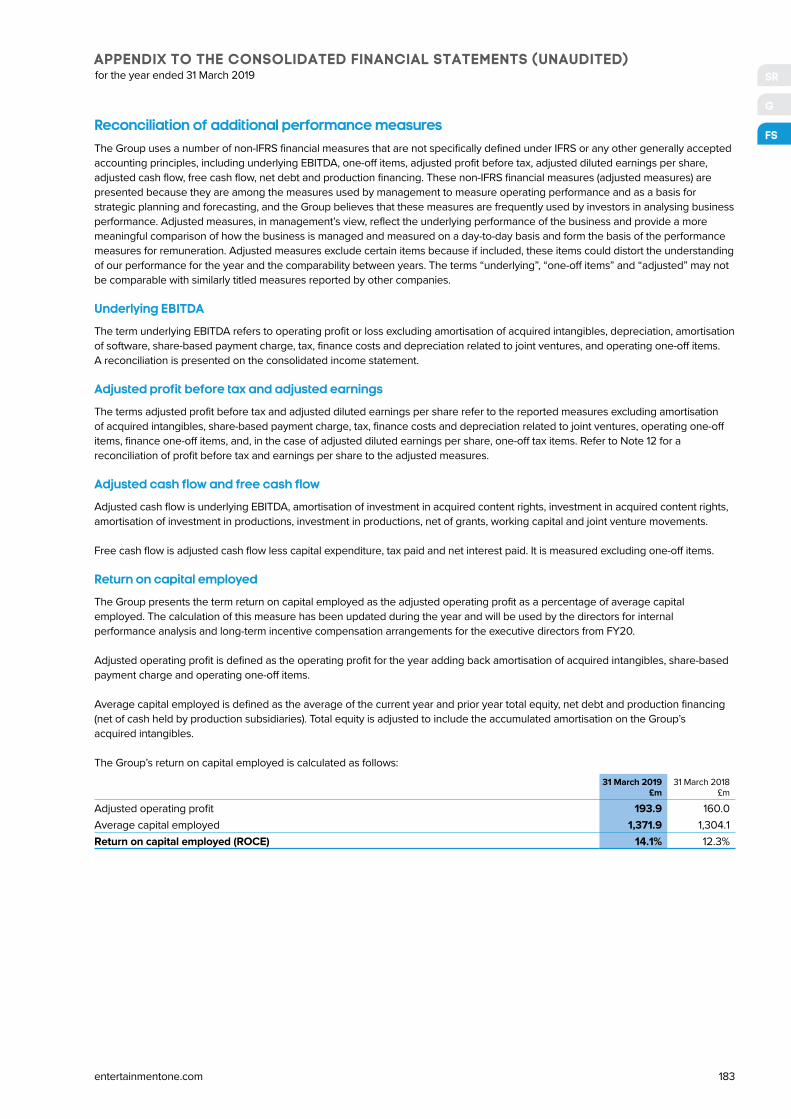
Reconciliation of additional performance measuresThe Group uses a number of non-IFRS financial measures that are not specifically defined under IFRS or any other generally accepted accounting principles, including underlying EBITDA, one-off items, adjusted profit before tax, adjusted diluted earnings per share, adjusted cash flow, free cash flow, net debt and production financing. These non-IFRS financial measures (adjusted measures) are presented because they are among the measures used by management to measure operating performance and as a basis for strategic planning and forecasting, and the Group believes that these measures are frequently used by investors in analysing business performance. Adjusted measures, in management’s view, reflect the underlying performance of the business and provide a more meaningful comparison of how the business is managed and measured on a day-to-day basis and form the basis of the performance measures for remuneration. Adjusted measures exclude certain items because if included, these items could distort the understanding of our performance for the year and the comparability between years. The terms “underlying”, “one-off items” and “adjusted” may not be comparable with similarly titled measures reported by other companies.
Underlying EBITDA
The term underlying EBITDA refers to operating profit or loss excluding amortisation of acquired intangibles, depreciation, amortisation of software, share-based payment charge, tax, finance costs and depreciation related to joint ventures, and operating one-off items. A reconciliation is presented on the consolidated income statement.
Adjusted profit before tax and adjusted earnings
The terms adjusted profit before tax and adjusted diluted earnings per share refer to the reported measures excluding amortisation of acquired intangibles, share-based payment charge, tax, finance costs and depreciation related to joint ventures, operating one-off items, finance one-off items, and, in the case of adjusted diluted earnings per share, one-off tax items. Refer to Note 12 for a reconciliation of profit before tax and earnings per share to the adjusted measures.
Adjusted cash flow and free cash flow
Adjusted cash flow is underlying EBITDA, amortisation of investment in acquired content rights, investment in acquired content rights, amortisation of investment in productions, investment in productions, net of grants, working capital and joint venture movements.
Free cash flow is adjusted cash flow less capital expenditure, tax paid and net interest paid. It is measured excluding one-off items.
Return on capital employed
The Group presents the term return on capital employed as the adjusted operating profit as a percentage of average capital employed. The calculation of this measure has been updated during the year and will be used by the directors for internal performance analysis and long-term incentive compensation arrangements for the executive directors from FY20.
Adjusted operating profit is defined as the operating profit for the year adding back amortisation of acquired intangibles, share-based payment charge and operating one-off items.
Average capital employed is defined as the average of the current year and prior year total equity, net debt and production financing (net of cash held by production subsidiaries). Total equity is adjusted to include the accumulated amortisation on the Group’s acquired intangibles.
The Group’s return on capital employed is calculated as follows:31 March 2019
£m31 March 2018
£m
Adjusted operating profit 193.9 160.0Average capital employed 1,371.9 1,304.1Return on capital employed (ROCE) 14.1% 12.3%
APPENDIX TO THE CONSOLIDATED FINANCIAL STATEMENTS (UNAUDITED)for the year ended 31 March 2019 SR
G
FS
183entertainmentone.com

The reconciliation of the adjusted operating profit to reported operating profit is as follows:
Note31 March 2019
£m31 March 2018
£m
Reported operating profit 70.7 100.7Amortisation of acquired intangibles 14 39.0 39.6Share-based payment charge 33 16.2 12.6One-off items 7 68.0 7.1Adjusted operating profit 193.9 160.0
The reconciliation of average capital employed to the consolidated financial statements is as follows:
Note31 March 2019
£m31 March 2018
£m31 March 2017
£m
Adjusted capital employed
Equity reported 714.7 666.1 719.4Cumulative amortisation of acquired intangibles 14 230.5 217.7 232.1Total equity – Adjusted 945.2 883.8 951.5Net debt – Reported and Adjusted 23 341.5 314.5 187.4Net production financing – Reported and Adjusted 24 140.1 118.7 152.3Adjusted capital employed 1,426.8 1,317.0 1,291.2Average capital employed 1,371.9 1,304.1
Library valuations
Underpinning eOne’s focus on growth through content ownership, the Group commissions an annual independent library valuation calculated using a discounted cash flow model (discounted using the Group’s published post-tax weighted average cost of capital) for all of eOne’s family, television, music and film assets on a rateable basis with eOne’s ownership of such assets. The cash flows represent forecast of future amounts which will be received from the exploitation of the assets, net of payments made as royalties or non-controlling interests and an estimate of the overheads required to support such exploitation.
Currency related adjustments
The Group presents revenue and underlying EBITDA on a constant currency basis, which is calculated by retranslating the comparative figures using weighted average exchange rates for the current year.
A reconciliation of the revenue growth on a constant currency basis is shown below:
Year ended 31 March 2019
£m
Restated Year ended
31 March 2018 £m
Change %
Revenue (per IFRS consolidated income statement) 941.2 1,029.0 (8.5%)Currency adjustment N/A 2.1 N/ARevenue (constant currency) 941.2 1,031.1 (8.7%)
A reconciliation of the underlying EBITDA growth on a constant currency basis is shown below:
Year ended 31 March 2019
£m
Restated Year ended
31 March 2018 £m
Change %
Underlying EBITDA (per IFRS consolidated income statement) 197.6 163.6 20.8%Currency adjustment N/A 1.8 N/AUnderlying EBITDA (constant currency) 197.6 165.4 19.5%
APPENDIX TO THE CONSOLIDATED FINANCIAL STATEMENTS (UNAUDITED) CONTINUEDfor the year ended 31 March 2019
eOne Annual Report and Accounts 2019184

Cash flow and net debt
The Group defines net debt as interest-bearing loans and borrowings net of cash and cash equivalents. Interest-bearing loans and borrowings include senior secured notes and revolving credit facility net of deferred finance charges, bank overdrafts and other interest-bearing loans.
The table below reconciles free cash flow associated with the net debt of the Group, shown in the Financial Review section of this Report, to the net cash from operating activities and net movement in cash and cash equivalents in the consolidated cash flow statement. It excludes cash flows associated with production activities which are reconciled in the Cash Flow and Production Financing section below:
Year ended 31 March 2019
£m
Restated Year ended
31 March 2018 £m
Underlying EBITDA 181.6 137.4Adjustment for:
One-off items (66.5) (3.0)Disposal of property, plant and equipment 0.1 –Amortisation of investment in productions 111.7 90.0Investment in productions, net of grants (131.7) (124.9)Amortisation of investment in acquired content rights 84.0 113.4Investment in acquired content rights (121.9) (144.5)Impairment of investment in acquired content rights 15.6 –Put call option movements – (3.9)Other (0.1) 0.1
Operating cash flows before changes in working capital and provisions 72.8 64.6Working capital movements (9.8) (38.5)Income tax paid (23.6) (31.8)Net cash from operating activities 39.4 (5.7)
Funds transferred between Net Debt and Production Financing 2.2 0.6Cash one-off items 11.1 33.4Purchase of property, plant and equipment and software (6.9) (3.2)Interest paid (33.4) (25.5)Free cash flow 12.4 (0.4)
Cash one-off items (11.1) (33.4)One-off finance items (1.9) (14.1)Acquisitions, net of net debt acquired and transactions with shareholders (14.0) (118.5)Net proceeds on issue of shares 0.1 52.0Dividends paid (13.4) (13.0)Net increase in net debt (27.9) (127.4)
Net debt at beginning of the year (314.5) (187.4)Net increase in net debt (27.9) (127.4)Effect of foreign exchange rate changes on net debt held 0.9 0.3Net debt at the end of the year (341.5) (314.5)
The table below reconciles the movement in net debt to movement in cash associated with net debt of the Group:Year ended
31 March 2019 £m
Year ended 31 March 2018
£m
Net increase in net debt (27.9) (127.4)Net drawdown of interest bearing loans and borrowings 15.6 105.0Fees paid in relation to the Group’s bank facility, premium received on notes and one-off finance costs (2.0) 0.7Amortisation of deferred finance charges and premium on secured notes 1.6 1.9Deferred finance charges accruals (0.8) –Write-off of deferred finance charges and other items 1.4 –Net decrease in cash and cash equivalents at the end of the year (net of bank overdrafts) (12.1) (19.8)
SR
G
FS
185entertainmentone.com
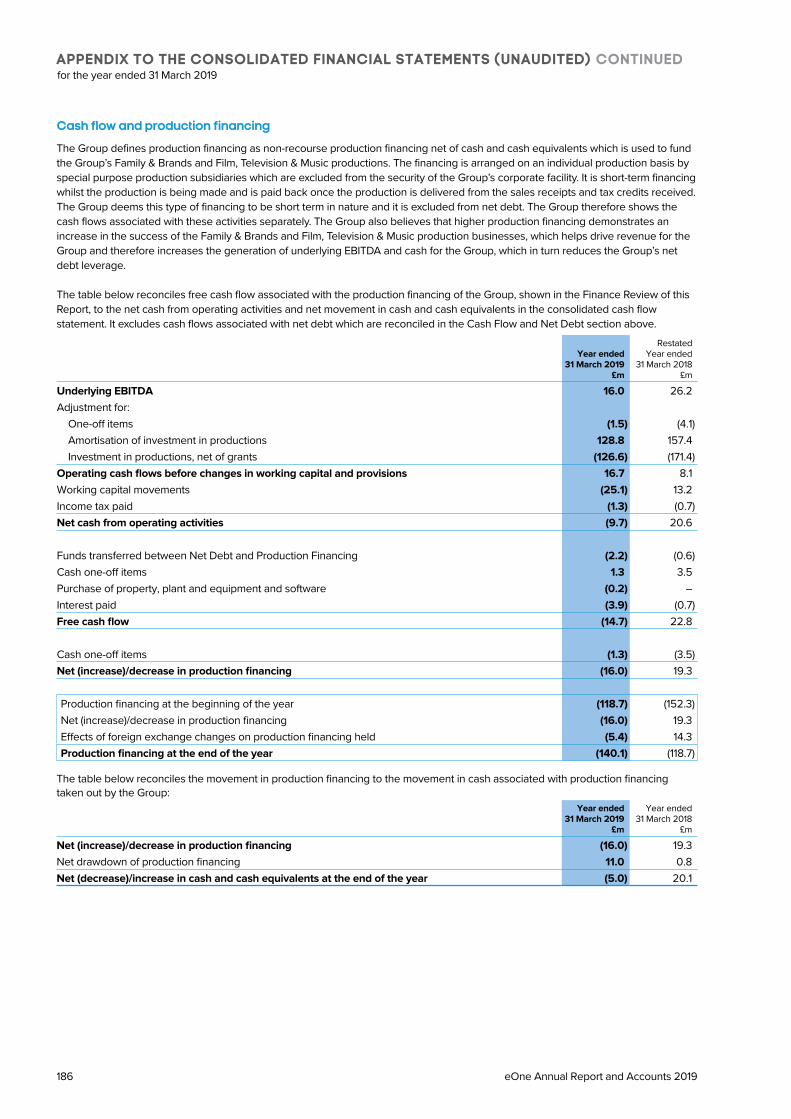
Cash flow and production financing
The Group defines production financing as non-recourse production financing net of cash and cash equivalents which is used to fund the Group’s Family & Brands and Film, Television & Music productions. The financing is arranged on an individual production basis by special purpose production subsidiaries which are excluded from the security of the Group’s corporate facility. It is short-term financing whilst the production is being made and is paid back once the production is delivered from the sales receipts and tax credits received. The Group deems this type of financing to be short term in nature and it is excluded from net debt. The Group therefore shows the cash flows associated with these activities separately. The Group also believes that higher production financing demonstrates an increase in the success of the Family & Brands and Film, Television & Music production businesses, which helps drive revenue for the Group and therefore increases the generation of underlying EBITDA and cash for the Group, which in turn reduces the Group’s net debt leverage.
The table below reconciles free cash flow associated with the production financing of the Group, shown in the Finance Review of this Report, to the net cash from operating activities and net movement in cash and cash equivalents in the consolidated cash flow statement. It excludes cash flows associated with net debt which are reconciled in the Cash Flow and Net Debt section above.
Year ended 31 March 2019
£m
Restated Year ended
31 March 2018 £m
Underlying EBITDA 16.0 26.2Adjustment for:
One-off items (1.5) (4.1)Amortisation of investment in productions 128.8 157.4Investment in productions, net of grants (126.6) (171.4)
Operating cash flows before changes in working capital and provisions 16.7 8.1Working capital movements (25.1) 13.2Income tax paid (1.3) (0.7)Net cash from operating activities (9.7) 20.6
Funds transferred between Net Debt and Production Financing (2.2) (0.6)Cash one-off items 1.3 3.5Purchase of property, plant and equipment and software (0.2) –Interest paid (3.9) (0.7)Free cash flow (14.7) 22.8
Cash one-off items (1.3) (3.5)Net (increase)/decrease in production financing (16.0) 19.3
Production financing at the beginning of the year (118.7) (152.3)Net (increase)/decrease in production financing (16.0) 19.3Effects of foreign exchange changes on production financing held (5.4) 14.3Production financing at the end of the year (140.1) (118.7)
The table below reconciles the movement in production financing to the movement in cash associated with production financing taken out by the Group:
Year ended 31 March 2019
£m
Year ended 31 March 2018
£m
Net (increase)/decrease in production financing (16.0) 19.3Net drawdown of production financing 11.0 0.8Net (decrease)/increase in cash and cash equivalents at the end of the year (5.0) 20.1
APPENDIX TO THE CONSOLIDATED FINANCIAL STATEMENTS (UNAUDITED) CONTINUEDfor the year ended 31 March 2019
eOne Annual Report and Accounts 2019186
Registered office
134 Peter Street Suite 700 Toronto Ontario Canada M5V 2H2
Bankers
JP Morgan Chase N.A. 25 Bank Street Canary Wharf London E14 5JP UK
Legal advisers to the Company (Canada)
Osler, Hoskin & Harcourt LLP 100 King Street West 1 First Canadian Place Toronto Ontario M5X 1B8 Canada
Legal advisers to the Company (UK)
Mayer Brown International LLP 201 Bishopsgate London EC2M 3AF UK
Legal advisers to the Company (US)
Sidley Austin LLP 1999 Avenue of the Stars Los Angeles California 90067 USA
Legal advisers to the Company (Financing)
Milbank, Tweed, Hadley & McCloy LLP 10 Gresham Street London EC2V 7JD UK
Joint broker
JP Morgan Cazenove 25 Bank Street Canary Wharf London E14 5JP UK
Joint broker
Investec Bank Plc. 30 Gresham Street London EC2V 7QP UK
Registrars
Link Market Services (Jersey) Limited 12 Castle Street St. Helier JE2 3RT Jersey
Auditor
PricewaterhouseCoopers LLP 1 Embankment Place London WC2N 6RH UK
COMPANY INFORMATIONSR
G
FS
187entertainmentone.com

eOne Annual Report and Accounts 2019188

This report is printed on Magno Satin and Essential Offset.
Both have been independently certified by the Forest
Stewardship Council® and manufactured using materials
from sustainable sources.
Printed at Principal Colour Ltd. ISO 14001 certified, Alcohol
Free and FSC® Chain of Custody certified.
The inks used are vegetable oil based.
Designed and produced by Black Sun Plc

Entertainment One Ltd.
134 Peter Street
Suite 700
Toronto
Ontario
Canada
M5V 2H2
T +1 416 646 2400
www.entertainmentone.com