2019 Air Quality Annual Status Report - (ASR)
108
-
Upload
khangminh22 -
Category
Documents
-
view
0 -
download
0
Transcript of 2019 Air Quality Annual Status Report - (ASR)


2019 Air Quality Annual Status Report (ASR) In fulfilment of Part IV of the Environment Act 1995 Local Air Quality Management June 2019

Local Authority Officer
Dr Stuart Maxwell
Department Environmental Protection
Address Maidstone House, King St, Maidstone ME15 6JQ
Telephone 01622602216
E-mail [email protected]
Report Reference number
ASR 2019
Date June 2019

LAQM Annual Status Report 2019 i
Executive Summary: Air Quality in Our Area
Air Quality in Maidstone
Air pollution is associated with a number of adverse health impacts. It is recognised
as a contributing factor in the onset of heart disease and cancer. Additionally, air
pollution particularly affects the most vulnerable in society: children and older people,
and those with heart and lung conditions. There is also often a strong correlation with
equalities issues, because areas with poor air quality are also often the less affluent
areas1,2.
The annual health cost to society of the impacts of particulate matter alone in the UK
is estimated to be around £16 billion3.
Maidstone is the county town of Kent. The mid year population of the borough in
2017 was 167,700 people, based on figures from Kent County Council. Its population
is expected to increase to 188,600 by 2026. Around 11,080 new homes are to be
provided within the planning period 2006 to 2026. The Borough is home to 10.8 per
cent of the population of the Kent County Council area (2017 estimate from KCC
website) and borders Swale, Ashford, Tunbridge Wells and Tonbridge and Malling
Boroughs, as well as Medway Unitary Authority.
The Borough of Maidstone includes the large urban area of Maidstone as well as
several small rural settlements. Its countryside, set within 'the Garden of England', is
of a high landscape quality and includes the Kent Downs Area of Outstanding Natural
Beauty.
The main source of air pollution in the Borough is traffic emissions from major roads,
notably the M2, M20, A20, A229, A249, A26 and A274. An Air Quality Management
Area (AQMA) was declared in August 2008 which incorporates the whole Maidstone
urban area and the M20 corridor, where exceedances of the annual mean objective
for nitrogen dioxide (NO2) and 24-hour mean objective for fine particulate matter
(PM10) were predicted.
The urban roadside automatic monitor in central Maidstone was decommissioned in
June 2016, as it needed to be moved to make way for a new road layout. A new site 1 Environmental equity, air quality, socioeconomic status and respiratory health, 2010
2 Air quality and social deprivation in the UK: an environmental inequalities analysis, 2006
3 Defra. Abatement cost guidance for valuing changes in air quality, May 2013

LAQM Annual Status Report 2019 ii
was proposed outside Miller House which is close to Upper Stone Street.
Unfortunately, when the lease negotiations were at an advanced stage, the property
was put on the market and the property owner would not complete the lease
agreement.
In December 2017, MBC adopted a new Low Emission Strategy incorporating an
updated Air Quality Action Plan. One of the actions included in the plan was a review
of the air quality monitoring provision in Maidstone. The main emphasis of this action
was to consider whether it was necessary to continue with continuous monitoring in
Maidstone town centre. The conclusion was that it is necessary, and a continuous
monitor was installed in Upper Stone Street, which is monitoring PM2.5 for the first
time in Maidstone, as well as NO2 and PM10. We will be particularly interested to find
out if there are exceedances of the PM10 objective and the hourly mean NO2
objective, but early indications are that there will not be.
As expected, both the annual mean objective and the 1-hour objective for NO2 were
met at the automatic rural background monitoring station in Detling.
During 2018, exceedances of the NO2 annual mean AQ objective were recorded at
eight non-automatic monitoring sites within the AQMA and one site outside the
AQMA:
Inside the AQMA
Maid 53 at The Wheatsheaf Public Health
Maid 81 at The Pilot on Upper Stone Street;
Maid 96 at Lashings Sports Club on Upper Stone Street.
Maid 97 at ‘No Loading’ sign outside Romney House, in Romney Place
Maid 116 at 37 Forstal Road Cottages
Maid 122 at Papermakers Arms PH, Upper Stone Street
Maid 123 at Upper Stone Street Opposite Maid 122
Maid 128 triplicate site co-located with new continuous monitor in Upper Stone
Street
Outside the AQMA
Maid 113 at 1 Ashford Road, Bearstead

LAQM Annual Status Report 2019 iii
All of these sites exceeded the NO2 annual mean objective in previous years except
for Maid 128, which is a new site established in 2018.
Where appropriate, NO2 concentrations have been distance corrected to estimate
concentrations at the nearest location of relevant exposure (some of the tubes are
already sited at the façade of residential properties). Following distance correction,
the annual mean NO2 concentration remains above the annual mean NO2 AQS
objective at five tube sites, namely, Maid 53, Maid 81, Maid 96, Maid 122, and Maid
128.
Annual mean concentrations of NO2 at the sites, Maid 81 and Maid 96 are greater
than 60µg/m3, which indicates that an exceedance of the 1-hour mean objective
might also occur at these sites. Maid 58, which has consistently shown levels above
60µg/m3 has now been discontinued owing to a high rate of theft of tubes.
There was one exceedance of the annual mean NO2 AQS objective in the non-
automatic monitoring sites outside the existing AQMA (Maid 113, Ashford Road), but
following distance corrrection there was shown to be no exceedance of the objective
at the nearest relevant receptors.
Maidstone Borough Council has previously identified a number of biomass
installations which are over the 50kW criteria for assessment. The details for these
biomass installations are presented in Appendix C. No new installations were
identified in 2018.
Actions to Improve Air Quality
During 2017 a new Air Quality Action Plan was introduced, linked to a new Air Quality
Management Area which came into effect on 1st January 2018, The new plan was
based on the principles of a low emission strategy. Good progress was made on
many of the actions included in the Action Plan, incluing adopting new Air Quality
Planning Guidance, and securing funding to undertake a feasibility study into a Low
Emission Zone. Full details are given in Appendix F
Local Priorities and Challenges
Although the 2018 monitoring results show that the annual mean NO2 AQS objective
has been met in majority of the monitoring locations, there were six locations within
the AQMA where NO2 levels were observed to exceed the annual mean objective for

LAQM Annual Status Report 2019 iv
NO2, when distance corrected to the nearest relevant exposure. Five of these
locations were in Upper Stone Street and the other was at the Wheatsheaf Junction.
It is clear that air quality in Maidstone has improved over recent years, to the extent
that a number of areas previously identified as air quality ‘hotspots,’ for example, the
High Street and Well Road, no longer appear to exceed the NO2 annual mean
objective. At the Wheatsheaf junction, whilst an exceedance is regularly measured at
the Wheatsheaf pub, the pub appears to be the only property where the exceedance
is measured. Neighbouring residential properties appear to be below the objective. A
similar picture is emerging at the Fountain Lane/Tonbridge Road junction where the
area of exceedance barely seems to extend outside the carriageway of the road to
the residential properties. In 2018, however, the results were affected by a sink hole
in Tonbridge Road which resulted in the closure of the road at the Fountain Lane
Junction, causing lower than expected NO2 levels.
Therefore it is now very clear that Upper Stone Street is now the main area of
concern in Maidstone with regards to air quality. Even here, there have been
considerable improvements in recent years. The figure below shows the NO2 levels
at site Maid 81, The Pilot public house, between 2011 and 2017. Despite the
improvements, the levels remain stubbornly in excess of the objective, and it’s clearly
here that we need to prioritise our efforts in the coming years.
NO2 levels measured at site Maid 81 in Upper Stone Street.

LAQM Annual Status Report 2019 v
How to Get Involved
As the main source of air pollution within Maidstone Borough Council is transport, the
easiest way for the public to get involved with helping improving air quality within the
area would be to look at alternatives to the way they usually travel.
The following are suggested alternatives to private travel that would contribute to
improving the air quality within the Borough:
Use public transport where available – This reduces the number of private
vehicles on the roads thus helping to reduce congestion and air pollution
levels;
Walk or cycle if your journey allows – Choosing to walk or cycle your journey
reduces the number of vehicles on the road and regular exercise helps keep
people fit and healthy;
Car/lift sharing – Where a number of individuals are making similar journeys,
such as travelling to work or to school, car sharing reduces the number of
vehicles on the road and therefore the amount of emissions being released.
This is being promoted via travel plans through the workplace and within
schools; and
Alternative fuel / more efficient vehicles – Choosing a vehicle that meets the
specific needs of the owner, fully electric, hybrid fuel and more fuel efficient
cars are available and all have different levels of benefits in reducing the
amount of emissions being released. The installation of Electric Vehicle
charging points is being promoted through the use of conditions attached to
relevant planning permissions.

LAQM Annual Status Report 2019 vi
Table of Contents
Executive Summary: Air Quality in Our Area .......................................................... i
Air Quality in Maidstone ...................................................................................................... i
Actions to Improve Air Quality ........................................................................................... iii
Local Priorities and Challenges ......................................................................................... iii
How to Get Involved........................................................................................................... v
1 Local Air Quality Management ........................................................................ 8
2 Actions to Improve Air Quality ........................................................................ 9
2.1 Air Quality Management Areas .............................................................................. 9
2.2 Progress and Impact of Measures to address Air Quality in Maidstone
Borough Council ..............................................................................................................11
2.3 Local Authority Approach to Reducing Emissions and or Concentrations .............13
3 Air Quality Monitoring Data and Comparison with Air Quality
Objectives and National Compliance .................................................................... 15
3.1 Summary of Monitoring Undertaken .....................................................................15
3.1.1 Automatic Monitoring Sites .......................................................................................... 15
3.1.2 Non-Automatic Monitoring Sites................................................................................... 15
3.2 Individual Pollutants .............................................................................................17
3.2.1 Nitrogen Dioxide (NO2)................................................................................................. 17
3.2.2 Particulate Matter (PM10) .............................................................................................. 21
4 Conclusion and Recommendation ............................................................... 23
4.1 Conclusion from the New Monitoring Data ...........................................................23
4.2 Recommendations ...............................................................................................24
Appendix A: Monitoring Results ........................................................................... 25
Appendix B: Full Monthly Diffusion Tube Results for 2017 ................................ 41
Appendix C: Supporting Technical Information / Air Quality Monitoring
Data QA/QC ............................................................................................................. 44
Appendix D: Map(s) of Monitoring Locations ...................................................... 55
Figure D.1 – Map of Non-Automatic Monitoring Sites: Maidstone District.........................55
Figure D.2 – Map of Non-Automatic Monitoring Sites: Harrietsham .................................56
Figure D.3– Map of Non-Automatic Monitoring Sites: A229 .............................................57
Figure D.4 – Map of Non-Automatic Monitoring Sites: M20 ..............................................58
Figure D.4 – Map of Non-Automatic Monitoring Sites: M2 ................................................59
Figure D.6 – Map of Non-Automatic Monitoring Sites: Detling Hill ....................................60
Figure D.7 – Map of Non-Automatic Monitoring Sites: Bearsted Road .............................61
Figure D.8 – Map of Non-Automatic Monitoring Sites: Park Wood ...................................62

LAQM Annual Status Report 2019 vii
Figure D.9 – Map of Non-Automatic Monitoring Sites: M20 Map 2 ...................................63
Figure D.10 – Map of Non-Automatic Monitoring Sites: A249 ..........................................64
Figure D.11 – Map of Non-Automatic Monitoring Sites: St Peters Street ..........................65
Figure D.12 – Map of Non-Automatic Monitoring Sites: Mote Road .................................66
Figure D.13 – Map of Non-Automatic Monitoring Sites: A229 Map 2 .............................. 667
Figure D.14 – Map of Non-Automatic Monitoring Sites: Loose Road ................................67
Figure D.15 – Map of Non-Automatic Monitoring Sites: Sutton Road ...............................68
Figure D.16 – Map of Non-Automatic Monitoring Sites: Willington Street .........................70
Figure D.17 – Map of Non-Automatic Monitoring Sites: Ashford Road .............................70
Figure D.18 – Map of Non-Automatic Monitoring Sites: New Cut Road ............................71
Figure D.19 – Map of Non-Automatic Monitoring Sites: Sittingbourne Road ....................72
Figure D.20 – Map of Non-Automatic Monitoring Sites: Tonbridge Road .........................73
Figure D.21 – Map of Non-Automatic Monitoring Sites: A20 London Road ......................74
Figure D.22 – Map of Non-Automatic Monitoring Sites: King Street .................................75
Figure D.23 – Map of Non-Automatic Monitoring Sites: A26 Tonbridge Road ..................76
Figure D.24 – Map of Non-Automatic Monitoring Sites: North View .................................77
Figure D.25 – Map of Non-Automatic Monitoring Sites: Forstal Road ..............................78
Figure D.26 – Map of Non-Automatic Monitoring Sites: Pilgrims Way ..............................80
Figure D.27 – Map of Non-Automatic Monitoring Sites: Queens Road .............................80
Figure D.28 – Map of Non-Automatic Monitoring Sites: Barming Heath ...........................81
Figure D.29 – Map of Non-Automatic Monitoring Sites: Hermitage Lane..........................82
Figure D.30 – Map of Non-Automatic Monitoring Sites: St Andrews Road .......................82
Figure D.31 – Map of Non-Automatic Monitoring Sites: Romney Place ............................82
Figure D.32 – Map of Non-Automatic Monitoring Sites: A229 Map 3 ................................82
Figure D.33 – Map of Non-Automatic Monitoring Sites: Hermitage Lane Map 2 ...............82
Figure D.34 – Map of Non-Automatic Monitoring Sites: Campbell Road ..........................82
Figure D.35 – Map of Non-Automatic Monitoring Sites: Farleigh Lane .............................83
Appendix E: Summary of Air Quality Objectives in England .............................. 90
Appendix F: Maidstone Air Quality Action Plan Action Table…… ........... ………91
Glossary of Terms ................................................................................................ 104
References ............................................................................................................ 105

LAQM Annual Status Report 2019 8
1 Local Air Quality Management
This report provides an overview of air quality in Maidstone Borough Council during
2018. It fulfils the requirements of Local Air Quality Management (LAQM) as set out
in Part IV of the Environment Act (1995) and the relevant Policy and Technical
Guidance documents.
The LAQM process places an obligation on all local authorities to regularly review
and assess air quality in their areas, and to determine whether or not the air quality
objectives are likely to be achieved. Where an exceedance is considered likely the
local authority must declare an Air Quality Management Area (AQMA) and prepare
an Air Quality Action Plan (AQAP) setting out the measures it intends to put in place
in pursuit of the objectives. This Annual Status Report (ASR) is an annual
requirement showing the strategies employed by Maidstone Borough Council to
improve air quality and any progress that has been made.
The statutory air quality objectives applicable to LAQM in England can be found in
Table E.1 in Appendix E.

LAQM Annual Status Report 2019 9
2 Actions to Improve Air Quality
2.1 Air Quality Management Areas
Air Quality Management Areas (AQMAs) are declared when there is an exceedance
or likely exceedance of an air quality objective. After declaration, the authority must
prepare an Air Quality Action Plan (AQAP) within 12-18 months setting out measures
it intends to put in place in pursuit of the objectives.
A summary of the AQMA declared by Maidstone Borough Council can be found in
Table 2.1 – Declared Air Quality Management Areas
AQMA Name
Date of
Declaratio
n
Pollutants and Air Quality
Objectives
City / Town
One Line Description
Is air quality in the AQMA
influenced by roads
controlled by
Highways England?
Level of Exceedance (maximum
monitored/modelled concentration at
a location of relevant exposure)
Action Plan (inc. date of
publication)
At Declaration
Now
Maidstone Borough Air
Quality Management
Area. The area follows
the carriageways of the main
roads passing through the Borough,
including the M20, A229, A20, A26, A249, and
A274.*
Declared
<Date>,
2004 Amended
<Date “2008 Decla
red Decla
red 2018
NO2
40µgm
-3
Maidstone
The area follows the
carriageways of the main
roads passing through the Borough,
including the M20, A229, A20, A26, A249, and
A274.*
Yes
Direct Comparison not
possible
Direct Comparis
on not possible
https://laqm.defra.gov.uk/lareports/report_5/6806_6771__Low%20Emissions%20Strategy%20Consultation%20Document%2020
17.pdf
. Further information related to declared or revoked AQMAs, including maps of
AQMA boundaries is available online at https://uk-air.defra.gov.uk/aqma/local-
authorities?la_id=152.
In December 2017, MBC Councillors approved a major change to the AQMA in
Maidstone. The new AQMA was based on the results of modelling and a review of
the existing AQMA, carried out by Air Quality Consultants Ltd in 2016. The modelling
was based on 2014 data, which was the most recent data available at the time. The
review by AQC constitutes a Detailed Assessment as part of the Local Air Quality
Management (LAQM) process for amending or revoking AQMA orders.

LAQM Annual Status Report 2019 10
The modelling showed that in the vast majority of cases, exceedances of the annual
mean NO2 objective occurred, as expected, close to the major roads in the District.
Away from major roads, NO2 levels tend to be below the objective, even though
many such areas have been included in the AQMA for many years.
Therefore the decision was made to declare a new AQMA based on the modelling
undertaken by AQC, and using the boundary of the modelled 36µgm-3 contour as the
boundary of the new AQMA. The contours are shown in Figure 2.1
Figure 2.1 – Modelled Air Quality Contours in Maidstone Borough (2014 data)
Therefore the new AQMA is very much smaller than the old AQMA which
encompassed the entire Maidstone conurbation. Each AQMA has advantages and
disadvantages, however, on balance It was felt that the old AQMA included many
areas where air quality was perfectly acceptable and therefore it should be changed
to allow the council to focus it’s resources more effectively. A map of the new AQMA
is shown in Figure 2.3.
LAQM Annual Status Report 2019 11
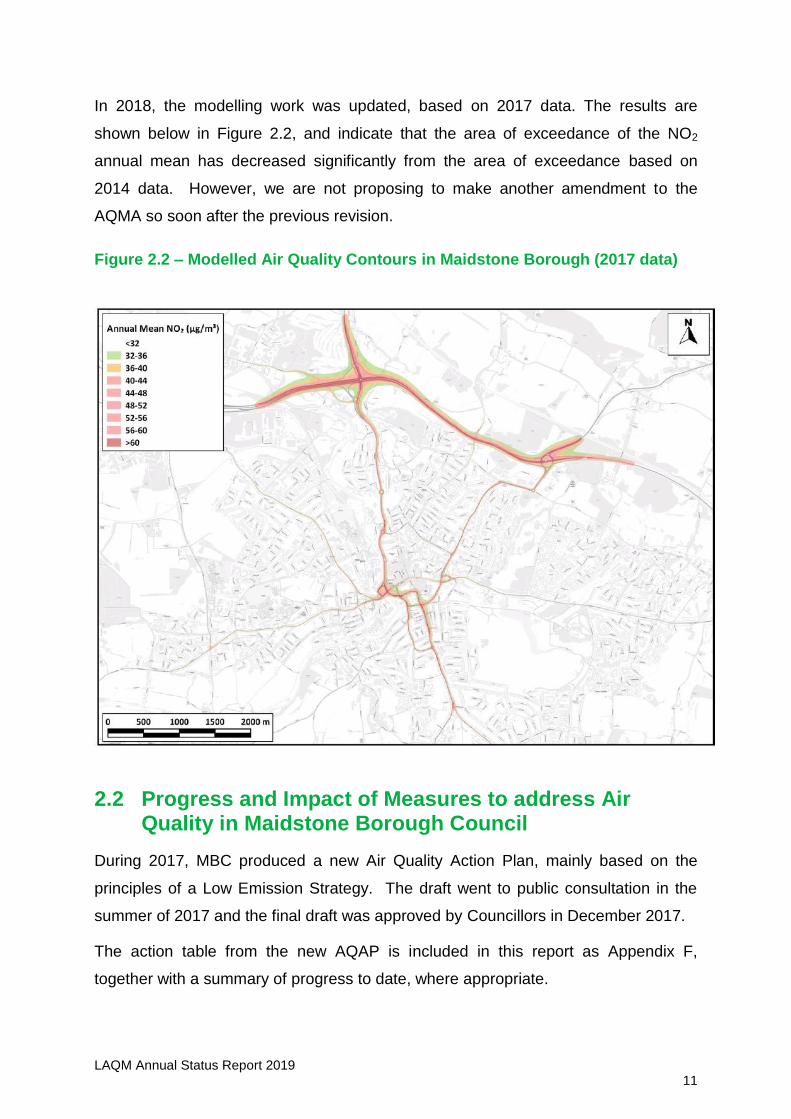
In 2018, the modelling work was updated, based on 2017 data. The results are
shown below in Figure 2.2, and indicate that the area of exceedance of the NO2
annual mean has decreased significantly from the area of exceedance based on
2014 data. However, we are not proposing to make another amendment to the
AQMA so soon after the previous revision.
Figure 2.2 – Modelled Air Quality Contours in Maidstone Borough (2017 data)
2.2 Progress and Impact of Measures to address Air Quality in Maidstone Borough Council
During 2017, MBC produced a new Air Quality Action Plan, mainly based on the
principles of a Low Emission Strategy. The draft went to public consultation in the
summer of 2017 and the final draft was approved by Councillors in December 2017.
The action table from the new AQAP is included in this report as Appendix F,
together with a summary of progress to date, where appropriate.

LAQM Annual Status Report 2019 12
The actions are divided into 5 themes, namely Transport, Planning, Property and
Carbon Management, Procurement, and Public Health.
Examples of the major actions to be included in each theme are given below:-
Transport
A feasibility study in to a Low Emission Zone, starting in the High Street and
subsequently being rolled out to other areas. This would involve, amongst other
things, consideration of emissions standards for buses and other vehicles.
Planning
Producing an Air Quality Development Plan Document (DPD) This will be a ‘mini
local plan’ relating just to air quality, and may contain a number of new policies.
Procurement
Review of commissioning and procurement strategy. This may, for example, include
targets about procuring items from the closest suppliers or having them delivered in
the cleanest vehicles.
Property and Carbon Management
Review of Park and Ride Provision, for example, when the Park and Ride contract is
renewed, an emission standard for the buses will be investigated.
Public Health
Raising awareness of AQ issues and promoting good practice.

LAQM Annual Status Report 2019 13
Figure 2.3– Map of Maidstone’s New Air Quality Management Area
2.3 Local Authority Approach to Reducing Emissions and or Concentrations
As mentioned above, the new Air Quality Action Plan is primarily based upon a Low
Emission Strategy approach. This means a change of emphasis from actions aimed
at modal shift, to actions aimed at cleaning up the vehicle fleet using Maidstone’s
roads. This does not mean that modal shift approach is being given a lower priority
by the council as a whole, however, there are many other strategies and policies
operating in the District, which are aimed at modal shift, for example, Kent County
Council’s Active Travel Strategy. The intention of the new AQAP is not to reproduce
or duplicate actions which are being covered elsewhere.
As detailed in Policy Guidance LAQM.PG16 (Chapter 7), local authorities are
expected to work towards reducing emissions and/or concentrations of PM2.5
(particulate matter with an aerodynamic diameter of 2.5µm or less). There is clear

LAQM Annual Status Report 2019 14
evidence that PM2.5 has a significant impact on human health, including premature
mortality, allergic reactions, and cardiovascular diseases.
The Public Health Outcomes Framework indicator for the fraction of deaths
attributable to PM2.5 within the district of Maidstone Borough Council is 5.5% during
2013, which is slightly above the national average of 5.3%.
During 2018, Maidstone Borough Council installed a new air quality monitoring
station in Upper Stone Street which monitors PM2.5 as well as PM10 and NO2. The
monitoring station was in operation from May 2018 onwards and for the period of
operation an average PM2.5 level of 18µgm-3 was recorded. Maidstone Borough
Council currently has no specific measures in place to address PM2.5 concentrations
within the Council area. However, it is recognised that any measures employed to
reduce NO2 and PM10 will also have a beneficial effect on PM2.5.

LAQM Annual Status Report 2019 15
3 Air Quality Monitoring Data and Comparison with Air Quality Objectives and National Compliance
3.1 Summary of Monitoring Undertaken
3.1.1 Automatic Monitoring Sites
This section sets out what monitoring has taken place and how it compares with
objectives.
Maidstone Borough Council undertook automatic (continuous) monitoring at 2 sites
during 2018. Table A.1 in Appendix A shows the details of the site.
Maps showing the location of all the monitoring sites are provided in Appendix D.
Further details on how the automatic monitors are calibrated and how the data has
been adjusted are included in Appendix C. The Maidstone Roadside monitoring site
at Fairmeadow in Maidstone Town Centre had to be discontinued in 2016 owing to
changes of the road layout. This station was located within the AQMA next to a main
road (the A229 on a Bridge Gyratory system) close to the bottom of Maidstone’s High
Street and measured NO2 and PM10.
In May 2018, a new air quality monitoring station was established in Upper Stone
Street. The site measures NO2 and PM10 and PM2.5 using beta attenuation monitors
(BAMS)
The Maidstone Rural background site at Detling is outside the AQMA and measures
NOx, and PM10. The monitoring of sulphur dioxide (SO2) and ozone (O3) was
discontinued at the Detling site in January 2015.
The background monitor (located in a field off Scragged Oak Road, Detling) uses a
Filter Dynamics Measurement System (FDMS). The monitor draws in air through a
filter which is then weighed. FDMS monitors are designed in such a way that, unlike
a TEOM, the semi-volatile component is not lost. They are therefore accurate enough
to be considered reference equivalent.
3.1.2 Non-Automatic Monitoring Sites
Maidstone Borough Council undertook non-automatic (passive) monitoring of NO2 at
62 sites during 2018. Table A.2 in Appendix A shows the details of the sites.

LAQM Annual Status Report 2019 16
Maps showing the location of the monitoring sites are provided in Appendix D.
Further details on Quality Assurance/Quality Control (QA/QC) and bias adjustment
for the diffusion tubes are included in Appendix C.
The following tubes sites were closed in 2018:
Maid 36 – 37 High Street, Maidstone
Maid 86 – Down pipe between 20 and 18 Mote Road
Maid 89 – Briar Wood Cottage, Langley Park (A20)
Maid 102 – EDF substation car park, Fairmeadow
Maid 108 – 13 Barming Walk, Hermitage Lane
Maid 120 – Garden wall to the rear of St Andrews Park.
The following new tube sites were established in 2018
Maid 125 – No loading sign, rear of garden wall behind Langley House
Maid 126 – Located opposite Maid 125 adjacent to 5a Hermitage Lane (in
addition to Maid 121)
Maid 127 – in bracket of Give Way sign on opposite side of Wrens Cross to
Maid 111
Maid 128 – site located in cage for air intake of new urban AQ station in Upper
Stone Street
Maid 129 – in bracket of road sign at South West façade of club (opposite end
to Town Hall) of Middle Row.
Maid 130 – Lamp post on roundabout near M20 Eclipse Park development
site.
Maid 131 – Lamp post KSGF0409 near façade of nearest new home of new
development for new road called Buffkyn Way (replacing the old Maid 89 site
opposite, adjacent to Briarwood Cottage.
Maid 132 – On roadsign outside 18 Mote Road, (replaces Maid 86)

LAQM Annual Status Report 2019 17
3.2 Individual Pollutants
The air quality monitoring results presented in this section are, where relevant,
adjusted for “annualisation” and bias. Further details on adjustments are provided in
Appendix C.
3.2.1 Nitrogen Dioxide (NO2)
Table A.3 in Appendix A compares the ratified and adjusted monitored NO2 annual
mean concentrations for the past 8 years with the air quality objective of 40µg/m3.
For diffusion tubes, the full 2018 dataset of monthly mean values are provided in
Appendix B.
Table A.4 in Appendix A compares the ratified continuous monitored NO2 hourly
mean concentrations for the past 8 years with the air quality objective of 200µg/m3,
not to be exceeded more than 18 times per year.
As would be expected, both the annual mean objective and the 1-hour objective for
NO2 were met at the rural background automatic monitoring station in Detling.
The graph in Figure 3.1 shows annual mean NO2 concentrations for the automatic
monitoring sites for the years from 2011 to 2018 and includes for reference, data
from the old Maidstone A229 Kerbside from 2011 to 2016
Concentrations of NO2 at the rural background site have been fairly consistent at
around 12-13µg/m3 in recent years (2011-2018). The new automatic monitoring
station in Upper Stone Street recorded an annualised NO2 level of 70µgm-3 for the
period from May to December 2018.

LAQM Annual Status Report 2019 18
Figure 3.1–Trends in Annual Mean NO2 Concentrations Measured at Automatic Monitoring Sites
Figure 3.2 shows trends in annual mean NO2 concentrations measured at Non-
automatic monitoring sites where there were exceedances of the AQS objective
during 2013-2018.
During 2018, exceedances of the NO2 annual mean were recorded at eight non-
automatic monitoring sites within the AQMA, and one outside of the AQMA. These
were:-
Inside the AQMA
Maid 53 at The Wheatsheaf Public Health
Maid 81 at The Pilot on Upper Stone Street;
Maid 96 at Lashings Sports Club on Upper Stone Street.
Maid 97 at ‘No Loading’ sign outside Romney House, in Romney Place
Maid 116 at 37 Forstal Road Cottages
Maid 122 at Papermakers Arms PH, Upper Stone Street
Maid 123 at Upper Stone Street, opposite Maid 122

LAQM Annual Status Report 2019 19
Maid 128 at Upper Stone Street, opposite Maid 96
Outside the AQMA
Maid 113 at 1 Ashford Road, Bearstead
Where there are comparable data, NO2 levels in 2018 appear to be generally slightly
lower than in previous years. Monitoring sites Maid 113, though outside the AQMA,
did show exceedances of the NO2 objective, at 44.5µgm-3 however, when distance
corrected to the nearest receptor, the value was below the objective at 34.3µgm-3
and 33.9µgm-3 respectively. Details of all distance correction calculations are given in
Table C.3
Annual mean concentrations of NO2 at the sites Maid 81 and Maid 96, located in
Upper Stone Street, are greater than 60µg/m3, which indicates that an exceedance
of the 1-hour mean objective is also possible at these sites. Site Maid 58, which had
also seen a potential exceedance of the 1-hour mean in previous years, was also
located in Upper Stone Street, but was discontinued at the start of 2016 owing to
regular theft of the tubes. Preliminary results from the new automatic monitoring
station in Upper Stone Street do not indicate an exceedance of the hourly mean
objective for NO2.

LAQM Annual Status Report 2019 20
Figure 3.2 –Trends in Annual Mean NO2 Concentrations Measured at Non-automatic Monitoring Sites Exceeding the AQS Objective Within the AQMA during 2013-2018

LAQM Annual Status Report 2019 21
Figure 3.3 – Trends in Annual Mean NO2 Concentrations Measured at Non-automatic Monitoring Sites Outside the AQMA
3.2.2 Particulate Matter (PM10)
Table A.5 in Appendix A compares the ratified and adjusted monitored PM10 annual
mean concentrations for the past 8 years with the air quality objective of 40µg/m3.
Table A.6 in Appendix A compares the ratified continuous monitored PM10 daily
mean concentrations for the past 8 years with the air quality objective of 50µg/m3, not
to be exceeded more than 35 times per year.
Figure 3.4 shows trends in annual mean PM10 concentrations measured at the
Detling Rural automatic monitoring site, along with data from the closed town centre

LAQM Annual Status Report 2019 22
site for comparison. The annual mean PM10 concentration at Maidstone Rural
remains well below the objective, despite something of an increase in 2018. There is
no clear discernible trend in PM10 levels over recent years.
Figure 3.4 – Trends in Annual Mean PM10 Concentrations Measured at Automatic Monitoring Sites

LAQM Annual Status Report 2019 23
4 Conclusion and Recommendation
4.1 Conclusion from the New Monitoring Data
The Urban Roadside monitoring site in Maidstone was decommissioned in June of
2016. Both the annual mean objective and the 1-hour objective for NO2 were met at
the automatic rural background monitoring station in Detling, as were the objectives
for .
During 2018, exceedances of the NO2 annual mean AQS objective were recorded at
eight non-automatic monitoring sites, which are located within the existing AQMA,
and at one site outside the existing AQMA. Exceedances occurred at:
Inside the AQMA
Maid 53 at The Wheatsheaf Public Health
Maid 81 at The Pilot on Upper Stone Street;
Maid 96 at Lashings Sports Club on Upper Stone Street.
Maid 97 at ‘No Loading’ sign outside Romney House, in Romney Place
Maid 116 at 37 Forstal Road Cottages
Maid 122 at Papermakers Arms PH, Upper Stone Street
Maid 123 at Upper Stone Street Opposite Maid 122
Maid 128 Triplicate co-location site with continuous monitoring station in
Upper Stone Street.
Outside the AQMA
Maid 113 at 1 Ashford Road, Bearstead
There are three NO2 diffusion tube locations, Maid 81 and Maid 96 and Maid 128,
where the annual mean exceeded 60µg/m3 at the nearest relevant exposure façade;
Maid 81 and Maid 96 have been identified previously, and Maid 128 is a new site,
which is co-located with the new automatic monitoring station in Upper Stone Street.
An annual mean concentration of greater than 60µg/m3 indicates the potential for
exceedance of the 1-hour objective.

LAQM Annual Status Report 2019 24
During 2015, the annual mean NO2 concentration at Maid 96 was 94.8µg/m3,
indicating an exceedance of the 1 hour mean air quality objective. This result,
however, was based on only 4 tube results which were annualised. In 2016 there
were 11 months (91.7%) of data, and the reading was reduced to 83.8µg/m3. The
2017 result was based on 12 months of data and had decreased to 79.4µgm-3 and
further decreased to 77.2µgm-3 in 2018, however, this is still indicative of an
exceedance of the hourly mean. A continuous monitor was installed on the grass
verge opposite Maid 96 during 2018 and was in operation from May onwards. There
was one exceedance of the annual mean NO2 objective at non-automatic monitoring
sites located outside of the existing AQMA (Maid 113) However, when distance
corrected to the nearest relevant receptor, the level is well below the relevant
objective.
4.2 Recommendations
Recommendations following this annual status report are:
Continuation of diffusion tube monitoring, especially in the area of Upper
Stone Street.
Continue operation of new automatic monitoring station in Upper Stone Street
in order to ascertain if an exceedances of either the 1-hour NO2 objective or
the PM10 annual mean are is occurring in the vicinity.
Continue to progress actions in the new Air Quality Action Plan.
Proceed to 2020 annual status report.

LAQM Annual Status Report 2019 25
Appendix A: Monitoring Results
Table A.1 – Details of Automatic Monitoring Site
Site ID
Site Name Site Type X OS Grid Ref
Y OS Grid Ref
Pollutants Monitored
In AQMA?
Monitoring Technique
Distance to Relevant Exposure
(m) (1)
Distance to kerb of
nearest road (m)
(2)
Inlet Height
(m)
CM1
Maidstone A229
(Closed June 2016)
Roadside 575740 155615 NO2; PM10 Y Chemiluminescence (NO2),
TEOM (PM10) 35 1.8 1.5
CM2 Maidstone
Rural Rural
Background 580108 159703 NO2, PM10, N
Chemiluminescence (NO2), TEOM FDMS (PM10),
58 110 1.5
CM3 Upper Stone
Street Roadside 576337 155183
NO2 PM10
PM2.5 Y
Chemiluminescence (NO2) BAM (PM2.5 and PM10)
1.5 2.0
(1) 0m if the monitoring site is at a location of exposure (e.g. installed on the façade of a residential property).
(2) N/A if not applicable.

LAQM Annual Status Report 2019 26
Table A.2 – Details of Non-Automatic Monitoring Sites
Site ID Site Name Site Type X OS Grid Ref
Y OS Grid Ref
Pollutants Monitored
In AQMA?
Distance to Relevant Exposure
(m) (1)
Distance to kerb of nearest
road (m) (2)
Tube collocated
with a Continuous Analyser?
Height (m)
Maid 06 Scragged Oak Lane Rural 580108 159703 NO2 N 58 >50 Y 2.5
Maid 10 Grange Lane South Other 575769 158500 NO2 Y 6.5 1.9 N 2.4
Maid 11 Boarley Lane Other 575718 158653 NO2 Y 6 1.7 N 2.6
Maid 19 196 Loose Rd Roadside 576692 53992 NO2 N 0 13.3 N 2.4
Maid 20 Sheals Crescent Roadside 576175 154854 NO2 Y 5.4 1.4 N 2.4
Maid 22 A20 London Road Roadside 574109 156930 NO2 Y 7.5 2.9 N 2.3
Maid 26 Drakes PH Roadside 575782 155678 NO2 Y 2 1.8 N 2.2
Maid 27 High Street (JPs Bar) Roadside 575970 155688 NO2 Y 0 4.4 N 2.2
Maid 29 Knightrider Street Roadside 576082 155371 NO2 Y 41 2.8 N 2.2
Maid 36 37 High Street Roadside 575865 155640 NO2 Y 0 4.9 N 1.7
Maid 44 Well Road (facade between No.3 & 4)
Roadside 576189 156440 NO2 Y 0 3.4 N 2.4
Maid 45 Mote Park Urban
Background 577390 155159 NO2 N N/A >50 N 2.5
Maid 46 Scrubbs Lane
(Oakwood Park) Urban
Background 574770 155774 NO2 N 73 >50 N 2.93
Maid 49 454 Tonbridge Road
(façade) Roadside 573309 154789 NO2 Y 0 6.6 N 2.3
Maid 51 121 Boxley Road Roadside 576146 156488 NO2 Y 0 3.5 N 2.5
Maid 52 565 & 567 Tonbridge
Road Roadside 573349 154790 NO2 Y 2.9 2.5 N 2.7
Maid 53 Wheatsheaf PH Roadside 576724 153948 NO2 Y 1.9 1.0 N 2.4
Maid 56 243 Loose Road Roadside 576735 154007 NO2 Y 0 15.1 N 1.6

LAQM Annual Status Report 2019 27
Site ID Site Name Site Type X OS Grid Ref
Y OS Grid Ref
Pollutants Monitored
In AQMA?
Distance to Relevant Exposure
(m) (1)
Distance to kerb of nearest
road (m) (2)
Tube collocated
with a Continuous Analyser?
Height (m)
Maid 57 33 & 34 Forstal road
cottages Roadside 573962 158759 NO2 N 0 4.5 N 1.5
Maid 63 Façade 8 Harbourland
Cottages Roadside 577037 157739 NO2 Y 0
14.0 from M20 & 12.8 from
Boxley Road N 1.2
Maid 66 1 Pilgrims Way
(Triplicate)
Other
(Semi-rural) 579097 158414 NO2 Y 0
17m from the main road of concern the
A249
N 2
Maid 68 Metro Bank (former
Burger King (King Street side)
Roadside 576100 155783 NO2 Y 48 2.3 N 2.3
Maid 69 34 Church Street Roadside 576267 155840 NO2 N 1.5 1.3 N 1.9
Maid 70 92 King Street Roadside 576463 155721 NO2 Y 6 1.3 N 1.9
Maid 71 Flowerpot PH, Sandling
Road Roadside 575738 156711 NO2 N 6.5
10 from Royal Engineers Road
N 2
Maid 74 Chiltern Hundreds PH Roadside 577377 157130 NO2 N 0 6.0 N 2
Maid 75 1 The Hampshires Roadside 586308 152577 NO2 N 28 8.0 N 2
Maid 80 Well Road / Wheeler
Street Roadside 576314 156312 NO2 Y 4.5 1.0 N 1.5
Maid 81 The Pilot PH Roadside 576302 155328 NO2 Y 0 1.0 N 1
Maid 84 384 & 382 Tonbridge
Road Roadside 573686 155050 NO2 N 2.5 1.0 N 2
Maid 86 20 & 18 Mote Road Roadside 576368 155408 NO2 Y 6 2.0 N 1.7
Maid 89 Briarwood Cottage, Sutton Road A274,
Maidstone Roadside 579072 152254 NO2 N 2 2.0 N 2
LAQM Annual Status Report 2019 28
Site ID Site Name Site Type X OS Grid Ref
Y OS Grid Ref
Pollutants Monitored
In AQMA?
Distance to Relevant Exposure
(m) (1)
Distance to kerb of nearest
road (m) (2)
Tube collocated
with a Continuous Analyser?
Height (m)
Maid 90 Pudding Lane, Medway
Street, Maidstone Kerbside 575918 155753 NO2b N 2 1.0 N 2
Maid 93 Corner Of St Andrews Road / Fountain Lane,
Maidstone Suburban 573347 154981 NO2 N 1 10.0 N 1.5
Maid 94 53, High Street,
Maidstone, Maidstone, Kent, ME14 1SY
Roadside 575822 155579 NO2 Y 0 10.0 N 2
Maid 96
Lampost KUBT 512 in bracket for "One Way" sign outside Lashings Sports Club (opposite grassy area) Upper
Stone St
Roadside 576346 155183 NO2 Y 0 1.5 N 2
Maid 97
Post re bracket for "No Loading" sign outside
Romney House in Romney Place
Roadside 576253 155534 NO2 Y 5.0 2.1 N 2
Maid 98 Post re bracket for "No Loading" sign outside
Miller House Roadside 576258 155422 NO2 Y 5 3 N 2
Maid 99
On metal post on left-hand side of road bridge
which crosses M2 approached from south (Bredhurst).Triplicate
site.
Roadside 579258 162300 NO2 N 77 1 (above) N 1
Maid 101
On green fence post by sign for Kent Medical
Other 578049 157248 NO2 N >100 Approx 55m from A249 &
N 2

LAQM Annual Status Report 2019 29
Site ID Site Name Site Type X OS Grid Ref
Y OS Grid Ref
Pollutants Monitored
In AQMA?
Distance to Relevant Exposure
(m) (1)
Distance to kerb of nearest
road (m) (2)
Tube collocated
with a Continuous Analyser?
Height (m)
Campus development, accessed by Private Road for Newnham
Court (Close to M20)
130m from M20 roundabout etc)
Maid 102
On fence near public toilets as you enter EDF
substation carpark Other 575753 155615 NO2 Y N/A 9 N 1.5
Maid
103
On plastic down-pipe Corner of Ashley
Gardens Care Centre, 419 Sutton Rd
Maidstone ME15 8RA (opposite Bellmeadow)
Roadside 578391 152617 NO2 N 0 10 N 2
Maid
104
On low metal bar next to metal junction box at
Wrens Cross Maidstone Roadside 576281 155408 NO2 N 5.6 5.4 N 0.4
Maid
105
On wooden fence post down the slope towards Harp Farm Rd on right hand side of M2 bridge
at Westfield Sole
Other 577289 161502 NO2 N 17.3
19m from M20 to North
(nearest road is actually Harp
Farm Rd)
N 1
Maid
106
On down-pipe to the left of front bay window at
432 Loose Road, Maidstone, ME15 9UA
Roadside 576449 153400 NO2 N 0 9m N 1.3
Maid
107
On down pipe to the left of front door at 7
Ashford Road, Bearsted, Kent. ME14 4BP
Roadside 578617 155398 NO2 N 0 15m N 1.3

LAQM Annual Status Report 2019 30
Site ID Site Name Site Type X OS Grid Ref
Y OS Grid Ref
Pollutants Monitored
In AQMA?
Distance to Relevant Exposure
(m) (1)
Distance to kerb of nearest
road (m) (2)
Tube collocated
with a Continuous Analyser?
Height (m)
Maid
108
High up on down-pipe to left of front door at 13
Barming Walk, Hermitage Lane,
Barming, ME16 9AH
Roadside 573263 155157 NO2 N 0 9m N 2
Maid
109
Cookes Cottages, Grane Lane, Boxley,
Kent. ME14 3BX. Other 576476 158231 NO2 N 0 102m N 2
Maid
110
Tonbridge Road (on lamp post near No 3)
Roadside 575540 155435 NO2 Y 2.8 1.5m N 2
Maid 111
Mote Road. On lamp post adjacent to
pedestrian crossing on Wat Tyler Way (Wren's
Cross) near Miller House.
Roadside 576287 155404 NO2 Y 9.8 1.3m N 2
Maid 112
New Cut Road. On Turkey Mill roadsign
near traffic lights (pole nearest back garden
wall of nearest residence)
Roadside 577770 155613 NO2 N 6.4 2.6m N 1.5
Maid 113
Tube located on lamp-post outside 1 Ashford Road, Bearsted, Kent,
ME14 5BJ.
Roadside 578567 155392 NO2 N 8.8 2.4m N 1.5
Maid 114
To replace triplicate site Maid 102 - speed sign
on pole on left-hand side of road bridge which
Roadside 579272 162291 NO2 N 35 15m N 1.5

LAQM Annual Status Report 2019 31
Site ID Site Name Site Type X OS Grid Ref
Y OS Grid Ref
Pollutants Monitored
In AQMA?
Distance to Relevant Exposure
(m) (1)
Distance to kerb of nearest
road (m) (2)
Tube collocated
with a Continuous Analyser?
Height (m)
crosses M2 approached from south (Bredhurst)
Maid 115
On pole immediately adjacent to side wall of
The Swan PH (to replace Maid 106 on opposite side of the
road)
Roadside 576476 153376 NO2 N 0 2m N 1.5
Maid 116
On telegraph pole by front garden wall of 37 Forstal Rd Cottages (to replace Maid 57 since
new resident has destroyed original site)
Roadside 573972 158753 NO2 Y 4.3 1m N 1.5
Maid 117
On lampost adjacent to drive though area of
McDonalds Roadside 575698 155448 NO2 Y 31m 1.3m N
2.5m from
pavement but
2m from
ground level of drive
through
Maid 118
On down-pipe to left of main hospital entrance (forward most façade)
Roadside 573304 155731 NO2 N 0 3 N 1.5
Maid 119
On down-pipe to right of 62 Tarragon Road
Roadside 573384 155479 NO2 N 0 4.2m N 2

LAQM Annual Status Report 2019 32
Site ID Site Name Site Type X OS Grid Ref
Y OS Grid Ref
Pollutants Monitored
In AQMA?
Distance to Relevant Exposure
(m) (1)
Distance to kerb of nearest
road (m) (2)
Tube collocated
with a Continuous Analyser?
Height (m)
Maid 120
Tube on lampost bracket near garden wall
to rear of St Andrew's Park
Roadside 573290 155070 NO2 Y 84 2m N 1.5
Maid 121
Tube site intially (Aug to Oct) on down-pipe on
corner of front façade of 46 Springwood Lane,
but then realised corners are not
recommended in guidance so moved to second down-pipe on front façade near gate
Roadside 573273 155107 NO2 N 0 5m N 1.5
Maid 122
Loading sign to the right of the front of the
Papermakers Arms PH* Roadside 576386 155035 NO2 Y 0 1.5m N 1.5
Maid 123
Loading sign on opposite side of Upper Stone St to Maid 122*
Roadside 576378 155033 NO2 Y 6.6 1.5m N 1.5
Maid 124
Fence pole at back of site for proposed
development at 102 Upper Stone St*
[*NB. Sites Maid 122-4 replacing triplicate Maid
114, in favour of checking accuracy of 2015 AQ contour lines
Roadside 576336 155031 NO2 N 0 40m N 1.5

LAQM Annual Status Report 2019 33
Site ID Site Name Site Type X OS Grid Ref
Y OS Grid Ref
Pollutants Monitored
In AQMA?
Distance to Relevant Exposure
(m) (1)
Distance to kerb of nearest
road (m) (2)
Tube collocated
with a Continuous Analyser?
Height (m)
modelled for Council by AQS ]
Maid 125
Tube located in no-loading sign on lampost
to rear of garden wall behind Langley House
etc (to replace Maid 120)
Roadside 573285 155266 NO2 N 3 2.6 N 2
Maid 126
Tube located opposite Maid 125 on lamppost
adjacent to 5a Hermitage Lane (in
addition to Maid 121)
Roadside 573269 155266 NO2 N 3.0 2.6 N 2
Maid 127
Tube located in bracket of Give Way sign on
opposite side of Wren's Cross to Maid 111
Roadside 576295 155376 NO2 Y 2 1.5 N 2
Maid
128
Site located in cage for air intake of new urban
AQ station in Upper Stone Street
Roadside 576337 155183 NO2 Y ???? 1.5 Y 2
Maid 129
Site Located in bracket of road sign at South-West façade of club
(opposite end to Town Hall) Middle Row
Roadside 575928 155652 NO2 Y 1 3 N 2
Maid 130
Site located on Lampost adjacent to roundabout
near planned development site by
Roadside 577843 157243 NO2 N 2 1.5 N 2

LAQM Annual Status Report 2019 34
Site ID Site Name Site Type X OS Grid Ref
Y OS Grid Ref
Pollutants Monitored
In AQMA?
Distance to Relevant Exposure
(m) (1)
Distance to kerb of nearest
road (m) (2)
Tube collocated
with a Continuous Analyser?
Height (m)
M20
Maid 131
On lamppost adjacent to nearest new home of new road called Buffkyn Way (replacing Maid 89 on opposite side of Sutton Rd)
Roadside 579090 152270 NO2 N 1.5 2 N 2
Maid 132
On Roadsign outside 18 Mote Road (Replaces Maid 86)
Roadside 576368 155408 NO2 Y 1.7 2 N 1.7
(1) 0m if the monitoring site is at a location of exposure (e.g. installed on/adjacent to the façade of a residential property).
(2) N/A if not applicable.
.
Table A.3 – Annual Mean NO2 Monitoring Results
Site ID Site Type Monitoring Type Valid Data Capture
for Monitoring Period (%)
(1)
Valid Data Capture 2018
(%) (2)
NO2 Annual Mean Concentration (µg/m3)
(3)
2011 2012 2013 2014 2015 2016 2017 2018
CM1 Roadside Automatic Closed Closed 53.5 43.2 48.1 46.9 40.1 38 Site
closed
CM2 Rural
Background Automatic 99.2% 99.2% 12.5 13.7 13.5 12.3 12.6 12 13
11
CM3 Roadside Automatic 89.5 58.1 - - - - - - - 70 (a)

LAQM Annual Status Report 2019 35
Site ID Site Type Monitoring Type Valid Data Capture
for Monitoring Period (%)
(1)
Valid Data Capture 2018
(%) (2)
NO2 Annual Mean Concentration (µg/m3)
(3)
2011 2012 2013 2014 2015 2016 2017 2018
Maid 06.1
Rural Diffusion Tube 100.0% 100.0% 15.9 16 15.1 13.3 12.2 12.64 12.6 10.8
Maid 06.2
Rural Diffusion Tube 100.0% 100.0% - - - - - - - 10.6
Maid 06.2
Rural Diffusion Tube 91.7% 91.7% - - - - - - - 10.1
Maid 10 Other Diffusion Tube 100% 100% 32.3 29.3 34.5 29.8 27.4 30.95 30.3 26.7
Maid 11 Other Diffusion Tube 66.7% 66.7% 32.3 26.6 28.8 29.4 27.0 24.73 25.1 21.7 (a)
Maid 19 Roadside Diffusion Tube 75% 75% 28.8 25.6 27.1 26.8 22.4 23.78 22.8 22.1
Maid 20 Roadside Diffusion Tube 91.7% 91.7% 29.4 29.2 31.6 29.7 24.8 28.13 27.1 26.2
Maid 22 Roadside Diffusion Tube 100% 91.7% 32.5 30.6 31.7 29.5 25.6a 28.59 28.5 25.4
Maid 26 Roadside Diffusion Tube 100% 100% 39 32.4 30.6 34.9 30.7 31.03 33.5 29.3
Maid 27 Roadside Diffusion Tube 100% 100% 44.9 38.1 37.8 44.1 37.0 36.39 33.8 33.2
Maid 29 Roadside Diffusion Tube 83.3% 83.3% 37.5 28.6 33.5 32 30.3 30.94 34.3 31.5
Maid 36 Roadside Diffusion Tube 33.3% 33.3% 46.3 39.4 42.3a 46.5a 39.4 40.69 36.8 29.9 (a)
Maid 44 Roadside Diffusion Tube 75% 75% 41.2 41.1 43.5 42.3 34.2 38.09 36.2 35.1
Maid 45 Urban
Background Diffusion Tube 91.7% 91.7% 22 21.1 22.3 17.7 17.1 17.84 16.6 13.7
Maid 46 Urban
Background Diffusion Tube 41.7% 41.7% 16.3 18 17.2a 15.0a 13.2a 14.89(a) 14.5 14 (a)
Maid 49 Roadside Diffusion Tube 83.3% 83.3% 43.1 39.4 43.2 42.4 36.2 40.22 36.5 33.0
Maid 51 Roadside Diffusion Tube 91.7% 91.7% 44 40.5 46.5 42.9 33.4 40.42 36.7 35.7
Maid 52 Roadside Diffusion Tube 100% 100% 48 42 46 44.7 37.7 42.87 38.2 29.7
Maid 53 Roadside Diffusion Tube 83.3% 83.3% 60.2 53.5 61.7 50.5 55.4 58.60 59.1 52.4
Maid 56 Roadside Diffusion Tube 100.0% 100.0% 30.4 27.7 27.6 36.8 27.5 27.76 27.0 21.1
Maid 63 Roadside Diffusion Tube 100% 100% 40.7 35.5 35.6 38.6 32.4 34.91 34.4 30.1
Maid 66 Other Diffusion Tube 100% 100% 34.9 31.7 35.4a 34.8 29.5 30.97 29.1 28.4
Maid 68 Roadside Diffusion Tube 91.7% 91.7% 43.8 35.3 39.9 36.1 34.9 36.36 33.2 32.0
Maid 69 Roadside Diffusion Tube 100% 100% 31.5 24.2 25.8 26.1 22.0 25.99 24.5 22.8
Maid 70 Roadside Diffusion Tube 100% 83.3% 47.9 37.8 35.2 43.2 38.3 38.52 37.6 35.3
Maid 74 Roadside Diffusion Tube 100% 100% 38.1 32.3 34.3 35.6 32.9a 33.32 34.8 29.6
Maid 75 Roadside Diffusion Tube 100% 100% 37.4 30.6 31 32.2 28.5 27.10 28.9 23.7
Maid 80 Roadside Diffusion Tube 91.7% 91.7% - 41.6 39 41.9 33.9 35.23 35.0 31.9

LAQM Annual Status Report 2019 36
Site ID Site Type Monitoring Type Valid Data Capture
for Monitoring Period (%)
(1)
Valid Data Capture 2018
(%) (2)
NO2 Annual Mean Concentration (µg/m3)
(3)
2011 2012 2013 2014 2015 2016 2017 2018
Maid 81 Roadside Diffusion Tube 100% 100% 84.8 87.3 81.7 74.8a 71.5 71.26 67.7 67.3
Maid 84 Roadside Diffusion Tube 100% 100% - 26.6 31.9 29.5 26.3 35.08 30.4 24.7
Maid 86 Roadside Diffusion Tube 83.1% 83.1% - 33.2 37.9 39.4 33.5 30.17 35.8 30.8
Maid 89 Roadside Diffusion Tube 41.7% 100% - - 27.4a 29.3 25.6 25.38 26.5 22.2 (a)
Maid 90 Kerbside Diffusion Tube 66.7% 66.7% - - 35.8a 37.2 32.9 32.77 34.2 29.3
Maid 93 Suburban Diffusion Tube 83.3% 83.3% - - (35.2a) 30.2 24.4 26.46 26.3 23.9
Maid 94 Roadside Diffusion Tube 100% 100% - - - - 31.3 35.51 35.4 35
Maid 96 Roadside Diffusion Tube 100% 100% - - - - 94.8a 83.84 79.3 77.2
Maid 97 Roadside Diffusion Tube 100% 100% 38.61 41.9 40.3
Maid 98 Roadside Diffusion Tube 75% 75% 35.22 34.8 34.7
Maid 101
Other Diffusion Tube 100% 100% 33.08 33.1 27.4
Maid 102
Other Diffusion Tube 33.3% 100% 30.11 28.8 26.9 (a)
Maid 103
Roadside Diffusion Tube 91.7% 100% 23.54 22.1 20.0
Maid 105
Other Diffusion Tube 100% 100% 24.66(a) 24.1 21.5
Maid 108
Roadside Diffusion Tube 58.3% 58.3% 23.75(a) 23.4 22.6 (a)
Maid 110
Roadside Diffusion Tube 91.7% 91.7% 28.98(a) 33.8 29.7
Maid 111
Roadside Diffusion Tube 91.7% 91.7% 30.4 30.0
Maid 112
Roadside Diffusion Tube 100% 100% 41.4 34.9
Maid 113
Roadside Diffusion Tube 81.3% 81.3% 44.5 46.4
Maid 114
Roadside Diffusion Tube 31.1 N/A
Maid 115
Roadside Diffusion Tube 100% 100% 35.8 32.2
Maid 116
Roadside Diffusion Tube 91.7% 91.7% 58.5 53.3

LAQM Annual Status Report 2019 37
Site ID Site Type Monitoring Type Valid Data Capture
for Monitoring Period (%)
(1)
Valid Data Capture 2018
(%) (2)
NO2 Annual Mean Concentration (µg/m3)
(3)
2011 2012 2013 2014 2015 2016 2017 2018
Maid 117
Roadside Diffusion Tube 100% 100% 31.8 34.5
Maid 118
Roadside Diffusion Tube 100% 100% 17 17.6
Maid 119
Roadside Diffusion Tube 100% 100% 15.2 15.3
Maid 120
Roadside Diffusion Tube 16.7% 100% 20.2 25.8 (a)
Maid 121
Roadside Diffusion Tube 91.7% 100% 30.7 23.3
Maid 122
Roadside Diffusion Tube 91.7% 91.7% 58.7 79.2
Maid 123
Roadside Diffusion Tube 100% 100% 59 53.5
Maid 124
Roadside Diffusion Tube 100% 100% 16.1 19.9
Maid 125
Roadside Diffusion Tube 58.3% 58.3% 23.3 (a)
Maid 126
Roadside Diffusion Tube 66.6% 66.6% 26.2 (a)
Maid 127
Roadside Diffusion Tube 83.7% 83.7% 36.2
Maid 128.1
Roadside Diffusion Tube 66.6% 100% 67.7(a)
Maid 128.2
Roadside Diffusion Tube 66.6% 100% 67.3 (a)
Maid 128.3
Roadside Diffusion Tube 66.6% 100% 68.1 (a)
Maid 129
Roadside Diffusion Tube 50% 50% 29.3 (a)
Maid 130
Roadside Diffusion Tube 50% 100% 26.3 (a)
Maid 131
Roadside Diffusion Tube 58.3% 100% 28.5 (a)

LAQM Annual Status Report 2019 38
Notes: Exceedances of the NO2 annual mean objective of 40µg/m3 are shown in bold.
NO2 annual means exceeding 60µg/m3, indicating a potential exceedance of the NO2 1-hour mean objective are shown in bold and underlined.
(1) data capture for the monitoring period, in cases where monitoring was only carried out for part of the year.
(2) data capture for the full calendar year (e.g. if monitoring was carried out for 6 months, the maximum data capture for the full calendar year is 50%).
(3) Means for diffusion tubes have been corrected for bias. All means have been “annualised” as per Technical Guidance LAQM.TG16 if valid data capture for the full calendar year is less than 75%. See Appendix C for details.
Table A.4 – 1-Hour Mean NO2 Monitoring Results
Site ID
Site Type Monitoring
Type
Valid Data Capture for Monitoring
Period (%) (1)
Valid Data Capture 2018
(%) (2)
NO2 1-Hour Means > 200µg/m3 (3)
2011 2012 2013 2014 2015 2016 2017 2018
CM1 Roadside Automatic N/A N/A 0 0 0 2 0 0 Site
Closed N/A
CM2 Rural
Background Automatic 99.2% 99.2% 0 0 0 0 0(68.9) 0 0 0
CM3 Roadside Automatic 89.5% 58.1% 1(174)
Notes: Exceedances of the NO2 1-hour mean objective (200µg/m3 not to be exceeded more than 18 times/year) are shown in bold.
(1) data capture for the monitoring period, in cases where monitoring was only carried out for part of the year.
(2) data capture for the full calendar year (e.g. if monitoring was carried out for 6 months, the maximum data capture for the full calendar year is 50%).
(3) If the period of valid data is less than 85%, the 99.8th percentile of 1-hour means is provided in brackets.

LAQM Annual Status Report 2019 39
Table A.5 – Annual Mean PM10 Monitoring Results
Site ID
Site Type
Valid Data Capture for Monitoring
Period (%) (1)
Valid Data Capture 2018
(%) (2)
PM10 Annual Mean Concentration (µg/m3) (3)
2011 2012 2013 2014 2015 2016 2017 2018
CM1 Roadside - - 26.5 24.9 24.5 22.6 22 24 Site
Closed N/A
CM2 Rural Background 98.60%
98.60%
15.8 17.5 18.8 25.3 19.4 20 13
20
CM3 Roadside 97.3% 62.9% 25
Notes: Exceedances of the PM10 annual mean objective of 40µg/m3 are shown in bold.
(1) data capture for the monitoring period, in cases where monitoring was only carried out for part of the year.
(2) data capture for the full calendar year (e.g. if monitoring was carried out for 6 months, the maximum data capture for the full calendar year is 50%).
(3) All means have been “annualised” as per Technical Guidance LAQM.TG16, valid data capture for the full calendar year is less than 75%. See Appendix C for details.
Table A.6 – 24-Hour Mean PM10 Monitoring Results
Site ID
Site Type Valid Data Capture
for Monitoring Period (%) (1)
Valid Data Capture 2018
(%) (2)
PM10 24-Hour Means > 50µg/m3 (3)
2011 2012 2013 2014 2015 2016 2017 2018
CM1 Roadside Closed Closed 11 11 11 10 3 5 Site
closed
Site
closed
CM2 Rural
Background 98.6% 98.6% 8 10 (33) 1 18 3 4 0 4

LAQM Annual Status Report 2019 40
Site ID
Site Type Valid Data Capture
for Monitoring Period (%) (1)
Valid Data Capture 2018
(%) (2)
PM10 24-Hour Means > 50µg/m3 (3)
2011 2012 2013 2014 2015 2016 2017 2018
CM3 Roadside 96.9% 62.9% - - - - - - - 1(38)
Notes: Exceedances of the PM10 24-hour mean objective (50µg/m3 not to be exceeded more than 35 times/year) are shown in bold.
(1) data capture for the monitoring period, in cases where monitoring was only carried out for part of the year.
(2) data capture for the full calendar year (e.g. if monitoring was carried out for 6 months, the maximum data capture for the full calendar year is 50%).
(3) If the period of valid data is less than 85%, the 90.4th percentile of 24-hour means is provided in brackets.
Table A.7 – PM2.5 Monitoring Results
Site ID Site Type Valid Data Capture for Monitoring
Period (%) (1)
Valid Data Capture
2018 (%) (2)
PM2.5 Annual Mean Concentration (µg/m3)
(3)
2014 2015 2016 2017 2018
CM3 Roadside 97.3 63.2 n/a n/a n/a n/a 18
Notes:
(1) Data capture for the monitoring period, in cases where monitoring was only carried out for part of the year.
(2) Data capture for the full calendar year (e.g. if monitoring was carried out for 6 months, the maximum data capture for the full calendar year is 50%).
(3) All means have been “annualised” as per Boxes 7.9 and 7.10 in LAQM.TG16, valid data capture for the full calendar year is less than 75%. See Appendix C for details.

LAQM Annual Status Report 2019 41
Appendix B: Full Monthly Diffusion Tube Results for 2018
Table B.1 – NO2 Monthly Diffusion Tube Results - 2018
Site ID
NO2 Mean Concentrations (µg/m3)
Jan Feb Mar Apr May Jun Jul Aug Sep Oct Nov Dec
Annual Mean
Raw Data
Bias Adjusted
(0.76)
Maid 06.1 20.3 17.5 15.8 12.9 10.5 9.1 9.9 11.5 12.7 15 16.7 18 14.2 10.8
Maid 06.2 20.1 17.8 13.5 11.4 11.9 8.7 8.8 11.4 12.6 14.5 16.6 20.4 14.0 10.6
Maid 06.3 18.8 15.2 14.8 11.4 12.2 7.8 9 - 13.4 16.1 11.8 16.4 13.4 10.1
Maid 10 40.8 45 41 29.5 41.4 25.5 28.2 29.9 31.1 35.7 31.6 42.1 35.2 26.7
Maid 11 38.2 28 31.7 31.4 - 15.5 25.3 26.1 - 26.6 - - 28.5 (a) 21.7
Maid 19 - - 34.9 - 32.2 22.8 22 23.1 26.1 33 31.1 36.1 29.1 22.1
Maid 20 - 41.8 42.1 31.4 35.5 25.7 27.4 25.9 32 42.4 33.3 41 34.4 26.2
Maid 22 34.5 28.6 31.4 32.9 32.4 23.6 33.3 30.9 37.1 38.4 33.6 44.8 33.5 25.4
Maid 26 37.9 40.9 42.2 39.8 36.8 28.1 36.4 36.4 37.4 45.4 35.8 45.3 38.5 29.3
Maid 27 47.5 29.6 44.6 47.3 43.4 39.4 44.8 39.3 40.5 50.7 46.9 50.5 43.7 33.2
Maid 29 44.8 41 42.2 41.7 - 33.2 39.4 36.5 39.3 51.3 44.7 - 41.4 31.5
Maid 36 49 48.2 40.9 - - 32.9 - - - - - - 39.4 (a) 29.9
Maid 44 46 53.2 48.1 - - 39.1 44.5 - 39.8 49.1 45.9 50.3 46.2 35.1
Maid 45 23.7 21.1 20.7 16.6 15.7 12.4 13.4 16.4 - 17.2 17.3 24.1 18.1 13.7
Maid 46 - - - - 10.5 20.3 13.8 15.9 22.9 18.4 (a) 14.0
Maid 49 44.6 51 42.1 40.1 - - 40.8 36.2 38.9 46.9 41.5 51.7 43.4 33.0
Maid 51 43.9 55.2 48.3 43.2 59.2 40.2 45.7 - 42.2 48.7 42.7 - 46.9 35.7
Maid 52 53.6 50.6 42.1 47.4 42.1 15.5 17.1 28.4 31.2 35.5 52 53.1 39.1 29.7
Maid 53 76.8 72.2 71.9 64.1 75.2 55.9 43.5 71.4 76.1 67.2 72.2 81.2 69.0 52.4
Maid 56 32.8 33.6 26.5 24.2 25.3 20.1 24.7 26.3 28.6 31.6 26.3 33.5 27.8 21.1
Maid 63 45.4 41.8 46.3 44 31.9 26 41.9 35.8 38.4 37.9 41.4 44.4 39.6 30.1
Maid 66 43.6 45.8 47.2 42.6 30 28.9 32.8 27.4 27.9 34.6 50.8 36.3 37.3 28.4
Maid 68 43.3 38.2 46.5 40.7 38.7 - 39.2 34 42.3 51 44.3 44.9 42.1 32.0

LAQM Annual Status Report 2019 42
Site ID
NO2 Mean Concentrations (µg/m3)
Jan Feb Mar Apr May Jun Jul Aug Sep Oct Nov Dec
Annual Mean
Raw Data
Bias Adjusted
(0.76)
Maid 69 34.9 36.8 33.7 31.4 22.7 18.9 23.6 21.6 24.3 38.9 33.5 39.3 30.0 22.8
Maid 70 - 49 51.5 44.9 40.7 35.6 48.2 44 44.4 52.8 - 53.3 46.4 35.3
Maid 74 42.2 42.6 39.3 38.2 34.8 28.8 35.3 36.2 41.6 40.2 44.2 44 39 29.6
Maid 75 36.4 28.9 33.6 32.4 23.3 20 30.5 30.9 29.7 32.3 36.8 39.9 31.2 23.7
Maid 80 41.1 45.7 45.8 43.2 40.6 26.7 38.8 - 39.2 45.2 41.8 52.9 41.9 31.9
Maid 81 85.3 81.4 99.2 91.6 100.1 73.7 92.1 81.8 88.3 91.2 86.5 91 88.5 67.3
Maid 84 41.3 40.8 38.4 34.9 37.9 20.2 23.4 22.6 24.8 32.3 30.5 43.1 32.5 24.7
Maid 86 46.7 31.4 50.5 37.5 45.4 34.6 37.2 40.2 41.8 39.9 - - 40.5 30.8
Maid 89 29.5 33 29.5 28.1 38.2 - - - - - - - 29.2 (a) 22.2
Maid 90 41.8 40.7 46.1 - 37.3 30.8 - 34.4 37.6 - - 45.3 38.5 29.3
Maid 93 38.4 31.9 27.8 15.6 25.6 27 40.9 37.1 29.8 40.8 31.5 23.9
Maid 94 47.8 49.6 48.8 43.4 47.2 40.1 47.9 42.5 38.5 53.8 45.1 47.2 46 35
Maid 96 88 114.9 89 99.6 117.8 108.1 108.9 95.7 91.2 119.9 99.6 85.9 101.6 77.2
Maid 97 55.6 56.6 51.5 54.9 61.6 51.2 56.8 51.6 50.9 - 40.1 - 53.1 40.3
Maid 98 - - 41.7 55.9 55.2 49.1 39.3 36.4 43.9 44.2 45.6 45.7 34.7
Maid 101 45.6 40.7 29.4 31.1 40 27.7 28.9 32.2 35.3 43.2 31.3 46.9 36.0 27.4
Maid 102.1 40.4 45.8 44.4 38.8 37.3 (a) 28.4
Maid 102.2 32.9 39.4 43.5 39.1 34.1 (a) 25.9
Maid 102.3 41 39.3 44 33.9 34.8 (a) 26.4
Maid 103 29 29.9 25.7 25.7 25.3 18.3 21.8 25.3 27.2 30.7 30.5 - 26.3 20.0
Maid 105 30.4 35.9 29.8 23.9 40.6 28.1 23.6 21.9 23.9 30.4 22.6 29.1 28.4 21.5
Maid 108 32.5 34.4 29.3 27.2 30.6 17.4 39.6 29.8 (a) 22.6
Maid 110 44 42.1 37.7 35.2 41.5 32 36.5 33.2 38.6 39.9 40.2 48.4 39.1 29.7
Maid 111 - 41.3 40.6 37.6 53.2 41.8 30.8 32 35.4 44.9 47.5 40.8 39.5 30.0
Maid 112 45.3 42.4 44.2 43.5 55.2 46.7 53.7 47.1 44.7 45.6 37.3 45.1 45.9 34.9
Maid 113 - 65.3 64.8 60.6 61.9 51.3 61 53.5 - 61.6 64.6 65.3 61.0 46.4
Maid 115 48.5 41.3 42.5 41.3 42.3 32.8 44.3 38.1 44.7 45.4 40.5 46.5 42.4 32.2

LAQM Annual Status Report 2019 43
Site ID
NO2 Mean Concentrations (µg/m3)
Jan Feb Mar Apr May Jun Jul Aug Sep Oct Nov Dec
Annual Mean
Raw Data
Bias Adjusted
(0.76)
Maid 116 72.7 63.1 77.3 - 85.6 60.7 85.6 65.6 74.6 69.8 62.1 75.2 72 53.3
Maid 117 46.9 46.8 52.6 38.1 59 42 42.2 31.1 38.9 51.5 41.9 53 45.3 34.5
Maid 118 26.9 27.3 23.1 19.9 21.9 14.2 18.8 18.5 20.2 26.4 24.5 29.4 22.6 17.6
Maid 119 21.1 24.5 20.8 18.2 21.4 12.1 16 15.3 18.1 22.5 21.5 27.9 20.0 15,3
Maid 120 26.7 57.1 - 33.9 (a) 25.8
Maid 121 - 33.3 27.5 25.8 43.4 29.4 27.3 22.9 23.7 30.7 30.8 32 29.7 23.3
Maid 122 96.7 108.1 116.7 121.7 98 102.5 92.7 84.6 129 104.3 92.6 104.3 79.2
Maid 123 82.7 81.3 60.8 71.8 72.5 55.9 70.6 64 65.9 85.3 66.8 67.7 70.4 53.5
Maid 124 28.2 32.1 30.9 24.4 26.1 20.4 19.9 20.9 22.1 28.5 29.5 31 26.2 19.9
Maid 125 26 32.8 - 24.7 28.5 39.6 31.7 38.6 30.7 (a) 23.3
Maid 126 37.8 35.8 37.9 21.6 27.8 34.3 36.4 44 34.5 (a) 26.2
Maid 127 50.3 53.7 48.9 46.5 47 43.2 40.6 49.5 42.9 54.1 47.7 36.2
Maid 128.1 75.1 72.6 91.2 81.1 84.6 85.4 92.9 76.9 89.1 (a) 67.7
Maid 128.2 74.4 70.8 88.1 75.5 81.7 102.1 82.8 80.1 88.5 (a) 67.3
Maid 128.3 79.4 72.9 85.9 73.7 87.5 99.2 89.4 76.1 89.6 (a) 68.1
Maid 129 36.3 32.9 32.8 35.6 45.7 47.6 38.5 (a) 29.3
Maid 130 26.1 26.5 30.7 33.9 35.3 48.8 34.6 (a) 26.3
Maid 131 29.4 31.4 32.1 36.8 39.7 37.8 37.5 37.5 (a) 28.5
(1) See Appendix C for details on bias adjustment

LAQM Annual Status Report 2019 44
Appendix C: Supporting Technical Information / Air Quality Monitoring Data QA/QC
Diffusion Tube Bias Adjustment Factors
The diffusion tubes are supplied and analysed by Environmental Scientifics Group
(ESG) Didcot utilising the 50% triethanolamine (TEA) in acetone preparation method.
A national bias adjustment of 0.76 for the year 2018 (based on 28 studies) has been
derived from the national bias adjustment calculator.
For previous data, years 2011 to 2017, the bias adjustment factors have been taken
from the Council’s previous LAQM annual reports. The factors used were 0.92
(2011), 0.79 (2012), 0.88 (2013), 0.88 (2014) 0.79 (2015) 0.79 (2016) and 0.77
(2017)
Factor from Local Co-location Studies
Maidstone Borough Council has triplicate tubes located at Maidstone Rural site
(diffusion tube site Maid 06) and since May 2018, has also had triplicate tubes co-
located with the new air quality station in Upper Stone Street.
A factor of 0.81 was produced from the Maidstone Rural co-location survey using
eleven periods of data with good diffusion tube precision and good data capture (see
Table C.1).
Table C.1– Local Bias Factors
Site ID
Diffusion Tube Data
capture
Continuous Monitor Data Capture for
Periods Used
Diffusion Tube Annual Mean (μg/m
3)
Continuous Monitor Annual Mean (μg/m
3)
Bias Factor
A
Bias Factor
B
CM2 100% 98% 16 13 0.78 29%
CM3

LAQM Annual Status Report 2019 45
Figure C.1 – Maidstone Rural
Figure C.2 – Maidstone Upper Stone Street.

LAQM Annual Status Report 2019 46
Discussion of Choice of Factor to Use
Data has been corrected using a bias adjustment factor, which is an estimate of the
difference between diffusion tube concentrations and continuous monitoring, the
latter assumed to be a more accurate method of monitoring. The technical guidance
LAQM.TG 16 provides guidance with regard to the application of a bias adjustment
factor to correct diffusion tubes. Triplicate co-location studies can be used to
determine a local bias factor based on the comparison of diffusion tube results with
data from NOx / NO2 continuous analysers. Alternatively, the national database of
diffusion tube co-location surveys provides bias factors for the relevant laboratory
and preparation method.
With regard to the application of a bias adjustment factor for the diffusion tubes, the
technical guidance LAQM.TG 16 and LAQM Helpdesk recommends the use of a
local bias adjustment factor where available and relevant to diffusion tube sites.
In the previous two years, Maidstone has had no town centre monitoring station; it’s
only automatic monitoring station being the rural station at Detling. In both years, the
local and national bias correction factors were very similar. In 2016 the local and
national bias correction factors were 0.79 and 0.78 respectively, and in 2017, they
were 0.78 and 0.77 respectively. The guidance states that a local bias correction
should be used where available and relevant to diffusion tube sites. It is therefore
the case that since most of the diffusion tube sites are roadside sites, the use of the
Detling site to calculate a bias correction factor is not ideal, Nevertheless, because of
the small difference between the 2 factors, it has been felt that data will be more
robust if we err on the side of caution and use the larger of the two factors.
In 2018, however, the difference between the local and national correction factors
was larger, with the local factor being 0.81 calculated using data from Detling Air
Quality station, and the national one being 0.76. It therefore seemed that using the
larger factor might be overly cautious, and the national factor was probably more
appropriate.
A bias correction factor was also calculated using the new monitoring station in
Upper Stone Street, however, the station was only commissioned on 9th May 2018,
which meant that the data capture for the year was only 58.1%. A couple of teething

LAQM Annual Status Report 2019 47
problems reduced the data capture for the period of operation to 89.5%. The bias
correction factor calculated for Upper Stone Street was 0.78. Although Upper Stone
Street would be a more relevant station to use for bias correction, the factor was not
used because of the low data capture.
Therefore it was decided to use the national bias adjustment factor (0.76) for the year
2018. The bias factor of 0.76 is slightly more consistent with factors used in recent
years.
Short-term to Long-term Data Adjustment
Data capture at all sites which recorded 75% data capture or less, during 2018 has
been annualised according to the method set out in LAQM TG(16) box 7.9. The
details of the annualisation have been provided in Table C.2.
Table C.2 – Short-Term to Long-Term Monitoring Data Adjustment
Site
Uncorrected Diffusion
Tube Mean (µg/m
3)
Detling AF Annualised Data Average µg/m
3
Annualised Bias Adjusted
Concentration (µg/m3)
Maid 11 27.9 1.02 28.5 21.7
Maid 36 42.8 0.92 39.4 29.9
Maid 46 16.7 1.1 18.4 14.0
Maid 89 31.7 0.92 29.2 22.2
Maid 90 39.3 0.98 38.5 29.3
Maid 102.1 42.4 0.88 37.3 28.4
Maid 102.2 38.7 0.88 34.1 25.9
Maid 102.3 39.6 0.88 34.8 26.4
Maid 108 30.1 0.99 29.8 22.6
Maid 120 41.9 0.81 33.9 25.8
Maid 125 31.7 0.97 30.7 23.3
Maid 126 34.5 1.0 34.5 26.2
Maid 128.1 82.5 1.08 89.1 67.7
Maid 128.2 81.9 1.08 88.5 67.3
Maid 128.3 83 1.08 89.6 68.1
Maid 129 38.5 1 38.5 29.3
Maid 130 33.6 1.03 34.6 26.3
Maid 131 35 1.07 37.5 28.5

LAQM Annual Status Report 2019 48
Further QA/QC AQMS Network Manager
QA/QC of Automatic Air Quality Instruments
Air quality measurements from automatic instruments are validated and ratified to the
standards described in the Local Air Quality Management – Technical Guidance
LAQM (TG16)
https://laqm.defra.gov.uk/technical-guidance
by Air Quality Data Management (AQDM) http://www.aqdm.co.uk
Validation
This process operates on data during the data collection stage. All data are
continually screened algorithmically and manually for anomalies. There are several
techniques designed to discover spurious and unusual measurements within a very
large dataset. These anomalies may be due to equipment failure, human error,
power failures, interference or other disturbances. Automatic screening can only
safely identify spurious results that need further manual investigation.
Raw data from the gaseous instruments (e.g. NOx, O3, SO2 and CO) are scaled into
concentrations using the latest values derived from the manual and automatic
calibrations. These instruments are not absolute and suffer drifts. Both the zero
baseline (background) and the sensitivity may change over time. Regular calibrations
with certified gas standards are used to measure the zero and sensitivity. However,
these are only valid for the moment of the calibration since the instrument will
continue to drift. Raw measurements from particulate instruments (e.g. PM10 and
PM2.5) generally do not require scaling into concentrations. The original raw data are
always preserved intact while the processed data are dynamically scaled and edited.
Ratification
This is the process that finalises the data to produce the measurements suitable for
reporting. All available information is critically assessed so that the best data scaling
is applied and all anomalies are appropriately edited. Generally this operates at
three, six or twelve month intervals. However, unexpected faults can be identified
during the instrument routine services or independent audits which are often at 6-
monthly intervals. In practice, therefore, the data can only be fully ratified in 12-month

LAQM Annual Status Report 2019 49
or annual periods. The data processing performed during the three and six monthly
cycles helps build a reliable dataset that is finalised at the end of the year.
There is a diverse range of additional information that can be essential to the correct
understanding and editing of data anomalies. These may include
er drift
2 conversion inefficiencies
ataset
-up after a powercut
The identification of data anomalies, the proper understanding of the effects and the
application of appropriate corrections requires expertise gained over many years of
operational experience. Instruments and infrastructure can fail in numerous ways that
significantly and visually affect the quality of the measurements. There are rarely
simple faults that can be discovered by computer algorithms or can be understood
without previous experience.
The PM10 concentrations require scaling into Gravimetric Equivalent concentration
units by use of the Volatile Correction Model (VCM) http://www.volatile-correction-
model.info or by corrections published by Defra https://uk-
air.defra.gov.uk/networks/monitoring-methods?view=mcerts-scheme depending on
the measurement technique.
Further information about air quality data management, expert data ratification and
examples of bad practices are given on the Air Quality Data Management (AQDM)
website http://www.aqdm.co.uk.

LAQM Annual Status Report 2019 50
QC Audits
The National Physical Laboratory, (NPL) carry out annual audits to rigorously
evaluate analysers to obtain an assessment of performance level. This information,
in conjunction with the full analyser data set and calibration and service records, help
ensure data quality specifications have been met during the preceding period.
Additionally, an assessment of the station calibration cylinder concentrations
provides an indication that the cylinder concentrations remain stable and therefore
suitable for data scaling purposes.
The following describes the audit process:-
1 Oxides of Nitrogen
1.1 Analyser Response Factors
A stable "intercalibration standard", validated against NPL primary standards,
is transported to each site and is sampled by the analyser.
The analyser also samples from a cylinder containing certified metrology
grade zero air, or catalytic scrubbers of known efficiency.
The analyser factor quoted is the response to the intercalibration standard,
expressed in nmol.mol-1.logged unit-1, with the zero point being the response
to zero air.
For oxides of nitrogen analysers, the NOx and NO channel response factors
are derived from an NO in nitrogen cylinder.
1.2 Analyser Linearity
To determine analyser linearity, a series of amount fractions are produced
(using dynamic dilution techniques) covering the analyser range. The analyser
output is noted for each of these amount fractions. A linear regression is then
carried out, relating analyser output to the dilution factor at each point. The
linearity error is defined as the maximum residual of the regression slope.
1.3 Analyser noise levels.
This is defined here as the standard error of ten successive spot readings of
analyser output when fully stabilised on zero (zero noise) or span (span noise)

LAQM Annual Status Report 2019 51
amount fraction.
1.4 NOx analyser Converter Efficiency
NO2 to NO Converter efficiency is determined as follows:
A stable amount fraction of NO is produced, (by two stage dynamic dilution)
and the analyser outputs, NOx and NO, are noted after a suitable stabilisation
period.
Ozone is added to the sample, converting some NO to NO2, note however, the
total NOx in the sample remains constant. Again, following appropriate
stabilisation times, the NOx and NO outputs are noted.
Converter (in)efficiency is defined as the change in scaled NOx signal as a
percentage ratio of the change in the scaled NO signal.
1.5 Estimation of Site Cylinder Amount fractions
The site cylinder amount fractions are evaluated by sampling from the site
cylinder and using the analyser response factors, section 1.1, to derive their
amount fraction.
2 Particle Analysers.
2.1 Analyser Flow Rates
Flow rates are measured by calibrated flow audit measurement systems. A
leak check is also carried out.
2.2 Analyser Calibration Constants
TEOM Analyser calibration constants are measured by consideration of the
change in frequency induced by placing pre-weighed masses on the analyser
sensors.
QA/QC of Diffusion Tube Monitoring
Socotec is a UKAS accredited laboratory and participates in the in the new AIR-PT
(Proficiency Test) Scheme previously known as the Workplace Analysis Scheme for
Proficiency (WASP)) for NO2 tube analysis and the Annual Field Inter-Comparison
Exercise. These provide strict performance criteria for participating laboratories to
meet, thereby ensuring NO2 concentrations reported are of a high calibre. The lab

LAQM Annual Status Report 2019 52
follows the procedures set out in the Harmonisation Practical Guidance. In the latest
available results, Socotec Didcot scored as follows: AIR-PT AR024 (Jan to Feb 2018)
100%, AIR-PT AR025 (April to May 2018) 100%, AIR-PT AR027 (July to August
2018) 100% and AIR-PT AR028 (September to October 2018) 100%. The
percentage score reflects the results deemed to be satisfactory based upon the z-
score of < ± 2. Based on 21 studies, 100% of all local Authority co-location studies in
2018, using the 50% TEA in acetone preparation method, were rated as ‘good’
(tubes are considered to have "good" precision where the coefficient of variation of
duplicate or triplicate diffusion tubes for eight or more periods during the year is less
than 20%).
Fall-off Distance Correction of Sites Exceeding the NO2 Annual Mean Objective
Distance corrections have been carried out, where appropriate, for all tubes which
have shown an exceedance in 2017. Some of the tubes showing an exceedance are
located on the facades of properties and therefore do not require distance correction.
The results of the distance correction are shown in Table C.3 and an example is
given in
Table C.3 – Fall-off Distance Correction of Sites Exceeding the NO2 Annual
Mean Objective (2018)
Site ID Site Name Distance to
kerb
Distance to relevant
exposure
Bias Adjusted Annual Mean
(µg/m3)
Distance Corrected
Annual Mean (µg/m
3)
Maid 53 Wheatsheaf PH 1.0m 1.9m 52.4 44.1
Maid 81 The Pilot Public
House 1.0 0m 67.3 67.3
Maid 96
Lashings sports club
Upper Stone Street
1.5m 0m 77.2 77.2
Maid 97 Outside Romney
House, in Romney Place
2.1m 5.0m 40.3 32.6
Maid 113 1 Ashford Road 2.4m 8.8m 46.4 34.3
Maid 116 Forstal Road
Cottages 1.0m 4.3m 53.3 40.0

LAQM Annual Status Report 2019 53
Maid 122 Papermakers
arms 1.5 0 58.7 58.7
Maid 123 Upper Stone
Street, opposite side to Maid 122
1.5 N/A 59 N/A
Maid 128 Upper Stone
Street, co-located with AQ station
1.5 N/A 65.9 N/A
Figure C.2 – Fall-off Distance Correction of the Site Maid 53
Biomass Combustion – Individual Installations
Maidstone Borough Council had previously identified a number of biomass
installations which are over the 50kW criteria for assessment. The details for these
installations are provided in Table C.4.
Two biomass installations, (Pinkhorn Green Farm and Elmscroft House) were
screened out in the 2016 ASR. No further information on other previously identified
biomass installations has been received, and no new planning applications for
biomass installations, have been submitted.

LAQM Annual Status Report 2019 54
Table C.4 – The Details for the Installations Identified
Installation: Comment:
Outline application (15/503359/OUT) with all matters reserved for residential development (approximately 89 dwellings) plus open space, biomass plant and access road (plus emergency access)
Land East Of Gleamingwood Drive Lordswood Kent. Permission granted on appeal December 2015.
The condition placed on the consent is given below:
No development shall commence until details of the biomass plant installation have been submitted to and approved in writing by the local planning authority.
The solid biomass boiler shall not exceed the following minimum emissions standards:180 mg/Nm
3 for NOx and 15 mg/Nm
3 for PM.
The installation shall be carried out in accordance with the approved
No further details relating to biomass specification available.
Ewell Manor, Ewell Lane, West Farleigh. Coppice Wood burner (571281, 152745) – the nearest residential exposure is 30m from the installation
The application confirmed by email on that whilst the property has built a biomass boiler has not been installed and currently there are no plans to install one.
Smiths Hall, Lower Road, West Farleigh, Maidstone. Wood Chip burner with a thermal output of 100kW (571343, 152610) – the nearest residential exposure is 76m from the installation
Email sent to the applicant on 13/12/16 requesting information – no reply received to date.
Little Addlestead, Yalding (570420,148834) – the nearest residential exposure is 60m from the installation
It is confirmed from the applicant that a gas boiler has been fitted rather than a biomass boiler. The Council is waiting for confirmation from the applicant that the boiler is for domestic use only or a larger installation.
Planning application 13/0819 - The Stumps, Lenham Road, Kingswood, ME17 1LX (584473, 150655)
The Scientific Officer wrote to the applicant in June 2015 and received no reply. The Scientific Officer has written again and the letter has been sent out on 20/12/16.

Maidstone Borough Council
LAQM Annual Status Report 2019 55
Appendix D: Map(s) of Monitoring Locations
Figure D.1 – Map of Non-Automatic Monitoring Sites: Maidstone Borough

Maidstone Borough Council
LAQM Annual Status Report 2019 56
Figure D.2 – Map of Non-Automatic Monitoring Sites: Harrietsham

Maidstone Borough Council
LAQM Annual Status Report 2019 57
Figure D.3– Map of Non-Automatic Monitoring Sites: A229

Maidstone Borough Council
LAQM Annual Status Report 2019 58
Figure D.4 – Map of Non-Automatic Monitoring Sites: M20

Maidstone Borough Council
LAQM Annual Status Report 2019 59
Figure D.5 – Map of Non-Automatic Monitoring Sites: M2

Maidstone Borough Council
LAQM Annual Status Report 2019 60
Figure D.6 – Map of Non-Automatic Monitoring Sites: Detling Hill

Maidstone Borough Council
LAQM Annual Status Report 2019 61
Figure D.7 – Map of Non-Automatic Monitoring Sites: Bearsted Road

Maidstone Borough Council
LAQM Annual Status Report 2019 62
Figure D.8 – Map of Non-Automatic Monitoring Sites: Park Wood

Maidstone Borough Council
LAQM Annual Status Report 2019 63
Figure D.9 – Map of Non-Automatic Monitoring Sites: M20 Map 2

Maidstone Borough Council
LAQM Annual Status Report 2019 64
Figure D.10 – Map of Non-Automatic Monitoring Sites: A249

Maidstone Borough Council
LAQM Annual Status Report 2019 65
Figure D.11 – Map of Non-Automatic Monitoring Sites: St Peters Street
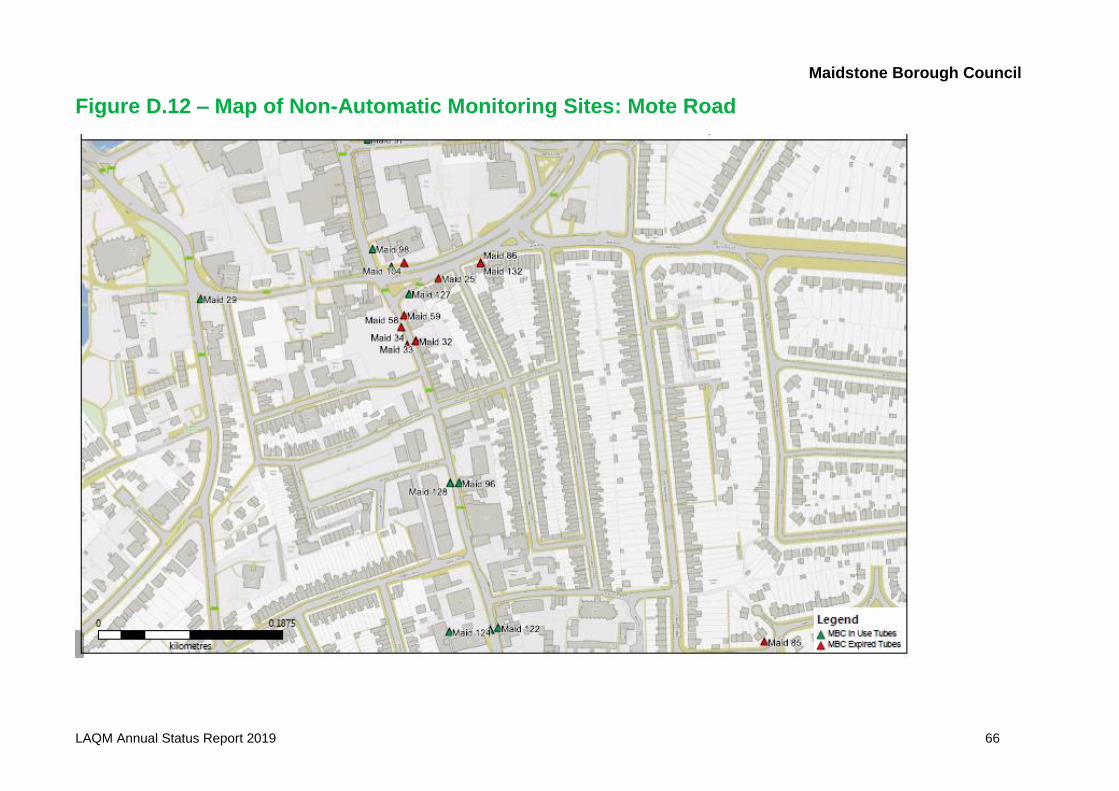
Maidstone Borough Council
LAQM Annual Status Report 2019 66
Figure D.12 – Map of Non-Automatic Monitoring Sites: Mote Road

Maidstone Borough Council
LAQM Annual Status Report 2019 67
Figure D.13 – Map of Non-Automatic Monitoring Sites: A229 Map 2

Maidstone Borough Council
LAQM Annual Status Report 2019 68
Figure D.14 – Map of Non-Automatic Monitoring Sites: Loose Road

Maidstone Borough Council
LAQM Annual Status Report 2019 69
Figure D.15 – Map of Non-Automatic Monitoring Sites: A20 Sutton Road

Maidstone Borough Council
LAQM Annual Status Report 2019 70
Figure D.16 – Map of Non-Automatic Monitoring Sites: Willington Street

Maidstone Borough Council
LAQM Annual Status Report 2019 71
Figure D.17 – Map of Non-Automatic Monitoring Sites: Ashford Road

Maidstone Borough Council
LAQM Annual Status Report 2019 72
Figure D.18 – Map of Non-Automatic Monitoring Sites: New Cut Road

Maidstone Borough Council
LAQM Annual Status Report 2019 73
Figure D.19 – Map of Non-Automatic Monitoring Sites: Sittingbourne Road

Maidstone Borough Council
LAQM Annual Status Report 2019 74
Figure D.20 – Map of Non-Automatic Monitoring Sites: Tonbridge Road

Maidstone Borough Council
LAQM Annual Status Report 2019 75
Figure D.21 – Map of Non-Automatic Monitoring Sites: A20 London Road

Maidstone Borough Council
LAQM Annual Status Report 2019 76
Figure D.22 – Map of Non-Automatic Monitoring Sites: King Street

Maidstone Borough Council
LAQM Annual Status Report 2019 77
Figure D.23 – Map of Non-Automatic Monitoring Sites: A26 Tonbridge Road

Maidstone Borough Council
LAQM Annual Status Report 2019 78
Figure D.24 – Map of Non-Automatic Monitoring Sites: North View

Maidstone Borough Council
LAQM Annual Status Report 2019 79
Figure D.25 – Map of Non-Automatic Monitoring Sites: Forstal Road

Maidstone Borough Council
LAQM Annual Status Report 2019 80
Figure D.26 – Map of Non-Automatic Monitoring Sites: Pilgrims Way

Maidstone Borough Council
LAQM Annual Status Report 2019 81
Figure D.27 – Map of Non-Automatic Monitoring Sites: Queens Road

Maidstone Borough Council
LAQM Annual Status Report 2019 82
Figure D.28 – Map of Non-Automatic Monitoring Sites: Barming Heath

Maidstone Borough Council
LAQM Annual Status Report 2019 83
Figure D.29 – Map of Non-Automatic Monitoring Sites: Hermitage Lane

Maidstone Borough Council
LAQM Annual Status Report 2019 84
Figure D.30 – Map of Non-Automatic Monitoring Sites: St Andrews Road

Maidstone Borough Council
LAQM Annual Status Report 2019 85
Figure D.31 – Map of Non-Automatic Monitoring Sites: Romney Place

Maidstone Borough Council
LAQM Annual Status Report 2019 86
Figure D.32 – Map of Non-Automatic Monitoring Sites: A229 Map 3

Maidstone Borough Council
LAQM Annual Status Report 2019 87
Figure D.33 – Map of Non-Automatic Monitoring Sites: Hermitage Lane Map 2

Maidstone Borough Council
LAQM Annual Status Report 2019 88
Figure D.34 – Map of Non-Automatic Monitoring Sites: Campbell Road

Maidstone Borough Council
LAQM Annual Status Report 2019 89
Figure D.35 – Map of Non-Automatic Monitoring Sites: Farleigh Lane

Maidstone Borough Council
LAQM Annual Status Report 2019 90
Appendix E: Summary of Air Quality Objectives in England
Table E.1 – Air Quality Objectives in England
Pollutant Air Quality Objective4
Concentration Measured as
Nitrogen Dioxide (NO2)
200 µg/m3 not to be exceeded more than 18 times a year
1-hour mean
40 µg/m3 Annual mean
Particulate Matter (PM10)
50 µg/m3, not to be exceeded more than 35 times a year
24-hour mean
40 µg/m3 Annual mean
Sulphur Dioxide (SO2)
350 µg/m3, not to be exceeded more than 24 times a year
1-hour mean
125 µg/m3, not to be exceeded more than 3 times a year
24-hour mean
266 µg/m3, not to be exceeded more than 35 times a year
15-minute mean
4 The units are in microgrammes of pollutant per cubic metre of air (µg/m
3).

Maidstone Borough Council
LAQM Annual Status Report 2019 91
Appendix F: Maidstone Air Quality Action Plan Action Table
Table 0.1 ‒ Air Quality Action Plan Measures
Measure No.
Measure EU
Category EU
Classification Lead
Authority Planning
Phase Implementation Phase
Key Performance Indicat
or
Target Pollution
Reduction in the AQMA
Progress to Date Estimated
Completion Date
Comments
Tr1
Investigate Low Emission Standard for
Buses. Either a graduated scheme of
improvement “Low
Emissions Zone” or a
Euro 6 “Clean Air
Zone”
Promoting Low
Emission Transport
Low Emission Zone
MBC KCC Arriva
NuVenture
Jan to March
2019 Unquantifiable
Funding secured internally procurement undertaken Nov 18.
Project likely to be completed be end of March 19
2021
Tr2 Securing
Grant funding for buses
Vehicle Fleet
Efficiency
Vehicle Retrofitting
Programmes
MBC
DEFRA
Tonbridge and Malling
Council
Existing DEFRA
funded project to be
completed by Mid 2019.
New DEFRA application made late
2018. Other applications depend on availability
Unquantifiable
Procurement completed 17 buses to be refrofitted in total due to be
completed early 2019. Includes telemetry on 2 buses.
New bid made in November 2018 joint project with TWBC, MBC, TMBC and
Arriva to retrofit 20 buses going through all three areas.
2021

Maidstone Borough Council
LAQM Annual Status Report 2019 92
Measure No.
Measure EU
Category EU
Classification Lead
Authority Planning
Phase Implementation Phase
Key Performance Indicat
or
Target Pollution
Reduction in the AQMA
Progress to Date Estimated
Completion Date
Comments
Tr3
Provide input into and
influence the review of bus station, time tabling and peripheral
routes
Traffic Manageme
nt
Other
MBC
Arriva
Nu-Venture
KCC
Unquantifiable
Architect and Employers' Agent to be appointed by January 2019 to
progress designs and feasibility work for the bus station. £750k grant
applied for from the Kent Business Rates Retention Pilot. Outcome
anticipated January 2019.
2024

Maidstone Borough Council
LAQM Annual Status Report 2019 93
Measure No.
Measure EU
Category EU
Classification Lead
Authority Planning
Phase Implementation Phase
Key Performance Indicat
or
Target Pollution
Reduction in the AQMA
Progress to Date Estimated
Completion Date
Comments
Tr4
Use of MBC Parking Policy to
improve Air Quality.
Promoting Low
Emission Transport
Priority Parking for LEVs
MBC (parking)
Unquantifiable
The outcomes of the tri-study were reported to SPST on 22nd January 2018. The Committee resolved to
agree a year's extension to the exisiting contract, with a switch to Pay
to Park and a further report was requested to be brought to committee in November 2018. This report on 6th november outlined the future options
for Park and Ride and referenced other possible sustainable transport
options. Managing traffic flow on the highway
is a county function. The KCC Highways team continue to implement Traffic Regulation Orders to improve
traffic flow at high risk locations throughout Maidstone. The current infrastructure is not compatible with variable charges linked to vehicle type. However the availability this
function will be a consideration when procuring new payment systems in
the future. The planned introduction of EV
charging points in off-street car parks formed part of a SPS&T committee
decision in February 2018 to introduce 8 dual EV points within off-street car parks at prime locations in
2019. Once available, the tariff structure will be a consideration to
promote EV usage. The introduction of a variable tariff structure in off-street car parks to
promote migration from high demand car parks in the town centre to outer
zone car parks formed part of a SPS&T committee decision in
February 2018. Variable tariffs by car park/zone was introduced in June
2018.
2024

Maidstone Borough Council
LAQM Annual Status Report 2019 94
Measure No.
Measure EU
Category EU
Classification Lead
Authority Planning
Phase Implementation Phase
Key Performance Indicat
or
Target Pollution
Reduction in the AQMA
Progress to Date Estimated
Completion Date
Comments
Tr5
Prevent bus and taxi
drivers from leaving their
engines idling
Traffic Manageme
nt
Anti Idling Enforcement
MBC Environmenta
l Protection
(lead)
MBC Comms
MBC Licensing
Arriva
Nu Venture
Ongoing Unquantifiable
Initial meeting held with MBC comms team Jan 18. Advice that this scheme would be complex, time consuming
and expensive to set up and promote then administer going forwards. Suggestion to look if there is an
exisiting scheme that can be adopted or promoted. Could also be
considered as a Kent Scheme in the emerging Kent LES. Some research
completed looking at BBC and Westmisitner # type compaigns whihc could be copied. Anti-idling campaign due to be launched in 2019 subject to identfying budget builidng in the clean
air for schools initiative. Although the contravention of 'Parked with engine running where prohibited'
is available under Civil Parking Enforcement legislation, the burden of
proof required makes enforcement under current legislation difficult to
prove and therefore ineffective.
2021
Tr6
Emissions Standard for Taxis to euro 6 standard
Promoting Low
Emission Transport
Taxi Licensing Conditions MBC Unquantifiable
This scheme has been suggested the group working on the Kent LES as an
action that would be of benefit if implemented across the county as it
would remove the element of percvieved bias towards MBC taxi. MBC taxi license policy currently
being reviewed incuding a requriement to have newer cleaner
vehicles
2024

Maidstone Borough Council
LAQM Annual Status Report 2019 95
Measure No.
Measure EU
Category EU
Classification Lead
Authority Planning
Phase Implementation Phase
Key Performance Indicat
or
Target Pollution
Reduction in the AQMA
Progress to Date Estimated
Completion Date
Comments
Tr7
Work with schools to
reduce impact of school
traffic
Promoting travel
Alternatives
Workplace Travel planning
MBC
KCC
2018/2019 Unquantifiable
The councils sponsorship of the scheme will continue, will also liaise with the KM group to influence the
way that MBC sponsorship is focussed. Officer have drafted a potential program that could be
delivered in schools over the school year starting in September 2018.
Have also identified the most appropriate schools. Next step is to discuss outcomes, contacts, funding and delivery with comms team and KM group as most natural partner. Very positive discussions with KM charity group who will support the initiative and are keen to roll it out across the county as one of their
green champion awards. Scheme has been launched successfully with 12 primary schools actively involved. Now includes and anti idling banner
competition that is open to all schools with the winning banner to be used in the wider campaign described above.
2021
Tr8
Encourage use of Low
and Ultra Low emission
vehicles as taxis
Promoting Low
Emission Transport
Taxi emission incentives
MBC (licensing)
Unquantifiable 2024
Tr9
Encourage and facilitate reducing the
impact of delivery vehicles
Freight and Delivery
Management
Quiet and out of hours delivery Unquantifiable
Preliminary work on the type of scheme has been started.
2022

Maidstone Borough Council
LAQM Annual Status Report 2019 96
Measure No.
Measure EU
Category EU
Classification Lead
Authority Planning
Phase Implementation Phase
Key Performance Indicat
or
Target Pollution
Reduction in the AQMA
Progress to Date Estimated
Completion Date
Comments
Tr10
Ensure that all EV Points
are maintained
and available for the public
Promoting Low
Emission Transport
Other MBC Unquantifiable EV Point in car park under Maidstone
house is operational. 2022
Tr11 Bus driver
training
Vehicle Fleet
Efficiency
Driver training and ECO driving
aids
Arriva
NuVenture
Unquantifiable 2022
Tr12
Promote Champion
and Encourage the Use of new and
novel technology
Public information
Other MBC
DEFRA and KCC
Unquantifiable
MBC is making a bid for £19,370 to be spent on hand held monitoring equipment to be used in mapping
walking to school routes and looking at the air quality inside buses etc.

Maidstone Borough Council
LAQM Annual Status Report 2019 97
Measure No.
Measure EU
Category EU
Classification Lead
Authority Planning
Phase Implementation Phase
Key Performance Indicat
or
Target Pollution
Reduction in the AQMA
Progress to Date Estimated
Completion Date
Comments
Pl1
Local Plan Development
Plan Document
Policy Guidance
and Development control
Air Quality Planning and
Policy Guidance
MBC Planning
Policy
Unquantifiable
Dec 2018 update: the council's Strategic Planning, Sustainability &
Transportation Committee considered a report about the approach to the
proposed Air Quality DPD at its meeting on 10th July 2018. The
report concluded that the AQDPD would be focused on areas of practice
guidance which in part are already covered by the approved Kent &
Medway guidance. Fully incorporating AQ matters into the
Local Plan Review will better enable a comprehensive and more effective approach whereby the air quality
impacts of the plan's strategy can be modelled and specific mitigation
measures can be incorporated into the plan's policies and the associated Infrastructure Delivery Plan. As the
Local Plan Review is already underway, this is considered to be a more effective and efficient approach which the Committee favoured over
the preparation of the dedicated AQDPD. The Local Plan Review
timetable would see the plan submitted for Examination in March
2021 and adoption in April 2022.
2020
Pl2
Adopt Kent and Medway Air Quality Planning
Guidance. Having made
necessary adaptations to
suite MBC circumstance
s
Policy Guidance
and Development control
Air Quality Planning and
Policy Guidance
MBC Planning
Policy
Unquantifiable This action has already been
completed with the technical guidance going live in Jan 18.
COMPLETE

Maidstone Borough Council
LAQM Annual Status Report 2019 98
Measure No.
Measure EU
Category EU
Classification Lead
Authority Planning
Phase Implementation Phase
Key Performance Indicat
or
Target Pollution
Reduction in the AQMA
Progress to Date Estimated
Completion Date
Comments
Pl3
Development Management influence on
developments to mitigate impact on
AQ.
Policy Guidance
and development control
Air Quality Planning and
Policy Guidance
MBC
Development Management
and Environmenta
l Protection
Unquantifiable
Envrionmental Protection are in regular contact with planning officers about applications where this may an issue. In most cases some mitigation
can be applied to move develops further from the road or decrease
heights. However still some concerns particulalrly on stone street about
making AQ worse for off site receptors.
2021
Pr1
Review of Commissionin
g and Procurement
Strategy
Policy Guidance
and development control
Sustainable Procurement
Guidance
MBC Procurement
(Lead)
Unquantifiable
Environmental considerations are part of the compulsory procurement plan
that has to be completed for all procurement above the value of £75k.
The council is currently conisdering how best to use social value to
greater effect in its tendering process and will publish this as part of its commissioning and procurement
strategy in 2019.
2024
PC1
Review park and ride
scheme to create lower emissions.
Alternatives to private
vehicle use.
Bus based Park and Ride
MBC Parking (Lead)
Unquantifiable
The future of Park & Ride services was considered by members of the
SPS&T committee in November 2018. The service will be subject to a
commercial opportunity where the supplier will be directed towards the councils air quality responsibilities.
2024

Maidstone Borough Council
LAQM Annual Status Report 2019 99
Measure No.
Measure EU
Category EU
Classification Lead
Authority Planning
Phase Implementation Phase
Key Performance Indicat
or
Target Pollution
Reduction in the AQMA
Progress to Date Estimated
Completion Date
Comments
PC2
Increase electric vehicle
infrastructure EV Charging
point long term strategy
Promote Low
Emission Transport
Other MBC Parking (Lead)
Unquantifiable
The planned introduction of EV charging points in off-street car parks formed part of a SPS&T committee
decision in February 2018 to introduce 8 dual EV points within off-street car parks at prime locations in
2019. Once available, the tariff structure will be a consideration to
promote EV usage. MBC are working with KCC to apply for ULEV grant
funding for an EV taxi bay in Maidstone
KCC are working on a long term strategy for the county, MBC will have
input in this at a local level.
2024
PC3
Sustainable development
principles enshrined in
MBC development
projects.
Policy Guidance
and Development Control
Air Quality Planning and
Policy Guidance Unquantifiable
Electric Charging Points incorporated into MBC housing development sites
of Brunswick and Union Street.
Investigating Community Heating Scheme for Maidstone East with KCC
2024
PC4
Scheduling of refuse
vehicles to minimise AQ impact. put
cleaner vehicles in poor AQ
areas
Freight and Delivery
Management
Other Unquantifiable
Due to vehicle reliability issues, it has not been possible to deliver this
consistently. However all vehicles are Euro 5 or 6 and every 6 months the
Diesel pump filters are regenerated to reduce pollution levels.
Currently procuring a Euro 7 vehicle for the commercial waste service
which regularly services customers within poor AQ areas.
2021

Maidstone Borough Council
LAQM Annual Status Report 2019 100
Measure No.
Measure EU
Category EU
Classification Lead
Authority Planning
Phase Implementation Phase
Key Performance Indicat
or
Target Pollution
Reduction in the AQMA
Progress to Date Estimated
Completion Date
Comments
PC5
Ensure that any buildings
owned by MBC and
managed by contractor are performing as efficiently as possible to
reduce emissions.
MBC property
services
(Lead)
Unquantifiable
contractors replace lights with LED's where possible. All property leased to tenants have to have an EPC of E or
above.
2022
PC6
Minimising emissions from MBC
Fleet
Promoting Low
Emission Transport
Company Vehicle
Procurement Prioritising
Uptake of Low Emission Vehicles
MBC Waste and Street
Scene
Unquantifiable
Machinery and plant is currently being replaced with electric versions to
reduce carbon emissions. Further trials of electric vehicles are
being carried out. The Parks Team have one electric
vehicle being used at Mote Park and will be considering further electric
vehicles within parks as the existing fleet is replaced.
2024
PC7
Review heat recovery
opportunities in MBC
property e.g. Crematorium
MBC property services
Unquantifiable Heat recovery used from Cremators
to heat the Crematorium Chapel. 2024
PC8 Review MBC
pool car provision
Promoting Low
Emission Transport
Company Vehicle
Procurement Prioritising
Uptake of Low Emission Vehicles
Unquantifiable The council is currently reviewing its options for encouraging the use of
greener transport by staff 2022
PC9
Improved bicycle parking facilities
Promoting Travel
Alternatives
Promotion of Cycling MBC Parking Unquantifiable
Current cycle parking provision is underutilised within town centre
locations. Once capacity increases consideration will be given to
extending provision to off-street locations.
2022

Maidstone Borough Council
LAQM Annual Status Report 2019 101
Measure No.
Measure EU
Category EU
Classification Lead
Authority Planning
Phase Implementation Phase
Key Performance Indicat
or
Target Pollution
Reduction in the AQMA
Progress to Date Estimated
Completion Date
Comments
PH1
Raise public and business awareness of
AQ issues and
promotion of good
practices by important
stakeholders
Public Information
Other
KCC Public Health
MBC Comms
MBC Health Team
Unquantifiable
Preliminary advice from MBC comms team Jan 18. The technicalities of setting up such a scheme, scoping, designing award levels are beyond
the time capacity of comms and EP at the current time. The ongoing
administration is also beyond the time capacity of officers. Without resolving the time issue exploring the funding is not a good use of time. The scheme
has been put forward to the cross council working group as one which could be implemented across the
county. Alternatively there may be national schemes that are simillar in
scope and outcome that could be adopted. Further investigation has identifed examples of softer 'type campaigns such as that used by
Westminster which will be expored further. As above awareness raising
will be done by smaller targeted campaigns as budgets are identified. The clean air for school project will be used to build upon the message wiht anti idling campaign and re branding of MBC web pages as Clean Air for
Maidstone
2022

Maidstone Borough Council
LAQM Annual Status Report 2019 102
Measure No.
Measure EU
Category EU
Classification Lead
Authority Planning
Phase Implementation Phase
Key Performance Indicat
or
Target Pollution
Reduction in the AQMA
Progress to Date Estimated
Completion Date
Comments
PH2
Raising Awareness of
Air Quality and health
issues
Public Information
Other
MBC Environmenta
l Protection Team
Health Team
Unquantifiable
Meeting have been held with public health Dec 17 and Jan, March 18 to
discuss joint work in this area. Currently exploring with public health observatory overlaying public health
data with AQ management are heatmap to estblish if this shows an
increase in associated health impacts, this could be provided as open source data to all LA's in Kent. This will then
focus on raising awarnesss with vulnerable groups and GPS to
promote the AQ alert scheme. Over lap with re-branding and specifc
campaigns described above.
2022
PH3
Review of air monitoring provision in Maidstone
Area
MBC
Environmental Protection
Unquantifiable
A review of the continuous AQ monitoring element of the network has
been completed and reported to SPST committee Feb18. Agreed that
a contractor be used to establish a one year baseline in stone street for
NOX PM10 and PM2.5. There will be a further review after this to inform a long term decision. In the meantime officers will work towards locating a
permanent site for continuous monitoring. The diffuion tube network
is regualrly reviewed with tubes moved, added or removed according
to current areas of interest. Continuous analyser was
commissined and operational in May 2018 network continues to be
monitored and changed as necessary.
COMPLETE but subject to continuous
review

Maidstone Borough Council
LAQM Annual Status Report 2019 103
Measure No.
Measure EU
Category EU
Classification Lead
Authority Planning
Phase Implementation Phase
Key Performance Indicat
or
Target Pollution
Reduction in the AQMA
Progress to Date Estimated
Completion Date
Comments
PH4
Ensure that the protection
and improvement
of public health is a
core principle of AQ work.
Policy Guidance
and Development Control
Other Policy MBC
Environmental Protection
Unquantifiable
EP team leader has attened all Public Health Champion events and is
regualr contact with the health team. This has been useful in making
contacts for use in other actions such as the schools project.
2022

Maidstone Borough Council
LAQM Annual Status Report 2019 104
Glossary of Terms
Abbreviation Description
AQAP Air Quality Action Plan - A detailed description of measures, outcomes, achievement dates and implementation methods, showing how the local authority intends to achieve air quality limit values’
AQMA Air Quality Management Area – An area where air pollutant concentrations exceed / are likely to exceed the relevant air quality objectives. AQMAs are declared for specific pollutants and objectives
ASR Air quality Annual Status Report
Defra Department for Environment, Food and Rural Affairs
DMRB Design Manual for Roads and Bridges – Air quality screening tool produced by Highways England
EU European Union
FDMS Filter Dynamics Measurement System
LAQM Local Air Quality Management
NO2 Nitrogen Dioxide
NOx Nitrogen Oxides
PM10 Airborne particulate matter with an aerodynamic diameter of 10µm (micrometres or microns) or less
PM2.5 Airborne particulate matter with an aerodynamic diameter of 2.5µm or less
QA/QC Quality Assurance and Quality Control
SO2 Sulphur Dioxide
MBC Maidstone Borough Council
KCC Kent County Council
ITS Integrated Transport Strategy
HA Highway Agency
LDF Local Development Framework
HDVs High Duty Vehicles
COPD Chronic Obstructive Pulmonary Disease
Planning DC Planning Development Control
LSP Local Strategic Partnership
K&MAQN Kent & Medway Air Quality Network
LEP Local Enterprise Partnership

Maidstone Borough Council
LAQM Annual Status Report 2019 105
References
Department for Environment, Food and Rural Affairs (Defra) (2016) Local Air Quality Management Technical Guidance LAQM.TG16.
Department for Environment, Food and Rural Affairs (Defra) (2016) Local Air Quality Management Policy Guidance LAQM.PG16.
http://www.phoutcomes.info/public-health-outcomes-framework#page/0/gid/1000043/pat/6/par/E12000008/ati/101/are/E07000112
Maidstone Borough Council 2015 Updating and Screening Assessment
http://laqm.defra.gov.uk/documents/LAQM-AIR-PT-Rounds-1-12-(April-2014-February-2016)-NO2-report.pdf
Maidstone Borough Council Maidstone Town Air Quality Action Plan 2010
Maidstone Borough Council Low Emission Strategy 2018