
2019-12-3 Item 20 Adoption of Berkeley Building Codes.pdf
320
Office of the City Manager 2180 Milvia Street, Berkeley, CA 94704 ● Tel: (510) 981-7000 ● TDD: (510) 981-6903 ● Fax: (510) 981-7099 E-Mail: [email protected] Website: http://www.CityofBerkeley.info/Manager PUBLIC HEARING December 3, 2019 To: Honorable Mayor and Members of the City Council From: Dee Williams-Ridley, City Manager Submitted by: Timothy Burroughs, Director, Department of Planning and Development Subject: Adoption of Berkeley Building Codes, including Local Amendments to California Building Standards Code RECOMMENDATION Conduct a public hearing, and upon conclusion adopt the second reading of Ordinance No. 7,678-N.S. repealing and reenacting the Berkeley Building, Residential, Electrical, Mechanical, Plumbing, Energy and Green Building Standards Codes in BMC Chapters 19.28, 19.29, 19.30, 19.32, 19.34, 19.36 and 19.37, and adopting related procedural and stricter provisions. FISCAL IMPACTS OF RECOMMENDATION Adoption of the revised and expanded 2019 California Buildings Standards Code, with the proposed local amendments, will increase the plan check and inspection workload. The substantially more complex and restrictive California Energy Code and the expanded California Green Building Standards Code, including additional acceptance testing, verification and documentation provisions, will increase plan check and inspection requirements. As identified in the City Council proceeding for the July 16, 2019, Ordinance Prohibiting Natural Gas Infrastructure in New Buildings, an additional staff position in the Building & Safety Division of the Planning and Development Department is needed to be able to implement the Natural Gas Prohibition, local reach codes, CALGreen EV requirements, and other Code amendments in support of the Berkeley Deep Green Building Initiative. The cost of this new position is estimated at $273,341 per year for two years and was referred to the November 2019 budget process for Council consideration. CURRENT SITUATION AND ITS EFFECTS As part of a regular three-year cycle, the State Building Standards Commission has published the 2019 California Building Standards Code that must go into effect no later than January 1, 2020. The California Building Standards Code (California Code of Regulations, Title 24) includes the Building Code (Part 2), Residential Code (Part 2.5), Electrical Code (Part 3), Mechanical Code (Part 4), Plumbing Code (Part 5), Energy Code (Part 6), Historical Code (Part 8), Existing Building Code (Part 10), and Green Building Standards Code (Part 11). The Codes provide for minimum uniform standards for health and safety related to the built environment and for their enforcement through Page 1 of 319
-
Upload
khangminh22 -
Category
Documents
-
view
0 -
download
0
Transcript of 2019-12-3 Item 20 Adoption of Berkeley Building Codes.pdf

Office of the City Manager
2180 Milvia Street, Berkeley, CA 94704 ● Tel: (510) 981-7000 ● TDD: (510) 981-6903 ● Fax: (510) 981-7099E-Mail: [email protected] Website: http://www.CityofBerkeley.info/Manager
PUBLIC HEARINGDecember 3, 2019
To: Honorable Mayor and Members of the City Council
From: Dee Williams-Ridley, City Manager
Submitted by: Timothy Burroughs, Director, Department of Planning and Development
Subject: Adoption of Berkeley Building Codes, including Local Amendments to California Building Standards Code
RECOMMENDATIONConduct a public hearing, and upon conclusion adopt the second reading of Ordinance No. 7,678-N.S. repealing and reenacting the Berkeley Building, Residential, Electrical, Mechanical, Plumbing, Energy and Green Building Standards Codes in BMC Chapters 19.28, 19.29, 19.30, 19.32, 19.34, 19.36 and 19.37, and adopting related procedural and stricter provisions.
FISCAL IMPACTS OF RECOMMENDATIONAdoption of the revised and expanded 2019 California Buildings Standards Code, with the proposed local amendments, will increase the plan check and inspection workload. The substantially more complex and restrictive California Energy Code and the expanded California Green Building Standards Code, including additional acceptance testing, verification and documentation provisions, will increase plan check and inspection requirements. As identified in the City Council proceeding for the July 16, 2019, Ordinance Prohibiting Natural Gas Infrastructure in New Buildings, an additional staff position in the Building & Safety Division of the Planning and Development Department is needed to be able to implement the Natural Gas Prohibition, local reach codes, CALGreen EV requirements, and other Code amendments in support of the Berkeley Deep Green Building Initiative. The cost of this new position is estimated at $273,341 per year for two years and was referred to the November 2019 budget process for Council consideration.
CURRENT SITUATION AND ITS EFFECTSAs part of a regular three-year cycle, the State Building Standards Commission has published the 2019 California Building Standards Code that must go into effect no later than January 1, 2020. The California Building Standards Code (California Code of Regulations, Title 24) includes the Building Code (Part 2), Residential Code (Part 2.5), Electrical Code (Part 3), Mechanical Code (Part 4), Plumbing Code (Part 5), Energy Code (Part 6), Historical Code (Part 8), Existing Building Code (Part 10), and Green Building Standards Code (Part 11). The Codes provide for minimum uniform standards for health and safety related to the built environment and for their enforcement through
Page 1 of 319
arichardson
Typewritten Text
20

Adoption of Berkeley Building Codes: Second Reading PUBLIC HEARINGDecember 3, 2019
Page 2
a system of permits, plan review, and inspections.
The proposed ordinance provides for the adoption of the referenced California Codes along with certain local amendments, effective January 1, 2020. If this ordinance does not become effective by January 1, 2020, the 2019 California Building Standards Code will automatically become effective on that date, and the City will not be able to maintain or implement the local amendments tailored to Berkeley. The last day to file for a building permit to be reviewed under the current 2016 Code will be Tuesday, December 31, 2019.
The City’s building-related codes include local amendments reflecting operations and local climatic, geological, or topographical conditions that need to be included as part of the adoption of the new code. Under state law, local jurisdictions may adopt other administrative provisions appropriate to the locality and may adopt stricter code provisions if justified by findings of local climatic, geological or topographical conditions. Stricter provisions of the Energy Code must also include a local finding of cost-effectiveness, and administrative approval of the adopted local amendment (reach code) at the California Energy Commission (CEC).
This ordinance, with the local amendments, is a Strategic Plan Priority Project, advancing the City of Berkeley’s goals to create a resilient, safe, connected, and prepared city as well as being a global leader in addressing climate change, advancing environmental justice, and protecting the environment. These code adoption actions also support implementation of the City Council resolution declaring a shelter crisis, implementation of the ordinance banning Natural Gas infrastructure in new construction, implementation of Senate Bill 1226, and continuing responses to previous Council referrals to adopt Deep Green Building and Electric Vehicle Charging requirements.
BACKGROUNDThe Council last adopted new California Building Standards Code with local amendments in 2016, which became effective on January 1, 2017. As with the last code adoption, staff is conducting community outreach to inform future applicants and other community members that all permit applications submitted before or on December 31, 2019 will be reviewed under the current building codes. Outreach efforts include Planning and Development Department’s Open House on October 16, notifications on the homepage websites, announcements on the online permit center website, staff outreach to Energy Commission and Housing Advisory Commission, notification flyers at the Permit Service Center, an email blast to local contractors, and staff participation in a home electrification workshop on November 5.
When the Department reopens on January 2, 2020, new submitted applications will be reviewed for conformance to the 2019 California Building Standards Code with adopted local amendments.
Codes recommended for adoption are the Berkeley Building Code (Chapter 19.28),
Page 2 of 319

Adoption of Berkeley Building Codes: Second Reading PUBLIC HEARINGDecember 3, 2019
Page 3
which also includes the Historical Building Code and the Existing Building Code, the Berkeley Residential Code (Chapter 19.29), the Berkeley Electrical Code (Chapter 19.30), the Berkeley Mechanical Code (Chapter 19.32), the Berkeley Plumbing Code (Chapter 19.34), the Berkeley Energy Code (Chapter 19.26) and the Berkeley Green Code (Chapter 19.37).
Berkeley Building Code (Chapter 19.28)The 2019 Berkeley Building Code includes numerous model code changes published by the State of California, impacting use and occupancies, allowable building heights and areas, fire protection features, means of egress, structural modifications, etc. These changes are designed to provide enhanced protection of public health, safety and general welfare as they relate to the construction and occupancy of buildings and structures.
The Codes published by the State also incorporate a newly revised HCD Appendix O for Emergency Housing, which has been substantially influenced by the technical provisions in the City of Berkeley Emergency Housing Ordinance approved by City Council on June 12, 2018 and the extension of Resolution 67,746-N.S., declaring a shelter crisis. The newly revised HCD Appendix O now includes by-right provisions for commercial modular buildings to be used as congregate sleeping quarters for emergency housing. This type of emergency housing was first introduced by the City of Berkeley at the Pathway STAIR Center on 2nd Street, codified in the Berkeley Municipal Code Chapter 19.28 Section 19.28.100, and is now approved at the state level. Since HCD Appendix O continues to defer to local authorities to establish minimum fire and life safety measures, the local amendments reflecting the particular characteristics and needs of Berkeley’s emergency shelter responses are recommended for continuance.
Additionally, the 2019 Berkeley Building Code has been amended with additional administrative provisions to assist in facilitating an amnesty program for existing undocumented dwelling units. Specifically, when a building permit record for a residential unit does not exist, the building official will be authorized to make a determination of when the residential unit was constructed and then apply the building standards in effect when the residential unit was determined to be constructed or the current building standards, whichever is the least restrictive, provided the building does not become or continue to be a substandard or unsafe building. The Building Official will also be authorized to accept reasonable alternatives to the requirements of the prior or current code editions when dealing with unpermitted dwelling units. This amendment is intended to codify the Building Official’s discretion and interpretative authority for legalization of unpermitted dwelling units as provided in Senate Bill No. 1226, which recognizes the Building Official’s authority to apply the Building Standards Code in effect at the time a residential unit is determined to be constructed and requires the Department of Housing and Community Development to propose the adoption of a building standard to this effect (see Health & Safety Code, § 17958.12).
Page 3 of 319

Adoption of Berkeley Building Codes: Second Reading PUBLIC HEARINGDecember 3, 2019
Page 4
Berkeley Residential Code (Chapter 19.29)
The 2019 Berkeley Residential Code has been updated to include local climatic criteria, which refine the energy needs for dwelling units for the purpose of ensuring that the selected HVAC equipment meets the heating or cooling requirements and that the HVAC designers use the correct data to prevent unnecessary oversizing of the equipment. The Code also adopts Appendix Q for tiny houses less than 400 square feet, which relaxes various code requirements. Attention is specifically paid to features such as compact stairs, reduced ceiling heights and areas in lofts, reduction of ceiling heights in habitable rooms to 6’-8”, reduction of ceiling heights in bathrooms and kitchens to 6’-4”, and other similar requirements. The objective of these provisions is to facilitate construction of new and legalization of existing smaller dwelling units in support of easing the housing crisis. The Code also adopts Appendices R and S for light straw-clay and strawbale alternate construction methods. These alternate construction practices provide the ability to build dwelling units with sustainable materials that increase thermal efficiencies and have a low environmental impact.
Berkeley Mechanical Code (Chapter 19.32)Staff proposes local amendments to the 2019 Berkeley Mechanical Code to include a new requirement to install residential kitchen range hoods in keeping with the June 26, 2018, (Item 52) referral response on the Berkeley Deep Green Building Initiative and in support of the July 16, 2019, Ordinance Prohibiting Natural Gas Infrastructure in New Buildings. Current requirements for kitchen hoods are limited to commercial cooking appliances. The proposed local amendment to the Mechanical Code would require kitchen range hoods, with a minimum air flow of 100 cfm and a maximum sound rating of 3 sones over residential stoves and cooktops within new and/or remodeled dwelling units. This amendment addresses indoor air quality and health concerns, particularly associated with cooking, and was supported by the Berkeley Energy Commission at their meeting on September 25, 2019. Consistent with the application of the California Building Standards Code, this requirement will apply to new construction, additions, alterations and repairs. Unless the building is being repaired, remodeled, expanded, or newly constructed, the codes do not retroactively apply to existing buildings, which can be maintained in accordance with the requirements under which they were built. However, the proposed amendment will effectively prevent removal of range hoods in existing residential units, which has been observed on multiple occasions by City housing inspectors. Instead, property owners will need to maintain existing range hoods in operable condition or replace them when necessary, rather than removing them as a non-required fixture.
Berkeley Energy Code (Chapter 19.26)The 2019 California Energy Code published by the State increases energy efficiency and solar generation requirements from the 2016 Energy Code standards, moving closer to State goals of zero net energy buildings. The proposed local amendments to the 2019 Energy Code (also known as “reach code”), require further cost-effective
Page 4 of 319
Adoption of Berkeley Building Codes: Second Reading PUBLIC HEARINGDecember 3, 2019
Page 5
increases to support the intent and implementation of the Natural Gas Prohibition adopted by City Council on July 23, 2019 (Attachment 3). An overview of the California Energy Code cycle changes and the reach code requirements follows.
The 2019 Energy Code requires solar photovoltaic (PV) systems on new homes (single family and low-rise multifamily buildings of 3 stories or less) for the first time. The production of rooftop solar energy generation from solar PV systems, in combination with new energy efficiency measures, will result in a single family home built to 2019 Energy Code standards using about 53% less energy than the same home built to the 2016 Energy Code standards. The 2019 Energy Code introduces a new metric for demonstrating residential compliance called Energy Design Rating (EDR), based on the Home Energy Rating System (HERS) scale from 0-100, where 0 is a net zero energy home. A typical new single family home in Berkeley, built to 2019 Energy Code standards would have a Total EDR score of about 25. Total EDR is calculated by compliance software approved by the California Energy Commission (CEC) for each project and incorporates an Efficiency EDR component as well as solar PV generation and demand flexibility to determine the Total EDR score.
The 2019 Energy Code standards are expected to increase the price of constructing a new single family home by about $9,500, but will save $19,000 in energy and maintenance costs over 30 years, resulting in about a $40/month decrease in a typical consumers combined mortgage and utility bills according to the CEC.
New 2019 Energy Code requirements for nonresidential buildings, high-rise residential buildings (4 or more stories), and hotel/motels are expected to reduce energy use by 30% in comparison to buildings meeting the 2016 Energy Code standards. These savings in energy use are primarily due to new more efficient lighting requirements.
The proposed electric-favored reach code was developed for the June 26, 2018, referral response on the Berkeley Deep Green Building Initiative and in support of the July 16, 2019, Ordinance Prohibiting Natural Gas Infrastructure in New Buildings. It is based on Statewide Cost Effectiveness Studies (Low-Rise Residential Study included as Attachment 2 and Nonresidential Study included as Attachment 3) and model code language that was collaboratively developed by the California Energy Codes and Standards Program, Building Decarbonization Coalition, and several Community Choice Aggregations (CCAs), including East Bay Community Energy (EBCE). Staff also worked with nearby jurisdictions, including Oakland and San Francisco, to promote regional consistency. PG&E has provided written support of this reach code (Attachment 4).
The reach code complements Berkeley’s recently-adopted Natural Gas Prohibition Ordinance, which requires that new buildings, with land use permit applications submitted on or after January 1, 2020, be designed without natural gas infrastructure, subject to limited exceptions and exemptions. The proposed reach code impacts all building permit applications for newly constructed buildings submitted on or after January 1, 2020, including those which already have approved land use permits. The
Page 5 of 319
Adoption of Berkeley Building Codes: Second Reading PUBLIC HEARINGDecember 3, 2019
Page 6
proposed reach code encourages all-electric construction and specifies what is required for electric-readiness to enable future electrification when natural gas appliances are utilized.
Like the Natural Gas Prohibition, the reach code is designed to improve the comfort and safety of new buildings and to minimize the greenhouse gas emissions associated with their construction and operation. It recognizes the dangers of natural gas, the significant greenhouse gas emissions associated with its extraction, piping, and combustion, and the availability of efficient, all-electric alternatives, as documented in the July 16, 2019, report to City Council accompanying the first reading of the Natural Gas Prohibition.1 The reach code, along with other local amendments described here, are directed by the June 26, 2018 referral response on the Berkeley Deep Green Building Initiative.
The reach code extends the solar PV requirement to nonresidential buildings, high-rise residential buildings, and hotel/motels. In addition, it provides two pathways for new buildings to demonstrate compliance with the Energy Code:
New all-electric buildings, meaning that no natural gas or propane plumbing is installed within the building, must simply demonstrate compliance with the Energy Code.
New mixed-fuel buildings, meaning that electricity and natural gas are used within the building, must exceed the energy efficiency requirements of the Energy Code by 10% for nonresidential buildings, high-rise residential buildings, and hotel/motels, or by 10 Total EDR points for single-family or low-rise residential buildings, or meet a set of prescriptive requirements, with equivalent efficiency savings, in place of these performance thresholds. In addition, the reach code includes electric-ready requirements for any natural gas appliance in new mixed-fuel buildings, to support future electrification. This pathway would also be required of projects that receive exemptions or exceptions to the Natural Gas Prohibition.
Both of these compliance pathways have been found to be cost-effective by the California Energy Codes and Standards Program.2 The all-electric construction, utilizing efficient heat pump technology, is lower in cost and produces more savings in greenhouse gas emissions. Through EBCE, Berkeley currently has access to electricity that is 78-100% carbon-free, providing opportunity for significant greenhouse gas
1 Revised Agenda Material for Supplemental Packet 2, “Adopt an Ordinance adding a new Chapter 12.80 to the Berkeley Municipal Code Prohibiting Natural Gas Infrastructure in New Buildings”, July 16, 2019, https://www.cityofberkeley.info/Clerk/City_Council/2019/07_Jul/Documents/2019-07-16_Supp_2_Reports_Item_C_Rev_Harrison_pdf.aspx. 2 The electric-ready aspects have not been studied for cost-effectiveness. However, the CEC does not consider them to be energy performance requirements, so that requirement is not applicable. Electric-readiness is also required by the Natural Gas Ordinance; the reach code provides the specific measures that are needed.
Page 6 of 319

Adoption of Berkeley Building Codes: Second Reading PUBLIC HEARINGDecember 3, 2019
Page 7
emissions savings through all-electric construction.
The Berkeley Energy Commission voted in support for the proposed reach code on September 25, 2019, without an exemption proposed by staff for new accessory dwelling units (ADUs) of 850 gross square feet or less (moved by Leger, second by Stromberg; motion carried 6-0-0, with three members absent). In keeping with Berkeley Energy Commission’s direction to promote consistency in applicability of the Natural Gas Prohibition and with the knowledge of economic options for all-electric systems in ADUs, staff removed the initially proposed reach code ADU exemption.
Berkeley Green Code (Chapter 19.37)The 2019 California Green Building Standards Code (CALGreen) published by the State makes moderate changes in comparison to the 2016 CALGreen, primarily concentrated on electric vehicle (EV) charging readiness and landscape irrigation requirements. The proposed local amendments, developed in response to City Council referrals on the Berkeley Deep Green Building Initiative and an Electric Vehicle Charging Ordinance, add additional EV charging requirements and requirements for low-carbon concrete, and maintain the current local amendments for construction and demolition (C&D) waste diversion. Unlike the reach code, no demonstration of cost-effectiveness is required for local amendments to CALGreen.
The proposed local amendments require increased EV charging readiness and installation in new buildings, based on the June 13, 2017 (Item 44), referral from City Council to develop an Electric Vehicle Charging Ordinance, existing requirements in place in Oakland and San Francisco, and on model code language developed by local CCAs including EBCE.
Specifically, the proposed EV amendments require: At least one parking space per dwelling unit at all new single family homes,
duplexes, and townhouses to be equipped with raceway, wiring, and power to support a future Level 2 EV charging station.
20% of parking spaces at new multifamily buildings to be equipped with raceways, wiring, and power to support future Level 2 EV charging stations, and additional connecting raceways between the electrical service and the remaining 80% of parking spaces. The raceway connections could allow for future EV management systems to distribute EV charging capability to all parking spaces without additional electric service capacity.
10% of parking spaces (when 10 or more parking spaces are constructed) at new nonresidential buildings (including hotel/motels) to have Level 2 charging stations installed, and additional connecting raceways between the electrical service and 40% of parking spaces. A DC Fast Charge station may be installed in place of 10 required Level 2 charging stations.
Page 7 of 319

Adoption of Berkeley Building Codes: Second Reading PUBLIC HEARINGDecember 3, 2019
Page 8
These proposed EV amendments set ambitious new EV charging requirements. EV charging infrastructure is a critical component to EV adoption and it is significantly more expensive to install charging infrastructure as a retrofit than it is during new construction. A 2016 report for the City of Oakland3 found the cost of installing EV charging readiness infrastructure during new construction to be $200-$1,400 per parking space; retrofit costs for the same installations were up to seven times as expensive. CALGreen includes exceptions for EV charging readiness requirements in residential construction when the utility side costs, passed on to the homeowner or developer, will be $400 or more per dwelling unit.
Ensuring that newly constructed residential and non-residential parking has EV charging capability will reduce long-term costs of EV infrastructure installation, while helping to increase EV adoption and decrease the 60% of Berkeley’s greenhouse gas emissions that are currently associated with transportation. Berkeley’s first Electric Mobility Roadmap, currently available in draft form,4 emphasizes that being able to charge at home or work is critical for supporting EV ownership and that, increasingly, daytime charging (at work or other nonresidential locations) could be used to leverage surplus renewable energy. The Roadmap estimates that Berkeley will need about 380 workplace EV charging stations by 2025 to be on track for the Berkeley Climate Action Plan goal of reducing greenhouse gas emissions by 80% from 2000 levels by 2050. To get to zero net carbon in line with State goals by 2045, this increases to 610 workplace EV charging stations. Requiring EV charging station installation in new nonresidential development, in concert with EV charging readiness requirements for residential and nonresidential developments, will substantially increase access to EV charging in Berkeley.
Proposed local amendments to CALGreen also include requirements for low-carbon concrete in new buildings in keeping with the June 26, 2018, referral response on the Berkeley Deep Green Building Initiative. The proposal utilizes recommendations from the Bay Area Low-Carbon Concrete Codes Project, a Bay Area Air Quality Management District-funded project for the County of Marin. Specifically, the local amendment requires cement reductions in concrete mix design of at least 25%. Cement used in concrete is the largest single material source of embodied emissions in buildings and is responsible for 8% of global emissions. Replacing cement with alternatives, such as fly ash, slag, silica fume, or rice hull ash, can reduce total emissions for concrete by 50%. The proposed requirements reduce the greenhouse gas emissions associated with this common carbon-intensive building material, while maintaining the strength and durability required for safe construction. The BRIDGE Housing/Berkeley Food and Housing Project new development project at 2012 Berkeley Way is a pilot project for the Bay Area Low-Carbon Concrete Codes Project.
3 Plug-In Electric Vehicle Infrastructure Cost-Effectiveness Report, prepared for the City of Oakland by Energy Solutions, July 20, 2016, available at https://energy-solution.com/wp-content/uploads/2016/08/PEV-Infrastructure-Cost-Effectiveness-Summary-Report-2016-07-20a.pdf 4 Available at https://www.cityofberkeley.info/EVCharging/
Page 8 of 319

Adoption of Berkeley Building Codes: Second Reading PUBLIC HEARINGDecember 3, 2019
Page 9
The Berkeley Energy Commission voted to support these proposed local CALGreen amendments for EV charging and low-carbon concrete on September 25, 2019. Previous Local AmendmentsPrevious local amendments, with some revisions in code language and code sections, that are recommended for continuance in the reenacted Berkeley Building Code (BMC Chapter 19.28) include:
Article 1. Administrative Provisions – local amendments concerning permits, plan reviews, fees, appeals, violations, unsafe buildings, and safety assessment placards
Article 2. Restrictions in Fire Zones adding additional local requirements and enacting fire protection areas not covered by the state-mandated areas
Article 3. Wood Burning Appliances - local amendment reducing the health risks caused by wood smoke based upon Berkeley’s climatic conditions
Article 4. Projection into Public Right of Way, an administrative amendment concerning revocation, removal and indemnification regarding construction in the Right of Way
Article 5. Existing Buildings, adopting 2019 California Existing Building Code and certain chapters of the 2018 International Existing Building Code to reduce the risk from earthquakes
Article 6. Repairs to Existing Buildings and Structures establishing updated regulations for the repairs of damaged structures to comply with the Stafford Act, which authorizes the Federal Emergency Management Agency (FEMA) to fund the repair and restoration of eligible facilities damaged in a declared disaster and requires that the repair and restoration be "on the basis of the design of such facility as it existed immediately prior to the major disaster and in conformity with current applicable codes, specifications and standards.”
Article 7. Technical Amendments to Structural Standards needed because of changes in the new code and Berkeley’s close proximity to major earthquake faults. The Berkeley Building Official has actively participated in meetings of the Tri-chapter Uniform Code Committee, which is part of the International Code Council East Bay Chapter. The Tri-Chapter Uniform Code Committee recommended several structural amendments to the California Building and Residential Codes, which are included in the proposed local amendments for Berkeley.
Article 8. Construction of Exterior Appurtenances, establishing more stringent
Page 9 of 319
Adoption of Berkeley Building Codes: Second Reading PUBLIC HEARINGDecember 3, 2019
Page 10
construction standards for exterior elevated elements and continuing the amendments adopted in July 2015 following the balcony collapse at 2020 Kittredge Street.
Berkeley Green Code (Chapter 19.37) Construction and Demolition debris amendments to require that 100% asphalt, concrete, excavated soil and land-clearing debris be diverted from disposal by recycling, reuse, and salvage, in addition to the general 65% diversion requirement are also recommended for continuance.
ENVIRONMENTAL SUSTAINABILITYAdoption of the 2019 Berkeley Building Codes with local amendments is important to meeting Berkeley’s Climate Action Plan, Zero Waste, and Fossil Fuel Free Berkeley goals. In particular, the Berkeley Energy Code makes significant gains towards reducing the greenhouse gas emissions associated with constructing and operating new buildings. Through favoring efficient, cost-effective, all-electric construction, the Berkeley Energy Code will minimize the natural gas use in buildings that currently accounts for 27% of community-wide greenhouse gas emissions.
The Berkeley Green Code, through expanded EV charging and low-carbon concrete requirements, limits the greenhouse gas emissions associated with transportation (currently 60% of Berkeley’s total emissions) and use of concrete, a common building product that is responsible for 8% of global carbon emissions. In addition, retaining the increased applicability and general diversion requirements for construction and demolition materials to keep all land clearing debris, concrete, and asphalt out of landfills, supports Berkeley’s goal of becoming Zero Waste by 2020.
RATIONALE FOR RECOMMENDATIONLocal Codes must be adopted every three years or State Codes go into effect without local amendments. Adoption of local amendments and findings are needed to adapt the State Codes to Berkeley’s particular administrative, topographic, geologic and climatic conditions. The purpose of the non-administrative local amendments is to provide a higher level of safety than is reflected in the State-adopted 2019 Codes. The fire and seismic danger and other local conditions, justify the Berkeley Code provisions that are stricter than the California Building Standards Code.
ALTERNATIVE ACTIONS CONSIDEREDAdopt the California Buildings Standards Code with fewer, or no, local amendments; or take no action, and let the state mandated codes take effect without local amendments designed for Berkeley. According to the California Building Standards Commission, the repeal of prior code is often overlooked by municipalities and is critically important to ensure that obsolete provisions are expressly repealed.
Page 10 of 319
Adoption of Berkeley Building Codes: Second Reading PUBLIC HEARINGDecember 3, 2019
Page 11
CONTACT PERSONAlex Roshal, Chief Building Official, Manager of Building and Safety Division, Planning
and Development Department, 981-7445Sarah Moore, Sustainability Program Manager, Office of Energy and Sustainable
Development, Planning and Development Department, 981-7494
Attachments: 1: Ordinance 2: 2019 Cost-Effectiveness Study: Low-Rise Residential New Construction, California
Energy Code & Standards, August 1, 20193: 2019 Nonresidential New Construction Reach Code Cost-Effectiveness Study,
California Code & Standards, July 25, 20194: PG&E Letter of Support for Berkeley’s Efforts to Promote All-Electric New
Construction, September 23, 20195: Public Hearing Notice
Page 11 of 319

Page 12 of 319

Page 1 of 69
ORDINANCE NO. 7,678–N.S.
REPEALING AND REENACTING BERKELEY MUNICIPAL CODE CHAPTERS 19.28 (BERKELEY BUILDING CODE), 19.29 (BERKELEY RESIDENTIAL CODE), 19.30 (BERKELEY ELECTRICAL CODE), 19.32 (BERKELEY MECHANICAL CODE), 19.34 (BERKELEY PLUMBING CODE), 19.36 (BERKELEY ENERGY CODE), AND 19.37 (BERKELEY GREEN CODE)
BE IT ORDAINED by the Council of the City of Berkeley as follows:
Section 1. That Berkeley Municipal Code Chapter 19.28 is hereby repealed and reenacted to read as follows:
Chapter 19.28
BERKELEY BUILDING CODE*
Sections:
19.28.010 Adoption of the California Building Code
Article 1. Scope and Administrative Provisions19.28.020 Adoption of Chapter 1 Scope and Administration
Article 2. Restrictions in Fire Zones19.28.030 Chapter 7A Materials and Construction Methods for Exterior
Wildlife Exposure
Article 3. Wood Burning Appliances19.28.040 Wood Burning Appliances
Article 4. Projection into Public Right of Way19.28.050 Encroachment into the Public Right of Way - Revocation and
Removal Indemnification and Hold Harmless
Article 5. Existing Buildings19.28.060 Adoption of 2019 California Existing Building Code and certain
Chapters of the 2018 International Existing Building Code by Reference
Article 6. Repairs to Existing Buildings and Structures19.28.070 Adoption of Regulations for the Repairs of Existing Structures
Article 7. Amendments to Structural Standards 19.28.080 Technical Amendments to Structural Standards
Page 13 of 319
Supplemental Attachment 2
Page 2 of 69
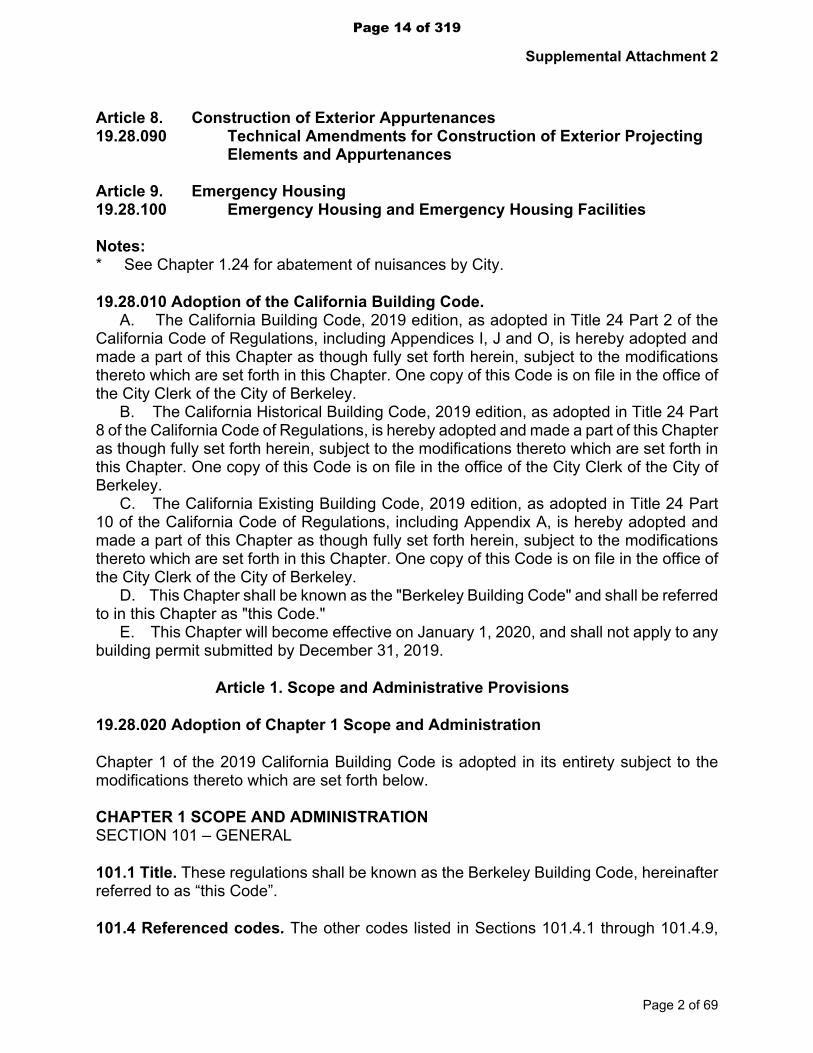
Article 8. Construction of Exterior Appurtenances19.28.090 Technical Amendments for Construction of Exterior Projecting
Elements and Appurtenances
Article 9. Emergency Housing19.28.100 Emergency Housing and Emergency Housing Facilities
Notes:* See Chapter 1.24 for abatement of nuisances by City.
19.28.010 Adoption of the California Building Code.A. The California Building Code, 2019 edition, as adopted in Title 24 Part 2 of the
California Code of Regulations, including Appendices I, J and O, is hereby adopted and made a part of this Chapter as though fully set forth herein, subject to the modifications thereto which are set forth in this Chapter. One copy of this Code is on file in the office of the City Clerk of the City of Berkeley.
B. The California Historical Building Code, 2019 edition, as adopted in Title 24 Part 8 of the California Code of Regulations, is hereby adopted and made a part of this Chapter as though fully set forth herein, subject to the modifications thereto which are set forth in this Chapter. One copy of this Code is on file in the office of the City Clerk of the City of Berkeley.
C. The California Existing Building Code, 2019 edition, as adopted in Title 24 Part 10 of the California Code of Regulations, including Appendix A, is hereby adopted and made a part of this Chapter as though fully set forth herein, subject to the modifications thereto which are set forth in this Chapter. One copy of this Code is on file in the office of the City Clerk of the City of Berkeley.
D. This Chapter shall be known as the "Berkeley Building Code" and shall be referred to in this Chapter as "this Code."
E. This Chapter will become effective on January 1, 2020, and shall not apply to any building permit submitted by December 31, 2019.
Article 1. Scope and Administrative Provisions
19.28.020 Adoption of Chapter 1 Scope and Administration
Chapter 1 of the 2019 California Building Code is adopted in its entirety subject to the modifications thereto which are set forth below.
CHAPTER 1 SCOPE AND ADMINISTRATIONSECTION 101 – GENERAL
101.1 Title. These regulations shall be known as the Berkeley Building Code, hereinafter referred to as “this Code”.
101.4 Referenced codes. The other codes listed in Sections 101.4.1 through 101.4.9,
Page 14 of 319

Supplemental Attachment 2
Page 3 of 69
and referenced elsewhere in this Code, shall be considered part of the requirements of this Code to the extent prescribed in each such reference.
101.4.1 Gas. The provisions of the Berkeley Mechanical Code, based on the 2019 California Mechanical Code, and the Berkeley Plumbing Code, based on the 2019 California Plumbing Code, as amended herein, shall apply to the installation of gas piping from the point of delivery, gas appliances and related accessories as covered in this Code. These requirements apply to gas piping systems extending from the point of delivery to the inlet connections of appliances and the installation and operation of residential and commercial gas appliances and related accessories.
101.4.2 Mechanical. The provisions of the Berkeley Mechanical Code, based on the 2019 California Mechanical Code, as amended herein, shall apply to the installation, alterations, repairs and replacement of mechanical systems, including equipment, appliances, fixtures, fittings and/or appurtenances, including ventilating, heating, cooling, air-conditioning and refrigeration systems, incinerators and other energy-related systems.
101.4.3 Plumbing. The provisions of the Berkeley Plumbing Code, based on the 2019 California Plumbing Code, as amended herein, shall apply to the installation, alteration, repair and replacement of plumbing systems, including equipment, appliances, fixtures, fittings and appurtenances, and where connected to a water or sewage system and all aspects of a medical gas system. The provisions of the Berkeley Plumbing Code shall apply to private sewage disposal systems.
101.4.4 Residential property maintenance. The provisions of the Berkeley Housing Code, based on the 1997 Uniform Housing code, as amended in Chapter 19.40, shall apply to existing residential buildings and premises; equipment and facilities; light, ventilation, space heating, sanitation, life and fire safety hazards; responsibilities of owners, operators and occupants; and occupancy of existing premises and structures.
Notwithstanding any provisions contrary in this Chapter, any building or portion thereof constructed in compliance with the Berkeley Building Code shall not be deemed to be in violation of the Housing Code provisions that may conflict.
101.4.5 Fire prevention. The provisions of the Berkeley Fire Code based on the 2019 California Fire Code shall apply to matters affecting or relating to structures, processes and premises from the hazard of fire and explosion arising from the storage, handling or use of structures, materials or devices; from conditions hazardous to life, property or public welfare in the occupancy of structures or premises; and from the construction, extension, repair, alteration or removal of fire suppression and alarm systems or fire hazards in the structure or on the premises from occupancy or operation.
Page 15 of 319

Supplemental Attachment 2
Page 4 of 69
101.4.6 Energy. The provisions of the Berkeley Energy Code, based on the 2019 California Energy Code, as amended herein, shall apply to all matters governing the design and construction of buildings for energy efficiency.
101.4.7 Existing buildings. The provisions of the Berkeley Existing Building Code, based on the 2019 California Existing Building Code, as amended herein, shall apply to matters governing the repair, alteration, change of occupancy, addition to and relocation of existing buildings.
101.4.8 Electrical. The provisions of the Berkeley Electrical Code, based on the 2019 California Electrical Code, as amended herein, shall apply to the installation of electrical systems, including alterations, repairs, replacement, equipment, appliances, fixtures, fittings and appurtenances thereto.
101.4.9 Green. The provisions of the Berkeley Green Code, based on the 2019 California Green Building Standards Code, as amended herein, shall apply to enhanced design and construction of buildings through the use building concepts having a reduced negative impact or the positive environmental impact and encouraging sustainable construction practices.
101.5 References to prior codes. Unless superseded and expressly repealed, references in City forms, documents and regulations to the chapters and sections of former Berkeley Building Code editions, shall be construed to apply to the corresponding provisions contained within the 2019 Berkeley Building Code Ordinance No. 7,315–N.S. and all ordinances amendatory thereof. Any ordinances or parts of ordinances in conflict herewith are hereby superseded and expressly repealed.
SECTION 103 – DIVISION OF BUILDING AND SAFETY
103.1 Creation of enforcement agency. The Division of Building and Safety is hereby created and the official in charge thereof shall be known as the building official.
103.2 Appointment. The building official shall be appointed by the City Manager.
SECTION 104 – DUTIES AND POWERS OF BUILDING OFFICIAL
104.7 Division records. The building official shall keep official records of applications received, permits and certificates issued, fees collected, reports of inspections, and notices and orders issued. Such records shall be retained in the official records for the period required for retention of public records.
Add a new Subsection 104.12 to read:
104.12 Unpermitted dwelling units. When a building permit record for a residential unit does not exist, the building official is authorized to make a determination of when the residential unit was constructed and then apply the building standards in effect when the
Page 16 of 319
Supplemental Attachment 2
Page 5 of 69
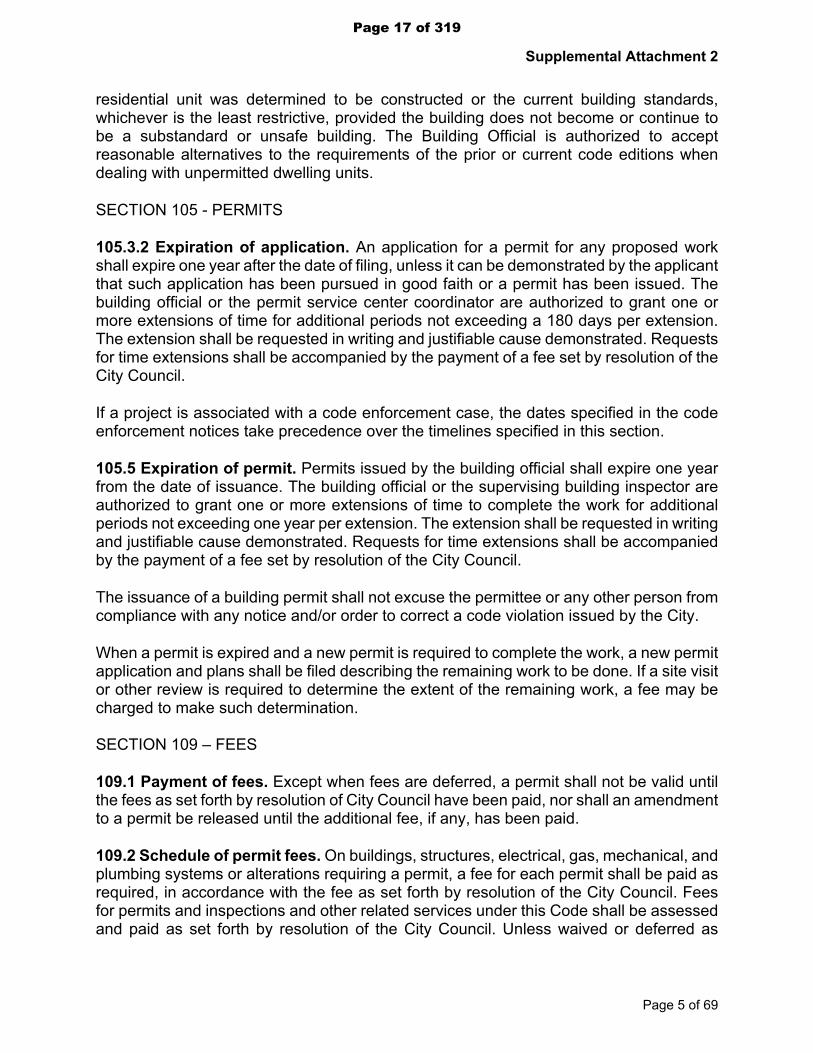
residential unit was determined to be constructed or the current building standards, whichever is the least restrictive, provided the building does not become or continue to be a substandard or unsafe building. The Building Official is authorized to accept reasonable alternatives to the requirements of the prior or current code editions when dealing with unpermitted dwelling units.
SECTION 105 - PERMITS
105.3.2 Expiration of application. An application for a permit for any proposed work shall expire one year after the date of filing, unless it can be demonstrated by the applicant that such application has been pursued in good faith or a permit has been issued. The building official or the permit service center coordinator are authorized to grant one or more extensions of time for additional periods not exceeding a 180 days per extension. The extension shall be requested in writing and justifiable cause demonstrated. Requests for time extensions shall be accompanied by the payment of a fee set by resolution of the City Council.
If a project is associated with a code enforcement case, the dates specified in the code enforcement notices take precedence over the timelines specified in this section.
105.5 Expiration of permit. Permits issued by the building official shall expire one year from the date of issuance. The building official or the supervising building inspector are authorized to grant one or more extensions of time to complete the work for additional periods not exceeding one year per extension. The extension shall be requested in writing and justifiable cause demonstrated. Requests for time extensions shall be accompanied by the payment of a fee set by resolution of the City Council.
The issuance of a building permit shall not excuse the permittee or any other person from compliance with any notice and/or order to correct a code violation issued by the City.
When a permit is expired and a new permit is required to complete the work, a new permit application and plans shall be filed describing the remaining work to be done. If a site visit or other review is required to determine the extent of the remaining work, a fee may be charged to make such determination.
SECTION 109 – FEES
109.1 Payment of fees. Except when fees are deferred, a permit shall not be valid until the fees as set forth by resolution of City Council have been paid, nor shall an amendment to a permit be released until the additional fee, if any, has been paid.
109.2 Schedule of permit fees. On buildings, structures, electrical, gas, mechanical, and plumbing systems or alterations requiring a permit, a fee for each permit shall be paid as required, in accordance with the fee as set forth by resolution of the City Council. Fees for permits and inspections and other related services under this Code shall be assessed and paid as set forth by resolution of the City Council. Unless waived or deferred as
Page 17 of 319

Supplemental Attachment 2
Page 6 of 69
provided by local regulations, a plan review fee and other fees as specified in the resolution shall be paid at the time of submitting any documents for review and additional fees as specified in the resolution shall be paid at issuance of the permit.
109.4 Work commencing before permit issuance. Any person who commences any work on a building, structure, electrical, gas, mechanical or plumbing system before obtaining the necessary permit shall be subject to a fee as set forth by resolution of the City Council equal to and in addition to the permit fees for the portion of the scope of work performed without the permit.
109.7 Re-inspection fees. A re-inspection fee, as set forth by resolution of the City Council, may be assessed for each re-inspection when such portion of work for which an inspection is scheduled is not complete or when corrections previously called for are not made.
Re-inspection fees shall not be required each time a job is disapproved for failure to comply with the requirements of this Code. Rather this section shall be used to control the practice of calling for inspections before the job is ready for such inspection, or when the approved plans are not readily available to the inspector, or for failure to provide access on the date for which the inspection is requested, or when work deviates from the approved plans but no revision is submitted to the City.
To obtain a re-inspection, the applicant shall pay the re-inspection fee as set forth by resolution of the City Council. In instances where re-inspection fees have been assessed, no additional inspection of the work will be performed until the required fees have been paid.
SECTION 112 – SERVICE UTILITIES
112.4 Authority to connect utilities. Clearance for connection of one utility, either gas or electrical, will be withheld until final building, electrical, plumbing, and/or mechanical inspections are made and approval has been given for any new building or change in occupancy classification to an existing building for which connection to such utilities is sought, unless approval has been first obtained from the building official, as provided by a Temporary Certificate of Occupancy or Final Certificate of Occupancy.
112.5 Unsafe service utilities. Unsafe service utilities are hereby declared to be public nuisances and shall be abated, repaired, rehabilitated, demolished or removed in accordance with the procedures set forth in Chapter 19.40 of the Berkeley Municipal Code (BMC) for residential buildings and Berkeley Building Code for all other buildings, or any alternate procedure that may be adopted by the City of Berkeley. In addition, the City Attorney may pursue other appropriate action to prevent, restrain, correct or abate the violation as provided for in the BMC. Remedies under this section are cumulative. When service utilities are maintained in violation of this Code and in violation of a notice issued pursuant to the provisions of this section, the building official shall institute appropriate action to prevent, restrain, correct or abate the violation.
Page 18 of 319

Supplemental Attachment 2
Page 7 of 69
112.6 Authority to disconnect utilities in emergencies. The building official or his or her authorized representative shall have the authority to disconnect electrical power or other energy service supplied to the building, structure or building service equipment therein regulated by this Code in case of emergency where necessary to eliminate an immediate hazard to life or property. The building official or his or her authorized representative shall, whenever possible, notify the serving utility, and the owner of the building, structure or electrical system or equipment and any building occupants of the decision to disconnect prior to taking such action and shall notify them, in writing, of the disconnection as soon as possible thereafter. 112.7 Authority to condemn electrical system and equipment. Whenever the building official determines that an electrical system or electrical equipment regulated by this Code is hazardous to life, health or property, the building official may order in writing that such electrical system or equipment either be removed or restored to a safe condition. The written notice shall fix a reasonable time limit for compliance with such order. Persons shall not use or maintain defective electrical systems or equipment after receiving such notice except as may be provided therein.
When equipment or an installation is to be disconnected, a written notice of such disconnection and the reasons therefore shall be given within 24 hours of the order to disconnect to the serving utility, the owner and occupants of the building, structure or premises.
When equipment or an installation is maintained in violation of this Code and in violation of a notice issued pursuant to the provisions of this section, the building official shall institute appropriate action to prevent, restrain, correct or abate the violation.
Unsafe electrical systems or equipment are hereby declared to be public nuisances and shall be abated by repair, rehabilitation, demolition or removal in accordance with the procedures set forth in Chapter 19.40 of the BMC for residential buildings and Berkeley Building Code for all other buildings, or any alternate procedure that may be adopted by the City of Berkeley. In addition, the City Attorney may pursue other appropriate action to prevent, restrain, correct or abate the violation as provided for in the BMC. Remedies under this section are cumulative.
112.8 Connection after order to disconnect. Persons shall not make connections to a service utility system or equipment that has been disconnected or ordered to be disconnected by the building official, or the use of which has been ordered to be discontinued by the building official, until the building official authorizes the reconnection and use of the electrical system or equipment.
SECTION 113 – BOARD OF APPEALS
113.1 General. In order to hear and decide appeals of orders, decisions, or determinations made by the building official relative to the application and interpretation of this Code, there shall be and is hereby created a board of appeals consisting of the
Page 19 of 319

Supplemental Attachment 2
Page 8 of 69
Housing Advisory Commission pursuant to Section 19.44.020 of the Berkeley Municipal Code. The building official may convene and consult with an advisory panel of qualified individuals. This advisory panel is intended to help the building official in formulating and making staff recommendations to the Housing Advisory Commission. The advisory panel may provide written and/or oral presentations to the Housing Advisory Commission as needed.
113.3 Qualifications. The board of appeals shall consist of members meeting the qualifications required for the Housing Advisory Commission. The advisory panel shall consist of individuals found by the building official to be qualified by experience and training in the specific area of the appeal who are not employees of the jurisdiction.
SECTION 114 – VIOLATIONS
114.4 Violation penalties. Any person who violates a provision of this Code or fails to comply with any of the requirements thereof or who erects, constructs, alters or repairs a building or structure in violation of the approved construction documents or directive of the building official, or of a permit or certificate issued under the provisions of this Code, shall be subject to penalties as prescribed by law. Violations of this Code are misdemeanors, but may be cited or charged, at the election of the enforcing officer, building official, or City Attorney, as infractions, subject to an election by the defendant under Penal Code Subsection 17(d). Nothing in this Section shall prevent any other remedy afforded by law.
SECTION 116 - UNSAFE STRUCTURES AND EQUIPMENT
116.1 Conditions. Structures or existing equipment that are or hereafter become structurally unsafe, insanitary or deficient because of inadequate means of egress facilities, inadequate light and ventilation, or which constitute a fire hazard, or are otherwise dangerous to human life or the public welfare, or that involve illegal or improper occupancy or inadequate maintenance shall be deemed an unsafe condition. Unsafe structures shall be taken down and removed or made safe, as the building official deems necessary and as provided for in this section. A vacant structure that is not secured against entry shall be deemed unsafe.
All such unsafe buildings, equipment, structures or appendages are hereby declared to be public nuisances and shall be abated by repair, rehabilitation, demolition or removal in accordance with the procedures set forth in Chapters 1.24, 19.28, 19.40 and/or 19.44 of the BMC as applicable. As an alternative, the building official, or other employee or official of this jurisdiction as designated by the City Council, may institute any other appropriate action to prevent, restrain, correct or abate the violation.
116.6 Safety Assessment Placards.
116.6.1 Intent. This section establishes standard placards to be used to indicate the condition of a structure for occupancy after a natural disaster and a rapid evaluation by
Page 20 of 319

Supplemental Attachment 2
Page 9 of 69
authorized personnel. The building official and his or her authorized representatives post the appropriate placard at each entry point to a building or structure upon completion of a safety assessment.
116.6.2 Application of provisions. The provisions of this section are applicable to all buildings and structures of all occupancies regulated by the City of Berkeley. The Council may extend the provisions as necessary.
116.6.3 Definitions.
116.6.3.1 "Safety Assessment" is a visual, non-destructive examination of a building or structure for the purpose of determining the condition for continued occupancy.
116.6.3.2 Placards. Following are titles and descriptions of the official jurisdiction placards to be used to designate the condition of a building structure for continued occupancy, partial or conditional occupancy, or unsafe to enter. Copies of placards are on file in the Building and Safety Division of the Planning and Development Department.
INSPECTED – Lawful Occupancy Permitted is to be posted on any building or structure wherein no apparent hazard has been found. This placard is not intended to mean there is no damage to the building or structure, but that any damage that occurred does not present a hazard to occupants.
RESTRICTED USE is to be posted on each building or structure that has been damaged wherein the damage has resulted in some form of restriction to the continued occupancy. The individual who posts this placard will note in general terms the type of damage encountered and will clearly and concisely note the restrictions on continued occupancy.
UNSAFE – Do Not Enter or Occupy is to be posted on each building or structure that has been damaged such that continued occupancy poses a threat to life safety. Building or structures posted with this placard shall not be entered under any circumstances except as authorized in writing by the building official, or his or her authorized representative. Safety assessment teams shall be authorized to enter these building at any time. This placard is not to be used or considered as a demolition order. The individual who posts this placard will note in general terms the type of damage encountered.
116.6.4 Content of placard. The BMC Section number and the words "City of Berkeley" shall be permanently affixed to each placard.
116.6.5 Unlawful to remove. Once a placard has been attached to a building or structure, it is not to be removed, altered or covered until done so by an authorized representative of the Building Official. It shall be unlawful for any person, firm or corporation to alter, remove, cover or deface a placard unless authorized pursuant to this section.
Article 2. Restrictions in Fire Zones
Page 21 of 319

Supplemental Attachment 2
Page 10 of 69
19.28.030 CBC Chapter 7A Materials and Construction Methods for Exterior Wildlife Exposure.
Chapter 7A of the 2019 California Building Code is adopted in its entirety subject to the modifications thereto which are set forth below.
701A – SCOPE, PURPOSE AND APPLICATION
701A.1 Scope. This chapter applies to building materials, systems and or assemblies used in the exterior design and construction of new buildings and structures, additions, alterations, repairs and re-roofs located within a Wildland-Urban Interface Fire Area as defined in Section 702A.
701A.2 Purpose. The purpose of this Chapter is to establish minimum standards for the protection of life and property by increasing the ability of a building located in any Fire Hazard Severity Zone within State Responsibility Areas or any building or structure in the Wildland-Urban Interface Fire Area to resist the intrusion of flame or burning embers projected by a vegetation fire and contributes to a systematic reduction in conflagration losses.
701A.3 Application. New buildings located in any Fire Hazard Severity Zone or new buildings and structures, additions, alterations, repairs and re-roofs located in any Wildland-Urban Interface Fire Area designated by the enforcing agency constructed after the application date shall comply with the provisions of this Chapter.
Exceptions:1. Buildings or structures of an accessory character classified as a Group U
occupancy and not exceeding 120 square feet in floor area, when located at least 30 feet from an applicable building or property lines.
701A.3.1 Application date and where required. New buildings for which an application for a building permit is submitted on or after July 1, 2008 located in any Fire Hazard Severity Zone or buildings and structures, additions, alterations, repairs and re-roofs for which an application for a building permit is submitted on or after July 1, 2008 located in the Wildland Interface Fire Area shall comply with all sections of this chapter.
702A – DEFINITIONS
FIRE ZONE ONE shall encompass the entire City of Berkeley except for Fire Zones Two and Three.
FIRE ZONE TWO encompasses those areas designated as Combined Hillside District in the Official Zoning map of the City of Berkeley and those areas designated as Very High in the official Fire Hazard Severity Zones (FHSZ) map of The Department of Forestry and Fire Protection (CAL FIRE), as they may be amended from time to time. The following properties, not part of the Combined Hillside District, are included in Fire Zone Two under the Very High designation of the FHSZ map: the eastern section of the University of
Page 22 of 319

Supplemental Attachment 2
Page 11 of 69
California, Berkeley main campus, block number 2042 (Alameda County Assessor’s parcel numbering (APN) system), to the east city line; all of the Clark-Kerr campus, block number 7690, to the east city line; all of block number 7680 in the City of Berkeley; portions of block number 1702 in the City of Berkeley. See Exhibit A for the specific parcels by APN and address.
FIRE ZONE 3 encompasses those areas designated as Environmental Safety – Residential Districts on the Official Zoning Map of the City of Berkeley, as it may be amended from time to time.
LOCAL AGENCY VERY HIGH FIRE HAZARD SEVERITY ZONE means an area designated by a local agency upon the recommendation of the CDF Director pursuant to Government Code Sections 51177(c), 51178 and 51189 that is not a state responsibility area and where a local agency, city, county, city and county, or district is responsible for fire protection. Fire Zones 2 and 3 are designated as Local Agency High Fire Hazard Severity Zone.
WILDLAND-URBAN INTERFACE FIRE AREA is a geographical area identified by the state as a “Fire Hazard Severity Zone” in accordance with the Public Resources Code Sections 4201 through 4204 and Government Code Sections 51175 through 51189, or other areas designated by the enforcing agency to be at a significant risk from wildfires. Fire Zones 2 and 3 are designated as Wildland-Urban Interface Fire Area.
705A – ROOFING
705A.1 General. Roofs shall be a Class A minimum and shall comply with the requirements of Chapter 7A and Chapter 15. Roofs shall have a roofing assembly installed in accordance with its listing and the manufacturer's installation instructions. Wooden shakes and shingles are prohibited roof coverings regardless of the assembly rating of the roof system.
Exception: Replacement of less than 50% of the roof area within a 5 year period.
705A.5 Spark Arrestors. All chimneys of fireplaces, stoves, barbecues or heating appliances using solid fuel shall be provided with an approved spark arrestor whenever modification has been made to any of these appliances, or whenever a structure is re-roofed. The net free area of the spark arrestor shall be not less than four times the net free area of the outlet of the chimney. The spark arrestor shall have heat and corrosion resistance equivalent to twelve-gauge wire, nineteen gauge galvanized wire, or twenty-four-gauge stainless steel. Openings shall not permit the passage of spheres having a diameter larger than one-half inch and shall not block the passage of spheres having a diameter of less than three-eighths inch. The arrestor shall be securely attached to the chimney or stovepipe and shall be adequately supported. The use of bands, mollies, masonry anchors or mortar ties are recommended depending upon the individual need.
707A – EXTERIOR COVERING
Page 23 of 319

Supplemental Attachment 2
Page 12 of 69
707A.3.3 Replacement of Exterior Wall Covering. Materials for replacement of existing exterior wall covering shall meet or exceed the standards set forth in this Chapter.
Exception: Where less than 50% of any wall surface is being replaced or repaired, and the matching of the new plane to the existing plane on that wall is not possible.
711A – UNDERGROUND UTILITY CONNECTIONS
711A.1 Underground utility connections. For new construction, provisions shall be made for the undergrounding of all utilities serving the property, including but not limited to electrical, telephone and cable television, by the installation of appropriately sized underground conduits extending from the street property.
712A – ADDITIONAL REQUIREMENTS IN FIRE ZONE THREE
712A.1 General. In addition to meeting the other requirements of this Chapter, buildings or structures hereinafter erected, constructed, moved, altered, added, or repaired within Fire Zone Three shall comply with the following requirements for buildings and structures.
712A.2 Fire Warning System. All residential units shall be equipped with a Fire Warning System as specified by the residential smoke detector requirements of the current edition of the California Building Code and with an audible exterior alarm. The exterior alarm must meet the requirements of NFPA 72 or equivalent and generate 45 decibels ten feet from the alarm, or more.
712A.3 Automatic Fire Sprinklers, Berkeley Fire Code Section 903.3. Any new construction or new additions to existing structures requiring a permit determined to be $100,000 or more in construction costs shall be required to install automatic fire sprinklers throughout the existing structure.
712A.4 Utilities. Utilities, pipes, furnaces, water heaters or other mechanical devices located in an exposed underfloor area of a building or structure shall be enclosed with material as required for exterior one hour fire resistive construction. Adequate covered access openings for servicing and ventilation of such facilities shall be provided as required by appropriate codes.
712A.5 Control of brush or vegetation. Brush and vegetation shall be controlled as required in the Berkeley Fire Code.
712A.6 Special Conditions. The following additional conditions must be met:1. Public access roads and fire trails. No person(s) shall use any public access
road or fire trail for the storage of any construction material, stationary construction equipment, construction office, portable refuse container, or earth from any grading or excavating.
Page 24 of 319

Supplemental Attachment 2
Page 13 of 69
2. Water Service. The water service to the site shall be installed with a ¾” hose bib connection prior to beginning any wood framing. The person responsible for the construction shall have at the site a 75 ft ¾” hose available.
Exhibit AParcels in Addition to the Combined Hillside District
The following additional parcels by Assessor’s Parcel Number and address are included in Fire Zone Two:
Parcel Number (APN) Address048-7680-001-02 3 Tanglewood Road048-7680-002-01 5 Tanglewood Road048-7680-031-00 7 Tanglewood Road048-7680-019-00 11 Tanglewood Road048-7680-014-00 19 Tanglewood Road048-7680-032-01 25 Tanglewood Road048-7680-027-00 29 Tanglewood Road054-1702-067-00 10 Tanglewood Road054-1702-068-00 18 Tanglewood Road054-1702-069-00 22 Tanglewood Road054-1702-070-00 28 Tanglewood Road054-1702-063-00 2701 Belrose Avenue054-1702-076-00 2715 Belrose Avenue054-1702-075-00 2721 Belrose Avenue054-1702-074-00 2729 Belrose Avenue054-1702-073-00 2737 Belrose Avenue054-1702-112-00 2801 Claremont Boulevard054-1702-123-01 2811 Claremont Boulevard054-1702-122-00 2815 Claremont Boulevard054-1702-120-01 2821 Claremont Boulevard054-1702-114-01 2816 Claremont Avenue054-1702-115-00 2820 Claremont Avenue054-1702-072-00 3005 Garber Street054-1702-071-00 3015 Garber Street054-1702-113-00 3020 Garber Street054-1702-116-00 3017 Avalon Avenue
Article 3. Wood Burning Appliances
Page 25 of 319

Supplemental Attachment 2
Page 14 of 69
19.28.040 Wood Burning Appliances.
Chapter 31 of the 2019 California Building Code is adopted in its entirety subject to the modifications thereto which are set forth below.
3114 Wood Burning Appliances.
A. The purpose of this section is to reduce the health risks caused by wood smoke under the climatic conditions applicable to Berkeley.
B. For purposes of this section the following terms shall be defined as set forth below.
1. “EPA” means the United States Environmental Protection Agency.
2. “EPA Certified” means any wood heater that is labeled “EPA Certified” in accordance with the standards in Title 40, Part 60, Subpart AAA, of the Code of Federal Regulations or equivalent, in effect at the time the wood heater is installed.
3. “Pellet heater” means wood heaters that burn pellet fuel exclusively and are either EPA-certified or exempted under EPA requirements set forth in Part 60 Title 40, Subpart AAA, of the Code of Federal Regulations, February 26, 1988.
4. “Wood-burning” means an appliance that burns wood or any wood-based solid fuel, including but not limited to wood pellets.
5. “Wood burning cooking device” means any wood-burning device that is designed or primarily used for cooking.
6. “Wood-burning fireplace” means any permanently-installed masonry or factory-built wood-burning appliance, either open or with doors in front of the combustion chamber, which is neither a wood heater as defined in 40 CFR 60.531 nor designed and used for cooking.
C. No wood-burning fireplace or wood heater as defined in 40 CFR 60.531, that is not EPA certified or exempted by under EPA requirements may be installed in any occupancy.
Exception: Existing masonry fireplaces may be repaired in accordance with the applicable codes in effect at the time of the proposed repair or reconstruction. For purposes of this exception, the term repair includes resurfacing the combustion chamber, but does not include replacing any other part of the combustion chamber.
D. Wood burning cooking devices are not prohibited by this section.
E. Any person planning to install a wood-burning fireplace or heating stove must submit
Page 26 of 319

Supplemental Attachment 2
Page 15 of 69
verifiable documentation to the City showing that the appliance conforms to the requirements of this section.
Article 4. Projection into Public Right of Way
19.28.050 Encroachments into the Public Right of Way – Revocation, Removal, Indemnification and Hold Harmless.
Chapter 32 of the 2019 California Building Code is adopted in its entirety subject to the modifications thereto which are set forth below.
3202 – ENCROACHMENTS
3202.5 Projection into the Public Right of Way – Revocation, Removal, Indemnification and Hold Harmless.
Any permits granted pursuant to this Code which allow any projection upon, over, or under the public right of way may be revoked by the City at any time. Upon such revocation, the permittee or his or her successor(s) or assignee(s) shall forthwith remove such projection at his or her cost and expense and without any cost or expense whatsoever to the City.
Any person who is granted a permit pursuant to the provisions of this Code which allows a projection upon, over or under the public right of way shall by the issuance of such permit thereby indemnify and hold harmless the City of Berkeley, its officers and employees of and from any and all liabilities, claims, demands, actions or causes of action for injury or injuries to any person or persons or death or deaths of any person or persons or damage to property arising out of or occasioned in any way by the issuance of said permit, the work performed pursuant to such permit, or the existence of such projection. The obligation of such indemnification and hold harmless provision shall be applicable to the successor(s) and assignee(s) of the permittee.
Article 5. Existing Buildings
19.28.060 Adoption of 2019 California Existing Building Code and certain Chapters of the 2018 International Existing Building Code by reference.
2019 California Existing Building Code (CEBC), including Appendix A, is adopted in its entirety subject to the modifications thereto which are set forth below.
DIVISION II SCOPE AND ADMINISTRATIONAll of the administrative provisions contained in Article 1 of Chapter 19.28, the Berkeley Building Code, shall apply to this Code as well and take precedence over any CEBC administrative provisions that may conflict.
101.9 Adoption of Certain Chapters of the 2018 International Existing Building Code by reference.
Page 27 of 319

Supplemental Attachment 2
Page 16 of 69
When seismic retrofit is not otherwise required by this Code, the following Chapters of the 2018 International Existing Building Code (IEBC) published by the International Code Council contained in the IEBC Appendix A are hereby adopted by reference as applicable to the types of buildings as designated therein as though fully set forth herein:
Chapter A2, Earthquake Hazard Reduction in Existing Reinforced Concrete and Reinforced Masonry Wall Buildings with Flexible Diaphragms,
Chapter A5, Earthquake Hazard Reduction in Existing Concrete Buildings.
Article 6. Repairs to Existing Buildings and Structures
19.28.070 Adoption of Regulations for the Repairs of Existing Structures.
Add a new Subsection 405.2.6 to Chapter 4 Repairs Section 405 Structural of the California Existing Building Code.
405.2.6 Seismic Evaluation and Design Procedures for Repairs. The seismic evaluation and design shall be based on the procedures specified in the California Building Code or ASCE 41 Seismic Evaluation and Retrofit of Existing Buildings. The procedures contained in Appendix A Chapters A1, A3 and A4 of the California Existing Building Code and Appendix A Chapters A2 and A5 of the International Existing Building Code shall be permitted to be used as specified in Section 405.2.6.2.
405.2.6.1 Compliance with CBC level seismic forces. Where compliance with the seismic design provisions of the California Building Code is required, the procedures shall be in accordance with one of the following:
1. One-hundred percent of the values in the California Building Code. Where the existing seismic force-resisting system is a type that can be designated as “Ordinary,” the values of R, Ωo, and Cd used for analysis in accordance with Chapter 16 of the California Building Code shall be those specified for structural systems classified as “Ordinary” in accordance with Table 12.2-1 of ASCE 7, unless it is demonstrated that the structural system will provide performance equivalent to that of a “Detailed,” “Intermediate” or “Special” system.
2. Compliance with ASCE 41 using both BSE-1 and BSE-2 earthquake hazard levels and the corresponding performance levels in Table 405.2.6.1.
Table 405.2.6.1PERFORMANCE CRITERIA FOR CBC LEVEL SEISMIC FORCES
Page 28 of 319

Supplemental Attachment 2
Page 17 of 69
RISK CATEGORY (BASED ON CBC TABLE 1604.5)
PERFORMANCE LEVEL FOR USE WITH ASCE 41
BSE-1 EARTHQUAKE HAZARD LEVEL
PERFORMANCE LEVEL FOR USE WITH ASCE
41 BSE-2 EARTHQUAKE HAZARD
LEVEL
I Life Safety (LS) Collapse Prevention (CP)
II Life Safety (LS) Collapse Prevention (CP)
III Note a Note a
IV Immediate Occupancy (IO) Life Safety (LS)a. Acceptance criteria for Risk Category III shall be taken as 80 percent of the
acceptance criteria specified for Risk Category II performance levels, but need not be less than the acceptance criteria specified for Risk Category IV performance levels.
405.2.6.2 Compliance with reduced CBC level seismic forces. Where seismic evaluation and design is permitted to meet reduced California Building Code seismic force levels, the procedures used shall be in accordance with one of the following:
1. The California Building Code using 75 percent of the prescribed forces. Values of R, Ωo, and Cd used for analysis shall be as specified in Section 405.2.6.1 Item 1.
2. Structures or portions of structures that comply with the requirements of the applicable chapter in Appendix A of the California Existing Building Code (CEBC) or Appendix A of the International Existing Building Code (IEBC) as specified in Items 2.1 through 2.5 below shall be deemed to comply with this section.
2.1. The seismic evaluation and design of unreinforced masonry bearing wall buildings in Risk Category I or II are permitted to be based on the procedures specified in CEBC Appendix A Chapter A1, provided the design is no less stringent than required in Berkeley Municipal Code Section 19.38.130.
2.2. Seismic evaluation and design of the wall anchorage system in reinforced concrete and reinforced masonry wall buildings with flexible diaphragms in Risk Category I or II are permitted to be based on the procedures specified in IEBC Appendix A Chapter A2.
2.3. Seismic evaluation and design of cripple walls and sill plate anchorage in residential buildings of light-frame wood construction in Risk Category I or II are permitted to be based on the procedures specified in CEBC Appendix A Chapter A3.
2.4. Seismic evaluation and design of soft, weak, or open-front wall conditions in
Page 29 of 319

Supplemental Attachment 2
Page 18 of 69
multiunit residential buildings of wood construction in Risk Category I or II are permitted to be based on the procedures specified in CEBC Appendix A Chapter A4.
2.5. Seismic evaluation and design of concrete buildings in all Risk Categories are permitted to be based on the procedures specified in IEBC Appendix A Chapter A5.
3. Compliance with ASCE 41 using the BSE-1 Earthquake Hazard Level defined in ASCE 41 and the performance level as shown in Table 405.2.6.2. The design spectral response acceleration parameters Sxs and Sx1 specified in ASCE 41 shall not be taken less than 75 percent of the respective design spectral response acceleration parameters SDS and SD1 defined by the California Building Code and its reference standards.
Page 30 of 319
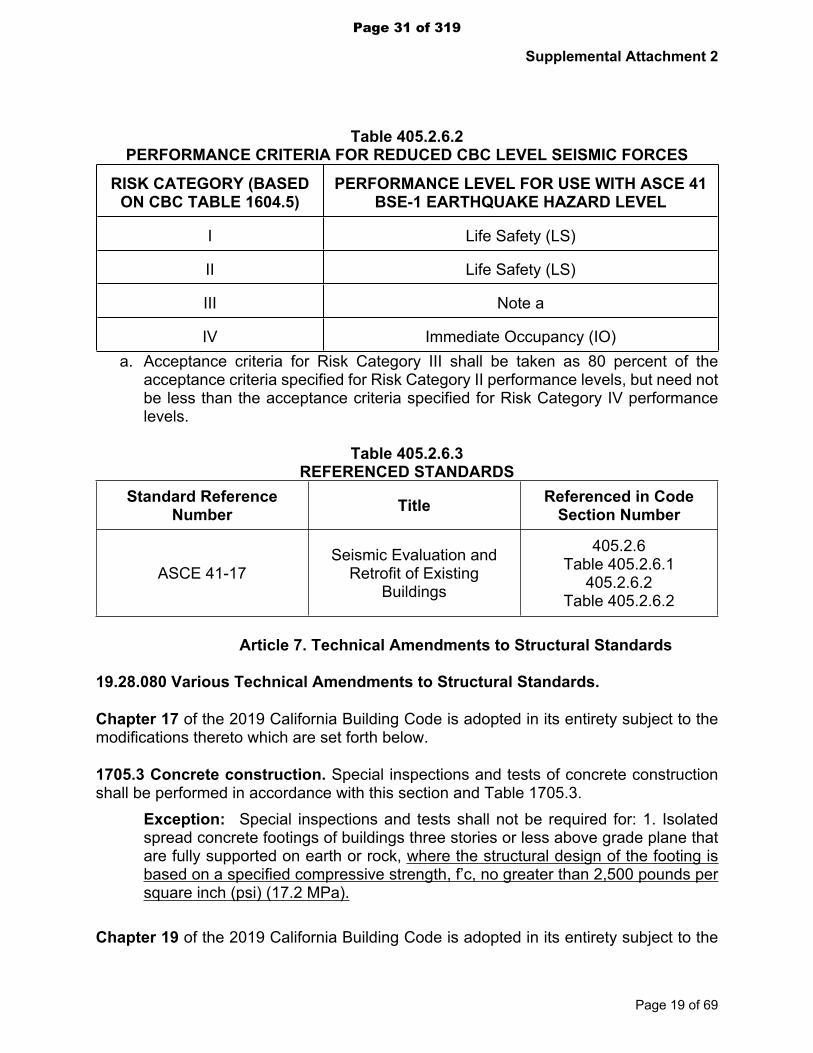
Supplemental Attachment 2
Page 19 of 69
Table 405.2.6.2PERFORMANCE CRITERIA FOR REDUCED CBC LEVEL SEISMIC FORCES
RISK CATEGORY (BASED ON CBC TABLE 1604.5)
PERFORMANCE LEVEL FOR USE WITH ASCE 41 BSE-1 EARTHQUAKE HAZARD LEVEL
I Life Safety (LS)
II Life Safety (LS)
III Note a
IV Immediate Occupancy (IO)a. Acceptance criteria for Risk Category III shall be taken as 80 percent of the
acceptance criteria specified for Risk Category II performance levels, but need not be less than the acceptance criteria specified for Risk Category IV performance levels.
Table 405.2.6.3REFERENCED STANDARDS
Standard Reference Number Title Referenced in Code
Section Number
ASCE 41-17Seismic Evaluation and
Retrofit of Existing Buildings
405.2.6Table 405.2.6.1
405.2.6.2Table 405.2.6.2
Article 7. Technical Amendments to Structural Standards
19.28.080 Various Technical Amendments to Structural Standards.
Chapter 17 of the 2019 California Building Code is adopted in its entirety subject to the modifications thereto which are set forth below.
1705.3 Concrete construction. Special inspections and tests of concrete construction shall be performed in accordance with this section and Table 1705.3.
Exception: Special inspections and tests shall not be required for: 1. Isolated spread concrete footings of buildings three stories or less above grade plane that are fully supported on earth or rock, where the structural design of the footing is based on a specified compressive strength, f’c, no greater than 2,500 pounds per square inch (psi) (17.2 MPa).
Chapter 19 of the 2019 California Building Code is adopted in its entirety subject to the
Page 31 of 319

Supplemental Attachment 2
Page 20 of 69
modifications thereto which are set forth below.
1905.1.7 ACI 318, Section 14.1.4. Delete ACI 318, Section 14.1.4, and replace with the following:
14.1.4 - Plain concrete in structures assigned to Seismic Design Category C, D, E or F.14.1.4.1 - Structures assigned to Seismic Design Category C, D, E or F shall not have elements of structural plain concrete, except as follows:(a) Structural plain concrete basement, foundation or other walls below the base
are permitted in detached one and two-family dwellings three stories or less in height constructed with stud bearing walls. In dwellings assigned to seismic design category D or E, the height of the wall shall not exceed 8 feet (2438 mm), the thickness shall not be less than 71/2 inches (190 mm), and the wall shall retain no more than 4 feet (1219 mm) of unbalanced fill. Walls shall have reinforcement in accordance with 14.6.1.
(b) Isolated footings of plain concrete supporting pedestals or columns are permitted, provided the projection of the footing beyond the face of the supported member does not exceed the footing thickness.
Exception: In detached one- and two-family dwelling three stories or less in height, the projection of the footing beyond the face of the supported member is permitted to exceed the footing thickness.
(c) Plain concrete footings supporting walls are permitted, provided the footings have at least two continuous longitudinal reinforcing bars. Bars shall not be smaller than No. 4 and shall have a total area of not less than 0.002 times the gross cross-sectional area of the footing. For footings that exceed 8” inches (203 mm) in thickness, A minimum of one bar shall be provided at the top and bottom of the footing. Continuity of reinforcement shall be provided at corners and intersections.
Exceptions: 1. In seismic design categories A, B and C, detached one- and two-family
dwellings three stories or less in height and constructed with stud bearing walls, are permitted to have plain concrete footings without longitudinal reinforcement.
2. For foundation systems consisting of a plain concrete footing and a plain concrete stem wall, a minimum of one bar shall be provided at the top of the stem wall and at the bottom of the footing.
3. Where a slab on ground is cast monolithically with the footing, one No. 5 bar is permitted to be located at either the top of the slab or bottom of the footing.
Article 8. Construction of Exterior Appurtenances
Page 32 of 319

Supplemental Attachment 2
Page 21 of 69
19.28.090 Technical Amendments for Construction of Exterior Projecting Elements and Appurtenances.
Chapter 12 of the 2019 California Building Code is adopted in its entirety subject to the modifications thereto which are set forth below:
1202.7 Ventilation of weather exposed enclosed assemblies. Balconies, landings, decks, stairs and similar exterior projecting elements and appurtenances exposed to the weather and sealed underneath shall have cross ventilation for each separate enclosed space by ventilation openings protected against the entrance of rain and snow and as set forth in Section 2304.12.2.6. Blocking and bridging shall be arranged so as not to interfere with the movement of air. The net free ventilating area shall not be less than 1/150th of the area of the space ventilated. Ventilation openings shall comply with Section 1202.2.2. An access panel of sufficient size shall be provided on the underside of the enclosed space to allow for periodic inspection.
Exceptions:1. An access panel is not required where the exterior coverings applied to the underside of joists are easily removable using only common tools.2. Removable soffit vents 4 inches minimum in width can be used to satisfy both ventilation and access panel requirements.
Chapter 14 of the 2019 California Building Code is adopted in its entirety subject to the modifications thereto which are set forth below:
1403.14 Projections exposed to weather. Balconies, landings, decks, stairs and similar floor projections exposed to the weather shall be constructed of naturally durable wood, preservative-treated wood, corrosion resistant (e.g., galvanized) steel, or similar approved materials.
Chapter 23 of the 2019 California Building Code is adopted in its entirety subject to the modifications thereto which are set forth below:
2304.12.2.3 Supporting members for permanent appurtenances. Naturally durable or preservative-treated wood shall be utilized for those portions of wood members that form the structural supports of buildings, balconies, porches or similar permanent building appurtenances where such members are exposed to the weather without adequate protection from a roof, eave, overhang or other covering to prevent moisture or water accumulation on the surface or at joints between members.
2304.12.2.4 Laminated timbers. The portions of glued-laminated timbers that form the structural supports of a building or other structure, projecting element, or appurtenance and are exposed to weather and not fully protected from moisture by a roof, eave or similar covering shall be pressure treated with preservative or be manufactured from naturally durable or preservative-treated wood.
Page 33 of 319

Supplemental Attachment 2
Page 22 of 69
2304.12.2.5 Supporting members for permeable floors and roofs. Wood structural members that support moisture-permeable floors or roofs that are exposed to the weather, such as concrete or masonry slabs, shall be of naturally durable or preservative-treated wood unless and shall be separated from such floors or roofs by an impervious moisture barrier.
Article 9. Emergency Housing
19.28.100 Emergency Housing and Emergency Housing Facilities.
HCD Appendix O of the 2019 California Building Code is adopted on an emergency basis and reproduced in its entirety subject to the modifications thereto which are set forth below:
APPENDIX OEMERGENCY HOUSING
SECTION O101
GENERAL
O101.1 Scope. This appendix shall be applicable to emergency housing and emergency housing facilities, as defined in Section O102. The provisions and standards set forth in this appendix shall be applicable to emergency housing established pursuant to the declaration of a shelter crisis under Government Code section 8698 et seq. and located in new or existing buildings, structures, or facilities owned, operated, erected, or constructed by, for or on behalf of the City of Berkeley on land owned or leased by the City of Berkeley.
O101.2 Application. Notwithstanding any provisions of this Code to the contrary, the following requirements shall apply to emergency housing operated during a shelter crisis, as provided for in Government Code Section 8698 et seq. Other than the specific requirements set forth in this appendix, the facilities need not comply with the requirements of this Code for Group R occupancies unless otherwise specified in this Code.
SECTION O102
DEFINITIONS
N102.1 General. The following words and terms shall, for the purposes of this appendix, have the meanings shown herein. Refer to Chapter 2 of this code for general definitions.
DECLARATION OF SHELTER CRISIS. The duly proclaimed existence of a situation in which a significant number of persons are without the ability to obtain shelter, resulting in a threat to their health and safety. (See Government Code Section 8698)
DEPENDENT UNIT. Emergency housing not equipped with a kitchen area, toilet, and
Page 34 of 319

Supplemental Attachment 2
Page 23 of 69
sewage disposal system. Recreational vehicles that are not self-contained and without utility service connections shall be considered dependent units.
EMERGENCY HOUSING. Housing in a permanent or temporary structure(s), occupied during a declaration of state of emergency, local emergency, or shelter crisis. Emergency housing may include, but is not limited to, buildings and structures constructed in accordance with the California Building Standards Code; and emergency sleeping cabins, emergency transportable housing units, and tents constructed in accordance with this appendix.
EMERGENCY HOUSING FACILITIES. On-site common use facilities supporting emergency housing. Emergency housing facilities include, but are not limited to, kitchen areas, toilets, showers and bathrooms with running water. The use of emergency housing facilities is limited exclusively to the occupants of the emergency housing, personnel involved in operating the housing, and other emergency personnel.
EMERGENCY HOUSING SITE. A site containing emergency housing and emergency housing facilities supporting the emergency housing.
EMERGENCY SLEEPING CABIN. Relocatable hard-sided structure constructed in accordance with this appendix, which may be occupied only for emergency housing if allowed by the enforcing agency.
EMERGENCY TRANSPORTABLE HOUSING UNIT. A single or multiple section prefabricated structure that is transportable by a vehicle and that can be installed on a permanent or temporary site in response to a need for emergency housing. Emergency transportable housing units include, but are not limited to, manufactured homes, mobilehomes, multifamily manufactured homes, recreational vehicles, and park trailers.For the purposes of this appendix, emergency transportable housing units may also include commercial modulars as defined in the Health and Safety Code Section 18001.8, if approved by the enforcing agency.Emergency transportable housing units do not include factory-built housing as defined in the Health and Safety Code Section 19971.
LANDING PLATFORM. A landing provided as the top step of a stairway accessing a loft.
LOCAL EMERGENCY. Local Emergency as defined in the Government Code, Section 8558.
LOFT. A floor level located more than 30 inches (762 mm) above the main floor and open to it on at least one side with a ceiling height of less than 6 feet 8 inches (2032 mm), used as a living or sleeping space.
MANUFACTURED HOME. A structure designed to be used as a single-family dwelling, as defined in the Health and Safety Code, Section 18007.
Page 35 of 319

Supplemental Attachment 2
Page 24 of 69
MOBILEHOME. A structure designed to be used as a single-family dwelling, as defined in the Health and Safety Code, Section 18008.
MULTIFAMILY MANUFACTURED HOME. A structure designed to contain not less than two dwelling units, as defined in the Health and Safety Code, Section 18008.7.
PARK TRAILER. A trailer designed for human habitation that meets all requirements in the Health and Safety Code, Section 18009.3.
RECREATIONAL VEHICLE. A motor home, travel trailer, truck camper, or camping trailer, with or without motive power, designed for human habitation, that meets all requirements in the Health and Safety Code, Section 18010.
STATE OF EMERGENCY. State of Emergency as defined in the Government Code, Section 8558.
TENT. A structure, enclosure or shelter, with or without sidewalls or drops, constructed of fabric or pliable material supported by any manner except by air or the contents that it protects.
SECTION O103
EMERGENCY HOUSING
O103.1 General. Emergency sleeping cabins, emergency transportable housing units including commercial modulars, membrane structures and tents constructed and/or assembled in accordance with this appendix, shall be occupied only during declaration of state of emergency, local emergency, or shelter crisis.
Buildings and structures constructed in accordance with the California Building Standards Code, used as emergency housing, shall be permitted to be permanently occupied.
O103.2 Existing buildings. Existing residential and nonresidential buildings or structures shall be permitted to be used as emergency housing and emergency housing facilities provided such buildings or structures comply with the building code provisions and/or other regulations in effect at the time of original construction and/or alteration. Existing buildings or structures used as emergency housing shall not become or continue to be substandard buildings, as determined by the enforcing agency.
O103.2.1 New additions, alterations, and change of occupancy. New additions, alterations, and change of occupancy to existing buildings shall comply with the requirements of the California Building Standards Code effective at the time of addition, alteration, or change of occupancy. The requirements shall apply only to and/or within the specific area of the addition, alteration, or change of occupancy.Exceptions:
Page 36 of 319

Supplemental Attachment 2
Page 25 of 69
1. Existing buildings and structures used for emergency housing and emergency housing facilities may not be required to comply with the California Energy Code, as determined by the enforcing agency.
2. Change in occupancy shall not mandate conformance with new construction requirements set forth in the California Building Standards Code, provided such change in occupancy meets the minimum fire and life safety requirements set forth in Section O112 of this appendix.
O103.3 Occupant load. Except as otherwise stated in this appendix, the maximum occupant load allowed in buildings and structures used as emergency housing shall be determined by the enforcing agency, but the interior floor area shall not be less than 70 square feet (6.5 m2) for one occupant. Where more than one person occupies the building/structure, the required floor area shall be increased at the rate of 50 square feet (4.65 m2) for each occupant in excess of one.Exceptions:
1. Tents.
2. Recreational vehicles and park trailers designed for human habitation that meet the requirements in the Health and Safety Code, Sections 18009.3 and 18010, as applicable
O103.4 Fire and life safety requirements not addressed in this appendix. If not otherwise addressed in this appendix, fire and life safety measures, including, but not limited to, means of egress, fire separation, fire sprinklers, smoke alarms, and carbon monoxide alarms, shall be determined and enforced by the enforcing agency.
O103.5 Privacy. Emergency housing shall be provided with a privacy lock on each entrance door and all windows for use by the occupants.
O103.6 Heating. All sleeping areas shall be provided with adequate heating as determined by the enforcing agency.
SECTION O104
EMERGENCY SLEEPING CABINS
O104.1 General. Emergency sleeping cabins shall have an interior floor area of not less than 70 square feet (6.5 m2) for one occupant. Where more than one person occupies the cabin, the required floor area shall be increased at the rate of 50 square feet (4.65 m2) for each occupant in excess of one. The interior floor area shall not exceed 400 square feet (37 m2), excluding lofts.
O104.2 Live loads. Emergency sleeping cabins shall be designed to resist intrusion of wind, rain, and to support the following live loads:
1. Floor live loads not less than 40 pounds per square foot (1.92 kPa) of floor area.2. Horizontal live loads not less than 15 pounds per square foot (718 Pa) of vertical
Page 37 of 319

Supplemental Attachment 2
Page 26 of 69
wall and roof area.3. Roof live loads not less than 20 pounds per square foot (958 Pa) of horizontal
roof area.4. In areas where snow loads are greater than 20 pounds per square foot (958 Pa),
the roof shall be designed and constructed to resist these additional loads.
O104.3 Minimum ceiling height. Habitable space and hallways in emergency sleeping cabins shall have a ceiling height of not less than 80 inches (2032 mm). Bathrooms, toilet rooms, and kitchens, if provided, shall have a ceiling height of not less than 76 inches (1930 mm). Obstructions shall not extend below these minimum ceiling heights including beams, girders, ducts, lighting and other obstructions.
Exception: Ceiling heights in lofts constructed in accordance with Section N108 are permitted to be less than 80 inches (2032 mm).
O104.4 Means of egress. Emergency sleeping cabins shall be provided with at least two forms of egress placed remotely from each other. One form of egress may be an egress window complying with Section N104.4.1. When a loft is provided, one form of egress shall be an egress window complying with Section N104.4.1, provided in the loft space.
O104.4.1 Egress window. The bottom of the clear opening of the egress window shall not be more than 44 inches (1118 mm) above the floor. The egress window shall have a minimum net clear opening height of 24 inches (610 mm), and a minimum net clear opening width of 20 inches (508 mm). The egress window shall have a minimum net clear opening area of 5 square feet (0.465 m2).
O104.5 Plumbing and gas service. If an emergency sleeping cabin contains plumbing or gas service, it shall comply with all applicable requirements of the California Plumbing Code and the California Mechanical Code.
O104.6 Electrical. Emergency sleeping cabins shall be provided with all of the following installed in compliance with the California Electrical Code:
1. Continuous source of electricity.Exception: The source of electricity may be an emergency generator or renewable source of power such as solar or wind power.
2. At least one interior lighting fixture.3. Electrical heating equipment listed for residential use and a dedicated receptacle
outlet for the electrical heating equipment.Exception: Electrical heating equipment and a dedicated receptacle outlet for the electrical heating equipment are not required if a nonelectrical source of heating is provided.
4. At least one GFCI-protected receptacle outlet for use by the occupant(s).
Page 38 of 319

Supplemental Attachment 2
Page 27 of 69
O104.7 Ventilation. Emergency sleeping cabins shall be provided with means of ventilation (natural and/or mechanical) allowing for adequate air replacement, as determined by the enforcing agency.
O104.8 Smoke alarms. Emergency sleeping cabins shall be provided with at least one smoke alarm installed in accordance with the California Residential Code, Section R314.
O104.9 Carbon monoxide alarms. If an emergency sleeping cabin contains a fuel-burning appliance(s) or a fireplace(s), a carbon monoxide alarm shall be installed in accordance with the California Residential Code, Section R315
SECTION O105
EMERGENCY TRANSPORTABLE HOUSING UNITS
O105.1 General. In addition to the requirements in this appendix, manufactured homes, mobilehomes, multifamily manufactured homes, commercial modulars, recreational vehicles, and park trailers used as emergency transportable housing shall comply with all applicable requirements in the Health and Safety Code, Division 13, Part 2; and Title 25, Division 1, Chapter 3, Subchapter 2.
No provisions of Sections O111 through O114 of this appendix shall be deemed to grant authorization for any additional work that may conflict with the standards specified in Section O105 applicable for emergency transportable housing units.
SECTION O106
TENTS AND MEMBRANE STRUCTURES
O106.1 General. Tents shall not be used to house occupants for more than 7 days unless such tents are maintained with tight wooden floors raised at least 4 inches (101.6 mm) above the ground level and are equipped with baseboards on all sides to a height of at least 6 inches (152.4 mm). Tents may be maintained with concrete slabs with the finished surface at least 4 inches (101.6 mm) above grade and equipped with curbs on all sides at least 6 inches (152.4 mm) high.
A tent shall not be considered a suitable sleeping place when it is found necessary to provide heating facilities in order to maintain a minimum temperature of 50 degrees Fahrenheit (10 degrees Celsius) within such tent during the period of occupancy.
Membrane structures installed and/or assembled in accordance with Chapter 31 of this code, may be permitted to be used as emergency housing and emergency housing facilities, as determined by the enforcing agency.
Tents and membrane structures shall comply with Chapter 31 of the California Fire Code and shall not be erected for a period of more than 180 days within a 12 month period.
Page 39 of 319

Supplemental Attachment 2
Page 28 of 69
Tents and membrane structures shall be limited to one level located at the level of Fire Department vehicle access road or lane. Tents and membrane structures complying with Chapter 31 of the California Fire Code shall not be subject to additional provisions of Sections O111 and O112 of this appendix.
Tents and membrane structures used for sleeping purposes shall be equipped with single station battery powered smoke alarms installed in accordance with Section 907.2.11 of the California Fire Code.
SECTION O107
ACCESSIBILITY
O107.1 General. Emergency housing shall comply with the applicable requirements in Chapter 11B and/or the US Access Board Final Guidelines for Emergency Transportable Housing.
Note: The Architectural and Transportation Barriers Compliance Board (US Access Board) issued the Final Guidelines for Emergency Transportable Housing on May 7, 2014. The final guidelines amended the 2004 ADA Accessibility Guidelines (2004 ADAAG) and the 2004 Architectural Barriers Act (ABA) Accessibility Guidelines (2004 ABAAG) to specifically address emergency transportable housing units provided to disaster survivors by entities subject to the ADA or ABA. The final rule ensures that the emergency transportable housing units are readily accessible to and usable by disaster survivors with disabilities.
SECTION O108
LOFTS IN EMERGENCY HOUSING
O108.1 Minimum loft area and dimensions. Lofts used as a sleeping or living space shall meet the minimum area and dimension requirements of Sections O108.1.1 through O108.1.3.
O108.1.1 Minimum area. Lofts shall have a floor area of not less than 35 square feet (3.25 m2).
O108.1.2 Minimum dimensions. Lofts shall be not less than 5 feet (1524 mm) in any horizontal dimension.
O108.1.3 Height effect on loft area. Portions of a loft with a sloping ceiling measuring less than 3 feet (914 mm) from the finished floor to the finished ceiling shall not be considered as contributing to the minimum required area for the loft.Exception: Under gable roofs with a minimum slope of 6:12, portions of a loft with a
sloping ceiling measuring less than 16 inches (406 mm) from the finished floor to the finished ceiling shall not be considered as contributing to the minimum required area for the loft.
Page 40 of 319

Supplemental Attachment 2
Page 29 of 69
O108.2 Loft access. The access to and primary egress from lofts shall be any type described in Sections O108.2.1 through O108.2.4.
O108.2.1 Stairways. Stairways accessing lofts shall comply with the California Residential Code or with Sections O108.2.1.1 through O108.2.1.6.
O108.2.1.1 Width. Stairways accessing a loft shall not be less than 17 inches (432 mm) in clear width at or above the handrail. The minimum width below the handrail shall be not less than 20 inches (508 mm).
O108.2.1.2 Headroom. The headroom in stairways accessing a loft shall be not less than 74 inches (1880 mm), as measured vertically, from a sloped line connecting the tread or landing platform nosings in the middle of their width.
O108.2.1.3 Treads and risers. Risers for stairs accessing a loft shall be not less than 7 inches (178 mm) and not more than 12 inches (305 mm) in height. Tread depth and riser height shall be calculated in accordance with one of the following formulas:1. The tread depth shall be 20 inches (508 mm) minus 4/3 of the riser height, or2. The riser height shall be 15 inches (381 mm) minus 3/4 of the tread depth.
O108.2.1.4 Landing platforms. The top step of stairways accessing lofts shall be constructed as a landing platform where the loft ceiling height is less than 74 inches (1880 mm). The landing platform shall be 18 inches (457 mm) to 22 inches (559 mm) in depth measured from the nosing of the landing platform to the edge of the loft, and 16 inches (406 mm) to 18 inches (457 mm) in height measured from the landing platform to the loft floor.
O108.2.1.5 Handrails. Handrails shall comply with the California Residential Code, Section R311.7.8.
N108.2.1.6 Stairway guards. Guards at open sides of stairways shall comply with the California Residential Code, Section R312.1.
O108.2.2 Ladders. Ladders accessing lofts shall comply with Sections O108.2.2.1 and O108.2.2.2.
O108.2.2.1 Size and capacity. Ladders accessing lofts shall have a rung width of not less than 12 inches (305 mm), and 10 inches (254 mm) to 14 inches (356 mm) spacing between rungs. Ladders shall be capable of supporting a 200 pound (90.7 kg) load on any rung. Rung spacing shall be uniform within 3/8-inch (9.5 mm).
O108.2.2.2 Incline. Ladders shall be installed at 70 to 80 degrees from horizontal.
Page 41 of 319

Supplemental Attachment 2
Page 30 of 69
O108.2.3 Alternating tread devices. Alternating tread devices are acceptable as allowed by the enforcing agency.
O108.2.4 Loft guards. Loft guards shall be located along the open side of lofts. Loft guards shall not be less than 36 inches (914 mm) in height or one-half of the clear height to the ceiling, whichever is less. Loft guards shall not have openings from the walking surface to the required guard height that allow passage of a sphere 4 inches (102 mm) in diameter.
SECTION O109
LOCATION, MAINTENANCE AND IDENTIFICATION
O109.1 Maintenance. Emergency housing and emergency housing facilities shall be maintained in a safe and sanitary condition, and free from vermin, vectors and other matter of an infectious or contagious nature. The grounds within emergency housing sites shall be kept clean and free from accumulation of debris, filth, garbage and deleterious matter. Emergency housing and emergency housing facilities shall not be occupied if a substandard condition exists, as determined by the enforcing agency.
O109.1.1 Fire hazards. Dangerous materials or materials that create a fire hazard, as determined by the enforcing agency, shall not be allowed on the grounds within emergency housing sites.
O109.3 Identification. Emergency housing shall be designated by address numbers, letters, or other suitable means of identification. The identification shall be in a conspicuous location facing the street or driveway fronting the building or structure. Each identification character shall be not less than 4 inches (102 mm) in height and not less than 0.5 inch (12.7 mm) in width, installed/painted on a contrasting background.
SECTION O110
EMERGENCY HOUSING FACILITIES SANITATION REQUIREMENTS
O110.1 Drinking water. Potable drinking water shall be provided for all occupants of emergency housing.
O110.2 Kitchens and food facilities. Where provided, kitchens and food facilities, as defined in Section 113789 of the California Health and Safety Code, which support emergency housing sites, shall comply with applicable food safety provisions of Sections 113980 – 114094.5 of the California Health and Safety Code.
Where occupants of dependent units are permitted or required to cook for themselves, a separate area shall be equipped and maintained as a common use kitchen. Refrigerated storage shall be provided for safe storage of food.
Page 42 of 319

Supplemental Attachment 2
Page 31 of 69
O110.3 Toilet and bathing facilities. When dependent units are used as emergency housing, the emergency housing site shall be provided with one toilet and one bathing facility for every 15 occupants of each gender. The enforcing agency may permit different types and ratios of toilet and bathing facilities. The approval shall be based upon a finding that the type and ratio of toilet and bathing facilities are sufficient to process the anticipated volume of sewage and waste water, while maintaining sanitary conditions for the occupants of the emergency housing.
Bathing facilities shall be provided with heating equipment which shall be capable of maintaining a temperature of 70 degrees F (21.0 degrees Celsius) within such facilities.
Lavatories with running water shall be installed and maintained in the toilet facilities or adjacent to the toilet facilities.
O110.4 Garbage, waste and rubbish disposal. All garbage, kitchen waste and rubbish shall be deposited in approved covered receptacles, which shall be emptied when filled and the contents shall be disposed of in a sanitary manner acceptable to the enforcing agency.
SECTION O111
EMERGENCY HOUSING LIGHTING AND VENTILATION REQUIREMENTS
O111.1 Lighting. Buildings or structures used for emergency housing shall be provided with natural light by means of exterior glazed openings in accordance with Section 1204.2 of the California Building Code, or shall be provided with artificial light in accordance with Section 1204.3 of the California Building Code.
O111.2 Ventilation. Buildings or structures used for emergency housing shall be provided with natural ventilation in accordance with Section 1202.5 of the California Building Code, or mechanical ventilation in accordance with the California Mechanical Code.
SECTION O112
EMERGENCY HOUSING FIRE AND LIFE SAFETY REQUIREMENTS
O112.1 Location on property. Buildings or structures used for emergency housing, including sleeping cabins, shall be located in accordance with the requirements of Table 602 and Section 705 of the California Building Code, based on their type of construction and fire-resistance ratings of the exterior walls. During a shelter crisis, the fire separation distances are permitted to be measured to the existing buildings on the adjacent parcels rather than to the interior lot lines, provided the open spaces are to remain unobstructed for the duration of the shelter crisis.
O112.2 Buildings on same lot. Buildings or structures used for emergency housing,
Page 43 of 319

Supplemental Attachment 2
Page 32 of 69
including sleeping cabins, shall be separated from each other and from other buildings on the same lot as set forth in Section 705.3 of the California Building Code. The Building Official and Fire Marshal may accept reasonable alternatives to these requirements provided reasonably equivalent fire and life safety is achieved.
O112.3 Means of egress. Buildings or structures used for emergency housing shall be provided with means of egress complying with Chapter 10 of the California Building Code, unless modified elsewhere in this appendix.
O112.4 Emergency escape and rescue. Each area of a building or structure used for sleeping purposes in emergency housing shall be provided with an emergency escape and rescue opening in accordance with Section 1030 of the California Building Code, unless modified elsewhere in this appendix.
O112.5 Smoke alarms. Buildings or structures used for emergency housing, which provide sleeping accommodations, shall be equipped with single station battery powered smoke alarms installed in accordance with the location requirements of Section 907.2.11 of the California Fire Code, unless modified elsewhere in this appendix.
O112.6 Carbon monoxide alarms. Buildings or structures used for emergency housing, which provide sleeping accommodations, and equipped with fuel-burning appliances shall be provided with carbon monoxide detection in accordance with Section 915 of the California Fire Code, unless modified elsewhere in this appendix.
O112.7 Fire alarm. A manual fire alarm system capable of arousing sleeping occupants in accordance with Section 907.2.10.1 of the California Fire Code shall be installed in buildings, structures, or groups of buildings or structures used for emergency housing and having a gross floor area of more than 2,500 square feet or having more than 49 sleeping occupants.
Exception: Individual buildings or structures in a group of buildings or structures with sufficient separation distances to allow each building or structure to function independently in case of a fire, as approved by the Fire Marshal.
O112.8 Automatic sprinkler systems. Fire sprinklers shall be provided for new and existing buildings or structures used for emergency housing, including sleeping cabins, which provide sleeping facilities, as required by Section 903.3 of the California Fire Code. Strict compliance with the requirements of Section 903.3 may not be required when approved by the Fire Marshal. The Fire Marshal is authorized to accept reasonably equivalent alternatives to the installation provisions of Section 903.3 when dealing with buildings or structures used for emergency housing.
O112.9 Fire extinguishers. Portable fire extinguishers shall be provided in accordance with Section 906.1 of the California Fire Code.
Page 44 of 319

Supplemental Attachment 2
Page 33 of 69
O112.10 Flammable or combustible liquids. The possession or storage of any flammable or combustible liquids or gases shall not be permitted (intact cigarette lighters excepted). The use of any type of open flame indoors is prohibited unless conditionally approved by the Fire Chief.
O112.11 Storage in attics, under-floor and concealed spaces. Combustible materials, including but not limited to the possessions of occupants, users and staff shall not be stored in attics, under-floor spaces, or within other concealed spaces of buildings or structures used for emergency housing with sleeping accommodations.
O112.12 Fire department access. Fire Department access to building and premises used for emergency housing shall be in compliance with Section 503, Appendix D and Section 504 of the California Fire Code, as approved by the Fire Chief.
O112.13 Water supply. An approved fire protection water supply complying with Section 507 of the California Fire Code, or as approved by the Fire Chief, shall be provided for each structure, group of structures or premises used for emergency housing.
SECTION O113
ADDITIONAL REQUIREMENTS
O113.1 Operating procedures. Operating procedures including a security plan and service requirements shall be developed by the professional service provider and shown to be consistent with the shelter standards imposed by the Alameda County Social Services Agency. These procedures shall be designed to maintain order and safety within the buildings or structures used for emergency housing.
SECTION O114
ALTERNATIVES AND MODIFICATIONS
O114.1 Alternatives and modifications. Alternative compliance and/or modifications that are reasonably equivalent to the requirements in this appendix may be granted by the Local Administrative Authority in individual cases when dealing with buildings or structures used for emergency housing.
NOTE:Authority Cited: Health and Safety Code Sections 17040, 17050, 17920.9, 17921, 17921.5, 17921.6, 17921.10, 17922, 17922.6, 17922.12, 17922.14, 17927, 17928, 18300, 18552, 18554, 18620, 18630, 18640, 18670, 18690, 18691, 18865, 18871.3, 18871.4, 18873, 18873.1 through 18873.5, 18938.3, 18944.11, and 19990; and Government Code Section 12955.1.
Reference: Health and Safety Code Sections 17000 through 17062.5, 17910 through 17995.5, 18200 through 18700, 18860 through 18874, and 19960 through 19997; Civil Code Sections 1101.4 and 1101.5; and Government Code Sections 12955.1 and
Page 45 of 319
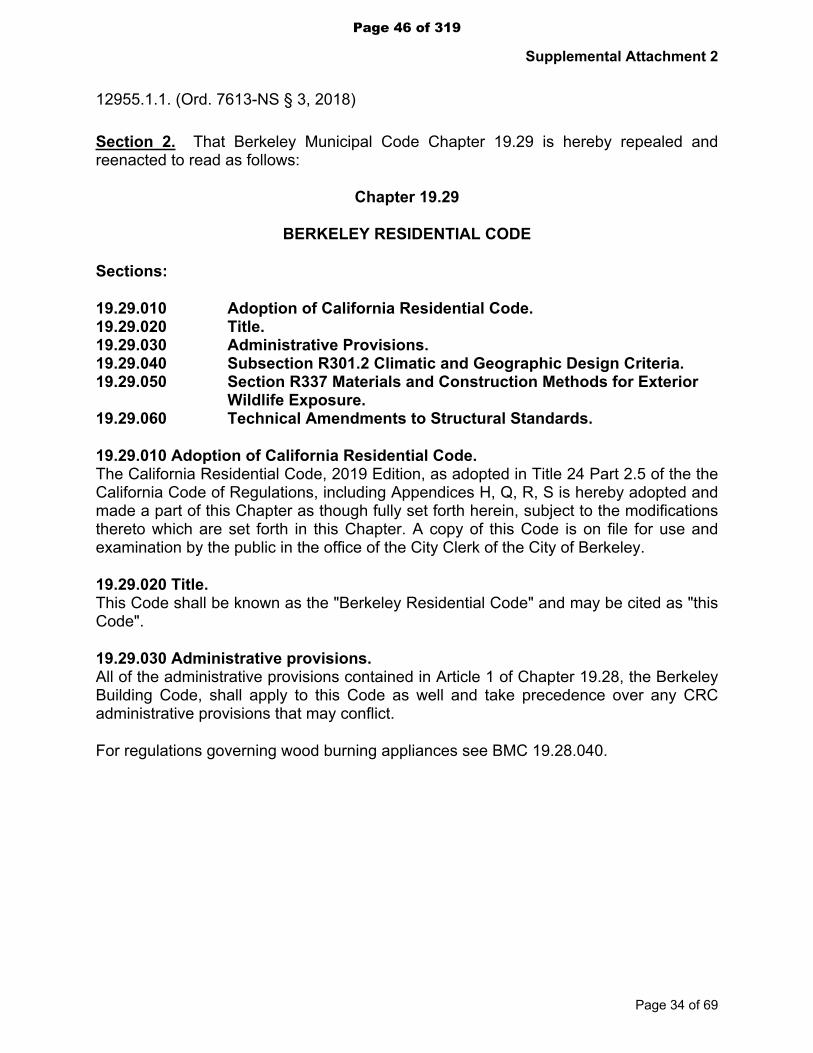
Supplemental Attachment 2
Page 34 of 69
12955.1.1. (Ord. 7613-NS § 3, 2018)
Section 2. That Berkeley Municipal Code Chapter 19.29 is hereby repealed and reenacted to read as follows:
Chapter 19.29
BERKELEY RESIDENTIAL CODE
Sections:
19.29.010 Adoption of California Residential Code.19.29.020 Title.19.29.030 Administrative Provisions.19.29.040 Subsection R301.2 Climatic and Geographic Design Criteria.19.29.050 Section R337 Materials and Construction Methods for Exterior
Wildlife Exposure.19.29.060 Technical Amendments to Structural Standards.
19.29.010 Adoption of California Residential Code.The California Residential Code, 2019 Edition, as adopted in Title 24 Part 2.5 of the the California Code of Regulations, including Appendices H, Q, R, S is hereby adopted and made a part of this Chapter as though fully set forth herein, subject to the modifications thereto which are set forth in this Chapter. A copy of this Code is on file for use and examination by the public in the office of the City Clerk of the City of Berkeley.
19.29.020 Title.This Code shall be known as the "Berkeley Residential Code" and may be cited as "this Code".
19.29.030 Administrative provisions.All of the administrative provisions contained in Article 1 of Chapter 19.28, the Berkeley Building Code, shall apply to this Code as well and take precedence over any CRC administrative provisions that may conflict.
For regulations governing wood burning appliances see BMC 19.28.040.
Page 46 of 319

Supplemental Attachment 2
Page 35 of 69
19.29.040 CRC Subsection R301.2 Climatic and geographic design criteria.
TABLE R301.2(1)CLIMATIC AND GEOGRAPHIC DESIGN CRITERIA
MANUAL J DESIGN CRITERIAn
Elevation Latitude Winterheating
Summercooling
Altitudecorrection
factor
Indoordesign
temperature
Designtemperature
cooling345 38 40 80 1.0 70 75
MANUAL J DESIGN CRITERIAn
Heatingtemperaturedifference
Coolingtemperaturedifference
Windvelocityheating
Windvelocitycooling
Coincidentwet bulb
Dailyrange
Winterhumidity
Summerhumidity
30 5 15MPH
7.5 MPH 63 16 55 55
For SI: 1 pound per square foot = 0.0479 kPa, 1 mile per hour = 0.447 m/s.a. Where weathering requires a higher strength concrete or grade of masonry than
necessary to satisfy the structural requirements of this Code, the frost line depth strength required for weathering shall govern. The weathering column shall be filled in with the weathering index, “negligible,” “moderate” or “severe” for concrete as determined from Figure R301.2.(4)]. The grade of masonry units shall be determined from ASTM C34, C55, C62, C73, C90, C129, C145, C216 or C652.
b. Where the frost line depth requires deeper footings than indicated in Figure R403.1(1), the frost line depth strength required for weathering shall govern. The jurisdiction shall fill in the frost line depth column with the minimum depth of footing below finish grade.
c. The jurisdiction shall fill in this part of the table to indicate the need for protection depending on whether there has been a history of local subterranean termite damage.
WIND DESIGN SUBJECT TO DAMAGE FROM
GROUND
SNOW LOADo
Speedd (mph)
Topographic
Effectsk
Special Wind
Regionl
Wind-borne Debri
s Zone
m
SEISMIC DESIGN
CATEGORYf Weatheringa
Frost line
depthb
Termitec
ZERO 85 NO NO NO D2 or E NEGLIGIBLE N/A VERY HEAVY
WINTERDESIGN TEMPe
ICE BARRIER UNDERLAYMENT
REQUIREDh
FLOOD HAZARDSg
AIR FREEZING
INDEXi
MEAN ANNUAL TEMPj
See Footnote ‘q’ NO SeeFootnote ‘p’ ZERO 57.2◦F
Page 47 of 319
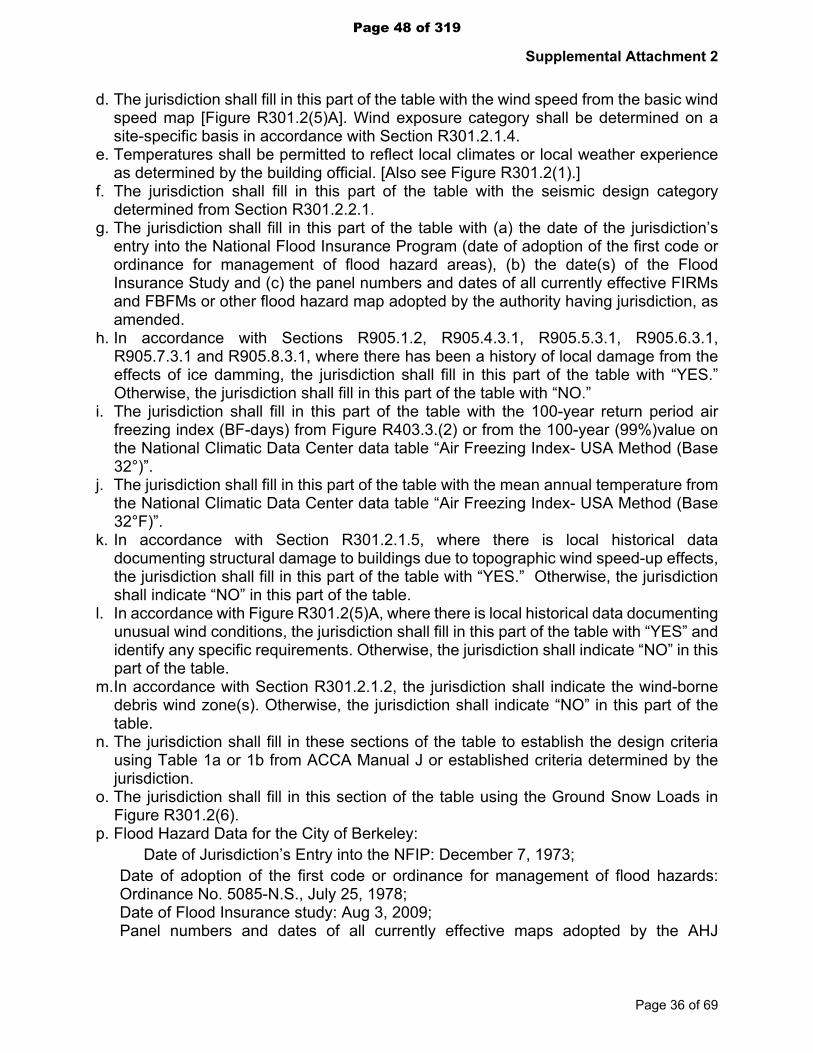
Supplemental Attachment 2
Page 36 of 69
d. The jurisdiction shall fill in this part of the table with the wind speed from the basic wind speed map [Figure R301.2(5)A]. Wind exposure category shall be determined on a site-specific basis in accordance with Section R301.2.1.4.
e. Temperatures shall be permitted to reflect local climates or local weather experience as determined by the building official. [Also see Figure R301.2(1).]
f. The jurisdiction shall fill in this part of the table with the seismic design category determined from Section R301.2.2.1.
g. The jurisdiction shall fill in this part of the table with (a) the date of the jurisdiction’s entry into the National Flood Insurance Program (date of adoption of the first code or ordinance for management of flood hazard areas), (b) the date(s) of the Flood Insurance Study and (c) the panel numbers and dates of all currently effective FIRMs and FBFMs or other flood hazard map adopted by the authority having jurisdiction, as amended.
h. In accordance with Sections R905.1.2, R905.4.3.1, R905.5.3.1, R905.6.3.1, R905.7.3.1 and R905.8.3.1, where there has been a history of local damage from the effects of ice damming, the jurisdiction shall fill in this part of the table with “YES.” Otherwise, the jurisdiction shall fill in this part of the table with “NO.”
i. The jurisdiction shall fill in this part of the table with the 100-year return period air freezing index (BF-days) from Figure R403.3.(2) or from the 100-year (99%)value on the National Climatic Data Center data table “Air Freezing Index- USA Method (Base 32°)”.
j. The jurisdiction shall fill in this part of the table with the mean annual temperature from the National Climatic Data Center data table “Air Freezing Index- USA Method (Base 32°F)”.
k. In accordance with Section R301.2.1.5, where there is local historical data documenting structural damage to buildings due to topographic wind speed-up effects, the jurisdiction shall fill in this part of the table with “YES.” Otherwise, the jurisdiction shall indicate “NO” in this part of the table.
l. In accordance with Figure R301.2(5)A, where there is local historical data documenting unusual wind conditions, the jurisdiction shall fill in this part of the table with “YES” and identify any specific requirements. Otherwise, the jurisdiction shall indicate “NO” in this part of the table.
m.In accordance with Section R301.2.1.2, the jurisdiction shall indicate the wind-borne debris wind zone(s). Otherwise, the jurisdiction shall indicate “NO” in this part of the table.
n. The jurisdiction shall fill in these sections of the table to establish the design criteria using Table 1a or 1b from ACCA Manual J or established criteria determined by the jurisdiction.
o. The jurisdiction shall fill in this section of the table using the Ground Snow Loads in Figure R301.2(6).
p. Flood Hazard Data for the City of Berkeley: Date of Jurisdiction’s Entry into the NFIP: December 7, 1973;
Date of adoption of the first code or ordinance for management of flood hazards: Ordinance No. 5085-N.S., July 25, 1978;Date of Flood Insurance study: Aug 3, 2009;Panel numbers and dates of all currently effective maps adopted by the AHJ
Page 48 of 319

Supplemental Attachment 2
Page 37 of 69
(Ordinance 7108-NS 9/29/09): FEMA’s “Use of Digital Flood Hazard Data” establishes that paper and digital
maps are equivalent. Policy and related information are available from FEMA. The policy implements section 107 of Public Law 108-264, 118 Stat. 724 (2004)
Panel 13 (not available in printed form) Panel 14 of 725, Map Number 06001C0014G, August 3, 2009 Panel 18 of 725, Map Number 06001C0018G, August 3, 2009 Panel 19 of 725, Map Number 06001C0019G, August 3, 2009 Panel 38 (not available in printed form) Panel 51 (not available in printed form) Panel 52 of 725, Map Number 06001C0052G, August 3, 2009 Panel 53 (not available in printed form) Panel 54 of 725, Map Number 06001C0054G, August 3, 2009 Panel 56 of 725, Map Number 06001C0056G, August 3, 2009 Panel 57 of 725, Map Number 06001C0057G, August 3, 2009 Panel 80 of 725, Map Number 06001C0080G, August 3, 2009
q. Heating Load Calculation Data for the City of Berkeley: 33 degrees F “Winter Median of Extremes" 37 degrees F “Design Drybulb (0.2%) 40 degrees F “Design Drybulb (0.6%)
19.29.050 CRC Section R337 Materials and Construction Methods for Exterior Wildlife Exposure.
Chapter 3 of the 2019 California Residential Code is adopted in its entirety subject to the modifications thereto which are set forth below.
R337.1 – SCOPE, PURPOSE AND APPLICATION
R337.1.1 Scope. This Chapter applies to building materials, systems and/or assemblies used in the exterior design and construction of new buildings and structures, additions, alterations, repairs and re-roofs located within a Wildland-Urban Interface Fire Area as defined in Section R337.2.
R337.1.2 Purpose. The purpose of this Chapter is to establish minimum standards for the protection of life and property by increasing the ability of a building located in any Fire Hazard Severity Zone within State Responsibility Areas or any building or structure in the Wildland-Urban Interface Fire Area to resist the intrusion of flame or burning embers projected by a vegetation fire and contributes to a systematic reduction in conflagration losses.
R337.1.3 Application. New buildings located in any Fire Hazard Severity Zone or new buildings and structures, additions, alterations, repairs and re-roofs located in any Wildland-Urban Interface Fire Area designated by the enforcing agency constructed after the application date shall comply with the provisions of this Chapter.
Page 49 of 319

Supplemental Attachment 2
Page 38 of 69
Exceptions: 1. Buildings or structures of an accessory character classified as a Group U
occupancy and not exceeding 120 square feet in floor area, when located at least 30 feet from an applicable building or property lines.
R337.1.3.1 Application date and where required. New buildings for which an application for a building permit is submitted on or after July 1, 2008 located in any Fire Hazard Severity Zone or buildings and structures, additions, alterations, repairs and re-roofs for which an application for a building permit is submitted on or after July 1, 2008 located in the Wildland Interface Fire Area shall comply with all sections of this chapter.
R337.2 – DEFINITIONS For the purposes of this Chapter, certain terms are defined below:
FIRE ZONE ONE shall encompass the entire City of Berkeley except for Fire Zones Two and Three.
FIRE ZONE TWO encompasses those areas designated as Combined Hillside District in the Official Zoning map of the City of Berkeley and those areas designated as Very High in the official Fire Hazard Severity Zones (FHSZ) map of The Department of Forestry and Fire Protection (CAL FIRE), as they may be amended from time to time. The following properties, not part of the Combined Hillside District, are included in Fire Zone Two under the Very High designation of the FHSZ map: the eastern section of the University of California, Berkeley main campus, block number 2042 (Alameda County Assessor’s parcel numbering (APN) system), to the east city line; all of the Clark-Kerr campus, block number 7690, to the east city line; all of block number 7680 in the City of Berkeley; portions of block number 1702 in the City of Berkeley. See Exhibit A for the specific parcels by APN and address.
FIRE ZONE 3 encompasses those areas designated as Environmental Safety – Residential Districts on the Official Zoning Map of the City of Berkeley, as it may be amended from time to time.
LOCAL AGENCY VERY HIGH FIRE HAZARD SEVERITY ZONE means an area designated by a local agency upon the recommendation of the CDF Director pursuant to Government Code Sections 51177(c), 51178 and 51189 that is not a state responsibility area and where a local agency, city, county, city and county, or district is responsible for fire protection. Fire Zones 2 and 3 are designated as Local Agency High Fire Hazard Severity Zone.
WILDLAND-URBAN INTERFACE FIRE AREA is a geographical area identified by the state as a “Fire Hazard Severity Zone” in accordance with the Public Resources Code Sections 4201 through 4204 and Government Code Sections 51175 through 51189, or other areas designated by the enforcing agency to be at a significant risk from wildfires. Fire Zones 2 and 3 are designated as Wildland-Urban Interface Fire Area.
Page 50 of 319

Supplemental Attachment 2
Page 39 of 69
R337.5 – ROOFING
R337.5.1 General. Roofs shall be a Class A minimum and shall comply with the requirements of Sections R337 and R902. Roofs shall have a roofing assembly installed in accordance with its listing and the manufacturer's installation instructions. Wooden shakes and shingles are prohibited roof coverings regardless of the assembly rating of the roof system.
Exception: Replacement of less than 50% of the roof area within a 5 year period.
R337.5.5 Spark Arrestors. All chimneys of fireplaces, stoves, barbecues or heating appliances using solid fuel shall be provided with an approved spark arrestor whenever modification has been made to any of these appliances, or whenever a structure is re-roofed. The net free area of the spark arrestor shall be not less than four times the net free area of the outlet of the chimney. The spark arrestor shall have heat and corrosion resistance equivalent to twelve-gauge wire, nineteen gauge galvanized wire, or twenty-four-gauge stainless steel. Openings shall not permit the passage of spheres having a diameter larger than one-half inch and shall not block the passage of spheres having a diameter of less than three-eighths inch. The arrestor shall be securely attached to the chimney or stovepipe and shall be adequately supported. The use of bands, mollies, masonry anchors or mortar ties are recommended depending upon the individual need.
R337.7 – EXTERIOR COVERING
R337.7.3.3 Replacement of Exterior Wall Covering. Materials for replacement of existing exterior wall covering shall meet or exceed the standards set forth in this chapter.
Exception: Where less than 50% of any wall surface is being replaced or repaired, and the matching of the new plane to the existing plane on that wall is not possible.
R337.11 – UNDERGROUND UTILITY CONNECTIONS
R337.11.1 Underground utility connections. For new construction, provisions shall be made for the undergrounding of all utilities serving the property, including but not limited to electrical, telephone and cable television, by the installation of appropriately sized underground conduits extending from the street property.
R337.12 – ADDITONAL REQUIREMENTS IN FIRE ZONE THREE
R337.12.1 General. In addition to meeting the other requirements of this Chapter, buildings or structures hereinafter erected, constructed, moved, altered, added, or repaired within Fire Zone Three shall comply with the following requirements for buildings and structures.
R337.12.2 Fire Warning System. All residential units shall be equipped with a Fire Warning System as specified by the residential smoke detector requirements of the current edition of the California Building Code and with an audible exterior alarm. The exterior alarm must meet the requirements of NFPA 72 or equivalent and generate 45
Page 51 of 319
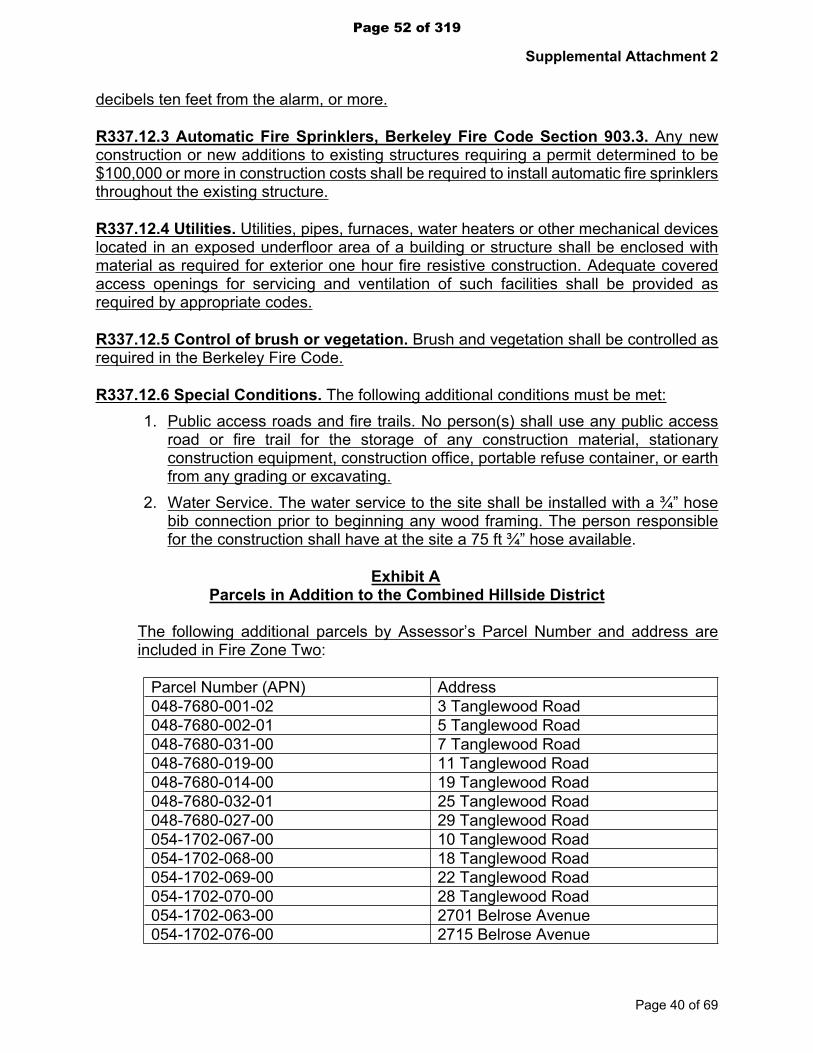
Supplemental Attachment 2
Page 40 of 69
decibels ten feet from the alarm, or more.
R337.12.3 Automatic Fire Sprinklers, Berkeley Fire Code Section 903.3. Any new construction or new additions to existing structures requiring a permit determined to be $100,000 or more in construction costs shall be required to install automatic fire sprinklers throughout the existing structure.
R337.12.4 Utilities. Utilities, pipes, furnaces, water heaters or other mechanical devices located in an exposed underfloor area of a building or structure shall be enclosed with material as required for exterior one hour fire resistive construction. Adequate covered access openings for servicing and ventilation of such facilities shall be provided as required by appropriate codes.
R337.12.5 Control of brush or vegetation. Brush and vegetation shall be controlled as required in the Berkeley Fire Code.
R337.12.6 Special Conditions. The following additional conditions must be met:1. Public access roads and fire trails. No person(s) shall use any public access
road or fire trail for the storage of any construction material, stationary construction equipment, construction office, portable refuse container, or earth from any grading or excavating.
2. Water Service. The water service to the site shall be installed with a ¾” hose bib connection prior to beginning any wood framing. The person responsible for the construction shall have at the site a 75 ft ¾” hose available.
Exhibit AParcels in Addition to the Combined Hillside District
The following additional parcels by Assessor’s Parcel Number and address are included in Fire Zone Two:
Parcel Number (APN) Address048-7680-001-02 3 Tanglewood Road048-7680-002-01 5 Tanglewood Road048-7680-031-00 7 Tanglewood Road048-7680-019-00 11 Tanglewood Road048-7680-014-00 19 Tanglewood Road048-7680-032-01 25 Tanglewood Road048-7680-027-00 29 Tanglewood Road054-1702-067-00 10 Tanglewood Road054-1702-068-00 18 Tanglewood Road054-1702-069-00 22 Tanglewood Road054-1702-070-00 28 Tanglewood Road054-1702-063-00 2701 Belrose Avenue054-1702-076-00 2715 Belrose Avenue
Page 52 of 319

Supplemental Attachment 2
Page 41 of 69
054-1702-075-00 2721 Belrose Avenue054-1702-074-00 2729 Belrose Avenue054-1702-073-00 2737 Belrose Avenue054-1702-112-00 2801 Claremont Boulevard054-1702-123-01 2811 Claremont Boulevard054-1702-122-00 2815 Claremont Boulevard054-1702-120-01 2821 Claremont Boulevard054-1702-114-01 2816 Claremont Avenue054-1702-115-00 2820 Claremont Avenue054-1702-072-00 3005 Garber Street054-1702-071-00 3015 Garber Street054-1702-113-00 3020 Garber Street054-1702-116-00 3017 Avalon Avenue
19.29.060 Technical Amendments to Structural Standards
Chapter 6 of the 2019 California Residential Code is adopted in its entirety subject to the modifications thereto which are set forth below.
Table R602.10.3(3) Bracing Requirements based on Seismic Design CategoryAdd a new footnote “g” to the end of CRC Table R602.10.3(3)g to read:
g. In Seismic Design Categories D0, D1, and D2, Method GB is not permitted and the use of Method PCP is limited to one-story dwellings and accessory structures.
Add a new Subsection R602.10.4.5, to read:R602.10.4.5 Limits on methods GB and PCP. In Seismic Design Categories D0, D1, and D2, Method GB is not permitted, but gypsum board is permitted to be placed on the opposite side of the studs from other types of braced wall panel sheathing. In Seismic Design Categories D0, D1, and D2, the use of Method PCP is limited to one-story dwellings and accessory structures.
Section 3. That Berkeley Municipal Code Chapter 19.30 is hereby repealed and reenacted to read as follows:
Chapter 19.30
BERKELEY ELECTRICAL CODE
Sections:
19.30.010 Adoption of California Electrical Code.19.30.020 Title.19.30.030 Administrative provisions.
19.30.010 Adoption of California Electrical Code.
Page 53 of 319

Supplemental Attachment 2
Page 42 of 69
The California Electrical Code, 2019 Edition, as adopted by the California Code of Regulations, Title 24, Part 3 is hereby adopted and made a part of this Chapter as though fully set forth herein subject to the modifications thereto which are set forth in this Chapter. A copy of this Code is on file for use and examination by the public in the office of the City Clerk of the City of Berkeley.
19.30.020 Title.This Code shall be known as the "Berkeley Electrical Code" and may be cited as "this Code".
19.30.030 Administrative provisions.All of the administrative provisions contained in Article 1 of Chapter 19.28, the Berkeley Building Code, shall apply to this Code as well and take precedence over any administrative provisions contained in Article 89 General Code Provisions that may conflict.
Section 4. That Berkeley Municipal Code Chapter 19.32 is hereby repealed and reenacted to read as follows:
Chapter 19.32
BERKELEY MECHANICAL CODE
Sections:
19.32.010 Adoption of the California Mechanical Code.19.32.020 Title.19.32.030 Administrative provisions.19.32.040 Amendments to the California Mechanical Code
19.32.010 Adoption of the California Mechanical Code.The California Mechanical Code, 2019 Edition, as adopted in Title 24 Part 4 of the California Code of Regulations, is hereby adopted and made a part of this Chapter as though fully set forth herein, subject to the modifications thereto which are set forth in this Chapter. A copy of this Code is on file for use and examination by the public in the office of the City Clerk of the City of Berkeley.
19.32.020 Title.This Code shall be known as the “Berkeley Mechanical Code” and may be cited as "this Code".
19.32.030 Administrative provisions.All of the administrative provisions contained in Article 1 of Chapter 19.28, the Berkeley Building Code, shall apply to this Code as well and take precedence over any CMC administrative provisions that may conflict.
Page 54 of 319

Supplemental Attachment 2
Page 43 of 69
19.32.040 Amendments to the California Mechanical Code
Chapter 4 of the 2019 California Mechanical Code is adopted in its entirety subject to the modifications thereto which are set forth below:
402.1.2 Ventilation in Dwelling Units. Requirements for ventilation air rate for single-family dwellings and residential dwelling units in multi-family buildings shall be in accordance with this chapter or section and ASHRAE 62.2. Each kitchen range shall be provided with a vented hood ducted to terminate outside the building, with a minimum air flow of 100 cfm and a maximum sound rating of 3 sones.
Exception: A vented range hood shall not be required in dwelling unit kitchens equipped with a local mechanical exhaust system installed in accordance with ASHRAE 62.2.
For regulations governing wood burning appliances, see BMC 19.28.040.
Section 5. That Berkeley Municipal Code Chapter 19.34 is hereby repealed and reenacted to read as follows:
Chapter 19.34
BERKELEY PLUMBING CODE
Sections:
19.34.010 Adoption of the California Plumbing Code.19.34.020 Title.19.34.030 Administrative provisions.19.34.040 Gas Shut-Off Valves
19.34.010 Adoption of the California Plumbing Code.The California Plumbing Code, 2019 Edition, as adopted in Title 24 Part 5 of the California Code of Regulations, including Appendices A, B and D, is hereby adopted and made a part of this Chapter as though fully set forth herein, subject to the modifications thereto which are set forth in this Chapter. A copy of this Code is on file for use and examination by the public in the office of the City Clerk of the City of Berkeley.
19.36.020 Title.This Code shall be known as the “Berkeley Plumbing Code” and may be cited as "this Code."
19.34.030 Administrative provisions.All of the administrative provisions contained in Article 1 of Chapter 19.28, the Berkeley Building Code, shall apply to this Code as well and take precedence over any CPC administrative provisions that may conflict.
Page 55 of 319

Supplemental Attachment 2
Page 44 of 69
19.34.040 Gas Shut-Off Valves
Chapter 12 of the 2019 California Plumbing Code is adopted in its entirety subject to the modifications thereto which are set forth below.
1209.2 General Requirements for Gas Shut-Off Valves. Automatic gas shut-off valves installed either in compliance with this Section or voluntarily pursuant to a plumbing permit issued on or after the effective date of this Section, shall comply with the following:
1209.2.1 All valves shall:
1. Comply with all applicable requirements of the Berkeley Plumbing Code.
2. Be tested and listed by recognized testing agencies such as the Independent Laboratory of the International Approval Services (IAS), Underwriter's Laboratory (UL), International Association of Plumbing and Mechanical Officials (IAPMO) or any other agency approved by the State of California Office of the State Architect (OSA).
3. Be listed to ANSI Z21.93/CSA6.30 Excess Flow Valves for Natural and LP Gas with Pressures up to 5 Psig.
4. Be installed on downstream side of the gas utility meter.
5. Be installed in accordance with the manufacturer's instructions.
6. Be installed in accordance with a plumbing permit issued by the City of Berkeley.
7. Provide a method for expedient and safe gas shut-off in an emergency.
8. Provide a capability for ease of consumer or owner resetting in a safe manner.
1209.2.2 Motion activated seismic gas shut-off valves shall be mounted rigidly to the exterior of the building or structure containing the fuel gas piping, unless otherwise specified in the manufacturer’s installation instructions.
1209.3 Definitions
For the purpose of this Section terms shall be defined as follows:
AUTOMATIC GAS SHUT- OFF VALVE shall mean either a motion activated gas shut-off valve or device or an excess flow gas shut-off valve or device.
DOWNSTREAM OF GAS UTILITY METER shall mean all gas piping on the property owner’s side of the gas meter and after the service tee.
Page 56 of 319
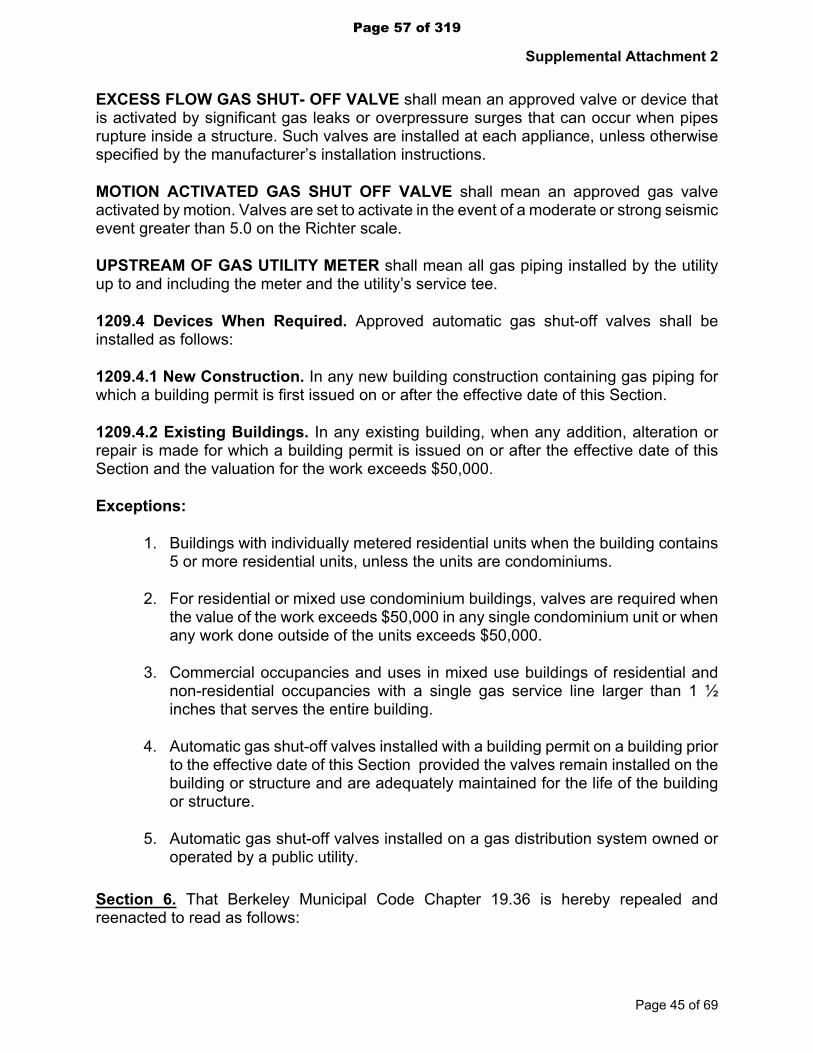
Supplemental Attachment 2
Page 45 of 69
EXCESS FLOW GAS SHUT- OFF VALVE shall mean an approved valve or device that is activated by significant gas leaks or overpressure surges that can occur when pipes rupture inside a structure. Such valves are installed at each appliance, unless otherwise specified by the manufacturer’s installation instructions.
MOTION ACTIVATED GAS SHUT OFF VALVE shall mean an approved gas valve activated by motion. Valves are set to activate in the event of a moderate or strong seismic event greater than 5.0 on the Richter scale.
UPSTREAM OF GAS UTILITY METER shall mean all gas piping installed by the utility up to and including the meter and the utility’s service tee.
1209.4 Devices When Required. Approved automatic gas shut-off valves shall be installed as follows:
1209.4.1 New Construction. In any new building construction containing gas piping for which a building permit is first issued on or after the effective date of this Section.
1209.4.2 Existing Buildings. In any existing building, when any addition, alteration or repair is made for which a building permit is issued on or after the effective date of this Section and the valuation for the work exceeds $50,000.
Exceptions:
1. Buildings with individually metered residential units when the building contains 5 or more residential units, unless the units are condominiums.
2. For residential or mixed use condominium buildings, valves are required when the value of the work exceeds $50,000 in any single condominium unit or when any work done outside of the units exceeds $50,000.
3. Commercial occupancies and uses in mixed use buildings of residential and non-residential occupancies with a single gas service line larger than 1 ½ inches that serves the entire building.
4. Automatic gas shut-off valves installed with a building permit on a building prior to the effective date of this Section provided the valves remain installed on the building or structure and are adequately maintained for the life of the building or structure.
5. Automatic gas shut-off valves installed on a gas distribution system owned or operated by a public utility.
Section 6. That Berkeley Municipal Code Chapter 19.36 is hereby repealed and reenacted to read as follows:
Page 57 of 319

Supplemental Attachment 2
Page 46 of 69
Chapter 19.36
BERKELEY ENERGY CODE
Sections:
19.36.010 Adoption of the California Energy Code.19.36.020 Title.19.36.030 Administrative provisions.19.36.040 Amendments to the California Energy Code.19.36.050 CEQA
19.36.010 Adoption of the California Energy Code.The California Energy Code, 2019 Edition, as adopted in Title 24 Part 6 of the California Code of Regulations, is hereby adopted and made a part of this Chapter as though fully set forth herein, subject to the modifications thereto which are set forth in this Chapter. A copy of this Code is on file for use and examination by the public in the office of the City Clerk of the City of Berkeley.
19.36.020 Title.This Code shall be known as the “Berkeley Energy Code” and may be cited as "this Code”.
19.36.030 Administrative provisions.All of the administrative provisions contained in Article 1 of Chapter 19.28, the Berkeley Building Code, shall apply to this Code as well and take precedence over any California Energy Code administrative provisions that may conflict.
For regulations governing wood burning appliances see BMC 19.28.040.
19.36.040 Amendments to the California Energy Code.
SUBCHAPTER 1: ALL OCCUPANCIES – GENERAL PROVISIONS of the 2019 California Energy Code is adopted in its entirety subject to the modifications thereto which are set forth below:
Modify SECTION 100.1(b) to add the following definitions:
ALL-ELECTRIC BUILDING is a building that has no natural gas or propane plumbing installed within the building, and that uses electricity as the source of energy for its space heating, water heating, cooking, and clothes drying appliances.
CERTIFIED ENERGY ANALYST is a person registered as a Certified Energy Analyst with the California Association of Building Energy Consultants as of the date of submission of a Certificate of Compliance as required under Section 10-103.
MIXED-FUEL BUILDING is a building that is plumbed for the use of natural gas or
Page 58 of 319

Supplemental Attachment 2
Page 47 of 69
propane as fuel for space heating, water heating (including pools and spas), cooking or clothes drying appliances.
NATURAL GAS shall have the same meaning as “Fuel Gas” as defined in the California Plumbing Code and Mechanical Code.
NEWLY CONSTRUCTED BUILDING is a building that has never before been used or occupied for any purpose and does not include additions, alterations, or repairs.
REACH CODE is a cost-effective locally adopted energy standard that requires buildings to be designed to consume no more energy than permitted by the California Energy Code.
Add a new SECTION 100.3 to read as follows:
SECTION 100.3 REACH CODE (a) Buildings Covered. In addition to all requirements of the California Energy Code,
newly constructed buildings shall comply with the following requirements of the Reach Code:1. New nonresidential, high-rise residential, and hotel/motel buildings that are
designed to utilize mixed-fuel (natural gas or propane in addition to electricity) shall be required to install solar panels on the Solar Zone, as defined in Section 110.10. With the exception of laboratory, industrial, and manufacturing uses or occupancies, the new nonresidential, high-rise residential, and hotel/motel buildings shall also comply with either the prescriptive requirements of Section 140.2, as amended herein, or have a compliance margin, as defined in Section 140.1, that meets or exceeds the Standard Design Building by 10%.
2. New low-rise residential buildings that are designed to utilize mixed-fuel (natural gas or propane in addition to electricity) shall be required to either comply with the prescriptive requirements of Section 150.1(c), as amended herein, or meet a Total Energy Design Rating (EDR) margin, as defined by the California Energy Code, of 10. The performance requirements may be reduced, but not below the requirements for the Standard Design Building, if sufficient solar access is not available.
3. If a Certified Energy Analyst prepares the Certificate of Compliance, the design shall be credited with one (1) EDR point or one (1) percent of compliance margin, to the extent that the resultant energy budget is no greater than the energy budget for the Standard Building Design.
4. New nonresidential, high-rise residential, and hotel/motel Mixed-Fuel Buildings shall have electrical systems and designs that support a future retrofit to facilitate the installation of all-electric appliances for all gas appliance plumbing connections. This includes electrical conductors or raceways, bus bar capacity, and space for circuit breakers.
Page 59 of 319

Supplemental Attachment 2
Page 48 of 69
5. New low-rise residential Mixed-Fuel Buildings shall have electrical systems and designs that support a future retrofit to facilitate the installation of all-electric appliances for all gas appliance plumbing connections. This includes electrical conductors or raceways, bus bar capacity, and space for circuit breakers, and for equipment serving individual units only, service panel capacity and pre-wired and installed circuit breakers.
SUBCHAPTER 5: NONRESIDENTIAL, HIGH-RISE RESIDENTIAL AND HOTEL/MOTEL OCCUPANCIES – PERFORMANCE AND PRESCRIPTIVE COMPLIANCE APPROACHES FOR ACHIEVING ENERGY EFFICIENCY of the 2019 California Energy Code is adopted in its entirety subject to the modifications thereto which are set forth below:
SECTION 140.0(b) is modified to read as follows:
(b) The requirements of Sections 120.0 through 130.5 (mandatory measures for nonresidential, high-rise residential and hotel/motel buildings) including the following additional mandatory measures:1. Photovoltaic Requirement. The solar zone, as specified in Section 110.10,
shall have a solar PV system installed, subject to the exceptions in Section 110.10.
2. Electric Readiness: Circuit Capacity. A Mixed-Fuel Building shall have conductors or raceway installed with termination points at the main electrical panel (via subpanels panels, if applicable) and at a location no more than 3 feet from each gas outlet or a designated location of a future electric replacement appliance. The conductors or raceway and any intervening subpanels shall be sized to meet the future electric power requirements as specified below at the service voltage. The capacity requirements may be adjusted for demand factors in accordance with the California Electric Code Article 220. Gas flow rates shall be determined in accordance with the California Plumbing Code Section 1208.4.A. Domestic Hot Water:
i. 24 amps at 240 volts per dwelling unit; orii. The electrical power required to provide equivalent functionality of the gas
powered equipment as calculated and documented by a licensed design professional associated with the project.
B. Space Heating:i. 24 amps at 240 volts per dwelling unit; or ii. The electrical power required to provide equivalent functionality of the gas
powered equipment as calculated and documented by a licensed design professional associated with the project. Exception to Section 140.0(b)2B: If permanent space cooling equipment is installed for all of the affected dwelling units, the conductors or raceway serving the cooling equipment may be increased in size to accommodate
Page 60 of 319

Supplemental Attachment 2
Page 49 of 69
the future electric space heating equipment.C. Clothes Dryer:
i. 24 amps at 240 volts per domestic dryer; orii. The electrical power required to provide equivalent functionality of the gas
powered equipment as calculated and documented by a licensed design professional associated with the project.
D. Cooking Equipment in Residential Space:i. Range or cooktop: 32 amps at 240 volts per appliance.ii. Stand-alone oven: 16 amps at 240 volts per appliance.
E. Pools and Spas: i. The electrical power required to provide equivalent functionality of the gas
powered equipment as calculated and documented by a licensed design professional associated with the project.
3. Electric Readiness: Service Capacity.A. A Mixed-Fuel Building shall have space for additional overcurrent protective
devices as well as bus bars of adequate capacity in the main electrical panel and any subpanels to meet all of the building’s potential future electrical requirements as specified in Section 140.0(b)2.
B. All newly installed raceways in a Mixed-Fuel Building between the main electric panel and any subpanels, and the point at which the conductors serving the building connect to the common conductors of the utility distribution system, shall be sized for conductors adequate to serve all of the building’s potential future electric loads as specified in Section 140.0(b)2.
C. The capacity requirements may be adjusted for demand factors in accordance with the California Electric Code, Title 24, Part 3, Section 220.
4. Electric Readiness: Other requirements. A Mixed-Fuel Building shall include the following components for equipment that serve individual residential units:A. Water Heating
i. The conductors or raceway shall terminate in an area that meets all of the requirements below:
ii. Is at least 3 feet by 3 feet by 7 feet high; and iii. If a condensate line is not attached to the water heater, a condensate line
for future use shall be provided that is no less than ¾ inch in diameter, compliant with California Plumbing Code Section 814, is no more than 2 inches higher than the base of the installed water heater, and located within 12 inches of the water heater.
B. Space Heating.
Page 61 of 319

Supplemental Attachment 2
Page 50 of 69
i. The conductors or raceway shall terminate in an area that has a condensate drain that is no less than ¾ inch in diameter, compliant with California Plumbing Code Section 814, is no more than two inches higher than the base of the installed heating equipment, and located within 12 inches of the designated location of the heating equipment.
Exception 1 to Sections 140.0(b)2, 3 and 4. If the design includes bus bar capacity, raceway or conductor capacity necessary for the installation of electrical equipment that can serve the intended function of the gas equipment.
Exception 2 to Sections 140.0(b)2, 3 and 4. Facilities where natural gas is necessary to meet the requirements of other permitting agencies or is demonstrated to be necessary for the purpose of protecting public health, safety and welfare.
NOTE: The requirements of Sections 140.0(b)2, 3 and 4 are not intended to trigger additional transformer capacity from the public utility at the time of construction.
SECTION 140.1 is modified to read as follows:
SECTION 140.1 – PERFORMANCE APPROACH: ENERGY BUDGETS A building newly constructed All-Electric Building or a newly constructed Mixed-Fuel Building occupied for laboratory, industrial, or manufacturing uses complies with the performance approach if the energy budget calculated for the Proposed Design Building under Subsection (b) is no greater than the energy budget calculated for the Standard Design Building under Subsection (a).
A newly constructed Mixed-Fuel Building occupied for other than laboratory, industrial, or manufacturing uses, complies with the performance approach if the energy budget calculated for the Proposed Design Building under Subsection (b) has a compliance margin, relative to the energy budget calculated for the Standard Design Building under Subsection (a), of at least 10%.
(a) Energy Budget for the Standard Design Building. The energy budget for the Standard Design Building is determined by applying the mandatory and prescriptive requirements to the proposed design building. The energy budget is the sum of the TDV energy for space-conditioning, indoor lighting, mechanical ventilation, service water heating, and covered process loads.
(b) Energy Budget for the Proposed Design Building. The energy budget for a Proposed Design Building is determined by calculating the TDV energy for the Proposed Design Building. The energy budget is the sum of the TDV energy for space-conditioning, indoor lighting, mechanical ventilation and service water heating and covered process loads.
(c) Calculation of Energy Budget. The TDV energy for both the Standard Design Building and the Proposed Design Building shall be computed by Compliance Software certified for this use by the Commission. The processes for Compliance
Page 62 of 319

Supplemental Attachment 2
Page 51 of 69
Software approval by the Commission are documented in the ACM Approval Manual.
Exception to Section 140.1: For newly constructed buildings, if the Certificate of Compliance is prepared and signed by a Certified Energy Analyst and the energy budget for the Proposed Design is no greater than the Standard Design Building, the required compliance margin is reduced by 1%.
SECTION 140.2 is modified to read as follows:
SECTION 140.2 – PRESCRIPTIVE APPROACHTo comply using the prescriptive approach, a building shall be designed with and shall have constructed and installed systems and components meeting the applicable requirements of Sections 140.3 through 140.9 and additionally the following measures as applicable intended to exceed the remaining prescriptive requirements:
(a) Mixed-Fuel Buildings of Hotel, Motels or High-Rise Multifamily Occupancies1. Install fenestration with a solar heat gain coefficient no less than 0.45 in both
common spaces and guest rooms.2. Design Variable Air Volume (VAV) box minimum airflows to be equal to the zone
ventilation minimums. 3. Include economizers and staged fan control in air handlers with a mechanical
cooling capacity ≥ 33,000 Btu/h. 4. Reduce the lighting power density (Watts/ft2) by ten percent (10%) from that
required from Table 140.6-C. 5. In common areas, improve lighting without claiming any Power Adjustment
Factor credits: A. Control to daylight dimming plus off per Section 140.6(a)2.H; and B. Perform Institutional Tuning per Section 140.6(a)2.J
6. Install one drain water heat recovery device per every three guest rooms that is field verified as specified in the Reference Appendix RA3.6.9.
(b) All Other Nonresidential Mixed-Fuel Buildings 1. Install fenestration with a solar heat gain coefficient no greater than 0.22.2. Limit the fenestration area on east-facing and west-facing walls to one-half of the
average amount of north-facing and south-facing fenestration.3. Design Variable Air Volume (VAV) box minimum airflows to be equal to the zone
ventilation minimums where VAV systems are installed.4. Include economizers and staged fan control in air handlers with a mechanical
cooling capacity ≥ 33,000 Btu/h.5. Reduce the lighting power density (Watts/ft2) by ten percent (10%) from that
required from Table 140.6-C.
Page 63 of 319

Supplemental Attachment 2
Page 52 of 69
6. Improve lighting without claiming any Power Adjustment Factor credits:A. Perform Institutional Tuning per Section 140.6(a)2.J, and B. In office spaces, control to daylight dimming plus off per Section 140.6(a)2.H,
and C. Install Occupant Sensing Controls in Large Open Plan Offices per Section
140.6(a)2.I.
Exception to Section 140.2(b). Newly constructed Mixed-Fuel Buildings occupied for laboratory, industrial, or manufacturing uses.
SUBCHAPTER 7: LOW-RISE RESIDENTIAL BUILDINGS – MANDATORY FEATURES AND DEVICES of the 2019 California Energy Code is adopted in its entirety subject to the modifications thereto which are set forth below:
SECTION 150.0 is modified to read as follows:
SECTION 150.0 – MANDATORY FEATURES AND DEVICESLow-rise residential buildings shall comply with the applicable requirements of Sections 150(a) through 150.0(r)(u).
NOTE: The requirements of Sections 150.0(a) through 150.0(r)(u) apply to newly constructed buildings. Sections 150.2(a) and 150.2(b) specify which requirements of Sections 150.0(a) through 150.0(r) also apply to additions or alterations.
SECTION 150.0(h) is modified to add a new subsection (5) to read as follows:
5. Electric Readiness. Systems using gas or propane space heating equipment shall include the following components: A. For equipment serving individual dwelling units, a dedicated 240 volt, 30 amp
or greater electrical circuit shall be provided for a future electric heater. In addition, all of the following shall be required:i. The circuit shall terminate within 3 feet from the designated future location
of an electric heater with no obstructions into a listed cabinet, box or enclosure labelled “For Future Electric Space Heater”; and
ii. The circuit shall be served by a dedicated double pole circuit breaker in the electrical panel labeled with the words “For Future Electric Space Heater”.
iii. If a condensate line is not attached to the heating equipment, a condensate line for future use shall be provided that is no less than ¾ inch in diameter, compliant with California Plumbing Code Section 814, is no more than two inches higher than the base of the installed heating equipment, and located within 12 inches of the designated location of the heating equipment.
Page 64 of 319
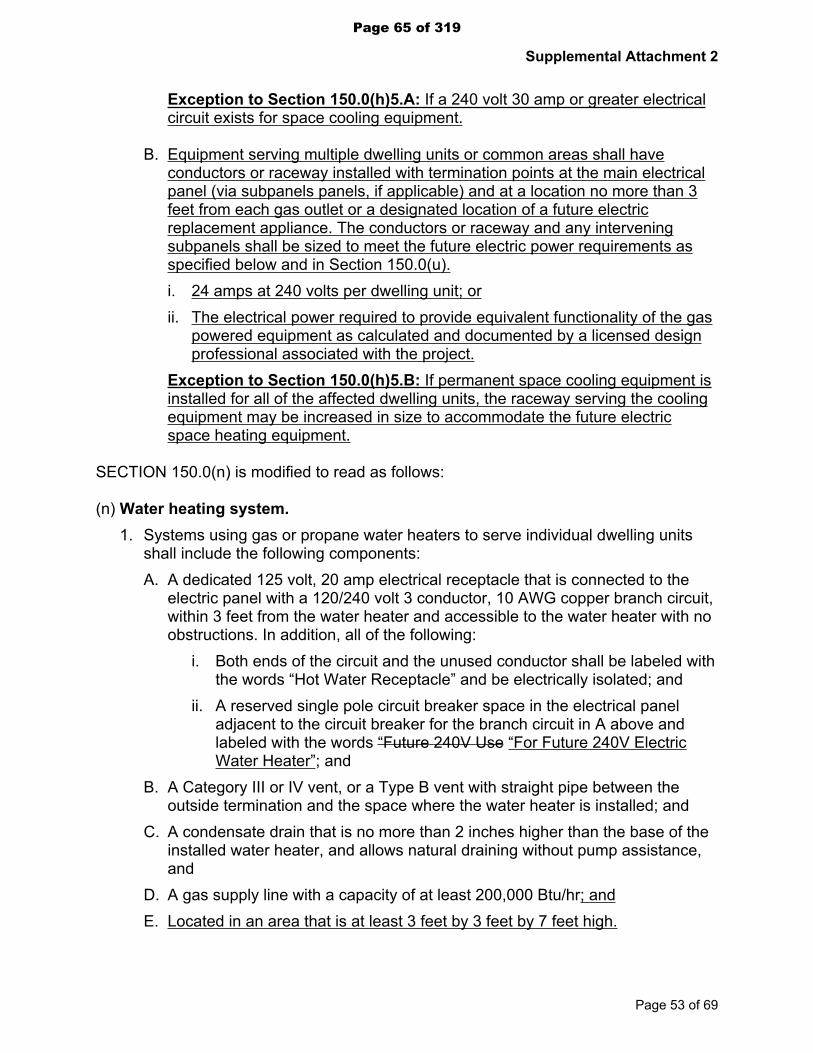
Supplemental Attachment 2
Page 53 of 69
Exception to Section 150.0(h)5.A: If a 240 volt 30 amp or greater electrical circuit exists for space cooling equipment.
B. Equipment serving multiple dwelling units or common areas shall have conductors or raceway installed with termination points at the main electrical panel (via subpanels panels, if applicable) and at a location no more than 3 feet from each gas outlet or a designated location of a future electric replacement appliance. The conductors or raceway and any intervening subpanels shall be sized to meet the future electric power requirements as specified below and in Section 150.0(u). i. 24 amps at 240 volts per dwelling unit; orii. The electrical power required to provide equivalent functionality of the gas
powered equipment as calculated and documented by a licensed design professional associated with the project.
Exception to Section 150.0(h)5.B: If permanent space cooling equipment is installed for all of the affected dwelling units, the raceway serving the cooling equipment may be increased in size to accommodate the future electric space heating equipment.
SECTION 150.0(n) is modified to read as follows:
(n) Water heating system. 1. Systems using gas or propane water heaters to serve individual dwelling units
shall include the following components: A. A dedicated 125 volt, 20 amp electrical receptacle that is connected to the
electric panel with a 120/240 volt 3 conductor, 10 AWG copper branch circuit, within 3 feet from the water heater and accessible to the water heater with no obstructions. In addition, all of the following:
i. Both ends of the circuit and the unused conductor shall be labeled with the words “Hot Water Receptacle” and be electrically isolated; and
ii. A reserved single pole circuit breaker space in the electrical panel adjacent to the circuit breaker for the branch circuit in A above and labeled with the words “Future 240V Use “For Future 240V Electric Water Heater”; and
B. A Category III or IV vent, or a Type B vent with straight pipe between the outside termination and the space where the water heater is installed; and
C. A condensate drain that is no more than 2 inches higher than the base of the installed water heater, and allows natural draining without pump assistance, and
D. A gas supply line with a capacity of at least 200,000 Btu/hr; and E. Located in an area that is at least 3 feet by 3 feet by 7 feet high.
Page 65 of 319

Supplemental Attachment 2
Page 54 of 69
2. Water heating recirculation loops serving multiple dwelling units shall meet the requirements of Section 110.3(c)5.
3. Solar water-heating systems and collectors shall be certified and rated by the Solar Rating and Certification Corporation (SRCC), the International Association of Plumbing and Mechanical Officials, Research and Testing (IAPMO R&T), or by a listing agency that is approved by the executive director.
4. Instantaneous water heaters with an input rating greater than 6.8 kBTU/hr (2kW) shall meet the requirements of Section 110.3(c)7.
5. Water heating equipment serving multiple dwelling units or common areas shall have: A. If a condensate line is not attached to the water heater, a condensate line for
future use shall be provided that is no less than ¾ inch in diameter, compliant with California Plumbing Code Section 814, is no more than two inches higher than the base of the installed water heater, and located within 12 inches of the water heater; and
B. Conductors or raceway installed with termination points at the main electrical panel (via subpanels panels, if applicable) and into a listed cabinet, box or enclosure at a location no more than 3 feet from each gas outlet or a designated location of a future electric replacement appliance labelled “For future water heater.” The conductors or raceway and any intervening subpanels shall be sized to meet the future electric power requirements as specified below and in Section 150.0(u). i. 24 amps at 240 volts per dwelling unit orii. The electrical power required to provide equivalent functionality of the gas
powered equipment as calculated and documented by a licensed design professional associated with the project.
SECTION 150.0 is modified to add new subsections (s, t, and u) to read as follows:
(s) Other Gas Equipment. Buildings plumbed for all other natural gas or propane equipment shall include the following components for each gas terminal or stub out: 1. Clothes Drying.
A. Equipment serving individual dwelling units shall have a dedicated 240-volt, 30 amp or greater electrical receptacle within 3 feet of the appliance and accessible with no obstructions. In addition, all of the following:i. The receptacle shall be labeled with the words “For Future Electric
Clothes Dryer”; and ii. A double pole circuit breaker in the electrical panel labeled with the words
“For Future Electric Clothes Dryer”. B. Equipment serving multiple dwelling units or common areas shall have
conductors or raceway installed with termination points at the main electrical
Page 66 of 319

Supplemental Attachment 2
Page 55 of 69
panel (via subpanels panels, if applicable) and at a location no more than 3 feet from each gas outlet or a designated location of a future electric replacement appliance. The conductors or raceway and any intervening subpanels shall be sized to meet the future electric power requirements as specified below and in Section 150.0(u). i. 24 amps at 240 volts per dwelling unit or ii. The electrical power required to provide equivalent functionality of the gas
powered equipment as calculated and documented by a licensed design professional associated with the project.
2. Combined Cooktop and Oven or Stand Alone CooktopA. A dedicated 240-volt, 40 amp or greater circuit and 50 amp or greater
electrical receptacle located within 3 feet of the appliance and accessible with no obstructions. In addition, all of the following: i. The electrical receptacle shall be labeled with the words “For Future
Electric Range” and be electrically isolated; and ii. A double pole circuit breaker in the electrical panel labeled with the words
“For Future Electric Range”. 3. Stand Alone Cooking Oven
A. A dedicated 240-volt, 20 amp or greater receptacle within 3 feet of the appliance and accessible with no obstructions. In addition, all of the following: i. The electrical receptacle shall be labeled with the words “For Future
Electric Oven” and be electrically isolated; and ii. A double pole circuit breaker in the electrical panel labeled with the words
“For Future Electric Oven”. 4. Pools and Spas
A. Gas or propane equipment pools or spas shall have conductors or raceway installed with termination points at the main electrical panel (via subpanels panels, if applicable) and at a location no more than 3 feet from each gas outlet or a designated location of a future electric replacement appliance. The conductors or raceway and any intervening subpanels shall be sized to meet the future electric power requirements as specified below and in Section 150.0(u). i. The electrical power required to provide equivalent functionality of the gas
powered equipment as calculated and documented by a licensed design professional associated with the project.
(t) Service Capacity1. All newly installed electrical panels and subpanels serving loads in a Mixed-Fuel
Building shall have space for additional overcurrent protective devices and
Page 67 of 319

Supplemental Attachment 2
Page 56 of 69
adequate bus bar capacity to meet all of the building’s potential future electrical requirements as specified in Sections 150.0(h), (n) and (s).
2. All newly installed raceways in a Mixed-Fuel Building between the utility service point and the main electric panel and any subpanels shall be adequately sized for conductors to serve all of the building’s potential future electrical requirements as specified in Sections 150.0(h), (n) and (s).
3. The service capacity requirements of this section shall be determined in accordance with Section 150.0(u).
(u) Conductor, Raceway and Subpanel Sizing. 1. The capacity requirements may be adjusted for demand factors in accordance
with the California Electric Code, Title 24, Part 3, Section 220.2. Raceway and subpanel capacity shall be sized to be large enough to meet the
requirements at the service voltage.
Exception to Sections 150.0(h)5, 150.0 (n)1.A.iii, 150.0 (n)1.E, 150.0 (n)5 and 150.0(s), 150.0(t) and 150.0(u): If the design includes the bus bar capacity raceway or conductor capacity necessary for the installation of electrical equipment that can serve the intended function of the gas equipment.
SUBCHAPTER 8: LOW-RISE RESIDENTIAL BUILDINGS – PERFORMANCE AND PRESCRIPTIVE COMPLIANCE APPROACHES of the 2019 California Energy Code is adopted in its entirety subject to the modifications thereto which are set forth below:
SECTION 150.1(b) is modified to read as follows:
(b) Performance Standards. A building complies with the performance standards if the energy consumption for the Proposed Design Building is no greater than the energy budget calculated for the Standard Design Building using Commission-certified compliance software as specified by the Alternative Calculation Methods Approval Manual. Newly Constructed Mixed-Fuel Buildings must additionally reach an EDR margin above the Standard Design in order to comply with performance standards.1. Newly Constructed Buildings. The Energy Budget for newly constructed
buildings is expressed in terms of the Energy Design Rating, which is based on TDV energy. The Energy Design Rating (EDR) has two components, the Energy Efficiency Design Rating, and the Solar Electric Generation and Demand Flexibility Design Rating. The Solar Electric Generation and Demand Flexibility Design Rating shall be subtracted from the Energy Efficiency Design Rating to determine the Total Energy Design Rating. The Proposed Building shall separately comply with the Energy Efficiency Design Rating and the Total Energy Design Rating. A. An All-Electric Building complies with the performance standards if both the
Total Energy Design Rating and the Energy Efficiency Design Rating for the
Page 68 of 319

Supplemental Attachment 2
Page 57 of 69
Proposed Building are no greater than the corresponding Energy Design Ratings for the Standard Design Building.
B. A Mixed-Fuel Building complies with the performance standards if: i. The Energy Efficiency Design Rating of the Proposed Building is no
greater than the Energy Efficiency Design Rating for the Standard Design Building; and
ii. The Total Energy Design Rating for the Proposed Building is at least 10 points less than the Total Energy Design Rating for the Standard Design Building. Exception 1 to Section 150.1(b)1.B.ii: If the Certificate of Compliance is prepared and signed by a Certified Energy Analyst and the Total Energy Design Rating of the Proposed Design is no greater than the Standard Design Building, the Total Energy Rating of the Proposed Building complies with this section if it is at least 9 points less than the Total Energy Design Rating for the Standard Design Building. Exception 2 to Section 150.1(b)1.B.ii: Buildings with limited solar access are exempt if all of the following are met: a. The Total Energy Design Rating for the Proposed Building is no
greater than the Standard Design Building; and b. A photovoltaic (PV) system meeting the minimum qualification
requirements as specified in Joint Appendix JA11 is installed on all available areas with 80 contiguous square feet or more of effective annual solar access. Effective annual solar access shall be 70 percent or greater of the output of an unshaded PV array on an annual basis, wherein shade is due to existing permanent natural or manmade barriers external to the dwelling, including but not limited to trees, hills, and adjacent structures; and
c. The Energy Efficiency Energy Design Rating for the Proposed Building is no greater than the respective value for the Standard Design Building by the EDR margin in Table 150.1(b)1 below. Table 150.1(b)1: Energy Efficiency EDR Margins
Building Type Energy Efficiency EDR Margin
Single Family 2Multifamily 0
Exception to Section 150.1(b)1: A community shared solar electric generation system, or other renewable electric generation system, and/or community shared battery storage system, which provides dedicated power, utility energy reduction credits, or payments for energy bill reductions, to the permitted building and is
Page 69 of 319

Supplemental Attachment 2
Page 58 of 69
approved by the Energy Commission as specified in Title 24, Part 1, Section 10-115, may offset part or all of the solar electric generation system Energy Design Rating required to comply with the Standards, as calculated according to methods established by the Commission in the Residential ACM Reference Manual.
SECTION 150.1(c) is modified to read as follows:
c. Prescriptive standards/component packages. Buildings that comply with the prescriptive standards shall be designed, constructed, and equipped to meet all of the requirements for the appropriate Climate Zone shown in TABLE 150.1-A or B as well as all of the requirements of Sections 150.1(c)15 and 16, whichever are more stringent. In TABLE 150.1-A and TABLE 150.1-B, a NA (not allowed) means that feature is not permitted in a particular Climate Zone and a NR (no requirement) means that there is no prescriptive requirement for that feature in a particular Climate Zone. Installed components shall meet the following requirements:
New Subsections 15 and 16 are added to SECTION 150.1(c) to read as follows:
15.Additional Prescriptive Requirements for Newly Constructed Single Family Mixed-Fuel Buildings:A. Duct System Sealing and Leakage Testing. The total duct system leakage
shall not exceed 2 percent of the nominal system air handler air flow.
B. Insulation for a Heated Slab. Perimeter insulation for a heated slab shall be installed with an R-value equal to or greater than R-10 and shall comply with the requirements of Section 110.8(g).
C. Compact Hot Water. The hot water distribution system shall be designed and installed to meet minimum requirements for the basic compact hot water distribution credit according to the procedures outlined in the 2019 Reference Appendices RA4.4.6.
D. Ducted Central Forced Air Heating Systems. Central Fan Integrated Ventilation Systems. The duct distribution system shall be designed to reduce external static pressure to meet a maximum fan efficacy equal to: Gas Furnaces: 0.35 Watts per cfm Heat Pumps: 0.45 Watts per cfm according to the procedures outlined in the 2019 Reference Appendices RA3.3.
E. Energy Storage. A battery energy storage system with a minimum capacity equal to 5 kWh shall be installed. The system shall have automatic controls programmed to have the ability to charge anytime PV generation is greater than the building load and discharge to the electric grid, during the highest priced time of use hours of the day.
Page 70 of 319

Supplemental Attachment 2
Page 59 of 69
16.Additional Prescriptive Requirements for Newly Constructed Multifamily Mixed-Fuel Buildings:A. Insulation for a Heated Slab. Perimeter insulation for a heated slab shall be
installed with an R-value equal to or greater than R-10 and shall comply with the requirements of Section 110.8(g).
B. Compact Hot Water. The hot water distribution system shall be designed and installed to meet minimum requirements for the basic compact hot water distribution credit according to the procedures outlined in the 2019 Reference Appendices RA4.4.6.
C. Central Fan Integrated Ventilation Systems. Central forced air system fans used to provide outside air, shall have an air-handling unit fan efficacy less than or equal to 0.35 W/CFM. The airflow rate and fan efficacy requirements in this section shall be confirmed through field verification and diagnostic testing in accordance with all applicable procedures specified in Reference Residential Appendix RA3.3. Central Fan Integrated Ventilation Systems shall be certified to the Energy Commission as Intermittent Ventilation Systems as specified in Reference Residential Appendix RA3.7.4.2.
D. Energy Storage. A battery energy storage system with a capacity equivalent to the PV system shall be installed. The system shall have automatic controls programmed to have the ability to charge anytime PV generation is greater than the building load and discharge to the electric grid, during the highest priced time of use hours of the day.
Page 71 of 319
Ordinance No. 7,678-N.S. Page 60 of 69
19.36.050 CEQAThese standards are is exempt from CEQA under 15061(b)(3) on the grounds that these standards are more stringent than the State energy standards, there are no reasonably foreseeable adverse impacts and there is no possibility that the activity in question may have a significant effect on the environment.
Section 7. That Berkeley Municipal Code Chapter 19.37 is hereby repealed and reenacted to read as follows:
Chapter 19.37
BERKELEY GREEN CODE
Sections:
19.37.010 Adoption of the California Green Building Standards Code.19.37.020 Title.19.37.030 Administrative provisions.19.37.040 Amendments to the California Green Building Standards Code.
The California Green Building Standards Code (CALGreen), 2019 Edition, as adopted in Title 24 Part 11 of the California Code of Regulations, is hereby adopted and made a part of this Chapter as though fully set forth herein, subject to the modifications thereto which are set forth in this Chapter. A copy of this Code is on file for use and examination by the public in the office of the City Clerk of the City of Berkeley.
19.37.020 Title.This Code shall be known as the “Berkeley Green Code” and may be cited as "this Code".
19.37.030 Administrative provisions.All of the administrative provisions contained in Article 1 of Chapter 19.28, the Berkeley Building Code, shall apply to this Code as well and take precedence over any California Green Building Standards Code administrative provisions that may conflict.
For regulations governing wood burning appliances see BMC 19.28.040.
19.37.040 Amendments to the California Green Building Standards Code.
Chapter 2 Definitions of the California Green Buildings Code is adopted in its entirety subject to the modifications thereto which are set forth below:Add a new definition to read:
ELECTRIC VEHICLE CHARGING SPACE (EV SPACE) RACEWAY EQUIPPED. An EV Space that includes a raceway between any enclosed, inaccessible or concealed areas and the electrical service panel or subpanel. No additional electrical panel capacity is required at time of construction.
Page 72 of 319

Ordinance No. 7,678-N.S. Page 61 of 69
Chapter 3 Green Building of the California Green Buildings Code is adopted in its entirety subject to the modifications thereto which are set forth below:
Add a new Subsection 301.1.2 to read:
301.1.2 Residential waste diversion. The requirements of Section 4.408 shall be required for:
1. Any additions or alterations, which increase the building’s conditioned area, volume or size
2. Any building alterations with a permit valuation over $100,000
3. Any interior or exterior demolitions valued over $3,000
Modify Subsection 301.3.2 to read:
301.3.2 Nonresidential waste diversion. The requirements of Section 5.408 shall be required for additions and, alterations and demolitions whenever a permit is required for work.
Chapter 4 Residential Mandatory Measures of the California Green Buildings Code is adopted in its entirety subject to the modifications thereto which are set forth below:
4.106.4.1 New one- and two-family dwellings and townhouses with attached or detached private garages, carports, or any other on-site parking. For each dwelling unit, install a listed raceway and associated conductors to accommodate a dedicated 208/240-volt branch circuit for a future EV charger. The raceway shall not be less than trade size 1 (nominal 1-inch inside diameter). The raceway shall originate at the main service or subpanel and shall terminate into a listed cabinet, box or other enclosure in close proximity to the proposed location of an EV charger. Raceways are required to be continuous at enclosed, inaccessible or concealed areas and spaces. The service panel and/or subpanel shall provide capacity to install a 40-ampere minimum dedicated branch circuit and space(s) reserved to permit installation of a branch circuit overcurrent protective device. The service panel and/or subpanel shall be provided with a 40 ampere minimum dedicated branch circuit and overcurrent protective device for a future EV charger.
4.106.4.1.1 Identification. The service panel or subpanel circuit directory shall identify the overcurrent protective device space(s) reserved for future EV charging as “EV CAPABLE” “EV CHARGER READY”. The raceway termination location shall be permanently and visibly marked as “EV CAPABLE” “EV CHARGER READY”.
4.106.4.2 New multifamily dwellings. If residential parking is available:
1. Twenty (20) ten (10) percent of the total number of parking spaces on a building
Page 73 of 319

Ordinance No. 7,678-N.S. Page 62 of 69
site, provided for all types of parking facilities, shall be electric vehicle charging spaces (EV spaces) capable of supporting future EVSE EV chargers. All raceways, conductors, 40-ampere minimum dedicated branch circuits, and branch circuit overcurrent protective devices, shall be installed as described in Sections 4.106.4.2.3 and 4.106.4.2.4. Calculations for the required number of EV spaces shall be rounded up to the nearest whole number.
2. Eighty (80) percent of the total number of parking spaces on a building site, provided for all types of parking facilities, shall be EV Spaces Raceway Equipped capable of supporting future Electric Vehicle Service Equipment (EVSE). Raceways shall be installed between any enclosed, inaccessible or concealed areas and the electrical service panel or subpanel. No additional electrical panel capacity is required at time of construction. Calculations for the required number of EV spaces shall be rounded up to the nearest whole number.
Notes:
1. Construction documents are intended to demonstrate the project’s capability and capacity for facilitating future EV charging.
2. There is no requirement for EV spaces to be constructed or available until EV chargers are installed for use.
4.106.4.2.1 Electric vehicle charging space (EV space) locations. Construction documents shall indicate the location of proposed EV spaces. Where common use parking is provided at least one EV space shall be located in the common use parking area and shall be available for use by all residents.
4.106.4.2.1.1 Electric vehicle charging stations (EVCS). When EV chargers are installed, EV spaces required by Section 4.106.4.2.2, Item 3, shall comply with at least one of the following options:
1. The EV space shall be located adjacent to an accessible parking space meeting the requirements of the California Building Code, Chapter 11A, to allow use of the EV charger from the accessible parking space.
2. The EV space shall be located on an accessible route, as defined in the California Building Code, Chapter 2, to the building.
Exception: Electric vehicle charging stations designed and constructed in compliance with the California Building Code, Chapter 11B, are not required to comply with Section 4.106.4.2.1.1 and Section 4.106.4.2.2, Item 3.
Note: Electric vehicle charging stations serving public housing are required to comply with the California Building Code, Chapter 11 B.
Page 74 of 319

Ordinance No. 7,678-N.S. Page 63 of 69
4.106.4.2.2 Electric vehicle charging space (EV space) dimensions. The EV spaces shall be designed to comply with the following:
1. The minimum length of each EV space shall be 18 feet (5486 mm).
2. The minimum width of each EV space shall be 9 feet (2743 mm).
3. One in every 25 EV spaces, but not less than one, shall also have an 8-foot (2438 mm) wide minimum aisle. A 5-foot (1524 mm) wide minimum aisle shall be permitted provided the minimum width of the EV space is 12 feet (3658 mm).
a. Surface slope for this EV space and the aisle shall not exceed 1 unit vertical in 48 units horizontal (2.083 percent slope) in any direction.
4.106.4.2.3 Single EV space for a future EV charger required. Install a listed raceway and associated conductors capable of accommodating a 208/240-volt dedicated branch circuit for a future EV charger. The raceway shall not be less than trade size 1 (nominal 1-inch inside diameter). The raceway shall originate at the main service or subpanel and shall terminate into a listed cabinet, box or enclosure in close proximity to the proposed location of the EV space. Construction documents shall identify the raceway termination point. The service panel and/or subpanel shall provide capacity to install a 40-ampere minimum dedicated branch circuit and space(s) reserved to permit installation of a branch circuit overcurrent protective device. The service panel and/or subpanel shall be provided with a 40 ampere minimum dedicated branch circuit and overcurrent protective device for a future EV charger.
4.106.4.2.4 Multiple EV spaces for future EV chargers required. Install listed raceways and all associated conductors capable of accommodating 208/240-volt dedicated branch circuits for future EV chargers. The raceways shall originate at the main service or subpanel and shall terminate into listed cabinets, boxes or other enclosures in close proximity to the proposed locations of EV spaces. Raceways are required to be continuous at enclosed, inaccessible or concealed areas and spaces. Construction documents shall indicate the raceway termination point and proposed location of future EV spaces and EV chargers. Construction documents shall also provide information on amperage of dedicated branch circuits, future EVSE, raceway method(s), wiring schematics and electrical load calculations to verify that the electrical panel service capacity and electrical system, including any on-site distribution transformer(s), have sufficient capacity to simultaneously charge all EVs at all required EV spaces at the full rated amperage of the EVSE. Plan design shall be based upon a 40-ampere minimum branch circuit. Required raceways and related components that are planned to be installed underground, enclosed, inaccessible or in concealed areas and spaces shall be installed at the time of original construction.
4.106.4.2.5 Identification. The service panel or subpanel circuit directory shall identify the overcurrent protective device space(s) reserved for future EV charging
Page 75 of 319

Ordinance No. 7,678-N.S. Page 64 of 69
purposes as “EV CAPABLE” “EV CHARGER READY” in accordance with the California Electrical Code.
4.106.4.3 New hotels and motels. All newly constructed hotels and motels shall provide Electric Vehicle Charging Stations (EVCS) equipped with EV chargers as set forth in Section 4.106.4.3.1 Item 1, and EV Spaces Raceway Equipped as set forth in Section 4.106.4.3.1 Item 2 capable of supporting future installation of EVSE. The construction documents shall identify the location of the EVCS and the EV spaces.
Notes:
1. Construction documents are intended to demonstrate the project’s capability and capacity for facilitating future EV charging.
2. There is no requirement for EV spaces to be constructed or available until EV chargers are installed for use.
4.106.4.3.1 Number of required EV spaces. The number of required EV spaces shall be based on the total number of parking spaces provided for all types of parking facilities in accordance with Table 4.106.4.3.1 the following:
1. Ten (10) percent of the total number of parking spaces shall be Electric Vehicle Charging Stations (EVCS), designed in accordance with Section 4.106.4.2.4, and equipped with EV chargers.
2. Forty (40) percent of the total number of parking spaces shall be EV Spaces Raceway Equipped capable of supporting future Electric Vehicle Service Equipment (EVSE). Raceways shall be installed between any enclosed, inaccessible or concealed areas and the electrical service panel or subpanel. No additional electrical panel capacity is required at time of construction.
Calculations for the required number of EV spaces shall be rounded up to the nearest whole number.
Exception: Installation of a Direct Current Fast Charger with the capacity to provide at least 80 kW of output may substitute for 10 EV Spaces as designed in accordance with Section 4.106.4.2.4.
Table 4.106.4.3.1 is deleted in its entirety.
4.106.4.3.2 Electric vehicle charging space (EV space) dimensions. The EV spaces shall be designed to comply with the following:
1. The minimum length of each EV space shall be 18 feet (5486 mm).
2. The minimum width of each EV space shall be 9 feet (2743 mm).
Page 76 of 319

Ordinance No. 7,678-N.S. Page 65 of 69
4.106.4.3.3 Single EV space EVCS required. When a single EV space EVCS is required, the EV space shall be designed in accordance with Section 4.106.4.2.3. Installation of the EV charger is required.
4.106.4.3.4 Multiple EV spaces EVCS required. When multiple EV spaces EVCS are required, the EV spaces shall be designed in accordance with Section 4.106.4.2.4. Installation of EV chargers is required.
4.106.4.3.5 Identification. The service panels or subpanels shall be identified in accordance with Section 4.106.4.2.5. The service panels or subpanels shall identify the overcurrent protective devices serving EVCS as “EV CHARGER”.
4.106.4.3.6 Accessible EV spaces. In addition to the requirements in Section 4.106.4.3, EV spaces for hotels/motels and all EVSE, when installed, shall comply with the accessibility provisions for EV charging stations in the California Building Code, Chapter 11B.
4.405 Material Sources
Add a new Subsection 4.405.1 to read:
4.405.1 Reduction in cement use. As allowed by the enforcing agency, cement used in concrete mix design shall be reduced not less than 25 percent. Products commonly used to replace cement in concrete mix designs include, but are not limited to:
1. Fly ash
2. Slag
3. Silica fume
4. Rice hull ash
Exception: Minimum cement reductions in concrete mix designs approved by the Engineer of Record may be lower where high early strength is needed for concrete products or to meet an accelerated project schedule.
Modify Subsection 4.408.1 to read:
4.408.1 Construction waste management. Recycle and/or salvage for reuse 100% of excavated soil and land-clearing debris, 100% of concrete, 100% of asphalt, and a minimum of 65 percent of the other nonhazardous construction and demolition waste in accordance with either Section 4.408.2, 4.408.3 or 4.408.4, or meet a more stringent local construction and demolition waste management ordinance.
Exceptions:
Page 77 of 319

Ordinance No. 7,678-N.S. Page 66 of 69
1. Excavated soil and land-clearing debris. 2. Alternate waste reduction methods developed by working with local agencies
if diversion or recycle facilities capable of compliance with this item do not exist or are not located reasonably close to the jobsite.
3. The enforcing agency may make exceptions to the requirements of this section when isolated jobsites are located in areas beyond the haul boundaries of the diversion facility.
Chapter 5 Nonresidential Mandatory Measures of the California Green Buildings Code is adopted in its entirety subject to the modifications thereto which are set forth below:
5.106.5.3 Electric vehicle (EV) charging. [N] Construction shall comply with Section 5.106.5.3.1 or Section 5.106.5.3.2 to facilitate future require installation of electric vehicle supply equipment (EVSE) including EV chargers. When EVSE(s) is/are installed, it shall be in accordance with the California Building Code, the California Electrical Code and as follows:
5.106.5.3.1 Single electric vehicle charging station (EVCS) charging space requirements. [N] When only a single charging space EVCS is required per Table 5.106.5.3.3 Section 5.106.5.3.3, a raceway with all associated conductors is required to be installed at the time of construction and shall be installed in accordance with the California Electrical Code. Construction plans and specifications shall include, but are not limited to, the following:
1. The type and location of the EVSE including the EV charger.
2. A listed raceway and associated conductors capable of accommodating a 208/240-volt dedicated branch circuit.
3. The raceway shall not be less than trade size 1”.
4. The raceway shall originate at a service panel or a subpanel serving the area, and shall terminate in close proximity to the proposed location of the charging equipment and into a listed suitable cabinet, box, enclosure or equivalent.
5. The service panel or subpanel shall have sufficient capacity to accommodate a minimum 40- ampere dedicated branch circuit for the future installation of the EVSE. The service panel or subpanel shall be provided with a 40 ampere minimum dedicated branch circuit and overcurrent protective device to serve EVSE.
5.106.5.3.2 Multiple electric vehicle charging station (EVCS) charging space requirements. [N] When multiple EVCS charging spaces are required per Table 5.106.5.3.3 Section 5.106.5.3.3 raceway(s) with associated conductors is/are required to be installed at the time of construction and shall be installed in
Page 78 of 319

Ordinance No. 7,678-N.S. Page 67 of 69
accordance with the California Electrical Code. Construction plans and specifications shall include, but are not limited to, the following:
1. The type and location of the EVSE including the EV chargers.
2. The raceway(s) shall originate at a service panel or a subpanel(s) serving the area, and shall terminate in close proximity to the proposed location of the charging equipment and into listed suitable cabinet(s), box(es), enclosure(s) or equivalent.
3. Plan design shall be based upon 40-ampere minimum branch circuits.
4. Electrical calculations shall substantiate the design of the electrical system, to include the rating of equipment and any on-site distribution transformers and have sufficient capacity to simultaneously charge all required EVs at its full rated amperage.
5. The service panel or subpanel(s) shall have sufficient capacity to accommodate the required number of dedicated branch circuit(s) for the future installation of the EVSE. The service panel or subpanel(s) shall be provided with a required number of 40 ampere minimum dedicated branch circuits and overcurrent protective devices to serve EVSE.
5.106.5.3.3 EV charging space calculation. [N] Table 5.106.5.3.3 shall be used to determine if single or multiple charging space requirements apply for the future installation of EVSE. When 10 or more parking spaces are constructed:
1. Ten (10) percent of the total number of parking spaces shall be EVCS with installed EV chargers designed in accordance with Section 5.106.5.3.1 or 5.106.5.3.2. Calculation for spaces shall be rounded up to the nearest whole number.
2. Forty (40) percent of the total number of parking spaces shall be EV Spaces Raceway Equipped capable of supporting future EVSE. Raceway(s) shall be installed between any enclosed, inaccessible or concealed areas and the electrical service panel or subpanel. No additional electrical panel capacity is required at time of construction. Calculation for spaces shall be rounded up to the nearest whole number.
Exceptions:
1. On a case-by-case basis where the local enforcing agency has determined EV charging and infrastructure is not feasible based upon one or more of the following conditions:
1.1 Where there is insufficient electrical supply.
Page 79 of 319
Ordinance No. 7,678-N.S. Page 68 of 69
1.2 Where there is evidence suitable to the local enforcing agency substantiating that additional local utility infrastructure design requirements, directly related to the implementation of Section 5.106.5.3, may adversely impact the construction cost of the project.
2. Installation of a Direct Current Fast Charger with the capacity to provide at least 80 kW of output may substitute for 10 EV Spaces as designed in accordance with Section 5.106.5.3.2.
Table 5.106.5.3.3 is deleted in its entirety.
5.106.5.3.4 [N] Identification. The service panel or subpanel(s) circuit directory shall identify the reserved overcurrent protective device space(s) for future EV charging as “EV CAPABLE”. The service panels or subpanels shall identify the overcurrent protective devices serving EVCS as “EV CHARGER”. The raceway termination location shall be permanently and visibly marked as “EV CAPABLE”.
5.106.5.3.5 [N] Future charging spaces. Future charging spaces qualify as designated parking as described in Section 5.106.5.2 Designated parking for clean air vehicles.
5.405 Material Sources
Add a new Subsection 5.405.1 to read:
5.405.1 Reduction in cement use. As allowed by the enforcing agency, cement used in concrete mix design shall be reduced not less than 25 percent. Products commonly used to replace cement in concrete mix designs include, but are not limited to:
1. Fly ash.
2. Slag.
3. Silica fume.
4. Rice hull ash.
Exception: Minimum cement reductions in concrete mix designs approved by the Engineer of Record may be lower where high early strength is needed for concrete products or to meet an accelerated project schedule.
5.408.3 Concrete, asphalt, excavated soil and land clearing debris. 100 percent of concrete, asphalt, trees, stumps, rocks and associated vegetation and soils resulting primarily from land clearing shall be reused or recycled. For a phased project, such material may be stockpiled on site until the storage site is developed.
Page 80 of 319

Ordinance No. 7,678-N.S. Page 69 of 69
Section 8. Copies of this Ordinance shall be posted for two days prior to adoption in the display case located near the walkway in front of Council Chambers, 2134 Martin Luther King Jr. Way. Within 15 days of adoption, copies of this Ordinance shall be filed at each branch of the Berkeley Public Library and the title shall be published in a newspaper of general circulation.
* * * * * *
At a regular meeting of the Council of the City of Berkeley held on November 12, 2019, this Ordinance was passed to print and ordered published by posting by the following vote:
Ayes: Bartlett, Davila, Droste, Hahn, Harrison, Kesarwani, Robinson, Wengraf, and Arreguin.
Noes: None.
Absent: None.
Page 81 of 319

Margin?
Title 24, Parts 6 and 11 Local Energy Efficiency Ordinances
2019 Cost-effectiveness Study:
Low-Rise Residential New Construction
Prepared for:
Kelly Cunningham
Codes and Standards Program
Pacific Gas and Electric Company
Prepared by:
Frontier Energy, Inc.
Misti Bruceri & Associates, LLC
Last Modified: August 01, 2019
ATTACHMENT 2Page 82 of 319

LEGAL NOTICE
This report was prepared by Pacific Gas and Electric Company and funded by the California utility customers under the auspices of the California Public Utilities Commission.
Copyright 2019, Pacific Gas and Electric Company. All rights reserved, except that this document may be used, copied, and distributed without modification.
Neither PG&E nor any of its employees makes any warranty, express or implied; or assumes any legal liability or responsibility for the accuracy, completeness or usefulness of any data, information, method, product, policy or process disclosed in this document; or represents that its use will not infringe any privately-owned rights including, but not limited to, patents, trademarks or copyrights.
Page 83 of 319

2019 Energy Efficiency Ordinance Cost-effectiveness Study
Table of Contents Acronyms ........................................................................................................................................................ 5
1 Introduction ............................................................................................................................................ 1
2 Methodology and Assumptions.............................................................................................................. 1
2.1 Building Prototypes ........................................................................................................................ 1
2.2 Measure Analysis ............................................................................................................................ 3
2.2.1 Federal Preemption ................................................................................................................ 4
2.2.2 Energy Design Rating .............................................................................................................. 4
2.2.3 Energy Efficiency Measures .................................................................................................... 5
2.3 Package Development .................................................................................................................... 8
2.3.1 Solar Photovoltaics (PV) ......................................................................................................... 8
2.3.2 Energy Storage (Batteries) ...................................................................................................... 8
2.4 Incremental Costs ........................................................................................................................... 9
2.5 Cost-effectiveness ........................................................................................................................ 13
2.5.1 On-Bill Customer Lifecycle Cost ............................................................................................ 13
2.5.2 TDV Lifecycle Cost ................................................................................................................. 15
2.6 Electrification Evaluation .............................................................................................................. 15
2.7 Greenhouse Gas Emissions ........................................................................................................... 18
3 Results .................................................................................................................................................. 18
3.1 PV and Battery System Sizing ....................................................................................................... 19
3.2 Single Family Results .................................................................................................................... 21
3.2.1 GHG Emission Reductions .................................................................................................... 26
3.3 Multifamily Results ....................................................................................................................... 26
3.3.1 GHG Emission Reductions .................................................................................................... 32
3.4 Electrification Results ................................................................................................................... 32
3.4.1 Single Family ......................................................................................................................... 33
3.4.2 Multifamily ........................................................................................................................... 33
4 Conclusions & Summary ....................................................................................................................... 41
5 References ............................................................................................................................................ 44
Appendix A – California Climate Zone Map .................................................................................................. 46
Appendix B – Utility Tariff Details................................................................................................................. 47
Appendix C – Single Family Detailed Results ................................................................................................ 57
Appendix D – Single Family Measure Summary ........................................................................................... 61
Appendix E – Multifamily Detailed Results .................................................................................................. 68
Appendix F – Multifamily Measure Summary .............................................................................................. 72
Appendix G – Results by Climate Zone ......................................................................................................... 79
Page 84 of 319

2019 Energy Efficiency Ordinance Cost-effectiveness Study
List of Tables Table 1: Prototype Characteristics .............................................................................................................................2 Table 2: Characteristics of the Mixed Fuel vs All-Electric Prototype ..........................................................................3 Table 3: Lifetime of Water Heating & Space Conditioning Equipment Measures .....................................................9 Table 4: Incremental Cost Assumptions .................................................................................................................. 10 Table 5: IOU Utility Tariffs Applied Based on Climate Zone .................................................................................... 14 Table 6: Incremental Costs – All-Electric Code Compliant Home Compared to a Mixed Fuel Code Compliant Home ................................................................................................................................................................................. 16 Table 7: PV & Battery Sizing Details by Package Type ............................................................................................. 20 Table 8: Single Family Package Lifetime Incremental Costs .................................................................................... 22 Table 9: Single Family Package Cost-Effectiveness Results for the Mixed Fuel Case 1,2 .......................................... 23 Table 10: Single Family Package Cost-Effectiveness Results for the All-Electric Case1,2 ......................................... 24 Table 11: Multifamily Package Incremental Costs per Dwelling Unit ..................................................................... 28 Table 12: Multifamily Package Cost-Effectiveness Results for the Mixed Fuel Case1,2 ........................................... 29 Table 13: Multifamily Package Cost-effectiveness Results for the All-Electric Case1,2 ............................................ 30 Table 14: Single Family Electrification Results ....................................................................................................... 34 Table 15: Comparison of Single Family On-Bill Cost Effectiveness Results with Additional PV ............................. 36 Table 16: Multifamily Electrification Results (Per Dwelling Unit) .......................................................................... 38 Table 17: Comparison of Multifamily On-Bill Cost Effectiveness Results with Additional PV (Per Dwelling Unit) 39 Table 18: Summary of Single Family Target EDR Margins ....................................................................................... 43 Table 19: Summary of Multifamily Target EDR Margins ......................................................................................... 43 Table 20: PG&E Baseline Territory by Climate Zone .............................................................................................. 48 Table 21: SCE Baseline Territory by Climate Zone .................................................................................................. 51 Table 22: SoCalGas Baseline Territory by Climate Zone ......................................................................................... 53 Table 23: SDG&E Baseline Territory by Climate Zone ............................................................................................ 54 Table 24: Real Utility Rate Escalation Rate Assumptions ........................................................................................ 56 Table 25: Single Family Mixed Fuel Efficiency Package Cost-Effectiveness Results ................................................ 57 Table 26: Single Family Mixed Fuel Efficiency & PV/Battery Package Cost-Effectiveness Results .......................... 58 Table 27: Single Family All-Electric Efficiency Package Cost-Effectiveness Results ................................................ 59 Table 28: Single Family All-Electric Efficiency & PV-PV/Battery Package Cost-Effectiveness Results ..................... 60 Table 29: Single Family Mixed Fuel Efficiency – Non-Preempted Package Measure Summary ............................. 61 Table 30: Single Family Mixed Fuel Efficiency – Equipment, Preempted Package Measure Summary .................. 62 Table 31: Single Family Mixed Fuel Efficiency & PV/Battery Package Measure Summary ..................................... 63 Table 32: Single Family All-Electric Efficiency – Non-Preempted Package Measure Summary .............................. 64 Table 33: Single Family All-Electric Efficiency – Equipment, Preempted Package Measure Summary .................. 65 Table 34: Single Family All-Electric Efficiency & PV Package Measure Summary ................................................... 66 Table 35: Single Family All-Electric Efficiency & PV/Battery Package Measure Summary ...................................... 67 Table 36: Multifamily Mixed Fuel Efficiency Package Cost-Effectiveness Results .................................................. 68 Table 37: Multifamily Mixed Fuel Efficiency & PV/Battery Package Cost-Effectiveness Results ............................ 69 Table 38: Multifamily All-Electric Efficiency Package Cost-Effectiveness Results ................................................... 70 Table 39: Multifamily All-Electric Efficiency & PV-PV/Battery Package Cost-Effectiveness Results ....................... 71 Table 40: Multifamily Mixed Fuel Efficiency – Non-Preempted Package Measure Summary ................................ 72 Table 41: Multifamily Mixed Fuel Efficiency – Equipment, Preempted Package Measure Summary .................... 73 Table 42: Multifamily Mixed Fuel Efficiency & PV/Battery Package Measure Summary ....................................... 74 Table 43: Multifamily All-Electric Efficiency – Non-Preempted Package Measure Summary ................................. 75 Table 44: Multifamily All-Electric Efficiency – Equipment, Preempted Package Measure Summary ..................... 76 Table 45: Multifamily All-Electric Efficiency & PV Package Measure Summary ...................................................... 77 Table 46: Multifamily All-Electric Efficiency & PV/Battery Package Measure Summary ........................................ 78 Table 47: Single Family Climate Zone 1 Results Summary ...................................................................................... 80
Page 85 of 319

2019 Energy Efficiency Ordinance Cost-effectiveness Study
Table 48: Multifamily Climate Zone 1 Results Summary (Per Dwelling Unit) ......................................................... 81 Table 49: Single Family Climate Zone 2 Results Summary ...................................................................................... 82 Table 50: Multifamily Climate Zone 2 Results Summary (Per Dwelling Unit) ......................................................... 83 Table 51: Single Family Climate Zone 3 Results Summary ...................................................................................... 84 Table 52: Multifamily Climate Zone 3 Results Summary (Per Dwelling Unit) ......................................................... 85 Table 53: Single Family Climate Zone 4 Results Summary ...................................................................................... 86 Table 54: Multifamily Climate Zone 4 Results Summary (Per Dwelling Unit) ......................................................... 87 Table 55: Single Family Climate Zone 5 PG&E Results Summary ............................................................................ 88 Table 56: Multifamily Climate Zone 5 PG&E Results Summary (Per Dwelling Unit) ............................................... 89 Table 57: Single Family Climate Zone 5 PG&E/SoCalGas Results Summary ............................................................ 90 Table 58: Multifamily Climate Zone 5 PG&E/SoCalGas Results Summary (Per Dwelling Unit) ............................... 91 Table 59: Single Family Climate Zone 6 Results Summary ...................................................................................... 92 Table 60: Multifamily Climate Zone 6 Results Summary (Per Dwelling Unit) ......................................................... 93 Table 61: Single Family Climate Zone 7 Results Summary ...................................................................................... 94 Table 62: Multifamily Climate Zone 7 Results Summary (Per Dwelling Unit) ......................................................... 95 Table 63: Single Family Climate Zone 8 Results Summary ...................................................................................... 96 Table 64: Multifamily Climate Zone 8 Results Summary (Per Dwelling Unit) ......................................................... 97 Table 65: Single Family Climate Zone 9 Results Summary ...................................................................................... 98 Table 66: Multifamily Climate Zone 9 Results Summary (Per Dwelling Unit) ......................................................... 99 Table 67: Single Family Climate Zone 10 SCE/SoCalGas Results Summary ........................................................... 100 Table 68: Multifamily Climate Zone 10 SCE/SoCalGas Results Summary (Per Dwelling Unit) .............................. 101 Table 69: Single Family Climate Zone 10 SDGE Results Summary......................................................................... 102 Table 70: Multifamily Climate Zone 10 SDGE Results Summary (Per Dwelling Unit) ............................................ 103 Table 71: Single Family Climate Zone 11 Results Summary .................................................................................. 104 Table 72: Multifamily Climate Zone 11 Results Summary (Per Dwelling Unit) ..................................................... 105 Table 73: Single Family Climate Zone 12 Results Summary .................................................................................. 106 Table 74: Multifamily Climate Zone 12 Results Summary (Per Dwelling Unit) ..................................................... 107 Table 75: Single Family Climate Zone 13 Results Summary .................................................................................. 108 Table 76: Multifamily Climate Zone 13 Results Summary (Per Dwelling Unit) ..................................................... 109 Table 77: Single Family Climate Zone 14 SCE/SoCalGas Results Summary ........................................................... 110 Table 78: Multifamily Climate Zone 14 SCE/SoCalGas Results Summary (Per Dwelling Unit) .............................. 111 Table 79: Single Family Climate Zone 14 SDGE Results Summary......................................................................... 112 Table 80: Multifamily Climate Zone 14 SDGE Results Summary (Per Dwelling Unit) ............................................ 113 Table 81: Single Family Climate Zone 15 Results Summary .................................................................................. 114 Table 82: Multifamily Climate Zone 15 Results Summary (Per Dwelling Unit) ..................................................... 115 Table 83: Single Family Climate Zone 16 Results Summary .................................................................................. 116 Table 84: Multifamily Climate Zone 16 Results Summary (Per Dwelling Unit) ..................................................... 117
List of Figures Figure 1: Graphical description of EDR scores (courtesy of Energy Code Ace) ..........................................................5 Figure 2: B/C ratio comparison for PV and battery sizing ....................................................................................... 20 Figure 3: Single family Total EDR comparison ......................................................................................................... 25 Figure 4: Single family EDR Margin comparison (based on Efficiency EDR Margin for the Efficiency packages and the Total EDR Margin for the Efficiency & PV and Efficiency & PV/Battery packages) ........................................... 25 Figure 5: Single family greenhouse gas emissions comparison............................................................................... 26 Figure 6: Multifamily Total EDR comparison ........................................................................................................... 31 Figure 7: Multifamily EDR Margin comparison (based on Efficiency EDR Margin for the Efficiency packages and the Total EDR Margin for the Efficiency & PV and Efficiency & PV/Battery packages) ........................................... 31 Figure 8: Multifamily greenhouse gas emissions comparison ................................................................................ 32
Page 86 of 319

2019 Energy Efficiency Ordinance Cost-effectiveness Study
Figure 9: B/C ratio results for a single family all-electric code compliant home versus a mixed fuel code compliant home ........................................................................................................................................................................ 36 Figure 10: B/C ratio results for the single family Efficiency & PV all-electric home versus a mixed fuel code compliant home ...................................................................................................................................................... 37 Figure 11: B/C ratio results for the single family neutral cost package all-electric home versus a mixed fuel code compliant home ...................................................................................................................................................... 37 Figure 12: B/C ratio results for a multifamily all-electric code compliant home versus a mixed fuel code compliant home ...................................................................................................................................................... 40 Figure 13: B/C ratio results for the multifamily Efficiency & PV all-electric home versus a mixed fuel code compliant home ...................................................................................................................................................... 40 Figure 14: B/C ratio results for the multifamily neutral cost package all-electric home versus a mixed fuel code compliant home ...................................................................................................................................................... 41 Figure 15: Map of California Climate Zones (courtesy of the California Energy Commission) ............................... 46
Page 87 of 319

2019 Energy Efficiency Ordinance Cost-effectiveness Study
Acronyms
2020 PV$ Present value costs in 2020
ACH50 Air Changes per Hour at 50 pascals pressure differential
ACM Alternative Calculation Method
AFUE Annual Fuel Utilization Efficiency
B/C Lifecycle Benefit-to-Cost Ratio
BEopt Building Energy Optimization Tool
BSC Building Standards Commission
CAHP California Advanced Homes Program
CBECC-Res Computer program developed by the California Energy Commission for use in demonstrating compliance with the California Residential Building Energy Efficiency Standards
CFI California Flexible Installation
CFM Cubic Feet per Minute
CMFNH California Multifamily New Homes
CO2 Carbon Dioxide
CPC California Plumbing Code
CZ California Climate Zone
DHW Domestic Hot Water
DOE Department of Energy
DWHR Drain Water Heat Recovery
EDR Energy Design Rating
EER Energy Efficiency Ratio
EF Energy Factor
GHG Greenhouse Gas
HERS Rater Home Energy Rating System Rater
HPA High Performance Attic
HPWH Heat Pump Water Heater
HSPF Heating Seasonal Performance Factor
HVAC Heating, Ventilation, and Air Conditioning
IECC International Energy Conservation Code
IOU Investor Owned Utility
kBtu kilo-British thermal unit
kWh Kilowatt Hour
LBNL Lawrence Berkeley National Laboratory
Page 88 of 319

2019 Energy Efficiency Ordinance Cost-effectiveness Study
LCC Lifecycle Cost
LLAHU Low Leakage Air Handler Unit
VLLDCS Verified Low Leakage Ducts in Conditioned Space
MF Multifamily
NAECA National Appliance Energy Conservation Act
NEEA Northwest Energy Efficiency Alliance
NEM Net Energy Metering
NPV Net Present Value
NREL National Renewable Energy Laboratory
PG&E Pacific Gas and Electric Company
PV Photovoltaic
SCE Southern California Edison
SDG&E San Diego Gas and Electric
SEER Seasonal Energy Efficiency Ratio
SF Single Family
CASE Codes and Standards Enhancement
TDV Time Dependent Valuation
Therm Unit for quantity of heat that equals 100,000 British thermal units
Title 24 Title 24, Part 6
TOU Time-Of-Use
UEF Uniform Energy Factor
ZNE Zero-net Energy
Page 89 of 319

2019 Energy Efficiency Ordinance Cost-effectiveness Study
1 2019-08-01
1 Introduction The California Building Energy Efficiency Standards Title 24, Part 6 (Title 24) (Energy Commission, 2018b) is maintained and updated every three years by two state agencies, the California Energy Commission (Energy Commission) and the Building Standards Commission (BSC). In addition to enforcing the code, local jurisdictions have the authority to adopt local energy efficiency ordinances, or reach codes, that exceed the minimum standards defined by Title 24 (as established by Public Resources Code Section 25402.1(h)2 and Section 10-106 of the Building Energy Efficiency Standards). Local jurisdictions must demonstrate that the requirements of the proposed ordinance are cost-effective and do not result in buildings consuming more energy than is permitted by Title 24. In addition, the jurisdiction must obtain approval from the Energy Commission and file the ordinance with the BSC for the ordinance to be legally enforceable.
This report documents cost-effective combinations of measures that exceed the minimum state requirements, the 2019 Building Energy Efficiency Standards, effective January 1, 2020, for new single family and low-rise (one- to three-story) multifamily residential construction. The analysis includes evaluation of both mixed fuel and all-electric homes, documenting that the performance requirements can be met by either type of building design. Compliance package options and cost-effectiveness analysis in all sixteen California climate zones (CZs) are presented (see Appendix A – California Climate Zone Map for a graphical depiction of Climate Zone locations). All proposed package options include a combination of efficiency measures and on-site renewable energy.
2 Methodology and Assumptions This analysis uses two different metrics to assess cost-effectiveness. Both methodologies require estimating and quantifying the incremental costs and energy savings associated with energy efficiency measures. The main difference between the methodologies is the manner in which they value energy and thus the cost savings of reduced or avoided energy use.
• Utility Bill Impacts (On-Bill): Customer-based Lifecycle Cost (LCC) approach that values energy based upon estimated site energy usage and customer on-bill savings using electricity and natural gas utility rate schedules over a 30-year duration accounting for discount rate and energy cost inflation.
• Time Dependent Valuation (TDV): Energy Commission LCC methodology, which is intended to capture the “societal value or cost” of energy use including long-term projected costs such as the cost of providing energy during peak periods of demand and other societal costs such as projected costs for carbon emissions, as well as grid transmission and distribution impacts. This metric values energy use differently depending on the fuel source (gas, electricity, and propane), time of day, and season. Electricity used (or saved) during peak periods has a much higher value than electricity used (or saved) during off-peak periods (Horii et al., 2014). This is the methodology used by the Energy Commission in evaluating cost-effectiveness for efficiency measures in Title 24, Part 6.
2.1 Building Prototypes
The Energy Commission defines building prototypes which it uses to evaluate the cost-effectiveness of proposed changes to Title 24 requirements. At the time that this report was written, there are two single family prototypes and one low-rise multifamily prototype. All three are used in this analysis in development of the above-code packages. Table 1 describes the basic characteristics of each prototype. Additional details on the prototypes can be found in the Alternative Calculation Method (ACM) Approval Manual (Energy Commission, 2018a). The prototypes have equal geometry on all walls, windows and roof to be orientation neutral.
Page 90 of 319
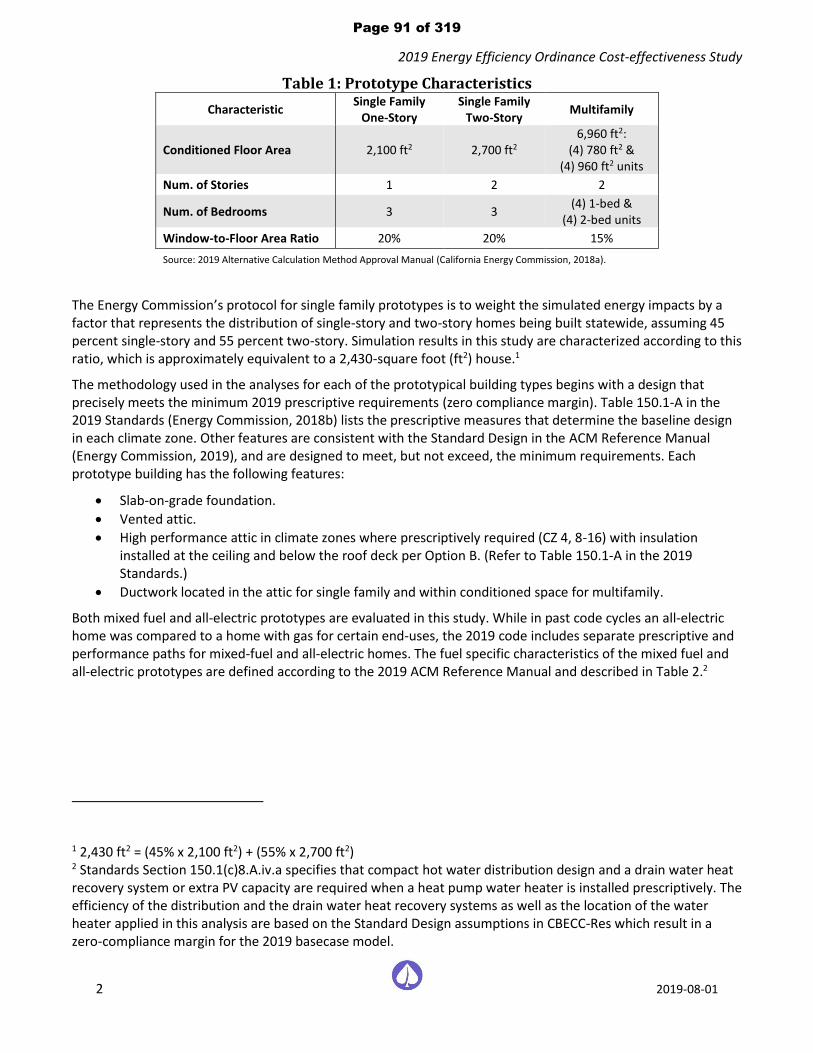
2019 Energy Efficiency Ordinance Cost-effectiveness Study
2 2019-08-01
Table 1: Prototype Characteristics
Characteristic Single Family
One-Story Single Family
Two-Story Multifamily
Conditioned Floor Area 2,100 ft2 2,700 ft2 6,960 ft2:
(4) 780 ft2 & (4) 960 ft2 units
Num. of Stories 1 2 2
Num. of Bedrooms 3 3 (4) 1-bed &
(4) 2-bed units
Window-to-Floor Area Ratio 20% 20% 15%
Source: 2019 Alternative Calculation Method Approval Manual (California Energy Commission, 2018a).
The Energy Commission’s protocol for single family prototypes is to weight the simulated energy impacts by a factor that represents the distribution of single-story and two-story homes being built statewide, assuming 45 percent single-story and 55 percent two-story. Simulation results in this study are characterized according to this ratio, which is approximately equivalent to a 2,430-square foot (ft2) house.1
The methodology used in the analyses for each of the prototypical building types begins with a design that precisely meets the minimum 2019 prescriptive requirements (zero compliance margin). Table 150.1-A in the 2019 Standards (Energy Commission, 2018b) lists the prescriptive measures that determine the baseline design in each climate zone. Other features are consistent with the Standard Design in the ACM Reference Manual (Energy Commission, 2019), and are designed to meet, but not exceed, the minimum requirements. Each prototype building has the following features:
• Slab-on-grade foundation.
• Vented attic.
• High performance attic in climate zones where prescriptively required (CZ 4, 8-16) with insulation installed at the ceiling and below the roof deck per Option B. (Refer to Table 150.1-A in the 2019 Standards.)
• Ductwork located in the attic for single family and within conditioned space for multifamily.
Both mixed fuel and all-electric prototypes are evaluated in this study. While in past code cycles an all-electric home was compared to a home with gas for certain end-uses, the 2019 code includes separate prescriptive and performance paths for mixed-fuel and all-electric homes. The fuel specific characteristics of the mixed fuel and all-electric prototypes are defined according to the 2019 ACM Reference Manual and described in Table 2.2
1 2,430 ft2 = (45% x 2,100 ft2) + (55% x 2,700 ft2) 2 Standards Section 150.1(c)8.A.iv.a specifies that compact hot water distribution design and a drain water heat recovery system or extra PV capacity are required when a heat pump water heater is installed prescriptively. The efficiency of the distribution and the drain water heat recovery systems as well as the location of the water heater applied in this analysis are based on the Standard Design assumptions in CBECC-Res which result in a zero-compliance margin for the 2019 basecase model.
Page 91 of 319

2019 Energy Efficiency Ordinance Cost-effectiveness Study
3 2019-08-01
Table 2: Characteristics of the Mixed Fuel vs All-Electric Prototype Characteristic Mixed Fuel All-Electric
Space Heating/Cooling1 Gas furnace 80 AFUE Split A/C 14 SEER, 11.7 EER
Split heat pump 8.2 HSPF, 14 SEER, 11.7 EER
Water Heater1,2, 3, 4 Gas tankless UEF = 0.81
50gal HPWH UEF = 2.0 SF: located in the garage
MF CZ 2,4,6-16: located in living space MF CZ 1,3,5: located in exterior closet
Hot Water Distribution Code minimum. All hot water
lines insulated
Basic compact distribution credit, (CZ 6-8,15)
Expanded compact distribution credit, compactness factor = 0.6
(CZ 1-5,9-14,16)
Drain Water Heat Recovery Efficiency
None
CZ 1: unequal flow to shower = 42% CZ 16: equal flow to shower & water
heater = 65% None in other CZs
Cooking Gas Electric
Clothes Drying Gas Electric 1Equipment efficiencies are equal to minimum federal appliance efficiency standards. 2The multifamily prototype is evaluated with individual water heaters. HPWHs located in the living space do not have ducting for either inlet or exhaust air; CBECC-Res does not have the capability to model ducted HPWHs. 3UEF = uniform energy factor. HPWH = heat pump water heater. SF = single family. MF = multifamily. 4CBECC-Res applies a 50gal water heater when specifying a storage water heater. Hot water draws differ between the prototypes based on number of bedrooms.
2.2 Measure Analysis
The California Building Energy Code Compliance simulation tool, CBECC-RES 2019.1.0, was used to evaluate energy impacts using the 2019 Title 24 prescriptive standards as the benchmark, and the 2019 TDV values. TDV is the energy metric used by the Energy Commission since the 2005 Title 24 energy code to evaluate compliance with the Title 24 standards.
Using the 2019 baseline as the starting point, prospective energy efficiency measures were identified and modeled in each of the prototypes to determine the projected energy (Therm and kWh) and compliance impacts. A large set of parametric runs were conducted to evaluate various options and develop packages of measures that exceed minimum code performance. The analysis utilizes a parametric tool based on Micropas3 to automate and manage the generation of CBECC-Res input files. This allows for quick evaluation of various efficiency measures across multiple climate zones and prototypes and improves quality control. The batch process functionality of CBECC-Res is utilized to simulate large groups of input files at once. Annual utility costs were calculated using hourly data output from CBECC-Res and electricity and natural gas tariffs for each of the investor owned utilities (IOUs).
3 Developed by Ken Nittler of Enercomp, Inc.
Page 92 of 319

2019 Energy Efficiency Ordinance Cost-effectiveness Study
4 2019-08-01
The Reach Codes Team selected packages and measures based on cost-effectiveness as well as decades of experience with residential architects, builders, and engineers along with general knowledge of the relative acceptance of many measures.
2.2.1 Federal Preemption
The Department of Energy (DOE) sets minimum efficiency standards for equipment and appliances that are federally regulated under the National Appliance Energy Conservation Act (NAECA), including heating, cooling, and water heating equipment. Since state and local governments are prohibited from adopting policies that mandate higher minimum efficiencies than the federal standards require, the focus of this study is to identify and evaluate cost-effective packages that do not include high efficiency equipment. While this study is limited by federal preemption, in practice builders may use any package of compliant measures to achieve the performance goals, including high efficiency appliances. Often, these measures are the simplest and most affordable measures to increase energy performance.
2.2.2 Energy Design Rating
The 2019 Title 24 code introduces California’s Energy Design Rating (EDR) as the primary metric to demonstrate compliance with the energy code. EDR is still based on TDV but it uses a building that is compliant with the 2006 International Energy Conservation Code (IECC) as the reference building. The reference building has an EDR score of 100 while a zero-net energy (ZNE) home has an EDR score of zero (Energy Commission, 2018d). See Figure 1 for a graphical representation of this. While the Reference Building is used to determine the rating, the Proposed Design is still compared to the Standard Design based on the prescriptive baseline assumptions to determine compliance.
The EDR is calculated by CBECC-Res and has two components:
1. An “Efficiency EDR” which represents the building’s energy use without solar generation.4 2. A “Total EDR” that represents the final energy use of the building based on the combined impact of
efficiency measures, PV generation and demand flexibility.
For a building to comply, two criteria are required:
(1) the proposed Efficiency EDR must be equal to or less than the Efficiency EDR of the Standard Design, and (2) the proposed Total EDR must be equal to or less than the Total EDR of the Standard Design.
Single family prototypes used in this analysis that are minimally compliant with the 2019 Title 24 code achieve a Total EDR between 20 and 35 in most climates.
This concept, consistent with California’s “loading order” which prioritizes energy efficiency ahead of renewable generation, requires projects meet a minimum Efficiency EDR before PV is credited but allows for PV to be traded off with additional efficiency when meeting the Total EDR. A project may improve on building efficiency beyond the minimum required and subsequently reduce the PV generation capacity required to achieve the required Total EDR but may not increase the size of the PV system and trade this off with a reduction of efficiency measures. Figure 1 graphically summarizes how both Efficiency EDR and PV / demand flexibility EDR are used to calculate the Total EDR used in the 2019 code and in this analysis.
4 While there is no compliance credit for solar PV as there is under the 2016 Standards, the credit for installing electric storage battery systems that meet minimum qualifications can be applied to the Efficiency EDR.
Page 93 of 319

2019 Energy Efficiency Ordinance Cost-effectiveness Study
5 2019-08-01
Figure 1: Graphical description of EDR scores (courtesy of Energy Code Ace5)
Results from this analysis are presented as EDR Margin, a reduction in the EDR score relative to the Standard Design. EDR Margin is a better metric to use than absolute EDR in the context of a reach code because absolute values vary, based on the home design and characteristics such as size and orientation. This approach aligns with how compliance is determined for the 2019 Title 24 code, as well as utility incentive programs, such as the California Advanced Homes Program (CAHP) & California Multifamily New Homes (CMFNH), which require minimum performance criteria based on an EDR Margin for low-rise residential projects. The EDR Margin is calculated according to Equation 1 for the two efficiency packages and Equation 2 for the Efficiency & PV and Efficiency & PV/Battery packages (see Section 2.3).
Equation 1 𝐸𝐷𝑅 𝑀𝑎𝑟𝑔𝑖𝑛𝒆𝒇𝒇𝒊𝒄𝒊𝒆𝒏𝒄𝒚 = 𝑆𝑡𝑎𝑛𝑑𝑎𝑟𝑑 𝐷𝑒𝑠𝑖𝑔𝑛 𝑬𝒇𝒇𝒊𝒄𝒊𝒆𝒏𝒄𝒚 𝐸𝐷𝑅 − 𝑃𝑟𝑜𝑝𝑜𝑠𝑒𝑑 𝐷𝑒𝑠𝑖𝑔𝑛 𝑬𝒇𝒇𝒊𝒄𝒊𝒆𝒏𝒄𝒚 𝐸𝐷𝑅
Equation 2 𝐸𝐷𝑅 𝑀𝑎𝑟𝑔𝑖𝑛𝒆𝒇𝒇𝒊𝒄𝒊𝒆𝒏𝒄𝒚 & 𝑷𝑽 = 𝑆𝑡𝑎𝑛𝑑𝑎𝑟𝑑 𝐷𝑒𝑠𝑖𝑔𝑛 𝑻𝒐𝒕𝒂𝒍 𝐸𝐷𝑅 − 𝑃𝑟𝑜𝑝𝑜𝑠𝑒𝑑 𝐷𝑒𝑠𝑖𝑔𝑛 𝑻𝒐𝒕𝒂𝒍 𝐸𝐷𝑅
2.2.3 Energy Efficiency Measures
Following are descriptions of each of the efficiency measures evaluated under this analysis. Because not all of the measures described below were found to be cost-effective and cost-effectiveness varied by climate zone, not all measures are included in all packages and some of the measures listed are not included in any final package. For a list of measures included in each efficiency package by climate zone, see Appendix D – Single Family Measure Summary and Appendix F – Multifamily Measure Summary.
Reduced Infiltration (ACH50): Reduce infiltration in single family homes from the default infiltration assumption of five (5) air changes per hour at 50 Pascals (ACH50)6 by 40 to 60 percent to either 3 ACH50 or 2 ACH50. HERS
5 https://energycodeace.com/
6 Whole house leakage tested at a pressure difference of 50 Pascals between indoors and outdoors.
Page 94 of 319

2019 Energy Efficiency Ordinance Cost-effectiveness Study
6 2019-08-01
rater field verification and diagnostic testing of building air leakage according to the procedures outlined in the 2019 Reference Appendices RA3.8 (Energy Commission, 2018c). This measure was not applied to multifamily homes because CBECC-Res does not allow reduced infiltration credit for multifamily buildings.
Improved Fenestration: Reduce window U-factor to 0.24. The prescriptive U-factor is 0.30 in all climates. In climate zones 1, 3, 5, and 16 where heating loads dominate, an increase in solar heat gain coefficient (SHGC) from the default assumption of 0.35 to 0.50 was evaluated in addition to the reduction in U-factor.
Cool Roof: Install a roofing product that’s rated by the Cool Roof Rating Council to have an aged solar reflectance (ASR) equal to or greater than 0.25. Steep-sloped roofs were assumed in all cases. Title 24 specifies a prescriptive ASR of 0.20 for Climate Zones 10 through 15 and assumes 0.10 in other climate zones.
Exterior Wall Insulation: Decrease wall U-factor in 2x6 walls to 0.043 from the prescriptive requirement of 0.048 by increasing exterior insulation from one-inch R-5 to 1-1/2 inch R-7.5. This was evaluated for single family buildings only in all climate zones except 6 and 7 where the prescriptive requirement is higher (U-factor of 0.065) and improving beyond the prescriptive value has little impact.
High Performance Attics (HPA): HPA with R-38 ceiling insulation and R-30 insulation under the roof deck. In climates where HPA is already required prescriptively this measure requires an incremental increase in roof insulation from R-19 or R-13 to R-30. In climates where HPA is not currently required (Climate Zones 1 through 3, and 5 through 7), this measure adds roof insulation to an uninsulated roof as well as increasing ceiling insulation from R-30 to R-38 in Climate Zones 3, 5, 6 and 7.
Slab Insulation: Install R-10 perimeter slab insulation at a depth of 16-inches. For climate zone 16, where slab insulation is required, prescriptively this measure increases that insulation from R-7 to R-10.
Duct Location (Ducts in Conditioned Space): Move the ductwork and equipment from the attic to inside the conditioned space in one of the three following ways.
1. Locate ductwork in conditioned space. The air handler may remain in the attic provided that 12 linear feet or less of duct is located outside the conditioned space including the air handler and plenum. Meet the requirements of 2019 Reference Appendices RA3.1.4.1.2. (Energy Commission, 2018c)
2. All ductwork and equipment located entirely in conditioned space meeting the requirements of 2019 Reference Appendices RA3.1.4.1.3. (Energy Commission, 2018c)
3. All ductwork and equipment located entirely in conditioned space with ducts tested to have less than or equal to 25 cfm leakage to outside. Meet the requirements of Verified Low Leakage Ducts in Conditioned Space (VLLDCS) in the 2019 Reference Appendices RA3.1.4.3.8. (Energy Commission, 2018c)
Option 1 and 2 above apply to single family only since the basecase for multifamily assumes ducts are within conditioned space. Option 3 applies to both single family and multifamily cases.
Reduced Distribution System (Duct) Leakage: Reduce duct leakage from 5% to 2% and install a low leakage air handler unit (LLAHU). This is only applicable to single family homes since the basecase for multifamily assumes ducts are within conditioned space and additional duct leakage credit is not available.
Low Pressure Drop Ducts: Upgrade the duct distribution system to reduce external static pressure and meet a maximum fan efficacy of 0.35 Watts per cfm for gas furnaces and 0.45 Watts per cfm for heat pumps operating at full speed. This may involve upsizing ductwork, reducing the total effective length of ducts, and/or selecting low pressure drop components such as filters. Fan watt draw must be verified by a HERS rater according to the procedures outlined in the 2019 Reference Appendices RA3.3 (Energy Commission, 2018c). New federal regulations that went into effect July 3, 2019 require higher fan efficiency for gas furnaces than for heat pumps and air handlers, which is why the recommended specification is different for mixed fuel and all-electric homes.
Page 95 of 319
2019 Energy Efficiency Ordinance Cost-effectiveness Study
7 2019-08-01
HERS Verification of Hot Water Pipe Insulation: The California Plumbing Code (CPC) requires pipe insulation on all hot water lines. This measure provides credit for HERS rater verification of pipe insulation requirements according to the procedures outlined in the 2019 Reference Appendices RA3.6.3. (Energy Commission, 2018c)
Compact Hot Water Distribution: Two credits for compact hot water distribution were evaluated.
1. Basic Credit: Design the hot water distribution system to meet minimum requirements for the basic compact hot water distribution credit according to the procedures outlined in the 2019 Reference Appendices RA4.4.6 (Energy Commission, 2018c). In many single family homes this may require moving the water heater from an exterior to an interior garage wall. Multifamily homes with individual water heaters are expected to easily meet this credit with little or no alteration to plumbing design. CBECC-Res software assumes a 30% reduction in distribution losses for the basic credit.
2. Expanded Credit: Design the hot water distribution system to meet minimum requirements for the expanded compact hot water distribution credit according to the procedures outlined in the 2019 Reference Appendices RA3.6.5 (Energy Commission, 2018c). In addition to requiring HERS verification that the minimum requirements for the basic compact distribution credit are met, this credit also imposes limitations on pipe location, maximum pipe diameter, and recirculation system controls allowed.
Drain Water Heat Recovery (DWHR): For multifamily buildings add DWHR that serves the showers in an unequal flow configuration (pre-heated water is piped directly to the shower) with 50% efficiency. This upgrade assumes all apartments are served by a DWHR with one unit serving each apartment individually. For a slab-on-grade building this requires a horizontal unit for the first-floor apartments.
Federally Preempted Measures:
The following additional measures were evaluated. Because these measures require upgrading appliances that are federally regulated to high efficiency models, they cannot be used to show cost-effectiveness in a local ordinance. The measures and packages are presented here to show that there are several options for builders to meet the performance targets. Heating and cooling capacities are autosized by CBECC-Res in all cases.
High Efficiency Furnace: For the mixed-fuel prototypes, upgrade natural gas furnace to one of two condensing furnace options with an efficiency of 92% or 96% AFUE.
High Efficiency Air Conditioner: For the mixed-fuel prototypes, upgrade the air conditioner to either single-stage SEER 16 / EER 13 or two-stage SEER 18 / EER 14 equipment.
High Efficiency Heat Pump: For the all-electric prototypes, upgrade the heat pump to either single-stage SEER 16 / EER 13 / HSPF 9 or two-stage SEER 18 / EER 14 / HSPF 10 equipment.
High Efficiency Tankless Water Heater: For the mixed-fuel prototype, upgrade tankless water heater to a condensing unit with a rated Uniform Energy Factor (UEF) of 0.96.
High Efficiency Heat Pump Water Heater (HPWH): For the all-electric prototypes, upgrade the federal minimum heat pump water heater to a HPWH that meets the Northwest Energy Efficiency Alliance (NEEA)7 Tier 3 rating. The evaluated NEEA water heater is an 80gal unit and is applied to all three building prototypes. Using the same
7 Based on operational challenges experienced in the past, NEEA established rating test criteria to ensure newly installed HPWHs perform adequately, especially in colder climates. The NEEA rating requires an Energy Factor equal to the ENERGY STAR performance level and includes requirements regarding noise and prioritizing heat pump use over supplemental electric resistance heating.
Page 96 of 319

2019 Energy Efficiency Ordinance Cost-effectiveness Study
8 2019-08-01
water heater provides consistency in performance across all the equipment upgrade cases, even though hot water draws differ across the prototypes.
2.3 Package Development
Three to four packages were evaluated for each prototype and climate zone, as described below.
1) Efficiency – Non-Preempted: This package uses only efficiency measures that don’t trigger federal preemption issues including envelope, and water heating and duct distribution efficiency measures.
2) Efficiency – Equipment, Preempted: This package shows an alternative design that applies HVAC and water heating equipment that are more efficient than federal standards. The Reach Code Team considers this more reflective of how builders meet above code requirements in practice.
3) Efficiency & PV: Using the Efficiency – Non-Preempted Package as a starting point8, PV capacity is added to offset most of the estimated electricity use. This only applies to the all-electric case, since for the mixed fuel cases, 100% of the projected electricity use is already being offset as required by 2019 Title 24, Part 6.
4) Efficiency & PV/Battery: Using the Efficiency & PV Package as a starting point, PV capacity is added as well as a battery system.
2.3.1 Solar Photovoltaics (PV)
Installation of on-site PV is required in the 2019 residential code. The PV sizing methodology in each package was developed to offset annual building electricity use and avoid oversizing which would violate net energy metering (NEM) rules.9 In all cases, PV is evaluated in CBECC-Res according to the California Flexible Installation (CFI) assumptions.
The Reach Code Team used two options within the CBECC-Res software for sizing the PV system, described below. Analysis was conducted to determine the most appropriate sizing method for each package which is described in the results.
• Standard Design PV – the same PV capacity as is required for the Standard Design case10
• Specify PV System Scaling – a PV system sized to offset a specified percentage of the estimated electricity use of the Proposed Design case
2.3.2 Energy Storage (Batteries)
A battery system was evaluated in CBECC-Res with control type set to “Time of Use” and with default efficiencies of 95% for both charging and discharging. The “Time of Use” option assumes batteries are charged anytime PV generation is greater than the house load but controls when the battery storage system discharges. During the summer months (July – September) the battery begins to discharge at the beginning of the peak period at a maximum rate until fully discharged. During discharge the battery first serves the house load but will
8 In cases where there was no cost-effective Efficiency – Non-Preempted Package, the most cost-effective efficiency measures for that climate zone were also included in the Efficiency & PV Package in order to provide a combination of both efficiency and PV beyond code minimum.
9 NEM rules apply to the IOU territories only.
10 The Standard Design PV system is sized to offset the electricity use of the building loads which are typically electric in a mixed fuel home, which includes all loads except space heating, water heating, clothes drying, and cooking.
Page 97 of 319

2019 Energy Efficiency Ordinance Cost-effectiveness Study
9 2019-08-01
discharge to the electric grid if there is excess energy available. During other months the battery discharges whenever the PV system does not cover the entire house load and does not discharge to the electric grid. This control option is considered to be most reflective of the current products on the market. This control option requires an input for the “First Hour of the Summer Peak” and the Statewide CASE Team applied the default hour in CBECC-Res which differs by climate zone (either a 6pm or 7pm start). The Self Utilization Credit was taken when the battery system was modeled.
2.4 Incremental Costs
Table 4 below summarizes the incremental cost assumptions for measures evaluated in this study. Incremental costs represent the equipment, installation, replacement, and maintenance costs of the proposed measures relative to the base case.11 Replacement costs are applied to HVAC and DHW equipment, PV inverters, and battery systems over the 30-year evaluation period. There is no assumed maintenance on the envelope, HVAC, or DHW measures since there should not be any additional maintenance cost for a more efficient version of the same system type as the baseline. Costs were estimated to reflect costs to the building owner. When costs were obtained from a source that didn’t already include builder overhead and profit, a markup of ten percent was added. All costs are provided as present value in 2020 (2020 PV$). Costs due to variations in furnace, air conditioner, and heat pump capacity by climate zone were not accounted for in the analysis.
Equipment lifetimes applied in this analysis for the water heating and space conditioning measures are summarized in Table 3.
Table 3: Lifetime of Water Heating & Space Conditioning Equipment Measures Measure Lifetime
Gas Furnace 20
Air Conditioner 20
Heat Pump 15
Gas Tankless Water Heater 20
Heat Pump Water Heater 15 Source: City of Palo Alto 2019 Title 24 Energy Reach Code Cost- effectiveness Analysis Draft (TRC, 2018) which is based on the Database of Energy Efficiency Resources (DEER).12
11 Interest costs due to financing are not included in the incremental costs presented in the Table 4 but are accounted for in the lifetime cost analysis. All first costs are assumed to be financed in a mortgage, see Section 2.5 for details.
12 http://www.deeresources.com
Page 98 of 319

2019 Energy Efficiency Ordinance Cost-effectiveness Study
10 2019-08-01
Table 4: Incremental Cost Assumptions
Measure Performance
Level
Incremental Cost (2020 PV$)
Source & Notes Single Family
Multifamily (Per Dwelling
Unit)
Non-Preempted Measures Reduced Infiltration
3.0 vs 5.0 ACH50 $391 n/a NREL’s BEopt cost database ($0.115/ft2 for 3 ACH50 & $0.207/ft2 for 2 ACH50) + $100 HERS rater verification. 2.0 vs 5.0 ACH50 $613 n/a
Window U-factor
0.24 vs 0.30 $2,261 $607 $4.23/ft2 window area based on analysis conducted for the 2019 and 2022 Title 24 cycles (Statewide CASE Team, 2018).
Window SHGC 0.50 vs 0.35 $0 $0 Data from CASE Report along with direct feedback from Statewide CASE Team that higher SHGC does not necessarily have any incremental cost (Statewide CASE Team, 2017d). Applies to CZ 1,3,5,16.
Cool Roof - Aged Solar Reflectance
0.25 vs 0.20 $237 $58 Costs based on 2016 Cost-effectiveness Study for Cool Roofs reach code analysis for 0.28 solar reflectance product. (Statewide Reach Codes Team, 2017b). 0.20 vs 0.10 $0 $0
Exterior Wall Insulation
R-7.5 vs R-5 $818 n/a Based on increasing exterior insulation from 1” R-5 to 1.5” R-7.5 in a 2x6 wall (Statewide CASE Team, 2017c). Applies to single family only in all climates except CZ 6, 7.
Under-Deck Roof Insulation (HPA)
R-13 vs R-0 $1,338 $334 Costs for R-13 ($0.64/ft2), R-19 ($0.78/ft2) and R-30 ($1.61/ft2) based on data presented in the 2019 HPA CASE Report (Statewide CASE Team, 2017b) along with data collected directly from builders during the 2019 CASE process. The R-30 costs include additional labor costs for cabling. Costs for R-38 from NREL’s BEopt cost database.
R-19 vs R-13 $282 $70
R-30 vs R-19 $1,831 $457
R-38 vs R-30 $585 $146
Attic Floor Insulation
R-38 vs R-30 $584 $146 NREL’s BEopt cost database: $0.34/ft2 ceiling area
Slab Edge Insulation
R-10 vs R-0 $553 $121 $4/linear foot of slab perimeter based on internet research. Assumes 16in depth.
R-10 vs R-7 $157 $21 $1.58/linear foot of slab perimeter based on NREL’s BEopt cost database. This applies to CZ 16 only where R-7 slab edge insulation is required prescriptively. Assumes 16in depth.
Duct Location
<12 feet in attic $358 n/a
Costs based on a 2015 report on the Evaluation of Ducts in Conditioned Space for New California Homes (Davis Energy Group, 2015). HERS verification cost of $100 for the Verified Low Leakage Ducts in Conditioned Space credit.
Ducts in Conditioned
Space $658 n/a
Verified Low Leakage Ducts in
Conditioned Space
$768 $110
Page 99 of 319
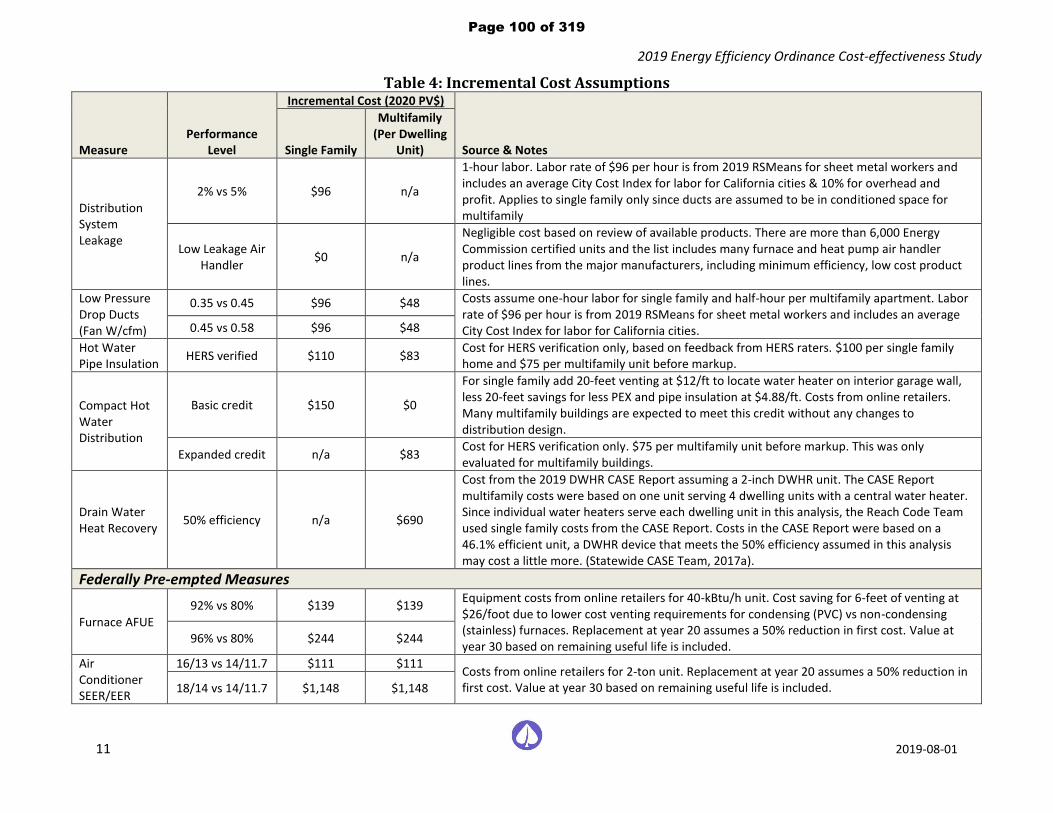
2019 Energy Efficiency Ordinance Cost-effectiveness Study
11 2019-08-01
Table 4: Incremental Cost Assumptions
Measure Performance
Level
Incremental Cost (2020 PV$)
Source & Notes Single Family
Multifamily (Per Dwelling
Unit)
Distribution System Leakage
2% vs 5% $96 n/a
1-hour labor. Labor rate of $96 per hour is from 2019 RSMeans for sheet metal workers and includes an average City Cost Index for labor for California cities & 10% for overhead and profit. Applies to single family only since ducts are assumed to be in conditioned space for multifamily
Low Leakage Air Handler
$0 n/a
Negligible cost based on review of available products. There are more than 6,000 Energy Commission certified units and the list includes many furnace and heat pump air handler product lines from the major manufacturers, including minimum efficiency, low cost product lines.
Low Pressure Drop Ducts (Fan W/cfm)
0.35 vs 0.45 $96 $48 Costs assume one-hour labor for single family and half-hour per multifamily apartment. Labor rate of $96 per hour is from 2019 RSMeans for sheet metal workers and includes an average City Cost Index for labor for California cities. 0.45 vs 0.58 $96 $48
Hot Water Pipe Insulation
HERS verified $110 $83 Cost for HERS verification only, based on feedback from HERS raters. $100 per single family home and $75 per multifamily unit before markup.
Compact Hot Water Distribution
Basic credit $150 $0
For single family add 20-feet venting at $12/ft to locate water heater on interior garage wall, less 20-feet savings for less PEX and pipe insulation at $4.88/ft. Costs from online retailers. Many multifamily buildings are expected to meet this credit without any changes to distribution design.
Expanded credit n/a $83 Cost for HERS verification only. $75 per multifamily unit before markup. This was only evaluated for multifamily buildings.
Drain Water Heat Recovery
50% efficiency n/a $690
Cost from the 2019 DWHR CASE Report assuming a 2-inch DWHR unit. The CASE Report multifamily costs were based on one unit serving 4 dwelling units with a central water heater. Since individual water heaters serve each dwelling unit in this analysis, the Reach Code Team used single family costs from the CASE Report. Costs in the CASE Report were based on a 46.1% efficient unit, a DWHR device that meets the 50% efficiency assumed in this analysis may cost a little more. (Statewide CASE Team, 2017a).
Federally Pre-empted Measures
Furnace AFUE
92% vs 80% $139 $139 Equipment costs from online retailers for 40-kBtu/h unit. Cost saving for 6-feet of venting at $26/foot due to lower cost venting requirements for condensing (PVC) vs non-condensing (stainless) furnaces. Replacement at year 20 assumes a 50% reduction in first cost. Value at year 30 based on remaining useful life is included.
96% vs 80% $244 $244
Air Conditioner SEER/EER
16/13 vs 14/11.7 $111 $111 Costs from online retailers for 2-ton unit. Replacement at year 20 assumes a 50% reduction in first cost. Value at year 30 based on remaining useful life is included. 18/14 vs 14/11.7 $1,148 $1,148
Page 100 of 319

2019 Energy Efficiency Ordinance Cost-effectiveness Study
12 2019-08-01
Table 4: Incremental Cost Assumptions
Measure Performance
Level
Incremental Cost (2020 PV$)
Source & Notes Single Family
Multifamily (Per Dwelling
Unit)
Heat Pump SEER/EER /HSPF
16/13/9 vs 14/11.7/8.2
$411 $411 Costs from online retailers for 2-ton unit. Replacement at year 15 assumes a 50% reduction in first cost. 18/14/10 vs
14/11.7/8.2 $1,511 $1,511
Tankless Water Heater Energy Factor
0.96 vs 0.81 $203 $203 Equipment costs from online retailers for 40-kBtu/h unit. Cost saving for 6-feet of venting at $26/foot due to lower cost venting requirements for condensing (PVC) vs non-condensing (stainless) furnaces. Replacement at year 15 assumes a 50% reduction in first cost.
HPWH NEEA Tier 3 vs
2.0 EF $294 $294
Equipment costs from online retailers. Replacement at year 15 assumes a 50% reduction in first cost.
PV + Battery
PV System System size
varies $3.72/W-DC $3.17/W-DC
First costs are from LBNL’s Tracking the Sun 2018 costs (Barbose et al., 2018) and represent costs for the first half of 2018 of $3.50/W-DC for residential system and $2.90/W-DC for non-residential system ≤500 kW-DC. These costs were reduced by 16% for the solar investment tax credit, which is the average credit over years 2020-2022. Inverter replacement cost of $0.14/W-DC present value includes replacements at year 11 at $0.15/W-DC (nominal) and at year 21 at $0.12/W-DC (nominal) per the 2019 PV CASE Report (California Energy Commission, 2017). System maintenance costs of $0.31/W-DC present value assume $0.02/W-DC (nominal) annually per the 2019 PV CASE Report (California Energy Commission, 2017). 10% overhead and profit added to all costs
Battery System size
varies by building type
$656/kWh $656/kWh
$633/kWh first cost based on the PV Plus Battery Study report (Statewide Reach Codes Team, 2018) as the average cost of the three systems that were analyzed. This cost was reduced by 16% for the solar investment tax credit, which is the average credit over years 2020-2022.
Replacement cost at year 15 of $100/kWh based on target price reductions (Penn, 2018).
Page 101 of 319

2019 Energy Efficiency Ordinance Cost-effectiveness Study
13 2019-08-01
2.5 Cost-effectiveness
Cost-effectiveness was evaluated for all sixteen climate zones and is presented based on both TDV energy, using the Energy Commission’s LCC methodology, and an On-Bill approach using residential customer utility rates. Both methodologies require estimating and quantifying the value of the energy impact associated with energy efficiency measures over the life of the measures (30 years) as compared to the prescriptive Title 24 requirements.
Results are presented as a lifecycle benefit-to-cost (B/C) ratio, a net present value (NPV) metric which represents the cost-effectiveness of a measure over a 30-year lifetime taking into account discounting of future savings and costs and financing of incremental first costs. A value of one indicates the NPV of the savings over the life of the measure is equivalent to the NPV of the lifetime incremental cost of that measure. A value greater than one represents a positive return on investment. The B/C ratio is calculated according to Equation 3.
Equation 3
𝐵𝑒𝑛𝑒𝑓𝑖𝑡 − 𝑡𝑜 − 𝐶𝑜𝑠𝑡 𝑅𝑎𝑡𝑖𝑜 =𝑁𝑃𝑉 𝑜𝑓 𝑙𝑖𝑓𝑒𝑡𝑖𝑚𝑒 𝑏𝑒𝑛𝑒𝑓𝑖𝑡
𝑁𝑃𝑉 𝑜𝑓 𝑙𝑖𝑓𝑒𝑡𝑖𝑚𝑒 𝑐𝑜𝑠𝑡
In most cases the benefit is represented by annual utility savings or TDV savings and the cost by incremental first cost and replacement costs. However, in some cases a measure may have incremental cost savings but with increased energy related costs. In this case, the benefit is the lower first cost and the cost is the increase in utility bills. The lifetime costs or benefits are calculated according to Equation 4.
Equation 4 𝑵𝑷𝑽 𝒐𝒇 𝒍𝒊𝒇𝒆𝒕𝒊𝒎𝒆 𝒄𝒐𝒔𝒕/𝒃𝒆𝒏𝒆𝒇𝒊𝒕 = ∑ 𝑨𝒏𝒏𝒖𝒂𝒍 𝒄𝒐𝒔𝒕/𝒃𝒆𝒏𝒆𝒇𝒊𝒕𝒕 ∗ (𝟏 + 𝒓)𝒕𝒏
𝒕=𝟏 Where:
• n = analysis term
• r = discount rate
The following summarizes the assumptions applied in this analysis to both methodologies.
• Analysis term of 30-years
• Real discount rate of 3 percent
• Inflation rate of 2 percent
• First incremental costs are financed into a 30-year mortgage
• Mortgage interest rate of 4.5 percent
• Average tax rate of 20 percent (to account for tax savings due to loan interest deductions)
2.5.1 On-Bill Customer Lifecycle Cost
Residential utility rates were used to calculate utility costs for all cases and determine On-Bill customer cost-effectiveness for the proposed packages. The Reach Codes Team obtained the recommended utility rates from each IOU based on the assumption that the reach codes go into effect January of 2020. Annual utility costs were calculated using hourly electricity and gas output from CBECC-Res and applying the utility tariffs summarized in Table 5. Appendix B – Utility Tariff Details includes the utility rate schedules used for this study. The applicable residential time-of-use (TOU) rate was applied to all cases.13 Annual electricity production in excess of annual electricity consumption is credited to the utility account at the applicable wholesale rate based on the approved
13 Under NEM rulings by the CPUC (D-16-01-144, 1/28/16), all new PV customers shall be in an approved TOU rate structure. https://www.cpuc.ca.gov/General.aspx?id=3800
Page 102 of 319

2019 Energy Efficiency Ordinance Cost-effectiveness Study
14 2019-08-01
NEM2 tariffs for that utility. Minimum daily use billing and mandatory non-bypassable charges have been applied. Future change to the NEM tariffs are likely; however, there is a lot of uncertainty about what those changes will be and if they will become effective during the 2019 code cycle (2020-2022). The net surplus compensation rates for each utility are as follows:14
• PG&E: $0.0287 / kWh
• SCE: $0.0301 / kWh
• SDG&E: $0.0355 / kWh
Utility rates were applied to each climate zone based on the predominant IOU serving the population of each zone according to Two SCE tariff options were evaluated: TOU-D-4-9 and TOU-D-PRIME. The TOU-D-PRIME rate is only available to customers with heat pumps for either space or water heating, a battery storage system, or an electric vehicle and therefore was only evaluated for the all-electric cases and the Efficiency & PV/Battery packages. The rate which resulted in the lowest annual cost to the customer was used for this analysis, which was TOU-D-4-9 in all cases with the exception of the single family all-electric cases in Climate Zone 14.
Table 5. Climate Zones 10 and 14 are evaluated with both SCE/SoCalGas and SDG&E tariffs since each utility has customers within these climate zones. Climate Zone 5 is evaluated under both PG&E and SoCalGas natural gas rates.
Two SCE tariff options were evaluated: TOU-D-4-9 and TOU-D-PRIME. The TOU-D-PRIME rate is only available to customers with heat pumps for either space or water heating, a battery storage system, or an electric vehicle and therefore was only evaluated for the all-electric cases and the Efficiency & PV/Battery packages. The rate which resulted in the lowest annual cost to the customer was used for this analysis, which was TOU-D-4-9 in all cases with the exception of the single family all-electric cases in Climate Zone 14.
Table 5: IOU Utility Tariffs Applied Based on Climate Zone
Climate Zones Electric / Gas
Utility Electricity
(Time-of-use) Natural
Gas
1-5, 11-13, 16 PG&E E-TOU, Option B G1
5 PG&E / SoCalGas E-TOU, Option B GR
6, 8-10, 14, 15 SCE / SoCal Gas TOU-D-4-9 or TOU-D-PRIME
GR
7, 10, 14 SDG&E TOU-DR1 GR
Source: Utility websites, See Appendix B – Utility Tariff Details for details
on the tariffs applied.
Utility rates are assumed to escalate over time, using assumptions from research conducted by Energy and Environmental Economics (E3) in the 2019 study Residential Building Electrification in California study (Energy & Environmental Economics, 2019). Escalation of natural gas rates between 2019 and 2022 is based on the currently filed General Rate Cases (GRCs) for PG&E, SoCalGas and SDG&E. From 2023 through 2025, gas rates are assumed to escalate at 4% per year above inflation, which reflects historical rate increases between 2013 and 2018. Escalation of electricity rates from 2019 through 2025 is assumed to be 2% per year above inflation, based on electric utility estimates. After 2025, escalation rates for both natural gas and electric rates are assumed to drop to a more conservative 1% escalation per year above inflation for long-term rate trajectories beginning in 2026 through 2050. See Appendix B – Utility Tariff Details for additional details.
14 Net surplus compensation rates based on 1-year average February 2018 – January 2019.
Page 103 of 319

2019 Energy Efficiency Ordinance Cost-effectiveness Study
15 2019-08-01
2.5.2 TDV Lifecycle Cost
Cost-effectiveness was also assessed using the Energy Commission’s TDV LCC methodology. TDV is a normalized monetary format developed and used by the Energy Commission for comparing electricity and natural gas savings, and it considers the cost of electricity and natural gas consumed during different times of the day and year. The 2019 TDV values are based on long term discounted costs of 30 years for all residential measures. The CBECC-Res simulation software outputs are in terms of TDV kBTUs. The present value of the energy cost savings in dollars is calculated by multiplying the TDV kBTU savings by a net present value (NPV) factor, also developed by the Energy Commission. The NPV factor is $0.173/TDV kBtu for residential buildings.
Like the customer B/C ratio, a TDV B/C ratio value of one indicates the savings over the life of the measure are equivalent to the incremental cost of that measure. A value greater than one represents a positive return on investment. The ratio is calculated according to Equation 5.
Equation 5
𝑇𝐷𝑉 𝐵𝑒𝑛𝑒𝑓𝑖𝑡 − 𝑡𝑜 − 𝐶𝑜𝑠𝑡 𝑅𝑎𝑡𝑖𝑜 =𝑇𝐷𝑉 𝑒𝑛𝑒𝑟𝑔𝑦 𝑠𝑎𝑣𝑖𝑛𝑔𝑠 ∗ 𝑁𝑃𝑉 𝑓𝑎𝑐𝑡𝑜𝑟
𝑁𝑃𝑉 𝑜𝑓 𝑙𝑖𝑓𝑒𝑡𝑖𝑚𝑒 𝑖𝑛𝑐𝑟𝑒𝑚𝑒𝑛𝑡𝑎𝑙 𝑐𝑜𝑠𝑡
2.6 Electrification Evaluation
In addition to evaluating upgrades to mixed fuel and all-electric buildings independently that do not result in fuel switching, the Reach Code Team also analyzed the impact on construction costs, utility costs, and TDV when a builder specifies and installs electric appliances instead of the gas appliances typically found in a mixed fuel building. This analysis compared the code compliant mixed fuel prototype, which uses gas for space heating, water heating, cooking, and clothes drying, with the code compliant all-electric prototype. It also compared the all-electric Efficiency & PV Package with the code compliance mixed fuel prototype. In these cases, the relative costs between natural gas and electric appliances, differences between in-house electricity and gas infrastructure and the associated infrastructure costs for providing gas to the building were also included.
A variety of sources were reviewed when determining incremental costs. The sources are listed below.
• SMUD All-Electric Homes Electrification Case Study (EPRI, 2016)
• City of Palo Alto 2019 Title 24 Energy Reach Code Cost-effectiveness Analysis (TRC, 2018)
• Building Electrification Market Assessment (E3, 2019)
• Decarbonization of Heating Energy Use in California Buildings (Hopkins et al., 2018)
• Analysis of the Role of Gas for a Low-Carbon California Future (Navigant, 2008)
• Rulemaking No. 15-03-010 An Order Instituting Rulemaking to Identify Disadvantaged Communities in the San Joaquin Valley and Analyze Economically Feasible Options to Increase Access to Affordable Energy in Those Disadvantages Communities (California Public Utilities Commission, 2016)
• 2010-2012 WO017 Ex Ante Measure Cost Study: Final Report (Itron, 2014)
• Natural gas infrastructure costs provided by utility staff through the Reach Code subprogram
• Costs obtained from builders, contractors and developers
Incremental costs are presented in Table 6. Values in parentheses represent a lower cost or cost reduction in the electric option relative to mixed fuel. The costs from the available sources varied widely, making it difficult to develop narrow cost estimates for each component. For certain components data is provided with a low to high range as well as what were determined to be typical costs and ultimately applied in this analysis. Two sets of typical costs are presented, one which is applied in the On-Bill cost effectiveness methodology and another applied in the TDV methodology. Details of these differences are explained in the discussion of site gas infrastructure costs in the following pages.
Page 104 of 319

2019 Energy Efficiency Ordinance Cost-effectiveness Study
16 2019-08-01
Table 6: Incremental Costs – All-Electric Code Compliant Home Compared to a Mixed Fuel Code Compliant Home
Measure Incremental Cost (2020 PV$) Incremental Cost (2020 PV$)
Multifamily1 (Per Dwelling Unit) Single Family1
Low High Typical
(On-Bill) Typical (TDV)
Low High Typical (On-Bill)
Typical (TDV)
Heat Pump vs Gas Furnace/Split AC ($2,770) $620 ($221)
Same as Single Family
Heat Pump Water Heater vs Gas Tankless
($1,120) $1,120 $0
Electric vs Gas Clothes Dryer2 ($428) $820 $0
Electric vs Gas Cooking2 $0 $1,800 $0
Electric Service Upgrade $200 $800 $600 $150 $600 $600
In-House Gas Infrastructure ($1,670) ($550) ($800) ($600) ($150) ($600)
Site Gas Infrastructure ($25,000) ($900) ($5,750) ($11,836) ($16,250) ($310) ($3,140) ($6,463)
Total First Cost ($30,788) $3,710 ($6,171) ($12,257) ($20,918) $4,500 ($3,361) ($6,684)
Present Value of Equipment Replacement Cost $1,266 $1,266
Lifetime Cost Including Replacement & Financing of First Cost
($5,349) ($11,872)
($2,337) ($5,899)
1Low and high costs represent the potential range of costs and typical represents the costs used in this analysis and determined to be most representative of the conditions described in this report. Two sets of typical costs are presented, one which is applied in the On-Bill cost effectiveness methodology and another applied in the TDV methodology. 2Typical costs assume electric resistance technology. The high range represents higher end induction cooktops and heat pump clothes dryers. Lower cost induction cooktops are available.
Typical incremental costs for switching from a mixed fuel design to an all-electric design are based on the following assumptions:
Appliances: The Reach Code Team determined that the typical first installed cost for electric appliances is very similar to that for natural gas appliances. This was based on information provided by HVAC contractors, plumbers and builders as well as a review of other studies. After review of various sources, the Reach Code Team concluded that the cost difference between gas and electric resistance options for clothes dryers and stoves is negligible and that the lifetimes of the two technologies are also similar.
HVAC: Typical HVAC incremental costs were based on the City of Palo Alto 2019 Title 24 Energy Reach Code Cost-effectiveness Analysis (TRC, 2018) which assumes approximately $200 first cost savings for the heat pump relative to the gas furnace and air conditioner. Table 6 also includes the present value of the incremental replacement costs for the heat pump based on a 15-year lifetime and a 20-year lifetime for the gas furnace in the mixed fuel home.
DHW: Typical costs for the water heating system were based on equivalent installed first costs for the HPWH and tankless gas water heater. This accounts for slightly higher equipment cost but lower installation labor due to the elimination of the gas flue. Incremental replacement costs for the HPWH are based on a 15-year lifetime and a 20-year lifetime for the tankless water heater.
For multifamily, less data was available and therefore a range of low and high costs is not provided. The typical first cost for multifamily similarly is expected to be close to the same for the mixed fuel and all-electric designs. However, there are additional considerations with multifamily such as greater complexity for venting of natural gas appliances as well as for locating the HPWH within the conditioned space (all climates except Climate Zones 1, 3, and 5, see Table 2) that may impact the total costs.
Electric service upgrade: The study assumes an incremental cost to run 220V service to each appliance of $200 per appliance for single family homes and $150 per appliance per multifamily apartment based on cost estimates from builders and contractors. The Reach Code Team reviewed production builder utility plans for
Page 105 of 319

2019 Energy Efficiency Ordinance Cost-effectiveness Study
17 2019-08-01
mixed-fuel homes and consulted with contractors to estimate which electricity and/or natural gas services are usually provided to the dryer and oven. Typical practice varied, with some builders providing both gas and electric service to both appliances, others providing both services to only one of the appliances, and some only providing gas. For this study, the Reach Code Team determined that for single family homes the typical cost is best qualified by the practice of providing 220V service and gas to either the dryer and the oven and only gas service to the other. For multifamily buildings it’s assumed that only gas is provided to the dryer and oven in the mixed fuel home.
It is assumed that no upgrades to the electrical panel are required and that a 200 Amp panel is typically installed for both mixed fuel and all-electric new construction homes. There are no incremental electrical site infrastructure requirements.
In-house gas infrastructure (from meter to appliances): Installation cost to run a gas line from the meter to the appliance location is $200 per appliance for single family and $150 per appliance per multifamily apartment based on cost estimates from builders and contractors. The cost estimate includes providing gas to the water heater, furnace, dryer and cooktop.
Site gas infrastructure: The cost-effective analysis components with the highest degree of variability are the costs for on-site gas infrastructure. These costs can be project dependent and may be significantly impacted by such factors as utility territory, site characteristics, distance to the nearest gas main and main location, joint trenching, whether work is conducted by the utility or a private contractor, and number of dwelling units per development. All gas utilities participating in this study were solicited for cost information. The typical infrastructure costs for single family homes presented in Table 6 are based on cost data provided by PG&E and reflect those for a new subdivision in an undeveloped area requiring the installation of natural gas infrastructure, including a main line. Infrastructure costs for infill development can also be highly variable and may be higher than in an undeveloped area. The additional costs associated with disruption of existing roads, sidewalks, and other structures can be significant. Total typical costs in Table 6 assume $10,000 for extension of a gas main, $1,686 for a service lateral, and $150 for the meter.
Utility Gas Main Extensions rules15 specify that the developer has the option to only pay 50% of the total cost for a main extension after subtraction of allowances for installation of gas appliances. This 50% refund and the appliance allowance deductions are accounted for in the site gas infrastructure costs under the On-Bill cost-effectiveness methodology. The net costs to the utility after partial reimbursement from the developer are included in utility ratebase and recovered via rates to all customers. The total cost of $5,750 presented in Table 6 reflects a 50% refund on the $10,000 extension and appliance deductions of $1,086 for a furnace, water heater, cooktop, and dryer. Under the On-Bill methodology this analysis assumes this developer option will remain available through 2022 and that the cost savings are passed along to the customer.
The 50% refund and appliance deductions were not applied to the site gas infrastructure costs under the TDV cost-effectiveness methodology based on input received from the Energy Commission and agreement from the Reach Code technical advisory team that the approach is appropriate. TDV cost savings impacts extend beyond the customer and account for societal impacts of energy use. Accounting for the full cost of the infrastructure upgrades was determined to be justified when evaluating under the TDV methodology.
15 PG&E Rule 15: https://www.pge.com/tariffs/tm2/pdf/GAS_RULES_15.pdf
SoCalGas Rule 20: https://www.socalgas.com/regulatory/tariffs/tm2/pdf/20.pdf
SDG&E Rule 15: http://regarchive.sdge.com/tm2/pdf/GAS_GAS-RULES_GRULE15.pdf
Page 106 of 319

2019 Energy Efficiency Ordinance Cost-effectiveness Study
18 2019-08-01
Less information was available for the costs associated with gas infrastructure for low-rise multifamily development. The typical cost in Table 6 for the On-Bill methodology is based on TRC’s City of Palo Alto 2019 Title 24 Energy Reach Code Cost-effectiveness Analysis (TRC, 2018). These costs, provided by the City of Palo Alto, are approximately $25,100 for an 8-unit new construction building and reflect connection to an existing main for infill development. Specific costs include plan review, connection charges, meter and manifold, plumbing distribution, and street cut fees. While these costs are specifically based on infill development and from one municipal utility, the estimates are less than those provided by PG&E reflecting the average cost differences charged to the developer between single family and multifamily in an undeveloped area (after accounting for deductions per the Gas Main Extensions rule). To convert costs charged to the developer to account for the full infrastructure upgrade cost (costs applied in the TDV methodology analysis), a factor of 2.0616 was calculated based on the single family analysis. This same factor was applied to the multifamily cost of $3,140 to arrive at $6,463 (see Table 6).
2.7 Greenhouse Gas Emissions
Equivalent CO2 emission savings were calculated based on outputs from the CBECC-Res simulation software. Electricity emissions vary by region and by hour of the year. CBECC-Res applies two distinct hourly profiles, one for Climate Zones 1 through 5 and 11 through 13 and another for Climate Zones 6 through 10 and 14 through 16. For natural gas a fixed factor of 0.005307 metric tons/therm is used. To compare the mixed fuel and all-electric cases side-by-side, greenhouse gas (GHG) emissions are presented as CO2-equivalent emissions per square foot of conditioned floor area.
3 Results The primary objective of the evaluation is to identify cost-effective, non-preempted performance targets for both single family and low-rise multifamily prototypes, under both mixed fuel and all-electric cases, to support the design of local ordinances requiring new low-rise residential buildings to exceed the minimum state requirements. The packages presented are representative examples of designs and measures that can be used to meet the requirements. In practice, a builder can use any combination of non-preempted or preempted compliant measures to meet the requirements.
This analysis covered all sixteen climate zones and evaluated two efficiency packages, including a non-preempted package and a preempted package that includes upgrades to federally regulated equipment, an Efficiency & PV Package for the all-electric scenario only, and an Efficiency & PV/Battery Package. For the efficiency-only packages, measures were refined to ensure that the non-preempted package was cost-effective based on one of the two metrics applied in this study, TDV or On-Bill. The preempted equipment package, which the Reach Code Team considers to be a package of upgrades most reflective of what builders commonly apply to exceed code requirements, was designed to be cost-effective based on the On-Bill cost-effectiveness approach.
Results are presented as EDR Margin instead of compliance margin. EDR is the metric used to determine code compliance in the 2019 cycle. Target EDR Margin is based on taking the calculated EDR Margin for the case and rounding down to the next half of a whole number. Target EDR Margin for the Efficiency Package are defined based on the lower of the EDR Margin of the non-preempted package and the equipment, preempted package. For example, if for a particular case the cost-effective non-preempted package has an EDR Margin of 3 and the preempted package an EDR Margin of 4, the Target EDR Margin is set at 3.
16 This factor includes the elimination of the 50% refund for the main extension and adding back in the appliance allowance deductions.
Page 107 of 319

2019 Energy Efficiency Ordinance Cost-effectiveness Study
19 2019-08-01
For a package to qualify, a minimum EDR Margin of 0.5 was required. This is to say that a package that only achieved an EDR Margin of 0.4, for example, was not considered. An EDR Margin less than 0.5 generally corresponds to a compliance margin lower than 5% and was considered too small to ensure repeatable results. In certain cases, the Reach Code Team did not identify a cost-effective package that achieved the minimum EDR Margin of 0.5.
Although some of the efficiency measures evaluated were not cost-effective and were eliminated, the following measures are included in at least one package:
• Reduced infiltration
• Improved fenestration
• Improved cool roofs
• High performance attics
• Slab insulation
• Reduced duct leakage
• Verified low leakage ducts in conditioned space
• Low pressure-drop distribution system
• Compact hot water distribution system, basic and expanded
• High efficiency furnace, air conditioner & heat pump (preempted)
• High efficiency tankless water heater & heat pump water heater (preempted)
3.1 PV and Battery System Sizing
The approach to determining the size of the PV and battery systems varied based on each package and the source fuel. Table 7 describes the PV and battery sizing approaches applied to each of the four packages. For the Efficiency Non-preempted and Efficiency – Equipment, Preempted packages a different method was applied to each the two fuel scenarios. In all mixed fuel cases, the PV was sized to offset 100% of the estimated electrical load and any electricity savings from efficiency measures were traded off with a smaller PV system. Not downsizing the PV system after adding efficiency measures runs the risk of producing more electricity than is consumed, reducing cost-effectiveness and violating NEM rules. While the impact of this in most cases is minor, analysis confirmed that cost-effectiveness improved when reducing the system size to offset 100% of the electricity usage as opposed to keeping the PV system the same size as the Standard Design.
In the all-electric Efficiency cases, the PV system size was left to match the Standard Design (Std Design PV), and the inclusion of energy efficiency measures was not traded off with a reduced capacity PV system. Because the PV system is sized to meet the electricity load of a mixed fuel home, it is cost-effective to keep the PV system the same size and offset a greater percentage of the electrical load.
For the Efficiency & PV case on the all-electric home, the Reach Code Team evaluated PV system sizing to offset 100%, 90% and 80% of the total calculated electricity use. Of these three, sizing to 90% proved to be the most cost-effective based on customer utility bills. This is a result of the impact of the annual minimum bill which is around $120 across all the utilities. The “sweet spot” is a PV system that reduces electricity bills just enough to match the annual minimum bill; increasing the PV size beyond this adds first cost but does not result in utility bill savings.
Page 108 of 319

2019 Energy Efficiency Ordinance Cost-effectiveness Study
20 2019-08-01
Table 7: PV & Battery Sizing Details by Package Type Package Mixed Fuel All-Electric
Efficiency (Envelope & Equipment) PV Scaled @ 100% electricity Std Design PV
Efficiency & PV n/a PV Scaled @ 90%
Efficiency & PV/Battery PV Scaled @ 100% electricity
5kWh / SF home 2.75kWh/ MF apt
PV Scaled @ 100% 5kWh / SF home 2.75kWh/ MF apt
A sensitivity analysis was conducted to determine the appropriate battery and PV capacity for the Efficiency & PV/Battery Packages using the 1-story 2,100 square foot prototype in Climate Zone 12. Results are shown in Figure 2. The current version of CBECC-Res requires a minimum battery size of 5 kWh to qualify for the self-utilization credit. CBECC-Res allows for PV oversizing up to 160% of the building’s estimated electricity load when battery storage systems are installed; however, the Reach Code Team considered this high, potentially problematic from a grid perspective, and likely not acceptable to the utilities or customers. The Reach Code Team compared cost-effectiveness of 5kWh and 7.5kWh battery systems as well as of PV systems sized to offset 90%, 100%, or 120% of the estimated electrical load.
Results show that from an on-bill perspective a smaller battery size is more cost-effective. The sensitivity analysis also showed that increasing the PV capacity from 90% to 120% of the electricity use reduced cost-effectiveness. From the TDV perspective there was little difference in results across all the scenarios, with the larger battery size being marginally more cost-effective. Based on these results, the Reach Code Team applied to the Efficiency & PV/Battery Package a 5kWh battery system for single family homes with PV sized to offset 100% of the electricity load. Even though PV scaled to 90% was the most cost-effective, sizing was increased to 100% to evaluate greater generation beyond the Efficiency & PV Package and to achieve zero net electricity. These results also show that in isolation, the inclusion of a battery system reduces cost-effectiveness compared to the same size PV system without batteries.
For multifamily buildings the battery capacity was scaled to reflect the average ratio of battery size to PV system capacity (kWh/kW) for the single family Efficiency & PV Package. This resulted in a 22kWh battery for the multifamily building, or 2.75kWh per apartment.
Figure 2: B/C ratio comparison for PV and battery sizing
On-Bill = 1.9 (TDV = 1.84)
On-Bill = 1.49 (TDV = 1.9)
On-Bill = 1.37 (TDV = 1.88)
On-Bill = 1.35 (TDV = 1.91)
On-Bill = 1.23 (TDV = 1.9)
On-Bill = 1.14 (TDV = 1.87)
On-Bill = 1.04 (TDV = 1.88)
Page 109 of 319

2019 Energy Efficiency Ordinance Cost-effectiveness Study
21 2019-08-01
3.2 Single Family Results
Table 8 through Table 10 contain cost effectiveness findings for the single family packages. Table 8 summarizes the package costs for all of the mixed fuel and all-electric efficiency, PV and battery packages. The mixed fuel results are evaluated and presented relative to a mixed fuel code compliant basecase while the all-electric results are relative to an all-electric code compliant basecase.
Table 9 and Table 10 present the B/C ratios for all the single family packages according to both the On-Bill and TDV methodologies for the mixed fuel and the all-electric cases, respectively. Results are cost-effective based on TDV for all cases except for Climate Zone 7 where no cost-effective combination of non-preempted efficiency measures was found that met the minimum 0.5 EDR Margin threshold. Cases where the B/C ratio is indicated as “>1” refer to instances where there are incremental cost savings in addition to annual utility bill savings. In these cases, there is no cost associated with the upgrade and benefits are realized immediately.
Figure 3 presents a comparison of Total EDRs for single family buildings and Figure 4 presents the EDR Margin results. Each graph compares the mixed fuel and all-electric cases as well as the various packages. The EDR Margin for the Efficiency Package for most climates is between 1.0 and 5.5 for mixed fuel cases and slightly higher, between 1.5 and 6.5, for the all-electric design. No cost-effective mixed fuel or all-electric non-preempted Efficiency package was found Climate Zone 7.
For the mixed fuel case, the Efficiency & PV/Battery Package increased the EDR Margin to values between 7.0 and 10.5. Because of the limitations on oversizing PV systems to offset natural gas use it is not feasible to achieve higher EDR Margins by increasing PV system capacity.
For the all-electric case, the Efficiency & PV Package resulted in EDR Margins of 11.0 to 19.0 for most climates; adding a battery system increased the EDR Margin by an additional 7 to 13 points. Climate zones 1 and 16, which have high heating loads, have much higher EDR Margins for the Efficiency & PV package (26.5-31.0). The Standard Design PV, which is what is applied in the all-electric Efficiency Package, is not sized to offset any of the heating load. When the PV system is sized to offset 90% of the total electricity use, the increase is substantial as a result. In contrast, in Climate Zone 15 the Standard Design PV system is already sized to cover the cooling electricity load, which represents 40% of whole building electricity use. Therefore, increasing the PV size to offset 90% of the electric load in this climate only results in adding approximately 120 Watts of PV capacity and subsequently a negligible impact on the EDR.
Additional results details can be found in Appendix C – Single Family Detailed Results with summaries of measures included in each of the packages in Appendix D – Single Family Measure Summary. A summary of results by climate zone is presented in Appendix G – Results by Climate Zone.
Page 110 of 319

2019 Energy Efficiency Ordinance Cost-effectiveness Study
22 2019-08-01
Table 8: Single Family Package Lifetime Incremental Costs
Climate Zone
Mixed Fuel All-Electric
Non-Preempted Equipment - Preempted
Efficiency & PV/Battery
Non-Preempted Equipment - Preempted
Efficiency & PV Efficiency & PV/Battery
CZ01 +$1,355 +$1,280 +$5,311 +$7,642 +$2,108 +$18,192 +$24,770
CZ02 +$1,504 +$724 +$5,393 +$3,943 +$2,108 +$12,106 +$18,132
CZ03 +$1,552 +$1,448 +$5,438 +$1,519 +$2,108 +$8,517 +$14,380
CZ04 +$1,556 +$758 +$5,434 +$1,519 +$2,108 +$8,786 +$14,664
CZ05 +$1,571 +$772 +$5,433 +$1,519 +$2,108 +$8,307 +$14,047
CZ06 +$1,003 +$581 +$4,889 +$926 +$846 +$6,341 +$12,036
CZ07 n/a +$606 +$4,028 n/a +$846 +$4,436 +$9,936
CZ08 +$581 +$586 +$4,466 +$926 +$412 +$5,373 +$11,016
CZ09 +$912 +$574 +$4,785 +$1,180 +$846 +$5,778 +$11,454
CZ10 +$1,648 +$593 +$5,522 +$1,773 +$949 +$6,405 +$12,129
CZ11 +$3,143 +$1,222 +$7,026 +$3,735 +$2,108 +$10,827 +$17,077
CZ12 +$1,679 +$654 +$5,568 +$3,735 +$2,108 +$11,520 +$17,586
CZ13 +$3,060 +$611 +$6,954 +$4,154 +$2,108 +$10,532 +$16,806
CZ14 +$1,662 +$799 +$5,526 +$4,154 +$2,108 +$10,459 +$16,394
CZ15 +$2,179 -($936) +$6,043 +$4,612 +$2,108 +$5,085 +$11,382
CZ16 +$3,542 +$2,441 +$7,399 +$5,731 +$2,108 +$16,582 +$22,838
Page 111 of 319

2019 Energy Efficiency Ordinance Cost-effectiveness Study
23 2019-08-01
Table 9: Single Family Package Cost-Effectiveness Results for the Mixed Fuel Case 1,2
CZ Utility
Efficiency Efficiency & PV/Battery
Non-Preempted Equipment - Preempted Target Efficiency
EDR Margin
Target Total EDR
Margin
Efficiency EDR
Margin
On-Bill B/C
Ratio
TDV B/C
Ratio
Efficiency EDR
Margin
On-Bill B/C
Ratio
TDV B/C
Ratio
Total EDR
Margin
On-Bill B/C
Ratio
TDV B/C
Ratio
01 PG&E 5.3 3.4 2.8 6.9 4.9 4.1 5.0 10.6 0.9 1.6 10.5
02 PG&E 3.3 1.6 1.7 3.3 3.8 3.6 3.0 10.1 0.5 1.6 10.0
03 PG&E 3.0 1.3 1.3 4.1 1.9 2.0 2.5 10.0 0.4 1.4 10.0
04 PG&E 2.5 0.9 1.2 2.7 2.4 2.7 2.5 10.1 0.3 1.5 10.0
05 PG&E 2.7 1.1 1.2 2.6 2.3 2.5 2.5 9.4 0.4 1.3 9.0
05 PG&E/SoCalGas 2.7 0.9 1.2 2.6 2.0 2.5 2.5 9.4 0.3 1.3 9.0
06 SCE/SoCalGas 2.0 0.7 1.2 2.0 1.6 2.0 1.5 9.8 0.8 1.3 9.5
07 SDG&E 0.0 - - 1.5 1.5 1.4 0.0 9.2 0.1 1.3 9.0
08 SCE/SoCalGas 1.3 0.6 1.4 1.6 1.3 1.8 1.0 8.4 0.9 1.3 8.0
09 SCE/SoCalGas 2.6 0.7 2.0 2.9 1.8 3.7 2.5 8.8 1.0 1.5 8.5
10 SCE/SoCalGas 3.2 0.6 1.3 3.2 2.0 3.8 3.0 9.6 1.0 1.5 9.5
10 SDG&E 3.2 0.8 1.3 3.2 2.6 3.8 3.0 9.6 0.6 1.5 9.5
11 PG&E 4.3 0.8 1.2 5.1 2.5 3.7 4.0 9.2 0.4 1.5 9.0
12 PG&E 3.5 1.2 1.8 3.4 3.3 4.6 3.0 9.6 0.4 1.7 9.5
13 PG&E 4.6 0.8 1.3 5.8 5.3 8.4 4.5 9.7 0.4 1.6 9.5
14 SCE/SoCalGas 5.0 1.6 2.5 5.8 4.0 6.1 4.5 9.0 1.3 1.7 9.0
14 SDG&E 5.0 1.9 2.5 5.8 4.9 6.1 4.5 9.0 1.2 1.7 9.0
15 SCE/SoCalGas 4.8 1.0 1.6 5.0 >1 >1 4.5 7.1 1.1 1.5 7.0
16 PG&E 5.4 1.6 1.5 6.2 2.2 2.2 5.0 10.5 0.9 1.4 10.5 1“>1” indicates cases where there are both first cost savings and annual utility bill savings. 2Information about the measures included for each climate zone are described in Appendix D – Single Family Measure Summary.
Page 112 of 319

2019 Energy Efficiency Ordinance Cost-effectiveness Study
24 2019-08-01
Table 10: Single Family Package Cost-Effectiveness Results for the All-Electric Case1,2
CZ Utility
Efficiency Efficiency & PV Efficiency & PV/Battery
Non-Preempted Equipment - Preempted Target Efficiency
EDR Margin
Target Total EDR
Margin
Target Total EDR
Margin
Efficiency EDR
Margin
On-Bill B/C
Ratio
TDV B/C
Ratio
Efficiency EDR
Margin
On-Bill B/C
Ratio
TDV B/C
Ratio
Total EDR
Margin
On-Bill B/C
Ratio
TDV B/C
Ratio
Total EDR
Margin
On-Bill B/C
Ratio
TDV B/C
Ratio
01 PG&E 15.2 1.8 1.7 6.9 2.9 2.7 6.5 31.4 1.8 1.5 31.0 41.2 1.4 1.4 41.0
02 PG&E 4.9 1.2 1.1 5.1 2.3 2.1 4.5 19.4 1.8 1.4 19.0 30.1 1.4 1.4 30.0
03 PG&E 4.7 2.6 2.4 4.4 1.8 1.6 4.0 18.5 2.2 1.7 18.0 29.3 1.5 1.6 29.0
04 PG&E 3.4 1.9 1.8 3.9 1.5 1.5 3.0 17.2 2.1 1.6 17.0 28.6 1.5 1.6 28.5
05 PG&E 4.4 2.6 2.3 4.4 1.9 1.7 4.0 18.2 2.3 1.8 18.0 28.7 1.6 1.6 28.5
05 PG&E/SoCalGas 4.4 2.6 2.3 4.4 1.9 1.7 4.0 18.2 2.3 1.8 18.0 28.7 1.6 1.6 28.5
06 SCE/SoCalGas 2.0 1.3 1.4 2.9 2.2 2.3 2.0 14.3 1.2 1.5 14.0 26.1 1.2 1.4 26.0
07 SDG&E 0.0 - - 2.2 1.6 1.7 0.0 11.3 1.9 1.5 11.0 24.2 1.3 1.5 24.0
08 SCE/SoCalGas 1.6 0.6 1.2 1.8 2.8 3.0 1.5 10.9 1.0 1.5 10.5 21.6 1.1 1.4 21.5
09 SCE/SoCalGas 2.8 0.8 2.0 3.3 2.1 3.2 2.5 11.5 1.1 1.6 11.5 21.3 1.1 1.5 21.0
10 SCE/SoCalGas 3.1 0.9 1.5 3.4 2.3 3.2 3.0 11.1 1.1 1.5 11.0 21.2 1.1 1.5 21.0
10 SDG&E 3.1 1.1 1.5 3.4 2.6 3.2 3.0 11.1 1.7 1.5 11.0 21.2 1.4 1.5 21.0
11 PG&E 4.6 1.2 1.5 5.9 3.0 3.3 4.5 14.2 1.8 1.6 14.0 23.2 1.5 1.6 23.0
12 PG&E 3.8 0.8 1.1 5.1 2.0 2.5 3.5 15.7 1.7 1.4 15.5 25.4 1.3 1.5 25.0
13 PG&E 5.1 1.1 1.4 6.0 2.9 3.3 5.0 13.4 1.7 1.5 13.0 22.5 1.4 1.5 22.0
14 SCE/SoCalGas 5.6 1.0 1.5 6.0 2.3 3.1 5.5 15.5 1.2 1.6 15.5 23.9 1.4 1.6 23.5
14 SDG&E 5.6 1.3 1.5 6.0 2.9 3.1 5.5 15.5 1.8 1.6 15.5 23.9 1.7 1.6 23.5 15 SCE/SoCalGas 5.6 1.1 1.6 7.3 3.3 4.5 5.5 6.2 1.1 1.6 6.0 13.5 1.2 1.5 13.0
16 PG&E 9.7 1.7 1.7 4.9 2.4 2.3 4.5 27.0 2.1 1.6 26.5 35.4 1.7 1.5 35.0 1“>1” indicates cases where there are both first cost savings and annual utility bill savings. 2Information about the measures included for each climate zone are described in Appendix D – Single Family Measure Summary
Page 113 of 319

2019 Energy Efficiency Ordinance Cost-effectiveness Study
25 2019-08-01
Figure 3: Single family Total EDR comparison
Figure 4: Single family EDR Margin comparison (based on Efficiency EDR Margin for the Efficiency packages and the Total EDR Margin for the Efficiency & PV and Efficiency &
PV/Battery packages)
Page 114 of 319

2019 Energy Efficiency Ordinance Cost-effectiveness Study
26 2019-08-01
3.2.1 GHG Emission Reductions
Figure 5 compares annual GHG emissions for both mixed fuel and all-electric single family 2019 code compliant cases with Efficiency, Efficiency & PV and Efficiency & PV/Battery packages. GHG emissions vary by climate but are consistently higher in mixed fuel cases than all-electric. Standard Design mixed fuel emissions range from 1.3 (CZ 7) to 3.3 (CZ 16) lbs CO2e/square foot of floor area, where all-electric Standard Design emissions range from 0.7 to 1.7 lbs CO2e/ ft2. Adding efficiency, PV and batteries to the mixed fuel code compliant prototype reduces GHG emissions by 20% on average to between 1.0 and 1.8 lbs CO2e/ft2, with the exception of Climate Zones 1 and 16. Adding efficiency, PV and batteries to the all-electric code compliant prototype reduces annual GHG emissions by 65% on average to 0.8 lbs CO2e/ft2 or less. None of the cases completely eliminate GHG emissions. Because of the time value of emissions calculation for electricity in CBECC-Res, there is always some amount of GHG impacts with using electricity from the grid.
Figure 5: Single family greenhouse gas emissions comparison
3.3 Multifamily Results
Table 11 through Table 13 contain cost effectiveness findings for the multifamily packages. Table 11 summarizes the package costs for all the mixed fuel and all-electric efficiency, PV and battery packages.
Table 12 and Table 13 present the B/C ratios for all the packages according to both the On-Bill and TDV methodologies for the mixed fuel and the all-electric cases, respectively. All the packages are cost-effective based on TDV except Climate Zone 3 for the all-electric cases where no cost-effective combination of non-preempted efficiency measures was found that met the minimum 0.5 EDR Margin threshold. Cases where the B/C ratio is indicated as “>1” refer to instances where there are incremental cost savings in addition to annual utility bill savings. In these cases, there is no cost associated with this upgrade and benefits are realized immediately.
It is generally more challenging to achieve equivalent savings targets cost-effectively for the multifamily cases than for the single family cases. With less exterior surface area per floor area the impact of envelope measures
Page 115 of 319

2019 Energy Efficiency Ordinance Cost-effectiveness Study
27 2019-08-01
is diminished in multifamily buildings. Ducts are already assumed to be within conditioned space and therefore only one of the duct measures found to be cost-effective in single family homes can be applied.
Figure 6 presents a comparison of Total EDRs for the multifamily cases and Figure 7 presents the EDR Margin results. Each graph compares the mixed fuel and all-electric cases as well as the various packages. Cost-effective efficiency packages were found for all mixed fuel cases. The Target EDR Margins for the mixed fuel Efficiency Package are 0.5 for Climate Zones 3, 5 and 7, between 1.0 and 2.5 for Climate Zones 1, 2, 4, 6, 8 through 12 and 16, and between 3.0 and 4.0 in Climate Zones 13 through 15. For the all-electric case, no cost-effective non-preempted efficiency packages were found in Climate Zone 3. The Target EDR Margins are between 0.5 and 2.5 for Climate Zones 2, 4 through 10 and 12, and between 3.0 and 4.0 in Climate Zones 1, 11, and 13 through 16.
For the mixed fuel case, the Efficiency & PV/Battery Package results in an EDR Margin of between 8.5 and 11.5 across all climate zones. Most of these packages were not found to be cost-effective based on utility bill savings alone, but they all are cost-effective based on TDV energy savings. For the all-electric case, the Efficiency & PV Package resulted in EDR Margins of 10.5 to 17.5 for most climates; adding a battery system increased the EDR Margin by an additional 10 to 15 points. Climate zones 1 and 16, which have high heating loads, have much higher EDR Margins for the Efficiency & PV package (19.5-22.5). The Standard Design PV, which is what is applied in the Efficiency Package, is not sized to offset any of the heating load. When the PV system is sized to offset 90% of the total electricity use, the increase is substantial as a result. In Climate Zone 15 the Standard Design PV system is already sized to cover the cooling electricity load, which represents 30% of whole building electricity use. Therefore, increasing the PV size to offset 90% of the electric load in this climate only results in adding approximately 240 Watts of PV capacity per apartment and subsequently a much smaller impact on the EDR than in other climate zones. Because of the limitations on oversizing PV systems to offset natural gas use it is not feasible to achieve comparable EDR Margins for the mixed fuel case as in the all-electric case.
Additional results details can be found in Appendix E – Multifamily Detailed Results with summaries of measures included in each of the packages in Appendix F – Multifamily Measure Summary. A summary of results by climate zone is presented in Appendix G – Results by Climate Zone.
Page 116 of 319

2019 Energy Efficiency Ordinance Cost-effectiveness Study
28 2019-08-01
Table 11: Multifamily Package Incremental Costs per Dwelling Unit
Climate Zone
Mixed Fuel All-Electric
Non-Preempted
Equipment - Preempted
Efficiency & PV/Battery
Non-Preempted
Equipment - Preempted
Efficiency & PV
Efficiency & PV/Battery
CZ01 +$960 +$507 +$3,094 +$949 +$795 +$5,538 +$8,919
CZ02 +$309 +$497 +$2,413 +$361 +$795 +$3,711 +$6,833
CZ03 +$175 +$403 +$2,279 n/a +$795 +$3,272 +$6,344
CZ04 +$329 +$351 +$2,429 +$361 +$795 +$3,158 +$6,201
CZ05 +$180 +$358 +$2,273 +$247 +$795 +$3,293 +$6,314
CZ06 +$190 +$213 +$2,294 +$231 +$361 +$2,580 +$5,590
CZ07 +$90 +$366 +$2,188 +$202 +$361 +$2,261 +$5,203
CZ08 +$250 +$213 +$2,353 +$231 +$361 +$2,240 +$5,249
CZ09 +$136 +$274 +$2,234 +$231 +$361 +$2,232 +$5,236
CZ10 +$278 +$250 +$2,376 +$361 +$361 +$2,371 +$5,395
CZ11 +$850 +$317 +$2,950 +$1,011 +$795 +$3,601 +$6,759
CZ12 +$291 +$434 +$2,394 +$1,011 +$795 +$3,835 +$6,943
CZ13 +$831 +$290 +$2,936 +$1,011 +$795 +$3,462 +$6,650
CZ14 +$874 +$347 +$2,957 +$1,011 +$795 +$3,356 +$6,380
CZ15 +$510 -($157) +$2,604 +$1,011 +$1,954 +$1,826 +$5,020
CZ16 +$937 +$453 +$3,028 +$843 +$795 +$4,423 +$7,533
Page 117 of 319
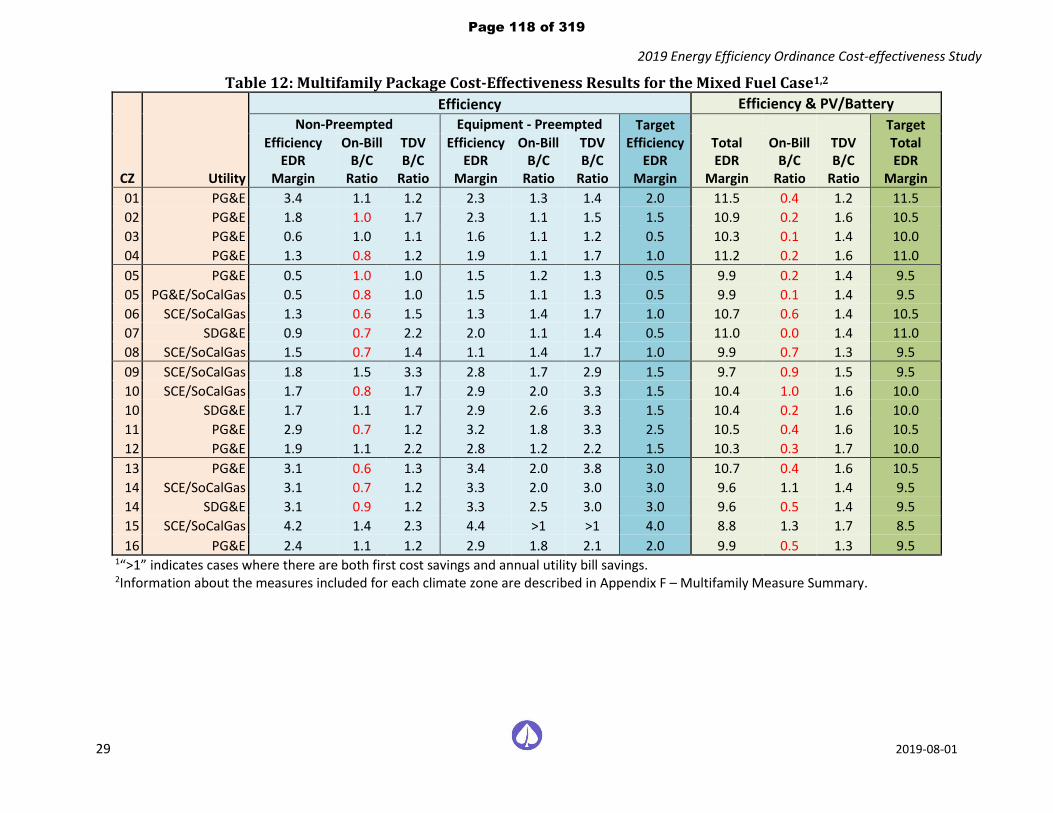
2019 Energy Efficiency Ordinance Cost-effectiveness Study
29 2019-08-01
Table 12: Multifamily Package Cost-Effectiveness Results for the Mixed Fuel Case1,2
CZ Utility
Efficiency Efficiency & PV/Battery
Non-Preempted Equipment - Preempted Target Efficiency
EDR Margin
Target Total EDR
Margin
Efficiency EDR
Margin
On-Bill B/C
Ratio
TDV B/C
Ratio
Efficiency EDR
Margin
On-Bill B/C
Ratio
TDV B/C
Ratio
Total EDR
Margin
On-Bill B/C
Ratio
TDV B/C
Ratio
01 PG&E 3.4 1.1 1.2 2.3 1.3 1.4 2.0 11.5 0.4 1.2 11.5
02 PG&E 1.8 1.0 1.7 2.3 1.1 1.5 1.5 10.9 0.2 1.6 10.5
03 PG&E 0.6 1.0 1.1 1.6 1.1 1.2 0.5 10.3 0.1 1.4 10.0
04 PG&E 1.3 0.8 1.2 1.9 1.1 1.7 1.0 11.2 0.2 1.6 11.0
05 PG&E 0.5 1.0 1.0 1.5 1.2 1.3 0.5 9.9 0.2 1.4 9.5
05 PG&E/SoCalGas 0.5 0.8 1.0 1.5 1.1 1.3 0.5 9.9 0.1 1.4 9.5
06 SCE/SoCalGas 1.3 0.6 1.5 1.3 1.4 1.7 1.0 10.7 0.6 1.4 10.5
07 SDG&E 0.9 0.7 2.2 2.0 1.1 1.4 0.5 11.0 0.0 1.4 11.0
08 SCE/SoCalGas 1.5 0.7 1.4 1.1 1.4 1.7 1.0 9.9 0.7 1.3 9.5
09 SCE/SoCalGas 1.8 1.5 3.3 2.8 1.7 2.9 1.5 9.7 0.9 1.5 9.5
10 SCE/SoCalGas 1.7 0.8 1.7 2.9 2.0 3.3 1.5 10.4 1.0 1.6 10.0
10 SDG&E 1.7 1.1 1.7 2.9 2.6 3.3 1.5 10.4 0.2 1.6 10.0
11 PG&E 2.9 0.7 1.2 3.2 1.8 3.3 2.5 10.5 0.4 1.6 10.5
12 PG&E 1.9 1.1 2.2 2.8 1.2 2.2 1.5 10.3 0.3 1.7 10.0
13 PG&E 3.1 0.6 1.3 3.4 2.0 3.8 3.0 10.7 0.4 1.6 10.5
14 SCE/SoCalGas 3.1 0.7 1.2 3.3 2.0 3.0 3.0 9.6 1.1 1.4 9.5
14 SDG&E 3.1 0.9 1.2 3.3 2.5 3.0 3.0 9.6 0.5 1.4 9.5
15 SCE/SoCalGas 4.2 1.4 2.3 4.4 >1 >1 4.0 8.8 1.3 1.7 8.5
16 PG&E 2.4 1.1 1.2 2.9 1.8 2.1 2.0 9.9 0.5 1.3 9.5 1“>1” indicates cases where there are both first cost savings and annual utility bill savings. 2Information about the measures included for each climate zone are described in Appendix F – Multifamily Measure Summary.
Page 118 of 319

2019 Energy Efficiency Ordinance Cost-effectiveness Study
30 2019-08-01
Table 13: Multifamily Package Cost-effectiveness Results for the All-Electric Case1,2
CZ Utility
Efficiency Efficiency & PV Efficiency & PV/Battery
Non-Preempted Equipment - Preempted
Efficiency EDR
Margin
On-Bill B/C
Ratio
TDV B/C
Ratio
Efficiency EDR
Margin On-Bill
B/C Ratio
TDV B/C
Ratio
Target Efficiency
EDR Margin
Total EDR
Margin
On-Bill B/C
Ratio
TDV B/C
Ratio
Target Total EDR
Margin
Total EDR
Margin
On-Bill B/C
Ratio
TDV B/C
Ratio
Target Total EDR
Margin
01 PG&E 3.6 1.6 1.4 3.3 2.4 2.3 3.0 22.5 2.0 1.5 22.5 34.5 1.3 1.4 34.5
02 PG&E 1.9 1.7 2.1 3.2 1.6 1.6 1.5 17.5 2.4 1.8 17.5 30.9 1.4 1.7 30.5
03 PG&E 0.0 - - 2.7 1.7 1.6 0.0 16.1 2.4 1.7 16.0 29.5 1.3 1.6 29.5
04 PG&E 1.4 1.4 1.5 2.2 1.2 1.1 1.0 15.0 2.4 1.8 15.0 28.9 1.3 1.8 28.5
05 PG&E 0.6 1.1 0.9 3.6 2.1 2.0 0.5 17.1 2.5 1.8 17.0 30.3 1.4 1.7 30.0
05 PG&E/SoCalGas 0.6 1.1 0.9 3.6 2.1 2.0 0.5 17.1 2.5 1.8 17.0 30.3 1.4 1.7 30.0
06 SCE/SoCalGas 1.0 0.7 1.3 2.2 1.6 1.9 1.0 13.8 1.2 1.7 13.5 27.5 1.2 1.6 27.5
07 SDG&E 0.6 0.6 1.0 1.9 1.6 1.7 0.5 12.8 2.1 1.8 12.5 27.1 1.2 1.6 27.0
08 SCE/SoCalGas 1.2 0.9 1.7 1.9 1.6 1.8 1.0 11.6 1.3 1.8 11.5 24.2 1.2 1.6 24.0
09 SCE/SoCalGas 1.6 1.3 2.7 1.5 1.6 1.6 1.5 11.3 1.3 1.9 11.0 23.3 1.3 1.7 23.0
10 SCE/SoCalGas 1.8 1.2 2.0 1.8 1.7 2.0 1.5 10.8 1.3 1.8 10.5 23.3 1.3 1.7 23.0
10 SDG&E 1.8 1.5 2.0 1.8 2.0 2.0 1.5 10.8 2.1 1.8 10.5 23.3 1.4 1.7 23.0
11 PG&E 3.5 1.4 1.6 3.9 2.0 2.3 3.5 13.4 2.2 1.8 13.0 25.3 1.4 1.8 25.0
12 PG&E 2.6 0.9 1.1 2.9 1.6 1.6 2.5 14.4 2.1 1.6 14.0 26.6 1.3 1.7 26.5
13 PG&E 3.3 1.3 1.6 3.8 2.0 2.3 3.0 12.2 2.1 1.7 12.0 23.9 1.4 1.7 23.5
14 SCE/SoCalGas 3.7 1.2 1.6 3.8 1.6 2.2 3.5 14.0 1.4 1.9 14.0 24.8 1.4 1.8 24.5
14 SDG&E 3.7 1.5 1.6 3.8 2.0 2.2 3.5 14.0 2.2 1.9 14.0 24.8 1.7 1.8 24.5
15 SCE/SoCalGas 4.4 1.5 2.3 6.4 1.2 1.7 4.0 7.1 1.4 2.1 7.0 16.9 1.3 1.8 16.5
16 PG&E 4.1 2.1 2.1 3.2 1.6 1.7 3.0 19.6 2.6 1.9 19.5 29.9 1.6 1.7 29.5 1“>1” indicates cases where there are both first cost savings and annual utility bill savings. 2Information about the measures included for each climate zone are described in Appendix F – Multifamily Measure Summary.
Page 119 of 319

2019 Energy Efficiency Ordinance Cost-effectiveness Study
31 2019-08-01
Figure 6: Multifamily Total EDR comparison
Figure 7: Multifamily EDR Margin comparison (based on Efficiency EDR Margin for the Efficiency packages and the Total EDR Margin for the Efficiency & PV and Efficiency &
PV/Battery packages)
Page 120 of 319

2019 Energy Efficiency Ordinance Cost-effectiveness Study
32 2019-08-01
3.3.1 GHG Emission Reductions
Figure 8 compares annual GHG emissions for both mixed fuel and all-electric multifamily 2019 code compliant cases with Efficiency, Efficiency & PV and Efficiency & PV/Battery packages. GHG emissions vary by climate but are consistently higher in mixed fuel cases than all-electric. Standard design mixed fuel emissions range from 2.0 to 3.0 lbs CO2e/square foot of floor area, where all-electric standard design emissions range from 1.2 to 1.7 lbs CO2e/ ft2. Adding PV, batteries and efficiency to the mixed fuel code compliant prototype reduces annual GHG emissions by 17% on average to between 1.7 and 2.2 lbs CO2e/ft2, except Climate Zone 16. Adding PV, batteries and efficiency to the all-electric code compliant prototype reduces annual GHG emissions by 64% on average to 0.6 lbs CO2e/ft2 or less with the exception of Climate Zones 14, 15 and 16. As in the single family case, none of the cases completely eliminate GHG emissions because of the time value of emissions calculation for electricity in CBECC-Res.
Figure 8: Multifamily greenhouse gas emissions comparison
3.4 Electrification Results
Cost-effectiveness results comparing mixed fuel and all-electric cases are summarized below. The tables show average annual utility bill impacts and lifetime utility bill impacts, which account for fuel escalation for electricity and natural gas (see Section 2.5), lifetime equipment cost savings, and both On-Bill and TDV cost-effectiveness (B/C ratio). Positive utility bill values indicate lower utility costs for the all-electric home relative to the mixed fuel case while negative values in red and parenthesis indicate higher utility costs for the all-electric case. Lifetime equipment cost savings include savings due to eliminating natural gas infrastructure and replacement costs for appliances based on equipment life. Positive values for the lifetime equipment cost savings indicate lower installed costs for the all-electric and negative values indicate higher costs. B/C ratios 1.0 or greater indicate positive cost-effectiveness. Cases where the B/C ratio is indicated as “>1” refer to instances where there was incremental cost savings in addition to annual utility bill savings. In these cases, there is no cost associated with this upgrade and benefits are realized immediately.
Page 121 of 319

2019 Energy Efficiency Ordinance Cost-effectiveness Study
33 2019-08-01
Three scenarios were evaluated:
1. 2019 Code Compliant: Compares a 2019 code compliant all-electric home with a 2019 code compliant mixed fuel home.
2. Efficiency & PV Package: Compares an all-electric home with efficiency and PV sized to 90% of the annual electricity use to a 2019 code compliant mixed fuel home. The first cost savings in the code compliant all-electric house is invested in above code efficiency and PV reflective of the Efficiency & PV packages described above.
3. Neutral Cost Package: Compares an all-electric home with PV beyond code minimum with a 2019 code compliant mixed fuel home. The PV system for the all-electric case is sized to result in a zero lifetime incremental cost relative to a mixed fuel home.
3.4.1 Single Family
Table 14, Table 15, Figure 9, Figure 10, and Figure 11 present results of cost-effectiveness analysis for electrification of single family buildings, according to both the On-Bill and TDV methodologies. Based on typical cost assumptions arrived at for this analysis, the lifetime equipment costs for the single family code compliant all-electric option are approximately $5,350 less than the mixed fuel code compliant option. Cost savings are entirely due to the elimination of gas infrastructure, which was assumed to be a savings of $5,750. When evaluating cost-effectiveness based on TDV, the Utility Gas Main Extensions rules 50% refund and appliance allowance deduction are not applied and therefore the cost savings are twice as much.
Under the Efficiency & PV Package and the On-Bill analysis, the incremental cost of the efficiency and PV is typically more than the cost savings seen in the code compliant case, which results in a net cost increase in most climate zones for the all-electric case. In climates with small heating loads (7 and 15) there continues to be an incremental cost savings for the all-electric home. With the TDV analysis, there is still an incremental cost savings in all climates except 1 and 16 for single family.
Utility impacts differ by climate zone and utility, but utility costs for the code compliant all-electric option are typically higher than for the compliant mixed fuel design. There are utility cost savings across all climates zones and building types for the all-electric Efficiency & PV Package, resulting in a more cost-effective option.
The all-electric code compliant option is cost-effective based on the On-Bill approach for single family homes in Climate Zones 6 through 9, 10 (SCE/SoCalGas territory only), and 15. The code compliant option is cost-effective based on the TDV methodology in all climate zones except 1 and 16. If the same costs used for the On-Bill approach are also used for the TDV approach (incorporating the Utility Gas Main Extensions rules 50% refund and appliance allowance deduction), the all-electric code compliant option is cost-effective in Climate Zones 6 through 10. The Efficiency & PV all-electric option is cost-effective in all climate zones based on both the On-Bill and TDV methodologies. In many cases it is cost-effective immediately with lower equipment and utility costs.
The last set of results in Table 14 shows the neutral cost case where the cost savings for the all-electric code compliant home is invested in a larger PV system, resulting in a lifetime incremental cost of zero based on the On-Bill approach. This package results in utility cost savings in all cases except Climate Zones 1, 14 (SCE/SoCalGas territory only), and 16. For these three cases the Reach Code Team evaluated how much additional PV would be required to result in a cost-effective package. These results are presented in Table 15 and show that an additional 1.6kW in Climate Zone 1 results in a B/C ratio of 1.1. For Climate Zone 14 and 16 adding 0.25kW and 1.2kW, respectively, results in a B/C ratio of 1.2. Neutral cost cases are cost-effective based on the TDV methodology in all climate zones except 16.
3.4.2 Multifamily
Multifamily results are found in Table 16, Table 17, Figure 12, Figure 13, and Figure 14. Lifetime costs for the multifamily code compliant all-electric option are approximately $2,300 less than the mixed fuel code compliant option, entirely due to the elimination of gas infrastructure. When evaluating cost-effectiveness based on TDV,
Page 122 of 319

2019 Energy Efficiency Ordinance Cost-effectiveness Study
34 2019-08-01
the Utility Gas Main Extensions rules 50% refund and appliance allowance deduction are not applied and therefore the cost savings are approximately 2.5 times higher.
With the Efficiency & PV Package and the On-Bill analysis, due to the added cost of the efficiency and PV there is a net cost increase for the all-electric case in all climate zones for except 7, 8, 9, and 15. With the TDV analysis, there is still an incremental cost savings in all climates. Like the single family results, utility costs are typically higher for the code compliant all-electric option but lower than the code compliant mixed fuel option with the Efficiency & PV Package.
The all-electric code compliant option is cost-effective based on the On-Bill approach for multifamily in Climate Zones 6 through 9, 10 and 14 (SCE/SoCalGas territory only), and 15. Based on the TDV methodology, the code compliant option for multifamily is cost-effective for all climate zones. If the same costs used for the On-Bill approach are also used for the TDV approach (incorporating the Utility Gas Main Extensions rules 50% refund and appliance allowance deduction), the all-electric code compliant option is cost-effective in Climate Zones 8 and 9. Like the single family cases, the Efficiency & PV all-electric option is cost-effective in all climate zones based on both the On-Bill and TDV methodologies.
The last set of results in Table 16 show the neutral cost case where the cost savings for the all-electric code compliant home is invested in a larger PV system, resulting in a lifetime incremental cost of zero based on the On-Bill approach. This package results in utility cost savings in all cases except Climate Zone 1. For this case the Reach Code Team evaluated how much additional PV would be required to result in a cost-effective package. These results are presented in Table 17 and show that an additional 0.3kW per apartment results in a B/C ratio of 1.1. Neutral cost cases are cost-effective based on the TDV methodology in all climate zones except 16.
Table 14: Single Family Electrification Results On-Bill Cost-effectiveness1 TDV Cost-effectiveness
CZ Utility
Average Annual Utility Bill Savings
Lifetime NPV Lifetime NPV
Electricity Natural
Gas
Net Utility
Savings Utility Bill
Savings
Equipment Cost
Savings
On-Bill B/C
Ratio2
TDV Cost Savings
Equipment Cost
Savings
TDV B/C
Ratio
2019 Code Compliant Home
01 PG&E -($1,194) +$712 -($482) -($14,464) +$5,349 0.4 -($13,081) +$11,872 0.9 02 PG&E -($825) +$486 -($340) -($10,194) +$5,349 0.5 -($7,456) +$11,872 1.6 03 PG&E -($717) +$391 -($326) -($9,779) +$5,349 0.5 -($7,766) +$11,872 1.5 04 PG&E -($710) +$387 -($322) -($9,671) +$5,349 0.6 -($7,447) +$11,872 1.6
05 PG&E -($738) +$367 -($371) -($11,128) +$5,349 0.5 -($8,969) +$11,872 1.3 05 PG&E/SoCalGas -($738) +$370 -($368) -($11,034) +$5,349 0.5 -($8,969) +$11,872 1.3 06 SCE/SoCalGas -($439) +$289 -($149) -($4,476) +$5,349 1.2 -($4,826) +$11,872 2.5 07 SDG&E -($414) +$243 -($171) -($5,134) +$5,349 1.0 -($4,678) +$11,872 2.5 08 SCE/SoCalGas -($347) +$249 -($97) -($2,921) +$5,349 1.8 -($3,971) +$11,872 3.0
09 SCE/SoCalGas -($377) +$271 -($107) -($3,199) +$5,349 1.7 -($4,089) +$11,872 2.9 10 SCE/SoCalGas -($403) +$280 -($123) -($3,684) +$5,349 1.5 -($4,458) +$11,872 2.7 10 SDG&E -($496) +$297 -($198) -($5,950) +$5,349 0.9 -($4,458) +$11,872 2.7 11 PG&E -($810) +$447 -($364) -($10,917) +$5,349 0.5 -($7,024) +$11,872 1.7 12 PG&E -($740) +$456 -($284) -($8,533) +$5,349 0.6 -($6,281) +$11,872 1.9
13 PG&E -($742) +$413 -($329) -($9,870) +$5,349 0.5 -($6,480) +$11,872 1.8 14 SCE/SoCalGas -($661) +$413 -($248) -($7,454) +$5,349 0.7 -($7,126) +$11,872 1.7 14 SDG&E -($765) +$469 -($296) -($8,868) +$5,349 0.6 -($7,126) +$11,872 1.7 15 SCE/SoCalGas -($297) +$194 -($103) -($3,090) +$5,349 1.7 -($5,364) +$11,872 2.2 16 PG&E -($1,287) +$712 -($575) -($17,250) +$5,349 0.3 -($17,391) +$11,872 0.7
Page 123 of 319

2019 Energy Efficiency Ordinance Cost-effectiveness Study
35 2019-08-01
On-Bill Cost-effectiveness1 TDV Cost-effectiveness
CZ Utility
Average Annual Utility Bill Savings
Lifetime NPV Lifetime NPV
Electricity Natural
Gas
Net Utility
Savings Utility Bill
Savings
Equipment Cost
Savings
On-Bill B/C
Ratio2
TDV Cost Savings
Equipment Cost
Savings
TDV B/C
Ratio
Efficiency & PV Package
01 PG&E -($99) +$712 +$613 +$18,398 -($12,844) 1.4 +$13,364 -($6,321) 2.1 02 PG&E -($89) +$486 +$397 +$11,910 -($6,758) 1.8 +$9,307 -($234) 39.7 03 PG&E -($87) +$391 +$304 +$9,119 -($3,169) 2.9 +$6,516 +$3,355 >1 04 PG&E -($85) +$387 +$302 +$9,074 -($3,438) 2.6 +$6,804 +$3,086 >1
05 PG&E -($98) +$367 +$268 +$8,054 -($2,959) 2.7 +$5,625 +$3,564 >1 05 PG&E/SoCalGas -($98) +$370 +$272 +$8,148 -($2,959) 2.8 +$5,625 +$3,564 >1 06 SCE/SoCalGas -($188) +$289 +$102 +$3,049 -($992) 3.1 +$4,585 +$5,531 >1 07 SDG&E -($137) +$243 +$106 +$3,174 +$912 >1 +$2,176 +$7,436 >1 08 SCE/SoCalGas -($160) +$249 +$89 +$2,664 -($25) 107.9 +$3,965 +$6,499 >1
09 SCE/SoCalGas -($169) +$271 +$102 +$3,067 -($429) 7.1 +$5,368 +$6,094 >1 10 SCE/SoCalGas -($173) +$280 +$107 +$3,216 -($1,057) 3.0 +$5,165 +$5,466 >1 10 SDG&E -($137) +$297 +$160 +$4,805 -($1,057) 4.5 +$5,165 +$5,466 >1 11 PG&E -($147) +$447 +$300 +$8,988 -($5,478) 1.6 +$9,776 +$1,045 >1 12 PG&E -($92) +$456 +$364 +$10,918 -($6,172) 1.8 +$9,913 +$352 >1
13 PG&E -($144) +$413 +$269 +$8,077 -($5,184) 1.6 +$8,960 +$1,339 >1 14 SCE/SoCalGas -($241) +$413 +$172 +$5,164 -($5,111) 1.0 +$9,850 +$1,412 >1 14 SDG&E -($139) +$469 +$330 +$9,910 -($5,111) 1.9 +$9,850 +$1,412 >1 15 SCE/SoCalGas -($107) +$194 +$87 +$2,603 +$264 >1 +$2,598 +$6,787 >1 16 PG&E -($130) +$712 +$582 +$17,457 -($11,234) 1.6 +$9,536 -($4,710) 2.0
Neutral Cost Package
01 PG&E -($869) +$712 -($157) -($4,704) +$0 0 -($6,033) +$6,549 1.1 02 PG&E -($445) +$486 +$40 +$1,213 +$0 >1 +$868 +$6,505 >1 03 PG&E -($335) +$391 +$56 +$1,671 +$0 >1 +$483 +$6,520 >1 04 PG&E -($321) +$387 +$66 +$1,984 +$0 >1 +$1,062 +$6,521 >1
05 PG&E -($335) +$367 +$31 +$938 +$0 >1 -($163) +$6,519 40.1 05 PG&E/SoCalGas -($335) +$370 +$34 +$1,031 +$0 >1 -($163) +$6,519 40.1 06 SCE/SoCalGas -($227) +$289 +$63 +$1,886 +$0 >1 +$3,258 +$6,499 >1 07 SDG&E -($72) +$243 +$171 +$5,132 +$0 >1 +$3,741 +$6,519 >1 08 SCE/SoCalGas -($144) +$249 +$105 +$3,162 +$0 >1 +$4,252 +$6,515 >1
09 SCE/SoCalGas -($170) +$271 +$100 +$3,014 +$0 >1 +$4,271 +$6,513 >1 10 SCE/SoCalGas -($199) +$280 +$81 +$2,440 +$0 >1 +$3,629 +$6,494 >1 10 SDG&E -($155) +$297 +$143 +$4,287 +$0 >1 +$3,629 +$6,494 >1 11 PG&E -($426) +$447 +$21 +$630 +$0 >1 +$1,623 +$6,504 >1 12 PG&E -($362) +$456 +$94 +$2,828 +$0 >1 +$2,196 +$6,525 >1
13 PG&E -($370) +$413 +$43 +$1,280 +$0 >1 +$1,677 +$6,509 >1 14 SCE/SoCalGas -($416) +$413 -($4) -($107) +$0 0 +$2,198 +$6,520 >1 14 SDG&E -($391) +$469 +$79 +$2,356 +$0 >1 +$2,198 +$6,520 >1 15 SCE/SoCalGas -($98) +$194 +$97 +$2,900 +$0 >1 +$2,456 +$6,483 >1 16 PG&E -($878) +$712 -($166) -($4,969) +$0 0 -($8,805) +$6,529 0.7
1Red values in parentheses indicate an increase in utility bill costs or an incremental first cost for the all-electric home. 2“>1” indicates cases where there are both first cost savings and annual utility bill savings.
Page 124 of 319

2019 Energy Efficiency Ordinance Cost-effectiveness Study
36 2019-08-01
Table 15: Comparison of Single Family On-Bill Cost Effectiveness Results with Additional PV
CZ Utility
Neutral Cost Min. Cost Effectiveness
PV Capacity
(kW) Utility Bill
Savings
Equipment Cost
Savings
On-Bill B/C
Ratio
PV Capacity (kW)
Utility Bill Savings
Equipment Cost
Savings
On-Bill B/C
Ratio
01 PG&E 4.7 -($4,704) +$0 0 6.3 +$6,898 -($6,372) 1.1 14 SCE/SoCalGas 4.5 -($107) +$0 0 4.8 +$1,238 -($1,000) 1.2 16 PG&E 4.1 -($4,969) +$0 0 5.3 +$5,883 -($4,753) 1.2
Figure 9: B/C ratio results for a single family all-electric code compliant home versus a
mixed fuel code compliant home
Page 125 of 319

2019 Energy Efficiency Ordinance Cost-effectiveness Study
37 2019-08-01
Figure 10: B/C ratio results for the single family Efficiency & PV all-electric home versus a mixed fuel code compliant home
Figure 11: B/C ratio results for the single family neutral cost package all-electric home versus a mixed fuel code compliant home
Page 126 of 319

2019 Energy Efficiency Ordinance Cost-effectiveness Study
38 2019-08-01
Table 16: Multifamily Electrification Results (Per Dwelling Unit) On-Bill Cost-effectiveness1 TDV Cost-effectiveness
CZ Utility
Average Annual Utility Bill Savings
Lifetime NPV Lifetime NPV
Electricity Natural
Gas
Net Utility
Savings Utility Bill
Savings
Equipment Cost
Savings
On-Bill B/C
Ratio2
TDV Cost Savings
Equipment Cost
Savings
TDV B/C
Ratio
2019 Code Compliant Home
01 PG&E -($396) +$193 -($203) -($6,079) +$2,337 0.4 -($5,838) +$5,899 1.0 02 PG&E -($310) +$162 -($148) -($4,450) +$2,337 0.5 -($4,144) +$5,899 1.4 03 PG&E -($277) +$142 -($135) -($4,041) +$2,337 0.6 -($4,035) +$5,899 1.5 04 PG&E -($264) +$144 -($120) -($3,595) +$2,337 0.6 -($3,329) +$5,899 1.8
05 PG&E -($297) +$140 -($157) -($4,703) +$2,337 0.5 -($4,604) +$5,899 1.3 05 PG&E/SoCalGas -($297) +$178 -($119) -($3,573) +$2,337 0.7 -($4,604) +$5,899 1.3 06 SCE/SoCalGas -($191) +$161 -($30) -($902) +$2,337 2.6 -($2,477) +$5,899 2.4 07 SDG&E -($206) +$136 -($70) -($2,094) +$2,337 1.1 -($2,390) +$5,899 2.5 08 SCE/SoCalGas -($169) +$157 -($12) -($349) +$2,337 6.7 -($2,211) +$5,899 2.7
09 SCE/SoCalGas -($177) +$159 -($18) -($533) +$2,337 4.4 -($2,315) +$5,899 2.5 10 SCE/SoCalGas -($183) +$159 -($23) -($697) +$2,337 3.4 -($2,495) +$5,899 2.4 10 SDG&E -($245) +$139 -($106) -($3,192) +$2,337 0.7 -($2,495) +$5,899 2.4 11 PG&E -($291) +$153 -($138) -($4,149) +$2,337 0.6 -($4,420) +$5,899 1.3 12 PG&E -($277) +$155 -($122) -($3,665) +$2,337 0.6 -($3,557) +$5,899 1.7
13 PG&E -($270) +$146 -($124) -($3,707) +$2,337 0.6 -($3,821) +$5,899 1.5 14 SCE/SoCalGas -($255) +$187 -($69) -($2,062) +$2,337 1.1 -($3,976) +$5,899 1.5 14 SDG&E -($328) +$175 -($154) -($4,607) +$2,337 0.5 -($3,976) +$5,899 1.5 15 SCE/SoCalGas -($154) +$142 -($12) -($367) +$2,337 6.4 -($2,509) +$5,899 2.4 16 PG&E -($404) +$224 -($180) -($5,411) +$2,337 0.4 -($5,719) +$5,899 1.0
Efficiency & PV Package
01 PG&E -($19) +$193 +$174 +$5,230 -($3,202) 1.6 +$2,467 +$361 >1 02 PG&E -($10) +$162 +$152 +$4,549 -($1,375) 3.3 +$2,605 +$2,187 >1 03 PG&E -($12) +$142 +$130 +$3,910 -($936) 4.2 +$1,632 +$2,626 >1 04 PG&E -($8) +$144 +$136 +$4,080 -($822) 5.0 +$2,381 +$2,740 >1
05 PG&E -($19) +$140 +$121 +$3,635 -($956) 3.8 +$1,403 +$2,606 >1 05 PG&E/SoCalGas -($19) +$178 +$159 +$4,765 -($956) 5.0 +$1,403 +$2,606 >1 06 SCE/SoCalGas -($84) +$161 +$77 +$2,309 -($243) 9.5 +$1,940 +$3,319 >1 07 SDG&E -($49) +$136 +$87 +$2,611 +$75 >1 +$1,583 +$3,638 >1 08 SCE/SoCalGas -($74) +$157 +$83 +$2,480 +$96 >1 +$1,772 +$3,658 >1
09 SCE/SoCalGas -($76) +$159 +$82 +$2,469 +$104 >1 +$1,939 +$3,667 >1 10 SCE/SoCalGas -($79) +$159 +$80 +$2,411 -($34) 70.9 +$1,737 +$3,528 >1 10 SDG&E -($77) +$139 +$61 +$1,842 -($34) 54.2 +$1,737 +$3,528 >1 11 PG&E -($25) +$153 +$128 +$3,834 -($1,264) 3.0 +$2,080 +$2,298 >1 12 PG&E -($11) +$155 +$144 +$4,316 -($1,498) 2.9 +$2,759 +$2,064 >1
13 PG&E -($26) +$146 +$121 +$3,625 -($1,125) 3.2 +$2,083 +$2,437 >1 14 SCE/SoCalGas -($99) +$187 +$87 +$2,616 -($1,019) 2.6 +$2,422 +$2,543 >1 14 SDG&E -($86) +$175 +$88 +$2,647 -($1,019) 2.6 +$2,422 +$2,543 >1 15 SCE/SoCalGas -($67) +$142 +$75 +$2,247 +$511 >1 +$1,276 +$4,073 >1 16 PG&E -($24) +$224 +$200 +$5,992 -($2,087) 2.9 +$2,629 +$1,476 >1
Page 127 of 319

2019 Energy Efficiency Ordinance Cost-effectiveness Study
39 2019-08-01
On-Bill Cost-effectiveness1 TDV Cost-effectiveness
CZ Utility
Average Annual Utility Bill Savings
Lifetime NPV Lifetime NPV
Electricity Natural
Gas
Net Utility
Savings Utility Bill
Savings
Equipment Cost
Savings
On-Bill B/C
Ratio2
TDV Cost Savings
Equipment Cost
Savings
TDV B/C
Ratio
Neutral Cost Package
01 PG&E -($228) +$193 -($35) -($1,057) +$0 0 -($2,267) +$3,564 1.6 02 PG&E -($115) +$162 +$47 +$1,399 +$0 >1 +$59 +$3,563 >1 03 PG&E -($81) +$142 +$61 +$1,843 +$0 >1 +$138 +$3,562 >1 04 PG&E -($64) +$144 +$80 +$2,402 +$0 >1 +$983 +$3,563 >1
05 PG&E -($90) +$140 +$50 +$1,490 +$0 >1 -($152) +$3,564 23.4 05 PG&E/SoCalGas -($90) +$178 +$87 +$2,620 +$0 >1 -($152) +$3,564 23.4 06 SCE/SoCalGas -($90) +$161 +$71 +$2,144 +$0 >1 +$1,612 +$3,562 >1 07 SDG&E -($32) +$136 +$105 +$3,135 +$0 >1 +$1,886 +$3,560 >1 08 SCE/SoCalGas -($67) +$157 +$90 +$2,705 +$0 >1 +$1,955 +$3,564 >1
09 SCE/SoCalGas -($71) +$159 +$87 +$2,623 +$0 >1 +$1,924 +$3,561 >1 10 SCE/SoCalGas -($78) +$159 +$81 +$2,431 +$0 >1 +$1,588 +$3,561 >1 10 SDG&E -($71) +$139 +$68 +$2,033 +$0 >1 +$1,588 +$3,561 >1 11 PG&E -($93) +$153 +$59 +$1,783 +$0 >1 -($48) +$3,562 74.0 12 PG&E -($82) +$155 +$73 +$2,184 +$0 >1 +$739 +$3,564 >1
13 PG&E -($79) +$146 +$68 +$2,034 +$0 >1 +$310 +$3,560 >1 14 SCE/SoCalGas -($141) +$187 +$45 +$1,359 +$0 >1 +$747 +$3,562 >1 14 SDG&E -($137) +$175 +$38 +$1,131 +$0 >1 +$747 +$3,562 >1 15 SCE/SoCalGas -($50) +$142 +$92 +$2,771 +$0 >1 +$1,738 +$3,560 >1 16 PG&E -($194) +$224 +$30 +$900 +$0 >1 -($1,382) +$3,564 2.6
1Red values in parentheses indicate an increase in utility bill costs or an incremental first cost for the all-electric home. 2“>1” indicates cases where there are both first cost savings and annual utility bill savings.
Table 17: Comparison of Multifamily On-Bill Cost Effectiveness Results with Additional PV
(Per Dwelling Unit)
CZ Utility
Neutral Cost Min. Cost Effectiveness
PV Capacity
(kW) Utility Bill
Savings
Equipment Cost
Savings On-Bill
B/C Ratio
PV Capacity
(kW) Utility Bill
Savings
Equipment Cost
Savings On-Bill
B/C Ratio
01 PG&E 2.7 -($1,057) +$0 0 3.0 +$1,198 -($1,052) 1.1
Page 128 of 319
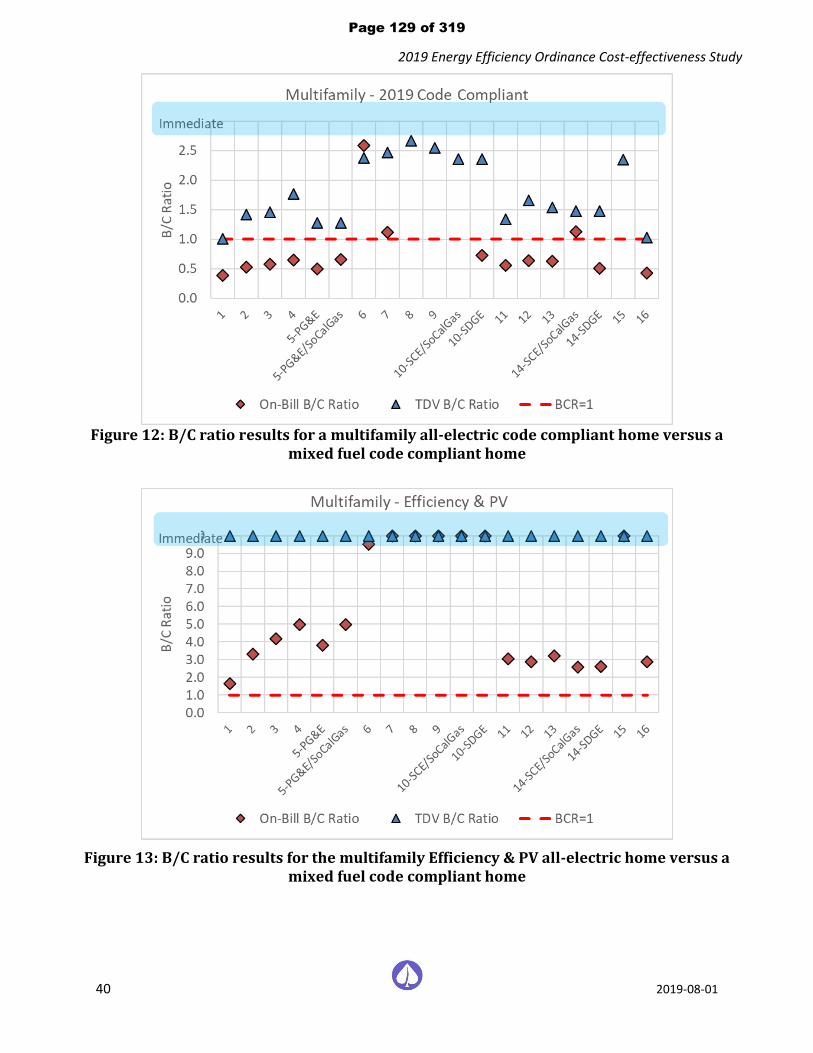
2019 Energy Efficiency Ordinance Cost-effectiveness Study
40 2019-08-01
Figure 12: B/C ratio results for a multifamily all-electric code compliant home versus a
mixed fuel code compliant home
Figure 13: B/C ratio results for the multifamily Efficiency & PV all-electric home versus a mixed fuel code compliant home
Page 129 of 319

2019 Energy Efficiency Ordinance Cost-effectiveness Study
41 2019-08-01
Figure 14: B/C ratio results for the multifamily neutral cost package all-electric home versus a mixed fuel code compliant home
4 Conclusions & Summary This report evaluated the feasibility and cost-effectiveness of “above code” performance specifications through the application of efficiency measures, PV, and electric battery storage in all 16 California climate zones. The analysis found cost-effective packages across the state for both single family and low-rise multifamily buildings. For the building types and climate zones where cost-effective packages were identified, the results of this analysis can be used by local jurisdictions to support the adoption of reach codes. Cost-effectiveness was evaluated according to two metrics: On-Bill customer lifecycle benefit-to-cost and TDV lifecycle benefit-to-cost. While all the above code targets presented are based on packages that are cost-effective under at least one of these metrics, they are not all cost-effective under both metrics. Generally, the test for being cost-effective under the TDV methodology is less challenging than under the On-Bill methodology. Therefore, all packages presented are cost-effective based on TDV, and may or may not be cost-effective based on the On-Bill method. It is up to each jurisdiction to determine what metric is most appropriate for their application. A summary of results by climate zone are presented in Appendix G – Results by Climate Zone.
Above code targets are presented as Target EDR Margin, which have been defined for each scenario where a cost-effective package was identified. Target EDR Margins represent the maximum “reach” values that meet the requirements. Jurisdictions may adopt less stringent requirements. For the Efficiency Package the Target EDR Margin was defined based on the lower EDR Margin of the Efficiency – Non-Preempted Package and the Efficiency – Equipment, Preempted Package. For example, if the cost-effective Non-Preempted package has an EDR Margin of 3 and the Preempted package an EDR Margin of 4, the Target EDR Margin is set at 3.
The average incremental cost for the single family Efficiency packages is ~$1,750. The Efficiency & PV Package average incremental cost is $9,180 and for the Efficiency & PV/Battery Package it is approximately $5,600 for the
Page 130 of 319

2019 Energy Efficiency Ordinance Cost-effectiveness Study
42 2019-08-01
mixed fuel cases and $15,100 for the all-electric cases. The incremental costs for each multifamily apartment are approximately 30-40% lower. See Table 8 and Table 11 for a summary of package costs by case.
Table 18 and Table 19 summarize the maximum Target EDR Margins determined to be cost effective for each package for single family and multifamily, respectively. Cases labeled as “n/a” in the tables indicate where no cost-effective package was identified under either On-Bill or TDV methodology.
This analysis also looked at the GHG emissions impacts of the various packages. An all-electric design reduces GHG emissions 40-50% in most cases relative to a comparable mixed fuel design.
There is significant interest throughout California on electrification of new buildings. The Reach Code Team assembled data on the cost differences between a code compliant mixed fuel building and a code compliant all-electric building. Based on lifetime equipment cost savings (the difference in first cost for equipment and infrastructure combined with incremental replacement costs) of $5,349 for an all-electric single family home this analysis found that from a customer on-bill perspective, the all-electric code compliant option is cost-effective in Climates Zones 6 through 9, 10 (SCE/SoCalGas territory only), and 15, and cost-effective in all climate zones except 1 and 16 based on TDV. For multifamily buildings, based on a cost savings of $2,337 per apartment, the code compliant option is cost-effective in Climates Zones 6 through 9, 10 & 14 (SCE/SoCalGas territory only), and 15, and cost-effective based on TDV.
Adding efficiency and PV to the code compliant all-electric buildings increases the cost-effectiveness in all climate zones. The Efficiency & PV Package is cost-effective when compared to a mixed fuel code compliant building in all climate zones for both single family and multifamily buildings based on both the On-Bill and TDV methodologies. The Efficiency & PV package adds PV to offset 90% of the electricity use of the home. While this results in higher installed costs, the reduced lifetime utility costs are larger ($0 to $6,000 lifetime incremental equipment costs in many climates for single family homes and an associated $4,500 to $13,500 lifetime utility cost savings across the same cases), resulting in positive B/C ratios for all cases.
The Reach Code Team also evaluated a neutral cost electrification scenario where the cost savings for the all-electric code compliant home is invested in a larger PV system, resulting in a lifetime incremental cost of zero based on the On-Bill approach. This package results in utility cost savings and positive on-bill B/C ratio in all cases except Climate Zones 1 and 16 for single family, and Climate Zone 1 for low-rise multifamily. Increasing the PV sizes in those climates by approximately 30% resulted in positive on-bill B/C ratios, while still not resulting in oversizing of PV systems.
Other studies have shown that cost-effectiveness of electrification increases with high efficiency space conditioning and water heating equipment in the all-electric home. This was not directly evaluated in this analysis but based on the favorable cost-effectiveness results of the Equipment, Preempted package for the individual mixed fuel and all-electric upgrades it’s expected that applying similar packages to the electrification analysis would result in increased cost-effectiveness.
The Reach Code Team found there can be substantial variability in first costs, particularly related to natural gas infrastructure. Costs are project-dependent and will be impacted by such factors as site characteristics, distance to the nearest gas main, joint trenching, whether work is conducted by the utility or a private contractor, and number of homes per development among other things. While the best cost data available to the Reach Code Team was applied in this analysis, individual projects may experience different costs, either higher or lower than the estimates presented here.
Page 131 of 319

2019 Energy Efficiency Ordinance Cost-effectiveness Study
43 2019-08-01
Table 18: Summary of Single Family Target EDR Margins
Clim
ate
Zo
ne
Mixed Fuel All-Electric
Efficiency Efficiency & PV/Battery Efficiency Efficiency & PV
Efficiency & PV/Battery
01 5.0 10.5 6.5 31.0 41.0
02 3.0 10.0 4.5 19.0 30.0
03 2.5 10.0 4.0 18.0 29.0
04 2.5 10.0 3.0 17.0 28.5
05 2.5 9.0 4.0 18.0 28.5
06 1.5 9.5 2.0 14.0 26.0
07 n/a 9.0 n/a 11.0 24.0
08 1.0 8.0 1.5 10.5 21.5
09 2.5 8.5 2.5 11.5 21.0
10 3.0 9.5 3.0 11.0 21.0
11 4.0 9.0 4.5 14.0 23.0
12 3.0 9.5 3.5 15.5 25.0
13 4.5 9.5 5.0 13.0 22.0
14 4.5 9.0 5.5 15.5 23.5
15 4.5 7.0 5.5 6.0 13.0
16 5.0 10.5 4.5 26.5 35.0
Table 19: Summary of Multifamily Target EDR Margins
Clim
ate
Zo
ne
Mixed Fuel All-Electric
Efficiency Efficiency & PV/Battery Efficiency Efficiency & PV
Efficiency & PV/Battery
01 2.0 11.5 3.0 22.5 34.5
02 1.5 10.5 1.5 17.5 30.5
03 0.5 10.0 n/a 16.0 29.5
04 1.0 11.0 1.0 15.0 28.5
05 0.5 9.5 0.5 17.0 30.0
06 1.0 10.5 1.0 13.5 27.5
07 0.5 11.0 0.5 12.5 27.0
08 1.0 9.5 1.0 11.5 24.0
09 1.5 9.5 1.5 11.0 23.0
10 1.5 10.0 1.5 10.5 23.0
11 2.5 10.5 3.5 13.0 25.0
12 1.5 10.0 2.5 14.0 26.5
13 3.0 10.5 3.0 12.0 23.5
14 3.0 9.5 3.5 14.0 24.5
15 4.0 8.5 4.0 7.0 16.5
16 2.0 9.5 3.0 19.5 29.5
Page 132 of 319

2019 Energy Efficiency Ordinance Cost-effectiveness Study
44 2019-08-01
5 References California Energy Commission. 2017. Rooftop Solar PV System. Measure number: 2019-Res-PV-D Prepared by Energy and Environmental Economics, Inc. https://efiling.energy.ca.gov/getdocument.aspx?tn=221366
California Energy Commission. 2018a. 2019 Alternative Calculation Method Approval Manual. CEC-400-2018-023-CMF. December 2018. California Energy Commission. https://www.energy.ca.gov/2018publications/CEC-400-2018-023/CEC-400-2018-023-CMF.pdf
California Energy Commission. 2018b. 2019 Building Energy Efficiency Standards for Residential and Nonresidential Buildings. CEC-400-2018-020-CMF. December 2018. California Energy Commission. https://www.energy.ca.gov/2018publications/CEC-400-2018-020/CEC-400-2018-020-CMF.pdf
California Energy Commission. 2018c. 2019 Reference Appendices. CEC-400-2018-021-CMF. December 2018. California Energy Commission. https://www.energy.ca.gov/2018publications/CEC-400-2018-021/CEC-400-2018-021-CMF.pdf
California Energy Commission. 2018d. 2019 Residential Compliance Manual. CEC-400-2018-017-CMF. December
2018. California Energy Commission. https://www.energy.ca.gov/2018publications/CEC-400-2018-017/CEC-400-
2018-017-CMF.pdf
California Energy Commission. 2019. 2019 Residential Alternative Calculation Method Reference Manual. CEC-400-2019-005-CMF. May 2019. California Energy Commission. https://www.energy.ca.gov/2019publications/CEC-400-2019-005/CEC-400-2019-005-CMF.pdf
California Public Utilities Commission. 2016. Rulemaking No. 15-03-010 An Order Instituting Rulemaking to Identify Disadvantaged Communities in the San Joaquin Valley and Analyze Economically Feasible Options to Increase Access to Affordable Energy in Those Disadvantages Communities. Proposed Decision of Commissioner Guzman Aceves. April 07, 2017. http://docs.cpuc.ca.gov/PublishedDocs/Efile/G000/M183/K389/183389022.PDF
Davis Energy Group. 2015. Evaluation of Ducts in Conditioned Space for New California Homes. Prepared for Pacific Gas and Electric Company. March 2015. https://www.etcc-ca.com/reports/evaluation-ducts-conditioned-space-new-california-homes
Energy & Environmental Economics. 2019. Residential Building Electrification in California. April 2019. https://www.ethree.com/wp-content/uploads/2019/04/E3_Residential_Building_Electrification_in_California_April_2019.pdf
EPRI. 2016. SMUD All-Electric Homes Electrification Case Study: Summary for the Three-Prong Test Discussion. Electric Power Research Institute, Inc. September. 2016. Presentation to Sacramento Municipal Utility District.
Horii, B., E. Cutter, N. Kapur, J. Arent, and D. Conotyannis. 2014. “Time Dependent Valuation of Energy for Developing Building Energy Efficiency Standards.” http://www.energy.ca.gov/title24/2016standards/prerulemaking/documents/2014-07-09_workshop/2017_TDV_Documents/
Itron. 2014. 2010-2012 WO017 Ex Ante Measure Cost Study: Final Report. Itron. May 2014. Presented to California Public Utilities Commission.
Barbose, Galen and Darghouth, Naim. 2018. Tracking the Sun. Installed Price Trends for Distributed Photovoltaic Systems in the United States – 2018 Edition. Lawrence Berkeley National Laboratory. September 2018. https://emp.lbl.gov/sites/default/files/tracking_the_sun_2018_edition_final_0.pdf
Navigant. 2018. Analysis of the Role of Gas for a Low-Carbon California Future. July 24, 2018. Prepared for Southern California Gas Company. https://www.socalgas.com/1443741887279/SoCalGas_Renewable_Gas_Final-Report.pdf
Page 133 of 319

2019 Energy Efficiency Ordinance Cost-effectiveness Study
45 2019-08-01
Penn, Ivan. 2018. Cheaper Battery Is Unveiled as a Step to a Carbon-Free Grid. The New York Times. September 2018. https://www.nytimes.com/2018/09/26/business/energy-environment/zinc-battery-solar-power.html. Accessed January 29, 2019.
Statewide CASE Team. 2017a. Codes and Standards Enhancement (CASE) Initiative Drain Water Heat Recovery – Final Report. July 2017. http://title24stakeholders.com/wp-content/uploads/2017/09/2019-T24-CASE-Report_DWHR_Final_September-2017.pdf
Statewide CASE Team. 2017b. Codes and Standards Enhancement (CASE) Initiative High Performance Attics – Final Report. September 2017. http://title24stakeholders.com/wp-content/uploads/2017/09/2019-T24-CASE-Report_HPA_Final_September-2017.pdf
Statewide CASE Team. 2017c. Codes and Standards Enhancement (CASE) Initiative High Performance Walls – Final Report. September 2017. http://title24stakeholders.com/wp-content/uploads/2017/09/2019-T24-CASE-Report_HPW_Final_September-2017.pdf
Statewide CASE Team. 2017d. Codes and Standards Enhancement (CASE) Initiative Residential High Performance Windows & Doors – Final Report. August 2017. http://title24stakeholders.com/wp-content/uploads/2017/09/2019-T24-CASE-Report_Res-Windows-and-Doors_Final_September-2017.pdf
Statewide CASE Team. 2018. Energy Savings Potential and Cost-Effectiveness Analysis of High Efficiency Windows in California. Prepared by Frontier Energy. May 2018. https://www.etcc-ca.com/reports/energy-savings-potential-and-cost-effectiveness-analysis-high-efficiency-windows-california
Statewide Reach Codes Team. 2016. CALGreen Cost-Effectiveness Study. Prepared for Pacific Gas and Electric Company. Prepared by Davis Energy Group. November 2016. http://localenergycodes.com/download/50/file_path/fieldList/2016%20RNC%20Tiers%201-2%20Cost-Eff%20Report
Statewide Reach Codes Team. 2017a. CALGreen All-Electric Cost-Effectiveness Study. Prepared for Pacific Gas and Electric Company. Prepared by Davis Energy Group. October 2017. http://localenergycodes.com/download/276/file_path/fieldList/2016%20RNC%20All-Electric%20Cost-Eff%20Report
Statewide Reach Codes Team. 2017b. 2016 Title 24 Residential Reach Code Recommendations: Cost-effectiveness Analysis for All California Climate Zones. Prepared for Southern California Edison. Prepared by TRC Energy Services. August 2017. http://localenergycodes.com/download/283/file_path/fieldList/2016%20RNC%20Reach%20Code%20Tier%203%20Cost-Eff%20Report
Statewide Reach Codes Team. 2018. PV + Battery Storage Study. Prepared for Pacific Gas and Electric Company. Prepared by EnergySoft. July, 2018. http://localenergycodes.com/download/430/file_path/fieldList/PV%20Plus%20Battery%20Storage%20Report
Hopkins, Asa, Takahashi, Kenji, Glick, Devi, Whited, Melissa. 2018. Decarbonization of Heating Energy Use in California Buildings. Synapse Energy Economics, Inc. October 2018. http://www.synapse-energy.com/sites/default/files/Decarbonization-Heating-CA-Buildings-17-092-1.pdf
TRC. 2018. City of Palo Alto 2019 Title 24 Energy Reach Code Cost-effectiveness Analysis Draft. September 2018. https://cityofpaloalto.org/civicax/filebank/documents/66742
Page 134 of 319
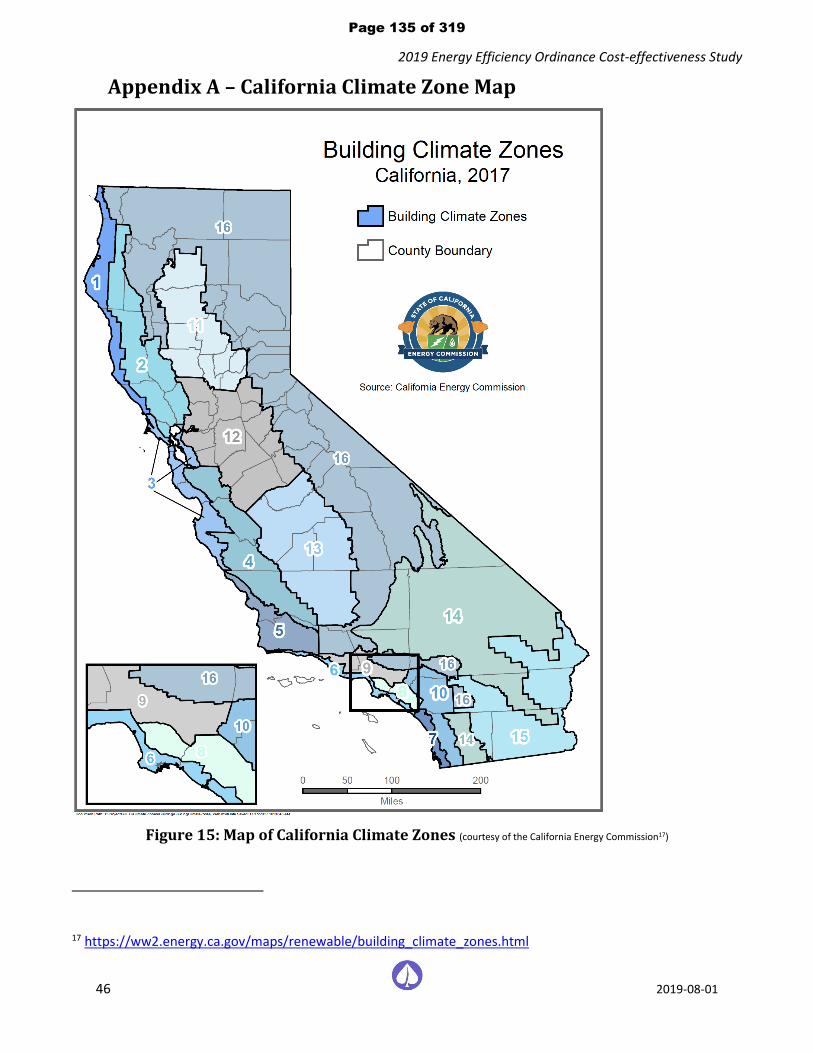
2019 Energy Efficiency Ordinance Cost-effectiveness Study
46 2019-08-01
Appendix A – California Climate Zone Map
Figure 15: Map of California Climate Zones (courtesy of the California Energy Commission17)
17 https://ww2.energy.ca.gov/maps/renewable/building_climate_zones.html
Page 135 of 319

2019 Energy Efficiency Ordinance Cost-effectiveness Study
47 2019-08-01
Appendix B – Utility Tariff Details PG&E ............................................................................................................................................................. 48
SCE ............................................................................................................................................................... 51
SoCalGas ....................................................................................................................................................... 53
SDG&E ........................................................................................................................................................... 54
Escalation Assumptions .............................................................................................................................. 56
Page 136 of 319

2019 Energy Efficiency Ordinance Cost-effectiveness Study
48 2019-08-01
PG&E
The following pages provide details on the PG&E electricity and natural gas tariffs applied in this study. Table 20 describes the baseline territories that were assumed for each climate zone.
Table 20: PG&E Baseline Territory by Climate Zone Baseline
Territory
CZ01 V
CZ02 X
CZ03 T
CZ04 X
CZ05 T
CZ11 R
CZ12 S
CZ13 R
CZ16 Y
The PG&E monthly gas rate in $/therm was applied on a monthly basis for the 12-month period ending January 2019 according to the rates shown below.
Page 137 of 319

2019 Energy Efficiency Ordinance Cost-effectiveness Study
49 2019-08-01
Page 138 of 319

2019 Energy Efficiency Ordinance Cost-effectiveness Study
50 2019-08-01
Page 139 of 319

2019 Energy Efficiency Ordinance Cost-effectiveness Study
51 2019-08-01
SCE
The following pages provide details on are the SCE electricity tariffs applied in this study. Table 21 describes the baseline territories that were assumed for each climate zone.
Table 21: SCE Baseline Territory by Climate Zone Baseline
Territory
CZ06 6
CZ08 8
CZ09 9
CZ10 10
CZ14 14
CZ15 15
Page 140 of 319

2019 Energy Efficiency Ordinance Cost-effectiveness Study
52 2019-08-01
Page 141 of 319

2019 Energy Efficiency Ordinance Cost-effectiveness Study
53 2019-08-01
SoCalGas
Following are the SoCalGas natural gas tariffs applied in this study. Table 22 describes the baseline territories that were assumed for each climate zone.
Table 22: SoCalGas Baseline Territory by Climate Zone Baseline
Territory
CZ05 2
CZ06 1
CZ08 1
CZ09 1
CZ10 1
CZ14 2
CZ15 1
Page 142 of 319

2019 Energy Efficiency Ordinance Cost-effectiveness Study
54 2019-08-01
SDG&E
Following are the SDG&E electricity and natural gas tariffs applied in this study. Table 23 describes the baseline territories that were assumed for each climate zone.
Table 23: SDG&E Baseline Territory by Climate Zone Baseline
Territory
CZ07 Coastal
CZ10 Inland
CZ14 Mountain
Page 143 of 319

2019 Energy Efficiency Ordinance Cost-effectiveness Study
55 2019-08-01
Page 144 of 319

2019 Energy Efficiency Ordinance Cost-effectiveness Study
56 2019-08-01
Escalation Assumptions
The average annual escalation rates in the following table were used in this study and are from E3’s 2019 study Residential Building Electrification in California (Energy & Environmental Economics, 2019). These rates are applied to the 2019 rate schedules over a thirty-year period beginning in 2020. SDG&E was not covered in the E3 study. The Reach Code Team reviewed SDG&E’s GRC filing and applied the same approach that E3 applied for PG&E and SoCalGas to arrive at average escalation rates between 2020 and 2022.
Table 24: Real Utility Rate Escalation Rate Assumptions
Statewide Electric
Residential Average Rate (%/year, real)
Natural Gas Residential Core Rate (%/yr escalation, real)
PG&E SoCalGas SDG&E
2020 2.0% 1.48% 6.37% 5.00%
2021 2.0% 5.69% 4.12% 3.14%
2022 2.0% 1.11% 4.12% 2.94%
2023 2.0% 4.0% 4.0% 4.0%
2024 2.0% 4.0% 4.0% 4.0%
2025 2.0% 4.0% 4.0% 4.0%
2026 1.0% 1.0% 1.0% 1.0%
2027 1.0% 1.0% 1.0% 1.0%
2028 1.0% 1.0% 1.0% 1.0%
2029 1.0% 1.0% 1.0% 1.0%
2030 1.0% 1.0% 1.0% 1.0%
2031 1.0% 1.0% 1.0% 1.0%
2032 1.0% 1.0% 1.0% 1.0%
2033 1.0% 1.0% 1.0% 1.0%
2034 1.0% 1.0% 1.0% 1.0%
2035 1.0% 1.0% 1.0% 1.0%
2036 1.0% 1.0% 1.0% 1.0%
2037 1.0% 1.0% 1.0% 1.0%
2038 1.0% 1.0% 1.0% 1.0%
2039 1.0% 1.0% 1.0% 1.0%
2040 1.0% 1.0% 1.0% 1.0%
2041 1.0% 1.0% 1.0% 1.0%
2042 1.0% 1.0% 1.0% 1.0%
2043 1.0% 1.0% 1.0% 1.0%
2044 1.0% 1.0% 1.0% 1.0%
2045 1.0% 1.0% 1.0% 1.0%
2046 1.0% 1.0% 1.0% 1.0%
2047 1.0% 1.0% 1.0% 1.0%
2048 1.0% 1.0% 1.0% 1.0%
2049 1.0% 1.0% 1.0% 1.0%
Page 145 of 319

2019 Energy Efficiency Ordinance Cost-effectiveness Study
57 2019-08-01
Appendix C – Single Family Detailed Results
Table 25: Single Family Mixed Fuel Efficiency Package Cost-Effectiveness Results
BASECASE Non-Preempted Equipment - Preempted
CZ Utility Tota
l ED
R
Effi
cie
ncy
EDR
CA
LGre
en
Tie
r 1
ED
R
Targ
et
lbs
CO
2 p
er
sqft
PV
kW
Tota
l ED
R
Effi
cie
ncy
EDR
Effi
cie
ncy
EDR
Mar
gin
% C
om
p
Mar
gin
lbs
CO
2 p
er
sqft
PV
kW
On
-Bill
B/C
Rat
io
TDV
B/C
Rat
io
Tota
l ED
R
Effi
cie
ncy
EDR
Effi
cie
ncy
EDR
Mar
gin
% C
om
p
Mar
gin
lbs
CO
2 p
er
sqft
PV
kW
On
-Bill
B/C
Rat
io
TDV
B/C
Rat
io
1 PG&E 32.5 54.2 23 3.0 3.3 27.9 49.0 5.3 18.8% 2.5 3.2 3.4 2.8 26.0 47.3 6.9 25.1% 2.3 3.2 4.9 4.1
2 PG&E 25.0 46.0 12 2.2 2.8 22.0 42.7 3.3 16.3% 1.9 2.8 1.6 1.7 21.8 42.6 3.3 16.4% 1.9 2.8 3.8 3.6
3 PG&E 23.9 46.9 10 1.9 2.7 21.3 43.9 3.0 16.7% 1.6 2.7 1.3 1.3 20.1 42.8 4.1 22.8% 1.5 2.7 1.9 2.0
4 PG&E 23.1 44.9 8 1.9 2.7 20.8 42.4 2.5 13.9% 1.7 2.7 0.9 1.2 20.5 42.2 2.7 14.9% 1.6 2.7 2.4 2.7
5 PG&E 22.2 44.4 10 1.8 2.6 19.7 41.7 2.7 16.7% 1.6 2.5 1.1 1.2 19.7 41.7 2.6 16.2% 1.5 2.5 2.3 2.5
5 PG&E/SoCalGas 22.2 44.4 10 1.8 2.6 19.7 41.7 2.7 16.7% 1.6 2.5 0.9 1.2 19.7 41.7 2.6 16.2% 1.5 2.5 2.0 2.5
6 SCE/SoCalGas 23.3 49.9 10 1.6 2.7 21.5 47.8 2.0 12.1% 1.5 2.7 0.7 1.2 21.5 47.9 2.0 11.8% 1.4 2.7 1.6 2.0
7 SDG&E 20.3 49.1 5 1.3 2.6 20.3 49.1 0.0 0.0% 1.3 2.6 - - 18.8 47.6 1.5 12.4% 1.2 2.6 1.5 1.4
8 SCE/SoCalGas 21.3 46.9 10 1.4 2.9 20.1 45.6 1.3 7.7% 1.3 2.9 0.6 1.4 19.7 45.3 1.6 9.4% 1.3 2.9 1.3 1.8
9 SCE/SoCalGas 24.5 47.7 13 1.5 2.9 22.3 45.1 2.6 11.7% 1.5 2.9 0.7 2.0 21.9 44.8 2.9 13.4% 1.4 2.9 1.8 3.7
10 SCE/SoCalGas 24.2 46.3 10 1.6 3.0 21.7 43.1 3.2 14.3% 1.5 3.0 0.6 1.3 21.5 43.1 3.2 14.6% 1.4 3.0 2.0 3.8
10 SDG&E 24.2 46.3 10 1.6 3.0 21.7 43.1 3.2 14.3% 1.5 3.0 0.8 1.3 21.5 43.1 3.2 14.6% 1.4 3.0 2.6 3.8
11 PG&E 24.6 44.9 11 2.1 3.6 21.3 40.6 4.3 16.4% 1.9 3.4 0.8 1.2 20.7 39.9 5.1 19.2% 1.8 3.4 2.5 3.7
12 PG&E 25.5 44.8 12 2.1 3.0 22.5 41.3 3.5 14.9% 1.9 2.9 1.2 1.8 22.5 41.4 3.4 14.4% 1.9 3.0 3.3 4.6
13 PG&E 25.7 46.5 11 2.0 3.8 22.2 41.9 4.6 16.9% 1.8 3.6 0.8 1.3 21.2 40.7 5.8 21.4% 1.7 3.6 5.3 8.4
14 SCE/SoCalGas 25.3 46.3 15 2.3 3.2 21.5 41.3 5.0 18.5% 2.1 3.0 1.6 2.5 20.8 40.4 5.8 21.7% 2.0 3.0 4.0 6.1
14 SDG&E 25.3 46.3 15 2.3 3.2 21.5 41.3 5.0 18.5% 2.1 3.0 1.9 2.5 20.8 40.4 5.8 21.7% 2.0 3.0 4.9 6.1
15 SCE/SoCalGas 22.4 49.1 11 1.7 5.4 19.7 44.3 4.8 14.8% 1.6 5.0 1.0 1.6 19.5 44.1 5.0 15.4% 1.5 5.0 >1 >1
16 PG&E 30.4 48.9 22 3.3 2.7 25.0 43.5 5.4 20.6% 2.6 2.7 1.6 1.5 24.8 42.7 6.2 23.5% 2.7 2.6 2.2 2.2
“>1” = indicates cases where there is both first cost savings and annual utility bill savings.
Page 146 of 319

2019 Energy Efficiency Ordinance Cost-effectiveness Study
58 2019-08-01
Table 26: Single Family Mixed Fuel Efficiency & PV/Battery Package Cost-Effectiveness Results
CZ Utility
BASECASE Efficiency & PV/Battery
Total EDR
CALGreen Tier 1 EDR Target
lbs CO2 per sqft
PV kW
Total EDR
Total EDR
Margin % Comp Margin
lbs CO2 per sqft
PV kW
On-Bill B/C Ratio
TDV B/C Ratio
1 PG&E 32.5 23 3.0 3.3 21.9 10.6 31.8% 2.4 3.3 0.9 1.6 2 PG&E 25.0 12 2.2 2.8 14.9 10.1 27.3% 1.8 2.9 0.5 1.6 3 PG&E 23.9 10 1.9 2.7 13.9 10.0 27.7% 1.5 2.8 0.4 1.4 4 PG&E 23.1 8 1.9 2.7 13.0 10.1 24.9% 1.5 2.8 0.3 1.5 5 PG&E 22.2 10 1.8 2.6 12.8 9.4 29.7% 1.4 2.6 0.4 1.3 5 PG&E/SoCalGas 22.2 10 1.8 2.6 12.8 9.4 29.7% 1.4 2.6 0.3 1.3 6 SCE/SoCalGas 23.3 10 1.6 2.7 13.6 9.8 20.1% 1.2 2.8 0.8 1.3 7 SDG&E 20.3 5 1.3 2.6 11.1 9.2 9.0% 1.0 2.7 0.1 1.3 8 SCE/SoCalGas 21.3 10 1.4 2.9 12.9 8.4 23.7% 1.1 3.0 0.9 1.3
9 SCE/SoCalGas 24.5 13 1.5 2.9 15.7 8.8 24.7% 1.2 3.0 1.0 1.5 10 SCE/SoCalGas 24.2 10 1.6 3.0 14.6 9.6 27.3% 1.3 3.1 1.0 1.5 10 SDG&E 24.2 10 1.6 3.0 14.6 9.6 27.3% 1.3 3.1 0.6 1.5 11 PG&E 24.6 11 2.1 3.6 15.4 9.2 29.4% 1.8 3.5 0.4 1.5 12 PG&E 25.5 12 2.1 3.0 15.9 9.6 28.9% 1.8 3.0 0.4 1.7
13 PG&E 25.7 11 2.0 3.8 16.1 9.7 28.9% 1.7 3.7 0.4 1.6 14 SCE/SoCalGas 25.3 15 2.3 3.2 16.3 9.0 30.1% 1.8 3.1 1.3 1.7 14 SDG&E 25.3 15 2.3 3.2 16.3 9.0 30.1% 1.8 3.1 1.2 1.7 15 SCE/SoCalGas 22.4 11 1.7 5.4 15.3 7.1 25.1% 1.4 5.1 1.1 1.5 16 PG&E 30.4 22 3.3 2.7 19.9 10.5 32.6% 2.4 2.8 0.9 1.4
“>1” = indicates cases where there is both first cost savings and annual utility bill savings.
Page 147 of 319

2019 Energy Efficiency Ordinance Cost-effectiveness Study
59 2019-08-01
Table 27: Single Family All-Electric Efficiency Package Cost-Effectiveness Results
CZ Utility
BASECASE Non-Preempted Equipment - Preempted
Tota
l ED
R
Effi
cie
ncy
ED
R
CA
LGre
en
Tie
r 1
EDR
Tar
get
lbs
CO
2 p
er
sqft
PV
kW
Tota
l ED
R
Effi
cie
ncy
ED
R
Effi
cie
ncy
ED
R
Mar
gin
% C
om
p M
argi
n
lbs
CO
2 p
er
sqft
PV
kW
On
-Bill
B/C
Rat
io
TDV
B/C
Rat
io
Tota
l ED
R
Effi
cie
ncy
ED
R
Effi
cie
ncy
ED
R
Mar
gin
% C
om
p M
argi
n
lbs
CO
2 p
er
sqft
PV
kW
On
-Bill
B/C
Rat
io
TDV
B/C
Rat
io
1 PG&E 46.8 68.2 36 1.5 3.3 31.8 53.0 15.2 40.2% 1.0 3.3 1.8 1.7 39.9 61.3 6.9 18.3% 1.3 3.3 2.9 2.7
2 PG&E 32.8 53.7 16 1.1 2.8 27.9 48.7 4.9 20.5% 0.9 2.8 1.2 1.1 27.7 48.5 5.1 21.2% 0.9 2.8 2.3 2.1
3 PG&E 33.1 55.6 14 1.0 2.7 28.5 50.9 4.7 20.6% 0.8 2.7 2.6 2.4 28.7 51.2 4.4 19.6% 0.9 2.7 1.8 1.6
4 PG&E 31.3 52.8 12 1.0 2.7 27.9 49.4 3.4 15.5% 0.9 2.7 1.9 1.8 27.4 48.9 3.9 17.6% 0.9 2.7 1.5 1.5
5 PG&E 32.5 54.2 16 1.0 2.6 28.1 49.9 4.4 19.7% 0.9 2.6 2.6 2.3 28.0 49.8 4.4 20.3% 0.9 2.6 1.9 1.7
5 PG&E/SoCalGas 32.5 54.2 16 1.0 2.6 28.1 49.9 4.4 19.7% 0.9 2.6 2.6 2.3 28.0 49.8 4.4 20.3% 0.9 2.6 1.9 1.7
6 SCE/SoCalGas 29.7 55.8 12 0.9 2.7 27.7 53.8 2.0 10.9% 0.8 2.7 1.3 1.4 26.8 53.0 2.9 16.0% 0.8 2.7 2.2 2.3
7 SDG&E 27.1 55.3 7 0.7 2.6 27.1 55.3 0.0 0.0% 0.7 2.6 - - 24.8 53.0 2.2 16.9% 0.7 2.6 1.6 1.7
8 SCE/SoCalGas 26.1 51.5 10 0.8 2.9 24.5 49.9 1.6 8.9% 0.8 2.9 0.6 1.2 24.4 49.7 1.8 9.7% 0.8 2.9 2.8 3.0
9 SCE/SoCalGas 28.8 51.9 13 0.9 2.9 26.0 49.1 2.8 12.5% 0.8 2.9 0.8 2.0 25.5 48.6 3.3 14.7% 0.8 2.9 2.1 3.2
10 SCE/SoCalGas 28.8 50.7 11 0.9 3.0 25.7 47.6 3.1 14.0% 0.9 3.0 0.9 1.5 25.3 47.2 3.4 15.5% 0.8 3.0 2.3 3.2
10 SDG&E 28.8 50.7 11 0.9 3.0 25.7 47.6 3.1 14.0% 0.9 3.0 1.1 1.5 25.3 47.2 3.4 15.5% 0.8 3.0 2.6 3.2
11 PG&E 30.0 50.2 12 1.1 3.6 25.4 45.6 4.6 16.2% 1.0 3.6 1.2 1.5 24.1 44.3 5.9 20.8% 0.9 3.6 3.0 3.3
12 PG&E 30.9 50.1 13 1.0 3.0 27.1 46.3 3.8 15.3% 0.9 3.0 0.8 1.1 25.8 45.0 5.1 20.4% 0.9 3.0 2.0 2.5
13 PG&E 30.7 51.5 13 1.1 3.8 25.7 46.4 5.1 17.4% 0.9 3.8 1.1 1.4 24.7 45.4 6.0 20.9% 0.9 3.8 2.9 3.3
14 SCE/SoCalGas 31.3 52.2 16 1.4 3.2 25.7 46.6 5.6 18.9% 1.2 3.2 1.0 1.5 25.3 46.2 6.0 20.5% 1.2 3.2 2.3 3.1
14 SDG&E 31.3 52.2 16 1.4 3.2 25.7 46.6 5.6 18.9% 1.2 3.2 1.3 1.5 25.3 46.2 6.0 20.5% 1.2 3.2 2.9 3.1
15 SCE/SoCalGas 26.2 52.8 8 1.3 5.4 20.6 47.2 5.6 16.8% 1.1 5.4 1.1 1.6 18.9 45.5 7.3 21.8% 1.0 5.4 3.3 4.5
16 PG&E 46.5 64.6 39 1.7 2.7 36.8 54.9 9.7 25.2% 1.4 2.7 1.7 1.7 41.6 59.7 4.9 12.7% 1.6 2.7 2.4 2.3
Page 148 of 319

2019 Energy Efficiency Ordinance Cost-effectiveness Study
60 2019-08-01
Table 28: Single Family All-Electric Efficiency & PV-PV/Battery Package Cost-Effectiveness Results
CZ Utility
BASECASE Efficiency & PV Efficiency & PV/Battery
Tota
l ED
R
CA
LGre
en
Tie
r 1
EDR
Tar
get
lbs
CO
2 p
er
sqft
PV
kW
Tota
l ED
R
Tota
l ED
R
Mar
gin
% C
om
p M
argi
n
lbs
CO
2 p
er
sqft
PV
kW
On
-Bill
B/C
Rat
io
TDV
B/C
Rat
io
Tota
l ED
R
Tota
l ED
R
Mar
gin
% C
om
p M
argi
n
lbs
CO
2 p
er
sqft
PV
kW
On
-Bill
B/C
Rat
io
TDV
B/C
Rat
io
1 PG&E 46.8 36 1.5 3.3 15.4 31.4 40.2% 0.5 6.0 1.8 1.5 5.6 41.2 51.9% 0.3 6.76 1.4 1.4
2 PG&E 32.8 16 1.1 2.8 13.4 19.4 20.5% 0.5 4.9 1.8 1.4 2.7 30.1 31.5% 0.3 5.51 1.4 1.4
3 PG&E 33.1 14 1.0 2.7 14.6 18.5 20.6% 0.5 4.5 2.2 1.7 3.7 29.3 31.6% 0.2 5.10 1.5 1.6
4 PG&E 31.3 12 1.0 2.7 14.1 17.2 15.5% 0.5 4.5 2.1 1.6 2.8 28.6 26.5% 0.2 5.15 1.5 1.6
5 PG&E 32.5 16 1.0 2.6 14.3 18.2 19.7% 0.5 4.3 2.3 1.8 3.8 28.7 32.7% 0.2 4.84 1.6 1.6
5 PG&E/SoCalGas 32.5 16 1.0 2.6 14.3 18.2 19.7% 0.5 4.3 2.3 1.8 3.8 28.7 32.7% 0.2 4.84 1.6 1.6
6 SCE/SoCalGas 29.7 12 0.9 2.7 15.5 14.3 10.9% 0.6 4.1 1.2 1.5 3.6 26.1 18.9% 0.3 4.68 1.2 1.4
7 SDG&E 27.1 7 0.7 2.6 15.8 11.3 0.7% 0.6 3.7 1.9 1.5 2.9 24.2 6.7% 0.3 4.21 1.3 1.5
8 SCE/SoCalGas 26.1 10 0.8 2.9 15.1 10.9 8.9% 0.6 4.0 1.0 1.5 4.5 21.6 24.9% 0.3 4.54 1.1 1.4
9 SCE/SoCalGas 28.8 13 0.9 2.9 17.3 11.5 12.5% 0.7 4.1 1.1 1.6 7.6 21.3 25.5% 0.4 4.66 1.1 1.5
10 SCE/SoCalGas 28.8 11 0.9 3.0 17.7 11.1 14.0% 0.7 4.2 1.1 1.5 7.6 21.2 27.0% 0.4 4.78 1.1 1.5
10 SDG&E 28.8 11 0.9 3.0 17.7 11.1 14.0% 0.7 4.2 1.7 1.5 7.6 21.2 27.0% 0.4 4.78 1.4 1.5
11 PG&E 30.0 12 1.1 3.6 15.8 14.2 16.2% 0.6 5.4 1.8 1.6 6.8 23.2 29.2% 0.4 6.11 1.5 1.6
12 PG&E 30.9 13 1.0 3.0 15.2 15.7 15.3% 0.5 5.0 1.7 1.4 5.6 25.4 29.3% 0.3 5.62 1.3 1.5
13 PG&E 30.7 13 1.1 3.8 17.3 13.4 17.4% 0.6 5.4 1.7 1.5 8.2 22.5 29.4% 0.4 6.14 1.4 1.5
14 SCE/SoCalGas 31.3 16 1.4 3.2 15.8 15.5 18.9% 0.9 4.8 1.2 1.6 7.4 23.9 30.9% 0.6 5.39 1.4 1.6
14 SDG&E 31.3 16 1.4 3.2 15.8 15.5 18.9% 0.9 4.8 1.8 1.6 7.4 23.9 30.9% 0.6 5.39 1.7 1.6
15 SCE/SoCalGas 26.2 8 1.3 5.4 20.0 6.2 16.8% 1.1 5.5 1.1 1.6 12.7 13.5 27.0% 0.8 6.25 1.2 1.5
16 PG&E 46.5 39 1.7 2.7 19.6 27.0 25.2% 0.9 5.5 2.1 1.6 11.1 35.4 34.3% 0.6 6.17 1.7 1.5
“>1” = indicates cases where there is both first cost savings and annual utility bill savings.
Page 149 of 319

2019 Energy Efficiency Ordinance Cost-effectiveness Study
61 2019-08-01
Appendix D – Single Family Measure Summary
Table 29: Single Family Mixed Fuel Efficiency – Non-Preempted Package Measure Summary
VVLDCS – Verified Low Leakage Ducts in Conditioned Space
Page 150 of 319

2019 Energy Efficiency Ordinance Cost-effectiveness Study
62 2019-08-01
Table 30: Single Family Mixed Fuel Efficiency – Equipment, Preempted Package Measure Summary
LLAHU - Low Leakage Air Handling Unit VVLDCS – Verified Low Leakage Ducts in Conditioned Space
Page 151 of 319

2019 Energy Efficiency Ordinance Cost-effectiveness Study
63 2019-08-01
Table 31: Single Family Mixed Fuel Efficiency & PV/Battery Package Measure Summary
VVLDCS – Verified Low Leakage Ducts in Conditioned Space
Page 152 of 319

2019 Energy Efficiency Ordinance Cost-effectiveness Study
64 2019-08-01
Table 32: Single Family All-Electric Efficiency – Non-Preempted Package Measure Summary
VVLDCS – Verified Low Leakage Ducts in Conditioned Space
Page 153 of 319
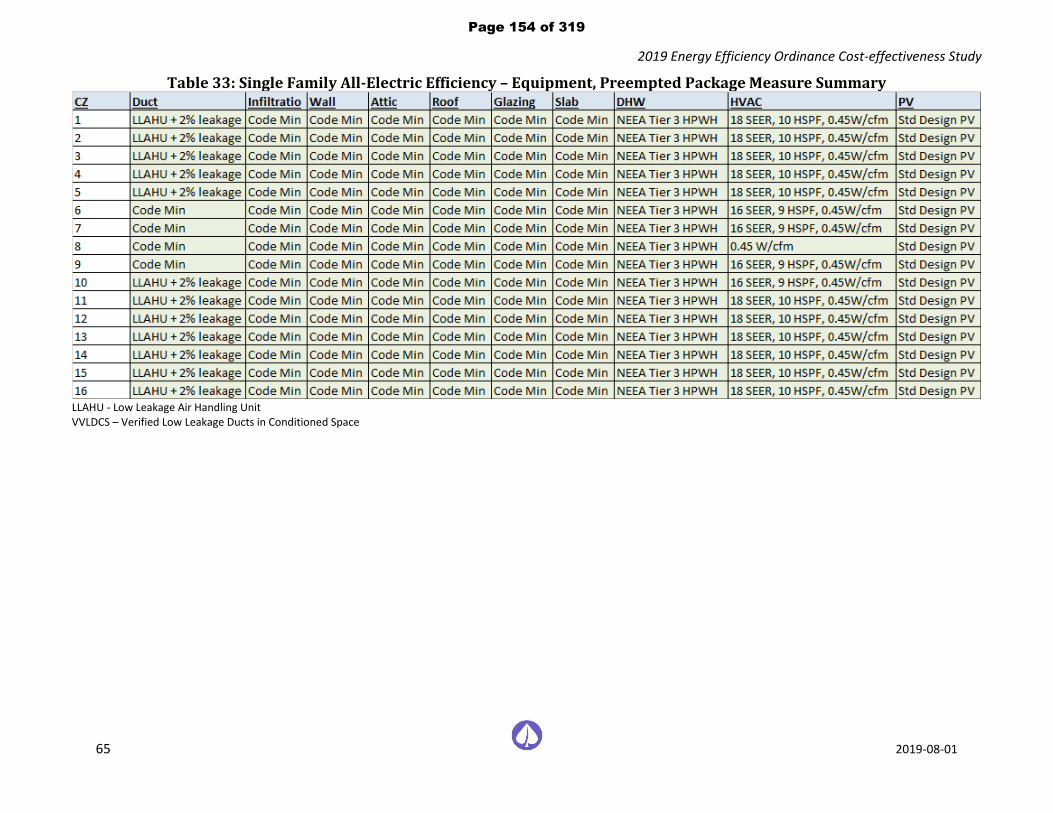
2019 Energy Efficiency Ordinance Cost-effectiveness Study
65 2019-08-01
Table 33: Single Family All-Electric Efficiency – Equipment, Preempted Package Measure Summary
LLAHU - Low Leakage Air Handling Unit VVLDCS – Verified Low Leakage Ducts in Conditioned Space
Page 154 of 319

2019 Energy Efficiency Ordinance Cost-effectiveness Study
66 2019-08-01
Table 34: Single Family All-Electric Efficiency & PV Package Measure Summary
VVLDCS – Verified Low Leakage Ducts in Conditioned Space
Page 155 of 319

2019 Energy Efficiency Ordinance Cost-effectiveness Study
67 2019-08-01
Table 35: Single Family All-Electric Efficiency & PV/Battery Package Measure Summary
VVLDCS – Verified Low Leakage Ducts in Conditioned Space
Page 156 of 319

2019 Energy Efficiency Ordinance Cost-effectiveness Study
68 2019-08-01
Appendix E – Multifamily Detailed Results
Table 36: Multifamily Mixed Fuel Efficiency Package Cost-Effectiveness Results
Clim
ate
Zo
ne
Uti
lity
BASECASE Non-Preempted Equipment - Preempted
Tota
l ED
R
Effi
cie
ncy
ED
R
CA
LGre
en
Tie
r 1
EDR
Tar
get
lbs
CO
2 p
er
sqft
PV
kW
pe
r
Bu
ildin
g
Tota
l ED
R
Effi
cie
ncy
ED
R
Effi
cie
ncy
ED
R
Mar
gin
% C
om
p M
argi
n
lbs
CO
2 p
er
sqft
PV
kW
pe
r
Bu
ildin
g
On
-Bill
B/C
Rat
io
TDV
B/C
Rat
io
Tota
l ED
R
Effi
cie
ncy
ED
R
Effi
cie
ncy
ED
R
Mar
gin
% C
om
p M
argi
n
lbs
CO
2 p
er
sqft
PV
kW
pe
r
Bu
ildin
g
On
-Bill
B/C
Rat
io
TDV
B/C
Rat
io
01 PG&E 28.6 60.7 23 2.7 15.9 25.1 57.3 3.4 19.3% 2.3 16.0 1.1 1.2 26.4 58.4 2.3 12.2% 2.5 15.9 1.3 1.4
02 PG&E 25.7 56.5 12 2.4 13.9 24.2 54.7 1.8 9.9% 2.3 13.8 1.0 1.7 23.6 54.2 2.3 12.5% 2.2 13.9 1.1 1.5
03 PG&E 24.7 57.8 10 2.1 13.5 24.0 57.2 0.6 4.7% 2.1 13.5 1.0 1.1 23.1 56.2 1.6 11.2% 1.9 13.4 1.1 1.2
04 PG&E 25.5 56.8 8 2.2 13.6 24.3 55.5 1.3 7.7% 2.1 13.5 0.8 1.2 23.8 54.9 1.9 10.9% 2.0 13.5 1.1 1.7
05 PG&E 24.2 57.4 10 2.1 12.6 23.7 56.9 0.5 4.4% 2.0 12.6 1.0 1.0 22.7 55.9 1.5 10.9% 1.9 12.6 1.2 1.3
05 PG&E/SoCalGas 24.2 57.4 10 2.1 12.6 23.7 56.9 0.5 4.4% 2.0 12.6 0.8 1.0 22.7 55.9 1.5 10.9% 1.9 12.6 1.1 1.3
06 SCE/SoCalGas 26.8 63.2 10 2.2 13.9 25.8 61.9 1.3 7.0% 2.1 13.8 0.6 1.5 25.5 61.9 1.3 7.4% 2.0 13.9 1.4 1.7
07 SDG&E 26.8 64.5 5 2.1 13.2 26.1 63.6 0.9 5.3% 2.1 13.1 0.7 2.2 25.0 62.5 2.0 12.2% 2.0 13.2 1.1 1.4
08 SCE/SoCalGas 25.7 61.8 10 2.2 14.6 24.6 60.3 1.5 7.4% 2.1 14.5 0.7 1.4 24.6 60.7 1.1 5.7% 2.0 14.6 1.4 1.7
09 SCE/SoCalGas 26.4 59.7 13 2.2 14.7 25.0 57.9 1.8 8.2% 2.2 14.4 1.5 3.3 24.1 56.9 2.8 12.9% 2.1 14.4 1.7 2.9
10 SCE/SoCalGas 27.0 58.7 10 2.3 15.1 25.7 57.0 1.7 7.7% 2.2 14.9 0.8 1.7 24.7 55.8 2.9 13.0% 2.1 14.8 2.0 3.3
10 SDG&E 27.0 58.7 10 2.3 15.1 25.7 57.0 1.7 7.7% 2.2 14.9 1.1 1.7 24.7 55.8 2.9 13.0% 2.1 14.8 2.6 3.3
11 PG&E 24.5 54.5 11 2.4 16.6 22.3 51.6 2.9 11.9% 2.2 16.3 0.7 1.2 22.2 51.3 3.2 13.2% 2.2 16.1 1.8 3.3
12 PG&E 25.9 55.3 12 2.3 14.9 24.3 53.4 1.9 8.8% 2.2 14.8 1.1 2.2 23.5 52.5 2.8 12.8% 2.1 14.7 1.2 2.2
13 PG&E 26.1 55.9 11 2.3 17.5 23.7 52.8 3.1 12.1% 2.1 17.1 0.6 1.3 23.7 52.5 3.4 13.2% 2.1 16.9 2.0 3.8
14 SCE/SoCalGas 25.6 55.9 15 2.8 14.6 23.1 52.8 3.1 12.8% 2.5 14.3 0.7 1.2 23.2 52.6 3.3 13.3% 2.5 14.2 2.0 3.0
14 SDG&E 25.6 55.9 15 2.8 14.6 23.1 52.8 3.1 12.8% 2.5 14.3 0.9 1.2 23.2 52.6 3.3 13.3% 2.5 14.2 2.5 3.0
15 SCE/SoCalGas 25.0 59.2 11 2.5 21.6 22.7 55.0 4.2 12.9% 2.4 20.4 1.4 2.3 22.6 54.8 4.4 13.5% 2.3 20.4 >1 >1
16 PG&E 29.4 57.3 22 3.5 13.4 26.6 54.9 2.4 11.3% 3.0 13.7 1.1 1.2 26.9 54.4 2.9 13.1% 3.1 13.2 1.8 2.1
“>1” = indicates cases where there is both first cost savings and annual utility bill savings.
Page 157 of 319

2019 Energy Efficiency Ordinance Cost-effectiveness Study
69 2019-08-01
Table 37: Multifamily Mixed Fuel Efficiency & PV/Battery Package Cost-Effectiveness Results
CZ Utility
BASECASE Efficiency & PV/Battery
Total EDR
CALGreen Tier 1 EDR
Target lbs CO2 per sqft
PV kW
per Building
Total EDR
Total EDR
Margin % Comp Margin
lbs CO2 per sqft
PV kW
per Building
On-Bill B/C Ratio
TDV B/C Ratio
01 PG&E 28.6 23 2.7 15.9 17.1 11.5 29.3% 2.1 16.5 0.4 1.2
02 PG&E 25.7 12 2.4 13.9 14.8 10.9 16.9% 2.1 14.2 0.2 1.6
03 PG&E 24.7 10 2.1 13.5 14.4 10.3 10.7% 1.9 13.9 0.1 1.4
04 PG&E 25.5 8 2.2 13.6 14.3 11.2 15.7% 1.9 13.9 0.2 1.6
05 PG&E 24.2 10 2.1 12.6 14.3 9.9 9.4% 1.8 13.1 0.2 1.4
05 PG&E/SoCalGas 24.2 10 2.1 12.6 14.3 9.9 9.4% 1.8 13.1 0.1 1.4
06 SCE/SoCalGas 26.8 10 2.2 13.9 16.1 10.7 10.0% 1.8 14.2 0.6 1.4
07 SDG&E 26.8 5 2.1 13.2 15.8 11.0 7.3% 1.7 13.6 0.0 1.4
08 SCE/SoCalGas 25.7 10 2.2 14.6 15.8 9.9 13.4% 1.8 14.9 0.7 1.3
09 SCE/SoCalGas 26.4 13 2.2 14.7 16.7 9.7 15.2% 1.8 14.9 0.9 1.5
10 SCE/SoCalGas 27.0 10 2.3 15.1 16.6 10.4 13.7% 1.9 15.3 1.0 1.6
10 SDG&E 27.0 10 2.3 15.1 16.6 10.4 13.7% 1.9 15.3 0.2 1.6
11 PG&E 24.5 11 2.4 16.6 14.0 10.5 19.9% 2.0 16.7 0.4 1.6
12 PG&E 25.9 12 2.3 14.9 15.6 10.3 17.8% 2.0 15.2 0.3 1.7
13 PG&E 26.1 11 2.3 17.5 15.4 10.7 20.1% 2.0 17.5 0.4 1.6
14 SCE/SoCalGas 25.6 15 2.8 14.6 16.0 9.6 20.8% 2.2 14.7 1.1 1.4
14 SDG&E 25.6 15 2.8 14.6 16.0 9.6 20.8% 2.2 14.7 0.5 1.4
15 SCE/SoCalGas 25.0 11 2.5 21.6 16.2 8.8 18.9% 2.1 20.9 1.3 1.7
16 PG&E 29.4 22 3.5 13.4 19.5 9.9 19.3% 2.7 14.1 0.5 1.3 “inf” = indicates cases where there is both first cost savings and annual utility bill savings.
Page 158 of 319

2019 Energy Efficiency Ordinance Cost-effectiveness Study
70 2019-08-01
Table 38: Multifamily All-Electric Efficiency Package Cost-Effectiveness Results
CZ Utility
BASECASE Non-Preempted Equipment - Preempted
Tota
l ED
R
Effi
cie
ncy
ED
R
CA
LGre
en
Tie
r
1 E
DR
Tar
get
lbs
CO
2 p
er
sqft
PV
kW
pe
r
Bu
ildin
g
Tota
l ED
R
Effi
cie
ncy
ED
R
Effi
cie
ncy
ED
R
Mar
gin
% C
om
p
Mar
gin
lbs
CO
2 p
er
sqft
PV
kW
pe
r
Bu
ildin
g
On
-Bill
B/C
Rat
io
TDV
B/C
Rat
io
Tota
l ED
R
Effi
cie
ncy
ED
R
Effi
cie
ncy
ED
R
Mar
gin
% C
om
p
Mar
gin
lbs
CO
2 p
er
sqft
PV
kW
pe
r
Bu
ildin
g
On
-Bill
B/C
Rat
io
TDV
B/C
Rat
io
01 PG&E 41.1 70.6 36 1.6 15.9 37.5 67.0 3.6 14.6% 1.5 15.9 1.6 1.4 37.1 67.3 3.3 18.4% 1.4 15.9 2.4 2.3
02 PG&E 34.3 63.4 16 1.4 13.9 32.4 61.5 1.9 9.1% 1.3 13.9 1.7 2.1 31.1 60.2 3.2 15.1% 1.3 13.9 1.6 1.6
03 PG&E 33.5 64.2 14 1.3 13.5 33.5 64.2 0.0 0.0% 1.3 13.5 - - 30.4 61.5 2.7 19.5% 1.1 13.5 1.7 1.6
04 PG&E 32.0 61.4 12 1.3 13.6 30.5 60.0 1.4 8.0% 1.2 13.6 1.4 1.5 29.7 59.2 2.2 12.2% 1.2 13.6 1.2 1.1
05 PG&E 34.7 65.4 16 1.3 12.6 34.1 64.8 0.6 3.4% 1.3 12.6 1.1 0.9 30.6 61.8 3.6 23.5% 1.2 12.6 2.1 2.0
05 PG&E/SoCalGas 34.7 65.4 16 1.3 12.6 34.1 64.8 0.6 3.4% 1.3 12.6 1.1 0.9 30.6 61.8 3.6 23.5% 1.2 12.6 2.1 2.0
06 SCE/SoCalGas 31.9 65.9 12 1.3 13.9 30.9 64.9 1.0 5.9% 1.3 13.9 0.7 1.3 29.8 63.7 2.2 13.0% 1.2 13.9 1.6 1.9
07 SDG&E 31.7 66.6 7 1.2 13.2 31.1 66.0 0.6 4.6% 1.2 13.2 0.6 1.0 29.7 64.7 1.9 13.6% 1.1 13.2 1.6 1.7
08 SCE/SoCalGas 29.8 63.6 10 1.3 14.6 28.6 62.4 1.2 6.5% 1.2 14.6 0.9 1.7 27.9 61.7 1.9 10.3% 1.2 14.6 1.6 1.8
09 SCE/SoCalGas 30.4 61.9 13 1.3 14.7 28.7 60.3 1.6 8.1% 1.3 14.7 1.3 2.7 28.8 60.4 1.5 7.4% 1.2 14.7 1.6 1.6
10 SCE/SoCalGas 31.2 61.3 11 1.4 15.1 29.3 59.5 1.8 8.7% 1.3 15.1 1.2 2.0 29.3 59.5 1.8 8.6% 1.3 15.1 1.7 2.0
10 SDG&E 31.2 61.3 11 1.4 15.1 29.3 59.5 1.8 8.7% 1.3 15.1 1.5 2.0 29.3 59.5 1.8 8.6% 1.3 15.1 2.0 2.0
11 PG&E 31.9 60.6 12 1.4 16.6 28.5 57.1 3.5 13.1% 1.3 16.6 1.4 1.6 28.1 56.7 3.9 14.4% 1.3 16.6 2.0 2.3
12 PG&E 32.0 59.9 13 1.3 14.9 29.4 57.3 2.6 11.4% 1.2 14.9 0.9 1.1 29.0 57.0 2.9 13.0% 1.2 14.9 1.6 1.6
13 PG&E 32.1 60.5 13 1.4 17.5 28.8 57.2 3.3 12.6% 1.2 17.5 1.3 1.6 28.3 56.7 3.8 14.3% 1.2 17.5 2.0 2.3
14 SCE/SoCalGas 32.5 61.6 16 1.7 14.6 28.9 57.9 3.7 13.8% 1.6 14.6 1.2 1.6 28.7 57.8 3.8 14.3% 1.6 14.6 1.6 2.2
14 SDG&E 32.5 61.6 16 1.7 14.6 28.9 57.9 3.7 13.8% 1.6 14.6 1.5 1.6 28.7 57.8 3.8 14.3% 1.6 14.6 2.0 2.2
15 SCE/SoCalGas 28.2 61.0 8 1.8 21.6 23.9 56.6 4.4 14.2% 1.6 21.6 1.5 2.3 21.9 54.6 6.4 20.6% 1.5 21.6 1.2 1.7
16 PG&E 40.2 66.6 39 1.9 13.4 36.2 62.5 4.1 15.0% 1.7 13.4 2.1 2.1 37.1 63.4 3.2 11.4% 1.7 13.4 1.6 1.7
“>1” = indicates cases where there is both first cost savings and annual utility bill savings.
Page 159 of 319

2019 Energy Efficiency Ordinance Cost-effectiveness Study
71 2019-08-01
Table 39: Multifamily All-Electric Efficiency & PV-PV/Battery Package Cost-Effectiveness Results C
limat
e Zo
ne
Uti
lity
BASECASE Efficiency & PV Efficiency & PV/Battery
Tota
l ED
R
CA
LGre
en
Tie
r
1 E
DR
Tar
get
lbs
CO
2 p
er
sqft
PV
kW
pe
r
Bu
ildin
g
Tota
l ED
R
Tota
l ED
R
Mar
gin
% C
om
p
Mar
gin
lbs
CO
2 p
er
sqft
PV
kW
pe
r
Bu
ildin
g
On
-Bill
B/C
Rat
io
TDV
B/C
Rat
io
Tota
l ED
R
Tota
l ED
R
Mar
gin
% C
om
p
Mar
gin
lbs
CO
2 p
er
sqft
PV
kW
pe
r
Bu
ildin
g
On
-Bill
B/C
Rat
io
TDV
B/C
Rat
io
01 PG&E 41.1 36 1.6 15.9 18.6 22.5 14.6% 0.8 26.9 2.0 1.5 6.6 34.5 24.6% 0.4 30.3 1.3 1.4
02 PG&E 34.3 16 1.4 13.9 16.8 17.5 9.1% 0.7 21.9 2.4 1.8 3.4 30.9 16.1% 0.3 24.8 1.4 1.7
03 PG&E 33.5 14 1.3 13.5 17.4 16.1 2.6% 0.7 20.8 2.4 1.7 4.0 29.5 8.6% 0.3 23.6 1.3 1.6
04 PG&E 32.0 12 1.3 13.6 17.0 15.0 8.0% 0.7 20.2 2.4 1.8 3.1 28.9 16.0% 0.3 22.9 1.30 1.77
05 PG&E 34.7 16 1.3 12.6 17.6 17.1 3.4% 0.7 19.9 2.5 1.8 4.4 30.3 8.4% 0.3 22.5 1.4 1.7
05 PG&E/SoCalGas 34.7 16 1.3 12.6 17.6 17.1 3.4% 0.7 19.9 2.5 1.8 4.4 30.3 8.4% 0.3 22.5 1.4 1.7
06 SCE/SoCalGas 31.9 12 1.3 13.9 18.1 13.8 5.9% 1.0 19.5 1.2 1.7 4.4 27.5 8.9% 0.5 22.1 1.2 1.6
07 SDG&E 31.7 7 1.2 13.2 18.9 12.8 4.6% 0.9 18.1 2.1 1.8 4.6 27.1 6.6% 0.5 20.5 1.2 1.6
08 SCE/SoCalGas 29.8 10 1.3 14.6 18.2 11.6 6.5% 1.0 19.4 1.3 1.8 5.6 24.2 12.5% 0.5 22.0 1.2 1.6
09 SCE/SoCalGas 30.4 13 1.3 14.7 19.1 11.3 8.1% 1.0 19.4 1.3 1.9 7.1 23.3 15.1% 0.6 22.0 1.3 1.7
10 SCE/SoCalGas 31.2 11 1.4 15.1 20.4 10.8 8.7% 1.1 19.9 1.3 1.8 7.9 23.3 14.7% 0.6 22.5 1.3 1.7
10 SDG&E 31.2 11 1.4 15.1 20.4 10.8 8.7% 1.1 19.9 2.1 1.8 7.9 23.3 14.7% 0.6 22.5 1.4 1.7
11 PG&E 31.9 12 1.4 16.6 18.5 13.4 13.1% 0.8 22.8 2.2 1.8 6.6 25.3 21.1% 0.4 25.8 1.4 1.8
12 PG&E 32.0 13 1.3 14.9 17.6 14.4 11.4% 0.7 21.7 2.1 1.6 5.4 26.6 20.4% 0.4 24.5 1.3 1.7
13 PG&E 32.1 13 1.4 17.5 19.9 12.2 12.6% 0.8 23.3 2.1 1.7 8.2 23.9 20.6% 0.4 26.4 1.4 1.7
14 SCE/SoCalGas 32.5 16 1.7 14.6 18.5 14.0 13.8% 1.3 20.2 1.4 1.9 7.7 24.8 21.8% 0.8 22.8 1.4 1.8
14 SDG&E 32.5 16 1.7 14.6 18.5 14.0 13.8% 1.3 20.2 2.2 1.9 7.7 24.8 21.8% 0.8 22.8 1.7 1.8
15 SCE/SoCalGas 28.2 8 1.8 21.6 21.1 7.1 14.2% 1.5 23.6 1.4 2.1 11.3 16.9 20.2% 1.1 26.6 1.3 1.8
16 PG&E 40.2 39 1.9 13.4 20.6 19.6 15.0% 1.2 22.0 2.6 1.9 10.3 29.9 23.0% 0.8 24.8 1.6 1.7 “>1” = indicates cases where there is both first cost savings and annual utility bill savings.
Page 160 of 319

2019 Energy Efficiency Ordinance Cost-effectiveness Study
72 2019-08-01
Appendix F – Multifamily Measure Summary
Table 40: Multifamily Mixed Fuel Efficiency – Non-Preempted Package Measure Summary
VLLDCS – Verified Low-Leakage Ducts in Conditioned Space
Page 161 of 319

2019 Energy Efficiency Ordinance Cost-effectiveness Study
73 2019-08-01
Table 41: Multifamily Mixed Fuel Efficiency – Equipment, Preempted Package Measure Summary
VLLDCS – Verified Low-Leakage Ducts in Conditioned Space
Page 162 of 319

2019 Energy Efficiency Ordinance Cost-effectiveness Study
74 2019-08-01
Table 42: Multifamily Mixed Fuel Efficiency & PV/Battery Package Measure Summary
VLLDCS – Verified Low-Leakage Ducts in Conditioned Space
Page 163 of 319
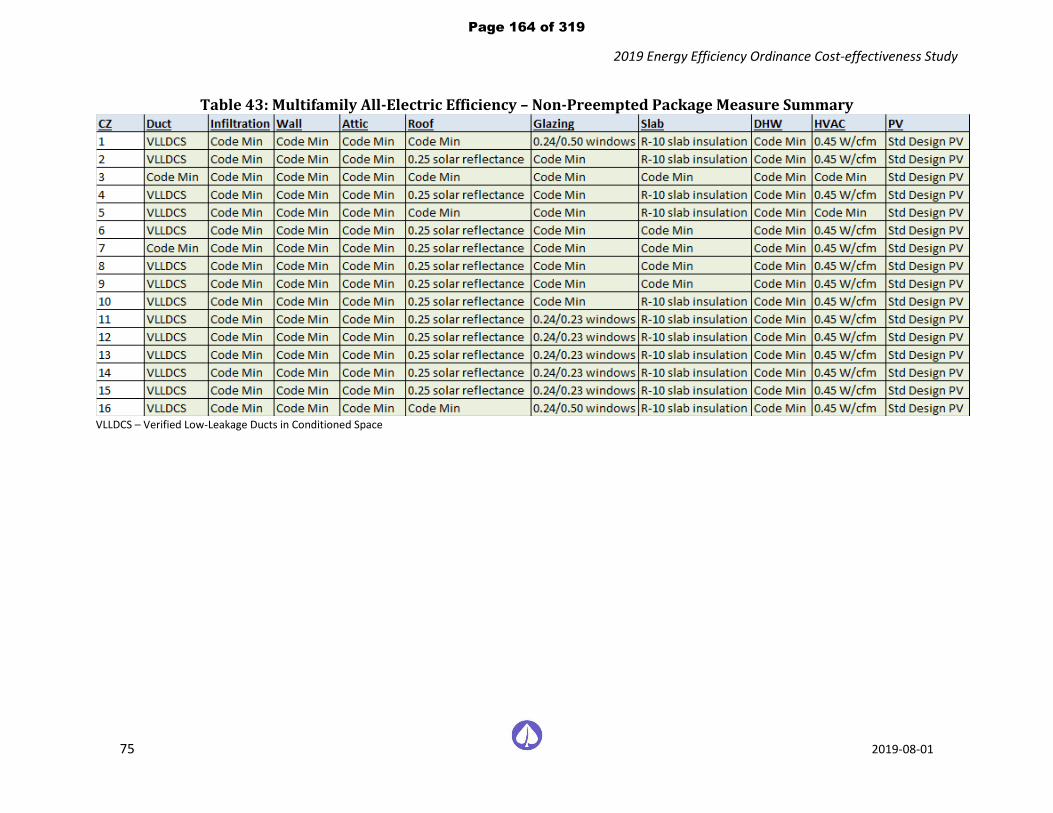
2019 Energy Efficiency Ordinance Cost-effectiveness Study
75 2019-08-01
Table 43: Multifamily All-Electric Efficiency – Non-Preempted Package Measure Summary
VLLDCS – Verified Low-Leakage Ducts in Conditioned Space
Page 164 of 319

2019 Energy Efficiency Ordinance Cost-effectiveness Study
76 2019-08-01
Table 44: Multifamily All-Electric Efficiency – Equipment, Preempted Package Measure Summary
VLLDCS – Verified Low-Leakage Ducts in Conditioned Space
Page 165 of 319
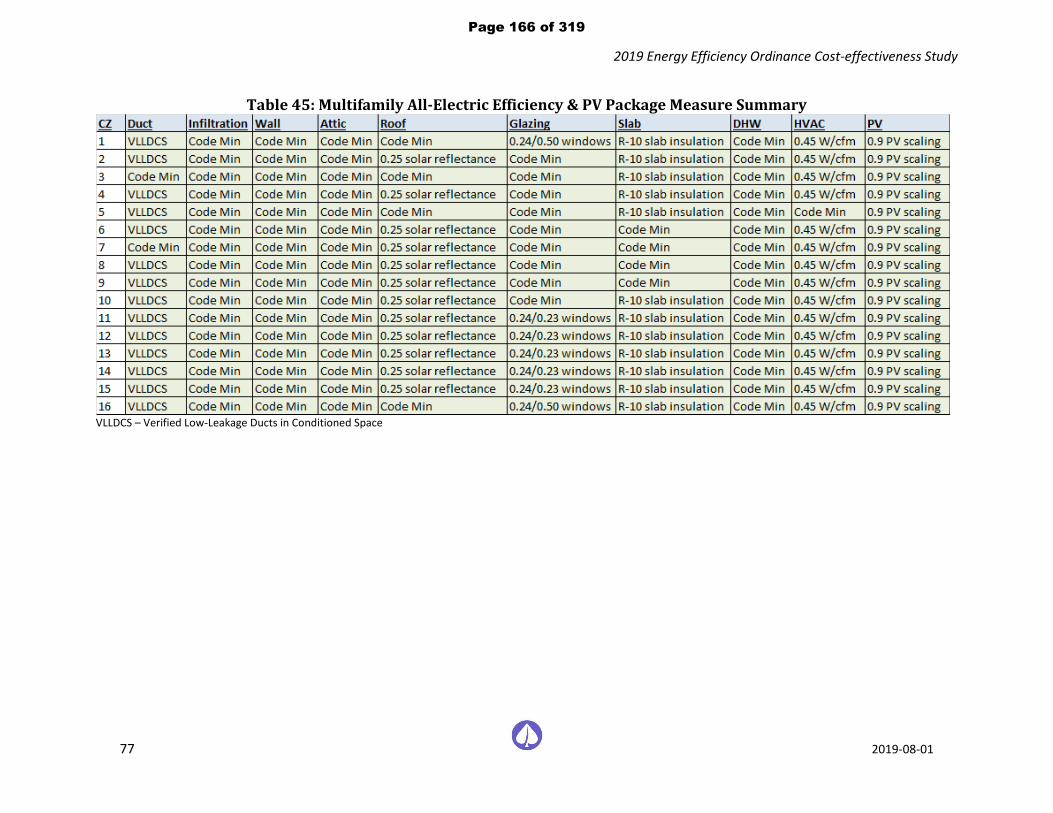
2019 Energy Efficiency Ordinance Cost-effectiveness Study
77 2019-08-01
Table 45: Multifamily All-Electric Efficiency & PV Package Measure Summary
VLLDCS – Verified Low-Leakage Ducts in Conditioned Space
Page 166 of 319

2019 Energy Efficiency Ordinance Cost-effectiveness Study
78 2019-08-01
Table 46: Multifamily All-Electric Efficiency & PV/Battery Package Measure Summary
VLLDCS – Verified Low-Leakage Ducts in Conditioned Space
Page 167 of 319
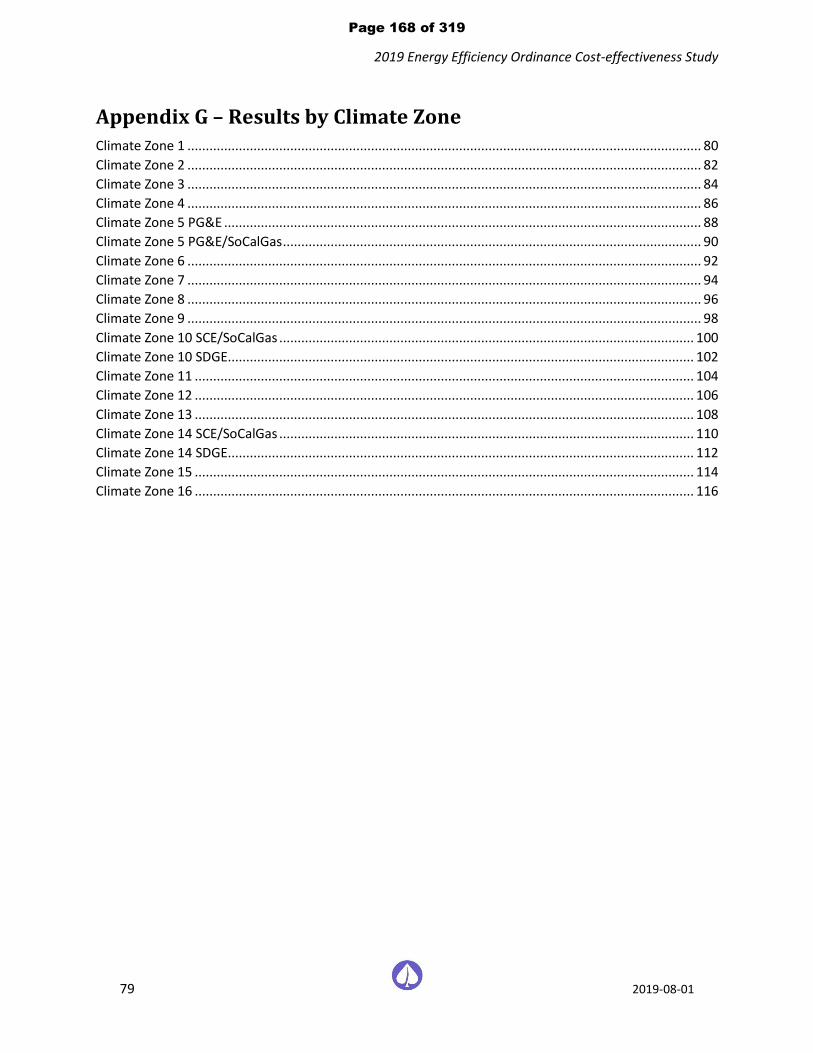
2019 Energy Efficiency Ordinance Cost-effectiveness Study
79 2019-08-01
Appendix G – Results by Climate Zone Climate Zone 1 ............................................................................................................................................ 80
Climate Zone 2 ............................................................................................................................................ 82
Climate Zone 3 ............................................................................................................................................ 84
Climate Zone 4 ............................................................................................................................................ 86
Climate Zone 5 PG&E .................................................................................................................................. 88
Climate Zone 5 PG&E/SoCalGas .................................................................................................................. 90
Climate Zone 6 ............................................................................................................................................ 92
Climate Zone 7 ............................................................................................................................................ 94
Climate Zone 8 ............................................................................................................................................ 96
Climate Zone 9 ............................................................................................................................................ 98
Climate Zone 10 SCE/SoCalGas ................................................................................................................. 100
Climate Zone 10 SDGE............................................................................................................................... 102
Climate Zone 11 ........................................................................................................................................ 104
Climate Zone 12 ........................................................................................................................................ 106
Climate Zone 13 ........................................................................................................................................ 108
Climate Zone 14 SCE/SoCalGas ................................................................................................................. 110
Climate Zone 14 SDGE............................................................................................................................... 112
Climate Zone 15 ........................................................................................................................................ 114
Climate Zone 16 ........................................................................................................................................ 116
Page 168 of 319

2019 Energy Efficiency Ordinance Cost-effectiveness Study
80 2019-08-01
Climate Zone 1
Table 47: Single Family Climate Zone 1 Results Summary
Climate Zone 1 PG&E Single Family
Annual Net kWh
Annual therms
EDR Margin4
PV Size Change
(kW)5
CO2-Equivalent Emissions (lbs/sf)
NPV of Lifetime
Incremental Cost ($)
Benefit to Cost Ratio (B/C)
Total Reduction On-Bill TDV
Mix
ed
Fu
el 1
Code Compliant (0) 581 n/a n/a 3.00 n/a n/a n/a n/a
Efficiency-Non-Preempted (0) 480 5.0 (0.08) 2.51 0.49 $1,355 3.38 2.82
Efficiency-Equipment 0 440 6.5 (0.07) 2.32 0.68 $1,280 4.92 4.10
Efficiency & PV/Battery (28) 480 10.5 0.04 2.40 0.60 $5,311 0.87 1.61
All
-Ele
ctr
ic 2 Code Compliant 7,079 0 n/a n/a 1.51 n/a n/a n/a n/a
Efficiency-Non-Preempted 4,461 0 15.0 0.00 1.01 0.50 $7,642 1.79 1.66
Efficiency-Equipment 5,933 0 6.5 0.00 1.29 0.22 $2,108 2.94 2.74
Efficiency & PV 889 0 31.0 2.67 0.52 1.00 $18,192 1.81 1.45
Efficiency & PV/Battery (14) 0 41.0 3.45 0.28 1.23 $24,770 1.45 1.40
Mix
ed
Fu
el to
All
-Ele
ctr
ic 3
Code Compliant 7,079 0 0.0 0.00 1.51 1.49 ($5,349) 0.37 0.91
Efficiency & PV 889 0 31.0 2.67 0.52 2.48 $12,844 1.43 2.11
Neutral Cost 5,270 0 8.0 1.35 1.26 1.74 $0 0.00 1.09
Min Cost Effectiveness 3,106 0 18.0 2.97 0.95 2.04 ($6,372) 1.08 >1
1All reductions and incremental costs relative to the mixed fuel code compliant home. 2All reductions and incremental costs relative to the all-electric code compliant home. 3All reductions and incremental costs relative to the mixed fuel code compliant home except the EDR Margins are relative to the Standard Design for each case
which is the all-electric code compliant home. Incremental costs for these packages reflect the cots used in the On-Bill cost effectiveness methodology. Costs differ for the TDV methodology due to differences in the site gas infrastructure costs (see Section 2.6). 4This represents the Efficiency EDR Margin for the Efficiency-Non-Preempted and Efficiency-Equipment packages and Total EDR Margin for the Efficiency & PV, Efficiency & PV/Battery, Neutral Cost, and Min Cost Effectiveness packages. 5Positive values indicate an increase in PV capacity relative to the Standard Design.
Page 169 of 319
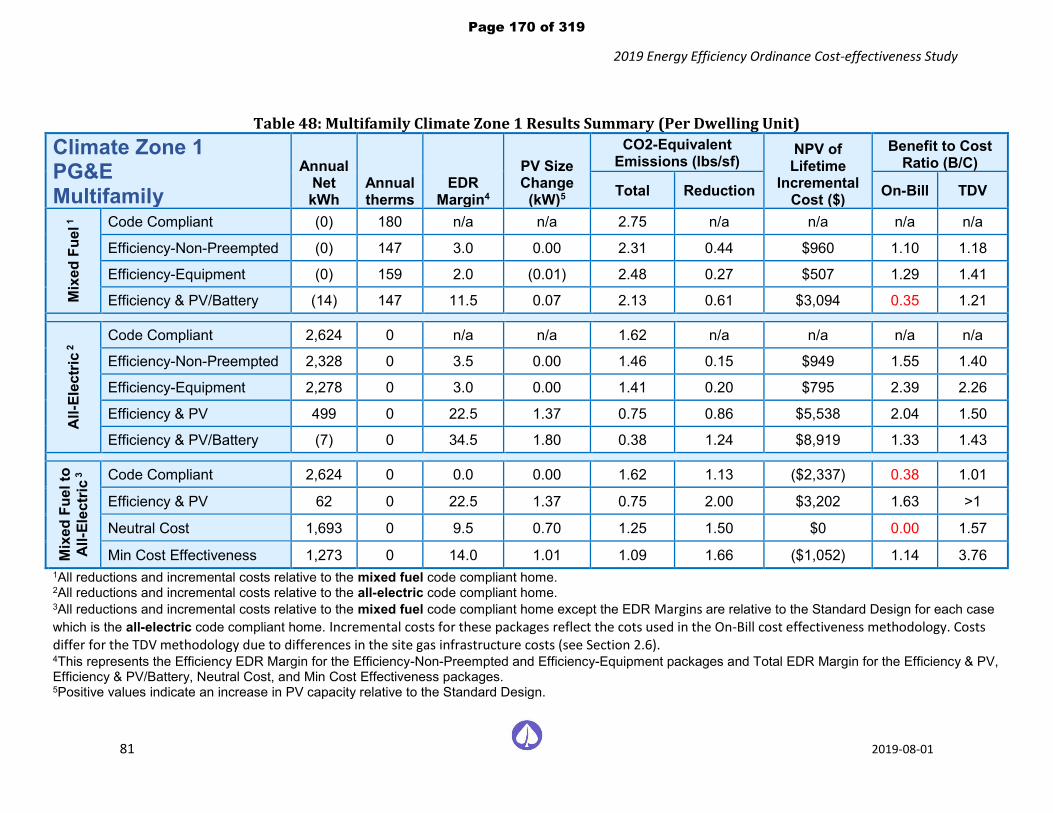
2019 Energy Efficiency Ordinance Cost-effectiveness Study
81 2019-08-01
Table 48: Multifamily Climate Zone 1 Results Summary (Per Dwelling Unit)
Climate Zone 1 PG&E Multifamily
Annual Net kWh
Annual therms
EDR Margin4
PV Size Change
(kW)5
CO2-Equivalent Emissions (lbs/sf)
NPV of Lifetime
Incremental Cost ($)
Benefit to Cost Ratio (B/C)
Total Reduction On-Bill TDV
Mix
ed
Fu
el 1
Code Compliant (0) 180 n/a n/a 2.75 n/a n/a n/a n/a
Efficiency-Non-Preempted (0) 147 3.0 0.00 2.31 0.44 $960 1.10 1.18
Efficiency-Equipment (0) 159 2.0 (0.01) 2.48 0.27 $507 1.29 1.41
Efficiency & PV/Battery (14) 147 11.5 0.07 2.13 0.61 $3,094 0.35 1.21
All
-Ele
ctr
ic 2 Code Compliant 2,624 0 n/a n/a 1.62 n/a n/a n/a n/a
Efficiency-Non-Preempted 2,328 0 3.5 0.00 1.46 0.15 $949 1.55 1.40
Efficiency-Equipment 2,278 0 3.0 0.00 1.41 0.20 $795 2.39 2.26
Efficiency & PV 499 0 22.5 1.37 0.75 0.86 $5,538 2.04 1.50
Efficiency & PV/Battery (7) 0 34.5 1.80 0.38 1.24 $8,919 1.33 1.43
Mix
ed
Fu
el to
All
-Ele
ctr
ic 3
Code Compliant 2,624 0 0.0 0.00 1.62 1.13 ($2,337) 0.38 1.01
Efficiency & PV 62 0 22.5 1.37 0.75 2.00 $3,202 1.63 >1
Neutral Cost 1,693 0 9.5 0.70 1.25 1.50 $0 0.00 1.57
Min Cost Effectiveness 1,273 0 14.0 1.01 1.09 1.66 ($1,052) 1.14 3.76
1All reductions and incremental costs relative to the mixed fuel code compliant home. 2All reductions and incremental costs relative to the all-electric code compliant home. 3All reductions and incremental costs relative to the mixed fuel code compliant home except the EDR Margins are relative to the Standard Design for each case
which is the all-electric code compliant home. Incremental costs for these packages reflect the cots used in the On-Bill cost effectiveness methodology. Costs differ for the TDV methodology due to differences in the site gas infrastructure costs (see Section 2.6). 4This represents the Efficiency EDR Margin for the Efficiency-Non-Preempted and Efficiency-Equipment packages and Total EDR Margin for the Efficiency & PV, Efficiency & PV/Battery, Neutral Cost, and Min Cost Effectiveness packages. 5Positive values indicate an increase in PV capacity relative to the Standard Design.
Page 170 of 319
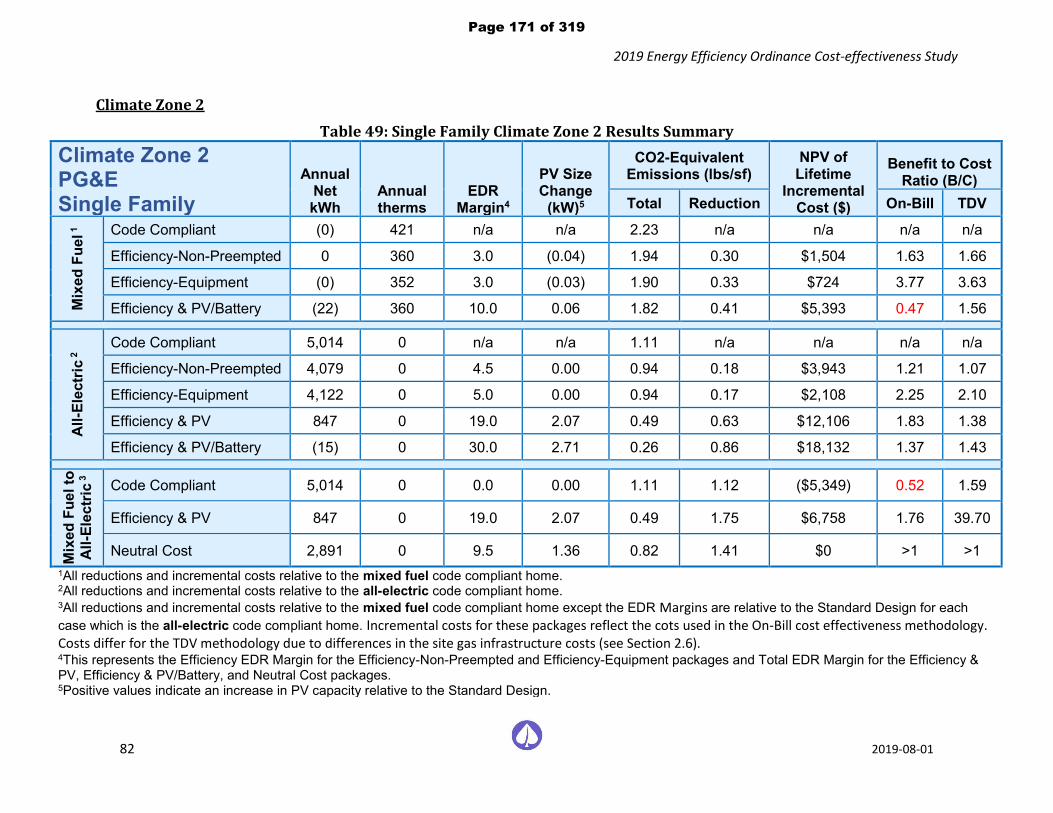
2019 Energy Efficiency Ordinance Cost-effectiveness Study
82 2019-08-01
Climate Zone 2
Table 49: Single Family Climate Zone 2 Results Summary
Climate Zone 2 PG&E Single Family
Annual Net kWh
Annual therms
EDR Margin4
PV Size Change
(kW)5
CO2-Equivalent Emissions (lbs/sf)
NPV of Lifetime
Incremental Cost ($)
Benefit to Cost Ratio (B/C)
Total Reduction On-Bill TDV
Mix
ed
Fu
el 1
Code Compliant (0) 421 n/a n/a 2.23 n/a n/a n/a n/a
Efficiency-Non-Preempted 0 360 3.0 (0.04) 1.94 0.30 $1,504 1.63 1.66
Efficiency-Equipment (0) 352 3.0 (0.03) 1.90 0.33 $724 3.77 3.63
Efficiency & PV/Battery (22) 360 10.0 0.06 1.82 0.41 $5,393 0.47 1.56
All
-Ele
ctr
ic 2 Code Compliant 5,014 0 n/a n/a 1.11 n/a n/a n/a n/a
Efficiency-Non-Preempted 4,079 0 4.5 0.00 0.94 0.18 $3,943 1.21 1.07
Efficiency-Equipment 4,122 0 5.0 0.00 0.94 0.17 $2,108 2.25 2.10
Efficiency & PV 847 0 19.0 2.07 0.49 0.63 $12,106 1.83 1.38
Efficiency & PV/Battery (15) 0 30.0 2.71 0.26 0.86 $18,132 1.37 1.43
Mix
ed
Fu
el to
All
-Ele
ctr
ic 3
Code Compliant 5,014 0 0.0 0.00 1.11 1.12 ($5,349) 0.52 1.59
Efficiency & PV 847 0 19.0 2.07 0.49 1.75 $6,758 1.76 39.70
Neutral Cost 2,891 0 9.5 1.36 0.82 1.41 $0 >1 >1
1All reductions and incremental costs relative to the mixed fuel code compliant home. 2All reductions and incremental costs relative to the all-electric code compliant home. 3All reductions and incremental costs relative to the mixed fuel code compliant home except the EDR Margins are relative to the Standard Design for each
case which is the all-electric code compliant home. Incremental costs for these packages reflect the cots used in the On-Bill cost effectiveness methodology. Costs differ for the TDV methodology due to differences in the site gas infrastructure costs (see Section 2.6). 4This represents the Efficiency EDR Margin for the Efficiency-Non-Preempted and Efficiency-Equipment packages and Total EDR Margin for the Efficiency & PV, Efficiency & PV/Battery, and Neutral Cost packages. 5Positive values indicate an increase in PV capacity relative to the Standard Design.
Page 171 of 319

2019 Energy Efficiency Ordinance Cost-effectiveness Study
83 2019-08-01
Table 50: Multifamily Climate Zone 2 Results Summary (Per Dwelling Unit)
Climate Zone 2 PG&E Multifamily
Annual Net kWh
Annual therms
EDR Margin4
PV Size Change
(kW)5
CO2-Equivalent Emissions (lbs/sf)
NPV of Lifetime
Incremental Cost ($)
Benefit to Cost Ratio (B/C)
Total Reduction On-Bill TDV
Mix
ed
Fu
el 1
Code Compliant (0) 150 n/a n/a 2.37 n/a n/a n/a n/a
Efficiency-Non-Preempted 0 142 1.5 (0.02) 2.25 0.12 $309 0.97 1.75
Efficiency-Equipment (0) 134 2.0 (0.01) 2.15 0.22 $497 1.08 1.49
Efficiency & PV/Battery (11) 142 10.5 0.04 2.07 0.30 $2,413 0.17 1.60
All
-Ele
ctr
ic 2 Code Compliant 2,151 0 n/a n/a 1.38 n/a n/a n/a n/a
Efficiency-Non-Preempted 2,038 0 1.5 0.00 1.32 0.06 $361 1.73 2.05
Efficiency-Equipment 1,928 0 3.0 0.00 1.25 0.13 $795 1.56 1.56
Efficiency & PV 476 0 17.5 1.00 0.72 0.67 $3,711 2.42 1.82
Efficiency & PV/Battery (7) 0 30.5 1.36 0.35 1.04 $6,833 1.38 1.74
Mix
ed
Fu
el to
All
-Ele
ctr
ic 3
Code Compliant 2,151 0 0.0 0.00 1.38 0.99 ($2,337) 0.53 1.42
Efficiency & PV 60 0 17.5 1.00 0.72 1.65 $1,375 3.31 >1
Neutral Cost 1,063 0 10.5 0.70 0.96 1.41 $0 >1 >1
1All reductions and incremental costs relative to the mixed fuel code compliant home. 2All reductions and incremental costs relative to the all-electric code compliant home. 3All reductions and incremental costs relative to the mixed fuel code compliant home except the EDR Margins are relative to the Standard Design for each case
which is the all-electric code compliant home. Incremental costs for these packages reflect the cots used in the On-Bill cost effectiveness methodology. Costs differ for the TDV methodology due to differences in the site gas infrastructure costs (see Section 2.6). 4This represents the Efficiency EDR Margin for the Efficiency-Non-Preempted and Efficiency-Equipment packages and Total EDR Margin for the Efficiency & PV, Efficiency & PV/Battery, and Neutral Cost packages. 5Positive values indicate an increase in PV capacity relative to the Standard Design.
Page 172 of 319

2019 Energy Efficiency Ordinance Cost-effectiveness Study
84 2019-08-01
Climate Zone 3
Table 51: Single Family Climate Zone 3 Results Summary
Climate Zone 3 PG&E Single Family
Annual Net kWh
Annual therms
EDR Margin4
PV Size Change
(kW)5
CO2-Equivalent Emissions (lbs/sf)
NPV of Lifetime
Incremental Cost ($)
Benefit to Cost Ratio (B/C)
Total Reduction On-Bill TDV
Mix
ed
Fu
el 1
Code Compliant (0) 348 n/a n/a 1.88 n/a n/a n/a n/a
Efficiency-Non-Preempted (0) 296 2.5 (0.03) 1.63 0.26 $1,552 1.28 1.31
Efficiency-Equipment (0) 273 4.0 (0.03) 1.52 0.37 $1,448 1.91 1.97
Efficiency & PV/Battery (20) 296 10.0 0.07 1.50 0.38 $5,438 0.38 1.38
All
-Ele
ctr
ic 2 Code Compliant 4,355 0 n/a n/a 1.00 n/a n/a n/a n/a
Efficiency-Non-Preempted 3,584 0 4.5 0.00 0.85 0.15 $1,519 2.60 2.36
Efficiency-Equipment 3,670 0 4.0 0.00 0.86 0.14 $2,108 1.76 1.62
Efficiency & PV 790 0 18.0 1.77 0.46 0.54 $8,517 2.22 1.68
Efficiency & PV/Battery (12) 0 29.0 2.37 0.23 0.76 $14,380 1.50 1.58
Mix
ed
Fu
el to
All
-Ele
ctr
ic 3
Code Compliant 4,355 0 0.0 0.00 1.00 0.89 ($5,349) 0.55 1.53
Efficiency & PV 790 0 18.0 1.77 0.46 1.43 $3,169 2.88 >1
Neutral Cost 2,217 0 10.5 1.35 0.70 1.18 $0 >1 >1
1All reductions and incremental costs relative to the mixed fuel code compliant home. 2All reductions and incremental costs relative to the all-electric code compliant home. 3All reductions and incremental costs relative to the mixed fuel code compliant home except the EDR Margins are relative to the Standard Design for each
case which is the all-electric code compliant home. Incremental costs for these packages reflect the cots used in the On-Bill cost effectiveness methodology. Costs differ for the TDV methodology due to differences in the site gas infrastructure costs (see Section 2.6). 4This represents the Efficiency EDR Margin for the Efficiency-Non-Preempted and Efficiency-Equipment packages and Total EDR Margin for the Efficiency & PV, Efficiency & PV/Battery, and Neutral Cost packages. 5Positive values indicate an increase in PV capacity relative to the Standard Design.
Page 173 of 319

2019 Energy Efficiency Ordinance Cost-effectiveness Study
85 2019-08-01
Table 52: Multifamily Climate Zone 3 Results Summary (Per Dwelling Unit)
Climate Zone 3 PG&E Multifamily
Annual Net kWh
Annual therms
EDR Margin4
PV Size Change
(kW)5
CO2-Equivalent Emissions (lbs/sf)
NPV of Lifetime
Incremental Cost ($)
Benefit to Cost Ratio (B/C)
Total Reduction On-Bill TDV
Mix
ed
Fu
el 1
Code Compliant (0) 133 n/a n/a 2.13 n/a n/a n/a n/a
Efficiency-Non-Preempted (0) 127 0.5 (0.00) 2.06 0.07 $175 1.00 1.11
Efficiency-Equipment (0) 119 1.5 (0.00) 1.94 0.19 $403 1.11 1.23
Efficiency & PV/Battery (10) 127 10.0 0.05 1.86 0.27 $2,279 0.11 1.41
All
-Ele
ctr
ic 2 Code Compliant 1,944 0 n/a n/a 1.27 n/a n/a n/a n/a
Efficiency-Non-Preempted 1,944 0 0.0 0.00 1.27 0.00 $0 - -
Efficiency-Equipment 1,698 0 2.5 0.00 1.13 0.14 $795 1.73 1.58
Efficiency & PV 457 0 16.0 0.92 0.69 0.58 $3,272 2.43 1.73
Efficiency & PV/Battery (7) 0 29.5 1.26 0.33 0.94 $6,344 1.32 1.64
Mix
ed
Fu
el to
All
-Ele
ctr
ic 3
Code Compliant 1,944 0 0.0 0.00 1.27 0.86 ($2,337) 0.58 1.46
Efficiency & PV 57 0 16.0 0.92 0.69 1.43 $936 4.18 >1
Neutral Cost 845 0 11.5 0.70 0.85 1.28 $0 >1 >1
1All reductions and incremental costs relative to the mixed fuel code compliant home. 2All reductions and incremental costs relative to the all-electric code compliant home. 3All reductions and incremental costs relative to the mixed fuel code compliant home except the EDR Margins are relative to the Standard Design for each case
which is the all-electric code compliant home. Incremental costs for these packages reflect the cots used in the On-Bill cost effectiveness methodology. Costs differ for the TDV methodology due to differences in the site gas infrastructure costs (see Section 2.6). 4This represents the Efficiency EDR Margin for the Efficiency-Non-Preempted and Efficiency-Equipment packages and Total EDR Margin for the Efficiency & PV, Efficiency & PV/Battery, and Neutral Cost packages. 5Positive values indicate an increase in PV capacity relative to the Standard Design.
Page 174 of 319

2019 Energy Efficiency Ordinance Cost-effectiveness Study
86 2019-08-01
Climate Zone 4
Table 53: Single Family Climate Zone 4 Results Summary
Climate Zone 4 PG&E Single Family
Annual Net kWh
Annual therms
EDR Margin4
PV Size Change
(kW)5
CO2-Equivalent Emissions (lbs/sf)
NPV of Lifetime
Incremental Cost ($)
Benefit to Cost Ratio (B/C)
Total Reduction On-Bill TDV
Mix
ed
Fu
el 1
Code Compliant 0 347 n/a n/a 1.88 n/a n/a n/a n/a
Efficiency-Non-Preempted 0 306 2.5 (0.03) 1.68 0.20 $1,556 0.93 1.15
Efficiency-Equipment (0) 294 2.5 (0.02) 1.62 0.26 $758 2.39 2.67
Efficiency & PV/Battery (18) 306 10.0 0.07 1.55 0.33 $5,434 0.30 1.48
All
-Ele
ctr
ic 2 Code Compliant 4,342 0 n/a n/a 1.00 n/a n/a n/a n/a
Efficiency-Non-Preempted 3,775 0 3.0 0.00 0.89 0.11 $1,519 1.92 1.84
Efficiency-Equipment 3,747 0 3.5 0.00 0.88 0.12 $2,108 1.52 1.52
Efficiency & PV 814 0 17.0 1.84 0.48 0.52 $8,786 2.13 1.62
Efficiency & PV/Battery (11) 0 28.5 2.44 0.25 0.75 $14,664 1.46 1.61
Mix
ed
Fu
el to
All
-Ele
ctr
ic 3
Code Compliant 4,342 0 0.0 0.00 1.00 0.88 ($5,349) 0.55 1.59
Efficiency & PV 814 0 17.0 1.84 0.48 1.40 $3,438 2.64 >1
Neutral Cost 2,166 0 10.0 1.35 0.70 1.18 $0 >1 >1
1All reductions and incremental costs relative to the mixed fuel code compliant home. 2All reductions and incremental costs relative to the all-electric code compliant home. 3All reductions and incremental costs relative to the mixed fuel code compliant home except the EDR Margins are relative to the Standard Design for each
case which is the all-electric code compliant home. Incremental costs for these packages reflect the cots used in the On-Bill cost effectiveness methodology. Costs differ for the TDV methodology due to differences in the site gas infrastructure costs (see Section 2.6). 4This represents the Efficiency EDR Margin for the Efficiency-Non-Preempted and Efficiency-Equipment packages and Total EDR Margin for the Efficiency & PV, Efficiency & PV/Battery, and Neutral Cost packages. 5Positive values indicate an increase in PV capacity relative to the Standard Design.
Page 175 of 319
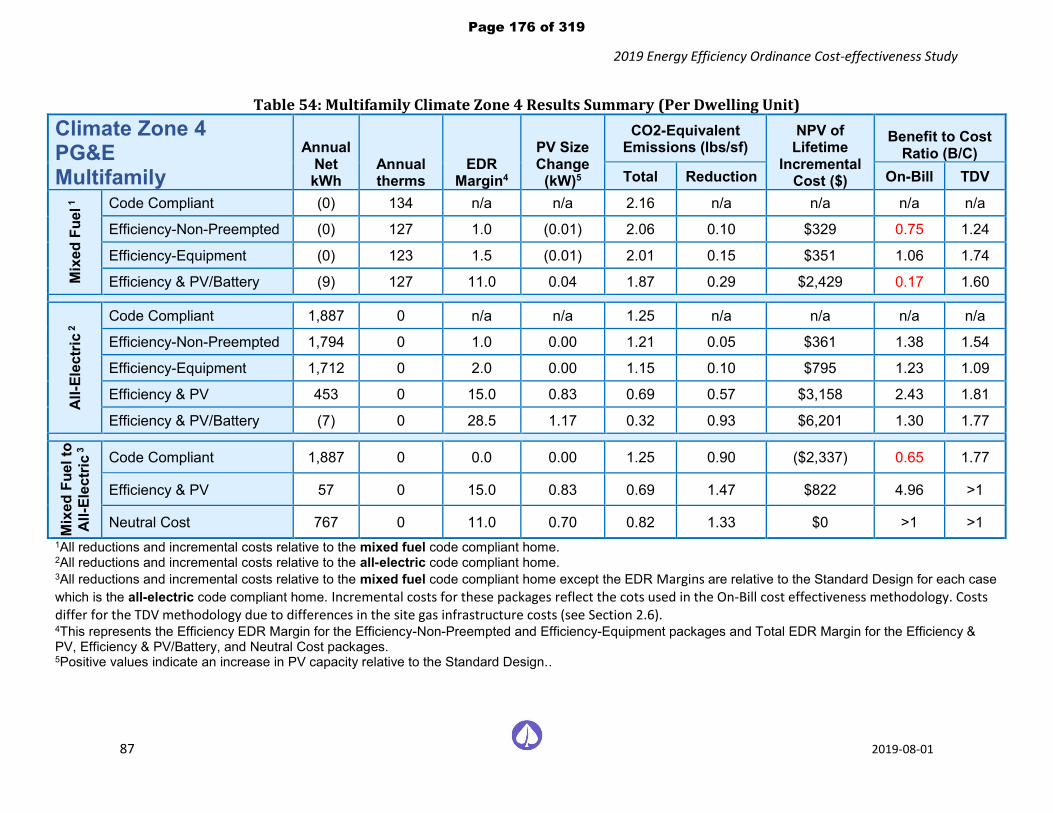
2019 Energy Efficiency Ordinance Cost-effectiveness Study
87 2019-08-01
Table 54: Multifamily Climate Zone 4 Results Summary (Per Dwelling Unit)
Climate Zone 4 PG&E Multifamily
Annual Net kWh
Annual therms
EDR Margin4
PV Size Change
(kW)5
CO2-Equivalent Emissions (lbs/sf)
NPV of Lifetime
Incremental Cost ($)
Benefit to Cost Ratio (B/C)
Total Reduction On-Bill TDV
Mix
ed
Fu
el 1
Code Compliant (0) 134 n/a n/a 2.16 n/a n/a n/a n/a
Efficiency-Non-Preempted (0) 127 1.0 (0.01) 2.06 0.10 $329 0.75 1.24
Efficiency-Equipment (0) 123 1.5 (0.01) 2.01 0.15 $351 1.06 1.74
Efficiency & PV/Battery (9) 127 11.0 0.04 1.87 0.29 $2,429 0.17 1.60
All
-Ele
ctr
ic 2 Code Compliant 1,887 0 n/a n/a 1.25 n/a n/a n/a n/a
Efficiency-Non-Preempted 1,794 0 1.0 0.00 1.21 0.05 $361 1.38 1.54
Efficiency-Equipment 1,712 0 2.0 0.00 1.15 0.10 $795 1.23 1.09
Efficiency & PV 453 0 15.0 0.83 0.69 0.57 $3,158 2.43 1.81
Efficiency & PV/Battery (7) 0 28.5 1.17 0.32 0.93 $6,201 1.30 1.77
Mix
ed
Fu
el to
All
-Ele
ctr
ic 3
Code Compliant 1,887 0 0.0 0.00 1.25 0.90 ($2,337) 0.65 1.77
Efficiency & PV 57 0 15.0 0.83 0.69 1.47 $822 4.96 >1
Neutral Cost 767 0 11.0 0.70 0.82 1.33 $0 >1 >1
1All reductions and incremental costs relative to the mixed fuel code compliant home. 2All reductions and incremental costs relative to the all-electric code compliant home. 3All reductions and incremental costs relative to the mixed fuel code compliant home except the EDR Margins are relative to the Standard Design for each case
which is the all-electric code compliant home. Incremental costs for these packages reflect the cots used in the On-Bill cost effectiveness methodology. Costs differ for the TDV methodology due to differences in the site gas infrastructure costs (see Section 2.6). 4This represents the Efficiency EDR Margin for the Efficiency-Non-Preempted and Efficiency-Equipment packages and Total EDR Margin for the Efficiency & PV, Efficiency & PV/Battery, and Neutral Cost packages. 5Positive values indicate an increase in PV capacity relative to the Standard Design..
Page 176 of 319

2019 Energy Efficiency Ordinance Cost-effectiveness Study
88 2019-08-01
Climate Zone 5 PG&E
Table 55: Single Family Climate Zone 5 PG&E Results Summary
Climate Zone 5 PG&E Single Family
Annual Net kWh
Annual therms
EDR Margin4
PV Size Change
(kW)5
CO2-Equivalent Emissions (lbs/sf)
NPV of Lifetime
Incremental Cost ($)
Benefit to Cost Ratio (B/C)
Total Reduction On-Bill TDV
Mix
ed
Fu
el 1
Code Compliant 0 331 n/a n/a 1.79 n/a n/a n/a n/a
Efficiency-Non-Preempted (0) 281 2.5 (0.03) 1.55 0.24 $1,571 1.10 1.22
Efficiency-Equipment (0) 279 2.5 (0.02) 1.54 0.25 $772 2.29 2.48
Efficiency & PV/Battery (14) 281 9.0 0.07 1.43 0.36 $5,433 0.37 1.32
All
-Ele
ctr
ic 2 Code Compliant 4,452 0 n/a n/a 1.01 n/a n/a n/a n/a
Efficiency-Non-Preempted 3,687 0 4.0 0.00 0.86 0.15 $1,519 2.58 2.31
Efficiency-Equipment 3,737 0 4.0 0.00 0.87 0.14 $2,108 1.85 1.70
Efficiency & PV 798 0 18.0 1.72 0.46 0.55 $8,307 2.31 1.76
Efficiency & PV/Battery (8) 0 28.5 2.29 0.24 0.78 $14,047 1.59 1.63
Mix
ed
Fu
el to
All
-Ele
ctr
ic 3
Code Compliant 4,452 0 0.0 0.00 1.01 0.78 ($5,349) 0.48 1.32
Efficiency & PV 798 0 18.0 1.72 0.46 1.33 $2,959 2.72 >1
Neutral Cost 2,172 0 11.0 1.35 0.70 1.10 $0 >1 40.07
1All reductions and incremental costs relative to the mixed fuel code compliant home. 2All reductions and incremental costs relative to the all-electric code compliant home. 3All reductions and incremental costs relative to the mixed fuel code compliant home except the EDR Margins are relative to the Standard Design for each
case which is the all-electric code compliant home. Incremental costs for these packages reflect the cots used in the On-Bill cost effectiveness methodology. Costs differ for the TDV methodology due to differences in the site gas infrastructure costs (see Section 2.6). 4This represents the Efficiency EDR Margin for the Efficiency-Non-Preempted and Efficiency-Equipment packages and Total EDR Margin for the Efficiency & PV, Efficiency & PV/Battery, and Neutral Cost packages. 5Positive values indicate an increase in PV capacity relative to the Standard Design.
Page 177 of 319

2019 Energy Efficiency Ordinance Cost-effectiveness Study
89 2019-08-01
Table 56: Multifamily Climate Zone 5 PG&E Results Summary (Per Dwelling Unit)
Climate Zone 5 PG&E Multifamily
Annual Net kWh
Annual therms
EDR Margin4
PV Size Change
(kW)5
CO2-Equivalent Emissions (lbs/sf)
NPV of Lifetime
Incremental Cost ($)
Benefit to Cost Ratio (B/C)
Total Reduction On-Bill TDV
Mix
ed
Fu
el1
Code Compliant 0 131 n/a n/a 2.10 n/a n/a n/a n/a
Efficiency-Non-Preempted (0) 126 0.5 (0.00) 2.03 0.07 $180 0.99 1.03
Efficiency-Equipment (0) 117 1.5 (0.00) 1.92 0.19 $358 1.24 1.34
Efficiency & PV/Battery (7) 126 9.5 0.05 1.84 0.26 $2,273 0.15 1.38
All
-Ele
ctr
ic2 Code Compliant 2,044 0 n/a n/a 1.32 n/a n/a n/a n/a
Efficiency-Non-Preempted 1,990 0 0.5 0.00 1.30 0.03 $247 1.09 0.86
Efficiency-Equipment 1,738 0 3.5 0.00 1.15 0.17 $795 2.15 2.03
Efficiency & PV 465 0 17.0 0.91 0.70 0.62 $3,293 2.53 1.82
Efficiency & PV/Battery (6) 0 30.0 1.24 0.34 0.98 $6,314 1.44 1.69
Mix
ed
Fu
el to
All
-Ele
ctr
ic3
Code Compliant 2,044 0 0.0 0.00 1.32 0.78 ($2,337) 0.50 1.28
Efficiency & PV 58 0 17.0 0.91 0.70 1.40 $956 3.80 >1
Neutral Cost 874 0 12.5 0.70 0.87 1.23 $0 >1 23.44
1All reductions and incremental costs relative to the mixed fuel code compliant home. 2All reductions and incremental costs relative to the all-electric code compliant home. 3All reductions and incremental costs relative to the mixed fuel code compliant home except the EDR Margins are relative to the Standard Design for each case
which is the all-electric code compliant home. Incremental costs for these packages reflect the cots used in the On-Bill cost effectiveness methodology. Costs differ for the TDV methodology due to differences in the site gas infrastructure costs (see Section 2.6). 4This represents the Efficiency EDR Margin for the Efficiency-Non-Preempted and Efficiency-Equipment packages and Total EDR Margin for the Efficiency & PV, Efficiency & PV/Battery, and Neutral Cost packages. 5Positive values indicate an increase in PV capacity relative to the Standard Design.
Page 178 of 319
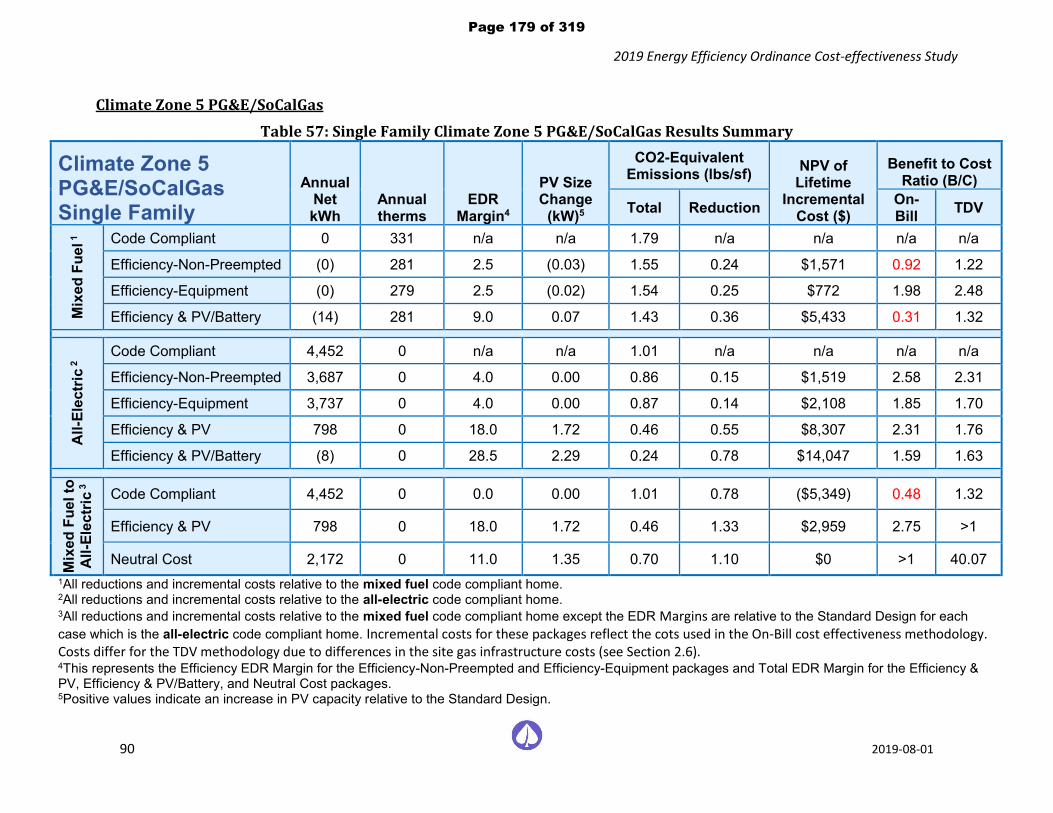
2019 Energy Efficiency Ordinance Cost-effectiveness Study
90 2019-08-01
Climate Zone 5 PG&E/SoCalGas
Table 57: Single Family Climate Zone 5 PG&E/SoCalGas Results Summary
Climate Zone 5 PG&E/SoCalGas Single Family
Annual Net kWh
Annual therms
EDR Margin4
PV Size Change
(kW)5
CO2-Equivalent Emissions (lbs/sf)
NPV of Lifetime
Incremental Cost ($)
Benefit to Cost Ratio (B/C)
Total Reduction On-Bill
TDV
Mix
ed
Fu
el 1
Code Compliant 0 331 n/a n/a 1.79 n/a n/a n/a n/a
Efficiency-Non-Preempted (0) 281 2.5 (0.03) 1.55 0.24 $1,571 0.92 1.22
Efficiency-Equipment (0) 279 2.5 (0.02) 1.54 0.25 $772 1.98 2.48
Efficiency & PV/Battery (14) 281 9.0 0.07 1.43 0.36 $5,433 0.31 1.32
All
-Ele
ctr
ic 2 Code Compliant 4,452 0 n/a n/a 1.01 n/a n/a n/a n/a
Efficiency-Non-Preempted 3,687 0 4.0 0.00 0.86 0.15 $1,519 2.58 2.31
Efficiency-Equipment 3,737 0 4.0 0.00 0.87 0.14 $2,108 1.85 1.70
Efficiency & PV 798 0 18.0 1.72 0.46 0.55 $8,307 2.31 1.76
Efficiency & PV/Battery (8) 0 28.5 2.29 0.24 0.78 $14,047 1.59 1.63
Mix
ed
Fu
el to
All
-Ele
ctr
ic 3
Code Compliant 4,452 0 0.0 0.00 1.01 0.78 ($5,349) 0.48 1.32
Efficiency & PV 798 0 18.0 1.72 0.46 1.33 $2,959 2.75 >1
Neutral Cost 2,172 0 11.0 1.35 0.70 1.10 $0 >1 40.07
1All reductions and incremental costs relative to the mixed fuel code compliant home. 2All reductions and incremental costs relative to the all-electric code compliant home. 3All reductions and incremental costs relative to the mixed fuel code compliant home except the EDR Margins are relative to the Standard Design for each
case which is the all-electric code compliant home. Incremental costs for these packages reflect the cots used in the On-Bill cost effectiveness methodology. Costs differ for the TDV methodology due to differences in the site gas infrastructure costs (see Section 2.6). 4This represents the Efficiency EDR Margin for the Efficiency-Non-Preempted and Efficiency-Equipment packages and Total EDR Margin for the Efficiency & PV, Efficiency & PV/Battery, and Neutral Cost packages. 5Positive values indicate an increase in PV capacity relative to the Standard Design.
Page 179 of 319

2019 Energy Efficiency Ordinance Cost-effectiveness Study
91 2019-08-01
Table 58: Multifamily Climate Zone 5 PG&E/SoCalGas Results Summary (Per Dwelling Unit)
Climate Zone 5 PG&E/SoCalGas Multifamily
Annual Net kWh
Annual therms
EDR Margin4
PV Size Change
(kW)5
CO2-Equivalent Emissions (lbs/sf)
NPV of Lifetime
Incremental Cost ($)
Benefit to Cost Ratio (B/C)
Total Reduction On-Bill TDV
Mix
ed
Fu
el 1
Code Compliant 0 131 n/a n/a 2.10 n/a n/a n/a n/a
Efficiency-Non-Preempted (0) 126 0.5 (0.00) 2.03 0.07 $180 0.85 1.03
Efficiency-Equipment (0) 117 1.5 (0.00) 1.92 0.19 $358 1.09 1.34
Efficiency & PV/Battery (7) 126 9.5 0.05 1.84 0.26 $2,273 0.14 1.38
All
-Ele
ctr
ic 2 Code Compliant 2,044 0 n/a n/a 1.32 n/a n/a n/a n/a
Efficiency-Non-Preempted 1,990 0 0.5 0.00 1.30 0.03 $247 1.09 0.86
Efficiency-Equipment 1,738 0 3.5 0.00 1.15 0.17 $795 2.15 2.03
Efficiency & PV 465 0 17.0 0.91 0.70 0.62 $3,293 2.53 1.82
Efficiency & PV/Battery (6) 0 30.0 1.24 0.34 0.98 $6,314 1.44 1.69
Mix
ed
Fu
el to
All
-Ele
ctr
ic 3
Code Compliant 2,044 0 0.0 0.00 1.32 0.78 ($2,337) 0.65 1.28
Efficiency & PV 58 0 17.0 0.91 0.70 1.40 $956 4.98 >1
Neutral Cost 874 0 12.5 0.70 0.87 1.23 $0 >1 23.44
1All reductions and incremental costs relative to the mixed fuel code compliant home. 2All reductions and incremental costs relative to the all-electric code compliant home. 3All reductions and incremental costs relative to the mixed fuel code compliant home except the EDR Margins are relative to the Standard Design for each case
which is the all-electric code compliant home. Incremental costs for these packages reflect the cots used in the On-Bill cost effectiveness methodology. Costs differ for the TDV methodology due to differences in the site gas infrastructure costs (see Section 2.6). 4This represents the Efficiency EDR Margin for the Efficiency-Non-Preempted and Efficiency-Equipment packages and Total EDR Margin for the Efficiency & PV, Efficiency & PV/Battery, and Neutral Cost packages. 5Positive values indicate an increase in PV capacity relative to the Standard Design.
Page 180 of 319

2019 Energy Efficiency Ordinance Cost-effectiveness Study
92 2019-08-01
Climate Zone 6
Table 59: Single Family Climate Zone 6 Results Summary
Climate Zone 6 SCE/SoCalGas Single Family
Annual Net kWh
Annual therms
EDR Margin4
PV Size Change
(kW)5
CO2-Equivalent Emissions (lbs/sf)
NPV of Lifetime
Incremental Cost ($)
Benefit to Cost Ratio (B/C)
Total Reduction On-Bill TDV
Mix
ed
Fu
el 1
Code Compliant (0) 249 n/a n/a 1.57 n/a n/a n/a n/a
Efficiency-Non-Preempted 0 229 2.0 (0.02) 1.47 0.10 $1,003 0.66 1.15
Efficiency-Equipment (0) 218 1.5 (0.01) 1.41 0.15 $581 1.58 2.04
Efficiency & PV/Battery (13) 229 9.5 0.08 1.22 0.34 $4,889 0.84 1.27
All
-Ele
ctr
ic 2 Code Compliant 3,099 0 n/a n/a 0.87 n/a n/a n/a n/a
Efficiency-Non-Preempted 2,885 0 2.0 0.00 0.83 0.05 $926 1.31 1.41
Efficiency-Equipment 2,746 0 2.5 0.00 0.80 0.08 $846 2.20 2.29
Efficiency & PV 722 0 14.0 1.37 0.63 0.24 $6,341 1.19 1.48
Efficiency & PV/Battery (6) 0 26.0 1.93 0.33 0.55 $12,036 1.15 1.43
Mix
ed
Fu
el to
All
-Ele
ctr
ic 3
Code Compliant 3,099 0 0.0 0.00 0.87 0.69 ($5,349) 1.19 2.46
Efficiency & PV 722 0 14.0 1.37 0.63 0.93 $992 3.07 >1
Neutral Cost 959 0 12.0 1.36 0.67 0.89 $0 >1 >1
1All reductions and incremental costs relative to the mixed fuel code compliant home. 2All reductions and incremental costs relative to the all-electric code compliant home. 3All reductions and incremental costs relative to the mixed fuel code compliant home except the EDR Margins are relative to the Standard Design for each
case which is the all-electric code compliant home. Incremental costs for these packages reflect the cots used in the On-Bill cost effectiveness methodology. Costs differ for the TDV methodology due to differences in the site gas infrastructure costs (see Section 2.6). 4This represents the Efficiency EDR Margin for the Efficiency-Non-Preempted and Efficiency-Equipment packages and Total EDR Margin for the Efficiency & PV, Efficiency & PV/Battery, and Neutral Cost packages. 5Positive values indicate an increase in PV capacity relative to the Standard Design.
Page 181 of 319

2019 Energy Efficiency Ordinance Cost-effectiveness Study
93 2019-08-01
Table 60: Multifamily Climate Zone 6 Results Summary (Per Dwelling Unit)
Climate Zone 6 SCE/SoCalGas Multifamily
Annual Net kWh
Annual therms
EDR Margin4
PV Size Change
(kW)5
CO2-Equivalent Emissions (lbs/sf)
NPV of Lifetime
Incremental Cost ($)
Benefit to Cost Ratio (B/C)
Total Reduction On-Bill TDV
Mix
ed
Fu
el 1
Code Compliant (0) 114 n/a n/a 2.17 n/a n/a n/a n/a
Efficiency-Non-Preempted (0) 112 1.0 (0.01) 2.14 0.03 $190 0.65 1.49
Efficiency-Equipment (0) 103 1.0 (0.00) 2.03 0.15 $213 1.43 1.74
Efficiency & PV/Battery (6) 112 10.5 0.04 1.76 0.41 $2,294 0.56 1.35
All
-Ele
ctr
ic 2 Code Compliant 1,558 0 n/a n/a 1.28 n/a n/a n/a n/a
Efficiency-Non-Preempted 1,531 0 1.0 0.00 1.26 0.02 $231 0.65 1.34
Efficiency-Equipment 1,430 0 2.0 0.00 1.20 0.08 $361 1.62 1.91
Efficiency & PV 427 0 13.5 0.70 0.97 0.31 $2,580 1.24 1.71
Efficiency & PV/Battery (5) 0 27.5 1.02 0.49 0.79 $5,590 1.22 1.58
Mix
ed
Fu
el to
All
-Ele
ctr
ic 3
Code Compliant 1,558 0 0.0 0.00 1.28 0.90 ($2,337) 2.59 2.38
Efficiency & PV 53 0 13.5 0.70 0.97 1.20 $243 9.50 >1
Neutral Cost 459 0 12.5 0.70 0.99 1.18 $0 >1 >1
1All reductions and incremental costs relative to the mixed fuel code compliant home. 2All reductions and incremental costs relative to the all-electric code compliant home. 3All reductions and incremental costs relative to the mixed fuel code compliant home except the EDR Margins are relative to the Standard Design for each case
which is the all-electric code compliant home. Incremental costs for these packages reflect the cots used in the On-Bill cost effectiveness methodology. Costs differ for the TDV methodology due to differences in the site gas infrastructure costs (see Section 2.6). 4This represents the Efficiency EDR Margin for the Efficiency-Non-Preempted and Efficiency-Equipment packages and Total EDR Margin for the Efficiency & PV, Efficiency & PV/Battery, and Neutral Cost packages. 5Positive values indicate an increase in PV capacity relative to the Standard Design.
Page 182 of 319

2019 Energy Efficiency Ordinance Cost-effectiveness Study
94 2019-08-01
Climate Zone 7
Table 61: Single Family Climate Zone 7 Results Summary
Climate Zone 7 SDG&E Single Family
Annual Net kWh
Annual therms
EDR Margin4
PV Size Change
(kW)5
CO2-Equivalent Emissions (lbs/sf)
NPV of Lifetime
Incremental Cost ($)
Benefit to Cost Ratio (B/C)
Total Reduction On-Bill TDV
Mix
ed
Fu
el 1
Code Compliant (0) 196 n/a n/a 1.30 n/a n/a n/a n/a
Efficiency-Non-Preempted (0) 196 0.0 0.00 1.30 0.00 $0 - -
Efficiency-Equipment 0 171 1.5 (0.00) 1.18 0.12 $606 1.50 1.40
Efficiency & PV/Battery (12) 189 9.0 0.10 1.04 0.26 $4,028 0.06 1.32
All
-Ele
ctr
ic 2 Code Compliant 2,479 0 n/a n/a 0.75 n/a n/a n/a n/a
Efficiency-Non-Preempted 2,479 0 0.0 0.00 0.75 0.00 $0 - -
Efficiency-Equipment 2,222 0 2.0 0.00 0.69 0.06 $846 1.60 1.65
Efficiency & PV 674 0 11.0 1.10 0.58 0.17 $4,436 1.87 1.55
Efficiency & PV/Battery (6) 0 24.0 1.61 0.29 0.46 $9,936 1.25 1.47
Mix
ed
Fu
el to
All
-Ele
ctr
ic 3
Code Compliant 2,479 0 0.0 0.00 0.75 0.55 ($5,349) 1.04 2.54
Efficiency & PV 674 0 11.0 1.10 0.58 0.72 ($912) >1 >1
Neutral Cost 267 0 13.5 1.35 0.55 0.75 $0 >1 >1
1All reductions and incremental costs relative to the mixed fuel code compliant home. 2All reductions and incremental costs relative to the all-electric code compliant home. 3All reductions and incremental costs relative to the mixed fuel code compliant home except the EDR Margins are relative to the Standard Design for each
case which is the all-electric code compliant home. Incremental costs for these packages reflect the cots used in the On-Bill cost effectiveness methodology. Costs differ for the TDV methodology due to differences in the site gas infrastructure costs (see Section 2.6). 4This represents the Efficiency EDR Margin for the Efficiency-Non-Preempted and Efficiency-Equipment packages and Total EDR Margin for the Efficiency & PV, Efficiency & PV/Battery, and Neutral Cost packages. 5Positive values indicate an increase in PV capacity relative to the Standard Design.
Page 183 of 319

2019 Energy Efficiency Ordinance Cost-effectiveness Study
95 2019-08-01
Table 62: Multifamily Climate Zone 7 Results Summary (Per Dwelling Unit)
Climate Zone 7 SDG&E Multifamily
Annual Net kWh
Annual therms
EDR Margin4
PV Size Change
(kW)5
CO2-Equivalent Emissions (lbs/sf)
NPV of Lifetime
Incremental Cost ($)
Benefit to Cost Ratio (B/C)
Total Reduction On-Bill TDV
Mix
ed
Fu
el 1
Code Compliant (0) 110 n/a n/a 2.11 n/a n/a n/a n/a
Efficiency-Non-Preempted (0) 108 0.5 (0.01) 2.08 0.03 $90 0.73 2.24
Efficiency-Equipment (0) 99 2.0 (0.00) 1.96 0.15 $366 1.07 1.41
Efficiency & PV/Battery (6) 108 11.0 0.05 1.71 0.40 $2,188 0.03 1.40
All
-Ele
ctr
ic 2 Code Compliant 1,434 0 n/a n/a 1.21 n/a n/a n/a n/a
Efficiency-Non-Preempted 1,416 0 0.5 0.00 1.20 0.01 $202 0.60 1.02
Efficiency-Equipment 1,319 0 1.5 0.00 1.14 0.07 $361 1.59 1.71
Efficiency & PV 412 0 12.5 0.61 0.94 0.27 $2,261 2.08 1.76
Efficiency & PV/Battery (5) 0 27.0 0.92 0.47 0.74 $5,203 1.19 1.62
Mix
ed
Fu
el to
All
-Ele
ctr
ic 3
Code Compliant 1,434 0 0.0 0.00 1.21 0.90 ($2,337) 1.12 2.47
Efficiency & PV 51 0 12.5 0.61 0.94 1.17 ($75) >1 >1
Neutral Cost 294 0 13.5 0.70 0.91 1.20 $0 >1 >1
1All reductions and incremental costs relative to the mixed fuel code compliant home. 2All reductions and incremental costs relative to the all-electric code compliant home. 3All reductions and incremental costs relative to the mixed fuel code compliant home except the EDR Margins are relative to the Standard Design for each case
which is the all-electric code compliant home. Incremental costs for these packages reflect the cots used in the On-Bill cost effectiveness methodology. Costs differ for the TDV methodology due to differences in the site gas infrastructure costs (see Section 2.6). 4This represents the Efficiency EDR Margin for the Efficiency-Non-Preempted and Efficiency-Equipment packages and Total EDR Margin for the Efficiency & PV, Efficiency & PV/Battery, and Neutral Cost packages. 5Positive values indicate an increase in PV capacity relative to the Standard Design.
Page 184 of 319

2019 Energy Efficiency Ordinance Cost-effectiveness Study
96 2019-08-01
Climate Zone 8
Table 63: Single Family Climate Zone 8 Results Summary
Climate Zone 8 SCE/SoCalGas Single Family
Annual Net kWh
Annual therms
EDR Margin4
PV Size Change
(kW)5
CO2-Equivalent Emissions (lbs/sf)
NPV of Lifetime
Incremental Cost ($)
Benefit to Cost Ratio (B/C)
Total Reduction On-Bill TDV
Mix
ed
Fu
el 1
Code Compliant (0) 206 n/a n/a 1.38 n/a n/a n/a n/a
Efficiency-Non-Preempted (0) 198 1.0 (0.02) 1.34 0.05 $581 0.57 1.41
Efficiency-Equipment 0 181 1.5 (0.01) 1.27 0.12 $586 1.30 1.82
Efficiency & PV/Battery (13) 198 8.0 0.08 1.11 0.27 $4,466 0.90 1.31
All
-Ele
ctr
ic 2 Code Compliant 2,576 0 n/a n/a 0.80 n/a n/a n/a n/a
Efficiency-Non-Preempted 2,483 0 1.5 0.00 0.78 0.02 $926 0.57 1.22
Efficiency-Equipment 2,352 0 1.5 0.00 0.75 0.05 $412 2.82 3.03
Efficiency & PV 703 0 10.5 1.13 0.62 0.18 $5,373 1.00 1.48
Efficiency & PV/Battery (7) 0 21.5 1.67 0.32 0.48 $11,016 1.09 1.42
Mix
ed
Fu
el to
All
-Ele
ctr
ic 3
Code Compliant 2,576 0 0.0 0.00 0.80 0.58 ($5,349) 1.83 2.99
Efficiency & PV 703 0 10.5 1.13 0.62 0.77 $25 107.93 >1
Neutral Cost 439 0 11.0 1.36 0.60 0.78 $0 >1 >1
1All reductions and incremental costs relative to the mixed fuel code compliant home. 2All reductions and incremental costs relative to the all-electric code compliant home. 3All reductions and incremental costs relative to the mixed fuel code compliant home except the EDR Margins are relative to the Standard Design for each
case which is the all-electric code compliant home. Incremental costs for these packages reflect the cots used in the On-Bill cost effectiveness methodology. Costs differ for the TDV methodology due to differences in the site gas infrastructure costs (see Section 2.6). 4This represents the Efficiency EDR Margin for the Efficiency-Non-Preempted and Efficiency-Equipment packages and Total EDR Margin for the Efficiency & PV, Efficiency & PV/Battery, and Neutral Cost packages. 5Positive values indicate an increase in PV capacity relative to the Standard Design.
Page 185 of 319

2019 Energy Efficiency Ordinance Cost-effectiveness Study
97 2019-08-01
Table 64: Multifamily Climate Zone 8 Results Summary (Per Dwelling Unit)
Climate Zone 8 SCE/SoCalGas Multifamily
Annual Net kWh
Annual therms
EDR Margin4
PV Size Change
(kW)5
CO2-Equivalent Emissions (lbs/sf)
NPV of Lifetime
Incremental Cost ($)
Benefit to Cost Ratio (B/C)
Total Reduction On-Bill TDV
Mix
ed
Fu
el 1
Code Compliant (0) 109 n/a n/a 2.18 n/a n/a n/a n/a
Efficiency-Non-Preempted (0) 106 1.5 (0.02) 2.13 0.05 $250 0.70 1.36
Efficiency-Equipment (0) 99 1.0 (0.00) 2.04 0.14 $213 1.37 1.67
Efficiency & PV/Battery (6) 106 9.5 0.03 1.77 0.41 $2,353 0.74 1.32
All
-Ele
ctr
ic 2 Code Compliant 1,409 0 n/a n/a 1.26 n/a n/a n/a n/a
Efficiency-Non-Preempted 1,373 0 1.0 0.00 1.24 0.02 $231 0.87 1.72
Efficiency-Equipment 1,276 0 1.5 0.00 1.18 0.08 $361 1.63 1.75
Efficiency & PV 426 0 11.5 0.60 0.99 0.27 $2,240 1.26 1.78
Efficiency & PV/Battery (5) 0 24.0 0.92 0.53 0.73 $5,249 1.24 1.59
Mix
ed
Fu
el to
All
-Ele
ctr
ic 3
Code Compliant 1,409 0 0.0 0.00 1.26 0.91 ($2,337) 6.69 2.67
Efficiency & PV 53 0 11.5 0.60 0.99 1.18 ($96) >1 >1
Neutral Cost 309 0 12.0 0.70 0.98 1.20 $0 >1 >1
1All reductions and incremental costs relative to the mixed fuel code compliant home. 2All reductions and incremental costs relative to the all-electric code compliant home. 3All reductions and incremental costs relative to the mixed fuel code compliant home except the EDR Margins are relative to the Standard Design for each case
which is the all-electric code compliant home. Incremental costs for these packages reflect the cots used in the On-Bill cost effectiveness methodology. Costs differ for the TDV methodology due to differences in the site gas infrastructure costs (see Section 2.6). 4This represents the Efficiency EDR Margin for the Efficiency-Non-Preempted and Efficiency-Equipment packages and Total EDR Margin for the Efficiency & PV, Efficiency & PV/Battery, and Neutral Cost packages. 5Positive values indicate an increase in PV capacity relative to the Standard Design.
Page 186 of 319
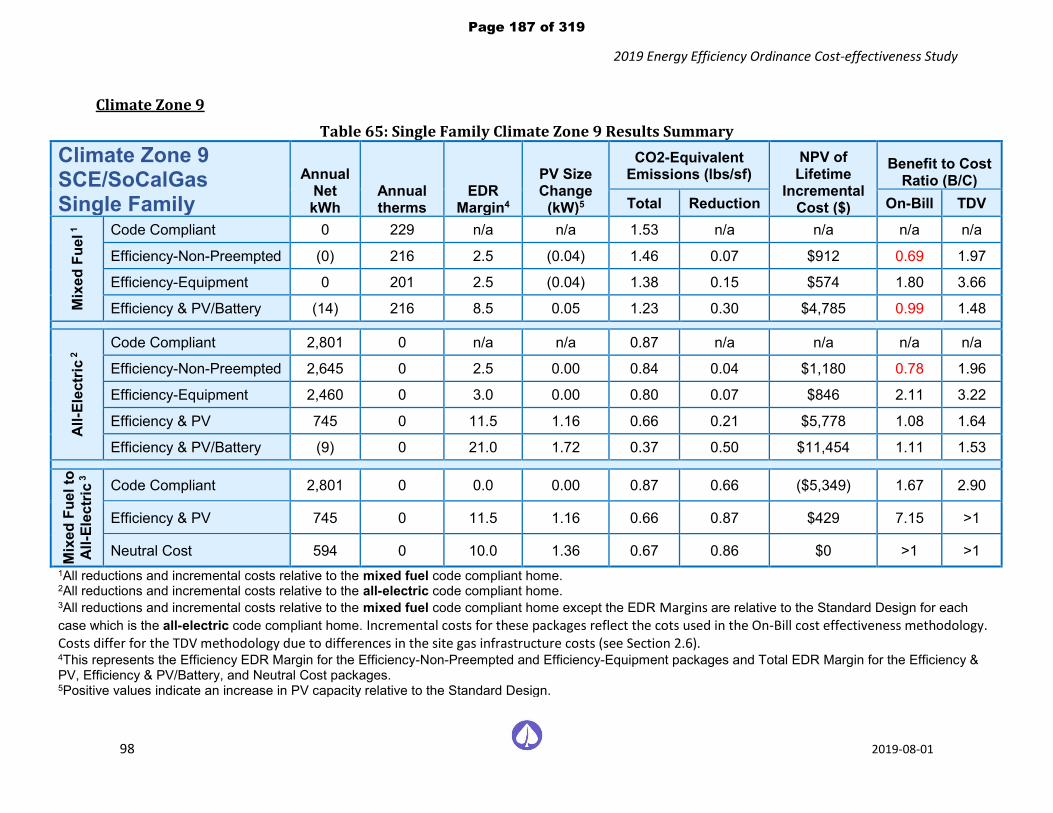
2019 Energy Efficiency Ordinance Cost-effectiveness Study
98 2019-08-01
Climate Zone 9
Table 65: Single Family Climate Zone 9 Results Summary
Climate Zone 9 SCE/SoCalGas Single Family
Annual Net kWh
Annual therms
EDR Margin4
PV Size Change
(kW)5
CO2-Equivalent Emissions (lbs/sf)
NPV of Lifetime
Incremental Cost ($)
Benefit to Cost Ratio (B/C)
Total Reduction On-Bill TDV
Mix
ed
Fu
el 1
Code Compliant 0 229 n/a n/a 1.53 n/a n/a n/a n/a
Efficiency-Non-Preempted (0) 216 2.5 (0.04) 1.46 0.07 $912 0.69 1.97
Efficiency-Equipment 0 201 2.5 (0.04) 1.38 0.15 $574 1.80 3.66
Efficiency & PV/Battery (14) 216 8.5 0.05 1.23 0.30 $4,785 0.99 1.48
All
-Ele
ctr
ic 2 Code Compliant 2,801 0 n/a n/a 0.87 n/a n/a n/a n/a
Efficiency-Non-Preempted 2,645 0 2.5 0.00 0.84 0.04 $1,180 0.78 1.96
Efficiency-Equipment 2,460 0 3.0 0.00 0.80 0.07 $846 2.11 3.22
Efficiency & PV 745 0 11.5 1.16 0.66 0.21 $5,778 1.08 1.64
Efficiency & PV/Battery (9) 0 21.0 1.72 0.37 0.50 $11,454 1.11 1.53
Mix
ed
Fu
el to
All
-Ele
ctr
ic 3
Code Compliant 2,801 0 0.0 0.00 0.87 0.66 ($5,349) 1.67 2.90
Efficiency & PV 745 0 11.5 1.16 0.66 0.87 $429 7.15 >1
Neutral Cost 594 0 10.0 1.36 0.67 0.86 $0 >1 >1
1All reductions and incremental costs relative to the mixed fuel code compliant home. 2All reductions and incremental costs relative to the all-electric code compliant home. 3All reductions and incremental costs relative to the mixed fuel code compliant home except the EDR Margins are relative to the Standard Design for each
case which is the all-electric code compliant home. Incremental costs for these packages reflect the cots used in the On-Bill cost effectiveness methodology. Costs differ for the TDV methodology due to differences in the site gas infrastructure costs (see Section 2.6). 4This represents the Efficiency EDR Margin for the Efficiency-Non-Preempted and Efficiency-Equipment packages and Total EDR Margin for the Efficiency & PV, Efficiency & PV/Battery, and Neutral Cost packages. 5Positive values indicate an increase in PV capacity relative to the Standard Design.
Page 187 of 319

2019 Energy Efficiency Ordinance Cost-effectiveness Study
99 2019-08-01
Table 66: Multifamily Climate Zone 9 Results Summary (Per Dwelling Unit)
Climate Zone 9 SCE/SoCalGas Multifamily
Annual Net kWh
Annual therms
EDR Margin4
PV Size Change
(kW)5
CO2-Equivalent Emissions (lbs/sf)
NPV of Lifetime
Incremental Cost ($)
Benefit to Cost Ratio (B/C)
Total Reduction On-Bill TDV
Mix
ed
Fu
el 1
Code Compliant 0 111 n/a n/a 2.24 n/a n/a n/a n/a
Efficiency-Non-Preempted (0) 109 1.5 (0.03) 2.19 0.05 $136 1.46 3.35
Efficiency-Equipment (0) 101 2.5 (0.03) 2.08 0.16 $274 1.66 2.87
Efficiency & PV/Battery (7) 109 9.5 0.03 1.84 0.40 $2,234 0.90 1.49
All
-Ele
ctr
ic 2 Code Compliant 1,468 0 n/a n/a 1.33 n/a n/a n/a n/a
Efficiency-Non-Preempted 1,414 0 1.5 0.00 1.30 0.03 $231 1.29 2.70
Efficiency-Equipment 1,334 0 1.5 0.00 1.25 0.08 $361 1.63 1.58
Efficiency & PV 441 0 11.0 0.60 1.04 0.29 $2,232 1.34 1.91
Efficiency & PV/Battery (7) 0 23.0 0.92 0.58 0.75 $5,236 1.28 1.67
Mix
ed
Fu
el to
All
-Ele
ctr
ic 3
Code Compliant 1,468 0 0.0 0.00 1.33 0.91 ($2,337) 4.38 2.55
Efficiency & PV 55 0 11.0 0.60 1.04 1.20 ($104) >1 >1
Neutral Cost 331 0 11.0 0.70 1.03 1.21 $0 >1 >1
1All reductions and incremental costs relative to the mixed fuel code compliant home. 2All reductions and incremental costs relative to the all-electric code compliant home. 3All reductions and incremental costs relative to the mixed fuel code compliant home except the EDR Margins are relative to the Standard Design for each case
which is the all-electric code compliant home. Incremental costs for these packages reflect the cots used in the On-Bill cost effectiveness methodology. Costs differ for the TDV methodology due to differences in the site gas infrastructure costs (see Section 2.6). 4This represents the Efficiency EDR Margin for the Efficiency-Non-Preempted and Efficiency-Equipment packages and Total EDR Margin for the Efficiency & PV, Efficiency & PV/Battery, and Neutral Cost packages. 5Positive values indicate an increase in PV capacity relative to the Standard Design.
Page 188 of 319

2019 Energy Efficiency Ordinance Cost-effectiveness Study
100 2019-08-01
Climate Zone 10 SCE/SoCalGas
Table 67: Single Family Climate Zone 10 SCE/SoCalGas Results Summary
Climate Zone 10 SCE/SoCalGas Single Family
Annual Net kWh
Annual therms
EDR Margin4
PV Size Change
(kW)5
CO2-Equivalent Emissions (lbs/sf)
NPV of Lifetime
Incremental Cost ($)
Benefit to Cost Ratio (B/C)
Total Reduction On-Bill TDV
Mix
ed
Fu
el 1
Code Compliant (0) 239 n/a n/a 1.61 n/a n/a n/a n/a
Efficiency-Non-Preempted (0) 217 3.0 (0.07) 1.48 0.13 $1,648 0.63 1.33
Efficiency-Equipment (0) 209 3.0 (0.06) 1.45 0.16 $593 2.05 3.84
Efficiency & PV/Battery (12) 217 9.5 0.03 1.25 0.36 $5,522 1.00 1.48
All
-Ele
ctr
ic 2 Code Compliant 2,981 0 n/a n/a 0.94 n/a n/a n/a n/a
Efficiency-Non-Preempted 2,673 0 3.0 0.00 0.88 0.07 $1,773 0.92 1.52
Efficiency-Equipment 2,563 0 3.0 0.00 0.85 0.10 $949 2.27 3.19
Efficiency & PV 762 0 11.0 1.17 0.70 0.24 $6,405 1.08 1.50
Efficiency & PV/Battery (6) 0 21.0 1.74 0.41 0.53 $12,129 1.11 1.51
Mix
ed
Fu
el to
All
-Ele
ctr
ic 3
Code Compliant 2,981 0 0.0 0.00 0.94 0.67 ($5,349) 1.45 2.66
Efficiency & PV 762 0 11.0 1.17 0.70 0.91 $1,057 3.04 >1
Neutral Cost 770 0 9.0 1.36 0.74 0.87 $0 >1 >1
1All reductions and incremental costs relative to the mixed fuel code compliant home. 2All reductions and incremental costs relative to the all-electric code compliant home. 3All reductions and incremental costs relative to the mixed fuel code compliant home except the EDR Margins are relative to the Standard Design for each
case which is the all-electric code compliant home. Incremental costs for these packages reflect the cots used in the On-Bill cost effectiveness methodology. Costs differ for the TDV methodology due to differences in the site gas infrastructure costs (see Section 2.6). 4This represents the Efficiency EDR Margin for the Efficiency-Non-Preempted and Efficiency-Equipment packages and Total EDR Margin for the Efficiency & PV, Efficiency & PV/Battery, and Neutral Cost packages. 5Positive values indicate an increase in PV capacity relative to the Standard Design.
Page 189 of 319

2019 Energy Efficiency Ordinance Cost-effectiveness Study
101 2019-08-01
Table 68: Multifamily Climate Zone 10 SCE/SoCalGas Results Summary (Per Dwelling Unit)
Climate Zone 10 SCE/SoCalGas Multifamily
Annual Net kWh
Annual therms
EDR Margin4
PV Size Change
(kW)5
CO2-Equivalent Emissions (lbs/sf)
NPV of Lifetime
Incremental Cost ($)
Benefit to Cost Ratio (B/C)
Total Reduction On-Bill TDV
Mix
ed
Fu
el 1
Code Compliant (0) 112 n/a n/a 2.29 n/a n/a n/a n/a
Efficiency-Non-Preempted (0) 108 1.5 (0.02) 2.23 0.06 $278 0.81 1.69
Efficiency-Equipment (0) 102 2.5 (0.04) 2.13 0.16 $250 1.96 3.27
Efficiency & PV/Battery (6) 108 10.0 0.03 1.88 0.41 $2,376 0.98 1.57
All
-Ele
ctr
ic 2 Code Compliant 1,507 0 n/a n/a 1.39 n/a n/a n/a n/a
Efficiency-Non-Preempted 1,425 0 1.5 0.00 1.34 0.05 $361 1.16 2.00
Efficiency-Equipment 1,369 0 1.5 0.00 1.31 0.08 $361 1.71 1.98
Efficiency & PV 450 0 10.5 0.60 1.09 0.30 $2,371 1.31 1.79
Efficiency & PV/Battery (4) 0 23.0 0.93 0.63 0.76 $5,395 1.27 1.69
Mix
ed
Fu
el to
All
-Ele
ctr
ic 3
Code Compliant 1,507 0 0.0 0.00 1.39 0.90 ($2,337) 3.35 2.36
Efficiency & PV 56 0 10.5 0.60 1.09 1.20 $34 70.89 >1
Neutral Cost 372 0 10.5 0.70 1.10 1.19 $0 >1 >1
1All reductions and incremental costs relative to the mixed fuel code compliant home. 2All reductions and incremental costs relative to the all-electric code compliant home. 3All reductions and incremental costs relative to the mixed fuel code compliant home except the EDR Margins are relative to the Standard Design for each case
which is the all-electric code compliant home. Incremental costs for these packages reflect the cots used in the On-Bill cost effectiveness methodology. Costs differ for the TDV methodology due to differences in the site gas infrastructure costs (see Section 2.6). 4This represents the Efficiency EDR Margin for the Efficiency-Non-Preempted and Efficiency-Equipment packages and Total EDR Margin for the Efficiency & PV, Efficiency & PV/Battery, and Neutral Cost packages. 5Positive values indicate an increase in PV capacity relative to the Standard Design.
Page 190 of 319

2019 Energy Efficiency Ordinance Cost-effectiveness Study
102 2019-08-01
Climate Zone 10 SDGE
Table 69: Single Family Climate Zone 10 SDGE Results Summary
Climate Zone 10 SDG&E Single Family
Annual Net kWh
Annual therms
EDR Margin4
PV Size Change
(kW)5
CO2-Equivalent Emissions (lbs/sf)
NPV of Lifetime
Incremental Cost ($)
Benefit to Cost Ratio (B/C)
Total Reduction On-Bill TDV
Mix
ed
Fu
el 1
Code Compliant (0) 239 n/a n/a 1.61 n/a n/a n/a n/a
Efficiency-Non-Preempted (0) 217 3.0 (0.07) 1.48 0.13 $1,648 0.80 1.33
Efficiency-Equipment (0) 209 3.0 (0.06) 1.45 0.16 $593 2.64 3.84
Efficiency & PV/Battery (12) 217 9.5 0.03 1.25 0.36 $5,522 0.58 1.48
All
-Ele
ctr
ic 2 Code Compliant 2,981 0 n/a n/a 0.94 n/a n/a n/a n/a
Efficiency-Non-Preempted 2,673 0 3.0 0.00 0.88 0.07 $1,773 1.08 1.52
Efficiency-Equipment 2,563 0 3.0 0.00 0.85 0.10 $949 2.62 3.19
Efficiency & PV 762 0 11.0 1.17 0.70 0.24 $6,405 1.68 1.50
Efficiency & PV/Battery (6) 0 21.0 1.74 0.41 0.53 $12,129 1.42 1.51
Mix
ed
Fu
el to
All
-Ele
ctr
ic 3
Code Compliant 2,981 0 0.0 0.00 0.94 0.67 ($5,349) 0.90 2.66
Efficiency & PV 762 0 11.0 1.17 0.70 0.91 $1,057 4.55 >1
Neutral Cost 770 0 9.0 1.36 0.74 0.87 $0 >1 >1
1All reductions and incremental costs relative to the mixed fuel code compliant home. 2All reductions and incremental costs relative to the all-electric code compliant home. 3All reductions and incremental costs relative to the mixed fuel code compliant home except the EDR Margins are relative to the Standard Design for each
case which is the all-electric code compliant home. Incremental costs for these packages reflect the cots used in the On-Bill cost effectiveness methodology. Costs differ for the TDV methodology due to differences in the site gas infrastructure costs (see Section 2.6). 4This represents the Efficiency EDR Margin for the Efficiency-Non-Preempted and Efficiency-Equipment packages and Total EDR Margin for the Efficiency & PV, Efficiency & PV/Battery, and Neutral Cost packages. 5Positive values indicate an increase in PV capacity relative to the Standard Design.
Page 191 of 319

2019 Energy Efficiency Ordinance Cost-effectiveness Study
103 2019-08-01
Table 70: Multifamily Climate Zone 10 SDGE Results Summary (Per Dwelling Unit)
Climate Zone 10 SDG&E Multifamily
Annual Net kWh
Annual therms
EDR Margin4
PV Size Change
(kW)5
CO2-Equivalent Emissions (lbs/sf)
NPV of Lifetime
Incremental Cost ($)
Benefit to Cost Ratio (B/C)
Total Reduction On-Bill TDV
Mix
ed
Fu
el 1
Code Compliant (0) 112 n/a n/a 2.29 n/a n/a n/a n/a
Efficiency-Non-Preempted (0) 108 1.5 (0.02) 2.23 0.06 $278 1.09 1.69
Efficiency-Equipment (0) 102 2.5 (0.04) 2.13 0.16 $250 2.60 3.27
Efficiency & PV/Battery (6) 108 10.0 0.03 1.88 0.41 $2,376 0.23 1.57
All
-Ele
ctr
ic 2 Code Compliant 1,507 0 n/a n/a 1.39 n/a n/a n/a n/a
Efficiency-Non-Preempted 1,425 0 1.5 0.00 1.34 0.05 $361 1.53 2.00
Efficiency-Equipment 1,369 0 1.5 0.00 1.31 0.08 $361 2.05 1.98
Efficiency & PV 450 0 10.5 0.60 1.09 0.30 $2,371 2.12 1.79
Efficiency & PV/Battery (4) 0 23.0 0.93 0.63 0.76 $5,395 1.44 1.69
Mix
ed
Fu
el to
All
-Ele
ctr
ic 3
Code Compliant 1,507 0 0.0 0.00 1.39 0.90 ($2,337) 0.73 2.36
Efficiency & PV 56 0 10.5 0.60 1.09 1.20 $34 54.15 >1
Neutral Cost 372 0 10.5 0.70 1.10 1.19 $0 >1 >1
1All reductions and incremental costs relative to the mixed fuel code compliant home. 2All reductions and incremental costs relative to the all-electric code compliant home. 3All reductions and incremental costs relative to the mixed fuel code compliant home except the EDR Margins are relative to the Standard Design for each case
which is the all-electric code compliant home. Incremental costs for these packages reflect the cots used in the On-Bill cost effectiveness methodology. Costs differ for the TDV methodology due to differences in the site gas infrastructure costs (see Section 2.6). 4This represents the Efficiency EDR Margin for the Efficiency-Non-Preempted and Efficiency-Equipment packages and Total EDR Margin for the Efficiency & PV, Efficiency & PV/Battery, and Neutral Cost packages. 5Positive values indicate an increase in PV capacity relative to the Standard Design.
Page 192 of 319

2019 Energy Efficiency Ordinance Cost-effectiveness Study
104 2019-08-01
Climate Zone 11
Table 71: Single Family Climate Zone 11 Results Summary
Climate Zone 11 PG&E Single Family
Annual Net kWh
Annual therms
EDR Margin4
PV Size Change
(kW)5
CO2-Equivalent Emissions (lbs/sf)
NPV of Lifetime
Incremental Cost ($)
Benefit to Cost Ratio (B/C)
Total Reduction On-Bill TDV
Mix
ed
Fu
el 1
Code Compliant (0) 378 n/a n/a 2.14 n/a n/a n/a n/a
Efficiency-Non-Preempted (0) 333 4.0 (0.19) 1.90 0.24 $3,143 0.78 1.20
Efficiency-Equipment 0 320 5.0 (0.21) 1.83 0.31 $1,222 2.50 3.68
Efficiency & PV/Battery (18) 333 9.0 (0.09) 1.78 0.36 $7,026 0.36 1.51
All
-Ele
ctr
ic 2 Code Compliant 4,585 0 n/a n/a 1.15 n/a n/a n/a n/a
Efficiency-Non-Preempted 3,815 0 4.5 0.00 0.99 0.16 $3,735 1.24 1.47
Efficiency-Equipment 3,533 0 5.5 0.00 0.93 0.22 $2,108 2.97 3.33
Efficiency & PV 957 0 14.0 1.79 0.60 0.55 $10,827 1.84 1.55
Efficiency & PV/Battery (13) 0 23.0 2.49 0.36 0.79 $17,077 1.49 1.61
Mix
ed
Fu
el to
All
-Ele
ctr
ic 3
Code Compliant 4,585 0 0.0 0.00 1.15 0.99 ($5,349) 0.49 1.69
Efficiency & PV 957 0 14.0 1.79 0.60 1.54 $5,478 1.64 >1
Neutral Cost 2,429 0 7.0 1.36 0.85 1.29 $0 >1 >1
1All reductions and incremental costs relative to the mixed fuel code compliant home. 2All reductions and incremental costs relative to the all-electric code compliant home. 3All reductions and incremental costs relative to the mixed fuel code compliant home except the EDR Margins are relative to the Standard Design for each
case which is the all-electric code compliant home. Incremental costs for these packages reflect the cots used in the On-Bill cost effectiveness methodology. Costs differ for the TDV methodology due to differences in the site gas infrastructure costs (see Section 2.6). 4This represents the Efficiency EDR Margin for the Efficiency-Non-Preempted and Efficiency-Equipment packages and Total EDR Margin for the Efficiency & PV, Efficiency & PV/Battery, and Neutral Cost packages. 5Positive values indicate an increase in PV capacity relative to the Standard Design.
Page 193 of 319

2019 Energy Efficiency Ordinance Cost-effectiveness Study
105 2019-08-01
Table 72: Multifamily Climate Zone 11 Results Summary (Per Dwelling Unit)
Climate Zone 11 PG&E Multifamily
Annual Net kWh
Annual therms
EDR Margin4
PV Size Change
(kW)5
CO2-Equivalent Emissions (lbs/sf)
NPV of Lifetime
Incremental Cost ($)
Benefit to Cost Ratio (B/C)
Total Reduction On-Bill TDV
Mix
ed
Fu
el 1
Code Compliant (0) 141 n/a n/a 2.38 n/a n/a n/a n/a
Efficiency-Non-Preempted 0 127 2.5 (0.05) 2.18 0.20 $850 0.65 1.17
Efficiency-Equipment (0) 126 3.0 (0.06) 2.16 0.22 $317 1.84 3.29
Efficiency & PV/Battery (9) 127 10.5 0.01 2.00 0.38 $2,950 0.39 1.60
All
-Ele
ctr
ic 2 Code Compliant 1,974 0 n/a n/a 1.42 n/a n/a n/a n/a
Efficiency-Non-Preempted 1,732 0 3.5 0.00 1.29 0.13 $1,011 1.40 1.64
Efficiency-Equipment 1,707 0 3.5 0.00 1.26 0.16 $795 2.02 2.33
Efficiency & PV 504 0 13.0 0.77 0.81 0.61 $3,601 2.22 1.81
Efficiency & PV/Battery (6) 0 25.0 1.14 0.45 0.98 $6,759 1.42 1.81
Mix
ed
Fu
el to
All
-Ele
ctr
ic 3
Code Compliant 1,974 0 0.0 0.00 1.42 0.96 ($2,337) 0.56 1.33
Efficiency & PV 63 0 13.0 0.77 0.81 1.56 $1,264 3.03 >1
Neutral Cost 866 0 9.0 0.70 0.99 1.38 $0 >1 73.96
1All reductions and incremental costs relative to the mixed fuel code compliant home. 2All reductions and incremental costs relative to the all-electric code compliant home. 3All reductions and incremental costs relative to the mixed fuel code compliant home except the EDR Margins are relative to the Standard Design for each case
which is the all-electric code compliant home. Incremental costs for these packages reflect the cots used in the On-Bill cost effectiveness methodology. Costs differ for the TDV methodology due to differences in the site gas infrastructure costs (see Section 2.6). 4This represents the Efficiency EDR Margin for the Efficiency-Non-Preempted and Efficiency-Equipment packages and Total EDR Margin for the Efficiency & PV, Efficiency & PV/Battery, and Neutral Cost packages. 5Positive values indicate an increase in PV capacity relative to the Standard Design.
Page 194 of 319

2019 Energy Efficiency Ordinance Cost-effectiveness Study
106 2019-08-01
Climate Zone 12
Table 73: Single Family Climate Zone 12 Results Summary
Climate Zone 12 PG&E Single Family
Annual Net kWh
Annual therms
EDR Margin4
PV Size Change
(kW)5
CO2-Equivalent Emissions (lbs/sf)
NPV of Lifetime
Incremental Cost ($)
Benefit to Cost Ratio (B/C)
Total Reduction On-Bill TDV
Mix
ed
Fu
el 1
Code Compliant (0) 390 n/a n/a 2.11 n/a n/a n/a n/a
Efficiency-Non-Preempted (0) 344 3.5 (0.06) 1.88 0.23 $1,679 1.18 1.83
Efficiency-Equipment 0 338 3.0 (0.05) 1.85 0.26 $654 3.31 4.65
Efficiency & PV/Battery (23) 344 9.5 0.04 1.76 0.35 $5,568 0.43 1.72
All
-Ele
ctr
ic 2 Code Compliant 4,492 0 n/a n/a 1.05 n/a n/a n/a n/a
Efficiency-Non-Preempted 3,958 0 3.5 0.00 0.94 0.10 $3,735 0.78 1.06
Efficiency-Equipment 3,721 0 5.0 0.00 0.90 0.15 $2,108 2.00 2.51
Efficiency & PV 867 0 15.5 1.97 0.51 0.53 $11,520 1.69 1.41
Efficiency & PV/Battery (15) 0 25.0 2.62 0.29 0.76 $17,586 1.29 1.48
Mix
ed
Fu
el to
All
-Ele
ctr
ic 3
Code Compliant 4,492 0 0.0 0.00 1.05 1.07 ($5,349) 0.63 1.89
Efficiency & PV 867 0 15.5 1.97 0.51 1.60 $6,172 1.77 >1
Neutral Cost 2,374 0 8.0 1.35 0.76 1.36 $0 >1 >1
1All reductions and incremental costs relative to the mixed fuel code compliant home. 2All reductions and incremental costs relative to the all-electric code compliant home. 3All reductions and incremental costs relative to the mixed fuel code compliant home except the EDR Margins are relative to the Standard Design for each
case which is the all-electric code compliant home. Incremental costs for these packages reflect the cots used in the On-Bill cost effectiveness methodology. Costs differ for the TDV methodology due to differences in the site gas infrastructure costs (see Section 2.6). 4This represents the Efficiency EDR Margin for the Efficiency-Non-Preempted and Efficiency-Equipment packages and Total EDR Margin for the Efficiency & PV, Efficiency & PV/Battery, and Neutral Cost packages. 5Positive values indicate an increase in PV capacity relative to the Standard Design.
Page 195 of 319

2019 Energy Efficiency Ordinance Cost-effectiveness Study
107 2019-08-01
Table 74: Multifamily Climate Zone 12 Results Summary (Per Dwelling Unit)
Climate Zone 12 PG&E Multifamily
Annual Net kWh
Annual therms
EDR Margin4
PV Size Change
(kW)5
CO2-Equivalent Emissions (lbs/sf)
NPV of Lifetime
Incremental Cost ($)
Benefit to Cost Ratio (B/C)
Total Reduction On-Bill TDV
Mix
ed
Fu
el 1
Code Compliant (0) 143 n/a n/a 2.33 n/a n/a n/a n/a
Efficiency-Non-Preempted (0) 135 1.5 (0.02) 2.21 0.12 $291 1.10 2.22
Efficiency-Equipment 0 128 2.5 (0.03) 2.12 0.21 $434 1.25 2.22
Efficiency & PV/Battery (11) 135 10.0 0.03 2.03 0.30 $2,394 0.30 1.75
All
-Ele
ctr
ic 2 Code Compliant 1,963 0 n/a n/a 1.34 n/a n/a n/a n/a
Efficiency-Non-Preempted 1,792 0 2.5 0.00 1.24 0.09 $1,011 0.91 1.12
Efficiency-Equipment 1,744 0 2.5 0.00 1.21 0.13 $795 1.56 1.63
Efficiency & PV 472 0 14.0 0.84 0.73 0.60 $3,835 2.08 1.65
Efficiency & PV/Battery (8) 0 26.5 1.20 0.38 0.96 $6,943 1.26 1.68
Mix
ed
Fu
el to
All
-Ele
ctr
ic 3
Code Compliant 1,963 0 0.0 0.00 1.34 1.00 ($2,337) 0.64 1.66
Efficiency & PV 59 0 14.0 0.84 0.73 1.60 $1,498 2.88 >1
Neutral Cost 872 0 9.5 0.70 0.92 1.42 $0 >1 >1
1All reductions and incremental costs relative to the mixed fuel code compliant home. 2All reductions and incremental costs relative to the all-electric code compliant home. 3All reductions and incremental costs relative to the mixed fuel code compliant home except the EDR Margins are relative to the Standard Design for each case
which is the all-electric code compliant home. Incremental costs for these packages reflect the cots used in the On-Bill cost effectiveness methodology. Costs differ for the TDV methodology due to differences in the site gas infrastructure costs (see Section 2.6). 4This represents the Efficiency EDR Margin for the Efficiency-Non-Preempted and Efficiency-Equipment packages and Total EDR Margin for the Efficiency & PV, Efficiency & PV/Battery, and Neutral Cost packages. 5Positive values indicate an increase in PV capacity relative to the Standard Design.
Page 196 of 319
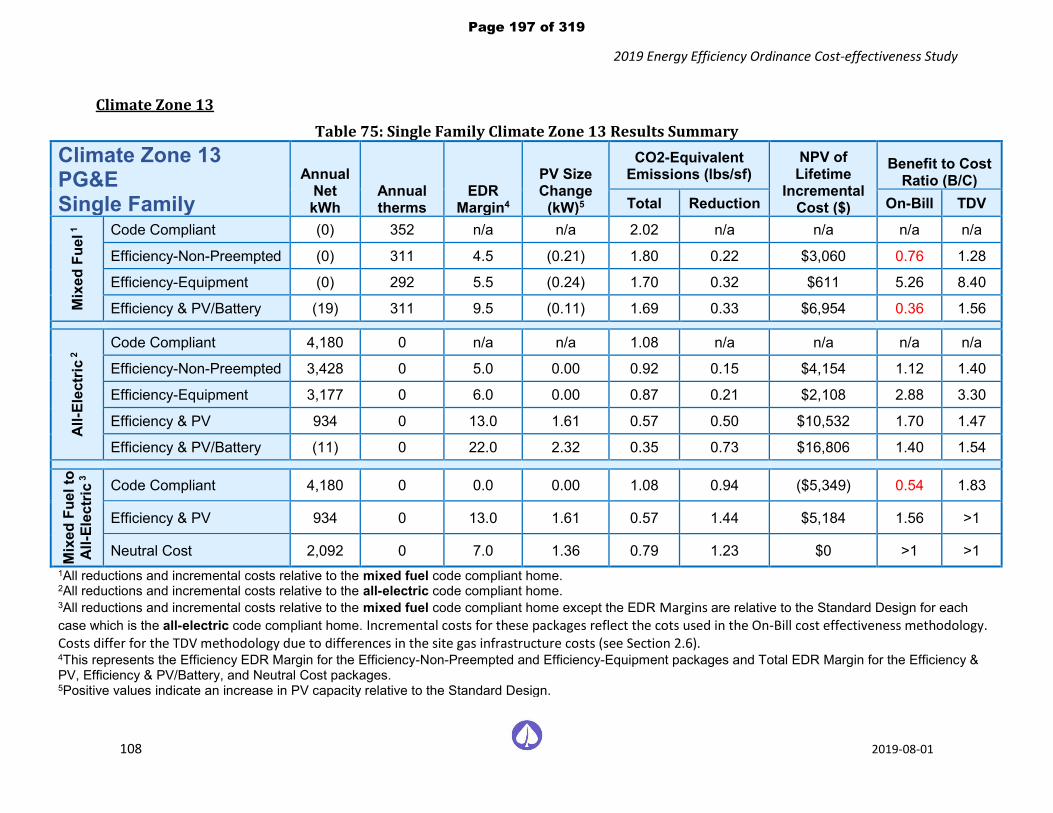
2019 Energy Efficiency Ordinance Cost-effectiveness Study
108 2019-08-01
Climate Zone 13
Table 75: Single Family Climate Zone 13 Results Summary
Climate Zone 13 PG&E Single Family
Annual Net kWh
Annual therms
EDR Margin4
PV Size Change
(kW)5
CO2-Equivalent Emissions (lbs/sf)
NPV of Lifetime
Incremental Cost ($)
Benefit to Cost Ratio (B/C)
Total Reduction On-Bill TDV
Mix
ed
Fu
el 1
Code Compliant (0) 352 n/a n/a 2.02 n/a n/a n/a n/a
Efficiency-Non-Preempted (0) 311 4.5 (0.21) 1.80 0.22 $3,060 0.76 1.28
Efficiency-Equipment (0) 292 5.5 (0.24) 1.70 0.32 $611 5.26 8.40
Efficiency & PV/Battery (19) 311 9.5 (0.11) 1.69 0.33 $6,954 0.36 1.56
All
-Ele
ctr
ic 2 Code Compliant 4,180 0 n/a n/a 1.08 n/a n/a n/a n/a
Efficiency-Non-Preempted 3,428 0 5.0 0.00 0.92 0.15 $4,154 1.12 1.40
Efficiency-Equipment 3,177 0 6.0 0.00 0.87 0.21 $2,108 2.88 3.30
Efficiency & PV 934 0 13.0 1.61 0.57 0.50 $10,532 1.70 1.47
Efficiency & PV/Battery (11) 0 22.0 2.32 0.35 0.73 $16,806 1.40 1.54
Mix
ed
Fu
el to
All
-Ele
ctr
ic 3
Code Compliant 4,180 0 0.0 0.00 1.08 0.94 ($5,349) 0.54 1.83
Efficiency & PV 934 0 13.0 1.61 0.57 1.44 $5,184 1.56 >1
Neutral Cost 2,092 0 7.0 1.36 0.79 1.23 $0 >1 >1
1All reductions and incremental costs relative to the mixed fuel code compliant home. 2All reductions and incremental costs relative to the all-electric code compliant home. 3All reductions and incremental costs relative to the mixed fuel code compliant home except the EDR Margins are relative to the Standard Design for each
case which is the all-electric code compliant home. Incremental costs for these packages reflect the cots used in the On-Bill cost effectiveness methodology. Costs differ for the TDV methodology due to differences in the site gas infrastructure costs (see Section 2.6). 4This represents the Efficiency EDR Margin for the Efficiency-Non-Preempted and Efficiency-Equipment packages and Total EDR Margin for the Efficiency & PV, Efficiency & PV/Battery, and Neutral Cost packages. 5Positive values indicate an increase in PV capacity relative to the Standard Design.
Page 197 of 319

2019 Energy Efficiency Ordinance Cost-effectiveness Study
109 2019-08-01
Table 76: Multifamily Climate Zone 13 Results Summary (Per Dwelling Unit)
Climate Zone 13 PG&E Multifamily
Annual Net kWh
Annual therms
EDR Margin4
PV Size Change
(kW)5
CO2-Equivalent Emissions (lbs/sf)
NPV of Lifetime
Incremental Cost ($)
Benefit to Cost Ratio (B/C)
Total Reduction On-Bill TDV
Mix
ed
Fu
el 1
Code Compliant (0) 135 n/a n/a 2.30 n/a n/a n/a n/a
Efficiency-Non-Preempted (0) 123 3.0 (0.05) 2.12 0.18 $831 0.63 1.27
Efficiency-Equipment (0) 121 3.0 (0.07) 2.10 0.21 $290 1.95 3.75
Efficiency & PV/Battery (9) 123 10.5 0.00 1.95 0.35 $2,936 0.38 1.64
All
-Ele
ctr
ic 2 Code Compliant 1,849 0 n/a n/a 1.36 n/a n/a n/a n/a
Efficiency-Non-Preempted 1,629 0 3.0 0.00 1.24 0.12 $1,011 1.31 1.56
Efficiency-Equipment 1,590 0 3.5 0.00 1.21 0.16 $795 1.98 2.28
Efficiency & PV 501 0 12.0 0.73 0.80 0.56 $3,462 2.12 1.71
Efficiency & PV/Battery (5) 0 23.5 1.11 0.44 0.92 $6,650 1.35 1.74
Mix
ed
Fu
el to
All
-Ele
ctr
ic 3
Code Compliant 1,849 0 0.0 0.00 1.36 0.94 ($2,337) 0.63 1.54
Efficiency & PV 63 0 12.0 0.73 0.80 1.50 $1,125 3.22 >1
Neutral Cost 773 0 8.5 0.70 0.94 1.36 $0 >1 >1
1All reductions and incremental costs relative to the mixed fuel code compliant home. 2All reductions and incremental costs relative to the all-electric code compliant home. 3All reductions and incremental costs relative to the mixed fuel code compliant home except the EDR Margins are relative to the Standard Design for each case
which is the all-electric code compliant home. Incremental costs for these packages reflect the cots used in the On-Bill cost effectiveness methodology. Costs differ for the TDV methodology due to differences in the site gas infrastructure costs (see Section 2.6). 4This represents the Efficiency EDR Margin for the Efficiency-Non-Preempted and Efficiency-Equipment packages and Total EDR Margin for the Efficiency & PV, Efficiency & PV/Battery, and Neutral Cost packages. 5Positive values indicate an increase in PV capacity relative to the Standard Design.
Page 198 of 319

2019 Energy Efficiency Ordinance Cost-effectiveness Study
110 2019-08-01
Climate Zone 14 SCE/SoCalGas
Table 77: Single Family Climate Zone 14 SCE/SoCalGas Results Summary
Climate Zone 14 SCE/SoCalGas Single Family
Annual Net kWh
Annual therms
EDR Margin4
PV Size Change
(kW)5
CO2-Equivalent Emissions (lbs/sf)
NPV of Lifetime
Incremental Cost ($)
Benefit to Cost Ratio (B/C)
Total Reduction On-Bill TDV
Mix
ed
Fu
el 1
Code Compliant (0) 371 n/a n/a 2.35 n/a n/a n/a n/a
Efficiency-Non-Preempted (0) 319 4.5 (0.17) 2.06 0.29 $1,662 1.57 2.46
Efficiency-Equipment (0) 305 5.5 (0.19) 1.98 0.36 $799 3.95 6.14
Efficiency & PV/Battery (5) 319 9.0 (0.08) 1.83 0.52 $5,526 1.31 1.74
All
-Ele
ctr
ic 2 Code Compliant 4,725 0 n/a n/a 1.38 n/a n/a n/a n/a
Efficiency-Non-Preempted 3,819 0 5.5 0.00 1.19 0.19 $4,154 0.95 1.46
Efficiency-Equipment 3,676 0 6.0 0.00 1.16 0.22 $2,108 2.29 3.13
Efficiency & PV 953 0 15.5 1.60 0.93 0.45 $10,459 1.21 1.62
Efficiency & PV/Battery (2) 0 23.5 2.21 0.63 0.75 $16,394 1.35 1.59
Mix
ed
Fu
el to
All
-Ele
ctr
ic 3
Code Compliant 4,725 0 0.0 0.00 1.38 0.97 ($5,349) 0.72 1.67
Efficiency & PV 953 0 15.5 1.60 0.93 1.42 $5,111 1.01 >1
Neutral Cost 2,299 0 8.5 1.35 1.15 1.19 $0 0.00 >1
Min Cost Effectiveness 1,853 0 10.0 1.61 1.12 1.23 ($1,000) 1.24 >1
1All reductions and incremental costs relative to the mixed fuel code compliant home. 2All reductions and incremental costs relative to the all-electric code compliant home. 3All reductions and incremental costs relative to the mixed fuel code compliant home except the EDR Margins are relative to the Standard Design for each case
which is the all-electric code compliant home. Incremental costs for these packages reflect the cots used in the On-Bill cost effectiveness methodology. Costs differ for the TDV methodology due to differences in the site gas infrastructure costs (see Section 2.6). 4This represents the Efficiency EDR Margin for the Efficiency-Non-Preempted and Efficiency-Equipment packages and Total EDR Margin for the Efficiency & PV, Efficiency & PV/Battery, Neutral Cost, and Min Cost Effectiveness packages. 5Positive values indicate an increase in PV capacity relative to the Standard Design.
Page 199 of 319

2019 Energy Efficiency Ordinance Cost-effectiveness Study
111 2019-08-01
Table 78: Multifamily Climate Zone 14 SCE/SoCalGas Results Summary (Per Dwelling Unit)
Climate Zone 14 SCE/SoCalGas Multifamily
Annual Net kWh
Annual therms
EDR Margin4
PV Size Change
(kW)5
CO2-Equivalent Emissions (lbs/sf)
NPV of Lifetime
Incremental Cost ($)
Benefit to Cost Ratio (B/C)
Total Reduction On-Bill TDV
Mix
ed
Fu
el 1
Code Compliant (0) 141 n/a n/a 2.76 n/a n/a n/a n/a
Efficiency-Non-Preempted (0) 126 3.0 (0.04) 2.53 0.23 $874 0.73 1.21
Efficiency-Equipment (0) 126 3.0 (0.05) 2.52 0.23 $347 1.96 2.99
Efficiency & PV/Battery (3) 126 9.5 0.01 2.18 0.58 $2,957 1.09 1.39
All
-Ele
ctr
ic 2 Code Compliant 2,022 0 n/a n/a 1.73 n/a n/a n/a n/a
Efficiency-Non-Preempted 1,759 0 3.5 0.00 1.58 0.15 $1,011 1.24 1.65
Efficiency-Equipment 1,748 0 3.5 0.00 1.56 0.16 $795 1.59 2.20
Efficiency & PV 504 0 14.0 0.70 1.26 0.47 $3,356 1.39 1.91
Efficiency & PV/Battery (2) 0 24.5 1.03 0.79 0.94 $6,380 1.36 1.77
Mix
ed
Fu
el to
All
-Ele
ctr
ic 3
Code Compliant 2,022 0 0.0 0.00 1.73 1.03 ($2,337) 1.13 1.48
Efficiency & PV 63 0 14.0 0.70 1.26 1.50 $1,019 2.57 >1
Neutral Cost 772 0 10.0 0.70 1.41 1.35 $0 >1 >1
1All reductions and incremental costs relative to the mixed fuel code compliant home. 2All reductions and incremental costs relative to the all-electric code compliant home. 3All reductions and incremental costs relative to the mixed fuel code compliant home except the EDR Margins are relative to the Standard Design for each case
which is the all-electric code compliant home. Incremental costs for these packages reflect the cots used in the On-Bill cost effectiveness methodology. Costs differ for the TDV methodology due to differences in the site gas infrastructure costs (see Section 2.6). 4This represents the Efficiency EDR Margin for the Efficiency-Non-Preempted and Efficiency-Equipment packages and Total EDR Margin for the Efficiency & PV, Efficiency & PV/Battery, and Neutral Cost packages. 5Positive values indicate an increase in PV capacity relative to the Standard Design.
Page 200 of 319

2019 Energy Efficiency Ordinance Cost-effectiveness Study
112 2019-08-01
Climate Zone 14 SDGE
Table 79: Single Family Climate Zone 14 SDGE Results Summary
Climate Zone 14 SDG&E Single Family
Annual Net kWh
Annual therms
EDR Margin4
PV Size Change
(kW)5
CO2-Equivalent Emissions (lbs/sf)
NPV of Lifetime
Incremental Cost ($)
Benefit to Cost Ratio (B/C)
Total Reduction On-Bill TDV
Mix
ed
Fu
el 1
Code Compliant (0) 371 n/a n/a 2.35 n/a n/a n/a n/a
Efficiency-Non-Preempted (0) 319 4.5 (0.17) 2.06 0.29 $1,662 1.92 2.46
Efficiency-Equipment (0) 305 5.5 (0.19) 1.98 0.36 $799 4.88 6.14
Efficiency & PV/Battery (5) 319 9.0 (0.08) 1.83 0.52 $5,526 1.23 1.74
All
-Ele
ctr
ic 2 Code Compliant 4,725 0 n/a n/a 1.38 n/a n/a n/a n/a
Efficiency-Non-Preempted 3,819 0 5.5 0.00 1.19 0.19 $4,154 1.30 1.46
Efficiency-Equipment 3,676 0 6.0 0.00 1.16 0.22 $2,108 2.92 3.13
Efficiency & PV 953 0 15.5 1.60 0.93 0.45 $10,459 1.80 1.62
Efficiency & PV/Battery (2) 0 23.5 2.21 0.63 0.75 $16,394 1.67 1.59
Mix
ed
Fu
el to
All
-Ele
ctr
ic 3
Code Compliant 4,725 0 0.0 0.00 1.38 0.97 ($5,349) 0.60 1.67
Efficiency & PV 953 0 15.5 1.60 0.93 1.42 $5,111 1.94 >1
Neutral Cost 2,299 0 8.5 1.35 1.15 1.19 $0 >1 >1
1All reductions and incremental costs relative to the mixed fuel code compliant home. 2All reductions and incremental costs relative to the all-electric code compliant home. 3All reductions and incremental costs relative to the mixed fuel code compliant home except the EDR Margins are relative to the Standard Design for each
case which is the all-electric code compliant home. Incremental costs for these packages reflect the cots used in the On-Bill cost effectiveness methodology. Costs differ for the TDV methodology due to differences in the site gas infrastructure costs (see Section 2.6). 4This represents the Efficiency EDR Margin for the Efficiency-Non-Preempted and Efficiency-Equipment packages and Total EDR Margin for the Efficiency & PV, Efficiency & PV/Battery, and Neutral Cost packages. 5Positive values indicate an increase in PV capacity relative to the Standard Design.
Page 201 of 319

2019 Energy Efficiency Ordinance Cost-effectiveness Study
113 2019-08-01
Table 80: Multifamily Climate Zone 14 SDGE Results Summary (Per Dwelling Unit)
Climate Zone 14 SDG&E Multifamily
Annual Net kWh
Annual therms
EDR Margin4
PV Size Change
(kW)5
CO2-Equivalent Emissions (lbs/sf)
NPV of Lifetime
Incremental Cost ($)
Benefit to Cost Ratio (B/C)
Total Reduction On-Bill TDV
Mix
ed
Fu
el 1
Code Compliant (0) 141 n/a n/a 2.76 n/a n/a n/a n/a
Efficiency-Non-Preempted (0) 126 3.0 (0.04) 2.53 0.23 $874 0.93 1.21
Efficiency-Equipment (0) 126 3.0 (0.05) 2.52 0.23 $347 2.48 2.99
Efficiency & PV/Battery (3) 126 9.5 0.01 2.18 0.58 $2,957 0.51 1.39
All
-Ele
ctr
ic 2 Code Compliant 2,022 0 n/a n/a 1.73 n/a n/a n/a n/a
Efficiency-Non-Preempted 1,759 0 3.5 0.00 1.58 0.15 $1,011 1.47 1.65
Efficiency-Equipment 1,748 0 3.5 0.00 1.56 0.16 $795 2.00 2.20
Efficiency & PV 504 0 14.0 0.70 1.26 0.47 $3,356 2.16 1.91
Efficiency & PV/Battery (2) 0 24.5 1.03 0.79 0.94 $6,380 1.69 1.77
Mix
ed
Fu
el to
All
-Ele
ctr
ic 3
Code Compliant 2,022 0 0.0 0.00 1.73 1.03 ($2,337) 0.51 1.48
Efficiency & PV 63 0 14.0 0.70 1.26 1.50 $1,019 2.60 >1
Neutral Cost 772 0 10.0 0.70 1.41 1.35 $0 >1 >1
1All reductions and incremental costs relative to the mixed fuel code compliant home. 2All reductions and incremental costs relative to the all-electric code compliant home. 3All reductions and incremental costs relative to the mixed fuel code compliant home except the EDR Margins are relative to the Standard Design for each case
which is the all-electric code compliant home. Incremental costs for these packages reflect the cots used in the On-Bill cost effectiveness methodology. Costs differ for the TDV methodology due to differences in the site gas infrastructure costs (see Section 2.6). 4This represents the Efficiency EDR Margin for the Efficiency-Non-Preempted and Efficiency-Equipment packages and Total EDR Margin for the Efficiency & PV, Efficiency & PV/Battery, and Neutral Cost packages. 5Positive values indicate an increase in PV capacity relative to the Standard Design.
Page 202 of 319

2019 Energy Efficiency Ordinance Cost-effectiveness Study
114 2019-08-01
Climate Zone 15
Table 81: Single Family Climate Zone 15 Results Summary
Climate Zone 15 SCE/SoCalGas Single Family
Annual Net kWh
Annual therms
EDR Margin4
PV Size Change
(kW)5
CO2-Equivalent Emissions (lbs/sf)
NPV of Lifetime
Incremental Cost ($)
Benefit to Cost Ratio (B/C)
Total Reduction On-Bill TDV
Mix
ed
Fu
el 1
Code Compliant 0 149 n/a n/a 1.69 n/a n/a n/a n/a
Efficiency-Non-Preempted 0 141 4.5 (0.43) 1.56 0.13 $2,179 1.00 1.58
Efficiency-Equipment (0) 132 4.5 (0.45) 1.51 0.18 ($936) >1 >1
Efficiency & PV/Battery (3) 141 7.0 (0.34) 1.38 0.32 $6,043 1.15 1.51
All
-Ele
ctr
ic 2 Code Compliant 2,149 0 n/a n/a 1.32 n/a n/a n/a n/a
Efficiency-Non-Preempted 1,230 0 5.5 0.00 1.12 0.20 $4,612 1.12 1.58
Efficiency-Equipment 866 0 7.0 0.00 1.04 0.28 $2,108 3.30 4.47
Efficiency & PV 1,030 0 6.0 0.12 1.10 0.22 $5,085 1.12 1.57
Efficiency & PV/Battery (2) 0 13.0 0.83 0.84 0.48 $11,382 1.16 1.54
Mix
ed
Fu
el to
All
-Ele
ctr
ic 3
Code Compliant 2,149 0 0.0 0.00 1.32 0.37 ($5,349) 1.73 2.21
Efficiency & PV 1,030 0 6.0 0.12 1.10 0.59 ($264) >1 >1
Neutral Cost 23 0 6.0 1.36 1.13 0.57 $0 >1 >1
1All reductions and incremental costs relative to the mixed fuel code compliant home. 2All reductions and incremental costs relative to the all-electric code compliant home. 3All reductions and incremental costs relative to the mixed fuel code compliant home except the EDR Margins are relative to the Standard Design for each
case which is the all-electric code compliant home. Incremental costs for these packages reflect the cots used in the On-Bill cost effectiveness methodology. Costs differ for the TDV methodology due to differences in the site gas infrastructure costs (see Section 2.6). 4This represents the Efficiency EDR Margin for the Efficiency-Non-Preempted and Efficiency-Equipment packages and Total EDR Margin for the Efficiency & PV, Efficiency & PV/Battery, and Neutral Cost packages. 5Positive values indicate an increase in PV capacity relative to the Standard Design.
Page 203 of 319

2019 Energy Efficiency Ordinance Cost-effectiveness Study
115 2019-08-01
Table 82: Multifamily Climate Zone 15 Results Summary (Per Dwelling Unit)
Climate Zone 15 SCE/SoCalGas Multifamily
Annual Net kWh
Annual therms
EDR Margin4
PV Size Change
(kW)5
CO2-Equivalent Emissions (lbs/sf)
NPV of Lifetime
Incremental Cost ($)
Benefit to Cost Ratio (B/C)
Total Reduction On-Bill TDV
Mix
ed
Fu
el 1
Code Compliant 0 93 n/a n/a 2.53 n/a n/a n/a n/a
Efficiency-Non-Preempted 0 92 4.0 (0.15) 2.42 0.11 $510 1.35 2.28
Efficiency-Equipment 0 86 4.0 (0.16) 2.33 0.20 ($157) >1 >1
Efficiency & PV/Battery (3) 92 8.5 (0.10) 2.13 0.40 $2,604 1.29 1.70
All
-Ele
ctr
ic 2 Code Compliant 1,243 0 n/a n/a 1.78 n/a n/a n/a n/a
Efficiency-Non-Preempted 954 0 4.0 0.00 1.61 0.17 $1,011 1.50 2.28
Efficiency-Equipment 764 0 6.0 0.00 1.50 0.29 $1,954 1.24 1.72
Efficiency & PV 548 0 7.0 0.24 1.50 0.28 $1,826 1.43 2.07
Efficiency & PV/Battery (3) 0 16.5 0.62 1.08 0.70 $5,020 1.34 1.80
Mix
ed
Fu
el to
All
-Ele
ctr
ic 3
Code Compliant 1,243 0 0.0 0.00 1.78 0.75 ($2,337) 6.36 2.35
Efficiency & PV 68 0 7.0 0.24 1.50 1.03 ($511) >1 >1
Neutral Cost 78 0 7.5 0.70 1.48 1.05 $0 >1 >1
1All reductions and incremental costs relative to the mixed fuel code compliant home. 2All reductions and incremental costs relative to the all-electric code compliant home. 3All reductions and incremental costs relative to the mixed fuel code compliant home except the EDR Margins are relative to the Standard Design for each case
which is the all-electric code compliant home. Incremental costs for these packages reflect the cots used in the On-Bill cost effectiveness methodology. Costs differ for the TDV methodology due to differences in the site gas infrastructure costs (see Section 2.6). 4This represents the Efficiency EDR Margin for the Efficiency-Non-Preempted and Efficiency-Equipment packages and Total EDR Margin for the Efficiency & PV, Efficiency & PV/Battery, and Neutral Cost packages. 5Positive values indicate an increase in PV capacity relative to the Standard Design.
Page 204 of 319

2019 Energy Efficiency Ordinance Cost-effectiveness Study
116 2019-08-01
Climate Zone 16
Table 83: Single Family Climate Zone 16 Results Summary
Climate Zone 16 PG&E Single Family
Annual Net kWh
Annual therms
EDR Margin4
PV Size Change
(kW)5
CO2-Equivalent Emissions (lbs/sf)
NPV of Lifetime
Incremental Cost ($)
Benefit to Cost Ratio (B/C)
Total Reduction On-Bill TDV
Mix
ed
Fu
el 1
Code Compliant (0) 605 n/a n/a 3.31 n/a n/a n/a n/a
Efficiency-Non-Preempted 0 454 5.0 0.01 2.59 0.72 $3,542 1.62 1.46
Efficiency-Equipment 0 474 6.0 (0.08) 2.66 0.65 $2,441 2.19 2.20
Efficiency & PV/Battery (18) 454 10.5 0.10 2.36 0.95 $7,399 0.87 1.37
All
-Ele
ctr
ic 2 Code Compliant 7,694 0 n/a n/a 1.73 n/a n/a n/a n/a
Efficiency-Non-Preempted 5,696 0 9.5 0.00 1.38 0.35 $5,731 1.72 1.69
Efficiency-Equipment 6,760 0 4.5 0.00 1.55 0.18 $2,108 2.36 2.32
Efficiency & PV 1,032 0 26.5 2.75 0.94 0.79 $16,582 2.09 1.62
Efficiency & PV/Battery (11) 0 35.0 3.45 0.64 1.09 $22,838 1.71 1.55
Mix
ed
Fu
el to
All
-Ele
ctr
ic 3
Code Compliant 7,694 0 0.0 0.00 1.73 1.58 ($5,349) 0.31 0.68
Efficiency & PV 1,032 0 26.5 2.75 0.94 2.37 $11,234 1.55 2.02
Neutral Cost 5,398 0 8.5 1.35 1.51 1.80 $0 0.00 0.74
Min Cost Effectiveness 3,358 0 16.0 2.56 1.32 1.99 ($4,753) 1.24 1.40
1All reductions and incremental costs relative to the mixed fuel code compliant home. 2All reductions and incremental costs relative to the all-electric code compliant home. 3All reductions and incremental costs relative to the mixed fuel code compliant home except the EDR Margins are relative to the Standard Design for each case
which is the all-electric code compliant home. Incremental costs for these packages reflect the cots used in the On-Bill cost effectiveness methodology. Costs differ for the TDV methodology due to differences in the site gas infrastructure costs (see Section 2.6). 4This represents the Efficiency EDR Margin for the Efficiency-Non-Preempted and Efficiency-Equipment packages and Total EDR Margin for the Efficiency & PV, Efficiency & PV/Battery, Neutral Cost, and Min Cost Effectiveness packages. 5Positive values indicate an increase in PV capacity relative to the Standard Design.
Page 205 of 319

2019 Energy Efficiency Ordinance Cost-effectiveness Study
117 2019-08-01
Table 84: Multifamily Climate Zone 16 Results Summary (Per Dwelling Unit)
Climate Zone 16 PG&E Multifamily
Annual Net kWh
Annual therms
EDR Margin4
PV Size Change
(kW)5
CO2-Equivalent Emissions (lbs/sf)
NPV of Lifetime
Incremental Cost ($)
Benefit to Cost Ratio (B/C)
Total Reduction On-Bill TDV
Mix
ed
Fu
el 1
Code Compliant 0 206 n/a n/a 3.45 n/a n/a n/a n/a
Efficiency-Non-Preempted (0) 172 2.0 0.03 3.02 0.44 $937 1.11 1.19
Efficiency-Equipment (0) 183 2.5 (0.02) 3.12 0.33 $453 1.76 2.15
Efficiency & PV/Battery (9) 172 9.5 0.08 2.65 0.80 $3,028 0.47 1.28
All
-Ele
ctr
ic 2 Code Compliant 2,699 0 n/a n/a 1.86 n/a n/a n/a n/a
Efficiency-Non-Preempted 2,329 0 4.0 0.00 1.70 0.16 $843 2.08 2.05
Efficiency-Equipment 2,470 0 3.0 0.00 1.74 0.13 $795 1.59 1.70
Efficiency & PV 518 0 19.5 1.07 1.23 0.63 $4,423 2.58 1.89
Efficiency & PV/Battery (6) 0 29.5 1.42 0.75 1.11 $7,533 1.65 1.69
Mix
ed
Fu
el to
All
-Ele
ctr
ic 3
Code Compliant 2,699 0 0.0 0.00 1.86 1.59 ($2,337) 0.43 1.03
Efficiency & PV 65 0 19.5 1.07 1.23 2.22 $2,087 2.87 >1
Neutral Cost 1,518 0 10.0 0.70 1.56 1.90 $0 >1 2.58
1All reductions and incremental costs relative to the mixed fuel code compliant home. 2All reductions and incremental costs relative to the all-electric code compliant home. 3All reductions and incremental costs relative to the mixed fuel code compliant home except the EDR Margins are relative to the Standard Design for each case
which is the all-electric code compliant home. Incremental costs for these packages reflect the cots used in the On-Bill cost effectiveness methodology. Costs differ for the TDV methodology due to differences in the site gas infrastructure costs (see Section 2.6). 4This represents the Efficiency EDR Margin for the Efficiency-Non-Preempted and Efficiency-Equipment packages and Total EDR Margin for the Efficiency & PV, Efficiency & PV/Battery, and Neutral Cost packages. 5Positive values indicate an increase in PV capacity relative to the Standard Design.
Page 206 of 319

Title 24, Parts 6 and 11 Local Energy Efficiency Ordinances
2019 Nonresidential New Construction Reach Code Cost Effectiveness Study
Prepared for: Christopher Kuch
Codes and Standards Program Southern California Edison Company
Prepared by: TRC
EnergySoft
Last Modified: July 25, 2019
ATTACHMENT 3Page 207 of 319

LEGAL NOTICE
This report was prepared by Southern California Edison Company (SCE) and funded by the California utility customers under the auspices of the California Public Utilities Commission. Copyright 2019, Southern California Edison Company. All rights reserved, except that this document may be used, copied, and distributed without modification. Neither SCE nor any of its employees makes any warranty, express or implied; or assumes any legal liability or responsibility for the accuracy, completeness or usefulness of any data, information, method, product, policy or process disclosed in this document; or represents that its use will not infringe any privately-owned rights including, but not limited to, patents, trademarks or copyrights.
Page 208 of 319
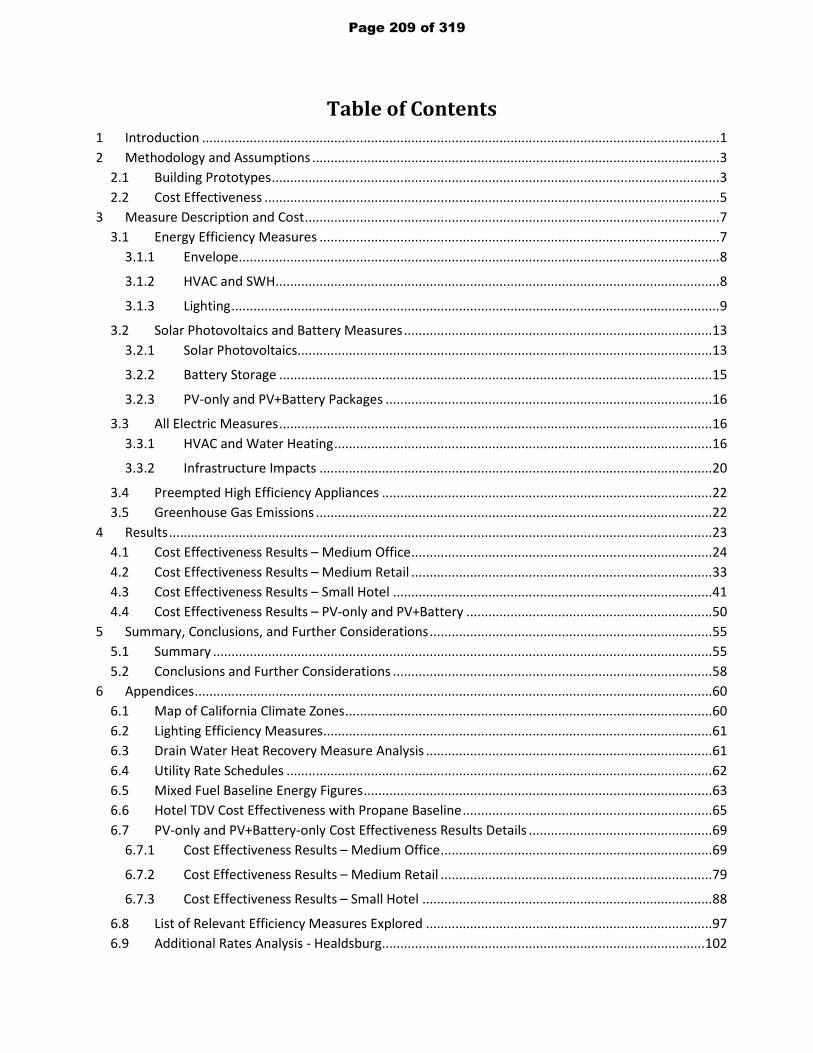
Table of Contents 1 Introduction ............................................................................................................................................. 1 2 Methodology and Assumptions ............................................................................................................... 3
2.1 Building Prototypes .......................................................................................................................... 3 2.2 Cost Effectiveness ............................................................................................................................ 5
3 Measure Description and Cost ................................................................................................................. 7 3.1 Energy Efficiency Measures ............................................................................................................. 7
3.1.1 Envelope ................................................................................................................................... 8
3.1.2 HVAC and SWH ......................................................................................................................... 8
3.1.3 Lighting ..................................................................................................................................... 9
3.2 Solar Photovoltaics and Battery Measures .................................................................................... 13 3.2.1 Solar Photovoltaics ................................................................................................................. 13
3.2.2 Battery Storage ...................................................................................................................... 15
3.2.3 PV-only and PV+Battery Packages ......................................................................................... 16
3.3 All Electric Measures ...................................................................................................................... 16 3.3.1 HVAC and Water Heating ....................................................................................................... 16
3.3.2 Infrastructure Impacts ........................................................................................................... 20
3.4 Preempted High Efficiency Appliances .......................................................................................... 22 3.5 Greenhouse Gas Emissions ............................................................................................................ 22
4 Results .................................................................................................................................................... 23 4.1 Cost Effectiveness Results – Medium Office .................................................................................. 24 4.2 Cost Effectiveness Results – Medium Retail .................................................................................. 33 4.3 Cost Effectiveness Results – Small Hotel ....................................................................................... 41 4.4 Cost Effectiveness Results – PV-only and PV+Battery ................................................................... 50
5 Summary, Conclusions, and Further Considerations ............................................................................. 55 5.1 Summary ........................................................................................................................................ 55 5.2 Conclusions and Further Considerations ....................................................................................... 58
6 Appendices ............................................................................................................................................. 60 6.1 Map of California Climate Zones .................................................................................................... 60 6.2 Lighting Efficiency Measures .......................................................................................................... 61 6.3 Drain Water Heat Recovery Measure Analysis .............................................................................. 61 6.4 Utility Rate Schedules .................................................................................................................... 62 6.5 Mixed Fuel Baseline Energy Figures ............................................................................................... 63 6.6 Hotel TDV Cost Effectiveness with Propane Baseline .................................................................... 65 6.7 PV-only and PV+Battery-only Cost Effectiveness Results Details .................................................. 69
6.7.1 Cost Effectiveness Results – Medium Office .......................................................................... 69
6.7.2 Cost Effectiveness Results – Medium Retail .......................................................................... 79
6.7.3 Cost Effectiveness Results – Small Hotel ............................................................................... 88
6.8 List of Relevant Efficiency Measures Explored .............................................................................. 97 6.9 Additional Rates Analysis - Healdsburg ........................................................................................ 102
Page 209 of 319

List of Figures Figure 1. Measure Category and Package Overview ....................................................................................... 2 Figure 2. Prototype Characteristics Summary ................................................................................................. 4 Figure 3. Utility Tariffs used based on Climate Zone ....................................................................................... 6 Figure 4. Energy Efficiency Measures - Specification and Cost ...................................................................... 10 Figure 5. Medium Office – Annual Percent kWh Offset with 135 kW Array ................................................. 13 Figure 6. Medium Retail – Annual Percent kWh Offset with 110 kW Array .................................................. 14 Figure 7. Small Hotel – Annual Percent kWh Offset with 80 kW Array ......................................................... 14 Figure 8. Medium Office Upfront PV Costs .................................................................................................... 15 Figure 9. All-Electric HVAC and Water Heating Characteristics Summary. .................................................... 17 Figure 10. Medium Office HVAC System Costs .............................................................................................. 18 Figure 11. Medium Retail HVAC System Costs .............................................................................................. 19 Figure 12. Small Hotel HVAC and Water Heating System Costs .................................................................... 20 Figure 13. Medium Office Electrical Infrastructure Costs for All-Electric Design .......................................... 21 Figure 14. Natural Gas Infrastructure Cost Savings for All-Electric Prototypes ............................................. 22 Figure 15. High Efficiency Appliance Assumptions ........................................................................................ 22 Figure 16. Package Summary ......................................................................................................................... 23 Figure 17. Cost Effectiveness for Medium Office Package 1A – Mixed-Fuel + EE ......................................... 26 Figure 18. Cost Effectiveness for Medium Office Package 1B – Mixed-Fuel + EE + PV + B............................ 27 Figure 19. Cost Effectiveness for Medium Office Package 1C – Mixed-Fuel + HE ......................................... 28 Figure 20. Cost Effectiveness for Medium Office Package 2 – All-Electric Federal Code Minimum ............. 29 Figure 21. Cost Effectiveness for Medium Office Package 3A – All-Electric + EE .......................................... 30 Figure 22. Cost Effectiveness for Medium Office Package 3B – All-Electric + EE + PV + B ............................ 31 Figure 23. Cost Effectiveness for Medium Office Package 3C – All-Electric + HE .......................................... 32 Figure 24. Cost Effectiveness for Medium Retail Package 1A – Mixed-Fuel + EE .......................................... 34 Figure 25. Cost Effectiveness for Medium Retail Package 1B – Mixed-Fuel + EE + PV + B ............................ 35 Figure 26. Cost Effectiveness for Medium Retail Package 1C – Mixed-Fuel + HE.......................................... 36 Figure 27. Cost Effectiveness for Medium Retail Package 2 – All-Electric Federal Code Minimum .............. 37 Figure 28. Cost Effectiveness for Medium Retail Package 3A – All-Electric + EE ........................................... 38 Figure 29. Cost Effectiveness for Medium Retail Package 3B – All-Electric + EE + PV + B ............................. 39 Figure 30. Cost Effectiveness for Medium Retail Package 3C – All-Electric + HE .......................................... 40 Figure 31. Cost Effectiveness for Small Hotel Package 1A – Mixed-Fuel + EE ............................................... 43 Figure 32. Cost Effectiveness for Small Hotel Package 1B – Mixed-Fuel + EE + PV + B ................................. 44 Figure 33. Cost Effectiveness for Small Hotel Package 1C – Mixed-Fuel + HE ............................................... 45 Figure 34. Cost Effectiveness for Small Hotel Package 2 – All-Electric Federal Code Minimum ................... 46 Figure 35. Cost Effectiveness for Small Hotel Package 3A – All-Electric + EE ................................................ 47 Figure 36. Cost Effectiveness for Small Hotel Package 3B – All-Electric + EE + PV + B .................................. 48 Figure 37. Cost Effectiveness for Small Hotel Package 3C – All-Electric + HE ................................................ 49 Figure 38. Cost Effectiveness for Medium Office - PV and Battery ............................................................... 52 Figure 39. Cost Effectiveness for Medium Retail - PV and Battery ................................................................ 53 Figure 40. Cost Effectiveness for Small Hotel - PV and Battery ..................................................................... 54 Figure 41. Medium Office Summary of Compliance Margin and Cost Effectiveness .................................... 56 Figure 42. Medium Retail Summary of Compliance Margin and Cost Effectiveness ..................................... 57 Figure 43. Small Hotel Summary of Compliance Margin and Cost Effectiveness .......................................... 58 Figure 44. Map of California Climate Zones ................................................................................................... 60 Figure 45. Impact of Lighting Measures on Proposed LPDs by Space Function ............................................ 61
Page 210 of 319

Figure 46. Utility Tariffs Analyzed Based on Climate Zone – Detailed View .................................................. 62 Figure 47. Medium Office – Mixed Fuel Baseline .......................................................................................... 63 Figure 48. Medium Retail – Mixed Fuel Baseline ........................................................................................... 64 Figure 49. Small Hotel – Mixed Fuel Baseline ................................................................................................ 65 Figure 50. TDV Cost Effectiveness for Small Hotel, Propane Baseline – Package 2 All-Electric Federal Code Minimum ........................................................................................................................................................ 66 Figure 51. TDV Cost Effectiveness for Small Hotel, Propane Baseline – Package 3A (All-Electric + EE) ........ 67 Figure 52. TDV Cost Effectiveness for Small Hotel, Propane Baseline – Package 3B (All-Electric + EE + PV) 67 Figure 53. TDV Cost Effectiveness for Small Hotel, Propane Baseline – Package 3C (All Electric + HE) ........ 68 Figure 54. Cost Effectiveness for Medium Office - Mixed Fuel + 3kW PV ..................................................... 71 Figure 55. Cost Effectiveness for Medium Office – Mixed Fuel + 3kW PV + 5 kWh Battery ......................... 72 Figure 56. Cost Effectiveness for Medium Office – Mixed Fuel + 135kW PV ................................................ 73 Figure 57. Cost Effectiveness for Medium Office – Mixed Fuel + 135kW PV + 50 kWh Battery ................... 74 Figure 58. Cost Effectiveness for Medium Office– All-Electric + 3kW PV ...................................................... 75 Figure 59. Cost Effectiveness for Medium Office – All-Electric + 3kW PV + 5 kWh Battery .......................... 76 Figure 60. Cost Effectiveness for Medium Office – All-Electric + 135kW PV ................................................. 77 Figure 61. Cost Effectiveness for Medium Office – All-Electric + 135kW PV + 50 kWh Battery .................... 78 Figure 62. Cost Effectiveness for Medium Retail – Mixed-Fuel + 3kW PV..................................................... 80 Figure 63. Cost Effectiveness for Medium Retail – Mixed Fuel + 3kW PV + 5 kWh Battery .......................... 81 Figure 64. Cost Effectiveness for Medium Retail – Mixed-Fuel + 110kW PV ................................................ 82 Figure 65. Cost Effectiveness for Medium Retail – Mixed-Fuel + 110 kW PV + 50 kWh Battery ................... 83 Figure 66. Cost Effectiveness for Medium Retail – All-Electric + 3kW PV ..................................................... 84 Figure 67. Cost Effectiveness for Medium Retail – All-Electric + 3kW PV + 5 kWh Battery........................... 85 Figure 68. Cost Effectiveness for Medium Retail – All-Electric + 110kW PV ................................................. 86 Figure 69. Cost Effectiveness for Medium Retail – All-Electric + 110kW PV + 50 kWh Battery .................... 87 Figure 70. Cost Effectiveness for Small Hotel – Mixed Fuel + 3kW PV .......................................................... 89 Figure 71. Cost Effectiveness for Small Hotel – Mixed Fuel + 3kW PV + 5 kWh Battery ............................... 90 Figure 72. Cost Effectiveness for Small Hotel - Mixed Fuel +80kW PV .......................................................... 91 Figure 73. Cost Effectiveness for Small Hotel – Mixed Fuel + 80kW PV + 50 kWh Battery ........................... 92 Figure 74. Cost Effectiveness for Small Hotel – All-Electric + 3kW PV ........................................................... 93 Figure 75. Cost Effectiveness for Small Hotel – All-Electric + 3kW PV + 5 kWh Battery ................................ 94 Figure 76. Cost Effectiveness for Small Hotel – All-Electric + 80kW PV ......................................................... 95 Figure 77. Cost Effectiveness for Small Hotel – All-Electric + 80kW PV + 50 kWh Battery ............................ 96 Figure 78. List of Relevant Efficiency Measures Explored ............................................................................. 97 Figure 79. Healdsburg Utility Rates Analysis – Medium Office, All Packages Cost Effectiveness Summary103 Figure 80. Healdsburg Utility Rates Analysis – Medium Retail, All Packages Cost Effectiveness Summary 104 Figure 81. Healdsburg Utility Rates Analysis – Small Hotel, All Packages Cost Effectiveness Summary ..... 105
Page 211 of 319

2019 Nonresidential New Construction Reach Code Cost Effectiveness Study
1 2019-07-25
1 Introduction The California Building Energy Efficiency Standards Title 24, Part 6 (Title 24) (CEC, 2019) is maintained and updated every three years by two state agencies: the California Energy Commission (the Energy Commission) and the Building Standards Commission (BSC). In addition to enforcing the code, local jurisdictions have the authority to adopt local energy efficiency ordinances—or reach codes—that exceed the minimum standards defined by Title 24 (as established by Public Resources Code Section 25402.1(h)2 and Section 10-106 of the Building Energy Efficiency Standards). Local jurisdictions must demonstrate that the requirements of the proposed ordinance are cost-effective and do not result in buildings consuming more energy than is permitted by Title 24. In addition, the jurisdiction must obtain approval from the Energy Commission and file the ordinance with the BSC for the ordinance to be legally enforceable. This report was developed in coordination with the California Statewide Investor Owned Utilities (IOUs) Codes and Standards Program, key consultants, and engaged cities—collectively known as the Reach Code Team.
This report documents cost-effective combinations of measures that exceed the minimum state requirements for design in newly-constructed nonresidential buildings. Buildings specifically examined include medium office, medium retail, and small hotels. Measures include energy efficiency, solar photovoltaics (PV), and battery storage. In addition, the report includes a comparison between a baseline mixed-fuel design and all-electric design for each occupancy type.
The Reach Code team analyzed the following seven packages as compared to 2019 code compliant mixed-fuel design baseline:
♦ Package 1A – Mixed-Fuel + Energy Efficiency (EE): Mixed-fuel design with energy efficiency measures and federal minimum appliance efficiencies.
♦ Package 1B – Mixed-Fuel + EE + PV + Battery (B): Same as Package 1A, plus solar PV and batteries.
♦ Package 1C – Mixed-fuel + High Efficiency (HE): Baseline code-minimum building with high efficiency appliances, triggering federal preemption. The intent of this package is to assess the standalone contribution that high efficiency appliances would make toward achieving high performance thresholds.
♦ Package 2 – All-Electric Federal Code-Minimum Reference: All-electric design with federal code minimum appliance efficiency. No solar PV or battery.
♦ Package 3A – All-Electric + EE: Package 2 all-electric design with energy efficiency measures and federal minimum appliance efficiencies.
♦ Package 3B – All-Electric + EE + PV + B: Same as Package 3A, plus solar PV and batteries.
♦ Package 3C – All-Electric + HE: All-electric design with high efficiency appliances, triggering federal preemption.
Figure 1 summarizes the baseline and measure packages. Please refer to Section 3 for more details on the measure descriptions.
Page 212 of 319

2019 Nonresidential New Construction Reach Code Cost Effectiveness Study
2 2019-07-25
Figure 1. Measure Category and Package Overview
Measure Category
Report Section
Mixed Fuel All-Electric Baseline 1A 1B 1C 2 3A 3B 3C Fed Code Minimum Efficiency
EE EE+ PV + B HE
Fed Code Minimum Efficiency
EE EE+ PV + B HE
Energy Efficiency Measures
3.1 X X X X
Solar PV + Battery 3.2 X X
All-Electric Measures 3.3 X X X X
Preemptive Appliance Measures
3.4 X X
The team separately developed cost effectiveness results for PV-only and PV+Battery packages, excluding any efficiency measures. For these packages, the PV is modeled as a “minimal” size of 3 kW and a larger size based on the available roof area and electric load of the building. PV sizes are combined with two sizes of battery storage for both mixed fuel and all electric buildings to form eight different package combinations as outlined below:
♦ Mixed-Fuel + 3 kW PV Only
♦ Mixed-Fuel + 3 kW PV + 5 kWh Battery
♦ Mixed-Fuel + PV Only: PV sized per the roof size of the building, or to offset the annual electricity consumption, whichever is smaller
♦ Mixed-Fuel + PV + 50 kWh Battery: PV sized per the roof size of the building, or to offset the annual electricity consumption, whichever is smaller, along with 50 kWh battery
♦ All-Electric + 3 kW PV Only
♦ All-Electric + 3 kW PV + 5 kWh Battery
♦ All-Electric + PV Only: PV sized per the roof size of the building, or to offset the annual electricity consumption, whichever is smaller
♦ All-Electric + PV + 50 kWh Battery: PV sized per the roof size of the building, or to offset the annual electricity consumption, whichever is smaller, along with 50 kWh battery.
Each of the eight packages are evaluated against a baseline model designed as per 2019 Title 24 Part 6 requirements. The Standards baseline for all occupancies in this report is a mixed-fuel design.
The Department of Energy (DOE) sets minimum efficiency standards for equipment and appliances that are federally regulated under the National Appliance Energy Conservation Act (NAECA), including heating, cooling, and water heating equipment.1 Since state and local governments are prohibited from adopting
1 https://www.ecfr.gov/cgi-bin/retrieveECFR?gp=&SID=8de751f141aaa1c1c9833b36156faf67&mc=true&n=pt10.3.431&r=PART&ty=HTML#se10.3.431_197
Page 213 of 319

2019 Nonresidential New Construction Reach Code Cost Effectiveness Study
3 2019-07-25
higher minimum efficiencies than the federal standards require, the focus of this study is to identify and evaluate cost-effective packages that do not include high efficiency equipment. However, because high efficiency appliances are often the easiest and most affordable measures to increase energy performance, this study provides an analysis of high efficiency appliances for informational purposes. While federal preemption would limit a reach code, in practice, builders may install any package of compliant measures to achieve the performance requirements, including higher efficiency appliances that are federally regulated.
2 Methodology and Assumptions With input from several stakeholders, the Reach Codes team selected three building types—medium office, medium retail, and small hotel—to represent a predominant segment of nonresidential new construction in the state.
This analysis used both on-bill and time dependent valuation of energy (TDV) based approaches to evaluate cost-effectiveness. Both methodologies require estimating and quantifying the energy savings associated with energy efficiency measures, as well as quantifying the costs associated with the measures. The main difference between the methodologies is the valuation of energy and thus the cost savings of reduced or avoided energy use. TDV was developed by the Energy Commission to reflect the time dependent value of energy including long-term projected costs of energy such as the cost of providing energy during peak periods of demand and other societal costs including projected costs for carbon emissions. With the TDV approach, electricity used (or saved) during peak periods has a much higher value than electricity used (or saved) during off-peak periods.2
The Reach Code Team performed energy simulations using EnergyPro 8.0 software for 2019 Title 24 code compliance analysis, which uses CBECC-Com 2019.1.0 for the calculation engine. The baseline prototype models in all climate zones have been designed to have compliance margins as close as possible to 0 to reflect a prescriptively-built building.3
2.1 Building Prototypes The DOE provides building prototype models which, when modified to comply with 2019 Title 24 requirements, can be used to evaluate the cost effectiveness of efficiency measures. These prototypes have historically been used by the California Energy Commission to assess potential code enhancements. The Reach Code Team performed analysis on a medium office, a medium retail, and a small hotel prototype.
Water heating includes both service water heating (SWH) for office and retail buildings and domestic hot water for hotels. In this report, water heating or SWH is used to refer to both. The Standard Design HVAC and SWH systems are based on the system maps included in the 2019 Nonresidential Alternate
2 Horii, B., E. Cutter, N. Kapur, J. Arent, and D. Conotyannis. 2014. “Time Dependent Valuation of Energy for Developing Building Energy Efficiency Standards.” Available at: http://www.energy.ca.gov/title24/2016standards/prerulemaking/documents/2014-07-09_workshop/2017_TDV_Documents 3 EnergySoft and TRC were able to develop most baseline prototypes to achieve a compliance margin of less than +/-1 percent except for few models that were at +/- 6 percent. This indicates these prototypes are not exactly prescriptive according to compliance software calculations. To calculate incremental impacts, TRC conservatively compared the package results to that of the proposed design of baseline prototypes (not the standard design).
Page 214 of 319
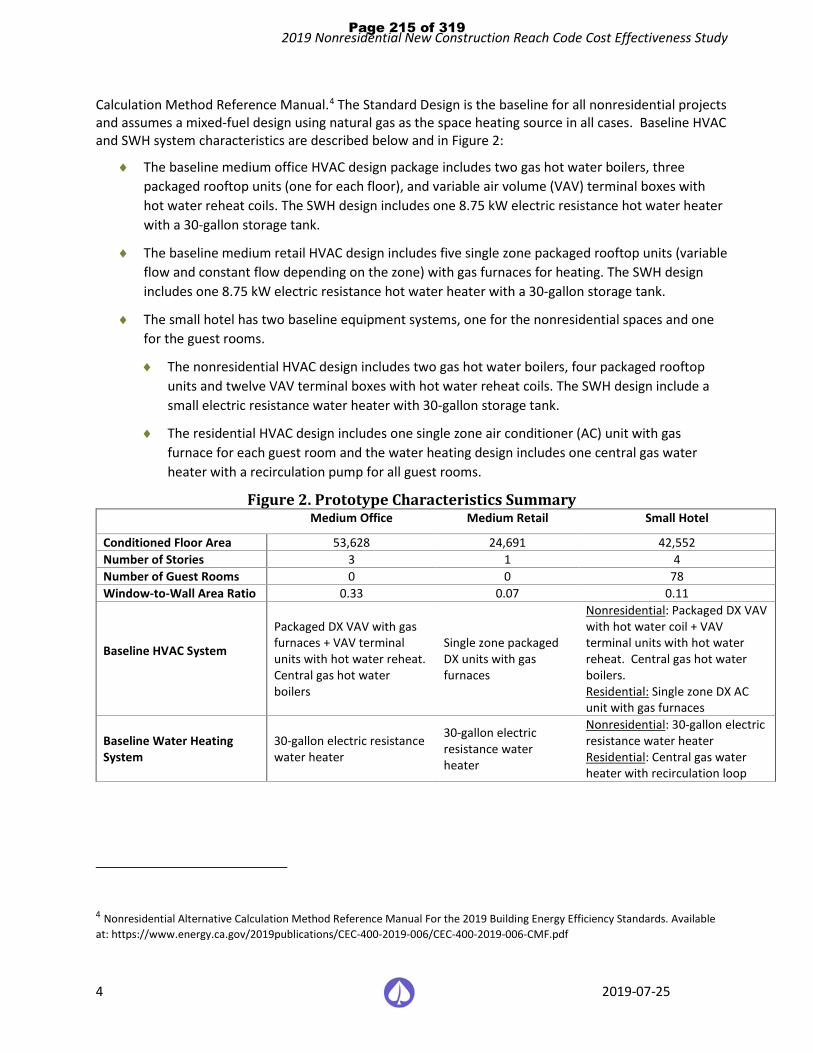
2019 Nonresidential New Construction Reach Code Cost Effectiveness Study
4 2019-07-25
Calculation Method Reference Manual.4 The Standard Design is the baseline for all nonresidential projects and assumes a mixed-fuel design using natural gas as the space heating source in all cases. Baseline HVAC and SWH system characteristics are described below and in Figure 2:
♦ The baseline medium office HVAC design package includes two gas hot water boilers, three packaged rooftop units (one for each floor), and variable air volume (VAV) terminal boxes with hot water reheat coils. The SWH design includes one 8.75 kW electric resistance hot water heater with a 30-gallon storage tank.
♦ The baseline medium retail HVAC design includes five single zone packaged rooftop units (variable flow and constant flow depending on the zone) with gas furnaces for heating. The SWH design includes one 8.75 kW electric resistance hot water heater with a 30-gallon storage tank.
♦ The small hotel has two baseline equipment systems, one for the nonresidential spaces and one for the guest rooms.
♦ The nonresidential HVAC design includes two gas hot water boilers, four packaged rooftop units and twelve VAV terminal boxes with hot water reheat coils. The SWH design include a small electric resistance water heater with 30-gallon storage tank.
♦ The residential HVAC design includes one single zone air conditioner (AC) unit with gas furnace for each guest room and the water heating design includes one central gas water heater with a recirculation pump for all guest rooms.
Figure 2. Prototype Characteristics Summary Medium Office Medium Retail Small Hotel
Conditioned Floor Area 53,628 24,691 42,552 Number of Stories 3 1 4 Number of Guest Rooms 0 0 78 Window-to-Wall Area Ratio 0.33 0.07 0.11
Baseline HVAC System
Packaged DX VAV with gas furnaces + VAV terminal units with hot water reheat. Central gas hot water boilers
Single zone packaged DX units with gas furnaces
Nonresidential: Packaged DX VAV with hot water coil + VAV terminal units with hot water reheat. Central gas hot water boilers. Residential: Single zone DX AC unit with gas furnaces
Baseline Water Heating System
30-gallon electric resistance water heater
30-gallon electric resistance water heater
Nonresidential: 30-gallon electric resistance water heater Residential: Central gas water heater with recirculation loop
4 Nonresidential Alternative Calculation Method Reference Manual For the 2019 Building Energy Efficiency Standards. Available at: https://www.energy.ca.gov/2019publications/CEC-400-2019-006/CEC-400-2019-006-CMF.pdf
Page 215 of 319

2019 Nonresidential New Construction Reach Code Cost Effectiveness Study
5 2019-07-25
2.2 Cost Effectiveness The Reach Code Team analyzed the cost effectiveness of the packages by applying them to building prototypes (as applicable) using the life cycle cost methodology, which is approved and used by the Energy Commission to establish cost effective building energy standards (Title 24, Part 6).5
Per Energy Commission’s methodology, the Reach Code Team assessed the incremental costs of the energy efficiency measure packages and compared them to the energy cost savings over the measure life of 15 years. Incremental costs represent the equipment, installation, replacements, and maintenance costs of the proposed measure relative to the 2019 Title 24 Standards minimum requirements. The energy savings benefits are estimated using both TDV of energy and typical utility rates for each building type:
♦ Time Dependent Valuation: TDV is a normalized monetary format developed and used by the Energy Commission for comparing electricity and natural gas savings, and it considers the cost of electricity and natural gas consumed during different times of the day and year. Simulation outputs are translated to TDV savings benefits using 2019 TDV multipliers and 15-year discounted costs for the nonresidential measure packages.
♦ Utility bill impacts (On-bill): Utility energy costs are estimated by applying appropriate IOU rates to estimated annual electricity and natural gas consumption. The energy bill savings are calculated as the difference in utility costs between the baseline and proposed package over a 15-year duration accounting for discount rate and energy cost escalation.
In coordination with the IOU rate team, and rate experts at a few electric publicly owned utilities (POUs), the Reach Code Team used the current nonresidential utility rates publicly available at the time of analysis to analyze the cost effectiveness for each proposed package. The utility tariffs, summarized in Figure 3, were determined based on the annual load profile of each prototype, and the most prevalent rate in each territory. For some prototypes there are multiple options for rates because of the varying load profiles of mixed-fuel buildings versus all-electric buildings. Tariffs were integrated in EnergyPro software to be applied to the hourly electricity and gas outputs. The Reach Code Team did not attempt to compare or test a variety of tariffs to determine their impact on cost effectiveness.
The currently available and applicable time-of–use (TOU) nonresidential rates are applied to both the base and proposed cases with PV systems.6 Any annual electricity production in excess of annual electricity consumption is credited at the applicable wholesale rate based on the approved NEM tariffs for that utility. For a more detailed breakdown of the rates selected refer to Appendix 6.4 Utility Rate Schedules. Note that most utility time-of-use rates will be updated in the near future, which can affect cost effectiveness results. For example, Pacific Gas and Electric Company (PG&E) will introduce new rates for new service connections in late 2019, and existing accounts will be automatically rolled over to new rates in November 2020.
5 Architectural Energy Corporation (January 2011) Life-Cycle Cost Methodology. California Energy Commission. Available at: http://www.energy.ca.gov/title24/2013standards/prerulemaking/documents/general_cec_documents/2011-01-14_LCC_Methodology_2013.pdf 6 Under NEM rulings by the CPUC (D-16-01-144, 1/28/16), all new PV customers shall be in an approved TOU rate structure. As of March 2016, all new PG&E net energy metering (NEM) customers are enrolled in a time-of-use rate. (http://www.pge.com/en/myhome/saveenergymoney/plans/tou/index.page?).
Page 216 of 319

2019 Nonresidential New Construction Reach Code Cost Effectiveness Study
6 2019-07-25
Figure 3. Utility Tariffs used based on Climate Zone Climate Zones
Electric / Gas Utility Electricity (Time-of-use) Natural Gas
IOUs 1-5,11-13,16 PG&E A-1/A-10 G-NR1
5 PG&E / Southern California Gas Company A-1/A-10 G-10 (GN-10)
6,8-10,14,15 SCE / Southern California Gas Company TOU-GS-1/TOU-GS-2/TOU-GS-3
G-10 (GN-10)
7,10,14 San Diego Gas and Electric Company (SDG&E)
A-1/A-10 GN-3
Electric POUs 4 City of Palo Alto (CPAU) E-2 n/a
12 Sacramento Municipal Utility District (SMUD)
GS n/a
6,7,8,16 Los Angeles Department of Water and Power (LADWP)
A-2 (B) n/a
The Reach Code Team obtained measure costs through interviews with contractors and California distributors and review of online sources, such as Home Depot and RS Means. Taxes and contractor markups were added as appropriate. Maintenance costs were not included because there is no assumed maintenance on the envelope measures. For HVAC and SWH measures the study assumes there are no additional maintenance cost for a more efficient version of the same system type as the baseline. Replacement costs for inverters were included for PV systems, but the useful life all other equipment exceeds the study period.
The Reach Code Team compared the energy benefits with incremental measure cost data to determine cost effectiveness for each measure package. The calculation is performed for a duration of 15 years for all nonresidential prototypes with a 3 percent discount rate and fuel escalation rates based on the most recent General Rate Case filings and historical escalation rates.7 Cost effectiveness is presented using net present value and benefit-to-cost ratio metrics.
♦ Net Present Value (NPV): The Reach Code Team uses net savings (NPV benefits minus NPV costs) as the cost effectiveness metric. If the net savings of a measure or package is positive, it is considered cost effective. Negative savings represent net costs. A measure that has negative energy cost benefits (energy cost increase) can still be cost effective if the costs to implement the measure are more negative (i.e., material and maintenance cost savings).
♦ Benefit-to-Cost Ratio (B/C): Ratio of the present value of all benefits to the present value of all costs over 15 years (NPV benefits divided by NPV costs). The criteria for cost effectiveness is a B/C greater than 1.0. A value of one indicates the savings over the life of the measure are equivalent to the incremental cost of that measure.
7 2019 TDV Methodology Report, California Energy Commission, Docket number: 16-BSTD-06 https://efiling.energy.ca.gov/GetDocument.aspx?tn=216062
Page 217 of 319

2019 Nonresidential New Construction Reach Code Cost Effectiveness Study
7 2019-07-25
There are several special circumstances to consider when reviewing these results:
♦ Improving the efficiency of a project often requires an initial incremental investment. However, some packages result in initial construction cost savings (negative incremental cost), and either energy cost savings (positive benefits), or increased energy costs (negative benefits). Typically, utility bill savings are categorized as a ‘benefit’ while incremental construction costs are treated as ‘costs.’ In cases where both construction costs are negative and utility bill savings are negative, the construction cost savings are treated as the ‘benefit’ while the utility bill negative savings are the ‘cost.’
♦ In cases where a measure package is cost effective immediately (i.e., there are upfront cost savings and lifetime energy cost savings), cost effectiveness is represented by “>1”.
♦ The B/C ratios sometimes appear very high even though the cost numbers are not very high (for example, an upfront cost of $1 but on-bill savings of $200 over 30 years would equate to a B/C ratio of 200). NPV is also displayed to clarify these potentially confusing conclusions – in the example, the NPV would be equal to a modest $199.
3 Measure Description and Cost Using the 2019 Title 24 code baseline as the starting point, The Reach Code Team identified potential measure packages to determine the projected energy (therm and kWh) and compliance impacts. The Reach Code Team developed an initial measure list based on experience with designers and contractors along with general knowledge of the relative acceptance and preferences of many measures, as well as their incremental costs.
The measures are categorized into energy efficiency, solar PV and battery, all-electric, and preempted high efficiency measures in subsections below.
3.1 Energy Efficiency Measures This section describes all the energy efficiency measures considered for this analysis to develop a non-preempted, cost-effective efficiency measure package. The Reach Code Team assessed the cost-effectiveness of measures for all climate zones individually and found that the packages did not need to vary by climate zone, with the exception of a solar heat gain coefficient measure in hotels, as described in more detail below. The measures were developed based on reviews of proposed 2022 Title 24 codes and standards enhancement measures, as well as ASHRAE 90.1 and ASHRAE 189.1 Standards. Please refer to Appendix Section 6.86.7 for a list of efficiency measures that were considered but not implemented.
Page 218 of 319

2019 Nonresidential New Construction Reach Code Cost Effectiveness Study
8 2019-07-25
Figure 4 provides a summary of the cost of each measure and the applicability of each measure to the prototype buildings.
3.1.1 Envelope ♦ Modify Solar Heat Gain Coefficient (SHGC) fenestration
♦ Office and Retail - All Climate Zones: reduce window SHGC from the prescriptive value of 0.25 to 0.22
♦ Hotel
♦ Climate zones 1, 2, 3, 5, and 16: Increase the SHGC for all nonresidential spaces from the prescriptive value of 0.25 to 0.45 in both common and guest room spaces.
♦ Climate zones 4, and 6-15: Reduce window SHGC from the prescriptive value of 0.25 to 0.22, only for common spaces.
In all cases, the fenestration visible transmittance and U-factor remain at prescriptive values.
♦ Fenestration as a function of orientation: Limit the amount of fenestration area as a function of orientation. East-facing and west-facing windows are each limited to one-half of the average amount of north-facing and south-facing windows.
3.1.2 HVAC and SWH ♦ Drain water heat recovery (DWHR): Add shower drain heat recovery in hotel guest rooms. DWHR
captures waste heat from a shower drain line and uses it to preheat hot water. Note that this measure cannot currently be modeled on hotel/motel spaces, and the Reach Code Team integrated estimated savings outside of modeling software based on SWH savings in residential scenarios. Please see Appendix Section 6.3 for details on energy savings analysis.
♦ VAV box minimum flow: Reduce VAV box minimum airflows from the current T24 prescriptive requirement of 20 percent of maximum (design) airflow to the T24 zone ventilation minimums.
♦ Economizers on small capacity systems: Require economizers and staged fan control in units with cooling capacity ≥ 33,000 Btu/hr and ≤ 54,000 Btu/hr, which matches the requirement in the 2018 International Green Construction Code and adopts ANSI/ASHRAE/ICC/USGBC/IES Standard 189.1. This measure reduces the T24 prescriptive threshold on air handling units that are required to have economizers, which is > 54,000 Btu/hr.
♦ Solar thermal hot water: For all-electric hotel only, add solar thermal water heating to supply the following portions of the water heating load, measured in solar savings fraction (SSF):
♦ 20 percent SSF in CZs 2, 3, and 5-9
♦ 25 percent in CZ4
♦ 35 percent SSF in CZs 1 and 10-16.
Page 219 of 319

2019 Nonresidential New Construction Reach Code Cost Effectiveness Study
9 2019-07-25
3.1.3 Lighting ♦ Interior lighting reduced lighting power density (LPD): Reduce LPD by 15 percent for Medium
Office, 10 percent for Medium Retail and by 10 percent for the nonresidential areas of the Small Hotel.
♦ Institutional tuning: Limit the maximum output or maximum power draw of lighting to 85 percent of full light output or full power draw.
♦ Daylight dimming plus off: Turn daylight-controlled lights completely off when the daylight available in the daylit zone is greater than 150 percent of the illuminance received from the general lighting system at full power. There is no associated cost with this measure, as the 2019 T24 Standards already require multilevel lighting and daylight sensors in primary and secondary daylit spaces. This measure is simply a revised control strategy and does not increase the number of sensors required or labor to install and program a sensor.
♦ Occupant sensing in open plan offices: In an open plan office area greater than 250 ft2, control lighting based on occupant sensing controls. Two workstations per occupancy sensor.
Details on the applicability and impact of each measure by building type and by space function can be found in Appendices 6.2. The appendix also includes the resulting LPD that is modeled as the proposed by building type and by space function.
Page 220 of 319

2019 Nonresidential New Construction Reach Code Cost Effectiveness Study
10 2019-07-25
Figure 4. Energy Efficiency Measures - Specification and Cost
Measure Baseline T24 Requirement
Measure Applicability ● Included in Packages 1A, 1B, 3A, 3C ─ Not applicable
Incremental Cost Sources & Notes
Med Office
Med Retail
Small Hotel
Guest rooms
Comm Spaces
Envelope
Modify SHGC Fenestration SHGC of 0.25 ● ● ● ●
$1.60 /ft2 window for SHGC decreases, $0/ft2
for SHGC increases
Costs from one manufacturer.
Fenestration as a Function of Orientation
Limit on total window area and west-facing window area as a function of wall area.
● ─ ─ ─ $0
No additional cost associated with the measure which is a design consideration not an equipment cost.
HVAC and SHW
Drain Water Heat Recovery No heat recovery required ─ ─ ● ─ $841 /unit Assume 1 heat recovery unit for every 3 guestrooms. Costs from three manufacturers.
VAV Box Minimum Flow 20 percent of maximum (design) airflow ● ─ ─ ● $0
No additional cost associated with the measure which is a design consideration not an equipment cost.
Economizers on Small Capacity Systems
Economizers required for units > 54,000 Btu/hr ─ ● ─ ─ $2,857 /unit
Costs from one manufacturer’s representative and one mechanical contractor.
Page 221 of 319

2019 Nonresidential New Construction Reach Code Cost Effectiveness Study
11 2019-07-25
Measure Baseline T24 Requirement
Measure Applicability ● Included in Packages 1A, 1B, 3A, 3C ─ Not applicable
Incremental Cost Sources & Notes
Med Office
Med Retail
Small Hotel
Guest rooms
Comm Spaces
Solar Thermal Hot Water For central heat pump water heaters, there is no prescriptive baseline requirement.
─ ─ ●
(electric only)
─ $33/therm-yr
Installed costs reported in the California Solar Initiative Thermal Program Database, 2015-present.8 Costs include tank and were only available for gas backup systems. Costs are reduced by 19 percent per federal income tax credit average through 2022.
Lighting
Interior Lighting Reduced LPD
Per Area Category Method, varies by Primary Function Area. Office area 0.60 – 0.70 W/ft2 depending on area of space. Hotel function area 0.85 W/ft2. Retail Merchandise Sales 1.00 W/ft2
● ● ─ ● $0 Industry report on LED pricing analysis shows that costs are not correlated with efficacy.9
8 http://www.csithermalstats.org/download.html 9 http://calmac.org/publications/LED_Pricing_Analysis_Report_-_Revised_1.19.2018_Final.pdf
Page 222 of 319

2019 Nonresidential New Construction Reach Code Cost Effectiveness Study
12 2019-07-25
Measure Baseline T24 Requirement
Measure Applicability ● Included in Packages 1A, 1B, 3A, 3C ─ Not applicable
Incremental Cost Sources & Notes
Med Office
Med Retail
Small Hotel
Guest rooms
Comm Spaces
Institutional Tuning
No requirement, but Power Adjustment Factor (PAF) credit of 0.10 available for luminaires in non-daylit areas and 0.05 for luminaires in daylit areas10
● ● ─ ● $0.06/ft2 Industry report on institutional tuning11
Daylight Dimming Plus Off No requirement, but PAF credit of 0.10 available. ● ─ ─ ─ $0
Given the amount of lighting controls already required, this measure is no additional cost.
Occupant Sensing in Open Plan Offices
No requirement, but PAF credit of 0.30 available. ● ─ ─ ─
$189 /sensor; $74 /powered relay; $108 /secondary relay
2 workstations per sensor; 1 fixture per workstation; 4 workstations per master relay; 120 ft2/workstation in open office area, which is 53% of total floor area of the medium office
10 Power Adjustment Factors allow designers to tradeoff increased lighting power densities for more efficient designs. In this study, PAF-related measures assume that the more efficient design is incorporated without a tradeoff for increased lighting power density. 11 https://slipstreaminc.org/sites/default/files/2018-12/task-tuning-report-mndoc-2015.pdf
Page 223 of 319

2019 Nonresidential New Construction Reach Code Cost Effectiveness Study
13 2019-07-25
3.2 Solar Photovoltaics and Battery Measures This section describes the PV and battery measures considered for this analysis. The Reach Code Team estimated the required PV sizes for each building prototype for the efficiency measure packages and the stand alone PV and battery options.
3.2.1 Solar Photovoltaics 2019 Title 24 requires nonresidential buildings to reserve at least 15 percent of the roof area as a “solar zone,” but does not include any requirements or compliance credits for the installation of photovoltaic systems. The Reach Code Team analyzed a range of PV system sizes to determine cost effectiveness. To determine upper end of potential PV system size, the Reach Code Team assumed a PV generation capacity of either
♦ 15 W/ft2 covering 50 percent of the roof area, or
♦ Enough to nearly offset the annual energy consumption.
The medium office and small hotel prototypes had small roof areas compared to their annual electricity demand, thus the PV system capacity at 50 percent of the roof area was less than the estimated annual usage. The medium office and small hotel had a 135 kW and 80 kW array, respectively. The medium retail building has a substantially large roof area that would accommodate a PV array that generates more than the annual electricity load of the building. The PV array for the medium retail building was sized at 110 kW to not exceed the annual electricity consumption of the building when accounting for the minimum annual energy demand across climate zones with efficiency packages.
The modeling software for nonresidential buildings does not allow auto-sizing of PV based on a desired percent offset of electricity use. Moreover, the PV size is also constrained by the availability of roof area. Hence, a common size of PV is modeled for all the packages including all electric design. Figure 5 through Figure 7 below demonstrate the percent of electricity offset by PV for both mixed fuel and all electric buildings over their respective federal minimum design package.
Figure 5. Medium Office – Annual Percent kWh Offset with 135 kW Array
0%10%20%30%40%50%60%70%80%90%
100%
1 2 3 4 5 6 7 8 9 10 11 12 13 14 15 16
Climate Zone
Medium Office - Percent kWh Offset by PV
Mixed-Fuel All-Electric
Page 224 of 319

2019 Nonresidential New Construction Reach Code Cost Effectiveness Study
14 2019-07-25
Figure 6. Medium Retail – Annual Percent kWh Offset with 110 kW Array
Figure 7. Small Hotel – Annual Percent kWh Offset with 80 kW Array
The costs for PV include first cost to purchase and install the system, inverter replacement costs, and annual maintenance costs. A summary of the medium office costs and sources is given in Figure 8. Upfront solar PV system costs are reduced by the federal income tax credit (ITC), approximately 19 percent due to a phased reduction in the credit through the year 2022.12
12 The federal credit drops to 26% in 2020, and 22% in 2021 before dropping permanently to 10% for commercial projects and 0% for residential projects in 2022. More information on federal Investment Tax Credits available at: https://www.seia.org/initiatives/solar-investment-tax-credit-itc
0%10%20%30%40%50%60%70%80%90%
100%
1 2 3 4 5 6 7 8 9 10 11 12 13 14 15 16
Climate Zone
Medium Retail - Percent kWh Offset by PV
Mixed fuel All electric
0%10%20%30%40%50%60%70%80%90%
100%
1 2 3 4 5 6 7 8 9 10 11 12 13 14 15 16
Climate Zone
Small Hotel - Percent kWh Offset by PV
Mixed Fuel All-Electric
Page 225 of 319

2019 Nonresidential New Construction Reach Code Cost Effectiveness Study
15 2019-07-25
Figure 8. Medium Office Upfront PV Costs Unit Cost Cost Useful Life (yrs.) Source
Solar PV System $2.30 / Wdc $310,500 30 National Renewable Energy Laboratory (NREL) Q1 201613
Inverter Replacement $0.15 / Wdc $20,250 10 E3 Rooftop Solar PV System Report14
Maintenance Costs $0.02 / Wdc $2,700 1
PV energy output is built into CBECC-Com and is based on NREL’s PVWatts calculator, which includes long term performance degradation estimates.15
3.2.2 Battery Storage This measure includes installation of batteries to allow energy generated through PV to be stored and used later, providing additional energy cost benefits. This report does not focus on optimizing battery sizes or controls for each prototype and climate zone, though the Reach Code Team ran test simulations to assess the impact of battery sizes on TDV savings and found diminishing returns as the battery size increased.
The team set battery control to the Time of Use Control (TOU) method, which assumes batteries are charged anytime PV generation is greater than the building load but discharges to the electric grid beginning during the highest priced hours of the day (the “First Hour of the Summer Peak”). Because there is no default hour available in CBECC-Com, the team applied the default hour available in CBECC-Res to start discharging (hour 19 in CZs 2, 4, and 8-15, and hour 20 in other CZs). This control option is most reflective of the current products on the market. While this control strategy is being used in the analysis, there would be no mandate on the control strategy used in practice.
The current simulation software has approximations of how performance characteristics change with environmental conditions, charge/discharge rates, and degradation with age and use. More information is on the software battery control capabilities and associated qualification requirements are available in the Residential Alternative Calculation Method Reference Manual and the 2019 Reference Appendices for the 2019 Title 24 Standards.16,17
The Reach Code Team used costs of $558 kWh based on a 2018 IOU Codes and Standards Program report, assuming a replacement is necessary in year 15.18 Batteries are also eligible for the ITC if they are installed at the same time as the renewable generation source and at least 75 percent of the energy used to charge
13 Available at: https://www.nrel.gov/docs/fy16osti/66532.pdf
14 Available at: https://efiling.energy.ca.gov/getdocument.aspx?tn=221366
15 More information available at: https://pvwatts.nrel.gov/downloads/pvwattsv5.pdf
16 Battery controls are discussed in Sections 2.1.5.4 and Appendix D of the Residential Alternative Calculation Method Reference Manual, available here: https://ww2.energy.ca.gov/2019publications/CEC-400-2019-005/CEC-400-2019-005-CMF.pdf
17 Qualification Requirements for Battery Storage Systems are available in JA12 of the 2019 Reference Appendices: https://ww2.energy.ca.gov/2018publications/CEC-400-2018-021/CEC-400-2018-021-CMF.pdf 18 Available at: http://localenergycodes.com/download/430/file_path/fieldList/PV%20Plus%20Battery%20Storage%20Report
Page 226 of 319

2019 Nonresidential New Construction Reach Code Cost Effectiveness Study
16 2019-07-25
the battery comes from a renewable source. Thus, the Reach Code Team also applied a 19 percent cost reduction to battery costs.
3.2.3 PV-only and PV+Battery Packages The Reach Code Team analyzed solar PV and battery storage only, without other efficiency measures in both mixed-fuel and all-electric building designs. Two different sizes of solar PV and battery storage were analyzed.
♦ Small PV Size: 3 kW, assumed to be the minimal PV system considered for installation in a nonresidential building.
♦ Large PV Size: PV capacity equal to 15 W/ft2 over 50 percent of the roof area, or sized to nearly offset annual electricity consumption, as described in Section 3.2.1.
♦ Small Battery Size: 5 kWh, assumed to be the minimal battery system considered for installation in a nonresidential building, and representative of smaller products currently available on the market.
♦ Large Battery Size: 50 kWh, assumed to be a substantially large size for a nonresidential setting. Generally, the reach code team found diminishing on-bill and TDV benefits as the battery size increased.
As described in Section 1 and Section 4.4, each PV size was run as a standalone measure. When packaged with a battery measure, the small PV size was paired with the small battery size, and the large PV size was paired with the large battery size.
3.3 All Electric Measures The Reach Code Team investigated the cost and performance impacts and associated infrastructure costs associated with changing the baseline HVAC and water heating systems to all-electric equipment. This includes heat pump space heating, electric resistance reheat coils, electric water heater with storage tank, heat pump water heating, increasing electrical capacity, and eliminating natural gas connections that would have been present in mixed-fuel new construction. The Reach Code Team selected electric systems that would be installed instead of gas-fueled systems in each prototype.
3.3.1 HVAC and Water Heating The nonresidential standards use a mixed-fuel baseline for the Standard Design systems. In most nonresidential occupancies, the baseline is natural gas space heating. Hotel/motels and high-rise residential occupancies also assume natural gas baseline water heating systems for the guest rooms and dwelling units. In the all-electric scenario, gas equipment serving these end-uses is replaced with electric equipment, as described in Figure 9.
Page 227 of 319

2019 Nonresidential New Construction Reach Code Cost Effectiveness Study
17 2019-07-25
Figure 9. All-Electric HVAC and Water Heating Characteristics Summary. Medium Office Medium Retail Small Hotel
HVAC System
Baseline Packaged DX + VAV with HW reheat. Central gas boilers.
Single zone packaged DX with gas furnaces
NonRes: Packaged DX + VAV with HW reheat. Central gas boilers. Res: Single zone DX AC unit with gas furnaces
Proposed All-Electric
Packaged DX + VAV with electric resistance reheat.
Single zone packaged heat pumps
NonRes: Packaged DX + VAV with electric resistance reheat Res: Single zone heat pumps
Water Heating System
Baseline Electric resistance with storage
Electric resistance with storage
NonRes: Electric resistance storage Res: Central gas storage with recirculation
Proposed All-Electric
Electric resistance with storage
Electric resistance with storage
NonRes: Electric resistance storage Res: Individual heat pumps
The Reach Code Team received cost data for baseline mixed-fuel equipment as well as electric equipment from an experienced mechanical contractor in the San Francisco Bay Area. The total construction cost includes equipment and material, labor, subcontractors (for example, HVAC and SHW control systems), and contractor overhead.
3.3.1.1 Medium Office
The baseline HVAC system includes two gas hot water boilers, three packaged rooftop units, and VAV hot water reheat boxes. The SHW design includes one 8.75 kW electric resistance hot water heater with a 30-gallon storage tank.
For the medium office all-electric HVAC design, the Reach Code Team investigated several potential all-electric design options, including variable refrigerant flow, packaged heat pumps, and variable volume and temperature systems. After seeking feedback from the design community, the Reach Code Team determined that the most feasible all-electric HVAC system, given the software modeling constraints is a VAV system with an electric resistance reheat instead of hot water reheat coil. A parallel fan-powered box (PFPB) implementation of electric resistance reheat would further improve efficiency due to reducing ventilation requirements, but an accurate implementation of PFPBs is not currently available in compliance software.
Note that the actual natural gas consumption for the VAV hot water reheat baseline may be higher than the current simulation results due to a combination of boiler and hot water distribution losses. A recent research study shows that the total losses can account for as high as 80 percent of the boiler energy use.19
19 Raftery, P., A. Geronazzo, H. Cheng, and G. Paliaga. 2018. Quantifying energy losses in hot water reheat systems. Energy and Buildings, 179: 183-199. November. https://doi.org/10.1016/j.enbuild.2018.09.020. Retrieved from https://escholarship.org/uc/item/3qs8f8qx
Page 228 of 319

2019 Nonresidential New Construction Reach Code Cost Effectiveness Study
18 2019-07-25
If these losses are considered savings for the electric resistance reheat (which has zero associated distribution loss) may be higher.
The all-electric SHW system remains the same electric resistance water heater as the baseline and has no associated incremental costs.
Cost data for medium office designs are presented in Figure 10. The all-electric HVAC system presents cost savings compared to the hot water reheat system from elimination of the hot water boiler and associated hot water piping distribution. CZ10 and CZ15 all-electric design costs are slightly higher because they require larger size rooftop heat pumps than the other climate zones.
Figure 10. Medium Office HVAC System Costs
Climate Zone Mixed Fuel Baseline All Electric System Incremental cost
for All-Electric CZ01 $1,202,538 $1,106,432 $(96,106) CZ02 $1,261,531 $1,178,983 $(82,548) CZ03 $1,205,172 $1,113,989 $(91,183) CZ04 $1,283,300 $1,205,434 $(77,865) CZ05 $1,207,345 $1,113,989 $(93,356) CZ06 $1,216,377 $1,131,371 $(85,006) CZ07 $1,227,932 $1,148,754 $(79,178) CZ08 $1,250,564 $1,172,937 $(77,626) CZ09 $1,268,320 $1,196,365 $(71,955) CZ10 $1,313,580 $1,256,825 $(56,755) CZ11 $1,294,145 $1,221,305 $(72,840) CZ12 $1,274,317 $1,197,121 $(77,196) CZ13 $1,292,884 $1,221,305 $(71,579) CZ14 $1,286,245 $1,212,236 $(74,009) CZ15 $1,357,023 $1,311,994 $(45,029) CZ16 $1,295,766 $1,222,817 $(72,949)
3.3.1.2 Medium Retail
The baseline HVAC system includes five packaged single zone rooftop ACs with gas furnaces. Based on fan control requirements in section 140.4(m), units with cooling capacity ≥ 65,000 Btu/h have variable air volume fans, while smaller units have constant volume fans. The SHW design includes one 8.75 kW electric resistance hot water heater with a 30-gallon storage tank.
For the medium retail all-electric HVAC design, the Reach Code Team assumed packaged heat pumps instead of the packaged ACs. The all-electric SHW system remains the same electric resistance water heater as the baseline and has no associated incremental costs.
Cost data for medium retail designs are presented in Figure 11. Costs for rooftop air-conditioning systems are very similar to rooftop heat pump systems.
Page 229 of 319

2019 Nonresidential New Construction Reach Code Cost Effectiveness Study
19 2019-07-25
Figure 11. Medium Retail HVAC System Costs Climate Zone Mixed Fuel
Baseline All Electric System Incremental cost for All-Electric
CZ01 $328,312 $333,291 $4,978 CZ02 $373,139 $373,702 $563 CZ03 $322,849 $326,764 $3,915 CZ04 $329,900 $335,031 $5,131 CZ05 $359,888 $362,408 $2,520 CZ06 $335,728 $341,992 $6,265 CZ07 $345,544 $349,808 $4,265 CZ08 $368,687 $369,792 $1,104 CZ09 $415,155 $411,069 $(4,087) CZ10 $345,993 $346,748 $755 CZ11 $418,721 $414,546 $(4,175) CZ12 $405,110 $400,632 $(4,477) CZ13 $376,003 $375,872 $(131) CZ14 $405,381 $406,752 $1,371 CZ15 $429,123 $427,606 $(1,517) CZ16 $401,892 $404,147 $2,256
3.3.1.3 Small Hotel
The small hotel has two different baseline equipment systems, one for the nonresidential spaces and one for the guest rooms. The nonresidential HVAC system includes two gas hot water boilers, four packaged rooftop units and twelve VAV terminal boxes with hot water reheat coil. The SHW design includes a small electric water heater with storage tank. The residential HVAC design includes one single zone AC unit with gas furnace for each guest room and the water heating design includes one central gas storage water heater with a recirculation pump for all guest rooms.
For the small hotel all-electric design, the Reach Code Team assumed the nonresidential HVAC system to be packaged heat pumps with electric resistance VAV terminal units, and the SHW system to remain a small electric resistance water heater.
For the guest room all-electric HVAC system, the analysis used a single zone (packaged terminal) heat pump and a central heat pump water heater serving all guest rooms. Central heat pump water heating with recirculation serving guest rooms cannot yet be modeled in CBECC-Com, and energy impacts were modeled by simulating individual heat pump water heaters in each guest room. The reach code team believes this is a conservative assumption, since individual heat pump water heaters will have much higher tank standby losses. The Reach Code Team attained costs for central heat pump water heating installation including storage tanks and controls and used these costs in the study.
Cost data for small hotel designs are presented in Figure 12. The all-electric design presents substantial cost savings because there is no hot water plant or piping distribution system serving the nonresidential spaces, as well as the lower cost of packaged terminal heat pumps serving the residential spaces compared to split DX/furnace systems with individual flues.
Page 230 of 319

2019 Nonresidential New Construction Reach Code Cost Effectiveness Study
20 2019-07-25
Figure 12. Small Hotel HVAC and Water Heating System Costs Climate Zone Mixed Fuel
Baseline All Electric System Incremental cost for All-Electric
CZ01 $2,337,531 $1,057,178 $(1,280,353) CZ02 $2,328,121 $1,046,795 $(1,281,326) CZ03 $2,294,053 $1,010,455 $(1,283,598) CZ04 $2,302,108 $1,018,675 $(1,283,433) CZ05 $2,298,700 $1,015,214 $(1,283,486) CZ06 $2,295,380 $1,011,753 $(1,283,627) CZ07 $2,308,004 $1,026,029 $(1,281,975) CZ08 $2,333,662 $1,053,717 $(1,279,946) CZ09 $2,312,099 $1,030,355 $(1,281,744) CZ10 $2,354,093 $1,075,348 $(1,278,745) CZ11 $2,347,980 $1,068,426 $(1,279,554) CZ12 $2,328,654 $1,047,660 $(1,280,994) CZ13 $2,348,225 $1,068,858 $(1,279,367) CZ14 $2,345,988 $1,066,263 $(1,279,725) CZ15 $2,357,086 $1,079,241 $(1,277,845) CZ16 $2,304,094 $1,019,973 $(1,284,121)
3.3.2 Infrastructure Impacts Electric heating appliances and equipment often require a larger electrical connection than an equivalent natural gas appliance because of the higher voltage and amperage necessary to electrically generate heat. Thus, many buildings may require larger electrical capacity than a comparable building with natural gas appliances. This includes:
♦ Electric resistance VAV space heating in the medium office and common area spaces of the small hotel.
♦ Heat pump water heating for the guest room spaces of the small hotel.
3.3.2.1 Electrical Panel Sizing and Wiring
This section details the additional electrical panel sizing and wiring required for all-electric measures. In an all-electric new construction scenario, heat pumps replace packaged DX units which are paired with either a gas furnace or a hot water coil (supplied by a gas boiler). The electrical requirements of the replacement heat pump would be the same as the packaged DX unit it replaces, as the electrical requirements would be driven by the cooling capacity, which would remain the same between the two units.
VAV terminal units with hot water reheat coils that are replaced with electric resistance reheat coils require additional electrical infrastructure. In the case of electric resistance coils, the Reach Code Team assumed that on average, a VAV terminal unit serves around 900 ft2 of conditioned space and has a heating capacity of 5 kW (15 kBtu/hr/ft2). The incremental electrical infrastructure costs were determined based on RS Means. Calculations for the medium office shown in Figure 13 include the cost to add electrical panels as well as the cost to add electrical lines to each VAV terminal unit electric resistance coil in the medium office prototype. Additionally, the Reach Code Team subtracted the electrical infrastructure costs associated with hot water pumps required in the mixed fuel baseline, which are not required in the all-electric measures.
Page 231 of 319

2019 Nonresidential New Construction Reach Code Cost Effectiveness Study
21 2019-07-25
The Reach Code Team calculated costs to increase electrical capacity for heat pump water heaters in the small hotel similarly.
Figure 13. Medium Office Electrical Infrastructure Costs for All-Electric Design A - No. VAV Boxes 60 B - VAV box heating capacity (watts) 4,748 C - No. hot water pumps 2 D - Hot water pump power (watts) 398
E - Voltage 208 F (AxB - CxD)/E Panel ampacity required 1,366 G F/400 Number of 400-amp panels required 4 H - Cost per 400-amp panel $3,100 I GxH Total panel cost $12,400
J - Total electrical line length required (ft) 4,320 K - Cost per linear foot of electrical line $3.62 L JxK Total electrical line cost $15,402
I + L Total electrical infrastructure incremental cost $27,802
3.3.2.2 Natural Gas
This analysis assumes that in an all-electric new construction scenario natural gas would not be supplied to the site. Eliminating natural gas in new construction would save costs associated with connecting a service line from the street main to the building, piping distribution within the building, and monthly connection charges by the utility.
The Reach Code Team determined that for a new construction building with natural gas piping, there is a service line (branch connection) from the natural gas main to the building meter. In the medium office prototype, natural gas piping is routed to the boiler. The Reach Code Team assumed that the boiler is on the first floor, and that 30 feet of piping is required from the connection to the main to the boiler. The Reach Code Team assumed 1” corrugated stainless steel tubing (CSST) material is used for the plumbing distribution. The Reach Code Team included costs for a natural gas plan review, service extension, and a gas meter, as shown in Figure 14 below. The natural gas plan review cost is based on information received from the City of Palo Alto Utilities. The meter costs are from PG&E and include both material and labor. The service extension costs are based on guidance from PG&E, who noted that the cost range is highly varied and that there is no “typical” cost, with costs being highly dependent on length of extension, terrain, whether the building is in a developed or undeveloped area, and number of buildings to be served. While an actual service extension cost is highly uncertain, the team believes the costs assumed in this analysis are within a reasonable range based on a sample range of costs provided by PG&E. These costs assume development in a previously developed area.
Page 232 of 319

2019 Nonresidential New Construction Reach Code Cost Effectiveness Study
22 2019-07-25
Figure 14. Natural Gas Infrastructure Cost Savings for All-Electric Prototypes Cost Type Medium Office Medium Retail Small Hotel Natural Gas Plan Review $2,316 $2,316 $2,316 Service Extension $13,000 $13,000 $13,000 Meter $3,000 $3,000 $3,000 Plumbing Distribution $633 $9,711 $37,704 Total Cost $18,949 $28,027 $56,020
3.4 Preempted High Efficiency Appliances The Reach Code Team developed a package of high efficiency (HE) space and water heating appliances based on commonly available products for both the mixed-fuel and all-electric scenarios. This package assesses the standalone contribution that high efficiency measures would make toward achieving high performance thresholds. The Reach Code Team reviewed the Air Conditioning, Heating, and Refrigeration Institute (AHRI) certified product database to estimate appropriate efficiencies.20
The Reach Code Team determined the efficiency increases to be appropriate based on equipment type, summarized in Figure 15, with cost premiums attained from a Bay Area mechanical contractor. The ranges in efficiency are indicative of varying federal standard requirements based on equipment size.
Figure 15. High Efficiency Appliance Assumptions Federal Minimum Efficiency Preempted Efficiency Cost Premium for
HE Appliance Gas space heating and water heating 80-82% 90-95% 10-15%
Large packaged rooftop cooling
9.8-12 EER 11.4-12.9 IEER
10.5-13 EER 15-15.5 IEER
10-15%
Single zone heat pump space heating
7.7 HSPF 3.2 COP
10 HSPF 3.5 COP
6-15%
Heat pump water heating 2.0 UEF 3.3 UEF None (market does not carry 2.0 UEF)
3.5 Greenhouse Gas Emissions The analysis uses the greenhouse gas (GHG) emissions estimates from Zero Code reports available in CBECC-Com.21 Zero Code uses 8760 hourly multipliers accounting for time dependent energy use and carbon emissions based on source emissions, including renewable portfolio standard projections. Fugitive
20 Available at: https://www.ahridirectory.org/Search/SearchHome?ReturnUrl=%2f
21 More information available at: https://zero-code.org/wp-content/uploads/2018/11/ZERO-Code-TSD-California.pdf
Page 233 of 319

2019 Nonresidential New Construction Reach Code Cost Effectiveness Study
23 2019-07-25
emissions are not included. There are two strings of multipliers – one for Northern California climate zones, and another for Southern California climate zones.22
4 Results The Reach Code Team evaluated cost effectiveness of the following measure packages over a 2019 mixed-fuel code compliant baseline for all climate zones, as detailed in Sections 4.1 -- 4.3 and reiterated in Figure 16:
♦ Package 1A – Mixed-Fuel + EE: Mixed-fuel design with energy efficiency measures and federal minimum appliance efficiencies.
♦ Package 1B – Mixed-Fuel + EE + PV + B: Same as Package 1A, plus solar PV and batteries.
♦ Package 1C – Mixed-fuel + HE: Alternative design with high efficiency appliances, triggering federal preemption.
♦ Package 2 – All-Electric Federal Code-Minimum Reference: All-electric design with federal code minimum appliance efficiency. No solar PV or battery.
♦ Package 3A – All-Electric + EE: All-electric design with energy efficiency measures and federal minimum appliance efficiencies.
♦ Package 3B – All-Electric + EE + PV + B: Same as Package 3A, plus solar PV and batteries.
♦ Package 3C – All-Electric + HE: All-electric design with high efficiency appliances, triggering federal preemption.
Figure 16. Package Summary
Package Fuel Type Energy
Efficiency Measures
PV & Battery (PV + B)
High Efficiency Appliances
(HE) Mixed Fuel All-Electric
Mixed-Fuel Code Minimum Baseline X
1A – Mixed-Fuel + EE X X
1B – Mixed-Fuel + EE + PV + B X X X
1C – Mixed-fuel + HE X X
2 – All-Electric Federal Code-Minimum Reference X
3A – All-Electric + EE X X
3B – All-Electric + EE + PV + B X X X
3C – All-Electric + HE X X
22 CBECC-Com documentation does not state which climate zones fall under which region. CBECC-Res multipliers are the same for CZs 1-5 and 11-13 (presumed to be Northern California), while there is another set of multipliers for CZs 6-10 and 14-16 (assumed to be Southern California).
Page 234 of 319
2019 Nonresidential New Construction Reach Code Cost Effectiveness Study
24 2019-07-25
Section 4.4 presents the results of the PV-only and PV+Battery analysis.
The TDV and on-bill based cost effectiveness results are presented in terms of B/C ratio and NPV in this section. What constitutes a ‘benefit’ or a ‘cost’ varies with the scenarios because both energy savings and incremental construction costs may be negative depending on the package. Typically, utility bill savings are categorized as a ‘benefit’ while incremental construction costs are treated as ‘costs.’ In cases where both construction costs are negative and utility bill savings are negative, the construction cost savings are treated as the ‘benefit’ while the utility bill negative savings are as the ‘cost.’
Overarching factors to keep in mind when reviewing the results include:
♦ To pass the Energy Commission’s application process, local reach codes must both be cost effective and exceed the energy performance budget using TDV (i.e., have a positive compliance margin). To emphasize these two important factors, the figures in this Section highlight in green the modeling results that have either a positive compliance margin or are cost effective. This will allow readers to identify whether a scenario is fully or partially supportive of a reach code, and the opportunities/challenges that the scenario presents. Conversely, Section 4.4 only highlights results that both have a positive compliance margin and are cost effective, to allow readers to identify reach code-ready scenarios.
♦ Note: Compliance margin represents the proportion of energy usage that is saved compared to the baseline, measured on a TDV basis.
♦ The Energy Commission does not currently allow compliance credit for either solar PV or battery storage. Thus, the compliance margins in Packages 1A are the same as 1B, and Package 3A is the same as 3B. However, The Reach Code Team did include the impact of solar PV and battery when calculating TDV cost-effectiveness.
♦ When performance modeling residential buildings, the Energy Commission allows the Standard Design to be electric if the Proposed Design is electric, which removes TDV-related penalties and associated negative compliance margins. This essentially allows for a compliance pathway for all-electric residential buildings. Nonresidential buildings are not treated in the same way and are compared to a mixed-fuel standard design.
♦ Results do not include an analysis and comparison of utility rates. As mentioned in Section 2.2, The Reach Code Team coordinated with utilities to select tariffs for each prototype given the annual energy demand profile and the most prevalent rates in each utility territory. The Reach Code Team did not compare a variety of tariffs to determine their impact on cost effectiveness. Note that most utility time-of-use rates are continuously updated, which can affect cost effectiveness results.
♦ As a point of comparison, mixed-fuel baseline energy figures are provided in Appendix 6.5.
4.1 Cost Effectiveness Results – Medium Office Figure 17 through Figure 23 contain the cost-effectiveness findings for the Medium Office packages. Notable findings for each package include:
♦ 1A – Mixed-Fuel + EE: Packages achieve +12 to +20 percent compliance margins depending on climate zone. All packages are cost effective in all climate zones using the TDV approach. All packages are cost effective using the On-Bill approach except for LADWP territory.
Page 235 of 319

2019 Nonresidential New Construction Reach Code Cost Effectiveness Study
25 2019-07-25
♦ 1B – Mixed-Fuel + EE + PV + B: All packages are cost effective using the On-Bill and TDV approaches, except On-Bill in LADWP territory. When compared to 1A, the B/C ratio changes depending on the utility and climate zone (some increase while others decrease). However, NPV savings are increased across the board, suggesting that larger investments yield larger returns.
♦ 1C – Mixed-Fuel + HE: Packages achieve +3 to +5 percent compliance margins depending on climate zone, but no packages were cost effective. The incremental costs of a high efficiency condensing boiler compared to a non-condensing boiler contributes to 26-47% of total incremental cost depending on boiler size. Benefits of condensing boiler efficiency come from resetting hot water return temperature as boiler efficiency increases at lower hot water temperature. However, hot water temperature reset control cannot currently be implemented in the software. In addition, the natural gas energy cost constitutes no more than 5% of total cost for 15 climate zones, so improving boiler efficiency has limited contribution to reduction of total energy cost.
♦ 2 – All-Electric Federal Code-Minimum Reference:
♦ Packages achieve between -27 percent and +1 percent compliance margins depending on climate zone. This is likely because the modeled system is electric resistance, and TDV values electricity consumption more heavily than natural gas. This all-electric design without other efficiency measures does not comply with the Energy Commission’s TDV performance budget.
♦ All incremental costs are negative due to the elimination of natural gas infrastructure.
♦ Packages achieve utility cost savings and are cost effective using the On-Bill approach in CZs 6-10 and 14-15. Packages do not achieve savings and are not cost effective using the On-Bill approach in most of PG&E territory (CZs 1,2,4, 11-13, and 16). Packages achieve savings and are cost effective using TDV in all climate zones except CZ16.
♦ 3A – All-Electric + EE: Packages achieve positive compliance margins except -15 percent in CZ16, which has a higher space heating load than other climate zones. All packages are cost effective in all climate zones except CZ16.
♦ 3B – All-Electric + EE + PV + B: Packages achieve positive compliance margins except -15 percent in CZ16. All packages are cost-effective from a TDV perspective in all climate zones. All packages are cost effective from an On-Bill perspective in all climate zones except in CZ 2 and CZ 16 in LADWP territory.
♦ 3C – All-Electric + HE: Packages achieve between -26 percent and +2 percent compliance margins depending on climate zone. The only packages that are cost effective and with a positive compliance margin are in CZs 7-9 and 15. As described in Package 1C results, space heating is a relatively low proportion of energy costs in most climate zones, limiting the costs gains for higher efficiency equipment.
Page 236 of 319

2019 Nonresidential New Construction Reach Code Cost Effectiveness Study
26 2019-07-25
Figure 17. Cost Effectiveness for Medium Office Package 1A – Mixed-Fuel + EE
CZ Utility
Elec Savings (kWh)
Gas Savings (therms)
GHG Reduc-tions (mtons)
Comp-liance Margin
Incremental Package Cost
Lifecycle Utility Cost Savings
$TDV Savings
B/C Ratio (On-bill)
B/C Ratio (TDV)
NPV (On-bill)
NPV (TDV)
Package 1A: Mixed Fuel + EE CZ01 PG&E 34,421 -808 4.5 18% $66,649 $125,902 $71,307 1.9 1.1 $59,253 $4,658 CZ02 PG&E 40,985 -505 8.1 17% $66,649 $163,655 $99,181 2.5 1.5 $97,005 $32,532 CZ03 PG&E 36,266 -463 7.0 20% $66,649 $141,897 $84,051 2.1 1.3 $75,248 $17,401 CZ04 PG&E 40,590 -547 7.7 14% $66,649 $162,139 $95,410 2.4 1.4 $95,489 $28,761 CZ04-2 CPAU 40,590 -547 7.7 14% $66,649 $85,537 $95,410 1.3 1.4 $18,887 $28,761 CZ05 PG&E 38,888 -499 7.4 18% $66,649 $154,044 $91,115 2.3 1.4 $87,395 $24,465 CZ05-2 SCG 38,888 -499 7.4 18% $66,649 $156,315 $91,115 2.3 1.4 $89,665 $24,465 CZ06 SCE 39,579 -305 8.7 20% $66,649 $86,390 $100,469 1.3 1.5 $19,741 $33,820 CZ06-2 LADWP 39,579 -305 8.7 20% $66,649 $51,828 $100,469 0.8 1.5 ($14,821) $33,820 CZ07 SDG&E 41,817 -6 11.3 20% $66,649 $204,394 $112,497 3.1 1.7 $137,745 $45,848 CZ08 SCE 41,637 -60 10.8 18% $66,649 $89,783 $113,786 1.3 1.7 $23,134 $47,137 CZ08-2 LADWP 41,637 -60 10.8 18% $66,649 $54,876 $113,786 0.8 1.7 ($11,773) $47,137 CZ09 SCE 42,539 -210 10.1 16% $66,649 $95,636 $115,647 1.4 1.7 $28,987 $48,998 CZ09-2 LADWP 42,539 -210 10.1 16% $66,649 $58,168 $115,647 0.9 1.7 ($8,481) $48,998 CZ10 SDG&E 41,857 -216 9.8 17% $66,649 $210,303 $108,726 3.2 1.6 $143,654 $42,077 CZ10-2 SCE 41,857 -216 9.8 17% $66,649 $92,736 $108,726 1.4 1.6 $26,087 $42,077 CZ11 PG&E 42,523 -390 9.1 13% $66,649 $166,951 $104,001 2.5 1.6 $100,301 $37,352 CZ12 PG&E 41,521 -466 8.4 14% $66,649 $161,594 $100,135 2.4 1.5 $94,945 $33,486 CZ12-2 SMUD 41,521 -466 8.4 14% $66,649 $71,734 $100,135 1.1 1.5 $5,085 $33,486 CZ13 PG&E 42,898 -434 9.0 13% $66,649 $169,107 $99,992 2.5 1.5 $102,457 $33,343 CZ14 SDG&E 42,224 -441 8.6 14% $66,649 $211,529 $106,913 3.2 1.6 $144,880 $40,264 CZ14-2 SCE 42,224 -441 8.6 14% $66,649 $95,809 $106,913 1.4 1.6 $29,160 $40,264 CZ15 SCE 45,723 -147 11.2 12% $66,649 $102,714 $118,034 1.5 1.8 $36,065 $51,384 CZ16 PG&E 37,758 -736 5.8 14% $66,649 $145,947 $79,755 2.2 1.2 $79,297 $13,106 CZ16-2 LADWP 37,758 -736 5.8 14% $66,649 $40,115 $79,755 0.6 1.2 ($26,534) $13,106
Page 237 of 319

2019 Nonresidential New Construction Reach Code Cost Effectiveness Study
27 2019-07-25
Figure 18. Cost Effectiveness for Medium Office Package 1B – Mixed-Fuel + EE + PV + B
CZ Utility
Elec Savings (kWh)
Gas Savings (therms)
GHG savings (mtons)
Comp-liance
Margin (%) Incremental Package Cost
Lifecycle Energy Cost
Savings $-TDV
Savings
B/C Ratio
(On-bill)
B/C Ratio (TDV)
NPV (On-bill)
NPV (TDV)
Mixed Fuel + PV + Battery CZ01 PG&E 211,225 -808 39.9 18% $397,405 $645,010 $454,284 1.6 1.1 $247,605 $56,879 CZ02 PG&E 255,787 -505 50.6 17% $397,405 $819,307 $573,033 2.1 1.4 $421,902 $175,628 CZ03 PG&E 245,421 -463 48.8 20% $397,405 $777,156 $536,330 2.0 1.3 $379,751 $138,925 CZ04 PG&E 267,612 -547 52.7 14% $397,405 $836,221 $597,471 2.1 1.5 $438,816 $200,066 CZ04-2 CPAU 267,612 -547 52.7 14% $397,405 $621,879 $597,471 1.6 1.5 $224,474 $200,066 CZ05 PG&E 264,581 -499 52.5 18% $397,405 $897,216 $578,856 2.3 1.5 $499,811 $181,451 CZ05-2 SCG 264,581 -499 52.5 18% $397,405 $899,487 $578,856 2.3 1.5 $502,082 $181,451 CZ06 SCE 257,474 -305 52.1 20% $397,405 $484,229 $594,416 1.2 1.5 $86,824 $197,011 CZ06-2 LA 257,474 -305 52.1 20% $397,405 $282,360 $594,416 0.7 1.5 ($115,045) $197,011 CZ07 SDG&E 264,530 -6 55.7 20% $397,405 $817,528 $610,548 2.1 1.5 $420,123 $213,143 CZ08 SCE 258,348 -60 54.0 18% $397,405 $479,073 $625,249 1.2 1.6 $81,668 $227,844 CZ08-2 LA 258,348 -60 54.0 18% $397,405 $275,704 $625,249 0.7 1.6 ($121,701) $227,844 CZ09 SCE 262,085 -210 54.3 16% $397,405 $480,241 $622,528 1.2 1.6 $82,836 $225,123 CZ09-2 LA 262,085 -210 54.3 16% $397,405 $282,209 $622,528 0.7 1.6 ($115,196) $225,123 CZ10 SDG&E 258,548 -216 53.4 17% $397,405 $839,931 $595,323 2.1 1.5 $442,526 $197,918 CZ10-2 SCE 258,548 -216 53.4 17% $397,405 $485,523 $595,323 1.2 1.5 $88,118 $197,918 CZ11 PG&E 253,623 -390 50.9 13% $397,405 $826,076 $585,682 2.1 1.5 $428,671 $188,277 CZ12 PG&E 252,868 -466 50.3 14% $397,405 $802,715 $582,866 2.0 1.5 $405,310 $185,461 CZ12-2 SMUD 252,868 -466 50.3 14% $397,405 $415,597 $582,866 1.0 1.5 $18,192 $185,461 CZ13 PG&E 250,915 -434 50.4 13% $397,405 $806,401 $573,606 2.0 1.4 $408,996 $176,201 CZ14 SDG&E 283,684 -441 56.4 14% $397,405 $874,753 $676,271 2.2 1.7 $477,348 $278,866 CZ14-2 SCE 283,684 -441 56.4 14% $397,405 $493,888 $676,271 1.2 1.7 $96,483 $278,866 CZ15 SCE 274,771 -147 56.0 12% $397,405 $476,327 $640,379 1.2 1.6 $78,922 $242,974 CZ16 PG&E 266,490 -736 51.8 14% $397,405 $842,205 $575,563 2.1 1.4 $444,800 $178,158 CZ16-2 LA 266,490 -736 51.8 14% $397,405 $260,372 $575,563 0.7 1.4 ($137,033) $178,158
Page 238 of 319

2019 Nonresidential New Construction Reach Code Cost Effectiveness Study
28 2019-07-25
Figure 19. Cost Effectiveness for Medium Office Package 1C – Mixed-Fuel + HE
CZ Utility
Elec Savings (kWh)
Gas Savings (therms)
GHG Reductions (mtons)
Comp-liance Margin
Incremental Package Cost
Lifecycle Utility Cost Savings
$TDV Savings
B/C Ratio (On-bill)
B/C Ratio (TDV)
NPV (On-bill)
NPV (TDV)
Package 1C: Mixed Fuel + HE CZ01 PG&E 288 688 4.1 3% $61,253 $18,656 $12,314 0.3 0.2 ($42,597) ($48,939) CZ02 PG&E 3,795 550 4.3 4% $68,937 $36,683 $24,676 0.5 0.4 ($32,254) ($44,261) CZ03 PG&E 1,241 439 2.9 3% $57,529 $20,150 $11,885 0.4 0.2 ($37,379) ($45,644) CZ04 PG&E 5,599 529 4.7 5% $72,074 $44,915 $30,928 0.6 0.4 ($27,158) ($41,145) CZ04-2 CPAU 5,599 529 4.7 5% $72,074 $24,175 $30,928 0.3 0.4 ($47,898) ($41,145) CZ05 PG&E 3,470 453 3.6 4% $60,330 $35,072 $18,232 0.6 0.3 ($25,258) ($42,097) CZ05-2 SCG 3,470 453 3.6 4% $60,330 $32,777 $18,232 0.5 0.3 ($27,553) ($42,097) CZ06 SCE 3,374 298 2.6 3% $55,594 $19,446 $16,132 0.3 0.3 ($36,148) ($39,462) CZ06-2 LADWP 3,374 298 2.6 3% $55,594 $13,450 $16,132 0.2 0.3 ($42,145) ($39,462) CZ07 SDG&E 5,257 140 2.3 4% $54,111 $41,086 $19,903 0.8 0.4 ($13,025) ($34,208) CZ08 SCE 5,921 176 2.7 4% $60,497 $22,210 $24,055 0.4 0.4 ($38,287) ($36,442) CZ08-2 LADWP 5,921 176 2.7 4% $60,497 $14,064 $24,055 0.2 0.4 ($46,434) ($36,442) CZ09 SCE 7,560 224 3.5 4% $61,311 $28,576 $31,835 0.5 0.5 ($32,735) ($29,476) CZ09-2 LADWP 7,560 224 3.5 4% $61,311 $18,262 $31,835 0.3 0.5 ($43,049) ($29,476) CZ10 SDG&E 5,786 288 3.2 4% $62,685 $50,717 $24,628 0.8 0.4 ($11,968) ($38,057) CZ10-2 SCE 5,786 288 3.2 4% $62,685 $24,575 $24,628 0.4 0.4 ($38,110) ($38,057) CZ11 PG&E 8,128 441 4.9 5% $71,101 $54,188 $37,849 0.8 0.5 ($16,912) ($33,252) CZ12 PG&E 6,503 478 4.7 5% $68,329 $47,329 $34,556 0.7 0.5 ($20,999) ($33,773) CZ12-2 SMUD 6,503 478 4.7 5% $68,329 $24,003 $34,556 0.4 0.5 ($44,325) ($33,773) CZ13 PG&E 8,398 432 5.0 5% $69,474 $51,347 $37,229 0.7 0.5 ($18,128) ($32,246) CZ14 SDG&E 7,927 470 5.0 5% $69,463 $62,744 $37,133 0.9 0.5 ($6,718) ($32,329) CZ14-2 SCE 7,927 470 5.0 5% $69,463 $32,517 $37,133 0.5 0.5 ($36,946) ($32,329) CZ15 SCE 15,140 219 5.5 5% $66,702 $43,773 $52,359 0.7 0.8 ($22,929) ($14,344) CZ16 PG&E 3,111 912 6.3 5% $71,765 $36,002 $24,914 0.5 0.3 ($35,763) ($46,851) CZ16-2 LADWP 3,111 912 6.3 5% $71,765 $23,057 $24,914 0.3 0.3 ($48,708) ($46,851)
Page 239 of 319

2019 Nonresidential New Construction Reach Code Cost Effectiveness Study
29 2019-07-25
Figure 20. Cost Effectiveness for Medium Office Package 2 – All-Electric Federal Code Minimum
CZ Utility Elec Savings (kWh)
Gas Savings (therms)
GHG Reductions (mtons)
Comp-liance Margin
Incremental Package Cost*
Lifecycle Utility Cost Savings
$TDV Savings
B/C Ratio (On-bill)
B/C Ratio (TDV)
NPV (On-bill)
NPV (TDV)
Package 2: All-Electric Federal Code Minimum CZ01 PG&E -53,657 4967 10.1 -15% ($87,253) ($98,237) ($58,420) 0.9 1.5 ($10,984) $28,833 CZ02 PG&E -49,684 3868 5.0 -7% ($73,695) ($101,605) ($41,429) 0.7 1.8 ($27,910) $32,266 CZ03 PG&E -35,886 3142 5.6 -7% ($82,330) ($57,345) ($29,592) 1.4 2.8 $24,986 $52,738 CZ04 PG&E -48,829 3759 4.7 -6% ($69,012) ($90,527) ($40,570) 0.8 1.7 ($21,515) $28,443 CZ04-2 CPAU -48,829 3759 4.7 -6% ($69,012) ($19,995) ($40,570) 3.5 1.7 $49,018 $28,443 CZ05 PG&E -40,531 3240 4.5 -8% ($84,503) ($63,663) ($39,997) 1.3 2.1 $20,840 $44,506 CZ06 SCE -26,174 2117 3.1 -4% ($76,153) $24,908 ($20,571) >1 3.7 $101,061 $55,581 CZ06-2 LADWP -26,174 2117 3.1 -4% ($76,153) $26,366 ($20,571) >1 3.7 $102,518 $55,581 CZ07 SDG&E -12,902 950 0.9 -2% ($70,325) $46,879 ($11,407) >1 6.2 $117,204 $58,918 CZ08 SCE -15,680 1219 1.5 -2% ($68,774) $17,859 ($12,648) >1 5.4 $86,633 $56,125 CZ08-2 LADWP -15,680 1219 1.5 -2% ($68,774) $18,603 ($12,648) >1 5.4 $87,376 $56,125 CZ09 SCE -19,767 1605 2.4 -2% ($63,102) $20,920 ($14,462) >1 4.4 $84,022 $48,640 CZ09-2 LADWP -19,767 1605 2.4 -2% ($63,102) $21,929 ($14,462) >1 4.4 $85,030 $48,640 CZ10 SDG&E -27,414 2053 2.2 -4% ($47,902) $38,918 ($23,339) >1 2.1 $86,820 $24,562 CZ10-2 SCE -27,414 2053 2.2 -4% ($47,902) $20,765 ($23,339) >1 2.1 $68,666 $24,562 CZ11 PG&E -40,156 3062 3.6 -4% ($63,987) ($72,791) ($32,837) 0.9 1.9 ($8,804) $31,150 CZ12 PG&E -43,411 3327 4.1 -5% ($68,343) ($85,856) ($35,463) 0.8 1.9 ($17,512) $32,880 CZ12-2 SMUD -43,411 3327 4.1 -5% ($68,343) ($5,109) ($35,463) 13.4 1.9 $63,234 $32,880 CZ13 PG&E -39,649 3063 3.8 -4% ($62,726) ($70,705) ($32,408) 0.9 1.9 ($7,980) $30,318 CZ14 SDG&E -44,322 3266 3.4 -5% ($65,156) $6,043 ($38,422) >1 1.7 $71,199 $26,735 CZ14-2 SCE -44,322 3266 3.4 -5% ($65,156) $4,798 ($38,422) >1 1.7 $69,954 $26,735 CZ15 SCE -19,917 1537 1.8 -2% ($36,176) $12,822 ($15,464) >1 2.3 $48,998 $20,711 CZ16 PG&E -94,062 6185 5.6 -27% ($64,096) ($212,158) ($150,871) 0.3 0.4 ($148,062) ($86,775) CZ16-2 LADWP -94,062 6185 5.6 -27% ($64,096) $1,493 ($150,871) >1 0.4 $65,589 ($86,775)
* The Incremental Package Cost is equal to the sum of the incremental HVAC and water heating equipment costs from
Figure 10, the electrical infrastructure incremental cost of $27,802 (see section 3.3.2.1), and the natural gas infrastructure incremental costs of $(18,949) (see section 3.3.2.2).
Page 240 of 319
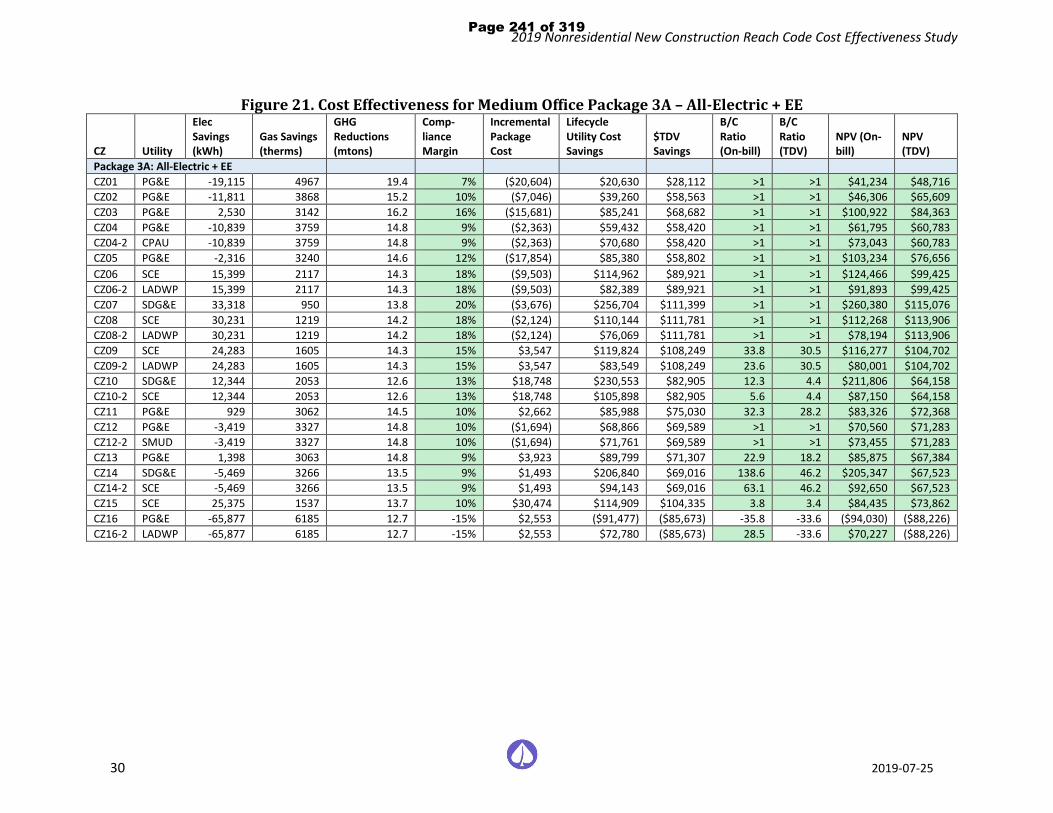
2019 Nonresidential New Construction Reach Code Cost Effectiveness Study
30 2019-07-25
Figure 21. Cost Effectiveness for Medium Office Package 3A – All-Electric + EE
CZ Utility
Elec Savings (kWh)
Gas Savings (therms)
GHG Reductions (mtons)
Comp-liance Margin
Incremental Package Cost
Lifecycle Utility Cost Savings
$TDV Savings
B/C Ratio (On-bill)
B/C Ratio (TDV)
NPV (On-bill)
NPV (TDV)
Package 3A: All-Electric + EE CZ01 PG&E -19,115 4967 19.4 7% ($20,604) $20,630 $28,112 >1 >1 $41,234 $48,716 CZ02 PG&E -11,811 3868 15.2 10% ($7,046) $39,260 $58,563 >1 >1 $46,306 $65,609 CZ03 PG&E 2,530 3142 16.2 16% ($15,681) $85,241 $68,682 >1 >1 $100,922 $84,363 CZ04 PG&E -10,839 3759 14.8 9% ($2,363) $59,432 $58,420 >1 >1 $61,795 $60,783 CZ04-2 CPAU -10,839 3759 14.8 9% ($2,363) $70,680 $58,420 >1 >1 $73,043 $60,783 CZ05 PG&E -2,316 3240 14.6 12% ($17,854) $85,380 $58,802 >1 >1 $103,234 $76,656 CZ06 SCE 15,399 2117 14.3 18% ($9,503) $114,962 $89,921 >1 >1 $124,466 $99,425 CZ06-2 LADWP 15,399 2117 14.3 18% ($9,503) $82,389 $89,921 >1 >1 $91,893 $99,425 CZ07 SDG&E 33,318 950 13.8 20% ($3,676) $256,704 $111,399 >1 >1 $260,380 $115,076 CZ08 SCE 30,231 1219 14.2 18% ($2,124) $110,144 $111,781 >1 >1 $112,268 $113,906 CZ08-2 LADWP 30,231 1219 14.2 18% ($2,124) $76,069 $111,781 >1 >1 $78,194 $113,906 CZ09 SCE 24,283 1605 14.3 15% $3,547 $119,824 $108,249 33.8 30.5 $116,277 $104,702 CZ09-2 LADWP 24,283 1605 14.3 15% $3,547 $83,549 $108,249 23.6 30.5 $80,001 $104,702 CZ10 SDG&E 12,344 2053 12.6 13% $18,748 $230,553 $82,905 12.3 4.4 $211,806 $64,158 CZ10-2 SCE 12,344 2053 12.6 13% $18,748 $105,898 $82,905 5.6 4.4 $87,150 $64,158 CZ11 PG&E 929 3062 14.5 10% $2,662 $85,988 $75,030 32.3 28.2 $83,326 $72,368 CZ12 PG&E -3,419 3327 14.8 10% ($1,694) $68,866 $69,589 >1 >1 $70,560 $71,283 CZ12-2 SMUD -3,419 3327 14.8 10% ($1,694) $71,761 $69,589 >1 >1 $73,455 $71,283 CZ13 PG&E 1,398 3063 14.8 9% $3,923 $89,799 $71,307 22.9 18.2 $85,875 $67,384 CZ14 SDG&E -5,469 3266 13.5 9% $1,493 $206,840 $69,016 138.6 46.2 $205,347 $67,523 CZ14-2 SCE -5,469 3266 13.5 9% $1,493 $94,143 $69,016 63.1 46.2 $92,650 $67,523 CZ15 SCE 25,375 1537 13.7 10% $30,474 $114,909 $104,335 3.8 3.4 $84,435 $73,862 CZ16 PG&E -65,877 6185 12.7 -15% $2,553 ($91,477) ($85,673) -35.8 -33.6 ($94,030) ($88,226) CZ16-2 LADWP -65,877 6185 12.7 -15% $2,553 $72,780 ($85,673) 28.5 -33.6 $70,227 ($88,226)
Page 241 of 319

2019 Nonresidential New Construction Reach Code Cost Effectiveness Study
31 2019-07-25
Figure 22. Cost Effectiveness for Medium Office Package 3B – All-Electric + EE + PV + B
CZ IOU territory
Elec Savings (kWh)
Gas Savings
(therms)
GHG savings (mtons)
Compliance Margin (%)
Incremental Package Cost
Lifecycle Energy
Cost Savings
$-TDV Savings
B/C Ratio (On-bill)
B/C Ratio (TDV)
NPV (On-bill) NPV (TDV)
All-Electric + PV + B CZ01 PG&E 157,733 4967 54.9 7% $310,152 $518,421 $410,946 1.7 1.3 $208,269 $100,794 CZ02 PG&E 203,026 3868 57.8 10% $323,710 $692,336 $532,273 2.1 1.6 $368,626 $208,563 CZ03 PG&E 211,706 3142 58.0 16% $315,075 $708,235 $520,866 2.2 1.7 $393,160 $205,791 CZ04 PG&E 216,204 3759 59.9 9% $328,393 $741,382 $560,576 2.3 1.7 $412,989 $232,183 CZ04-2 CPAU 216,204 3759 59.9 9% $328,393 $607,074 $560,576 1.8 1.7 $278,681 $232,183 CZ05 PG&E 223,399 3240 59.8 12% $312,902 $799,992 $546,592 2.6 1.7 $487,090 $233,690 CZ06 SCE 233,299 2117 57.7 18% $321,252 $509,969 $583,963 1.6 1.8 $188,716 $262,711 CZ06-2 LA 233,299 2117 57.7 18% $321,252 $311,931 $583,963 1.0 1.8 ($9,322) $262,711 CZ07 SDG&E 256,034 950 58.3 20% $327,079 $870,156 $609,498 2.7 1.9 $543,076 $282,419 CZ08 SCE 246,944 1219 57.4 18% $328,631 $499,506 $623,292 1.5 1.9 $170,874 $294,661 CZ08-2 LA 246,944 1219 57.4 18% $328,631 $296,991 $623,292 0.9 1.9 ($31,640) $294,661 CZ09 SCE 243,838 1605 58.5 15% $334,303 $504,498 $615,178 1.5 1.8 $170,195 $280,875 CZ09-2 LA 243,838 1605 58.5 15% $334,303 $307,626 $615,178 0.9 1.8 ($26,677) $280,875 CZ10 SDG&E 229,044 2053 56.2 13% $349,503 $851,810 $569,549 2.4 1.6 $502,306 $220,046 CZ10-2 SCE 229,044 2053 56.2 13% $349,503 $491,383 $569,549 1.4 1.6 $141,880 $220,046 CZ11 PG&E 212,047 3062 56.4 10% $333,418 $743,403 $556,758 2.2 1.7 $409,985 $223,340 CZ12 PG&E 207,955 3327 56.7 10% $329,062 $713,054 $552,415 2.2 1.7 $383,993 $223,353 CZ12-2 SMUD 207,955 3327 56.7 10% $329,062 $414,371 $552,415 1.3 1.7 $85,310 $223,353 CZ13 PG&E 209,431 3063 56.3 9% $334,679 $728,822 $544,969 2.2 1.6 $394,143 $210,289 CZ14 SDG&E 236,002 3266 61.3 9% $332,249 $865,181 $638,517 2.6 1.9 $532,933 $306,269 CZ14-2 SCE 236,002 3266 61.3 9% $332,249 $488,163 $638,517 1.5 1.9 $155,914 $306,269 CZ15 SCE 254,426 1537 58.5 10% $361,229 $487,715 $626,728 1.4 1.7 $126,486 $265,499 CZ16 PG&E 162,915 6185 58.6 -15% $333,309 $580,353 $406,746 1.7 1.2 $247,044 $73,437 CZ16-2 LA 162,915 6185 58.6 -15% $333,309 $290,566 $406,746 0.9 1.2 ($42,742) $73,437
Page 242 of 319

2019 Nonresidential New Construction Reach Code Cost Effectiveness Study
32 2019-07-25
Figure 23. Cost Effectiveness for Medium Office Package 3C – All-Electric + HE
CZ Utility
Elec Savings (kWh)
Gas Savings (therms)
GHG Reductions (mtons)
Comp-liance Margin
Incremental Package Cost
Lifecycle Utility Cost Savings
$TDV Savings
B/C Ratio (On-bill)
B/C Ratio (TDV)
NPV (On-bill) NPV (TDV)
Package 3C: All-Electric + HE CZ01 PG&E -53,390 4967 10.2 -14% ($43,987) ($93,740) ($57,752) 0.5 0.8 ($49,753) ($13,765) CZ02 PG&E -45,916 3868 6.1 -5% ($22,722) ($77,212) ($26,394) 0.3 0.9 ($54,490) ($3,672) CZ03 PG&E -34,656 3142 6.0 -6% ($38,261) ($45,796) ($25,153) 0.8 1.5 ($7,535) $13,108 CZ04 PG&E -43,248 3759 6.3 -3% ($15,229) ($56,932) ($18,996) 0.3 0.8 ($41,703) ($3,767) CZ04-2 CPAU -43,248 3759 6.3 -3% ($15,229) ($5,298) ($18,996) 2.9 0.8 $9,932 ($3,767) CZ05 PG&E -37,068 3240 5.4 -6% ($40,434) ($38,330) ($29,544) 1.1 1.4 $2,104 $10,890 CZ06 SCE -22,805 2117 4.0 -2% ($30,237) $39,812 ($9,594) >1 3.2 $70,050 $20,644 CZ06-2 LADWP -22,805 2117 4.0 -2% ($30,237) $35,414 ($9,594) >1 3.2 $65,651 $20,644 CZ07 SDG&E -7,646 950 2.5 1% ($22,564) $86,159 $6,062 >1 >1 $108,722 $28,625 CZ08 SCE -9,761 1219 3.2 1% ($18,443) $37,375 $8,305 >1 >1 $55,818 $26,748 CZ08-2 LADWP -9,761 1219 3.2 1% ($18,443) $29,973 $8,305 >1 >1 $48,416 $26,748 CZ09 SCE -12,211 1605 4.5 2% ($10,282) $46,335 $13,364 >1 >1 $56,617 $23,646 CZ09-2 LADWP -12,211 1605 4.5 2% ($10,282) $37,030 $13,364 >1 >1 $47,313 $23,646 CZ10 SDG&E -21,642 2053 3.7 -1% $11,340 $84,901 ($3,818) 7.5 -0.3 $73,561 ($15,158) CZ10-2 SCE -21,642 2053 3.7 -1% $11,340 $40,659 ($3,818) 3.6 -0.3 $29,319 ($15,158) CZ11 PG&E -32,052 3062 5.9 0% ($8,519) ($29,013) ($3,007) 0.3 2.8 ($20,495) $5,512 CZ12 PG&E -36,926 3327 6.0 -1% ($15,443) ($48,955) ($9,546) 0.3 1.6 ($33,511) $5,898 CZ12-2 SMUD -36,926 3327 6.0 -1% ($15,443) $9,916 ($9,546) >1 1.6 $25,359 $5,898 CZ13 PG&E -31,253 3063 6.3 0% ($7,257) ($27,782) ($3,055) 0.3 2.4 ($20,525) $4,202 CZ14 SDG&E -36,402 3266 5.7 -1% ($10,651) $61,605 ($9,832) >1 1.1 $72,256 $819 CZ14-2 SCE -36,402 3266 5.7 -1% ($10,651) $30,625 ($9,832) >1 1.1 $41,276 $819 CZ15 SCE -4,775 1537 6.0 3% $28,927 $52,955 $32,790 1.8 1.1 $24,028 $3,863 CZ16 PG&E -90,949 6185 6.5 -26% ($8,467) ($194,115) ($142,041) 0.0 0.1 ($185,648) ($133,574) CZ16-2 LADWP -90,949 6185 6.5 -26% ($8,467) $37,127 ($142,041) >1 0.1 $45,594 ($133,574)
Page 243 of 319

2019 Nonresidential New Construction Reach Code Cost Effectiveness Study
33 2019-07-25
4.2 Cost Effectiveness Results – Medium Retail Figure 24 through Figure 30 contain the cost-effectiveness findings for the Medium Retail packages. Notable findings for each package include:
♦ 1A – Mixed-Fuel + EE:
♦ Packages achieve +9% to +18% compliance margins depending on climate zone, and all packages are cost effective in all climate zones.
♦ Incremental package costs vary across climate zones because of the HVAC system size in some climate zones are small enough (<54 kBtu/h) to have the economizers measure applied.
♦ B/C ratios are high compared to other prototypes because the measures applied are primarily low-cost lighting measures. This suggests room for the inclusion of other energy efficiency measures with lower cost-effectiveness to achieve even higher compliance margins for a cost effective package.
♦ 1B – Mixed-Fuel + EE + PV + B: All packages are cost effective using both the On-Bill and TDV approach, except On-Bill in LADWP territory. Adding PV and battery to the efficiency packages reduces the B/C ratio but increases overall NPV savings.
♦ 1C – Mixed-fuel + HE: Packages achieve +1 to +4% compliance margins depending on climate zone, and packages are cost effective in all climate zones except CZs 1, 3 and 5 using the TDV approach.
♦ 2 – All-Electric Federal Code-Minimum Reference:
♦ Packages achieve between -12% and +1% compliance margins depending on climate zone.
♦ Packages achieve positive savings using both the On-Bill and TDV approaches in CZs 6-10 and 14-15. Packages do not achieve On-Bill or TDV savings in most of PG&E territory (CZs 1, 2, 4, 5, 12-13, and 16).
♦ Packages are cost effective in all climate zones except CZ16.
♦ All incremental costs are negative primarily due to elimination of natural gas infrastructure.
♦ 3A – All-Electric + EE: Packages achieve between +3% and +16% compliance margins depending on climate zone. All packages are cost effective in all climate zones.
♦ 3B – All-Electric + EE + PV + B: All packages are cost effective using both the On-Bill and TDV approaches, except On-Bill in LADWP territory. Adding PV and Battery to the efficiency package reduces the B/C ratio but increases overall NPV savings.
♦ 3C – All-Electric + HE: Packages achieve between -8% and +5% compliance margins depending on climate zone, and packages are cost effective using both On-Bill and TDV approaches in all CZs except CZs 1 and 16.
Page 244 of 319

2019 Nonresidential New Construction Reach Code Cost Effectiveness Study
34 2019-07-25
Figure 24. Cost Effectiveness for Medium Retail Package 1A – Mixed-Fuel + EE
CZ Utility
Elec Savings (kWh)
Gas Savings (therms)
GHG Reductions (mtons)
Comp-liance Margin
Incremental Package Cost
Lifecycle Utility Cost Savings
$TDV Savings
B/C Ratio (On-bill)
B/C Ratio (TDV)
NPV (On-bill)
NPV (TDV)
Package 1A: Mixed Fuel + EE
CZ01 PG&E 15,210 1209 11.10 18% $2,712 $68,358 $60,189 25.2 22.2 $65,646 $57,478 CZ02 PG&E 18,885 613 8.73 13% $5,569 $76,260 $59,135 13.7 10.6 $70,691 $53,566 CZ03 PG&E 18,772 462 7.87 16% $5,569 $66,813 $57,135 12.0 10.3 $61,244 $51,566 CZ04 PG&E 19,100 439 7.84 14% $5,569 $75,989 $58,036 13.6 10.4 $70,420 $52,467 CZ04-2 CPAU 19,100 439 7.84 14% $5,569 $51,556 $58,036 9.3 10.4 $45,987 $52,467 CZ05 PG&E 17,955 415 7.41 16% $5,569 $63,182 $55,003 11.3 9.9 $57,613 $49,435 CZ05-2 SCG 17,955 415 7.41 16% $5,569 $61,810 $55,003 11.1 9.9 $56,241 $49,435 CZ06 SCE 12,375 347 5.54 10% $2,712 $31,990 $41,401 11.8 15.3 $29,278 $38,689 CZ06-2 LADWP 12,375 347 5.54 10% $2,712 $21,667 $41,401 8.0 15.3 $18,956 $38,689 CZ07 SDG&E 17,170 136 5.65 13% $5,569 $73,479 $49,883 13.2 9.0 $67,910 $44,314 CZ08 SCE 12,284 283 5.15 10% $2,712 $30,130 $41,115 11.1 15.2 $27,419 $38,403 CZ08-2 LADWP 12,284 283 5.15 10% $2,712 $20,243 $41,115 7.5 15.2 $17,531 $38,403 CZ09 SCE 13,473 302 5.51 10% $5,569 $32,663 $46,126 5.9 8.3 $27,094 $40,557 CZ09-2 LADWP 13,473 302 5.51 10% $5,569 $22,435 $46,126 4.0 8.3 $16,866 $40,557 CZ10 SDG&E 19,873 267 6.99 12% $5,569 $83,319 $58,322 15.0 10.5 $77,751 $52,753 CZ10-2 SCE 19,873 267 6.99 12% $5,569 $39,917 $58,322 7.2 10.5 $34,348 $52,753 CZ11 PG&E 21,120 578 9.14 13% $5,569 $86,663 $67,485 15.6 12.1 $81,095 $61,916 CZ12 PG&E 20,370 562 8.85 13% $5,569 $81,028 $64,409 14.6 11.6 $75,459 $58,840 CZ12-2 SMUD 20,370 562 8.85 13% $5,569 $44,991 $64,409 8.1 11.6 $39,422 $58,840 CZ13 PG&E 22,115 620 9.98 15% $2,712 $109,484 $83,109 40.4 30.6 $106,772 $80,398 CZ14 SDG&E 25,579 406 9.38 13% $2,712 $116,354 $80,055 42.9 29.5 $113,643 $77,343 CZ14-2 SCE 26,327 383 9.42 13% $2,712 $57,290 $83,065 21.1 30.6 $54,578 $80,354 CZ15 SCE 26,433 169 8.35 12% $2,712 $57,152 $79,506 21.1 29.3 $54,440 $76,794 CZ16 PG&E 15,975 752 8.72 13% $2,712 $72,427 $55,025 26.7 20.3 $69,715 $52,314 CZ16-2 LADWP 15,975 752 8.72 13% $2,712 $31,906 $55,025 11.8 20.3 $29,194 $52,314
Page 245 of 319
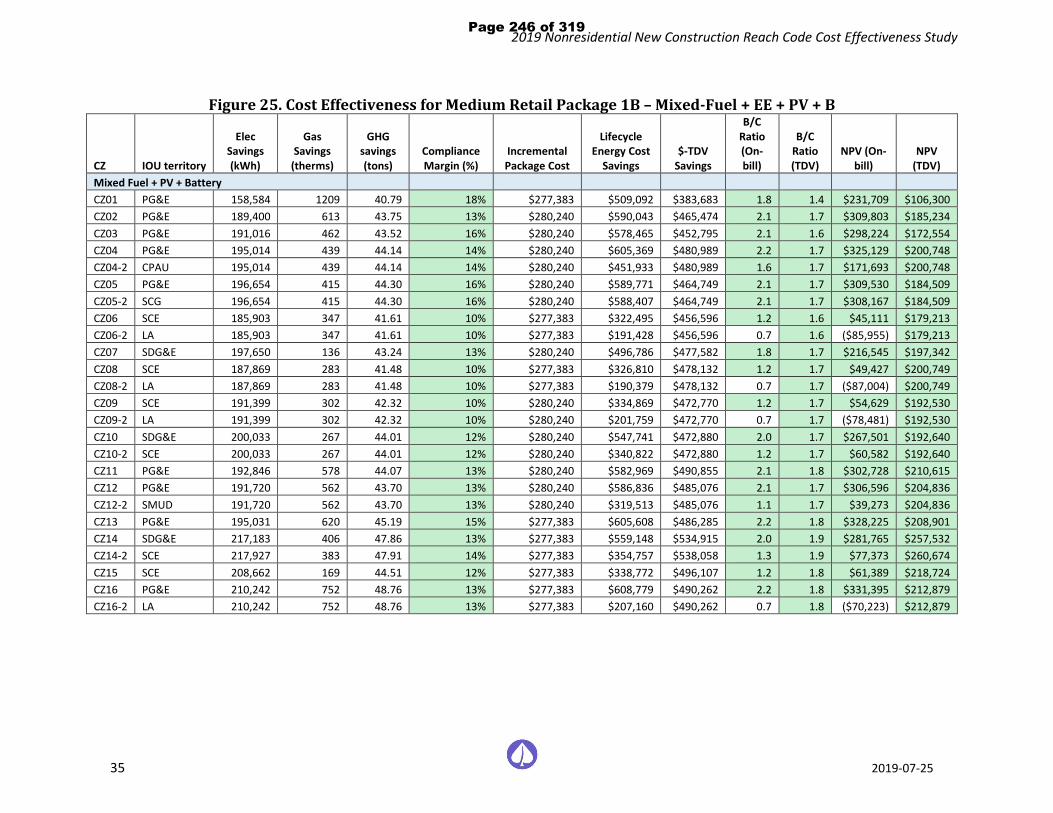
2019 Nonresidential New Construction Reach Code Cost Effectiveness Study
35 2019-07-25
Figure 25. Cost Effectiveness for Medium Retail Package 1B – Mixed-Fuel + EE + PV + B
CZ IOU territory
Elec Savings (kWh)
Gas Savings
(therms)
GHG savings (tons)
Compliance Margin (%)
Incremental Package Cost
Lifecycle Energy Cost
Savings $-TDV
Savings
B/C Ratio (On-bill)
B/C Ratio (TDV)
NPV (On-bill)
NPV (TDV)
Mixed Fuel + PV + Battery CZ01 PG&E 158,584 1209 40.79 18% $277,383 $509,092 $383,683 1.8 1.4 $231,709 $106,300 CZ02 PG&E 189,400 613 43.75 13% $280,240 $590,043 $465,474 2.1 1.7 $309,803 $185,234 CZ03 PG&E 191,016 462 43.52 16% $280,240 $578,465 $452,795 2.1 1.6 $298,224 $172,554 CZ04 PG&E 195,014 439 44.14 14% $280,240 $605,369 $480,989 2.2 1.7 $325,129 $200,748 CZ04-2 CPAU 195,014 439 44.14 14% $280,240 $451,933 $480,989 1.6 1.7 $171,693 $200,748 CZ05 PG&E 196,654 415 44.30 16% $280,240 $589,771 $464,749 2.1 1.7 $309,530 $184,509 CZ05-2 SCG 196,654 415 44.30 16% $280,240 $588,407 $464,749 2.1 1.7 $308,167 $184,509 CZ06 SCE 185,903 347 41.61 10% $277,383 $322,495 $456,596 1.2 1.6 $45,111 $179,213 CZ06-2 LA 185,903 347 41.61 10% $277,383 $191,428 $456,596 0.7 1.6 ($85,955) $179,213 CZ07 SDG&E 197,650 136 43.24 13% $280,240 $496,786 $477,582 1.8 1.7 $216,545 $197,342 CZ08 SCE 187,869 283 41.48 10% $277,383 $326,810 $478,132 1.2 1.7 $49,427 $200,749 CZ08-2 LA 187,869 283 41.48 10% $277,383 $190,379 $478,132 0.7 1.7 ($87,004) $200,749 CZ09 SCE 191,399 302 42.32 10% $280,240 $334,869 $472,770 1.2 1.7 $54,629 $192,530 CZ09-2 LA 191,399 302 42.32 10% $280,240 $201,759 $472,770 0.7 1.7 ($78,481) $192,530 CZ10 SDG&E 200,033 267 44.01 12% $280,240 $547,741 $472,880 2.0 1.7 $267,501 $192,640 CZ10-2 SCE 200,033 267 44.01 12% $280,240 $340,822 $472,880 1.2 1.7 $60,582 $192,640 CZ11 PG&E 192,846 578 44.07 13% $280,240 $582,969 $490,855 2.1 1.8 $302,728 $210,615 CZ12 PG&E 191,720 562 43.70 13% $280,240 $586,836 $485,076 2.1 1.7 $306,596 $204,836 CZ12-2 SMUD 191,720 562 43.70 13% $280,240 $319,513 $485,076 1.1 1.7 $39,273 $204,836 CZ13 PG&E 195,031 620 45.19 15% $277,383 $605,608 $486,285 2.2 1.8 $328,225 $208,901 CZ14 SDG&E 217,183 406 47.86 13% $277,383 $559,148 $534,915 2.0 1.9 $281,765 $257,532 CZ14-2 SCE 217,927 383 47.91 14% $277,383 $354,757 $538,058 1.3 1.9 $77,373 $260,674 CZ15 SCE 208,662 169 44.51 12% $277,383 $338,772 $496,107 1.2 1.8 $61,389 $218,724 CZ16 PG&E 210,242 752 48.76 13% $277,383 $608,779 $490,262 2.2 1.8 $331,395 $212,879 CZ16-2 LA 210,242 752 48.76 13% $277,383 $207,160 $490,262 0.7 1.8 ($70,223) $212,879
Page 246 of 319

2019 Nonresidential New Construction Reach Code Cost Effectiveness Study
36 2019-07-25
Figure 26. Cost Effectiveness for Medium Retail Package 1C – Mixed-Fuel + HE
CZ Utility
Elec Savings (kWh)
Gas Savings (therms)
GHG Reductions (mtons)
Comp-liance Margin
Incremental Package Cost
Lifecycle Utility Cost Savings
$TDV Savings
B/C Ratio (On-bill)
B/C Ratio (TDV)
NPV (On-bill)
NPV (TDV)
Package 1C: Mixed Fuel + HE CZ01 PG&E 57 346 2.04 2% $9,006 $6,301 $6,065 0.7 0.7 ($2,705) ($2,941) CZ02 PG&E 2,288 229 2.01 3% $9,726 $23,016 $13,998 2.4 1.4 $13,291 $4,273 CZ03 PG&E 1,087 171 1.31 2% $9,063 $6,782 $7,186 0.7 0.8 ($2,282) ($1,877) CZ04 PG&E 1,862 159 1.46 3% $9,004 $17,891 $10,878 2.0 1.2 $8,887 $1,874 CZ04-2 CPAU 1,862 159 1.46 3% $9,004 $7,821 $10,878 0.9 1.2 ($1,182) $1,874 CZ05 PG&E 664 162 1.11 1% $9,454 $5,119 $4,725 0.5 0.5 ($4,335) ($4,729) CZ05-2 SCG 664 162 1.11 1% $9,454 $4,558 $4,725 0.5 0.5 ($4,896) ($4,729) CZ06 SCE 2,648 90 1.24 3% $8,943 $11,646 $11,427 1.3 1.3 $2,703 $2,484 CZ06-2 LADWP 2,648 90 1.24 3% $8,943 $7,329 $11,427 0.8 1.3 ($1,614) $2,484 CZ07 SDG&E 2,376 49 0.95 2% $9,194 $20,103 $9,779 2.2 1.1 $10,909 $585 CZ08 SCE 2,822 72 1.20 3% $9,645 $11,989 $12,877 1.2 1.3 $2,344 $3,233 CZ08-2 LADWP 2,822 72 1.20 3% $9,645 $7,427 $12,877 0.8 1.3 ($2,218) $3,233 CZ09 SCE 4,206 88 1.73 4% $10,446 $16,856 $18,745 1.6 1.8 $6,410 $8,299 CZ09-2 LADWP 4,206 88 1.73 4% $10,446 $10,604 $18,745 1.0 1.8 $158 $8,299 CZ10 SDG&E 4,226 119 1.88 4% $9,514 $36,412 $19,008 3.8 2.0 $26,898 $9,494 CZ10-2 SCE 4,226 119 1.88 4% $9,514 $17,094 $19,008 1.8 2.0 $7,580 $9,494 CZ11 PG&E 4,188 225 2.56 4% $10,479 $31,872 $22,393 3.0 2.1 $21,392 $11,913 CZ12 PG&E 3,675 214 2.34 4% $10,409 $29,653 $20,525 2.8 2.0 $19,243 $10,115 CZ12-2 SMUD 3,675 214 2.34 4% $10,409 $12,823 $20,525 1.2 2.0 $2,414 $10,115 CZ13 PG&E 4,818 180 2.46 4% $9,809 $34,149 $23,623 3.5 2.4 $24,340 $13,814 CZ14 SDG&E 6,439 153 2.71 4% $12,103 $44,705 $26,348 3.7 2.2 $32,601 $14,245 CZ14-2 SCE 6,439 153 2.71 4% $12,103 $22,032 $26,348 1.8 2.2 $9,929 $14,245 CZ15 SCE 8,802 48 2.76 5% $12,534 $25,706 $31,402 2.1 2.5 $13,171 $18,868 CZ16 PG&E 2,316 390 2.97 3% $11,999 $22,663 $13,888 1.9 1.2 $10,665 $1,890 CZ16-2 LADWP 2,316 390 2.97 3% $11,999 $11,921 $13,888 1.0 1.2 ($78) $1,890
Page 247 of 319

2019 Nonresidential New Construction Reach Code Cost Effectiveness Study
37 2019-07-25
Figure 27. Cost Effectiveness for Medium Retail Package 2 – All-Electric Federal Code Minimum
CZ Utility
Elec Savings (kWh)
Gas Savings (therms)
GHG Reductions (mtons)
Comp-liance Margin
Incremental Package Cost*
Lifecycle Utility Cost Savings
$TDV Savings
B/C Ratio (On-bill)
B/C Ratio (TDV)
NPV (On-bill)
NPV (TDV)
Package 2: All-Electric Federal Code Minimum CZ01 PG&E -29,155 3893 13.85 -4.1% ($23,048) ($8,333) ($13,910) 2.8 1.7 $14,715 $9,138 CZ02 PG&E -21,786 2448 7.49 -1.0% ($27,464) ($16,476) ($4,483) 1.7 6.1 $10,987 $22,981 CZ03 PG&E -14,583 1868 6.26 -0.4% ($24,111) $263 ($1,450) >1 16.6 $24,374 $22,661 CZ04 PG&E -14,186 1706 5.30 -0.1% ($22,896) ($8,753) ($220) 2.6 104.2 $14,143 $22,676 CZ04-2 CPAU -14,186 1706 5.30 -0.1% ($22,896) $12,493 ($220) >1 104.2 $35,389 $22,676 CZ05 PG&E -14,334 1746 5.47 -1.2% ($25,507) ($1,567) ($4,197) 16.3 6.1 $23,940 $21,309 CZ06 SCE -7,527 1002 3.32 0.5% ($21,762) $18,590 $1,868 >1 >1 $40,351 $23,630 CZ06-2 LADWP -7,527 1002 3.32 0.5% ($21,762) $19,309 $1,868 >1 >1 $41,071 $23,630 CZ07 SDG&E -3,812 522 1.76 0.3% ($23,762) $54,345 $1,318 >1 >1 $78,107 $25,080 CZ08 SCE -5,805 793 2.70 0.4% ($26,922) $16,735 $1,846 >1 >1 $43,658 $28,768 CZ08-2 LADWP -5,805 793 2.70 0.4% ($26,922) $17,130 $1,846 >1 >1 $44,052 $28,768 CZ09 SCE -7,241 970 3.32 0.4% ($32,113) $18,582 $1,978 >1 >1 $50,695 $34,091 CZ09-2 LADWP -7,241 970 3.32 0.4% ($32,113) $19,089 $1,978 >1 >1 $51,202 $34,091 CZ10 SDG&E -10,336 1262 3.99 0.1% ($27,272) $54,453 $505 >1 >1 $81,724 $27,777 CZ10-2 SCE -10,336 1262 3.99 0.1% ($27,272) $20,996 $505 >1 >1 $48,268 $27,777 CZ11 PG&E -19,251 2415 7.95 0.5% ($32,202) ($7,951) $2,615 4.1 >1 $24,251 $34,817 CZ12 PG&E -19,471 2309 7.28 -0.1% ($32,504) ($14,153) ($461) 2.3 70.4 $18,351 $32,042 CZ12-2 SMUD -19,471 2309 7.28 -0.1% ($32,504) $12,939 ($461) >1 70.4 $45,443 $32,042 CZ13 PG&E -16,819 1983 6.15 -0.4% ($28,158) ($10,575) ($2,022) 2.7 13.9 $17,582 $26,136 CZ14 SDG&E -13,208 1672 5.44 0.7% ($26,656) $41,117 $4,461 >1 >1 $67,772 $31,117 CZ14-2 SCE -13,208 1672 5.44 0.7% ($26,656) $18,467 $4,461 >1 >1 $45,123 $31,117 CZ15 SCE -2,463 518 2.14 0.9% ($29,544) $16,796 $5,823 >1 >1 $46,339 $35,367 CZ16 PG&E -41,418 4304 13.23 -12.2% ($25,771) ($49,862) ($52,542) 0.5 0.5 ($24,091) ($26,771) CZ16-2 LADWP -41,418 4304 13.23 -12.2% ($25,771) $39,319 ($52,542) >1 0.5 $65,090 ($26,771)
* The Incremental Package Cost is the addition of the incremental HVAC and water heating equipment costs from Figure 11 and the natural gas infrastructure incremental cost savings of $28,027 (see section 3.3.2.2).
Page 248 of 319

2019 Nonresidential New Construction Reach Code Cost Effectiveness Study
38 2019-07-25
Figure 28. Cost Effectiveness for Medium Retail Package 3A – All-Electric + EE
CZ Utility
Elec Savings (kWh)
Gas Savings (therms)
GHG Reductions (mtons)
Comp-liance Margin
Incremental Package Cost
Lifecycle Utility Cost Savings
$TDV Savings
B/C Ratio (On-bill)
B/C Ratio (TDV)
NPV (On-bill)
NPV (TDV)
Package 3A: All-Electric + EE
CZ01 PG&E -5,478 3893 20.64 15% ($20,336) $63,593 $51,224 >1 >1 $83,929 $71,560 CZ02 PG&E 2,843 2448 14.58 13% ($21,895) $74,997 $56,893 >1 >1 $96,892 $78,788 CZ03 PG&E 7,791 1868 12.73 16% ($18,542) $68,968 $56,586 >1 >1 $87,511 $75,128 CZ04 PG&E 8,572 1706 11.89 14% ($17,327) $81,957 $57,904 >1 >1 $99,284 $75,231 CZ04-2 CPAU 8,572 1706 11.89 14% ($17,327) $63,082 $57,904 >1 >1 $80,408 $75,231 CZ05 PG&E 6,973 1746 11.68 15% ($19,938) $63,677 $51,949 >1 >1 $83,615 $71,887 CZ06 SCE 7,431 1002 7.72 11% ($19,050) $47,072 $42,610 >1 >1 $66,122 $61,660 CZ06-2 LADWP 7,431 1002 7.72 11% ($19,050) $37,078 $42,610 >1 >1 $56,128 $61,660 CZ07 SDG&E 14,350 522 6.98 13% ($18,193) $127,461 $50,828 >1 >1 $145,654 $69,021 CZ08 SCE 8,524 793 6.90 10% ($24,210) $43,679 $42,258 >1 >1 $67,890 $66,468 CZ08-2 LADWP 8,524 793 6.90 10% ($24,210) $34,038 $42,258 >1 >1 $58,248 $66,468 CZ09 SCE 8,403 970 7.81 10% ($26,545) $47,819 $47,356 >1 >1 $74,364 $73,901 CZ09-2 LADWP 8,403 970 7.81 10% ($26,545) $37,934 $47,356 >1 >1 $64,478 $73,901 CZ10 SDG&E 11,737 1262 10.23 12% ($21,703) $137,436 $58,761 >1 >1 $159,139 $80,464 CZ10-2 SCE 11,737 1262 10.23 12% ($21,703) $58,257 $58,761 >1 >1 $79,959 $80,464 CZ11 PG&E 5,892 2415 15.13 12% ($26,633) $85,256 $65,859 >1 >1 $111,889 $92,492 CZ12 PG&E 5,548 2309 14.46 12% ($26,935) $80,631 $63,903 >1 >1 $107,566 $90,838 CZ12-2 SMUD 5,548 2309 14.46 12% ($26,935) $59,311 $63,903 >1 >1 $86,246 $90,838 CZ13 PG&E 10,184 1983 14.15 14% ($25,446) $110,105 $80,604 >1 >1 $135,551 $106,050 CZ14 SDG&E 16,583 1672 13.83 15% ($23,944) $171,200 $88,471 >1 >1 $195,145 $112,415 CZ14-2 SCE 16,583 1672 13.83 15% ($23,944) $656,178 $159,604 >1 >1 $680,122 $183,548 CZ15 SCE 23,642 518 9.44 12% ($26,832) $65,573 $76,781 >1 >1 $92,404 $103,612 CZ16 PG&E -18,232 4304 19.80 3% ($23,059) $38,796 $14,152 >1 >1 $61,855 $37,211 CZ16-2 LADWP -18,232 4304 19.80 3% ($23,059) $67,793 $14,152 >1 >1 $90,852 $37,211
Page 249 of 319

2019 Nonresidential New Construction Reach Code Cost Effectiveness Study
39 2019-07-25
Figure 29. Cost Effectiveness for Medium Retail Package 3B – All-Electric + EE + PV + B
CZ IOU territory
Elec Savings (kWh)
Gas Savings
(therms)
GHG savings (tons)
Compliance Margin (%)
Incremental Package Cost
Lifecycle Energy Cost
Savings $-TDV
Savings
B/C Ratio (On-bill)
B/C Ratio (TDV)
NPV (On-bill)
NPV (TDV)
All-Electric + PV + B CZ01 PG&E 137,956 3893 50.51 15% $254,335 $510,831 $374,432 2.0 1.5 $256,496 $120,097 CZ02 PG&E 173,387 2448 49.87 13% $252,777 $590,112 $463,431 2.3 1.8 $337,336 $210,654 CZ03 PG&E 180,055 1868 48.55 16% $256,129 $585,861 $452,399 2.3 1.8 $329,732 $196,270 CZ04 PG&E 184,499 1706 48.38 14% $257,345 $608,814 $481,011 2.4 1.9 $351,470 $223,666 CZ04-2 CPAU 184,499 1706 48.38 14% $257,345 $465,690 $481,011 1.8 1.9 $208,345 $223,666 CZ05 PG&E 185,690 1746 48.84 15% $254,734 $600,933 $461,804 2.4 1.8 $346,199 $207,071 CZ06 SCE 180,968 1002 43.91 11% $255,621 $335,909 $457,959 1.3 1.8 $80,288 $202,337 CZ06-2 LADWP 180,968 1002 43.91 11% $255,621 $206,021 $457,959 0.8 1.8 ($49,601) $202,337 CZ07 SDG&E 194,837 522 44.67 13% $256,478 $550,714 $478,637 2.1 1.9 $294,236 $222,159 CZ08 SCE 184,120 793 43.32 10% $250,461 $340,301 $479,406 1.4 1.9 $89,840 $228,945 CZ08-2 LADWP 184,120 793 43.32 10% $250,461 $203,813 $479,406 0.8 1.9 ($46,648) $228,945 CZ09 SCE 186,346 970 44.77 10% $248,127 $349,524 $474,176 1.4 1.9 $101,397 $226,049 CZ09-2 LADWP 186,346 970 44.77 10% $248,127 $216,654 $474,176 0.9 1.9 ($31,473) $226,049 CZ10 SDG&E 191,923 1262 47.46 12% $252,969 $593,514 $473,605 2.3 1.9 $340,545 $220,636 CZ10-2 SCE 191,923 1262 47.46 12% $252,969 $356,958 $473,605 1.4 1.9 $103,989 $220,636 CZ11 PG&E 177,639 2415 50.26 12% $248,039 $585,689 $489,317 2.4 2.0 $337,650 $241,278 CZ12 PG&E 176,919 2309 49.46 12% $247,736 $591,104 $484,702 2.4 2.0 $343,368 $236,966 CZ12-2 SMUD 176,919 2309 49.46 12% $247,736 $335,286 $484,702 1.4 2.0 $87,550 $236,966 CZ13 PG&E 183,129 1983 49.48 14% $249,226 $608,560 $483,670 2.4 1.9 $359,334 $234,444 CZ14 SDG&E 208,183 1672 52.54 15% $250,727 $593,232 $544,079 2.4 2.2 $342,505 $293,351 CZ14-2 SCE 264,589 1672 80.97 15% $250,727 $656,178 $580,403 2.6 2.3 $405,450 $329,676 CZ15 SCE 205,869 518 45.67 12% $247,840 $347,125 $493,339 1.4 2.0 $99,285 $245,499 CZ16 PG&E 176,114 4304 60.13 3% $251,612 $567,822 $446,795 2.3 1.8 $316,210 $195,183 CZ16-2 LADWP 176,114 4304 60.13 3% $251,612 $241,757 $446,795 1.0 1.8 ($9,856) $195,183
Page 250 of 319

2019 Nonresidential New Construction Reach Code Cost Effectiveness Study
40 2019-07-25
Figure 30. Cost Effectiveness for Medium Retail Package 3C – All-Electric + HE
CZ Utility
Elec Savings (kWh)
Gas Savings (therms)
GHG Reductions (mtons)
Comp-liance Margin
Incremental Package Cost
Lifecycle Utility Cost Savings
$TDV Savings
B/C Ratio (On-bill)
B/C Ratio (TDV)
NPV (On-bill)
NPV (TDV)
Package 3C: All-Electric + HE CZ01 PG&E -26,199 3893 14.76 -2% ($587) $369 ($5,757) >1 0.1 $956 ($5,170) CZ02 PG&E -16,989 2448 8.95 3% ($4,211) $12,323 $11,251 >1 >1 $16,534 $15,463 CZ03 PG&E -11,703 1868 7.15 2% ($2,213) $9,159 $6,944 >1 >1 $11,372 $9,157 CZ04 PG&E -10,675 1706 6.37 3% ($316) $14,317 $11,383 >1 >1 $14,633 $11,700 CZ04-2 CPAU -10,675 1706 6.37 3% ($316) $20,599 $11,383 >1 >1 $20,915 $11,700 CZ05 PG&E -11,969 1746 6.19 1% ($2,298) $5,592 $1,824 >1 >1 $7,890 $4,122 CZ06 SCE -3,919 1002 4.35 3% $1,418 $29,751 $13,734 21.0 9.7 $28,333 $12,316 CZ06-2 LADWP -3,919 1002 4.35 3% $1,418 $25,891 $13,734 18.3 9.7 $24,473 $12,316 CZ07 SDG&E -955 522 2.59 3% ($710) $74,518 $11,229 >1 >1 $75,227 $11,939 CZ08 SCE -2,224 793 3.74 4% ($3,719) $28,067 $15,075 >1 >1 $31,785 $18,793 CZ08-2 LADWP -2,224 793 3.74 4% ($3,719) $23,848 $15,075 >1 >1 $27,566 $18,793 CZ09 SCE -2,089 970 4.84 4% ($8,268) $34,648 $21,162 >1 >1 $42,916 $29,430 CZ09-2 LADWP -2,089 970 4.84 4% ($8,268) $28,837 $21,162 >1 >1 $37,105 $29,430 CZ10 SDG&E -4,868 1262 5.58 4% ($5,222) $91,136 $20,041 >1 >1 $96,358 $25,263 CZ10-2 SCE -4,868 1262 5.58 4% ($5,222) $37,200 $20,041 >1 >1 $42,422 $25,263 CZ11 PG&E -12,651 2415 9.95 5% ($8,217) $29,015 $26,172 >1 >1 $37,232 $34,389 CZ12 PG&E -13,479 2309 9.10 4% ($9,239) $20,839 $21,228 >1 >1 $30,078 $30,466 CZ12-2 SMUD -13,479 2309 9.10 4% ($9,239) $26,507 $21,228 >1 >1 $35,746 $30,466 CZ13 PG&E -9,935 1983 8.23 4% ($4,975) $30,123 $24,063 >1 >1 $35,097 $29,037 CZ14 SDG&E -5,407 1672 7.71 5% $121 $88,669 $31,029 732.5 256.3 $88,547 $30,908 CZ14-2 SCE -5,407 1672 7.71 5% $121 $40,709 $31,029 336.3 256.3 $40,588 $30,908 CZ15 SCE 6,782 518 4.77 6% ($2,508) $42,238 $37,379 >1 >1 $44,745 $39,887 CZ16 PG&E -35,297 4304 15.03 -8% $1,102 ($21,384) ($33,754) -19.4 -30.6 ($22,486) ($34,856) CZ16-2 LADWP -35,297 4304 15.03 -8% $1,102 $48,625 ($33,754) 44.1 -30.6 $47,523 ($34,856)
Page 251 of 319
2019 Nonresidential New Construction Reach Code Cost Effectiveness Study
41 2019-07-25
4.3 Cost Effectiveness Results – Small Hotel The following issues must be considered when reviewing the Small Hotel results:
♦ The Small Hotel is a mix of residential and nonresidential space types, which results in different occupancy and load profiles than the office and retail prototypes.
♦ A potential laundry load has not been examined for the Small Hotel. The Reach Code Team attempted to characterize and apply the energy use intensity of laundry loads in hotels but did not find readily available data for use. Thus, cost effectiveness including laundry systems has not been examined.
♦ Contrary to the office and retail prototypes, the Small Hotel baseline water heater is a central gas storage type. Current compliance software cannot model central heat pump water heater systems with recirculation serving guest rooms.23 The only modeling option for heat pump water heating is individual water heaters at each guest room even though this is a very uncommon configuration. TRC modeled individual heat pump water heaters but as a proxy for central heat pump water heating performance, but integrated costs associated with tank and controls for central heat pump water heating into cost effectiveness calculations.
♦ Assuming central heat pump water heating also enabled the inclusion of a solar hot water thermal collection system, which was a key efficiency measure to achieving compliance in nearly all climate zones.
Figure 31 through Figure 37 contain the cost-effectiveness findings for the Small Hotel packages. Notable findings for each package include:
♦ 1A – Mixed-Fuel + EE:
♦ Packages achieve +3 to +10% compliance margins depending on climate zone.
♦ Packages are cost effective using either the On-Bill or TDV approach in all CZs except 12 (using SMUD rates), 14 (using SCE rates), and 15 (with SCE rates).
♦ The hotel is primarily guest rooms with a smaller proportion of nonresidential space. Thus, the inexpensive VAV minimum flow measure and lighting measures that have been applied to the entirety of the Medium Office and Medium Retail prototypes have a relatively small impact in the Small Hotel.24
♦ 1B – Mixed-Fuel + EE + PV + B: Packages are cost effective using either the On-Bill or TDV approach in all CZs. Solar PV generally increases cost effectiveness compared to efficiency-only, particularly when using an NPV metric.
♦ 1C – Mixed-Fuel + HE: Packages achieve +2 to +5% compliance margins depending on climate zone. The package is cost effective using the On-Bill approach in a minority of climate zones, and cost effective using TDV approach only in CZ15.
23 The IOUs and CEC are actively working on including central heat pump water heater modeling with recirculation systems in early 2020. 24 Title 24 requires that hotel/motel guest room lighting design comply with the residential lighting standards, which are all mandatory and are not awarded compliance credit for improved efficacy.
Page 252 of 319

2019 Nonresidential New Construction Reach Code Cost Effectiveness Study
42 2019-07-25
♦ 2 – All-Electric Federal Code-Minimum Reference:
♦ This all-electric design does not comply with the Energy Commission’s TDV performance budget. Packages achieve between -50% and -4% compliance margins depending on climate zone. This may be because the modeled HW system is constrained to having an artificially low efficiency to avoid triggering federal pre-emption, and the heat pump space heating systems must operate overnight when operation is less efficient.
♦ All packages are cost effective in all climate zones.
♦ 3A – All-Electric + EE: Packages achieve positive compliance margins in all CZs ranging from 0% to +17%, except CZ16 which had a -18% compliance margin. All packages are cost effective in all climate zones. The improved degree of cost effectiveness outcomes in Package 3A compared to Package 1A appear to be due to the significant incremental package cost savings.
♦ 3B – All-Electric + EE + PV + B: All packages are cost effective. Packages improve in B/C ratio when compared to 3A and increase in magnitude of overall NPV savings. PV appears to be more cost-effective with higher building electricity loads.
♦ 3C – All-Electric + HE:
♦ Packages do not comply with Title 24 in all CZs except CZ15 which resulted in a +0.04% compliance margin.
♦ All packages are cost effective.
Page 253 of 319

2019 Nonresidential New Construction Reach Code Cost Effectiveness Study
43 2019-07-25
Figure 31. Cost Effectiveness for Small Hotel Package 1A – Mixed-Fuel + EE
CZ Utility
Elec Savings (kWh)
Gas Savings (therms)
GHG Reductions (mtons)
Comp-liance Margin
Incremental Package Cost
Lifecycle Utility Cost Savings
$TDV Savings
B/C Ratio (On-bill)
B/C Ratio (TDV)
NPV (On-bill)
NPV (TDV)
Package 1A: Mixed Fuel + EE CZ01 PG&E 3,855 1288 5.65 9% $20,971 $34,339 $36,874 1.6 1.8 $13,368 $15,903 CZ02 PG&E 3,802 976 3.91 7% $20,971 $26,312 $29,353 1.3 1.4 $5,341 $8,381 CZ03 PG&E 4,153 1046 4.48 10% $20,971 $31,172 $35,915 1.5 1.7 $10,201 $14,944 CZ04 PG&E 5,007 395 0.85 6% $21,824 $24,449 $24,270 1.1 1.1 $2,625 $2,446 CZ04-2 CPAU 4,916 422 0.98 6% $21,824 $18,713 $24,306 0.9 1.1 ($3,111) $2,483 CZ05 PG&E 3,530 1018 4.13 9% $20,971 $28,782 $34,448 1.4 1.6 $7,810 $13,477 CZ05-2 SCG 3,530 1018 4.13 9% $20,971 $23,028 $34,448 1.1 1.6 $2,057 $13,477 CZ06 SCE 5,137 418 1.16 8% $21,824 $16,001 $26,934 0.7 1.2 ($5,823) $5,110 CZ06-2 LADWP 5,137 418 1.16 8% $21,824 $11,706 $26,934 0.5 1.2 ($10,118) $5,110 CZ07 SDG&E 5,352 424 1.31 8% $21,824 $26,699 $27,975 1.2 1.3 $4,876 $6,152 CZ08 SCE 5,151 419 1.21 7% $21,824 $15,931 $23,576 0.7 1.1 ($5,893) $1,752 CZ08-2 LADWP 5,151 419 1.21 7% $21,824 $11,643 $23,576 0.5 1.1 ($10,180) $1,752 CZ09 SCE 5,229 406 1.16 6% $21,824 $15,837 $22,365 0.7 1.0 ($5,987) $541 CZ09-2 LADWP 5,229 406 1.16 6% $21,824 $11,632 $22,365 0.5 1.0 ($10,192) $541 CZ10 SDG&E 4,607 342 0.92 5% $21,824 $25,506 $22,219 1.2 1.0 $3,683 $396 CZ10-2 SCE 4,607 342 0.92 5% $21,824 $13,868 $22,219 0.6 1.0 ($7,956) $396 CZ11 PG&E 4,801 325 0.87 4% $21,824 $22,936 $19,503 1.1 0.9 $1,112 ($2,321) CZ12 PG&E 5,276 327 0.90 5% $21,824 $22,356 $21,305 1.0 0.98 $532 ($519) CZ12-2 SMUD 5,276 327 0.90 5% $21,824 $15,106 $21,305 0.7 0.98 ($6,717) ($519) CZ13 PG&E 4,975 310 0.87 4% $21,824 $23,594 $19,378 1.1 0.9 $1,770 ($2,445) CZ14 SDG&E 4,884 370 0.82 4% $21,824 $24,894 $21,035 1.1 0.96 $3,070 ($789) CZ14-2 SCE 4,884 370 0.82 4% $21,824 $14,351 $21,035 0.7 0.96 ($7,473) ($789) CZ15 SCE 5,187 278 1.23 3% $21,824 $13,645 $18,089 0.6 0.8 ($8,178) ($3,735) CZ16 PG&E 2,992 1197 4.95 6% $20,971 $27,813 $30,869 1.3 1.5 $6,842 $9,898 CZ16-2 LADWP 2,992 1197 4.95 6% $20,971 $19,782 $30,869 0.9 1.5 ($1,190) $9,898
Page 254 of 319

2019 Nonresidential New Construction Reach Code Cost Effectiveness Study
44 2019-07-25
Figure 32. Cost Effectiveness for Small Hotel Package 1B – Mixed-Fuel + EE + PV + B
CZ Utility
Elec Savings (kWh)
Gas Savings (therms)
GHG Reductions (mtons)
Comp-liance Margin
Incremental Package Cost
Lifecycle Utility Cost Savings
$TDV Savings
B/C Ratio (On-bill)
B/C Ratio (TDV)
NPV (On-bill)
NPV (TDV)
Package 1B: Mixed Fuel + EE + PV + B CZ01 PG&E 107,694 1288 28.73 9% $228,341 $366,509 $295,731 1.6 1.3 $138,168 $67,390 CZ02 PG&E 130,144 976 31.14 7% $228,341 $359,248 $336,575 1.6 1.5 $130,907 $108,233 CZ03 PG&E 129,107 1046 31.57 10% $228,341 $430,737 $335,758 1.9 1.5 $202,396 $107,416 CZ04 PG&E 132,648 395 28.46 6% $229,194 $355,406 $338,455 1.6 1.5 $126,212 $109,262 CZ04-2 CPAU 132,556 422 28.59 6% $229,194 $322,698 $338,492 1.4 1.5 $93,504 $109,298 CZ05 PG&E 136,318 1018 32.73 9% $228,341 $452,611 $352,342 2.0 1.5 $224,269 $124,001 CZ05-2 SCG 136,318 1018 32.73 9% $228,341 $446,858 $352,342 2.0 1.5 $218,516 $124,001 CZ06 SCE 131,051 418 28.47 8% $229,194 $217,728 $336,843 0.9 1.5 ($11,466) $107,649 CZ06-2 LADWP 131,051 418 28.47 8% $229,194 $131,052 $336,843 0.6 1.5 ($98,142) $107,649 CZ07 SDG&E 136,359 424 29.63 8% $229,194 $306,088 $345,378 1.3 1.5 $76,894 $116,184 CZ08 SCE 132,539 419 28.85 7% $229,194 $227,297 $353,013 1.0 1.5 ($1,897) $123,819 CZ08-2 LADWP 132,539 419 28.85 7% $229,194 $134,739 $353,013 0.6 1.5 ($94,455) $123,819 CZ09 SCE 131,422 406 28.82 6% $229,194 $230,791 $343,665 1.0 1.5 $1,597 $114,471 CZ09-2 LADWP 131,422 406 28.82 6% $229,194 $136,024 $343,665 0.6 1.5 ($93,170) $114,471 CZ10 SDG&E 134,146 342 29.05 5% $229,194 $339,612 $342,574 1.5 1.5 $110,418 $113,380 CZ10-2 SCE 134,146 342 29.05 5% $229,194 $226,244 $342,574 1.0 1.5 ($2,949) $113,380 CZ11 PG&E 128,916 325 27.62 4% $229,194 $352,831 $337,208 1.5 1.5 $123,637 $108,014 CZ12 PG&E 131,226 327 28.04 5% $229,194 $425,029 $338,026 1.9 1.5 $195,835 $108,832 CZ12-2 SMUD 131,226 327 28.04 5% $229,194 $213,176 $338,026 0.9 1.5 ($16,018) $108,832 CZ13 PG&E 127,258 310 27.33 4% $229,194 $351,244 $324,217 1.5 1.4 $122,050 $95,023 CZ14 SDG&E 147,017 370 30.96 4% $229,194 $861,445 $217,675 3.8 0.9 $632,251 ($11,518) CZ14-2 SCE 147,017 370 30.96 4% $229,194 $244,100 $381,164 1.1 1.7 $14,906 $151,970 CZ15 SCE 137,180 278 29.12 3% $229,194 $225,054 $348,320 1.0 1.5 ($4,140) $119,127 CZ16 PG&E 141,478 1197 34.60 6% $228,341 $377,465 $357,241 1.7 1.6 $149,124 $128,899 CZ16-2 LADWP 141,478 1197 34.60 6% $228,341 $136,563 $357,241 0.6 1.6 ($91,778) $128,899
Page 255 of 319

2019 Nonresidential New Construction Reach Code Cost Effectiveness Study
45 2019-07-25
Figure 33. Cost Effectiveness for Small Hotel Package 1C – Mixed-Fuel + HE
CZ Utility
Elec Savings (kWh)
Gas Savings (therms)
GHG Reductions (mtons)
Comp-liance Margin
Incremental Package Cost
Lifecycle Utility Cost Savings
$TDV Savings
B/C Ratio (On-bill)
B/C Ratio (TDV)
NPV (On-bill)
NPV (TDV)
Package 1C: Mixed Fuel + HE CZ01 PG&E 10 632 3.76 2% $22,839 $11,015 $10,218 0.5 0.4 ($11,823) ($12,621) CZ02 PG&E 981 402 2.69 3% $23,092 $16,255 $11,808 0.7 0.5 ($6,837) ($11,284) CZ03 PG&E 81 383 2.30 2% $20,510 $7,066 $6,850 0.3 0.3 ($13,444) ($13,660) CZ04 PG&E 161 373 2.26 2% $22,164 $8,593 $7,645 0.4 0.3 ($13,571) ($14,519) CZ04-2 CPAU 161 373 2.26 2% $22,164 $7,097 $7,645 0.3 0.3 ($15,067) ($14,519) CZ05 PG&E 154 361 2.19 2% $21,418 $6,897 $6,585 0.3 0.3 ($14,521) ($14,833) CZ05-2 SCG 154 361 2.19 2% $21,418 $4,786 $6,585 0.2 0.3 ($16,632) ($14,833) CZ06 SCE 237 201 1.27 2% $20,941 $3,789 $4,882 0.2 0.2 ($17,152) ($16,059) CZ06-2 LADWP 237 201 1.27 2% $20,941 $3,219 $4,882 0.2 0.2 ($17,722) ($16,059) CZ07 SDG&E 1,117 158 1.28 2% $19,625 $13,771 $7,342 0.7 0.4 ($5,854) ($12,283) CZ08 SCE 1,302 169 1.39 2% $20,678 $8,378 $8,591 0.4 0.4 ($12,300) ($12,088) CZ08-2 LADWP 1,302 169 1.39 2% $20,678 $5,802 $8,591 0.3 0.4 ($14,877) ($12,088) CZ09 SCE 1,733 178 1.56 3% $20,052 $10,489 $11,164 0.5 0.6 ($9,563) ($8,888) CZ09-2 LADWP 1,733 178 1.56 3% $20,052 $7,307 $11,164 0.4 0.6 ($12,745) ($8,888) CZ10 SDG&E 3,170 220 2.29 4% $22,682 $35,195 $19,149 1.6 0.8 $12,513 ($3,533) CZ10-2 SCE 3,170 220 2.29 4% $22,682 $16,701 $19,149 0.7 0.8 ($5,981) ($3,533) CZ11 PG&E 3,343 323 2.96 4% $23,344 $27,633 $20,966 1.2 0.9 $4,288 ($2,379) CZ12 PG&E 1,724 320 2.44 4% $22,302 $11,597 $15,592 0.5 0.7 ($10,705) ($6,710) CZ12-2 SMUD 1,724 320 2.44 4% $22,302 $11,156 $15,592 0.5 0.7 ($11,146) ($6,710) CZ13 PG&E 3,083 316 2.81 3% $22,882 $23,950 $17,068 1.0 0.7 $1,068 ($5,814) CZ14 SDG&E 3,714 312 2.99 4% $23,299 $35,301 $21,155 1.5 0.9 $12,002 ($2,144) CZ14-2 SCE 3,714 312 2.99 4% $23,299 $18,460 $21,155 0.8 0.9 ($4,839) ($2,144) CZ15 SCE 8,684 97 3.21 5% $20,945 $26,738 $31,600 1.3 1.5 $5,792 $10,655 CZ16 PG&E 836 700 4.42 3% $24,616 $18,608 $14,494 0.8 0.6 ($6,007) ($10,121) CZ16-2 LADWP 836 700 4.42 3% $24,616 $15,237 $14,494 0.6 0.6 ($9,378) ($10,121)
Page 256 of 319
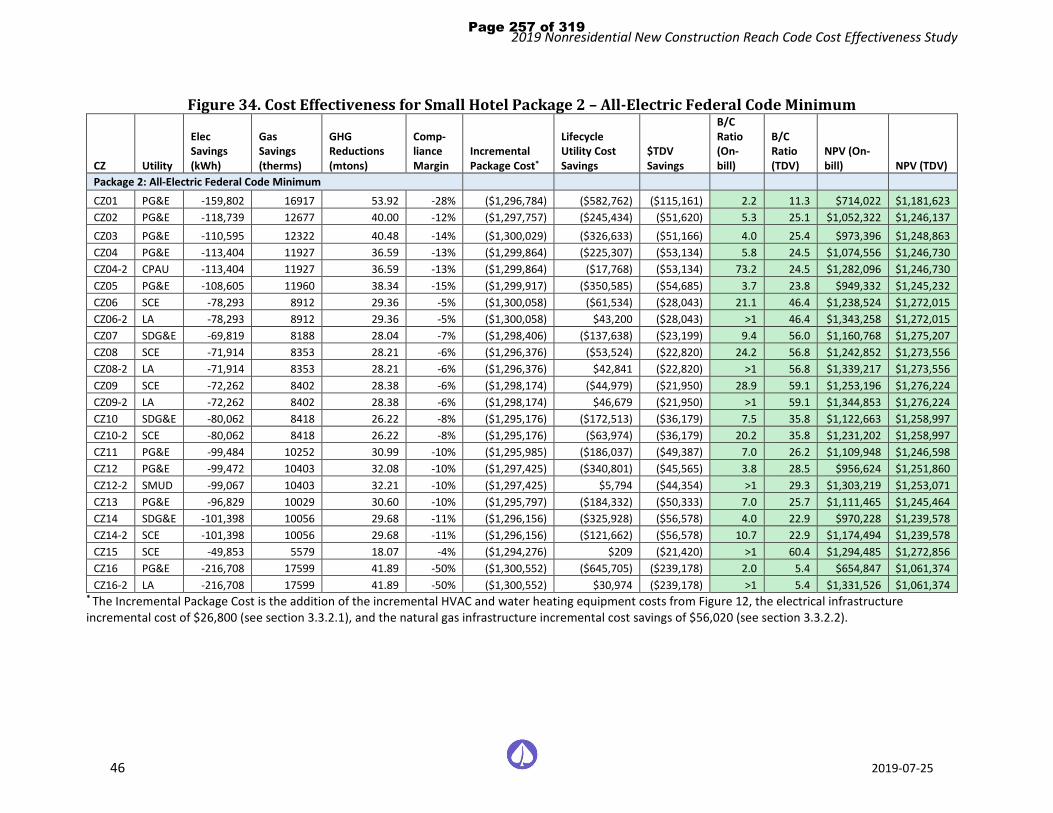
2019 Nonresidential New Construction Reach Code Cost Effectiveness Study
46 2019-07-25
Figure 34. Cost Effectiveness for Small Hotel Package 2 – All-Electric Federal Code Minimum
CZ Utility
Elec Savings (kWh)
Gas Savings (therms)
GHG Reductions (mtons)
Comp- liance Margin
Incremental Package Cost*
Lifecycle Utility Cost Savings
$TDV Savings
B/C Ratio (On-bill)
B/C Ratio (TDV)
NPV (On-bill) NPV (TDV)
Package 2: All-Electric Federal Code Minimum
CZ01 PG&E -159,802 16917 53.92 -28% ($1,296,784) ($582,762) ($115,161) 2.2 11.3 $714,022 $1,181,623 CZ02 PG&E -118,739 12677 40.00 -12% ($1,297,757) ($245,434) ($51,620) 5.3 25.1 $1,052,322 $1,246,137 CZ03 PG&E -110,595 12322 40.48 -14% ($1,300,029) ($326,633) ($51,166) 4.0 25.4 $973,396 $1,248,863 CZ04 PG&E -113,404 11927 36.59 -13% ($1,299,864) ($225,307) ($53,134) 5.8 24.5 $1,074,556 $1,246,730 CZ04-2 CPAU -113,404 11927 36.59 -13% ($1,299,864) ($17,768) ($53,134) 73.2 24.5 $1,282,096 $1,246,730 CZ05 PG&E -108,605 11960 38.34 -15% ($1,299,917) ($350,585) ($54,685) 3.7 23.8 $949,332 $1,245,232 CZ06 SCE -78,293 8912 29.36 -5% ($1,300,058) ($61,534) ($28,043) 21.1 46.4 $1,238,524 $1,272,015 CZ06-2 LA -78,293 8912 29.36 -5% ($1,300,058) $43,200 ($28,043) >1 46.4 $1,343,258 $1,272,015 CZ07 SDG&E -69,819 8188 28.04 -7% ($1,298,406) ($137,638) ($23,199) 9.4 56.0 $1,160,768 $1,275,207 CZ08 SCE -71,914 8353 28.21 -6% ($1,296,376) ($53,524) ($22,820) 24.2 56.8 $1,242,852 $1,273,556 CZ08-2 LA -71,914 8353 28.21 -6% ($1,296,376) $42,841 ($22,820) >1 56.8 $1,339,217 $1,273,556 CZ09 SCE -72,262 8402 28.38 -6% ($1,298,174) ($44,979) ($21,950) 28.9 59.1 $1,253,196 $1,276,224 CZ09-2 LA -72,262 8402 28.38 -6% ($1,298,174) $46,679 ($21,950) >1 59.1 $1,344,853 $1,276,224 CZ10 SDG&E -80,062 8418 26.22 -8% ($1,295,176) ($172,513) ($36,179) 7.5 35.8 $1,122,663 $1,258,997 CZ10-2 SCE -80,062 8418 26.22 -8% ($1,295,176) ($63,974) ($36,179) 20.2 35.8 $1,231,202 $1,258,997 CZ11 PG&E -99,484 10252 30.99 -10% ($1,295,985) ($186,037) ($49,387) 7.0 26.2 $1,109,948 $1,246,598 CZ12 PG&E -99,472 10403 32.08 -10% ($1,297,425) ($340,801) ($45,565) 3.8 28.5 $956,624 $1,251,860 CZ12-2 SMUD -99,067 10403 32.21 -10% ($1,297,425) $5,794 ($44,354) >1 29.3 $1,303,219 $1,253,071 CZ13 PG&E -96,829 10029 30.60 -10% ($1,295,797) ($184,332) ($50,333) 7.0 25.7 $1,111,465 $1,245,464 CZ14 SDG&E -101,398 10056 29.68 -11% ($1,296,156) ($325,928) ($56,578) 4.0 22.9 $970,228 $1,239,578 CZ14-2 SCE -101,398 10056 29.68 -11% ($1,296,156) ($121,662) ($56,578) 10.7 22.9 $1,174,494 $1,239,578 CZ15 SCE -49,853 5579 18.07 -4% ($1,294,276) $209 ($21,420) >1 60.4 $1,294,485 $1,272,856 CZ16 PG&E -216,708 17599 41.89 -50% ($1,300,552) ($645,705) ($239,178) 2.0 5.4 $654,847 $1,061,374 CZ16-2 LA -216,708 17599 41.89 -50% ($1,300,552) $30,974 ($239,178) >1 5.4 $1,331,526 $1,061,374
* The Incremental Package Cost is the addition of the incremental HVAC and water heating equipment costs from Figure 12, the electrical infrastructure incremental cost of $26,800 (see section 3.3.2.1), and the natural gas infrastructure incremental cost savings of $56,020 (see section 3.3.2.2).
Page 257 of 319

2019 Nonresidential New Construction Reach Code Cost Effectiveness Study
47 2019-07-25
Figure 35. Cost Effectiveness for Small Hotel Package 3A – All-Electric + EE
CZ Utility
Elec Savings (kWh)
Gas Savings (therms)
GHG Reductions (mtons)
Comp-liance Margin
Incremental Package Cost
Lifecycle Utility Cost Savings
$TDV Savings
B/C Ratio (On-bill)
B/C Ratio (TDV)
NPV (On-bill) NPV (TDV)
Package 3A: All-Electric + EE
CZ01 PG&E -113,259 16917 62.38 1.3% ($1,251,544) ($200,367) $5,460 6.2 >1 $1,051,177 $1,257,005 CZ02 PG&E -90,033 12677 45.46 4% ($1,265,064) ($108,075) $15,685 11.7 >1 $1,156,989 $1,280,749 CZ03 PG&E -83,892 12322 45.93 6% ($1,267,509) ($198,234) $20,729 6.4 >1 $1,069,274 $1,288,237 CZ04 PG&E -91,197 11927 40.36 0.2% ($1,263,932) ($112,892) $703 11.2 >1 $1,151,041 $1,264,635 CZ04-2 CPAU -90,981 11927 40.42 0.2% ($1,263,932) $32,557 $918 >1 >1 $1,296,489 $1,264,850 CZ05 PG&E -82,491 11960 43.62 5% ($1,267,355) ($221,492) $18,488 5.7 >1 $1,045,863 $1,285,843 CZ06 SCE -61,523 8912 32.45 7% ($1,267,916) ($33,475) $15,142 37.9 >1 $1,234,441 $1,283,057 CZ06-2 LADWP -61,523 8912 32.45 7% ($1,267,916) $57,215 $15,142 >1 >1 $1,325,130 $1,283,057 CZ07 SDG&E -53,308 8188 31.22 7% ($1,266,354) ($81,338) $22,516 15.6 >1 $1,185,015 $1,288,870 CZ08 SCE -55,452 8353 31.33 3% ($1,264,408) ($23,893) $9,391 52.9 >1 $1,240,515 $1,273,800 CZ08-2 LADWP -55,452 8353 31.33 3% ($1,264,408) $57,058 $9,391 >1 >1 $1,321,466 $1,273,800 CZ09 SCE -55,887 8402 31.40 2% ($1,266,302) ($19,887) $9,110 63.7 >1 $1,246,415 $1,275,412 CZ09-2 LADWP -55,887 8402 31.40 2% ($1,266,302) $60,441 $9,110 >1 >1 $1,326,743 $1,275,412 CZ10 SDG&E -60,239 8418 29.96 2% ($1,256,002) ($126,072) $7,365 10.0 >1 $1,129,930 $1,263,367 CZ10-2 SCE -60,239 8418 29.96 2% ($1,256,002) ($33,061) $7,365 38.0 >1 $1,222,940 $1,263,367 CZ11 PG&E -77,307 10252 35.12 1% ($1,256,149) ($80,187) $3,114 15.7 >1 $1,175,962 $1,259,263 CZ12 PG&E -75,098 10403 36.73 2% ($1,256,824) ($234,275) $9,048 5.4 >1 $1,022,550 $1,265,872 CZ12-2 SMUD -75,098 10403 36.73 2% ($1,256,824) $54,941 $9,048 >1 >1 $1,311,765 $1,265,872 CZ13 PG&E -75,052 10029 34.72 0.3% ($1,256,109) ($79,378) $1,260 15.8 >1 $1,176,731 $1,257,369 CZ14 SDG&E -76,375 10056 34.28 0.1% ($1,255,704) ($170,975) $543 7.3 >1 $1,084,729 $1,256,247 CZ14-2 SCE -76,375 10056 34.28 0.1% ($1,255,704) ($34,418) $543 36.5 >1 $1,221,286 $1,256,247 CZ15 SCE -33,722 5579 21.43 2% ($1,257,835) $26,030 $12,262 >1 >1 $1,283,864 $1,270,097 CZ16 PG&E -139,676 17599 55.25 -14% ($1,255,364) ($197,174) ($66,650) 6.4 18.8 $1,058,190 $1,188,714 CZ16-2 LADWP -139,676 17599 55.25 -14% ($1,255,364) $165,789 ($66,650) >1 18.8 $1,421,153 $1,188,714
Page 258 of 319

2019 Nonresidential New Construction Reach Code Cost Effectiveness Study
48 2019-07-25
Figure 36. Cost Effectiveness for Small Hotel Package 3B – All-Electric + EE + PV + B
CZ Utility
Elec Savings (kWh)
Gas Savings (therms)
GHG Reductions (mtons)
Comp-liance Margin
Incremental Package Cost
Lifecycle Utility Cost Savings
$TDV Savings
B/C Ratio (On-bill) B/C Ratio (TDV)
NPV (On-bill) NPV (TDV)
Package 3B: All-Electric + EE + PV + B
CZ01 PG&E -8,900 16917 87.15 1% ($1,044,174) $90,964 $324,376 >1 >1 $1,135,139 $1,368,551 CZ02 PG&E 36,491 12677 73.03 4% ($1,057,694) $242,514 $313,711 >1 >1 $1,300,208 $1,371,405 CZ03 PG&E 41,239 12322 73.43 6% ($1,060,139) $155,868 $308,385 >1 >1 $1,216,007 $1,368,524 CZ04 PG&E 36,628 11927 69.70 0.2% ($1,056,562) $240,799 $308,682 >1 >1 $1,297,361 $1,365,244 CZ04-2 CPAU 36,844 11927 69.76 0.2% ($1,056,562) $336,813 $418,836 >1 >1 $1,393,375 $1,475,398 CZ05 PG&E 36,365 11960 73.11 5% ($1,059,985) $119,173 $317,952 >1 >1 $1,179,158 $1,377,937 CZ06 SCE 64,476 8912 60.47 7% ($1,060,545) $156,327 $311,730 >1 >1 $1,216,872 $1,372,275 CZ06-2 LADWP 64,476 8912 60.47 7% ($1,060,545) $180,648 $311,730 >1 >1 $1,241,193 $1,372,275 CZ07 SDG&E 77,715 8188 60.45 7% ($1,058,983) $197,711 $330,458 >1 >1 $1,256,694 $1,389,441 CZ08 SCE 71,990 8353 59.49 3% ($1,057,038) $165,393 $320,814 >1 >1 $1,222,432 $1,377,852 CZ08-2 LADWP 71,990 8353 60.24 3% ($1,057,038) $180,367 $443,809 >1 >1 $1,237,405 $1,500,847 CZ09 SCE 70,465 8402 59.29 2% ($1,058,932) $175,602 $301,459 >1 >1 $1,234,534 $1,360,391 CZ09-2 LADWP 70,465 8402 59.29 2% ($1,058,932) $183,220 $301,459 >1 >1 $1,242,152 $1,360,391 CZ10 SDG&E 69,581 8418 58.04 2% ($1,048,632) $161,513 $294,530 >1 >1 $1,210,145 $1,343,162 CZ10-2 SCE 69,581 8418 58.04 2% ($1,048,632) $164,837 $294,530 >1 >1 $1,213,469 $1,343,162 CZ11 PG&E 47,260 10252 61.57 1% ($1,048,779) $253,717 $286,797 >1 >1 $1,302,496 $1,335,576 CZ12 PG&E 51,115 10403 64.07 2% ($1,049,454) $104,523 $305,446 >1 >1 $1,153,977 $1,354,900 CZ12-2 SMUD 51,115 10403 64.99 2% ($1,049,454) $253,197 $430,977 >1 >1 $1,302,651 $1,480,431 CZ13 PG&E 47,757 10029 60.77 0.3% ($1,048,739) $251,663 $281,877 >1 >1 $1,300,402 $1,330,616 CZ14 SDG&E 66,084 10056 64.54 0.1% ($1,048,334) $148,510 $334,938 >1 >1 $1,196,844 $1,383,272 CZ14-2 SCE 66,084 10056 64.54 0.1% ($1,048,334) $185,018 $334,938 >1 >1 $1,233,352 $1,383,272 CZ15 SCE 98,755 5579 49.04 2.1% ($1,050,465) $233,308 $311,121 >1 >1 $1,283,772 $1,361,585 CZ16 PG&E -873 17599 84.99 -14% ($1,047,994) $191,994 $240,724 >1 >1 $1,239,987 $1,288,718 CZ16-2 LADWP -873 17599 84.99 -14% ($1,047,994) $291,279 $240,724 >1 >1 $1,339,273 $1,288,718
Page 259 of 319
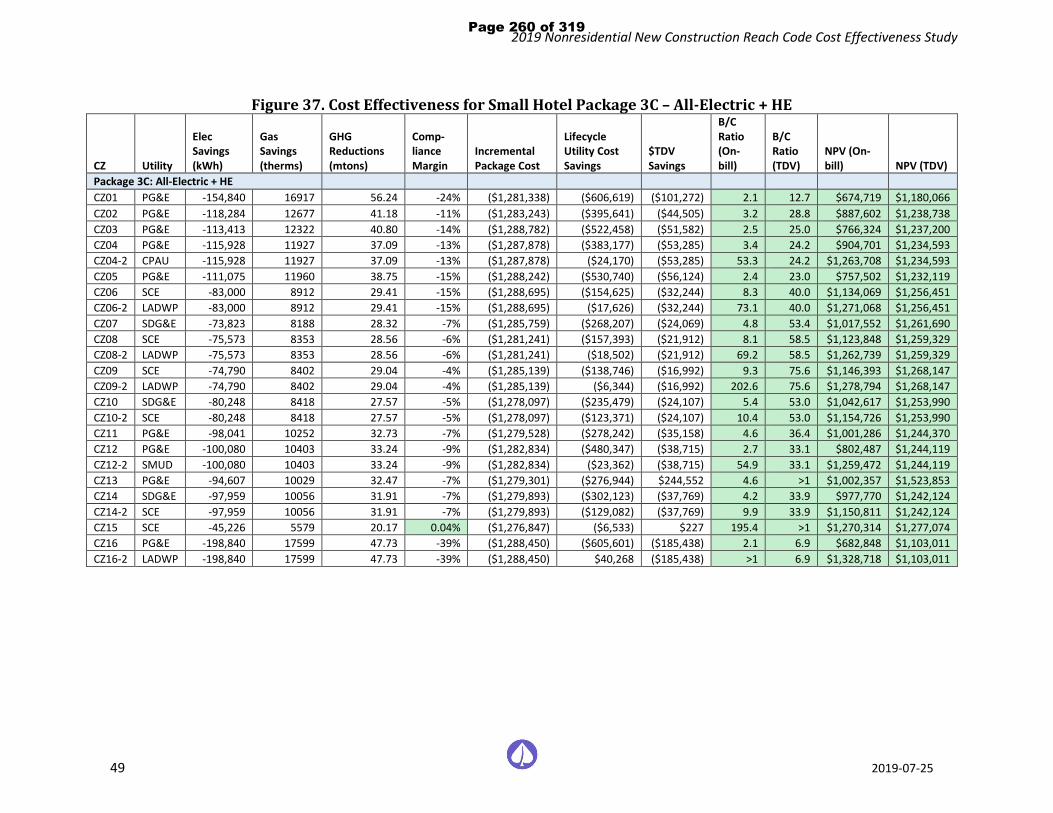
2019 Nonresidential New Construction Reach Code Cost Effectiveness Study
49 2019-07-25
Figure 37. Cost Effectiveness for Small Hotel Package 3C – All-Electric + HE
CZ Utility
Elec Savings (kWh)
Gas Savings (therms)
GHG Reductions (mtons)
Comp-liance Margin
Incremental Package Cost
Lifecycle Utility Cost Savings
$TDV Savings
B/C Ratio (On-bill)
B/C Ratio (TDV)
NPV (On-bill) NPV (TDV)
Package 3C: All-Electric + HE CZ01 PG&E -154,840 16917 56.24 -24% ($1,281,338) ($606,619) ($101,272) 2.1 12.7 $674,719 $1,180,066 CZ02 PG&E -118,284 12677 41.18 -11% ($1,283,243) ($395,641) ($44,505) 3.2 28.8 $887,602 $1,238,738 CZ03 PG&E -113,413 12322 40.80 -14% ($1,288,782) ($522,458) ($51,582) 2.5 25.0 $766,324 $1,237,200 CZ04 PG&E -115,928 11927 37.09 -13% ($1,287,878) ($383,177) ($53,285) 3.4 24.2 $904,701 $1,234,593 CZ04-2 CPAU -115,928 11927 37.09 -13% ($1,287,878) ($24,170) ($53,285) 53.3 24.2 $1,263,708 $1,234,593 CZ05 PG&E -111,075 11960 38.75 -15% ($1,288,242) ($530,740) ($56,124) 2.4 23.0 $757,502 $1,232,119 CZ06 SCE -83,000 8912 29.41 -15% ($1,288,695) ($154,625) ($32,244) 8.3 40.0 $1,134,069 $1,256,451 CZ06-2 LADWP -83,000 8912 29.41 -15% ($1,288,695) ($17,626) ($32,244) 73.1 40.0 $1,271,068 $1,256,451 CZ07 SDG&E -73,823 8188 28.32 -7% ($1,285,759) ($268,207) ($24,069) 4.8 53.4 $1,017,552 $1,261,690 CZ08 SCE -75,573 8353 28.56 -6% ($1,281,241) ($157,393) ($21,912) 8.1 58.5 $1,123,848 $1,259,329 CZ08-2 LADWP -75,573 8353 28.56 -6% ($1,281,241) ($18,502) ($21,912) 69.2 58.5 $1,262,739 $1,259,329 CZ09 SCE -74,790 8402 29.04 -4% ($1,285,139) ($138,746) ($16,992) 9.3 75.6 $1,146,393 $1,268,147 CZ09-2 LADWP -74,790 8402 29.04 -4% ($1,285,139) ($6,344) ($16,992) 202.6 75.6 $1,278,794 $1,268,147 CZ10 SDG&E -80,248 8418 27.57 -5% ($1,278,097) ($235,479) ($24,107) 5.4 53.0 $1,042,617 $1,253,990 CZ10-2 SCE -80,248 8418 27.57 -5% ($1,278,097) ($123,371) ($24,107) 10.4 53.0 $1,154,726 $1,253,990 CZ11 PG&E -98,041 10252 32.73 -7% ($1,279,528) ($278,242) ($35,158) 4.6 36.4 $1,001,286 $1,244,370 CZ12 PG&E -100,080 10403 33.24 -9% ($1,282,834) ($480,347) ($38,715) 2.7 33.1 $802,487 $1,244,119 CZ12-2 SMUD -100,080 10403 33.24 -9% ($1,282,834) ($23,362) ($38,715) 54.9 33.1 $1,259,472 $1,244,119 CZ13 PG&E -94,607 10029 32.47 -7% ($1,279,301) ($276,944) $244,552 4.6 >1 $1,002,357 $1,523,853 CZ14 SDG&E -97,959 10056 31.91 -7% ($1,279,893) ($302,123) ($37,769) 4.2 33.9 $977,770 $1,242,124 CZ14-2 SCE -97,959 10056 31.91 -7% ($1,279,893) ($129,082) ($37,769) 9.9 33.9 $1,150,811 $1,242,124 CZ15 SCE -45,226 5579 20.17 0.04% ($1,276,847) ($6,533) $227 195.4 >1 $1,270,314 $1,277,074 CZ16 PG&E -198,840 17599 47.73 -39% ($1,288,450) ($605,601) ($185,438) 2.1 6.9 $682,848 $1,103,011 CZ16-2 LADWP -198,840 17599 47.73 -39% ($1,288,450) $40,268 ($185,438) >1 6.9 $1,328,718 $1,103,011
Page 260 of 319

2019 Nonresidential New Construction Reach Code Cost Effectiveness Study
50 2019-07-25
4.4 Cost Effectiveness Results – PV-only and PV+Battery The Reach Code Team ran packages of PV-only and PV+Battery measures, without any additional efficiency measures, to assess cost effectiveness on top of the mixed-fuel baseline building and the all-electric federal code minimum reference (Package 2 in Sections 4.1 – 4.3).
Jurisdictions interested in adopting PV-only reach codes should reference the mixed-fuel cost effectiveness results because a mixed-fuel building is the baseline for the nonresidential prototypes analyzed in this study. PV or PV+Battery packages are added to all-electric federal code minimum reference which (in many scenarios) do not have a positive compliance margin compared to the mixed-fuel baseline model, and are solely provided for informational purposes. Jurisdictions interested in reach codes requiring all-electric+PV or all-electric+PV+battery should reference package 3B results in Sections 4.1 – 4.3.25
Each of the following eight packages were evaluated against a mixed fuel baseline designed as per 2019 Title 24 Part 6 requirements.
♦ Mixed-Fuel + 3 kW PV Only:
♦ Mixed-Fuel + 3 kW PV + 5 kWh battery
♦ Mixed-Fuel + PV Only: PV sized per the roof size of the building, or to offset the annual electricity consumption, whichever is smaller
♦ Mixed-Fuel + PV + 50 kWh Battery: PV sized per the roof size of the building, or to offset the annual electricity consumption, whichever is smaller, along with 50 kWh battery
♦ All-Electric + 3 kW PV Only
♦ All-Electric + 3 kW PV + 5 kWh Battery
♦ All-Electric + PV Only: PV sized per the roof size of the building, or to offset the annual electricity consumption, whichever is smaller
♦ All-Electric + PV + 50 kWh Battery: PV sized per the roof size of the building, or to offset the annual electricity consumption, whichever is smaller, along with 50 kWh battery
Figure 38 through Figure 40 summarize the on-bill and TDV B/C ratios for each prototype for the two PV only packages and the two PV plus battery packages. Compliance margins are 0 percent for all mixed-fuel packages. For all-electric packages, compliance margins are equal to those found in Package 2 for each prototype in Sections 4.1 – 4.3. The compliance margins are not impacted by renewables and battery storage measures and hence not shown in the tables. These figures are formatted in the following way:
♦ Cells highlighted in green have a B/C ratio greater than 1 and are cost-effective. The shade of green gets darker as cost effectiveness increases.
♦ Cells not highlighted have a B/C ratio less than one and are not cost effective.
25 Because this study shows that the addition of battery generally reduces cost effectiveness, removing a battery measure would only increase cost effectiveness. Thus, a jurisdiction can apply the EE+PV+Battery cost effectiveness findings to support EE+PV reach codes, because EE+PV would still remain cost effective without a battery.
Page 261 of 319

2019 Nonresidential New Construction Reach Code Cost Effectiveness Study
51 2019-07-25
Please see Appendix 6.7 for results in full detail. Generally, for mixed-fuel packages across all prototypes, all climate zones were proven to have cost effective outcomes using TDV except in CZ1 with a 3 kW PV + 5 kWh Battery scenario. Most climate zones also had On-Bill cost effectiveness. The addition of a battery slightly reduces cost effectiveness.
In all-electric packages, the results for most climate zones were found cost effective using both TDV and On-Bill approaches with larger PV systems or PV+Battery systems. Most 3 kW PV systems were also found to be cost effective except in some scenarios analyzing the Medium Office using the On-Bill method. CZ16 results continue to show challenges being cost effective with all electric buildings, likely due to the high heating loads in this climate. The addition of a battery slightly reduces the cost effectiveness for all-electric buildings with PV.
Page 262 of 319

2019 Nonresidential New Construction Reach Code Cost Effectiveness Study
52 2019-07-25
Figure 38. Cost Effectiveness for Medium Office - PV and Battery
PVBatteryUtility On-Bill TDV On-Bill TDV On-Bill TDV On-Bill TDV On-Bill TDV On-Bill TDV On-Bill TDV On-Bill TDV
CZ01 PG&E 2.8 1.5 1.7 0.9 1.7 1.3 1.6 1.2 0.9 1.6 0.9 1.6 2.5 2.0 2.1 1.7CZ02 PG&E 3.7 1.9 2.1 1.1 2.2 1.6 2.0 1.4 0.8 2.2 0.9 2.6 3.2 2.4 2.7 2.1CZ03 PG&E 3.7 1.8 2.2 1.0 2.1 1.5 1.9 1.4 1.9 3.9 2.0 4.0 3.4 2.5 2.9 2.2CZ04 PG&E 3.6 2.0 2.1 1.2 2.3 1.6 2.1 1.5 0.9 2.1 1.1 2.7 3.3 2.5 2.9 2.2CZ04-2 CPAU 2.1 2.0 1.3 1.2 1.8 1.6 1.6 1.5 7.7 2.1 9.8 2.7 2.9 2.5 2.5 2.2CZ05 PG&E 4.2 1.9 2.4 1.1 2.5 1.6 2.3 1.5 1.8 2.7 1.9 2.7 4.0 2.7 3.4 2.3CZ05-2 SCG 4.2 1.9 2.4 1.1 2.5 1.6 2.3 1.5 >1 >1 >1 >1 >1 3.0 9.4 2.6CZ06 SCE 2.0 2.0 1.2 1.1 1.3 1.6 1.2 1.5 >1 7.2 >1 8.2 2.4 2.7 2.1 2.3CZ06-2 LA 1.2 2.0 0.7 1.1 0.8 1.6 0.7 1.5 >1 7.2 >1 8.2 1.5 2.7 1.3 2.3CZ07 SDG&E 3.2 2.0 1.9 1.2 2.1 1.6 1.9 1.5 >1 >1 >1 >1 3.7 2.7 3.2 2.3CZ08 SCE 1.9 2.0 1.1 1.2 1.3 1.7 1.2 1.5 >1 >1 >1 >1 2.2 2.7 1.9 2.4CZ08-2 LA 1.2 2.0 0.7 1.2 0.7 1.7 0.7 1.5 >1 >1 >1 >1 1.3 2.7 1.1 2.4CZ09 SCE 1.9 2.0 1.1 1.2 1.3 1.7 1.2 1.5 >1 >1 >1 >1 2.2 2.6 1.9 2.3CZ09-2 LA 1.1 2.0 0.7 1.2 0.7 1.7 0.7 1.5 >1 >1 >1 >1 1.3 2.6 1.2 2.3CZ10 SDG&E 3.8 1.9 2.2 1.1 2.1 1.6 1.9 1.5 >1 3.3 >1 6.3 3.3 2.3 2.9 2.0CZ10-2 SCE 2.1 1.9 1.2 1.1 1.3 1.6 1.2 1.5 >1 3.3 >1 6.3 2.0 2.3 1.8 2.0CZ11 PG&E 3.6 1.9 2.1 1.1 2.2 1.6 2.0 1.5 1.1 2.6 1.5 3.6 3.2 2.4 2.8 2.1CZ12 PG&E 3.5 1.9 2.1 1.1 2.2 1.6 2.0 1.5 0.9 2.5 1.2 3.2 3.1 2.4 2.7 2.1CZ12-2 SMUD 1.4 1.9 0.8 1.1 1.1 1.6 1.04 1.5 >1 2.5 >1 3.2 1.9 2.4 1.6 2.1CZ13 PG&E 3.5 1.8 2.0 1.1 2.2 1.5 2.0 1.4 1.1 2.5 1.5 3.6 3.1 2.3 2.7 2.0CZ14 SDG&E 3.4 2.3 2.0 1.3 2.2 1.9 2.0 1.7 >1 2.3 >1 3.1 3.6 2.8 3.2 2.5CZ14-2 SCE 1.9 2.3 1.1 1.3 1.3 1.9 1.2 1.7 >1 2.3 >1 3.1 2.2 2.8 1.9 2.5CZ15 SCE 1.8 2.1 1.1 1.2 1.2 1.7 1.1 1.6 >1 7.5 >1 >1 1.8 2.4 1.6 2.1CZ16 PG&E 3.9 2.0 2.3 1.1 2.3 1.6 2.1 1.5 0.3 0.4 0.4 0.6 2.5 1.8 2.2 1.6CZ16-2 LA 1.2 2.0 0.7 1.1 0.7 1.6 0.7 1.5 >1 0.4 >1 0.6 1.3 1.8 1.2 1.6
CZ
135kW0 05kWh 50kWh
3kW0
135kW0
3kW5kWh
135kW50kWh
Mixed Fuel All-Electric3kW 135kW3kW
Page 263 of 319

2019 Nonresidential New Construction Reach Code Cost Effectiveness Study
53 2019-07-25
Figure 39. Cost Effectiveness for Medium Retail - PV and Battery
PVBatteryUtility On-Bill TDV On-Bill TDV On-Bill TDV On-Bill TDV On-Bill TDV On-Bill TDV On-Bill TDV On-Bill TDV
CZ01 PG&E 2.3 1.5 1.3 0.9 1.8 1.3 1.6 1.2 >1 3.0 >1 2.7 2.5 1.6 2.2 1.5CZ02 PG&E 3.2 1.8 1.9 1.1 1.9 1.5 1.8 1.5 >1 >1 >1 >1 2.7 2.1 2.3 1.9CZ03 PG&E 2.7 1.8 1.6 1.1 2.2 1.5 2.0 1.4 >1 >1 >1 >1 3.0 2.1 2.6 1.9CZ04 PG&E 3.3 1.9 1.9 1.1 2.0 1.6 1.9 1.5 >1 >1 >1 >1 2.7 2.1 2.5 2.0CZ04-2 CPAU 2.1 1.9 1.2 1.1 1.7 1.6 1.5 1.5 >1 >1 >1 >1 2.4 2.1 2.1 2.0CZ05 PG&E 2.8 1.9 1.6 1.1 2.3 1.6 2.0 1.5 >1 >1 >1 >1 3.2 2.1 2.7 2.0CZ05-2 SCG 2.8 1.9 1.6 1.1 2.3 1.6 2.0 1.5 >1 >1 >1 >1 3.7 1.9 3.2 1.6CZ06 SCE 2.0 1.9 1.2 1.1 1.2 1.6 1.1 1.5 >1 >1 >1 >1 1.7 2.2 1.5 2.0CZ06-2 LA 1.3 1.9 0.7 1.1 0.7 1.6 0.6 1.5 >1 >1 >1 >1 1.01 2.2 0.9 2.0CZ07 SDG&E 4.0 2.0 2.4 1.2 1.5 1.6 1.6 1.6 >1 >1 >1 >1 2.4 2.3 2.3 2.1CZ08 SCE 2.1 2.0 1.2 1.2 1.2 1.7 1.1 1.6 >1 >1 >1 >1 1.7 2.4 1.5 2.1CZ08-2 LA 1.3 2.0 0.8 1.2 0.7 1.7 0.6 1.6 >1 >1 >1 >1 1.01 2.4 0.9 2.1CZ09 SCE 2.0 2.0 1.2 1.2 1.2 1.7 1.1 1.5 >1 >1 >1 >1 1.8 2.4 1.6 2.1CZ09-2 LA 1.2 2.0 0.7 1.2 0.7 1.7 0.7 1.5 >1 >1 >1 >1 1.1 2.4 0.99 2.1CZ10 SDG&E 3.8 2.0 2.2 1.2 1.7 1.6 1.7 1.5 >1 >1 >1 >1 2.6 2.3 2.5 2.0CZ10-2 SCE 2.0 2.0 1.2 1.2 1.2 1.6 1.1 1.5 >1 >1 >1 >1 1.8 2.3 1.6 2.0CZ11 PG&E 2.8 1.9 1.6 1.1 1.9 1.6 1.8 1.5 >1 >1 >1 >1 2.7 2.3 2.5 2.1CZ12 PG&E 3.0 1.9 1.7 1.1 1.9 1.6 1.8 1.5 >1 >1 >1 >1 2.7 2.3 2.5 2.1CZ12-2 SMUD 1.5 1.9 0.9 1.1 1.1 1.6 0.997 1.5 >1 >1 >1 >1 1.7 2.3 1.4 2.1CZ13 PG&E 3.0 1.9 1.7 1.1 1.9 1.6 1.8 1.4 >1 >1 >1 >1 2.7 2.2 2.4 1.9CZ14 SDG&E 3.5 2.2 2.1 1.3 1.6 1.8 1.5 1.6 >1 >1 >1 >1 2.5 2.6 2.2 2.2CZ14-2 SCE 1.8 2.2 1.1 1.3 1.2 1.8 1.1 1.6 >1 >1 >1 >1 1.7 2.6 1.5 2.2CZ15 SCE 1.9 2.0 1.1 1.2 1.1 1.7 1.02 1.5 >1 >1 >1 >1 1.7 2.4 1.5 2.1CZ16 PG&E 3.7 2.0 2.1 1.2 2.1 1.7 1.9 1.6 0.6 0.5 0.5 0.4 2.7 2.0 2.3 1.8CZ16-2 LA 1.3 2.0 0.7 1.2 0.7 1.7 0.6 1.6 >1 0.5 >1 0.4 1.2 2.0 1.0 1.8
3kW 90 kW3kW0 05kWh 50kWh
CZ
Mixed Fuel
0 05kWh 50kWh3kW 90 kW3kW 90 kW
All-Electric90 kW
Page 264 of 319

2019 Nonresidential New Construction Reach Code Cost Effectiveness Study
54 2019-07-25
Figure 40. Cost Effectiveness for Small Hotel - PV and Battery
PVBatteryUtility On-Bill TDV On-Bill TDV On-Bill TDV On-Bill TDV On-Bill TDV On-Bill TDV On-Bill TDV On-Bill TDV
CZ01 PG&E 2.3 1.5 1.3 0.9 1.9 1.2 1.6 1.1 2.3 >1 2.3 >1 4.8 >1 4.7 >1CZ02 PG&E 2.3 1.9 1.3 1.1 1.8 1.5 1.6 1.4 5.6 >1 5.6 >1 >1 >1 >1 >1CZ03 PG&E 2.7 1.8 1.6 1.05 2.3 1.5 1.9 1.4 4.2 >1 4.2 >1 >1 >1 >1 >1CZ04 PG&E 2.4 1.9 1.4 1.1 1.8 1.6 1.6 1.5 6.2 >1 6.2 >1 >1 >1 >1 >1CZ04-2 CPAU 2.1 1.9 1.2 1.1 1.7 1.6 1.5 1.5 >1 >1 >1 >1 >1 >1 >1 >1CZ05 PG&E 2.9 1.9 1.7 1.1 2.4 1.6 2.0 1.5 3.9 >1 3.9 >1 >1 >1 >1 >1CZ05-2 SCG 2.9 1.9 1.7 1.1 2.4 1.6 2.0 1.5 >1 >1 >1 >1 >1 >1 >1 >1CZ06 SCE 1.8 1.9 1.1 1.1 1.1 1.6 0.9 1.4 >1 >1 >1 >1 >1 >1 >1 >1CZ06-2 LA 1.1 1.9 0.7 1.1 0.7 1.6 0.6 1.4 >1 >1 >1 >1 >1 >1 >1 >1CZ07 SDG&E 2.6 2.0 1.5 1.1 1.4 1.6 1.3 1.5 >1 >1 >1 >1 >1 >1 >1 >1CZ08 SCE 1.9 2.0 1.1 1.2 1.2 1.7 1.0 1.5 >1 >1 >1 >1 >1 >1 >1 >1CZ08-2 LA 1.2 2.0 0.7 1.2 0.7 1.7 0.6 1.5 >1 >1 >1 >1 >1 >1 >1 >1CZ09 SCE 1.9 1.9 1.1 1.1 1.2 1.6 0.997 1.4 >1 >1 >1 >1 >1 >1 >1 >1CZ09-2 LA 1.1 1.9 0.7 1.1 0.7 1.6 0.6 1.4 >1 >1 >1 >1 >1 >1 >1 >1CZ10 SDG&E 2.9 1.9 1.7 1.1 1.5 1.6 1.4 1.4 8.2 >1 8.2 >1 >1 >1 >1 >1CZ10-2 SCE 1.7 1.9 0.99 1.1 1.2 1.6 0.99 1.4 >1 >1 >1 >1 >1 >1 >1 >1CZ11 PG&E 2.6 1.9 1.5 1.1 1.8 1.6 1.5 1.4 7.6 >1 7.6 >1 >1 >1 >1 >1CZ12 PG&E 2.7 1.9 1.6 1.1 2.3 1.6 1.9 1.4 4.0 >1 4.0 >1 >1 >1 >1 >1CZ12-2 SMUD 1.4 1.9 0.8 1.1 1.1 1.6 0.95 1.4 >1 >1 >1 >1 >1 >1 >1 >1CZ13 PG&E 2.6 1.8 1.5 1.1 1.8 1.5 1.5 1.4 7.7 >1 7.7 >1 >1 >1 >1 >1CZ14 SDG&E 3.0 2.2 1.7 1.3 1.7 1.8 1.5 1.6 4.2 >1 4.2 >1 >1 >1 >1 >1CZ14-2 SCE 1.8 2.2 1.1 1.3 1.3 1.8 1.1 1.6 >1 >1 >1 >1 >1 >1 >1 >1CZ15 SCE 1.7 2.0 1.002 1.2 1.2 1.7 1.003 1.4 >1 >1 >1 >1 >1 >1 >1 >1CZ16 PG&E 2.7 2.0 1.6 1.2 1.9 1.6 1.7 1.5 2.1 5.7 2.1 5.6 5.8 >1 5.8 >1CZ16-2 LA 1.02 2.0 0.6 1.2 0.6 1.6 0.6 1.5 >1 5.7 >1 5.6 >1 >1 >1 >1
5kWh 50kWh 0CZ
Mixed Fuel All-Electric3kW 80kW3kW 80kW 3kW 80kW3kW 80kW
05kWh 50kWh0 0
Page 265 of 319

2019 Nonresidential New Construction Reach Code Cost Effectiveness Study
55 2019-07-25
5 Summary, Conclusions, and Further Considerations The Reach Codes Team developed packages of energy efficiency measures as well as packages combining energy efficiency with PV generation and battery storage systems, simulated them in building modeling software, and gathered costs to determine the cost effectiveness of multiple scenarios. The Reach Codes team coordinated assumptions with multiple utilities, cities, and building community experts to develop a set of assumptions considered reasonable in the current market. Changing assumptions, such as the period of analysis, measure selection, cost assumptions, energy escalation rates, or utility tariffs are likely to change results.
5.1 Summary Figure 41 through Figure 43 summarize results for each prototype and depict the compliance margins achieved for each climate zone and package. Because local reach codes must both exceed the Energy Commission performance budget (i.e., have a positive compliance margin) and be cost-effective, the Reach Code Team highlighted cells meeting these two requirements to help clarify the upper boundary for potential reach code policies:
♦ Cells highlighted in green depict a positive compliance margin and cost-effective results using both On-Bill and TDV approaches.
♦ Cells highlighted in yellow depict a positive compliance and cost-effective results using either the On-Bill or TDV approach.
♦ Cells not highlighted either depict a negative compliance margin or a package that was not cost effective using either the On-Bill or TDV approach.
For more detail on the results in the Figures, please refer to Section 4 Results. As described in Section 4.4, PV-only and PV+Battery packages in the mixed-fuel building were found to be cost effective across all prototypes, climate zones, and packages using the TDV approach, and results are not reiterated in the following figures.
Page 266 of 319

2019 Nonresidential New Construction Reach Code Cost Effectiveness Study
56 2019-07-25
Figure 41. Medium Office Summary of Compliance Margin and Cost Effectiveness
CZ Utility Mixed Fuel All Electric
EE EE + PV + B HE Fed Code EE EE + PV + B HE
CZ01 PG&E 18% 18% 3% -15% 7% 7% -14% CZ02 PG&E 17% 17% 4% -7% 10% 10% -5% CZ03 PG&E 20% 20% 3% -7% 16% 16% -6% CZ04 PG&E 14% 14% 5% -6% 9% 9% -3% CZ04-2 CPAU 14% 14% 5% -6% 9% 9% -3% CZ05 PG&E 18% 18% 4% -8% 12% 12% -6% CZ05-2 SCG 18% 18% 4% NA NA NA NA CZ06 SCE 20% 20% 3% -4% 18% 18% -2% CZ06-2 LADWP 20% 20% 3% -4% 18% 18% -2% CZ07 SDG&E 20% 20% 4% -2% 20% 20% 1% CZ08 SCE 18% 18% 4% -2% 18% 18% 1% CZ08-2 LADWP 18% 18% 4% -2% 18% 18% 1% CZ09 SCE 16% 16% 4% -2% 15% 15% 2% CZ09-2 LADWP 16% 16% 4% -2% 15% 15% 2% CZ10 SDG&E 17% 17% 4% -4% 13% 13% -1% CZ10-2 SCE 17% 17% 4% -4% 13% 13% -1% CZ11 PG&E 13% 13% 5% -4% 10% 10% 0% CZ12 PG&E 14% 14% 5% -5% 10% 10% -1% CZ12-2 SMUD 14% 14% 5% -5% 10% 10% -1% CZ13 PG&E 13% 13% 5% -4% 9% 9% 0% CZ14 SDG&E 14% 14% 5% -5% 9% 9% -1% CZ14-2 SCE 14% 14% 5% -5% 9% 9% -1% CZ15 SCE 12% 12% 5% -2% 10% 10% 3% CZ16 PG&E 14% 14% 5% -27% -15% -15% -26% CZ16-2 LADWP 14% 14% 5% -27% -15% -15% -26%
Page 267 of 319
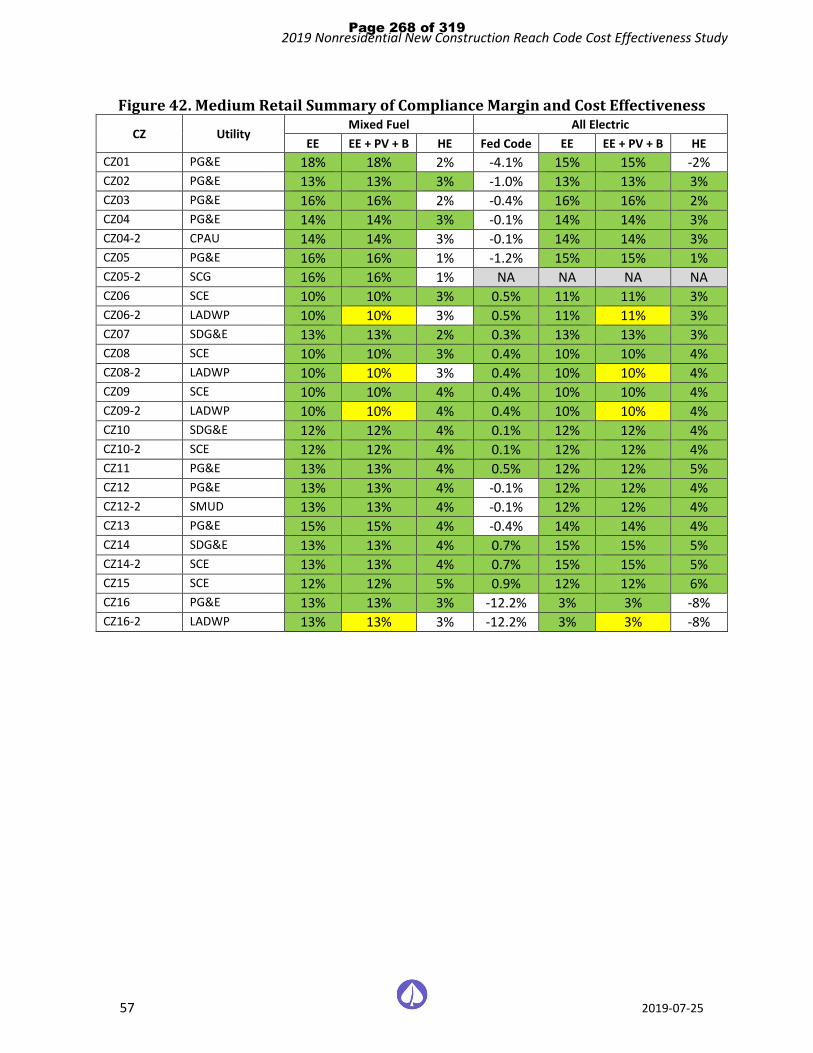
2019 Nonresidential New Construction Reach Code Cost Effectiveness Study
57 2019-07-25
Figure 42. Medium Retail Summary of Compliance Margin and Cost Effectiveness
CZ Utility Mixed Fuel All Electric
EE EE + PV + B HE Fed Code EE EE + PV + B HE CZ01 PG&E 18% 18% 2% -4.1% 15% 15% -2% CZ02 PG&E 13% 13% 3% -1.0% 13% 13% 3% CZ03 PG&E 16% 16% 2% -0.4% 16% 16% 2% CZ04 PG&E 14% 14% 3% -0.1% 14% 14% 3% CZ04-2 CPAU 14% 14% 3% -0.1% 14% 14% 3% CZ05 PG&E 16% 16% 1% -1.2% 15% 15% 1% CZ05-2 SCG 16% 16% 1% NA NA NA NA CZ06 SCE 10% 10% 3% 0.5% 11% 11% 3% CZ06-2 LADWP 10% 10% 3% 0.5% 11% 11% 3% CZ07 SDG&E 13% 13% 2% 0.3% 13% 13% 3% CZ08 SCE 10% 10% 3% 0.4% 10% 10% 4% CZ08-2 LADWP 10% 10% 3% 0.4% 10% 10% 4% CZ09 SCE 10% 10% 4% 0.4% 10% 10% 4% CZ09-2 LADWP 10% 10% 4% 0.4% 10% 10% 4% CZ10 SDG&E 12% 12% 4% 0.1% 12% 12% 4% CZ10-2 SCE 12% 12% 4% 0.1% 12% 12% 4% CZ11 PG&E 13% 13% 4% 0.5% 12% 12% 5% CZ12 PG&E 13% 13% 4% -0.1% 12% 12% 4% CZ12-2 SMUD 13% 13% 4% -0.1% 12% 12% 4% CZ13 PG&E 15% 15% 4% -0.4% 14% 14% 4% CZ14 SDG&E 13% 13% 4% 0.7% 15% 15% 5% CZ14-2 SCE 13% 13% 4% 0.7% 15% 15% 5% CZ15 SCE 12% 12% 5% 0.9% 12% 12% 6% CZ16 PG&E 13% 13% 3% -12.2% 3% 3% -8% CZ16-2 LADWP 13% 13% 3% -12.2% 3% 3% -8%
Page 268 of 319

2019 Nonresidential New Construction Reach Code Cost Effectiveness Study
58 2019-07-25
Figure 43. Small Hotel Summary of Compliance Margin and Cost Effectiveness
CZ Utility Mixed Fuel All Electric
EE EE + PV + B HE Fed Code EE EE + PV + B HE CZ01 PG&E 9% 9% 2% -28% 1% 1% -24% CZ02 PG&E 7% 7% 3% -12% 4% 4% -11% CZ03 PG&E 10% 10% 2% -14% 6% 6% -14% CZ04 PG&E 6% 6% 2% -13% 0.2% 0.2% -13% CZ04-2 CPAU 6% 6% 2% -13% 0.2% 0.2% -13% CZ05 PG&E 9% 9% 2% -15% 5% 5% -15% CZ05-2 SCG 9% 9% 2% NA NA NA NA CZ06 SCE 8% 8% 2% -5% 7% 7% -15% CZ06-2 LADWP 8% 8% 2% -5% 7% 7% -15% CZ07 SDG&E 8% 8% 2% -7% 7% 7% -7% CZ08 SCE 7% 7% 2% -6% 3% 3% -6% CZ08-2 LADWP 7% 7% 2% -6% 3% 3% -6% CZ09 SCE 6% 6% 3% -6% 2% 2% -4% CZ09-2 LADWP 6% 6% 3% -6% 2% 2% -4% CZ10 SDG&E 5% 5% 4% -8% 2% 2% -5% CZ10-2 SCE 5% 5% 4% -8% 2% 2% -5% CZ11 PG&E 4% 4% 4% -10% 1% 1% -7% CZ12 PG&E 5% 5% 4% -10% 2% 2% -9% CZ12-2 SMUD 5% 5% 4% -10% 2% 2% -9% CZ13 PG&E 4% 4% 3% -10% 0.3% 0.3% -7% CZ14 SDG&E 4% 4% 4% -11% 0.1% 0.1% -7% CZ14-2 SCE 4% 4% 4% -11% 0.1% 0.1% -7% CZ15 SCE 3% 3% 5% -4% 2% 2% 0.04% CZ16 PG&E 6% 6% 3% -50% -14% -14% -39% CZ16-2 LADWP 6% 6% 3% -50% -14% -14% -39%
5.2 Conclusions and Further Considerations Findings are specific to the scenarios analyzed under this specific methodology, and largely pertain to office, retail, and hotel-type occupancies. Nonresidential buildings constitute a wide variety of occupancy profiles and process loads, making findings challenging to generalize across multiple building types.
Findings indicate the following overall conclusions:
1. This study assumed that electrifying space heating and service water heating could eliminate natural gas infrastructure alone, because these were the only gas end-uses included the prototypes. Avoiding the installation of natural gas infrastructure results in significant cost savings and is a primary factor toward cost-effective outcomes in all-electric designs, even with necessary increases in electrical capacity.
2. There is ample opportunity for cost effective energy efficiency improvements, as demonstrated by the compliance margins achieved in many of the efficiency-only and efficiency + PV packages. Though much of the energy savings are attributable to lighting measures, efficiency measures selected for these prototypes are confined to the building systems that can be modeled. There is
Page 269 of 319
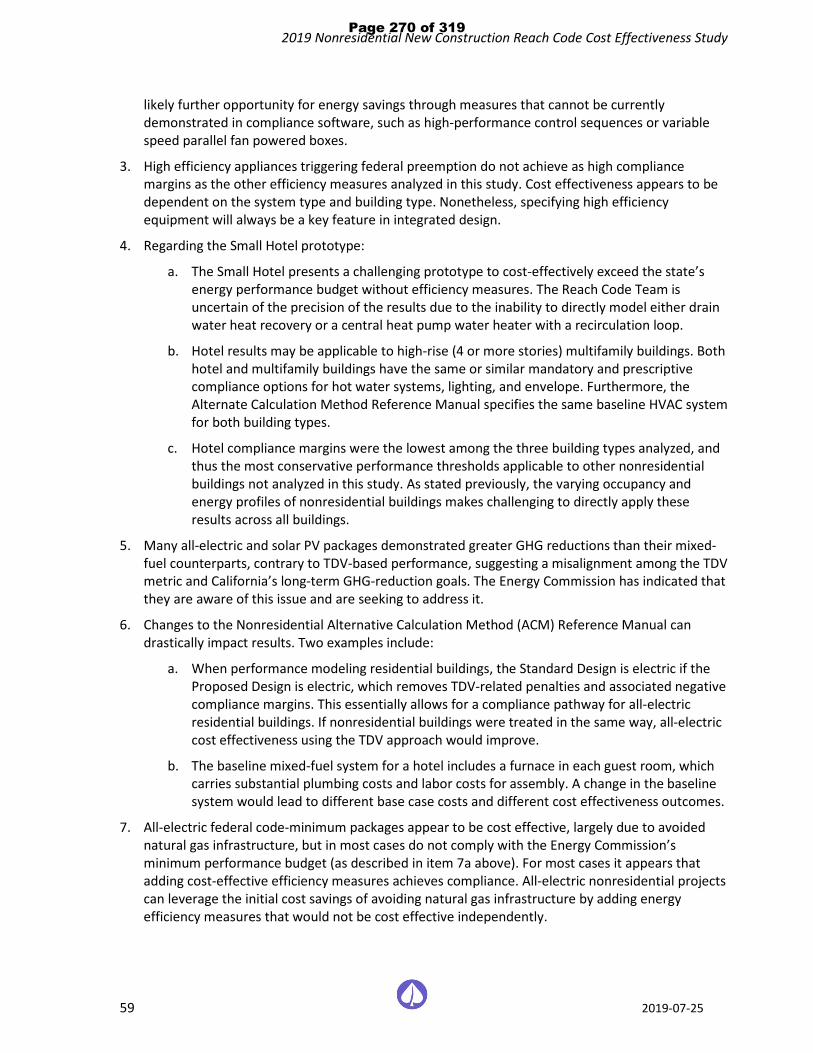
2019 Nonresidential New Construction Reach Code Cost Effectiveness Study
59 2019-07-25
likely further opportunity for energy savings through measures that cannot be currently demonstrated in compliance software, such as high-performance control sequences or variable speed parallel fan powered boxes.
3. High efficiency appliances triggering federal preemption do not achieve as high compliance margins as the other efficiency measures analyzed in this study. Cost effectiveness appears to be dependent on the system type and building type. Nonetheless, specifying high efficiency equipment will always be a key feature in integrated design.
4. Regarding the Small Hotel prototype:
a. The Small Hotel presents a challenging prototype to cost-effectively exceed the state’s energy performance budget without efficiency measures. The Reach Code Team is uncertain of the precision of the results due to the inability to directly model either drain water heat recovery or a central heat pump water heater with a recirculation loop.
b. Hotel results may be applicable to high-rise (4 or more stories) multifamily buildings. Both hotel and multifamily buildings have the same or similar mandatory and prescriptive compliance options for hot water systems, lighting, and envelope. Furthermore, the Alternate Calculation Method Reference Manual specifies the same baseline HVAC system for both building types.
c. Hotel compliance margins were the lowest among the three building types analyzed, and thus the most conservative performance thresholds applicable to other nonresidential buildings not analyzed in this study. As stated previously, the varying occupancy and energy profiles of nonresidential buildings makes challenging to directly apply these results across all buildings.
5. Many all-electric and solar PV packages demonstrated greater GHG reductions than their mixed-fuel counterparts, contrary to TDV-based performance, suggesting a misalignment among the TDV metric and California’s long-term GHG-reduction goals. The Energy Commission has indicated that they are aware of this issue and are seeking to address it.
6. Changes to the Nonresidential Alternative Calculation Method (ACM) Reference Manual can drastically impact results. Two examples include:
a. When performance modeling residential buildings, the Standard Design is electric if the Proposed Design is electric, which removes TDV-related penalties and associated negative compliance margins. This essentially allows for a compliance pathway for all-electric residential buildings. If nonresidential buildings were treated in the same way, all-electric cost effectiveness using the TDV approach would improve.
b. The baseline mixed-fuel system for a hotel includes a furnace in each guest room, which carries substantial plumbing costs and labor costs for assembly. A change in the baseline system would lead to different base case costs and different cost effectiveness outcomes.
7. All-electric federal code-minimum packages appear to be cost effective, largely due to avoided natural gas infrastructure, but in most cases do not comply with the Energy Commission’s minimum performance budget (as described in item 7a above). For most cases it appears that adding cost-effective efficiency measures achieves compliance. All-electric nonresidential projects can leverage the initial cost savings of avoiding natural gas infrastructure by adding energy efficiency measures that would not be cost effective independently.
Page 270 of 319

2019 Nonresidential New Construction Reach Code Cost Effectiveness Study
60 2019-07-25
6 Appendices 6.1 Map of California Climate Zones Climate zone geographical boundaries are depicted in Figure 44. The map in Figure 44 along with a zip-code search directory is available at: https://ww2.energy.ca.gov/maps/renewable/building_climate_zones.html
Figure 44. Map of California Climate Zones
Page 271 of 319
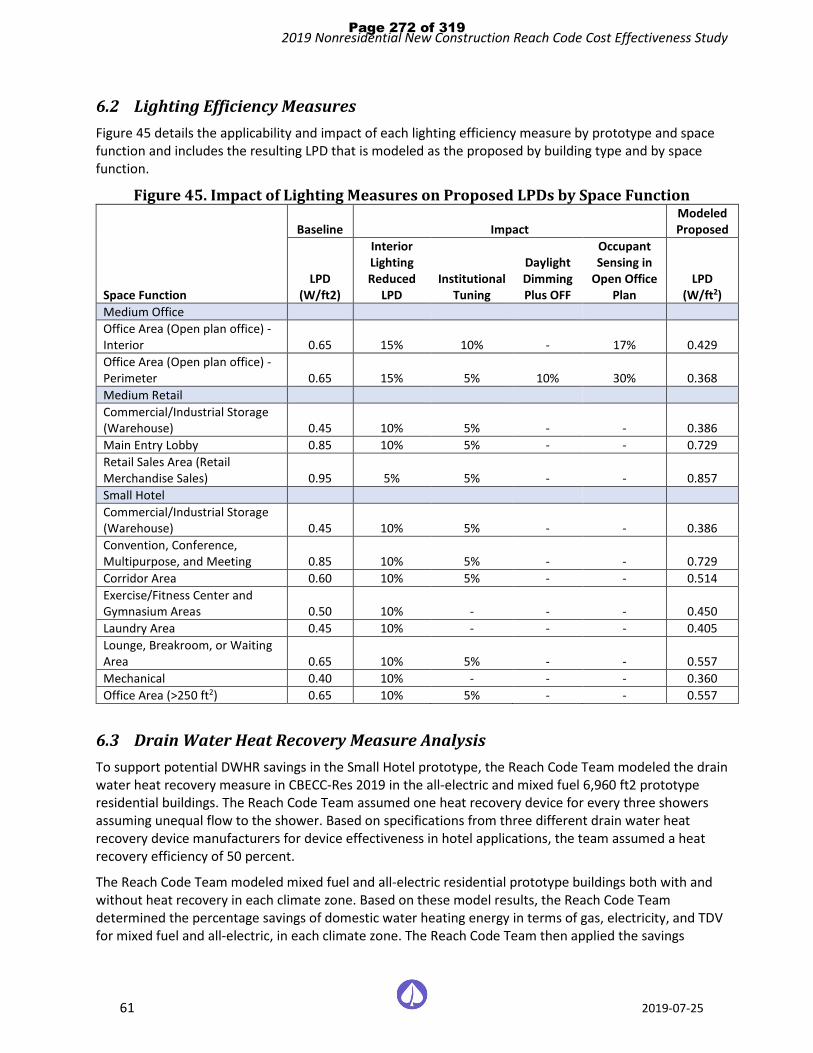
2019 Nonresidential New Construction Reach Code Cost Effectiveness Study
61 2019-07-25
6.2 Lighting Efficiency Measures Figure 45 details the applicability and impact of each lighting efficiency measure by prototype and space function and includes the resulting LPD that is modeled as the proposed by building type and by space function.
Figure 45. Impact of Lighting Measures on Proposed LPDs by Space Function
Space Function
Baseline Impact Modeled Proposed
LPD (W/ft2)
Interior Lighting Reduced
LPD Institutional
Tuning
Daylight Dimming Plus OFF
Occupant Sensing in
Open Office Plan
LPD (W/ft2)
Medium Office Office Area (Open plan office) - Interior 0.65 15% 10% - 17% 0.429 Office Area (Open plan office) - Perimeter 0.65 15% 5% 10% 30% 0.368 Medium Retail Commercial/Industrial Storage (Warehouse) 0.45 10% 5% - - 0.386 Main Entry Lobby 0.85 10% 5% - - 0.729 Retail Sales Area (Retail Merchandise Sales) 0.95 5% 5% - - 0.857 Small Hotel Commercial/Industrial Storage (Warehouse) 0.45 10% 5% - - 0.386 Convention, Conference, Multipurpose, and Meeting 0.85 10% 5% - - 0.729 Corridor Area 0.60 10% 5% - - 0.514 Exercise/Fitness Center and Gymnasium Areas 0.50 10% - - - 0.450 Laundry Area 0.45 10% - - - 0.405 Lounge, Breakroom, or Waiting Area 0.65 10% 5% - - 0.557 Mechanical 0.40 10% - - - 0.360 Office Area (>250 ft2) 0.65 10% 5% - - 0.557
6.3 Drain Water Heat Recovery Measure Analysis To support potential DWHR savings in the Small Hotel prototype, the Reach Code Team modeled the drain water heat recovery measure in CBECC-Res 2019 in the all-electric and mixed fuel 6,960 ft2 prototype residential buildings. The Reach Code Team assumed one heat recovery device for every three showers assuming unequal flow to the shower. Based on specifications from three different drain water heat recovery device manufacturers for device effectiveness in hotel applications, the team assumed a heat recovery efficiency of 50 percent.
The Reach Code Team modeled mixed fuel and all-electric residential prototype buildings both with and without heat recovery in each climate zone. Based on these model results, the Reach Code Team determined the percentage savings of domestic water heating energy in terms of gas, electricity, and TDV for mixed fuel and all-electric, in each climate zone. The Reach Code Team then applied the savings
Page 272 of 319

2019 Nonresidential New Construction Reach Code Cost Effectiveness Study
62 2019-07-25
percentages to the Small Hotel prototype domestic water heating energy in both the mixed-fuel and all-electric to determine energy savings for the drain water heat recovery measure in the Small Hotel. The Reach Code Team applied volumetric energy rates to estimate on-bill cost impacts from this measure.
6.4 Utility Rate Schedules The Reach Codes Team used the IOU and POU rates depicted in Figure 46 to determine the On-Bill savings for each prototype.
Figure 46. Utility Tariffs Analyzed Based on Climate Zone – Detailed View Climate Zones
Electric / Gas Utility
Electricity (Time-of-use) Natural Gas
Medium Office Medium Retail Small Hotel All Prototypes
CZ01 PG&E A-10 A-1 A-1 or A-10 G-NR1 CZ02 PG&E A-10 A-10 A-1 or A-10 G-NR1 CZ03 PG&E A-10 A-1 or A-10 A-1 or A-10 G-NR1 CZ04 PG&E A-10 A-10 A-1 or A-10 G-NR1
CZ04-2 CPAU/PG&E E-2 E-2 E-2 G-NR1 CZ05 PG&E A-10 A-1 A-1 or A-10 G-NR1
CZ05-2 PG&E/SCG A-10 A-1 A-1 or A-10 G-10 (GN-10) CZ06 SCE/SCG TOU-GS-2 TOU-GS-2 TOU-GS-2 or TOU-GS-3 G-10 (GN-10) CZ06 LADWP/SCG TOU-GS-2 TOU-GS-2 TOU-GS-2 or TOU-GS-3 G-10 (GN-10)
CZ07 SDG&E AL-TOU+EECC
(AL-TOU) AL-TOU+EECC
(AL-TOU) AL-TOU+EECC
(AL-TOU) GN-3
CZ08 SCE/SCG TOU-GS-2 TOU-GS-2 TOU-GS-2 or TOU-GS-3 G-10 (GN-10) CZ08-2 LADWP/SCG A-2 (B) A-2 (B) A-2 (B) G-10 (GN-10) CZ09 SCE/SCG TOU-GS-2 TOU-GS-2 TOU-GS-2 or TOU-GS-3 G-10 (GN-10)
CZ09-2 LADWP/SCG A-2 (B) A-2 (B) A-2 (B) G-10 (GN-10) CZ10 SCE/SCG TOU-GS-2 TOU-GS-2 TOU-GS-2 G-10 (GN-10)
CZ10-2 SDG&E AL-TOU+EECC
(AL-TOU) AL-TOU+EECC
(AL-TOU) AL-TOU+EECC
(AL-TOU) GN-3
CZ11 PG&E A-10 A-10 A-10 G-NR1 CZ12 PG&E A-10 A-10 A-1 or A-10 G-NR1
CZ12-2 SMUD/PG&E GS GS GS G-NR1 CZ13 PG&E A-10 A-10 A-10 G-NR1 CZ14 SCE/SCG TOU-GS-3 TOU-GS-3 TOU-GS-3 G-10 (GN-10)
CZ14-2 SDG&E AL-TOU+EECC
(AL-TOU) AL-TOU+EECC
(AL-TOU) AL-TOU+EECC
(AL-TOU) GN-3
CZ15 SCE/SCG TOU-GS-3 TOU-GS-2 TOU-GS-2 G-10 (GN-10)
CZ16 PG&E A-10 A-10 A-1 or A-10 G-NR1
CZ16-2 LADWP/SCG A-2 (B) A-2 (B) A-2 (B) G-10 (GN-10)
Page 273 of 319

2019 Nonresidential New Construction Reach Code Cost Effectiveness Study
63 2019-07-25
6.5 Mixed Fuel Baseline Energy Figures Figures 47 to 49 show the annual electricity and natural gas consumption and cost, compliance TDV, and GHG emissions for each prototype under the mixed fuel design baseline.
Figure 47. Medium Office – Mixed Fuel Baseline
Climate Zone Utility
Electricity Consumption (kWh)
Natural Gas Consumption (Therms)
Electricity Cost
Natural Gas Cost
Compliance TDV
GHG Emissions (lbs)
Medium Office Mixed Fuel Baseline CZ01 PG&E 358,455 4,967 $109,507 $6,506 84 266,893 CZ02 PG&E 404,865 3,868 $130,575 $5,256 122 282,762 CZ03 PG&E 370,147 3,142 $116,478 $4,349 88 251,759 CZ04 PG&E 431,722 3,759 $140,916 $5,144 141 299,993 CZ04-2 CPAU 431,722 3,759 $75,363 $5,144 141 299,993 CZ05 PG&E 400,750 3,240 $131,277 $4,481 106 269,768 CZ05-2 SCG 400,750 3,240 $131,277 $3,683 106 269,768 CZ06 SCE 397,441 2,117 $74,516 $2,718 105 253,571 CZ06-2 LA 397,441 2,117 $44,311 $2,718 105 253,571 CZ07 SDG&E 422,130 950 $164,991 $4,429 118 257,324 CZ08 SCE 431,207 1,219 $79,181 $1,820 132 265,179 CZ08-2 LA 431,207 1,219 $46,750 $1,820 132 265,179 CZ09 SCE 456,487 1,605 $86,190 $2,196 155 287,269 CZ09-2 LA 456,487 1,605 $51,111 $2,196 155 287,269 CZ10 SDG&E 431,337 2,053 $173,713 $5,390 130 272,289 CZ10-2 SCE 431,337 2,053 $80,636 $2,603 130 272,289 CZ11 PG&E 464,676 3,062 $150,520 $4,333 163 310,307 CZ12 PG&E 441,720 3,327 $142,902 $4,647 152 299,824 CZ12-2 SMUD 441,720 3,327 $65,707 $4,647 152 299,824 CZ13 PG&E 471,540 3,063 $150,919 $4,345 161 316,228 CZ14 SDG&E 467,320 3,266 $185,812 $6,448 165 314,258 CZ14-2 SCE 467,320 3,266 $92,071 $3,579 165 314,258 CZ15 SCE 559,655 1,537 $105,388 $2,058 211 347,545 CZ16 PG&E 405,269 6,185 $127,201 $8,056 116 312,684
CZ16-2 LA 405,269 6,185 $43,115 $8,056 116 312,684
Page 274 of 319

2019 Nonresidential New Construction Reach Code Cost Effectiveness Study
64 2019-07-25
Figure 48. Medium Retail – Mixed Fuel Baseline
Climate Zone Utility
Electricity Consumption (kWh)
Natural Gas Consumption (Therms)
Electricity Cost
Natural Gas Cost
Compliance TDV
GHG Emissions (lbs)
Medium Retail Mixed Fuel Baseline CZ01 PG&E 184,234 3,893 $43,188 $5,247 155 156,972 CZ02 PG&E 214,022 2,448 $70,420 $3,572 202 157,236 CZ03 PG&E 199,827 1,868 $47,032 $2,871 165 140,558 CZ04 PG&E 208,704 1,706 $66,980 $2,681 187 143,966 CZ04-2 CPAU 208,704 1,706 $36,037 $2,681 187 143,966 CZ05 PG&E 195,864 1,746 $45,983 $2,697 155 135,849 CZ05-2 SCG 195,864 1,746 $45,983 $2,342 155 135,849 CZ06 SCE 211,123 1,002 $36,585 $1,591 183 135,557 CZ06-2 LA 211,123 1,002 $21,341 $1,591 183 135,557 CZ07 SDG&E 211,808 522 $75,486 $4,055 178 130,436 CZ08 SCE 212,141 793 $36,758 $1,373 190 133,999 CZ08-2 LA 212,141 793 $21,436 $1,373 190 133,999 CZ09 SCE 227,340 970 $40,083 $1,560 218 146,680 CZ09-2 LA 227,340 970 $23,487 $1,560 218 146,680 CZ10 SDG&E 235,465 1,262 $87,730 $4,700 228 154,572 CZ10-2 SCE 235,465 1,262 $41,000 $1,853 228 154,572 CZ11 PG&E 234,560 2,415 $76,670 $3,547 244 170,232 CZ12 PG&E 228,958 2,309 $75,084 $3,426 234 165,133 CZ12-2 SMUD 228,958 2,309 $32,300 $3,426 234 165,133 CZ13 PG&E 242,927 1,983 $81,995 $3,034 258 170,345 CZ14 SDG&E 264,589 1,672 $97,581 $5,059 277 178,507 CZ14-2 SCE 264,589 1,672 $46,217 $2,172 277 178,507 CZ15 SCE 290,060 518 $50,299 $1,083 300 179,423 CZ16 PG&E 212,204 4,304 $67,684 $5,815 197 180,630
CZ16-2 LA 212,204 4,304 $20,783 $5,815 197 180,630
Page 275 of 319
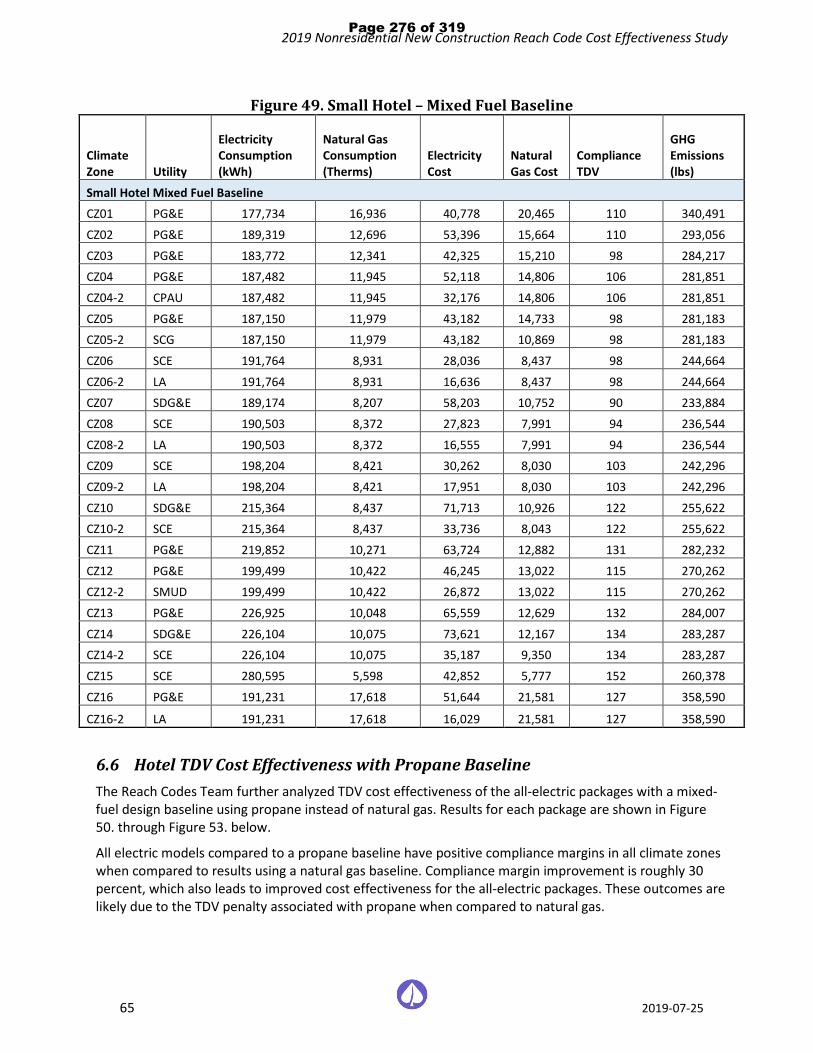
2019 Nonresidential New Construction Reach Code Cost Effectiveness Study
65 2019-07-25
Figure 49. Small Hotel – Mixed Fuel Baseline
Climate Zone Utility
Electricity Consumption (kWh)
Natural Gas Consumption (Therms)
Electricity Cost
Natural Gas Cost
Compliance TDV
GHG Emissions (lbs)
Small Hotel Mixed Fuel Baseline CZ01 PG&E 177,734 16,936 40,778 20,465 110 340,491
CZ02 PG&E 189,319 12,696 53,396 15,664 110 293,056
CZ03 PG&E 183,772 12,341 42,325 15,210 98 284,217 CZ04 PG&E 187,482 11,945 52,118 14,806 106 281,851
CZ04-2 CPAU 187,482 11,945 32,176 14,806 106 281,851
CZ05 PG&E 187,150 11,979 43,182 14,733 98 281,183 CZ05-2 SCG 187,150 11,979 43,182 10,869 98 281,183
CZ06 SCE 191,764 8,931 28,036 8,437 98 244,664
CZ06-2 LA 191,764 8,931 16,636 8,437 98 244,664 CZ07 SDG&E 189,174 8,207 58,203 10,752 90 233,884
CZ08 SCE 190,503 8,372 27,823 7,991 94 236,544
CZ08-2 LA 190,503 8,372 16,555 7,991 94 236,544 CZ09 SCE 198,204 8,421 30,262 8,030 103 242,296
CZ09-2 LA 198,204 8,421 17,951 8,030 103 242,296
CZ10 SDG&E 215,364 8,437 71,713 10,926 122 255,622 CZ10-2 SCE 215,364 8,437 33,736 8,043 122 255,622
CZ11 PG&E 219,852 10,271 63,724 12,882 131 282,232
CZ12 PG&E 199,499 10,422 46,245 13,022 115 270,262 CZ12-2 SMUD 199,499 10,422 26,872 13,022 115 270,262
CZ13 PG&E 226,925 10,048 65,559 12,629 132 284,007
CZ14 SDG&E 226,104 10,075 73,621 12,167 134 283,287 CZ14-2 SCE 226,104 10,075 35,187 9,350 134 283,287
CZ15 SCE 280,595 5,598 42,852 5,777 152 260,378
CZ16 PG&E 191,231 17,618 51,644 21,581 127 358,590
CZ16-2 LA 191,231 17,618 16,029 21,581 127 358,590
6.6 Hotel TDV Cost Effectiveness with Propane Baseline The Reach Codes Team further analyzed TDV cost effectiveness of the all-electric packages with a mixed-fuel design baseline using propane instead of natural gas. Results for each package are shown in Figure 50. through Figure 53. below.
All electric models compared to a propane baseline have positive compliance margins in all climate zones when compared to results using a natural gas baseline. Compliance margin improvement is roughly 30 percent, which also leads to improved cost effectiveness for the all-electric packages. These outcomes are likely due to the TDV penalty associated with propane when compared to natural gas.
Page 276 of 319

2019 Nonresidential New Construction Reach Code Cost Effectiveness Study
66 2019-07-25
Across packages, TDV cost effectiveness with a propane baseline follows similar trends as the natural gas baseline. Adding efficiency measures increased compliance margins by 3 to 10 percent depending on climate zone, while adding high efficiency HVAC and SHW equipment alone increased compliance margins by smaller margins of about 2 to 4 percent compared to the All-Electric package.
Figure 50. TDV Cost Effectiveness for Small Hotel, Propane Baseline – Package 2 All-Electric Federal Code Minimum
Climate Zone
Compliance
Margin (%)
Incremental Package Cost $-TDV Savings
B/C Ratio (TDV) NPV (TDV)
CZ01 -4% ($1,271,869) ($28,346) 44.9 $1,243,523 CZ02 27% ($1,272,841) $170,263 >1 $1,443,104 CZ03 -3% ($1,275,114) ($16,425) 77.6 $1,258,689 CZ04 26% ($1,274,949) $155,466 >1 $1,430,414 CZ05 27% ($1,275,002) $154,709 >1 $1,429,710 CZ06 17% ($1,275,143) $126,212 >1 $1,401,355 CZ07 25% ($1,273,490) $117,621 >1 $1,391,111 CZ08 24% ($1,271,461) $122,087 >1 $1,393,548 CZ09 23% ($1,273,259) $123,525 >1 $1,396,784 CZ10 18% ($1,270,261) $109,522 >1 $1,379,783 CZ11 19% ($1,271,070) $129,428 >1 $1,400,498 CZ12 -4% ($1,272,510) ($26,302) 48.4 $1,246,208 CZ13 18% ($1,270,882) $124,357 >1 $1,395,239 CZ14 17% ($1,271,241) $117,621 >1 $1,388,861 CZ15 -7% ($1,269,361) ($45,338) 28.0 $1,224,023 CZ16 9% ($1,275,637) $68,272 >1 $1,343,908
Page 277 of 319

2019 Nonresidential New Construction Reach Code Cost Effectiveness Study
67 2019-07-25
Figure 51. TDV Cost Effectiveness for Small Hotel, Propane Baseline – Package 3A (All-Electric + EE)
Climate Zone
Compliance Margin (%)
Incremental Package Cost $-TDV Savings
B/C Ratio (TDV) NPV (TDV)
CZ01 35% ($1,250,898) $252,831 >1 $1,503,729 CZ02 34% ($1,251,870) $217,238 >1 $1,469,108 CZ03 37% ($1,254,142) $218,642 >1 $1,472,784 CZ04 31% ($1,250,769) $191,393 >1 $1,442,162 CZ05 36% ($1,254,031) $208,773 >1 $1,462,804 CZ06 25% ($1,250,964) $159,714 >1 $1,410,677 CZ07 32% ($1,249,311) $154,111 >1 $1,403,422 CZ08 29% ($1,247,282) $146,536 >1 $1,393,818 CZ09 27% ($1,249,080) $146,671 >1 $1,395,751 CZ10 22% ($1,246,081) $134,477 >1 $1,380,559 CZ11 23% ($1,246,891) $157,138 >1 $1,404,029 CZ12 27% ($1,248,330) $167,945 >1 $1,416,276 CZ13 22% ($1,246,703) $149,270 >1 $1,395,973 CZ14 21% ($1,247,061) $145,269 >1 $1,392,331 CZ15 14% ($1,245,182) $93,647 >1 $1,338,829 CZ16 20% ($1,254,665) $154,035 >1 $1,408,701
Figure 52. TDV Cost Effectiveness for Small Hotel, Propane Baseline – Package 3B (All-Electric + EE + PV)
Climate Zone
Compliance Margin (%)
Incremental Package Cost $-TDV Savings B/C Ratio (TDV) NPV (TDV)
CZ01 35% ($1,043,528) $511,688 >1 $1,555,215 CZ02 34% ($1,044,500) $524,460 >1 $1,568,960 CZ03 37% ($1,046,772) $518,485 >1 $1,565,257 CZ04 31% ($1,043,399) $505,579 >1 $1,548,978 CZ05 36% ($1,046,660) $526,668 >1 $1,573,328 CZ06 25% ($1,043,594) $469,623 >1 $1,513,216 CZ07 32% ($1,041,941) $471,513 >1 $1,513,454 CZ08 29% ($1,039,912) $475,973 >1 $1,515,885 CZ09 27% ($1,041,710) $467,971 >1 $1,509,681 CZ10 22% ($1,038,711) $454,832 >1 $1,493,543 CZ11 23% ($1,039,521) $474,844 >1 $1,514,364 CZ12 27% ($1,040,960) $484,667 >1 $1,525,627 CZ13 22% ($1,039,333) $454,108 >1 $1,493,441 CZ14 21% ($1,039,691) $505,398 >1 $1,545,090 CZ15 14% ($1,037,811) $423,879 >1 $1,461,691 CZ16 20% ($1,047,295) $480,407 >1 $1,527,702
Page 278 of 319

2019 Nonresidential New Construction Reach Code Cost Effectiveness Study
68 2019-07-25
Figure 53. TDV Cost Effectiveness for Small Hotel, Propane Baseline – Package 3C (All Electric + HE)
Climate Zone
Compliance Margin (%)
Incremental Package Cost $-TDV Savings B/C Ratio (TDV) NPV (TDV)
CZ01 27% ($1,256,423) $194,975 >1 $1,451,398 CZ02 28% ($1,258,328) $177,378 >1 $1,435,706 CZ03 28% ($1,263,867) $164,094 >1 $1,427,961 CZ04 26% ($1,262,963) $155,314 >1 $1,418,277 CZ05 26% ($1,263,327) $153,271 >1 $1,416,598 CZ06 17% ($1,263,779) $122,011 >1 $1,385,790 CZ07 24% ($1,260,844) $116,751 >1 $1,377,594 CZ08 25% ($1,256,326) $122,995 >1 $1,379,321 CZ09 24% ($1,260,223) $128,482 >1 $1,388,706 CZ10 20% ($1,253,181) $121,595 >1 $1,374,776 CZ11 21% ($1,254,613) $143,658 >1 $1,398,271 CZ12 23% ($1,257,919) $142,901 >1 $1,400,820 CZ13 21% ($1,254,386) $138,625 >1 $1,393,011 CZ14 20% ($1,254,978) $136,430 >1 $1,391,407 CZ15 14% ($1,251,932) $96,087 >1 $1,348,019 CZ16 15% ($1,263,534) $122,011 >1 $1,385,545
Page 279 of 319

2019 Nonresidential New Construction Reach Code Cost Effectiveness Study
69 2019-07-25
6.7 PV-only and PV+Battery-only Cost Effectiveness Results Details The Reach Code Tea evaluated cost effectiveness of installing a PV system and battery storage in six different measure combinations over a 2019 code-compliant baseline for all climate zones. The baseline for all nonresidential buildings is a mixed-fuel design.
All mixed fuel models are compliant with 2019 Title24, whereas all electric models can show negative compliance. The compliance margin is the same as that of their respective federal minimum design and is not affected by addition of solar PV or battery. These scenarios evaluate the cost effectiveness of PV and/or battery measure individually. The climate zones where all-electric design is not compliant will have the flexibility to ramp up the efficiency of appliance or add another measure to be code compliant, as per package 1B and 3B in main body of the report. The large negative lifecycle costs in all electric packages are due to lower all-electric HVAC system costs and avoided natural gas infrastructure costs. This is commonly applied across all climate zones and packages over any additional costs for PV and battery.
6.7.1 Cost Effectiveness Results – Medium Office Figure 54 through Figure 61 contain the cost-effectiveness findings for the Medium Office packages. Notable findings for each package include:
♦ Mixed-Fuel + 3 kW PV Only: All packages are cost effective using the On-Bill and TDV approaches.
♦ Mixed-Fuel + 3 kW PV + 5 kWh Battery: The packages are mostly cost effective on a TDV basis except in CZ1. As compared to the 3 kW PV only package, battery reduces cost effectiveness. This package is not cost effective for LADWP and SMUD territories using an On-Bill approach.
♦ Mixed-Fuel + PV only: The packages are less cost effective as compared to 3 kW PV packages in most climate zones. In areas served by LADWP, the B/C ratio is narrowly less than 1 and not cost effective.
♦ Mixed-Fuel + PV + 50 kWh Battery: The packages are cost effective in all climate zones except for in the areas served by LADWP. On-Bill and TDV B/C ratios are slightly lower compared to the PV only package.
♦ All-Electric + 3 kW PV: Packages are on-bill cost effective in ten of sixteen climate zones. Climate zones 1,2,4,12, and 16 were not found to be cost-effective from an on-bill perspective. These zones are within PG&E’s service area. Packages are cost effective using TDV in all climate zones except CZ16.
♦ All-Electric + 3 kW PV + 5 kWh Battery: Packages are slightly more cost effective than the previous minimal PV only package. Packages are on-bill cost effective in most climate zones except for 1,2 and 16 from an on-bill perspective. These zones are within PG&E’s service area. Packages are cost effective using TDV in all climate zones except CZ16.
♦ All-Electric + PV only: All packages are cost effective and achieve savings using the On-Bill and TDV approaches.
Page 280 of 319

2019 Nonresidential New Construction Reach Code Cost Effectiveness Study
70 2019-07-25
♦ All-Electric + PV + 50 kWh Battery: All packages are cost effective and achieve savings using the On-Bill and TDV approaches. On-Bill and TDV B/C ratios are slightly lower compared to the PV only package.
Page 281 of 319

2019 Nonresidential New Construction Reach Code Cost Effectiveness Study
71 2019-07-25
Figure 54. Cost Effectiveness for Medium Office - Mixed Fuel + 3kW PV
CZ IOU territory
Elec Savings (kWh)
Gas Savings
(therms)
GHG savings (tons)
Incremental Package Cost
Lifecycle Energy Cost
Savings Lifecycle $-
TDV Savings
B/C Ratio
(On-bill)
B/C Ratio (TDV)
NPV (On-bill)
NPV (TDV)
Mixed Fuel + 3kW PV CZ01 PG&E 3,941 0 0.8 $5,566 $15,743 $8,448 2.8 1.5 $10,177 $2,882 CZ02 PG&E 4,785 0 0.9 $5,566 $20,372 $10,500 3.7 1.9 $14,806 $4,934 CZ03 PG&E 4,660 0 0.9 $5,566 $20,603 $9,975 3.7 1.8 $15,037 $4,409 CZ04 PG&E 5,056 0 1.0 $5,566 $20,235 $11,073 3.6 2.0 $14,669 $5,507 CZ04-2 CPAU 5,056 0 1.0 $5,566 $11,945 $11,073 2.1 2.0 $6,379 $5,507 CZ05 PG&E 5,027 0 1.0 $5,566 $23,159 $10,834 4.2 1.9 $17,593 $5,268 CZ06 SCE 4,853 0 0.9 $5,566 $10,968 $10,930 2.0 2.0 $5,402 $5,364 CZ06-2 LADWP 4,853 0 0.9 $5,566 $6,575 $10,930 1.2 2.0 $1,009 $5,364 CZ07 SDG&E 4,960 0 1.0 $5,566 $17,904 $11,025 3.2 2.0 $12,338 $5,459 CZ08 SCE 4,826 0 0.9 $5,566 $10,768 $11,359 1.9 2.0 $5,202 $5,793 CZ08-2 LADWP 4,826 0 0.9 $5,566 $6,503 $11,359 1.2 2.0 $937 $5,793 CZ09 SCE 4,889 0 1.0 $5,566 $10,622 $11,216 1.9 2.0 $5,056 $5,650 CZ09-2 LADWP 4,889 0 1.0 $5,566 $6,217 $11,216 1.1 2.0 $651 $5,650 CZ10 SDG&E 4,826 0 0.9 $5,566 $21,280 $10,787 3.8 1.9 $15,714 $5,221 CZ10-2 SCE 4,826 0 0.9 $5,566 $11,598 $10,787 2.1 1.9 $6,032 $5,221 CZ11 PG&E 4,701 0 0.9 $5,566 $19,869 $10,644 3.6 1.9 $14,303 $5,078 CZ12 PG&E 4,707 0 0.9 $5,566 $19,643 $10,644 3.5 1.9 $14,077 $5,078 CZ12-2 SMUD 4,707 0 0.9 $5,566 $8,005 $10,644 1.4 1.9 $2,439 $5,078 CZ13 PG&E 4,633 0 0.9 $5,566 $19,231 $10,262 3.5 1.8 $13,665 $4,696 CZ14 SDG&E 5,377 0 1.0 $5,566 $18,789 $12,600 3.4 2.3 $13,223 $7,034 CZ14-2 SCE 5,377 0 1.0 $5,566 $10,512 $12,600 1.9 2.3 $4,946 $7,034 CZ15 SCE 5,099 0 1.0 $5,566 $10,109 $11,550 1.8 2.1 $4,543 $5,984 CZ16 PG&E 5,096 0 1.0 $5,566 $21,836 $10,882 3.9 2.0 $16,270 $5,316 CZ16-2 LADWP 5,096 0 1.0 $5,566 $6,501 $10,882 1.2 2.0 $935 $5,316
Page 282 of 319

2019 Nonresidential New Construction Reach Code Cost Effectiveness Study
72 2019-07-25
Figure 55. Cost Effectiveness for Medium Office – Mixed Fuel + 3kW PV + 5 kWh Battery
CZ IOU territory
Elec Savings (kWh)
Gas Savings (therms)
GHG savings (tons)
Incremental Package Cost
Lifecycle Energy Cost
Savings $-TDV
Savings
B/C Ratio
(On-bill)
B/C Ratio (TDV)
NPV (On-bill)
NPV (TDV)
Mixed Fuel + 3kW PV + 5kWh Battery CZ01 PG&E 3,941 0 0.8 $9,520 $15,743 $8,448 1.7 0.9 $6,223 ($1,072) CZ02 PG&E 4,785 0 0.9 $9,520 $20,372 $10,500 2.1 1.1 $10,852 $980 CZ03 PG&E 4,660 0 0.9 $9,520 $20,603 $9,975 2.2 1.0 $11,083 $455 CZ04 PG&E 5,056 0 1.0 $9,520 $20,235 $11,073 2.1 1.2 $10,714 $1,553 CZ04-2 CPAU 5,056 0 1.0 $9,520 $11,945 $11,073 1.3 1.2 $2,425 $1,553 CZ05 PG&E 5,027 0 1.0 $9,520 $23,159 $10,834 2.4 1.1 $13,639 $1,314 CZ06 SCE 4,853 0 0.9 $9,520 $10,968 $10,930 1.2 1.1 $1,448 $1,410 CZ06-2 LADWP 4,853 0 0.9 $9,520 $6,575 $10,930 0.7 1.1 ($2,945) $1,410 CZ07 SDG&E 4,960 0 1.0 $9,520 $17,904 $11,025 1.9 1.2 $8,384 $1,505 CZ08 SCE 4,826 0 0.9 $9,520 $10,768 $11,359 1.1 1.2 $1,248 $1,839 CZ08-2 LADWP 4,826 0 0.9 $9,520 $6,503 $11,359 0.7 1.2 ($3,017) $1,839 CZ09 SCE 4,889 0 1.0 $9,520 $10,622 $11,216 1.1 1.2 $1,102 $1,696 CZ09-2 LADWP 4,889 0 1.0 $9,520 $6,217 $11,216 0.7 1.2 ($3,303) $1,696 CZ10 SDG&E 4,826 0 0.9 $9,520 $21,280 $10,787 2.2 1.1 $11,760 $1,267 CZ10-2 SCE 4,826 0 0.9 $9,520 $11,598 $10,787 1.2 1.1 $2,078 $1,267 CZ11 PG&E 4,701 0 0.9 $9,520 $19,869 $10,644 2.1 1.1 $10,349 $1,123 CZ12 PG&E 4,707 0 0.9 $9,520 $19,643 $10,644 2.1 1.1 $10,123 $1,123 CZ12-2 SMUD 4,707 0 0.9 $9,520 $8,005 $10,644 0.8 1.1 ($1,515) $1,123 CZ13 PG&E 4,633 0 0.9 $9,520 $19,231 $10,262 2.0 1.1 $9,711 $742 CZ14 SDG&E 5,377 0 1.0 $9,520 $18,789 $12,600 2.0 1.3 $9,269 $3,080 CZ14-2 SCE 5,377 0 1.0 $9,520 $10,512 $12,600 1.1 1.3 $992 $3,080 CZ15 SCE 5,099 0 1.0 $9,520 $10,109 $11,550 1.1 1.2 $589 $2,030 CZ16 PG&E 5,096 0 1.0 $9,520 $21,836 $10,882 2.3 1.1 $12,316 $1,362 CZ16-2 LADWP 5,096 0 1.0 $9,520 $6,501 $10,882 0.7 1.1 ($3,019) $1,362
Page 283 of 319

2019 Nonresidential New Construction Reach Code Cost Effectiveness Study
73 2019-07-25
Figure 56. Cost Effectiveness for Medium Office – Mixed Fuel + 135kW PV
CZ IOU territory
Elec Savings (kWh)
Gas Savings
(therms)
GHG savings (tons)
Incremental Package Cost
Lifecycle Energy Cost
Savings
Lifecycle TDV
Savings
B/C Ratio (On-bill)
B/C Ratio (TDV)
NPV (On-bill)
NPV (TDV)
Mixed Fuel +135kW PV CZ01 PG&E 177,340 0 34.3 $302,856 $526,352 $380,399 1.7 1.3 $223,497 $77,544 CZ02 PG&E 215,311 0 41.5 $302,856 $666,050 $471,705 2.2 1.6 $363,194 $168,849 CZ03 PG&E 209,717 0 40.7 $302,856 $645,010 $449,797 2.1 1.5 $342,154 $146,942 CZ04 PG&E 227,535 0 44.0 $302,856 $686,434 $497,431 2.3 1.6 $383,578 $194,575 CZ04-2 CPAU 227,535 0 44.0 $302,856 $537,521 $497,431 1.8 1.6 $234,665 $194,575 CZ05 PG&E 226,195 0 44.1 $302,856 $753,230 $486,596 2.5 1.6 $450,374 $183,741 CZ06 SCE 218,387 0 42.3 $302,856 $401,645 $492,515 1.3 1.6 $98,789 $189,659 CZ06-2 LADWP 218,387 0 42.3 $302,856 $233,909 $492,515 0.8 1.6 ($68,947) $189,659 CZ07 SDG&E 223,185 0 43.3 $302,856 $623,078 $496,667 2.1 1.6 $320,223 $193,811 CZ08 SCE 217,171 0 42.0 $302,856 $389,435 $510,270 1.3 1.7 $86,579 $207,414 CZ08-2 LADWP 217,171 0 42.0 $302,856 $222,066 $510,270 0.7 1.7 ($80,790) $207,414 CZ09 SCE 220,010 0 43.2 $302,856 $387,977 $505,783 1.3 1.7 $85,122 $202,928 CZ09-2 LADWP 220,010 0 43.2 $302,856 $226,516 $505,783 0.7 1.7 ($76,340) $202,928 CZ10 SDG&E 217,148 0 42.5 $302,856 $632,726 $485,451 2.1 1.6 $329,870 $182,595 CZ10-2 SCE 217,148 0 42.5 $302,856 $394,884 $485,451 1.3 1.6 $92,028 $182,595 CZ11 PG&E 211,556 0 40.9 $302,856 $671,691 $478,912 2.2 1.6 $368,835 $176,056 CZ12 PG&E 211,824 0 40.9 $302,856 $653,242 $478,101 2.2 1.6 $350,386 $175,245 CZ12-2 SMUD 211,824 0 40.9 $302,856 $345,255 $478,101 1.1 1.6 $42,399 $175,245 CZ13 PG&E 208,465 0 40.5 $302,856 $651,952 $462,732 2.2 1.5 $349,096 $159,876 CZ14 SDG&E 241,965 0 46.7 $302,856 $659,487 $566,351 2.2 1.9 $356,632 $263,496 CZ14-2 SCE 241,965 0 46.7 $302,856 $401,712 $566,351 1.3 1.9 $98,856 $263,496 CZ15 SCE 229,456 0 43.9 $302,856 $378,095 $520,102 1.2 1.7 $75,239 $217,246 CZ16 PG&E 229,317 0 44.8 $302,856 $707,095 $489,508 2.3 1.6 $404,239 $186,652 CZ16-2 LADWP 229,317 0 44.8 $302,856 $223,057 $489,508 0.7 1.6 ($79,799) $186,652
Page 284 of 319

2019 Nonresidential New Construction Reach Code Cost Effectiveness Study
74 2019-07-25
Figure 57. Cost Effectiveness for Medium Office – Mixed Fuel + 135kW PV + 50 kWh Battery
CZ IOU territory
Elec Savings (kWh)
Gas Savings
(therms)
GHG savings (tons)
Incremental Package Cost
Lifecycle Energy Cost
Savings
Lifecycle TDV
Savings
B/C Ratio (On-bill)
B/C Ratio (TDV)
NPV (On-bill)
NPV (TDV)
Mixed Fuel + 135kW PV + 50 kWh Battery CZ01 PG&E 176,903 0 35.3 $330,756 $525,948 $381,450 1.6 1.2 $195,192 $50,694 CZ02 PG&E 214,861 0 42.6 $330,756 $665,864 $472,898 2.0 1.4 $335,108 $142,142 CZ03 PG&E 209,255 0 41.8 $330,756 $644,170 $451,611 1.9 1.4 $313,414 $120,855 CZ04 PG&E 227,076 0 45.0 $330,756 $685,605 $502,108 2.1 1.5 $354,849 $171,352 CZ04-2 CPAU 227,076 0 45.0 $330,756 $536,463 $502,108 1.6 1.5 $205,707 $171,352 CZ05 PG&E 225,752 0 45.1 $330,756 $753,558 $487,742 2.3 1.5 $422,803 $156,986 CZ06 SCE 217,939 0 43.4 $330,756 $401,356 $494,042 1.2 1.5 $70,601 $163,286 CZ06-2 LADWP 217,939 0 43.4 $330,756 $233,673 $494,042 0.7 1.5 ($97,083) $163,286 CZ07 SDG&E 222,746 0 44.4 $330,756 $628,383 $498,147 1.9 1.5 $297,627 $167,391 CZ08 SCE 216,724 0 43.1 $330,756 $389,184 $511,511 1.2 1.5 $58,428 $180,755 CZ08-2 LADWP 216,724 0 43.1 $330,756 $221,839 $511,511 0.7 1.5 ($108,917) $180,755 CZ09 SCE 219,563 0 44.2 $330,756 $387,728 $506,929 1.2 1.5 $56,972 $176,173 CZ09-2 LADWP 219,563 0 44.2 $330,756 $226,303 $506,929 0.7 1.5 ($104,453) $176,173 CZ10 SDG&E 216,700 0 43.5 $330,756 $638,040 $486,644 1.9 1.5 $307,284 $155,888 CZ10-2 SCE 216,700 0 43.5 $330,756 $394,633 $486,644 1.2 1.5 $63,877 $155,888 CZ11 PG&E 211,129 0 41.9 $330,756 $670,932 $481,298 2.0 1.5 $340,177 $150,543 CZ12 PG&E 211,386 0 41.9 $330,756 $652,465 $482,826 2.0 1.5 $321,709 $152,070 CZ12-2 SMUD 211,386 0 41.9 $330,756 $344,668 $482,826 1.0 1.5 $13,913 $152,070 CZ13 PG&E 208,045 0 41.5 $330,756 $651,191 $473,280 2.0 1.4 $320,435 $142,524 CZ14 SDG&E 241,502 0 47.7 $330,756 $672,601 $569,454 2.0 1.7 $341,846 $238,698 CZ14-2 SCE 241,502 0 47.7 $330,756 $401,450 $569,454 1.2 1.7 $70,694 $238,698 CZ15 SCE 229,062 0 44.8 $330,756 $377,827 $521,963 1.1 1.6 $47,071 $191,208 CZ16 PG&E 228,825 0 45.9 $330,756 $706,201 $496,190 2.1 1.5 $375,445 $165,434 CZ16-2 LADWP 228,825 0 45.9 $330,756 $222,802 $496,190 0.7 1.5 ($107,953) $165,434
Page 285 of 319

2019 Nonresidential New Construction Reach Code Cost Effectiveness Study
75 2019-07-25
Figure 58. Cost Effectiveness for Medium Office– All-Electric + 3kW PV
CZ IOU territory
Elec Savings (kWh)
Gas Savings
(therms)
GHG savings (tons)
Incremental Package Cost
Lifecycle Energy Cost
Savings Lifecycle TDV
Savings
B/C Ratio (On-bill)
B/C Ratio (TDV) NPV (On-bill) NPV (TDV)
All-Electric + 3kW PV CZ01 PG&E -49,716 4967 10.9 ($80,523) ($84,765) ($49,972) 0.9 1.6 ($4,242) $30,551 CZ02 PG&E -44,899 3868 6.0 ($66,965) ($83,115) ($30,928) 0.8 2.2 ($16,150) $36,037 CZ03 PG&E -31,226 3142 6.5 ($75,600) ($39,441) ($19,617) 1.9 3.9 $36,159 $55,983 CZ04 PG&E -43,772 3759 5.7 ($62,282) ($70,999) ($29,496) 0.9 2.1 ($8,717) $32,786 CZ04-2 CPAU -43,772 3759 5.7 ($62,282) ($8,050) ($29,496) 7.7 2.1 $54,232 $32,786 CZ05 PG&E -35,504 3240 5.5 ($77,773) ($42,559) ($29,162) 1.8 2.7 $35,214 $48,611 CZ06 SCE -21,321 2117 4.0 ($69,422) $35,862 ($9,641) >1 7.2 $105,284 $59,781 CZ06-2 LADWP -21,321 2117 4.0 ($69,422) $32,936 ($9,641) >1 7.2 $102,358 $59,781 CZ07 SDG&E -7,943 950 1.9 ($63,595) $64,781 ($382) >1 166.6 $128,376 $63,214 CZ08 SCE -10,854 1219 2.5 ($62,043) $28,651 ($1,289) >1 48.1 $90,694 $60,755 CZ08-2 LADWP -10,854 1219 2.5 ($62,043) $25,122 ($1,289) >1 48.1 $87,165 $60,755 CZ09 SCE -14,878 1605 3.3 ($56,372) $31,542 ($3,246) >1 17.4 $87,913 $53,126 CZ09-2 LADWP -14,878 1605 3.3 ($56,372) $28,145 ($3,246) >1 17.4 $84,517 $53,126 CZ10 SDG&E -22,588 2053 3.1 ($41,171) $59,752 ($12,553) >1 3.3 $100,924 $28,619 CZ10-2 SCE -22,588 2053 3.1 ($41,171) $32,039 ($12,553) >1 3.3 $73,211 $28,619 CZ11 PG&E -35,455 3062 4.5 ($57,257) ($53,776) ($22,194) 1.1 2.6 $3,481 $35,063 CZ12 PG&E -38,704 3327 5.0 ($61,613) ($66,808) ($24,819) 0.9 2.5 ($5,195) $36,794 CZ12-2 SMUD -38,704 3327 5.0 ($61,613) $2,897 ($24,819) >1 2.5 $64,510 $36,794 CZ13 PG&E -35,016 3063 4.7 ($55,996) ($52,159) ($22,146) 1.1 2.5 $3,836 $33,849 CZ14 SDG&E -38,945 3266 4.5 ($58,426) $24,867 ($25,821) >1 2.3 $83,293 $32,605 CZ14-2 SCE -38,945 3266 4.5 ($58,426) $15,338 ($25,821) >1 2.3 $73,764 $32,605 CZ15 SCE -14,818 1537 2.8 ($29,445) $22,852 ($3,914) >1 7.5 $52,298 $25,532 CZ16 PG&E -88,966 6185 6.6 ($57,366) ($193,368) ($139,989) 0.3 0.4 ($136,002) ($82,623) CZ16-2 LADWP -88,966 6185 6.6 ($57,366) $36,354 ($139,989) >1 0.4 $93,720 ($82,623)
Page 286 of 319

2019 Nonresidential New Construction Reach Code Cost Effectiveness Study
76 2019-07-25
Figure 59. Cost Effectiveness for Medium Office – All-Electric + 3kW PV + 5 kWh Battery
CZ IOU territory
Elec Savings (kWh)
Gas Savings
(therms)
GHG savings (tons)
Incremental Package Cost
Lifecycle Energy Cost
Savings $-TDV
Savings
B/C Ratio (On-bill)
B/C Ratio (TDV)
NPV (On-bill)
NPV (TDV)
All-Electric + 3kW PV + 5 kWh Battery CZ01 PG&E -49,716 4967 10.9 ($78,897) ($84,765) ($49,972) 0.9 1.6 ($5,868) $28,925 CZ02 PG&E -44,899 3868 6.0 ($78,897) ($83,115) ($30,928) 0.9 2.6 ($4,218) $47,969 CZ03 PG&E -31,226 3142 6.5 ($78,897) ($39,441) ($19,617) 2.0 4.0 $39,456 $59,280 CZ04 PG&E -43,772 3759 5.7 ($78,897) ($70,999) ($29,496) 1.1 2.7 $7,898 $49,400 CZ04-2 CPAU -43,772 3759 5.7 ($78,897) ($8,050) ($29,496) 9.8 2.7 $70,847 $49,400 CZ05 PG&E -35,504 3240 5.5 ($78,897) ($42,559) ($29,162) 1.9 2.7 $36,338 $49,735 CZ06 SCE -21,321 2117 4.0 ($78,897) $35,862 ($9,641) >1 8.2 $114,759 $69,256 CZ06-2 LADWP -21,321 2117 4.0 ($78,897) $32,936 ($9,641) >1 8.2 $111,833 $69,256 CZ07 SDG&E -7,943 950 1.9 ($78,897) $64,781 ($382) >1 206.6 $143,678 $78,515 CZ08 SCE -10,854 1219 2.5 ($78,897) $28,651 ($1,289) >1 61.2 $107,548 $77,608 CZ08-2 LADWP -10,854 1219 2.5 ($78,897) $25,122 ($1,289) >1 61.2 $104,019 $77,608 CZ09 SCE -14,878 1605 3.3 ($78,897) $31,542 ($3,246) >1 24.3 $110,439 $75,651 CZ09-2 LADWP -14,878 1605 3.3 ($78,897) $28,145 ($3,246) >1 24.3 $107,042 $75,651 CZ10 SDG&E -22,588 2053 3.1 ($78,897) $59,752 ($12,553) >1 6.3 $138,649 $66,344 CZ10-2 SCE -22,588 2053 3.1 ($78,897) $32,039 ($12,553) >1 6.3 $110,936 $66,344 CZ11 PG&E -35,455 3062 4.5 ($78,897) ($53,776) ($22,194) 1.5 3.6 $25,121 $56,703 CZ12 PG&E -38,704 3327 5.0 ($78,897) ($66,808) ($24,819) 1.2 3.2 $12,089 $54,078 CZ12-2 SMUD -38,704 3327 5.0 ($78,897) $2,897 ($24,819) >1 3.2 $81,794 $54,078 CZ13 PG&E -35,016 3063 4.7 ($78,897) ($52,159) ($22,146) 1.5 3.6 $26,738 $56,751 CZ14 SDG&E -38,945 3266 4.5 ($78,897) $24,867 ($25,821) >1 3.1 $103,764 $53,076 CZ14-2 SCE -38,945 3266 4.5 ($78,897) $15,338 ($25,821) >1 3.1 $94,235 $53,076 CZ15 SCE -14,818 1537 2.8 ($78,897) $22,852 ($3,914) >1 20.2 $101,749 $74,983 CZ16 PG&E -88,966 6185 6.6 ($78,897) ($193,368) ($139,989) 0.4 0.6 ($114,472) ($61,092) CZ16-2 LADWP -88,966 6185 6.6 ($78,897) $36,354 ($139,989) >1 0.6 $115,250 ($61,092)
Page 287 of 319

2019 Nonresidential New Construction Reach Code Cost Effectiveness Study
77 2019-07-25
Figure 60. Cost Effectiveness for Medium Office – All-Electric + 135kW PV
CZ IOU territory
Elec Savings (kWh)
Gas Savings
(therms)
GHG savings (tons)
Incremental Package Cost
Lifecycle Energy Cost
Savings
Lifecycle TDV
Savings
B/C Ratio (On-bill)
B/C Ratio (TDV)
NPV (On-bill)
NPV (TDV)
All-Electric + 135kW PV CZ01 PG&E 123,683 4967 44.5 $163,217 $405,731 $321,979 2.5 2.0 $242,514 $158,762 CZ02 PG&E 165,627 3868 46.6 $176,775 $562,528 $430,276 3.2 2.4 $385,753 $253,501 CZ03 PG&E 173,831 3142 46.3 $168,140 $575,864 $420,205 3.4 2.5 $407,725 $252,066 CZ04 PG&E 178,706 3759 48.7 $181,458 $601,431 $456,861 3.3 2.5 $419,973 $275,403 CZ04-2 CPAU 178,706 3759 48.7 $181,458 $517,526 $456,861 2.9 2.5 $336,069 $275,403 CZ05 PG&E 185,664 3240 48.6 $165,967 $664,842 $446,600 4.0 2.7 $498,875 $280,633 CZ06 SCE 192,214 2117 45.3 $174,317 $423,657 $471,944 2.4 2.7 $249,340 $297,626 CZ06-2 LADWP 192,214 2117 45.3 $174,317 $259,270 $471,944 1.5 2.7 $84,953 $297,626 CZ07 SDG&E 210,282 950 44.3 $180,145 $669,979 $485,260 3.7 2.7 $489,834 $305,115 CZ08 SCE 201,491 1219 43.5 $181,696 $407,277 $497,622 2.2 2.7 $225,580 $315,925 CZ08-2 LADWP 201,491 1219 43.5 $181,696 $240,657 $497,622 1.3 2.7 $58,960 $315,925 CZ09 SCE 200,242 1605 45.6 $187,368 $408,922 $491,322 2.2 2.6 $221,554 $303,953 CZ09-2 LADWP 200,242 1605 45.6 $187,368 $248,452 $491,322 1.3 2.6 $61,084 $303,953 CZ10 SDG&E 189,734 2053 44.7 $202,568 $667,551 $462,111 3.3 2.3 $464,982 $259,543 CZ10-2 SCE 189,734 2053 44.7 $202,568 $412,659 $462,111 2.0 2.3 $210,091 $259,543 CZ11 PG&E 171,399 3062 44.5 $186,483 $597,807 $446,074 3.2 2.4 $411,324 $259,592 CZ12 PG&E 168,413 3327 45.0 $182,127 $571,758 $442,638 3.1 2.4 $389,632 $260,511 CZ12-2 SMUD 168,413 3327 45.0 $182,127 $343,602 $442,638 1.9 2.4 $161,475 $260,511 CZ13 PG&E 168,817 3063 44.3 $187,744 $581,964 $430,324 3.1 2.3 $394,220 $242,580 CZ14 SDG&E 197,643 3266 50.1 $185,314 $667,762 $527,930 3.6 2.8 $482,449 $342,616 CZ14-2 SCE 197,643 3266 50.1 $185,314 $408,424 $527,930 2.2 2.8 $223,110 $342,616 CZ15 SCE 209,539 1537 45.7 $214,294 $390,267 $504,638 1.8 2.4 $175,972 $290,343 CZ16 PG&E 135,255 6185 50.4 $186,374 $470,199 $338,637 2.5 1.8 $283,825 $152,263 CZ16-2 LADWP 135,255 6185 50.4 $186,374 $250,807 $338,637 1.3 1.8 $64,433 $152,263
Page 288 of 319

2019 Nonresidential New Construction Reach Code Cost Effectiveness Study
78 2019-07-25
Figure 61. Cost Effectiveness for Medium Office – All-Electric + 135kW PV + 50 kWh Battery
CZ IOU territory
Elec Savings (kWh)
Gas Savings
(therms)
GHG savings (tons)
Incremental Package Cost
Lifecycle Energy Cost
Savings
Lifecycle TDV
Savings
B/C Ratio (On-bill)
B/C Ratio (TDV)
NPV (On-bill)
NPV (TDV)
All-Electric + 135kW PV + 50 kWh Battery CZ01 PG&E 123,280 4967 45.4 $191,117 $404,994 $323,077 2.1 1.7 $213,877 $131,960 CZ02 PG&E 165,200 3868 47.7 $204,675 $561,747 $431,469 2.7 2.1 $357,072 $226,795 CZ03 PG&E 173,384 3142 47.4 $196,040 $575,043 $422,019 2.9 2.2 $379,003 $225,979 CZ04 PG&E 178,259 3759 49.8 $209,358 $600,621 $461,634 2.9 2.2 $391,263 $252,276 CZ04-2 CPAU 178,259 3759 49.8 $209,358 $516,495 $461,634 2.5 2.2 $307,137 $252,276 CZ05 PG&E 185,229 3240 49.7 $193,867 $664,046 $447,793 3.4 2.3 $470,179 $253,926 CZ06 SCE 191,767 2117 46.5 $202,217 $423,369 $473,519 2.1 2.3 $221,152 $271,301 CZ06-2 LADWP 191,767 2117 46.5 $202,217 $259,033 $473,519 1.3 2.3 $56,816 $271,301 CZ07 SDG&E 209,848 950 45.4 $208,045 $675,307 $486,787 3.2 2.3 $467,262 $278,743 CZ08 SCE 201,047 1219 44.7 $209,596 $407,027 $498,910 1.9 2.4 $197,430 $289,314 CZ08-2 LADWP 201,047 1219 44.7 $209,596 $240,432 $498,910 1.1 2.4 $30,835 $289,314 CZ09 SCE 199,802 1605 46.6 $215,268 $408,676 $492,515 1.9 2.3 $193,408 $277,246 CZ09-2 LADWP 199,802 1605 46.6 $215,268 $248,242 $492,515 1.2 2.3 $32,974 $277,246 CZ10 SDG&E 189,293 2053 45.7 $230,468 $672,867 $463,352 2.9 2.0 $442,399 $232,884 CZ10-2 SCE 189,293 2053 45.7 $230,468 $412,412 $463,352 1.8 2.0 $181,944 $232,884 CZ11 PG&E 170,987 3062 45.5 $214,383 $597,062 $448,509 2.8 2.1 $382,680 $234,126 CZ12 PG&E 167,995 3327 46.0 $210,027 $571,002 $447,411 2.7 2.1 $360,975 $237,384 CZ12-2 SMUD 167,995 3327 46.0 $210,027 $343,043 $447,411 1.6 2.1 $133,017 $237,384 CZ13 PG&E 168,408 3063 45.3 $215,644 $581,225 $440,920 2.7 2.0 $365,580 $225,275 CZ14 SDG&E 197,188 3266 51.2 $213,214 $680,893 $531,080 3.2 2.5 $467,679 $317,866 CZ14-2 SCE 197,188 3266 51.2 $213,214 $408,166 $531,080 1.9 2.5 $194,952 $317,866 CZ15 SCE 209,148 1537 46.6 $242,194 $390,000 $506,499 1.6 2.1 $147,806 $264,305 CZ16 PG&E 134,809 6185 51.4 $214,274 $469,378 $341,978 2.2 1.6 $255,105 $127,704 CZ16-2 LADWP 134,809 6185 51.4 $214,274 $250,580 $341,978 1.2 1.6 $36,306 $127,704
Page 289 of 319

2019 Nonresidential New Construction Reach Code Cost Effectiveness Study
79 2019-07-25
6.7.2 Cost Effectiveness Results – Medium Retail Figure 62 through Figure 69 contain the cost-effectiveness findings for the Medium Retail packages. Notable findings for each package include:
♦ Mixed-Fuel + 3 kW PV: Packages are cost effective and achieve savings for all climate zones using the On-Bill and TDV approaches.
♦ Mixed-Fuel + 3 kW PV + 5 kWh Battery: The packages are less cost effective as compared to the 3 kW PV only package and not cost effective for LADWP and SMUD service area.
♦ Mixed-Fuel + PV only: Packages achieve positive energy cost savings and are cost effective using the On-Bill approach for all climate zones except for LADWP territory (CZs 6, 8, 9 and 16). Packages achieve positive savings and are cost effective using the TDV approach for all climate zones.
♦ Mixed Fuel + PV + 5 kWh Battery: Adding battery slightly reduces On-Bill B/C ratios but is still cost effective for all climate zones except for LADWP territory. Packages achieve savings and cost effective using the TDV approach for all climate zones.
♦ All-Electric + 3 kW PV: Packages are cost effective using the On-Bill and TDV approach for all climate zones except for CZ16 under PG&E service.
♦ All-Electric + 3 kW PV + 5 kWh Battery: Similar to minimal PV only package, adding battery is cost effective as well using the On-Bill and TDV approach for all climate zones except for CZ16 under PG&E service.
♦ All-Electric + PV only: Packages are cost effective and achieve savings in all climate zones for both the On-Bill and TDV approaches
♦ All-Electric + PV + 50 kWh Battery: Adding battery slightly reduces B/C ratios for both the On-Bill and TDV approaches. Packages are not cost effective for all climate zones except CZ6, CZ8 and CZ9 under LADWP service area.
Page 290 of 319
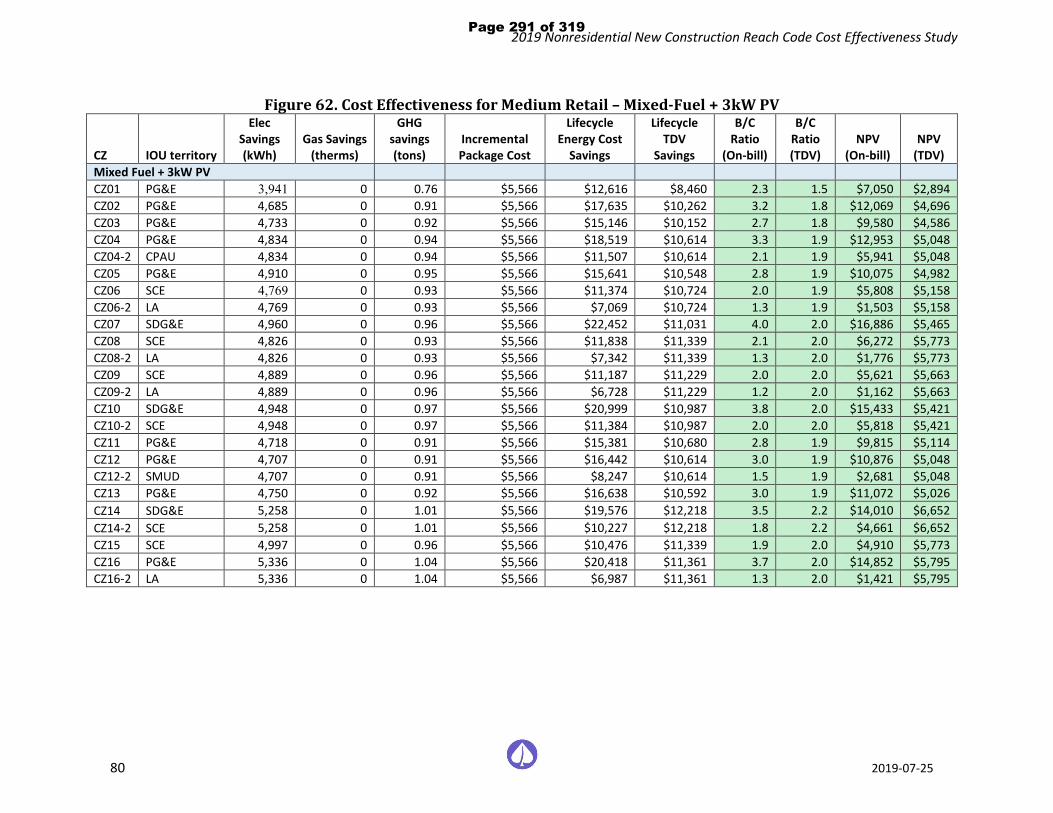
2019 Nonresidential New Construction Reach Code Cost Effectiveness Study
80 2019-07-25
Figure 62. Cost Effectiveness for Medium Retail – Mixed-Fuel + 3kW PV
CZ IOU territory
Elec Savings (kWh)
Gas Savings (therms)
GHG savings (tons)
Incremental Package Cost
Lifecycle Energy Cost
Savings
Lifecycle TDV
Savings
B/C Ratio
(On-bill)
B/C Ratio (TDV)
NPV (On-bill)
NPV (TDV)
Mixed Fuel + 3kW PV CZ01 PG&E 3,941 0 0.76 $5,566 $12,616 $8,460 2.3 1.5 $7,050 $2,894 CZ02 PG&E 4,685 0 0.91 $5,566 $17,635 $10,262 3.2 1.8 $12,069 $4,696 CZ03 PG&E 4,733 0 0.92 $5,566 $15,146 $10,152 2.7 1.8 $9,580 $4,586 CZ04 PG&E 4,834 0 0.94 $5,566 $18,519 $10,614 3.3 1.9 $12,953 $5,048 CZ04-2 CPAU 4,834 0 0.94 $5,566 $11,507 $10,614 2.1 1.9 $5,941 $5,048 CZ05 PG&E 4,910 0 0.95 $5,566 $15,641 $10,548 2.8 1.9 $10,075 $4,982 CZ06 SCE 4,769 0 0.93 $5,566 $11,374 $10,724 2.0 1.9 $5,808 $5,158 CZ06-2 LA 4,769 0 0.93 $5,566 $7,069 $10,724 1.3 1.9 $1,503 $5,158 CZ07 SDG&E 4,960 0 0.96 $5,566 $22,452 $11,031 4.0 2.0 $16,886 $5,465 CZ08 SCE 4,826 0 0.93 $5,566 $11,838 $11,339 2.1 2.0 $6,272 $5,773 CZ08-2 LA 4,826 0 0.93 $5,566 $7,342 $11,339 1.3 2.0 $1,776 $5,773 CZ09 SCE 4,889 0 0.96 $5,566 $11,187 $11,229 2.0 2.0 $5,621 $5,663 CZ09-2 LA 4,889 0 0.96 $5,566 $6,728 $11,229 1.2 2.0 $1,162 $5,663 CZ10 SDG&E 4,948 0 0.97 $5,566 $20,999 $10,987 3.8 2.0 $15,433 $5,421 CZ10-2 SCE 4,948 0 0.97 $5,566 $11,384 $10,987 2.0 2.0 $5,818 $5,421 CZ11 PG&E 4,718 0 0.91 $5,566 $15,381 $10,680 2.8 1.9 $9,815 $5,114 CZ12 PG&E 4,707 0 0.91 $5,566 $16,442 $10,614 3.0 1.9 $10,876 $5,048 CZ12-2 SMUD 4,707 0 0.91 $5,566 $8,247 $10,614 1.5 1.9 $2,681 $5,048 CZ13 PG&E 4,750 0 0.92 $5,566 $16,638 $10,592 3.0 1.9 $11,072 $5,026 CZ14 SDG&E 5,258 0 1.01 $5,566 $19,576 $12,218 3.5 2.2 $14,010 $6,652 CZ14-2 SCE 5,258 0 1.01 $5,566 $10,227 $12,218 1.8 2.2 $4,661 $6,652 CZ15 SCE 4,997 0 0.96 $5,566 $10,476 $11,339 1.9 2.0 $4,910 $5,773 CZ16 PG&E 5,336 0 1.04 $5,566 $20,418 $11,361 3.7 2.0 $14,852 $5,795 CZ16-2 LA 5,336 0 1.04 $5,566 $6,987 $11,361 1.3 2.0 $1,421 $5,795
Page 291 of 319

2019 Nonresidential New Construction Reach Code Cost Effectiveness Study
81 2019-07-25
Figure 63. Cost Effectiveness for Medium Retail – Mixed Fuel + 3kW PV + 5 kWh Battery
CZ IOU territory
Elec Savings (kWh)
Gas Savings (therms)
GHG savings (tons)
Incremental Package Cost
Lifecycle Energy Cost
Savings $-TDV
Savings
B/C Ratio
(On-bill)
B/C Ratio (TDV)
NPV (On-bill)
NPV (TDV)
Mixed Fuel + 3kW PV + 5 kWh Battery CZ01 PG&E 3,941 0 0.76 $9,520 $12,616 $8,460 1.3 0.9 $3,096 ($1,060) CZ02 PG&E 4,685 0 0.91 $9,520 $17,635 $10,262 1.9 1.1 $8,115 $742 CZ03 PG&E 4,733 0 0.92 $9,520 $15,146 $10,152 1.6 1.1 $5,626 $632 CZ04 PG&E 4,834 0 0.94 $9,520 $18,519 $10,614 1.9 1.1 $8,999 $1,094 CZ04-2 CPAU 4,834 0 0.94 $9,520 $11,507 $10,614 1.2 1.1 $1,987 $1,094 CZ05 PG&E 4,910 0 0.95 $9,520 $15,641 $10,548 1.6 1.1 $6,120 $1,028 CZ05-2 SCG 4,910 0 0.95 $9,520 $15,641 $10,548 1.6 1.1 $6,120 $1,028 CZ06 SCE 4,769 0 0.93 $9,520 $11,374 $10,724 1.2 1.1 $1,854 $1,204 CZ06-2 LA 4,769 0 0.93 $9,520 $7,069 $10,724 0.7 1.1 ($2,452) $1,204 CZ07 SDG&E 4,960 0 0.96 $9,520 $22,452 $11,031 2.4 1.2 $12,932 $1,511 CZ08 SCE 4,826 0 0.93 $9,520 $11,838 $11,339 1.2 1.2 $2,317 $1,819 CZ08-2 LA 4,826 0 0.93 $9,520 $7,342 $11,339 0.8 1.2 ($2,178) $1,819 CZ09 SCE 4,889 0 0.96 $9,520 $11,187 $11,229 1.2 1.2 $1,667 $1,709 CZ09-2 LA 4,889 0 0.96 $9,520 $6,728 $11,229 0.7 1.2 ($2,792) $1,709 CZ10 SDG&E 4,948 0 0.97 $9,520 $20,999 $10,987 2.2 1.2 $11,479 $1,467 CZ10-2 SCE 4,948 0 0.97 $9,520 $11,384 $10,987 1.2 1.2 $1,863 $1,467 CZ11 PG&E 4,718 0 0.91 $9,520 $15,381 $10,680 1.6 1.1 $5,861 $1,160 CZ12 PG&E 4,707 0 0.91 $9,520 $16,442 $10,614 1.7 1.1 $6,922 $1,094 CZ12-2 SMUD 4,707 0 0.91 $9,520 $8,247 $10,614 0.9 1.1 ($1,273) $1,094 CZ13 PG&E 4,750 0 0.92 $9,520 $16,638 $10,592 1.7 1.1 $7,117 $1,072 CZ14 SDG&E 5,258 0 1.01 $9,520 $19,576 $12,218 2.1 1.3 $10,056 $2,698 CZ14-2 SCE 5,258 0 1.01 $9,520 $10,227 $12,218 1.1 1.3 $707 $2,698 CZ15 SCE 4,997 0 0.96 $9,520 $10,476 $11,339 1.1 1.2 $956 $1,819 CZ16 PG&E 5,336 0 1.04 $9,520 $20,418 $11,361 2.1 1.2 $10,898 $1,841 CZ16-2 LA 5,336 0 1.04 $9,520 $6,987 $11,361 0.7 1.2 ($2,533) $1,841
Page 292 of 319

2019 Nonresidential New Construction Reach Code Cost Effectiveness Study
82 2019-07-25
Figure 64. Cost Effectiveness for Medium Retail – Mixed-Fuel + 110kW PV
CZ IOU territory
Elec Savings (kWh)
Gas Savings
(therms)
GHG savings (tons)
Incremental Package Cost
Lifecycle Energy Cost
Savings
Lifecycle TDV
Savings
B/C Ratio
(On-bill)
B/C Ratio (TDV)
NPV (On-bill)
NPV (TDV)
Mixed Fuel + 110kW PV CZ01 PG&E 144,499 0 27.97 $201,904 $454,462 $309,935 2.3 1.5 $252,558 $108,031 CZ02 PG&E 171,790 0 33.31 $201,904 $477,584 $376,300 2.4 1.9 $275,681 $174,396 CZ03 PG&E 173,534 0 33.55 $201,904 $538,530 $372,146 2.7 1.8 $336,626 $170,243 CZ04 PG&E 177,229 0 34.42 $201,904 $489,934 $389,067 2.4 1.9 $288,030 $187,163 CZ04-2 CPAU 177,229 0 34.42 $201,904 $418,173 $389,067 2.1 1.9 $216,269 $187,163 CZ05 PG&E 180,044 0 34.84 $201,904 $556,787 $386,958 2.8 1.9 $354,883 $185,054 CZ06 SCE 174,855 0 33.92 $201,904 $288,188 $393,198 1.4 1.9 $86,284 $191,295 CZ06-2 LA 174,855 0 33.92 $201,904 $165,538 $393,198 0.8 1.9 ($36,366) $191,295 CZ07 SDG&E 181,854 0 35.32 $201,904 $373,974 $404,713 1.9 2.0 $172,070 $202,809 CZ08 SCE 176,954 0 34.23 $201,904 $284,481 $415,789 1.4 2.1 $82,577 $213,885 CZ08-2 LA 176,954 0 34.23 $201,904 $161,366 $415,789 0.8 2.1 ($40,538) $213,885 CZ09 SCE 179,267 0 35.18 $201,904 $289,050 $412,097 1.4 2.0 $87,146 $210,193 CZ09-2 LA 179,267 0 35.18 $201,904 $168,822 $412,097 0.8 2.0 ($33,082) $210,193 CZ10 SDG&E 181,443 0 35.41 $201,904 $410,310 $402,999 2.0 2.0 $208,406 $201,095 CZ10-2 SCE 181,443 0 35.41 $201,904 $291,236 $402,999 1.4 2.0 $89,332 $201,095 CZ11 PG&E 172,983 0 33.46 $201,904 $464,776 $391,550 2.3 1.9 $262,872 $189,646 CZ12 PG&E 172,597 0 33.33 $201,904 $467,870 $389,573 2.3 1.9 $265,966 $187,669 CZ12-2 SMUD 172,597 0 33.33 $201,904 $267,086 $389,573 1.3 1.9 $65,182 $187,669 CZ13 PG&E 174,151 0 33.81 $201,904 $478,857 $387,968 2.4 1.9 $276,953 $186,065 CZ14 SDG&E 192,789 0 36.97 $201,904 $396,181 $448,268 2.0 2.2 $194,277 $246,364 CZ14-2 SCE 192,789 0 36.97 $201,904 $288,782 $448,268 1.4 2.2 $86,878 $246,364 CZ15 SCE 183,214 0 35.12 $201,904 $277,867 $415,789 1.4 2.1 $75,963 $213,885 CZ16 PG&E 195,665 0 37.97 $201,904 $522,352 $416,558 2.6 2.1 $320,448 $214,654 CZ16-2 LA 195,665 0 37.97 $201,904 $171,802 $416,558 0.9 2.1 ($30,101) $214,654
Page 293 of 319

2019 Nonresidential New Construction Reach Code Cost Effectiveness Study
83 2019-07-25
Figure 65. Cost Effectiveness for Medium Retail – Mixed-Fuel + 110 kW PV + 50 kWh Battery
CZ IOU territory
Elec Savings (kWh)
Gas Savings
(therms)
GHG savings (tons)
Incremental Package Cost
Lifecycle Energy Cost
Savings
Lifecycle TDV
Savings
B/C Ratio
(On-bill)
B/C Ratio (TDV)
NPV (On-bill)
NPV (TDV)
Mixed Fuel + 110kW PV + 50 kWh Battery CZ01 PG&E 143,423 0 29.48 $229,804 $452,119 $324,373 2.0 1.4 $222,315 $94,569 CZ02 PG&E 170,542 0 35.14 $229,804 $486,704 $398,363 2.1 1.7 $256,900 $168,559 CZ03 PG&E 172,266 0 35.66 $229,804 $535,974 $395,374 2.3 1.7 $306,170 $165,570 CZ04 PG&E 175,940 0 36.32 $229,804 $525,788 $422,579 2.3 1.8 $295,984 $192,775 CZ04-2 CPAU 175,940 0 36.32 $229,804 $416,019 $422,579 1.8 1.8 $186,216 $192,775 CZ05 PG&E 178,728 0 36.91 $229,804 $554,968 $409,086 2.4 1.8 $325,164 $179,283 CZ06 SCE 173,567 0 35.99 $229,804 $290,599 $412,690 1.3 1.8 $60,795 $182,886 CZ06-2 LA 173,567 0 35.99 $229,804 $169,786 $412,690 0.7 1.8 ($60,018) $182,886 CZ07 SDG&E 180,508 0 37.61 $229,804 $425,793 $427,040 1.9 1.9 $195,989 $197,236 CZ08 SCE 175,616 0 36.29 $229,804 $296,318 $434,687 1.3 1.9 $66,514 $204,883 CZ08-2 LA 175,616 0 36.29 $229,804 $170,489 $434,687 0.7 1.9 ($59,315) $204,883 CZ09 SCE 177,966 0 36.74 $229,804 $300,540 $421,195 1.3 1.8 $70,736 $191,391 CZ09-2 LA 177,966 0 36.74 $229,804 $178,852 $421,195 0.8 1.8 ($50,952) $191,391 CZ10 SDG&E 180,248 0 36.91 $229,804 $459,486 $410,537 2.0 1.8 $229,683 $180,733 CZ10-2 SCE 180,248 0 36.91 $229,804 $301,219 $410,537 1.3 1.8 $71,415 $180,733 CZ11 PG&E 171,779 0 34.85 $229,804 $490,245 $417,679 2.1 1.8 $260,442 $187,875 CZ12 PG&E 171,392 0 34.77 $229,804 $497,363 $417,371 2.2 1.8 $267,559 $187,567 CZ12-2 SMUD 171,392 0 34.77 $229,804 $273,783 $417,371 1.2 1.8 $43,979 $187,567 CZ13 PG&E 173,052 0 34.97 $229,804 $488,196 $397,791 2.1 1.7 $258,392 $167,987 CZ14 SDG&E 191,703 0 38.31 $229,804 $420,241 $452,641 1.8 2.0 $190,437 $222,837 CZ14-2 SCE 191,703 0 38.31 $229,804 $294,010 $452,641 1.3 2.0 $64,206 $222,837 CZ15 SCE 182,299 0 36.01 $229,804 $279,036 $416,382 1.2 1.8 $49,232 $186,578 CZ16 PG&E 194,293 0 40.00 $229,804 $535,137 $432,951 2.3 1.9 $305,333 $203,147 CZ16-2 LA 194,293 0 40.00 $229,804 $175,573 $432,951 0.8 1.9 ($54,231) $203,147
Page 294 of 319

2019 Nonresidential New Construction Reach Code Cost Effectiveness Study
84 2019-07-25
Figure 66. Cost Effectiveness for Medium Retail – All-Electric + 3kW PV
CZ IOU territory
Elec Savings (kWh)
Gas Savings
(therms)
GHG savings (tons)
Incremental Package Cost
Lifecycle Energy Cost
Savings
Lifecycle TDV
Savings
B/C Ratio (On-bill)
B/C Ratio (TDV)
NPV (On-bill)
NPV (TDV)
All-Electric + 3kW PV CZ01 PG&E -25,214 3893 14.61 ($16,318) $4,288 ($5,450) >1 3.0 $20,606 $10,868 CZ02 PG&E -17,101 2448 8.40 ($20,734) $859 $5,779 >1 >1 $21,593 $26,513 CZ03 PG&E -9,851 1868 7.18 ($17,381) $15,418 $8,702 >1 >1 $32,799 $26,083 CZ04 PG&E -9,353 1706 6.24 ($16,166) $9,110 $10,394 >1 >1 $25,276 $26,560 CZ04-2 CPAU -9,353 1706 6.24 ($16,166) $24,000 $10,394 >1 >1 $40,166 $26,560 CZ05 PG&E -9,423 1746 6.42 ($18,776) $14,076 $6,351 >1 >1 $32,852 $25,127 CZ06 SCE -2,759 1002 4.24 ($15,032) $29,710 $12,592 >1 >1 $44,741 $27,623 CZ06-2 LA -2,759 1002 4.24 ($15,032) $26,292 $12,592 >1 >1 $41,324 $27,623 CZ07 SDG&E 1,148 522 2.72 ($17,032) $76,810 $12,350 >1 >1 $93,842 $29,382 CZ08 SCE -979 793 3.64 ($20,192) $28,576 $13,185 >1 >1 $48,768 $33,377 CZ08-2 LA -979 793 3.64 ($20,192) $24,475 $13,185 >1 >1 $44,667 $33,377 CZ09 SCE -2,352 970 4.28 ($25,383) $29,776 $13,207 >1 >1 $55,159 $38,590 CZ09-2 LA -2,352 970 4.28 ($25,383) $25,823 $13,207 >1 >1 $51,207 $38,590 CZ10 SDG&E -5,388 1262 4.95 ($20,541) $75,458 $11,493 >1 >1 $95,999 $32,034 CZ10-2 SCE -5,388 1262 4.95 ($20,541) $32,394 $11,493 >1 >1 $52,936 $32,034 CZ11 PG&E -14,533 2415 8.86 ($25,471) $7,618 $13,295 >1 >1 $33,090 $38,766 CZ12 PG&E -14,764 2309 8.19 ($25,774) $2,210 $10,152 >1 >1 $27,984 $35,926 CZ12-2 SMUD -14,764 2309 8.19 ($25,774) $21,215 $10,152 >1 >1 $46,988 $35,926 CZ13 PG&E -12,069 1983 7.08 ($21,428) $5,647 $8,570 >1 >1 $27,075 $29,998 CZ14 SDG&E -7,950 1672 6.45 ($19,926) $60,412 $16,679 >1 >1 $80,338 $36,605 CZ14-2 SCE -7,950 1672 6.45 ($19,926) $28,631 $16,679 >1 >1 $48,557 $36,605 CZ15 SCE 2,534 518 3.10 ($22,813) $27,271 $17,162 >1 >1 $50,084 $39,976 CZ16 PG&E -36,081 4304 14.26 ($19,041) ($30,111) ($41,181) 0.6 0.5 ($11,070) ($22,140) CZ16-2 LA -36,081 4304 14.26 ($19,041) $45,706 ($41,181) >1 0.5 $64,747 ($22,140)
Page 295 of 319

2019 Nonresidential New Construction Reach Code Cost Effectiveness Study
85 2019-07-25
Figure 67. Cost Effectiveness for Medium Retail – All-Electric + 3kW PV + 5 kWh Battery
CZ IOU territory
Elec Savings (kWh)
Gas Savings
(therms)
GHG savings (tons)
Incremental Package Cost
Lifecycle Energy Cost
Savings $-TDV
Savings
B/C Ratio (On-bill)
B/C Ratio (TDV)
NPV (On-bill)
NPV (TDV)
All-Electric + 3kW PV + 5 kWh Battery CZ01 PG&E -25,214 3893 14.61 ($14,692) $4,288 ($5,450) >1 2.7 $18,980 $9,242 CZ02 PG&E -17,101 2448 8.40 ($14,692) $859 $5,779 >1 >1 $15,551 $20,472 CZ03 PG&E -9,851 1868 7.18 ($14,692) $15,418 $8,702 >1 >1 $30,110 $23,394 CZ04 PG&E -9,353 1706 6.24 ($14,692) $9,110 $10,394 >1 >1 $23,802 $25,086 CZ04-2 CPAU -9,353 1706 6.24 ($14,692) $24,000 $10,394 >1 >1 $38,693 $25,086 CZ05 PG&E -9,423 1746 6.42 ($14,692) $14,076 $6,351 >1 >1 $28,768 $21,043 CZ06 SCE -2,759 1002 4.24 ($14,692) $29,710 $12,592 >1 >1 $44,402 $27,284 CZ06-2 LA -2,759 1002 4.24 ($14,692) $26,292 $12,592 >1 >1 $40,984 $27,284 CZ07 SDG&E 1,148 522 2.72 ($14,692) $76,810 $12,350 >1 >1 $91,502 $27,042 CZ08 SCE -979 793 3.64 ($14,692) $28,576 $13,185 >1 >1 $43,268 $27,877 CZ08-2 LA -979 793 3.64 ($14,692) $24,475 $13,185 >1 >1 $39,167 $27,877 CZ09 SCE -2,352 970 4.28 ($14,692) $29,776 $13,207 >1 >1 $44,468 $27,899 CZ09-2 LA -2,352 970 4.28 ($14,692) $25,823 $13,207 >1 >1 $40,516 $27,899 CZ10 SDG&E -5,388 1262 4.95 ($14,692) $75,458 $11,493 >1 >1 $90,150 $26,185 CZ10-2 SCE -5,388 1262 4.95 ($14,692) $32,394 $11,493 >1 >1 $47,086 $26,185 CZ11 PG&E -14,533 2415 8.86 ($14,692) $7,618 $13,295 >1 >1 $22,310 $27,987 CZ12 PG&E -14,764 2309 8.19 ($14,692) $2,210 $10,152 >1 >1 $16,902 $24,845 CZ12-2 SMUD -14,764 2309 8.19 ($14,692) $21,215 $10,152 >1 >1 $35,907 $24,845 CZ13 PG&E -12,069 1983 7.08 ($14,692) $5,647 $8,570 >1 >1 $20,339 $23,262 CZ14 SDG&E -7,950 1672 6.45 ($14,692) $60,412 $16,679 >1 >1 $75,104 $31,371 CZ14-2 SCE -7,950 1672 6.45 ($14,692) $28,631 $16,679 >1 >1 $43,323 $31,371 CZ15 SCE 2,534 518 3.10 ($14,692) $27,271 $17,162 >1 >1 $41,963 $31,855 CZ16 PG&E -36,081 4304 14.26 ($14,692) ($30,111) ($41,181) 0.5 0.4 ($15,419) ($26,489) CZ16-2 LA -36,081 4304 14.26 ($14,692) $45,706 ($41,181) >1 0.4 $60,398 ($26,489)
Page 296 of 319
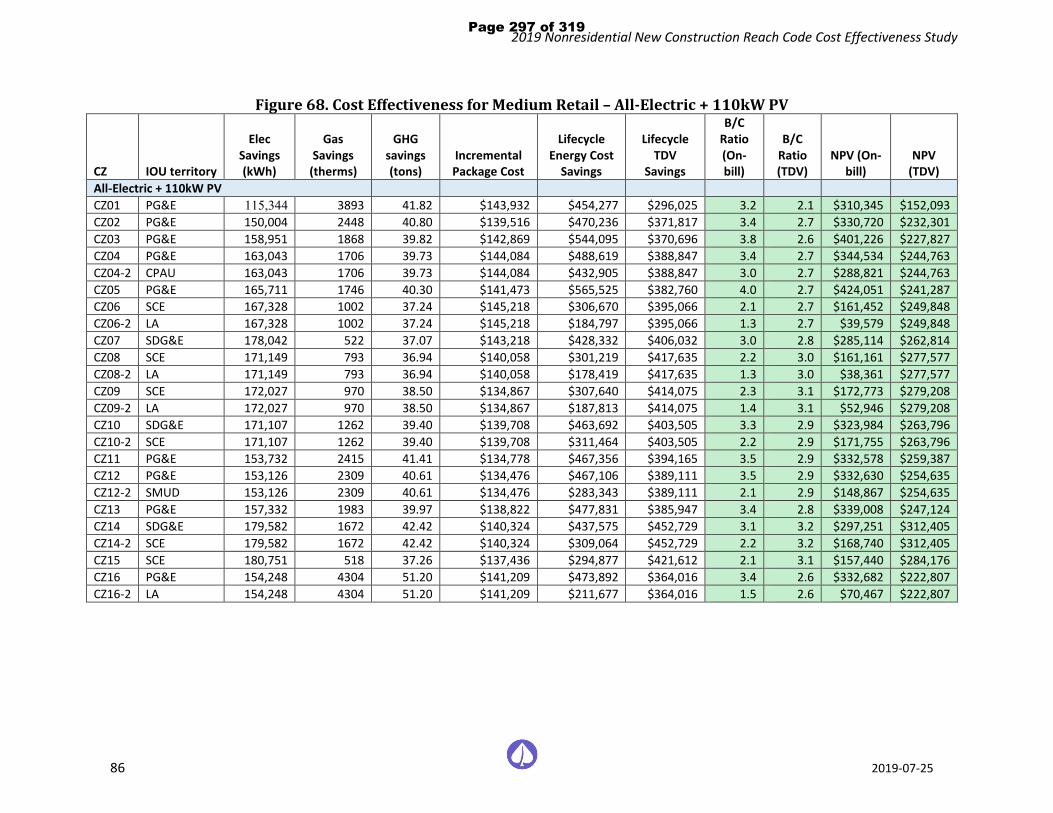
2019 Nonresidential New Construction Reach Code Cost Effectiveness Study
86 2019-07-25
Figure 68. Cost Effectiveness for Medium Retail – All-Electric + 110kW PV
CZ IOU territory
Elec Savings (kWh)
Gas Savings
(therms)
GHG savings (tons)
Incremental Package Cost
Lifecycle Energy Cost
Savings
Lifecycle TDV
Savings
B/C Ratio (On-bill)
B/C Ratio (TDV)
NPV (On-bill)
NPV (TDV)
All-Electric + 110kW PV CZ01 PG&E 115,344 3893 41.82 $143,932 $454,277 $296,025 3.2 2.1 $310,345 $152,093 CZ02 PG&E 150,004 2448 40.80 $139,516 $470,236 $371,817 3.4 2.7 $330,720 $232,301 CZ03 PG&E 158,951 1868 39.82 $142,869 $544,095 $370,696 3.8 2.6 $401,226 $227,827 CZ04 PG&E 163,043 1706 39.73 $144,084 $488,619 $388,847 3.4 2.7 $344,534 $244,763 CZ04-2 CPAU 163,043 1706 39.73 $144,084 $432,905 $388,847 3.0 2.7 $288,821 $244,763 CZ05 PG&E 165,711 1746 40.30 $141,473 $565,525 $382,760 4.0 2.7 $424,051 $241,287 CZ06 SCE 167,328 1002 37.24 $145,218 $306,670 $395,066 2.1 2.7 $161,452 $249,848 CZ06-2 LA 167,328 1002 37.24 $145,218 $184,797 $395,066 1.3 2.7 $39,579 $249,848 CZ07 SDG&E 178,042 522 37.07 $143,218 $428,332 $406,032 3.0 2.8 $285,114 $262,814 CZ08 SCE 171,149 793 36.94 $140,058 $301,219 $417,635 2.2 3.0 $161,161 $277,577 CZ08-2 LA 171,149 793 36.94 $140,058 $178,419 $417,635 1.3 3.0 $38,361 $277,577 CZ09 SCE 172,027 970 38.50 $134,867 $307,640 $414,075 2.3 3.1 $172,773 $279,208 CZ09-2 LA 172,027 970 38.50 $134,867 $187,813 $414,075 1.4 3.1 $52,946 $279,208 CZ10 SDG&E 171,107 1262 39.40 $139,708 $463,692 $403,505 3.3 2.9 $323,984 $263,796 CZ10-2 SCE 171,107 1262 39.40 $139,708 $311,464 $403,505 2.2 2.9 $171,755 $263,796 CZ11 PG&E 153,732 2415 41.41 $134,778 $467,356 $394,165 3.5 2.9 $332,578 $259,387 CZ12 PG&E 153,126 2309 40.61 $134,476 $467,106 $389,111 3.5 2.9 $332,630 $254,635 CZ12-2 SMUD 153,126 2309 40.61 $134,476 $283,343 $389,111 2.1 2.9 $148,867 $254,635 CZ13 PG&E 157,332 1983 39.97 $138,822 $477,831 $385,947 3.4 2.8 $339,008 $247,124 CZ14 SDG&E 179,582 1672 42.42 $140,324 $437,575 $452,729 3.1 3.2 $297,251 $312,405 CZ14-2 SCE 179,582 1672 42.42 $140,324 $309,064 $452,729 2.2 3.2 $168,740 $312,405 CZ15 SCE 180,751 518 37.26 $137,436 $294,877 $421,612 2.1 3.1 $157,440 $284,176 CZ16 PG&E 154,248 4304 51.20 $141,209 $473,892 $364,016 3.4 2.6 $332,682 $222,807 CZ16-2 LA 154,248 4304 51.20 $141,209 $211,677 $364,016 1.5 2.6 $70,467 $222,807
Page 297 of 319

2019 Nonresidential New Construction Reach Code Cost Effectiveness Study
87 2019-07-25
Figure 69. Cost Effectiveness for Medium Retail – All-Electric + 110kW PV + 50 kWh Battery
CZ IOU territory
Elec Savings (kWh)
Gas Savings
(therms)
GHG savings (tons)
Incremental Package Cost
Lifecycle Energy Cost
Savings
Lifecycle TDV
Savings
B/C Ratio (On-bill)
B/C Ratio (TDV)
NPV (On-bill)
NPV (TDV)
All-Electric + 90kW PV + 50 kWh Battery CZ01 PG&E 114,356 3893 43.52 $171,832 $451,043 $310,265 2.6 1.8 $279,211 $138,433 CZ02 PG&E 148,793 2448 42.89 $167,416 $475,081 $394,099 2.8 2.4 $307,664 $226,683 CZ03 PG&E 157,707 1868 42.12 $170,769 $541,418 $394,034 3.2 2.3 $370,649 $223,265 CZ04 PG&E 161,769 1706 41.82 $171,984 $523,603 $422,535 3.0 2.5 $351,618 $250,551 CZ04-2 CPAU 161,769 1706 41.82 $171,984 $430,567 $422,535 2.5 2.5 $258,582 $250,551 CZ05 PG&E 164,408 1746 42.68 $169,373 $561,966 $405,087 3.3 2.4 $392,592 $235,714 CZ06 SCE 166,052 1002 39.48 $173,118 $306,697 $414,756 1.8 2.4 $133,579 $241,638 CZ06-2 LA 166,052 1002 39.48 $173,118 $187,941 $414,756 1.1 2.4 $14,823 $241,638 CZ07 SDG&E 176,705 522 39.47 $171,118 $479,038 $428,490 2.8 2.5 $307,920 $257,372 CZ08 SCE 169,825 793 39.14 $167,958 $312,602 $436,709 1.9 2.6 $144,645 $268,751 CZ08-2 LA 169,825 793 39.14 $167,958 $187,142 $436,709 1.1 2.6 $19,185 $268,751 CZ09 SCE 170,747 970 40.23 $162,767 $318,113 $423,370 2.0 2.6 $155,346 $260,604 CZ09-2 LA 170,747 970 40.23 $162,767 $197,006 $423,370 1.2 2.6 $34,240 $260,604 CZ10 SDG&E 169,935 1262 41.08 $167,608 $503,504 $411,284 3.0 2.5 $335,896 $243,675 CZ10-2 SCE 169,935 1262 41.08 $167,608 $317,927 $411,284 1.9 2.5 $150,319 $243,675 CZ11 PG&E 152,559 2415 42.99 $162,678 $491,775 $420,667 3.0 2.6 $329,096 $257,989 CZ12 PG&E 151,956 2309 42.21 $162,376 $494,703 $417,063 3.0 2.6 $332,327 $254,687 CZ12-2 SMUD 151,956 2309 42.21 $162,376 $288,950 $417,063 1.8 2.6 $126,573 $254,687 CZ13 PG&E 156,271 1983 41.25 $166,722 $485,422 $395,770 2.9 2.4 $318,699 $229,047 CZ14 SDG&E 178,505 1672 43.94 $168,224 $452,456 $457,387 2.7 2.7 $284,232 $289,163 CZ14-2 SCE 178,505 1672 43.94 $168,224 $311,520 $457,387 1.9 2.7 $143,296 $289,163 CZ15 SCE 179,840 518 38.23 $165,336 $296,004 $422,293 1.8 2.6 $130,668 $256,957 CZ16 PG&E 152,965 4304 53.53 $169,109 $483,205 $378,299 2.9 2.2 $314,096 $209,190 CZ16-2 LA 152,965 4304 53.53 $169,109 $215,341 $378,299 1.3 2.2 $46,231 $209,190
Page 298 of 319

2019 Nonresidential New Construction Reach Code Cost Effectiveness Study
88 2019-07-25
6.7.3 Cost Effectiveness Results – Small Hotel Figure 70 through Figure 77 contain the cost-effectiveness findings for the Small Hotel packages. Notable findings for each package include:
♦ Mixed-Fuel + 3 kW PV: Packages are cost effective and achieve savings for all climate zones for both the On-Bill and TDV approaches.
♦ Mixed-Fuel + 3 kW PV + 5 kWh Battery: The packages are less cost effective as compared to the previous minimal PV only package and not cost effective for LADWP and SMUD service area. The addition of battery reduces the cost effectiveness of packages.
♦ Mixed-Fuel + PV only: Packages are cost effective and achieve savings for the On-Bill approach for all climate zones except for LADWP territory. Packages are cost effective and achieve savings for the TDV approach for all climate zones.
♦ Mixed-Fuel + PV + 50 kWh Battery: Adding battery slightly reduces On-Bill B/C ratios. Packages are not cost effective for LADWP territory, SMUD territory as well as for climate zones 6,8,9 under PG&E service area.
♦ All-Electric + 3 kW PV: All packages are cost effective using the On-Bill approach. All packages are cost effective using the TDV approach but do not achieve positive energy cost savings.
♦ All-Electric + 3 kW PV + 5 kWh Battery: Similar to minimal PV only package, all packages are cost effective using the On-Bill approach. All packages are cost effective using the TDV approach but do not achieve positive energy cost savings.
♦ All-Electric + PV only: All packages are cost effective for both On-Bill and TDV approaches. Packages achieve on-bill savings for all climate zones.
♦ All-Electric + PV + 50 kWh Battery: Adding battery slightly reduces On-Bill B/C ratios but is still cost effective for all climate zones.
Page 299 of 319

2019 Nonresidential New Construction Reach Code Cost Effectiveness Study
89 2019-07-25
Figure 70. Cost Effectiveness for Small Hotel – Mixed Fuel + 3kW PV
CZ IOU territory
Elec Savings (kWh)
Gas Savings
(therms)
GHG savings (tons)
Incremental Package Cost
Lifecycle Energy Cost
Savings Lifecycle $-
TDV Savings
B/C Ratio
(On-bill)
B/C Ratio (TDV)
NPV (On-bill)
NPV (TDV)
Mixed Fuel + 3kW PV CZ01 PG&E 3,941 0 0.8 $5,566 $12,616 $8,326 2.3 1.5 $7,050 $2,760 CZ02 PG&E 4,785 0 0.9 $5,566 $12,639 $10,332 2.3 1.9 $7,073 $4,766 CZ03 PG&E 4,733 0 0.9 $5,566 $15,146 $9,991 2.7 1.8 $9,580 $4,425 CZ04 PG&E 4,834 0 1.0 $5,566 $13,266 $10,445 2.4 1.9 $7,700 $4,879 CZ04-2 CPAU 4,834 0 1.0 $5,566 $11,507 $10,445 2.1 1.9 $5,941 $4,879 CZ05 PG&E 5,027 0 1.0 $5,566 $16,048 $10,634 2.9 1.9 $10,482 $5,068 CZ06 SCE 4,769 0 0.9 $5,566 $10,276 $10,559 1.8 1.9 $4,710 $4,993 CZ06-2 LA 4,769 0 0.9 $5,566 $6,307 $10,559 1.1 1.9 $741 $4,993 CZ07 SDG&E 4,960 0 1.0 $5,566 $14,576 $10,861 2.6 2.0 $9,010 $5,295 CZ08 SCE 4,824 0 0.9 $5,566 $10,837 $11,202 1.9 2.0 $5,271 $5,636 CZ08-2 LA 4,824 0 0.9 $5,566 $6,505 $11,202 1.2 2.0 $939 $5,636 CZ09 SCE 4,779 0 0.9 $5,566 $10,298 $10,824 1.9 1.9 $4,732 $5,258 CZ09-2 LA 4,779 0 0.9 $5,566 $6,201 $10,824 1.1 1.9 $635 $5,258 CZ10 SDG&E 4,905 0 1.0 $5,566 $16,302 $10,710 2.9 1.9 $10,736 $5,144 CZ10-2 SCE 4,905 0 1.0 $5,566 $9,468 $10,710 1.7 1.9 $3,902 $5,144 CZ11 PG&E 4,701 0 0.9 $5,566 $14,193 $10,483 2.6 1.9 $8,627 $4,917 CZ12 PG&E 4,770 0 0.9 $5,566 $15,262 $10,596 2.7 1.9 $9,696 $5,030 CZ12-2 SMUD 4,770 0 0.9 $5,566 $7,848 $10,596 1.4 1.9 $2,282 $5,030 CZ13 PG&E 4,633 0 0.9 $5,566 $14,674 $10,105 2.6 1.8 $9,108 $4,539 CZ14 SDG&E 5,377 0 1.1 $5,566 $16,615 $12,375 3.0 2.2 $11,049 $6,809 CZ14-2 SCE 5,377 0 1.1 $5,566 $10,021 $12,375 1.8 2.2 $4,455 $6,809 CZ15 SCE 4,997 0 1.0 $5,566 $9,542 $11,164 1.7 2.0 $3,976 $5,598 CZ16 PG&E 5,240 0 1.0 $5,566 $14,961 $10,975 2.7 2.0 $9,395 $5,409 CZ16-2 LA 5,240 0 1.0 $5,566 $5,670 $10,975 1.0 2.0 $104 $5,409
Page 300 of 319
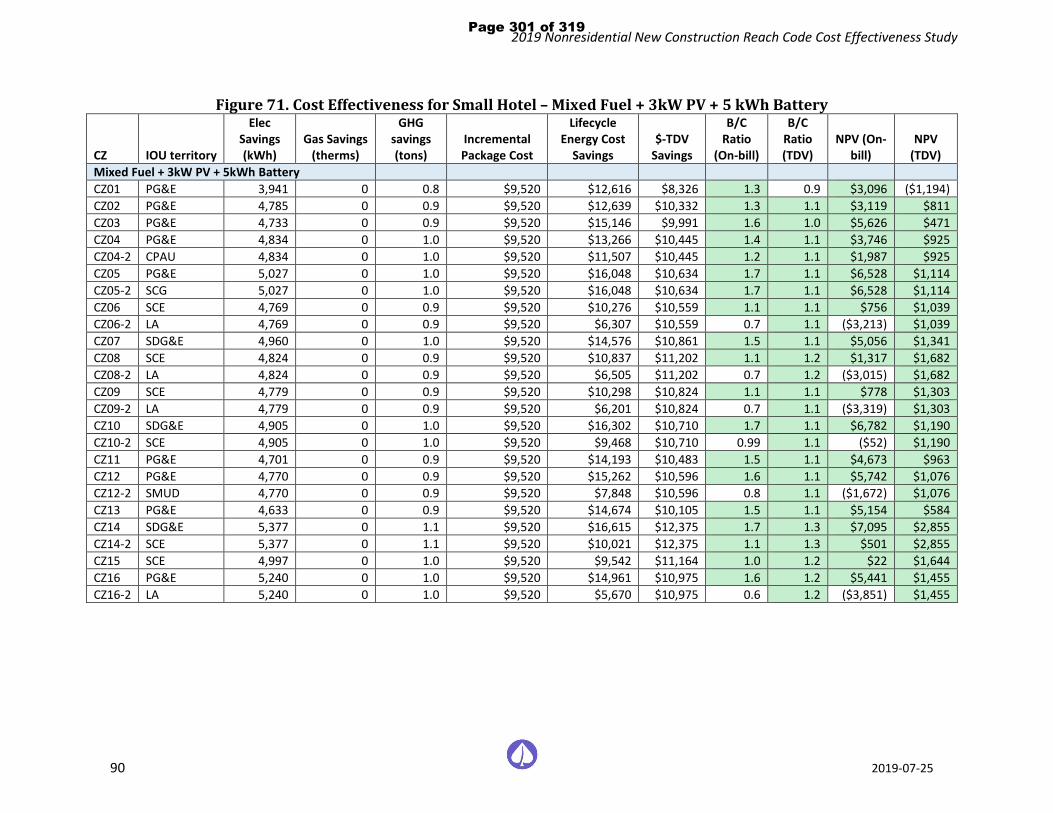
2019 Nonresidential New Construction Reach Code Cost Effectiveness Study
90 2019-07-25
Figure 71. Cost Effectiveness for Small Hotel – Mixed Fuel + 3kW PV + 5 kWh Battery
CZ IOU territory
Elec Savings (kWh)
Gas Savings (therms)
GHG savings (tons)
Incremental Package Cost
Lifecycle Energy Cost
Savings $-TDV
Savings
B/C Ratio
(On-bill)
B/C Ratio (TDV)
NPV (On-bill)
NPV (TDV)
Mixed Fuel + 3kW PV + 5kWh Battery CZ01 PG&E 3,941 0 0.8 $9,520 $12,616 $8,326 1.3 0.9 $3,096 ($1,194) CZ02 PG&E 4,785 0 0.9 $9,520 $12,639 $10,332 1.3 1.1 $3,119 $811 CZ03 PG&E 4,733 0 0.9 $9,520 $15,146 $9,991 1.6 1.0 $5,626 $471 CZ04 PG&E 4,834 0 1.0 $9,520 $13,266 $10,445 1.4 1.1 $3,746 $925 CZ04-2 CPAU 4,834 0 1.0 $9,520 $11,507 $10,445 1.2 1.1 $1,987 $925 CZ05 PG&E 5,027 0 1.0 $9,520 $16,048 $10,634 1.7 1.1 $6,528 $1,114 CZ05-2 SCG 5,027 0 1.0 $9,520 $16,048 $10,634 1.7 1.1 $6,528 $1,114 CZ06 SCE 4,769 0 0.9 $9,520 $10,276 $10,559 1.1 1.1 $756 $1,039 CZ06-2 LA 4,769 0 0.9 $9,520 $6,307 $10,559 0.7 1.1 ($3,213) $1,039 CZ07 SDG&E 4,960 0 1.0 $9,520 $14,576 $10,861 1.5 1.1 $5,056 $1,341 CZ08 SCE 4,824 0 0.9 $9,520 $10,837 $11,202 1.1 1.2 $1,317 $1,682 CZ08-2 LA 4,824 0 0.9 $9,520 $6,505 $11,202 0.7 1.2 ($3,015) $1,682 CZ09 SCE 4,779 0 0.9 $9,520 $10,298 $10,824 1.1 1.1 $778 $1,303 CZ09-2 LA 4,779 0 0.9 $9,520 $6,201 $10,824 0.7 1.1 ($3,319) $1,303 CZ10 SDG&E 4,905 0 1.0 $9,520 $16,302 $10,710 1.7 1.1 $6,782 $1,190 CZ10-2 SCE 4,905 0 1.0 $9,520 $9,468 $10,710 0.99 1.1 ($52) $1,190 CZ11 PG&E 4,701 0 0.9 $9,520 $14,193 $10,483 1.5 1.1 $4,673 $963 CZ12 PG&E 4,770 0 0.9 $9,520 $15,262 $10,596 1.6 1.1 $5,742 $1,076 CZ12-2 SMUD 4,770 0 0.9 $9,520 $7,848 $10,596 0.8 1.1 ($1,672) $1,076 CZ13 PG&E 4,633 0 0.9 $9,520 $14,674 $10,105 1.5 1.1 $5,154 $584 CZ14 SDG&E 5,377 0 1.1 $9,520 $16,615 $12,375 1.7 1.3 $7,095 $2,855 CZ14-2 SCE 5,377 0 1.1 $9,520 $10,021 $12,375 1.1 1.3 $501 $2,855 CZ15 SCE 4,997 0 1.0 $9,520 $9,542 $11,164 1.0 1.2 $22 $1,644 CZ16 PG&E 5,240 0 1.0 $9,520 $14,961 $10,975 1.6 1.2 $5,441 $1,455 CZ16-2 LA 5,240 0 1.0 $9,520 $5,670 $10,975 0.6 1.2 ($3,851) $1,455
Page 301 of 319

2019 Nonresidential New Construction Reach Code Cost Effectiveness Study
91 2019-07-25
Figure 72. Cost Effectiveness for Small Hotel - Mixed Fuel +80kW PV
CZ IOU territory
Elec Savings (kWh)
Gas Savings
(therms)
GHG savings (tons)
Incremental Package Cost
Lifecycle Energy Cost
Savings
Lifecycle TDV
Savings
B/C Ratio (On-bill)
B/C Ratio (TDV)
NPV (On-bill)
NPV (TDV)
Mixed Fuel + 80kW PV CZ01 PG&E 105,090 0 20.6 $179,470 $336,440 $221,883 1.9 1.2 $156,970 $42,413 CZ02 PG&E 127,592 0 25.0 $179,470 $320,009 $275,130 1.8 1.5 $140,539 $95,660 CZ03 PG&E 126,206 0 24.8 $179,470 $403,900 $266,426 2.3 1.5 $224,430 $86,956 CZ04 PG&E 128,894 0 25.4 $179,470 $322,782 $278,536 1.8 1.6 $143,312 $99,066 CZ04-2 CPAU 128,894 0 25.4 $179,470 $306,862 $278,536 1.7 1.6 $127,392 $99,066 CZ05 PG&E 134,041 0 26.5 $179,470 $427,935 $283,834 2.4 1.6 $248,465 $104,364 CZ06 SCE 127,168 0 25.0 $179,470 $200,425 $281,488 1.1 1.6 $20,955 $102,018 CZ06-2 LA 127,168 0 25.0 $179,470 $119,357 $281,488 0.7 1.6 ($60,113) $102,018 CZ07 SDG&E 132,258 0 26.1 $179,470 $247,646 $289,700 1.4 1.6 $68,176 $110,230 CZ08 SCE 128,641 0 25.3 $179,470 $207,993 $298,594 1.2 1.7 $28,523 $119,124 CZ08-2 LA 128,641 0 25.3 $179,470 $122,591 $298,594 0.7 1.7 ($56,879) $119,124 CZ09 SCE 127,447 0 25.3 $179,470 $211,567 $288,830 1.2 1.6 $32,096 $109,360 CZ09-2 LA 127,447 0 25.3 $179,470 $123,486 $288,830 0.7 1.6 ($55,984) $109,360 CZ10 SDG&E 130,792 0 25.8 $179,470 $274,832 $285,386 1.5 1.6 $95,361 $105,916 CZ10-2 SCE 130,792 0 25.8 $179,470 $206,865 $285,386 1.2 1.6 $27,395 $105,916 CZ11 PG&E 125,366 0 24.6 $179,470 $316,781 $279,331 1.8 1.6 $137,311 $99,861 CZ12 PG&E 127,203 0 25.0 $179,470 $406,977 $282,358 2.3 1.6 $227,507 $102,888 CZ12-2 SMUD 127,203 0 25.0 $179,470 $198,254 $282,358 1.1 1.6 $18,784 $102,888 CZ13 PG&E 123,535 0 24.4 $179,470 $317,261 $269,908 1.8 1.5 $137,791 $90,437 CZ14 SDG&E 143,387 0 28.1 $179,470 $309,521 $330,345 1.7 1.8 $130,051 $150,875 CZ14-2 SCE 143,387 0 28.1 $179,470 $225,083 $330,345 1.3 1.8 $45,612 $150,875 CZ15 SCE 133,246 0 25.9 $179,470 $207,277 $297,648 1.2 1.7 $27,807 $118,177 CZ16 PG&E 139,738 0 27.3 $179,470 $341,724 $292,728 1.9 1.6 $162,254 $113,258 CZ16-2 LA 139,738 0 27.3 $179,470 $114,215 $292,728 0.6 1.6 ($65,255) $113,258
Page 302 of 319

2019 Nonresidential New Construction Reach Code Cost Effectiveness Study
92 2019-07-25
Figure 73. Cost Effectiveness for Small Hotel – Mixed Fuel + 80kW PV + 50 kWh Battery
CZ IOU territory
Elec Savings (kWh)
Gas Savings
(therms)
GHG savings (tons)
Incremental Package Cost
Lifecycle Energy Cost
Savings
Lifecycle TDV
Savings
B/C Ratio (On-bill)
B/C Ratio (TDV)
NPV (On-bill)
NPV (TDV)
Mixed Fuel + 80kW PV + 50kWh Battery CZ01 PG&E 104,026 0 23.2 $207,370 $332,596 $237,740 1.6 1.1 $125,226 $30,370 CZ02 PG&E 126,332 0 28.1 $207,370 $336,179 $296,058 1.6 1.4 $128,809 $88,688 CZ03 PG&E 124,934 0 28.0 $207,370 $399,220 $289,360 1.9 1.4 $191,850 $81,990 CZ04 PG&E 127,602 0 28.5 $207,370 $332,161 $308,887 1.6 1.5 $124,790 $101,517 CZ04-2 CPAU 127,602 0 28.5 $207,370 $303,828 $308,887 1.5 1.5 $96,458 $101,517 CZ05 PG&E 132,725 0 29.8 $207,370 $423,129 $303,627 2.0 1.5 $215,758 $96,257 CZ06 SCE 125,880 0 28.4 $207,370 $193,814 $297,950 0.9 1.4 ($13,556) $90,580 CZ06-2 LA 125,880 0 28.4 $207,370 $123,083 $297,950 0.6 1.4 ($84,287) $90,580 CZ07 SDG&E 130,940 0 29.5 $207,370 $274,313 $309,682 1.3 1.5 $66,943 $102,312 CZ08 SCE 127,332 0 28.5 $207,370 $199,786 $312,899 1.0 1.5 ($7,584) $105,529 CZ08-2 LA 127,332 0 28.5 $207,370 $124,651 $312,899 0.6 1.5 ($82,719) $105,529 CZ09 SCE 126,232 0 28.2 $207,370 $206,706 $292,804 1.0 1.4 ($664) $85,433 CZ09-2 LA 126,232 0 28.2 $207,370 $126,710 $292,804 0.6 1.4 ($80,660) $85,433 CZ10 SDG&E 129,683 0 28.4 $207,370 $292,202 $287,278 1.4 1.4 $84,832 $79,908 CZ10-2 SCE 129,683 0 28.4 $207,370 $206,171 $287,278 1.0 1.4 ($1,199) $79,908 CZ11 PG&E 124,337 0 26.9 $207,370 $315,330 $283,683 1.5 1.4 $107,960 $76,313 CZ12 PG&E 126,013 0 27.8 $207,370 $403,127 $297,118 1.9 1.4 $195,757 $89,748 CZ12-2 SMUD 126,013 0 27.8 $207,370 $198,007 $297,118 1.0 1.4 ($9,363) $89,748 CZ13 PG&E 122,591 0 26.5 $207,370 $315,541 $280,996 1.5 1.4 $108,171 $73,626 CZ14 SDG&E 142,257 0 30.7 $207,370 $317,565 $334,697 1.5 1.6 $110,195 $127,327 CZ14-2 SCE 142,257 0 30.7 $207,370 $224,195 $334,697 1.1 1.6 $16,824 $127,327 CZ15 SCE 132,418 0 27.8 $207,370 $208,044 $299,199 1.0 1.4 $674 $91,829 CZ16 PG&E 138,402 0 30.7 $207,370 $358,582 $315,699 1.7 1.5 $151,212 $108,329 CZ16-2 LA 138,402 0 30.7 $207,370 $118,770 $315,699 0.6 1.5 ($88,600) $108,329
Page 303 of 319

2019 Nonresidential New Construction Reach Code Cost Effectiveness Study
93 2019-07-25
Figure 74. Cost Effectiveness for Small Hotel – All-Electric + 3kW PV
CZ IOU territory
Elec Savings (kWh)
Gas Savings
(therms)
GHG savings (tons)
Incremental Package Cost*
Lifecycle Energy Cost
Savings Lifecycle
TDV Savings
B/C Ratio (On-bill)
B/C Ratio (TDV)
NPV (On-bill) NPV (TDV)
All-Electric + 3kW PV CZ01 PG&E -155,861 16917 54.7 ($1,265,139) ($568,892) ($106,835) 2.2 11.8 $696,246 $1,158,304 CZ02 PG&E -113,954 12677 40.9 ($1,266,111) ($229,433) ($41,288) 5.5 30.7 $1,036,679 $1,224,823 CZ03 PG&E -105,862 12322 41.4 ($1,268,383) ($309,874) ($41,175) 4.1 30.8 $958,510 $1,227,208 CZ04 PG&E -108,570 11927 37.5 ($1,268,218) ($208,239) ($42,689) 6.1 29.7 $1,059,980 $1,225,530 CZ04-2 CPAU -108,570 11927 37.5 ($1,268,218) ($6,261) ($42,689) 202.6 29.7 $1,261,958 $1,225,530 CZ05 PG&E -103,579 11960 39.3 ($1,268,272) ($332,879) ($44,051) 3.8 28.8 $935,393 $1,224,221 CZ06 SCE -73,524 8912 30.3 ($1,268,413) $48,898 ($17,484) >1 72.5 $1,317,311 $1,250,929 CZ06-2 LA -64,859 8188 29.0 ($1,266,760) ($120,842) ($12,337) 10.5 102.7 $1,145,918 $1,254,423 CZ07 SDG&E -67,090 8353 29.2 ($1,264,731) ($43,964) ($11,618) 28.8 108.9 $1,220,767 $1,253,113 CZ08 SCE -67,090 8353 29.2 ($1,264,731) $48,736 ($11,618) >1 108.9 $1,313,467 $1,253,113 CZ08-2 LA -67,483 8402 29.3 ($1,266,529) ($35,547) ($11,126) 35.6 113.8 $1,230,982 $1,255,403 CZ09 SCE -67,483 8402 29.3 ($1,266,529) $52,410 ($11,126) >1 113.8 $1,318,939 $1,255,403 CZ09-2 LA -75,157 8418 27.2 ($1,263,531) ($156,973) ($25,469) 8.0 49.6 $1,106,558 $1,238,061 CZ10 SDG&E -75,157 8418 27.2 ($1,263,531) ($54,711) ($25,469) 23.1 49.6 $1,208,820 $1,238,061 CZ10-2 SCE -94,783 10252 31.9 ($1,264,340) ($169,847) ($38,904) 7.4 32.5 $1,094,493 $1,225,436 CZ11 PG&E -94,702 10403 33.0 ($1,265,779) ($324,908) ($34,968) 3.9 36.2 $940,872 $1,230,811 CZ12 PG&E -94,297 10403 33.1 ($1,265,779) $13,603 ($33,757) >1 37.5 $1,279,382 $1,232,022 CZ12-2 SMUD -92,196 10029 31.5 ($1,264,152) ($168,358) ($40,229) 7.5 31.4 $1,095,794 $1,223,923 CZ13 PG&E -96,021 10056 30.7 ($1,264,510) ($308,542) ($44,202) 4.1 28.6 $955,969 $1,220,308 CZ14 SDG&E -96,021 10056 30.7 ($1,264,510) ($110,730) ($44,202) 11.4 28.6 $1,153,780 $1,220,308 CZ14-2 SCE -44,856 5579 19.0 ($1,262,631) $8,996 ($10,256) >1 123.1 $1,271,627 $1,252,375 CZ15 SCE -211,468 17599 42.9 ($1,268,907) ($625,671) ($228,203) 2.0 5.6 $643,236 $1,040,704 CZ16 PG&E -211,468 17599 42.9 ($1,268,907) $37,142 ($228,203) >1 5.6 $1,306,049 $1,040,704 CZ16-2 LA -155,861 16917 54.7 ($1,265,139) ($568,892) ($106,835) 2.2 11.8 $696,246 $1,158,304
Page 304 of 319
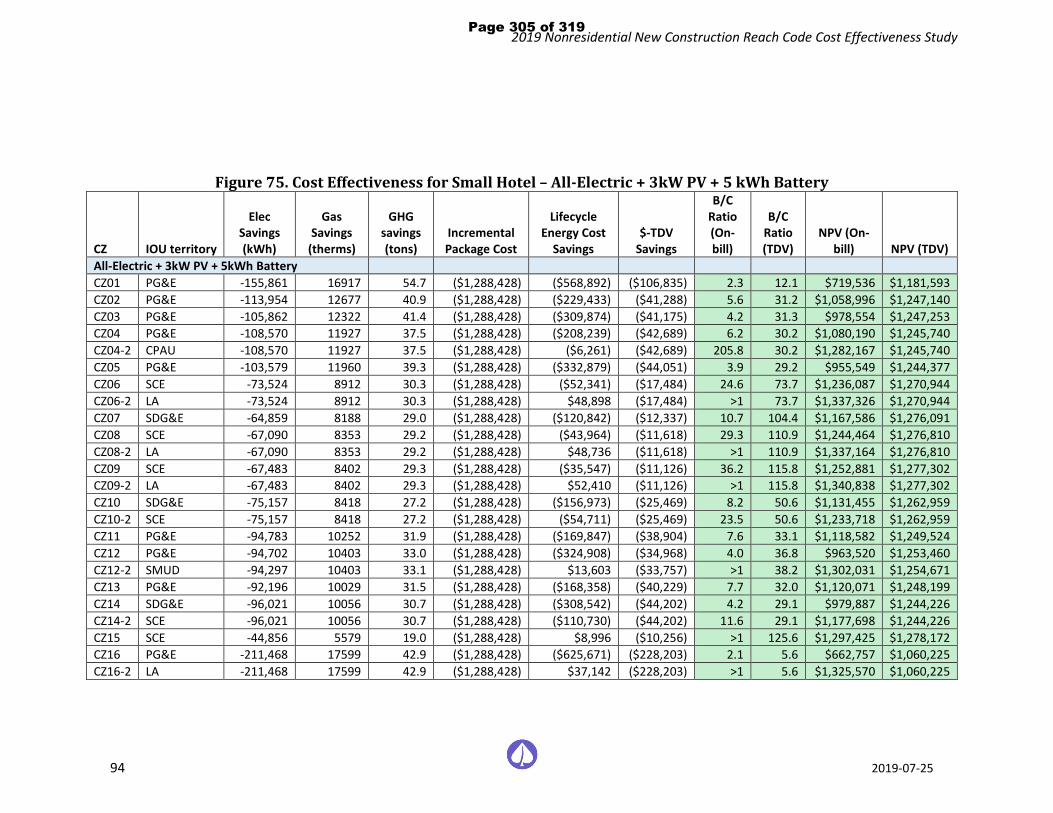
2019 Nonresidential New Construction Reach Code Cost Effectiveness Study
94 2019-07-25
Figure 75. Cost Effectiveness for Small Hotel – All-Electric + 3kW PV + 5 kWh Battery
CZ IOU territory
Elec Savings (kWh)
Gas Savings
(therms)
GHG savings (tons)
Incremental Package Cost
Lifecycle Energy Cost
Savings $-TDV
Savings
B/C Ratio (On-bill)
B/C Ratio (TDV)
NPV (On-bill) NPV (TDV)
All-Electric + 3kW PV + 5kWh Battery CZ01 PG&E -155,861 16917 54.7 ($1,288,428) ($568,892) ($106,835) 2.3 12.1 $719,536 $1,181,593 CZ02 PG&E -113,954 12677 40.9 ($1,288,428) ($229,433) ($41,288) 5.6 31.2 $1,058,996 $1,247,140 CZ03 PG&E -105,862 12322 41.4 ($1,288,428) ($309,874) ($41,175) 4.2 31.3 $978,554 $1,247,253 CZ04 PG&E -108,570 11927 37.5 ($1,288,428) ($208,239) ($42,689) 6.2 30.2 $1,080,190 $1,245,740 CZ04-2 CPAU -108,570 11927 37.5 ($1,288,428) ($6,261) ($42,689) 205.8 30.2 $1,282,167 $1,245,740 CZ05 PG&E -103,579 11960 39.3 ($1,288,428) ($332,879) ($44,051) 3.9 29.2 $955,549 $1,244,377 CZ06 SCE -73,524 8912 30.3 ($1,288,428) ($52,341) ($17,484) 24.6 73.7 $1,236,087 $1,270,944 CZ06-2 LA -73,524 8912 30.3 ($1,288,428) $48,898 ($17,484) >1 73.7 $1,337,326 $1,270,944 CZ07 SDG&E -64,859 8188 29.0 ($1,288,428) ($120,842) ($12,337) 10.7 104.4 $1,167,586 $1,276,091 CZ08 SCE -67,090 8353 29.2 ($1,288,428) ($43,964) ($11,618) 29.3 110.9 $1,244,464 $1,276,810 CZ08-2 LA -67,090 8353 29.2 ($1,288,428) $48,736 ($11,618) >1 110.9 $1,337,164 $1,276,810 CZ09 SCE -67,483 8402 29.3 ($1,288,428) ($35,547) ($11,126) 36.2 115.8 $1,252,881 $1,277,302 CZ09-2 LA -67,483 8402 29.3 ($1,288,428) $52,410 ($11,126) >1 115.8 $1,340,838 $1,277,302 CZ10 SDG&E -75,157 8418 27.2 ($1,288,428) ($156,973) ($25,469) 8.2 50.6 $1,131,455 $1,262,959 CZ10-2 SCE -75,157 8418 27.2 ($1,288,428) ($54,711) ($25,469) 23.5 50.6 $1,233,718 $1,262,959 CZ11 PG&E -94,783 10252 31.9 ($1,288,428) ($169,847) ($38,904) 7.6 33.1 $1,118,582 $1,249,524 CZ12 PG&E -94,702 10403 33.0 ($1,288,428) ($324,908) ($34,968) 4.0 36.8 $963,520 $1,253,460 CZ12-2 SMUD -94,297 10403 33.1 ($1,288,428) $13,603 ($33,757) >1 38.2 $1,302,031 $1,254,671 CZ13 PG&E -92,196 10029 31.5 ($1,288,428) ($168,358) ($40,229) 7.7 32.0 $1,120,071 $1,248,199 CZ14 SDG&E -96,021 10056 30.7 ($1,288,428) ($308,542) ($44,202) 4.2 29.1 $979,887 $1,244,226 CZ14-2 SCE -96,021 10056 30.7 ($1,288,428) ($110,730) ($44,202) 11.6 29.1 $1,177,698 $1,244,226 CZ15 SCE -44,856 5579 19.0 ($1,288,428) $8,996 ($10,256) >1 125.6 $1,297,425 $1,278,172 CZ16 PG&E -211,468 17599 42.9 ($1,288,428) ($625,671) ($228,203) 2.1 5.6 $662,757 $1,060,225 CZ16-2 LA -211,468 17599 42.9 ($1,288,428) $37,142 ($228,203) >1 5.6 $1,325,570 $1,060,225
Page 305 of 319
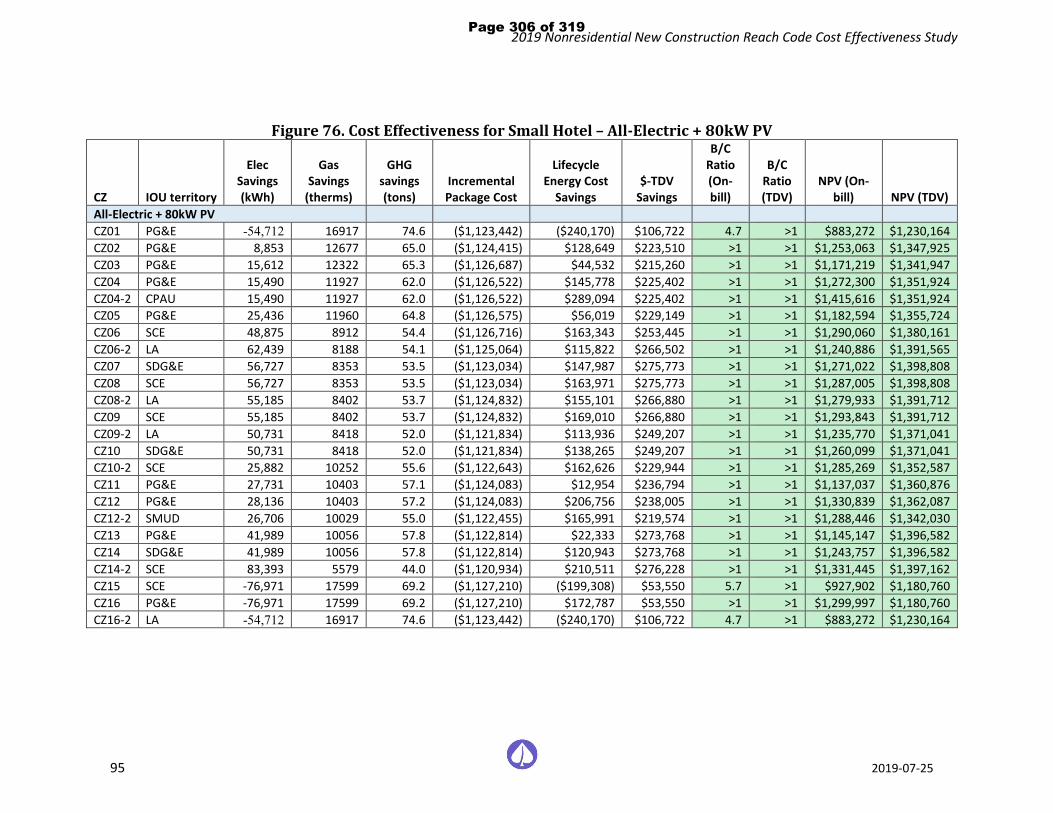
2019 Nonresidential New Construction Reach Code Cost Effectiveness Study
95 2019-07-25
Figure 76. Cost Effectiveness for Small Hotel – All-Electric + 80kW PV
CZ IOU territory
Elec Savings (kWh)
Gas Savings
(therms)
GHG savings (tons)
Incremental Package Cost
Lifecycle Energy Cost
Savings $-TDV
Savings
B/C Ratio (On-bill)
B/C Ratio (TDV)
NPV (On-bill) NPV (TDV)
All-Electric + 80kW PV CZ01 PG&E -54,712 16917 74.6 ($1,123,442) ($240,170) $106,722 4.7 >1 $883,272 $1,230,164 CZ02 PG&E 8,853 12677 65.0 ($1,124,415) $128,649 $223,510 >1 >1 $1,253,063 $1,347,925 CZ03 PG&E 15,612 12322 65.3 ($1,126,687) $44,532 $215,260 >1 >1 $1,171,219 $1,341,947 CZ04 PG&E 15,490 11927 62.0 ($1,126,522) $145,778 $225,402 >1 >1 $1,272,300 $1,351,924 CZ04-2 CPAU 15,490 11927 62.0 ($1,126,522) $289,094 $225,402 >1 >1 $1,415,616 $1,351,924 CZ05 PG&E 25,436 11960 64.8 ($1,126,575) $56,019 $229,149 >1 >1 $1,182,594 $1,355,724 CZ06 SCE 48,875 8912 54.4 ($1,126,716) $163,343 $253,445 >1 >1 $1,290,060 $1,380,161 CZ06-2 LA 62,439 8188 54.1 ($1,125,064) $115,822 $266,502 >1 >1 $1,240,886 $1,391,565 CZ07 SDG&E 56,727 8353 53.5 ($1,123,034) $147,987 $275,773 >1 >1 $1,271,022 $1,398,808 CZ08 SCE 56,727 8353 53.5 ($1,123,034) $163,971 $275,773 >1 >1 $1,287,005 $1,398,808 CZ08-2 LA 55,185 8402 53.7 ($1,124,832) $155,101 $266,880 >1 >1 $1,279,933 $1,391,712 CZ09 SCE 55,185 8402 53.7 ($1,124,832) $169,010 $266,880 >1 >1 $1,293,843 $1,391,712 CZ09-2 LA 50,731 8418 52.0 ($1,121,834) $113,936 $249,207 >1 >1 $1,235,770 $1,371,041 CZ10 SDG&E 50,731 8418 52.0 ($1,121,834) $138,265 $249,207 >1 >1 $1,260,099 $1,371,041 CZ10-2 SCE 25,882 10252 55.6 ($1,122,643) $162,626 $229,944 >1 >1 $1,285,269 $1,352,587 CZ11 PG&E 27,731 10403 57.1 ($1,124,083) $12,954 $236,794 >1 >1 $1,137,037 $1,360,876 CZ12 PG&E 28,136 10403 57.2 ($1,124,083) $206,756 $238,005 >1 >1 $1,330,839 $1,362,087 CZ12-2 SMUD 26,706 10029 55.0 ($1,122,455) $165,991 $219,574 >1 >1 $1,288,446 $1,342,030 CZ13 PG&E 41,989 10056 57.8 ($1,122,814) $22,333 $273,768 >1 >1 $1,145,147 $1,396,582 CZ14 SDG&E 41,989 10056 57.8 ($1,122,814) $120,943 $273,768 >1 >1 $1,243,757 $1,396,582 CZ14-2 SCE 83,393 5579 44.0 ($1,120,934) $210,511 $276,228 >1 >1 $1,331,445 $1,397,162 CZ15 SCE -76,971 17599 69.2 ($1,127,210) ($199,308) $53,550 5.7 >1 $927,902 $1,180,760 CZ16 PG&E -76,971 17599 69.2 ($1,127,210) $172,787 $53,550 >1 >1 $1,299,997 $1,180,760 CZ16-2 LA -54,712 16917 74.6 ($1,123,442) ($240,170) $106,722 4.7 >1 $883,272 $1,230,164
Page 306 of 319

2019 Nonresidential New Construction Reach Code Cost Effectiveness Study
96 2019-07-25
Figure 77. Cost Effectiveness for Small Hotel – All-Electric + 80kW PV + 50 kWh Battery
CZ IOU territory
Elec Savings (kWh)
Gas Savings
(therms)
GHG savings (tons)
Incremental Package Cost
Lifecycle Energy Cost
Savings $-TDV
Savings
B/C Ratio (On-bill)
B/C Ratio (TDV)
NPV (On-bill) NPV (TDV)
All-Electric + 80kW PV + 50kWh Battery CZ01 PG&E -55,323 16917 75.7 ($1,095,542) ($238,351) $118,605 4.6 >1 $857,191 $1,214,147 CZ02 PG&E 7,849 12677 67.4 ($1,096,515) $129,794 $239,632 >1 >1 $1,226,309 $1,336,146 CZ03 PG&E 14,594 12322 67.7 ($1,098,787) $43,166 $235,280 >1 >1 $1,141,953 $1,334,067 CZ04 PG&E 14,459 11927 64.4 ($1,098,622) $148,698 $249,244 >1 >1 $1,247,320 $1,347,866 CZ04-2 CPAU 14,459 11927 64.4 ($1,098,622) $286,573 $249,244 >1 >1 $1,385,195 $1,347,866 CZ05 PG&E 24,292 11960 67.6 ($1,098,675) $53,719 $244,514 >1 >1 $1,152,394 $1,343,189 CZ06 SCE 47,762 8912 57.2 ($1,098,816) $165,763 $267,221 >1 >1 $1,264,579 $1,366,037 CZ06-2 LA 61,252 8188 57.1 ($1,097,164) $138,060 $283,797 >1 >1 $1,235,223 $1,380,960 CZ07 SDG&E 55,588 8353 56.2 ($1,095,134) $138,718 $286,483 >1 >1 $1,233,852 $1,381,618 CZ08 SCE 55,588 8353 56.2 ($1,095,134) $165,932 $286,483 >1 >1 $1,261,066 $1,381,618 CZ08-2 LA 54,162 8402 56.1 ($1,096,932) $149,615 $269,453 >1 >1 $1,246,548 $1,366,386 CZ09 SCE 54,162 8402 56.1 ($1,096,932) $171,168 $269,453 >1 >1 $1,268,101 $1,366,386 CZ09-2 LA 49,832 8418 54.1 ($1,093,934) $120,627 $250,720 >1 >1 $1,214,561 $1,344,654 CZ10 SDG&E 49,832 8418 54.1 ($1,093,934) $136,144 $250,720 >1 >1 $1,230,078 $1,344,654 CZ10-2 SCE 25,148 10252 57.3 ($1,094,743) $160,744 $233,842 >1 >1 $1,255,487 $1,328,585 CZ11 PG&E 26,813 10403 59.2 ($1,096,183) $10,314 $247,504 >1 >1 $1,106,497 $1,343,686 CZ12 PG&E 27,217 10403 59.3 ($1,096,183) $206,749 $248,790 >1 >1 $1,302,931 $1,344,973 CZ12-2 SMUD 26,027 10029 56.5 ($1,094,555) $164,506 $229,300 >1 >1 $1,259,061 $1,323,856 CZ13 PG&E 41,123 10056 59.7 ($1,094,914) $25,707 $276,947 >1 >1 $1,120,621 $1,371,860 CZ14 SDG&E 41,123 10056 59.7 ($1,094,914) $119,382 $276,947 >1 >1 $1,214,296 $1,371,860 CZ14-2 SCE 82,697 5579 45.5 ($1,093,034) $209,837 $277,287 >1 >1 $1,302,871 $1,370,321 CZ15 SCE -77,815 17599 71.1 ($1,099,310) ($193,758) $65,850 5.7 >1 $905,552 $1,165,160 CZ16 PG&E -77,815 17599 71.1 ($1,099,310) $175,872 $65,850 >1 >1 $1,275,182 $1,165,160 CZ16-2 LA -55,323 16917 75.7 ($1,095,542) ($238,351) $118,605 4.6 >1 $857,191 $1,214,147
Page 307 of 319

2019 Nonresidential New Construction Reach Code Cost Effectiveness Study
97 2019-07-25
6.8 List of Relevant Efficiency Measures Explored The Reach Code Team started with a potential list of energy efficiency measures proposed for 2022 Title 24 codes and standards enhancement measures, as well as measures from the 2018 International Green Construction Code, which is based on ASHRAE Standard 189.1-2017. The team also developed new measures based on their experience. This original list was over 100 measures long. The measures were filtered based on applicability to the prototypes in this study, ability to model in simulation software, previously demonstrated energy savings potential, and market readiness. The list of 28 measures below represent the list of efficiency measures that meet these criteria and were investigated to some degree. The column to the far right indicates whether the measure was ultimately included in analysis or not.
Figure 78. List of Relevant Efficiency Measures Explored
Building Component Measure Name Measure Description Notes Include?
Water Heating Drain water Heat Recovery Add drain water heat recovery in hotel prototype Requires calculations outside of modeling software. Y
Envelope High performance fenestration Improved fenestration SHGC (reduce to 0.22). Y
Envelope High SHGC for cold climates Raise prescriptive fenestration SHGC (to 0.45) in cold climates where additional heat is beneficial. Y
Envelope Allowable fenestration by orientation Limit amount of fenestration as a function of orientation Y
Envelope High Thermal Mass Buildings
Increase building thermal mass. Thermal mass slows the change in internal temperature of buildings with respect to the outdoor temperature, allowing the peak cooling load during summer to be pushed to the evening, resulting in lower overall cooling loads.
Initial energy modeling results showed marginal cooling savings, negative heating savings. N
Envelope Opaque Insulation Increases the insulation requirement for opaque envelopes (i.e., roof and above-grade wall).
Initial energy modeling results showed marginal energy savings at significant costs which would not meet c/e criteria.
N
Envelope Triple pane windows U-factor of 0.20 for all windows Initial energy modeling results showed only marginal energy savings and, in some cases, increased energy use.
N
Page 308 of 319

2019 Nonresidential New Construction Reach Code Cost Effectiveness Study
98 2019-07-25
Building Component Measure Name Measure Description Notes Include?
Envelope Duct Leakage Testing
Expand duct leakage testing requirements based on ASHRAE Standard 215-2018: Method of Test to Determine Leakage of Operating HVAC Air Distribution Systems (ANSI Approved).
More research needs to be done on current duct leakage and how it can be addressed. N
Envelope Fenestration area Reduce maximum allowable fenestration area to 30%. Instead of this measure, analyzed measure which looked at limiting fenestration based on wall orientation.
N
Envelope Skinny triple pane windows U-factor of 0.20 for all windows, with no changes to existing framing or building structure.
Market not ready. No commercially-available products for commercial buildings. N
Envelope Permanent projections
Detailed prescriptive requirements for shading based on ASHRAE 189. PF >0.50 for first story and >0.25 for other floors. Many exceptions. Corresponding SHGC multipliers to be used.
Title 24 already allows owner to trade off SHGC with permanent projections. Also, adding requirements for permanent projections would raise concerns.
N
Envelope Reduced infiltration Reduce infiltration rates by improving building sealing.
Infiltration rates are a fixed ACM input and cannot be changed. A workaround attempt would not be precise, and the practicality of implementation by developers is low given the modeling capabilities and the fact that in-field verification is challenging. Benefits would predominantly be for air quality rather than energy.
N
Page 309 of 319

2019 Nonresidential New Construction Reach Code Cost Effectiveness Study
99 2019-07-25
Building Component Measure Name Measure Description Notes Include?
HVAC Heat recovery ventilation For the hotel, recover and transfer heat from exhausted air to ventilation air.
For small hotels, the ventilation requirement could be met by various approaches, and the most common ones are: a. Exhaust only system, and ventilation is met by infiltration or window operation. b. Through a Z-duct that connects the zone AC unit’s intake to an outside air intake louver. c. Centralized ventilation system (DOAS) The prototype developed for the small hotel is using Type 2 above. The major consideration is that currently, HRV + PTACs cannot be modeled at each guest room, only at the rooftop system. Option 1 would require the same type of HRV implementation as Option 2. Option 3 may be pursuable, but would require a significant redesign of the system, with questionable impacts. Previous studies have found heat recovery as cost effective in California only in buildings with high loads or high air exchange rates, given the relatively mild climate.
N
HVAC Require Economizers in Smaller Capacity Systems
Lower the capacity trigger for air economizers. Previous studies have shown cost effectiveness for systems as low as 3 tons.
Y
HVAC Reduce VAV minimum flow limit
Current T24 and 90.1 requirements limit VAV minimum flow rates to no more than 20% of maximum flow. Proposal based on ASHRAE Guideline 36 which includes sequences that remove technical barriers that previously existed. Also, most new DDC controllers are now capable of lower limits. The new limit may be as low as the required ventilation rate. A non-energy benefit of this measure is a reduction in over-cooling, thus improving comfort.
Y
Page 310 of 319
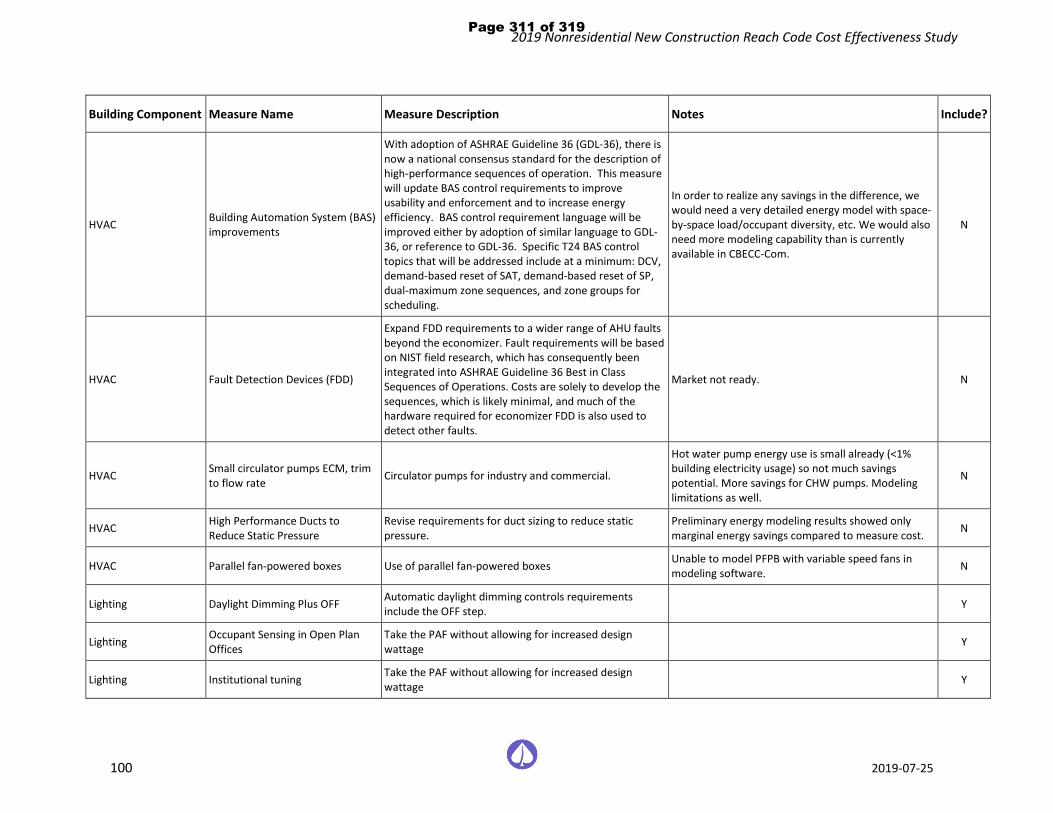
2019 Nonresidential New Construction Reach Code Cost Effectiveness Study
100 2019-07-25
Building Component Measure Name Measure Description Notes Include?
HVAC Building Automation System (BAS) improvements
With adoption of ASHRAE Guideline 36 (GDL-36), there is now a national consensus standard for the description of high-performance sequences of operation. This measure will update BAS control requirements to improve usability and enforcement and to increase energy efficiency. BAS control requirement language will be improved either by adoption of similar language to GDL-36, or reference to GDL-36. Specific T24 BAS control topics that will be addressed include at a minimum: DCV, demand-based reset of SAT, demand-based reset of SP, dual-maximum zone sequences, and zone groups for scheduling.
In order to realize any savings in the difference, we would need a very detailed energy model with space-by-space load/occupant diversity, etc. We would also need more modeling capability than is currently available in CBECC-Com.
N
HVAC Fault Detection Devices (FDD)
Expand FDD requirements to a wider range of AHU faults beyond the economizer. Fault requirements will be based on NIST field research, which has consequently been integrated into ASHRAE Guideline 36 Best in Class Sequences of Operations. Costs are solely to develop the sequences, which is likely minimal, and much of the hardware required for economizer FDD is also used to detect other faults.
Market not ready. N
HVAC Small circulator pumps ECM, trim to flow rate Circulator pumps for industry and commercial.
Hot water pump energy use is small already (<1% building electricity usage) so not much savings potential. More savings for CHW pumps. Modeling limitations as well.
N
HVAC High Performance Ducts to Reduce Static Pressure
Revise requirements for duct sizing to reduce static pressure.
Preliminary energy modeling results showed only marginal energy savings compared to measure cost. N
HVAC Parallel fan-powered boxes Use of parallel fan-powered boxes Unable to model PFPB with variable speed fans in modeling software. N
Lighting Daylight Dimming Plus OFF Automatic daylight dimming controls requirements include the OFF step. Y
Lighting Occupant Sensing in Open Plan Offices
Take the PAF without allowing for increased design wattage Y
Lighting Institutional tuning Take the PAF without allowing for increased design wattage Y
Page 311 of 319

2019 Nonresidential New Construction Reach Code Cost Effectiveness Study
101 2019-07-25
Building Component Measure Name Measure Description Notes Include?
Lighting Reduced Interior Lighting Power Density Reduced interior LPD values. Y
Lighting Shift from general to task illumination
Low levels of general illumination with task and accent lighting added to locations where higher light levels are required. The shift from general to task illumination measure is based on the assumption that proper lighting of a desk surface with high efficacy lighting can allow for the significant reduction of ambient general lighting.
This is a tough measure to require as the LPDs decrease. N
Lighting Future-proof lighting controls
Fill any holes in the current code that could lead to the situations where TLEDS or LED fixtures that are not dimmable or upgradable in the future, or any other issues with code that make it hard to transition to ALCS/IoT lighting in the future
Major lighting controls already covered in other measures being considered N
Lighting Integrated control of lighting and HVAC systems
Formalize the definition of "lighting and HVAC control integration" by defining the level of data sharing required between systems and the mechanism needed to share such data. The highest savings potential would likely be generated from VAV HVAC systems by closing the damper in unoccupied zones based on the occupancy sensor information from the lighting systems.
Not market ready enough. N
Other NR Plug Load Controls
Energy savings opportunities for plug loads, which may include: energy efficient equipment, equipment power management, occupancy sensor control, and occupant awareness programs. The proposal could be extending controlled receptacles requirements in Section 130.5(d) to more occupancy types. It would also consider circuit-level controls.
Office equipment now all have their own standby power modes that use very little power, making plug load controls very difficult to be cost-effective.
N
Page 312 of 319

2019 Nonresidential New Construction Reach Code Cost Effectiveness Study
102 2019-07-25
6.9 Additional Rates Analysis - Healdsburg After the final version of the report was released, the Reach Code Team provided additional cost effectiveness analysis in Climate Zone 2 using City of Healdsburg electric utility rates and PG&E gas rates. All aspects of the methodology remain the same, and the results for each package and prototype are aggregated below in Figure 79 through Figure 81. Results generally indicate:
♦ Mixed fuel prototypes achieve positive compliance margins for EE packages and are cost effective.
♦ All-electric prototypes achieve slightly lower compliance margins than mixed fuel for EE packages and are cost effective.
♦ All PV and PV+Battery packages are cost effective both using an on-bill and TDV approach.
Page 313 of 319

2019 Nonresidential New Construction Reach Code Cost Effectiveness Study
103 2019-07-25
Figure 79. Healdsburg Utility Rates Analysis – Medium Office, All Packages Cost Effectiveness Summary
Prototype Package
Elec Savings (kWh)
Gas Savings
(therms)
GHG savings (tons)
Comp-liance
Margin (%)
Incremental Package
Cost
Lifecycle Energy
Cost Savings
$-TDV Savings
B/C Ratio (On-bill)
B/C Ratio (TDV)
NPV (On-bill) NPV (TDV)
Medium Office
Mixed Fuel + EE 40,985 -505 8.1 17% $66,649 $89,645 $99,181 1.3 1.5 $22,996 $32,532
Mixed Fuel + EE + PVB 255,787 -505 50.6 17% $359,648 $510,922 $573,033 1.4 1.6 $151,274 $213,385
Mixed Fuel + HE 3,795 550 4.3 4% $68,937 $24,204 $24,676 0.4 0.4 -$44,733 -$44,261
All-Electric -49,684 3,868 5.0 -7% -$73,695 -$7,042 -$41,429 10.5 1.8 $66,653 $32,266
All-Electric + EE -11,811 3,868 15.2 10% -$7,046 $83,285 $58,563 >1 >1 $90,331 $65,609
All-Electric + EE + PVB 203,026 3,868 57.8 10% $285,953 $511,954 $532,273 1.8 1.9 $226,001 $246,320
All-Electric + HE -45,916 3,868 6.1 -5% -$22,722 $6,983 -$26,394 >1 0.9 $29,705 -$3,672
Mixed Fuel + 3kW 4,785 0 0.9 n/a $5,566 $10,430 $10,500 1.9 1.9 $4,864 $4,934
Mixed Fuel + 3kW + 5kWh 4,785 0 0.9 n/a $8,356 $10,430 $10,500 1.2 1.3 $2,074 $2,144
Mixed Fuel + 135kW 215,311 0 41.5 n/a $250,470 $424,452 $471,705 1.7 1.9 $173,982 $221,235 Mixed Fuel + 135kW + 50kWh 214,861 0 42.6 n/a $278,370 $423,721 $472,898 1.5 1.7 $145,351 $194,528
All-Electric + 3kW -44,899 3,868 6.0 n/a -$68,129 $3,299 -$30,928 >1 2.2 $71,429 $37,201
All-Electric + 3kW + 5kWh -44,899 3,868 6.0 n/a -$65,339 $3,299 -$30,928 >1 2.1 $68,639 $34,411
All-Electric + 135kW 165,627 3,868 46.6 n/a $176,775 $424,146 $430,276 2.4 2.4 $247,371 $253,501 All-Electric + 135kW + 50kWh 165,200 3,868 47.7 n/a $204,675 $423,466 $431,469 2.1 2.1 $218,792 $226,795 All-Electric + 80kW + 50kWh 40,985 -505 8.1 17% $66,649 $89,645 $99,181 1.3 1.5 $22,996 $32,532
Page 314 of 319

2019 Nonresidential New Construction Reach Code Cost Effectiveness Study
104 2019-07-25
Figure 80. Healdsburg Utility Rates Analysis – Medium Retail, All Packages Cost Effectiveness Summary
Prototype Package
Elec Savings (kWh)
Gas Savings
(therms)
GHG savings (tons)
Comp-liance
Margin (%)
Incremental Package
Cost
Lifecycle Energy
Cost Savings
$-TDV Savings
B/C Ratio (On-bill)
B/C Ratio (TDV)
NPV (On-bill) NPV (TDV)
Medium Retail
Mixed Fuel + EE 18,885 613 8.7 13% $5,569 $49,546 $59,135 8.9 10.6 $43,977 $53,566
Mixed Fuel + EE + PVB 189,400 613 43.8 13% $249,475 $376,219 $465,474 1.5 1.9 $126,744 $215,999
Mixed Fuel + HE 2,288 229 2.0 3% $9,726 $13,143 $13,998 1.4 1.4 $3,417 $4,273
All-Electric -21,786 2,448 7.5 -1% -$27,464 $9,228 -$4,483 >1 6.1 $36,692 $22,981
All-Electric + EE 2,843 2,448 14.6 13% -$21,895 $61,918 $56,893 >1 >1 $83,813 $78,788
All-Electric + EE + PVB 173,387 2,448 49.9 13% $222,012 $391,257 $463,431 1.8 2.1 $169,245 $241,419
All-Electric + HE -16,989 2,448 8.9 3% -$4,211 $23,567 $11,251 >1 >1 $27,779 $15,463
Mixed Fuel + 3kW 4,685 0 0.9 n/a $5,566 $10,256 $10,262 1.8 1.8 $4,690 $4,696
Mixed Fuel + 3kW + 5kWh 4,685 0 0.9 n/a $8,356 $10,256 $10,262 1.2 1.2 $1,900 $1,906
Mixed Fuel + 110kW 171,790 0 33.3 n/a $204,087 $316,293 $376,300 1.5 1.8 $112,206 $172,213 Mixed Fuel + 110kW + 50kWh 170,542 0 35.1 n/a $231,987 $320,349 $398,363 1.4 1.7 $88,363 $166,376
All-Electric + 3kW -17,101 2,448 8.4 n/a -$21,898 $19,523 $5,779 >1 >1 $41,421 $27,677
All-Electric + 3kW + 5kWh -17,101 2,448 8.4 n/a -$19,108 $19,523 $5,779 >1 >1 $38,631 $24,887
All-Electric + 110kW 150,004 2,448 40.8 n/a $176,623 $332,213 $371,817 1.9 2.1 $155,591 $195,194 All-Electric + 110kW + 50kWh 148,793 2,448 42.9 n/a $204,523 $335,043 $394,099 1.6 1.9 $130,520 $189,577
Page 315 of 319

2019 Nonresidential New Construction Reach Code Cost Effectiveness Study
105 2019-07-25
Figure 81. Healdsburg Utility Rates Analysis – Small Hotel, All Packages Cost Effectiveness Summary
Prototype Package
Elec Savings (kWh)
Gas Savings
(therms)
GHG savings (tons)
Comp-liance
Margin (%)
Incremental Package
Cost
Lifecycle Energy
Cost Savings
$-TDV Savings
B/C Ratio (On-bill)
B/C Ratio (TDV)
NPV (On-bill) NPV (TDV)
Small Hotel
Mixed Fuel + EE 3,802 976 3.9 7% $20,971 $22,829 $29,353 1.1 1.4 $1,857 $8,381
Mixed Fuel + EE + PVB 130,144 976 31.1 7% $205,967 $254,577 $336,575 1.2 1.6 $48,610 $130,608
Mixed Fuel + HE 981 402 2.7 3% $23,092 $12,291 $11,808 0.5 0.5 -$10,801 -$11,284
All-Electric -
118,739 12,677 40.0 -12% -$1,297,757 -$24,318 -$51,620 53.4 25.1 $1,273,439 $1,246,137
All-Electric + EE -88,410 12,677 45.9 5% -$1,265,064 $45,918 $20,860 >1 >1 $1,310,982 $1,285,924
All-Electric + EE + PVB 38,115 12,677 73.5 5% -$1,080,068 $296,233 $317,296 >1 >1 $1,376,301 $1,397,365
All-Electric + HE -
118,284 12,677 41.2 -11% -$1,283,243 -$83,994 -$44,505 15.3 28.8 $1,199,249 $1,238,738
Mixed Fuel + 3kW 4,785 0 0.9 n/a $5,566 $8,927 $10,332 1.6 1.9 $3,361 $4,766
Mixed Fuel + 3kW + 5kWh 4,785 0 0.9 n/a $8,356 $8,927 $10,332 1.1 1.2 $571 $1,976
Mixed Fuel + 80kW 127,592 0 25.0 n/a $148,427 $229,794 $275,130 1.5 1.9 $81,367 $126,703 Mixed Fuel + 80kW + 50kWh 126,332 0 28.1 n/a $176,327 $236,570 $296,058 1.3 1.7 $60,243 $119,731
All-Electric + 3kW -
113,954 12,677 40.9 n/a -$1,292,191 -$14,447 -$41,288 89.4 31.3 $1,277,744 $1,250,902
All-Electric + 3kW + 5kWh -
113,954 12,677 40.9 n/a -$1,289,401 -$14,447 -$41,288 89.3 31.2 $1,274,954 $1,248,112
All-Electric + 80kW 8,853 12,677 65.0 n/a -$1,149,330 $222,070 $223,510 >1 >1 $1,371,400 $1,372,840 All-Electric + 80kW + 50kWh 7,849 12,677 67.4 n/a -$1,121,430 $223,812 $239,632 >1 >1 $1,345,241 $1,361,062
Page 316 of 319

Robert S. Kenney Vice President State and Regulatory Affairs
P. O. Box 77000 San Francisco, CA 94177-00001
Mail Code B23A (415) 973-2500
September 23, 2019
VIA EMAIL TO: Sarah Moore, Sustainability Program Manager [email protected]
Mr. Timothy Burroughs Director, Planning and Development Department City of Berkeley 1947 Center Street, 6th Floor Berkeley, CA 94704
Dear Mr. Burroughs:
Pacific Gas and Electric Company (PG&E) is proud to provide electric and natural gas service to the City of Berkeley. And we are committed to helping customers and the community achieve their energy goals. As part of this commitment, PG&E welcomes the opportunity to support the City of Berkeley’s efforts to promote efficient, all-electric new construction, when it is cost-effective.
PG&E strongly supports California’s climate and clean air goals. We recognize that achieving these goals requires a range of approaches and tools, including increasing the use of energy-efficient electric appliances in buildings when cost-effective. PG&E welcomes the opportunity to avoid investments in new gas assets that might later prove underutilized as local governments and the state work together to realize long-term decarbonization objectives. With all this in mind, PG&E supports local government policies that promote all-electric new construction when cost effective.
PG&E recognizes the need for a multi-faceted approach to address climate change, including electrification, as well as opportunities to decarbonize the gas system with renewable natural gas and hydrogen. As electrification policies are implemented and as large scale renewable gas options develop, PG&E will continue to ensure the safe and reliable operation of the existing gas system to continue supporting the customers that depend on it.
PG&E appreciates the partnership with the City of Berkeley during its policy development process, which allows us to prepare for the future and continue providing the best service possible to customers. PG&E remains ready to engage with our customers, local government, businesses, and community members to meet their needs safely, reliably, affordably, and with clean energy.
PG&E looks forward to continuing to work with the City of Berkeley to accomplish its policy goals.
ATTACHMENT 4Page 317 of 319

September 23, 2019 Page 2 of 2 Thank you, and have a safe day. Sincerely,
Robert S. Kenney Vice President cc: Berkeley Mayor Jesses Arreguin and Councilmembers Alex Roshal, Chief Building Official and Building and Safety Division Manager Billi Romain, Office of Energy and Sustainable Development Manager
Anna Brooks, Sr. Manager, Public Affairs, PG&E [[email protected]] Darin Cline, Sr. Manager, Government Relations, PG&E [[email protected]]
Page 318 of 319

Attachment 5
NOTICE OF PUBLIC HEARINGBERKELEY CITY COUNCIL
Adoption of Berkeley Building Codes
The Department of Planning is proposing that City Council adopt the second reading of an ordinance an Ordinance repealing and reenacting the Berkeley Building, Residential, Electrical, Mechanical, Plumbing, Energy and Green Building Standards Codes in BMC Chapters 19.28, 19.29, 19.30, 19.32, 19.34, 19.36 and 19.37, and adopting related procedural and stricter provisions.
The hearing will be held on December 3, 2019 at 6:00 p.m. in the School District Board Room, 1231 Addison Street
A copy of the agenda material for this hearing will be available on the City’s website at www.CityofBerkeley.info as of November 21, 2019.
For further information, please contact Alex Roshal, Chief Building Official, Manager of Building and Safety Division, Planning and Development Department, 510-981-7445
Written comments should be mailed or delivered directly to the City Clerk, 2180 Milvia Street, Berkeley, CA 94704, in order to ensure delivery to all Councilmembers and inclusion in the agenda packet.
Communications to the Berkeley City Council are public record and will become part of the City’s electronic records, which are accessible through the City’s website. Please note: e-mail addresses, names, addresses, and other contact information are not required, but if included in any communication to the City Council, will become part of the public record. If you do not want your e-mail address or any other contact information to be made public, you may deliver communications via U.S. Postal Service or in person to the City Clerk. If you do not want your contact information included in the public record, please do not include that information in your communication. Please contact the City Clerk at 981-6900 or [email protected] for further information.
Published: The Berkeley Voice – November 15 and November 22, 2019.Public hearing required per California Government Code section 50022.3
~~~~~~~~~~~~~~~~~~~~~~~~~~~~~~~~~~~~~~~~~~~~~~~~~~~~~~~~~~~~~~~~I hereby certify that the Notice for this Public Hearing of the Berkeley City Council was posted at the display case located near the walkway in front of the Maudelle Shirek Building, 2134 Martin Luther King Jr. Way, as well as on the City’s website, on November 21, 2019.
__________________________________Mark Numainville, City Clerk
Page 319 of 319