2018 review cycle application - Destiny Software Inc ...
545
-
Upload
khangminh22 -
Category
Documents
-
view
3 -
download
0
Transcript of 2018 review cycle application - Destiny Software Inc ...


2018 REVIEW CYCLE APPLICATION
SECTION 5310 ENHANCED MOBILITY OF SENIORS & INDIVIDUALS
WITH DISABLITIES GRANT PROGRAM
FOR THE HOUSTON URBANIZED AREA
Section 5310 Grant Application FY 2018 Page 1 of 17 12/26/18
PROGRAM OVERVIEW
Congress establishes the funding for FTA programs through authorizing legislation that amends
Chapter 53 of Title 49 of the U.S. Code. On December 4, 2015, President Obama signed the
Fixing America’s Surface Transportation (FAST) Act, reauthorizing surface
transportation programs through Fiscal Year 2020. The FAST Act continued the 5310 Enhanced
Mobility of Seniors and Individuals with Disabilities formula program established in MAP-21.
Eligible applicant may include private, non-profit organizations, which are corporations or
associations determined by the Secretary of the Treasury to be an organization described by 26
U.S.C. 501(c); public bodies that certify to the governor that no non-profit corporations or
associations are readily available in an area to provide the service; and public bodies approved by
the state to coordinate services for seniors and persons with disabilities.
Eligible Activities - At least 55 percent of funds must be used for those public transportation
capital projects that are planned, designed, and carried out to meet the special needs of seniors and
individuals with disabilities when public transportation is insufficient, inappropriate, or
unavailable.
In addition to the above required capital projects, no more than 45% of finds may be used for
public transportation projects that exceed the requirements of the Americans with Disabilities
(ADA), improve access to fixed-route service and decrease reliance by individuals with
disabilities on ADA complementary paratransit service or provide alternatives to public
transportation that assist seniors and individuals with disabilities with transportation.
For detailed list of eligible projects refer to FTA Circular 9070.1G.
Match Requirements For capital project, the federal share of eligible costs may not exceed 80
percent of the net cost of the activity, leaving the local share at no less that 20 percent. For
operating costs, the local share may not exceed 50 percent.
Items classified as administrative activities are funded at 100%, requiring no local match. All of
the local match must be provided from sources other than Federal DOT funds. Examples of
sources of local match that may be used include the following:
State or local appropriations
Other non-DOT Federal funds
Dedicates tax revenues
Private donations
Revenue from human service contracts
Net income generated from advertising and concessions

2018 REVIEW CYCLE APPLICATION
SECTION 5310 ENHANCED MOBILITY OF SENIORS & INDIVIDUALS
WITH DISABLITIES GRANT PROGRAM
FOR THE HOUSTON URBANIZED AREA
Section 5310 Grant Application FY 2018 Page 2 of 17 12/26/18
FUNDING AVAILABILITY
The funding available for the Houston UZA is based on the FY2018. The 2018 apportionment is
net of the allocation to METRO, Ft. Bend County and Harris County.
Funding Availability
FY2018 Total
Houston UZA $824,381
$824,381
PROGRAM DATES
December 29 and 30, 2018 Advertisement in
the Houston Chronicle
January 10, 2019 Deadline for written
responses to questions
December 31, 2018 e-mail notification February 8, 2019 Electronic Applications due
by 4 pm
January 8, 2019 Pre Application Workshop March 2019 Project Evaluation Team
Finalizes selection
January 10, 2019 Deadline for written
questions
April – May 2019 project funding presented to
METRO Board of Directors for approval and
H-GAC Transportation Policy Council for
inclusion in the regional Transportation
Improvement Program, State Transportation
Improvement Program and Regional
Coordination Plan.

2018 REVIEW CYCLE APPLICATION
SECTION 5310 ENHANCED MOBILITY OF SENIORS & INDIVIDUALS
WITH DISABLITIES GRANT PROGRAM
FOR THE HOUSTON URBANIZED AREA
Section 5310 Grant Application FY 2018 Page 3 of 17 12/26/18
GRANT APPLICATION GUIDELINES
Instructions: Please click on each shaded area to enter your application information. As you type
in each field, the field will expand. Enter information in the shaded fields only.
PART I- APPLICANT INFORMATION
a) Project Sponsor and Contact Information:
Legal Name:
Fort Bend County
Otherwise Known As:
Fort Bend Transit
Federal Identification Number, DUNS Number:
1746001969231 04-149-7075
Primary Contact Person:
Yvette R. Maldonado
Title:
Finance & Administration Manager
Department:
Fort Bend County Public Transportation
Organization:
Fort Bend County
Telephone Number:
281-243-6722
Fax No.:
281-243-6715
Email Address:
Secondary Contact Person (optional):
Perri D’Armond
Title:
Assistant Director

2018 REVIEW CYCLE APPLICATION
SECTION 5310 ENHANCED MOBILITY OF SENIORS & INDIVIDUALS
WITH DISABLITIES GRANT PROGRAM
FOR THE HOUSTON URBANIZED AREA
Section 5310 Grant Application FY 2018 Page 4 of 17 12/26/18
Department:
Fort Bend County Public Transportation
Organization:
Fort Bend County
Telephone Number:
281-633-7433
Fax No.:
281-243-6715
Email Address:
Main Office
Address:
301 Jackson
City/ State/ Zip
Richmond, TX 77469
b) Agency Type
Please identify your agency as the following:
State or local governmental entity/authority
Operator of public transportation services (privately owned)
Operator of public transportation services (publicly owned)
Private, non-profit organization (Please attach appropriate documentation certifying non-
profit status to this application.)
c) Agency Profile
Please provide key descriptive information about your agency:
Years in business
Fort Bend Transit (FBT) Department has been in existence
since 2005
13 Years
Annual budget
County Fiscal Year FY2019
$10 mil

2018 REVIEW CYCLE APPLICATION
SECTION 5310 ENHANCED MOBILITY OF SENIORS & INDIVIDUALS
WITH DISABLITIES GRANT PROGRAM
FOR THE HOUSTON URBANIZED AREA
Section 5310 Grant Application FY 2018 Page 5 of 17 12/26/18
Number of employees
Fort Bend Transit: 24 Full-Time & 3 Part-Time Employees
First Transit Bus Service Employees: 82
Ambassador Program Employees: 14
27 County Employees
+ 96 Contractors
Years of transit experience
Staff employed at Fort Bend Transit has combined years of
transit experience exceeding 30+ years.
30+ Years
Fleet size
Fort Bend Transit currently has an active fleet of 43 vehicles
but also uses vehicles provided through our service contractor.
43 Revenue Vehicles
d) Grantee Status
Is your agency an existing Federal or State grantee?
No
Yes
If yes, please mark all that apply:
Section 5307 (Federal Designated Recipient)
Section 5307 (Federal Grantee)
Section 5310 (State Grantee)
Section 5311 (State Grantee)
Other: Section 5311 Federal, Section 5310; Section 5309, Congestion Mitigation Air
Quality and Texas Commission of Environmental Quality

2018 REVIEW CYCLE APPLICATION
SECTION 5310 ENHANCED MOBILITY OF SENIORS & INDIVIDUALS
WITH DISABLITIES GRANT PROGRAM
FOR THE HOUSTON URBANIZED AREA
Section 5310 Grant Application FY 2018 Page 6 of 17 12/26/18
e) Contract Authority
List the name(s) and title(s) of persons authorized to enter into contracts and agreements
with METRO.
Name:
Judge Kyle P. George
Title:
County Judge
f) Project Partners
Organization #1:
Contact Name:
Address:
City/ State/ Zip
Phone Number:
Fax No.:
Email Address:
Organization #2:
Contact Name:
Address:
City/ State/ Zip

2018 REVIEW CYCLE APPLICATION
SECTION 5310 ENHANCED MOBILITY OF SENIORS & INDIVIDUALS
WITH DISABLITIES GRANT PROGRAM
FOR THE HOUSTON URBANIZED AREA
Section 5310 Grant Application FY 2018 Page 7 of 17 12/26/18
Phone Number:
Fax No.:
Email Address:
PART II – PROJECT INFORMATION
a) Project Title/Name (Limit: 2 lines)
Ambassadors Program
b) Brief Description (Limit: one-half Page)
Fort Bend County is requesting continuation of funds to support its Ambassador Program.
Fort Bend County Public Transportation, also known as Fort Bend Transit (FBT), was created
in June 2005, Ambassadors services were launched and established in 2009 through a New
Freedom grant. This grant supported new public transportation services and public
transportation alternatives beyond those required by the Americans with Disabilities Act
(ADA). FBT introduced Ambassador services, which were developed to assist seniors and
individuals with disabilities who have difficulty traversing the public transportation system
due to physical or cognitive disabilities.
Federal legislation, known as MAP21, eliminated designated programming for New Freedom
programs and allowed funding for these types of projects to be eligible under the Section 5310
Program. FBT has exhausted its New Freedom operating programming and need to move
Ambassador Program services to Section 5310. FBT is requesting federal funds in the amount
of $307,770. FBT’s preference would be to use $153,885 in TDC’s in lieu of local match, but
if TDC’s are unavailable FBT will provide up to $153,885 in cash local match. As the services
are contracted, federal regulations allow a portion of the operating expenses to be reimbursed
under Operating Assistance (50% reimbursement from the net project cost). The budget
attached to this application reflects this allowance.
c) Project Type
Please mark all that apply:
Capital (including Mobility Management & Purchase of Service)
Operating
Both

2018 REVIEW CYCLE APPLICATION
SECTION 5310 ENHANCED MOBILITY OF SENIORS & INDIVIDUALS
WITH DISABLITIES GRANT PROGRAM
FOR THE HOUSTON URBANIZED AREA
Section 5310 Grant Application FY 2018 Page 8 of 17 12/26/18
d) Matching Funds
Please indicate the source and the amount of local funds your agency has secured toward the
local match requirement:
Source: Transportation Development Credits*
Amount: $ 153,885
*Fort Bend Transit will be submitting a Transportation Development Credit (TDC)
Application to the Houston Galveston Area Council (HGAC) for TDC’s for this grant
application (Attachment A).
Source: County Local Match
Amount: $ 153,885
*Fort Bend Transit will provide local cash match up to $153,885 if HGAC does not award
TDC’s.
Source:
Amount: $
e) Project Timeline
Start Date: June 1, 2019
End Date: May 31, 2020
f) Service Area
Congressional District(s) (by number):
9, 14 and 22
Briefly describe the service area:
Urbanized areas of Fort Bend County.
City or Cities Served:
All cities in Fort Bend County: Arcola, Beasley, Village of Fairchild, Fulshear, portions of
Houston within the County Katy, Kendleton, Meadows Place, Missouri, Needville, Orchard,
Pearland, Pleak, Richmond, Rosenberg, Simonton, Stafford, Sugar Land, and Thompsons
Town. Including Commuter Service into the Texas Medical Center. Greenway Plaza and
Galleria areas of Houston in Harris County. Connections are provided to Houston’s METRO
service for passengers wishing to access other areas of Houston.
Geographic Area Served by the project (neighborhoods, census tracts, etc.):
Ambassador services are provided throughout Fort Bend County, Fort Bend Transit’s Demand
Response service area.

2018 REVIEW CYCLE APPLICATION
SECTION 5310 ENHANCED MOBILITY OF SENIORS & INDIVIDUALS
WITH DISABLITIES GRANT PROGRAM
FOR THE HOUSTON URBANIZED AREA
Section 5310 Grant Application FY 2018 Page 9 of 17 12/26/18
g) Estimated number of individuals to be served by your project annually. (All
projects)
Per FTA Circular, provide the total number
of passengers currently served by your
agency’s transportation program
Per FTA Circular, provide the percent of
national origins currently served by your
program. (Total 100%)
Number of seniors 8% American Indian & Alaska Native .3%
Number of persons w/disabilities 0% Asian 19.3%
Number of elderly w/disabilities 0% Caucasian 31%
General Public Transportation 92% Black or African American 20.6%
Hispanic or Latino 17.6%
Total must be 100 100% Native Hawaiian & Other 0%
All Other 11.2%
Total must be 100 100%
Note: Census information may be obtained at http://factfinder.census.gov/home/saff/main.html
*Job access, non-senior, non-disabled
Describe and attach supporting documents for the above estimate of target market(s):
The target population for this program is seniors and individuals with cognitive disabilities.
According to the American Community Survey conducted by the US Census Bureau, the
overall percentage of those with a disability in the US population increased from 11.9% in
2010 to 12.8% in 2016. In Texas alone, the percentage of individuals with a disability is 11.6%
and 8% of the population within Fort Bend County.
Census information may be obtained at: https://disabilitycompendium.org/sites/default/files/user-uploads/2017_AnnualReport_2017_FINAL.pdf
https://www.disabled-world.com/disability/statistics/scc.php#county
Describe and attach surveys, needs assessment(s), letters, etc. that document development of
project need:
Before the Ambassadors Program was implemented in 2009, informal meetings were held
between Fort Bend Transit and various social service and senior center agencies. Information
provided in these meetings indicated that individuals with cognitive disabilities needed
assistance traversing the public transportation system and seniors needed physical assistance
boarding and alighting vehicles as well as assistance carrying bags, walkers, canes, etc.
Ambassadors Program project was developed to meet those needs.
h) Proposed Service is:
New
Expansion

2018 REVIEW CYCLE APPLICATION
SECTION 5310 ENHANCED MOBILITY OF SENIORS & INDIVIDUALS
WITH DISABLITIES GRANT PROGRAM
FOR THE HOUSTON URBANIZED AREA
Section 5310 Grant Application FY 2018 Page 10 of 17 12/26/18
Continuation
i) Service Characteristics for Operating Projects
Current One-ways Annually (existing projects)
FY18 23,652 Elderly & Disabled trips
Projected One-way Trips Annually, proposed
FY19 Projected 24,835 Elderly & Disabled trips
PART III – PROJECT BUDGET NOTES
Budget Worksheet
An Excel File template has been developed to use for the project budget. You should enter your project
budget into that file, save the file with your project name, and submit it along with the completed
application form.
Fi
Applicants should attach audited financial statements for the two (2) most recent fiscal years including
the audit firm’s certification and management letter with response (as applicable). Please note that
this is an application requirement.
The FY18 report is not yet available, but the links below are for our FY17, and FY16 Comprehensive
Annual Financial Reports (CAFR) and a copy can also be found in Attachment E:
FY17: https://www.fortbendcountytx.gov/home/showdocument?id=43461
FY16: https://www.fortbendcountytx.gov/home/showdocument?id=40406
Letters of Commitment from Stakeholders
Please attach all letters of commitment for match and project support.
Letter of Commitment from Fort Bend County and Project Support from Fort Bend Seniors are
included in Attachment B.

2018 REVIEW CYCLE APPLICATION
SECTION 5310 ENHANCED MOBILITY OF SENIORS & INDIVIDUALS
WITH DISABLITIES GRANT PROGRAM
FOR THE HOUSTON URBANIZED AREA
Section 5310 Grant Application FY 2018 Page 11 of 17 12/26/18
PART IV – CONSISTENCY WITH SELECTION CRITERIA In addition to the project description required in the previous section, answers to the following
questions will be used to evaluate proposals. All questions must be answered or noted as “Not
Applicable.” You may attach pages if necessary, not to exceed three (3) additional pages.
Section 1 – Project Benefits
1. In detail, describe how the proposed project is important to seniors and individuals with
disabilities and describe how the project provides new services beyond those mandated by the
American with Disabilities Act (ADA). Explain how the project will:
Improve Service Integration
Transportation is essential for people of all ages and backgrounds to live a fulfilling and
satisfying life. It plays a vital role in many aspects of daily life including access to
employment, health care, shopping, and social occasions. Despite the apparent
importance, many people do not have access to the assistance needed to use a public
transportation system.
Ambassadors Program lays the foundation for continued service integration between FBT
and its’ elderly and disabled passengers. Representatives of Senior Centers, indicating that
seniors need physical assistance boarding and disembarking vehicles, carrying bags,
walkers, etc, initially identified the need. Caregivers and caregiver associates for
individuals with cognitive disabilities indicated the inability to travel without an attendant
prevents caregivers from being employed and prevents those they care for from interacting
with others independently. FBT is providing Ambassador assistance to more than 100
passengers per day. In FY2018, our Ambassador Service provided over 29,000
accommodations to individuals requiring additional assistance during transit.
Continuation of funding under the 5310 program allows FBT to continue to ensure the
needs of passengers are addressed.
Improve Accessibility
While going to the doctor or picking up groceries might be an easy and simple task for
many it can be a huge order for elderly individuals or those with a disability. Individuals
with cognitive disabilities might not be able to independently traverse a public
transportation system at all or without prior training.
Ambassadors work directly with passengers assisting at the rider’s door to the vehicle and
from the vehicle to the final destination. Ambassadors’ aid consists of gentle support, such
as opening doors and providing verbal guidance. At times, they may provide physical
support such as assisting passengers with balance problems, climbing steps, handling
packages or providing directions, prompting individuals to be aware of safety issues
(securing seatbelts, not stepping out into traffic, etc.). Ambassadors may also give a “hand
2018 REVIEW CYCLE APPLICATION
SECTION 5310 ENHANCED MOBILITY OF SENIORS & INDIVIDUALS
WITH DISABLITIES GRANT PROGRAM
FOR THE HOUSTON URBANIZED AREA
Section 5310 Grant Application FY 2018 Page 12 of 17 12/26/18
to hand” service. Hand to hand service encompasses the escort of a rider from one hand
of a caregiver or representative to another caregiver or representative. This personalized
assistance is to assist with the safe passage for those unable to travel unescorted or alone.
Ambassadors may also be assigned to bus stop locations and/or transit vehicles.
Ambassadors act in a training capacity by assisting passengers to travel independently.
Improve Productivity
Drivers are not able to assist individuals with disabilities. The driver’s responsibility is
the safe conveyance of the vehicle and its passengers. Their focus is on traffic, the
operation of the wheelchair lift, monitoring bicycle attachment, and removal to bike racks,
etc. Drivers cannot safely leave buses unattended while assisting passengers to and from
buildings or at bus stops. Ambassadors provide a safe segway into the public
transportation services.
The Ambassadors must successfully complete passenger assistance training as well as
other training related to their duties ensuring our passengers are getting the best service
and the number of accidents or incidents related to passengers needing assistance is kept
to a minimum. The assistance from the Ambassadors also ensures passengers can board
and alight within the given scheduling timeframe.
Provide Flexible Transit Services
Ambassadors Program allows FBT to enhance service by providing an additional amenity
to the elderly and disabled passengers. By offering this flexibility, it encourages
comfortability of the elderly and disabled population to use public transportation. The
Ambassadors offer a sense of comfort and calm the passengers with their presence and
support, and this is especially important to our Senior Center and Adult Day Care
passengers. It allows these individuals to live their lives independently.
Enhance Mobility for Seniors and People with Disabilities
The Ambassadors services allow the elderly and disabled passengers a sense of
independence to take control of their lives that they might not have without this service.
The service encourages passengers to make more trips by way of public transportation.
Also, the Ambassadors services allow the family members to return to work or other
responsibilities as the Ambassador accompanying the passenger while using public
transportation might alleviate the need for a caretaker to do so.
Section 2 - Goals and Objectives
1. Is this project included in the 2011 Updated Coordination Plan?

2018 REVIEW CYCLE APPLICATION
SECTION 5310 ENHANCED MOBILITY OF SENIORS & INDIVIDUALS
WITH DISABLITIES GRANT PROGRAM
FOR THE HOUSTON URBANIZED AREA
Section 5310 Grant Application FY 2018 Page 13 of 17 12/26/18
Yes
Page Number in Plan where project is listed:
The project can be found on page 47 of the 2011 Updated Coordination Plan.
Identify the project included in the Plan:
The project included in the plan is identified as G.A.P.S
If not, is the project eligible for inclusion in the Plan by meeting a need identified in the Plan?
Yes
Page Number in Plan where need is identified:
Not Applicable.
2. Does the project support the goals of the Enhanced Mobility of Seniors and Individuals with
Disabilities program?
Yes
Explain how this project meets the program goals:
The program goals for Section 5310 funding are to “improve mobility for seniors and individuals
with disabilities by removing barriers to transportation services and expanding the transportation
mobility options available.” Individuals with physical or cognitive disabilities might not be able
to independently traverse the public transportation systems available at all or without prior
training. The Ambassadors provide on route or bus stop assistance to passengers needing
assistance when boarding or disembarking the vehicles or to and from building entrances. They
might also assist the passenger with their bags, cane, or walker. They also provide a sense of
safety for those with cognitive disabilities by identifying the correct bus for boarding or ensuring
that an individual is accompanied to and from caretaker locations.
This project addresses the need to provide a service customized to alleviate the barriers to
independent travel identified by seniors and individuals with disabilities population over and
beyond what is typically offered in a public transportation system. Those who utilize the service
have commented the service allows them to gain a sense of independence and gives the family
members more independence and comfort.
Section 3 – Project Plan/Coordination Plan/Implementation Plan
1. Describe how the project is being coordinated with public and/or private transportation and/
or social service agencies.
In 2007, Fort Bend County entered into an agreement with Fort Bend Seniors Meals on Wheels
- and Much, Much More (FBS) to provide transportation services. Before that, the agency was
directly providing transportation services for seniors. Our collaboration has prevented
duplicative use of funding sources. FBS continues to determine eligibility for the program

2018 REVIEW CYCLE APPLICATION
SECTION 5310 ENHANCED MOBILITY OF SENIORS & INDIVIDUALS
WITH DISABLITIES GRANT PROGRAM
FOR THE HOUSTON URBANIZED AREA
Section 5310 Grant Application FY 2018 Page 14 of 17 12/26/18
utilizing the Houston Galveston Area Agency on Aging requirements and refers the applicants
to FBT for their transportation needs.
The seniors enjoy daily activities of living and being able to participate in the various programs
offered by FBS; they especially appreciate that the transportation services offer enhanced
services by way of an Ambassador.
2. Describe how the specific coordination activities are expected to result in better utilization of
access to resources.
Riding public transportation is not always an option for those who need additional assistance.
In 2009, the community indicated individuals could not always find attendants to ride with
them and attendants that did ride often had to be absent from work themselves or could not
work at all. Caregivers indicated individuals with cognitive disabilities could not utilize bus
stops due to safety concerns. Implementation of the Ambassador program eliminated these
issues and reduced incidents and accidents both on board vehicles and near vehicles.
Ambassadors work directly with passengers and are individuals providing physical assistance,
monitoring activities at bus stops, escorting to and from buses, in and out of buildings and
monitoring activities on buses.
In FY17, FBT continued its coordination activities with Texana, Fort Bend County’s
Intellectual and Development Disability Authority (LIDDA) and the Local Mental Health
Authority, by entering into an interlocal agreement to provide buses for transportations
services provided by Texana to their clients. FBT continues to provide trips for Texana clients
whose trips are best suited for public transportation. Many of these trips can be performed
because of Ambassador services available. The additional coordination activities allow
Texana the equipment necessary to perform trips needed outside of FBT”s operating hours or
during FBT’s peak hours.
Ambassadors Program will allow FBT to utilize its funding resources. The Ambassadors
services were to fold into our urban area-funding stream; however, with the inception of MAP
21, we are faced with a funding challenge. MAP 21 places a cap on operating expenses in
Section 5307 funding stream making it difficult to sustain and expand services. As such, FBT
has developed a multifaceted approach to mitigate these issues. FBT’s mitigation activities
have included:
Reprogramming grant balances in pre-MAP 21 grants to operating.
Revised budget requests to maximize the amount of funding programmed to the
operating expense budget.
Reprogramming capital and planning expenses to post-MAP 21 grants.
Requesting extensions or additional funding under the JARC and New Freedom
programs
Identifying and seeing other local funding sources to allow reprogramming of existing
local funds.

2018 REVIEW CYCLE APPLICATION
SECTION 5310 ENHANCED MOBILITY OF SENIORS & INDIVIDUALS
WITH DISABLITIES GRANT PROGRAM
FOR THE HOUSTON URBANIZED AREA
Section 5310 Grant Application FY 2018 Page 15 of 17 12/26/18
Researching, identifying and pursuing local and state legislative options and processes
for mitigation.
The overall goal is to complete the Federal legislative process aimed at removing the operating
cap.
Upon approval of this application, FBT can reduce the amount of funding under the Section
5307 relative to the amount awarded allowing a lower operating expense counted under the
MAP21 operating cap. Continuation of this project will complement the efforts needed to
ensure the continuation of services operated by Fort Bend County due to the threat of their
continuation evident in the MAP21 legislation.
3. If proposing new service, provide an operating plan for implementing the project.
Ambassadors Program is not a new project but a continuation of services previously funded
under a New Freedom grant.
4. Describe how the project will be marketed to the target population and provide your
organization Limited English Proficiency Plan.
FBT’s Reservationists are trained to ask if the passenger needs assistance while taking
reservations and if so, then the Scheduler ensures that an Ambassador is available either on
the route or at the bus stop to accommodate the need. Our various social service agencies also
work with the Mobility Manager to ensure if a need is present that an Ambassador is assigned.
The Mobility Manager also provides service information along with Ambassador information
during monthly outreach events and meetings with various social service agencies and senior
centers. FBT also ensures it provides all of its vital documents in both English and Spanish;
including, but not limited to outreach and transit service brochures or pamphlets. Clients also
have the option to call our office in which they can speak with a department employee who
can verbally communicate with them in Spanish.
Our Limited English Proficiency Plan is incorporated in the Title VI Program starting on page
47 of Attachment D.
The ARC, Texana and Fort Bend Seniors all continue to coordinate transportation
programming with Fort Bend County. They also refer their clients to our transportation
services. In addition, the ARC supports our Ambassadors Program by providing referrals and
job coaching services to individuals interested in becoming an Ambassador or Passenger
Attendant.
Section 4 – Project Financial Status /Monitoring /Sustainability

2018 REVIEW CYCLE APPLICATION
SECTION 5310 ENHANCED MOBILITY OF SENIORS & INDIVIDUALS
WITH DISABLITIES GRANT PROGRAM
FOR THE HOUSTON URBANIZED AREA
Section 5310 Grant Application FY 2018 Page 16 of 17 12/26/18
1. Indicate whether the project has a full funding plan, if not, describe any potential long-term
efforts or funding sources that could sustain the project beyond the Section 5310 grant
period.
If funding is not approved Fort Bend County will fund the Ambassadors Program from Section
5307, Section 5311 and local county funds. Fort Bend County plans to include the costs to
continue to provide these services in its annual 5310 requests to METRO.
2. Describe how you plan to monitor your project.
FBT Operations team meets on a weekly basis to assess operation’s needs, growth areas,
strategic planning, and program implementation. Monthly Staff Meetings are also held
where customer input is reviewed along with financial and operational data. If goals are not
being met, route and/or schedules are reviewed to determine if changes are warranted. To
date, all of our programs have been successful.
3. Describe how you will measure the success of the project. Include any performance
measures for the project.
Project success is measured by both customer satisfaction and performance. Incidents,
accidents, customer complaints, and compliments are monitored on a monthly basis along
with other operational data. Data from these indicators is tracked across the year and fiscal
years and watched for trends.

2018 REVIEW CYCLE APPLICATION
SECTION 5310 ENHANCED MOBILITY OF SENIORS & INDIVIDUALS
WITH DISABLITIES GRANT PROGRAM
FOR THE HOUSTON URBANIZED AREA
Section 5310 Grant Application FY 2018 Page 17 of 17 12/26/18
APPLICATION AUTHORITY
(Please print and sign this page. Include a scanned copy of this signed page with your Application
Package.)
By signing the application, I certify to the best of my knowledge that: 1) the information in this
application is true and accurate and that this organization has the necessary fiscal, data collection,
and managerial capability to implement and manage the projects associated with this application, and
that I have authority to submit this Application Package; and 2) is prepared to abide by all applicable
federal requirements specified in 49 U.S.C. Section 5310, FTA Circular C 9070.1G.
Further, I understand that selection of this project for Enhanced Mobility of Seniors and Individuals
with Disabilities grant funding will require compliance with all applicable federal laws and
regulations and that an Interagency Agreement with the Metropolitan Transit Authority of Harris
County (METRO) will be required.
For
Applicant:
Fort Bend County
Project Title:
Ambassadors Program
Name and Title of Signatory:
KP George, County Judge
Authorized Signature:
Date:
February 5, 2019
Please Note: Your application must be signed by someone authorized to sign contracts on behalf
of your agency/organization, such as the Board Chair or Chief Executive Officer. Unsigned
applications will not be accepted.

Attachment A
HGAC TDC Application Form

Date Received :
Agency Information: Date: 1/29/2019
Name:
Address:
Contact Person:
Name:
Phone:
Email:
----
--
MPO ID:
Project Description: Federal cost: 307,770$ TDC Request: 153,885$
Project Status:Regional Transportation Plan Yes No
TIP Year Yes No
Project Type (Priority Use of TDCs) - Choose 1 (one) and Explain:
Regionally Significant Roadway Capacity Project
281-633-7433
Yvette R. Maldonado
3555 Timmons Lane, Houston, Texas 77027
Houston-Galveston Area Council
Transportation Development Credit Application (Rev. 10-25-17)
Projects that will not typically be considered for TDCs because they individually lack regionally significant benefit
include, but not limited to:Transportation enhancement projects,"Stand Alone" sidewalk and on-street bicycle projects,Roadway projects on collector or local streets,
Roadway maintenance, repaving or reconstruction projects without regionally significant added capacity
components,Access management projects, andLivable centers projects.
Fort Bend County Public Transportation is requesting $153,885 in TDC's as local match for our Federal FY2018 Section 5310 Call for Projects application. Funding will be assigned as follows:
Ambassadors Services (50/50) $307,770 Federal $153,885 TDC
2018
1/28/2019 DRAFT - TDC Application Page 1 of 2

Support of Federal Transit Funding
Other Regionally Significant Project
Maintenance of Local Investment:
H-GAC use only:
TPC approval: Agency Notification:
Notes:
Explain and document the effect the TDC's will have on local and non-federal funding support for existing transit services.
Roadways Projects:
Transit Projects:
Explain and document how state or local matching funds will be reinvested in transportation projects
within the 8-county MPO region and are consistant with the RTP.
Fort Bend County will use TDC's as match for operating Ambassador services.
X
With FAST Act apportionments, Fort Bend County is using TDC's to match operating to allow local funds, generally allocated to these projects, to be used instead for additional operating costs in excess of the operating cap. The federal operating cap imposed by the FAST Act is well below the amount which would have typically been eligible for federal reimbursement; consequently, Fort Bend County will use local match cash for the resulting deficit in federal reimbursement.
Fort Bend County provides local match cash in support of public transportation services and has a local funding budget of $2,574,357 for FY2019.
1/28/2019 DRAFT - TDC Application Page 2 of 2

Attachment B
Letters of Support

February 5, 2019 Albert Lyne, CPA, PMP Director Grant Programs Houston METRO Via Email Application Submittal RE: Local Match Support Letter
FY19 Section 5310 Enhanced Mobility of Seniors & Individuals with Disabilities Grant Program for the Houston Urbanized Area
Mr. Lyne, Please accept this letter as assurance that the local match funds necessary to support the attached request for federal funding under the Section 5310 Enhanced Mobility of Seniors & Individuals with Disabilities Grant Program for the Houston Urbanized Area will be provided from Fort Bend County General Revenue funds should the application be awarded, and TDC’s be unavailable. As proposed, $153,885 would be used as the local cash match share, if TDC’s be unavailable. As always we appreciate the efforts of the METRO to provide funding and helping us serve and meet the transportation need of our county’s seniors and individuals with disabilities. If you have any questions regarding this application or need any additional information, please contact Yvette R. Maldonado at 281-633-7433, email [email protected]. Sincerely, KP George County Judge

January 23, 2019
Re: Letter of support, Fort Bend County Transportation, Ambassador Services
Dear Grants Committee:
I’m writing to express my support of the Ambassador Service provided by Fort
Bend County Transportation to Fort Bend Seniors Meals on Wheels (FBS).
Fort Bend Seniors Meals on Wheels is a non-profit serving Fort Bend and Waller
Counties. We have been serving this community since 1974. With the support of
the local communities, we have been able to deliver hot nutritious meals to
seniors for the past 45 years, and now serve more than 1,500 seniors each day.
We provide these much-needed daily meals in addition to recreation activities,
socialization, referral services and more to the seniors visiting our 12 congregate
centers each day. The FBS mission is to enhance seniors’ quality of life and allow
them to remain independent and stay an integral part of the fabric of the Fort
Bend community.
To that end, Fort Bend County Transportation is an integral part of this mission.
Fort Bend County Transportation, and specifically the Ambassador Service, allows
FBS to offer these services by providing seniors with a helping hand with their
daily transportation to our centers. Ambassadors provide assistance from the
passenger’s door to the vehicle, and from the vehicle to one of our 11 congregate
centers in Fort Bend County. This personalized service provides an extra level of
safety that our seniors and their families can take comfort in. Ambassadors
provide gentle support, assist with balance, hold doors open, assist with steps,
and ensure seniors get on and off at the correct locations. The Ambassador
Program offers comfort to both the senior and their family knowing they have a
helping hand allowing them to remain safe and independent as long as possible.
In closing, Fort Bend Transportation Ambassador Services serves fills a gap in our
community that no other organization could easily provide: ensuring seniors
travel safely from the comfort of home to a local congregate center daily. Without
this added safety check, FBS would not be able to serve as many seniors and
would not be able to keep seniors independent and fully involved in the Fort Bend
community. We therefore offer our full support of Fort Bend County
Transportation’s grant application.
Sincerely,
Manuela H. Arroyos, CEO
Fort Bend Seniors Meals on Wheels

Attachment C
Risk Assessment Form

Agency: Fort Bend County
Date: 1/29/2019
No
No
5310 Enhanced Mobility for Seniors and Individuals with Disabilities Grant Program
NO
2. Have you failed to make substantial progress on past grants?
3. Do you have no experience with a similar Grant Program? Yes
If yes, please give details including awarding agency.
No
No
4. Do you have qualified auditor's opinion on a financial statement in the
past five years? If so provide details.
5. Do you have questioned costs on single audits in the last five years? If
so, provide details.
6. Have you had an audit finding relating to cash management in the last
five years? If so provide details.
1. Have you had a grant closed due to material noncompliance in the last 5
years?

Attachment D
Fort Bend County Public TransportationTitle VI Program and Compliance Report

Title VI Program and Compliance Report
Public Transportation Department
Fort Bend County, Texas
December 2009
Revised March 2010
Revised March 2013
Revised March 2016
Prepared by Fort Bend County Public Transportation Department with data research assistance
by Texas A&M Transportation Institute
FINAL
Submitted for approval by
Commissioner’s Court on
March 22, 2016


iii
DISCLAIMER
This report was prepared with funds provided from the Federal Transit Administration (FTA)
and the Texas Department of Transportation (TxDOT). The contents of this report reflect the
views of the authors, who are responsible for the facts and the accuracy of the data presented
herein. The contents do not necessarily reflect the official view or policies of the FTA or
TxDOT.


v
TABLE OF CONTENTS
Page
TABLE OF CONTENTS ............................................................................................................. v
List of Figures .............................................................................................................................. vii List of Tables .............................................................................................................................. viii Introduction ................................................................................................................................... 1 Section 1. FTA Guidance and Instructions ................................................................................ 4
Objectives ................................................................................................................................... 4 General Requirements ................................................................................................................. 4
Specific Requirements for Large Urbanized Areas .................................................................... 5 Requirements for Construction Projects ..................................................................................... 7
Section 2. Overview of Fort Bend County .................................................................................. 9 Population Demographics in Fort Bend County ......................................................................... 9 Fort Bend County Public Transportation Department .............................................................. 12
Section 3. Assessment of Transit Services ................................................................................ 17 Demographic Information ......................................................................................................... 17 Home Locations for Transit Users ............................................................................................ 20 Assessment ................................................................................................................................ 22
Section 4. Access to Transit for Persons with Limited English Proficiency ......................... 30 Linguistically Isolated Households ........................................................................................... 30
Language Spoken at Home ....................................................................................................... 31
Section 5. Title VI Policies and Procedures .............................................................................. 42 Title VI Statement of Policy for Public Transportation ............................................................ 42
Filing a Discrimination Complaint ........................................................................................... 43
Tracking and Investigating Title VI Complaints ...................................................................... 44 Public Notice ............................................................................................................................. 45
Section 6. Public Information About Transit Services and LEP Plan ................................... 47 Summary of Current Public Outreach and Involvement ........................................................... 47 Enhancements for Public Outreach to Title VI Populations ..................................................... 48
Four Factor Analysis ................................................................................................................. 49 LEP Plan ................................................................................................................................... 50 Triennial Reports ...................................................................................................................... 52
Section 7. Services Standards and Policies for Transit in Large Urban Areas ..................... 54 Service Standards and Service Policies .................................................................................... 54 Review of System-Wide Service Changes and Fare Increases ................................................. 58 Review for Title VI Compliance............................................................................................... 59
References .................................................................................................................................... 61

vi
LIST OF APPENDICES
Appendix A – Title VI Demographic Analysis ......................................................................... 62 Appendix B – Language Spoken at Home in Fort Bend County ........................................... 75 Appendix C – Presentations and Outreach .............................................................................. 80 Appendix D – Title VI Complaint Procedures and Complaint Form .................................. 124
Title VI Statement of Policy for Public Transportation .......................................................... 124
Title VI Complaint Procedures ............................................................................................... 125 Title VI Complaint Form ........................................................................................................ 127 Título VI Declaración de Política para el Transporte Público ................................................ 129 Título VI Procedimientos de Denuncia................................................................................... 130 Título VI Formulario de Denuncia ......................................................................................... 132
Appendix E – Letter of No Complaints .................................................................................. 135
Appendix F – Advisory Committee Membership .................................................................. 137
Appendix G – Fort Bend County Public Transportation Subrecipients ............................. 139 Title VI and Subrecipients ...................................................................................................... 139
Appendix H – Commissioner's Court Minutes Adopting Program ..................................... 141

vii
LIST OF FIGURES
Figure 1. Houston Urbanized Area (UZA) in Fort Bend County. .................................................. 6 Figure 2. Fort Bend County Point-Deviation Routes.................................................................... 14 Figure 3. Fort Bend County Public Transportation Regional Transit Destination ....................... 15 Figure 4. Census Tracts in Fort Bend County............................................................................... 18 Figure 5. Transit Rider Home Addresses and Population Density by Census Block Group. ....... 21
Figure 6. Transit Rider Home Addresses and Minority Population. ............................................ 23 Figure 7. Transit Rider Home Addresses and Households Below Poverty Level. ....................... 24 Figure 8. Transit Rider Home Addresses and LEP Population. ................................................... 25 Figure 9. Transit Rider Home Addresses and Linguistically Isolated Households. ..................... 26 Figure 10. Transit Rider Home Addresses and Population 65 Years and Older. ......................... 27
Figure 11. Transit Rider Home Addresses and Persons with Disabilities. ................................... 28
Figure 12. Transit Rider Home Addresses and Population that Speaks Spanish at Home. .......... 32
Figure 13. Transit Rider Home Addresses and Population that Speaks Chinese at Home. .......... 33 Figure 14. Transit Rider Home Addresses and Population that Speaks Vietnamese at Home. .... 34
Figure 15. Transit Rider Home Addresses and Population that Speaks Urdu at Home. .............. 35 Figure 16. Transit Rider Home Addresses and Population that Speaks Other Asian Languages at
Home. .................................................................................................................................... 36 Figure 17. Transit Rider Home Addresses and Population that Speaks African Languages at
Home. .................................................................................................................................... 37
Figure 18. Transit Rider Home Addresses and Population that Speaks Tagalog at Home. ......... 38 Figure 19. Transit Rider Home Addresses and Population that Speaks Hindi at Home. ............. 39
Figure 20. Transit Rider Home Addresses and Population that Speaks Gujarati at Home. ......... 40

viii
LIST OF TABLES
Table 1. Population in Fort Bend County. ...................................................................................... 9 Table 2. Population of Fort Bend County by Race and Ethnicity. ............................................... 10 Table 3. Incorporated Cities in Fort Bend County. ....................................................................... 11 Table 4. Fort Bend County 2014 Demographic Data Used for Maps. ......................................... 22
Table 5. Fort Bend County Linguistically Isolated Households. .................................................. 30 Table 6. Languages Other than English Spoken at Home. ........................................................... 31

1
INTRODUCTION
Title VI of the Civil Rights Act of 1964 is the federal law that protects individuals and groups
from discrimination on the basis of race, color, and national origin in programs and activities that
receive federal financial assistance. Title VI established a standard that outlawed discrimination
in the conduct of all federal activities. Another concern was that high and adverse environmental
impacts of private or governmental actions might fall disproportionately on populations
protected by Title VI. With this concern in mind, Executive Order 12898 was issued in 1994 to
establish requirements for environmental justice to ensure that everyone within the U.S. receives
equal protection under the law. Executive Order 12898 directed each federal agency to review its
procedures and to make environmental justice part of its mission by identifying and addressing
the effect of all programs, policies, and activities on minority populations.
All programs and activities of entities that receive federal financial assistance must also comply
with Executive Order 13166 “Improving Access to Services for Persons with Limited English
Proficiency.” All recipients of federal funds must take reasonable steps to ensure that limited
English proficient (LEP) persons have meaningful access to its programs, services, and
information provided. Persons who do not speak English as their primary language and have a
limited ability to read, speak, write, or understand English may be considered LEP.
The U.S. Department of Transportation (DOT) issued Title VI Regulations (49 CFR part 21) to
ensure that no person is excluded from or denied the benefits of, or otherwise subjected to
discrimination, on the grounds of race, color, or national origin, under any program or activity
receiving federal financial assistance from the DOT. The Federal Transit Administration (FTA)
is an agency within the DOT that provides financial and technical assistance to state and local
public transit systems. FTA Circular 4702.1B provides recipients of FTA financial assistance
with guidance and instructions necessary to carry out the DOT Title VI Regulations and to
integrate into their programs and activities principles of environmental justice and access to
services for persons with limited English proficiency.
The Fort Bend County Public Transportation Department is a recipient of federal funds from the
FTA and must follow the guidance included in FTA Circular 4702.1B. This report serves two
purposes: 1) to provide an assessment of current compliance by Fort Bend County with the
requirements of Title VI pursuant to FTA Circular 4702.1B; and 2) to establish procedures for
future Title VI compliance.
This document is organized into seven sections following this introduction. The material covered
in each section is described as follows:
• Section 1 provides an overview for the guidance and instructions in FTA Circular 4702.1B.
• Section 2 includes information about the population demographics for Fort Bend County and
highlights the transit services and programs sponsored by the Fort Bend County Public
Transportation Department.

2
• Section 3 discusses the sources and types of data used in assessing compliance with Title VI.
Maps illustrating the outcomes of the assessment are also presented.
• Section 4 looks more specifically at what languages other than English are spoken at home
by Fort Bend County residents and gages the extent to which these populations access transit
services.
• Section 5 presents a statement of policy for compliance with Title VI, instructions for how a
member of the public may file a discrimination complaint, and procedures for tracking and
investigating Title VI complaints.
• Section 6 documents the types of public information about transit services currently provided
by the Public Transportation Department and summarizes public outreach and involvement
activities. The LEP Plan is included in Section 6.
• Section 7 provides system-wide service standards and policies in compliance with the FTA
Circular 4702.1B program-specific guidance for recipients that provide transit service in a
large urban area.
Appendices include demographic data by census block groups and by census tracts in Fort Bend
County, summaries of public outreach activities, a copy of the Title VI Complaint Form (in
English and Spanish), and other relevant documentation.

3
This Page Intentionally Left Blank
4
SECTION 1. FTA GUIDANCE AND INSTRUCTIONS
The purpose of this section is to provide an overview for the guidance and instructions in FTA
Circular 4702.1B. The circular applies to all recipients of FTA financial assistance. Compliance
with the guidance and instructions is addressed in Sections 3 through 7 of this document.
OBJECTIVES
Consistent with DOT Title VI Regulations and the principles of environmental justice and access
to services for persons with limited English proficiency, the FTA Circular 4702.1B sets forth the
following objectives:
• Ensure that the level and quality of transportation service is provided without regard to race,
color, or national origin;
• Identify and address, as appropriate, disproportionately high and adverse human health and
environmental effects, including social and economic effects of programs and activities on
minority populations and low-income populations;
• Promote the full and fair participation of all affected populations in transportation decision
making;
• Prevent the denial, reduction, or delay in benefits related to programs and activities that
benefit minority populations or low-income populations; and
• Ensure meaningful access to programs and activities by persons with limited English
proficiency.
GENERAL REQUIREMENTS
The Fort Bend County Public Transportation Department must follow FTA Circular 4702.1B
general requirements to ensure that programs, policies, and activities comply with DOT Title VI
Regulations. These requirements include:
• Submit an annual Title VI assurance as part of the annual Certification and Assurance to
FTA;
• Notify beneficiaries of protection under Title VI;
• Develop Title VI complaint procedures for investigating and tracking Title VI complaints
and make procedures for filing a complaint available to members of the public;
• Prepare and maintain a list of any active Title VI investigations, complaints, and lawsuits
conducted by entities other than FTA; and
• Ensure meaningful access to LEP persons by developing and carrying out a language
implementation plan. FTA requires the Fort Bend County Public Transportation Department to prepare and submit a
Title VI Program to FTA every three years. The program is required to include the following
information:
• Evidence of notice to the public that the Public Transportation Department complies with
Title VI and instructions to the public on how to file a discrimination complaint;

5
• Procedures for tracking and investigating Title VI complaints;
• List of any Title VI investigations, complaints, or lawsuits;
• Summary of public outreach and involvement activities and steps undertaken to ensure that
minority and low-income people have meaningful access to these activities; and
• Plan for providing language assistance for persons with limited English proficiency.
SPECIFIC REQUIREMENTS FOR LARGE URBANIZED AREAS
The FTA Circular 4702.1B has program-specific guidance for recipients that, “operate 50 or
more fixed route vehicles in peak service and are located in an Urbanized Area (UZA) of
200,000 or more people.” While Fort Bend County Public Transportation does not operate 50 or
more fixed route vehicles at peak service hours or any other time, service is provided within the
Houston urbanized area (population 4,944,332 in 2010). Because of its operating environment,
Fort Bend County Public Transportation chooses to adhere to the following guidance for
monitoring the population it serves:
• Collect demographic data and produce maps showing the extent to which members of
minority groups and low-income populations are beneficiaries of transit services;
• Monitor transit service throughout the county through analysis of demographic data;
• Adopt quantitative system-wide service standards to guard against discriminatory service
design or operations decisions;
• Adopt system-wide service policies necessary to guard against service design and operational
policies that have disparate impacts; and
• Evaluate significant system wide service and fare changes and proposed improvements at the
planning and programming stages to determine whether those changes have discriminatory
impact and submit results of service and/or fare equity analyses conducted since the last Title
VI Program submission, including evidence that the board or other governing entity or
official(s) considered, was aware of, and approved the results of the analysis
Figure 1 displays a map of Fort Bend County and shows the areas that are included in the
Houston urbanized area as well as city boundaries and county census tracts.

6
Figure 1. Houston Urbanized Area (UZA) in Fort Bend County.

7
REQUIREMENTS FOR CONSTRUCTION PROJECTS
Recipients of Federal Transit Administration financial assistance are required to conduct a Title
VI equity analysis during the planning phase of all construction projects (i.e. vehicle storage,
operations and maintenance) and during the analysis required by the National Environmental
Policy Act analysis. Since Fort Bend County Public Transportation’s last Title VI update (March
2013) there has been no construction activity. Fort Bend County is planning to construct an
operations and maintenance facility and will undertake all necessary Title VI analyses at that
time.
National Environmental Protection Act Background
The primary law governing the FTA environmental protection process is the National
Environmental Policy Act (NEPA) of 1969 (42 U.S.C. 4321 et seq.), as amended. Many different
federal laws, rules, and regulations govern environmental review of federally assisted mass
transportation projects. NEPA establishes protection of the environment as a national priority
and mandates that environmental impacts must be considered before any federal action likely to
significantly affect the environment is undertaken. Other special purpose statutes and procedures
may apply as well, depending on specific circumstances, e.g., protective measures for historic
properties, wetlands, floodplains, etc. If related environmental review requirements apply, they
are to be undertaken as part of the NEPA compliance process.
The process for complying with NEPA and federal surface transportation statutes is defined in
the joint Federal Highway Administration/ FTA Environmental Impact and Related Procedures
(23 C.F.R 771). The regulation sets forth the agencies' policy of combining all environmental
analyses and reviews into a single process. It defines the roles and responsibilities of FTA and its
grant applicants in preparing documents, and in managing the environmental process within the
various project development phases. http://www.fta.dot.gov/documents/NEPA_reg_clean.pdf
Applicants intending to apply for federal transit funding should notify FTA at the time a project
concept is identified. Once the applicant has furnished sufficient information and documentation,
FTA will advise the applicant of the probable class of action and the related level of
documentation required in the NEPA process. Recipients and sub-recipients of federal funding
for construction projects should integrate an environmental justice analysis into the NEPA
documentation. Recipients are not required to conduct environmental justice analyses of projects
where NEPA documentation is not required.

8
This Page Intentionally Left Blank

9
SECTION 2. OVERVIEW OF FORT BEND COUNTY
The purpose of this section is to provide an overview of the population demographics for Fort
Bend County and to highlight the transit services provided by the Fort Bend County Public
Transportation Department.
POPULATION DEMOGRAPHICS IN FORT BEND COUNTY
Fort Bend County is located along the Gulf Coast region of Texas, within the Houston-Sugar
Land-Baytown metropolitan area, the sixth-largest metropolitan area in the United States with a
population of approximately 6.1 million as of the 2010 U.S. Census estimate. In 2010, Fort Bend
County represented just over 9.5 percent of the total population in the metropolitan area.
Population Growth
The population of Fort Bend County has grown significantly since 1990, as shown in Table 1.
The county’s population in 2014, according to the American Communities Survey 5-year
estimate, was 632,946—8 percent greater than the 2010 U.S. Census population. The Houston-
Galveston Area Council (H-GAC) estimates that Fort Bend County’s population will continue to
grow, adding nearly 200,000 people by the year 2020. The growth from 1990 to 2014 represents
a 181 percent increase and the growth from 1990 to 2020, assuming the H-GAC forecast is
realized, represents a 267 percent increase.
Table 1. Population in Fort Bend County.
Year Population Percent Growth
1990 A 225,421 -
2000 A 354,452 57%
2010 A 585,375 10%
2014 B 632,946 8%
2016 C 731,519 16%
2020 C 827,996 13%
Sources: A U.S. Census
B 2014 American Communities Survey (ACS) 5-Year Estimates
C H-GAC Regional Growth Forecast
Urban and Rural Fort Bend County
Most of the population of Fort Bend County falls within the Houston urbanized area (see Figure
1). In 2010, the Fort Bend County population was 585,375 and 547,198 or 93.5 percent was in
the urbanized area. The remaining population 38,177 or 6.5 percent was in rural Fort Bend
County.
According to the U.S. Census Bureau, the county has a total area of 861.5 square miles. The
average population density was 679.5 persons per square mile as of the 2010 Census and 1,213
persons per square mile according to the 2014 ACS 5-Year Estimates. Rural areas of the county

10
average 400 or fewer persons per square mile. Geographically, large portions of the county are
rural; however, cities are growing rapidly.
Diversity
Fort Bend County is diverse as reflected in racial and ethnic population demographics. Table 2
identifies the population in Fort Bend County by race and ethnicity. The data for 2010 are based
on the U.S. Census decennial survey. The data for 2014 are from the U.S. Census American
Community Survey (ACS) 5-Year Estimates for 2014. The ACS data are published for selected
geographic areas with populations of 65,000 or greater, and represent the results for a sample of
data. The Hispanic or Latino segment of the population maintained its size while the White
alone, Black or African American alone, and Asian alone segments shrunk between 2010 and
2014.
Table 2. Population of Fort Bend County by Race and Ethnicity.
Race and Ethnic Group
2010 2014
Population Percent Population Percent
Total Population 585,375 632,946
Hispanic or Latino 138,967 23.74% 151,616 23.95%
Not Hispanic or Latino 446,408 76.26% 481,330 76.05%
White alone 211,680 36.16% 224,691 35.50%
Black or African American alone 123,267 21.06% 131,378 20.76%
Asian alone 98,762 16.87% 112,762 17.82%
Two or more races, not Hispanic or Latino 10,025 1.71% 10,425 1.65%
American Indian and Alaska Native alone 1,159 0.20% 905 0.14%
Some Other Race alone 1,341 0.23% 1,130 0.18%
Native Hawaiian and Other Pacific Islander alone 174 0.03% 39 0.01%
Source: 2010 U.S. Census, 2014 ACS 5-Year Estimate
Incorporated Cities
Eighteen incorporated cities fall within the boundaries of Fort Bend County.1 Table 3 identifies
the cities and provides the population and growth from 2010 to 2014. The remaining population
in Fort Bend County resides in unincorporated areas of the county or in the small segments of the
City of Houston that exist within Fort Bend County.
1 A small portion of the City of Houston falls within Fort Bend County.

11
Table 3. Incorporated Cities in Fort Bend County.
City 2010 Population 2014 Population Percent Growth
Arcola 1,642 1,964 20%
Beasley 641 519 -19%
Fairchilds Village 763 746 -2%
Fulshear 1,134 2,284 101%
Katy (a) 14,102 15,071 7%
Kendleton 380 326 -14%
Meadows Place 4,660 4,701 1%
Missouri City (b) 67,358 69,152 3%
Needville 2,823 2,995 6%
Orchard 352 366 4%
Pleak Village 1,044 1,260 21%
Richmond 11,679 11,769 1%
Rosenberg 30,618 32,789 7%
Simonton 814 863 6%
Stafford 17,693 17,990 2%
Sugar Land 78,817 82,420 5%
Thompson 246 178 -28%
Source: 2010 U.S. Census, 2014 ACS 5-Year Estimate
(a) Katy is incorporated in Harris County, with portions in Fort Bend County
and Waller County
(b) Missouri City is incorporated in Fort Bend County, with portions in Harris
County
Poverty
Under the federal guidelines for environmental justice, low-income population means a person
whose median household income is at or below the poverty guidelines. In 2010, according to the
ACS 5-year Estimate, about 12,000 households in Fort Bend County (7.2 percent of the total
population) were living below the poverty level. The poverty level in Fort Bend County is below
the state of Texas (15.74 percent) and Harris County (15.83 percent). In 2014, 7.7 percent of Fort
Bend County households (about 15,000) were living below the poverty level, according to the
2014 ACS 5-year estimate.
Older Adults and Persons with a Disability
The focus of federal Title VI regulations is not on demographics of age and disability. However,
the Fort Bend County Public Transportation Department does develop services that are
responsive to the needs of older adults (persons age 65 and over) and persons with a disability.
Approximately 7.3 percent of all persons residing in Fort Bend County in 2010 were 65 years of
age or older. This compares with the senior population for the state of Texas at 10.9 percent and

12
Harris County at 8.7 percent. According to the 2014 ACS 5-Year Estimate, approximately 8.4
percent of Fort Bend County’s population is 65 years of age.
According to 2010 ACS 3-Year Estimates, approximately7.3 percent of civilian,
non-institutionalized persons over age 5 reported a disability. In 2014, ACS 5-year estimates
report that 8.1 percent of Fort Bend County’s non-institutionalized population over age 5
reported a disability. The 2014 statistic compares to 11.5 percent for the state of Texas and 9.1
percent for Harris County.
FORT BEND COUNTY PUBLIC TRANSPORTATION DEPARTMENT
The Fort Bend County Public Transportation Department is the public transit provider within
Fort Bend County. The Public Transportation Department provides five transit
services/programs: demand response transit service; point-deviation transit service in Richmond
and Rosenberg, Texas; commuter express bus; Job Access and Reverse Commute (JARC); New
Freedom; and services for older adults and persons with a disability.
Fort Bend County offers demand response transit services to all citizens of Fort Bend County.
Demand response transit service only serves origins/destinations in Fort Bend County. In order
to schedule or cancel a ride, a rider may call 866-751-TRIP between the hours of 8:00 a.m. and
5:00 p.m. Monday thru Friday (excluding Fort Bend County holidays) and ask for the “Fort Bend
County Reservations.” Reservations can be made 30 days or up to 1 business day in advance of
the appointment time. Rides are typically scheduled for first destination drop-off by 8:00 a.m.
and the last pick-up will be no later than 5:00 p.m. Repeat rides may be scheduled in advance.
Rides will be accepted on a “time and space” available basis. Trip fares are $1.00 per person
each way. Passengers must be ready 15 minutes before scheduled pick up time. This is a curb-to-
curb service; however, persons with disabilities can request door-to-door service.
In July 2015, Fort Bend County introduced point-deviation transportation service in Richmond
and Rosenberg Texas. This service operates on three fixed routes throughout Richmond and
Rosenberg and will deviate (up to 3/4 of a mile) from the prescribed routes to pick up passengers
upon request. Point Deviation Route Service operates along a fixed route and keeps to a
timetable, but the bus or van can deviate from the route to go to a specific location, such as a
house, childcare center, or employment site. Once the pick-up or drop-off is made, the vehicle
returns to the fixed route. Fort Bend County provides point-deviation service Monday through
Friday (excluding Fort Bend County holidays) from 6:40 AM until 5:15 PM.
Fort Bend County operates the Fort Bend Express, a peak period commuter bus service to three
major employment centers in Harris County. The service consists of three bus routes, one to
Greenway Plaza, one to Uptown/Galleria, and one to the TMC. Park-and-rides are located at the
University of Houston Sugar Land campus at University Boulevard and US 59, the AMC Movie
Theatre on Town Center Boulevard near First Colony Mall, and the Fort Bend County
Fairgrounds near State Highway 36 and Fairgrounds Road. The Greenway Plaza route offers a
connection to the Metropolitan Transit Authority (METRO) West Bellfort Park & Ride. At this
location, riders are able to transfer to METRO routes to downtown Houston and the TMC. Fort
Bend Express service runs Monday through Friday (excluding Fort Bend County holidays)

13
during peak commuter periods. Buses leave the park and ride lots between 4:40 a.m. and 8:30
a.m. and return from the activity centers between 3:15 p.m. and 6:40 p.m. at 15 to 20 minute
intervals. The fare varies from $1.00 to $3.50 each way depending on the origin and destination.
Fort Bend County also participates in three transportation programs for specialized populations:
JARC, New Freedom, and services for older adults and persons with disabilities. Job Access and
Reverse Commute provides transportation to individuals on welfare and other people with low-
income in the urban area to and from jobs and activities related to employment. This is
considered the “job access” portion of JARC. The service also takes individuals from urbanized
areas to non-urbanized (rural) areas where suburban employers are located, and this accounts for
the “reverse commute” portion of JARC.
The Public Transportation Department also provides New Freedom public transportation
services. New Freedom is a transportation program dedicated to people with disabilities. New
Freedom provides reserved bus service in the mornings and afternoons, Monday through Friday
(excluding Fort Bend County holidays) and the fare is $1.00 for each one-way trip. An attendant
may accompany a rider in need of assistance, free of charge. The New Freedom program also
includes bus stop monitors and rider attendants to assist passengers who cannot travel
independently.
Fort Bend County also provides transportation services to assist private nonprofit groups in
meeting the transportation needs of older adults and persons with disabilities. The county also
assists human service agencies to provide transportation for older adults to congregate meal
programs and other activities at senior centers in Fort Bend County.
Figure 2 illustrates Fort Bend County’s point-deviation routes and stops in Richmond and
Rosenberg Texas.
Figure 3 illustrates the locations for regional public transportation services from Fort Bend
County to destinations in Harris County. The regional destinations include Greenway Plaza,
Uptown/Galleria, the TMC, and METRO West Bellfort Park & Ride for Fort Bend Express, and
the TMC for demand response public transportation.

14
Figure 2. Fort Bend County Point-Deviation Routes

15
Figure 3. Fort Bend County Public Transportation Regional Transit Destination

16
This Page Intentionally Left Blank

17
SECTION 3. ASSESSMENT OF TRANSIT SERVICES
The Fort Bend County Public Transportation Department collected demographic data and
produced maps showing the extent to which areas of concentration of minority groups, low-
income populations, and persons with limited English-proficiency have access to public
transportation services.
This section will discuss the sources and types of data used for the assessment of transit services.
Maps illustrating the outcomes of the assessment are also presented. Appendix A of this report
presents data tables.
DEMOGRAPHIC INFORMATION
Demographic information from 2014 ACS 5-Year Estimates provides the data to determine if
members of minority groups, low-income populations, and persons with limited
English-proficiency have access to public transportation services in compliance with Title VI.
The assessment also includes two demographic groups not required by the Title VI guidelines:
older adults and persons with disabilities. These are important target populations for transit
service in Fort Bend County.
Geographic Areas
Census data are available at two categories of geographic area: census tracts and census block
groups. Census tracts are small, relatively permanent statistical subdivisions of a county. The
primary purpose of census tracts is to provide a stable set of geographic units for the presentation
of decennial census data. Census tracts generally have between 1,500 and 8,000 people, with an
optimum size of 4,000 people. The spatial size of census tracts varies widely depending on the
density of settlement. Census tracts are identified by a four-digit basic number.
Figure 4 illustrates a map of Fort Bend County showing the locations of major highways and
incorporated cities. The numbers indicate census tracts.
A census block group is a cluster of census blocks having the same first digit of their four-digit
identifying numbers within a census tract. For example, block group 3 within a census tract
includes all blocks numbered from 3000 to 3999. Block groups generally contain between 600
and 3,000 people, with an optimum size of 1,500 people.
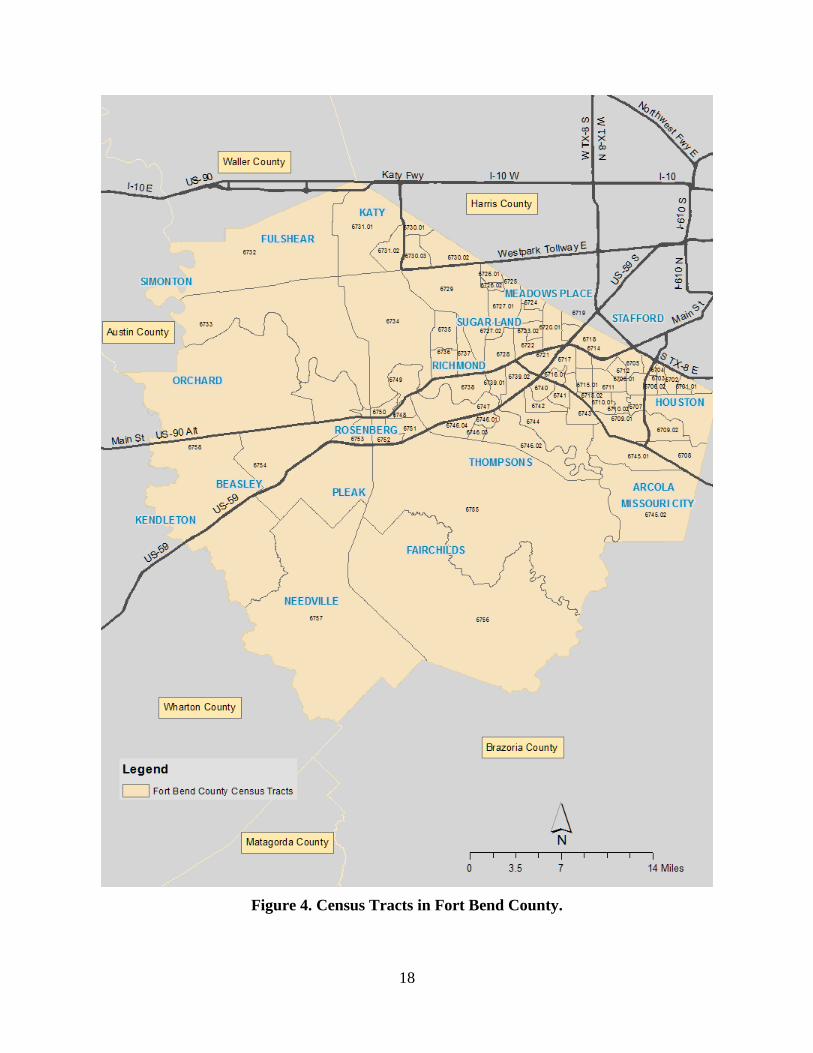
18
Figure 4. Census Tracts in Fort Bend County.

19
Source of Data
2014 ACS 5-Year Estimate data are used as available. Data for minority population, low-income
households, and age are provided at the census block group level. Information about persons
with disabilities, households that are linguistically isolated, and language spoken at home is
available at the larger census tract level. ACS 5-Year Estimate data products for smaller
geographic areas (i.e., census tracts and census block groups) were released beginning in 2010
and will be used by Fort Bend County Public Transportation Department for all non-decennial
year Title VI assessments.
Demographic Data
Below is a list of the data used for the assessment of transit service with a short description and
the geographic level used for the assessment.
• Minority Population – For the purposes of this assessment, minority population is defined
as race or ethnicity other than non-Hispanic white. The data are reported by census block
group as a percent of population that is minority. Source: 2014 ACS 5-Year Estimates.
Census Block Group Level.
• Households Below Poverty Level – Low-income population is defined by household
income below poverty level in. The data are reported by census block group as a percent of
households below poverty status. Source: 2014 ACS 5-Year Estimates. Census Block Group
Level.
• Limited English Proficient (LEP) Population – LEP are those persons over 5 years of age
who speak English “not well” or not at all. The data are reported by census block group as a
percent of population over 5 years of age. Source: 2014 ACS 5-Year Estimates. Census Tract
Level.
• Households Linguistically Isolated – Limited English proficiency is also defined as all
households in which no member of the household 14 years and over speaks English “very
well.” The data are reported by census tract as a percent of households that are linguistically
isolated. Source: 2009 ACS 5-Year Estimates. Census Tract Level.
• Language Spoken at Home –The data are reported by census tract as population 5 years and
over in which a language other than English is spoken at home. Research describing
languages other than English spoken at home in Fort Bend County is discussed in Section 4
of this report. Source: 2014 ACS 5-Year Estimates. Census Tract Level.
• Senior Population – Senior population is defined as persons 65 years of age or older. The
data are reported by census block group as a percent of population that is 65 years of age or
older. Source: 2014 ACS 5-Year Estimates. Census Block Group Level.
• Persons with a Disability – The data for persons with a disability are reported by census
block group as a percent of the civilian, non-institutionalized population at least 5 years of
age as of 2014 ACS 5-Year Estimates. A person with a disability has any of the following

20
three conditions: 1. Five years old and over and reported a long-lasting sensory, physical, mental or self-
care disability;
2. Sixteen years old and over and reported difficulty going outside the home because of
a physical, mental, or emotional condition lasting six months or more; or
3. Sixteen to 64 years old and reported difficulty working at a job or business because of
a physical, mental, or emotional condition lasting six months or more.
Source: 2014 ACS 5-Year Estimates. Census Tract Level.
Statistical Analysis
The analysis identifies where the percent of the total target population residing in an area (census
block group or census tract) exceeds the average of the target population for Fort Bend County as
a whole.
Appendix A presents a table that shows the actual numbers and percent for each Title VI target
population by census block group. Those block groups where the target population percent
exceeds the average for Fort Bend County are highlighted in the table.
HOME LOCATIONS FOR TRANSIT USERS
The Fort Bend County Public Transportation Department maintains a database of riders and
home addresses for all demand response transit services (shared ride public transportation for the
general public, JARC, New Freedom, and service for older adults and persons with disabilities).
Fort Bend County geocoded the list of addresses and projected the data on maps of the county to
compare to demographic data. The successful geocode rate was 82 percent of all addresses in the
database.
Figure 5 illustrates the locations of transit user home addresses and the Richmond and Rosenberg
point-deviation service area as compared to the population density by census block group for
Fort Bend County. The purpose of the map is to demonstrate that the majority of transit riders
originate from the most densely populated urban areas. Approximately 3.0 percent of all home
addresses for transit users exist within areas designated as rural by the 2010 U.S. Census
Urban/Rural population statistics.
Fort Bend County’s point-deviation routes are within 3/4 mile of the home location of 969
demand response users—nearly 17% of all demand response users.

21
Figure 5. Transit Rider Home Addresses and Population Density by Census Block Group.

22
ASSESSMENT
The statistical analyses of demographic characteristics by census block groups and tracts as well
as the Richmond and Rosenberg point-deviation service area were displayed on geographic
information system (GIS) maps. The data points for home addresses of Fort Bend County transit
users were overlaid on each of the GIS maps to permit assessment of the home locations of
transit users to areas of concentration of target populations. Each overlay provides a graphic tool
to assess the distribution of public transportation services as compared to a Title VI population or
other target groups in Fort Bend County.
Table 4 displays the demographic data used to map and analyze the Fort Bend County Public
Transportation Department services. Figure 5 though Figure 10 are used to assess compliance
with Title VI.
Table 4. Fort Bend County 2014 Demographic Data Used for Maps.
Total Population Minority Population Percent Minority
632,946 296,319 46.82%
Total
Households (HH) HH Below Poverty Level
Percent HH Below Poverty
Level
198,316 19,205 9.68%
Total Population
Age 5 and Over
LEP
Population Percent LEP
588,234 35,882 6.10%
Total HH*
Linguistically Isolated
HH*
Percent Linguistically
Isolated HH*
140,542 8,097 5.76%
Total Population
Population
Age 65 and Over
Percent Age
65 and Over
632,946 53,462 8.45%
Total Civilian Population 5+
Not-Institutional
Population
With Disability
Percent
With Disability
583,013 47,393 8.13%
Source: 2014 ACS 5-Year Estimates, * 2009 ACS 5-Year Estimates

23
Minority Population
In Figure 6 census block groups are mapped with demand response home addresses overlaid.
The census block groups highlighted in blue are above the county average percent minority
population of 46.8 percent. The distribution of home addresses within the highlighted areas
indicates that transit user home addresses are within census block groups with higher percent
minority population than the county average.
Figure 6. Transit Rider Home Addresses and Minority Population.

24
Households Below Poverty Level
Figure 7 highlights the census block groups in Fort Bend County that are above the county
average 9.7 percent of households below the poverty level (2014). The distribution of home
addresses within the highlighted areas indicates that transit user home addresses are within
census block groups with higher percent households below the poverty level than the county
average.
Figure 7. Transit Rider Home Addresses and Households Below Poverty Level.

25
LEP Population
In Figure 8, transit rider home origins are assessed within the census tracts that are above the
county average 6.1 percent LEP population. The distribution of home origins within the
highlighted areas indicates that transit user home addresses are within census block groups with
higher concentrations of LEP population than the county average.
Figure 8. Transit Rider Home Addresses and LEP Population.

26
Linguistically Isolated Households
Limited English proficiency is also measured by households that are linguistically isolated.
Figure 9 highlights the census tracts that are above the county average 5.8 percent linguistically
isolated households. The distribution of transit rider home origins within the highlighted areas
indicates that Fort Bend County public transportation service is provided within census block
groups with higher concentrations of linguistically isolated households than the county average.
Figure 9 displays data for linguistic isolation in Fort Bend County from the U.S. Census
Bureau’s 2009 ACS 5-Year Estimates, the last year this data set was produced for Fort Bend
County.
Figure 9. Transit Rider Home Addresses and Linguistically Isolated Households.

27
Population 65 Years and Older
Figure 10 displays block groups, highlighted in blue, within Fort Bend County with a percent of
population 65 years of age and over that is greater than the county average 8.4 percent. Senior
population is not specifically addressed by the Title VI objectives but represents an important
target market for the demand response services provided by Fort Bend County Public
Transportation.
Figure 10. Transit Rider Home Addresses and Population 65 Years and Older.

28
Population with Disabilities
Figure 11 displays the census block groups with a concentration of non-institutionalized civilians
over five years of age that reported a disability greater than the Fort Bend County average 8.1
percent. The public transportation services provided by the Fort Bend County Public
Transportation Department emphasize demand response services with specific programs for
persons with disabilities.
Figure 11. Transit Rider Home Addresses and Persons with Disabilities.

29
This Page Intentionally Left Blank

30
SECTION 4. ACCESS TO TRANSIT FOR PERSONS
WITH LIMITED ENGLISH PROFICIENCY
In previous statistical analyses of demographic characteristics by census block group, Fort Bend
County identified the concentrations of population that have limited English proficiency. Two
demographic variables were documented and mapped: LEP persons over 5 years of age who
speak English not well or not at all and households that are linguistically isolated (no member of
the household 14 years and over speaks English very well).
The purpose of this section is to look more specifically at what languages other than English are
spoken at home by Fort Bend County residents and to gauge the extent to which these
populations may access transit services. The analysis will help the Fort Bend County Public
Transportation Department to develop and carry out a language implementation plan.
Several sources of information were accessed to identify languages other than English that are
most prevalent in Fort Bend County. Data from 2009 ACS 5-Year Estimate were analyzed to
identify linguistically isolated households (the most recent dataset for linguistic isolation). 2014
ACS 5-Year Estimates provided data to identify the specific languages spoken at home.
LINGUISTICALLY ISOLATED HOUSEHOLDS
Table 5 compares the number of linguistically isolated households in Fort Bend County to the
total number of households. Spanish is the language spoken in 60.6 percent of linguistically
isolated households.
Table 5. Fort Bend County Linguistically Isolated Households.
Household Language
Number of
Linguistically
Isolated Households
Linguistically Isolated
Households as Percent
of Total Households
Spanish 4910 2.48%
Other Indo-European Languages 592 0.30%
Asian and Pacific Island Languages 2455 1.24%
Other Languages 140 0.07%
Total Households 198,316 100.00%
Source: 2009 ACS 5-Year Estimates

31
LANGUAGE SPOKEN AT HOME
To determine the current language/translation needs of the Fort Bend County population, 2014
ACS 5-Year Estimate data are used. This data is reported by census tract as population over age
5 in which a language other than English is spoken at home. Appendix B presents the data.
A benefit of looking at languages spoken at home is to identify the languages that are most
familiar to a person whose nation of origin is not the United States. This information will serve
as guidance for Fort Bend County to provide language assistance for growing segments of the
population.
According to 2014 ACS 5-Year Estimates, there are nine languages other than English spoken at
home by more than 1 percent of the Fort Bend County population. These languages are: Spanish,
Gujarati, Hindi, Urdu, Chinese, Vietnamese, Other Asian Languages, Tagalog, and African
Languages. As shown in Table 6, Spanish is the language spoken at home by the largest percent
of the population over age 5, over 18 percent.
Table 6. Languages Other than English Spoken at Home.
Population 5+
Percent of Total
Population
Fort Bend County
Total 588,234 100%
Spanish 107,052 18.2%
Chinese 21,691 3.7%
Vietnamese 13,882 2.4%
Urdu 13,589 2.3%
Other Asian Languages 11,554 2.0%
Hindi 8,699 1.5%
Tagalog 8,978 1.5%
African Languages 9,005 1.5%
Gujarati 6,050 1.0%
Source: 2014 ACS 5-Year Estimates

32
Spanish Spoken at Home
Figure 12 shows the census tracts where the percent of the population over age 5 who speak
Spanish at home is greater than the county average 18.2 percent. The distribution of transit rider
home origins within the highlighted areas indicates that Fort Bend County public transportation
service is provided within census tracts where a higher than average percent of the population
speak Spanish at home.
Figure 12. Transit Rider Home Addresses and Population that Speaks Spanish at Home.

33
Chinese Spoken at Home
Figure 13 shows the areas where the percent of the population over age five who speak Chinese
at home is greater than the county average 3.7 percent. The distribution of transit rider home
origins within the highlighted areas indicates that Fort Bend County public transportation service
is provided within census tracts where a higher than average percent of the population speak
Chinese at home.
Figure 13. Transit Rider Home Addresses and Population that Speaks Chinese at Home.

34
Vietnamese Spoken at Home
Figure 14 shows the census tracts where the percent of the population over age 5 speak
Vietnamese at home is greater than the county average 2.4 percent. Fort Bend County public
transportation service is provided within census tracts where a higher than average percent of the
population speak Vietnamese at home.
Figure 14. Transit Rider Home Addresses and Population that Speaks Vietnamese at
Home.

35
Urdu Spoken at Home
Figure 15 shows the census tracts where the percent of the population over age 5 speak Urdu at
home is greater than the county average 2.3 percent. Fort Bend County public transportation
service is provided within census tracts where a higher than average percent of the population
speak Urdu at home.
Figure 15. Transit Rider Home Addresses and Population that Speaks Urdu at Home.

36
Other Asian Languages Spoken at Home
Figure 16 shows the census tracts where the percent of the population over age 5 speak Other
Asian Languages at home is greater than the county average 2.0 percent. Fort Bend County
public transportation service is provided within census tracts where a higher than average percent
of the population speak Other Asian Languages at home.
Figure 16. Transit Rider Home Addresses and Population that Speaks Other Asian
Languages at Home.

37
African Languages Spoken at Home
Figure 17 shows the census tracts where the percent of the population over age 5 speak African
Languages at home is greater than the county average 1.5 percent. Fort Bend County public
transportation service is provided within census tracts where a higher than average percent of the
population speak African Languages at home.
Figure 17. Transit Rider Home Addresses and Population that Speaks African Languages
at Home.

38
Tagalog Spoken at Home
Figure 18 shows the census tracts where the percent of the population over age 5 speak Tagalog
at home is greater than the county average 1.5 percent. Fort Bend County public transportation
service is provided within census tracts where a higher than average percent of the population
speak Tagalog at home.
Figure 18. Transit Rider Home Addresses and Population that Speaks Tagalog at Home.

39
Hindi Spoken at Home
Figure 19 shows the census tracts where the percent of the population over age 5 speak Hindi at
home is greater than the county average 1.5 percent. Fort Bend County public transportation
service is provided within census tracts where a higher than average percent of the population
speak Hindi at home.
Figure 19. Transit Rider Home Addresses and Population that Speaks Hindi at Home.

40
Gujarati Spoken at Home
Figure 20 shows the census tracts where the percent of the population over age 5 speak Gujarati
at home is greater than the county average 1.0 percent. Fort Bend County public transportation
service is provided within census tracts where a higher than average percent of the population
speak Gujarati at home.
Figure 20. Transit Rider Home Addresses and Population that Speaks Gujarati at Home.

41
This Page Intentionally Left Blank

42
SECTION 5. TITLE VI POLICIES AND PROCEDURES
According to the guidance provided by FTA Circular 4702.1B, the Fort Bend County Public
Transportation Department must ensure that programs, policies, and activities comply with DOT
Title VI Regulations.
The purpose of this section is to present a statement of policy for compliance with Title VI,
instructions for how a member of the public may file a discrimination complaint, and procedures
for tracking and investigating Title VI complaints. The Public Transportation Department has a
responsibility to provide public notice to the beneficiaries of its public transportation services of
protection under Title VI.
TITLE VI STATEMENT OF POLICY FOR PUBLIC TRANSPORTATION
Fort Bend County is committed to a policy of non-discrimination in the conduct of its business,
including the Title VI responsibility to deliver equitable and accessible transportation services.
Fort Bend County officially formed the Public Transportation Department in June 2005 to
provide residents with safe and efficient public transportation services while maintaining service
quality and customer satisfaction.
The Public Transportation Department recognizes its responsibility to the Fort Bend County
community in which it operates and to the society it serves. The Public Transportation
Department will utilize its best efforts to assure that no person shall, on the grounds of race,
color, or national origin, be excluded from participation in, be denied the benefits of, or be
subjected to discrimination under the Fort Bend County program of transit service delivery and
related benefits. Further, the Public Transportation Department will utilize best efforts to provide
equitable and accessible public transportation services to persons of low income and persons
with limited English proficiency.
In order to comply with the Title VI requirements, the Public Transportation Department strives
to accomplish the following objectives:
• Ensure that the level and quality of transportation service is provided without regard to race,
color or national origin;
• Identify and address, as appropriate, disproportionately high and adverse human health and
environmental effects, including social and economic effects of programs and activities on
minority populations and low-income populations;
• Promote the full and fair participation of all affected populations in transportation decision
making;
• Prevent the denial, reduction or delay in benefits related to programs and activities that
benefit minority populations or low-income populations; and
• Ensure meaningful access to programs and activities by persons with limited English
proficiency.
The responsibility for carrying out Fort Bend County’s commitment to Title VI responsibilities
rests with the Director of the Public Transportation Department. All managers, supervisors, and

43
employees in the Public Transportation Department share in the responsibility for making the
Title VI Program a success.
Fort Bend County is committed to safeguarding against discrimination in its provision of public
transportation services. Any person who feels he or she may have been discriminated against is
encouraged to report in writing such a violation to the Fort Bend County within 180 days of the
alleged discrimination. Additional information concerning the Fort Bend County Title VI
obligations and the complaint procedure can be found by calling (281) 633-7433 or on the
county’s web site
http://www.fortbendcountytx.gov/Modules/ShowDocument.aspx?documentid=10133.
FILING A DISCRIMINATION COMPLAINT
The responsibility for carrying out Fort Bend County’s commitment to Title VI responsibilities
rests with the Director of the Public Transportation Department. All managers, supervisors, and
employees in the Public Transportation Department share in the responsibility for making the
Title VI Program a success.
Any person who feels he or she may have been discriminated against is encouraged to report in
writing such a violation to the Fort Bend County Public Transportation Department within 180
days of the alleged discrimination. If the individual believes that he/she has been excluded from
participation in, denied the benefits of, or subjected to discrimination based on race, color,
national origin, language, or income level under Fort Bend County’s Public Transportation
Department programs for transit service delivery or related benefits, the individual may file a
complaint with the Fort Bend County Public Transportation Department:
• Mail to the Fort Bend County Public Transportation Department, Attention Assistant
Director of Public Transportation, 12550 Emily Court, Suite 400, Sugar Land, TX 77478;
• Telephone (281) 633-7433;
• Fax (281) 243-6710; or
• Email at [email protected].
Complaints may also be filed with the following organization no later than 180 days after the
date of the alleged discrimination:
Federal Transit Administration’s Office of Civil Rights
Attention: Title VI Program Coordinator
East Building, 5th Floor - TCR
1200 New Jersey Ave., SE
Washington, DC 20590
202-366-4018
http://www.fta.dot.gov/civilrights/title6/civil_rights_5104.html
Appendix D of this report provides a copy of the recommended complaint form. Comments can
be submitted in a format other than the complaint form. If the complaint is filed verbally, the
information will be documented in writing by the Public Transportation Department.

44
TRACKING AND INVESTIGATING TITLE VI COMPLAINTS
The Assistant Director will review and investigate every complaint promptly. Reasonable
measures will be undertaken to preserve any information that is confidential. At a minimum, the
Assistant Director will:
• Identify and review all relevant documents, practices and procedures;
• Identify and interview persons with knowledge of the Title VI violation, i.e., the person
making the complaint; witnesses or anyone identified by the Complainant; anyone who may
have been subject to similar activity, or anyone with relevant information;
• Notify Fort Bend County Public Transportation Department’s local TxDOT Public
Transportation Coordinator (PTC) of any Title VI-related complaint within ten working days
after receiving the complaint.
Upon completion of the investigation, the Assistant Director will complete a final report and
deliver it to the Director of Public Transportation. If a Title VI violation is found to exist,
remedial steps as appropriate and necessary will be taken immediately. The complainant will
also receive a final report together with any remedial steps. The investigation process and final
report should take no longer than twenty-five (25) business days. If no violation is found and the
complainant wishes to appeal the decision, he or she may appeal directly to the Director of
Public Transportation, 12550 Emily Court, Suite 400, Sugar Land, TX 77478.
The Assistant Director will maintain a log of Title VI complaints received from this process
which shall include the date the complaint was filed; a summary of the allegations; the status of
the complaint; and actions taken by the Department of Public Transportation in response to the
complaint. Should Fort Bend County receive a Title VI complaint in the form of a formal charge
or lawsuit, the complaint will be forwarded to the Fort Bend County Attorney. The Assistant
Director’s log of Title VI complaints will be included in each Title Vi program update. If no
complaints were received, a letter stating this fact will be included in place of the complaint log.
See Appendix E for Fort Bend County’s 2016 Letter of No Complaints.
Complaints may also be filed with the following organization no later than 180 days after the
date of the alleged discrimination:
Federal Transit Administration’s Office of Civil Rights
Attention: Title VI Program Coordinator
East Building, 5th Floor - TCR
1200 New Jersey Ave., SE
Washington, DC 20590
202-366-4018
http://www.fta.dot.gov/civilrights/title6/civil_rights_5104.html
The Assistant Director will prepare and maintain a list of any active Title VI investigations,
complaints, and lawsuits conducted by entities other than FTA.

45
PUBLIC NOTICE
The Fort Bend County Public Transportation Department is responsible for notifying the public
and beneficiaries of public transportation services of protection under Title VI and providing
instructions on how to file a discrimination complaint.
To notify the public and beneficiaries of public transportation services of protection under
Title VI, the Public Transportation Department will do the following:
• Post the Title VI policy statement, instructions on how to file a complaint, and access to
the complaint form on the departmental website.
• Post the Title VI policy statement and instructions on how to file a complaint in the office
of the Public Transportation Department.
• Fort Bend County Public Transportation posts Title VI notices in the following
locations/documents:
Buses
Website
Bulletins
Passenger Guidelines
Route Schedules
Brochures
Customer Handouts
Public Transportation Department Office and areas accessible to riders
• Include the Title VI policy statement and instructions on how to file a complaint in a
published format (flyer, brochure) that can be available at public outreach events and
distributed to transit users.
All material will be provided in English and Spanish.

46
This Page Intentionally Left Blank

47
SECTION 6. PUBLIC INFORMATION ABOUT TRANSIT SERVICES AND
LEP PLAN
The Fort Bend County Public Transportation Department is committed to ensuring meaningful
access to programs and activities by persons with limited English proficiency, as required by
FTA Circular 4702.1B.
This section has two purposes. The first purpose is to document the types of public information
about transit services currently provided by the Public Transportation Department and to
summarize public outreach and involvement activities to reach out to target markets including
minority and low-income people, older adults, and persons with disabilities. The second purpose
is to document a proposed approach to ensure meaningful access to persons with limited English
proficiency by providing more bilingual information.
SUMMARY OF CURRENT PUBLIC OUTREACH AND INVOLVEMENT
The Fort Bend County Public Transportation Department provides public outreach pamphlets in
both English and Spanish. The Public Transportation Department also provides public
information about transit services in English via the following media.
Internet Website: http://www.fortbendcountytx.gov/index.aspx?page=313
Telephone: 281-633-7433
Toll Free: 866-751-8747
Fax: 281-243-6710
Email: [email protected]
TTY for the
Hearing Impaired: 281-494-7160 Administrative Offices
281-243-6781 Reservations
Fort Bend Express commuter transit services—public information is available in English from
the following website or by telephone or email:
Internet Website: http://www.fortbendcountytx.gov/index.aspx?page=317
Telephone: 281-633-7433
Fax: 281-243-6710
Email: [email protected]
All Fort Bend County websites, including the Public Transportation website, can be translated
into 80 languages by selecting a language from a dropdown menus of Google Translate®
options.

48
The Fort Bend County Public Transportation Department engages in public outreach in order to
attract ridership and inform others of transit services. Outreach takes the form of presentations,
open houses, information tables, group discussions, posters, and pamphlets. Pamphlets are
available in Spanish. Public involvement activities occur at churches, schools, community
centers, governmental agencies, chambers of commerce, and agencies that provide human and
social services for older adults and persons with disabilities. The Public Transportation
Department keeps a record of the locations and events. The language used for all verbal
presentations and group discussions is English. Once a month, a sign language interpreter is
present for an outreach initiative at the Fort Bend Center for Independent Living. Sign language
interpreters are available upon request by attendees to other presentations.
Appendix C includes documentation of public presentations and public outreach initiatives by
the Fort Bend County Public Transportation Department. Many of the collaboration meetings are
with advocates for minority and low-income people – for example:
• Fort Bend County Meals on Wheels
• Texas Workforce Solutions
• Catholic Charities
• Literacy Council of Fort Bend County
• Experience Works Employment, Training Director
• Fort Bend Independent School District, Vocational Adjustment Coordinator
• Fort Bend County Indigent Health Care Manager
• Parkwest Staffing, Branch Manager
• Texana, Supported Employment Coordinator
• The Association for Retarded Citizens of Fort Bend County
Public outreach also includes a concerted effort to reach out to health and human service
agencies that support persons with disabilities and older adults.
ENHANCEMENTS FOR PUBLIC OUTREACH TO TITLE VI POPULATIONS
In order to ensure that minority, low-income, and LEP persons have meaningful access to public
outreach activities, the Fort Bend County Public Transportation Department will enhance the
current public involvement program in the following ways:
• All public outreach efforts will continue to be descriptively documented and the following
information about each outreach effort will be noted:
o Date of the outreach;
o Name, address, and phone number of location of the public outreach;
o Names of Fort Bend County Public Transportation staff that were present;
o Name of partner staff that were present;
o Notes about the outreach effort describing the reason for the outreach and the format
of the outreach (presentation, open house, information table, group discussion,
meeting, or other);
o Number of individuals in attendance.

49
• The Public Transportation Department has developed a language implementation plan to
ensure meaningful access to LEP persons (see LEP Plan below).
FOUR FACTOR ANALYSIS
In developing the language implementation plan, the Fort Bend County Public Transportation
Department undertook a U.S. DOT “four factor” LEP analysis. A brief description of each factor
and pertinent considerations are provided in the following discussion.
1. The number or proportion of LEP persons eligible in the Fort Bend County service area who
maybe served or likely to encounter a Public Transportation Department program, activity, or
service.
As documented in Sections 4 and 5 of this report, Spanish is the language other than English
most often used by residents of Fort Bend County. Over 18 percent of the Fort Bend County
population over age 5 speaks Spanish at home. There are eight other languages spoken at
home by at least one percent of Fort Bend County’s population, including: Chinese (3.7
percent), Vietnamese (2.4 percent), Urdu (2.3 percent), Other Asian Languages (2.0 percent),
African Languages (1.5 percent), Tagalog (1.5 percent), Hindi (1.5 percent), and Gujarati
(1.0 percent).
2. The frequency with which LEP individuals come in contact with a Public Transportation
Department program, activity, or service.
The Fort Bend County Public Transportation Department assesses the frequency with which
staff and drivers have or could possibly have contact with LEP persons. This includes
documenting phone inquiries and verbally surveying drivers. The occasions when
information is requested in another language are infrequent; however, when a request is
made, the request is for information in Spanish.
3. The nature and importance of the program, activity, or service provided by the Public
Transportation Department.
Public transportation is the means of travel to work, getting to medical appointments or to
attend school and achieve general mobility for many LEP persons. The Public Transportation
Department partners with numerous community organizations and social and human service
agencies to provide transit services. The Fort Bend County Public Transportation Department
will collaborate with all organizations and agencies in the service area to seek public input,
hold public meetings, and assist in advising all LEP persons of the types of language
assistance and public transportation services that can be provided.
4. The resources available to the Public Transportation Department and overall costs.
The Public Transportation Department continuously assesses its available resources that
could be used for providing LEP assistance. This includes determining the ability of
members of the staff and drivers to speak another language (specifically, Spanish),

50
identifying how much a professional interpreter and translation would cost on an as needed
basis, which documents would be most valuable to be translated if and when warranted,
taking an inventory of available organizations that the Public Transportation Department
could partner with for outreach and translation efforts, and what level of staff training is
needed.
Based on these four factors, the Fort Bend County Public Transportation Department developed
a plan to assist LEP persons who speak Spanish as a native language.
LEP PLAN
Consistent with guidance provided by FTA Circular 4702.1B, the Fort Bend County Public
Transportation Department will provide language assistance in Spanish for persons with limited
English proficiency. In addition, the department will monitor available information to anticipate
the need for languages other than English and Spanish every three years.
Language Assistance Measures
In order to ensure meaningful access by LEP persons who speak Spanish, the Fort Bend County
Public Transportation Department will enhance current public information about transit services
in the following ways:
• The statement of policy for compliance with Title VI, instructions for how to file a
discrimination complaint, and the complaint form will be provided in both English and
Spanish.
• Public information materials will be provided with a bilingual option for Spanish:
o Fort Bend County Public Transportation Department website will have critical
information posted in English and Spanish;
o The recorded information for the telephone number for general information will
have a bilingual option in Spanish;
o Printed publications will be printed in an English/Spanish format.
• When an interpreter is needed to respond to a telephone call to reserve a demand response
transit trip, the person will be referred to a bilingual Public Transportation Department
employee, or, if necessary, a bilingual employee in another Fort Bend County department
will be called in to assist the customer. The individual’s reserved trip will be noted as
Spanish-speaking on the driver’s manifest to alert the driver to a LEP passenger who may
need additional assistance.
• A member of the Fort Bend County staff who speaks Spanish or an interpreter will be
available to facilitate public outreach efforts involving the general public in areas of the
county where there are concentrations of population that speak Spanish at home (to be
determined based on census data, ESL data from school districts, or other reliable sources of
information).

51
• The Public Transportation Department will make available an English/Spanish interpreter
for public meetings. The English/Spanish announcement for the public meeting will state
that translation services will be provided if requested in advance.
Monitor Trends in Languages Other than English
The Fort Bend Public Transportation Department will use the following tools to identify who
may need language assistance:
• Examine records for language assistance from past meetings and events to anticipate the
possible need for assistance at upcoming meetings.
• When the Public Transportation Department sponsors workshops or conferences, the
responsible staff member will set up a sign-in sheet and then assign someone to personally
greet and briefly speak to each attendee. To informally gage the attendee’s ability to speak
and understand English, the greeter will ask a question that requires a full sentence reply.
• Ask reservation clerks and receptionists to document each time a call is received from a
person who does not speak proficiently in English. Keep a log of experiences to establish a
trend line.
Training for Staff
The Fort Bend County Public Transportation Department will provide staff with a copy of the
LEP Plan and provide training for all employees including new hires. Training topics will
include:
• Understanding the Title VI policy and LEP responsibilities;
• What language assistance services the Public Transportation Department offers;
• Instructions on how to document language assistance requests; and
• How to handle complaints.
Monitoring and Updating the LEP Plan
The Fort Bend County Public Transportation Department will monitor and evaluate changes in
LEP population through available demographic information to determine the growing incidence
of other languages and potential need for language accommodation.
The LEP plan is designed to be flexible and can be easily updated. Each triennial update should
examine components such as the following:
• Was the need for language assistance provided? If not, why not? If yes, how was the
assistance was provided?
• Were any complaints received?
• Has there been any change in the types of languages where translation services are needed?
• What is the current LEP population in the service area?
• Is there still a need for continued language assistance for previously identified programs or
services? Are there other programs or services that should be included?
• Have the goals of the LEP Plan been accomplished?

52
TRIENNIAL REPORTS
The Fort Bend County Public Transportation Department will prepare and submit a Title VI
Program to FTA every three years beginning in 2009. The program will include the following
information at a minimum:
• Evidence of notice to the public that the Fort Bend County Public Transportation Department
complies with Title VI and instructions to the public on how to file a discrimination
complaint;
• Procedures for tracking and investigating Title VI complaints;
• List of any Title VI investigations, complaints, or lawsuits;
• Summary of public outreach and involvement activities and steps undertaken to ensure that
minority and low-income people have meaningful access to these activities; and
• Plan for providing language assistance for persons with limited English proficiency.

53
This Page Intentionally Left Blank

54
SECTION 7. SERVICES STANDARDS AND POLICIES FOR TRANSIT IN
LARGE URBAN AREAS
According to the FTA Circular 4702.1B program-specific guidance for recipients that provide
transit service in a large urban area, the Fort Bend County Public Transportation Department
should adopt quantitative system-wide service standards and policies to guard against service
design and operational policies that have disparate impacts. The department is also required to
monitor transit service throughout the county to ensure that minority groups and low-income
populations are beneficiaries of transit services. Every three years, the Fort Bend County Public
Transportation Department is required to document compliance.
The purpose of this section is to document Fort Bend County compliance with the FTA Circular
4702.1B program-specific guidance for recipients that provide transit service in a large urban
area.
SERVICE STANDARDS AND SERVICE POLICIES
Fort Bend County public transportation services are either demand response or commuter
express bus. As a result, the service standards and policies have specific requirements, different
from traditional service standards that include local fixed-route service. The following
paragraphs include the service standards and service policies for the Fort Bend County Public
Transportation Department.
Service Coverage Coverage refers to the geographic area where transit services are provided.
Demand Response Point Deviation Service Commuter Express Bus
Standard: Origins and
destinations in Fort Bend
County.
The service area includes a
buffer service area within one-
mile of the county limit. Trips
may be scheduled for origins
and destinations within the
buffer service area.
Service is provided along three
fixed routes in Richmond, TX
and Rosenberg, TX. Deviations
from the fixed routes are
accommodated upon request, up
to 3/4 of a mile from the main
route.
Standard: Service from park and
ride lots in Fort Bend County to
activity centers in the Harris
County metropolitan area based
on demand and resources.
Intermediate stops may include
METRO transit facilities to
provide opportunity for regional
connections by transfer.

55
Service Availability Availability refers to how passengers may access transit service
Demand Response Point Deviation Service Commuter Express Bus
Standard: Service is available
curb-to-curb; however, persons
with disabilities can request
door-to-door service. All
passengers must wear seat
restraints. Seat restraints must be
provided for children 40 lbs. or
less. Passengers 12 years or
younger must be accompanied
by another person 18 years or
older
Standard: Service is available
to anyone who can access
transit service at the designated
transit stops by driving,
walking, biking or by transfer
from demand response transit
service. Service is also
available to those individuals
that request to be picked up by
the transit vehicle at a location
within 3/4 mile of the route.
Standard: Service is available
to anyone who can access
transit service at the park and
ride lot, by driving, walking,
biking or by transfer from
demand response transit
service.
Span of Service Span of service refers to the days of the week and the hours that service is available.
Demand Response Point Deviation Service Commuter Express Bus
Standard: Days - Monday
through Friday (excluding Fort
Bend County holidays). Service
may be provided on Saturday
for the JARC and New Freedom
programs and other services as
funding becomes available.
Hours -Service is typically
scheduled for first
destination drop-off by 8:00
a.m. and last pick-up for service
from activity centers.
up no later than 5:00 p.m.
Standard: Service is available
Monday through Friday
(excluding Fort Bend County
holidays) from 6:40 AM until
5:15 PM.
Standard: Days - Monday
through Friday (excluding Fort
Bend County holidays) and
Hours. Generally between 5:00
a.m. and 9:00 a.m. for service to
activity centers and between
3:00 p.m. and 7:00 p.m. for
service from activity centers –
some routes offer midday
service between 11:00 a.m. and
2:00 p.m.

56
Service Frequency Vehicle headway refers to the time interval between vehicles travelling the same direction on the
same route.
Demand Response Point Deviation Service Commuter Express Bus
Standard: Not Applicable Standard: 60 minute intervals.
More frequent service (smaller
intervals) may be provided as
demand warrants and subject to
available resources (funding and
vehicle availability).
Standard: 15-30 minute
intervals during peak periods in
the peak direction of travel.
More frequent service (smaller
intervals) may be provided as
demand warrants and subject to
available resources (funding
and vehicle availability).
Load Factor The “load factor” reflects the number of passengers divided by the seated capacity of the bus,
reflected as a percentage.
Demand Response Point Deviation Service Commuter Express Bus
Standard: Not to exceed 100%
The demand response service,
while serving members of the
general public, also serves many
older adults and persons with
disabilities. This makes it
important for 100% of riders to
have a seat or wheelchair option.
Fort Bend County Transit does
not allow riders to stand while
onboard the transit agency’s
vehicles.
Reservations for rides will be
accepted on a “time and space”
available basis.
Standard: Not to exceed 100%.
Fort Bend County Transit does
not allow riders to stand while
onboard the transit agency’s
vehicles, therefore each rider
must have a seat (or a location
to secure their wheelchair).
Standard: Not to exceed 100%
The express service is designed
for riders to commute long
distances to activity centers,
making it necessary that riders
have a seat. Fort Bend County
Transit does not allow riders to
stand while onboard the transit
agency’s vehicles.

57
Service Reliability (On-Time Performance) On-time performance is a measure of service reliability.
Demand Response Point Deviation Service Commuter Express Bus
Standard: Service is considered
on-time within 15 minutes
before and 15 minutes after the
scheduled pick-up time.
Standard: Service is considered
on-time if the bus departs a
designated time point no more
than 5 minutes later than
scheduled.
Operators should never depart a
time point early (ahead of the
published schedule) On-time
performance should meet or
exceed 90% at end of line
locations.
Standard: Service is considered
on-time if the bus departs a
designated time point no more
than 5 minutes later than
scheduled.
Operators should never depart a
time point early (ahead of the
published schedule) On-time
performance should meet or
exceed 90% at end of line
locations.
Vehicle Assignment Vehicle assignment refers to the process by which transit vehicles are placed into service throughout
the system.
Standard: Buses are assigned to ensure the best match of vehicle specifications to the types of transit
service to be provided. Vehicles will be assigned on the basis of safety, efficiency, and performance.
Vehicle will not be assigned with the intent to provide preference or benefit to any geographic service
area or any passenger.
Passenger Amenities Passenger amenities include bus stops, benches, and shelters for the convenience of passengers who
must wait for fixed route buses on schedule.
Demand Response Point Deviation Service Commuter Express Bus
Standard: A bus stop and/or a
sign containing pertinent
information may be posted at
destinations that are frequent
stops for demand response
passengers, such as a medical
facility.
Standard: A bus stop and/or a
sign containing route
information will be posted at
stops.
Passenger amenities such as
benches and shelters will be
incorporated in permanent park
and ride lots, but may not be
provided at temporary and/or
leased park and ride lots because
of tenant agreements.
Standard: A bus stop and/or a
sign containing route
information will be posted at
stops.
Passenger amenities such as
benches and shelters will be
incorporated in permanent park
and ride lots, but may not be
provided at temporary and/or
leased park and ride lots
because of tenant agreements.

58
REVIEW OF SYSTEM-WIDE SERVICE CHANGES AND FARE INCREASES
In order to comply with Title VI requirements, the Fort Bend County Public Transportation
Department will evaluate significant system-wide service and fare changes and proposed service
improvements at the planning and programming stages to determine whether those changes have
a discriminatory impact on minority and low-income populations.
The Public Transportation Department will take the following steps to evaluate significant
system-wide service and fare changes and proposed service improvements:
• Assess the effects of the proposed fare or service change on minority and low-income
populations.
Service Changes: Analyze demographic information and maps of the service area to
determine how services changes will impact minority and low-income populations in the
county.
Span of Service: For reducing or increasing the span of service, the Public
Transportation Department will analyze data obtained from ridership surveys or other
data to determine days and times of the day when low-income and minority riders might
be negatively affected by a service span alteration.
Fare Changes: For any reduction or increase in service fares, the Public Transportation
Department will analyze any available information from surveys or other data indicating
whether minority or low-income riders are more likely to use the mode of service,
payment type, or payment media that would be affected by the fare change.
• Assess the alternatives available for people affected by the major service or fare change.
Service Changes: For proposed service changes, the Public Transportation Department
will analyze what, if any, modes of transit or transit services are available for people
affected by the service expansion or reduction. This analysis will compare the travel time
and cost of the current route with the travel time and cost to the rider of the alternatives.
Fare Changes: For proposed fare changes, the Public Transportation Department will
analyze what, if any, alternative transit modes, fare payment types, or fare payment
media are available for people affected by the fare change. This analysis will compare the
fares paid under the change with fares that would be paid through available alternatives.
• Determine which, if any, of the proposals under consideration would have a
disproportionately high and adverse effect on minority and low-income riders.
Under FTA guidelines, Fort Bend County can implement a fare increase or major service
change that would have disproportionately high and adverse effects on minority and low-
income riders provided the Public Transportation Department demonstrates that the
action meets a substantial need that is in the public interest and that alternatives would
have more severe adverse effects than the preferred alternative.

59
• Identify plans to minimize, mitigate, or offset any adverse effects of proposed fare and
service changes on minority and low-income populations.
REVIEW FOR TITLE VI COMPLIANCE
As a way to ensure Title VI compliance, the Fort Bend County Public Transportation
Department will monitor Title VI related service factors. The review will include the following
steps:
• Record of Complaints: The Public Transportation Department will investigate and track
Title VI complaints according to the adopted procedures. Fort Bend County Public
Transportation Department will maintain a list of any active investigations conducted by
entities other than FTA, which includes lawsuits and complaints.
• Ridership Data: The Public Transportation Department will monitor the location of riders of
transit services and compare to the most current demographic data to ensure no
discriminatory service. The department will include questions to ascertain rider
characteristics for Title VI demographics in periodic surveys of transit riders.
• Changes in Service: The Public Transportation Department will evaluate and modify any
change in service in order to eliminate or mitigate adverse effects or discrimination that could
occur as a result of the change. Changes in service include changes in routes, hours of
operation, frequency of service, reduction of service, or elimination of service.
• LEP Plan: The Public Transportation Department will provide language assistance in
Spanish for persons with limited English proficiency according to the LEP Plan. In addition,
the department will monitor available information to anticipate the need for languages other
than English and Spanish. Information on LEP populations will be obtained from ACS data
and school districts in Fort Bend County. This will help track growth of specific languages in
the county and provide insight into what languages people in the general public may need
assistance.
• Public Outreach: The Public Transportation Department will maintain a list of all public
outreach initiatives and presentation. Records will be reviewed periodically to ensure that
minority, low-income, and LEP persons have meaningful access to public outreach activities.

60
This Page Intentionally Left Blank

61
REFERENCES
Federal Transit Administration. Circular 4702.1B, Title VI Requirements and Guidelines for
Federal Transit Administration Recipients. October 1, 2012.
Federal Transit Administration. Quick Reference Title VI Circular 4702.1B. October 3, 2012.
Rural Transit Assistance Program. Transit Managers Toolkit. Available at:
http://nationalrtap.org/transitmanager/AdministrationCompliance/CivilRights. Accessed
September 16, 2015.
Texas Department of Transportation, Public Transportation Division (PTN). Title VI Program
for Federal Transit Administration Recipients, 2015-2018. March 12, 2015.

62
APPENDIX A – TITLE VI DEMOGRAPHIC ANALYSIS
Fort Bend County Demographic Data – Census Block Group Level Source: 2014 ACS 5-Year Estimates
**Highlighted cell indicates census block group is above the county average for the data category**
Location Total
Population Total
Minority* Percent
Minority
Population Aged
65+ Percent
Aged 65+ Total
Households
HH Income
Below Poverty
Level
Percent HH
Income Below
Poverty Level 1999
Fort Bend County 632,946 296,319 46.8% 53,462 27.0% 198,316 19,205 9.7%
Block Group 1, Census Tract 6701.01 1,103 734 66.5% 93 30.2% 308 88 28.6%
Block Group 2, Census Tract 6701.01 1,968 1,423 72.3% 92 18.9% 486 146 30.0%
Block Group 3, Census Tract 6701.01 3,418 2,158 63.1% 215 24.4% 882 168 19.0%
Block Group 4, Census Tract 6701.01 1,823 694 38.1% 166 45.5% 365 96 26.3%
Block Group 1, Census Tract 6701.02 2,397 2,043 85.2% 135 16.1% 836 224 26.8%
Block Group 2, Census Tract 6701.02 952 835 87.7% 48 14.0% 344 38 11.0%
Block Group 1, Census Tract 6702 977 779 79.7% 90 30.7% 293 27 9.2%
Block Group 2, Census Tract 6702 1,075 430 40.0% 175 43.8% 400 28 7.0%
Block Group 3, Census Tract 6702 1,522 1,145 75.2% 44 9.5% 465 42 9.0%
Block Group 4, Census Tract 6702 2,715 2,399 88.4% 187 23.7% 789 0 0.0%
Block Group 5, Census Tract 6702 1,927 1,656 85.9% 143 20.7% 690 148 21.4%
Block Group 1, Census Tract 6703 1,615 1,311 81.2% 226 40.1% 564 37 6.6%
Block Group 2, Census Tract 6703 2,165 1,972 91.1% 229 35.7% 641 101 15.8%
Block Group 1, Census Tract 6704 1,557 1,516 97.4% 59 11.0% 535 29 5.4%
Block Group 2, Census Tract 6704 1,410 1,143 81.1% 200 39.5% 506 138 27.3%
Block Group 3, Census Tract 6704 2,377 2,129 89.6% 163 22.8% 715 52 7.3%
Block Group 1, Census Tract 6705 1,019 897 88.0% 87 27.4% 317 67 21.1%
Block Group 2, Census Tract 6705 3,108 2,566 82.6% 237 20.9% 1,132 76 6.7%
Block Group 1, Census Tract 6706.01 1,584 1,554 98.1% 173 30.2% 572 50 8.7%
Block Group 2, Census Tract 6706.01 1,220 1,090 89.3% 125 28.3% 441 35 7.9%
Block Group 3, Census Tract 6706.01 3,713 3,384 91.1% 460 42.5% 1,083 31 2.9%
Block Group 4, Census Tract 6706.01 2,836 2,640 93.1% 204 23.9% 854 78 9.1%
Block Group 1, Census Tract 6706.02 1,823 1,644 90.2% 131 20.8% 630 276 43.8%
Block Group 1, Census Tract 6707 1,822 1,495 82.1% 170 26.9% 633 41 6.5%
Block Group 2, Census Tract 6707 2,020 1,411 69.9% 213 35.9% 594 46 7.7%
Block Group 1, Census Tract 6708 4,758 4,001 84.1% 187 14.4% 1,300 103 7.9%
Block Group 2, Census Tract 6708 1,946 1,004 51.6% 124 22.1% 561 243 43.3%
Block Group 3, Census Tract 6708 8,603 7,670 89.2% 240 10.6% 2,264 208 9.2%
Block Group 1, Census Tract 6709.01 3,487 2,513 72.1% 342 29.8% 1,149 32 2.8%

63
Location Total
Population Total
Minority* Percent
Minority
Population Aged
65+ Percent
Aged 65+ Total
Households
HH Income
Below Poverty
Level
Percent HH
Income Below
Poverty Level 1999
Fort Bend County 632,946 296,319 46.8% 53,462 27.0% 198,316 19,205 9.7%
Block Group 2, Census Tract 6709.01 4,784 3,912 81.8% 314 21.2% 1,481 56 3.8%
Block Group 3, Census Tract 6709.01 2,994 1,687 56.3% 243 28.9% 841 50 5.9%
Block Group 1, Census Tract 6709.02 4,223 3,769 89.2% 59 4.5% 1,308 35 2.7%
Block Group 2, Census Tract 6709.02 1,252 833 66.5% 137 37.4% 366 126 34.4%
Block Group 1, Census Tract 6710.01 1,664 449 27.0% 484 70.9% 683 42 6.1%
Block Group 2, Census Tract 6710.01 1,499 270 18.0% 302 48.8% 619 15 2.4%
Block Group 3, Census Tract 6710.01 1,467 432 29.4% 272 43.2% 629 28 4.5%
Block Group 4, Census Tract 6710.01 829 291 35.1% 227 65.4% 347 18 5.2%
Block Group 1, Census Tract 6710.02 1,188 753 63.4% 187 36.7% 509 44 8.6%
Block Group 2, Census Tract 6710.02 2,297 994 43.3% 389 60.0% 648 0 0.0%
Block Group 3, Census Tract 6710.02 1,742 878 50.4% 143 23.9% 598 107 17.9%
Block Group 4, Census Tract 6710.02 1,527 1,088 71.3% 190 38.0% 500 80 16.0%
Block Group 1, Census Tract 6711 2,415 1,239 51.3% 122 21.8% 560 89 15.9%
Block Group 2, Census Tract 6711 2,014 579 28.7% 173 24.5% 706 171 24.2%
Block Group 3, Census Tract 6711 1,154 413 35.8% 35 10.3% 340 96 28.2%
Block Group 4, Census Tract 6711 3,024 2,674 88.4% 370 37.3% 993 67 6.7%
Block Group 1, Census Tract 6712 3,872 2,114 54.6% 306 27.7% 1,105 169 15.3%
Block Group 2, Census Tract 6712 2,515 1,939 77.1% 66 8.1% 817 226 27.7%
Block Group 1, Census Tract 6713 2,466 1,414 57.3% 129 16.9% 762 157 20.6%
Block Group 2, Census Tract 6713 1,145 549 47.9% 137 33.0% 415 1 0.2%
Block Group 1, Census Tract 6714 6,839 4,946 72.3% 529 20.5% 2,580 393 15.2%
Block Group 2, Census Tract 6714 1,757 834 47.5% 155 26.5% 585 116 19.8%
Block Group 1, Census Tract 6715.01 1,631 839 51.4% 155 26.2% 592 0 0.0%
Block Group 2, Census Tract 6715.01 1,518 836 55.1% 96 18.5% 520 0 0.0%
Block Group 3, Census Tract 6715.01 2,204 1,764 80.0% 269 40.9% 658 74 11.2%
Block Group 4, Census Tract 6715.01 2,130 1,494 70.1% 213 31.2% 683 63 9.2%
Block Group 1, Census Tract 6715.02 1,616 1,169 72.3% 208 46.7% 445 23 5.2%
Block Group 1, Census Tract 6716.01 1,314 587 44.7% 127 18.6% 684 134 19.6%
Block Group 2, Census Tract 6716.01 2,394 1,417 59.2% 280 35.0% 801 56 7.0%
Block Group 3, Census Tract 6716.01 1,172 261 22.3% 217 51.3% 423 0 0.0%
Block Group 4, Census Tract 6716.01 1,461 698 47.8% 222 44.0% 505 110 21.8%
Block Group 1, Census Tract 6716.02 1,968 839 42.6% 261 40.3% 647 16 2.5%
Block Group 2, Census Tract 6716.02 1,283 403 31.4% 164 35.4% 463 63 13.6%
Block Group 1, Census Tract 6717 981 529 53.9% 129 35.1% 368 0 0.0%
Block Group 2, Census Tract 6717 2,472 387 15.7% 800 87.6% 913 1 0.1%

64
Location Total
Population Total
Minority* Percent
Minority
Population Aged
65+ Percent
Aged 65+ Total
Households
HH Income
Below Poverty
Level
Percent HH
Income Below
Poverty Level 1999
Fort Bend County 632,946 296,319 46.8% 53,462 27.0% 198,316 19,205 9.7%
Block Group 3, Census Tract 6717 1,689 680 40.3% 259 45.0% 576 96 16.7%
Block Group 1, Census Tract 6718 1,574 556 35.3% 250 51.0% 490 26 5.3%
Block Group 2, Census Tract 6718 1,419 878 61.9% 105 16.4% 639 49 7.7%
Block Group 1, Census Tract 6719 1,179 338 28.7% 183 49.1% 373 51 13.7%
Block Group 2, Census Tract 6719 1,392 393 28.2% 363 62.8% 578 19 3.3%
Block Group 3, Census Tract 6719 1,185 256 21.6% 115 31.9% 361 21 5.8%
Block Group 1, Census Tract 6720.01 2,234 1,643 73.5% 274 46.7% 587 150 25.6%
Block Group 2, Census Tract 6720.01 2,484 1,841 74.1% 208 29.1% 716 0 0.0%
Block Group 3, Census Tract 6720.01 1,879 932 49.6% 322 41.9% 768 305 39.7%
Block Group 4, Census Tract 6720.01 1,716 1,176 68.5% 133 26.6% 500 49 9.8%
Block Group 1, Census Tract 6720.02 1,837 786 42.8% 157 16.0% 980 184 18.8%
Block Group 2, Census Tract 6720.02 3,146 2,131 67.7% 243 17.0% 1,430 477 33.4%
Block Group 3, Census Tract 6720.02 858 633 73.8% 104 32.2% 323 0 0.0%
Block Group 1, Census Tract 6721 2,396 956 39.9% 439 44.2% 994 61 6.1%
Block Group 2, Census Tract 6721 1,038 99 9.5% 320 74.4% 430 20 4.7%
Block Group 1, Census Tract 6722 2,494 381 15.3% 260 29.4% 884 28 3.2%
Block Group 2, Census Tract 6722 930 359 38.6% 221 63.1% 350 92 26.3%
Block Group 1, Census Tract 6723.01 8,210 5,595 68.1% 382 15.4% 2,484 96 3.9%
Block Group 1, Census Tract 6723.02 1,210 267 22.1% 210 46.0% 457 20 4.4%
Block Group 2, Census Tract 6723.02 964 97 10.1% 98 23.1% 425 47 11.1%
Block Group 3, Census Tract 6723.02 1,523 88 5.8% 350 61.2% 572 62 10.8%
Block Group 4, Census Tract 6723.02 4,976 2,856 57.4% 371 23.8% 1,556 48 3.1%
Block Group 1, Census Tract 6724 2,323 1,496 64.4% 251 34.3% 731 23 3.1%
Block Group 2, Census Tract 6724 3,474 1,545 44.5% 112 13.2% 849 168 19.8%
Block Group 3, Census Tract 6724 1,944 986 50.7% 45 7.7% 584 201 34.4%
Block Group 4, Census Tract 6724 1,910 620 32.5% 184 36.7% 501 132 26.3%
Block Group 1, Census Tract 6725 3,024 1,890 62.5% 100 11.7% 853 171 20.0%
Block Group 2, Census Tract 6725 1,024 583 56.9% 78 21.1% 370 0 0.0%
Block Group 3, Census Tract 6725 3,438 2,509 73.0% 606 57.5% 1,054 48 4.6%
Block Group 1, Census Tract 6726.01 3,140 1,818 57.9% 248 23.7% 1,046 262 25.0%
Block Group 2, Census Tract 6726.01 1,115 414 37.1% 54 19.9% 272 46 16.9%
Block Group 3, Census Tract 6726.01 2,146 1,563 72.8% 78 13.7% 569 26 4.6%
Block Group 4, Census Tract 6726.01 1,241 879 70.8% 187 32.6% 573 92 16.1%
Block Group 5, Census Tract 6726.01 2,421 742 30.6% 91 15.6% 585 121 20.7%
Block Group 1, Census Tract 6726.02 2,916 2,114 72.5% 143 17.8% 802 51 6.4%

65
Location Total
Population Total
Minority* Percent
Minority
Population Aged
65+ Percent
Aged 65+ Total
Households
HH Income
Below Poverty
Level
Percent HH
Income Below
Poverty Level 1999
Fort Bend County 632,946 296,319 46.8% 53,462 27.0% 198,316 19,205 9.7%
Block Group 2, Census Tract 6726.02 3,908 2,517 64.4% 249 25.3% 983 97 9.9%
Block Group 1, Census Tract 6727.01 5,263 4,138 78.6% 271 23.0% 1,179 207 17.6%
Block Group 2, Census Tract 6727.01 8,627 6,429 74.5% 552 26.0% 2,125 361 17.0%
Block Group 3, Census Tract 6727.01 1,803 1,111 61.6% 215 42.2% 509 115 22.6%
Block Group 1, Census Tract 6727.02 2,363 1,400 59.2% 166 23.9% 695 107 15.4%
Block Group 2, Census Tract 6727.02 4,744 2,293 48.3% 375 26.1% 1,435 97 6.8%
Block Group 1, Census Tract 6728 7,842 5,206 66.4% 409 17.8% 2,295 275 12.0%
Block Group 1, Census Tract 6729 34,898 20,252 58.0% 1,703 16.2% 10,534 1,102 10.5%
Block Group 1, Census Tract 6730.01 3,435 945 27.5% 387 34.7% 1,114 33 3.0%
Block Group 2, Census Tract 6730.01 2,422 354 14.6% 245 25.0% 981 36 3.7%
Block Group 3, Census Tract 6730.01 1,910 520 27.2% 100 16.3% 612 8 1.3%
Block Group 1, Census Tract 6730.02 6,309 2,599 41.2% 360 17.9% 2,007 94 4.7%
Block Group 2, Census Tract 6730.02 2,686 1,343 50.0% 211 26.5% 797 20 2.5%
Block Group 1, Census Tract 6730.03 4,954 1,614 32.6% 340 24.4% 1,393 56 4.0%
Block Group 2, Census Tract 6730.03 7,983 2,319 29.0% 181 7.7% 2,347 118 5.0%
Block Group 1, Census Tract 6731.01 33,034 9,535 28.9% 1,547 15.5% 9,965 235 2.4%
Block Group 2, Census Tract 6731.01 9,560 2,941 30.8% 480 16.6% 2,885 146 5.1%
Block Group 3, Census Tract 6731.01 3,736 670 17.9% 309 24.7% 1,253 76 6.1%
Block Group 1, Census Tract 6731.02 11,872 2,692 22.7% 893 22.7% 3,928 73 1.9%
Block Group 2, Census Tract 6731.02 5,257 1,505 28.6% 191 12.8% 1,489 0 0.0%
Block Group 1, Census Tract 6732 925 45 4.9% 98 29.9% 328 14 4.3%
Block Group 2, Census Tract 6732 7,227 1,524 21.1% 325 14.3% 2,280 128 5.6%
Block Group 1, Census Tract 6733 3,476 328 9.4% 685 49.8% 1,376 36 2.6%
Block Group 2, Census Tract 6733 1,137 191 16.8% 171 44.2% 387 44 11.4%
Block Group 1, Census Tract 6734 11,435 2,658 23.2% 730 21.9% 3,336 82 2.5%
Block Group 2, Census Tract 6734 5,631 1,248 22.2% 513 25.8% 1,985 109 5.5%
Block Group 1, Census Tract 6735 4,048 988 24.4% 502 35.0% 1,434 17 1.2%
Block Group 2, Census Tract 6735 2,707 350 12.9% 184 15.7% 1,171 70 6.0%
Block Group 3, Census Tract 6735 1,561 218 14.0% 117 22.0% 531 22 4.1%
Block Group 1, Census Tract 6736 1,933 0 0.0% 272 44.8% 607 0 0.0%
Block Group 2, Census Tract 6736 1,873 200 10.7% 196 34.1% 575 32 5.6%
Block Group 3, Census Tract 6736 1,728 50 2.9% 320 44.5% 719 0 0.0%
Block Group 4, Census Tract 6736 1,565 22 1.4% 136 25.3% 537 21 3.9%
Block Group 1, Census Tract 6737 2,355 1,093 46.4% 79 1580.0% 5 0 0.0%
Block Group 1, Census Tract 6738 3,139 1,698 54.1% 184 20.7% 888 60 6.8%

66
Location Total
Population Total
Minority* Percent
Minority
Population Aged
65+ Percent
Aged 65+ Total
Households
HH Income
Below Poverty
Level
Percent HH
Income Below
Poverty Level 1999
Fort Bend County 632,946 296,319 46.8% 53,462 27.0% 198,316 19,205 9.7%
Block Group 2, Census Tract 6738 2,439 1,900 77.9% 136 17.7% 767 0 0.0%
Block Group 3, Census Tract 6738 2,676 1,690 63.2% 144 19.5% 739 103 13.9%
Block Group 4, Census Tract 6738 1,156 74 6.4% 116 36.0% 322 102 31.7%
Block Group 1, Census Tract 6739.01 2,177 1,372 63.0% 112 17.2% 650 32 4.9%
Block Group 2, Census Tract 6739.01 2,120 1,124 53.0% 272 42.8% 635 13 2.0%
Block Group 3, Census Tract 6739.01 3,257 1,076 33.0% 211 21.6% 977 40 4.1%
Block Group 4, Census Tract 6739.01 1,586 593 37.4% 79 19.3% 409 48 11.7%
Block Group 1, Census Tract 6739.02 7,188 5,848 81.4% 476 23.6% 2,019 57 2.8%
Block Group 2, Census Tract 6739.02 2,027 1,519 74.9% 62 9.0% 690 53 7.7%
Block Group 1, Census Tract 6740 2,834 900 31.8% 65 7.8% 830 38 4.6%
Block Group 2, Census Tract 6740 2,887 1,395 48.3% 710 56.6% 1,254 61 4.9%
Block Group 3, Census Tract 6740 2,252 1,072 47.6% 260 31.2% 833 56 6.7%
Block Group 1, Census Tract 6741 2,043 865 42.3% 244 34.9% 700 0 0.0%
Block Group 2, Census Tract 6741 1,472 510 34.6% 260 45.6% 570 80 14.0%
Block Group 3, Census Tract 6741 1,955 651 33.3% 143 18.8% 759 72 9.5%
Block Group 4, Census Tract 6741 1,460 265 18.2% 60 13.2% 454 0 0.0%
Block Group 1, Census Tract 6742 1,279 723 56.5% 101 24.6% 410 35 8.5%
Block Group 2, Census Tract 6742 1,469 777 52.9% 159 37.9% 419 30 7.2%
Block Group 3, Census Tract 6742 1,434 432 30.1% 188 40.8% 461 20 4.3%
Block Group 4, Census Tract 6742 1,470 502 34.1% 162 36.4% 445 0 0.0%
Block Group 1, Census Tract 6743 1,515 379 25.0% 49 11.1% 443 29 6.5%
Block Group 2, Census Tract 6743 2,603 1,690 64.9% 101 14.1% 716 16 2.2%
Block Group 3, Census Tract 6743 4,906 3,486 71.1% 372 25.6% 1,455 0 0.0%
Block Group 1, Census Tract 6744 6,003 4,690 78.1% 636 42.7% 1,490 14 0.9%
Block Group 2, Census Tract 6744 1,335 175 13.1% 144 32.0% 450 51 11.3%
Block Group 3, Census Tract 6744 5,317 3,270 61.5% 291 19.7% 1,479 26 1.8%
Block Group 1, Census Tract 6745.01 8,180 4,979 60.9% 711 27.6% 2,576 37 1.4%
Block Group 1, Census Tract 6745.02 15,927 7,802 49.0% 1,016 22.3% 4,560 475 10.4%
Block Group 2, Census Tract 6745.02 2,722 484 17.8% 196 24.5% 800 0 0.0%
Block Group 1, Census Tract 6746.01 2,576 563 21.9% 461 50.4% 915 7 0.8%
Block Group 2, Census Tract 6746.01 1,100 79 7.2% 242 59.9% 404 0 0.0%
Block Group 1, Census Tract 6746.02 3,904 658 16.9% 228 19.7% 1,155 61 5.3%
Block Group 2, Census Tract 6746.02 3,883 877 22.6% 366 30.2% 1,213 0 0.0%
Block Group 1, Census Tract 6746.03 1,466 62 4.2% 491 99.0% 496 15 3.0%
Block Group 2, Census Tract 6746.03 1,195 294 24.6% 101 21.3% 475 78 16.4%

67
Location Total
Population Total
Minority* Percent
Minority
Population Aged
65+ Percent
Aged 65+ Total
Households
HH Income
Below Poverty
Level
Percent HH
Income Below
Poverty Level 1999
Fort Bend County 632,946 296,319 46.8% 53,462 27.0% 198,316 19,205 9.7%
Block Group 3, Census Tract 6746.03 3,265 712 21.8% 319 30.3% 1,054 35 3.3%
Block Group 1, Census Tract 6746.04 5,095 2,759 54.2% 418 30.4% 1,376 114 8.3%
Block Group 1, Census Tract 6747 4,686 3,403 72.6% 384 32.0% 1,199 96 8.0%
Block Group 2, Census Tract 6747 663 95 14.3% 127 81.4% 156 47 30.1%
Block Group 3, Census Tract 6747 6,677 2,888 43.3% 744 33.5% 2,219 53 2.4%
Block Group 1, Census Tract 6748 943 542 57.5% 155 36.9% 420 227 54.0%
Block Group 2, Census Tract 6748 491 0 0.0% 201 75.3% 267 29 10.9%
Block Group 3, Census Tract 6748 935 0 0.0% 141 44.1% 320 46 14.4%
Block Group 4, Census Tract 6748 2,247 460 20.5% 99 13.2% 748 268 35.8%
Block Group 5, Census Tract 6748 687 39 5.7% 0 0.0% 299 72 24.1%
Block Group 1, Census Tract 6749 886 247 27.9% 83 24.7% 336 133 39.6%
Block Group 2, Census Tract 6749 715 284 39.7% 68 35.8% 190 46 24.2%
Block Group 3, Census Tract 6749 2,493 432 17.3% 182 31.5% 578 287 49.7%
Block Group 4, Census Tract 6749 1,468 477 32.5% 183 44.5% 411 36 8.8%
Block Group 1, Census Tract 6750 1,320 340 25.8% 170 35.0% 486 148 30.5%
Block Group 2, Census Tract 6750 1,889 337 17.8% 99 17.9% 552 128 23.2%
Block Group 1, Census Tract 6751 1,894 28 1.5% 260 46.0% 565 271 48.0%
Block Group 2, Census Tract 6751 1,453 198 13.6% 248 56.4% 440 55 12.5%
Block Group 3, Census Tract 6751 1,305 157 12.0% 148 35.6% 416 15 3.6%
Block Group 4, Census Tract 6751 5,893 2,137 36.3% 656 34.3% 1,915 217 11.3%
Block Group 1, Census Tract 6752 1,313 65 5.0% 54 12.7% 425 203 47.8%
Block Group 2, Census Tract 6752 1,250 85 6.8% 65 16.9% 385 126 32.7%
Block Group 3, Census Tract 6752 3,100 471 15.2% 268 27.7% 967 100 10.3%
Block Group 4, Census Tract 6752 555 14 2.5% 107 45.7% 234 67 28.6%
Block Group 1, Census Tract 6753 1,489 78 5.2% 353 53.9% 655 152 23.2%
Block Group 2, Census Tract 6753 2,290 590 25.8% 288 40.6% 709 225 31.7%
Block Group 3, Census Tract 6753 719 575 80.0% 163 74.4% 219 101 46.1%
Block Group 4, Census Tract 6753 2,387 393 16.5% 119 19.9% 599 117 19.5%
Block Group 1, Census Tract 6754 2,707 180 6.6% 201 22.7% 887 220 24.8%
Block Group 2, Census Tract 6754 4,012 495 12.3% 462 34.8% 1,327 155 11.7%
Block Group 1, Census Tract 6755 8,502 3,532 41.5% 772 28.4% 2,720 115 4.2%
Block Group 2, Census Tract 6755 4,675 1,305 27.9% 228 16.6% 1,377 141 10.2%
Block Group 1, Census Tract 6756 3,646 194 5.3% 369 28.6% 1,290 185 14.3%
Block Group 2, Census Tract 6756 2,339 13 0.6% 181 28.9% 626 50 8.0%
Block Group 1, Census Tract 6757 1,803 479 26.6% 254 39.4% 645 139 21.6%

68
Location Total
Population Total
Minority* Percent
Minority
Population Aged
65+ Percent
Aged 65+ Total
Households
HH Income
Below Poverty
Level
Percent HH
Income Below
Poverty Level 1999
Fort Bend County 632,946 296,319 46.8% 53,462 27.0% 198,316 19,205 9.7%
Block Group 2, Census Tract 6757 2,823 188 6.7% 456 39.3% 1,160 243 20.9%
Block Group 3, Census Tract 6757 1,688 64 3.8% 191 33.5% 570 54 9.5%
Block Group 1, Census Tract 6758 742 0 0.0% 121 43.1% 281 8 2.8%
Block Group 2, Census Tract 6758 1,932 215 11.1% 283 46.3% 611 218 35.7%
Block Group 3, Census Tract 6758 610 460 75.4% 169 52.5% 322 207 64.3%

69
Fort Bend County Demographic Data – Census Tract Level Data Source: 2014 ACS 5-Year Estimates
**Highlighted cell indicates census tract is above the county average for the data category**
Location
Total Population
5+
Persons 5+ with
Disabilities Percent
Disabled Total
Population 5+
Total Population 5+
Speak Language other than
English at Home
Percent of Population
Non-English at Home
Fort Bend County 583,013 47,393 8.1% 588,234 200,500 34%
Census Tract 6701.01 7,633 901 11.8% 7,633 4,396 58%
Census Tract 6701.02 3,151 487 15.5% 3,162 1,009 32%
Census Tract 6702 7,788 687 8.8% 7,788 2,790 36%
Census Tract 6703 3,458 573 16.6% 3,458 601 17%
Census Tract 6704 5,004 393 7.9% 5,004 425 8%
Census Tract 6705 3,897 300 7.7% 3,908 857 22%
Census Tract 6706.01 8,894 768 8.6% 8,905 1,377 15%
Census Tract 6706.02 1,699 233 13.7% 1,699 480 28%
Census Tract 6707 3,514 388 11.0% 3,514 999 28%
Census Tract 6708 14,498 1,407 9.7% 14,498 3,845 27%
Census Tract 6709.01 10,866 752 6.9% 10,866 3,171 29%
Census Tract 6709.02 5,047 251 5.0% 5,057 1,311 26%
Census Tract 6710.01 5,148 667 13.0% 5,148 503 10%
Census Tract 6710.02 6,422 688 10.7% 6,422 653 10%
Census Tract 6711 7,868 922 11.7% 7,908 3,023 38%
Census Tract 6712 5,802 657 11.3% 5,802 2,057 35%
Census Tract 6713 3,343 336 10.1% 3,343 1,347 40%
Census Tract 6714 8,145 483 5.9% 8,145 4,327 53%
Census Tract 6715.01 6,956 349 5.0% 7,070 2,426 34%
Census Tract 6715.02 1,567 194 12.4% 1,567 534 34%
Census Tract 6716.01 5,936 530 8.9% 5,936 1,619 27%
Census Tract 6716.02 3,027 320 10.6% 3,027 982 32%
Census Tract 6717 4,755 408 8.6% 4,833 1,021 21%
Census Tract 6718 2,836 204 7.2% 2,836 1,089 38%
Census Tract 6719 3,613 368 10.2% 3,613 868 24%
Census Tract 6720.01 7,718 680 8.8% 7,797 4,786 61%
Census Tract 6720.02 5,524 551 10.0% 5,524 2,187 40%
Census Tract 6721 3,231 242 7.5% 3,354 799 24%
Census Tract 6722 3,211 304 9.5% 3,211 682 21%
Census Tract 6723.01 7,784 484 6.2% 7,784 4,741 61%
Census Tract 6723.02 8,133 804 9.9% 8,133 2,715 33%
Census Tract 6724 8,970 474 5.3% 8,970 5,283 59%

70
Location
Total Population
5+
Persons 5+ with
Disabilities Percent
Disabled Total
Population 5+
Total Population 5+
Speak Language other than
English at Home
Percent of Population
Non-English at Home
Fort Bend County 583,013 47,393 8.1% 588,234 200,500 34%
Census Tract 6725 7,069 485 6.9% 7,069 3,981 56%
Census Tract 6726.01 9,083 401 4.4% 9,083 5,573 61%
Census Tract 6726.02 6,453 407 6.3% 6,464 3,602 56%
Census Tract 6727.01 14,534 1,016 7.0% 14,542 9,608 66%
Census Tract 6727.02 6,644 268 4.0% 6,644 2,133 32%
Census Tract 6728 6,816 365 5.4% 7,343 3,182 43%
Census Tract 6729 30,953 2,292 7.4% 30,963 13,175 43%
Census Tract 6730.01 7,492 363 4.8% 7,492 871 12%
Census Tract 6730.02 8,275 454 5.5% 8,275 3,133 38%
Census Tract 6730.03 11,975 168 1.4% 11,975 3,255 27%
Census Tract 6731.01 41,805 1,942 4.6% 41,941 10,448 25%
Census Tract 6731.02 16,062 881 5.5% 16,062 5,088 32%
Census Tract 6732 7,401 617 8.3% 7,401 1,244 17%
Census Tract 6733 4,414 345 7.8% 4,414 464 11%
Census Tract 6734 15,363 1,003 6.5% 15,363 2,356 15%
Census Tract 6735 7,933 587 7.4% 7,933 943 12%
Census Tract 6736 6,769 676 10.0% 6,769 943 14%
Census Tract 6737 13 4 30.8% 2,355 445 19%
Census Tract 6738 8,720 820 9.4% 8,720 4,563 52%
Census Tract 6739.01 8,723 468 5.4% 8,905 2,893 32%
Census Tract 6739.02 8,357 329 3.9% 8,357 5,228 63%
Census Tract 6740 7,669 540 7.0% 7,669 2,898 38%
Census Tract 6741 6,671 578 8.7% 6,671 1,574 24%
Census Tract 6742 5,350 142 2.7% 5,350 1,494 28%
Census Tract 6743 8,645 314 3.6% 8,645 3,848 45%
Census Tract 6744 11,883 441 3.7% 11,883 5,932 50%
Census Tract 6745.01 7,476 314 4.2% 7,476 2,295 31%
Census Tract 6745.02 17,011 1,234 7.3% 17,011 3,182 19%
Census Tract 6746.01 3,433 250 7.3% 3,433 448 13%
Census Tract 6746.02 7,102 318 4.5% 7,102 1,029 14%
Census Tract 6746.03 5,637 867 15.4% 5,637 1,373 24%
Census Tract 6746.04 4,633 347 7.5% 4,633 2,103 45%
Census Tract 6747 10,175 853 8.4% 11,275 3,988 35%
Census Tract 6748 4,788 935 19.5% 4,792 1,887 39%
Census Tract 6749 4,777 1,144 23.9% 4,967 2,789 56%
Census Tract 6750 2,946 608 20.6% 2,946 1,579 54%
Census Tract 6751 9,707 1,085 11.2% 9,808 3,434 35%

71
Location
Total Population
5+
Persons 5+ with
Disabilities Percent
Disabled Total
Population 5+
Total Population 5+
Speak Language other than
English at Home
Percent of Population
Non-English at Home
Fort Bend County 583,013 47,393 8.1% 588,234 200,500 34%
Census Tract 6752 5,864 770 13.1% 5,864 2,862 49%
Census Tract 6753 6,257 999 16.0% 6,310 2,647 42%
Census Tract 6754 6,017 930 15.5% 6,017 2,230 37%
Census Tract 6755 12,045 1,478 12.3% 12,045 3,185 26%
Census Tract 6756 5,583 1,134 20.3% 5,595 1,769 32%
Census Tract 6757 5,897 854 14.5% 5,965 891 15%
Census Tract 6758 3,155 562 17.8% 3,155 1,032 33%

72
Fort Bend County Demographic Data – Linguistic Isolation, Census Tract Level Data Source: 2009 ACS 5-Year Estimates
**Highlighted cell indicates census tract is above the county average for the data category**
Location
Total Households
(2009)
Households that Are
Linguistically Isolated
Percent Linguistically
Isolated
Fort Bend County 140,542 74,545 53.0%
Census Tract 6701 1,858 771 41.5%
Census Tract 6702 1,858 572 30.8%
Census Tract 6703 834 175 21.0%
Census Tract 6704 1,030 319 31.0%
Census Tract 6705 1,097 277 25.3%
Census Tract 6706 2,928 430 14.7%
Census Tract 6707 756 278 36.8%
Census Tract 6708 2,908 1,097 37.7%
Census Tract 6709 3,323 1,440 43.3%
Census Tract 6710 4,050 935 23.1%
Census Tract 6711 1,925 907 47.1%
Census Tract 6712 1,608 730 45.4%
Census Tract 6713 1,142 706 61.8%
Census Tract 6714 1,931 1,535 79.5%
Census Tract 6715 2,741 2,028 74.0%
Census Tract 6716 3,397 2,385 70.2%
Census Tract 6717 1,825 722 39.6%
Census Tract 6718 851 502 59.0%
Census Tract 6719 1,834 945 51.5%
Census Tract 6720 4,649 3,664 78.8%
Census Tract 6721 1,416 1,044 73.7%
Census Tract 6722 1,033 344 33.3%
Census Tract 6723 4,533 3,182 70.2%
Census Tract 6724 2,089 1,785 85.4%
Census Tract 6725 1,930 1,456 75.4%
Census Tract 6726 3,758 2,707 72.0%
Census Tract 6727 4,327 3,402 78.6%
Census Tract 6728 1,606 1,280 79.7%
Census Tract 6729 4,331 2,719 62.8%
Census Tract 6730 7,143 3,514 49.2%
Census Tract 6731 8,567 3,894 45.5%
Census Tract 6732 837 143 17.1%
Census Tract 6733 1,190 162 13.6%
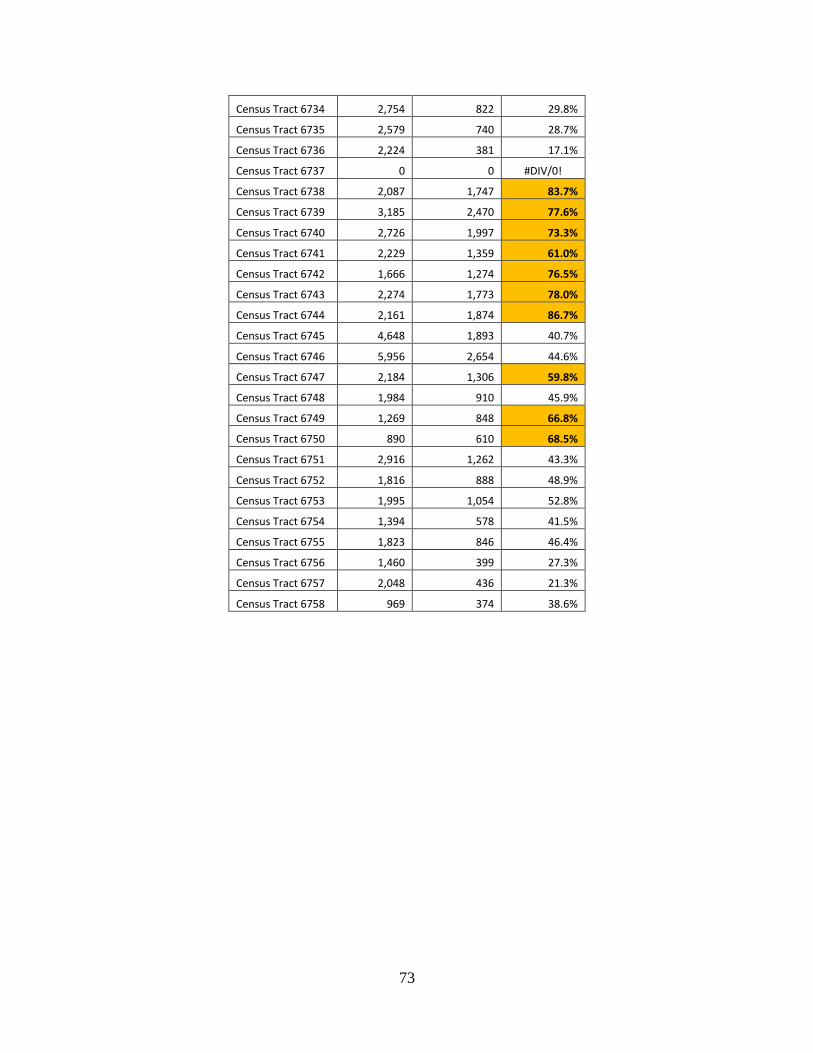
73
Census Tract 6734 2,754 822 29.8%
Census Tract 6735 2,579 740 28.7%
Census Tract 6736 2,224 381 17.1%
Census Tract 6737 0 0 #DIV/0!
Census Tract 6738 2,087 1,747 83.7%
Census Tract 6739 3,185 2,470 77.6%
Census Tract 6740 2,726 1,997 73.3%
Census Tract 6741 2,229 1,359 61.0%
Census Tract 6742 1,666 1,274 76.5%
Census Tract 6743 2,274 1,773 78.0%
Census Tract 6744 2,161 1,874 86.7%
Census Tract 6745 4,648 1,893 40.7%
Census Tract 6746 5,956 2,654 44.6%
Census Tract 6747 2,184 1,306 59.8%
Census Tract 6748 1,984 910 45.9%
Census Tract 6749 1,269 848 66.8%
Census Tract 6750 890 610 68.5%
Census Tract 6751 2,916 1,262 43.3%
Census Tract 6752 1,816 888 48.9%
Census Tract 6753 1,995 1,054 52.8%
Census Tract 6754 1,394 578 41.5%
Census Tract 6755 1,823 846 46.4%
Census Tract 6756 1,460 399 27.3%
Census Tract 6757 2,048 436 21.3%
Census Tract 6758 969 374 38.6%

74
This Page Intentionally Left Blank

75
APPENDIX B – LANGUAGE SPOKEN AT HOME IN FORT BEND COUNTY
Fort Bend County Demographic Data – Language Spoken At Home by Population 5 Years or Older, Census Tract Level Data Source: 2014 ACS 5-Year Estimates
**Highlighted cell indicates census tract is above the county average for the data category**
.
Language Spoken at Home by Persons 5+
Spanish or
Spanish Creole Chinese Vietnamese Urdu Other Asian languages Hindi Tagalog
African languages Gujarati
Location
Total Population 5+ La
ngu
age
Po
pu
lati
on
% o
f To
tal
Po
pu
lati
on
Lan
guag
e
Po
pu
lati
on
% o
f To
tal
Po
pu
lati
on
Lan
guag
e
Po
pu
lati
on
% o
f To
tal
Po
pu
lati
on
Lan
guag
e
Po
pu
lati
on
% o
f To
tal
Po
pu
lati
on
Lan
guag
e
Po
pu
lati
on
% o
f To
tal
Po
pu
lati
on
Lan
guag
e
Po
pu
lati
on
% o
f To
tal
Po
pu
lati
on
Lan
guag
e
Po
pu
lati
on
% o
f To
tal
Po
pu
lati
on
Lan
guag
e
Po
pu
lati
on
% o
f To
tal
Po
pu
lati
on
Lan
guag
e
Po
pu
lati
on
% o
f To
tal
Po
pu
lati
on
Fort Bend County 588,234 36,958 6.28% 9,904 1.68% 7,674 1.30% 4,039 0.69% 3,087 0.52% 1,551 0.26% 1,892 0.32% 2,257 0.38% 2,169 0.37%
Census Tract 6701.01 7,633 2,358 30.89% 0 0.00% 0 0.00% 0 0.00% 0 0.00% 0 0.00% 0 0.00% 19 0.25% 0 0.00%
Census Tract 6701.02 3,162 434 13.73% 0 0.00% 0 0.00% 0 0.00% 0 0.00% 0 0.00% 0 0.00% 0 0.00% 0 0.00%
Census Tract 6702 7,788 1,655 21.25% 0 0.00% 0 0.00% 0 0.00% 0 0.00% 0 0.00% 0 0.00% 0 0.00% 0 0.00%
Census Tract 6703 3,458 217 6.28% 0 0.00% 0 0.00% 0 0.00% 0 0.00% 0 0.00% 0 0.00% 0 0.00% 0 0.00%
Census Tract 6704 5,004 148 2.96% 0 0.00% 0 0.00% 0 0.00% 0 0.00% 0 0.00% 0 0.00% 61 1.22% 0 0.00%
Census Tract 6705 3,908 189 4.84% 0 0.00% 0 0.00% 0 0.00% 48 1.23% 0 0.00% 0 0.00% 33 0.84% 0 0.00%
Census Tract 6706.01 8,905 304 3.41% 0 0.00% 0 0.00% 0 0.00% 0 0.00% 0 0.00% 0 0.00% 43 0.48% 0 0.00%
Census Tract 6706.02 1,699 148 8.71% 0 0.00% 0 0.00% 0 0.00% 0 0.00% 0 0.00% 0 0.00% 10 0.59% 0 0.00%
Census Tract 6707 3,514 185 5.26% 0 0.00% 117 3.33% 17 0.48% 14 0.40% 14 0.40% 54 1.54% 0 0.00% 0 0.00%
Census Tract 6708 14,498 1,932 13.33% 0 0.00% 0 0.00% 0 0.00% 0 0.00% 0 0.00% 0 0.00% 238 1.64% 0 0.00%
Census Tract 6709.01 10,866 162 1.49% 201 1.85% 159 1.46% 40 0.37% 499 4.59% 0 0.00% 85 0.78% 0 0.00% 0 0.00%
Census Tract 6709.02 5,057 467 9.23% 0 0.00% 100 1.98% 0 0.00% 0 0.00% 0 0.00% 0 0.00% 0 0.00% 0 0.00%
Census Tract 6710.01 5,148 90 1.75% 21 0.41% 0 0.00% 0 0.00% 0 0.00% 14 0.27% 14 0.27% 0 0.00% 0 0.00%
Census Tract 6710.02 6,422 81 1.26% 12 0.19% 0 0.00% 0 0.00% 10 0.16% 0 0.00% 0 0.00% 0 0.00% 0 0.00%
Census Tract 6711 7,908 1,347 17.03% 0 0.00% 0 0.00% 0 0.00% 33 0.42% 0 0.00% 14 0.18% 71 0.90% 79 1.00%
Census Tract 6712 5,802 747 12.87% 0 0.00% 15 0.26% 0 0.00% 32 0.55% 0 0.00% 28 0.48% 12 0.21% 0 0.00%
Census Tract 6713 3,343 415 12.41% 57 1.71% 26 0.78% 0 0.00% 167 5.00% 24 0.72% 0 0.00% 8 0.24% 0 0.00%

76
Language Spoken at Home by Persons 5+
Spanish or
Spanish Creole Chinese Vietnamese Urdu Other Asian languages Hindi Tagalog
African languages Gujarati
Location
Total Population 5+ La
ngu
age
Po
pu
lati
on
% o
f To
tal
Po
pu
lati
on
Lan
guag
e
Po
pu
lati
on
% o
f To
tal
Po
pu
lati
on
Lan
guag
e
Po
pu
lati
on
% o
f To
tal
Po
pu
lati
on
Lan
guag
e
Po
pu
lati
on
% o
f To
tal
Po
pu
lati
on
Lan
guag
e
Po
pu
lati
on
% o
f To
tal
Po
pu
lati
on
Lan
guag
e
Po
pu
lati
on
% o
f To
tal
Po
pu
lati
on
Lan
guag
e
Po
pu
lati
on
% o
f To
tal
Po
pu
lati
on
Lan
guag
e
Po
pu
lati
on
% o
f To
tal
Po
pu
lati
on
Lan
guag
e
Po
pu
lati
on
% o
f To
tal
Po
pu
lati
on
Fort Bend County 588,234 36,958 6.28% 9,904 1.68% 7,674 1.30% 4,039 0.69% 3,087 0.52% 1,551 0.26% 1,892 0.32% 2,257 0.38% 2,169 0.37%
Census Tract 6714 8,145 532 6.53% 275 3.38% 192 2.36% 277 3.40% 232 2.85% 115 1.41% 15 0.18% 15 0.18% 406 4.98%
Census Tract 6715.01 7,070 45 0.64% 460 6.51% 0 0.00% 17 0.24% 24 0.34% 34 0.48% 46 0.65% 0 0.00% 15 0.21%
Census Tract 6715.02 1,567 53 3.38% 103 6.57% 28 1.79% 3 0.19% 7 0.45% 17 1.08% 15 0.96% 0 0.00% 0 0.00%
Census Tract 6716.01 5,936 211 3.55% 363 6.12% 81 1.36% 180 3.03% 114 1.92% 0 0.00% 0 0.00% 0 0.00% 31 0.52%
Census Tract 6716.02 3,027 36 1.19% 243 8.03% 3 0.10% 0 0.00% 10 0.33% 0 0.00% 11 0.36% 0 0.00% 30 0.99%
Census Tract 6717 4,833 5 0.10% 149 3.08% 27 0.56% 4 0.08% 0 0.00% 0 0.00% 79 1.63% 0 0.00% 0 0.00%
Census Tract 6718 2,836 109 3.84% 50 1.76% 0 0.00% 7 0.25% 0 0.00% 0 0.00% 10 0.35% 0 0.00% 0 0.00%
Census Tract 6719 3,613 118 3.27% 0 0.00% 43 1.19% 0 0.00% 30 0.83% 0 0.00% 26 0.72% 17 0.47% 18 0.50%
Census Tract 6720.01 7,797 321 4.12% 624 8.00% 644 8.26% 242 3.10% 92 1.18% 70 0.90% 57 0.73% 88 1.13% 0 0.00%
Census Tract 6720.02 5,524 297 5.38% 72 1.30% 177 3.20% 92 1.67% 52 0.94% 119 2.15% 5 0.09% 40 0.72% 0 0.00%
Census Tract 6721 3,354 33 0.98% 127 3.79% 9 0.27% 27 0.81% 0 0.00% 0 0.00% 0 0.00% 0 0.00% 30 0.89%
Census Tract 6722 3,211 232 7.23% 34 1.06% 0 0.00% 0 0.00% 0 0.00% 0 0.00% 0 0.00% 0 0.00% 0 0.00%
Census Tract 6723.01 7,784 712 9.15% 155 1.99% 299 3.84% 92 1.18% 21 0.27% 0 0.00% 30 0.39% 230 2.95% 32 0.41%
Census Tract 6723.02 8,133 237 2.91% 288 3.54% 188 2.31% 74 0.91% 35 0.43% 85 1.05% 19 0.23% 0 0.00% 11 0.14%
Census Tract 6724 8,970 1,155 12.88% 233 2.60% 580 6.47% 42 0.47% 30 0.33% 0 0.00% 0 0.00% 69 0.77% 0 0.00%
Census Tract 6725 7,069 1,164 16.47% 0 0.00% 372 5.26% 0 0.00% 0 0.00% 15 0.21% 33 0.47% 251 3.55% 0 0.00%
Census Tract 6726.01 9,083 2,247 24.74% 110 1.21% 168 1.85% 0 0.00% 0 0.00% 0 0.00% 0 0.00% 36 0.40% 0 0.00%
Census Tract 6726.02 6,464 1,065 16.48% 24 0.37% 415 6.42% 69 1.07% 0 0.00% 17 0.26% 77 1.19% 145 2.24% 41 0.63%
Census Tract 6727.01 14,542 1,388 9.54% 194 1.33% 695 4.78% 281 1.93% 38 0.26% 45 0.31% 157 1.08% 254 1.75% 177 1.22%
Census Tract 6727.02 6,644 428 6.44% 164 2.47% 124 1.87% 35 0.53% 0 0.00% 31 0.47% 75 1.13% 107 1.61% 125 1.88%
Census Tract 6728 7,343 223 3.04% 84 1.14% 183 2.49% 236 3.21% 20 0.27% 21 0.29% 130 1.77% 0 0.00% 19 0.26%
Census Tract 6729 30,963 1,082 3.49% 247 0.80% 1,128 3.64% 930 3.00% 0 0.00% 0 0.00% 286 0.92% 151 0.49% 357 1.15%
Census Tract 6730.01 7,492 106 1.41% 181 2.42% 0 0.00% 0 0.00% 0 0.00% 0 0.00% 0 0.00% 0 0.00% 9 0.12%

77
Language Spoken at Home by Persons 5+
Spanish or
Spanish Creole Chinese Vietnamese Urdu Other Asian languages Hindi Tagalog
African languages Gujarati
Location
Total Population 5+ La
ngu
age
Po
pu
lati
on
% o
f To
tal
Po
pu
lati
on
Lan
guag
e
Po
pu
lati
on
% o
f To
tal
Po
pu
lati
on
Lan
guag
e
Po
pu
lati
on
% o
f To
tal
Po
pu
lati
on
Lan
guag
e
Po
pu
lati
on
% o
f To
tal
Po
pu
lati
on
Lan
guag
e
Po
pu
lati
on
% o
f To
tal
Po
pu
lati
on
Lan
guag
e
Po
pu
lati
on
% o
f To
tal
Po
pu
lati
on
Lan
guag
e
Po
pu
lati
on
% o
f To
tal
Po
pu
lati
on
Lan
guag
e
Po
pu
lati
on
% o
f To
tal
Po
pu
lati
on
Lan
guag
e
Po
pu
lati
on
% o
f To
tal
Po
pu
lati
on
Fort Bend County 588,234 36,958 6.28% 9,904 1.68% 7,674 1.30% 4,039 0.69% 3,087 0.52% 1,551 0.26% 1,892 0.32% 2,257 0.38% 2,169 0.37%
Census Tract 6730.02 8,275 251 3.03% 327 3.95% 245 2.96% 38 0.46% 44 0.53% 29 0.35% 0 0.00% 16 0.19% 0 0.00%
Census Tract 6730.03 11,975 319 2.66% 419 3.50% 60 0.50% 74 0.62% 26 0.22% 0 0.00% 0 0.00% 0 0.00% 0 0.00%
Census Tract 6731.01 41,941 1,102 2.63% 356 0.85% 340 0.81% 0 0.00% 20 0.05% 70 0.17% 178 0.42% 144 0.34% 58 0.14%
Census Tract 6731.02 16,062 498 3.10% 340 2.12% 25 0.16% 0 0.00% 26 0.16% 0 0.00% 0 0.00% 0 0.00% 0 0.00%
Census Tract 6732 7,401 166 2.24% 13 0.18% 0 0.00% 0 0.00% 44 0.59% 0 0.00% 0 0.00% 0 0.00% 16 0.22%
Census Tract 6733 4,414 150 3.40% 4 0.09% 1 0.02% 0 0.00% 0 0.00% 0 0.00% 0 0.00% 0 0.00% 0 0.00%
Census Tract 6734 15,363 361 2.35% 0 0.00% 106 0.69% 0 0.00% 0 0.00% 0 0.00% 10 0.07% 0 0.00% 0 0.00%
Census Tract 6735 7,933 57 0.72% 20 0.25% 0 0.00% 0 0.00% 0 0.00% 0 0.00% 0 0.00% 0 0.00% 0 0.00%
Census Tract 6736 6,769 137 2.02% 0 0.00% 0 0.00% 0 0.00% 13 0.19% 0 0.00% 0 0.00% 0 0.00% 0 0.00%
Census Tract 6737 2,355 66 2.80% 0 0.00% 0 0.00% 0 0.00% 0 0.00% 0 0.00% 0 0.00% 0 0.00% 0 0.00%
Census Tract 6738 8,720 388 4.45% 23 0.26% 181 2.08% 361 4.14% 82 0.94% 14 0.16% 15 0.17% 0 0.00% 61 0.70%
Census Tract 6739.01 8,905 2 0.02% 314 3.53% 47 0.53% 60 0.67% 93 1.04% 40 0.45% 0 0.00% 0 0.00% 83 0.93%
Census Tract 6739.02 8,357 53 0.63% 405 4.85% 130 1.56% 171 2.05% 215 2.57% 261 3.12% 0 0.00% 0 0.00% 231 2.76%
Census Tract 6740 7,669 191 2.49% 629 8.20% 73 0.95% 54 0.70% 49 0.64% 86 1.12% 0 0.00% 0 0.00% 34 0.44%
Census Tract 6741 6,671 95 1.42% 312 4.68% 0 0.00% 0 0.00% 0 0.00% 0 0.00% 54 0.81% 0 0.00% 41 0.61%
Census Tract 6742 5,350 18 0.34% 390 7.29% 82 1.53% 45 0.84% 0 0.00% 15 0.28% 0 0.00% 0 0.00% 0 0.00%
Census Tract 6743 8,645 175 2.02% 534 6.18% 143 1.65% 10 0.12% 237 2.74% 19 0.22% 0 0.00% 16 0.19% 116 1.34%
Census Tract 6744 11,883 47 0.40% 642 5.40% 14 0.12% 90 0.76% 221 1.86% 257 2.16% 14 0.12% 0 0.00% 51 0.43%
Census Tract 6745.01 7,476 180 2.41% 95 1.27% 20 0.27% 0 0.00% 306 4.09% 109 1.46% 94 1.26% 84 1.12% 0 0.00%
Census Tract 6745.02 17,011 753 4.43% 70 0.41% 25 0.15% 0 0.00% 46 0.27% 0 0.00% 85 0.50% 11 0.06% 0 0.00%
Census Tract 6746.01 3,433 18 0.52% 6 0.17% 0 0.00% 56 1.63% 11 0.32% 0 0.00% 0 0.00% 0 0.00% 0 0.00%
Census Tract 6746.02 7,102 156 2.20% 37 0.52% 25 0.35% 0 0.00% 0 0.00% 0 0.00% 64 0.90% 0 0.00% 9 0.13%
Census Tract 6746.03 5,637 214 3.80% 0 0.00% 0 0.00% 0 0.00% 0 0.00% 0 0.00% 0 0.00% 0 0.00% 22 0.39%

78
Language Spoken at Home by Persons 5+
Spanish or
Spanish Creole Chinese Vietnamese Urdu Other Asian languages Hindi Tagalog
African languages Gujarati
Location
Total Population 5+ La
ngu
age
Po
pu
lati
on
% o
f To
tal
Po
pu
lati
on
Lan
guag
e
Po
pu
lati
on
% o
f To
tal
Po
pu
lati
on
Lan
guag
e
Po
pu
lati
on
% o
f To
tal
Po
pu
lati
on
Lan
guag
e
Po
pu
lati
on
% o
f To
tal
Po
pu
lati
on
Lan
guag
e
Po
pu
lati
on
% o
f To
tal
Po
pu
lati
on
Lan
guag
e
Po
pu
lati
on
% o
f To
tal
Po
pu
lati
on
Lan
guag
e
Po
pu
lati
on
% o
f To
tal
Po
pu
lati
on
Lan
guag
e
Po
pu
lati
on
% o
f To
tal
Po
pu
lati
on
Lan
guag
e
Po
pu
lati
on
% o
f To
tal
Po
pu
lati
on
Fort Bend County 588,234 36,958 6.28% 9,904 1.68% 7,674 1.30% 4,039 0.69% 3,087 0.52% 1,551 0.26% 1,892 0.32% 2,257 0.38% 2,169 0.37%
Census Tract 6746.04 4,633 233 5.03% 52 1.12% 35 0.76% 63 1.36% 108 2.33% 0 0.00% 8 0.17% 0 0.00% 41 0.88%
Census Tract 6747 11,275 426 3.78% 112 0.99% 191 1.69% 352 3.12% 38 0.34% 11 0.10% 70 0.62% 67 0.59% 26 0.23%
Census Tract 6748 4,792 880 18.36% 0 0.00% 0 0.00% 0 0.00% 0 0.00% 0 0.00% 0 0.00% 0 0.00% 0 0.00%
Census Tract 6749 4,967 1,523 30.66% 0 0.00% 0 0.00% 0 0.00% 0 0.00% 0 0.00% 0 0.00% 0 0.00% 0 0.00%
Census Tract 6750 2,946 590 20.03% 0 0.00% 10 0.34% 0 0.00% 0 0.00% 0 0.00% 0 0.00% 0 0.00% 0 0.00%
Census Tract 6751 9,808 678 6.91% 333 3.40% 0 0.00% 0 0.00% 0 0.00% 19 0.19% 0 0.00% 21 0.21% 0 0.00%
Census Tract 6752 5,864 856 14.60% 0 0.00% 0 0.00% 0 0.00% 0 0.00% 0 0.00% 0 0.00% 0 0.00% 0 0.00%
Census Tract 6753 6,310 963 15.26% 0 0.00% 0 0.00% 0 0.00% 0 0.00% 0 0.00% 0 0.00% 0 0.00% 0 0.00%
Census Tract 6754 6,017 774 12.86% 0 0.00% 0 0.00% 0 0.00% 0 0.00% 0 0.00% 0 0.00% 0 0.00% 0 0.00%
Census Tract 6755 12,045 594 4.93% 0 0.00% 148 1.23% 0 0.00% 0 0.00% 0 0.00% 34 0.28% 0 0.00% 0 0.00%
Census Tract 6756 5,595 805 14.39% 0 0.00% 0 0.00% 0 0.00% 0 0.00% 0 0.00% 0 0.00% 0 0.00% 0 0.00%
Census Tract 6757 5,965 299 5.01% 0 0.00% 0 0.00% 0 0.00% 0 0.00% 0 0.00% 0 0.00% 0 0.00% 0 0.00%
Census Tract 6758 3,155 262 8.30% 0 0.00% 0 0.00% 0 0.00% 0 0.00% 0 0.00% 0 0.00% 0 0.00% 0 0.00%

79
This Page Intentionally Left Blank

80
APPENDIX C – PRESENTATIONS AND OUTREACH
Date of
Presentation Attendance
Number Organization Name Location
First Name
Last Name Contact Number Notes Employee
06-Mar-12 60 Senior Group with St. Theresa Church
St Theresa Church
Kathy Moller Marketing our services to the general public of FBC ; Small presentation and gave out promotional items
Tennille
03-Apr-12 30 FBC Transportation - Grand Opening/Ribbon Cutting
HWY 36 - Park and Ride lot
Paulette Shelton 281-243-6701 Took marketing material and promotional items to our grand opening & ribbon cutting
Melanie & Donna
04-Apr-12 50 MD Anderson Transportation Info Fair
MD Anderson at TMC 7007 Bertner Ave
Faredda Momin 713-792-6101 Transportation Fair - Handed out promotional items and information packets - Also there to sell ticket books.
Melanie, Donna & Tennille
05-Apr-12 35 Silver Living Senior Care
Sugar Land Senior Center off of Matlage Way
Susan Marbin 404-317-7527 Marketing our services to a group of FBC Older adults
Melanie & Tennille
11-Apr-12 20 MD Anderson Transportation Info Fair
MD Anderson at TMC 7007 Bertner Ave
Faredda Momin 713-792-6101 Transportation Fair - Handed out promotional items and information packets - Also there to sell ticket books.
Melanie & Donna
14-Apr-12 10 Meadows Place Senior Living Health Fair
Meadows Place Senior Living -12221 S.
Lyric Daniel 281-240-1932 Health Fair - Handed out promotional items
Melanie & Donna

81
Date of Presentation
Attendance Number
Organization Name Location First
Name Last Name Contact Number Notes Employee
Kirkwood and information
18-Apr-12 20 MD Anderson Transportation Info Fair
MD Anderson at TMC 7007 Bertner Ave
Faredda Momin 713-792-6101 Transportation Fair - Handed out promotional items and information packets
First Transit Reps
21-Apr-12 75+ Needville Youth Fair
KC Hall - Needville, TX 13631 Texas 36
James Wenzel 832-473-0504 Needville Youth Fair - Handed out promotional items and information. Staged a commuter bus at event.
Melanie & Oscar
25-Apr-12 20 MD Anderson Transportation Info Fair
MD Anderson at TMC 7007 Bertner Ave
Faredda Momin 713-792-6101 Transportation Fair - Handed out promotional items and information packets
First Transit Reps
09-May-12 100+ Fort Bend Older adults Older adults' Senior Prom
Bud O'Shieles Community Center 1330 Band Road Rosenberg, TX 77471
Dana Thompson 281-633-7058 Meet and greet older adults at the Older adults' Senior Prom
Melanie
10-May-12 10 Fort Bend Center for Independent Living
FBCIL 12946 Dairy Ashford Rd. Ste.110 Sugar Land, TX 77478
Mary Francis
Wasson 281-980-2219 Presentation to a group of consumers w/ disabilities regarding our services and client responsibilities.
Melanie
11-May-12 100+ Meyer Elementary "Careers on Wheels"
Meyer Elementary 1930 J. Meyer Rd. Rosenberg, TX 77469
Latonya Hamilton 832-223-2005 Presentation to groups of elementary students regarding public transportation
Melanie

82
Date of Presentation
Attendance Number
Organization Name Location First
Name Last Name Contact Number Notes Employee
service. Staged bus at event for children to explore.
22-May-12 100+ Fort Bend Older adults Hurricane Preparedness 2012 Conference
Bud O'Shieles Community Center 1330 Band Road Rosenberg, TX 77471
Dana Thompson 281-633-7058 Presentation to a group of older adults regarding transportation during emergency operations. Handed out information and promotional items.
Melanie & James
08-Jun-12 60 FBC Office of Emergency Management Emergency Preparedness Presentation
First United Methodist Church 431 Eldridge Rd. Sugar Land, TX 77478
Kathy Renfro 281-238-3401 OEM Presentation to various social service agencies regarding emergency preparedness. Handed out transit info.
Melanie
12-Jul-12 3 Fort Bend Center for Independent Living
FBCIL 12946 Dairy Ashford Rd. Ste.110 Sugar Land, TX 77478
Mary Francis
Wasson 281-980-2219 Presentation to a group of consumers w/ disabilities regarding our services and client responsibilities.
Melanie
13-Jul-12 75+ Fort Bend CONNECT Meeting HGAC "Transportation Updates in Fort Bend
First United Methodist Church 431 Eldridge Rd. Sugar Land, TX 77478
Valerie Roberson 281-207-2304 "Transportation Updates in Fort Bend" presentation by HGAC to various human service organizations.
Melanie

83
Date of Presentation
Attendance Number
Organization Name Location First
Name Last Name Contact Number Notes Employee
County" Presentation
Participated in panel discussion and answered service questions. Handed out promotional items and information.
25-Jul-12 15 Fort Bend Center for Independent Living
FBCIL 12946 Dairy Ashford Rd. Ste.110 Sugar Land, TX 77478
Mary Francis
Wasson 281-980-2219 22nd ADA Anniversary Observance Celebration. Discussion & refreshments.
Melanie & Paulette
15-Aug-12 6 Fort Bend Center for Independent Living
FBCIL 12946 Dairy Ashford Rd. Ste.110 Sugar Land, TX 77478
Mary Francis
Wasson 281-980-2219 Presentation to a group of consumers w/ disabilities regarding our services and client responsibilities.
Melanie
16-Aug-12 375 Fort Bend County Employee Fair
FBC Rosenberg Annex 4520 Reading Road Rosenberg, TX 77471
Lynette Montgomery 281-238-3562 Employee Fair - Handed out promotional items and information
Melanie
23-Aug-12 200+ Commute Solutions Appreciation Event
AMC Theater Park & Ride 3301 Town Center Blvd. South Sugar Land, TX 77479
Nicolas Williams 713-993-4567 Commuter Appreciation Day - Handed out goodie bags and pastries provided by Commuter Solutions to transit commuters
Melanie & Donna
06-Sep-12 50 Fort Bend Older adults Meals-On-Wheels
Rosenberg Senior Center 1330 Band Rd. Rosenberg, TX
Dana Thompson 281-633-7058 Brief presentation to a group of older adults regarding our
Melanie

84
Date of Presentation
Attendance Number
Organization Name Location First
Name Last Name Contact Number Notes Employee
77471 services. Addressed comments and concerns.
11-Sep-12 2 Rosenberg Dialysis Center
Rosenberg Dialysis 4519 Reading Rd. Suite 18 Rosenberg, TX 77471
Connie Karger 281-341-7425 Brief presentation regarding our services. Addressed comments and concerns.
Melanie
12-Sep-12 12 Missouri City Dialysis Center
Missouri City Dialysis 1673 Cartwright Rd. Missouri City, TX 77459
Jenny Kincaid 281-437-9700 Brief presentation regarding our services. Addressed comments and concerns.
Melanie
13-Sep-12 200+ "My Solution Is…." Transportation Fair
Transportation Fair 3 Greenway Plaza Houston, TX 77046
Ch'rese Jackson 713-993-2487 Handed out promotional items and information to Greenway Plaza commuters.
Melanie
17-Sep-12 20 Simonton/Fulshear Fort Bend Older adults Meals-On-Wheels
Irene Stern Community Center 6920 Katy-Fulshear Rd. Fulshear, TX 77441
Dana Thompson 281-633-7058 Brief presentation to a group of older adults regarding our services. Addressed comments and concerns.
Melanie
18-Sep-12 50 Tri-City Fort Bend Older adults Meals-On-Wheels
Stafford Community Center 3110 Fifth St. Stafford, TX 77477
Dana Thompson 281-633-7058 Brief presentation to a group of older adults regarding our services. Addressed comments and concerns.
Melanie

85
Date of Presentation
Attendance Number
Organization Name Location First
Name Last Name Contact Number Notes Employee
19-Sep-12 15 Fresno Fort Bend Older adults Meals-On-Wheels
Mustang Community Center 4521 FM 521 Fresno, TX 77545
Dana Thompson 281-633-7058 Brief presentation to a group of older adults regarding our services. Addressed comments and concerns.
Melanie
20-Sep-12 5 Kendleton Fort Bend Older adults Meals-On-Wheels
Kendleton Senior Center 109 Guess Ave. Kendleton, TX 77451
Dana Thompson 281-633-7058 Brief presentation to a group of older adults regarding our services. Addressed comments and concerns.
Melanie
21-Sep-12 30 Hometowne Fort Bend Older adults Meals-On-Wheels
Hometowne Senior Center 10888 Huntington Estates Houston, TX 77099
Dana Thompson 281-633-7058 Brief presentation to a group of older adults regarding our services. Addressed comments and concerns.
Melanie
04-Oct-12 5 Sugar Land Senior Center
T.E. Harman Recreation Center 226 Matlage Way Sugar land, TX 77478
Samantha
Foster 281-275-2839 Brief presentation to a group of older adults regarding our services. Addressed comments and concerns.
Melanie
12-Oct-12 50+ Fort Bend CONNECT Meeting "Counseling Services for Low Income and
First United Methodist Church 431 Eldridge Rd. Sugar Land, TX 77478
Valerie Roberson 281-207-2304 Handed out promotional items and information to various social service agencies.
Melanie

86
Date of Presentation
Attendance Number
Organization Name Location First
Name Last Name Contact Number Notes Employee
Uninsured" FBC Residents Presentation
23-Oct-12 1 Colorado Valley Transit
Colorado Valley Transit 210 N. Cloud St. Wharton, TX 77488
Vastene Olier 979-732-6281 Met with CVT Director in order to discuss ideas to connect our services effectively and how to best serve the transportation needs of the public.
Melanie
14-Nov-12 150+ Fort Bend Older adults Thanksgiving Luncheon
Bud O'Shieles Community Center 1330 Band Road Rosenberg, TX 77471
Dana Thompson 281-633-7058 Meet and greet older adults at the Older adults' Thanksgiving Luncheon. Helped pass out food and drinks during lunch.
Melanie
15-Nov-12 26 TEXANA Behavioral Healthcare Clinic-ROS Staff Meeting
TEXANA Behavioral Healthcare Clinic-ROS 4910 Airport Ave. Rosenberg, TX 77471
Linda Bracey 281-239-1307 Brief presentation to Texana staff regarding our services. Addressed comments and concerns.
Melanie
04-Dec-12 5 TEXANA Behavioral Healthcare Clinic-SGL Staff Meeting
TEXANA Behavioral Healthcare Clinic-SGL 2535 Cordes Dr. Sugar Land, TX 77479
Rosemary
Nicolas 281-276-4400 Brief presentation to Texana staff regarding our services. Addressed comments and concerns.
Melanie
05-Dec-12 2 Katy Area Ride Service
KARS 22503 Katy Freeway, Suite 8
Pat Hender 281-994-4238 Meeting with administrator of KARS to discuss
Melanie

87
Date of Presentation
Attendance Number
Organization Name Location First
Name Last Name Contact Number Notes Employee
Katy, TX 77450 their services and how to best to serve the public.
06-Dec-12 10 The ARC of Fort Bend Support Group Meeting Transportation Solutions to VAST Program
HEB-Sugar Land 530 SH 6 Sugar Land, TX 77479
Cheryl Sewell 281-494-5924 Meeting regarding transportation solutions to/from HCC's VAST program located in downtown Houston for students with disabilities.
Melanie, Hoss, & Paulette
11-Dec-12 8 Access Health Center (formerly FB Family Health Center)
Access Health Center 400 Austin St. Richmond, TX 77469
Sylvia Teeple 281-342-4530 Brief presentation to healthcare staff regarding our services. Addressed comments and concerns.
Melanie
17-Dec-12 3 First Colony Dialysis
First Colony Dialysis 1107 Soldiers Field Sugar Land, TX 77479
John Hougham 713-772-5228 Brief presentation to healthcare staff regarding our services and client responsibilities. Addressed comments and concerns.
Melanie
21-Dec-12 20 Fort Bend Center for Independent Living
FBCIL 12946 Dairy Ashford Rd. Ste.110 Sugar Land, TX 77478
Mary Knotts 281-980-2219 Presentation to low vision group regarding our services and client responsibilities. Addressed comments and concerns.
Melanie

88
Date of Presentation
Attendance Number
Organization Name Location First
Name Last Name Contact Number Notes Employee
11-Jan-13 75+ Fort Bend CONNECT Meeting "Neighborhood Tax Centers" for FBC Residents Presentation
First United Methodist Church 431 Eldridge Rd. Sugar Land, TX 77478
Katie Thomas 281-207-2300 Handed out promotional items and information to various social service agencies.
Melanie
07-Feb-13 2 Mamie George/Catholic Charities
Mamie George Center 1111 Collins Rd. Richmond, TX 77469
Gladys Brumfield 281-202-6224 Met with senior services manager to discuss doing a presentation to center clients regarding our services.
Melanie
08-Feb-13 75+ Fort Bend CONNECT Meeting "Gang Tatoos"
First United Methodist Church 431 Eldridge Rd. Sugar Land, TX 77478
Katie Thomas 281-207-2300 Handed out promotional items and information to various social service agencies.
Melanie
20-Feb-13 4 Fort Bend Center for Independent Living
FBCIL 12946 Dairy Ashford Rd. Ste.110 Sugar Land, TX 77478
Mary Francis
Wasson 281-980-2219 Presentation to a group of consumers w/ disabilities regarding our services and client responsibilities.
Melanie
04-Mar-13 8 Simonton/Fulshear Fort Bend Older adults Meals-On-Wheels
Irene Stern Community Center 6920 Katy-Fulshear Rd. Fulshear, TX 77441
Cathy Tuttle 281-633-7058 Brief presentation to a group of older adults regarding our services. Addressed comments and concerns.
Melanie
06-Mar-13 1 Tri-City Fort Bend Older adults Meals-On-
Stafford Community Center 3110
Cathy Tuttle 281-633-7058 Met with site director regarding our services.
Melanie & Hoss

89
Date of Presentation
Attendance Number
Organization Name Location First
Name Last Name Contact Number Notes Employee
Wheels Fifth St. Stafford, TX 77477
Addressed comments and concerns.
07-Mar-13 15 Hometowne Fort Bend Older adults Meals-On-Wheels
Hometowne Senior Center 10888 Huntington Estates Houston, TX 77099
Cathy Tuttle 281-633-7058 Brief presentation to a group of older adults regarding our services. Addressed comments and concerns.
Melanie
8-Mar-13 75+ Fort Bend CONNECT Meeting "Hunger in Fort Bend County"
Mamie George Center 1111 Collins Rd. Richmond, TX 77469
Katie Thomas 281-207-2300 Handed out promotional items and information to various social service agencies.
Melanie
20-Mar-13 6 Fort Bend Center for Independent Living
FBCIL 12946 Dairy Ashford Rd. Ste.110 Sugar Land, TX 77478
Mary Wasson 281-980-2219 Presentation to a group of consumers w/ disabilities regarding our services and client responsibilities.
Melanie
28-Mar-13 50+ Rosenberg Fort Bend Older adults Meals-On-Wheels
Rosenberg Senior Center 1330 Band Rd. Rosenberg, TX 77471
Cathy Tuttle 281-633-7058 Brief presentation to a group of older adults regarding our services. Addressed comments and concerns.
Melanie
12-Apr-13 75+ Fort Bend CONNECT Meeting "Health & Nutrition"
First United Methodist Church 431 Eldridge Rd. Sugar Land, TX 77478
Katie Thomas 281-207-2300 Handed out promotional items and information to various social service agencies.
Melanie
16-Apr-13 20 Dulles High School Dulles High Hyacinth Pickersgill 281-634-5641 Brief presentation Melanie

90
Date of Presentation
Attendance Number
Organization Name Location First
Name Last Name Contact Number Notes Employee
Adult Transition Program
School 550 Dulles Avenue Sugar Land, TX 77478
to a group of special education students regarding our services. Addressed comments and concerns.
17-Apr-13 10 Fort Bend Center for Independent Living
FBCIL 12946 Dairy Ashford Rd. Ste.110 Sugar Land, TX 77478
John Bickham 281-980-2219 Presentation to a group of consumers w/ disabilities regarding our services and client responsibilities.
Melanie
23-Apr-13 15 Fresno Fort Bend Older adults Meals-On-Wheels
Mustang Community Center 4521 FM 521 Fresno, TX 77545
Cathy Tuttle 281-633-7058 Brief presentation to a group of older adults regarding our services. Addressed comments and concerns.
Melanie
27-Apr-13 100+ Veterans' Benefits Seminar
FBC Annex 4520 Reading Rd. Rosenberg, TX 77471
Helen Washington 281-238-3587 Handed out promotional items and information to Veterans and their families. Addressed comments and concerns.
Melanie
1-May-13 5 Kendleton Fort Bend Older adults Meals-On-Wheels
Kendleton Senior Center 109 Guess Ave. Kendleton, TX 77451
Cathy Tuttle 281-633-7058 Brief presentation to a group of older adults regarding our services. Addressed
Melanie

91
Date of Presentation
Attendance Number
Organization Name Location First
Name Last Name Contact Number Notes Employee
comments and concerns.
10-May-13 100+ Meyer Elementary "Careers on Wheels"
Meyer Elementary 1930 J. Meyer Rd. Rosenberg, TX 77469
Latonya Hamilton 832-223-2005 Presentation to groups of elementary students regarding public transportation service. Staged bus at event for children to explore.
Melanie
14-May-13 15 FBC Indigent Health Care
FBC Annex 4520 Reading Rd. Rosenberg, TX 77471
Karl Lavine 281-238-3234 Brief presentation to a staff regarding our services. Addressed comments and concerns.
Melanie
15-May-13 5 Fort Bend Center for Independent Living
FBCIL 12946 Dairy Ashford Rd. Ste.110 Sugar Land, TX 77478
John Bickham 281-980-2219 Presentation to a group of consumers w/ disabilities regarding our services and client responsibilities.
Melanie
17-May-13 100+ Fort Bend County Emergency Preparedness Workshop
Rosenberg Civic Center 3825 SH 36 Rosenberg, TX 77471
Kathy Renfrow 281-238-3401 Handed out promotional items and information. Addressed comments and concerns.
Melanie
23-May-13 75+ AARP Healthcare & Senior Resource Fair
Rosenberg Civic Center 3825 SH 36 Rosenberg, TX 77471
Nancy Talasek 281-342-8575 Handed out promotional items and information. Addressed comments and
Melanie

92
Date of Presentation
Attendance Number
Organization Name Location First
Name Last Name Contact Number Notes Employee
concerns.
13-Jun-13 4 Fort Bend Center for Independent Living
FBCIL 12946 Dairy Ashford Rd. Ste.110 Sugar Land, TX 77478
John Bickham 281-980-2219 Presentation to a group of consumers w/ disabilities regarding our services and client responsibilities.
Melanie
14-Jun-13 35 Fort Bend CONNECT Meeting
First United Methodist Church 431 Eldridge Rd. Sugar Land, TX 77478
Katie Thomas 281-207-2300 Handed out promotional items and information to various social service agencies.
Melanie
11-Jul-13 5 Fort Bend Center for Independent Living
FBCIL 12946 Dairy Ashford Rd. Ste.110 Sugar Land, TX 77478
John Bickham 281-980-2219 Presentation to a group of consumers w/ disabilities regarding our services and client responsibilities.
Melanie
12-Jul-13 50 Fort Bend CONNECT Meeting
FBC Annex 4520 Reading Rd. Rosenberg, TX 77471
Ruby Canales 281-207-2304 Handed out promotional items and information to various social service agencies.
Melanie
31-Jul-13 100+ Fort Bend Older adults Older adults' Senior Prom
Bud O'Shieles Community Center 1330 Band Road Rosenberg, TX 77471
Robin Steinmann 281-633-7058 Meet and greet older adults at the Older adults' Senior Prom
Melanie
3-Aug-13 1600 Commissioner Precinct 2 Health Fair
Commissioner Pct. 2 Office 303 Texas Pkwy. Ste. 213 Missouri City, TX
Brenda Patton 281-403-8001 Handed out promotional items and information to fair participants.
Donna & Twila

93
Date of Presentation
Attendance Number
Organization Name Location First
Name Last Name Contact Number Notes Employee
77489
8-Aug-13 7 Fort Bend Center for Independent Living
FBCIL 12946 Dairy Ashford Rd. Ste.110 Sugar Land, TX 77478
John Bickham 281-980-2219 Presentation to a group of consumers w/ disabilities regarding our services and client responsibilities.
Melanie
15-Aug-13 456 Fort Bend County Employee Fair
FBC Annex 4520 Reading Rd. Rosenberg, TX 77471
Beatrice Galan 281-238-3336 Employee Fair - Handed out promotional items and information
Melanie
16-Aug-13 3 Davita Greatwood Dialysis
Davita Dialysis-Greatwood 20333 Southwest Frwy. Sugar Land, TX 77479
Zaleka Henderson 281-545-1470 Brief presentation to a staff regarding our services. Addressed comments and concerns.
Melanie
05-Sep-13 40 Rosenberg Fort Bend Older adults Meals-On-Wheels
Bud O'Sheiles Center 1330 Band Rd. Rosenberg, TX 77471
Monica Welch 281-633-7058 Brief presentation to a group of older adults regarding our services. Addressed comments and concerns.
Melanie
11-Sep-13 10 Simonton/Fulshear Fort Bend Older adults Meals-On-Wheels
Irene Stern Community Center 6920 Katy-Fulshear Rd. Fulshear, TX 77441
Monica Welch 281-633-7058 Brief presentation to a group of older adults regarding our services. Addressed comments and concerns.
Melanie
12-Sep-13 200+ "My Solution Is…." Transportation Ch'rese Jackson 713-993-2487 Handed out Melanie &

94
Date of Presentation
Attendance Number
Organization Name Location First
Name Last Name Contact Number Notes Employee
Transportation Fair Fair 3 Greenway Plaza Houston, TX 77046
promotional items and information to Greenway Plaza commuters.
Cindy
13-Sep-13 75+ Fort Bend CONNECT Meeting "Senior Services in Fort Bend County"
First United Methodist Church 431 Eldridge Rd. Sugar Land, TX 77478
Ruby Canales 281-207-2304 Handed out promotional items and information to various social service agencies.
Melanie
17-Sep-13 60 Tri-City Fort Bend Older adults Meals-On-Wheels
Stafford Community Center 3110 Fifth St. Stafford, TX 77477
Monica Welch 281-633-7058 Met with site director regarding our services. Addressed comments and concerns.
Melanie
18-Sep-13 4 Fort Bend Center for Independent Living
FBCIL 12946 Dairy Ashford Rd. Ste.110 Sugar Land, TX 77478
John Bickham 281-980-2219 Presentation to a group of consumers w/ disabilities regarding our services and client responsibilities.
Melanie
19-Sep-13 12 Fresno Fort Bend Older adults Meals-On-Wheels
Mustang Community Center 4521 FM 521 Fresno, TX 77545
Monica Welch 281-633-7058 Brief presentation to a group of older adults regarding our services. Addressed comments and concerns.
Melanie
23-Sep-13 125+ Fort Bend County Fair Older adults' Fair Day
Fort Bend County Fairgrounds 4110 SH 36 Rosenberg, TX 77489
Monica Welch 281-633-7058 Assisted in making certain older adults boarded appropriate buses as efficiently as
Melanie

95
Date of Presentation
Attendance Number
Organization Name Location First
Name Last Name Contact Number Notes Employee
possible.
25-Sep-13 7 Kendleton Fort Bend Older adults Meals-On-Wheels
Church of God 619 FM 2919 Kendleton, TX 77451
Monica Welch 281-633-7058 Brief presentation to a group of older adults regarding our services. Addressed comments and concerns.
Melanie
26-Sep-13 12 Hometowne Fort Bend Older adults Meals-On-Wheels
Hometowne Senior Center 10888 Huntington Estates Houston, TX 77099
Monica Welch 281-633-7058 Brief presentation to a group of older adults regarding our services. Addressed comments and concerns.
Melanie
10-Oct-13 125+ Fort Bend Older adults Meals-On-Wheels Older adults' Health Fair
Bud O'Shieles Community Center 1330 Band Road Rosenberg, TX 77471
Monica Welch 281-633-7058 Assisted in making certain older adults boarded appropriate buses as efficiently as possible.
Melanie
11-Oct-13 75+ Fort Bend CONNECT Meeting
First United Methodist Church 431 Eldridge Rd. Sugar Land, TX 77478
Ruby Canales 281-207-2304 Handed out promotional items and information to various social service agencies.
Melanie
19-Oct-13 50 Texas Children's Health Plan "Hot Rods & Cool Rides" Health & Exercise Expo
Seabourne Creek Nature Park 3831 SH 36 Rosenberg, TX 77471
Veronica Reyes 832-828-1182 Staged a commuter bus at the event. Handed out promotional items and information to families attending the event.
Melanie
13-Nov-13 150+ Fort Bend County Bud O'Sheiles Monica Welch 281-633-7058 Assisted in Melanie &

96
Date of Presentation
Attendance Number
Organization Name Location First
Name Last Name Contact Number Notes Employee
Meals on Wheels Thanksgiving Celebration
Center 1330 Band Rd. Rosenberg, TX 77471
making certain all the older adults got on correct buses after field trip as efficiently as possible. Helped serve older adults lunch.
Tennille
19-Nov-13 1 Fort Bend Dialysis Center
Fresenius Dialysis - Fort Bend 3819 Cartwright Rd. Missouri City, TX 77459
Shalondra
Diggs 281-403-0749 Briefly met with staff social worker regarding our services. Addressed comments and concerns.
Melanie
6-Dec-13 450 Sartartia Middle School Career Day
Sartartia Middle School 8125 Homeward Way Sugar Land, TX 77479
Tina Remmers 281-634-6310 Presentation to groups of middle school students regarding careers in public transportation and our services.
Melanie
10-Dec-13 150+ Fort Bend County Meals on Wheels Holiday Celebration
Bud O'Sheiles Center 1330 Band Rd. Rosenberg, TX 77471
Monica Welch 281-633-7058 Assisted in making certain all the older adults got on correct buses after field trip as efficiently as possible. Helped serve older adults lunch.
Melanie
10-Jan-14 75+ Fort Bend CONNECT Meeting "United Way
Pinnacle Senior Center 5525 Hobby Rd. Houston, TX
Ruby Canales 281-207-2304 Handed out promotional items and information to various social
Melanie

97
Date of Presentation
Attendance Number
Organization Name Location First
Name Last Name Contact Number Notes Employee
THRIVE" 77053 service agencies.
12-Feb-14 40 Rosenberg Fort Bend Older adults Meals-On-Wheels
Rosenberg Senior Center 1330 Band Rd. Rosenberg, TX 77471
Monica Welch 281-633-7058 Brief presentation to a group of older adults regarding our services. Addressed comments and concerns.
Melanie
14-Feb-14 75+ Fort Bend CONNECT Meeting "Legal Services in Fort Bend"
Pinnacle Senior Center 5525 Hobby Rd. Houston, TX 77053
Ruby Canales 281-207-2304 Handed out promotional items and information to various social service agencies.
Melanie
19-Feb-14 60 Tri-City Fort Bend Older adults Meals-On-Wheels
Stafford Community Center 3110 Fifth St. Stafford, TX 77477
Monica Welch 281-633-7058 Met with site director regarding our services. Addressed comments and concerns.
Melanie
20-Feb-14 30 TEXANA Behavioral Healthcare Clinic-ROS Staff Meeting
TEXANA Behavioral Healthcare Clinic-ROS 4910 Airport Ave. Rosenberg, TX 77471
Tony Vettraino 281-239-1324 Brief presentation to Texana staff regarding our services. Addressed comments and concerns.
Melanie
20-Feb-14 150+ Fort Bend Older adults Meals-On-Wheels Older adults' Health Fair
Rosenberg Civic Center 3825 SH 36 Rosenberg, TX 77471
Monica Welch 281-633-7058 Assisted in making certain all the older adults got on correct buses after field trip as efficiently as possible.
Melanie
26-Feb-14 15 Simonton/Fulshear Fort Bend Older adults Meals-On-Wheels
Irene Stern Community Center 6920 Katy-Fulshear
Monica Welch 281-633-7058 Brief presentation to a group of older adults regarding our
Melanie

98
Date of Presentation
Attendance Number
Organization Name Location First
Name Last Name Contact Number Notes Employee
Rd. Fulshear, TX 77441
services. Addressed comments and concerns.
1-Mar-14 100+ The ARC of Fort Bend County 2014 Special Needs Resource Fair
Dulles High School 550 Dulles Avenue Sugar Land, TX 77478
Cheryl Sewell 281-494-5924 Handed out promotional items and information. Answered questions regarding our services.
Melanie
19-Mar-14 10 Fresno Fort Bend Older adults Meals-On-Wheels
Mustang Community Center 4521 FM 521 Fresno, TX 77545
Monica Welch 281-633-7058 Brief presentation to a group of older adults regarding our services. Addressed comments and concerns.
Melanie
25-Mar-14 87 United Way Fort Bend Benefits Access Fair
Fort Bend County Service Center 10435 Greenbough Dr. Ste. 200 Stafford, TX 77477
Ruby Canales 281-207-2304 Handed out promotional items and information. Answered questions regarding our services.
Tennille
25-Mar-14 7 Fort Bend Center for Independent Living
FBCIL 12946 Dairy Ashford Rd. Ste.110 Sugar Land, TX 77478
Mary Francis
Wasson 281-980-2219 Presentation to a group of consumers w/ disabilities regarding our services and client responsibilities.
Melanie
16-Apr-14 6 Fort Bend Center for Independent Living
FBCIL 12946 Dairy Ashford Rd. Ste.110 Sugar
Mary Francis
Wasson 281-980-2219 Presentation to a group of consumers w/ disabilities
Melanie

99
Date of Presentation
Attendance Number
Organization Name Location First
Name Last Name Contact Number Notes Employee
Land, TX 77478 regarding our services and client responsibilities.
17-Apr-14 150+ Fort Bend County Meals on Wheels Spring Fling Celebration
Bud O'Sheiles Center 1330 Band Rd. Rosenberg, TX 77471
Monica Welch 281-633-7058 Assisted in making certain all the older adults got on correct buses after field trip as efficiently as possible.
Treva Burroughs w/ First Transit
9-May-14 100+ Meyer Elementary "Careers on Wheels"
Meyer Elementary 1930 J. Meyer Rd. Rosenberg, TX 77469
Latonya Hamilton 832-223-2005 Presentation to groups of elementary students regarding public transportation service. Staged bus at event for children to explore.
Melanie
14-May-14 150+ Fort Bend County Meals on Wheels Older adults' Senior Prom
Bud O'Sheiles Center 1330 Band Rd. Rosenberg, TX 77471
Monica Welch 281-633-7058 Assisted in making certain all the older adults got on correct buses after field trip as efficiently as possible.
Treva Burroughs w/ First Transit
17-May-14 20 Veterans' Benefits Seminar
FBC Annex 307 Texas Pkwy. Missouri City, TX 77489
Dwight Marshall 281-238-3585 Handed out promotional items and information to Veterans and their families. Addressed comments and concerns.
Donna
21-May-14 7 Fort Bend Center for Independent
FBCIL 12946 Dairy
Mary Francis
Wasson 281-980-2219 Presentation to a group of
Melanie

10
0
Date of Presentation
Attendance Number
Organization Name Location First
Name Last Name Contact Number Notes Employee
Living Ashford Rd. Ste.110 Sugar Land, TX 77478
consumers w/ disabilities regarding our services and client responsibilities.
22-May-14 150+ Fort Bend County Meals on Wheels NRG Picnic
Rosenberg KC Hall 1007 Kay Cee Drive Rosenberg, TX 77471
Monica Welch 281-633-7058 Assisted in making certain all the older adults got on correct buses after field trip as efficiently as possible.
April w/ First Transit
30-May-14 100+ Fort Bend County Emergency Preparedness Workshop
Rosenberg Civic & Rec.Center 3825 Highway 36 South Rosenberg, TX 77471
Kathy Renfrow 281-238-3401 Handed out promotional items and information. Addressed comments & concerns. Directed the public how to register for emergency evacuation.
Melanie
18-Jun-14 5 Fort Bend Center for Independent Living
FBCIL 12946 Dairy Ashford Rd. Ste.110 Sugar Land, TX 77478
Mary Francis
Wasson 281-980-2219 Presentation to a group of consumers w/ disabilities regarding our services and client responsibilities.
Melanie
26-Jun-14 62 United Way Fort Bend Benefits Access Fair
Fort Bend County Service Center 10435 Greenbough Dr. Ste. 200 Stafford, TX
Ruby Canales 281-207-2304 Handed out promotional items and information. Answered questions regarding our
Melanie

10
1
Date of Presentation
Attendance Number
Organization Name Location First
Name Last Name Contact Number Notes Employee
77477 services.
11-Jul-14 75+ Fort Bend CONNECT Meeting "Emergency Preparedness"
Mamie George Center 1111 Collins Rd. Richmond, TX 77469
Ruby Canales 281-207-2300 Handed out promotional items and information to various social service agencies.
Melanie
16-Jul-14 7 Fort Bend Center for Independent Living
FBCIL 12946 Dairy Ashford Rd. Ste.110 Sugar Land, TX 77478
Mary Francis
Wasson 281-980-2219 Presentation to a group of consumers w/ disabilities regarding our services and client responsibilities.
Melanie
22-Jul-14 8 Access Health Transportation Meeting
Access Health 10435 Greenbough Dr. Ste. 300 Stafford, TX 77477
Debra Ann
Zagala 281-969-1837 Brief presentation to a group of clinic staff regarding our services. A rep from MTM & Red Cross were also participating. Addressed comments and concerns.
Melanie
24-Jul-14 450+ Fort Bend County Employee Fair
FBC Rosenberg Annex 4520 Reading Road Rosenberg, TX 77471
Beatrice Galan 281-238-3336 Employee Fair - Handed out promotional items and information
Melanie
29-Jul-14 150+ Rosenberg Business Resource EXPO
Rosenberg Civic & Rec.Center 3825 Highway 36 South Rosenberg, TX 77471
Shannan Stavinoha 281-342-5464 Handed out promotional items and information. Answered questions regarding our services.
Melanie
7-Aug-14 10 Fresno City of Arcola Monica Welch 281-633-7058 Brief presentation Melanie

10
2
Date of Presentation
Attendance Number
Organization Name Location First
Name Last Name Contact Number Notes Employee
Fort Bend Older adults Meals-On-Wheels
Office 13222 SH 6 Arcola, TX 77583
to a group of older adults regarding our services. Addressed comments and concerns.
8-Aug-14 66 Fort Bend CONNECT Meeting "Transportation Alternatives"
Mamie George Center 1111 Collins Rd. Richmond, TX 77469
Ruby Canales 281-207-2300 Transportation Alternatives presentation to various human service organizations. Participated in presentation as a guest speaker using power point and answered service questions. Handed out promotional items and information.
Melanie
13-Aug-14 30 Rosenberg Fort Bend Older adults Meals-On-Wheels
Bud O'Sheiles Center 1330 Band Rd. Rosenberg, TX 77471
Monica Welch 281-633-7058 Brief presentation to a group of older adults regarding our services. Addressed comments and concerns.
Melanie
14-Aug-14 200+ My Solution Is…. Transportation Fair
Transportation Fair 3 Greenway Plaza Houston, TX 77046
Ch'rese Jackson 713-993-2487 Handed out promotional items and information to Greenway Plaza commuters.
Tennille & Cindy
15-Aug-14 40 Richmond State Supported Living
RSSLC 2100 Preston St.
Destiny Johnson 281-344-4257 Brief presentation to staff members
Melanie

10
3
Date of Presentation
Attendance Number
Organization Name Location First
Name Last Name Contact Number Notes Employee
Center Richmond, TX 77469
& volunteers regarding our services. Addressed comments and concerns.
19-Aug-14 3 Kendleton Fort Bend Older adults Meals-On-Wheels
Kendleton Senior Center 109 Guess Ave. Kendleton, TX 77451
Monica Welch 281-633-7058 Addressed comments and concerns.
Melanie
27-Aug-14 50 Tri-City Fort Bend Older adults Meals-On-Wheels
Stafford Community Center 3110 Fifth St. Stafford, TX 77477
Monica Welch 281-633-7058 Brief presentation to a group of older adults regarding our services. Addressed comments and concerns.
Melanie
11-Sep-14 30 Hometowne Fort Bend Older adults Meals-On-Wheels
Hometowne Senior Center 10888 Huntington Estates Houston, TX 77099
Monica Welch 281-633-7058 Brief presentation to a group of older adults regarding our services. Addressed comments and concerns.
Melanie
12-Sep-14 40+ Fort Bend CONNECT Meeting "Sickle Cell Anemia"
Mamie George Center 1111 Collins Rd. Richmond, TX 77469
Ruby Canales 281-207-2300 Handed out promotional items and information to various social service agencies.
Melanie
22-Sep-14 125+ Fort Bend County Fair SRS Fair Day
Fort Bend County Fairgrounds 4110 SH 36 Rosenberg, TX 77489
Monica Welch 281-633-7058 Assisted in making certain all the older adults got on correct buses after field trip as efficiently
Melanie

10
4
Date of Presentation
Attendance Number
Organization Name Location First
Name Last Name Contact Number Notes Employee
as possible.
25-Sep-14 20 United Way Fort Bend Benefits Access Fair
Fort Bend County Service Center 10435 Greenbough Dr. Ste. 200 Stafford, TX 77477
Ruby Canales 281-207-2304 Handed out promotional items and information. Answered questions regarding our services.
Melanie
10-Oct-14 75 Fort Bend CONNECT Meeting "Affordable Health Care"
Mamie George Center 1111 Collins Rd. Richmond, TX 77469
Ruby Canales 281-207-2300 Handed out promotional items and information to various social service agencies.
Melanie
15-Oct-14 6 Fort Bend Center for Independent Living
FBCIL 12946 Dairy Ashford Rd. Ste.110 Sugar Land, TX 77478
Mary Francis
Wasson 281-980-2219 Presentation to a group of consumers w/ disabilities regarding our services and client responsibilities.
Melanie
17-Oct-14 9 Simonton/Fulshear Fort Bend Older adults Meals-On-Wheels
Irene Stern Community Center 6920 Katy-Fulshear Rd. Fulshear, TX 77441
Monica Welch 281-633-7058 Brief presentation to a group of older adults regarding our services. Addressed comments and concerns.
Melanie
7-Nov-14 150+ Fort Bend Older adults Meals-On-Wheels SRS Veterans Day
Bud O'Sheiles Center 1330 Band Rd. Rosenberg, TX 77471
Monica Welch 281-633-7058 Assisted in making certain all the older adults got on correct buses after field trip as efficiently as possible.
Melanie
12-Nov-14 5 Fort Bend Center for Independent
FBCIL 12946 Dairy
Mary Francis
Wasson 281-980-2219 Presentation to a group of
Melanie

10
5
Date of Presentation
Attendance Number
Organization Name Location First
Name Last Name Contact Number Notes Employee
Living Ashford Rd. Ste.110 Sugar Land, TX 77478
consumers w/ disabilities regarding our services and client responsibilities.
14-Nov-14 75+ Fort Bend CONNECT Meeting "Holiday Celebration"
Mamie George Center 1111 Collins Rd. Richmond, TX 77469
Ruby Canales 281-207-2300 Handed out promotional items and information to various social service agencies.
Melanie
18-Nov-14 50 Houston Area Women's Center Transportation 101
United Way Houston 50 Waugh Dr. Houston, TX 77007
Sheila Holbrook-White
512-699-8136 Presentation to a group of various social service agencies regarding our services and client responsibilities. Handed out brochures and answered questions.
Melanie & Paulette
19-Nov-14 150+ Fort Bend Older adults Meals-On-Wheels Thanksgiving Luncheon
Bud O'Sheiles Center 1330 Band Rd. Rosenberg, TX 77471
Monica Welch 281-633-7058 Assisted in making certain all the older adults got on correct buses after field trip as efficiently as possible. Helped serve older adults lunch.
Melanie
5-Dec-14 450 Sartartia Middle School Career Day
Sartartia Middle School 8125 Homeward Way Sugar Land, TX 77479
Tina Remmers 281-634-6310 Presentation to groups of middle school students regarding careers with public
Melanie

10
6
Date of Presentation
Attendance Number
Organization Name Location First
Name Last Name Contact Number Notes Employee
transportation and our services.
11-Dec-14 150+ Fort Bend Older adults Meals-On-Wheels Christmas Luncheon
Bud O'Sheiles Center 1330 Band Rd. Rosenberg, TX 77471
Monica Welch 281-633-7058 Assisted in making certain all the older adults got on correct buses after field trip as efficiently as possible. Helped serve older adults lunch.
Melanie
17-Dec-14 5 Fort Bend Center for Independent Living
FBCIL 12946 Dairy Ashford Rd. Ste.110 Sugar Land, TX 77478
Mary Francis
Wasson 281-980-2219 Presentation to a group of consumers w/ disabilities regarding our services and client responsibilities.
Melanie
21-Jan-15 5 Fort Bend Center for Independent Living
FBCIL 12946 Dairy Ashford Rd. Ste.110 Sugar Land, TX 77478
Laurie Pennell 281-980-2219 Presentation to a group of consumers w/ disabilities regarding our services and client responsibilities.
Melanie
26-Jan-15 3 Catholic Charities Mamie George Center 1111 Collins Rd. Richmond, TX 77469
Beth Zarate 832-768-4320 Meeting to discuss contracted transportation for clients.
Melanie & Tennille
28-Jan-15 15 Access Health Transportation Meeting
Access Health 400 Austin St. Richmond, TX 77469
Debra Ann
Zagala 281-969-1837 Meeting to discuss transportation options in our
Melanie & Paulette

10
7
Date of Presentation
Attendance Number
Organization Name Location First
Name Last Name Contact Number Notes Employee
area for healthcare clients. Addressed comments & concerns.
4-Feb-15 7 Pinnacle Senior Center
Pinnacle Senior Center 5525 Hobby Rd. Houston, TX 77053
Angie Villareal 832-471-2765 Presentation to group of older adults regarding our services and client responsibilities.
Melanie
11-Feb-15 12 Adult Transition Program George Ranch High School
George Ranch H.S. 8181 FM 762 Richmond, TX 77469
Valisha Ashton 832-757-0065 Brief presentation to a group of special education high school students regarding our services. Addressed comments and concerns.
Melanie
13-Feb-15 100+ Pinnacle Senior Center Annual Health Fair
Pinnacle Senior Center 5525 Hobby Rd. Houston, TX 77053
Angie Villareal 832-471-2765 Handed out promotional items and information to senior center participants.
Melanie
18-Feb-15 5 Fort Bend Center for Independent Living
FBCIL 12946 Dairy Ashford Rd. Ste.110 Sugar Land, TX 77478
Laurie Pennell 281-980-2219 Presentation to a group of consumers w/ disabilities regarding our services and client responsibilities.
Melanie
25-Feb-15 18 Adult Transition Program Lamar Consolidated High
Lamar Consolidated H.S. 4606 Mustang Ave.
Mary Baker 713-501-4765 Brief presentation to a group of special education high school
Melanie

10
8
Date of Presentation
Attendance Number
Organization Name Location First
Name Last Name Contact Number Notes Employee
School Rosenberg, TX 77471
students regarding our services. Addressed comments and concerns.
5-Mar-15 2 Harris County Rides
Community Services Department 8410 Lantern Point Dr. Houston, TX 77054
Vernon Chambers 713-578-2204 Meeting to discuss alternative transportation / rider voucher program in Fort Bend County.
Melanie
17-Mar-15 9 Fort Bend CONNECT Steering Committee Meeting
United Way - Fort Bend 10435 Greenbough Dr. Ste.200 Stafford, TX 77477
Ruby Canales 281-207-2300 Participated in Steering Committee Meeting for Monthly Fort Bend CONNECT Meetings.
Melanie
18-Mar-15 4 Fort Bend Center for Independent Living
FBCIL 12946 Dairy Ashford Rd. Ste.110 Sugar Land, TX 77478
Laurie Pennell 281-980-2219 Presentation to a group of consumers w/ disabilities regarding our services and client responsibilities.
Melanie
10-Apr-15 75+ Fort Bend CONNECT Meeting "Summer Youth Programs"
Mamie George Center 1111 Collins Rd. Richmond, TX 77469
Ruby Canales 281-207-2300 Handed out promotional items and information to various social service agencies. Participated in Steering Committee duties.
Melanie
10-Apr-15 150+ Fort Bend Older adults Meals-On-
Rosenberg Civic & Rec.Center
Monica Welch 281-633-7058 Assisted in making certain all
Melanie

10
9
Date of Presentation
Attendance Number
Organization Name Location First
Name Last Name Contact Number Notes Employee
Wheels "Spring Fling"
3825 Highway 36 South Rosenberg, TX 77471
the older adults got on correct buses after field trip as efficiently as possible. Helped serve older adults lunch.
15-Apr-15 2 Fort Bend Center for Independent Living
FBCIL 12946 Dairy Ashford Rd. Ste.110 Sugar Land, TX 77478
Laurie Pennell 281-980-2219 Presentation to a group of consumers w/ disabilities regarding our services and client responsibilities.
Melanie
5-May-15 15 Transportation Town Hall Meeting
Mamie George Center 1111 Collins Rd. Richmond, TX 77469
Alexandra
Neinast 512-371-7353 Participated in Town Hall Meeting held by The Transportation Works Team of the Texas State Independent Living Council & HGAC regarding public transportation access in our area for persons with disabilities.
Melanie
6-May-15 150+ Fort Bend Older adults Meals-On-Wheels "Older adults' Senior Prom"
Bud O'Sheiles Center 1330 Band Rd. Rosenberg, TX 77471
Monica Welch 281-633-7058 Assisted in making certain all the older adults got on correct buses after field trip as efficiently as possible.
Melanie

11
0
Date of Presentation
Attendance Number
Organization Name Location First
Name Last Name Contact Number Notes Employee
Helped serve older adults lunch.
8-May-15 100+ Meyer Elementary "Careers on Wheels"
Meyer Elementary 1930 J. Meyer Rd. Rosenberg, TX 77469
Latonya Hamilton 832-223-2005 Presentation to groups of elementary students regarding public transportation service. Staged bus at event for children to explore.
Tennille & Yvette
8-May-15 60+ Fort Bend CONNECT Meeting "DARS"
Mamie George Center 1111 Collins Rd. Richmond, TX 77469
Ruby Canales 281-207-2300 Handed out promotional items and information to various social service agencies. Participated in Steering Committee duties.
Melanie
12-May-15 150+ Fort Bend Older adults Meals-On-Wheels "NRG Picnic"
Rosenberg KC Hall 2007 Kay Cee Drive Rosenberg, TX 77471
Monica Welch 281-633-7058 Assisted in making certain all the older adults got on correct buses after field trip as efficiently as possible. Helped serve older adults lunch.
Melanie
14-May-15 25 Richmond VA Clinic Health Fair
Oakbend Doctor's Center 22001 Southwest Frwy. Richmond, TX 77469
Michelle Jabbie 832-595-7700 Handed out promotional items and information to health fair participants.
Melanie & Twila
16-May-15 50 Veterans' Benefits Pinnacle Senior Dwight Marshall 281-238-3585 Handed out Melanie &

11
1
Date of Presentation
Attendance Number
Organization Name Location First
Name Last Name Contact Number Notes Employee
Fair Center 5525 Hobby Rd. Houston, TX 77053
promotional items and information to Veterans and their families. Addressed comments & concerns.
Twila
19-May-15 9 Fort Bend CONNECT Steering Committee Meeting
United Way - Fort Bend 10435 Greenbough Dr. Ste.200 Stafford, TX 77477
Ruby Canales 281-207-2300 Participated in Steering Committee Meeting for Monthly Fort Bend CONNECT Meetings.
Melanie
20-May-15 20 Fort Bend Center for Independent Living Spring Open House
FBCIL 12946 Dairy Ashford Rd. Ste.110 Sugar Land, TX 77478
Laurie Pennell 281-980-2219 Open House event to introduce new FBCIL employees. Brief presentation to a group of consumers w/ disabilities regarding our services and new Rich-Rose PD routes.
Melanie
10-Jun-15 25 Transportation Meeting @ MGCC
Catholic Charities Mamie George Center 1111 Collins Rd. Richmond, TX 77469
Rosalyn Beyince 281-202-6200 Brief presentation to a group of consumers regarding our services and new Rich-Rose PD routes. Handed out information and answered service questions.
Melanie & Oscar
12-Jun-15 60+ Fort Bend CONNECT
Mamie George Center
Ruby Canales 281-207-2300 Handed out promotional items
Melanie

11
2
Date of Presentation
Attendance Number
Organization Name Location First
Name Last Name Contact Number Notes Employee
Meeting "Diversity in FBC"
1111 Collins Rd. Richmond, TX 77469
and information to various social service agencies. Participated in Steering Committee duties (I was volunteer coordinator for this meeting).
23-Jun-15 9 Fort Bend CONNECT Steering Committee Meeting
United Way - Fort Bend 10435 Greenbough Dr. Ste.200 Stafford, TX 77477
Ruby Canales 281-207-2300 Participated in Steering Committee Meeting for Monthly Fort Bend CONNECT Meetings.
Melanie
24-Jun-15 4 Fort Bend Center for Independent Living
FBCIL 12946 Dairy Ashford Rd. Ste.110 Sugar Land, TX 77478
Laurie Pennell 281-980-2219 Presentation to a group of consumers w/ disabilities regarding our services and client responsibilities.
Melanie
29-Jun-15 30 Richmond-Rosenberg Town Hall Meeting
Jackson Elementary 301 3rd Street Rosenberg, TX 77471
Kaye Supak 832-595-3310 Brief presentation about new PD routes during town hall meeting for Richmond/Rosenberg area. Handed out information.
Melanie
21-Jul-15 25 Fort Bend Center for Independent Living Annual ADA Celebration
FBCIL 12946 Dairy Ashford Rd. Ste.110 Sugar Land, TX 77478
Laurie Pennell 281-980-2219 Open House event to celebrate anniversary of ADA. Brief presentation to a
Melanie

11
3
Date of Presentation
Attendance Number
Organization Name Location First
Name Last Name Contact Number Notes Employee
group of consumers w/ disabilities regarding our services and new Rich-Rose PD routes.
22-Jul-15 5 Fort Bend Center for Independent Living
FBCIL 12946 Dairy Ashford Rd. Ste.110 Sugar Land, TX 77478
Laurie Pennell 281-980-2219 Presentation to a group of consumers w/ disabilities regarding our services and client responsibilities.
Melanie
24-Jul-15 12 Fort Bend CONNECT Steering Committee Meeting
The Egg & I Restaurant 9920 US 90A Ste. 150C Sugar Land, TX 77478
Ruby Canales 281-207-2300 Participated in Steering Committee Meeting for Monthly Fort Bend CONNECT Meetings.
Melanie
13-Aug-15 200+ My Solution Is…. Transportation Fair
Transportation Fair 3 Greenway Plaza Houston, TX 77046
Ch'rese Jackson 713-993-2487 Handed out promotional items and information to Greenway Plaza commuters.
Melanie
14-Aug-15 77 Fort Bend CONNECT Meeting "Immigration Services"
Mamie George Center 1111 Collins Rd. Richmond, TX 77469
Ruby Canales 281-207-2300 Handed out promotional items and information to various social service agencies. Participated in Steering Committee duties. Announced HGAC
Melanie

11
4
Date of Presentation
Attendance Number
Organization Name Location First
Name Last Name Contact Number Notes Employee
Transportation Planning/Letters of Commitment needed.
18-Aug-15 10 Fort Bend CONNECT Steering Committee Meeting
United Way - Fort Bend 10435 Greenbough Dr. Ste.200 Stafford, TX 77477
Ruby Canales 281-207-2300 Participated in Steering Committee Meeting for Monthly Fort Bend CONNECT Meetings.
Melanie
26-Aug-15 6 Fort Bend Center for Independent Living
FBCIL 12946 Dairy Ashford Rd. Ste.110 Sugar Land, TX 77478
Laurie Pennell 281-980-2219 Presentation to a group of consumers w/ disabilities regarding our services and client responsibilities.
Melanie
11-Sep-15 65 Fort Bend CONNECT Meeting "Mental Health & Substance Abuse"
Mamie George Center 1111 Collins Rd. Richmond, TX 77469
Ruby Canales 281-207-2300 Handed out promotional items and information to various social service agencies. Participated in Steering Committee duties.
Melanie
15-Sep-15 11 Fort Bend CONNECT Steering Committee Meeting
United Way - Fort Bend 10435 Greenbough Dr. Ste.200 Stafford, TX 77477
Ruby Canales 281-207-2300 Participated in Steering Committee Meeting for Monthly Fort Bend CONNECT Meetings.
Melanie
17-Sep-15 450+ Fort Bend County Employee Fair
FBC Rosenberg Annex 4520 Reading Road Rosenberg, TX
Beatrice Galan 281-238-3336 Employee Fair - Handed out promotional items and information
Melanie

11
5
Date of Presentation
Attendance Number
Organization Name Location First
Name Last Name Contact Number Notes Employee
77471
19-Sep-15 75 Outreach Event for NEW PD Routes
Fiesta 3707 Avenue H Rosenberg, TX 77471
Tennille Jones 281-633-7433 Had a table to hand out information about our new PD Fixed Routes in Richmond/Rosenberg.
Tennille & Oscar
19-Sep-15 20 Outreach Event for NEW PD Routes
Walmart 5330 FM 1640 Richmond, TX 77469
Tennille Jones 281-633-7433 Had a table to hand out information about our new PD Fixed Routes in Richmond/Rosenberg.
Dalia & Donna A.
21-Sep-15 200+ Fort Bend County Fair Older adults Fair Day
Fort Bend County Fairgrounds 4110 SH 36 Rosenberg, TX 77489
Winnifer Washington 281-633-7058 Assisted in making certain all the older adults got on correct buses after field trip as efficiently as possible.
Melanie
25-Sep-15 1000+ Fort Bend County Fair Fair Day Parade
Fort Bend County Courthouse 401 Jackson St. Richmond, TX 77469
Tennille Jones 281-633-7433 Had a bus in the parade! Handed out PD Route flyers and candy to the spectators.
Melanie, Donna, & Erasmo
26-Sep-15 100+ The Arc of Fort Bend County 2015 Special Needs Resource Fair
Dulles High School 550 Dulles Ave. Sugar Land, TX 77478
Cheryl Sewell 281-494-5924 Handed out promotional items and information. Answered questions regarding our services.
Melanie
30-Sep-15 5 Fort Bend Center for Independent Living
FBCIL 12946 Dairy Ashford Rd. Ste.110 Sugar
Laurie Pennell 281-980-2219 Presentation to a group of consumers w/ disabilities
Melanie

11
6
Date of Presentation
Attendance Number
Organization Name Location First
Name Last Name Contact Number Notes Employee
Land, TX 77478 regarding our services and client responsibilities.
1-Oct-15 20 Transportation Meeting @ MGCC
Mamie George Center 1111 Collins Rd. Richmond, TX 77469
Rosalyn Beyince 281-202-6200 Brief presentation about new PD routes during town hall meeting for Richmond/Rosenberg area. Handed out information.
Melanie
6-Oct-15 35 Richmond National Night Out Event
North Richmond Community Center - 1305 Clay St. Richmond, TX 77469
Tennille Jones 281-633-7433 Had a table to hand out information about our new PD Fixed Routes in Richmond/Rosenberg.
Melanie & Dalia
6-Oct-15 20 Rosenberg National Night Out Event
North Rosenberg Community Park - 2000 Avenue A Rosenberg, TX 77489
Tennille Jones 281-633-7433 Had a table to hand out information about our new PD Fixed Routes in Richmond/Rosenberg.
Hope & Erasmo
9-Oct-15 65 Fort Bend CONNECT Meeting "Domestic Violence"
Mamie George Center 1111 Collins Rd. Richmond, TX 77469
Ruby Canales 281-207-2300 Handed out promotional items and information to various social service agencies. Participated in Steering Committee duties.
Melanie
14-Oct-15 150+ Senior EXPO 2015 Stafford Center 10505 Cash Rd. Stafford, TX
Tennille Jones 281-633-7433 Handed out information regarding our
Melanie & Donna A.

11
7
Date of Presentation
Attendance Number
Organization Name Location First
Name Last Name Contact Number Notes Employee
77477 services to older adults at the event. Answered service questions.
20-Oct-15 10 Fort Bend CONNECT Steering Committee Meeting
United Way - Fort Bend 12300 Parc Crest Dr. Stafford, TX 77477
Ruby Canales 281-207-2300 Participated in Steering Committee Meeting for Monthly Fort Bend CONNECT Meetings.
Melanie
21-Oct-15 8 Fort Bend Center for Independent Living
FBCIL 12946 Dairy Ashford Rd. Ste.110 Sugar Land, TX 77478
Laurie Pennell 281-980-2219 Presentation to a group of consumers w/ disabilities regarding our services and client responsibilities.
Melanie
4-Nov-15 20 Fresno Fort Bend Older adults Meals-On-Wheels
Mustang Community Center 4521 FM 521 Fresno, TX 77545
Winnifer Washington 281-633-7058 Brief presentation to a group of older adults regarding our services. Addressed comments and concerns.
Melanie
10-Nov-15 150+ Fort Bend Older adults Meals-On-Wheels SRS Veterans Day
Bud O'Sheiles Center 1330 Band Rd. Rosenberg, TX 77471
Winnifer Washington 281-633-7058 Assisted in making certain all the older adults got on correct buses after field trip as efficiently as possible.
Melanie
13-Nov-15 70 Fort Bend CONNECT Meeting "Holiday
Mamie George Center 1111 Collins Rd. Richmond, TX
Ruby Canales 281-207-2300 Handed out promotional items and information to various social
Melanie

11
8
Date of Presentation
Attendance Number
Organization Name Location First
Name Last Name Contact Number Notes Employee
Celebration" 77469 service agencies. Participated in Steering Committee duties.
17-Nov-15 9 Fort Bend CONNECT Steering Committee Meeting
United Way - Fort Bend 12300 Parc Crest Dr. Stafford, TX 77477
Ruby Canales 281-207-2300 Participated in Steering Committee Meeting for Monthly Fort Bend CONNECT Meetings.
Melanie
18-Nov-15 150+ Fort Bend Older adults Meals-On-Wheels Thanksgiving Luncheon
Bud O'Sheiles Center 1330 Band Rd. Rosenberg, TX 77471
Crystal Collins 281-633-7058 Assisted in making certain all the older adults got on correct buses after field trip as efficiently as possible.
Melanie
19-Nov-15 20 Rosenberg Fort Bend Older adults Meals-On-Wheels
Bud O'Sheiles Center 1330 Band Rd. Rosenberg, TX 77471
Crystal Collins 281-633-7058 Brief presentation to a group of older adults regarding our services. Addressed comments and concerns.
Melanie
20-Nov-15 8 Fort Bend Center for Independent Living
FBCIL 12946 Dairy Ashford Rd. Ste.110 Sugar Land, TX 77478
Laurie Pennell 281-980-2219 Presentation to a group of consumers w/ disabilities regarding our services and client responsibilities.
Melanie
30-Nov-15 13 Adult Transition Program George Ranch High School
George Ranch H.S. 8181 FM 762 Richmond, TX
Valisha Ashton 832-757-0065 Brief presentation to a group of special education high school
Melanie

11
9
Date of Presentation
Attendance Number
Organization Name Location First
Name Last Name Contact Number Notes Employee
77469 students regarding our services. Addressed comments and concerns.
1-Dec-15 40 Tri-City Fort Bend Older adults Meals-On-Wheels
Stafford Community Center 3110 Fifth St. Stafford, TX 77477
Crystal Collins 281-633-7058 Brief presentation to a group of older adults regarding our services. Addressed comments and concerns.
Melanie
3-Dec-15 7 Kendleton Fort Bend Older adults Meals-On-Wheels
Kendleton Senior Center 109 Guess Ave. Kendleton, TX 77451
Crystal Collins 281-633-7058 Brief presentation to a group of older adults regarding our services. Addressed comments and concerns.
Melanie
4-Dec-15 450 Sartartia Middle School Career Day
Sartartia Middle School 8125 Homeward Way Sugar Land, TX 77479
Tina Remmers 281-634-6310 Presentation to groups of middle school students regarding careers with public transportation and our services.
Melanie
8-Dec-15 20 Simonton/Fulshear Fort Bend Older adults Meals-On-Wheels
Irene Stern Community Center 6920 Katy-Fulshear Rd. Fulshear, TX 77441
Crystal Collins 281-633-7058 Brief presentation to a group of older adults regarding our services. Addressed comments and concerns.
Melanie
10-Dec-15 200+ Fort Bend Older Bud O'Sheiles Crystal Collins 281-633-7058 Assisted in Melanie

12
0
Date of Presentation
Attendance Number
Organization Name Location First
Name Last Name Contact Number Notes Employee
adults Meals-On-Wheels Christmas Luncheon
Center 1330 Band Rd. Rosenberg, TX 77471
making certain all the older adults got on correct buses after field trip as efficiently as possible.
15-Dec-15 20 Hometowne Fort Bend Older adults Meals-On-Wheels
Hometowne Senior Center 10888 Huntington Estates Houston, TX 77099
Crystal Collins 281-633-7058 Brief presentation to a group of older adults regarding our services. Addressed comments and concerns.
Melanie
16-Dec-15 15 Fort Bend Center for Independent Living
FBCIL 12946 Dairy Ashford Rd. Ste.110 Sugar Land, TX 77478
Laurie Pennell 281-980-2219 Presentation to a group of consumers w/ disabilities regarding our services and client responsibilities. Christmas festivities!
Melanie
16-Dec-15 10 Fort Bend CONNECT Steering Committee Meeting
Lasagna House 16089 City Walk Sugar Land, TX 77479
Ruby Canales 281-207-2300 End of year celebration lunch. Participated in Steering Committee Meeting for monthly Fort Bend CONNECT Meetings.
Melanie
30-Dec-15 20 Huntington @ Sienna Fort Bend Older adults Meals-On-Wheels
Huntington @ Sienna 4522 Trammel Fresno Rd. Missouri City,
Crystal Collins 281-633-7058 Brief presentation to a group of older adults regarding our services.
Melanie

12
1
Date of Presentation
Attendance Number
Organization Name Location First
Name Last Name Contact Number Notes Employee
77459 Addressed comments and concerns.
8-Jan-16 102 Fort Bend CONNECT Meeting "Parenting Education"
United Way - Fort Bend 12300 Parc Crest Dr. Stafford, TX 77477
Ruby Canales 281-207-2300 Handed out promotional items and information to various social service agencies. Participated in Steering Committee duties.
Melanie
19-Jan-16 12 Fort Bend CONNECT Steering Committee Meeting
United Way - Fort Bend 12300 Parc Crest Dr. Stafford, TX 77477
Ruby Canales 281-207-2300 Participated in Steering Committee Meeting for Monthly Fort Bend CONNECT Meetings.
Melanie
20-Jan-16 3 Fort Bend Center for Independent Living
FBCIL 12946 Dairy Ashford Rd. Ste.110 Sugar Land, TX 77478
Laurie Pennell 281-980-2219 Presentation to a group of consumers w/ disabilities regarding our services and client responsibilities.
Melanie
16-Feb-16 14 Fort Bend CONNECT Steering Committee Meeting
United Way - Fort Bend 12300 Parc Crest Dr. Stafford, TX 77477
Ruby Canales 281-207-2300 Participated in Steering Committee Meeting for Monthly Fort Bend CONNECT Meetings.
Melanie
18-Feb-16 20 Rosenberg Fort Bend Older adults Meals-On-Wheels
Bud O'Sheiles Center 1330 Band Rd. Rosenberg, TX
Crystal Collins 281-633-7058 Rosenberg older adults asked me to come out to answer service
Melanie

12
2
Date of Presentation
Attendance Number
Organization Name Location First
Name Last Name Contact Number Notes Employee
77471 questions. Addressed comments and concerns.
24-Feb-16 6 Fort Bend Center for Independent Living
FBCIL 12946 Dairy Ashford Rd. Ste.110 Sugar Land, TX 77478
Laurie Pennell 281-980-2219 Presentation to a group of consumers w/ disabilities regarding our services and client responsibilities.
Melanie

123
This Page Intentionally Left Blank

124
APPENDIX D – TITLE VI COMPLAINT PROCEDURES AND
COMPLAINT FORM
TITLE VI STATEMENT OF POLICY FOR PUBLIC TRANSPORTATION
Fort Bend County is committed to a policy of non-discrimination in the conduct of its business,
including the Title VI responsibility to deliver equitable and accessible transportation services.
Fort Bend County officially formed the Public Transportation Department in June 2005 to
provide residents with safe and efficient public transportation services while maintaining service
quality and customer satisfaction.
The Public Transportation Department recognizes its responsibility to the Fort Bend County
community in which it operates and to the society it serves. The Public Transportation
Department will utilize its best efforts to assure that no person shall, on the grounds of race,
color, or national origin, be excluded from participation in, be denied the benefits of, or be
subjected to discrimination under the Fort Bend County program of transit service delivery and
related benefits. Further, the Public Transportation Department will utilize best efforts to provide
equitable and accessible public transportation services to persons of low income and persons
with limited English proficiency.
In order to comply with the Title VI requirements, the Public Transportation Department strives
to accomplish the following objectives:
Ensure that the level and quality of transportation service is provided without regard to
race, color or national origin;
Identify and address, as appropriate, disproportionately high and adverse human health
and environmental effects, including social and economic effects of programs and
activities on minority populations and low-income populations;
Promote the full and fair participation of all affected populations in transportation
decision making;
Prevent the denial, reduction or delay in benefits related to programs and activities that
benefit minority populations or low-income populations; and
Ensure meaningful access to programs and activities by persons with limited English
proficiency.
The responsibility for carrying out Fort Bend County’s commitment to Title VI responsibilities
rests with the Director of Public Transportation. All managers, supervisors, and employees in the
Public Transportation Department share in the responsibility for making the Title VI Program a
success.
Fort Bend County is committed to safeguarding against discrimination in its provision of public
transportation services. Any person who feels he or she may have been discriminated against is
encouraged to report such a violation to the Fort Bend County within 180 days of the alleged
discrimination. Additional information concerning the Fort Bend County Title VI obligations and
the complaint procedure can be found by calling (281) 633-7433 or on the county’s web site
http://www.fortbendcountytx.gov/Modules/ShowDocument.aspx?documentid=10133.

125
TITLE VI COMPLAINT PROCEDURES
Fort Bend County is committed to a policy of non-discrimination in the conduct of its business,
including the Title VI responsibility to deliver equitable and accessible public transportation
services. The Public Transportation Department recognizes its responsibilities to the Fort Bend
County community in which it operates and to the society it serves. The Public Transportation
Department will utilize its best efforts to assure that no person shall, on the grounds of race,
color, or national origin, be excluded from participation in, be denied the benefits of, or be
subjected to discrimination under the Fort Bend County program of transit service delivery and
related benefits. Further, the Public Transportation Department will utilize best efforts to provide
equitable and accessible public transportation services to persons of low income or limited
English proficiency. For a complete copy of the Fort Bend County Title VI Statement of Policy
for Public Transportation, please visit “Fort Bend County Title VI - Statement of Policy.”
The responsibility for carrying out Fort Bend County’s commitment to Title VI responsibilities
rests with the Director of Public Transportation. All managers, supervisors, and employees in the
Public Transportation Department share in the responsibility for making the Title VI Program a
success.
Any person who feels he or she may have been discriminated against is encouraged to report
such a violation to the Fort Bend County Public Transportation Department within 180 days of
the alleged discrimination. If you believe that you have been excluded from participation in,
denied the benefits of, or subjected to discrimination based on race, color, national origin,
language, or income level under Fort Bend County’s Public Transportation Department programs
for transit service delivery or related benefits, you may file a complaint with the Fort Bend
County Public Transportation Department, Attention Assistant Director of Public Transportation,
12550 Emily Court, Suite 400, Sugar Land, TX 77478; by telephone (281) 633-7433; by fax
(281) 243-6710; or by email at [email protected]. For a form to file a complaint, please
see “Fort Bend County Title VI Complaint Form.” We encourage you to make your complaint
in writing; however, comments can also be submitted verbally.
The Assistant Director will review and investigate every complaint promptly. Reasonable
measures will be undertaken to preserve any information that is confidential. At a minimum the
Assistant Director will:
Identify and review all relevant documents, practices and procedures;
Identify and interview persons with knowledge of the Title VI violation, i.e., the person
making the complaint; witnesses or anyone identified by the Complainant; anyone who
may have been subject to similar activity, or anyone with relevant information.
Upon completion of the investigation, the Assistant Director will complete a final report and
deliver to the Director of Public Transportation. If a Title VI violation is found to exist, remedial
steps as appropriate and necessary will be taken immediately. The Complainant will also receive
a final report together with any remedial steps. The investigation process and final report should
take no longer than twenty-five (25) business days. If no violation is found and the complainant
wishes to appeal the decision, he or she may appeal directly to the Director of Public
Transportation, 12550 Emily Court, Suite 400, Sugar Land, TX 77478.

126
The Assistant Director shall maintain a log of Title VI complaints received from this process
which shall include the date the complaint was filed; a summary of the allegations; the status of
the complaint; and actions taken by the Fort Bend County Department of Public Transportation
in response to the complaint. Should Fort Bend County receive a Title VI complaint in the form
of a formal charge or lawsuit, the complaint will be forwarded to the County Attorney.
Complaints may also be filed with the following organization no later than 180 days after the
date of the alleged discrimination:
Federal Transit Administration’s Office of Civil Rights Attention: Title VI Program Coordinator
East Building, 5th Floor - TCR
1200 New Jersey Ave., SE
Washington, DC 20590
202-366-4018
http://www.fta.dot.gov/civilrights/title6/civil_rights_5104.html
For more information see “Filing a Title VI Complaint with the FTA.”
FTA Title VI Complaint Form

127
TITLE VI COMPLAINT FORM
Title VI of the 1964 Civil Rights Act requires that “No person in the United States shall, on the
ground of race, color or national origin, be excluded from participation in, be denied the benefits
of, or be subjected to discrimination under any program or activity receiving federal financial
assistance.” The Fort Bend County Public Transportation Department is committed to a policy
of non-discrimination in the conduct of its business, including the responsibility to deliver
equitable and accessible public transportation services.
Any person who feels he or she may have been discriminated against is encouraged to report
such a violation to the Fort Bend County Public Transportation Department within 180 days of
the alleged discrimination.
The following information is necessary to assist us in processing your complaint. Should you
require any assistance in completing this form, please let us know by telephone (281) 633-7433
or by email at [email protected]. Complete and return this form to Fort Bend County
Public Transportation Department, Attention Assistant Director of Public Transportation, 12550
Emily Court, Suite 400, Sugar Land, TX 77478 or fax by fax (281) 243-6710.
1. Complainant’s Name ________________________________________________
2. Address___________________________________________________________
3. City, State and Zip Code______________________________________________
4. Telephone Number______________________(alternate)____________________
5. Email Address______________________________________________________
6. Person discriminated against (if someone other than the complainant)
Name_____________________________________________________________
Address___________________________________________________________
City, State and Zip Code______________________________________________
Please explain your relationship to this person ____________________________
7. Which of the following best describes the reason you believe the discrimination took
place? Was it because of your:
a. Race/Color/Ethnicity_____________
b. National Origin __________
8. What date did the alleged discrimination take place?_______________

128
9. In your own words, describe the alleged discrimination. Explain what happened and
whom you believe was responsible. Please use the back of this form if additional space is
required.
________________________________________________________________________
________________________________________________________________________
________________________________________________________________________
________________________________________________________________________
________________________________________________________________________
________________________________________________________________________
________________________________________________________________________
________________________________________________________________________
________________________________________________________________________
________________________________________________________________________
________________________________________________________________________
10. Have you filed this complaint with any other federal, state, or local agency; or with any
federal or state court? ______ Yes ______ No
If yes, check all that apply:
____ Federal agency ____ Federal court
____ State agency ____ State court
____ Local agency
11. Please provide information about a contact person at the agency/court where the
complaint was filed.
Name ____________________________________________________________
Address __________________________________________________________
City, State, and Zip Code _____________________________________________
Telephone Number __________________________________________________
12. Please sign below. You may attach any written materials or other information
that you think is relevant to your complaint.
_____________________________ ______________
Complainant’s Signature Date

129
TÍTULO VI DECLARACIÓN DE POLÍTICA PARA EL TRANSPORTE PÚBLICO
El Condado de Fort Bend está comprometido a una política de no discriminación en el ejercicio
de sus actividades, incluyendo la responsabilidad del Título VI de ofrecer servicios equitativos y
accesibles de transporte público. El Condado de Fort Bend formó oficialmente el Departamento
de Transporte Público en junio del 2005 para proporcionar a sus residentes servicios de
transporte público seguros y eficientes, y al mismo tiempo mantener un servicio de calidad y la
satisfacción de sus clientes.
El Departamento de Transporte Público reconoce sus responsabilidades a la comunidad del
Condado de Fort Bend en la cual opera y a la sociedad que sirve. El Departamento de Transporte
Público utilizará sus mejores esfuerzos para asegurar que ninguna persona, por motivos de raza,
color o nacionalidad, sea excluida de la participación, se le niegue los beneficios, o sea sujeto a
discriminación bajo el programa del Condado de Fort Bend de servicios de tránsito y beneficios
relacionados. Además, el Departamento de Transporte Público utilizará los mejores esfuerzos
para proporcionar servicios equitativos y accesibles de transporte público a las personas de bajos
ingresos y de inglés limitado.
A fin de cumplir con los requisitos del Título VI, el Departamento de Transporte Público se
esfuerza por lograr los siguientes objetivos:
Asegurar que el nivel y la calidad del servicio de transporte se proporcione sin tomar en
cuenta raza, color o nacionalidad;
Identificar y abordar, en su caso, desproporcionadamente altos y adversos efectos a la
salud humana y el medio ambiente, incluyendo efectos sociales y económicos de los
programas y actividades en las poblaciones minoritarias y poblaciones de bajos recursos;
Promover la plena y justa participación de todas las poblaciones afectadas en la toma de
decisiones de transporte;
Prevenir la negación, reducción o demora en beneficios relacionados con programas y
actividades que benefician a las poblaciones minoritarias o poblaciones de bajos recursos;
y
Asegurar que personas con inglés limitado tengan acceso significativo a los programas y
actividades.
La responsabilidad de llevar a cabo el compromiso del Condado de Fort Bend a las
responsabilidades del Título VI recae en el Director de Transporte Público. Todos los gerentes,
supervisores y empleados del Departamento de Transporte Público comparten la responsabilidad
de hacer que el Programa Título VI tenga éxito.
El Condado de Fort Bend está comprometido a la protección contra la discriminación en su
repartición de servicios de transporte público. A cualquier persona que sienta que haya sido
discriminada en su contra, se le recomienda denunciar tal violación al Departamento de
Transporte Público del Condado de Fort Bend dentro de los siguientes 180 días de la presunta
discriminación. Para encontrar información adicional sobre las obligaciones de Título VI del
Condado de Fort Bend, pueden llamar al (281) 633 - 7433 o en el sitio de web del condado (en
inglés): http://www.fortbendcountytx.gov/Modules/ShowDocument.aspx?documentid=10133

130
TÍTULO VI PROCEDIMIENTOS DE DENUNCIA
El Condado de Fort Bend está comprometido a una política de no discriminación en el ejercicio
de sus actividades, incluyendo la responsabilidad del Título VI de ofrecer servicios de transporte
público, equitativo y accesible. El Departamento de Transporte Público reconoce sus
responsabilidades a la comunidad del Condado de Fort Bend en la cual opera y a la sociedad que
sirve. El Departamento de Transporte Público utilizará sus mejores esfuerzos para asegurar que
ninguna persona, por motivos de raza, color o nacionalidad, sea excluida de la participación, se
le niegue los beneficios, o sea sujeto a discriminación bajo el programa del Condado de Fort
Bend de servicios de tránsito y beneficios relacionados. Además, el Departamento de Transporte
Público utilizará los mejores esfuerzos para proporcionar servicios equitativos y accesibles de
transporte público a las personas de bajos ingresos y de inglés limitado. Para ver una copia
completa del Título VI - Declaración de la Política de Transporte Público del Condado de Fort
Bend, por favor visite “Condado de Fort Bend Título VI - Declaración de Política para el
Transporte Público”.
La responsabilidad de llevar a cabo el compromiso del Condado de Fort Bend a las
responsabilidades del Título VI recae en el Director de Transporte Público. Todos los gerentes,
supervisores y empleados del Departamento de Transporte Público comparten la responsabilidad
de hacer que el Programa Título VI tenga éxito.
A cualquier persona que sienta que haya sido discriminada en su contra, se le recomienda
denunciar tal violación al Departamento de Transporte Público del Condado de Fort Bend dentro
de los siguientes 180 días de la presunta discriminación. Si cree que ha sido excluido de
participación, se le ha negado los beneficios, o ha sido sujeto a discriminación basado en raza,
color, nacionalidad, idioma o nivel de ingresos bajo los programas de servicio de transito del
Departamento de Transporte Público del Condado de Fort Bend o beneficios relacionados, podrá
presentar una denuncia. Diríjala a: Fort Bend County Public Transportation Department,
Attention Assistant Director of Public Transportation, 12550 Emily Court, Suite 400, Sugar
Land, TX 77478; por teléfono al (281) 633-7433; por fax al (281) 243-6710; o por correo
electrónico a [email protected]. Para llenar un formulario donde hacer la denuncia, por
favor vea “Título VI - Formulario de Denuncia del Condado de Fort Bend”. Le recomendamos
que haga su denuncia por escrito; sin embargo, comentarios también se pueden hacer
verbalmente.
El Subdirector examinará e investigará cada denuncia sin demora. Se llevarán a cabo las medidas
razonables para preservar cualquier información que sea confidencial. Y como mínimo, el
Subdirector:
Identificará y revisará todos los documentos pertinentes, prácticas y procedimientos;
Identificará y entrevistará a las personas que tengan conocimientos de la violación al
Título VI, es decir, la persona que hace la denuncia; testigos o cualquier persona
identificada por el denunciante; quien pudo haber sido sujeto a actividades similares, o
cualquier persona con información pertinente.
Al término de la investigación, el Subdirector hará un reporte final y lo entregará al Director de
Transporte Público. Si se encuentra que ha existido una violación del Título VI, medidas
correctivas, apropiadas y necesarias, se tomarán inmediatamente. El denunciante también

131
recibirá un reporte final junto con las medidas correctivas. Todo el proceso de investigación y el
reporte final no deben de tomar más de veinticinco (25) días hábiles. Si no se encuentra ninguna
violación y el denunciante desea apelar la decisión, él o ella puede apelar directamente a:
Director of Public Transportation, 12550 Emily Tribunal, Suite 400, Sugar Land, TX 77478.
El Subdirector mantendrá un registro de las denuncias recibidas al Título VI por medio de este
proceso, que deberá incluir la fecha en que fue presentada la denuncia, un resumen de las
alegaciones, el estado de la denuncia, y las medidas adoptadas por el Departamento de
Transporte Público del Condado de Fort Bend en respuesta a la queja o denuncia. Si el Condado
de Fort Bend recibiera una denuncia al Título VI a través de una demanda o cargos legales, la
queja se reenviará al Fiscal de Condado.
También se pueden presentar las denuncias con la siguiente organización, a más tardar 180 días
después de la fecha de la supuesta discriminación:
Federal Transit Administration’s Office of Civil Rights Attention: Title VI Program Coordinator
East Building, 5th Floor - TCR
1200 New Jersey Ave., SE
Washington, DC 20590
202-366-4018
http://www.fta.dot.gov/civilrights/title6/civil_rights_5104.html
Para más información (en inglés) diríjase a “Filing a Title VI Complaint with the FTA.”
FTA Title VI Complaint Form

132
TÍTULO VI FORMULARIO DE DENUNCIA
El Título VI de la ley de los Derechos Civiles de 1964 requiere que "ninguna persona en los
Estados Unidos, por motivos de raza, color u nacionalidad, podrá ser excluido de la
participación, se le niegue los beneficios o sea sujeto a discriminación en virtud de ningún
programa o actividad que reciba ayuda económica federal." El Departamento de Transporte
Público del Condado de Fort Bend está comprometido a una política de no discriminación en el
ejercicio de sus actividades, incluyendo la responsabilidad de ofrecer servicios de transporte
público, equitativo y accesible.
A cualquier persona que sienta que haya sido discriminada en su contra, se le recomienda
denunciar tal violación al Departamento de Transporte Público del Condado de Fort Bend dentro
de los siguientes 180 días de la presunta discriminación.
La siguiente información es necesaria para ayudarnos en el procesamiento de su queja. En caso
de que requiera cualquier asistencia para llenar este formulario, por favor háganoslo saber por
teléfono al (281) 633-7433 o por correo electrónico a [email protected]. Llene y envíe
el presente formulario a: Fort Bend County Public Transportation Department, Attention
Assistant Director of Public Transportation, 12550 Emily Court, Suite 400, Sugar Land, TX
77478, o por fax al (281) 243-6710.
1. Nombre del denunciante________________________________________________
2. Dirección ___________________________________________________________
3. Ciudad, Estado & Código Postal__________________________________________
4. Número de Teléfono______________________(Alternativo)____________________
5. Correo electrónico______________________________________________________
6. Persona que fue discriminada (si fue alguien diferente al denunciante)
Nombre_____________________________________________________________
Dirección___________________________________________________________
Ciudad, Estado & Código Postal_________________________________________
Por favor explique su relación con esta persona ____________________________
7. ¿Cuál de los siguientes motivos describe mejor la razón por la cual usted cree que la
discriminación se llevó a cabo? Fue a causa de:
a. Raza / Color / Etnicidad_____________
b. Nacionalidad __________
8. ¿En qué fecha sucedió la supuesta discriminación? _______________

133
9. En sus propias palabras, describa la presunta discriminación. Explique lo que ocurrió y
quien cree usted que fue responsable. Por favor utilice la parte posterior de este
formulario si necesita espacio adicional.
________________________________________________________________________
________________________________________________________________________
________________________________________________________________________
________________________________________________________________________
________________________________________________________________________
________________________________________________________________________
________________________________________________________________________
________________________________________________________________________
________________________________________________________________________
________________________________________________________________________
________________________________________________________________________
10. ¿Ha presentado esta denuncia ante cualquier otra agencia federal, estatal o local; o en
cualquier tribunal federal o estatal? ______ Si ______ No
Si es así, marque todo lo que aplica:
____ Agencia Federal ____ Corte Federal
____ Agencia Estatal ____ Corte Estatal
____ Agencia Local
11. Por favor proporcione información acerca de una persona de contacto en la agencia/corte
donde se presentó la denuncia.
Nombre____________________________________________________________
Dirección __________________________________________________________
Ciudad, Estado & Código Postal_________________________________________
Número de teléfono __________________________________________________
12. Por favor firme abajo. Usted puede agregar cualquier material escrito u otra
información que considere que es pertinente a su denuncia.
_____________________________ ______________
Firma del Denunciante Fecha

134
This Page Intentionally Left Blank

135
APPENDIX E – LETTER OF NO COMPLAINTS

136
This Page Intentionally Left Blank

137
APPENDIX F – ADVISORY COMMITTEE MEMBERSHIP
Area Represented Member Name Ethnicity/Gender
County Judge Ann Werlein Anglo-American/Female Commissioner Precinct 1 Michael Gutierrez Hispanic/Male Commissioner Precinct 2 Katie Herrington African-American/Female Commissioner Precinct 3 Lila Smith Anglo-American/Female Commissioner Precinct 4 Danielle Garrison Hispanic/Female Disabled Community Representative Laura Lavigne Anglo-American/Female Older adults Community Representative Manual Zamora Hispanic/Male Fort Bend County Public Transportation Yvette Maldonaldo Hispanic/Female Public at Large Community Representative Rachael Steele Anglo-American/Female
The Fort Bend County Public Transportation Department picks its advisory committee based on
the representation of the entire county. Each elected Commissioner and the County Judge have a
representative on the committee. Additionally, there is a representative from the Transportation
Department as well as from two community non-profit entities. The non-profit committee
members represent the older adult population and the disabled community of Fort Bend County

138
This Page Intentionally Left Blank

139
APPENDIX G – FORT BEND COUNTY PUBLIC TRANSPORTATION
SUBRECIPIENTS
TITLE VI AND SUBRECIPIENTS
Subrecipients will adopt the Fort Bend County's Title VI Program, including the notice to
beneficiaries, complaint procedures and complaint forms, public participation plan and the
language assistance plan if it is required according to their operations.
Subrecipients will be required to submit the attached Statement of Certification along with
approval of minutes from their governing body that the entity has adopted the Fort Bend County
Title VI Program and Procedures every year by January 30.
Annually, by January 30, subrecipient will be required to submit on their letterhead, a list of
board members and committee members for the upcoming year. If board/committee positions are
transit-related non-elected positions, then a breakdown of race membership is required along
with a description of the process the entity used to encourage participation. Additionally,
subrecipients will be required to list complaints, investigations or any lawsuits for the previous
year on the same scheduled date.
Fort Bend County's Title VI Coordinator will provide blank copies of complaint forms and logs
to be used by subrecipients should they have any complaints to report to the Title VI Coordinator
throughout the year, who will also be available to assist.
Annually, by January 30 subrecipient is also required to submit to Fort Bend County's Title VI
Coordinator a Title VI Notice to the Public, including a list of locations where the notice is
posted.
Schedule of Sub recipient Title VI Program Submissions
January 30, 2017-Subrecipients adoption of the FBC Title VI Program along with entities
attachments are stored electronically by FBC Title VI Coordinator.
January 30, 2018-Subrecipients adoption of the FBC Title VI Program along with entities
attachments are stored electronically by FBC Title VI Coordinator.
January 30, 2019-Subrecipients adoption of the FBC Title VI Program along with entities
attachments are stored electronically by FBC Title VI Coordinator.

140
This Page Intentionally Left Blank

141
APPENDIX H – COMMISSIONER'S COURT MINUTES ADOPTING
PROGRAM
(March 22, 2016 Court Approval)
Pending Approval by
Commissioners Court
March 22, 2016


Attachment E
Fort Bend CountyFY2017 and FY2018 Comprehensive Annual Financial Report

FORT BEND COUNTY, TEXAS COMPREHENSIVE ANNUAL FINANCIAL REPORT
For the Year Ended September 30, 2016
Fort Bend County Public Transportation
Established 2005 Provided 391,372 trips in 2016
Robert Ed Sturdivant, CPA County Auditor


COMPREHENSIVE ANNUAL FINANCIAL REPORT
For the Year Ended September 30, 2016
Prepared by:
County Auditor's Office
Robert Ed Sturdivant, CPA
County Auditor

FORT BEND COUNTY, TEXAS TABLE OF CONTENTS
Page(s) INTRODUCTORY SECTION
Letter of Transmittal i-v GFOA Certificate of Achievement vi List of Principal Officials vii Organizational Charts viii-ix Location Map x FINANCIAL SECTION Independent Auditors’ Report 1-3 Management’s Discussion and Analysis 5-16 Basic Financial Statements Government-Wide Financial Statements Statement of Net Position 19 Statement of Activities 20-21 Fund Financial Statements Governmental Funds Financial Statements Balance Sheet Governmental Funds 22 Reconciliation of the Balance Sheet to the Statement of Net Position 23 Statement of Revenues, Expenditures, and Changes in Fund Balances Governmental Funds
24
Reconciliation of the Statement of Revenues, Expenditures, and Changes in Fund Balances (Governmental Funds) to the Statement of Activities 25 Proprietary Funds Financial Statements Statement of Net Position 26 Statement of Revenues, Expenses, and Changes in Fund Net Position (Deficit) 27 Statement of Cash Flows 28 Fiduciary Fund Financial Statements Statement of Fiduciary Net Position 29 Component Unit Financial Statements Statement of Net Position (Deficit) 31 Statement of Revenues, Expenses, and Changes in Net Position (Deficit) 32-33 Notes to Financial Statements 34-68 Required Supplementary Information Schedule of Revenues, Expenditures, and Changes in Fund Balance Budget and Actual - General Fund - Budgetary Basis 70-79 Notes to Budgetary Required Supplementary Information 80-81 Schedule of Funding Progress - Texas County and District Retirement System 82-83 Notes to Pension Required Supplementary Information 84 Schedule of Funding Progress - Fort Bend County Employee Benefit Plan 85

FORT BEND COUNTY, TEXAS TABLE OF CONTENTS
Page(s)
Other Supplementary Information Combining and Individual Fund Statements and Schedules Non-Major Fund Descriptions 91-95 Combining Balance Sheet - Non-Major Special Revenue Funds 96-103 Combining Statement of Revenues, Expenditures, and Changes in Fund Balances - Non-Major Special Revenue Funds 104-111 Schedules of Revenues, Expenditures, and Changes in Fund Balance - Budget and Actual - Budgetary Basis Road and Bridge Special Revenue Fund 112 Drainage District Special Revenue Fund 113 Debt Service Fund 114 Combining Statement of Net Position - Internal Service Funds 115 Combining Statement of Revenues, Expenses, and Changes in Fund Net Position (Deficit) - Internal Service Funds 116 Combining Statement of Cash Flows - Internal Service Funds 117 Statement of Changes in Assets and Liabilities - Agency Funds 118 UNAUDITED STATISTICAL SECTION Net Position by Component 120-121 Changes in Net Position 122-125 Fund Balances of Governmental Funds 126-127 Changes in Fund Balances, Governmental Funds 128-129 Assessed Value of Taxable Property 130-131 Assessed and Estimated Actual Value of Real and Personal Property 133 Property Tax Rates - Direct and Overlapping Governments 134-143 Principal Property Taxpayers 145 Property Tax Levies and Collections 146-147 Ratio of Net Long-Term Debt to Assessed Value Personal Income, and Net Long-Term Debt Per Capita 148-149 Direct and Overlapping Debt 150-153 Computation of Legal Debt Margin 154-155 Demographic and Economic Statistics 156 Largest Employers 157 Capital Assets Used in the Operation of Governmental Funds Schedule by Activity 158-159 Full-Time Equivalent County Government Employees by Function 160-161 Operating Indicators by Function 162-167


i
COUNTY AUDITOR Fort Bend County, Texas
Robert Ed Sturdivant County Auditor
281-341-3769, 281-341-3744 (fax) [email protected]
March 31, 2017
To the Honorable District Judges, Members of the Commissioners Court, and Citizens of Fort Bend County (the “County”), Texas: According to Section 114.025 of the Local Government Code of the State of Texas, the County Auditor is required to submit an annual report to the Commissioners Court and District Judges of the County. This report is published to fulfill that requirement for the fiscal year ended September 30, 2016. Management assumes full responsibility for the completeness and reliability of the information contained in this report, based upon a comprehensive framework of internal control that it has established for this purpose. Because the cost of internal control should not exceed anticipated benefits, the objective is to provide reasonable, rather than absolute, assurance that the financial statements are free of any material misstatements. Whitley Penn, LLP has issued an unmodified (“clean”) opinion on Fort Bend County’s financial statements for the year ended September 30, 2016. The independent auditors' report is located at the front of the financial section of this report. Management's discussion and analysis (“MD&A”) immediately follows the independent auditors’ report and provides a narrative introduction, overview, and analysis of the basic financial statements. MD&A complements this letter of transmittal and should be read in conjunction with it. Profile of the Government Fort Bend County is located in the Houston metropolitan area of southeast Texas. It encompasses a total of 875.0 square miles (562,560 acres). The terrain varies from level to gently rolling with elevations from 46 to 127 feet above sea level, with an average elevation of 85 feet. US 59 traverses the center of the County from northeast to southwest, while US 90A crosses from east to west. State Highways (SH) 6, 36 and 99 provide important north-south routes. Neighboring counties are Austin, Brazoria, Harris, Waller and Wharton. Fort Bend County has approximately 11 square miles of surface water in rivers, creeks and small lakes. The County is drained by the Brazos and San Bernard Rivers as well as Oyster Creek. The Brazos River formed a broad alluvial valley, up to ten miles wide in places. The resulting fertile soils have been a major contributing factor to the agricultural industry in the County. The three permanently floatable

ii
waterways in Fort Bend County are the Brazos River, the San Bernard River (south of Farm to Market Road 442), and Oyster Creek (south of State Highway 6). The section of the San Bernard River south of Interstate Highway 10 is a seasonally floatable waterway, shared on the west with adjacent counties. Soils vary from the rich alluvial soils in the Brazos River Valley to sandy loam and clay on the prairies. Native trees include pecan, oak, ash and cottonwood, with some old bottomland forests remaining along waterways. The Commissioners Court, which is composed of the County Judge and four County Commissioners, is the governing body of the County. It has certain powers granted to it by the state legislature. Its duties include the approval of the budget, determination of the tax rates, approval of contracts, calling of elections, issuance of bonds, appointment of certain county officials, and the oversight responsibility of all the funds included in this report. The County provides a full range of services to the citizens of the area. Among these services are public safety (sheriff, jail facilities, constables and fire marshal), road and bridge maintenance, drainage and flood control, health and welfare (ambulance paramedics, health and sanitation, indigent care, animal control, landfill, etc.), a eleven-branch library system, county/district judicial systems, and other state-supported programs. In accordance with standards established by the Governmental Accounting Standards Board (“GASB”), the County reports all funds for which the County, as the primary government, is financially accountable. The Fort Bend County Drainage District, Fort Bend County Assistance Districts (“CADs”), Fort Bend County Toll Road Authority, Fort Bend Grand Parkway Toll Road Authority, Fort Bend County Surface Water Supply Corporation, Fort Bend County Housing Finance Corporation, and Fort Bend County Industrial Development Corporation are considered to meet the criteria of component units. The Toll Road Authorities, Surface Water Supply Corporation, Housing Finance Corporation, and Industrial Development Corporation have been included in the report as discretely presented component units. The Drainage District and the CADs have been included in the combining statements in other supplementary information, as they are reported as blended component units. Additional information about the County is available on the Fort Bend County website: http://www.fortbendcountytx.gov/. Local Economy Fort Bend County continues to experience growth in the local economy for fiscal year 2016. This is evident by the continued increases in new home sales, labor force, and employment rate. The demand for services regarding the governmental functions performed by the County increased again in 2016. The Commissioners Court remains conservative in its approach to the allocation of resources to serve the County’s needs to ensure that Fort Bend County is prepared as the local economy improves. This ongoing conservative approach will allow the County to meet the service demands of the residents in Fort Bend County. Long-Term Financial Planning and Relevant Financial Policies Budget The County adopts a one-year budget through its fully coordinated financial planning process. The budget implements strategies, both financial and operational, identified through the strategic and long-range planning process to meet existing challenges and to effectively plan for future needs. The budget is a financial plan for a fiscal year of operations that matches all planned revenues and expenditures with the services provided the citizens of Fort Bend County based on the established budget policy. Decisions are

iii
not based solely on current conditions but on the long-term welfare of the community. The budget is developed and resources allocated based on the vision, mission, and goals of the County. Long-Term Comprehensive Plan The County’s Long-Term Comprehensive Plan outlines goals to be accomplished by the County through its various departments. Many of the specific goals have been met, but since all are long-term, many are still in the future. The County’s departments are working hard to realize these goals on a continuing basis. We intend to achieve all the goals and objectives in the plan over time. These goals are as follows:
• Assure that the County is a safe and attractive place to live, work and play. • Utilize state-of-the-art equipment and methods appropriately in the provision and timely
delivery of authorized and allowed services. • Provide the necessary support for mobility and transportation needs in the County. • Promote a favorable environment for retaining and expanding existing businesses while
attracting a wide variety of new businesses to provide employment opportunities. • Support environmental concerns for preservation of natural and historic resources
balanced with sensitivity to the needs of development and recreation. • Encourage cultural development and ethnic diversity. • Develop a quality, consumer sensitive, holistic approach to health and human services
that keeps pace with the County’s growth. • Actively seek to increase and coordinate volunteerism and active citizen participation that
strives for the good of the County as a whole. • Work cooperatively with other governmental entities to complement their efforts. • Operate the County government in the most fiscally responsible manner. • Reorganize and consolidate departments under the direction of competent, trained senior
managers who report to Commissioners Court. • Regularly consider the decisions on behalf of the County with respect to the goals set
forth in the plan. Review, update, and amend the plan on an annual basis. Capital Improvement Program The County maintains a multi-year Capital Projects Plan that includes two primary elements: facilities construction or remodeling and mobility projects. Mobility projects include all road projects fully or partially funded by the County and encompass county, municipal, and state roads. Under the facilities construction plan for projects to be funded from the annual operating budget, all requested and anticipated construction projects are documented with annual costs of new personnel, furnishings, utilities, and other operating costs attached. Annually, the Commissioners Court selects projects from this list to be accomplished during the current fiscal year and determines the capital outlay associated with those projects. These capital costs are budgeted within Capital Outlay and moved to individual project budgets within the parent fund as the projects develop, and current year operating costs are budgeted in the applicable departmental budget. The Commissioners Court presented a referendum to the voters in November 2015 to construct a judicial administration building, parking garage adjacent to the justice center, medical examiner’s office, Sheriff’s Office administration building, county-wide parks improvements, parks land acquisitions, Emergency Medical Services facility improvements, fairgrounds facilities, 5th Street community center expansion, Houston Community College Sienna campus acquisition, Missouri City branch library expansion/renovation, Sheriff’s Office Katy area sub-station, and a new branch library west of Katy . The referendum was presented for a total of $93.4 million and each proposition was passed by the voters as follows: Proposition 1 (parks and community centers) – 68.99%; proposition 2 (fairgrounds buildings,

iv
parking and improvements) – 60.82%; proposition 3 (library facilities) – 69.92%; and proposition 4 (justice and public safety facilities) – 59.62%. These projects will be funded from the authorized referendum with a phased plan to meet the needs of the governmental functions. The first issuance of this authorization is planned in the summer of fiscal year 2017 as the initial projects reach construction phases. Mobility Projects involve projects accomplished in cooperation with other entities, including the Texas Department of Transportation and other entities within Fort Bend County. The County’s portion of these projects is being funded by bond authorizations approved in fiscal years 2007 and 2013. The County issued the remaining $41 million of the 2007 authorization in May 2015 and plans to issue $50 million of the 2013 authorization in fiscal year 2018. The County has issued a total of $242 million in unlimited tax road bonds since fiscal year 2001. Individual projects have been completed at a total cost of approximately $276.1 million with the aid of additional resources from other entities. The 2013 mobility bond authorization for $184.9 million was approved by the voters in November 2013 by 73.26%. The remaining projects will be completed over the next eight years. The Fort Bend County Toll Road Authority and the County began phase one of the Westpark Tollway extension in February 2016. The Authority issued $64.4 million in first lien revenue bonds for the tolled lanes of phase one and preliminary construction of phase two in fiscal year 2016. The County will fund and finance the non-tolled lanes for phase one and phase two for an estimated amount of $81.8 million from sources other than the general property tax levy. Debt Policy The purpose of Fort Bend County’s Debt Policy is to establish guidelines for the utilization of debt instruments issued by the County whether payable from County taxes or payable from certain revenues of the County. Debt instruments may include general obligation tax bonds, revenue bonds, subordinate-lien bonds, commercial paper, variable rate demand notes, variable rate auction notes, bond anticipation notes, revenue anticipation notes, tax anticipation notes and capitalized leases, as well as combinations of the foregoing. These debt instruments shall only be used to fund the lease, purchase or construction costs of capital assets; to fund infrastructure improvements and additions; to refund or defease existing debt; to fund capitalized interest; to fund costs of issuance; or to make deposits to reserve funds and other funds required or provided for in debt instruments. Debt instruments will not be used to fund operating expenses except in extreme circumstances for very short terms. This policy will apply to all debt issued by the County or any district or authority where the Commissioners Court acts as the governing body. It also may apply to those entities over which the Commissioners Court has oversight authority if the entity’s governing body approves a recommendation of the Commissioners Court to adopt this policy. This debt policy does not apply to debt issued by the Housing Finance Corporation, Industrial Development Corporation, or similar agencies operating in Fort Bend County but are responsible to another entity. The County will ensure all uses of debt instruments are in compliance with all statutory requirements, and in accordance with the guidelines contained herein, outstanding ordinances, insurance covenants, and existing agreements. Further, the County will ensure that the utilization of any debt instrument provides the most prudent and cost-effective funding possible, taking all material matters into account. Major Initiatives Mobility remains one of the top priorities as the County continues to grow and develop. With the major roadways already heavily congested, mobility has been, and continues to be, a primary concern. Continued residential and commercial expansion has increased the use of County roads. Right-of-way

v
acquisitions for future roads have required more focus on future planning to prevent project delays. Completed road projects have proven to be effective in reducing congestion and enhancing safety within the County. As noted above in “Capital Improvement Programs” on pages iii-iv, the County is continuing with its mobility project initiatives as well as the extension of the Westpark Tollway in cooperation with the Fort Bend County Toll Road Authority. Awards and Acknowledgements The Government Finance Officers Association of the United States and Canada (“GFOA”) awarded a Certificate of Achievement for Excellence in Financial Reporting to Fort Bend County, Texas, for its Comprehensive Annual Financial Report (“CAFR”) for the year ended September 30, 2015. This was the thirtieth consecutive year that the County has received this prestigious award. In order to be awarded a Certificate of Achievement, a governmental unit must publish an easily readable and efficiently organized CAFR. This report must satisfy both generally accepted accounting principles and applicable legal requirements. A Certificate of Achievement is valid for a period of one year only. We believe that our current CAFR continues to meet the Certificate of Achievement Program's requirements, and we are submitting it to GFOA to determine its eligibility for another certificate. In addition, the County also received the GFOA's Distinguished Budget Presentation Award for its annual budget document dated September 30, 2015. In order to qualify for the Distinguished Budget Presentation Award, the government's budget document must be judged proficient as a policy document, a financial plan, an operations guide, and a communications device. The preparation of this report could not be achieved without the efficient and dedicated services of the staff of the County Auditor's Office and Whitley Penn, LLP, our independent auditor. Respectfully submitted,
Robert E. Sturdivant, CPA County Auditor Fort Bend County, Texas
FORT BEND COUNTY MISSION STATEMENT
Fort Bend County strives to be the most family friendly community in Texas by providing a high quality, enriching and safe environment. Each department and elective office provides fast, friendly service to its customers and continually strives to be number one in efficiency and effectiveness. The Commissioners Court fulfills its leadership role by providing necessary resources to the offices and
departments to accomplish their duties and goals, by establishing budgets, policies and procedures to make the most efficient uses of the resources and by actively pursuing quality businesses to locate in
Fort Bend County.

vi

vii
FORT BEND COUNTY, TEXASLIST OF PRINCIPAL OFFICIALSSeptember 30, 2016
COMMISSIONERS COURT:County Judge Robert HebertCommissioner, Precinct #1 Richard MorrisonCommissioner, Precinct #2 Grady PrestageCommissioner, Precinct #3 Andy MeyersCommissioner, Precinct #4 James Patterson
OTHER COUNTY OFFICIALS:Tax Collector Patsy ShultzCounty Clerk Laura RichardDistrict Clerk Annie Rebecca ElliotCounty Treasurer Jeff CouncilCounty Auditor Ed SturdivantCounty Sheriff Troy NehlsPurchasing Agent Gilbert JalomoBudget Officer Pamela Gubbels
DISTRICT COURTS:Judge, 240th District Court Chad BridgesJudge, 268th District Court Brady ElliottJudge, 328th District Court Ronald PopeJudge, 387th District Court Brenda MullinixJudge, 400th District Court Maggie Perez-JaramilloJudge, 434th District Court James ShoemakeJudge, 505th District Court David PerwinDistrict Attorney John Healey
COUNTY COURT-AT-LAW:Judge, County Court-at-Law #1 Christopher MoralesJudge, County Court-at-Law #2 Jeff McMeansJudge, County Court-at-Law #3 Susan LoweryJudge, County Court-at-Law #4 R.H. "Sandy" BielsteinJudge, County Court-at-Law #5 Toni WallaceCounty Attorney Roy Cordes, Jr.
JUSTICES OF THE PEACE:Justice of the Peace, Precinct #1-1 Gary JanssenJustice of the Peace, Precinct #1-2 Mary WardJustice of the Peace, Precinct #2 Joel ClouserJustice of the Peace, Precinct #3 Ken CannataJustice of the Peace, Precinct #4 Justin Joyce
CONSTABLES:Constable, Precinct #1 Ramon Ramirez Constable, Precinct #2 Ruben DavisConstable, Precinct #3 Rob CookConstable, Precinct #4 Trever Nehls

viii
FORT BEND COUNTY, TEXAS ORGANIZATIONAL CHART OF ELECTED OFFICIALS

ix
FORT BEND COUNTY, TEXAS ORGANIZATIONAL CHART OF COUNTY DEPARTMENTS

x

Austin Dallas Fort Worth Houston
Houston Office3411 Richmond AvenueSuite 500Houston, Texas 77046713.621.1515 Main
whitleypenn.com
1
INDEPENDENT AUDITOR’S REPORT To the Honorable Robert E. Hebert, County Judge and Members of Commissioners Court Fort Bend County, Texas Report on the Financial Statements
We have audited the accompanying financial statements of the governmental activities, the aggregate discretely presented component units, each major fund, and the aggregate remaining fund information of Fort Bend County, Texas, (the “County”), as of and for the year ended September 30, 2016, and the related notes to the financial statements, which collectively comprise the County’s basic financial statements as listed in the table of contents.
Management’s Responsibility for the Financial Statements
Management is responsible for the preparation and fair presentation of these financial statements in accordance with accounting principles generally accepted in the United States of America; this includes the design, implementation, and maintenance of internal control relevant to the preparation and fair presentation of financial statements that are free from material misstatement, whether due to fraud or error.
Auditor’s Responsibility
Our responsibility is to express opinions on these financial statements based on our audit. We conducted our audit in accordance with auditing standards generally accepted in the United States of America and the standards applicable to financial audits contained in Government Auditing Standards, issued by the Comptroller General of the United States. Those standards require that we plan and perform the audit to obtain reasonable assurance about whether the financial statements are free from material misstatement.
An audit involves performing procedures to obtain audit evidence about the amounts and disclosures in the financial statements. The procedures selected depend on the auditor’s judgment, including the assessment of the risks of material misstatement of the financial statements, whether due to fraud or error. In making those risk assessments, the auditor considers internal control relevant to the entity’s preparation and fair presentation of the financial statements in order to design audit procedures that are appropriate in the circumstances, but not for the purpose of expressing an opinion on the effectiveness of the entity’s internal control. Accordingly, we express no such opinion. An audit also includes evaluating the appropriateness of accounting policies used and the reasonableness of significant accounting estimates made by management, as well as evaluating the overall presentation of the financial statements.
We believe that the audit evidence we have obtained is sufficient and appropriate to provide a basis for our audit opinions.

To the Honorable Robert E. Hebert, County Judge and Members of Commissioners Court Fort Bend County, Texas
2
Opinions
In our opinion, the financial statements referred to above present fairly, in all material respects, the respective financial position of the governmental activities, the aggregate discretely presented component units, each major fund, and the aggregate remaining fund information of the County, as of September 30, 2016, and the respective changes in financial position, and, where applicable, cash flows thereof for the year then ended in accordance with accounting principles generally accepted in the United States of America.
Other Matters
Required Supplementary Information
Accounting principles generally accepted in the United States of America require that the management’s discussion and analysis on pages 4 through 16 and other required supplementary information, as listed in the table of contents, on pages 70 through 85 be presented to supplement the basic financial statements. Such information, although not a part of the basic financial statements, is required by the Governmental Accounting Standards Board, who considers it to be an essential part of financial reporting for placing the basic financial statements in an appropriate operational, economic, or historical context. We have applied certain limited procedures to the required supplementary information in accordance with auditing standards generally accepted in the United States of America, which consisted of inquiries of management about the methods of preparing the information and comparing the information for consistency with management’s responses to our inquiries, the basic financial statements, and other knowledge we obtained during our audit of the basic financial statements. We do not express an opinion or provide any assurance on the information because the limited procedures do not provide us with sufficient evidence to express an opinion or provide any assurance.
Other Information
Our audit was conducted for the purpose of forming opinions on the financial statements that collectively comprise the County’s basic financial statements. The introductory section, combining and individual nonmajor fund financial statements, budgetary comparison schedules, and statistical section are presented for purposes of additional analysis and are not a required part of the basic financial statements.
The combining and individual nonmajor fund financial statements and the budgetary comparison schedules are the responsibility of management and were derived from and relate directly to the underlying accounting and other records used to prepare the basic financial statements. Such information has been subjected to the auditing procedures applied in the audit of the basic financial statements and certain additional procedures, including comparing and reconciling such information directly to the underlying accounting and other records used to prepare the basic financial statements or to the basic financial statements themselves, and other additional procedures in accordance with auditing standards generally accepted in the United States of America. In our opinion, the combining and individual nonmajor fund financial statements and the budgetary comparison schedules are fairly stated in all material respects in relation to the basic financial statements as a whole.
The introductory and statistical sections have not been subjected to the auditing procedures applied in the audit of the basic financial statements and, accordingly, we do not express an opinion or provide any assurance on them.

To the Honorable Robert E. Hebert, County Judge and Members of Commissioners Court Fort Bend County, Texas
3
Other Reporting Required by Government Auditing Standards
In accordance with Government Auditing Standards, we have also issued our report dated March 31, 2017 on our consideration of the County’s internal control over financial reporting and on our tests of its compliance with certain provisions of laws, regulations, contracts, and grant agreements and other matters. The purpose of that report is to describe the scope of our testing of internal control over financial reporting and compliance and the results of that testing, and not to provide an opinion on internal control over financial reporting or on compliance. That report is an integral part of an audit performed in accordance with Government Auditing Standards in considering the County’s internal control over financial reporting and compliance. Houston, Texas March 31, 2017

4
(This page intentionally left blank.)

5
FORT BEND COUNTY, TEXAS MANAGEMENT’S DISCUSSION AND ANALYSIS As management of Fort Bend County, Texas (the “County”), we offer readers of the County’s financial statements this narrative overview and analysis of the financial activities of the County for the fiscal year ended September 30, 2016. The following narrative includes approximate values and percentages in the wording to summarize the schedules and financials in this report that include the exact values. We encourage readers to consider the information presented here in conjunction with additional information that we have furnished in our letter of transmittal, which can be found on pages i-v of this report. Financial Highlights
The assets and deferred outflows of resources of the County exceeded its liabilities and deferred inflows of resources at the close of the most recent fiscal year by $1.2 billion (“net position”). Of this amount, there is a deficit of $147.8 million in unrestricted net position due to the continued increase in pension and other post-employment benefits (“OPEB”) liabilities.
The County’s total net position increased by $99.7 million. As of the close of the current fiscal year, the County’s governmental funds reported a
combined ending fund balance of $188.9 million, an increase of $84.5 million from the prior year.
At the end of the current fiscal year approximately $37.9 million is available for spending at the government's discretion in the General Fund (unassigned fund balance). This unassigned fund balance amounts to 14.2% of total General Fund expenditures.
The County’s total assets and deferred outflow of resources increased by $279.6 million and total liabilities and deferred inflows of resources increased by $179.9 million during the current fiscal year.
Overview of the Financial Statements This discussion and analysis is intended to serve as an introduction to the County’s basic financial statements. The County’s basic financial statements consist of three components: (1) government-wide financial statements, (2) fund financial statements, and (3) notes to the financial statements. As noted above this narrative includes approximate values and percentages in the wording to summarize the schedules and financials in this report that include the exact values. This report also contains other supplementary information intended to furnish additional detail to support the basic financial statements themselves. Government-wide financial statements The government-wide financial statements are designed to provide readers with a broad overview of the County’s finances, in a manner similar to a private-sector business. The statement of net position presents financial information on all of the County’s assets, liabilities, and deferred inflows/outflows, with the difference reported as net position. Over time, increases or decreases in net position may serve as a useful indicator of whether the financial position of the County is improving or deteriorating. The statement of activities presents information showing how the County’s net position changed during the most recent fiscal year. All changes in net position are reported as soon as the underlying event giving rise to the change occurs, regardless of the timing of related cash flows. Thus, revenues and expenses are reported in this statement for some items that will only result in cash flows in future fiscal periods (e.g., uncollected taxes and earned but unused vacation leave).

6
The government-wide financial statements present functions of the County that are principally supported by taxes (governmental activities). The governmental activities of the County include general administration, financial administration, administration of justice, construction and maintenance, health and welfare, cooperative services, public safety, parks and recreation, libraries and education, and interest on long-term debt. The government-wide financial statements include not only the County itself (known as the primary government), but also legally separate entities for which the County is financially accountable. Financial information for these component units is reported separately from the financial information presented for the primary government itself. The County’s five discretely presented component units consist of the following:
Fort Bend County Toll Road Authority Fort Bend Grand Parkway Toll Road Authority Fort Bend County Surface Water Supply Corporation Fort Bend County Housing Finance Corporation Fort Bend County Industrial Development Corporation
The government-wide financial statements can be found on pages 19 through 21 of this report. Fund financial statements A fund is a grouping of related accounts that is used to maintain control over resources that have been segregated for specific activities or objectives. The County uses fund accounting to ensure and demonstrate compliance with finance-related legal requirements. All of the funds of the County can be divided into three categories: governmental funds, proprietary funds, and fiduciary funds. Governmental funds Governmental funds are used to account for essentially the same functions reported as governmental activities in the government-wide financial statements. However, unlike the government-wide financial statements, governmental fund financial statements focus on near-term inflows and outflows of spendable resources, as well as on balances of spendable resources available at the end of the fiscal year. Such information may be useful in evaluating a government's near-term financing requirements. Because the focus of governmental funds is narrower than that of the government-wide financial statements, it is useful to compare the information presented for governmental funds with similar information presented for governmental activities in the government-wide financial statements. By doing so, readers may better understand the long-term impact of the government's near-term financing decisions. Both the governmental fund balance sheet and the governmental fund statement of revenues, expenditures, and changes in fund balances provide a reconciliation to facilitate this comparison between governmental funds and governmental activities. The County maintains 68 individual governmental funds. Information is presented separately in the governmental funds balance sheet and in the governmental funds statement of revenues, expenditures, and changes in fund balances for the major governmental funds. Data from the other governmental funds are combined into a single, aggregated presentation. Individual fund data for each of these non-major governmental funds is provided in the form of combining statements elsewhere in this comprehensive annual financial report. The basic governmental fund financial statements can be found on pages 22 through 25 of this report.

7
Proprietary funds The County uses internal service funds to report activities that provide services for the County’s other programs and activities. The Employee Benefits Fund and Other Self-Funded Insurance Fund are the County's internal service funds. Their purpose is to provide for the accumulation of money for insurance and employee benefits used in County operations. Because all of these services predominantly benefit governmental rather than business-type functions, they have been included within governmental activities in the government-wide financial statements. All internal service funds are combined into a single, aggregated presentation in the proprietary fund financial statements. Individual fund data for the internal service funds is provided in the form of combining statements elsewhere in this comprehensive annual financial report. The basic proprietary fund financial statements can be found on pages 26 through 28 of this report. Fiduciary funds Fiduciary funds are used to account for resources held for the benefit of parties outside the government. Fiduciary funds are not reflected in the government-wide financial statements because the resources of those funds are not available to support the County’s own programs. The accounting used for fiduciary funds is much like that used for proprietary funds. The basic fiduciary fund financial statement can be found on page 29 of this report. Combining component unit financial statements The County’s five discretely presented component units shown in aggregate on the face of the government-wide financial statements have individual information for each of the major discretely presented component units presented in the form of combining statements immediately following the fund financial statements of the primary government. The combining component unit financial statements can be found on pages 31 through 33 of this report. Notes to the financial statements The notes provide additional information that is essential to a full understanding of the data provided in the government-wide and fund financial statements. The notes to financial statements can be found on pages 34 through 68 of this report. Other information In addition to the basic financial statements and accompanying notes, this report also presents certain required supplementary information concerning the County’s progress in funding its obligation to provide pension benefits to its employees. The County adopts an annual appropriated budget for its General, Debt Service and certain special revenue funds. A budgetary comparison statement has been provided for the General Fund to demonstrate compliance with this budget. Required supplementary information can be found on pages 70 through 85 of this report.

8
Government-Wide Financial Analysis The following table provides a summary of the County’s net position at September 30, 2016 and 2015:
2016 2015*
Current and other assets $ 281,703,650 $ 181,965,423 Capital assets, net 1,734,291,246 1,595,376,676Total Assets 2,015,994,896 1,777,342,099
Deferred outflows of resources 64,146,670 23,194,398
Long-term liabilities 807,687,216 639,298,197Other liabilities 56,211,771 48,692,455Total Liabilities 863,898,987 687,990,652
Deferred inflows of resources 4,233,692 264,230
Net Position: Net investment in capital assets 1,359,840,462 1,236,758,942Restricted 1,852,069Unrestricted (147,831,575) (126,329,396)
Total Net Position 1,212,008,887$ 1,112,281,615$
CONDENSED SCHEDULE OF NET POSITIONSeptember 30, 2016 and 2015
Primary GovernmentGovernmental Activities
*Net Position as of October 1, 2015 was increased by $479.5 million due to the restatement of the carrying value of its capital assets. Restated prior year capital asset values have been presented in this schedule for comparative purposes. Refer to Note 17 for more detail about the restatement. As noted earlier, net position may serve over time as a useful indicator of a government's financial position. In the case of the County, assets and deferred outflows of resources exceeded liabilities and deferred inflows of resources by $1.2 billion at the close of the most recent fiscal year.
The County’s capital assets (e.g., land, buildings, vehicles, machinery and equipment, office furniture and equipment, infrastructure, and construction in progress), less any related debt used to acquire those assets that is still outstanding, total $1.4 billion. The County uses these capital assets to provide services to citizens. Consequently, these assets are not available for future spending. Although the County’s investment in its capital assets is reported net of related debt, it should be noted that the resources needed to repay this debt must be provided from other sources, since the capital assets themselves cannot be used to liquidate these liabilities. The deficit balance for unrestricted net position of $147.8 million was primarily due to the growing OPEB and net pension liabilities. The County’s net position increased $99.7 million from the prior year. This increase is primarily due to the following: increase in cash and investments of $89.7 million due to the issuance of bonds for road and facilities projects; increase in due from component units of $4.0 million due to an increase of accounts payable transactions at the end of September; increase in receivables of $6.2 million; increase in capital assets of $138.9 million due to construction of new facilities and construction and contribution of

9
new roads; an increase in OPEB liability of $35.6 million, an increase of $4.3 million due to the ambulance service overpayment liability; an increase of $96.7 million in bonds payable and related premiums; and an increase in unearned revenue of $2.9 million primarily due to reimbursement agreements with other jurisdictions to fund current debt service related to a specific project. The following table provides a summary of the County’s operations for the years ended September 30, 2016 and 2015:
2016 2015**RevenuesProgram revenues:
Charges for services $ 51,970,902 $ 47,638,105 Operating grants and contributions 38,115,985 36,841,200Capital grants and contributions 126,855,630 32,984,374
General revenues:Property taxes 270,349,769 264,741,926Sales taxes 6,958,956 5,789,362Earnings on investments 1,761,994 904,359Other 7,520,474 7,138,231
Total Revenues 503,533,710 396,037,557
ExpensesGeneral administration 61,923,654 49,953,700Financial administration 10,668,228 9,923,190Administration of justice 106,035,587 97,317,659Construction and maintenance 78,151,431 80,574,657Health and human services 43,153,506 36,721,273Cooperative services 1,215,874 1,150,926Public safety 64,704,958 63,537,941Parks and recreation 4,545,562 4,133,419Libraries and education 18,446,773 17,638,589Interest on long-term debt 14,960,865 14,108,075Total Expenses 403,806,438 375,059,429
Change in net position for the year 99,727,272 20,978,128
Net Position, Beginning - as originally presented 632,734,387 611,756,259 Change in capital assets ** 479,547,228 479,547,228 Net Position, Ending 1,212,008,887$ 1,112,281,615$
SCHEDULE OF CHANGES IN NET POSITIONFor the years ended September 30, 2016 and 2015
Primary GovernmentGovernmental Activities
**During the fiscal year ended September 30, 2016, the County restated the carrying value of its capital assets. The restatement of prior year capital assets has increased the ending net position balance but the related activities have not been presented in this schedule. See Note 17 for more information on the restatement. At the end of the current fiscal year, the County was able to report a positive balance in net position for the government as a whole. The same situation held true for the prior fiscal year.

10
Governmental activities increased the County’s net position by $99.7 million. This increase is up from last year’s increase of $21.0 million. The key elements of this change in net position are as follows:
Increase in charges for services of $4.3 million due to an increase in services from all the governmental functions.
Increase in operating grants and contributions of $1.3 million due to an increase of $3.4 million in federal and state grant payments and reimbursements offset by a decrease of $1.9 million in local funding on projects and grants.
Increase in capital grants and contributions of $93.9 million primarily due to an increase in infrastructure donated to the County.
Increase in property taxes of $5.6 million due to an increase in property valuations. Increase in sales taxes of $1.2 million due to an increase in sales from current and new businesses
located in the County Assistance Districts. Increase in earnings on investments of $0.9 million due to an increase in investable cash and
more aggressive investing. Increase in other revenue of $0.4 million primarily due to facilities reimbursements received. General administration expenses increased by $12.0 million primarily due to the following:
o Increase of $3.4 million in payroll and related costs. o Increase of $0.7 million due to TIRZ payments made in the current year. o Decrease of $0.8 million in allocation of the net operational activity of the Internal
Service Funds. o Increase of $1.1 million in pension and retirement costs. o Increase of $3.4 million in operating expenses. o Increase of $4.5 million in County Attorney fees due to a reimbursement of EMS
Ambulance Services overpayments received from Medicare and other federal providers caused by incorrect billing in prior years.
Financial administration expenses increased by $0.7 million primarily due to the following: o Increase of $0.6 million in payroll and related costs. o Decrease of $0.3 million in allocation of the net operational activity of the Internal
Service Funds. o Increase of $0.4 million in pension and retirement costs.
Administration of justice expenses increased by $8.7 million primarily due to the following: o Increase of $6.1 million in payroll and related costs. o Decrease of $2.4 million in allocation of the net operational activity of the Internal
Service Funds. o Increase of $3.4 million in pension and retirement costs. o Increase of $1.5 million in operating expenses.
Construction and maintenance expenses decreased by $2.4 million primarily due to the following: o Increase of $1.1 million in payroll and related costs. o Increase of $0.6 million in pension and retirement costs. o Decrease of $0.5 million in allocation of the net operational activity of the Internal
Service Funds. o Increase of $2.7 million in fees paid by the County Assistance Districts. o Decrease of $21.7 million in fees due to a decrease in payments made to other
jurisdictions for contributions for infrastructure. o Decrease of $1.3 million in assets donated to component unit. o Increase of $15.3 million in depreciation due to the correction of infrastructure assets
undervalued in prior years. o Increase of $1.3 million in operating expenses.
Health and human services expenses increased by $6.4 million due to: o Increase of $3.3 million in payroll and related costs. o Decrease of $0.6 million in allocation of the net operational activity of the Internal
Service Funds. o Increase of $1.1 million in pension and retirement costs.

11
o Increase of $2.6 million in operating expenses.
Public safety expenses increased by $1.2 million primarily due to the following: o Increase of $3.3 million in payroll and related costs. o Decrease of $1.4 million in allocation of the net operational activity of the Internal
Service Funds. o Increase of $1.9 million in pension and retirement. o Absence of $2.7 million in radio replacements for the Sheriff’s Office from the prior
year. Parks and recreation expenses increased by $0.4 million primarily due to the following:
o Increase of $0.2 million in payroll and related costs. o Increase of $0.1 million in pension and retirement costs. o Increase of $0.1 million in depreciation.
Libraries and education expenses increased by $0.8 million primarily due to the following: o Increase of $0.6 million in payroll and related costs. o Increase of $0.4 million in pension and retirement costs. o Decrease of $0.3 million in allocation of the net operational activity of the Internal
Service Funds. o Increase of $0.1 million in operating expenses.
Interest on long-term debt increased by $0.9 million due to an increase in total debt. Governmental revenues for fiscal year 2016 are graphically displayed as follows:
Property taxes53.7%
Other 1.5%
Charges for services10.3%
Earnings on investments0.3%
Capital grants and contributions
25.2%
Sales taxes1.4%
Operating grants and contributions
7.6%
GOVERNMENTAL REVENUES

12
Governmental functional expenses for fiscal year 2016 are graphically displayed as follows:
General administration15.3%
Financial administration2.6%
Administration of justice26.3%
Construction and maintenance
19.4%
Health and human services10.7%
Cooperative services0.3%
Public safety16.0%
Parks and recreation1.1%
Libraries and education4.6%
Interest on long-term debt3.7%
GOVERNMENTAL FUNCTIONAL EXPENSES
Financial Analysis of the County's Funds As noted earlier, fund accounting is used to demonstrate and ensure compliance with finance-related legal requirements. Governmental Funds - The focus of the County’s governmental funds is to provide information of near-term inflows, outflows, and balances of spendable resources. Such information is useful in assessing the County's financing requirements. In particular, unassigned fund balance may serve as a useful measure of the County's net resources available for spending at the end of the fiscal year. The combined governmental fund balance reached $188.9 million. Of this, $37.9 million is unassigned fund balance and available for day-to-day operations within the General Fund. $8.3 million is committed fund balance for capital projects within the General Fund. $142.5 million is restricted fund balance for General ($0.3 million), Debt Service ($1.1 million), Capital Projects ($89.5 million), and the non-major special revenue funds ($51.6 million). $0.3 million is non-spendable fund balance for the General Fund ($0.3 million) and the non-major special revenue funds ($28.0 thousand). There was an increase in the combined fund balance of $84.5 million from the prior year for the governmental funds. This overall increase was made up of an increase in the Capital Projects Funds of $77.4 million, a decrease in the Debt Service Fund of $1.7 million, an increase in Non-major Special Revenue Funds of $8.0 million, and an increase in General Fund balance of $0.8 million, which is down from the previous year’s increase of $8.4 million. This net decrease in change in fund balance for General Fund of $7.6 million is primarily due to the following factors:
Increase in General Fund property tax allocation of $22.6 million due to increased property valuations.
Increase in fees of office collections of $2.1 million due to increase in services from all the governmental functions.
Increase in intergovernmental revenues of $1.5 million primarily due to an increase in grant funding of $2.6 million, offset by a $1.0 million decrease in funding of projects from local jurisdictions.

13
Increase in earnings on investments of $0.4 million due to an increase in investable cash and more aggressive investing.
Increase in miscellaneous revenues of $1.1 million primarily due to a $1.3 million reimbursement from County Assistance District #2 and $1.4 million in facilities reimbursements received in the current year, offset by a decrease of $1.7 million in sales proceeds.
General administration expenditures increased by $10.8 million primarily due to: o Increase in payroll and related costs of $2.3 million due to added positions, cost-of-living
adjustments, and an increase in insurance funding. o Increase of $0.7 million in TIRZ payments. o Increase of $1.0 million due to costs related to flooding events. o Increase of $1.5 million in grant payments on the AirCheck Texas program. o Increase of $4.5 million due to a reimbursement of ambulance services payments.
Financial administration expenditures increased by $0.7 million primarily due to an increase in payroll and related costs due to added positons, cost-of-living adjustments, and an increase in insurance funding.
Administration of justice expenditures increase by $7.0 million primarily due: o Increase in payroll and related costs of $4.8 million due to added positions, cost-of-living
adjustments, and an increase in insurance funding. o Increase of $1.1 million for additional courts added during the current year. o Increase of $0.8 million in costs of Public Defender grant.
Health and welfare expenditures increased by $5.0 million primarily due to: o Increase in payroll and related costs of $3.2 million due to added positions, cost-of-living
adjustments, and an increase in insurance funding. o Increase in 1115 Waiver project expenses of $0.8 million. o Increase in Indigent Healthcare costs of $0.5 million.
Public safety expenditures increased by $1.2 million primarily due to: o Increase in payroll and related costs of $3.1 million due to added positions, cost-of-living
adjustments, and an increase in insurance. o Decrease of $1.6 million in non-capital project costs.
Parks and recreation expenditures increased by $0.2 million primarily due to an increase in payroll and related costs due to added positions, cost-of-living adjustments, and an increase in insurance funding.
Libraries and education increased by $0.8 million primarily due to: o Increase in payroll and related costs of $0.5 million due to added positions, cost-of-living
adjustments, and an increase in insurance funding. o Increase in maintenance costs of the Library facilities of $0.2 million.
Capital outlay increased by $8.7 million primarily due to an increase in right of way acquisitions. Transfers out increased by $0.6 million primarily due to:
o Increase in funding of the Juvenile Probation fund of $1.1 million. o Decrease in funding contribution to the Mobility Projects funds of $0.4 million.
The Debt Service Fund balance decreased by $1.7 million which is $1.7 million less than the previous year’s increase of $25 thousand primarily due to a budgeted decrease in fund balance. The Debt Service Fund balance was budgeted for the current year to decrease by $1.2 million; however, there was an actual decrease in fund balance of $1.7 million. This variance was caused primarily by an increase of $251 thousand in tax revenues collected over budgeted amount, and an increase in other financing uses of $684 thousand attributable to debt refunding, which was unbudgeted. Proprietary Funds - The County's proprietary funds consist of insurance related internal service funds. The Employee Benefits Fund had a net position balance at fiscal year-end of $4.4 million, which is an improvement of $4.6 million over the prior year’s deficit net position of $0.2 million. This increase was primarily caused by an increase in county allocations to the Employee Benefits Fund.

14
The Other Self-Funded Insurance Fund has a net position balance of $0.5 million at fiscal year-end, which is an improvement of $2.0 million over the prior year's deficit net position balance of $1.5 million. This increase was primarily to an increase in allocation for the Other Self-Funded Insurance Fund and a decrease in general administrative cost. General Fund Budgetary Highlights During the year there was a net decrease of $12.8 million in expenditure appropriations between the original and final amended budget. The main components of this decrease were based on the following: $8.2 million decrease for general administration; $1.8 million decrease for health and welfare; $0.4 million decrease in construction and maintenance; and $2.0 million decrease for public safety. General Fund revenues exceeded the amended budget by $3.1 million for the year. The reasons for this surplus are detailed as follows:
Property taxes resulted in a $1.9 million excess over budget due to increased collection rate. Fees and fines resulted in $1.2 million in excess revenues due to continued increased collections
of fines, fees and court costs. General Fund expenditures exceeded the amended budget by $3.7 million for the year. This was primarily due to a major budgetary shortfall of $4,487,147 for the County Attorney, caused by an unbudgeted reimbursement of ambulance service overpayments. There were also minor budgetary shortfalls within budget categories of some departments. These minor shortfalls were not covered by budget transfers at the end of the year due to materiality and that the overall departmental expenditure budget had a surplus. The individual governmental function’s budgetary performance for significant negative variances is detailed as follows:
In addition to the major budget shortfall for the County Attorney, general administration had one minor budget shortfall within individual budget categories for Facilities Management and Planning of $4,272. These combined shortfalls did cause an overall budget deficit within general administration. Procedures have been put in place to prevent this in the future.
Administration of justice had one budget shortfall within individual budget categories for County Court-at-Law #3 of $235,258. This shortfall did not cause an overall budget deficit within administration of justice, however, procedures have been put in place to prevent this in the future.
Health and welfare had one budget shortfall within individual budget categories for Ambulance-EMS of $419. This shortfall did not cause an overall budget deficit within health and welfare, however, procedures have been put in place to prevent this in the future.
Cooperative Services had one budget shortfall within budget categories for Extension Service of $4,579. This shortfall did not cause an overall budget deficit with cooperative services, however, procedures have been put in place to prevent this in the future.

15
Capital Assets and Debt Administration Capital Assets - At the end of fiscal year 2016, the County's governmental activities had invested $1.7 billion in a variety of capital assets and infrastructure, as reflected in the following schedule. This represents an increase of approximately $138.9 million over the previous fiscal year.
2016 2015*
Non-Depreciable Capital AssetsLand 417,808,330$ 383,866,412$ Construction in progress 48,223,387 39,528,860
Depreciable Capital Assets, NetVehicles 14,564,064 14,484,339Office furniture and equipment 5,510,222 6,290,410Machinery and equipment 11,054,002 10,443,148Buildings, facilities and improvements 262,624,295 259,833,336Infrastructure 974,506,946 880,930,171Totals 1,734,291,246$ 1,595,376,676$
Governmental Activities
*as restated. See Note 17 for more information. Construction in progress at year-end represents: Road construction ($38.4 million); facility construction and improvements ($5.2 million); library construction ($0.3 million); parks and fairgrounds improvements ($1.9 million); software initiatives ($1.3 million); transportation facility ($0.8 million); and helicopter retrofit ($0.4 million). Long-Term Debt - The County had total bonds outstanding of $410.6 million at fiscal year-end. This is an increase of $68.9 million from the prior year due to the issuance of the 2016 Unlimited Tax Road and Refunding Bonds and the 2016 Facilities Limited Tax Road and Refunding Bonds, offset by scheduled debt service payments made during fiscal year 2016. OPEB liability increased by $35.6 million based on the actuarial valuation dated September 30, 2016, to a total balance of $256.9 million. Net pension liability increased by $49.2 million based on the actuarial valuation dated December 31, 2015, to a total balance of $70.6 million
2016 2015General obligation bonds 410,560,000$ 341,640,000$ Premiums on bonds 62,444,495 34,625,782Accrued compensated absences 7,195,732 6,948,338Other post-employment benefits ("OPEB") obligation 256,897,972 221,281,360Net pension liability 70,589,017 21,429,052
Totals 807,687,216$ 625,924,532$
Governmental Activities
The County received an insured rating of Aaa from Moody’s and Standard and Poors on issuances prior to 2009. Subsequent County issuances were not insured and therefore retained the uninsured ratings. The uninsured ratings were Aa1 from Moody’s and AA+ from Fitch. The Fort Bend County Housing Finance Corporation (“FBCHFC”), a component unit of the County, issues conduit debt in the form of tax-exempt bonds for the purpose of providing below-market interest rate financing to qualified homebuyers and developers of affordable rental housing, and sponsorship of the federal low-income housing tax credit program. The tax-exempt bonds issued by FBCHFC do not constitute a debt or pledge of faith by FBCHFC, but are payable by the user pursuant to terms defined in the loan agreement underlying each issue. As of September 30, 2016, approximately $8.8 million of total bonds were outstanding.

16
The Fort Bend County Industrial Development Corporation (“FBCIDC”), a component unit of the County, issues conduit debt in the form of bonds to finance all or part of the cost of one or more projects as defined in the Development Corporation Act of 1979, Article 5190.6, Vernon’s Annotated Texas Civil Statutes, as amended. The bonds issued by the Corporation do not constitute a debt or pledge of faith by FBCIDC, but are payable by the user pursuant to terms defined in the loan agreement underlying each issue. As of September 30, 2016, approximately $129.6 million of total bonds were outstanding. Additional information on capital assets and long-term debt is available in Notes 6 and 8, respectively. Economic Factors and Next Year’s Budgets and Rates The County continues to enjoy growth in various demographic areas as the economy improves. The population of the County is estimated at 716,087 in 2016 and is expected to grow to 807,660 by 2020. The number of households has increased to 229,900 in 2016 and is expected to grow to 258,820 by 2020. Mean household income for 2016 is $187,460 and is estimated to rise to $205,547 by 2020. Income per capita is currently $59,793 and is expected to grow to $66,199 by 2020. The Commissioners Court approved a $346.3 million total budget for the 2017 fiscal year. This is a 8.77% increase over the adopted 2016 fiscal year budget. The increase in the budget is primarily due to payroll costs of $30.3 million as a result of a county-wide cost of living increase along with 82 new positions. There was also a scheduled increase in debt service of $1.9 million. These increases were offset by a decrease in capital outlay of $ 4.0 million. The overall tax rate decreased from $0.489 per $100 of assessed valuation for 2016 to $0.474 per $100 valuation for 2017. Requests for Information This financial report is designed to provide a general overview of Fort Bend County, Texas finances for all of those with an interest in the County’s finances. Questions concerning this report or requests for additional financial information should be directed to Ed Sturdivant, County Auditor, 301 Jackson, Suite 701, Richmond, TX 77469, telephone (281) 341-3760.

17
BASIC FINANCIAL STATEMENTS

18

The accompanying notes are an integral part of these financial statements.
19
FORT BEND COUNTY, TEXASSTATEMENT OF NET POSITION
September 30, 2016
Primary Government
Governmental Activities
Component Units
AssetsCash and cash equivalents 190,603,783$ 116,797,263$ Investments 22,047,766 31,103,441 Receivables: Property taxes, net 6,158,766 Sales taxes 1,179,353 Grants 11,388,599 Fines and fees 27,703,056 Other 10,276,404 4,814,638 Prepaid items 298,067 Due from component units 12,047,856Capital assets, not being depreciated 466,031,717 102,602,160 Capital assets, net of accumulated depreciation 1,268,259,529 282,213,600 Total Assets 2,015,994,896 537,531,102
Deferred Outflows of ResourcesDeferred charges-debt refunding 9,171,473 9,630,508 Deferred outflows related to pension activities 54,975,197Total Deferred Outflows of Resources 64,146,670 9,630,508
LiabilitiesAccounts payable and accrued expenses 46,207,991 3,900 Retainage payable 842,685 1,435,067 Accrued interest payable 1,605,345 1,579,856Unearned revenues 6,928,612Due to primary government 12,047,856Due to other governments 627,138Long-term Liabilities:
Long-term liabilities due within one-year 23,218,933 5,390,000 Long-term liabilities due in more than one-year 713,879,266 447,507,481 Net pension liability 70,589,017
Total Liabilities 863,898,987 467,964,160
Deferred Inflows of ResourcesDeferred inflows related to pension activities 4,233,692Total Deferred Inflows of Resources 4,233,692
Net Position (Deficit)Net investment in capital assets 1,359,840,462 (868,707) Restricted for:
Debt service 19,944,002 Unrestricted (147,831,575) 60,122,155 Total Net Position 1,212,008,887$ 79,197,450$

The accompanying notes are an integral part of these financial statements.
20
FORT BEND COUNTY, TEXASSTATEMENT OF ACTIVITIES
For the Year Ended September 30, 2016
Program Revenues
Functions/Programs ExpensesCharges for
Services
Operating Grants and
Contributions
Capital Grants and
Contributions
Primary GovernmentGovernmental Activities:
General administration 61,923,654$ 8,561,186$ 4,380,173$ 89,000$ Financial administration 10,668,228 8,143,353Administration of justice 106,035,587 8,700,278 10,823,506Construction and maintenance 78,151,431 7,121,643 390,265 125,334,640Health and human services 43,153,506 10,263,992 18,361,326Cooperative services 1,215,874 21,586Public safety 64,704,958 8,733,631 3,994,478 28,000Parks and recreation 4,545,562 158,626 98,583 1,403,990Libraries and education 18,446,773 288,193 46,068Interest on long-term debt 14,960,865
Total Primary Government 403,806,438$ 51,970,902$ 38,115,985$ 126,855,630$
Component Units:FBC Surface Water Supply Corporation $ $ $ $ FBC Toll Road Authority 23,319,629 29,480,671 95,000FB Grand Parkway Toll Road Authority 18,152,184 24,172,876FBC Housing Finance Corporation 23,516 151,953 FBC Industrial Development Corporation 71,453
Total Component Units 41,566,782$ 53,805,500$ $ 95,000$
General Revenues:Property taxes, penalties, and interestSales taxesEarnings on investmentsMiscellaneous
Total General Revenues Changes in Net Position
Net Position, Beginning of YearPrior period adjustmentsNet Position, End of Year

The accompanying notes are an integral part of these financial statements.
21
Net (Expense) Revenue and Changes in Net Position
Primary Government
Component Units
Governmental Activities
(48,893,295)$ $ (2,524,875)
(86,511,803) 54,695,117
(14,528,188) (1,194,288)
(51,948,849) (2,884,363)
(18,112,512) (14,960,865)
(186,863,921)
6,256,0426,020,692
128,437(71,453)
12,333,718
270,349,7696,958,9561,761,994 825,349 7,520,474 103,081
286,591,193 928,430 99,727,272 13,262,148
632,734,387 65,935,302 479,547,228
1,212,008,887$ 79,197,450$

The accompanying notes are an integral part of these financial statements.
22
FORT BEND COUNTY, TEXASBALANCE SHEETGOVERNMENTAL FUNDSSeptember 30, 2016
General FundDebt Service
FundCapital
Project Funds
Non-major Special Revenue
Funds
Totals Governmental
FundsAssets
Cash and cash equivalents 47,937,531$ 1,074,764$ 76,540,402 53,974,947$ 179,527,644$ Investments 22,047,766 22,047,766 Taxes receivable, net 4,913,128 331,085 2,093,906 7,338,119 Grants receivable 10,567,490 821,109 11,388,599 Fines and fees receivable 27,703,056 27,703,056 Other receivables 3,844,944 3,775,612 56,285 2,297,864 9,974,705 Due from other funds 13,100,151 112,444 13,212,595 Due from component units 12,047,856 12,047,856 Prepaid items 270,023 28,044 298,067
Total Assets 120,384,179$ 5,181,461$ 98,644,453$ 59,328,314$ 283,538,407$
Liabilities and Fund BalancesLiabilities
Accounts payable 36,764,139$ $ $ 32,780$ 36,796,919$ Accrued payroll 2,932,166 2,932,166 Retainage payable 61,832 626,833 154,020 842,685 Due to other funds 8,535,383 4,097,223 12,632,606 Due to other governments 627,138 627,138 Unearned revenues 694,246 3,763,978 2,470,388 6,928,612
Total Liabilities 41,079,521 3,763,978 9,162,216 6,754,411 60,760,126
Deferred Inflows of ResourcesUnavailable revenue-property taxes 4,913,128 331,085 914,553 6,158,766 Unavailable revenue-other 27,703,056 27,703,056 Total Deferred Inflows of Resources 32,616,184 331,085 914,553 33,861,822
Fund BalancesNonspendable 270,023 28,044 298,067 Restricted 257,923 1,086,398 89,482,237 51,643,816 142,470,374 Committed 8,278,285 8,278,285Unassigned 37,882,243 (12,510) 37,869,733
Total Fund Balances 46,688,474 1,086,398 89,482,237 51,659,350 188,916,459
Total Liabilities, Deferred Inflows of Resources, and Fund Balances 120,384,179$ 5,181,461$ 98,644,453$ 59,328,314$ 283,538,407$

The accompanying notes are an integral part of these financial statements.
23
FORT BEND COUNTY, TEXASRECONCILIATION OF THE BALANCE SHEET TO THE STATEMENT OF NET POSITIONSeptember 30, 2016
Total fund balances, governmental funds 188,916,459$
Amounts reported for governmental activities in the Statement of Net Position are differentbecause:
Capital assets used in governmental activities are not current financial resources and thereforeare not reported in the fund financial statements, but are reported in the governmentalactivities of the Statement of Net Position. 1,733,644,115
Other long-term assets are not available to pay for current period expenditures and aretherefore deferred in the funds. 33,861,822
Internal Service Funds are used by management to charge the costs of certain activities, suchas insurance, to individual funds. The assets and liabilities of the Internal Service Funds areincluded in governmental activities in the Statement of Net Position. 4,966,074
Some liabilities are not due and payable in the current period and are not included in the fundfinancial statements, but are reported in the governmental activities of the Statement of NetPosition.
Bonds payable (410,560,000) Deferred charges on debt refunding 9,171,473 Compensated absences (7,195,732) Other post-employment benefits ("OPEB") obligation (256,897,972) Premiums on issuance of debt (62,444,495)
Net pension liability and related deferred outflows and inflows do not represent assets orliabilities in the current period and are not recognized in the governmental fund financialstatements. (19,847,512)
Accrued interest is not due and payable in the current period and therefore not reported in thefunds. (1,605,345)
Net Position of Governmental Activities 1,212,008,887$

The accompanying notes are an integral part of these financial statements.
24
FORT BEND COUNTY, TEXASSTATEMENT OF REVENUES, EXPENDITURES, AND CHANGES IN FUND BALANCESGOVERNMENTAL FUNDSFor the Year Ended September 30, 2016
General FundDebt Service
FundCapital
Project Funds
Non-major Special
Revenue Funds
Totals Governmental
FundsRevenuesProperty taxes 208,164,429$ 33,485,251$ $ 29,322,721$ 270,972,401$ Sales taxes 6,958,956 6,958,956 Fines and fees 38,492,838 11,739,125 50,231,963 Intergovernmental 27,416,195 1,633,247 10,623,655 39,673,097 Earnings on investments 1,098,322 56,403 225,910 369,996 1,750,631 Miscellaneous 6,463,232 1,450,450 7,913,682 Total Revenues 281,635,016 33,541,654 1,859,157 60,464,903 377,500,730
ExpendituresCurrent:
General administration 54,297,274 145,552 1,651,152 56,093,978 Financial administration 9,056,117 7,470 9,063,587 Administration of justice 67,198,866 1,000 22,516,051 89,715,917 Construction and maintenance 2,737,885 8,904,192 31,633,515 43,275,592 Health and human services 35,534,009 2,780,618 38,314,627 Cooperative services 1,050,282 1,050,282 Public safety 53,789,913 603,676 54,393,589 Parks and recreation 3,297,608 7,200 2,730 3,307,538 Libraries and education 15,159,262 56,615 15,215,877
Capital Outlay 25,237,168 29,681,709 6,692,486 61,611,363 Debt Service:
Principal 18,480,000 18,480,000 Interest and fiscal charges 15,506,610 15,506,610 Bond issuance costs 563,745 752,493 1,316,238
Total Expenditures 267,358,384 34,550,355 39,492,146 65,944,313 407,345,198 Excess (Deficiency) of Revenues
Over (Under) Expenditures 14,276,632 (1,008,701) (37,632,989) (5,479,410) (29,844,468)
Other Financing Sources (Uses)Transfers in 17,200 13,763,470 13,780,670 Transfers (out) (13,539,414) (241,256) (13,780,670) General obligation bonds isssued 96,640,000 96,640,000 Premium on general obligation bonds issued 18,416,480 18,416,480 Refunding bonds issued 73,120,000 73,120,000 Payment to refunded bond escrow agent (89,544,194) (89,544,194) Premium on refunding bonds issued 15,739,791 15,739,791
Total Other Financing Sources (Uses) (13,522,214) (684,403) 115,056,480 13,522,214 114,372,077
Net Change in Fund Balances 754,418 (1,693,104) 77,423,491 8,042,804 84,527,609 Fund Balances, Beginning of Year 45,934,056 2,779,502 12,058,746 43,616,546 104,388,850 Fund Balances, End of Year 46,688,474$ 1,086,398$ 89,482,237$ 51,659,350$ 188,916,459$

The accompanying notes are an integral part of these financial statements.
25
FORT BEND COUNTY, TEXASRECONCILIATION OF THE STATEMENT OF REVENUES, EXPENDITURES, AND CHANGES IN
FUND BALANCES (GOVERNMENTAL FUNDS) TO THE STATEMENT OF ACTIVITIESFor the Year Ended September 30, 2016
Net change in fund balances - total governmental funds 84,527,609$
Adjustments for the Statement of Activities:
Governmental funds report capital outlays as expenditures. However, in the Statement of Activities, the costof those assets is allocated over their estimated useful lives and reported as depreciation expense. This is theamount by which current year capital outlay ($61,611,363) exceeded depreciation ($47,302,167) in the currentperiod. 14,309,196
Capital contributions of infrastructure are reported in the government-wide financial statements but not in thefund financial statements. 124,838,215
Governmental funds report the entire net sales prices (proceeds) from the sales of capital assets as revenuebecause they provide current financial resources. The change in net position differs from the change in fundbalance by the cost of capital assets sold. (270,496)
The issuance of long-term debt (e.g. bonds, leases) provides current financial resources to governmental funds,while the repayment of the principal of long-term debt consumes the of governmental funds. Neithertransaction, however, has any effect on net position. Also, governmental current financial resources fundsreport the effect of premiums, discounts, and similar items when debt is first issued, whereas these amountsare deferred and amortized in the Statement of Activities. This amount is the net effect of these differences inthe treatment of long-term debt and related items.
Debt issued:General obligation and refunding bonds (169,760,000) Premium on bonds issued (34,156,271)
Repayments:Principal repayments 18,480,000 Payment to escrow agent for refunding 89,544,194
Pension contributions made during the year, are treated as expenditures in the governmental funds but aretreated as a reduction in pension liability in government wide financial statements. 16,282,151
Some expenses reported in the statement of activities do not require the use of current financial resources andtherefore, are not reported as expenditures in the governmental funds.
Compensated absences (247,394) Accrued interest (269,297) Pension expense for the pension plan measurement year (18,063,557) Other post-employment benefit ("OPEB") obligation (35,616,612) Amortization of bond premiums 2,795,782 Amortization of deferred charge on refunding (664,502)
Revenues that do not provide current financial resources are not reported as revenues in the governmentalfunds. This adjustment reflects the net change in receivables on the accrual basis of accounting. 1,377,194
Internal service funds are used by management to charge the costs of certain activities, such as insurance andequipment replacement, to individual funds. The net revenues (expenses) are reported with governmentalactivities. 6,621,060
Change in net position of governmental activities 99,727,272$
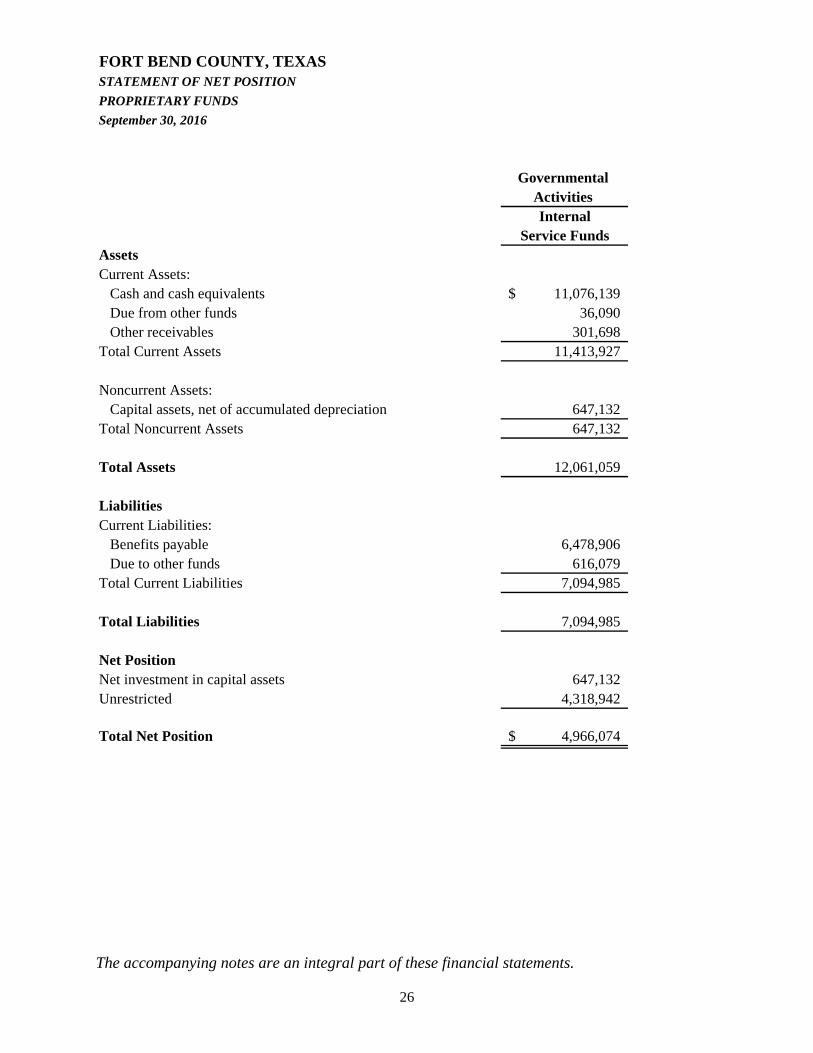
The accompanying notes are an integral part of these financial statements.
26
FORT BEND COUNTY, TEXASSTATEMENT OF NET POSITION
PROPRIETARY FUNDS
September 30, 2016
Governmental Activities
Internal Service Funds
AssetsCurrent Assets:
Cash and cash equivalents 11,076,139$ Due from other funds 36,090 Other receivables 301,698
Total Current Assets 11,413,927
Noncurrent Assets:Capital assets, net of accumulated depreciation 647,132
Total Noncurrent Assets 647,132
Total Assets 12,061,059
LiabilitiesCurrent Liabilities:
Benefits payable 6,478,906 Due to other funds 616,079
Total Current Liabilities 7,094,985
Total Liabilities 7,094,985
Net PositionNet investment in capital assets 647,132 Unrestricted 4,318,942
Total Net Position 4,966,074$

The accompanying notes are an integral part of these financial statements.
27
FORT BEND COUNTY, TEXASSTATEMENT OF REVENUES, EXPENSES, AND
CHANGES IN FUND NET POSITION (DEFICIT)
PROPRIETARY FUNDS
For the Year Ended September 30, 2016
Governmental Activities
Internal Service FundsOperating RevenuesCharges for services 46,984,196$ Total Operating Revenues 46,984,196
Operating ExpensesCurrent operations - general administration 2,369,490 Benefits provided 38,005,007 Total Operating Expenses 40,374,497
Operating Income 6,609,699
Non-Operating RevenuesEarnings on investments 11,361 Total Non-Operating Revenues 11,361
Change in Net Position (Deficit) 6,621,060
Total Net (Deficit), Beginning of Year (1,654,986)
Total Net Position, End of Year 4,966,074$

The accompanying notes are an integral part of these financial statements.
28
FORT BEND COUNTY, TEXASSTATEMENT OF CASH FLOWS
PROPRIETARY FUNDS
For the Year Ended September 30, 2016
Governmental Activities
Internal Service FundsCash Flows from Operating ActivitiesCharges for services 46,794,699$ Payment of benefits (37,972,464) Payment of general administration expenses (2,327,821) Net Cash Provided by Operating Activities 6,494,414
Cash Flows from Investing ActivitiesInterest earned on investments 11,361 Net Cash Provided by Investing Activities 11,361
Cash Flows from Capital and Related Financing Activities:Purchase of capital assets (76,145) Net Cash (Used) by Capital and Related Financing Activities (76,145)
Net Increase in Cash and Cash Equivalents 6,429,630
Cash and Cash Equivalents, Beginning of Year 4,646,509
Cash and Cash Equivalents, End of Year 11,076,139$
Reconciliation of Operating Income to Net CashProvided by Operating ActivitiesOperating Income 6,609,699$ Adjustments to operations:
Depreciation 38,491 Change in assets and liabilities:
Decrease in prepaid expenses 3,178 Decrease in other receivables 40,851 Decrease in due from other funds 74,198 (Decrease) in due to other funds (304,546) Increase in benefits payable 32,543 Total Adjustments (115,285)
Net Cash Provided by Operating Activities 6,494,414$

The accompanying notes are an integral part of these financial statements.
29
FORT BEND COUNTY, TEXASSTATEMENT OF FIDUCIARY NET POSITIONSeptember 30, 2016
AgencyFunds
AssetsCash and cash equivalents 40,588,013$ Investments 1,002,295Miscellaneous receivables 1,008,260
Total Assets 42,598,568$
LiabilitiesDue to other governments 42,598,568$
Total Liabilities 42,598,568$

30

The accompanying notes are an integral part of these financial statements.
31
FORT BEND COUNTY, TEXASSTATEMENT OF NET POSITION (DEFICIT)
COMPONENT UNITS
September 30, 2016
Fort Bend County Surface
Water Supply Corporation
Fort Bend County Toll
Road Authority
Fort Bend Grand
Parkway Toll Road
Authority
Fort Bend County Housing Finance
Corporation
Fort Bend County
Industrial Development Corporation Totals
Assets
Cash and cash equivalents 7,795$ 94,093,647$ 22,428,406$ 107,519$ 159,896$ 116,797,263$
Investments 30,203,441 900,000 31,103,441
Miscellaneous receivables 2,614,069 2,200,543 26 4,814,638
Capital assets, not being depreciated 90,209,977 12,392,183 102,602,160
Capital assets, net of
accumulated depreciation 149,134,863 133,078,737 282,213,600
Total Assets 7,795 366,255,997 170,099,869 1,007,545 159,896 537,531,102
Deferred Outflows of Resources
Deferred charges-debt refunding 9,630,508 9,630,508
Total Deferred Outflows of Resources 9,630,508 9,630,508
Liabilities
Accounts payable and accrued expenses 3,900 3,900
Retainage payable 1,242,883 192,184 1,435,067
Due to primary government 7,239,603 4,803,922 4,331 12,047,856
Accrued interest payable 981,506 598,350 1,579,856
Long-term liabilities:
Due within one year 5,390,000 5,390,000
Due in more than one year 275,879,148 171,628,333 447,507,481
Total Liabilities 290,733,140 177,222,789 3,900 4,331 467,964,160
Net Position (Deficit)
Net investment in capital assets 19,805,959 (20,674,666) (868,707)
Restricted for:
Debt service 19,944,002 19,944,002
Unrestricted 7,795 45,403,404 13,551,746 1,003,645 155,565 60,122,155 Total Net Position (Deficit) 7,795$ 85,153,365$ (7,122,920)$ 1,003,645$ 155,565$ 79,197,450$

The accompanying notes are an integral part of these financial statements.
32
FORT BEND COUNTY, TEXASSTATEMENT OF REVENUES, EXPENSES AND CHANGES IN NET POSITION (DEFICIT)
COMPONENT UNITS
For the Year Ended September 30, 2016
Functions/Programs ExpensesCharges for
Services
Capital Grants and
Contributions
Fort Bend County Surface Water Supply CorporationHealth and welfare $ $ $ Total Fort Bend County Surface Water Supply Corporation
Fort Bend County Toll Road AuthorityToll road operations 12,498,371 29,480,671 95,000Interest on long-term debt 10,821,258Total Fort Bend County Toll Road Authority 23,319,629 29,480,671 95,000
Fort Bend Grand Parkway Toll Road AuthorityToll road operations 11,519,465 24,172,876Interest on long-term debt 6,632,719Total Fort Bend Grand Parkway Toll Road Authority 18,152,184 24,172,876
Fort Bend County Housing Finance CorporationGeneral administration 23,516 151,953 Total Fort Bend County Housing Finance Corporation 23,516 151,953
Fort Bend County Industrial Development CorporationGeneral administration 71,453 Total Fort Bend County Industrial Development Corporation 71,453
Totals Component Units 41,566,782$ 53,805,500$ 95,000$
General Revenues:Earnings on investmentsMiscellaneous
Total General Revenues Changes in Net Position (Deficit)
Net Position (Deficit), Beginning of YearNet Position (Deficit), End of Year
Program Revenues

The accompanying notes are an integral part of these financial statements.
33
Net (Expense) Revenue and Changes in Net Position
Fort Bend County Surface Water Supply Corporation
Fort Bend County Toll
Road Authority
Fort Bend Grand Parkway Toll
Road Authority
Fort Bend County Housing
Finance Corporation
Fort Bend County
Industrial Development Corporation Totals
$ $ $ $ $ $
17,077,300 17,077,300 (10,821,258) (10,821,258)
6,256,042 6,256,042
12,653,411 12,653,411 (6,632,719) (6,632,719)
6,020,692 6,020,692
128,437 128,437 128,437 128,437
(71,453) (71,453) (71,453) (71,453)
6,256,042 6,020,692 128,437 (71,453) 12,333,718
41 694,415 113,113 16,781 999 825,349 3,759 99,322 103,081
41 698,174 212,435 16,781 999 928,430 41 6,954,216 6,233,127 145,218 (70,454) 13,262,148
7,754 78,199,149 (13,356,047) 858,427 226,019 65,935,302 7,795$ 85,153,365$ (7,122,920)$ 1,003,645$ 155,565$ 79,197,450$

34
FORT BEND COUNTY, TEXAS NOTES TO FINANCIAL STATEMENTS NOTE 1 – SUMMARY OF SIGNIFICANT ACCOUNTING POLICIES A. Financial Reporting Entity Fort Bend County, Texas, (the "County") is a public corporation and a political subdivision of the State of Texas. The Commissioners Court, composed of four County Commissioners and the County Judge, all of whom are elected officials, govern the County. The County is considered an independent entity for financial reporting purposes and is considered a primary government. As required by generally accepted accounting principles, these financial statements have been prepared based on considerations regarding the potential for inclusion of other entities, organizations, or functions as part of the County's financial reporting entity. Considerations regarding the potential for inclusion of other entities, organizations, or functions in the County's financial reporting entity are based on criteria prescribed by generally accepted accounting principles. These same criteria are evaluated in considering whether the County is a part of any other governmental or other type of reporting entity. The overriding elements associated with prescribed criteria considered in determining that the County's financial reporting entity status is that of a primary government are that it has a separately elected governing body; it is legally separate; and it is fiscally independent of other state and local governments. Additionally, prescribed criteria under generally accepted accounting principles include considerations pertaining to organizations for which the primary government is financially accountable; and considerations pertaining to other organizations for which the nature and significance of their relationship with the primary government are such that exclusion would cause the reporting entity's financial statements to be misleading or incomplete. Blended Component Units Blended component units, although legally separate entities, are, in substance, part of the County's operations and so data of these units are combined with data of the County. Each of the County's blended component units has a September 30 year-end. The following component units have been identified and are presented in a blended format in the government-wide financial statements:
Fort Bend County Drainage District (“District”) Established under Section 59 of Article XVI of the Constitution of Texas, the District includes all of the property within Fort Bend County. The District was created for the purpose of reclamation and drainage of its lands. The District’s governing body is the same as the County’s and there is a financial benefit relationship between the County and the District. Financial information for the District is available at the Fort Bend County Auditor’s Office located at 301 Jackson, Suite 701, Richmond, Texas 77469.
Fort Bend Flood Control Water Supply Corporation (“FBFCWSC”) The FBFCWSC is a non-profit corporation organized for the benefit of the County to provide for the acquisition, construction and financing of flood control and drainage projects for the County. Upon completion, these projects are maintained by the Fort Bend County Drainage District. Commissioners Court appoints the Board of Directors and approves all budgets and expenditures. The Corporation provides services entirely to the County and the debt service of the Corporation is repaid entirely by the County. FBFCWSC was dissolved on October 28, 2015 and was shut down during the 2016 fiscal year. Financial information for the FBFCWSC is available at the Fort Bend County Auditor’s Office located at 301 Jackson, Suite 701, Richmond, Texas 77469.

35
Fort Bend County Assistance Districts (“CADs”) The CADs are special districts authorized for creation by counties under chapter 387 of the Texas Local Government Code. CADs have the power to impose a sales and use tax for the following purposes: (1) the construction or maintenance of roads and highways; (2) provision of law enforcement and detention services; (3) maintenance or improvement of libraries, museums, parks or other recreational facilities; (4) provision of services that benefit the public health and welfare, including fire-fighting services; and (5) promotion of economic development and tourism. Currently there are five CADs (#1, #2, #4, #5, and #6) within Fort Bend County. CADs are political subdivisions of the state and each CAD has its own governing body, which is a five member Board of Directors. Each CADs’ governing body is the same as the County’s and there is a financial benefit relationship between the County and the CAD. Financial information is available at the Fort Bend County Auditor’s Office located at 301 Jackson, Suite 701, Richmond, Texas 77469.
Discretely Presented Component Units Discretely presented component units are presented in a separate column in the government-wide financial statements to emphasize that they are legally separate from the County. Each of the County's discretely presented component units has a September 30 year-end. The following component units have been identified and are presented in a discrete format in the County's government-wide financial statements:
Fort Bend County Toll Road Authority (“FBCTRA”) The FBCTRA is organized under the Texas Transportation Corporation Act and the Texas Non-Profit Corporation Act. It was created to assist in the planning, designing, financing and building of county roads and highways. In particular, the FBCTRA is to assist in the building and operation of the Fort Bend Toll Road system that will extend from Sam Houston Parkway in Harris County to the Brazos River and the City of Fulshear in Fort Bend County. The County has financial accountability because it appoints a voting majority of the Board and the County can impose its will. Financial information is available at the Fort Bend County Auditor’s Office located at 301 Jackson, Suite 701, Richmond, Texas 77469. Fort Bend Grand Parkway Toll Road Authority (“FBGPTRA”) The FBGPTRA is organized under the Texas Transportation Corporation Act and the Texas Non-Profit Corporation Act. It was created to assist in the planning, designing, financing and building of county roads and highways. In particular, the FBGPTRA is to assist in the building and operation of the Fort Bend Grand Parkway Toll Road that will extend from the Westpark Tollway along State Highway 99 to US 59. The County has financial accountability because it appoints a voting majority of the Board and the County can impose its will. Financial information is available at the Fort Bend County Auditor’s Office located at 301 Jackson, Suite 701, Richmond, Texas 77469. Fort Bend County Surface Water Supply Corporation (“FBCSWSC”) The FBCSWSC was established for the purpose of conducting a feasibility study of a surface water facility in the area. Currently, its revenue sources are primarily from special districts, private corporations, and other entities interested in the study. The County has financial accountability because it appoints a voting majority of the Board and the County can impose its will. Financial information is available at the Fort Bend County Auditor’s Office located at 301 Jackson, Suite 701, Richmond, Texas 77469. Fort Bend County Housing Finance Corporation (“FBCHFC”) The FBCHFC was established under the Texas Housing Finance Corporation Act. It provides down payment assistance programs for individuals meeting certain income guidelines and serves as a conduit for activity related to bond issues for affordable housing in Fort Bend County. The tax-exempt bonds issued by the FBCHFC do not constitute a debt or a pledge of faith by the FBCHFC, but are payable by the user pursuant to terms defined in the loan agreements underlying each issue. The County has financial accountability because it appoints a voting majority of the Board and the

36
County can impose its will. Financial information is available by contacting the Fort Bend County Housing Finance Corporation, Thomas Shirley – President, 2214 Avenue H, Rosenberg, Texas 77471. Fort Bend County Industrial Development Corporation (“FBCIDC”) The FBCIDC was established under the Development Corporation Act of 1979 (“Act”). It facilitates the issuance of obligations in the form of bonds to finance all or part of the cost of one or more projects as defined by the Act. The bonds issued by the FBCIDC do not constitute a debt or a pledge of faith by the FBCIDC, but are payable by the user pursuant to terms defined in the loan agreements underlying each issue. The County has financial accountability because it appoints a voting majority of the Board and the County can impose its will. Financial information is available at the Fort Bend County Auditor’s Office located at 301 Jackson, Suite 701, Richmond, Texas 77469.
B. Implementation of New Standards During the current fiscal year, the County implemented the following new standards:
GASB Statement No. 72, Fair Value Measurement and Application, addresses accounting and financial reporting issues related to fair value measurements. The definition of fair value is the price that would be received to sell an asset or paid to transfer a liability in an orderly transaction between market participants at the measurement date. This Statement provides guidance for determining a fair value measurement for financial reporting purposes. This Statement also provides guidance for applying fair value to certain investments and disclosures related to all fair value measurements.
GASB Statement No. 73, Accounting and Financial Reporting for Pensions and Related Assets That Are Not within the Scope of GASB Statement 68, and Amendments to Certain Provisions of GASB Statements 67 and 68, clarifies the application of certain provisions of Statement No. 68 with regard to information that is required to be presented as notes to the 10-year schedules of required supplementary information about investment-related factors that significantly affect trends in the amounts reported.
GASB Statement No. 79, Certain External Investment Pools and Pool Participants, address accounting and financial reporting for certain external investment pools and pool participants. Specifically, it establishes criteria for an external investment pool to qualify for making the election to measure all of its investments at amortized cost for financial reporting purposes. This Statement establishes additional note disclosure requirements for qualifying external investment pools that measure all of their investment at amortized cost for financial reporting purposes and for governments that participate in those pools. Those disclosures include information about any limitations or restrictions on participant withdrawals.
C. Government-wide and Fund Accounting The basic financial statements include both government-wide (based on the County as a whole) and fund financial statements. While the previous reporting model emphasized fund types (the total of all funds of a particular type), the GASB 34 reporting model focuses on either the County as a whole or on major individual funds (within the fund financial statements). Typically, both the government-wide and fund financial statements (within the basic financial statements) categorize primary activities as either governmental or business-type. All primary activities of the County are considered to be governmental activities; therefore no business-type activities are presented within the basic financial statements. In the government-wide Statement of Net Position, governmental activities are presented on a full accrual, economic resource basis, which incorporates long-term assets and receivables, as well as long-term debt and obligations.

37
The government-wide Statement of Activities reflects both the gross and net cost per functional category (general administration, financial administration, public safety, etc.), which are otherwise being supported by general government revenues (property taxes, earnings on investments, etc.). The Statement of Activities reduces gross expenses (including depreciation) by related program revenues. The program revenues must be directly associated with the function (general administration, financial administration, public safety, etc.). The governmental funds major fund statements in the fund financial statements are presented on a current financial resource and modified accrual basis of accounting. This is the manner in which these funds are normally budgeted. Since the governmental fund statements are presented on a different measurement focus and basis of accounting than the government-wide statements’ governmental column, a reconciliation is presented which briefly explains the adjustments necessary to reconcile fund-based financial statements with the governmental column of the government-wide presentation. The County’s fiduciary funds are presented in the fund financial statements by type. Since, by definition, these assets are being held for the benefit of a third party and cannot be used to address activities or obligations of the government, these funds are not incorporated into the government-wide statements. Since the County only reports agency funds, a statement of changes in fiduciary net position is not presented. All assets reported in agency funds should be offset by a corresponding liability, resulting in zero net position. In the fund financial statements, the accounts of the County are organized on the basis of funds, each of which is considered a separate accounting entity. The operations of each fund are accounted for with a separate set of self-balancing accounts that comprise its assets, liabilities, deferred inflows of resources, fund equity, revenues, and expenditures or expenses, as appropriate. Following is a description of the various funds: The County reports the following major governmental funds:
General Fund The General Fund is the County’s primary operating fund. It is used to account for all financial transactions not properly includable in other funds. The principal source of revenue is local property taxes. Expenditures include all costs associated with the daily operations of the County.
Debt Service Fund This fund is used to account for the debt service transactions relating to the following bond issues: Unlimited Tax Road Bonds Series 2007, Fort Bend Flood Control Water Supply Corporation Refunding Bonds Series 2010, Facilities Limited Tax Bonds Series 2007, Unlimited Tax Road Bonds Series 2009, Justice Center Limited Tax Bonds Series 2009, Unlimited Tax Road Refunding Bonds Series 2009, Unlimited Tax Road Bonds Series 2012, Unlimited Tax Road Refunding Bonds Series 2014, Unlimited Tax Road and Refunding Bonds Series 2015, Facilities Refunding Bonds Series 2015 , Unlimited Tax Road and Refunding Bonds Series 2016, and Facilities and Justice Center Refunding Bonds Series 2016. Revenues in this fund are comprised of property taxes levied against property located in the County. These funds are restricted for the payment of debt service obligations. Capital Projects Funds These funds are used to account for bond sale proceeds and other revenues, which are being used to finance the construction and/or expansion of numerous roads in the County or the construction or improvement of County facilities. These funds are restricted pursuant to bond covenant.

38
The County also reports the following fund types: Internal Service Funds These funds are used to account for the County’s employee benefits for employees, retirees, and their dependents, including medical and dental; and self-insurance programs, including workers’ compensation, personal injury and property damage. The principal source of revenue is contributions paid by individual funds. Agency Funds These funds are custodial in nature and do not report operating results. They are used to account for assets held by the County as an agent for various local governments and individuals.
D. Measurement Focus, Basis of Accounting and Financial Statement Presentation The accounting and financial reporting treatment applied to a fund is determined by its measurement focus. All governmental fund-types are accounted for using a current financial resources measurement focus. With this measurement focus, only current assets and current liabilities generally are included on the balance sheet. Operating statements of these funds present increases (i.e., revenues and other financing resources) and decreases (i.e., expenditures and other financing uses) in fund balance. The government-wide statements of net position and statements of activities and all proprietary funds are accounted for on a flow of economic resources measurement focus. With this measurement focus, all assets and all liabilities associated with the operations of these activities are included on the balance sheet. Proprietary fund equity consists of net position. Proprietary fund-type operating statements present increases (i.e., revenues) and decreases (i.e., expenses) in total net position. The accounts of the Governmental Fund Types (the General Fund, Special Revenue Funds, Debt Service Fund, and Capital Projects Funds) and certain component units are maintained, and the financial statements have been prepared, on the modified accrual basis of accounting. Under this basis of accounting, revenues are recognized when they become susceptible to accrual (i.e., both measurable and available). Available means collectible within the current year or soon enough thereafter to pay liabilities of the current year. For this purpose, the County considers revenues to be available if they are collected within 60 days of the end of the current fiscal period. Substantially all revenues, except property taxes, are considered to be susceptible to accrual. Expenditures are generally recognized under the modified accrual basis of accounting when the related fund liability is incurred. Principal and interest on long-term debt are recognized as expenditures when due. As a general rule the effect of interfund activity has been eliminated from the government-wide financial statements. An exception to this general rule is that interfund services provided and used within the County are not eliminated in the process of consolidation. Elimination of these services would distort the direct costs and program revenues reported for the various functions concerned. Amounts reported as program revenues include: (1) charges to customers for goods, services, or privileges provided, (2) operating grants and contributions, and (3) capital grants and contributions, including special assessments. Revenues that are generated internally are reported as general revenues, including property taxes. Proprietary funds present operating revenues and expenses as well as non-operating revenues and expenses. Operating revenues and expenses are generally derived from providing services and producing goods as part of ongoing operations. The principal operating revenues of the County’s internal service funds are charges to users for services. The operating expenses for the County’s internal service funds include administrative expenses and all costs associated with providing services. All other revenue and expenses are reported as non-operating revenue.

39
The financial statements of the proprietary fund types and certain component units are presented on the accrual basis of accounting. Under this method of accounting, revenues are recognized in the accounting period in which they are earned, and expenses in the accounting period in which they are incurred. E. Encumbrances Encumbrance accounting, under which purchase orders, contracts, and other commitments for the expenditure of monies are recorded in order to reserve that portion of the applicable appropriation, is used as an extension of formal budgetary control. Significant encumbrances outstanding at year-end are represented in aggregate within the respective fund balance category (restricted or committed) on the face of the balance sheet. Additional information regarding significant encumbrances is included in Note 13 on page 66 in the section entitled “Committed to”. Unencumbered appropriations lapse at the end of the fiscal year. F. Cash and Cash Equivalents The County’s cash and cash equivalents are considered to be cash on hand, demand deposits, balances in privately managed local government investment pools and short-term investments with original maturities of three months or less from the date of acquisition. The County’s local government investment pools are recorded at amortized cost, which approximates fair value, as permitted by GASB Statement No. 79, Certain Investment Pools and Pool Participants. For the purpose of the statement of cash flows, the proprietary fund types consider temporary investments with maturities of three months or less when purchased to be cash equivalents. G. Investments The County's investments, when held, are comprised primarily of U.S. Government Securities. The investments in U.S. Government Securities are generally held to maturity. The County reports investments at fair value. The County categorizes fair value measurements of its investments based on the hierarchy established by generally accepted accounting principles. The fair value hierarchy, which has three levels, is based on the valuation inputs used to measure an asset’s fair value: Level 1 inputs are quoted prices in active markets for identical assets; Level 2 inputs are significant other observable inputs; and Level 3 inputs are significant unobservable inputs. H. Receivables All receivables are reported at their gross value and, where appropriate, are reduced by the estimated portion that is expected to be uncollectible. I. Prepaid Items Certain payments to vendors reflect costs applicable to future accounting periods and are recorded as prepaid items in both government-wide and fund financial statements. The cost of prepaid items is recorded as expenditures/expenses when consumed rather than when purchased. J. Capital Assets Capital assets used in governmental and proprietary fund types of the government are recorded as expenditures of the General, Special Revenue, Capital Projects, and Internal Service Funds and as capital assets in the government-wide financial statements to the extent the County’s capitalization threshold (currently $10,000 on new assets) is met. Betterments to existing assets are capitalized if they meet the $10,000 threshold. Depreciation is recorded on capital assets on a government-wide basis. Major outlays for capital assets and improvements are capitalized as projects are constructed and subsequently

40
depreciated over their estimated useful lives on a straight-line basis at the government-wide levels. All capital assets are valued at historical cost or estimated historical cost if actual cost was not available. Donated capital assets are valued at their estimated fair value on the date of donation. The costs of normal maintenance and repairs that do not add to the value of an asset or materially extend assets' lives are charged to operations when incurred. Expenditures that materially change capacities or extend useful lives are capitalized. Upon sale or retirement of capital assets, the cost and related accumulated depreciation, if applicable, are eliminated from the respective accounts and any resulting gain or loss is included in the results of operations. The County applies a half-year convention for depreciation on all capital assets. Therefore, one half of a year of depreciation is charged to operations the first and last year that an asset is in service. Depreciation has been provided for plant and equipment using the straight-line method over the estimated useful life for the type of assets as follows:
EstimatedAsset Description Useful LifeVehicles 5 to 7 yearsOffice furniture and equipment 5 to 7 yearsMachinery and equipment 7 to 15 yearsBuildings, facilities and improvements 5 to 39 yearsInfrastructure 20 to 45 years
K. Deferred Outflows/Inflows of Resources In addition to assets, the statement of financial position will sometimes report a separate section for deferred outflows of resources. This separate financial statement element, deferred outflows of resources, represents a consumption of net position that applies to a future period(s) and so will not be recognized as an outflow of resources (expense/expenditure) until then. The County has two items that qualify for reporting in this category:
Deferred charges on refunding - A deferred charge on refunding results from the difference in the carrying value of refunded debt and its reacquisition price. This amount is deferred and amortized over the shorter of the life of the refunded or refunding debt.
Deferred outflows of resources for pension items - This deferred outflow results from pension plan contributions made after the measurement date of the net pension liability and the results of differences between expected and actual actuarial experiences. The deferred outflows of resources related to pensions resulting from County contributions subsequent to the measurement date will be recognized as a reduction of the net pension liability in the next fiscal year. The other pension related deferred outflows will be amortized over the expected remaining service lives of all employees (active and inactive employees) that are provided with pensions through the pension plan which is currently 6 years for the County plan.
In addition to liabilities, the statement of financial position will sometimes report a separate section for deferred inflows of resources. This separate financial statement element, deferred inflows of resources, represents an acquisition of net position that applies to a future period(s) and so will not be recognized as an inflow of resources (revenue) until that time. The County has only two items that qualifies for reporting in this category:
Deferred inflows of resources for unavailable revenues - Reported only in the governmental funds balance sheet, unavailable revenues from property taxes arise under the modified accrual basis of accounting. These amounts are deferred and recognized as an inflow of resources in the period that the amounts become available.

41
Deferred inflows of resources for pension – Reported by the County in the government-wide financial statement of net position, these deferred inflows result primarily from differences between projected and actual earnings on pension plan investments. These amounts will be amortized over a closed five year period.
L. Due To and Due From Other Funds During the course of operations, transactions occur between individual funds for specified purposes, such as lending/borrowing arrangements or amounts. Therefore, a receivable and payable are recorded in the proper funds. These receivables and payables are classified as "due from other funds" or "due to other funds" (or "due from component unit/primary government” or "due to component unit/primary government" if the transactions are between the primary government and a component unit).
M. Accrued Compensated Absences All full-time employees accumulate vacation benefits in varying annual number of days up to a maximum of twenty days a year. Accumulated vacation exceeding twenty days lapses on December 31 of each year. Compensatory time exceeding 80 hours is paid to nonexempt employees. In the event of termination, an employee is paid for all maximum allowable accumulation of vacation and compensatory time. Sick leave benefits are earned by all full-time employees at a rate of eight days per year and may be accumulated without limit. Upon retirement, an employee may be eligible to receive a payment for up to one-half of their unused sick leave balance, not to exceed a maximum of $5,000. In the event of any termination other than retirement, an employee is not paid for any unused sick leave. A liability for accrued compensated absences is recorded in the government-wide financial statements. N. Interfund Transfers The County maintains numerous special revenue and capital project funds to account separately for monies that have been set aside for particular purposes. Often, these monies are initially budgeted in the General Fund during the annual budget process and are then transferred to various funds during the course of the fiscal year. In addition, when these projects are complete, these same funds often transfer residual monies back to the General Fund or some other fund, as determined by where the monies should be returned. These interfund transfers are classified as "transfers in" and "transfers out" within the primary government. O. Net Position and Fund Balance Net Position Classifications Net position in government-wide financial statements are classified in three categories: 1) Net investment in capital assets, 2) Restricted net position, and 3) Unrestricted net position. Net position is shown as restricted if constraints placed on use are either (1) externally imposed by creditors, grantors, contributors, or laws or regulations of other governments or (2) imposed by law through constitutional provisions or enabling legislation. It is the County’s policy to consider restricted – net position to have been depleted before unrestricted – net position is applied. Fund Balance Classifications As prescribed by GASB Statement No. 54, governmental funds report fund balance in classifications based primarily on the extent to which the County is bound to honor constraints on the specific purposes

42
for which amounts in the funds can be spent. Fund balances are required to be reported according to the following classifications: Nonspendable Fund Balance – includes amounts that are (a) not in spendable form, or (b) legally or contractually required to be maintained intact. The “not in spendable form” criterion includes items that are not expected to be converted to cash, for example: inventories, prepaid amounts, and long-term notes receivable. Restricted Fund Balance - includes amounts that can be spent only for the specific purposes stipulated by external resource providers, constitutionally or through enabling legislation. Restrictions may effectively be changed or lifted only with the consent of resource providers. When restricted and unrestricted fund balance exists for the same purpose, restricted fund balance will be used first. Committed Fund Balance – includes amounts that can only be used for the specific purposes determined by the County’s Board. The commitment of fund balance requires the highest level action of the Board to constitute a binding constraint on fund balance. This can only be achieved by majority vote of approval of the County’s Board to transfer an amount from fund balance for a specific purpose. This order requires the County Auditor to establish a special project account to manage the use of the committed fund balance over the period for which the purpose is achieved or served. These allocations are primarily made for capital purposes that extend beyond the fiscal year of the County. Commitments may only be changed or lifted by majority vote of approval of the County’s Board. The proposed action of the Board with regard to creation or modification of a commitment must also be clearly posted on the Board’s agenda in advance of taking any action. Assigned Fund Balance – comprises amounts intended to be used by the County for specific purposes that are neither restricted nor committed. Intent is expressed by (a) the County’s Board or (b) a body (for example: a budget or finance committee) or official to which the County’s Board has delegated the authority to assign amounts to be used for specific purposes. As of the date of this report, the County’s Board has not authorized any other official to have the authority to assign fund balance; therefore the assignment of fund balance must be made by approval of the Board. Unassigned Fund Balance – is the residual classification for the General Fund and includes all amounts not contained in the other classifications. Unassigned amounts are technically available for any purpose. The General Fund is the only fund that reports a positive unassigned fund balance. When various unrestricted fund balances are available for the same purpose, the County will use committed fund balance first, assigned fund balance next and unassigned fund balance last. GASB 54 requires disclosure of any formally adopted minimum fund balance policies. The County’s policy is to budget to maintain a minimum fund balance of 15% of the County’s General Fund annual operating expenditures. If the actual fund balance drops below 15%, it shall be budgeted for recovery the following year. This policy is reviewed annually. P. Reclassifications Certain reclassifications to prior year balances have been made to conform to current year presentation. Such reclassifications have had no effect on the excess of revenues over expenditures. Q. Estimates The preparation of financial statements in conformity with generally accepted accounting principles requires management to make estimates and assumptions that affect the reported amounts of assets and liabilities and disclosures of contingent assets and liabilities at the date of the financial statements and the reported amounts of revenues and expenditures/expenses during the reporting period. Actual amounts could differ from those estimates.

43
R. Pensions For purposes of measuring the net pension liability, deferred outflows of resources and deferred inflows of resources related to pensions, and pension expense, information about the fiduciary net position of the County’s defined benefit pension plan (the “Plan”) administered by the statewide Texas County and District Retirement System (“TCDRS”) and additions to/deductions from the Plan’s fiduciary net position have been determined on the same basis as they are reported by the Plan. For this purpose, benefit payments (including refunds of employee contributions) are recognized when due and payable in accordance with the benefit terms. Investments are reported at fair value. S. Date of Managements’ Review In preparing the financial statements, the County has evaluated events and transactions for potential recognition or disclosure through March 31, 2017, the date that the financial statements were available to be issued. NOTE 2 – DEPOSITS (CASH) AND INVESTMENTS A. Authorization for Deposits and Investments The Texas Public Funds Investment Act (“PFIA”), as prescribed in Chapter 2256 of the Texas Government Code, regulates deposits and investment transactions of the County. In accordance with applicable statutes, the County has a depository contract with an area bank (depository) providing for interest rates to be earned on deposited funds and for banking charges the County incurs for banking services received. The County may place funds with the depository in interest and non-interest bearing accounts. State law provides that collateral pledged as security for bank deposits must have a market value of not less than the amount of the deposits and must consist of: (1) obligations of the United States or its agencies and instrumentalities; (2) direct obligations of the State of Texas or its agencies; (3) other obligations, the principal and interest on which are unconditionally guaranteed or insured by the State of Texas; and/or (4) obligations of states, agencies, counties, cities, and other political subdivisions of any state having been rated as to investment quality by a nationally recognized investment rating firm and having received a rating of not less than A or its equivalent. County policy requires the collateralization level to be at least 110% of market value of principal and accrued interest. Commissioners Court has adopted a written investment policy regarding the investment of its funds as defined by the PFIA. The investments of the County are in compliance with this policy. State statutes authorize the County to invest in fully collateralized or insured time deposits, direct debt obligations of the United States, and certain repurchase agreements. Investments in security repurchase agreements are authorized when the investment has a defined termination date, is secured by obligations described in the PFIA, is pledged to the County, is deposited with a third party selected and approved by the entity, and is placed through a primary government securities dealer or national bank domiciled in the State of Texas. The County did not invest in repurchase agreements for the year ended September 30, 2016. B. Deposit and Investment Amounts The County's cash and investments are classified as: cash and cash equivalents, and investments. Cash and cash equivalents include cash on hand, deposits with financial institutions, and short-term investments in privately-managed public funds investment pool accounts. As of September 30, 2016, the County’s cash deposits are either insured by FDIC or covered by collateral held by the County’s agent in the County’s name.

44
The following schedule shows the County’s recorded cash and cash equivalents and investment pools as of year-end, excluding agency funds:
Internal TotalsGovernmental Service Governmental Component
Investments Funds Funds Activities Units Totals
Cash deposits 90,175,449$ 11,076,139$ 101,251,588$ 93,224,705$ 194,476,293$ Investment pools:
Texas CLASS 89,346,796 89,346,796 16,803,192 106,149,988 TexasTERM 2,358 2,358 1,012 3,370 LOGIC 3,041 3,041 1,020 4,061 Wells Fargo Government Money Market Fund 6,767,334 6,767,334
Totals cash and cash equivalents 179,527,644 11,076,139 190,603,783 116,797,263 307,401,046 Certificates of deposit 900,000 900,000 Governmental securities:
FHLMC 22,047,766 22,047,766 22,047,766 FHLMC 19,287,844 19,287,844 FNMA 2,895,003 2,895,003 FFCB 8,020,594 8,020,594
Totals Cash and Investments 201,575,410$ 11,076,139$ 212,651,549$ 147,900,704$ 360,552,253$
Investment’s fair value measurements are as follows as of September 30, 2016:
Investments
Fair Value/ Amortized
Cost
Cash deposits 194,476,293$ Investment pools:
Texas CLASS 106,149,988 TexasTERM 3,370 LOGIC 4,061 Wells Fargo Government Money Market Fund 6,767,334
Totals cash and cash equivalents 307,401,046 Certificates of deposit 900,000 Governmental securities:
FHLMC 22,047,766 FHLMC 19,287,844 FNMA 2,895,003 FFCB 8,020,594
Totals Cash and Investments 360,552,253$
The fair values for all governmental securities are determined using Level 1 inputs. Texas Cooperative Liquid Assets Securities System Trust (“Texas CLASS”) is a local government investment pool organized under the authority of the Interlocal Cooperation Act, chapter 791, Texas Government Code, and the PFIA. Texas CLASS was established in 1996. Pursuant to the Trust Agreement, Texas CLASS is supervised by a Board of Trustees who are elected by the Participants. The Board of Trustees supervises the Trust and its affairs and acts as the liaison between the Participants, the Custodian and the Program Administrator. Cutwater Investor Services Corp. serves as Program Administrator. Cutwater Investor Services Corp. is a subsidiary of Cutwater Asset Management. Texas CLASS is considered a '2a-7 like pool' under Governmental Accounting Standards Statement No. 31; it

45
will operate the pool consistent with the SEC's Rule 2a7. It maintains a Net Asset Value of approximately $1 per share. The TexasTERM Local Government Investment Pool (“TexasTERM”) is organized in conformity with the PFIA. It provides for a fixed-rate, fixed-term investment for a period of 60 days to one year and includes TexasDAILY, a portfolio of the Local Government Pool, providing daily access to funds. An Advisory Board composed of participants in TexasTERM and other parties who do not participate in the Pool, has responsibility for the overall management of the Pool, including formulation and implementation of its investment and operating policies. PFM Asset Management LLC, a leading national financial and investment advisory firm, is the investment advisor to the pool. TexasTERM's TexasDAILY portfolio is considered a '2a-7 like pool' under Governmental Accounting Standards Statement No. 31; it will operate the pool consistent with the SEC's Rule 2a7. It maintains a Net Asset Value of approximately $1 per share. Local Government Investment Cooperative (“LOGIC”) is a local government investment pool organized under the authority of the Interlocal Cooperation Act, chapter 791, Texas Government Code, and the PFIA. The Pool was created in April, 1994 through a contract among its participating governmental units, and is governed by a board of directors, to provide for the joint investment of participant's public funds and funds under their control. LOGIC is considered a '2a-7 like pool' under Governmental Accounting Standards Statement No. 31; it will operate the pool consistent with the SEC's Rule 2a7. It maintains a Net Asset Value of approximately $1 per share. Wells Fargo Government Money Market Fund seeks current income, while preserving capital and liquidity. It invests in high-quality, short-term money market instruments that consist of U.S. Government obligation and repurchase agreements collateralized by U.S. Government obligations. In accordance with GASB Statement No. 79, Certain External Investment Pools and Pool Participants, the local government investment pools do not have any limitations and restrictions on withdrawals such as notice periods or maximum transaction amounts. These pools do not impose any liquidity fees or redemption gates. C. Interest Rate Risk As of year-end, the County had the following investments subject to interest rate risk disclosure, under U.S. generally accepted accounting principles:
Fair Value
Weighted Average
Maturity (days)
Percentage of Total
PortfolioCertificates of deposit 900,000$ 211 0.5%Investment pools:
Texas CLASS 106,149,988 56 64.0%TexasTERM 3,370 55 0.0%LOGIC 4,061 39 0.0%Wells Fargo Government Money Market Fund 6,767,334 42 4.1%
Governmental securities:FHLMC 22,047,766 532 13.3%FHLMC 19,287,844 349 11.6%FNMA 2,895,003 879 1.7%FFCB 8,020,594 1,008 4.8%
Total Fair Value 166,075,960$ Portfolio weighted average maturity 214

46
It is the County’s policy to select any individual investment with a maximum stated maturity of thirty-six (36) months. Portfolio maturities will be structured to meet the obligations of the County first and then to achieve the highest rate of return of interest. When the County has funds not required to meet current year obligations, maturity restraints will be imposed based upon the investment strategy for the group of funds. D. Credit Risk The County’s investment policy does not require investments to hold certain credit ratings issued by nationally recognized statistical rating organizations. As of September 30, 2016, the County’s investments in Texas CLASS, TexasTERM, and LOGIC were rated “AAAm” by Standard and Poor’s. The County’s investments in the Wells Fargo Money Market Fund was rated “AAAm” and “Aaa-mf” by Standards and Poor’s and Moody’s Investments, respectively. E. Concentration of Credit Risk It is the County’s policy to diversify its portfolio to eliminate the risk of loss resulting from a concentration of assets in a specific maturity (save and except zero duration funds), a specific issuer or a specific class of investments. To achieve this diversification, the County will limit investments in specific types of securities to the following percentages of the total portfolio:
Investment Type Maximum
Investment %
Repurchase Agreements up to 35% Certificates of Deposit up to 50% U.S. Treasury Bills/Notes up to 100% Other U.S. Government Securities up to 80% Authorized Local Government Investment Pools up to 80% No Load Money Market Mutual Funds up to 50% Bankers Acceptances up to 15%
It is the County’s policy to select investments in order to provide stability of income and reasonable liquidity. NOTE 3 - RECEIVABLES Receivables, including applicable allowances for uncollectible accounts, as of September 30, 2016, were as follows:
Debt Capital Non-majorGeneral Service Projects Special Revenue
Fund Fund Funds FundsReceivables:
Property taxes 5,459,031$ 367,872$ $ 1,016,170$ Sales taxes 1,179,353Grants 10,567,490 821,109Fines and fees 85,102,510Other 3,844,944 3,775,612 56,285 2,297,864
Gross receivables 104,973,975 4,143,484 56,285 5,314,496Less: allowance for
uncollectibles (57,945,357) (36,787) (101,617)Totals 47,028,618$ 4,106,697$ 56,285$ 5,212,879$
Governmental Activities

47
Governmental funds report unavailable revenue in connection with receivables for revenues that are not considered to be available to liquidate liabilities of the current period. Governmental funds also postpone revenue recognition in connection with resources that have been received, but not yet earned. As of September 30, 2016, the various components of unavailable revenue reported in the governmental funds are as follows:
Unavailable UnearnedDelinquent property taxes (General Fund) 4,913,128$ $Delinquent property taxes (Road and Bridge Fund) 659,443Delinquent property taxes (Drainage District Fund) 255,110Delinquent property taxes (Debt Service Fund) 331,085Fines and fees (General Fund) 27,703,056
6,928,612
33,861,822$ 6,928,612$
Grant funds received prior to meeting all eligibility requirementsTotal unavailable/unearned revenue for governmental funds
NOTE 4 – PROPERTY TAXES The County's tax year covers the period October 1st through September 30th. The County's property taxes are levied annually in October on the basis of the Fort Bend Central Appraisal District's (“CAD”) assessed values as of January 1st of that calendar year. Such taxes become delinquent on February 1st of the subsequent calendar year. The CAD establishes appraised values at 100% of market value less exemptions. The County's property taxes are billed and collected by the County's Tax Assessor/Collector. A. 2015 Tax Year Property taxes are prorated between the General, certain Special Revenue, and Debt Service Funds based on rates adopted for the year of the levy. For the 2016 fiscal year (2015 tax year), the County levied property taxes of $0.48600 per $100 of assessed valuation. The 2015 rates resulted in total adjusted tax levies of approximately $261.6 million based on a total adjusted valuation of approximately $53.4 billion. The total tax rate in the 2015 tax year was prorated as follows:
2015 Rate 2015 Limit
General, certain Special Revenue and Debt Service Funds 0.46500$ 0.80000$ Fort Bend County Drainage District 0.02100$ 0.25000$ Total Tax Rate 0.48600$ 1.05000$
B. Fort Bend Central Appraisal District The Fort Bend Central Appraisal District (“CAD”), a separate governmental entity, is responsible for the recording and appraisal of property for all taxing units in the County. The CAD is required by state law to assess property at 100% of its appraised value. Further, real property must be appraised at least every four years. Under certain circumstances, the taxpayers and taxing units, including the County, may challenge orders of the CAD's Appraisal Review Board through various appeals and, if necessary, legal action may be taken. The Commissioners Court will continue to set the tax rates on the property. State law also provides that, if approved by the qualified voters in the County, collection functions may be assigned to the CAD.

48
NOTE 5 – INTERFUND ACTIVITY During the year, cash advances are occasionally made between funds for various projects and situations, which create receivables and payables between these funds. All of these interfund balances are expected to be paid within one year. As of September 30, 2016, the interfund receivables and payables were as follows:
Interfund InterfundReceivable Payable
General Fund 13,100,151$ $ Capital Project Funds 8,535,383 Non-major Special Revenue Funds 112,444 4,097,223
13,212,595 12,632,606 Internal Service Funds 36,090 616,079
Total Governmental Activities 13,248,685$ 13,248,685$
Transfers totaling approximately $13.8 million were made during the year primarily for the purpose of moving unrestricted fund revenues to finance various programs that the government must account for in other funds in accordance with the budgetary authorizations, including amounts provided as subsidies or matching funds for various grant programs.
Transfers TransfersIn (Out)
General Fund 17,200$ 13,539,414$ Non-major Special Revenue Funds 13,763,470 241,256
Total Governmental Activities 13,780,670$ 13,780,670$

49
NOTE 6 – CAPITAL ASSETS A summary of changes in the primary government’s capital assets for the year ended September 30, 2016, is as follows:
Balances Balances10/1/15 * Increases Decreases 9/30/16
Governmental activities:Capital assets not being depreciated:
Land 383,866,412$ 33,941,918$ $ 417,808,330$ Construction in progress 39,528,860 35,356,976 (26,662,449) 48,223,387
Total capital assets not being depreciated 423,395,272 69,298,894 (26,662,449) 466,031,717
Depreciable capital assets:Vehicles 37,107,219 4,335,146 (3,216,957) 38,225,408 Office furniture and equipment 30,314,736 1,613,741 (410,783) 31,517,694 Machinery and equipment 27,425,635 2,285,997 (368,197) 29,343,435 Buildings, facilities and improvements 352,302,778 12,270,936 364,573,714 Infrastructure 1,105,191,461 123,434,790 1,228,626,251
Total other capital assets 1,552,341,829 143,940,610 (3,995,937) 1,692,286,502
Accumulated depreciation for:Vehicles (22,622,880) (3,979,743) 2,941,279 (23,661,344) Office furniture and equipment (24,024,326) (2,392,578) 409,432 (26,007,472) Machinery and equipment (16,982,487) (1,630,345) 323,399 (18,289,433) Buildings, facilities and improvements (92,469,442) (9,479,977) (101,949,419) Infrastructure (224,261,290) (29,858,015) (254,119,305)
Total accumulated depreciation (380,360,425) (47,340,658) 3,674,110 (424,026,973) Depreciable capital assets, net 1,171,981,404 96,599,952 (321,827) 1,268,259,529 Total governmental activities
capital assets, net 1,595,376,676$ 165,898,846$ (26,984,276)$ 1,734,291,246$
Primary Government
*as restated. See Note 17 for more information. Depreciation expenses were charged to the following functions in the statement of activities:
Fiscal Year 2016 Depreciation ExpenseGeneral administration 2,092,147$ Financial administration 311,301 Administration of justice 5,040,638 Construction and maintenance 32,046,503 Health and welfare 1,979,944 Cooperative services 74,637 Public safety 3,153,129 Parks and recreation 936,783 Library 1,667,085
38,491
Total Depreciation Expense 47,340,658$
Capital assets held by the County's internal service funds are charged to the various functions based on their usage of the assets

50
Construction in progress and remaining commitments under related construction contracts for general government construction projects as of September 30, 2016, is as follows:
Increases-Balances Retainage Decreases Balances Remaining
Project 10/1/15 * Included Capitalizations 9/30/16 CommitmentsMobility Projects - Bonds 29,705,353$ 12,636,595$ (12,884,399)$ 29,457,549$ 10,481,522$ Wespark B Frontage Roads 4,964,807 419,897 5,384,704 1,750 Congestion Mitigation 1,568,583 1,568,583 Utility Relocation - Greenbusch 1,496,929 1,496,929 Justice Center Expansion 1,190,718 1,190,718 Jail Energy Efficiency Project 1,049,540 1,049,540 Justice Center Finish Out 973,377 973,377 Crabb River Road Expansion 926,777 38,843 965,620 2011 Public Transportation Grant 245,900 516,378 762,278 Parks Infrastructure 2016 632,670 632,670 Justice Center Structured Parking 587,920 587,920 Lawson Upgrade 506,040 506,040 122,092 2015 County-wide Parks Projects 487,354 487,354 Sheriff Txwarn Tower Software 434,145 434,145 Sheriff Helicopter Project 424,911 424,911 58,857 Sheriff Vocational Building #2 312,708 312,708 FM762 Landscaping 221,754 221,754 Document Management Steer Team 211,950 211,950 686,525 LJ Parkway 208,702 208,702 Four Corners Community Service Center 25,976 152,253 178,229 Justice Center Security Upgrade 26,310 141,107 167,417 57,138 Justice Center Courtrooms Buildout 9,360 144,707 154,067 Fairgrounds Livestock Building 152,606 152,606 Missouri City Library Expansion 147,287 147,287 Mission Bend Library 143,597 143,597 CSI Redaction Software 124,798 124,798 5th Street Community Center Expansion 82,794 82,794 Enotices Software 45,000 45,000 4,228 Kitty Hollow Improvements 40,700 40,700 West Bellfort Extention 31,706 31,706 Courthouse Renovation Project 29,550 29,550 Precinct 4 Renovations 26,972 26,972 Mission Bend Community Center 14,657 14,657 Sheriff Administratin Building 6,555 6,555 Fort Bend Senior Meals on Wheels 1,084,565 527,530 (1,612,095) 40,072 Gordon Ranch 413,120 706 (413,826) 7,700 Juvenile Probation Gym Renovation 94,875 30,281 (125,156) 8,500 Odyssey Judges Sessions Software 62,447 (62,447) 9,342 Big Creek 190,486 (190,486) 367,155 Tiburon Upgrades 197,639 (197,639) 82,621 2015 Ebola Grant 67,056 (67,056) 14,580 Sienna Parkway Project 11,180 Facilities Tracking Software 6,950 Drainage Facility Carpet Replacement 3,976 IT Hardware Infrastructure 2,878 Stafford Run Project 179,215 (179,215) 1,080 Projects Completed in FY2016 250,687 10,679,443 (10,930,130)
Totals 39,528,860$ 35,356,976$ (26,662,449)$ 48,223,387$ 11,968,146$
2016 CONSTRUCTION COSTS
*as restated. See Note 17 for more information.

51
A summary of changes in the discretely presented component units (Fort Bend County Toll Road Authority and Fort Bend Grand Parkway Toll Road Authority) capital assets for the year ended September 30, 2016, is as follows:
Balances Balances10/1/15 Increases Decreases 9/30/16
Governmental Activities:Capital assets not being depreciated:
Land 26,505,127$ 4,925,442$ $ 31,430,569$ Construction in progress 28,373,977 53,952,936 (11,155,322) 71,171,591
Total capital assets not being depreciated 54,879,104 58,878,378 (11,155,322) 102,602,160
Depreciable capital assets:Office furniture and equipment 29,902 29,902 Infrastructure 327,351,968 10,001,430 337,353,398
Total other capital assets 327,381,870 10,001,430 337,383,300
Accumulated depreciation for:Office furniture and equipment (2,990) (5,980) (8,970) Infrastructure (46,949,414) (8,211,316) (55,160,730)
Total accumulated depreciation (46,952,404) (8,217,296) (55,169,700) Depreciable capital assets, net 280,429,466 1,784,134 282,213,600 Total Governmental Activities
capital assets, net 335,308,570$ 60,662,512$ (11,155,322)$ 384,815,760$
Discretely Presented Component Units
Depreciation expense for the Fort Bend County Toll Road Authority and the Fort Bend Grand Parkway Toll Road Authority totaled $8,217,296 for fiscal year 2016. Construction in progress and remaining commitments under related construction contracts for the Fort Bend County Toll Road Authority and the Fort Bend Grand Parkway Toll Road Authority construction projects as of September 30, 2016, are as follows:
Increases-Balances Retainage Decreases Balances Remaining
Project 10/1/15 Included Capitalizations 9/30/16 CommitmentsFort Bend County Toll
Road Authority 23,112,190$ 46,057,092$ (5,676,593)$ 63,492,689$ 48,704,098$ Fort Bend Grand Parkway
Toll Road Authority 5,261,787 7,895,844 (5,478,729) 7,678,902 3,890,602
Totals 28,373,977$ 53,952,936$ (11,155,322)$ 71,171,591$ 52,594,700$
2016 CONSTRUCTION COSTS

52
NOTE 7 – AMBULANCE SERVICES OVERPAYMENT LIABILITY Fort Bend County identified a technical compliance deficiency regarding billing of ambulance services to Center for Medicare and Medicaid Services (“CMS”) and other federal payers. This was confirmed with a statistically valid random-sample audit performed in August of 2016. The variance rate was calculated at 26.6%. Based on this error rate, Fort Bend County was overpaid by CMS and other federal payers by approximately $3 million over a period of six years. With the additional penalty, the County will be required to reimburse approximately $4.5 million. The technical deficiency was corrected as of January 31, 2016 and controls have been implemented to ensure full compliance with regard to all requirements of all funding entities of ambulance services provided by Fort Bend County. This liability is included in accounts payable and accrued expenses in the financial statements. NOTE 8 - LONG-TERM DEBT A. General Obligation Bonds and Long-Term Liabilities Long-term liabilities applicable to the County’s governmental activities are not due and payable in the current period, and accordingly, are not reported as fund liabilities in the governmental funds. Interest on long-term debt is not accrued in governmental funds, but rather is recognized as an expenditure when due. Long-term bonded debt as of September 30, 2016, is as follows:
Original IssueInterest Rate
% MaturesDebt
Outstanding
General Obligation Bonds
126,675,000$ Facilities Limited Tax Bonds,Series 2007 4.00 - 5.00 2031 4,845,000$
48,940,000 Unlimited Tax Road Bonds,Series 2009 3.00 - 5.00 2029 4,245,000
73,430,000 Justice Center Limited Tax Bonds,Series 2009 3.00 - 5.25 2030 5,800,000
20,780,000 Unlimited Tax Road Refunding Bonds,Series 2009 3.00 - 5.00 2021 9,115,000
9,675,000 Fort Bend Flood Control Water SupplyRefunding Bonds, Series 2010 2.50 - 4.00 2021 4,655,000
58,220,000 Unlimited Tax Road Bonds,Series 2012 2.00 - 5.00 2032 50,275,000
18,900,000 Unlimited Tax Road Refunding Bonds,Series 2014 1.00 - 5.00 2026 17,445,000
52,220,000 Unlimited Tax Road and Refunding Bonds,Series 2015A 2.00 - 5.00 2035 51,050,000
93,370,000 Facilities Limited Tax Refunding Bonds,Series 2015B 4.00 - 5.00 2031 93,370,000
75,340,000 Unlimited Tax Road and Refunding Bonds,Series 2016A 2.00 - 5.00 2036 75,340,000
94,420,000 Facilities Limited Tax and Refunding Bonds,Series 2016B 2.00 - 5.00 2036 94,420,000
Total General Obligation Bonds 410,560,000$
Primary Government
Description
The County issues general obligation bonds primarily for the purpose of funding construction projects. The Facilities and Justice Center Limited Tax Bonds were issued to provide funds for the construction of major County facilities. The Unlimited Tax Road Bonds have been issued to fund the acquisition of right-of-way and the construction of roads and bridges that are within the County’s major thoroughfare plan. The Fort Bend Flood Control Water Supply Refunding Bonds were issued to refund and defease the FBFCWSC’s outstanding Revenue Bonds, Series 2001, which were originally issued to fund the improvement of Big Creek as a component of the Drainage District infrastructure.

53
On June 6, 2016, Fort Bend County issued $75,340,000 of Unlimited Tax Road and Refunding Bonds, of which $28,070,000 was to refund and defease a material portion of the Unlimited Tax Road Bonds, Series 2009 of $32,045,000. This advance refunding was undertaken to reduce total debt service payments over the next 13 years by $5,763,175, and resulted in an economic gain of $5,332,325. The remaining $47,270,000 of this issue was new funding for County mobility projects. The deferred gain on this refunding was $1,687,277. On June 6, 2016, Fort Bend County issued $94,420,000 of Limited Tax and Refunding Bonds, of which $45,050,000 was to refund and defease a material portion of the Justice Center Limited Tax Bonds, Series 2009 of $50,315,000. This advance refunding was undertaken to reduce total debt service payments over the next 14 years by $10,364,450, and resulted in an economic gain of $9,606,494. The remaining $49,370,000 of this issue was new funding for various County facilities projects. The deferred gain on this refunding was $1,955,142. All of the County’s outstanding bond issues are subject to federal arbitrage regulations. The County complies with the five year reporting requirements to the Internal Revenue Service for rebate calculation. As of the date of this report, the County has no contingent rebatable arbitrage. A summary of long-term liability transactions of the County for the year ended September 30, 2016, follows:
AmountsBalance Balance Due Within10/1/15 Additions Retirements 9/30/16 One Year
Bonds payable:General obligation bonds 341,640,000$ 169,760,000$ (100,840,000)$ 410,560,000$ 21,420,000$ Premiums on bonds 34,625,782 34,156,270 (6,337,557) 62,444,495
Total bonds payable 376,265,782 203,916,270 (107,177,557) 473,004,495 21,420,000
Accrued compensated absences 6,948,338 8,125,216 (7,877,822) 7,195,732 1,798,933 Other post-employment benefits
("OPEB") obligation 221,281,360 42,570,952 (6,954,340) 256,897,972
Total Long-Term Liabilities 604,495,480$ 254,612,438$ (122,009,719)$ 737,098,199$ 23,218,933$
Bonded debt is funded primarily by property taxes from the Debt Service Fund. Accrued compensated absences are payable by the fund in which the individual positions are budgeted. General Fund and the Drainage District Fund have been used to fund current OPEB costs. As of the date of this report, the long-term portion of the OPEB liability is not funded. Annual debt service requirements to maturity for the general obligation bonds are summarized as follows:
Principal Interest Totals
2017 21,420,000$ 18,828,362$ 40,248,362$ 2018 21,840,000 17,908,919 39,748,919 2019 22,110,000 16,888,950 38,998,950 2020 23,045,000 15,794,125 38,839,125 2021 24,020,000 14,660,800 38,680,800
2022-2026 124,070,000 55,650,775 179,720,775 2027-2031 126,160,000 24,255,500 150,415,500 2032-2036 47,895,000 4,935,550 52,830,550
Totals 410,560,000$ 168,922,981$ 579,482,981$

54
Discretely presented component units long-term bonded debt as of September 30, 2016, is listed below:
Original IssueInterest Rate
% MaturesDebt
Outstanding
Fort Bend County Toll Road Authority:Revenue Bonds
30,775,000$ Senior Lien Toll Road Revenue Bonds,Series 2012 2.00 - 4.125 2040 30,280,000$
116,940,000 Unlimited Tax and Subordinate Lien Toll Road Revenue Refunding BondsSeries 2012 3.125 - 5.00 2032 112,635,000
45,000,000 Senior Lien Toll Road Revenue Bonds,Series 2014 2.00 - 5.00 2042 44,100,000
64,440,000 Senior Lien Toll Road Revenue Bonds,Series 2016 2.00 - 5.00 2045 64,440,000
251,455,000$
Fort Bend Grand Parkway Toll Road Authority:Revenue Bonds
155,085,000$ Limited Contract Tax and SubordinateLien Toll Road Revenue Bonds,Series 2012 3.00 - 5.00 2046 155,085,000$
Total Revenue Bonds 155,085,000$
Discretely Presented Component Units
Description
Total Revenue Bonds
A summary of long-term liability transactions of the discretely presented component units for the year ended September 30, 2016, follows: Fort Bend County Toll Road Authority:
AmountsBalance Balance Due Within10/1/15 Additions Retirements 9/30/16 One Year
Revenue bonds 191,660,000$ 64,440,000$ (4,645,000)$ 251,455,000$ 5,390,000$ Premiums on bonds 21,074,427 10,335,412 (1,319,824) 30,090,015 Discounts on bonds (287,523) 11,656 (275,867)
Total Long-Term Liabilities 212,446,904$ 74,775,412$ (5,953,168)$ 281,269,148$ 5,390,000$
Fort Bend Grand Parkway Toll Road Authority:Amounts
Balance Balance Due Within10/1/15 Additions Retirements 9/30/16 One Year
Revenue bonds 155,085,000$ $ $ 155,085,000$ $ Premiums on bonds 17,096,314 (552,981) 16,543,333
Total Long-Term Liabilities 172,181,314$ $ (552,981)$ 171,628,333$ $

55
Annual debt service requirements to maturity for the revenue bonds are summarized as follows:
Fort Bend County Toll Road Authority:
Principal Interest Totals
2017 5,390,000$ 11,685,175$ 17,075,175$ 2018 6,260,000 11,453,288 17,713,288 2019 7,070,000 11,185,688 18,255,688 2020 7,845,000 10,881,575 18,726,575 2021 8,530,000 10,518,375 19,048,375
2022-2026 52,260,000 45,680,028 97,940,028 2027-2031 67,625,000 31,190,181 98,815,181 2032-2036 40,645,000 16,884,306 57,529,306 2037-2041 36,370,000 8,786,347 45,156,347 2042-2045 19,460,000 1,772,150 21,232,150
Totals 251,455,000$ 160,037,113$ 411,492,113$
Fort Bend Grand Parkway Toll Road Authority:
Principal Interest Totals
2017 $ 7,180,200$ 7,180,200$ 2018 7,180,200 7,180,200 2019 7,180,200 7,180,200 2020 7,180,200 7,180,200 2021 14,945,000 34,367,375 49,312,375
2022-2026 22,585,000 29,578,675 52,163,675 2027-2031 27,785,000 24,101,075 51,886,075 2032-2036 35,270,000 16,312,500 51,582,500 2037-2041 44,490,000 6,768,375 51,258,375 2042-2046 10,010,000 200,200 10,210,200
Totals 155,085,000$ 140,049,000$ 295,134,000$
B. Conduit Debt – Component Units
The Fort Bend County Housing Finance Corporation is authorized to finance residential housing by issuing tax-exempt revenue bonds to acquire mortgage loans as security for the payment of the principal and interest of such revenue bonds. The tax-exempt bonds issued by the Corporation do not constitute a debt or pledge of faith of the Corporation, but are payable by the user pursuant to terms defined in the loan agreement underlying each issue. As of September 30, 2016, $8,829,000 of total bonds are outstanding.
The Fort Bend County Industrial Development Corporation is authorized to finance industrial development projects as defined by the Development Act of 1979 by issuing bonds. The bonds issued by the Corporation do not constitute a debt or pledge of faith of the Corporation, but are payable by the user pursuant to terms defined in the loan agreement underlying each issue. As of September 30, 2016, $129,640,071 of total bonds are outstanding.

56
C. Defeasance of Debt In fiscal year 2015, the County defeased a large portion of the Facilities Limited Tax Bonds, Series 2007 by placing the proceeds of the refunding bonds in an irrevocable trust to provide for all future debt service on the refunded bonds. The trust account assets and the liability for the defeased bonds are not included in the County’s basic financial statements. As of September 30, 2016, the outstanding balance of the Facilities Limited Tax Bonds, Series 2007 was $100,470,000. In fiscal year 2016, the County defeased a large portion of the Unlimited Tax Road Bonds, Series 2009 and a large portion of the Justice Center Limited Tax Bonds, Series 2009 by placing the proceeds of the refunding bonds in an irrevocable trust to provide for all future debt service on the refunded bonds. The trust account assets and the liability for the defeased bonds are not included in the County’s basic financial statements. As of September 30, 2016, the outstanding balance of the Unlimited Tax Road Bonds, Series 2009 was $32,045,000, and the outstanding balance of the Justice Center Limited Tax Bonds, Series 2009 was $50,315,000. NOTE 9 – EMPLOYEE RETIREMENT SYSTEM General Information about the Pension Plan A. Plan Description The County provides retirement, disability, and death benefits for all of its full-time employees through a nontraditional defined benefit pension plan in the statewide Texas County and District Retirement System (“TCDRS”). The Board of Trustees of TCDRS is responsible for the administration of the statewide agent multiple-employer public employee retirement system consisting of nontraditional defined benefit pension plans. TCDRS in the aggregate issues a comprehensive annual financial report (“CAFR”) on a calendar year basis. The CAFR is available upon written request from the TCDRS Board of Trustees at P.O. Box 2034, Austin, Texas 78768-2034. B. Benefits Provided The plan provisions are adopted by the governing body of the employer, within the options available in the Texas state statutes governing TCDRS (“TCDRS Act”). Members can retire with eight or more years of service at age 60 and above, with 30 years of service regardless of age, or when the sum of their age and years of service equals 75 or more. Members are vested after eight years of service but must leave their accumulated contributions in the plan to receive any employer-financed benefit. Members who withdraw their personal contributions in a lump sum are not entitled to any amounts contributed by their employer. Benefit amounts are determined by the sum of the employee's contributions to the plan, with interest, and employer-financed monetary credits. The level of these monetary credits is adopted by the governing body of the employer within the actuarial constraints imposed by the TCDRS Act so that the resulting benefits can be expected to be adequately financed by the employer's commitment to contribute. At retirement, death, or disability, the benefit is calculated by converting the sum of the employee's accumulated contributions and the employer-financed monetary credits to a monthly annuity using annuity purchase rates prescribed by the TCDRS Act. All employees are eligible for non-duty disability benefits after 10 years of service and for duty-related disability benefits upon hire. Disability retirement benefits are determined in the same manner as retirement benefits but are payable immediately without an actuarial reduction. Death benefits equal two times the employee’s final full-year salary. An employee who leaves County service may withdraw his or her contributions, plus any accumulated interest.

57
Benefit terms provide for annual cost-of-living adjustments to each employee’s retirement allowance subsequent to the employee’s retirement date. The annual adjustments are one-half of the change in the Consumer Price Index, limited to a maximum increase in retirement allowance of 2 percent for general employees and 3 percent for public safety employees. The Commissioners Court considers providing an additional cost-of-living adjustment after the employee’s retirement date beyond the terms of the plan during the budget process if sufficient funds are available. C. Employees Covered by Benefit Terms As of September 30, 2016, the following employees were covered by the benefit terms:
Inactive employees or beneficiaries currently receiving benefits 824 Inactive employees entitled to but not yet receiving benefits 1,734 Active employees 2,752 Total 5,310
D. Contributions The employer has elected the annually determined contribution rate (“ADCR”) plan provisions of the TCDRS Act. The plan is funded by monthly contributions from both employee members and the employer based on the covered payroll of employee members. Under the TCDRS Act, the contribution rate of the employer is actuarially determined annually. It was12.14% for calendar year 2015 and 11.79% for calendar year 2016. The contribution rate payable by the employee members is 7% as adopted by the governing body of the employer. The employee contribution rate and the employer contribution rate may be changed by the governing body of the employer within the options available in the TCDRS Act. The County’s total payroll in fiscal year 2016 was $138.4 million and the County’s contributions were based on a payroll of $137.2 million. Contributions made by employees totaled $9.6 million, and the County made contributions of $16.3 million during the fiscal year ended September 30, 2016. Net Pension Liability The County’s net pension liability was measured as of December 31, 2015, and the total pension liability used to calculate the net pension liability was determined by an actuarial valuation as of that date.

58
A. Actuarial Assumptions The total pension liability in the December 31, 2015 actuarial valuation was determined using the following actuarial assumptions, applied to all periods included in the measurement: Valuation Timing Actuarially determined contribution rates are calculated as of
December 31, two years prior to the end of the fiscal year inwhich the contributions are reported.
Actuarial Cost Method Entry Age Normal
Actuarial Cost Method Recognition of economic/demographic
gains or losses Straight-Line amortization over Expected Working LifeRecognition of assumptions changes
or inputs Straight-Line amortization over Expected Working Life
Asset Valuation MethodSmoothing period 5 years Recognition method Non-asymptoticCorridor None
Inflation 3.00%
Salary Increases 3.50%
Investment Rate of Return 8.10%
Cost-of-Living Adjustments Cost-of-Living Adjustments for Fort Bend County are notconsidered to be substantively automatic under GASB 68.Therefore, no assumption for future cost-of-living adjustments isincluded in the GASB calculations. No assumption for future cost-of-living adjustments is included in the funding valuation.
Mortality Depositing members The RP-2000 Active Employee Mortality Table for males with a
two-year set-forward and the RP-2000 Active Employee MortalityTable for females with a four-year setback, both projected to 2014with a scale AA, and then projected with a 110% of the MP-2014Ultimate scale after that.
Service retirees, beneficiaries and non-depositing members
The RP-2000 Combined Mortality Table projected to 2014 withscale AA, and then projected with 110% of the MP-2014 Ultimatescale after that, with a one-year set-forward for males and no ageadjustment for females.
Disabled retirees RP-2000 Disabled Mortality Table projected to 2014 with scaleAA and then projected with 110% of the MP-2014 Ultimate scaleafter that, with no age adjustment for males and a two-year set-forward for females.
The long-term expected rate of return on pension plan investments was determined using a building-block method in which best-estimate ranges of expected future real rates of return (expected returns, net of pension plan investment expense and inflation) are developed for each major asset class. These ranges are combined to produce the long-term expected rate of return by weighting the expected future real rates of return by the target asset allocation percentage and by adding expected inflation.

59
B. Discount rate The discount rate is the single rate of return that, when applied to all projected benefit payments results in an actuarial present value of projected benefit payments equal to the total of the following:
1. The actuarial present value of benefit payments projected to be made in future periods in which (a) the amount of the pension plan’s fiduciary net position is projected to be greater than the benefit payments that are projected to be made in that period and (b) pension plan assets up to that point are expected to be invested using a strategy to achieve the long-term rate of return, calculated using the long-term expected rate of return on pension plan investments.
2. The actuarial present value of projected benefit payments not included in (1), calculated using the municipal bond rate.
Therefore, if plan investments in a given future year are greater than projected benefit payments in that year and are invested such that they are expected to earn the long-term rate of return, the discount rate applied to projected benefit payments in that year should be the long-term expected rate of return on plan investments. If future years exist where this is not the case, then an index rate reflecting the yield on a 20-year, tax-exempt municipal bond should be used to discount the projected benefit payments for those years. The determination of a future date when plan investments are not sufficient to pay projected benefit payments is often referred to as a depletion date projection. A depletion date projection compares projections of the pension plan’s fiduciary net position to projected benefit payments and aims to determine a future date, if one exists, when the fiduciary net position is projected to be less than projected benefit payments. If an evaluation of the sufficiency of the projected fiduciary net position compared to projected benefit payments can be made with sufficient reliability without performing a depletion date projection, alternative methods to determine sufficiency may be applied. In order to determine the discount rate to be used by the employer we have used an alternative method to determine the sufficiency of the fiduciary net position in all future years. Our alternative method reflects the funding requirements under the employer’s funding policy and the legal requirements under the TCDRS Act.
1. TCDRS has a funding policy where the Unfunded Actuarial Accrued Liability (“UAAL”) shall be amortized as a level percent of pay over 20-year closed layered periods.
2. Under the TCDRS Act, the employer is legally required to make the contribution specified in the funding policy.
3. The employer’s assets are projected to exceed its accrued liabilities in 20 years or less. When this point is reached, the employer is still required to contribute at least the normal cost.
4. Any increased cost due to the adoption of a COLA is required to be funded over a period of 15
years, if applicable. Based on the above, the projected fiduciary net position is determined to be sufficient compared to projected benefit payments. Based on the expected level of cash flows and investment returns to the system, the fiduciary net position as a percentage of total pension liability is projected to increase from its current level in future years. Since the projected fiduciary net position is projected to be sufficient to pay projected benefit payments in all future years, the discount rate for purposes of calculating the total pension liability and net pension liability of the employer is equal to the long-term assumed rate of return on investments. This long-term assumed rate of return should be net of investment expenses, but gross of administrative expenses for

60
GASB 68 purposes. Therefore, we have used a discount rate of 8.10%. This rate reflects the long-term assumed rate of return on assets for funding purposes of 8.00%, net of all expenses, increased by 0.10% to be gross of administrative expenses. C. Long-Term Expected Rate of Return The long-term expected rate of return on TCDRS assets is determined by adding expected inflation to expected long-term real returns, and reflecting expected volatility and correlation. The capital market assumptions and information shown below are provided by TCDRS’ investment consultant, Cliffwater LLC. The numbers shown are based on January 2016 information for a 7-10 year time horizon. Note that the valuation assumption for long-term expected return is re-assessed at a minimum of every four years, and is set based on a 30-year time horizon; the most recent analysis was performed in 2013.
Asset Class Benchmark
US Equities Dow Jones U.S. Total Stock Market Index 14.50% 5.45%
Private Equity Cambridge Associates Global Private Equity & Venture Capital Index (3) 14.00% 8.45%
Global Equities MSCI World (net) Index 1.50% 5.75%
International Equities - Developed MSCI World Ex USA (net) 10.00% 5.45%
International Equities - Emerging MSCI World Ex USA (net) 8.00% 6.45%
Investment-Grade Bonds Barclays Capital Aggregate Bond Index 3.00% 1.00%
High Yield Bonds Citigroup High-Yield Cash-Pay Capped Index 3.00% 5.10%
Opportunistic Credit Citigroup High-Yield Cash-Pay Capped Index 2.00% 5.09%
Direct Lending Citigroup High-Yield Cash-Pay Capped Index 5.00% 6.40%
Distressed Debt Citigroup High-Yield Cash-Pay Capped Index 3.00% 8.10%
REIT Equities 67% FTSE NAREIT Equity REITs Index + 33% FRSE EPRA/NAREIT Global Real Estate Index 3.00% 4.00%
Master Limited Partmerships ("MLPs") Alerian MLP Index 3.00% 6.80%
Private Real Estate Partnerships Cambridge Associates Real Estate Index (4) 5.00% 6.90%
Hedge Funds Hedge Fund Research, Inc. ("HFRI") Fund of Funds Composite Index 25.00% 5.25%
(1) Target asset allocation adopted at the April 2016 TCDRS Board meeting. (2) Geometric real rates of return in addition to assumed inflation of 1.6%, per Cliffwater’s 2016 capital market assumptions. (3) Includes vintage years 2006-present of Quarter Pooled Horizon IRRs. (4) Includes vintage years 2007-present of Quarter Pooled Horizon IRRs.
Target Allocation (1)
Geometric Real Rate of Return
(Expected minus Inflation) (2)

61
D. Changes in the Net Pension Liability
Total Pension FiduciaryLiability Net Position
(a) (b)
Balances as of December 31, 2014 508,779,484$ 473,976,767$ 34,802,717$
Changes for the year:Service cost 17,634,188 17,634,188 Interest on total pension liability 41,231,027 41,231,027 Effect of plan changes (3,757,840) (3,757,840) Effect of economic/demographic gains or losses (4,826,769) (4,826,769) Effect of assumptions changes or inputs 5,221,392 5,221,392 Refund of contributions (1,116,367) (1,116,367) Benefit payments (17,480,536) (17,480,536) Administrative expenses (341,868) 341,868 Member contributions 8,950,888 (8,950,888) Net investment income (3,695,830) 3,695,830 Employer contributions 15,499,968 (15,499,968) Other (697,460) 697,460
Balances as of December 31, 2015 545,684,579$ 475,095,562$ 70,589,017$
Increase (Decrease)Net Pension
Liability (a) – (b)
E. Sensitivity Analysis The following presents the net pension liability of the county/district, calculated using the discount rate of 8.10%, as well as what the Fort Bend County net pension liability would be if it were calculated using a discount rate that is 1 percentage point lower (7.10%) or 1 percentage point higher (9.10%) than the current rate.
1% Current 1%Decrease Discount Rate Increase
7.10% 8.10% 9.10%
Total pension liability 621,773,657$ 545,684,579$ 482,713,228$ Fiduciary net position 475,095,562 475,095,562 475,095,562 Net pension liability / (asset) 146,678,095$ 70,589,017$ 7,617,666$

62
F. Pension Expense and Deferred Outflows of Resources and Deferred Inflows of Resources Related to Pensions
For the year ended September 30, 2016, the County recognized pension expense of $18,063,556 as follows:
Pension Expense
Service cost 17,634,188$ Interest on total pension liability 41,231,027 Effect of plan changes (3,757,840) Administrative expenses 341,868 Member contributions (8,950,888) Expected investment return net of investment expenses (38,925,182) Recognition of deferred inflows/outflows of resources
Recognition of economic/demographic gains or losses (857,308) Recognition of assumption changes or inputs 870,232 Recognition of investment gains or losses 9,779,999
Other 697,460
Pension expense 18,063,556$
January 1, 2015 toDecember 31, 2015
Deferred Inflows / Outflows of Resources As of the measurement date of December 31, 2015, the deferred inflows and outflows of resources are as follows:
Deferred Inflowsof Resources
Differences between expected and actual experience $ $ 4,233,692 Changes of assumptions 4,351,160 Net difference between projected and actual earnings 37,864,200 Contributions made subsequent to measurement date 12,759,837
54,975,197$ 4,233,692$
Deferred Outflowsof Resources
Amounts currently reported as deferred outflows of resources and deferred inflows of resources related to pensions, excluding contributions made subsequent to the December 31 measurement date, will be recognized in pension expense as follows:
Year ended December 31:2016 9,792,924$ 2017 9,792,924 2018 9,792,924 2019 8,537,127 2020 65,769
Total 37,981,668$
NOTE 10 – DEFERRED COMPENSATION PLAN The County offers all of its full-time employees a deferred compensation plan created in accordance with Section 457 of the Internal Revenue Code. Nationwide Retirement Solutions, Security Benefit Life, and Edward Jones have been appointed as plan administrators. The plan permits employees to defer a portion

63
of their salary until future years. The deferred compensation is not available to the employees until termination, retirement, death, or emergency. Amounts of compensation deferred by employees under the plan provisions are disbursed to the plan administrators after each pay period. The plan administrators hold all funds invested in the plan and disburse funds to employees in accordance with plan provisions. The County does not maintain significant oversight of the plan administrators’ activities. NOTE 11 – OTHER POST-EMPLOYMENT BENEFITS (“OPEB”) A. Plan Description In addition to providing pension benefits through the Texas County and District Retirement System, the County sponsors and administers a single-employer defined benefit health care plan titled “Fort Bend County Employee Benefit Plan” (“Plan”). The Plan was established and approved by Fort Bend County Commissioners Court and Chapter 175 of the Local Government Code which provides eligible employees, retirees, and their eligible dependents with the following post-employment benefits: • Eligible retirees have a portion of their medical and dental insurance premiums paid by the County for participation with the County’s healthcare provider; and at the County’s cost to cover current employees. • Eligible dependents of retirees have a portion of their medical and dental insurance premiums paid by the County for participation with the County’s healthcare provider; and at the County’s cost to cover current employees. The Plan does not issue a separate, publicly available report. B. Funding Policy and Contribution Rates The contribution requirements of the County and plan members are established and may be amended by Commissioners Court. These contributions are neither guaranteed nor mandatory. The County has retained the right to unilaterally modify its payments toward retiree healthcare benefits. The Plan provides for the payment of a portion of the health and dental insurance premiums for eligible retired employees and their dependents. Plan members receiving benefits contribute a percentage of the monthly insurance premium. Currently, the Plan pays a portion of the retiree’s premiums, as well as his or her dependent coverage. The retiree contributes the premium cost each month, less the Plan subsidy. The County is statutorily required to permit retiree participation in the health insurance program on a pooled non-differentiated basis. The County, therefore, charges both groups an equal, blended rate premium. Although both groups are charged the same rate, GAAP requires the actuarial figures to be calculated using age adjusted premiums approximating claim costs for retirees separately from active employees. The use of age adjusted premiums results in the addition of an implicit rate subsidy into the actuarial accrued liability. However, the County has elected to contribute to the Plan at a rate that is based on an actuarial valuation prepared using the blended rate premium that is actually charged to the Plan. The County recognizes its share of the costs of providing these benefits when paid, on a “pay-as-you-go” basis. These payments are budgeted annually. As of September 30, 2016, there were 824 retirees receiving benefits and approximately 2,752 active members not yet receiving benefits. Commencing in fiscal 2008, the County implemented GASB Statement No. 45 “Accounting and Financial Reporting by Employers for Post-employment Benefits Other Than Pensions.” The County has performed an actuarial valuation of its post-retirement benefit liability. The financial statement disclosures for 2016 are as follows:

64
C. Annual OPEB Costs and Net OPEB Obligation For fiscal year 2016, the County’s annual OPEB cost for the Plan was $42,570,952. The County’s annual OPEB cost, the percentage of annual OPEB cost contributed to the Plan, and the net OPEB obligation for the year ended September 30, 2016, were as follows:
Fiscal Year Ending 9/30/16
Determination of Annual Required ContributionNormal Cost at Fiscal Year End 23,303,760$ Amortization of Unfunded Actuarial Accrued Liability 22,720,479 Annual Required Contribution ("ARC") 46,024,239
Determination of Net OPEB ObligationAnnual Required Contribution 46,024,239 Interest on prior-year Net OPEB Obligation 8,851,254 Adjustment to ARC (12,304,541) Annual OPEB Cost 42,570,952
Less Assumed Contributions Made (6,954,340) Estimated Increase in Net OPEB Obligation 35,616,612
Net OPEB Obligation - Beginning of Year 221,281,360
Net OPEB Obligation - End of Year 256,897,972$
Percentage of OPEB Cost Contributed 16.3%
D. Trend Information The following table shows the estimated annual OPEB cost and net OPEB obligation for the prior three years assuming the plan is not prefunded (4% discount):
Fiscal Year Ended
Discount Rate
Annual OPEB Cost
Percentage of OPEB Cost Contributed
Net OPEB Obligation
2014 4% $ 35,741,230 13.3% $ 189,759,358 2015 4% $ 36,980,392 14.8% $ 221,281,360 2016 4% $ 42,570,952 16.3% $ 256,897,972
E. Funded Status and Funding Progress A schedule of funded status as of the most recent actuarial valuation is as follows:
Actuarial valuation date October 1, 2015Actuarial value of plan assets (a) 0$ Actuarial accrued liability ("AAL") (b) 350,708,226$ Unfunded/(Overfunded) actuarial accrued
liability ("UAAL" or "OAAL") (b-a) 350,708,226$ Funded Ratio (a/b) 0.0%Annual Covered Payroll (c) 127,676,972$ UAAL or OAAL as % of covered payroll
((b-a)/c) 274.7%

65
Actuarial valuations of an ongoing plan involve estimates of the value of reported amounts and assumptions about the probability of occurrence of events far into the future. Examples include assumptions about future employment, mortality, and the healthcare cost trend. Amounts determined regarding the funded status of the plan and the annual required contributions of the employer are subject to continual revision as actual results are compared with past expectations and new estimates are made about the future. The schedule of funding progress, presented as required supplementary information following the notes to the financial statements, presents multi-year trend information about whether the actuarial value of plan assets is increasing or decreasing over time relative to the actuarial accrued liability. F. Actuarial Methods and Assumptions The actuarial cost method used for determining the benefit obligations is a Projected Unit Credit Cost Method. Under this method, the actuarial present value of projected benefits is the value of benefits expected to be paid for current actives and retirees and is calculated based on certain assumptions and census data. The amortization period and method utilized was a 30 year level dollar closed period. The Actuarial Accrued Liability (“AAL”) is the actuarial present value of benefits attributed to employee service rendered prior to the valuation date. The AAL equals the present value of benefits multiplied by a fraction equal to service to date over service at expected retirement. The Normal Cost is the actuarial present value of benefits attributed to one year of service. This equals the present value of benefits divided by service at expected retirement. Since retirees are not accruing any more service, their normal cost is zero. In determining the Annual Required Contribution, The Unfunded AAL is amortized as a level dollar over 30 years. The actuarial assumptions included a 4% per annum discount rate for valuing liabilities. Employees eligible for retiree medical benefits assumed to elect continued medical coverage in retirement for themselves and their spouses is 100% and 40% respectively. The valuation assumes the following:
Healthcare cost trend rates: o Pre-65 trend begins at 6.2% in fiscal year 2011 and falls to 4.7% in 2089. o Post-65 trend begins at 6.2% in fiscal year 2011 and falls to 4.8% in 2099. o Dental trend begins at 5.86% in fiscal year 2011 and falls to 3.95% in 2024.
4% per annum discount rate for valuing liabilities. Employees eligible for retiree medical benefits assumed to elect continued medical coverage in
retirement for themselves and their spouses is 100% and 40% respectively. 2.75% inflation rate. No projected salary increases.
NOTE 12 – NET PENSION OBLIGATION AND OTHER POST-EMPLOYMENT BENEFITS FUNDING IN PRIOR YEARS The governmental funds that have been used to fund the net pension obligation and other post-employment benefit obligations in prior years have been the General Fund and the Drainage District Fund. The Drainage District Fund has only funded these obligations for retirees that worked for that department through the date of their retirement. All other obligations for retirees have been funded within the General Fund.

66
NOTE 13 – FUND BALANCES Fund balances are presented in the following categories: nonspendable, restricted, committed, assigned, and unassigned, as described in Note 1. Fund balances for all the major and non-major governmental funds as of September 30, 2016, were distributed as follows:
Debt Capital Non-majorGeneral Service Project Special Revenue
Fund Fund Funds Funds TotalsNonspendable:
Prepaid items 270,023$ $ $ 28,044$ 298,067$ Subtotal 270,023 28,044 298,067
Restricted for:General administration 1,889 3,390,451 3,392,340 Financial administration 973 973 Administration of justice 245,276 3,452,656 3,697,932 Construction and maintenance 89,482,237 42,680,860 132,163,097 Health and welfare 10,758 136,997 147,755 Public safety 1,355,862 1,355,862 Library 626,017 626,017 Debt service 1,086,398 1,086,398
Subtotal 257,923 1,086,398 89,482,237 51,643,816 142,470,374
Committed to:Facility construction/renovation 625,957 625,957 Mobility road projects 1,906,590 1,906,590 Contract Management 165,200 165,200 Parks and Fairgrounds renovations 91,369 91,369 Highway 36 Rail Corridor 50,000 50,000 IT Infrastructure 176,459 176,459 Wetlands Mitigation 436,500 436,500 Willow Fork Drainage Project 34,381 34,381 Special Projects-Commissioners Court 603,032 603,032 Software projects 2,632,561 2,632,561 Right-of-way acquisitions 1,556,236 1,556,236
Subtotal 8,278,285 8,278,285
Unassigned 37,882,243 (12,510) 37,869,733
Total Fund Balances 46,688,474$ 1,086,398$ 89,482,237$ 51,659,350$ 188,916,459$
NOTE 14 – CONTINGENCIES AND COMMITMENTS A. Construction Contract Commitments The County had several capital improvement commitments as of September 30, 2016. A contract between two parties does not result immediately in the recognition of a liability. Instead, a liability is incurred when performance has occurred under the contract. Until such time as performance takes place, these contracts represent a commitment rather than a liability. These commitments and their related construction in progress are summarized in Note 6. B. Litigation and Other Contingencies The County is contingently liable with respect to lawsuits and other claims in the ordinary course of its operations. The settlement of such contingencies under the budgetary process would not materially affect the financial position of the County as of September 30, 2016.

67
NOTE 15 - RISK MANAGEMENT The County is exposed to various risks related to torts: theft of, damage to, and destruction of assets; errors and omissions; and natural disasters. The County's risk management program encompasses various means of protecting the County against loss through self-insurance and obtaining property, casualty, and liability coverage through commercial insurance carriers. Settled claims have not exceeded insurance coverage in any of the previous three fiscal years. There has not been any significant reduction in insurance coverage from that of the previous year. Liabilities have been recorded for workers’ compensation, auto liability, general liability, and employee benefits. These liabilities are recorded when it is probable that a loss has occurred and the amount can be reasonably estimated. Liabilities include an amount for claims that have been incurred but not reported (“IBNR”). The result of the process to estimate the claims liability is not an exact amount as it depends on many complex factors, such as inflation, changes in legal doctrines, and damage awards. Accordingly, claims are reevaluated periodically to consider the effects of inflation, recent claim settlement trends, and other economic and social factors. The estimate of the claims liability also includes amounts for incremental claim adjustment expenses regardless of whether allocated to specific claims. Non-incremental claim adjustment expenses have not been included as part of the liability for claims and judgments. However, estimated recoveries, for example from salvage or subrogation, are another component of the claims liability estimate. A summary of the changes in the balances of claims liabilities for the years ended September 30, 2016 and 2015 is as follows:
Employee Benefits:Year ended Year ended
9/30/16 9/30/15
Unpaid claims, beginning of year 2,970,451$ 3,653,931$ Incurred claims (including IBNRs) 29,534,115 34,888,587 Claim payments (29,577,387) (35,572,067) Unpaid claims, end of year 2,927,179$ 2,970,451$
Other Insurance:Year ended Year ended
9/30/16 9/30/15
Unpaid claims, beginning of year 3,475,912$ 3,449,991$ Incurred claims (including IBNRs) 436,046 2,884,017 Claim payments (360,231) (2,858,096) Unpaid claims, end of year 3,551,727$ 3,475,912$
NOTE 16 – DEFICIT NET POSITION As of September 30, 2016, the Fort Bend Grand Parkway Toll Road Authority has a deficit net position of $7,122,920. This is caused by the issuance of bonds for the construction of the tolled overpasses along State Highway 99. Operating revenues from toll collections began in February 2014. Therefore, sufficient assets have not yet been generated to offset the liabilities, resulting in a deficit net position. NOTE 17 – RESTATEMENT OF BEGINNING NET POSITION Restatement of Capital Assets During the 2016 fiscal year, it was discovered that in prior years, the County had understated the capitalized value of infrastructure donated to the County by other municipalities within the County, and understated the value of the construction in progress and capitalized value of roads built by the County. Therefore, during the 2016 fiscal year, the County made adjustments to its capital asset records to correct for these understatements, as well as minor adjustments to other capital assets due to misclassifications.

68
As a result of these adjustments, the County has restated its beginning capital asset amounts and accumulated depreciation, increasing beginning net position by $479,547,228. The detail of this restatement is as follows:
Capital Assets:Construction in progress 12,945,789$ Vehicles 18,000 Machinery and equipment 14,584 Infrastructure 522,749,930
535,728,303 Accumulated Depreciation:
Vehicles 18,000 Machinery and equipment 731 Infrastructure 56,162,344
56,181,075 Net restatement due to capital assets 479,547,228$
NOTE 18 – SUBSEQUENT EVENTS Fort Bend County issued approximately $3.8 million in tax notes in January 2017 to fund the construction of West Bellfort Road from Binion Lane to Harlem Road. The debt service on these notes will be paid from a Joint Participation agreement with the Municipal Utility District and a sales tax allocation from the Management District which the new road is located within.
69
Required Supplementary Information

70
FORT BEND COUNTY, TEXASSCHEDULE OF REVENUES, EXPENDITURES, AND CHANGES page 1 of 10
IN FUND BALANCE - BUDGET AND ACTUALGENERAL FUND - BUDGETARY BASISFor the Year Ended September 30, 2016
Actual VarianceAmounts from Final
Original Final Budgetary PositiveBudget Budget Basis (Negative)
RevenuesProperty taxes 206,218,766$ 206,218,766$ 208,164,429$ 1,945,663$ Fines and fees 28,548,350 28,548,350 29,733,212 1,184,862 Intergovernmental 6,321,616 6,321,616 5,627,816 (693,800) Earnings on investments 552,000 552,000 861,601 309,601 Miscellaneous 2,898,350 2,898,350 3,272,137 373,787 Total Revenues 244,539,082 244,539,082 247,659,195 3,120,113
ExpendituresGeneral AdministrationCounty Judge:
Salaries and personnel costs 663,806 658,806 658,613 193 Operating costs 16,648 14,197 14,108 89 Information technology costs 250 401 371 30
Commissioner Precinct 1:Salaries and personnel costs 451,960 452,109 452,109 Operating costs 12,660 8,670 8,661 9
Commissioner Precinct 2:Salaries and personnel costs 587,193 589,008 587,367 1,641 Operating costs 33,218 33,166 31,816 1,350 Information technology costs 52 52
Commissioner Precinct 3:Salaries and personnel costs 589,098 526,645 526,597 48 Operating costs 34,169 25,149 23,928 1,221 Information technology costs 750 592 158
Commissioner Precinct 4:Salaries and personnel costs 427,057 421,857 421,837 20 Operating costs 11,857 8,511 8,299 212 Information technology costs 546 473 73
County Clerk: Salaries and personnel costs 3,872,577 3,820,579 3,820,306 273 Operating costs 97,744 95,144 94,851 293 Information technology costs 27,138 27,138 26,330 808
Non-Departmental: Salaries and personnel costs 4,748,401 5,098,565 5,098,401 164 Operating costs 9,853,042 8,217,564 8,070,732 146,832 Information technology costs 1,230 1,230 Capital acquisitions 2,071,361 2,070,361 1,000
Risk Management/Insurance: Salaries and personnel costs 809,121 779,785 779,761 24 Operating costs 176,516 164,116 139,983 24,133 Information technology costs 601 601 551 50 Capital acquisitions 10,000 7,200 7,185 15

71
FORT BEND COUNTY, TEXASSCHEDULE OF REVENUES, EXPENDITURES, AND CHANGES page 2 of 10
IN FUND BALANCE - BUDGET AND ACTUALGENERAL FUND - BUDGETARY BASISFor the Year Ended September 30, 2016
Actual VarianceAmounts from Final
Original Final Budgetary PositiveBudget Budget Basis (Negative)
Elections Administrator:Salaries and personnel costs 693,105 680,199 680,159 40 Operating costs 205,465 205,465 203,850 1,615
Elections Services: Salaries and personnel costs 292,556 321,336 321,295 41 Operating costs 272,800 278,500 263,675 14,825 Information technology costs 9,400 9,400 9,357 43
Human Resources: Salaries and personnel costs 829,590 822,636 822,614 22 Operating costs 193,550 157,780 157,567 213 Information technology costs 1,450 1,402 48 Capital acquisitions 5,320 5,320
Vehicle Maintenance: Salaries and personnel costs 850,329 755,589 755,506 83 Operating costs (1,111,708) (933,587) (948,673) 15,086 Information technology costs 45 30 15 Capital acquisitions 276,746 203,631 203,563 68
Records Management: Salaries and personnel costs 384,233 368,753 368,707 46 Operating costs 18,482 19,519 19,031 488 Information technology costs 14,186 7,579 7,579 Capital acquisitions 5,570 5,431 139
Central Mailroom: Salaries and personnel costs 217,566 217,566 215,730 1,836 Operating costs 555,313 600,313 599,196 1,117 Capital acquisitions 24,650 24,650 24,650
Facilities Management and Planning: Salaries and personnel costs 608,609 601,098 605,370 (4,272) Operating costs 38,600 33,969 32,605 1,364 Information technology costs 2,030 1,664 366 Capital acquisitions 16,550 24,151 24,150 1
Facilities Maintenance: Salaries and personnel costs 902,461 881,587 881,587 Operating costs 954,207 887,257 886,768 489 Information technology costs 11,500 13,700 13,669 31 Capital acquisitions 24,070 32,720 32,720
Facilities Operations: Salaries and personnel costs 216,201 196,772 196,697 75 Operating costs 4,423,282 4,119,982 4,111,227 8,755
Janitorial: Salaries and personnel costs 579,701 565,980 565,976 4 Operating costs 622,215 612,515 611,751 764
Jail Maintenance:Salaries and personnel costs 725,481 654,527 654,480 47 Operating costs 750,828 479,028 478,992 36 Information technology costs 21,000 10,300 10,269 31

72
FORT BEND COUNTY, TEXASSCHEDULE OF REVENUES, EXPENDITURES, AND CHANGES page 3 of 10
IN FUND BALANCE - BUDGET AND ACTUALGENERAL FUND - BUDGETARY BASISFor the Year Ended September 30, 2016
Actual VarianceAmounts from Final
Original Final Budgetary PositiveBudget Budget Basis (Negative)
Interdepartmental Construction: Salaries and personnel costs 1,136,204 1,140,133 1,140,133 Operating costs 62,456 38,434 37,666 768 Capital acquisitions 67,440 55,440 55,325 115
County Attorney: Salaries and personnel costs 2,457,856 2,432,583 2,431,196 1,387 Operating costs 138,714 131,529 4,606,643 (4,475,114) Information technology costs 6,999 8,567 7,165 1,402 Capital acquisitions 12,617 24,650 (12,033)
Information Technology: Salaries and personnel costs 4,857,886 4,776,959 4,776,696 263 Operating costs 2,882,188 2,635,600 2,598,176 37,424 Information technology costs 292,500 358,871 358,664 207 Capital acquisitions 82,185 81,986 199
Purchasing: Salaries and personnel costs 893,865 877,007 876,979 28 Operating costs 28,866 28,620 26,290 2,330 Information technology costs 2,862 2,742 120
Capital Outlay-General Fund: Capital acquisitions 7,768,118
Total General Administration 56,637,116 48,471,887 52,691,509 (4,219,622)
Financial AdministrationCounty Auditor:
Salaries and personnel costs 2,122,741 2,083,431 2,083,343 88 Operating costs 23,735 56,935 56,597 338 Information technology costs 500 500 186 314
County Treasurer: Salaries and personnel costs 770,899 764,467 764,437 30 Operating costs 182,716 179,661 174,946 4,715 Information technology costs 4,000 400 207 193
Court Collections: Salaries and personnel costs 122,277 122,277 121,870 407 Operating costs 15,255 15,255 14,575 680 Information technology costs 375 375 163 212
EMS Collections: Salaries and personnel costs 439,124 415,424 415,413 11 Operating costs 152,629 178,142 143,126 35,016 Information technology costs 100 100 37 63
Tax Assessor/Collector: Salaries and personnel costs 4,420,658 4,399,641 4,399,545 96 Operating costs 287,487 271,975 271,917 58 Information technology costs 1,000 27,672 27,080 592 Capital acquisitions 9,160
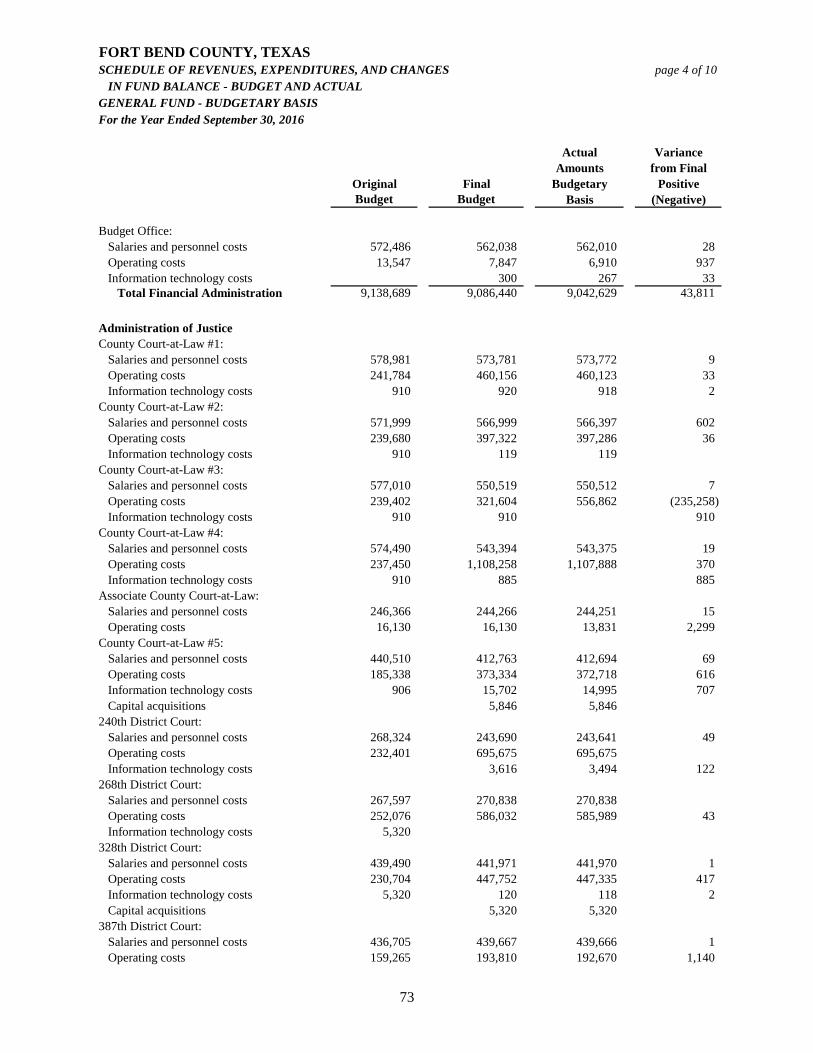
73
FORT BEND COUNTY, TEXASSCHEDULE OF REVENUES, EXPENDITURES, AND CHANGES page 4 of 10
IN FUND BALANCE - BUDGET AND ACTUALGENERAL FUND - BUDGETARY BASISFor the Year Ended September 30, 2016
Actual VarianceAmounts from Final
Original Final Budgetary PositiveBudget Budget Basis (Negative)
Budget Office: Salaries and personnel costs 572,486 562,038 562,010 28 Operating costs 13,547 7,847 6,910 937 Information technology costs 300 267 33
Total Financial Administration 9,138,689 9,086,440 9,042,629 43,811
Administration of JusticeCounty Court-at-Law #1:
Salaries and personnel costs 578,981 573,781 573,772 9 Operating costs 241,784 460,156 460,123 33 Information technology costs 910 920 918 2
County Court-at-Law #2: Salaries and personnel costs 571,999 566,999 566,397 602 Operating costs 239,680 397,322 397,286 36 Information technology costs 910 119 119
County Court-at-Law #3: Salaries and personnel costs 577,010 550,519 550,512 7 Operating costs 239,402 321,604 556,862 (235,258) Information technology costs 910 910 910
County Court-at-Law #4: Salaries and personnel costs 574,490 543,394 543,375 19 Operating costs 237,450 1,108,258 1,107,888 370 Information technology costs 910 885 885
Associate County Court-at-Law: Salaries and personnel costs 246,366 244,266 244,251 15 Operating costs 16,130 16,130 13,831 2,299
County Court-at-Law #5: Salaries and personnel costs 440,510 412,763 412,694 69 Operating costs 185,338 373,334 372,718 616 Information technology costs 906 15,702 14,995 707 Capital acquisitions 5,846 5,846
240th District Court: Salaries and personnel costs 268,324 243,690 243,641 49 Operating costs 232,401 695,675 695,675 Information technology costs 3,616 3,494 122
268th District Court: Salaries and personnel costs 267,597 270,838 270,838 Operating costs 252,076 586,032 585,989 43 Information technology costs 5,320
328th District Court: Salaries and personnel costs 439,490 441,971 441,970 1 Operating costs 230,704 447,752 447,335 417 Information technology costs 5,320 120 118 2 Capital acquisitions 5,320 5,320
387th District Court: Salaries and personnel costs 436,705 439,667 439,666 1 Operating costs 159,265 193,810 192,670 1,140

74
FORT BEND COUNTY, TEXASSCHEDULE OF REVENUES, EXPENDITURES, AND CHANGES page 5 of 10
IN FUND BALANCE - BUDGET AND ACTUALGENERAL FUND - BUDGETARY BASISFor the Year Ended September 30, 2016
Actual VarianceAmounts from Final
Original Final Budgetary PositiveBudget Budget Basis (Negative)
400th District Court: Salaries and personnel costs 268,588 269,494 269,493 1 Operating costs 212,550 930,915 929,834 1,081 Information technology costs 2,760 2,757 3
434th District Court: Salaries and personnel costs 273,315 274,449 274,448 1 Operating costs 239,050 1,163,413 1,138,919 24,494 Information technology costs 2,760 2,760 Capital acquisitions 520 520
505th District Court: Salaries and personnel costs 261,434 268,168 268,168 Operating costs 242,370 59,370 58,400 970 Information technology costs 800 3,560 2,987 573
Child Support: Salaries and personnel costs 465,232 446,492 446,417 75 Operating costs 17,544 17,544 16,377 1,167
District Clerk:Salaries and personnel costs 4,211,365 4,062,157 4,062,141 16 Operating costs 232,977 163,508 163,468 40 Information technology costs 24,957 15,626 15,619 7
District Clerk Jury Payments: Operating costs 300,000 203,500 203,277 223
Justice of the Peace Precinct #1, Place 1: Salaries and personnel costs 506,365 501,965 501,874 91 Operating costs 13,800 13,800 13,423 377
Justice of the Peace Precinct #1, Place 2: Salaries and personnel costs 656,999 642,216 642,174 42 Operating costs 19,125 19,125 17,814 1,311 Information technology costs 7,869 2,549 2,549 Capital acquisitions 5,320 5,320
Justice of the Peace Precinct #2: Salaries and personnel costs 520,328 512,648 512,632 16 Operating costs 30,950 30,950 29,284 1,666
Justice of the Peace Precinct #3: Salaries and personnel costs 616,055 616,055 615,811 244 Operating costs 13,700 13,700 11,317 2,383
Justice of the Peace Precinct #4: Salaries and personnel costs 529,384 528,106 526,352 1,754 Operating costs 12,136 12,136 11,258 878
Bail Bond Board: Salaries and personnel costs 90,651 90,676 90,676 Operating costs 2,781 2,781 1,887 894 Information technology costs 25 25 25

75
FORT BEND COUNTY, TEXASSCHEDULE OF REVENUES, EXPENDITURES, AND CHANGES page 6 of 10
IN FUND BALANCE - BUDGET AND ACTUALGENERAL FUND - BUDGETARY BASISFor the Year Ended September 30, 2016
Actual VarianceAmounts from Final
Original Final Budgetary PositiveBudget Budget Basis (Negative)
District Attorney: Salaries and personnel costs 9,880,263 9,678,653 9,678,639 14 Operating costs 604,815 335,338 325,718 9,620 Information technology costs 22,450 34,650 34,210 440 Capital acquisitions 87,700 66,225 66,200 25
Public Defender - Mental Health: Salaries and personnel costs 822,619 724,671 724,600 71 Operating costs 227,782 33,598 33,584 14 Information technology costs 4,120 4,720 3,904 816 Capital acquisitions 16,550 17,076 16,550 526
District Judges Fees/Services: Operating costs 3,000,000
Sheriff Detention Operating: Salaries and personnel costs 23,698,585 23,593,484 23,593,432 52 Operating costs 5,809,269 6,362,708 6,207,537 155,171 Information technology costs 23,075 23,075 19,672 3,403 Capital acquisitions 207,755 207,492 203,030 4,462
Sheriff - Bailiffs: Salaries and personnel costs 2,900,216 2,858,583 2,858,576 7 Operating costs 59,998 38,998 36,884 2,114 Information technology costs 6,723 6,723 4,928 1,795
240th,400th Dist Ct Assoc Jdg:Salaries and personnel costs 254,752 254,056 254,056 Operating costs 22,003 10,584 10,386 198 Information technology costs 600 769 769
Indigent Defense Program: Salaries and personnel costs 229,771 217,723 217,641 82 Operating costs 47,176 72,430 72,193 237
Behavioral Health Services: Salaries and personnel costs 323,719 300,469 299,622 847 Operating costs 15,873 18,339 18,211 128 Information technology costs 886 4,642 4,057 585
268th,434th Dist Ct Assoc Jdg: Salaries and personnel costs 169,768 170,423 170,423 Operating costs 10,303 10,545 10,214 331
Death Investigators: Operating costs 24,350 24,350 21,906 2,444
Adult Probation Operating: Salaries and personnel costs 78,588 80,189 78,998 1,191 Operating costs 85,904 64,104 64,037 67
CSR Program: Salaries and personnel costs 319,639 306,139 306,112 27 Operating costs 24,804 24,804 23,967 837
Drug Court - County: Operating costs 100,000 92,100 80,655 11,445

76
FORT BEND COUNTY, TEXASSCHEDULE OF REVENUES, EXPENDITURES, AND CHANGES page 7 of 10
IN FUND BALANCE - BUDGET AND ACTUALGENERAL FUND - BUDGETARY BASISFor the Year Ended September 30, 2016
Actual VarianceAmounts from Final
Original Final Budgetary PositiveBudget Budget Basis (Negative)
Juvenile Truancy Court: Salaries and personnel costs 324,378 301,578 301,493 85 Operating costs 10,375 2,875 2,805 70 Information technology costs 150 150 55 95
Total Administration of Justice 65,636,197 65,739,950 65,730,803 9,147
Construction and MaintenanceEngineering:
Salaries and personnel costs 2,187,149 2,096,252 2,096,052 200 Operating costs 518,568 262,468 220,412 42,056 Information technology costs 15,846 19,215 17,746 1,469 Capital acquisitions 86,504 93,135 93,134 1
Landfill: Salaries and personnel costs 41,326 27,926 27,870 56 Operating costs 85,635 58,635 55,630 3,005
Recycling Center: Salaries and personnel costs 138,938 134,038 133,967 71 Operating costs 47,647 56,138 55,529 609 Capital acquisitions 90,000 80,234 80,234
Household/Ag Waste Program: Salaries and personnel costs 37,569 29,169 29,107 62 Operating costs 58,906 64,506 63,968 538 Information technology costs 300 124 176 Capital acquisitions 5,932 5,932
Total Construction and Maintenance 3,308,088 2,927,948 2,879,705 48,243
Health and Human Services:Ambulance - EMS:
Salaries and personnel costs 10,760,338 11,146,120 11,146,120 Operating costs 1,328,777 1,214,070 1,210,694 3,376 Information technology costs 6,000 6,000 5,851 149 Capital acquisitions 796,580 792,780 793,199 (419)
Public Transportation: Operating costs 2,511,497 23,339 22,900 439
Health Department - County: Salaries and personnel costs 486,397 465,784 464,062 1,722 Operating costs 41,448 44,203 43,130 1,073 Information technology costs 100 845 845
Clinical Health Immunization: Salaries and personnel costs 365,041 356,941 356,843 98 Operating costs 20,975 20,975 19,223 1,752
Animal Control: Salaries and personnel costs 895,763 846,239 846,159 80 Operating costs 193,424 170,292 147,501 22,791 Information technology costs 1,946 1,946 1,946 Capital acquisitions 58,620 58,620 58,614 6

77
FORT BEND COUNTY, TEXASSCHEDULE OF REVENUES, EXPENDITURES, AND CHANGES page 8 of 10
IN FUND BALANCE - BUDGET AND ACTUALGENERAL FUND - BUDGETARY BASISFor the Year Ended September 30, 2016
Actual VarianceAmounts from Final
Original Final Budgetary PositiveBudget Budget Basis (Negative)
Health and Human Services: Salaries and personnel costs 506,271 502,671 502,626 45 Operating costs 629,227 777,476 672,438 105,038 Information technology costs 5,000 3,651 3,651
Senior Center: Salaries and personnel costs 271,744 252,313 251,912 401 Operating costs 19,245 18,990 18,184 806 Information technology costs 755 755
Environmental Services: Salaries and personnel costs 1,380,837 1,321,313 1,321,228 85 Operating costs 143,668 110,688 110,510 178 Information technology costs 1,500 1,500 1,496 4 Capital acquisitions 41,200 46,520 46,520
CIHC Coordinator - County: Salaries and personnel costs 597,512 599,709 599,705 4 Operating costs 1,526,374 1,955,599 1,933,310 22,289 Information technology costs 75 75 75
Social Services: Salaries and personnel costs 822,374 820,087 787,044 33,043 Operating costs 326,686 333,780 333,232 548 Information technology costs 1,986 1,792 1,791 1
Total Health and Welfare 23,740,605 21,895,073 21,699,543 195,530
Cooperative ServicesExtension Service:
Salaries and personnel costs 501,271 477,108 477,016 92 Operating costs 338,007 350,957 347,174 3,783 Information technology costs 100 350 257 93 Capital acquisitions 11,971 16,550 (4,579)
Veterans Service: Salaries and personnel costs 214,004 210,404 210,334 70 Operating costs 10,817 6,967 5,365 1,602 Information technology costs 50 500 315 185
Total Cooperative Services 1,064,249 1,058,257 1,057,011 1,246
Public SafetyCivil Service Commission:
Salaries and personnel costs 85,188 85,188 85,178 10 Operating costs 10,428 10,428 8,012 2,416 Information technology costs 50 50 50
Fire Marshal: Salaries and personnel costs 1,074,408 1,081,378 1,081,378 Operating costs 1,672,218 1,634,416 1,633,227 1,189 Information technology costs 7,775 7,775 7,409 366 Capital acquisitions 85,332 74,300 74,300

78
FORT BEND COUNTY, TEXASSCHEDULE OF REVENUES, EXPENDITURES, AND CHANGES page 9 of 10
IN FUND BALANCE - BUDGET AND ACTUALGENERAL FUND - BUDGETARY BASISFor the Year Ended September 30, 2016
Actual VarianceAmounts from Final
Original Final Budgetary PositiveBudget Budget Basis (Negative)
Department of Public Safety: Salaries and personnel costs 126,244 120,344 120,329 15 Operating costs 20,802 20,802 17,155 3,647 Information technology costs 3,700 3,700 3,609 91
DPS - License and Weight: Operating costs 5,673 5,673 4,272 1,401 Information technology costs 500 500 461 39
Constable Precinct #1: Salaries and personnel costs 1,598,405 1,560,356 1,560,288 68 Operating costs 180,805 112,581 110,954 1,627 Information technology costs 886 886 37 849 Capital acquisitions 49,245 40,873 40,873
Constable Precinct #2: Salaries and personnel costs 1,590,424 1,609,828 1,609,827 1 Operating costs 175,981 126,262 121,715 4,547 Information technology costs 1,000 874 126 Capital acquisitions 124,583 102,258 101,700 558
Constable Precinct #3: Salaries and personnel costs 1,117,472 984,614 984,598 16 Operating costs 163,851 123,362 122,246 1,116 Information technology costs 751 1,051 932 119 Capital acquisitions 28,975 26,100 26,097 3
Constable Precinct #4: Salaries and personnel costs 1,078,546 1,112,887 1,112,887 Operating costs 152,255 110,911 110,873 38 Information technology costs 2,525 6,496 6,495 1 Capital acquisitions 82,679 106,701 106,588 113
Sheriff Enforcement Operating: Salaries and personnel costs 29,672,154 29,576,904 29,576,904 Operating costs 4,679,117 3,410,259 3,314,033 96,226 Information technology costs 46,779 106,925 101,813 5,112 Capital acquisitions 1,588,265 1,118,958 1,118,957 1
Commissary Administration:Operating costs 94,307 19,399 74,908
Emergency Management - County: Salaries and personnel costs 510,292 532,528 532,527 1 Operating costs 115,790 91,534 88,725 2,809 Information technology costs 100 12,084 11,493 591 Capital acquisitions 5,972 5,972
Total Public Safety 46,052,198 44,020,191 43,822,137 198,054

79
FORT BEND COUNTY, TEXASSCHEDULE OF REVENUES, EXPENDITURES, AND CHANGES page 10 of 10
IN FUND BALANCE - BUDGET AND ACTUALGENERAL FUND - BUDGETARY BASISFor the Year Ended September 30, 2016
Actual VarianceAmounts from Final
Original Final Budgetary PositiveBudget Budget Basis (Negative)
Parks and RecreationFairgrounds:
Salaries and personnel costs 499,755 475,331 475,259 72 Operating costs 84,704 123,312 121,194 2,118 Information technology costs 192 191 1 Capital acquisitions 22,850 22,850 22,850
Jones Creek Ranch: Salaries and personnel costs 420,848 393,054 392,716 338 Operating costs 105,365 102,765 99,347 3,418 Information technology costs 5,842 5,842 5,350 492 Capital acquisitions 95,000 89,500 88,789 711
Parks Department: Salaries and personnel costs 1,320,872 1,246,770 1,246,509 261 Operating costs 680,808 600,808 576,445 24,363 Information technology costs 886 7,886 6,295 1,591 Capital acquisitions 143,940 141,940 141,723 217
Total Parks and Recreation 3,380,870 3,210,250 3,176,668 33,582 Libraries and EducationCounty Library Operating:
Salaries and personnel costs 11,756,006 11,528,115 11,527,836 279 Operating costs 3,341,668 3,385,583 3,385,074 509 Information technology costs 221,941 197,421 197,360 61 Capital acquisitions 218,397 171,002 170,488 514
Total Libraries and Education 15,538,012 15,282,121 15,280,758 1,363
Total Expenditures 224,496,024 211,692,117 215,380,763 (3,688,646)
Excess of Revenues Over Expenditures 20,043,058 32,846,965 32,278,432 (568,533)
Other Financing (Uses)Transfers (out) (14,831,864) (14,765,514) (13,539,414) 1,226,100 Total Other Financing (Uses) (14,831,864) (14,765,514) (13,539,414) 1,226,100
Net Change in Fund Balance-Budgetary Basis 5,211,194 18,081,451 18,739,018 657,567
Net Adjustment to ReflectOperations in Accordancewith GAAP (a) (17,984,600)
Fund Balance, Beginning of Year 45,934,056 45,934,056 45,934,056 Fund Balance, End of Year 51,145,250$ 64,015,507$ 46,688,474$ 657,567$
(a) See reconciliation on page 81.

80
FORT BEND COUNTY, TEXAS NOTES TO BUDGETARY REQUIRED SUPPLEMENTARY INFORMATION For the Year Ended September 30, 2015 Budgets Formal budgets are legally adopted on a GAAP basis for the General Fund, certain Special Revenue Funds and all Debt Service Funds except for the Fort Bend Parkway Road District Unlimited Tax Bonds Debt Service Fund. The debt service requirements relating to the Parkway bonds are funded solely from property taxes levied on property within the Road District. The County does not present any major Special Revenue Funds as of September 30, 2016, regardless of whether there is a legally adopted budget. Formal budgets (annualized budgeting) are not adopted in the Capital Projects Funds. Effective budgetary control in those funds is achieved through individual project budgeting in conformance with the provisions of bond orders and other sources. The County Budget Officer prepares the proposed budget and submits the data to the Commissioners Court. A public hearing is held on the budget before finalizing it. The Court may increase or decrease the amounts requested by the departments. In the final budget, which is usually adopted in the last quarter of the year, appropriations of the budgeted funds cannot exceed the available fund balances in such funds at October 1, plus the estimated revenues for the ensuing year. During the year, the Court may increase budgeted revenues and expenditures for unexpected revenues or beginning fund balances in excess of budget estimates, provided the Court rules that a state of emergency exists. The legal level of budgetary control takes place at the major operating group level within each department. The four major operating groups are: salary and personnel costs, operating and training costs, information technology costs, and capital acquisition costs. Budgetary transfers between major operating groups within each department require Commissioners Court approval. Amounts reported in the accompanying financial statements represent the original budgeted amount plus all supplemental appropriations. Budgetary Basis
Fort Bend County budgets for operational and capital activity through the fiscal year budget process for the General Fund, Road & Bridge, Drainage, and Debt Service Fund. The General Fund includes a multi-year budget that is not confined to the fiscal year ending September 30. This multi-year budget is used to account for capital projects, grants, and other activity expanding beyond the fiscal year. The funding for these projects and grants originates from a prior or current fiscal year budget allocation that is then transferred to the multi-year project budget. The following schedule shows a reconciliation of the actual activity in the General Fund in the fiscal year from a budgetary to GAAP basis.

81
Actual Amounts Actual AmountsBudgetary Actual GAAP
Basis Multi-Year BasisGeneral FundRevenues 247,659,195$ 33,975,821$ 281,635,016$ Expenditures 215,380,763 51,977,621 267,358,384 Excess (Deficiency) of Revenues
Over (Under) Expenditures 32,278,432 (18,001,800) 14,276,632
Other Financing Sources (Uses)Transfers in 17,200 17,200 Transfers (out) (13,539,414) (13,539,414) Total Other Financing Sources (Uses) (13,539,414) 17,200 (13,522,214)
Net Change in Fund Balance 18,739,018 (17,984,600) 754,418 Fund Balance, Beginning of Year 45,934,056 Fund Balance, End of Year 46,688,474$
Excess of Expenditures over Appropriations For the year ended September 30, 2016, significant variances where expenditures exceeded appropriations in the following budget categories are detailed below:
General Fund:General Administration:
Facilities Management and Planning - Salaries and personnel costs 4,272$ County Attorney - Operating costs 4,475,114 County Attorney - Capital acquistions 12,033
Administration of Justice:County Court-at-Law #3 - Operating costs 235,258
Health and Welfare:Ambulance - EMS - Capital acquisitions 419
Cooperative Services:Extension Service - Capital acquisitions 4,579
Debt Service Fund:Total expenditures 112,391
The excess expenditures in the General Fund for County Court-at-Law #3, Ambulance – EMS, and Extension Service were funded from other available budgets within each governmental function. The excess expenditures for County Attorney caused an overall budget deficit in general administration, which was unable to be funded by the other governmental functions within General Fund, but did not cause a deficit for the General Fund overall. Procedures have been put in place to prevent these excess expenditures over budget in the future.

82
FORT BEND COUNTY, TEXAS REQUIRED PENSION SUPPLEMENTARY INFORMATION SCHEDULE OF FUNDING PROGRESS TEXAS COUNTY AND DISTRICT RETIREMENT SYSTEM September 30, 2016 TEXAS COUNTY AND DISTRICT RETIREMENT SYSTEM (UNAUDITED)Schedule of Changes in Net Pension Liability and Related Ratios
Measurement MeasurementYear Year2015 2014
Total pension liability:Service cost 17,634,188$ 16,523,133$ Interest on total pension liability 41,231,027 38,158,329 Effect of plan changes (3,757,840) Effect of assumptions changes or inputs 5,221,392 Effect of economic/demographic gains or losses (4,826,769) (317,076) Benefit payments, including refunds of employee contributions (18,596,903) (16,821,825) Net change in total pension liability 36,905,095 37,542,561
Total pension liability - Beginning of Year 508,779,484 471,236,923
Total pension liability - End of Year (a) 545,684,579$ 508,779,484$
Plan fiduciary net position:Member contributions 8,950,888$ 8,374,898$ Employer contributions 15,499,968 14,592,621 Net investment income (3,695,830) 29,818,164 Benefit payments, including refunds of employee contributions (18,596,903) (16,821,825) Administrative expenses (341,868) (351,781) Other (697,460) (187,536) Net change in plan fiduciary net position 1,118,795 35,424,541
Plan fiduciary net position - Beginning of Year 473,976,767 438,552,226
Plan fiduciary net position - End of Year (b) 475,095,562 473,976,767
Net pension liability - End of Year (a) - (b) 70,589,017$ 34,802,717$
Plan fiduciary net position as a percentage of total pension liability 87.06% 93.16%
Covered employee payroll (measurement year) 127,676,972$ 119,513,775$
Net pension liability as a percentage of covered employee payroll 55.29% 29.12%
Note: GASB 68 requires 10 years of net pension liability and related ratios information. This information is not available and has not been calculated prior to the first measurement year ended December 31, 2014. In the future, such information will be used to populate this schedule as it becomes available.

83
FORT BEND COUNTY, TEXAS REQUIRED PENSION SUPPLEMENTARY INFORMATION SCHEDULE OF FUNDING PROGRESS TEXAS COUNTY AND DISTRICT RETIREMENT SYSTEM September 30, 2016 TEXAS COUNTY AND DISTRICT RETIREMENT SYSTEM (UNAUDITED)Schedule of ContributionsLast Ten Fiscal Years
Year ending September 30
Actuarially determined contribution
Actual contributions
Contribution deficiency (excess)
Covered employee
payroll
2016 16,282,073$ 16,282,073$ 141,373,051$ 11.5%
2015 15,237,042 15,237,042 125,320,314 12.2%
2014 14,139,360 14,139,360 117,481,100 12.0%
2013 12,681,672 12,681,672 110,913,229 11.4%
2012 12,127,523 12,127,523 110,352,543 11.0%
2011 11,418,711 11,418,711 106,734,729 10.7%
2010 11,235,138 11,235,138 105,310,643 10.7%
2009 10,187,718 10,187,718 99,913,522 10.2%
2008 9,110,858 9,110,858 89,502,142 10.2%
2007 8,097,682 8,097,682 78,967,489 10.3%
Contributions as a percentage of covered
employee payroll

84
FORT BEND COUNTY, TEXAS NOTES TO PENSION REQUIRED SUPPLEMENTARY INFORMATION For the Year Ended September 30, 2016 Valuation Timing Actuarially determined contribution rates are calculated as of
December 31, two years prior to the end of the fiscal year in which thecontributions are reported.
Actuarial Cost Method Entry Age Normal
Actuarial Cost Method Recognition of economic/demographic
gains or losses Straight-Line amortization over Expected Working LifeRecognition of assumptions changes
or inputs Straight-Line amortization over Expected Working Life
Asset Valuation MethodSmoothing period 5 years Recognition method Non-asymptoticCorridor None
Inflation 3.00%
Salary Increases 3.50%
Investment Rate of Return 8.10%
Cost-of-Living Adjustments Cost-of-Living Adjustments for Fort Bend County are not consideredto be substantively automatic under GASB 68. Therefore, noassumption for future cost-of-living adjustments is included in theGASB calculations. No assumption for future cost-of-living adjustments is included in the funding valuation.
Mortality Depositing members The RP-2000 Active Employee Mortality Table for males with a two-
year set-forward and the RP-2000 Active Employee Mortality Tablefor females with a four-year setback, both projected to 2014 with ascale AA,and then projected with a 110% of the MP-2014 Ultimatescale after that.
Service retirees, beneficiaries and non-depositing members
The RP-2000 Combined Mortality Table projected to 2014 with scaleAA, and then projected with 110% of the MP-2014 Ultimate scaleafter that, with a one-year set-forward for males and no age adjustmentfor females.
Disabled retirees RP-2000 Disabled Mortality Table projected to 2014 with scale AAand then projected with 110% of the MP-2014 Ultimate scale afterthat, with no age adjustment for males and a two-year set-forward forfemales.

85
FORT BEND COUNTY, TEXAS REQUIRED OTHER POST EMPLOYMENT BENEFIT SUPPLEMENTARY INFORMATION SCHEDULE OF FUNDING PROGRESS FORT BEND COUNTY EMPLOYEE BENEFIT PLAN September 30, 2016
Unfunded UAAL asActuarial Actuarial Actuarial Actuarial % of Valuation Value of Discount Accrued Liability Accrued Liability Funded Covered Covered
Date Assets (a) Rate ("AAL") (b) ("UAAL") (b-a) Ratio (a/b) Payroll Payroll
10/1/2007 $ 0 4.0% $ 207,157,655 $ 207,157,655 0.0% $ 92,096,921 224.9%10/1/2009 $ 0 4.0% $ 240,282,297 $ 240,282,297 0.0% $ 104,983,019 228.9%10/1/2011 $ 0 4.0% $ 255,897,447 $ 255,897,447 0.0% $ 108,712,740 235.4%10/1/2013 $ 0 4.0% $ 283,630,840 $ 283,630,840 0.0% $ 112,043,745 253.1%10/1/2015 $ 0 4.0% $ 350,708,226 $ 350,708,226 0.0% $ 127,676,972 274.7%
Note: Actuarial information is only available for Fort Bend County back to fiscal year 2008, the year that the County implemented GASB 45.

86

87
Other Supplementary Information

88

89
Combining and Individual Fund Statements and Schedules

90

91
FORT BEND COUNTY, TEXAS NON-MAJOR FUND DESCRIPTIONS
Special Revenue Funds Fort Bend County Assistance Districts This fund is used to account for the receipts and disbursements of the Fort Bend County Assistance Districts. Revenues are derived mainly from sales tax. These funds are restricted by state statute. This includes Funds 130, 131, 133, 134, and 135. Fort Bend County ESD 100 Agreement This fund is used to account for the receipts and disbursements from the sales tax allocation derived from the agreement with the Fort Bend County Emergency Services District 100. The District is a political subdivision of Texas that is entrusted with providing emergency medical and fire services to within its District boundaries. These funds are restricted by the interlocal agreement for mobility improvements along FM 1093 within the District. This includes Fund 145. Juvenile Operations This fund is used to account for the receipts and disbursements of the Fort Bend County Juvenile Probation Department. Monies deposited into this fund are received from the Fort Bend County General Fund as well as various state and federal agencies. These funds are restricted for the support of juvenile probation pursuant to state statutes and granting agencies with the exception of the nonspendable portion of fund balance which is due to prepaid items. This includes Fund 150. Road and Bridge This fund is used to account for the costs associated with the construction and maintenance of roads and bridges. Revenues are derived mainly from ad-valorem taxes, intergovernmental revenues, and fees and fines. These funds are restricted pursuant to state statute with the exception of the nonspendable portion of fund balance which is due to prepaid items. This includes Fund 155. Drainage District This fund is used to account for the receipts and disbursements related to the reclamation and drainage of lands located within the County. Revenues are derived mainly from ad-valorem taxes. These funds are restricted pursuant to state statute with the exception of the nonspendable portion of fund balance which is due to prepaid items. This includes Fund 160. Lateral Road This fund is used to account for the receipts and disbursements of funds received from the State that are restricted for constructing new County roads and maintaining existing ones. These funds are restricted pursuant to state statute. This includes Fund 165. County Historical Commission This fund is used to account for funds donated to the County by private citizens and is restricted for spending on Texas historical markers. These funds are restricted pursuant to donor requirements. This includes Fund 170. Utility Assistance This fund is used to account for the receipts and disbursements related to private and public donations made to Fort Bend County. The monies are restricted for assisting Fort Bend County residents that demonstrate an inability to pay their various utility bills. These funds are restricted pursuant to grant and donor requirements. This includes Funds 175, 185, and 190.

92
County Law Library The law library fund was created by Commissioners Court pursuant to Article 1702h, Revised Texas Civil Statutes, for the establishment and maintenance of the County Law Library. Revenues are derived from law library fees assessed against each civil case filed in the County Court, County Court-at-Law, and the District Courts, except tax lawsuits. These funds are restricted pursuant to state statute with the exception of the nonspendable portion of fund balance which is due to prepaid items. This includes Fund 195. Gus George Law Academy This fund is used to account for the transactions of the school operations of the County Law Enforcement Academy. The program is mainly funded from reimbursements from the State via the Houston-Galveston Area Council. These funds are restricted pursuant to grant requirements with the exception of the nonspendable portion of fund balance which is due to prepaid items. This includes Fund 200. Library Donations This fund is used to account for donations by private citizens, which are used for the purchase of books and equipment for the County library system. These funds are restricted pursuant to donor requirements. This includes Fund 215. Probate Court Training This fund is used to account for the collection of certain probate fees, which are restricted for the use of continuing education of the probate staff pursuant to state statute. This includes Fund 235. Juvenile Alert Program This fund is used to account for fees collected from the parent, guardian, or custodian of a juvenile who participates in the alternative rehabilitation program administered by Juvenile Probation. These funds are restricted pursuant to state statute. This includes Fund 245. Juvenile Probation Special This fund is used to account for fees collected from the parent, guardian, or custodian of a juvenile who by order of a court, is required to pay the fee. The fees collected may only be used for juvenile probation or correction services or facilities. These funds are restricted pursuant to state statute. This includes Fund 250. District Attorney Bad Check Collection Fee This fund is used to account for the fees earned by the District Attorney for the collection of bad checks issued in the County. The District Attorney has the sole discretion to dispose of the fees. These funds are restricted pursuant to state statute. This includes Fund 260. Gus George Memorial This fund is used to account for the receipts and disbursements of funds that were donated to the County in memory of the late Gus George, former County Sheriff. The funds are restricted for law enforcement activities of the Sheriff's department pursuant to donor requirements. This includes Fund 265.
District Attorney Special Fun Run This fund is used to account for receipts and disbursements from proceeds of an annual fun run sponsored by local merchants through the District Attorney's office. The money is disbursed to Crime Victims Alliance Corporation with Commissioners Court approval. These funds are restricted pursuant to donor requirements. This includes Fund 275. County Attorney Salary Supplement This fund is used to account for funds received from the State to supplement the salary of the County Attorney and staff. These funds are restricted pursuant to state statute. This includes Fund 280.

93
Records Management - County This fund is used to account for fees assessed and collected in criminal cases to fund records management and preservation services performed by the County. These funds are restricted pursuant to state statute. This includes Fund 285. VIT Interest This fund is used to account for interest earned on prepayments of vehicle inventory taxes by automobile dealers. The money is held in an escrow bank account by the Tax Collector and the interest is used by the Tax Collector to defray the costs of administration. These funds are restricted pursuant to state statute. This includes Fund 290. Elections Contract This fund is used to account for receipts and expenditures related to money paid to the County Election Officer under an election services contract. As per Section 31.093, Texas Election Code the fund is administered by the Elections Administrator and audited by the County Auditor. These funds are restricted pursuant to state statute. This includes Fund 300. Asset Forfeitures This fund is used to account for the receipts and disbursements of funds awarded by the courts and confiscated from drug traffickers. These forfeitures are restricted for expenditures to deter drug trafficking activities in the County. These funds are restricted pursuant to state statute. This includes Funds 225, 255, 305, 310, 315, 320, 332, and 335. County Child Abuse Prevention This fund is used to account for fees collected by the County which are used to fund child abuse prevention programs in the County where the court is located. These funds are restricted pursuant to donor requirements. This includes Fund 355. Law Enforcement Officer’s Standards Education Grant This fund is used to account for funds provided to law enforcement officers for Texas Certified Law Enforcement Officers Standard Education certification that are restricted to be used for education and training. These funds are restricted pursuant to grant requirements. This includes Fund 360. Juvenile Title IV-E Foster Care This fund is used to account for federal funds received for eligible juvenile probation children and for administrative costs related to administering the Title IV-E program. These funds are restricted pursuant to grant requirements. This includes Fund 385. Child Protective Services This fund is used to account for all monies received by Children’s Protective Services (“CPS”). CPS receives money from the County, the State, and from other miscellaneous sources. These funds are restricted pursuant to donor and grant requirements. This includes Fund 390. Community Development Combined Funds This fund is used to account for monies received from various housing programs. The majority of monies is received from the U.S. Department of Housing and Urban Development (“HUD”) and is to be used for housing rehabilitation projects. The nonspendable portion of fund balance is due to prepaid items. This includes Fund 400. HOPE 3 Implementation and Program Sales These funds are used to account for the Hope 3 Planning Grant money received from the U.S. Department of Housing and Urban Development (“HUD”) to develop a home ownership program for low and moderate income families. These funds are restricted pursuant to grant requirements. This includes Fund 402.

94
Child Support Title IV-D Reimbursement This fund is used to account for monies received for processing child support payments. The amount of receipts depends on the number of child support payments processed. Expenditures from this fund are used for salaries, equipment and other costs related to the processing of child support payments. These funds are restricted pursuant to grant requirements. This includes Fund 410. Local Law Enforcement Block Grants These funds are used to account for federal funds that are to be used by county law enforcement agencies for the purpose of purchasing technological equipment and to assist the agencies in their overall operations. These funds are restricted pursuant to grant requirements. This includes Fund 415. Juvenile Justice Alternative Education This fund is used to account for amounts received to be used as start-up costs for a juvenile justice alternative education program. If funding exceeds start-up costs, the excess may be used for other costs incurred in operating the program. These funds are restricted pursuant to state statute. This includes Fund 425. Juvenile Probation - State Funds This fund is used to account for revenues received from the Texas Juvenile Justice Department ("TJJD"). The funds must be disbursed and restricted for use in accordance with TJJD regulations. This includes Fund 430. CSCD – Pre-trial Bond This fund is used to account for fees collected by the County from defendants participating in the pre-trial bond supervision program. The collected fees are used for costs associated with administering the program. These funds are restricted pursuant to state statute. This includes Fund 452. Adult Probation - State Funds This fund is used to account for revenues received from the Texas Department of Criminal Justice - Criminal Justice Assistance Division (“TDCJ-CJAD”), as well as probation fees collected by the Fort Bend County Community Supervision & Corrections Department (“CSCD”). The funds are disbursed and restricted in accordance with TDCJ-CJAD regulations. This includes Funds 440, 441, 442, 443, 444, 445, 447, 448, 450, 451, 453 and 454. East Fort Bend County Development Authority This fund is used to account for the operating activity of the Authority. These funds are restricted pursuant to state statute with the exception of the nonspendable portion of fund balance which is due to prepaid items.

95
Internal Service Funds Employee Benefits This fund is used to account for allocations from various County budgets and employee contributions to administer the self-funded medical/dental benefits plan. This includes Fund 850. Other Self-Funded Insurance This fund is used to account for allocations from various County budgets to administer the self-funded pool for the administration of workers' compensation, property and casualty insurance, and unemployment insurance. Unemployment insurance is administered through Texas Association of Counties’ self-funded consortium. This includes Fund 855.
Fiduciary Funds Agency Funds These funds are used to account for collections and disbursements of court costs, fees, fines, and other funds due to other entities for which the County serves as the fiscal agent.

96
FORT BEND COUNTY, TEXASCOMBINING BALANCE SHEETNON-MAJOR SPECIAL REVENUE FUNDSSeptember 30, 2016
FBC Assistance Districts
FBC ESD 100 Agreement
Juvenile Operations
Road and Bridge
AssetsCash and cash equivalents 16,894,936$ 3,919,100$ 680,922$ 10,825,565$
Taxes receivable, net 1,179,353 659,443
Grants receivable 6,372Other receivables 363,414 5,122 1,190,570
Due from other funds 97,620 14,824Prepaid items 6,540 2,037
Total Assets 18,074,289$ 4,282,514$ 796,576$ 12,692,439$
Liabilities and Fund BalancesLiabilities
Accounts payable $ $ $ $ Retainage payable 154,020Due to other funds 165,417 351,439 421,849 1,229,412Unearned revenues
Total Liabilities 165,417 505,459 421,849 1,229,412
Deferred Inflows of ResourcesUnavailable revenue-property taxes 659,443Unavailable revenue-other
Total Deferred Inflows of Resources 659,443
Fund Balances:Nonspendable 6,540 2,037 Restricted 17,908,872 3,777,055 368,187 10,801,547Unassigned
Total Fund Balances 17,908,872 3,777,055 374,727 10,803,584
Total Liabilities, Deferred Inflows of Resources, and Fund Balances 18,074,289$ 4,282,514$ 796,576$ 12,692,439$
Special Revenue Funds

97
page 1 of 4
Drainage District Lateral Road
County Historical
CommissionUtility
AssistanceCounty Law
LibraryGus George
Law Academy
9,930,195$ 741,809$ 4,313$ 48,906$ 1,180,559$ 522,572$
255,110
64,802 3,638 30,838
10,454 1,044 64010,260,561$ 741,809$ 4,313$ 52,544$ 1,212,441$ 523,212$
$ $ $ $ $ $
543,420 12,287 15,343 48,675
543,420 12,287 15,343 48,675
255,110
255,110
10,454 1,044 640 9,451,577 741,809 4,313 40,257 1,196,054 473,897
9,462,031 741,809 4,313 40,257 1,197,098 474,537
10,260,561$ 741,809$ 4,313$ 52,544$ 1,212,441$ 523,212$
Special Revenue Funds

98
FORT BEND COUNTY, TEXASCOMBINING BALANCE SHEETNON-MAJOR SPECIAL REVENUE FUNDS (continued)September 30, 2016
Library Donations
Probate Court Training
Juvenile Alert Program
Juvenile Probation
SpecialAssets
Cash and cash equivalents 121,432$ 91,246$ 51,016$ 125,570$
Taxes receivable, net
Grants receivable
Other receivables 520 145
Due from other funds
Prepaid items Total Assets 121,432$ 91,766$ 51,016$ 125,715$
Liabilities and Fund BalancesLiabilities
Accounts payable $ $ $ $ Retainage payableDue to other funds 1,881Unearned revenues
Total Liabilities 1,881
Deferred Inflows of ResourcesUnavailable revenue-property taxesUnavailable revenue-other
Total Deferred Inflows of Resources
Fund Balances:Nonspendable Restricted 119,551 91,766 51,016 125,715Unassigned
Total Fund Balances 119,551 91,766 51,016 125,715
Total Liabilities, Deferred Inflows of Resources, and Fund Balances 121,432$ 91,766$ 51,016$ 125,715$
Special Revenue Funds

99
page 2 of 4
District Attorney Bad
Check Collection Fee
Gus George Memorial
District Attorney
Special Fun Run
County Attorney Salary
Supplement
Records Management-
County VIT Interest
55,083$ 4,701$ 17,910$ 229,486$ 2,391,414$ 6,244$
550 82,188
55,633$ 4,701$ 17,910$ 229,486$ 2,473,602$ 6,244$
$ $ $ $ $ $
8,534 200 167,901 5,271
8,534 200 167,901 5,271
47,099 4,701 17,910 229,286 2,305,701 973
47,099 4,701 17,910 229,286 2,305,701 973
55,633$ 4,701$ 17,910$ 229,486$ 2,473,602$ 6,244$
Special Revenue Funds

100
FORT BEND COUNTY, TEXASCOMBINING BALANCE SHEETNON-MAJOR SPECIAL REVENUE FUNDS (continued)September 30, 2016
Elections Contract
Asset Forfeitures
County Child Abuse
Prevention
Law Enforcement
Officers' Standards Education
GrantAssets
Cash and cash equivalents 789,037$ 1,869,341$ 14,211$ 147,419$
Taxes receivable, net
Grants receivable
Other receivables 73,079 10,105 117
Due from other funds
Prepaid items Total Assets 862,116$ 1,879,446$ 14,328$ 147,419$
Liabilities and Fund BalancesLiabilities
Accounts payable $ $ $ $ Retainage payableDue to other funds 10,965 38,354Unearned revenues
Total Liabilities 10,965 38,354
Deferred Inflows of ResourcesUnavailable revenue-property taxesUnavailable revenue-other
Total Deferred Inflows of Resources
Fund Balances:Nonspendable Restricted 851,151 1,841,092 14,328 147,419Unassigned
Total Fund Balances 851,151 1,841,092 14,328 147,419
Total Liabilities, Deferred Inflows of Resources, and Fund Balances 862,116$ 1,879,446$ 14,328$ 147,419$
Special Revenue Funds

101
page 3 of 4
Juvenile Title IV-E Foster
Care
Child Protective Services
Community Development
Combined Funds
HOPE 3 Implementation
and Program Sales
Child Support Title IV-D
Reimbursement
Local Law Enforcement Block Grants
434,309$ 131,298$ $ 5,479$ 244,403$ 12,698$
11,049 545,382
2,103
1,167434,309$ 142,347$ 546,549$ 5,479$ 246,506$ 12,698$
$ $ $ $ $ $
24,962 19,678 546,549 749409,347 5,479 246,506 11,949434,309 19,678 546,549 5,479 246,506 12,698
1,167 122,669
(1,167) 122,669
434,309$ 142,347$ 546,549$ 5,479$ 246,506$ 12,698$
Special Revenue Funds

102
FORT BEND COUNTY, TEXASCOMBINING BALANCE SHEETNON-MAJOR SPECIAL REVENUE FUNDS (continued)September 30, 2016
Juvenile Justice
Alternative Education
Juvenile Probation - State Funds
CSCD Pre-trial Bond
Adult Probation - State Funds
AssetsCash and cash equivalents 122,534$ $ 858,440$ 1,481,362$
Taxes receivable, net
Grants receivable 258,306
Other receivables 68,909 401,764
Due from other funds
Prepaid items Total Assets 122,534$ 258,306$ 927,349$ 1,883,126$
Liabilities and Fund BalancesLiabilities
Accounts payable $ $ $ $ Retainage payableDue to other funds 24,026 258,306 17,478 184,527Unearned revenues 98,508 1,698,599
Total Liabilities 122,534 258,306 17,478 1,883,126
Deferred Inflows of ResourcesUnavailable revenue-property taxesUnavailable revenue-other
Total Deferred Inflows of Resources
Fund Balances:Nonspendable Restricted 909,871Unassigned
Total Fund Balances 909,871
Total Liabilities, Deferred Inflows of Resources, and Fund Balances 122,534$ 258,306$ 927,349$ 1,883,126$
Special Revenue Funds

103
page 4 of 4
Special Revenue Funds
East Fort Bend County
Development Authority
Totals Non-major Special
Revenue Funds
21,437$ 53,974,947$
2,093,906
821,109
2,297,864
112,444
6,162 28,04427,599$ 59,328,314$
32,780$ 32,780$ 154,020
4,097,2232,470,388
32,780 6,754,411
914,553
914,553
6,162 28,044 51,643,816
(11,343) (12,510) (5,181) 51,659,350
27,599$ 59,328,314$

104
FORT BEND COUNTY, TEXASCOMBINING STATEMENT OF REVENUES, EXPENDITURES, AND CHANGES IN FUND BALANCESNON-MAJOR SPECIAL REVENUE FUNDSFor the Year Ended September 30, 2016
FBC Assistance Districts
FBC ESD 100 Agreement
Juvenile Operations
Road and Bridge
RevenuesProperty taxes $ $ $ 17,860,816$ Sales taxes 6,958,956Fines and fees 7,199,621Intergovernmental 1,360,203 278,123 241,684Earnings on investments 84,539 23,025 40,256 101,766Miscellaneous 21,931 236,692Total Revenues 7,043,495 1,383,228 340,310 25,640,579 ExpendituresCurrent:
General administrationFinancial administrationAdministration of justice 13,445,391Construction and maintenance 2,923,838 20,769,335Health and human servicesPublic safetyParks and recreation 2,730Libraries and education
Capital Outlay 178,229 1,774,551 397,592 2,453,331Total Expenditures 3,104,797 1,774,551 13,842,983 23,222,666 Excess (Deficiency) of Revenues Over (Under) Expenditures 3,938,698 (391,323) (13,502,673) 2,417,913
Other Financing Sources (Uses)Transfers in 13,373,064Transfers (out)Total Other Financing Sources (Uses) 13,373,064
Net Change in Fund Balances 3,938,698 (391,323) (129,609) 2,417,913 Fund Balances, Beginning of Year 13,970,174 4,168,378 504,336 8,385,671 Fund Balances, End of Year 17,908,872$ 3,777,055$ 374,727$ 10,803,584$
Special Revenue Funds

105
page 1 of 4
Drainage District Lateral Road
County Historical
CommissionUtility
AssistanceCounty Law
LibraryGus George
Law Academy
11,461,905$ $ $ $ $ $
108,334 343,884 45,71562,635 25,515
66,935 3,905 23 221 6,269 3,018111,261 50,602
11,748,435 66,540 23 50,823 350,153 74,248
342,0077,940,342
65,091180,103
1,642,182 16,5509,582,524 65,091 342,007 196,653
2,165,911 66,540 23 (14,268) 8,146 (122,405)
2,165,911 66,540 23 (14,268) 8,146 (122,405) 7,296,120 675,269 4,290 54,525 1,188,952 596,942 9,462,031$ 741,809$ 4,313$ 40,257$ 1,197,098$ 474,537$
Special Revenue Funds

106
FORT BEND COUNTY, TEXASCOMBINING STATEMENT OF REVENUES, EXPENDITURES, AND CHANGES IN FUND BALANCESNON-MAJOR SPECIAL REVENUE FUNDS (continued)For the Year Ended September 30, 2016
Library Donations
Probate Court Training
Juvenile Alert Program
Juvenile Probation
SpecialRevenuesProperty taxes $ $ $ $ Sales taxesFines and fees 6,030IntergovernmentalEarnings on investments 662 467 269Miscellaneous 58,784 220 22,656Total Revenues 59,446 6,497 489 22,656 ExpendituresCurrent:
General administrationFinancial administrationAdministration of justice 678Construction and maintenanceHealth and human servicesPublic safetyParks and recreationLibraries and education 56,615
Capital OutlayTotal Expenditures 56,615 678 Excess (Deficiency) of Revenues Over (Under) Expenditures 2,831 6,497 489 21,978
Other Financing Sources (Uses)Transfers inTransfers (out)Total Other Financing Sources (Uses)
Net Change in Fund Balances 2,831 6,497 489 21,978 Fund Balances, Beginning of Year 116,720 85,269 50,527 103,737 Fund Balances, End of Year 119,551$ 91,766$ 51,016$ 125,715$
Special Revenue Funds

107
page 2 of 4
District Attorney Bad
Check Collection Fee
Gus George Memorial
District Attorney
Special Fun Run
County Attorney
Salary Supplement
Records Management-
County VIT Interest
$ $ $ $ $ $
13,263 917,4663,918 70,000
20 94 1,010 6,4708,448 2,725
25,629 2,745 94 71,010 917,466 6,470
61,338 917,6397,470
42,340
13,37042,340 61,338 931,009 7,470
(16,711) 2,745 94 9,672 (13,543) (1,000)
(16,711) 2,745 94 9,672 (13,543) (1,000) 63,810 1,956 17,816 219,614 2,319,244 1,973 47,099$ 4,701$ 17,910$ 229,286$ 2,305,701$ 973$
Special Revenue Funds

108
FORT BEND COUNTY, TEXASCOMBINING STATEMENT OF REVENUES, EXPENDITURES, AND CHANGES IN FUND BALANCESNON-MAJOR SPECIAL REVENUE FUNDS (continued)For the Year Ended September 30, 2016
Elections Contract
Asset Forfeitures
County Child Abuse
Prevention
Law Enforcement
Officers' Standards Education
GrantRevenuesProperty taxes $ $ $ $ Sales taxesFines and fees 1,254Intergovernmental 88,983 52,688Earnings on investments 4,513 9,754 715Miscellaneous 398,749 520,402Total Revenues 403,262 619,139 1,254 53,403 ExpendituresCurrent:
General administration 551,987Financial administrationAdministration of justice 54,347 1,200Construction and maintenanceHealth and human servicesPublic safety 324,693 15,574Parks and recreationLibraries and education
Capital Outlay 47,557 169,124Total Expenditures 599,544 548,164 16,774 Excess (Deficiency) of Revenues Over (Under) Expenditures (196,282) 70,975 1,254 36,629
Other Financing Sources (Uses)Transfers inTransfers (out)Total Other Financing Sources (Uses)
Net Change in Fund Balances (196,282) 70,975 1,254 36,629 Fund Balances, Beginning of Year 1,047,433 1,770,117 13,074 110,790 Fund Balances, End of Year 851,151$ 1,841,092$ 14,328$ 147,419$
Special Revenue Funds

109
page 3 of 4
Juvenile Title IV-E Foster
Care
Child Protective Services
Community Development
Combined Funds
HOPE 3 Implementation
and Program Sales
Child Support Title IV-D
Reimbursement
Local Law Enforcement Block Grants
$ $ $ $ $ $
24,962 12,482 2,542,710 83,102293 1,194 204111 173
24,962 12,886 2,542,883 1,194 83,306
24,962 1,194
172,644 2,542,88383,306
24,962 172,644 2,542,883 1,194 83,306
(159,758)
166,350
166,350
6,592 116,077 $ 122,669$ $ $ $ $
Special Revenue Funds

110
FORT BEND COUNTY, TEXASCOMBINING STATEMENT OF REVENUES, EXPENDITURES, AND CHANGES IN FUND BALANCESNON-MAJOR SPECIAL REVENUE FUNDS (continued)For the Year Ended September 30, 2016
Juvenile Justice
Alternative Education
Juvenile Probation - State Funds
CSCD Pre-trial Bond
Adult Probation - State Funds
RevenuesProperty taxes $ $ $ $ Sales taxesFines and fees 691,239 2,297,319Intergovernmental 267,331 2,402,670 3,106,649Earnings on investments 14,367Miscellaneous 8,000 9,696Total Revenues 267,331 2,402,670 699,239 5,428,031 ExpendituresCurrent:
General administrationFinancial administrationAdministration of justice 267,331 2,402,670 523,100 5,410,831Construction and maintenanceHealth and human servicesPublic safetyParks and recreationLibraries and education
Capital OutlayTotal Expenditures 267,331 2,402,670 523,100 5,410,831 Excess (Deficiency) of Revenues Over (Under) Expenditures 176,139 17,200
Other Financing Sources (Uses)Transfers in 224,056Transfers (out) (241,256) Total Other Financing Sources (Uses) (17,200)
Net Change in Fund Balances 176,139 Fund Balances, Beginning of Year 733,732 Fund Balances, End of Year $ $ 909,871$ $
Special Revenue Funds

111
page 4 of 4
Special Revenue Funds
East Fort Bend County
Development Authority
Totals Non-major Special
Revenue Funds
$ 29,322,721$ 6,958,956
115,000 11,739,12510,623,655
7 369,9961,450,450
115,007 60,464,903
120,188 1,651,1527,470
22,516,05131,633,515
2,780,618603,676
2,73056,615
6,692,486120,188 65,944,313
(5,181) (5,479,410)
13,763,470 (241,256) 13,522,214
(5,181) 8,042,804 43,616,546
(5,181)$ 51,659,350$

112
FORT BEND COUNTY, TEXASSCHEDULE OF REVENUES, EXPENDITURES, AND CHANGES
IN FUND BALANCE - BUDGET AND ACTUALROAD AND BRIDGE - BUDGETARY BASISFor the Year Ended September 30, 2016
Actual VarianceAmounts from Final
Original Final Budgetary PositiveBudget Budget Basis (Negative)
RevenuesProperty taxes 17,660,570$ 17,660,570$ 17,860,816$ 200,246$ Fines and fees 6,075,000 6,075,000 7,199,621 1,124,621 Intergovernmental 250,000 250,000 241,684 (8,316) Earnings on investments 35,000 35,000 101,766 66,766 Miscellaneous 345,000 345,000 236,692 (108,308) Total Revenues 24,365,570 24,365,570 25,640,579 1,275,009
ExpendituresCurrent:
Salaries and personnel costs 10,282,593 9,666,492 9,666,412 80 Operating costs 13,265,038 11,446,881 10,390,322 1,056,559 Information technology costs 1,590 1,590 1,574 16 Capital acquisitions 926,480 972,988 970,998 1,990
Total Expenditures 24,475,701 22,087,951 21,029,306 1,058,645
Net Change in Fund Balance-Budgetary Basis (110,131) 2,277,619 4,611,273 2,333,654
Net Adjustment to ReflectOperations in Accordancewith GAAP (a) (2,193,360)
Fund Balance, Beginning of Year 8,385,671 8,385,671 8,385,671 Fund Balance, End of Year 8,275,540$ 10,663,290$ 10,803,584$ 2,333,654$
(a) See reconciliation below.
Actual Amounts Actual Amounts
Budgetary Actual GAAPBasis Multi-Year Basis
Revenues 25,640,579$ $ 25,640,579$ Expenditures 21,029,306 2,193,360 23,222,666
Net Change in Fund Balance 4,611,273 (2,193,360) 2,417,913 Fund Balance, Beginning of Year 8,385,671 Fund Balance, End of Year 10,803,584$

113
FORT BEND COUNTY, TEXASSCHEDULE OF REVENUES, EXPENDITURES, AND CHANGES
IN FUND BALANCE - BUDGET AND ACTUALDRAINAGE DISTRICT - BUDGETARY BASISFor the Year Ended September 30, 2016
Actual VarianceAmounts from Final
Original Final Budgetary PositiveBudget Budget Basis (Negative)
RevenuesProperty taxes 11,435,816$ 11,435,816$ 11,461,905$ 26,089$ Fines and fees 25,000 25,000 108,334 83,334 Earnings on investments 20,000 20,000 66,935 46,935 Miscellaneous 65,000 65,000 111,261 46,261 Total Revenues 11,545,816 11,545,816 11,748,435 202,619
ExpendituresCurrent:
Salaries and personnel costs 5,951,996 5,656,418 5,656,281 137 Operating costs 2,555,289 2,172,702 2,052,917 119,785 Information technology costs 2,116 6,116 5,731 385 Capital acquisitions 952,600 1,212,765 1,212,264 501
Total Expenditures 9,462,001 9,048,001 8,927,193 120,808
Excess of Revenues Over Expenditures 2,083,815 2,497,815 2,821,242 323,427
Other Financing (Uses)Transfers (out) (1,151,391) (121,391) 121,391 Total Other Financing (Uses) (1,151,391) (121,391) 121,391
Net Change in Fund Balance-Budgetary Basis 932,424 2,376,424 2,821,242 444,818
Net Adjustment to ReflectOperations in Accordancewith GAAP (a) (655,331)
Fund Balance, Beginning of Year 7,296,120 7,296,120 7,296,120 Fund Balance, End of Year 8,228,544$ 9,672,544$ 9,462,031$ 444,818$
(a) See reconciliation below.
Actual Amounts Actual AmountsBudgetary Actual GAAP
Basis Multi-Year Basis
Revenues 11,748,435$ $ 11,748,435$ Expenditures 8,927,193 655,331 9,582,524
Net Change in Fund Balance 2,821,242 (655,331) 2,165,911 Fund Balance, Beginning of Year 7,296,120 Fund Balance, End of Year 9,462,031$

114
FORT BEND COUNTY, TEXASSCHEDULE OF REVENUES, EXPENDITURES, AND CHANGES
IN FUND BALANCE - BUDGET AND ACTUALDEBT SERVICE - BUDGETARY BASISFor the Year Ended September 30, 2016
Actual VarianceAmounts from Amended
Original Budget as Budgetary PositiveBudget Amended Basis (Negative)
Revenues
Property taxes 33,233,568$ 33,233,568$ 33,485,251$ 251,683$
Earnings on investments 30,000 30,000 56,403 26,403
Total Revenues 33,263,568 33,263,568 33,541,654 278,086
Expenditures
Debt Service - Non-specific 375,000 375,000 10,000 365,000
2007 Unlimited Tax Road Bonds 1,215,800 1,215,800 1,214,550 1,250
2007 Facilities Bonds 4,848,375 4,848,375 4,968,000 (119,625)
2009 Justice Center Bonds 6,039,313 6,039,313 4,740,281 1,299,032
2009 Unlimited Tax Road Bonds 3,777,913 3,777,913 2,994,688 783,225
2009 Unlimited Tax Road Bonds Refunding 2,356,850 2,356,850 2,355,350 1,500
2010 Fort Bend Flood Control Water Supply
Corporation Refunding 1,184,100 1,184,100 1,183,600 500
2012 Unlimited Tax Road Bonds 4,498,725 4,498,725 4,497,275 1,450
2014 Unlimited Tax Road Bonds Refunding 2,146,588 2,146,588 2,144,587 2,001
2015A Unlimited Tax Road and Refunding Bonds 3,499,900 3,499,900 3,498,900 1,000
2015B Facilities Refunding Bonds 4,495,400 4,495,400 4,494,400 1,000
2016A Unlimited Tax Road and Refunding Bonds 1,084,247 (1,084,247)
2016B Facilities and Justice Center Refunding Bonds 1,364,477 (1,364,477)
Total Expenditures 34,437,964 34,437,964 34,550,355 (112,391)
Excess (Deficit) of Revenues Over (Under) Expenditures (1,174,396) (1,174,396) (1,008,701) 165,695
Other Financing Sources (Uses)
Refunding bonds issued 73,120,000 73,120,000
Payment to refunded bond escrow agent (89,544,194) (89,544,194)
Premium on refunding bonds issued 15,739,791 15,739,791
Total Other Financing Sources (Uses) (684,403) (684,403)
Net Change in Fund Balance-
budgetary basis (1,174,396) (1,174,396) (1,693,104) (518,708)
Fund Balance, Beginning of Year 2,779,502 2,779,502 2,779,502 Fund Balance, End of Year 1,605,106$ 1,605,106$ 1,086,398$ (518,708)$

115
FORT BEND COUNTY, TEXASCOMBINING STATEMENT OF NET POSITION
INTERNAL SERVICE FUNDS
September 30, 2016
Employee Benefits
Other Self-Funded
Insurance TotalsAssetsCurrent Assets:
Cash and cash equivalents 6,578,017$ 4,498,122$ 11,076,139$ Due from other funds 30,826 5,264 36,090 Other receivables 291,469 10,229 301,698
Total Current Assets 6,900,312 4,513,615 11,413,927
Noncurrent Assets:Capital assets, not being depreciated Capital assets, net of accumulated depreciation 647,132 647,132
Total Noncurrent Assets 647,132 647,132
Total Assets 7,547,444 4,513,615 12,061,059
LiabilitiesCurrent Liabilities:
Benefits payable 2,927,179 3,551,727 6,478,906 Due to other funds 192,153 423,926 616,079
Total Current Liabilities 3,119,332 3,975,653 7,094,985
Total Liabilities 3,119,332 3,975,653 7,094,985
Net PositionNet investment in capital assets 647,132 647,132 Unrestricted 3,780,980 537,962 4,318,942
Total Net Position 4,428,112$ 537,962$ 4,966,074$

116
FORT BEND COUNTY, TEXASCOMBINING STATEMENT OF REVENUES, EXPENSES, AND
CHANGES IN FUND NET POSITION (DEFICIT)
INTERNAL SERVICE FUNDS
For the Year Ended September 30, 2016
Employee Benefits
Other Self-Funded
Insurance TotalsOperating RevenuesCharges for services 41,373,245$ 5,610,951$ 46,984,196$ Total Operating Revenues 41,373,245 5,610,951 46,984,196
Operating ExpensesCurrent operations - general administration 1,717,192 652,298 2,369,490 Benefits provided 35,083,700 2,921,307 38,005,007 Total Operating Expenses 36,800,892 3,573,605 40,374,497
Operating Income (Loss) 4,572,353 2,037,346 6,609,699
Non-Operating RevenuesEarnings on investments 11,361 11,361 Total Non-Operating Revenues 11,361 11,361
Change in Net Position (Deficit) 4,583,714 2,037,346 6,621,060
Total Net (Deficit), Beginning of Year (155,602) (1,499,384) (1,654,986)
Total Net Position, End of Year 4,428,112$ 537,962$ 4,966,074$

117
FORT BEND COUNTY, TEXASCOMBINING STATEMENT OF CASH FLOWS
INTERNAL SERVICE FUNDS
For the Year Ended September 30, 2016
Employee Benefits
Other Self-Funded
Insurance TotalsCash Flows from Operating ActivitiesCharges for services 40,976,902$ 5,817,797$ 46,794,699$ Payment of benefits (35,126,972) (2,845,492) (37,972,464) Payment of general administration expenses (1,678,701) (649,120) (2,327,821) Net Cash Provided by Operating Activities 4,171,229 2,323,185 6,494,414
Cash Flows from Investing Activities:Interest earned on investments 11,361 11,361 Net Cash Provided by Investing Activities 11,361 11,361
Cash Flows from Capital and Related Financing Activities:Purchase of capital assets (76,145) (76,145) Net Cash (Used) by Capital and Related
Financing Activities (76,145) (76,145)
Net Increase in Cash and Cash Equivalents 4,106,445 2,323,185 6,429,630
Cash and Cash Equivalents, Beginning of Year 2,471,572 2,174,937 4,646,509
Cash and Cash Equivalents, End of Year 6,578,017$ 4,498,122$ 11,076,139$
Reconciliation of Operating Income to Net CashProvided by Operating ActivitiesOperating Income 4,572,353$ 2,037,346$ 6,609,699$ Adjustments to operations:
Depreciation 38,491 38,491 Change in assets and liabilities:
Decrease in prepaid expenses 3,178 3,178 Decrease (Increase) in other receivables 41,553 (702) 40,851 Decrease in due from other funds 62,481 11,717 74,198 Increase (Decrease) in due to other funds (500,377) 195,831 (304,546) Increase (Decrease) in benefits payable (43,272) 75,815 32,543 Total Adjustments (401,124) 285,839 (115,285)
Net Cash Provided by Operating Activities 4,171,229$ 2,323,185$ 6,494,414$

118
FORT BEND COUNTY, TEXASSTATEMENT OF CHANGES IN ASSETS AND LIABILITIES - AGENCY FUNDSFor the Year Ended September 30, 2016
Balances Balances10/1/15 Increases Decreases 9/30/16
AssetsCash and cash equivalents 35,717,386$ 1,714,564,478$ 1,709,693,851$ 40,588,013$ Investments 1,002,295 1,002,295
Miscellaneous receivables 1,127,420 1,582,796 1,701,956 1,008,260Total Assets 36,844,806$ 1,717,149,569$ 1,711,395,807$ 42,598,568$
LiabilitiesDue to other governments 36,844,806$ 1,750,689,118$ 1,744,935,356$ 42,598,568$ Total Liabilities 36,844,806$ 1,750,689,118$ 1,744,935,356$ 42,598,568$
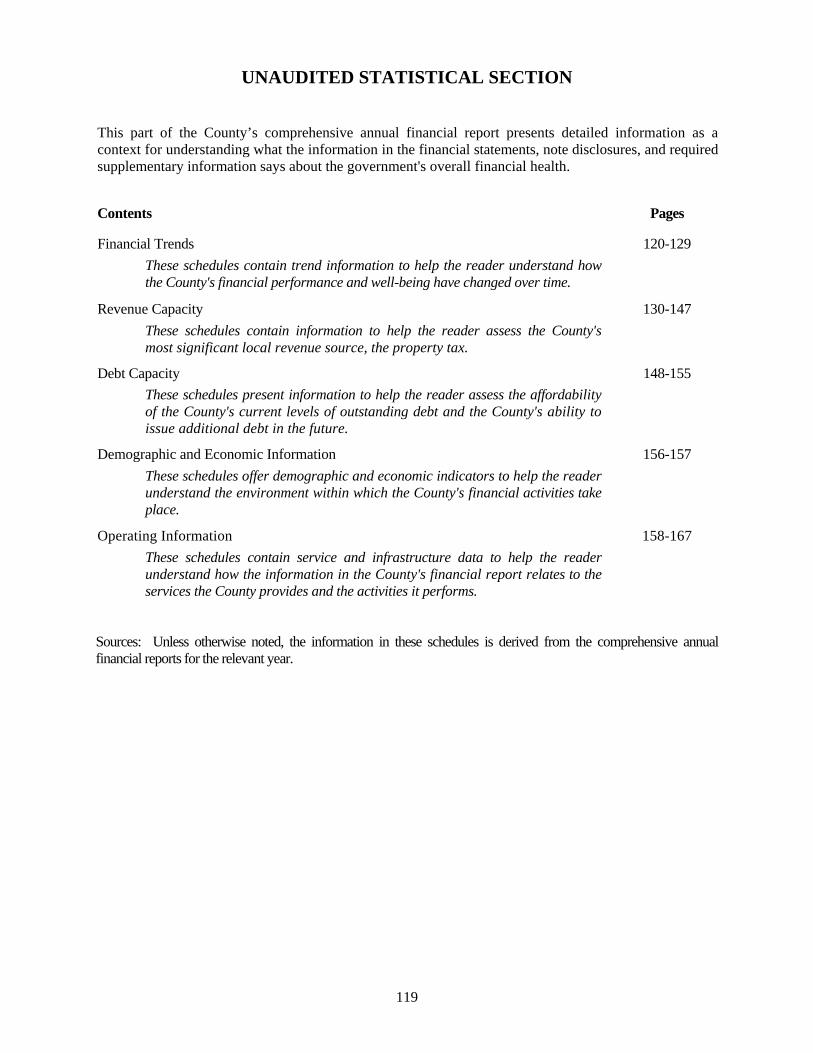
119
UNAUDITED STATISTICAL SECTION
This part of the County’s comprehensive annual financial report presents detailed information as a context for understanding what the information in the financial statements, note disclosures, and required supplementary information says about the government's overall financial health.
Contents Pages
Financial Trends 120-129
These schedules contain trend information to help the reader understand how the County's financial performance and well-being have changed over time.
Revenue Capacity 130-147
These schedules contain information to help the reader assess the County's most significant local revenue source, the property tax.
Debt Capacity 148-155
These schedules present information to help the reader assess the affordability of the County's current levels of outstanding debt and the County's ability to issue additional debt in the future.
Demographic and Economic Information 156-157
These schedules offer demographic and economic indicators to help the reader understand the environment within which the County's financial activities take place.
Operating Information 158-167
These schedules contain service and infrastructure data to help the reader understand how the information in the County's financial report relates to the services the County provides and the activities it performs.
Sources: Unless otherwise noted, the information in these schedules is derived from the comprehensive annual financial reports for the relevant year.

120
FORT BEND COUNTY, TEXASNET POSITION BY COMPONENT -
ACCRUAL BASIS OF ACCOUNTINGLAST TEN FISCAL YEARS(UNAUDITED)
2007 2008 2009 2010
Governmental ActivitiesNet investment in capital
assets 571,604,116$ 617,510,081$ 679,586,901$ 714,396,078$ Restricted 2,712,985 4,034,606 5,363,740 4,168,945 Unrestricted 67,881,987 42,289,889 23,075,239 (2,719,935)
Total GovernmentalActivities Net Position 642,199,088$ 663,834,576$ 708,025,880$ 715,845,088$
Primary Government:Total Primary Government
Net Position 642,199,088$ 663,834,576$ 708,025,880$ 715,845,088$
Notes:GASB 65 was implemented in fiscal year 2013, and only fiscal year 2013 has been restated.GASB 68 was implemented in fiscal year 2015, and only fiscal year 2014 ending balances have been restated.The beginning carrying value of capital assets were restated in fiscal year 2016, and only fiscal year 2016
ending balances have been restated.
Fiscal Year

121
2011 2012 2013 2014 2015 2016
750,965,320$ 776,642,051$ 811,299,625$ 839,830,725$ 757,211,714$ 1,359,840,462$ 4,477,906 2,977,051 1,414,427 1,753,831 1,852,069
(37,092,502) (64,023,524) (96,828,987) (119,662,250) (126,329,396) (147,831,575)
718,350,724$ 715,595,578$ 715,885,065$ 721,922,306$ 632,734,387$ 1,212,008,887$
718,350,724$ 715,595,578$ 715,885,065$ 721,922,306$ 632,734,387$ 1,212,008,887$
Fiscal Year

122
BASIS OF ACCOUNTING
(UNAUDITED)
2007 2008 2009 2010ExpensesGovernmental Activities:
General administration 38,058,905$ 35,066,142$ 42,900,684$ 40,543,784$ Financial administration 5,655,962 7,581,878 8,841,189 8,059,389 Administration of justice 31,881,523 63,851,167 73,811,398 76,268,255 Construction and maintenance 25,197,262 47,535,293 47,188,776 46,946,163 Health and welfare 19,465,407 21,592,759 25,623,533 28,566,454 Cooperative services 826,741 1,143,390 1,188,580 1,123,951 Public safety 49,422,796 50,016,288 61,126,911 55,269,509 Parks and recreation 1,699,999 2,128,502 1,879,525 2,263,280 Libraries and education 10,474,327 12,325,097 12,956,363 13,468,700 Interest on long-term debt 9,190,051 10,621,067 12,338,352 15,494,994
Total Governmental Activities Expenses 191,872,973$ 251,861,583$ 287,855,311$ 288,004,479$
Program RevenuesGovernmental Activities:
Charges for services:General administration 1,630,304$ 6,962,663$ 6,991,778$ 7,023,114$ Financial administration 1,760,789 1,976,033 2,451,191 3,273,137 Administration of justice 11,948,143 6,692,111 6,828,228 7,032,374 Construction and maintenance 7,690,682 8,305,998 8,442,746 6,737,542 Health and human services 5,240,602 4,036,821 5,057,246 5,652,201 Public safety 3,493,999 3,946,125 4,887,245 5,060,714 Parks and recreation 86,733 189,273 187,724 136,864 Libraries and education 240,363 262,957 256,730 240,719
Operating grants and contributions:General administration 1,767,550 6,457,536 6,274,615 2,161,046 Administration of justice 4,810,498 5,924,346 7,225,796 6,679,626 Construction and maintenance 368,058 1,137,555 1,509,761 356,447 Health and human services 5,042,570 4,663,836 4,982,855 8,188,534 Cooperative services 10,648 1,936 13,136 Public safety 4,895,654 5,754,025 13,784,334 4,464,349 Parks and recreation 112,464 102,738 61,023 1,255,743 Libraries and education 88,948 141,938 97,403 194,400
Capital grants and contributions:General administrationAdministration of justice 2,934 Construction and maintenance 101,241,210 33,540,586 62,012,765 30,355,407 Health and human services 45,000 Public safetyParks and recreationLibraries and education 1,917,000
Total Governmental ActivitiesProgram Revenues 150,429,215$ 90,096,477$ 133,013,440$ 88,828,287$
Fiscal Year
FORT BEND COUNTY, TEXASCHANGES IN NET POSITION - ACCRUAL
LAST TEN FISCAL YEARS

123
page 1 of 2
2011 2012 2013 2014 2015 2016
42,795,907$ 41,702,254$ 42,034,040$ 47,178,578$ 49,953,700$ 61,923,654$ 9,441,048 8,344,714 8,849,251 9,809,215 9,923,190 10,668,228
84,507,797 88,819,892 94,210,925 96,510,853 97,317,659 106,035,587 45,632,055 46,468,925 50,078,091 57,430,317 80,574,657 78,151,431 30,104,991 30,677,345 34,630,163 34,976,018 36,721,273 43,153,506
1,177,426 1,118,341 1,067,104 1,152,222 1,150,926 1,215,874 55,315,591 54,954,201 55,866,404 58,412,120 63,537,941 64,704,958
2,917,574 2,578,555 2,069,935 3,379,366 4,133,419 4,545,562 14,800,838 15,708,114 16,156,200 17,170,818 17,638,589 18,446,773 14,887,908 15,037,346 15,536,759 14,836,824 14,108,075 14,960,865
301,581,135$ 305,409,687$ 320,498,872$ 340,856,331$ 375,059,429$ 403,806,438$
7,054,198$ 7,558,755$ 8,181,551$ 8,323,648$ 8,579,034$ 8,561,186$ 3,988,371 4,695,710 5,762,439 6,497,643 7,541,956 8,143,353 7,222,932 7,522,930 8,918,247 8,400,556 8,485,619 8,700,278 6,679,429 7,466,798 7,562,523 6,759,102 7,078,136 7,121,643 6,396,645 6,138,679 7,047,993 7,371,859 7,762,002 10,263,992 5,621,993 5,642,978 6,140,083 7,125,686 7,721,948 8,733,631
141,893 183,406 175,619 193,631 188,437 158,626 246,699 269,015 279,570 276,635 280,973 288,193
5,420,407 4,428,089 3,597,784 3,626,019 3,849,997 4,380,173 7,556,661 6,560,970 8,311,676 10,213,349 10,292,737 10,823,506 1,381,572 949,663 293,441 372,129 1,713,376 390,265
12,506,581 10,899,781 16,191,142 14,782,021 16,106,462 18,361,326 1,000 200 350 21,586
8,623,225 6,252,054 4,758,606 3,932,646 4,427,337 3,994,478 157,468 104,002 86,260 100,286 346,283 98,583 174,204 438,841 64,483 69,806 104,658 46,068
2,052,920 3,500,000 89,000 27,234
25,214,312 23,872,205 28,068,322 32,683,107 32,920,374 125,334,640
10,965 357,373 64,000 28,000 1,403,990
98,386,590$ 93,011,110$ 107,504,624$ 114,585,696$ 117,463,679$ 216,942,517$
Fiscal Year

124
BASIS OF ACCOUNTING
(UNAUDITED)
2007 2008 2009 2010Net (Expense)/RevenueGovernmental Activities (41,443,758)$ (161,765,106)$ (154,841,871)$ (199,176,192)$
Total Primary Government Net(Expense)/Revenue (41,443,758)$ (161,765,106)$ (154,841,871)$ (199,176,192)$
General Revenues and OtherChanges in Net Position
Governmental Activities:Property taxes, penalties, and interest 151,404,502$ 171,832,680$ 191,467,403$ 198,888,176$ Sales taxesEarnings on investments 12,009,284 8,082,178 3,664,184 3,870,155 Miscellaneous 875,137 3,486,452 3,901,588 4,237,069
Total Governmental Activities 164,288,923 183,401,310 199,033,175 206,995,400
Total Primary Government 164,288,923$ 183,401,310$ 199,033,175$ 206,995,400$
Change in Net PositionGovernmental Activities 122,845,165$ 21,636,204$ 44,191,304$ 7,819,208$
Total Primary Government 122,845,165$ 21,636,204$ 44,191,304$ 7,819,208$
Note: GASB 65 was implemented in fiscal year 2013, and only fiscal year 2013 has been restated.
FORT BEND COUNTY, TEXASCHANGES IN NET POSITION - ACCRUAL
LAST TEN FISCAL YEARS
Fiscal Year

125
page 2 of 2
2011 2012 2013 2014 2015 2016
(203,194,545)$ (212,398,577)$ (212,994,248)$ (226,270,635)$ (257,595,750)$ (186,863,921)$
(203,194,545)$ (212,398,577)$ (212,994,248)$ (226,270,635)$ (257,595,750)$ (186,863,921)$
196,820,339$ 199,213,697$ 207,458,672$ 222,838,642$ 264,741,926$ 270,349,769$ 1,099,103 2,956,560 4,214,553 5,789,362 6,958,956
2,925,202 2,584,776 963,652 880,712 904,359 1,761,994 5,954,640 6,745,855 5,537,404 4,373,699 7,138,231 7,520,474
205,700,181 209,643,431 216,916,288 232,307,606 278,573,878 286,591,193
205,700,181$ 209,643,431$ 216,916,288$ 232,307,606$ 278,573,878$ 286,591,193$
2,505,636$ (2,755,146)$ 3,922,040$ 6,036,971$ 20,978,128$ 99,727,272$
2,505,636$ (2,755,146)$ 3,922,040$ 6,036,971$ 20,978,128$ 99,727,272$
Fiscal Year

126
FORT BEND COUNTY, TEXASFUND BALANCES OF GOVERNMENTAL FUNDS -
MODIFIED ACCRUAL BASIS OF ACCOUNTINGLAST TEN FISCAL YEARS(UNAUDITED)
2007 2008 2009 2010General FundReserved:
Prepaid Items 326,402$ 197,806$ 100,233$ 111,184$ Unreserved 35,375,155 38,547,536 34,463,474 43,269,189 Total General Fund 35,701,557$ 38,745,342$ 34,563,707$ 43,380,373$
All Other Governmental FundsReserved:
Debt service 4,031,923$ 4,370,499$ 6,057,482$ 4,849,712$ Prepaid items 7,879 11,224 4,305 Capital projects 171,246,482 106,937,644 154,475,649 76,694,711
Unreserved, reported in:Special revenue funds 16,787,185 15,585,100 23,120,456 22,906,854 Capital project funds 4,381,036 4,857,926
Total All Other Governmental Funds 196,446,626$ 131,759,048$ 183,664,811$ 104,455,582$
2011 2012 2013 2014General Fund
Nonspendable 136,007$ 36,826$ 1,233,591$ 386,965$ Restricted 246,021 277,783 209,080 Committed 33,106,759 24,179,874 22,857,602 22,676,941 Unassigned 10,816,215 11,563,846 13,037,646 14,251,514
Total General Fund 44,058,981$ 36,026,567$ 37,406,622$ 37,524,500$
All Other Governmental FundsNonspendable 69,379$ 54,201$ 10,963$ 45,408$ Restricted 39,683,423 78,702,294 55,371,174 41,583,667 Unassigned (4,419,144) (1,663) (3,169)
Total All Other Governmental Funds 35,333,658$ 78,756,495$ 55,380,474$ 41,625,906$
Note:In 2011, the County implemented GASB 54, under which governmental fund balances are reported asnonspendable, restricted, committed, assigned, and unassigned, compared to reserved and unreserved.The County has not restated prior years.
Fiscal Year
Fiscal Year

127
2015 2016
359,792$ 270,023$ 217,488 257,923
14,766,773 8,278,285 30,590,003 37,882,243 45,934,056$ 46,688,474$
44,468$ 28,044$ 584,412,209 142,212,451
(1,883) (12,510) 584,454,794$ 142,227,985$
Fiscal Year

128
FORT BEND COUNTY, TEXASCHANGES IN FUND BALANCES, GOVERNMENTAL FUNDS -
MODIFIED ACCRUAL BASIS OF ACCOUNTINGLAST TEN FISCAL YEARS(UNAUDITED)
2007 2008 2009 2010RevenuesProperty taxes 151,296,278$ 173,947,606$ 190,558,904$ 199,229,197$ Sales taxes (a)Fees and fines 26,999,560 28,948,356 34,591,324 35,306,339 Intergovernmental 18,948,719 27,189,804 35,910,436 28,400,145 Earnings on investments 11,724,807 7,875,929 3,509,046 3,744,027 Miscellaneous 7,377,537 5,397,431 8,396,202 7,256,967 Total Revenues 216,346,901 243,359,126 272,965,912 273,936,675
ExpendituresCurrent:
General administration 28,215,570 37,890,706 40,284,501 42,633,073 Financial administration 5,666,739 6,330,272 7,162,814 6,725,826 Administration of justice 31,713,297 37,064,764 66,125,857 65,405,264 Construction and maintenance 27,314,125 28,584,504 30,896,400 26,775,517 Health and human services 18,227,500 20,369,042 22,539,945 21,124,782 Cooperative services 934,276 975,720 1,049,985 933,519 Public safety 51,014,580 63,081,120 44,578,722 40,895,974 Parks and recreation 1,822,404 1,739,346 1,815,986 2,231,528 Libraries and education 10,694,749 10,422,032 11,398,561 11,354,804
Capital Outlay 30,205,800 78,040,663 102,627,536 99,931,347 Debt Service:
Principal 7,125,000 8,220,000 8,305,000 8,100,000 Interest and fiscal charges 4,600,363 12,266,435 12,149,302 16,341,773 Bond issuance costs (b) 2,010,266 1,176,319 225,979
Total Expenditures 219,544,669 304,984,604 350,110,928 342,679,386 (Deficiency) of Revenues (Under) Expenditures (3,197,768) (61,625,478) (77,145,016) (68,742,711)
Other Financing Sources (Uses)Transfers in 9,165,382 9,569,698 23,578,390 15,248,368 Transfers (out) (9,165,382) (9,569,698) (23,578,390) (15,248,368) Bonds issued 152,675,000 119,910,000 Refunding bonds issued 2,460,000 20,780,000 Premium on bonds issued 4,877,984 5,241,474 Premium on refunding bonds issued 122,676 2,170,147 Payments to current refunding bond agent (2,865,000) (24,600,000) Total Other Financing Sources (Uses) 157,552,984 124,869,150 (1,649,853)
Net Change in Fund Balances 154,355,216$ (61,625,478)$ 47,724,134$ (70,392,564)$
Debt Service as a Percentage ofNoncapital Expenditures 6.19% 9.03% 8.26% 10.07%
(a) No sales taxes were collected prior to fiscal year 2012.
Fiscal Year

129
2011 2012 2013 2014 2015 2016
197,406,898$ 200,056,507$ 208,142,339$ 222,992,307$ 242,444,112$ 270,972,401$ 1,099,103 2,956,559 4,214,553 5,789,362 6,958,956
37,371,124 39,598,440 44,177,263 45,106,533 47,803,283 50,231,963 36,971,987 29,377,233 42,565,592 36,899,095 39,904,787 39,673,097
2,798,039 2,451,577 930,273 848,534 878,980 1,750,631 6,635,261 7,175,498 5,988,682 8,243,270 7,545,715 7,913,682
281,183,309 279,758,358 304,760,708 318,304,292 344,366,239 377,500,730
44,312,741 37,792,578 37,437,702 41,478,910 44,698,720 56,093,978 7,176,186 7,221,313 7,180,608 7,891,034 8,369,921 9,063,587
69,878,942 73,198,325 73,839,598 77,242,153 81,411,531 89,715,917 29,542,425 28,214,027 27,403,229 35,374,943 59,785,401 43,275,592 22,067,744 27,835,260 30,403,209 30,267,231 32,436,431 38,314,627
986,392 960,392 883,324 944,039 973,026 1,050,282 44,156,502 45,463,593 44,991,489 46,688,895 53,652,220 54,393,589
2,263,590 1,957,044 1,979,888 2,411,558 3,051,927 3,307,538 12,176,637 13,012,700 13,034,163 13,613,875 14,460,419 15,215,877 88,927,796 44,845,671 57,223,885 40,964,586 28,911,628 61,611,363
12,590,000 13,300,000 15,630,000 16,250,000 16,750,000 18,480,000 15,528,257 15,571,727 16,749,579 15,893,399 14,391,964 15,506,610
249,266 541,944 234,472 1,207,260 1,316,238 349,856,478 309,914,574 326,756,674 329,255,095 360,100,448 407,345,198
(68,673,169) (30,156,216) (21,995,966) (10,950,803) (15,734,209) (29,844,468)
14,402,786 13,258,127 11,521,941 11,771,144 13,517,505 13,780,670 (14,402,786) (13,258,127) (11,521,941) (14,493,144) (13,517,505) (13,780,670)
58,220,000 37,365,000 96,640,000 9,675,000 18,900,000 108,225,000 73,120,000
3,944,496 18,416,480 784,853 7,326,639 2,202,026 18,114,658 15,739,791
(10,230,000) (21,065,913) (126,676,501) (89,544,194) 229,853 65,546,639 (2,685,887) 40,972,653 114,372,077
(68,443,316)$ 35,390,423$ (21,995,966)$ (13,636,690)$ 25,238,444$ 84,527,609$
10.78% 10.89% 12.01% 11.15% 9.40% 9.83%
Fiscal Year

130
FORT BEND COUNTY, TEXASASSESSED VALUE OF TAXABLE PROPERTYLAST TEN TAX YEARS(UNAUDITED)
Category 2006 2007 2008 2009Real, Residential, Single-family 23,347,791,025$ 26,097,453,310$ 29,960,281,188$ 29,649,115,219$ Real, Residential, Multi-family 624,746,015 724,480,330 1,036,720,280 953,747,851 Real, Vacant Lots/Tracts 735,283,478 906,501,540 1,128,365,928 1,129,570,008 Qualified Ag Land 1,396,938,636 1,619,246,573 2,622,322,905 Non-Qualified Ag Land 115,815,172 149,627,110 197,166,064 Real, Acreage (Land only) 2,745,455,296 Real, Farm and Ranch Improvement 277,749,409 298,618,116 348,641,070 330,298,802 Commercial Real Property 3,418,004,025 3,606,646,451 6,042,412,301 Industrial Real Property 1,546,854,160 2,431,755,890 2,512,976,750 Real, Commercial and Industrial 7,798,910,271 Oil and Gas 493,944,860 488,114,480 483,549,300 Real, Oil, Gas, and Other Mineral Reserves 288,530,290 Real & Intangible Personal, Utilities 679,232,435 689,009,066 721,569,810 710,328,240 Commercial Personal Property 1,268,271,001 1,523,192,050 1,519,692,659 Industrial Personal Property 1,246,210,863 1,810,785,110 1,888,201,580 Tangible Personal, Business 3,955,067,370 Tangible Other Personal, Mobile Homes 69,123,485 75,153,055 68,619,455 Tangible Other Personal, Other 65,665,620 Intangible Personal 9,736,015 Real, Inventory 822,890,210 1,125,116,437 1,279,793,460 1,001,220,160 Special Inventory 59,368,540 70,754,490 72,837,620 61,578,930 Total Exempt Property 80,080 1,876,101,450 2,349,880,727 2,559,873,420 Unidentified Category/Error 19,389,929 11,877,010
Total Assessed Value per Tax Year 36,102,303,394$ 43,511,945,387$ 52,244,908,107$ 51,259,097,492$
Source of data: Fort Bend County Central Appraisal District Certified Comptrollers Audit Report.

131
2010 2011 2012 2013 2014 201529,993,796,370$ 31,039,400,739$ 32,696,769,609$ 34,939,222,040$ 38,197,156,012$ 48,210,660,622$
970,309,935 985,883,440 1,038,540,000 1,223,124,193 1,492,817,879 1,825,084,868 1,027,648,723 982,287,088 961,783,939 910,690,568 854,963,794 846,058,635
2,629,194,720 2,536,288,590 2,535,052,048 2,405,933,092 2,455,020,886 2,375,050,069 327,283,766 331,068,370 348,241,112 368,553,330 380,697,030 403,688,459
7,178,698,624 7,050,117,340 7,134,533,264 7,241,630,477 7,759,852,998 8,082,106,852
319,839,370 273,529,460 333,441,300 262,592,210 256,495,180 129,149,800 689,401,553 661,509,515 615,750,037 627,521,930 754,452,129 808,967,279
3,544,368,206 3,611,035,498 3,599,878,815 3,979,309,449 4,181,424,859 4,239,563,234
56,722,635 55,860,570 55,486,280 60,883,115 62,049,925 66,002,285 10,051,655 10,398,285 10,398,285 11,233,017 13,398,220 16,435,550
788,688,120 729,776,091 730,016,310 793,911,390 999,071,390 1,082,771,520 60,319,760 74,140,120 84,571,490 102,899,736 109,766,186 127,126,210
2,751,636,029 2,782,972,308 3,243,813,982 3,558,753,941 3,677,487,845 3,808,991,325 8,860
50,347,968,326$ 51,124,267,414$ 53,388,276,471$ 56,486,258,488$ 61,194,654,333$ 72,021,656,708$

132

133
NetTax Fiscal Estimated Less Assessed Assessment Total DirectYear Year Actual Value Exemptions Value Ratio Tax Rate2006 2007 34,898,864,755$ 5,874,692,725$ 29,024,172,030$ 83.2% 0.51674$ 2007 2008 40,030,188,967 6,548,855,518 33,481,333,449 83.6% 0.516742008 2009 45,414,424,927 7,350,144,660 38,064,280,267 83.8% 0.499762009 2010 46,004,789,281 7,599,334,136 38,405,455,145 83.5% 0.499762010 2011 45,090,492,561 7,722,448,765 37,368,043,796 82.9% 0.499762011 2012 45,964,582,256 7,930,095,144 38,034,487,112 82.7% 0.499762012 2013 47,665,443,449 8,225,496,395 39,439,947,054 82.7% 0.499762013 2014 50,586,160,527 8,608,492,257 41,977,668,270 83.0% 0.484762014 2015 54,808,002,219 9,231,100,402 45,576,901,817 83.2% 0.472762015 2016 64,167,624,512 10,809,541,312 53,358,083,200 83.2% 0.46500
Source of data: Fort Bend County Central Appraisal District.
FORT BEND COUNTY, TEXASASSESSED AND ESTIMATED ACTUAL VALUE OF REAL AND
FOR THE LAST TEN FISCAL YEARS(UNAUDITED)
PERSONAL PROPERTY

134
FORT BEND COUNTY, TEXASPROPERTY TAX RATES - DIRECT AND
OVERLAPPING GOVERNMENTSLast Ten Tax Years(UNAUDITED)
2006 2007 2008 2009
Fort Bend County 0.49334$ 0.49874$ 0.48376$ 0.47900$
Fort Bend County Drainage District 0.02340 0.01800 0.01600 0.02076
Political Subdivision: Arcola, City of 0.73000 0.73000 0.95258 0.96500 Beasley, City of 0.41687 0.41687 0.44828 0.44828 Big Oaks MUD 0.73000 0.73000 0.73000 0.79000 Blue Ridge West MUD 0.43000 0.43000 0.42000 0.41500 Brazoria-Fort Bend MUD 1 **N/A 0.85000 0.85000 0.85000 Brazos ISD **N/A **N/A 1.22000 1.36890 Burney Road MUD 0.30000 0.30000 0.30000 0.24250 Chelford City MUD **N/A **N/A 0.43000 0.43000 Cimarron MUD **N/A **N/A 0.58000 0.57000 Cinco MUD 1 0.88000 0.88000 0.88000 0.67500 Cinco MUD 2 0.52000 0.52000 0.50000 0.47500 Cinco MUD 3 0.51000 0.51000 0.51000 0.47000 Cinco MUD 5 0.57500 0.57500 0.57500 0.50000 Cinco MUD 6 0.59000 0.59000 0.59000 0.48000 Cinco MUD 7 0.57500 0.57500 0.57500 0.52500 Cinco MUD 8 0.89000 0.89000 0.89000 0.84000 Cinco MUD 9 0.65000 0.65000 0.37000 0.61000 Cinco MUD 10 0.65000 0.65000 0.65000 0.60000 Cinco MUD 12 0.53000 0.53000 0.53000 0.47000 Cinco MUD 14 0.79000 0.79000 0.79000 0.66000 Cinco Southwest MUD 1 **N/A 0.90000 1.50000 1.50000 Cinco Southwest MUD 2 **N/A 1.50000 1.50000 1.50000 Cinco Southwest MUD 3 **N/A **N/A 1.50000 1.50000 Cinco Southwest MUD 4 **N/A **N/A 1.50000 1.50000 Cornerstone MUD **N/A **N/A 0.38000 0.37000 Eldridge Road MUD 0.32000 0.32000 0.25000 0.22000 First Colony LID 0.19460 0.19460 0.19460 0.19460 First Colony LID 2 0.31500 0.31500 0.29500 0.28500 First Colony MUD 9 0.30000 0.30000 0.29500 0.29500 First Colony MUD 10 **N/A 0.75000 0.75000 0.75000 Fort Bend County LID 2 0.16500 0.16500 0.14500 0.13400 Fort Bend County LID 6 **N/A **N/A 0.50000 0.50000 Fort Bend County LID 7 0.21500 0.21500 0.21500 0.21500 Fort Bend County LID 10 0.46000 0.46000 0.47500 0.47500 Fort Bend County LID 11 0.27000 0.27000 0.27000 0.27000 Fort Bend County LID 12 0.25000 0.25000 0.19000 0.15000 Fort Bend County LID 14 0.19000 0.19000 0.19000 0.20000 Fort Bend County LID 15 0.70000 0.70000 0.70000 0.70000 Fort Bend County LID 17 0.57000 0.57000 0.58000 0.63000 Fort Bend County LID 19 **N/A 0.70000 0.70000 0.70000 Fort Bend County LID 20 **N/A **N/A 0.45000 0.45000 Fort Bend County MUD 1 0.65000 0.65000 0.65000 0.53000 Fort Bend County MUD 2 0.46000 0.46000 0.44000 0.50000

135
page 1 of 5
2010 2011 2012 2013 2014 2015
0.48016$ 0.48096$ 0.48076$ 0.48476$ 0.47276$ 0.46500$
0.01960 0.01880 0.01900 0.01500 0.02200 0.02100
0.99000 0.95426 0.95426 0.95426 0.91000 0.910000.44828 0.49314 0.49913 0.49913 0.49913 0.499130.79000 0.79000 0.85000 0.85000 0.85000 0.790000.41000 0.41000 0.41000 0.41000 0.41000 0.425000.85000 0.90000 0.85000 0.85000 0.85000 0.850001.39510 1.43285 1.40115 1.39966 1.42172 1.424100.26750 0.26750 0.26750 0.26000 0.26000 0.255000.43000 0.43000 0.43000 0.43000 0.42500 0.425000.57000 0.57000 0.57000 0.57000 0.57000 0.420000.64500 0.59500 0.55000 0.50000 0.48000 0.440000.47500 0.47500 0.47500 0.47500 0.47000 0.450000.47000 0.48000 0.45000 0.42000 0.42000 0.400000.49500 0.49500 0.47500 0.44500 0.41500 0.380000.48000 0.48000 0.48000 0.41000 0.39500 0.355000.52000 0.49000 0.48500 0.48500 0.48000 0.465000.85000 0.59500 0.82000 0.76000 0.71000 0.640000.59500 0.59500 0.59500 0.57000 0.53000 0.430000.61000 0.59000 0.59000 0.58000 0.58000 0.530000.43000 0.43000 0.36000 0.36000 0.30000 0.270000.63500 0.59500 0.55500 0.54500 0.53500 0.520001.50000 1.50000 1.50000 1.29000 1.01000 0.905001.50000 1.50000 1.44500 1.34500 1.20000 1.040001.50000 1.50000 1.50000 1.50000 1.44000 1.030001.50000 1.50000 1.48000 1.40000 1.20000 1.030000.37000 0.36000 0.36000 0.36000 0.34000 0.330000.08000 **N/A **N/A **N/A **N/A **N/A0.19460 0.19460 0.19460 0.15500 0.15500 0.152500.27500 0.27500 0.27500 0.27500 0.25000 0.250000.30500 0.32000 0.32000 0.31500 0.30000 0.280000.49000 0.49000 0.49000 0.47000 0.41000 0.250000.13400 0.13400 0.12900 0.12900 0.12000 0.110000.50000 0.50000 0.50000 0.50000 0.50000 0.500000.21500 0.21000 0.20500 0.20500 0.23500 0.235000.47500 0.47500 0.62000 0.62000 0.64300 0.643000.28000 0.28000 0.26000 0.25000 0.22500 0.205000.14000 0.13000 0.12500 0.12500 0.11500 0.100000.20000 0.20500 0.20500 0.20500 0.20000 0.195000.80000 0.80000 0.80000 0.80000 0.80000 0.750000.63000 0.63000 0.65000 0.65000 0.63000 0.610000.80000 0.80000 0.80000 0.80000 0.80000 0.720000.45000 0.45000 0.45000 0.55000 0.55000 0.550000.65000 0.65000 **N/A **N/A **N/A **N/A0.54000 0.65000 0.63000 0.65000 0.68000 0.66000

136
FORT BEND COUNTY, TEXASPROPERTY TAX RATES - DIRECT AND
OVERLAPPING GOVERNMENTSLast Ten Tax Years(UNAUDITED)
2006 2007 2008 2009Political Subdivision: (continued) Fort Bend County MUD 5 **N/A **N/A **N/A 1.50000 Fort Bend County MUD 19 1.20000 1.20000 1.20000 1.24000 Fort Bend County MUD 21 0.39000 0.39000 0.39000 0.27000 Fort Bend County MUD 23 0.95000 0.95000 0.91000 1.00000 Fort Bend County MUD 24 **N/A 1.29000 1.29000 1.29000 Fort Bend County MUD 25 0.82000 0.82000 0.82000 0.82000 Fort Bend County MUD 26 0.72000 0.72000 0.67000 0.70000 Fort Bend County MUD 30 0.88000 0.88000 0.87000 0.95000 Fort Bend County MUD 34 0.72000 0.72000 0.71000 0.71000 Fort Bend County MUD 35 1.05000 1.05000 0.89000 0.74000 Fort Bend County MUD 37 0.59000 0.59000 0.59000 0.56000 Fort Bend County MUD 41 0.58000 0.58000 0.55000 0.55000 Fort Bend County MUD 42 0.43000 0.43000 0.42000 0.42000 Fort Bend County MUD 46 0.90000 0.90000 0.90000 0.88000 Fort Bend County MUD 47 1.09000 1.09000 1.04000 1.04000 Fort Bend County MUD 48 0.89000 0.89000 0.88000 0.88000 Fort Bend County MUD 49 0.80000 0.80000 0.95000 0.95000 Fort Bend County MUD 50 0.90000 0.90000 0.90000 0.90000 Fort Bend County MUD 57 1.50000 1.50000 1.50000 1.50000 Fort Bend County MUD 58 1.50000 1.50000 1.50000 1.50000 Fort Bend County MUD 66 **N/A 1.35000 1.35000 1.35000 Fort Bend County MUD 67 0.45000 0.45000 0.47500 0.47500 Fort Bend County MUD 68 0.40500 0.40500 0.40500 0.40000 Fort Bend County MUD 69 0.33000 0.33000 0.40000 0.40000 Fort Bend County MUD 81 0.42500 0.42500 0.42500 0.38000 Fort Bend County MUD 94 0.71000 0.71000 0.71000 0.71000 Fort Bend County MUD 106 0.47000 0.47000 0.45000 0.45000 Fort Bend County MUD 108 0.40000 0.40000 0.39000 0.39000 Fort Bend County MUD 109 0.51000 0.51000 0.50700 0.58000 Fort Bend County MUD 111 0.30000 0.30000 0.30000 0.30000 Fort Bend County MUD 112 0.39000 0.39000 0.39000 0.38000 Fort Bend County MUD 115 0.59000 0.59000 0.53000 0.50000 Fort Bend County MUD 116 1.13000 1.13000 1.13000 1.22000 Fort Bend County MUD 117 0.67000 0.67000 0.66000 0.66000 Fort Bend County MUD 118 0.89000 0.89000 0.84000 0.81000 Fort Bend County MUD 119 0.75000 0.75000 0.75000 0.71000 Fort Bend County MUD 121 1.25000 1.25000 1.20000 1.20000 Fort Bend County MUD 122 1.00000 1.00000 1.00000 1.00000 Fort Bend County MUD 123 1.00000 1.00000 1.00000 1.08000 Fort Bend County MUD 124 0.99000 0.99000 0.92000 0.92000 Fort Bend County MUD 128 **N/A 0.80000 0.80000 0.80000 Fort Bend County MUD 129 0.80000 0.80000 0.80000 0.80000 Fort Bend County MUD 130 0.79000 0.79000 0.77000 0.76000 Fort Bend County MUD 131 0.90000 0.90000 1.01000 1.01000 Fort Bend County MUD 133 **N/A 1.50000 1.50000 1.50000 Fort Bend County MUD 134 B **N/A **N/A **N/A **N/A Fort Bend County MUD 134 C **N/A **N/A 1.25000 1.25000

137
page 2 of 5
2010 2011 2012 2013 2014 2015
1.50000 1.50000 1.50000 1.50000 1.50000 1.500001.38000 1.38000 1.89940 1.51500 1.40000 1.400000.26000 0.26000 0.24000 **N/A **N/A **N/A1.03000 1.03000 1.07000 1.05000 1.05000 0.950001.29000 1.35000 1.43000 1.36000 1.35000 1.300000.82000 0.82000 0.85000 0.86000 0.86500 0.845000.71000 0.86250 0.86250 0.90850 0.87500 0.840000.98000 1.02000 1.00000 1.00000 0.97000 0.920000.69000 0.68000 0.68000 0.68000 0.68000 0.630000.69000 0.63000 0.63000 0.62000 0.57000 0.515000.52000 0.52000 0.52000 0.52000 0.52000 0.500000.55000 0.55000 0.55000 0.55000 0.55000 0.540000.43000 0.43000 0.43000 0.43000 0.43000 0.420000.88000 0.88000 0.89500 0.89500 0.89500 0.902501.04000 1.04000 1.17000 1.12000 1.07000 0.950000.88000 0.88000 0.88000 0.88000 0.98000 0.980000.95000 0.95000 0.95000 0.95000 0.95000 0.940000.90000 0.90000 0.91000 0.91000 0.91000 0.910001.50000 1.45000 1.45000 1.40000 1.27000 1.050001.50000 1.50000 1.50000 1.45000 1.28000 1.160001.35000 1.50000 1.50000 1.47000 1.39000 1.250000.47500 0.46500 0.44500 0.41000 0.36000 0.222500.40000 0.40000 0.40000 0.40000 0.40000 0.393450.40000 0.40000 0.40000 0.38500 0.38500 0.355000.37000 0.37000 0.35000 0.33000 0.33000 0.320000.77000 0.77000 0.77000 0.71000 0.66000 0.580000.49000 0.52000 0.50000 0.49000 0.46000 0.345000.42000 0.44000 0.44000 0.44000 0.41000 0.290000.63000 0.66000 0.65000 0.65000 0.62000 0.440000.30000 0.30000 0.30000 0.30000 0.30000 0.300000.38000 0.38000 0.38000 0.37000 0.34000 0.340000.50000 0.50000 0.50000 0.50000 0.48000 0.460001.22000 1.22000 1.21000 1.18000 1.14000 1.080000.66000 0.69000 0.68000 0.68000 0.65000 0.480000.78000 0.77000 0.77000 0.77000 0.75000 0.700000.71000 0.71000 0.71000 0.71000 0.70000 0.640001.20000 1.20000 1.20000 1.20000 1.17000 1.120001.00000 1.00000 1.04000 1.04000 1.01500 0.990001.14000 1.15000 1.15500 1.15500 1.15500 1.100000.92000 0.99000 0.99000 0.99000 0.95000 0.950000.70000 0.70000 0.70000 0.70000 0.70000 0.700000.70000 0.67000 0.67000 0.65000 0.57000 0.420000.76000 0.75000 0.74000 0.73000 0.72000 0.660001.01000 1.01000 1.01000 1.01000 1.01000 1.010001.50000 1.50000 1.50000 1.50000 1.50000 1.43000
**N/A **N/A **N/A **N/A 1.45000 1.450001.30000 1.30000 1.35000 1.35000 1.35000 1.30000

138
FORT BEND COUNTY, TEXASPROPERTY TAX RATES - DIRECT AND
OVERLAPPING GOVERNMENTSLast Ten Tax Years(UNAUDITED)
2006 2007 2008 2009Political Subdivision: (continued) Fort Bend County MUD 136 0.63000 0.63000 0.62000 0.62000 Fort Bend County MUD 137 0.63000 0.63000 0.62000 0.57000 Fort Bend County MUD 138 0.63000 0.63000 0.62000 0.57000 Fort Bend County MUD 139 **N/A **N/A **N/A **N/A Fort Bend County MUD 140 1.25000 1.25000 1.25000 1.25000 Fort Bend County MUD 141 1.39000 1.39000 **N/A **N/A Fort Bend County MUD 142 1.32000 1.32000 1.32000 1.32000 Fort Bend County MUD 143 1.25000 1.25000 1.31000 1.35000 Fort Bend County MUD 144 0.80000 0.80000 0.80000 0.80000 Fort Bend County MUD 145 **N/A 1.25000 1.25000 1.25000 Fort Bend County MUD 146 1.20000 1.20000 1.20000 1.15000 Fort Bend County MUD 147 0.95000 0.95000 0.95000 0.95000 Fort Bend County MUD 148 0.90000 0.90000 0.90000 0.90000 Fort Bend County MUD 149 **N/A 0.80000 0.80000 0.80000 Fort Bend County MUD 151 1.30000 1.30000 1.30000 1.30000 Fort Bend County MUD 152 1.45000 1.45000 1.45000 1.45000 Fort Bend County MUD 155 1.39000 1.39000 1.39000 1.39000 Fort Bend County MUD 156 **N/A **N/A **N/A **N/A Fort Bend County MUD 158 1.45000 1.45000 1.45000 1.45000 Fort Bend County MUD 159 **N/A 0.84000 0.84000 0.84000 Fort Bend County MUD 161 **N/A **N/A **N/A **N/A Fort Bend County MUD 162 **N/A 0.55000 0.70000 0.74000 Fort Bend County MUD 163 **N/A **N/A **N/A **N/A Fort Bend County MUD 165 **N/A 1.25000 1.31000 1.35000 Fort Bend County MUD 167 **N/A 0.85000 0.85000 0.85000 Fort Bend County MUD 168 **N/A 1.03000 **N/A **N/A Fort Bend County MUD 169 **N/A **N/A **N/A **N/A Fort Bend County MUD 170 **N/A **N/A **N/A 1.29400 Fort Bend County MUD 171 **N/A **N/A 1.29400 1.29400 Fort Bend County MUD 172 **N/A **N/A **N/A **N/A Fort Bend County MUD 173 **N/A **N/A **N/A **N/A Fort Bend County MUD 176 **N/A 0.70000 0.65000 0.65000 Fort Bend County MUD 182 **N/A 0.91000 **N/A **N/A Fort Bend County MUD 184 **N/A **N/A **N/A **N/A Fort Bend County MUD 185 **N/A **N/A 1.25000 1.25000 Fort Bend County MUD 187 **N/A **N/A 1.00000 1.00000 Fort Bend County MUD 192 **N/A **N/A **N/A **N/A Fort Bend County MUD 194 **N/A **N/A **N/A 1.25000 Fort Bend County MUD 199 **N/A **N/A **N/A **N/A Fort Bend County MUD 206 **N/A **N/A **N/A **N/A Fort Bend County MUD 207 **N/A **N/A **N/A **N/A Fort Bend County WC&ID 2 0.18000 0.18000 0.18000 0.18000 Fort Bend County WC&ID 3 0.50000 0.50000 0.48000 0.48000 Fort Bend County WC&ID 8 **N/A 0.95000 0.95000 0.95000 Fort Bend ESD 1 0.06250 0.06250 0.06250 0.07500 Fort Bend ESD 2 0.09200 0.09200 0.08830 0.09600

139
page 3 of 5
2010 2011 2012 2013 2014 2015
0.57000 0.57000 0.54000 0.54000 0.50000 0.430000.57000 0.57000 0.54000 0.48000 0.43000 0.420000.57000 0.57000 0.54000 0.48000 0.44500 0.435000.57000 0.57000 0.54000 0.54000 0.44000 0.410001.25000 1.25000 1.34000 1.34000 1.34000 1.25000
**N/A **N/A **N/A **N/A 1.15000 1.150001.32000 1.32000 1.27000 1.17000 0.95000 0.850001.35000 1.36000 1.34000 1.30000 1.26000 1.260000.80000 0.80000 0.80000 0.80000 0.80000 0.800001.25000 1.25000 1.25000 1.25000 1.25000 1.230001.15000 1.15000 1.10000 1.02000 1.01000 0.940000.95000 0.95000 0.95000 0.95000 0.95000 0.950000.90000 0.90000 0.90000 0.90000 0.90000 0.880000.70000 0.70000 0.70000 0.70000 0.70000 0.650001.27000 1.26000 1.26000 1.26000 1.22000 1.110001.45000 1.45000 1.45000 1.45000 1.45000 1.370001.39000 1.39000 1.39000 1.39000 1.29000 1.14000
**N/A **N/A **N/A 1.50000 1.45000 1.250001.45000 1.45000 1.45000 1.45000 1.39000 1.250000.84000 0.84000 0.84000 0.84000 0.78000 0.72000
**N/A **N/A **N/A 0.90620 0.90620 0.900000.80000 1.00000 1.12000 1.12000 1.12000 1.09000
**N/A **N/A **N/A 0.90000 0.90000 0.900001.36000 1.37000 1.37000 1.37000 1.37000 1.320000.89000 0.89000 0.87000 0.89000 0.89000 0.85000
**N/A **N/A **N/A **N/A **N/A **N/A1.29500 1.29500 1.29727 1.30380 1.32260 1.339261.29500 1.29500 1.29727 1.30380 1.32260 1.339261.29500 1.29500 1.28328 1.26500 1.22000 1.160001.29500 1.29500 1.29727 1.30380 1.32260 1.281801.29500 1.29500 1.29727 1.30380 1.32260 1.339260.65000 0.65000 0.65000 0.55000 0.55000 0.55000
**N/A **N/A **N/A **N/A 1.50000 1.50000**N/A **N/A **N/A **N/A 1.40000 1.50000
1.25000 1.25000 1.25000 1.20000 1.17000 1.040001.00000 1.00000 1.00000 1.00000 1.00000 0.97000
**N/A **N/A **N/A **N/A 1.50000 1.500001.25000 1.25000 1.25000 1.25000 1.25000 1.250000.60000 0.60000 0.60000 0.60000 0.60000 0.60000
**N/A **N/A **N/A **N/A 1.40000 1.40000**N/A **N/A **N/A **N/A 1.00000 1.00000
0.18000 0.18000 0.18000 0.18000 0.18000 0.180000.45000 0.45000 0.45000 0.45000 0.45000 0.440000.95000 0.95000 1.05000 1.18000 1.10000 1.070000.07500 0.07500 0.07500 0.07500 0.07500 0.075000.09800 0.09800 0.09800 0.09800 0.09800 0.09800

140
FORT BEND COUNTY, TEXASPROPERTY TAX RATES - DIRECT AND
OVERLAPPING GOVERNMENTSLast Ten Tax Years(UNAUDITED)
2006 2007 2008 2009Political Subdivision: (continued) Fort Bend ESD 3 0.06750 0.06750 0.06750 0.07900 Fort Bend ESD 4 0.08897 0.08897 0.08502 0.08234 Fort Bend ESD 5 **N/A **N/A 0.08000 0.07997 Fort Bend ESD 6 **N/A **N/A **N/A **N/A Fort Bend ESD 8 **N/A **N/A **N/A **N/A Fort Bend Fresh Water Supply 1 1.00000 1.00000 1.00000 1.00000 Fort Bend Fresh Water Supply 2 0.50000 0.50000 0.50000 0.49900 Fort Bend-Harris ESD 100 **N/A 0.10000 0.09473 0.09697 Fort Bend-Waller MUD 2 **N/A **N/A **N/A **N/A Fort Bend-Waller MUD 3 **N/A **N/A **N/A **N/A Fort Bend Independent School District 1.25000 1.25000 1.27000 1.30500 Fort Bend Parkway Road District **N/A 0.05443 0.05443 0.01483 Fulshear, City of 0.20592 0.20592 0.20592 0.20592 Fulshear MUD 1 **N/A **N/A 1.19000 1.19000 Fulshear MUD 2 **N/A **N/A **N/A **N/A Fulshear MUD 3A **N/A **N/A **N/A **N/A Grand Mission MUD 1 1.05000 1.05000 1.10000 1.10000 Grand Mission MUD 2 1.25000 1.25000 1.31000 1.31000 Grand Lakes MUD 1 0.79000 0.79000 0.79000 0.65000 Grand Lakes MUD 2 0.70000 0.70000 0.70000 0.46500 Grand Lakes MUD 4 0.82000 0.82000 0.82000 0.79000 Grand Lakes WCID 0.09500 0.09500 0.09500 0.08750 Harris County MUD 393 **N/A **N/A **N/A **N/A Harris-Fort Bend EMS District 0.10000 **N/A **N/A **N/A Harris-Fort Bend MUD 1 0.88000 0.88000 0.88000 0.77000 Harris-Fort Bend MUD 3 1.25000 1.25000 1.25000 1.25000 Harris-Fort Bend MUD 4 0.96000 0.96000 0.96000 0.96000 Harris-Fort Bend MUD 5 0.82000 0.82000 0.82000 0.75000 Houston, City of **N/A **N/A 0.64375 0.63875 HCC Stafford 0.09518 0.09518 0.09243 0.09222 HCC Missouri City **N/A 0.09518 0.09243 0.09222 Imperial Redevelopment District **N/A **N/A 1.00000 **N/A Katy, City of **N/A **N/A 0.60540 0.59372 Katy ISD 1.52660 1.52660 1.52660 1.52660 Kendleton, City of 0.76503 0.76503 0.76632 0.89100 Kendleton ISD 1.23170 1.23170 1.20500 1.20830 Kingsbridge MUD 0.80000 0.80000 0.78000 0.78000 Lamar Consolidated I.S.D. 1.29765 1.29765 1.29765 1.29765 Meadowcreek MUD 0.10000 0.10000 0.10000 0.10000 Meadows Place, City of 0.79000 0.79000 0.79000 0.83000 Memorial MUD **N/A **N/A 0.52000 0.54000 Mission Bend MUD 1 0.28000 0.28000 0.25000 0.25000 Missouri City, City of 0.49926 0.49926 0.51724 0.52840 Needville, City of 0.42284 0.42284 0.39169 0.39153 Needville Independent School District 1.27929 1.27929 1.45600 1.48400 North Mission Glen MUD 0.52000 0.52000 0.52000 0.54400

141
page 4 of 5
2010 2011 2012 2013 2014 2015
0.08460 0.09100 0.09100 0.09100 0.09100 0.100000.07804 0.07827 0.08103 0.07964 0.09000 0.100000.07997 0.08298 0.08553 0.08341 0.07904 0.07135
**N/A **N/A **N/A **N/A **N/A 0.10000**N/A **N/A **N/A **N/A **N/A 0.10000
1.00000 1.00000 1.00000 1.00000 1.00000 1.000000.50000 0.51000 0.54000 0.54000 0.56000 0.557000.09000 0.09000 0.09000 0.08840 0.08840 0.07951
**N/A **N/A **N/A 0.80000 0.80000 0.80000**N/A **N/A **N/A **N/A **N/A 0.93000
1.34000 1.34000 1.34000 1.34000 1.34000 1.34000**N/A **N/A **N/A **N/A **N/A **N/A
0.20592 0.20592 0.20366 0.19713 0.17829 0.161631.19000 1.19000 1.19000 1.19000 1.19000 1.19000
**N/A **N/A **N/A **N/A **N/A 1.20000**N/A **N/A **N/A **N/A **N/A 1.50000
1.10000 1.10000 1.15000 1.12000 1.02000 0.900001.31000 1.31000 1.31000 1.31000 1.30000 1.250000.63000 0.54000 0.54000 0.54000 0.54000 0.515000.45500 0.44500 0.43750 0.36950 0.35000 0.320000.79000 0.77000 0.76000 0.73000 0.68000 0.600000.08250 0.08250 0.08250 0.07850 0.07300 0.06650
**N/A **N/A **N/A 1.02000 0.91000 0.86000**N/A **N/A **N/A **N/A **N/A **N/A
0.75000 0.73000 0.70000 0.68500 0.68500 0.655001.25000 1.25000 1.24000 1.19000 1.07000 0.970000.95000 0.95000 0.88000 0.82000 0.82000 0.820000.73000 0.71000 0.71000 0.70000 0.65000 0.590000.63875 0.63875 0.63875 0.63875 0.63108 0.601120.09222 0.09722 0.09717 0.09717 0.10689 0.101940.09222 0.09722 0.09717 0.09717 0.10689 0.10194
**N/A **N/A **N/A 1.10000 1.10000 1.100000.59372 0.59372 0.58672 0.56672 0.54672 0.526721.52660 1.52660 1.52660 1.52660 1.52660 1.516600.70627 0.69923 0.63933 0.66908 0.69771 0.78500
**N/A 1.20830 **N/A **N/A **N/A **N/A0.78000 0.78000 0.78000 0.78000 0.78000 0.710001.36455 1.39005 1.39005 1.39005 1.39005 1.390050.10000 0.10000 0.10000 0.10000 0.10000 0.100000.89500 0.89869 0.89500 0.89500 0.89500 0.868000.55500 0.55000 0.54000 0.54000 0.51000 0.480000.25000 0.25000 0.25000 0.28000 0.28000 0.277500.52840 0.52840 0.54480 0.57375 0.56500 0.544680.38151 0.39779 0.40121 0.38551 0.37359 0.381171.51999 1.57958 1.64958 1.64958 1.59995 1.573000.57100 0.64110 0.65110 0.65110 0.60000 0.55000

142
FORT BEND COUNTY, TEXASPROPERTY TAX RATES - DIRECT AND
OVERLAPPING GOVERNMENTSLast Ten Tax Years(UNAUDITED)
2006 2007 2008 2009Political Subdivision: (continued) Orchard, City of 0.30750 0.30750 0.33123 0.39601 Palmer Plantation MUD 1 0.68000 0.68000 0.68000 0.69000 Palmer Plantation MUD 2 0.49000 0.49000 0.49000 0.49800 Pearland, City of **N/A 0.65260 0.65260 0.65260 Pecan Grove MUD 0.47000 0.47000 0.46800 0.46800 Plantation MUD 0.63000 0.63000 0.63000 0.66000 Renn Road MUD **N/A **N/A 0.63000 0.63000 Richmond, City of 0.79000 0.79000 0.79000 0.78650 Rosenberg, City of 0.54500 0.54500 0.52020 0.50000 Sienna Plantation LID 0.58000 0.58000 0.49000 0.49000 Sienna Plantation Management **N/A 0.92000 1.01000 1.01000 Sienna Plantation MUD 2 0.72000 0.72000 0.71000 0.71000 Sienna Plantation MUD 3 0.75000 0.75000 0.75000 0.73000 Sienna Plantation MUD 4 **N/A **N/A **N/A **N/A Sienna Plantation MUD 10 0.90000 0.90000 0.94000 0.94000 Sienna Plantation MUD 12 0.90000 0.90000 0.94000 0.94000 Simonton, City of 0.27000 0.27000 0.27000 0.27000 Stafford Municipal School District 1.25000 1.25000 1.23500 1.23000 Sugar Land, City of 0.30000 0.30000 0.30000 0.30000 West Keegans Bayou I.D. 0.12100 0.12100 0.12100 0.12100 West Harris County MUD 4 **N/A **N/A 0.90000 0.95000 Wharton County Junior College 0.13485 0.13485 0.13797 0.14666 Willow Creek Farms MUD **N/A **N/A 1.25000 1.25000 Willow Fork Drainage District 0.20000 0.20000 0.19000 0.19000 Willow Point MUD **N/A **N/A **N/A **N/A Woodcreek Reserve MUD 0.60000 0.60000 0.60000 0.60000
Source of data: Fort Bend County Central Appraisal District.
All tax rates are shown per $100 assessed value at 100% assessment ratio.
**N/A - Political entity not in existence at this time or taxes not yet levied. Data provided bythe Fort Bend Economic Development Council.

143
page 5 of 5
2010 2011 2012 2013 2014 2015
0.39267 0.42380 0.39475 0.37887 0.37887 0.371530.73500 0.73500 0.73500 0.75500 0.75500 0.560000.51500 0.51500 0.54000 0.54000 0.53000 0.490000.66510 0.68510 0.70500 0.70510 0.71210 0.705300.55000 0.55000 0.56000 0.65500 0.65500 0.640000.66000 0.74000 0.74000 0.74000 0.74000 0.685000.66500 0.69000 0.76000 0.76000 0.75000 0.750000.78650 0.78650 0.78650 0.78000 0.77000 0.755000.50000 0.50000 0.51000 0.50000 0.49000 0.470000.49000 0.49000 0.49000 0.49000 0.49000 0.470001.01000 1.01000 1.01000 1.01000 1.01000 1.030000.71000 0.71000 0.71000 0.71000 0.71000 0.650000.72000 0.72000 0.72000 0.71000 0.71000 0.63000
**N/A **N/A **N/A **N/A 1.01000 1.030000.94000 0.94000 0.94000 0.94000 0.94000 0.940000.94000 0.94000 0.94000 0.94000 0.94000 0.940000.27000 0.27000 0.27000 0.26000 0.26000 0.240001.11000 1.22000 1.25000 1.25000 1.24005 1.230050.30000 0.30245 0.30895 0.30895 0.31595 0.315951.05000 0.11100 0.10000 0.10000 0.10000 0.095000.11100 1.06000 1.09000 1.09000 1.09000 1.080000.14448 0.14414 0.13821 0.13419 0.12656 0.130281.25000 1.25000 1.25000 1.25000 1.25000 1.150000.19000 0.19000 0.19000 0.19000 0.19000 0.18500
**N/A **N/A **N/A 1.50000 1.50000 1.500000.60000 0.60000 0.60000 0.60000 0.60000 0.60000

144

145
FORT BEND COUNTY, TEXASPRINCIPAL PROPERTY TAXPAYERSCurrent Year and Nine Years Ago(UNAUDITED)
Percentage of Percentage ofTotal Net Total Net
Assessed Assessed Assessed Assessed Taxpayer Value Rank Valuation Value Rank Valuation
NRG Texas LP 929,570,820$ 1 1.742 1,799,052,080$ 1 6.637Centerpoint Energy Inc. 277,880,600 2 0.521 221,152,430 2 0.816Katy Mills Mall LTD Partnership 121,548,330 3 0.228 148,319,680 5 0.547Niagara Bottling LLC 119,341,870 4 0.224AmerisourceBergen Drug Corporation 98,619,650 5 0.185Tramontina USA Inc. 91,571,580 6 0.172 98,752,240 7 0.364Lakepointe Assets LLC 89,467,110 7 0.168 89,443,550 8 0.330Fairfield Industries 87,673,520 8 0.164Schlumberger Technology Corp 87,450,440 9 0.164 101,650,560 6 0.375Brazos Valley Energy 87,212,170 10 0.163
Texas Instruments, Inc. 157,258,290 3 0.580Conocophillips Company 148,455,640 4 0.548Texas Genco LP 87,398,320 9 0.322Jetta Operating Company Inc. 71,518,610 10 0.264
Subtotal 1,990,336,090 3.73 % 2,923,001,400 10.78 %
Other taxpayers 51,367,747,110 96.27 24,184,132,183 89.22
Total 53,358,083,200$ 100.00 % 27,107,133,583$ 100.00 %
Fiscal Year 2007Fiscal Year 2016

146
FORT BEND COUNTY, TEXASPROPERTY TAX LEVIES AND COLLECTIONSFOR THE LAST TEN FISCAL YEARS(UNAUDITED)
Total Total Percentage ofTax Fiscal Original Adjusted Adjusted LevyYear Year Levy Adjustments Levy Amount Collected2006 2007 150,171,810$ (1,278,281)$ 148,893,529$ 146,154,761$ 98.16%2007 2008 173,203,701 (1,083,633) 172,120,068 169,011,211 98.19%2008 2009 190,430,794 (1,533,970) 188,896,824 186,012,685 98.47%2009 2010 191,862,995 5,402,334 197,265,329 194,801,626 98.75%2010 2011 193,704,140 2,075,024 195,779,164 193,251,014 98.71%2011 2012 197,913,656 261,751 198,175,407 196,106,467 98.96%2012 2013 198,853,734 7,185,873 206,039,607 204,426,149 99.22%2013 2014 220,732,237 (56,070) 220,676,167 219,405,724 99.42%2014 2015 231,440,796 9,248,755 240,689,551 239,321,688 99.43%2015 2016 261,554,958 7,494,595 269,049,553 267,472,379 99.41%
Collected within the Fiscal Year of the Levy

147
Total Tax DelinquentCollections Total Collections as a Outstanding Taxes as a
in Subsequent Tax Percentage of Delinquent Percentage ofYears Collections Adjusted Levy Taxes Adjusted Levy2,674,131$ 148,828,892$ 99.96% 64,637$ 0.04%2,809,610 171,820,821 99.83% 299,247 0.17%2,663,773 188,676,458 99.88% 220,366 0.12%2,246,966 197,048,592 99.89% 216,737 0.11%2,286,563 195,537,577 99.88% 241,587 0.12%1,784,868 197,891,335 99.86% 284,072 0.14%1,298,278 205,724,427 99.85% 315,180 0.15%
872,988 220,278,712 99.82% 397,455 0.18%768,422 240,090,110 99.75% 599,441 0.25%
267,472,379 99.41% 1,577,174 0.59%

148
FORT BEND COUNTY, TEXASRATIO OF NET LONG-TERM DEBT TO ASSESSED VALUE
PERSONAL INCOME, AND LONG-TERM DEBT PER CAPITAFOR THE LAST TEN FISCAL YEARS(UNAUDITED)
AmountsAvailable
Net General Total in DebtTax Fiscal Assessed Obligation Long-Term ServiceYear Year Population (1) Value Bonds (2) Debt (2) Fund (2)2006 2007 507,110 29,024,172,030$ 246,563,943$ 246,563,943$ 3,965,968$ 2007 2008 531,660 33,481,333,449 238,044,854 238,044,854 4,290,890 2008 2009 547,876 38,064,280,267 350,787,773 350,787,773 5,956,061 2009 2010 581,830 38,405,455,145 343,448,573 343,448,573 4,844,023 2010 2011 606,786 37,368,043,796 330,308,251 330,308,251 5,169,725 2011 2012 639,969 38,034,487,112 381,602,454 381,602,454 3,977,092 2012 2013 643,408 39,439,947,054 364,812,865 364,812,865 2,461,472 2013 2014 652,365 41,977,668,270 347,708,537 347,708,537 2,739,786 2014 2015 685,345 45,576,901,817 376,265,782 376,265,782 2,764,772 2015 2016 716,087 53,358,083,200 473,004,495 473,004,495 1,071,278
(1) Source of data: Fort Bend Economic Development Council.
(2) The figures do not include both long-term debt principal and amounts available fordebt service for the Fort Bend Parkway Road District Unlimited Tax bonds. The levy for those bonds is not calculated on the assessed value of the County propertiespresented in this table.

149
Percent Long-TermNet of Debt to Long-Term
Long-Term Personal Personal Assessed DebtDebt Income Income Value Per Capita
242,597,975$ 15,364,670,000$ 1.60% 0.84% 486$ 233,753,964 20,218,050,000 1.18% 0.70% 448 344,831,712 22,319,780,000 1.57% 0.91% 640 338,604,550 20,455,780,000 1.68% 0.88% 590 325,138,526 22,444,080,000 1.47% 0.87% 544 377,625,362 27,002,708,000 1.41% 0.99% 596 362,351,393 29,242,120,000 1.25% 0.92% 567 344,968,751 30,215,817,000 1.15% 0.82% 533 373,501,010 32,349,654,690 1.16% 0.82% 549 471,933,217 40,162,314,000 1.18% 0.88% 661

150
FORT BEND COUNTY, TEXASDIRECT AND OVERLAPPING DEBT page 1 of 4Fiscal Year 2016(UNAUDITED)
Long-Term Applicable OverlappingOutstanding Percentage Debt
Fort Bend County 473,004,495$ (1) 100.00% 473,004,495$ (1)
Special Districts:Big Oaks MUD 18,170,000 100.00% 18,170,000 Burney Road MUD 8,575,000 100.00% 8,575,000 Cinco MUD # 1 6,250,600 100.00% 6,250,600 Cinco MUD # 2 10,941,840 100.00% 10,941,840 Cinco MUD # 5 7,910,960 100.00% 7,910,960 Cinco MUD # 7 12,511,600 100.00% 12,511,600 Cinco MUD # 8 13,295,280 100.00% 13,295,280 Cinco MUD # 10 10,532,920 100.00% 10,532,920 Cinco MUD # 12 6,370,000 100.00% 6,370,000 Cinco MUD # 14 21,518,640 100.00% 21,518,640 Cinco Southwest MUD # 1 1,296,592 100.00% 1,296,592 Cinco Southwest MUD # 2 77,063,738 100.00% 77,063,738 Cinco Southwest MUD # 3 66,706,094 100.00% 66,706,094 Cinco Southwest MUD # 4 76,058,842 100.00% 76,058,842 First Colony MUD # 9 12,200,000 100.00% 12,200,000 First Colony MUD # 10 13,905,000 100.00% 13,905,000 Fort Bend Co FWSD # 1 28,880,000 100.00% 28,880,000 Fort Bend Co LID # 2 12,875,000 100.00% 12,875,000 Fort Bend Co LID # 6 10,430,000 100.00% 10,430,000 Fort Bend Co LID # 7 26,530,000 100.00% 26,530,000 Fort Bend Co LID # 10 11,520,000 100.00% 11,520,000 Fort Bend Co LID # 11 17,710,000 100.00% 17,710,000 Fort Bend Co LID # 12 13,035,000 100.00% 13,035,000 Fort Bend Co LID # 14 3,465,000 100.00% 3,465,000 Fort Bend Co LID # 15 73,030,000 100.00% 73,030,000 Fort Bend Co LID # 17 57,395,000 100.00% 57,395,000 Fort Bend Co LID # 19 36,060,000 100.00% 36,060,000 Fort Bend Co LID # 20 2,525,000 100.00% 2,525,000 Fort Bend Co Municipal Mgmt # 1 4,570,000 100.00% 4,570,000 Fort Bend Co MUD # 2 15,380,000 100.00% 15,380,000 Fort Bend Co MUD # 5 7,450,000 100.00% 7,450,000 Fort Bend Co MUD # 19 1,205,000 100.00% 1,205,000 Fort Bend Co MUD # 23 60,535,000 100.00% 60,535,000 Fort Bend Co MUD # 24 8,775,000 100.00% 8,775,000 Fort Bend Co MUD # 25 95,030,000 100.00% 95,030,000 Fort Bend Co MUD # 26 11,635,000 100.00% 11,635,000 Fort Bend Co MUD # 30 60,640,000 99.96% 60,615,744 Fort Bend Co MUD # 34 17,700,000 100.00% 17,700,000 Fort Bend Co MUD # 35 35,460,000 100.00% 35,460,000 Fort Bend Co MUD # 41 2,115,000 100.00% 2,115,000 Fort Bend Co MUD # 42 9,095,000 100.00% 9,095,000 Fort Bend Co MUD # 46 12,780,000 100.00% 12,780,000 Fort Bend Co MUD # 47 6,780,000 100.00% 6,780,000 Fort Bend Co MUD # 48 14,615,000 100.00% 14,615,000 Fort Bend Co MUD # 49 1,265,000 100.00% 1,265,000 Fort Bend Co MUD # 50 43,700,000 100.00% 43,700,000 Fort Bend Co MUD # 57 51,730,000 100.00% 51,730,000 Fort Bend Co MUD # 58 101,860,000 100.00% 101,860,000 Fort Bend Co MUD # 66 1,705,000 100.00% 1,705,000 Fort Bend Co MUD # 68 750,000 100.00% 750,000
Taxing Jurisdiction

151
FORT BEND COUNTY, TEXASDIRECT AND OVERLAPPING DEBT page 2 of 4Fiscal Year 2016(UNAUDITED)
Long-Term Applicable OverlappingOutstanding Percentage Debt
Fort Bend Co MUD # 81 4,170,000 100.00% 4,170,000 Fort Bend Co MUD # 94 5,255,000 100.00% 5,255,000 Fort Bend Co MUD # 106 6,080,000 100.00% 6,080,000 Fort Bend Co MUD # 108 1,090,000 100.00% 1,090,000 Fort Bend Co MUD # 109 8,320,000 100.00% 8,320,000 Fort Bend Co MUD # 111 4,720,000 100.00% 4,720,000 Fort Bend Co MUD # 112 4,390,000 100.00% 4,390,000 Fort Bend Co MUD # 115 10,375,000 100.00% 10,375,000 Fort Bend Co MUD # 116 26,340,000 100.00% 26,340,000 Fort Bend Co MUD # 117 16,125,000 100.00% 16,125,000 Fort Bend Co MUD # 118 30,540,000 100.00% 30,540,000 Fort Bend Co MUD # 119 17,035,000 100.00% 17,035,000 Fort Bend Co MUD # 121 34,280,000 100.00% 34,280,000 Fort Bend Co MUD # 122 17,330,000 100.00% 17,330,000 Fort Bend Co MUD # 123 31,125,000 100.00% 31,125,000 Fort Bend Co MUD # 124 10,470,000 100.00% 10,470,000 Fort Bend Co MUD # 128 67,465,000 100.00% 67,465,000 Fort Bend Co MUD # 129 20,835,000 100.00% 20,835,000 Fort Bend Co MUD # 130 10,670,000 100.00% 10,670,000 Fort Bend Co MUD # 131 2,395,000 100.00% 2,395,000 Fort Bend Co MUD # 133 45,650,000 100.00% 45,650,000 Fort Bend Co MUD # 134B 4,000,000 100.00% 4,000,000 Fort Bend Co MUD # 134C 67,255,000 100.00% 67,255,000 Fort Bend Co MUD # 136 4,385,000 100.00% 4,385,000 Fort Bend Co MUD # 137 28,570,000 100.00% 28,570,000 Fort Bend Co MUD # 138 43,410,000 100.00% 43,410,000 Fort Bend Co MUD # 139 14,085,000 100.00% 14,085,000 Fort Bend Co MUD # 140 10,990,000 100.00% 10,990,000 Fort Bend Co MUD # 142 64,665,000 100.00% 64,665,000 Fort Bend Co MUD # 143 17,925,000 100.00% 17,925,000 Fort Bend Co MUD # 144 15,905,000 100.00% 15,905,000 Fort Bend Co MUD # 145 4,425,000 100.00% 4,425,000 Fort Bend Co MUD # 146 44,745,000 100.00% 44,745,000 Fort Bend Co MUD # 148 4,845,000 100.00% 4,845,000 Fort Bend Co MUD # 149 26,800,000 100.00% 26,800,000 Fort Bend Co MUD # 151 77,065,000 100.00% 77,065,000 Fort Bend Co MUD # 152 8,400,000 100.00% 8,400,000 Fort Bend Co MUD # 155 25,825,000 100.00% 25,825,000 Fort Bend Co MUD # 156 18,295,000 100.00% 18,295,000 Fort Bend Co MUD # 158 10,655,000 100.00% 10,655,000 Fort Bend Co MUD # 159 4,845,000 100.00% 4,845,000 Fort Bend Co MUD # 161 5,100,000 100.00% 5,100,000 Fort Bend Co MUD # 162 8,500,000 100.00% 8,500,000 Fort Bend Co MUD # 163 5,500,000 100.00% 5,500,000 Fort Bend Co MUD # 165 23,175,000 100.00% 23,175,000 Fort Bend Co MUD # 167 24,505,000 100.00% 24,505,000 Fort Bend Co MUD # 169 520,320 100.00% 520,320 Fort Bend Co MUD # 170 12,951,528 100.00% 12,951,528 Fort Bend Co MUD # 171 44,415,976 100.00% 44,415,976 Fort Bend Co MUD #172 61,274,488 100.00% 61,274,488 Fort Bend Co MUD #173 7,622,688 100.00% 7,622,688
Taxing Jurisdiction

152
FORT BEND COUNTY, TEXASDIRECT AND OVERLAPPING DEBT page 3 of 4Fiscal Year 2016(UNAUDITED)
Long-Term Applicable OverlappingOutstanding Percentage Debt
Fort Bend Co MUD # 176 2,440,000 100.00% 2,440,000 Fort Bend Co MUD # 182 15,970,000 100.00% 15,970,000 Fort Bend Co MUD # 185 21,190,000 100.00% 21,190,000 Fort Bend Co MUD # 187 22,990,000 100.00% 22,990,000 Fort Bend Co MUD # 194 24,110,000 100.00% 24,110,000 Fort Bend Co MUD # 199 1,905,000 100.00% 1,905,000 Fort Bend Co WC&ID # 3 2,985,000 100.00% 2,985,000 Fort Bend Co WC&ID # 8 1,840,000 100.00% 1,840,000 Fulshear MUD # 1 8,535,000 100.00% 8,535,000 Grand Lakes MUD # 1 11,030,000 100.00% 11,030,000 Grand Lakes MUD # 2 7,165,000 100.00% 7,165,000 Grand Lakes MUD # 4 15,145,000 100.00% 15,145,000 Grand Lakes WC&ID 3,980,000 100.00% 3,980,000 Grand Mission MUD # 1 34,420,000 100.00% 34,420,000 Grand Mission MUD # 2 20,005,000 100.00% 20,005,000 Palmer Plantation MUD # 2 6,255,000 100.00% 6,255,000 Pecan Grove MUD 53,335,000 100.00% 53,335,000 Plantation MUD 6,055,000 100.00% 6,055,000 Sienna Plantation Levee Improvement Dist 91,920,000 100.00% 91,920,000 Sienna Plantation Management District 31,610,000 100.00% 31,610,000 Sienna Plantation MUD # 2 19,585,000 100.00% 19,585,000 Sienna Plantation MUD # 3 37,150,000 100.00% 37,150,000 Sienna Plantation MUD # 10 61,165,000 100.00% 61,165,000 Sienna Plantation MUD # 12 58,320,000 100.00% 58,320,000 Woodcreek Reserve MUD 14,915,000 100.00% 14,915,000
County Line Special Districts:Brazoria-Fort Bend Co MUD # 1 75,605,000 44.32% 33,508,136 Brazoria County MUD # 22 4,915,000 6.81% 334,712 Chelford City MUD 8,275,000 56.38% 4,665,445 Cimarron MUD 29,910,000 4.97% 1,486,527 Cinco MUD # 3 6,209,720 85.53% 5,311,174 Cinco MUD # 6 7,756,200 62.68% 4,861,586 Cinco MUD # 9 6,777,680 59.07% 4,003,576 Cornerstones MUD 2,535,000 16.37% 414,980 Fort Bend Co WC&ID # 2 71,065,000 99.16% 70,468,054 Fort Bend-Waller Cty MUD #2 6,900,000 2.66% 183,540 Harris-Fort Bend Cos MUD # 1 13,265,000 86.04% 11,413,206 Harris-Fort Bend Cos MUD # 3 37,985,000 0.79% 300,082 Harris-Fort Bend Cos MUD # 5 20,945,000 94.83% 19,862,144 Katy Management District 9,370,000 70.26% 6,583,362 Kingsbridge MUD 22,415,000 96.80% 21,697,720 Mission Bend MUD #1 2,340,000 50.70% 1,186,380 North Mission Glen MUD 23,940,000 99.14% 23,734,116 Renn Road MUD 7,985,000 31.55% 2,519,268 West Harris Co MUD # 4 2,895,000 16.80% 486,360 Willow Creek Farms MUD 23,715,000 0.76% 180,234 Willow Fork Drainage District 35,485,000 92.81% 32,933,629 Willow Point MUD 5,520,000 64.32% 3,550,464 Total Special District Debt (2) 3,110,532,545$
Taxing Jurisdiction

153
FORT BEND COUNTY, TEXASDIRECT AND OVERLAPPING DEBT page 4 of 4Fiscal Year 2016(UNAUDITED)
Long-Term Applicable OverlappingOutstanding Percentage Debt
Cities:Arcola, City of 3,370,000 100.00% 3,370,000$ Meadows Place, City of 1,660,000 100.00% 1,660,000 Needville, City of 1,550,000 100.00% 1,550,000 Richmond, City of 32,330,000 100.00% 32,330,000
County Line Cities:Rosenberg, City of 67,588,000 100.00% 67,588,000 Sugar Land, City of 294,569,881 100.00% 294,569,881 Houston, City of 2,924,340,000 0.45% 13,159,530 Katy, City of 18,540,000 37.21% 6,898,734 Missouri City, City of 140,440,000 95.56% 134,204,464 Pearland, City of 322,710,000 3.92% 12,650,232 Total Cities 567,980,841$
School Districts: Fort Bend ISD 841,418,767 100.00% 841,418,767$ Lamar CISD 719,995,000 100.00% 719,995,000 Needville ISD 60,185,000 100.00% 60,185,000
County Line School Districts:Brazos ISD 14,839,987 60.83% 9,027,164 Katy ISD 1,449,414,330 38.68% 560,633,463 Stafford MSD 57,295,000 99.60% 57,065,820 Total School Districts 2,248,325,214$
Other:Houston Community College System 618,155,000 3.84% 23,737,152
Total Other 23,737,152$
Summary of Total Estimated Overlapping Debt: Special Districts 3,110,532,545$ Cities 567,980,841 School Districts 2,248,325,214 Other 23,737,152 Estimated Overlapping Debt 5,950,575,752$
Fort Bend County Fort Bend County - Direct Obligations 473,004,495 (1)
Total Direct and Estimated Overlapping Debt 6,423,580,247$
(1) County debt outstanding as of September 30, 2016. Includes the Fort Bend Flood Control WaterSupply Corporation debt.
(2) Total Special District Debt includes numerous special districts with varying amounts of debtapplicable to the County.
The allocation of the county-line jurisdictions is calculated by determining the ratio of the assessed valuation of taxable property that is within Fort Bend County. This rate is then applied to the outstanding debt of the county-line jurisdiction to calculate the overlapping debt amount.
Source of data: Texas Municipal Reports published by the Municpal Advisory Council of Texas.
Taxing Jurisdiction

154
FORT BEND COUNTY, TEXASCOMPUTATION OF LEGAL DEBT MARGINLAST TEN FISCAL YEARS(UNAUDITED)
2007 2008 2009 2010
Assessed value of real property 25,226,420,176$ 28,931,048,114$ 33,294,278,049$ 33,574,551,064$ Assessed value of personal
and other property 3,797,751,854 4,550,285,335 4,770,002,218 4,830,904,081
Total assessed value 29,024,172,030$ 33,481,333,449$ 38,064,280,267$ 38,405,455,145$
Debt Limit, 25% of real property 6,306,605,044$ 7,232,762,029$ 8,323,569,512$ 8,393,637,766$
Amount of debt applicableto debt limit 246,563,943 238,044,854 350,787,773 343,448,573
Less: Assets available inDebt Service Fundsfor payment of principal 3,965,968 4,290,890 5,956,061 4,844,023
Total amount of debt applicableto debt limit 242,597,975 233,753,964 344,831,712 338,604,550
Legal Debt Margin 6,064,007,069$ 6,999,008,065$ 7,978,737,800$ 8,055,033,216$
Total net debt applicable toto the limit as a percentage ofdebt limit 3.85% 3.23% 4.14% 4.03%
Source of data: Fort Bend County Central Appraisal District and County Tax Assessor/Collector.

155
2011 2012 2013 2014 2015 2016
32,877,992,163$ 33,530,169,247$ 34,906,683,521$ 36,962,606,903$ 40,220,320,218$ 47,990,163,282$
4,490,051,633 4,504,317,865 4,533,263,533 5,015,061,367 5,356,581,599 5,367,919,918
37,368,043,796$ 38,034,487,112$ 39,439,947,054$ 41,977,668,270$ 45,576,901,817$ 53,358,083,200$
8,219,498,041$ 8,382,542,312$ 8,726,670,880$ 9,240,651,726$ 10,055,080,055$ 11,997,540,821$
330,308,251 381,602,454 364,812,865 347,708,537 376,265,782 473,004,495
5,169,725 3,977,092 2,461,472 2,739,786 2,764,772 1,086,398
325,138,526 377,625,362 362,351,393 344,968,751 373,501,010 471,918,097
7,894,359,515$ 8,004,916,950$ 8,364,319,487$ 8,895,682,975$ 9,681,579,045$ 11,525,622,724$
3.96% 4.50% 4.15% 3.73% 3.71% 3.93%

156
FORT BEND COUNTY, TEXASDEMOGRAPHIC AND ECONOMIC STATISTICSLAST TEN FISCAL YEARS(UNAUDITED)
Year Population Personal Income
Per Capita Personal Income
Unemployment Rate
2007 507,110 15,364,670,000$ 30,298$ 4.1%2008 531,660 20,218,050,000 38,028 4.8%2009 547,876 22,319,780,000 40,739 7.2%2010 581,830 20,455,780,000 35,158 8.2%2011 606,786 22,444,080,000 36,988 7.7%2012 639,969 27,002,708,000 42,194 6.1%2013 643,408 29,242,120,000 45,449 5.7%2014 652,365 30,215,817,000 46,317 5.1%2015 685,345 32,349,654,690 (1) 47,202 4.4%2016 716,087 40,162,314,000 56,086 4.9%
Source of data: Fort Bend Economic Development Council (1) Estimated using 2014 per capita rate of increase

157
FORT BEND COUNTY, TEXASLARGEST EMPLOYERSCurrent Year and Nine Years Ago(UNAUDITED)
Fiscal Year 2016
Local Local Employer Employees Rank Employees Rank
Fort Bend ISD 10,579 1 8,563 1Lamar CISD 3,188 2 2,650 3Fort Bend County 2,438 3 1,889 5Fluor Corporation 2,430 4 3,000 2Methodist Sugar Land Hospital 2,200 5 744 9Schlumberger Technology Corp. 1,750 6 2,100 4Richmond State School 1,300 7 1,370 7United Parcel Service 1,200 8 1,092 8Oak Bend Medical Center 1,164 9Nalco Company Energy Services 1,100 10Texas Instruments 1,700 6Suntron Corporation 742 10
27,349 23,850
Source of data: Fort Bend Economic Development Council
Fiscal Year 2007

158
FORT BEND COUNTYCAPITAL ASSETS USED IN THE OPERATION OF GOVERNMENTAL FUNDSSCHEDULE BY ACTIVITYLAST TEN FISCAL YEARS(UNAUDITED)
Function 2007 2008 2009 2010General administration 24,886,374$ 25,143,119$ 21,386,052$ 27,725,376$ Financial administration 1,951,989 1,889,426 6,375,329 8,103,759 Administration of justice 28,459,912 35,161,552 147,292,804 189,617,993 Construction and maintenance 647,221,647 703,697,692 791,157,372 850,839,272 Health and human services 4,160,584 4,908,808 12,995,437 16,185,268 Cooperative services 2,287,024 2,287,024 2,256,940 2,300,936 Public safety 50,123,838 97,267,937 26,227,701 29,744,390 Parks and recreation 15,882,914 17,342,600 17,436,639 18,276,965 Libraries and education 28,047,190 29,238,712 37,076,054 41,604,572 Health and wellness clinic
Total 803,021,472$ 916,936,870$ 1,062,204,328$ 1,184,398,531$
Note: In fiscal year 2011, Fort Bend County opened an Employee Health and Wellness Clinic. The capitalassets of the Clinic are recorded in the Employee Benefits Fund, an internal service fund. These capitalassets are shown separately above.
The beginning carrying value of capital assets were restated in fiscal year 2016, and only fiscal year 2016 ending balances have been restated.

159
2011 2012 2013 2014 2015 201630,424,429$ 31,053,685$ 38,511,978$ 47,788,376$ 47,712,406$ 62,504,936$ 7,551,132 8,049,094 8,071,200 8,062,148 8,006,260 7,998,874
213,531,972 211,029,100 212,162,704 210,533,760 211,691,340 216,307,886 919,567,377 973,992,987 1,028,923,374 1,072,802,682 1,017,211,011 1,707,617,590
20,751,252 22,661,709 23,996,133 24,798,446 26,937,313 31,860,971 2,312,616 2,342,593 2,349,882 2,349,882 2,331,532 2,346,000
30,849,243 33,796,158 35,412,137 37,482,448 37,753,040 40,167,926 18,871,156 19,754,283 23,483,574 28,995,973 30,901,307 31,434,794 48,525,974 49,423,344 52,890,523 56,294,393 56,737,602 57,276,109
88,810 677,097 721,184 721,184 726,989 803,133
1,292,473,961$ 1,352,780,050$ 1,426,522,689$ 1,489,829,292$ 1,440,008,800$ 2,158,318,219$

160
FORT BEND COUNTY, TEXASFULL-TIME EQUIVALENT COUNTY GOVERNMENT EMPLOYEES BY FUNCTIONLAST TEN FISCAL YEARS(UNAUDITED)
Function 2007 2008 2009 2010 2011General administration 208.35 211.43 217.06 222.89 237.35Financial administration 93.76 108.78 117.63 117.58 118.58Administration of justice * 232.94 251.04 256.35 261.90 266.60Construction and maintenance 253.41 263.08 273.49 275.21 276.06Health and human services 151.98 168.85 157.90 160.42 160.52Cooperative services 11.07 13.00 14.00 14.00 13.00Public safety 637.04 626.35 790.63 782.07 785.87Parks and recreation 22.13 21.87 22.43 22.25 22.67Libraries and education 180.00 182.00 170.00 172.00 218.00
Total Full-Time Equivalents 1,790.68 1,846.40 2,019.49 2,028.32 2,098.65
Source of data: County employment records.
* Note: Prior to fiscal year 2012, the employees of the Juvenile Probation fund were not part of the budget process, and therefore, were not included in the full-time equivalent count.
Full-Time Equivalent Employees as of September 30

161
2012 2013 2014 2015 2016224.31 225.71 237.51 242.50 253.27114.75 114.75 120.00 121.00 127.14412.41 414.80 429.09 445.02 485.44266.59 267.71 273.60 269.87 275.19160.25 163.61 165.84 174.64 199.81
12.00 12.00 12.00 12.00 11.70785.13 791.98 802.95 805.50 821.01
23.20 23.00 27.34 35.81 36.98224.00 232.74 232.19 234.86 227.28
2,222.64 2,246.30 2,300.52 2,341.20 2,437.82
Full-Time Equivalent Employees as of September 30

162
FORT BEND COUNTY, TEXASOPERATING INDICATORS BY FUNCTIONLAST TEN FISCAL YEARS(UNAUDITED)
Function 2007 2008 2009 2010
General AdministrationFull-time equivalent count 208.35 210.43 218.45 222.89 Documents filed with County Clerk 459,328 423,350 339,335 326,919 Copies issued by County Clerk 197,005 163,492 72,120 72,300 Technical support calls to IT 29,028 36,770 22,396 18,394 County web-site visits (avg/day) N/A 5,950 6,605 6,960 Medical claims filed with Risk Management 41,444 45,019 51,121 57,433 On the job accident claims to Risk Management 155 181 156 177 Voter registrations 31,420 36,900 29,026 20,579 Early voting as a percentage of turnout N/A 42.5% 70.6% 61.2%Job openings 263 308 213 317 Employee service awards 5 years N/A 95 95 97 10 years N/A 54 81 60 15 years N/A 52 42 38 20 years N/A 26 33 17 25 years N/A 26 10 15 30 years N/A 5 3 2 35 years N/A 0 1 0Responses to posted job openings 7,984 7,763 12,244 15,266 Pieces of mail processed 1,240,000 1,400,000 1,600,000 1,800,000 Facilities service requests (avg/month) N/A 256 306 306 Bids, RFP's, & SOQ's solicited N/A 98 107 124 Purchase orders issued N/A 13,077 15,360 13,469 Public Transportation trips N/A 118,189 193,095 180,409 Records Management On site storage (cubic footage) 536 536 211 276 Off site storage (cubic footage) 12,052 13,279 13,856 12,704
Financial AdministrationFull-time equivalent count 93.66 108.78 111.01 116.58 Cash receipts processed (count) 10,500 10,040 8,250 7,800 Checks processed (count) 31,556 108,500 120,000 120,000 Expenditures to budget ratio -10.80% -9.00% -8.00% -9.00%Earned GFOA Certificate of Excellence for CAFR Yes Yes Yes YesEarned GFOA Certificate for Distinguished
Budget Presentation N/A Yes Yes YesInvoice payment processing (days) 10 8 10 10 Journal entry count (estimated) 5,000 2,500 2,000 1,000
Source of data: various County departments
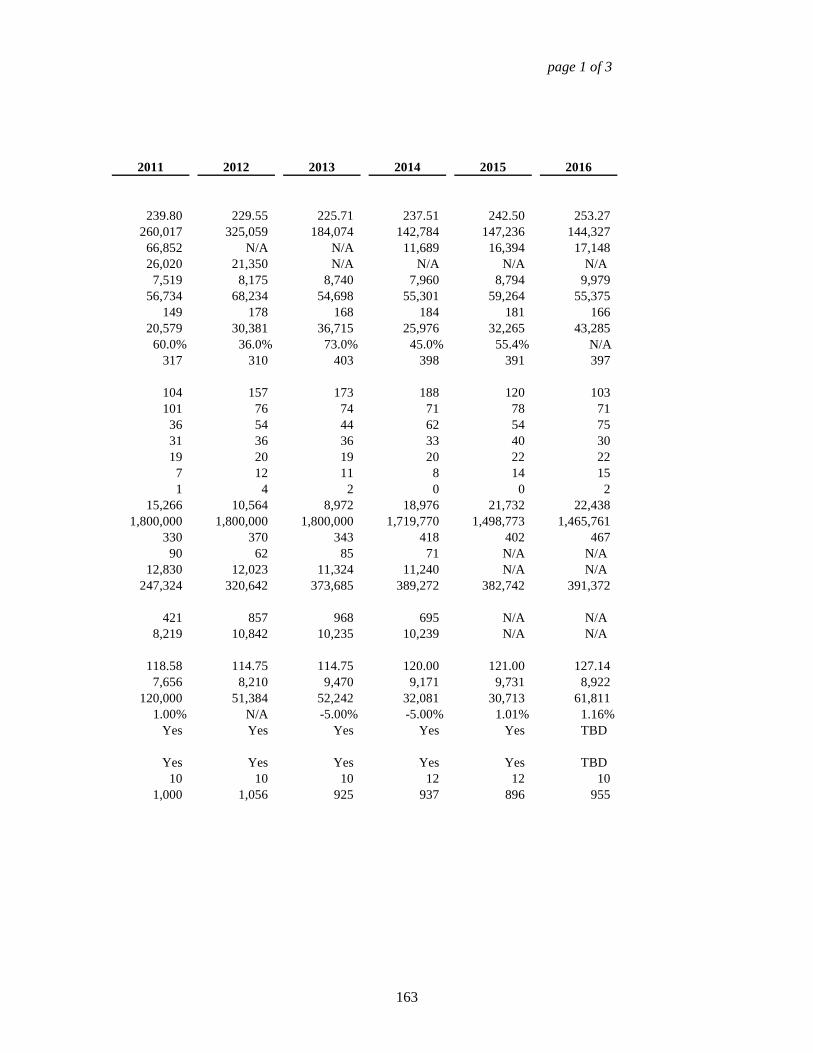
163
page 1 of 3
2011 2012 2013 2014 2015 2016
239.80 229.55 225.71 237.51 242.50 253.27 260,017 325,059 184,074 142,784 147,236 144,327
66,852 N/A N/A 11,689 16,394 17,148 26,020 21,350 N/A N/A N/A N/A
7,519 8,175 8,740 7,960 8,794 9,979 56,734 68,234 54,698 55,301 59,264 55,375
149 178 168 184 181 166 20,579 30,381 36,715 25,976 32,265 43,285
60.0% 36.0% 73.0% 45.0% 55.4% N/A 317 310 403 398 391 397
104 157 173 188 120 103 101 76 74 71 78 71
36 54 44 62 54 75 31 36 36 33 40 30 19 20 19 20 22 22
7 12 11 8 14 15 1 4 2 0 0 2
15,266 10,564 8,972 18,976 21,732 22,438 1,800,000 1,800,000 1,800,000 1,719,770 1,498,773 1,465,761
330 370 343 418 402 467 90 62 85 71 N/A N/A
12,830 12,023 11,324 11,240 N/A N/A 247,324 320,642 373,685 389,272 382,742 391,372
421 857 968 695 N/A N/A 8,219 10,842 10,235 10,239 N/A N/A
118.58 114.75 114.75 120.00 121.00 127.14 7,656 8,210 9,470 9,171 9,731 8,922
120,000 51,384 52,242 32,081 30,713 61,811 1.00% N/A -5.00% -5.00% 1.01% 1.16%
Yes Yes Yes Yes Yes TBD
Yes Yes Yes Yes Yes TBD 10 10 10 12 12 10
1,000 1,056 925 937 896 955

164
FORT BEND COUNTY, TEXASOPERATING INDICATORS BY FUNCTIONLAST TEN FISCAL YEARS(UNAUDITED)
Function 2007 2008 2009 2010
Administration of JusticeFull-time equivalent count 231.80 250.04 256.35 261.90 Child Support case inquiries N/AA N/A 50,758 49,635 Passport applications (count) 3,783 8,835 3,500 2,792 Passport fees collected 113,490$ 265,050$ 87,500$ 69,805$ Worthless check clearance rate 65.00% 74.40% 83.60% 97.80%Felony case disposition rate 87.00% 87.40% 87.70% 101.20%Misdemeanor case disposition rate 85.00% 89.10% 99.50% N/AMisdemeanor case dispositions N/A N/A 104.3 96.6 Community Service rehabilitation hours 70,207 73,578 75,652 77,578 Justice Court case filings - Precinct 1 Place 1 4,909 5,569 5,341 5,592 Justice Court case filings - Precinct 1 Place 2 15,996 11,908 11,771 9,377 Justice Court case filings - Precinct 2 3,611 6,102 6,102 7,577 Justice Court case filings - Precinct 3 9,976 15,109 23,409 19,952 Justice Court case filings - Precinct 4 4,557 5,825 8,959 8,517 Justice Court cases disposed - Precinct 1 Place 1 3,984 4,558 4,537 6,262 Justice Court cases disposed - Precinct 1 Place 2 14,472 9,762 11,713 8,537 Justice Court cases disposed - Precinct 2 4,495 4,789 4,789 5,275 Justice Court cases disposed - Precinct 3 10,339 11,517 16,015 16,215 Justice Court cases disposed - Precinct 4 3,756 4,623 6,973 7,502
Construction and MaintenanceFull-time equivalent count 254.93 263.08 272.49 275.21 Building & right-of-way permits issued 6,892 5,500 4,500 4,826 Tonnage of recyclable diverted from landfills 343 699 732 676 Pounds of hazardous materials collected 150,000 145,238 171,109 160,450 Mileage of drainage channel maintained 1,800 2,206 1,988 2,150 Mileage of county roads - unincorporated areas 1,213 1,263 1,404 1,600 New County road miles constructed -
unincorporated areas 50 50 35 N/AHealth and Human Services
Full-time equivalent count 151.98 168.85 157.90 160.42 Number of clients receiving Social Service
assistance annually 6,609 5,094 8,888 6,012 Number of child immunizations annually 12,577 10,791 14,398 11,776 Number of reportable diseases documented 2,836 3,473 1,893 3,175 Number of food establishments inspected 1,030 1,424 825 787 Number of septic system applications submitted 547 471 330 361 Number of licensed aerobic systems 4,715 5,302 5,896 6,203 Number of citations issued for aerobic system
non-compliance 2,500 3,604 2,521 3,500 Number of EMS incident responses 25,204 26,242 28,603 26,677 Number of stray animals impounded 4,058 3,613 3,615 4,323 Number of stray animals euthanized 3,768 3,204 2,798 3,599 Number of stray animals adopted 290 409 817 727 Indigent healthcare clients - annual 2,659 1,710 1,314 2,996

165
page 2 of 3
2011 2012 2013 2014 2015 2016
266.60 266.41 267.20 281.09 298.02 328.44 52,100 50,150 36,328 33,908 34,971 36,468
2,144 2,909 4,562 6,061 6,638 8,821 53,600$ 72,725$ 114,050$ 151,525$ 165,950$ 220,525$ 84.40% 91.20% 79.00% 95.00% 98.00% 95.00%93.50% 91.90% 100.00% 84.00% 84.00% 99.00%
N/A N/A N/A N/A N/A N/A 116.6 111.0 102.2 93.0 103.0 107.0
73,456 70,270 70,605 89,853 85,296 85,586 5,170 5,582 4,646 3,772 4,234 3,916 9,905 11,513 11,581 10,955 10,365 11,306 7,000 6,851 6,616 5,548 5,583 7,115
20,739 19,895 18,744 13,463 15,968 12,361 7,195 5,041 6,064 3,473 4,607 6,993 4,724 4,615 4,913 3,651 4,184 3,808
10,441 10,274 11,938 10,564 9,828 10,098 5,100 7,239 5,429 4,902 9,702 5,989
15,821 16,647 16,656 15,425 18,775 11,798 7,744 4,414 8,338 3,745 4,494 5,302
276.06 266.59 267.71 273.60 269.87 275.19 4,260 5,032 6,400 7,368 8,961 5,212
676 702 687 N/A N/A N/A 160,500 184,943 176,840 N/A N/A N/A
1,850 2,100 2,200 2,200 2,000 2,500 1,664 1,655 1,703 1,762 1,815 1,837
20 85 80 60 75 75
160.52 160.25 163.61 165.84 174.64 199.81
5,924 7,074 N/A N/A N/A N/A 11,367 8,316 5,417 5,000 10,330 10,924
1,360 1,181 1,142 1,250 1,250 1,598 986 1,192 1,301 1,403 1,584 2,799 360 373 438 470 471 498
6,588 6,915 7,364 6,776 7,068 7,686
3,535 6,695 6,224 3,523 4,889 4,372 26,850 29,774 31,426 29,414 N/A 24,750
4,141 4,854 4,586 3,867 3,580 3,757 3,408 3,930 3,252 2,498 895 811
733 604 1,154 935 1,336 1,771 2,622 2,325 2,153 1,997 1,699 2,228

166
FORT BEND COUNTY, TEXASOPERATING INDICATORS BY FUNCTIONLAST TEN FISCAL YEARS(UNAUDITED)
Function 2007 2008 2009 2010
Cooperative ServicesFull-time equivalent count 11.07 13.00 14.00 14.00 Veterans' Services clients N/A 234 458 645 Veterans' Services claims submitted N/A 126 228 348
Public SafetyFull-time equivalent count 637.04 620.35 784.63 776.07 Number of civil processes received annually Constable Precinct 1 13,400 14,000 15,000 16,093 Constable Precinct 2 8,232 N/A 8,827 5,550 Constable Precinct 3 7,147 N/A 7,635 8,963 Civil Process 24 hour success rate Constable Precinct 4 N/A N/A 86% 78%TCLEOSE training hours held per officer 864 853 974 1,014 Homeland security grant funds expended 1,764,000$ 1,724,700$ 3,917,747$ 5,004,054$ Fire calls responded to annually 6,508 6,278 6,927 5,584
Parks and RecreationFull-time equivalent count 22.13 21.87 22.43 22.25 Number of facility rentals annually 650 700 845 651 Number of park reservations annually 655 808 955 955
Libraries and EducationFull-time equivalent count 180.00 182.00 170.00 172.00 Number of library transactions annually 4,456,882 4,188,249 4,385,041 4,732,773 Library circulation items per capita 1.78 1.64 1.61 1.65

167
page 3 of 3
2011 2012 2013 2014 2015 2016
13.00 12.00 12.00 12.00 12.00 11.70 619 479 503 471 448 668 225 249 337 376 N/A N/A
779.87 785.13 791.98 802.95 805.50 821.01
16,434 15,070 14,510 13,906 13,684 15,603 6,921 7,660 6,606 6,861 7,135 N/A 8,963 6,927 5,475 3,264 2,867 N/A
75% 84% 85% 85% N/A N/A 1,203 1,196 1,361 1,246 1,258 1,249
355,927$ 3,586,852$ 2,692,134$ 2,790,449$ 2,146,261$ 2,454,267$ 7,901 7,842 7,388 N/A N/A N/A
22.67 23.20 23.00 27.34 35.81 36.98 818 908 990 1,939 3,126 3,766 918 1,010 1,111 1,222 1,688 2,410
218.00 224.00 232.74 230.13 232.26 224.68 4,890,834 5,094,324 7,098,423 7,108,212 7,253,708 7,426,609
1.51 1.58 1.65 1.68 1.59 1.43
168
(This page intentionally left blank.)

FORT BEND COUNTY, TEXAS COMPREHENSIVE ANNUAL FINANCIAL
REPORT
For the Year Ended September 30, 2017
Fort Bend County Justice Center and Annex Annex completed April 2018
District Attorney, District Clerk, and County Clerk Now located in new annex
Robert Ed Sturdivant, CPA County Auditor


COMPREHENSIVE ANNUAL FINANCIAL REPORT
For the Year Ended September 30, 2017
Prepared by:
County Auditor's Office
Robert Ed Sturdivant, CPA
County Auditor

FORT BEND COUNTY, TEXAS TABLE OF CONTENTS
Page(s) INTRODUCTORY SECTION
Letter of Transmittal i-v GFOA Certificate of Achievement vi List of Principal Officials vii Organizational Charts viii-ix Location Map x FINANCIAL SECTION Independent Auditors’ Report 1-3 Management’s Discussion and Analysis 5-12 Basic Financial Statements Government-Wide Financial Statements Statement of Net Position 15 Statement of Activities 16-17 Fund Financial Statements Governmental Funds Financial Statements Balance Sheet Governmental Funds 18 Reconciliation of the Balance Sheet to the Statement of Net Position 19 Statement of Revenues, Expenditures, and Changes in Fund Balances Governmental Funds
20
Reconciliation of the Statement of Revenues, Expenditures, and Changes in Fund Balances (Governmental Funds) to the Statement of Activities 21 Proprietary Funds Financial Statements Statement of Net Position 22 Statement of Revenues, Expenses, and Changes in Fund Net Position (Deficit) 23 Statement of Cash Flows 24 Fiduciary Fund Financial Statements Statement of Fiduciary Net Position 25 Component Unit Financial Statements Statement of Net Position (Deficit) 27 Statement of Revenues, Expenses, and Changes in Net Position (Deficit) 28-29 Notes to Financial Statements 30-66 Required Supplementary Information Schedule of Revenues, Expenditures, and Changes in Fund Balance Budget and Actual - General Fund - Budgetary Basis 68-77 Notes to Budgetary Required Supplementary Information 78-79 Schedule of Funding Progress - Texas County and District Retirement System 80-81 Notes to Pension Required Supplementary Information 82 Schedule of Funding Progress - Fort Bend County Employee Benefit Plan 83

FORT BEND COUNTY, TEXAS TABLE OF CONTENTS
Page(s)
Other Supplementary Information Combining and Individual Fund Statements and Schedules Non-Major Fund Descriptions 89-93 Combining Balance Sheet - Non-Major Special Revenue Funds 94-101 Combining Statement of Revenues, Expenditures, and Changes in Fund Balances - Non-Major Special Revenue Funds 102-109 Schedules of Revenues, Expenditures, and Changes in Fund Balance - Budget and Actual - Budgetary Basis Road and Bridge Special Revenue Fund 110 Drainage District Special Revenue Fund 111 Debt Service Fund 112 Combining Statement of Net Position - Internal Service Funds 113 Combining Statement of Revenues, Expenses, and Changes in Fund Net Position (Deficit) - Internal Service Funds 114 Combining Statement of Cash Flows - Internal Service Funds 115 Statement of Changes in Assets and Liabilities - Agency Funds 116 UNAUDITED STATISTICAL SECTION Net Position by Component 118-119 Changes in Net Position 120-123 Fund Balances of Governmental Funds 124-125 Changes in Fund Balances, Governmental Funds 126-127 Assessed Value of Taxable Property 128-129 Assessed and Estimated Actual Value of Real and Personal Property 131 Property Tax Rates - Direct and Overlapping Governments 132-141 Principal Property Taxpayers 143 Property Tax Levies and Collections 144-145 Ratio of Net Long-Term Debt to Assessed Value Personal Income, and Net Long-Term Debt Per Capita 146-147 Direct and Overlapping Debt 148-151 Computation of Legal Debt Margin 152-153 Demographic and Economic Statistics 154 Largest Employers 155 Full-Time Equivalent County Government Employees by Function 156-157 Operating Indicators by Function 158-163 Capital Assets Used in the Operation of Governmental Funds Schedule by Activity 164-165


i
COUNTY AUDITOR Fort Bend County, Texas
Robert Ed Sturdivant County Auditor
281-341-3769, 281-341-3744 (fax) [email protected]
March 31, 2018
To the Honorable District Judges, Members of the Commissioners Court, and Citizens of Fort Bend County (the “County”), Texas: According to Section 114.025 of the Local Government Code of the State of Texas, the County Auditor is required to submit an annual report to the Commissioners Court and District Judges of the County. This report is published to fulfill that requirement for the fiscal year ended September 30, 2017. Management assumes full responsibility for the completeness and reliability of the information contained in this report, based upon a comprehensive framework of internal control that it has established for this purpose. Because the cost of internal control should not exceed anticipated benefits, the objective is to provide reasonable, rather than absolute, assurance that the financial statements are free of any material misstatements. Whitley Penn, LLP has issued an unmodified (“clean”) opinion on Fort Bend County’s financial statements for the year ended September 30, 2017. The independent auditors' report is located at the front of the financial section of this report. Management's discussion and analysis (“MD&A”) immediately follows the independent auditors’ report and provides a narrative introduction, overview, and analysis of the basic financial statements. MD&A complements this letter of transmittal and should be read in conjunction with it. Profile of the Government Fort Bend County is located in the Houston metropolitan area of southeast Texas. It encompasses a total of 875.0 square miles (562,560 acres). The terrain varies from level to gently rolling with elevations from 46 to 127 feet above sea level, with an average elevation of 85 feet. US 59 traverses the center of the County from northeast to southwest, while US 90A crosses from east to west. State Highways (SH) 6, 36 and 99 provide important north-south routes. Neighboring counties are Austin, Brazoria, Harris, Waller and Wharton. Fort Bend County has approximately 11 square miles of surface water in rivers, creeks and small lakes. The County is drained by the Brazos and San Bernard Rivers as well as Oyster Creek. The Brazos River formed a broad alluvial valley, up to ten miles wide in places. The resulting fertile soils have been a major contributing factor to the agricultural industry in the County. The three permanently floatable waterways in Fort Bend County are the Brazos River, the San Bernard River (south of Farm to Market Road 442), and

ii
Oyster Creek (south of State Highway 6). The section of the San Bernard River south of Interstate Highway 10 is a seasonally floatable waterway, shared on the west with adjacent counties. Soils vary from the rich alluvial soils in the Brazos River Valley to sandy loam and clay on the prairies. Native trees include pecan, oak, ash and cottonwood, with some old bottomland forests remaining along waterways. The Commissioners Court, which is composed of the County Judge and four County Commissioners, is the governing body of the County. It has certain powers granted to it by the state legislature. Its duties include the approval of the budget, determination of the tax rates, approval of contracts, calling of elections, issuance of bonds, appointment of certain county officials, and the oversight responsibility of all the funds included in this report. The County provides a full range of services to the citizens of the area. Among these services are public safety (sheriff, jail facilities, constables and fire marshal), road and bridge maintenance, drainage and flood control, health and welfare (ambulance paramedics, health and sanitation, indigent care, animal control, landfill, etc.), a eleven-branch library system, county/district judicial systems, and other state-supported programs. In accordance with standards established by the Governmental Accounting Standards Board (“GASB”), the County reports all funds for which the County, as the primary government, is financially accountable. The Fort Bend County Drainage District, Fort Bend County Assistance Districts (“CADs”), Fort Bend County Toll Road Authority, Fort Bend Grand Parkway Toll Road Authority, Fort Bend County Surface Water Supply Corporation, Fort Bend County Housing Finance Corporation, and Fort Bend County Industrial Development Corporation are considered to meet the criteria of component units. The Toll Road Authorities, Surface Water Supply Corporation, Housing Finance Corporation, and Industrial Development Corporation have been included in the report as discretely presented component units. The Drainage District and the CADs have been included in the combining statements in other supplementary information, as they are reported as blended component units. Additional information about the County is available on the Fort Bend County website: http://www.fortbendcountytx.gov/. Local Economy Fort Bend County continues to experience growth in the local economy for fiscal year 2017. This is evident by the continued increases in new home sales, labor force, and employment rate. The demand for services regarding the governmental functions performed by the County increased again in 2017. The Commissioners Court remains conservative in its approach to the allocation of resources to serve the County’s needs to ensure that Fort Bend County is prepared as the local economy improves. This ongoing conservative approach will allow the County to meet the service demands of the residents in Fort Bend County. Long-Term Financial Planning and Relevant Financial Policies Budget The County adopts a one-year budget through its fully coordinated financial planning process. The budget implements strategies, both financial and operational, identified through the strategic and long-range planning process to meet existing challenges and to effectively plan for future needs. The budget is a financial plan for a fiscal year of operations that matches all planned revenues and expenditures with the services provided the citizens of Fort Bend County based on the established budget policy. Decisions are not based solely on current conditions but on the long-term welfare of the community. The budget is developed and resources allocated based on the vision, mission, and goals of the County.

iii
Long-Term Comprehensive Plan The County’s Long-Term Comprehensive Plan outlines goals to be accomplished by the County through its various departments. Many of the specific goals have been met, but since all are long-term, many are still in the future. The County’s departments are working hard to realize these goals on a continuing basis. We intend to achieve all the goals and objectives in the plan over time. These goals are as follows:
• Assure that the County is a safe and attractive place to live, work and play. • Utilize state-of-the-art equipment and methods appropriately in the provision and timely
delivery of authorized and allowed services. • Provide the necessary support for mobility and transportation needs in the County. • Promote a favorable environment for retaining and expanding existing businesses while
attracting a wide variety of new businesses to provide employment opportunities. • Support environmental concerns for preservation of natural and historic resources
balanced with sensitivity to the needs of development and recreation. • Encourage cultural development and ethnic diversity. • Develop a quality, consumer sensitive, holistic approach to health and human services
that keeps pace with the County’s growth. • Actively seek to increase and coordinate volunteerism and active citizen participation that
strives for the good of the County as a whole. • Work cooperatively with other governmental entities to complement their efforts. • Operate the County government in the most fiscally responsible manner. • Reorganize and consolidate departments under the direction of competent, trained senior
managers who report to Commissioners Court. • Regularly consider the decisions on behalf of the County with respect to the goals set
forth in the plan. Review, update, and amend the plan on an annual basis. Capital Improvement Program The County maintains a multi-year Capital Projects Plan that includes two primary elements: facilities construction or remodeling and mobility projects. Mobility projects include all road projects fully or partially funded by the County and encompass county, municipal, and state roads. Under the facilities construction plan for projects to be funded from the annual operating budget, all requested and anticipated construction projects are documented with annual costs of new personnel, furnishings, utilities, and other operating costs attached. Annually, the Commissioners Court selects projects from this list to be accomplished during the current fiscal year and determines the capital outlay associated with those projects. These capital costs are budgeted within Capital Outlay and moved to individual project budgets within the parent fund as the projects develop, and current year operating costs are budgeted in the applicable departmental budget. The Commissioners Court presented a referendum to the voters in November 2015 to construct a judicial administration building, parking garage adjacent to the justice center, medical examiner’s office, Sheriff’s Office administration building, county-wide parks improvements, parks land acquisitions, Emergency Medical Services facility improvements, fairgrounds facilities, 5th Street community center expansion, Houston Community College Sienna campus acquisition, Missouri City branch library expansion/renovation, Sheriff’s Office Katy area sub-station, and a new branch library west of Katy . The referendum was presented for a total of $93.4 million and each proposition was passed by the voters as follows: Proposition 1 (parks and community centers) – 68.99%; proposition 2 (fairgrounds buildings, parking and improvements) – 60.82%; proposition 3 (library facilities) – 69.92%; and proposition 4 (justice and public safety facilities) – 59.62%. These projects will be funded from the authorized referendum with a phased plan to meet the needs of the governmental functions. The County issued $57.2 million of this

iv
authorization in June 2016. The remaining $41.4 million will be issued during the summer of 2019. Mobility Projects involve projects accomplished in cooperation with other entities, including the Texas Department of Transportation and other entities within Fort Bend County. The County’s portion of these projects is being funded by bond authorizations approved in fiscal years 2013 and 2017. The County issued the $57.1 million of the 2013 authorization in June 2016 and an additional $60 million in January 2018 leaving an unissued balance of $67.8 million. This balance is expected to be issued in 2020. The County presented a Mobility Bond referendum to the voters in November 2017 in the amount of $218.5 million and was approved by 70% of the vote. The County has issued a total of $359.1 million in unlimited tax road bonds since fiscal year 2001 as of the date of this report. Individual projects have been completed at a total cost of approximately $316.3 million with the aid of additional resources from other entities. The remaining projects will be completed over the next ten years. The Fort Bend County Toll Road Authority and the County began phase one of the Westpark Tollway extension in February 2017. The Authority issued $64.4 million in first lien revenue bonds for the tolled lanes of phase one and preliminary construction of phase two in February 2016. The County issued $47.5 million in combination tax and revenue bonds in August 2017 to fund the non-tolled lanes for phase one and phase two of the project. The debt service for this issue will be paid from a $40 million commitment from Texas Department of Transportation with the balance paid from sales tax revenue from County Assistance District One. Debt Policy The purpose of Fort Bend County’s Debt Policy is to establish guidelines for the utilization of debt instruments issued by the County whether payable from County taxes or payable from certain revenues of the County. Debt instruments may include general obligation tax bonds, revenue bonds, subordinate-lien bonds, commercial paper, variable rate demand notes, variable rate auction notes, bond anticipation notes, revenue anticipation notes, tax anticipation notes and capitalized leases, as well as combinations of the foregoing. These debt instruments shall only be used to fund the lease, purchase or construction costs of capital assets; to fund infrastructure improvements and additions; to refund or defease existing debt; to fund capitalized interest; to fund costs of issuance; or to make deposits to reserve funds and other funds required or provided for in debt instruments. Debt instruments will not be used to fund operating expenses except in extreme circumstances for very short terms. This policy will apply to all debt issued by the County or any district or authority where the Commissioners Court acts as the governing body. It also may apply to those entities over which the Commissioners Court has oversight authority if the entity’s governing body approves a recommendation of the Commissioners Court to adopt this policy. This debt policy does not apply to debt issued by the Housing Finance Corporation, Industrial Development Corporation, or similar agencies operating in Fort Bend County but are responsible to another entity. The County will ensure all uses of debt instruments are in compliance with all statutory requirements, and in accordance with the guidelines contained herein, outstanding ordinances, insurance covenants, and existing agreements. Further, the County will ensure that the utilization of any debt instrument provides the most prudent and cost-effective funding possible, taking all material matters into account. Major Initiatives Mobility remains one of the top priorities as the County continues to grow and develop. With the major roadways already heavily congested, mobility has been, and continues to be, a primary concern. Continued residential and commercial expansion has increased the use of County roads. Right-of-way acquisitions for future roads have required more focus on future planning to prevent project delays. Completed road projects have proven to be effective in reducing congestion and enhancing safety within the County. As

v
noted above in “Capital Improvement Programs” on pages iii-iv, the County is continuing with its mobility project initiatives as well as the extension of the Westpark Tollway in cooperation with the Fort Bend County Toll Road Authority. Awards and Acknowledgements The Government Finance Officers Association of the United States and Canada (“GFOA”) awarded a Certificate of Achievement for Excellence in Financial Reporting to Fort Bend County, Texas, for its Comprehensive Annual Financial Report (“CAFR”) for the year ended September 30, 2016. This was the thirty first consecutive year that the County has received this prestigious award. In order to be awarded a Certificate of Achievement, a governmental unit must publish an easily readable and efficiently organized CAFR. This report must satisfy both generally accepted accounting principles and applicable legal requirements. A Certificate of Achievement is valid for a period of one year only. We believe that our current CAFR continues to meet the Certificate of Achievement Program's requirements, and we are submitting it to GFOA to determine its eligibility for another certificate. In addition, the County also received the GFOA's Distinguished Budget Presentation Award for its annual budget document dated September 30, 2016. In order to qualify for the Distinguished Budget Presentation Award, the government's budget document must be judged proficient as a policy document, a financial plan, an operations guide, and a communications device. The preparation of this report could not be achieved without the efficient and dedicated services of the staff of the County Auditor's Office and Whitley Penn, LLP, our independent auditor. Respectfully submitted,
Robert E. Sturdivant, CPA County Auditor Fort Bend County, Texas
FORT BEND COUNTY MISSION STATEMENT
Fort Bend County strives to be the most family friendly community in Texas by providing a high quality, enriching and safe environment. Each department and elective office provides fast, friendly service to its customers and continually strives to be number one in efficiency and effectiveness. The Commissioners Court fulfills its leadership role by providing necessary resources to the offices and
departments to accomplish their duties and goals, by establishing budgets, policies and procedures to make the most efficient uses of the resources and by actively pursuing quality businesses to locate in
Fort Bend County.

vi

vii

viii
FORT BEND COUNTY, TEXAS ORGANIZATIONAL CHART OF ELECTED OFFICIALS

ix
FORT BEND COUNTY, TEXAS ORGANIZATIONAL CHART OF COUNTY DEPARTMENTS

x

1
INDEPENDENT AUDITORS’ REPORT To the Honorable Robert E. Hebert, County Judge and Members of Commissioners Court Fort Bend County, Texas Report on the Financial Statements
We have audited the accompanying financial statements of the governmental activities, the aggregate discretely presented component units, each major fund, and the aggregate remaining fund information of Fort Bend County, Texas, (the “County”), as of and for the year ended September 30, 2017, and the related notes to the financial statements, which collectively comprise the County’s basic financial statements as listed in the table of contents.
Management’s Responsibility for the Financial Statements
Management is responsible for the preparation and fair presentation of these financial statements in accordance with accounting principles generally accepted in the United States of America; this includes the design, implementation, and maintenance of internal control relevant to the preparation and fair presentation of financial statements that are free from material misstatement, whether due to fraud or error.
Auditor’s Responsibility
Our responsibility is to express opinions on these financial statements based on our audit. We conducted our audit in accordance with auditing standards generally accepted in the United States of America and the standards applicable to financial audits contained in Government Auditing Standards, issued by the Comptroller General of the United States. Those standards require that we plan and perform the audit to obtain reasonable assurance about whether the financial statements are free from material misstatement.
An audit involves performing procedures to obtain audit evidence about the amounts and disclosures in the financial statements. The procedures selected depend on the auditor’s judgment, including the assessment of the risks of material misstatement of the financial statements, whether due to fraud or error. In making those risk assessments, the auditor considers internal control relevant to the entity’s preparation and fair presentation of the financial statements in order to design audit procedures that are appropriate in the circumstances, but not for the purpose of expressing an opinion on the effectiveness of the entity’s internal control. Accordingly, we express no such opinion. An audit also includes evaluating the appropriateness of accounting policies used and the reasonableness of significant accounting estimates made by management, as well as evaluating the overall presentation of the financial statements.
We believe that the audit evidence we have obtained is sufficient and appropriate to provide a basis for our audit opinions.

2
Opinions
In our opinion, the financial statements referred to above present fairly, in all material respects, the respective financial position of the governmental activities, the aggregate discretely presented component units, each major fund, and the aggregate remaining fund information of the County, as of September 30, 2017, and the respective changes in financial position, and, where applicable, cash flows thereof for the year then ended in accordance with accounting principles generally accepted in the United States of America.
Other Matters
Required Supplementary Information
Accounting principles generally accepted in the United States of America require that the management’s discussion and analysis on pages 5 through 12 and other required supplementary information, as listed in the table of contents, on pages 68 through 83 be presented to supplement the basic financial statements. Such information, although not a part of the basic financial statements, is required by the Governmental Accounting Standards Board, who considers it to be an essential part of financial reporting for placing the basic financial statements in an appropriate operational, economic, or historical context. We have applied certain limited procedures to the required supplementary information in accordance with auditing standards generally accepted in the United States of America, which consisted of inquiries of management about the methods of preparing the information and comparing the information for consistency with management’s responses to our inquiries, the basic financial statements, and other knowledge we obtained during our audit of the basic financial statements. We do not express an opinion or provide any assurance on the information because the limited procedures do not provide us with sufficient evidence to express an opinion or provide any assurance.
Other Information
Our audit was conducted for the purpose of forming opinions on the financial statements that collectively comprise the County’s basic financial statements. The introductory section, combining and individual nonmajor fund financial statements, budgetary comparison schedules, and statistical section are presented for purposes of additional analysis and are not a required part of the basic financial statements.
The combining and individual nonmajor fund financial statements and the budgetary comparison schedules are the responsibility of management and were derived from and relate directly to the underlying accounting and other records used to prepare the basic financial statements. Such information has been subjected to the auditing procedures applied in the audit of the basic financial statements and certain additional procedures, including comparing and reconciling such information directly to the underlying accounting and other records used to prepare the basic financial statements or to the basic financial statements themselves, and other additional procedures in accordance with auditing standards generally accepted in the United States of America. In our opinion, the combining and individual nonmajor fund financial statements and the budgetary comparison schedules are fairly stated in all material respects in relation to the basic financial statements as a whole.
The introductory and statistical sections have not been subjected to the auditing procedures applied in the audit of the basic financial statements and, accordingly, we do not express an opinion or provide any assurance on them.

3
Other Reporting Required by Government Auditing Standards
In accordance with Government Auditing Standards, we have also issued our report dated March 31, 2018 on our consideration of the County’s internal control over financial reporting and on our tests of its compliance with certain provisions of laws, regulations, contracts, and grant agreements and other matters. The purpose of that report is to describe the scope of our testing of internal control over financial reporting and compliance and the results of that testing, and not to provide an opinion on internal control over financial reporting or on compliance. That report is an integral part of an audit performed in accordance with Government Auditing Standards in considering the County’s internal control over financial reporting and compliance. Houston, Texas March 31, 2018

4
(This page intentionally left blank.)

FORT BEND COUNTY, TEXAS MANAGEMENT’S DISCUSSION AND ANALYSIS
5
As management of Fort Bend County, Texas (the “County”), we offer readers of the County’s financial statements this narrative overview and analysis of the financial activities of the County for the fiscal year ended September 30, 2017. The following narrative includes approximate values and percentages in the wording to summarize the schedules and financials in this report that include the exact values. We encourage readers to consider the information presented here in conjunction with additional information that we have furnished in our letter of transmittal, which can be found on pages i-v of this report. Financial Highlights
The assets and deferred outflows of resources of the County exceeded its liabilities and deferred inflows of resources at the close of the most recent fiscal year by $1.3 billion (“net position”). Of this amount, there is a deficit of $227.2 million in unrestricted net position due to the continued increase in pension and other post-employment benefits (“OPEB”) liabilities.
The County’s total net position increased by $44.9 million. The County’s total assets and deferred outflow of resources increased by $166.8 million
and total liabilities and deferred inflows of resources increased by $121.9 million during the current fiscal year.
As of the close of the current fiscal year, the County’s governmental funds reported a combined ending fund balance of $204 million, an increase of $15.1 million from the prior year.
At the end of the current fiscal year approximately $44.7 million is available for spending at the government's discretion in the General Fund (unassigned fund balance). This unassigned fund balance amounts to 16.3% of total General Fund expenditures.
Overview of the Financial Statements This discussion and analysis is intended to serve as an introduction to the County’s basic financial statements. The County’s basic financial statements consist of three components: (1) government-wide financial statements, (2) fund financial statements, and (3) notes to the financial statements. As noted above this narrative includes approximate values and percentages in the wording to summarize the schedules and financials in this report that include the exact values. This report also contains other supplementary information intended to furnish additional detail to support the basic financial statements themselves. Government-wide financial statements The government-wide financial statements are designed to provide readers with a broad overview of the County’s finances, in a manner similar to a private-sector business. The statement of net position presents financial information on all of the County’s assets, liabilities, and deferred inflows/outflows, with the difference reported as net position. Over time, increases or decreases in net position may serve as a useful indicator of whether the financial position of the County is improving or deteriorating. The statement of activities presents information showing how the County’s net position changed during the most recent fiscal year. All changes in net position are reported as soon as the underlying event giving rise to the change occurs, regardless of the timing of related cash flows. Thus, revenues and expenses are reported in this statement for some items that will only result in cash flows in future fiscal periods (e.g., uncollected taxes and earned but unused vacation leave).

FORT BEND COUNTY, TEXAS MANAGEMENT’S DISCUSSION AND ANALYSIS (continued)
6
The government-wide financial statements present functions of the County that are principally supported by taxes (governmental activities). The governmental activities of the County include general administration, financial administration, administration of justice, construction and maintenance, health and welfare, cooperative services, public safety, parks and recreation, libraries and education, and interest on long-term debt. The government-wide financial statements include not only the County itself (known as the primary government), but also legally separate entities for which the County is financially accountable. Financial information for these component units is reported separately from the financial information presented for the primary government itself. The County’s five discretely presented component units consist of the following:
Fort Bend County Toll Road Authority Fort Bend Grand Parkway Toll Road Authority Fort Bend County Surface Water Supply Corporation Fort Bend County Housing Finance Corporation Fort Bend County Industrial Development Corporation
The government-wide financial statements can be found on pages 15 through 17 of this report. Fund financial statements A fund is a grouping of related accounts that is used to maintain control over resources that have been segregated for specific activities or objectives. The County uses fund accounting to ensure and demonstrate compliance with finance-related legal requirements. All of the funds of the County can be divided into three categories: governmental funds, proprietary funds, and fiduciary funds. Governmental funds Governmental funds are used to account for essentially the same functions reported as governmental activities in the government-wide financial statements. However, unlike the government-wide financial statements, governmental fund financial statements focus on near-term inflows and outflows of spendable resources, as well as on balances of spendable resources available at the end of the fiscal year. Such information may be useful in evaluating a government's near-term financing requirements. Because the focus of governmental funds is narrower than that of the government-wide financial statements, it is useful to compare the information presented for governmental funds with similar information presented for governmental activities in the government-wide financial statements. By doing so, readers may better understand the long-term impact of the government's near-term financing decisions. Both the governmental fund balance sheet and the governmental fund statement of revenues, expenditures, and changes in fund balances provide a reconciliation to facilitate this comparison between governmental funds and governmental activities. The County maintains 40 individual governmental funds. Information is presented separately in the governmental funds balance sheet and in the governmental funds statement of revenues, expenditures, and changes in fund balances for the major governmental funds. Data from the other governmental funds are combined into a single, aggregated presentation. Individual fund data for each of these non-major governmental funds is provided in the form of combining statements elsewhere in this comprehensive annual financial report. The basic governmental fund financial statements can be found on pages 18 through 21 of this report.

FORT BEND COUNTY, TEXAS MANAGEMENT’S DISCUSSION AND ANALYSIS (continued)
7
Proprietary funds The County uses internal service funds to report activities that provide services for the County’s other programs and activities. The Employee Benefits Fund and Other Self-Funded Insurance Fund are the County's internal service funds. Their purpose is to provide for the accumulation of money for insurance and employee benefits used in County operations. Because all of these services predominantly benefit governmental rather than business-type functions, they have been included within governmental activities in the government-wide financial statements. All internal service funds are combined into a single, aggregated presentation in the proprietary fund financial statements. Individual fund data for the internal service funds is provided in the form of combining statements elsewhere in this comprehensive annual financial report. The proprietary fund financial statements can be found on pages 22 through 24 of this report. Fiduciary funds Fiduciary funds are used to account for resources held for the benefit of parties outside the government. Fiduciary funds are not reflected in the government-wide financial statements because the resources of those funds are not available to support the County’s own programs. The accounting used for fiduciary funds is much like that used for proprietary funds. The fiduciary fund financial statement can be found on page 25 of this report. Combining component unit financial statements The County’s five discretely presented component units shown in aggregate on the face of the government-wide financial statements have individual information for each of the major discretely presented component units presented in the form of combining statements immediately following the fund financial statements of the primary government. The combining component unit financial statements can be found on pages 27 through 29 of this report. Notes to the financial statements The notes provide additional information that is essential to a full understanding of the data provided in the government-wide and fund financial statements. The notes to financial statements can be found on pages 30 through 66 of this report. Other information In addition to the basic financial statements and accompanying notes, this report also presents certain required supplementary information concerning the County’s progress in funding its obligation to provide pension benefits to its employees. The County adopts an annual appropriated budget for its General, Debt Service and certain special revenue funds. A budgetary comparison statement has been provided for the General Fund to demonstrate compliance with this budget. Required supplementary information can be found on pages 68 through 83 of this report.

FORT BEND COUNTY, TEXAS MANAGEMENT’S DISCUSSION AND ANALYSIS (continued)
8
Government-Wide Financial Analysis The following table provides a summary of the County’s net position at September 30, 2017 and 2016:
2017 2016
Current and other assets $ 336,918,315 $ 281,703,650 Capital assets, net 1,853,284,174 1,734,291,246 Total Assets 2,190,202,489 2,015,994,896
Deferred outflows of resources 56,736,501 64,146,670
Current liabilities 86,558,084 56,211,771Long-term liabilities 826,198,743 737,098,199Net pension liability 73,160,316 70,589,017Total Liabilities 985,917,143 863,898,987
Deferred inflows of resources 4,075,462 4,233,692 Net Position:
Net investment in capital assets 1,414,937,836 1,359,940,461 Restricted 69,185,967 51,713,877 Unrestricted (227,177,418) (199,645,451)
Total Net Position 1,256,946,385$ 1,212,008,887$
CONDENSED SCHEDULE OF NET POSITIONSeptember 30, 2017 and 2016
Primary GovernmentGovernmental Activities
As noted earlier, net position may serve over time as a useful indicator of a government's financial position. In the case of the County, assets and deferred outflows of resources exceeded liabilities and deferred inflows of resources by $1.3 billion at the close of the most recent fiscal year.
The County’s capital assets (e.g., land, buildings, vehicles, machinery and equipment, office furniture and equipment, infrastructure, and construction in progress), less any related debt used to acquire those assets that is still outstanding, total $1.4 billion. The County uses these capital assets to provide services to citizens. Consequently, these assets are not available for future spending. Although the County’s investment in its capital assets is reported net of related debt, it should be noted that the resources needed to repay this debt must be provided from other sources, since the capital assets themselves cannot be used to liquidate these liabilities. The deficit balance for unrestricted net position of $227.2 million was primarily due to the growing OPEB and net pension liabilities. The County’s net position increased $44.9 million from the prior year. This increase is primarily due to the following: increase in cash and investments of $55 million primarily due to the issuance of bonds for road projects; increase in capital assets of $119 million due to construction of new facilities and construction

FORT BEND COUNTY, TEXAS MANAGEMENT’S DISCUSSION AND ANALYSIS (continued)
9
and contribution of new roads; an increase in OPEB liability of $36.2 million, and an increase of $84 million in bonds payable. The following table provides a summary of the County’s operations for the years ended September 30, 2017 and 2016:
2017 2016RevenuesProgram revenues:
Charges for services $ 51,501,215 $ 51,970,902 Operating grants and contributions 43,581,664 38,115,985 Capital grants and contributions 120,393,977 126,855,630
General revenues:Property taxes 288,588,806 270,349,769 Sales taxes 6,858,009 6,958,956 Earnings on investments 3,460,544 1,761,994 Other 8,503,412 7,520,474
Total Revenues 522,887,627 503,533,710
ExpensesGeneral administration 67,508,837$ 61,923,654$ Financial administration 11,263,933 10,668,228 Administration of justice 115,538,871 106,035,587 Construction and maintenance 124,089,221 78,151,431 Health and human services 47,679,907 43,153,506 Cooperative services 1,210,100 1,215,874 Public safety 69,963,634 64,704,958 Parks and recreation 5,217,764 4,545,562 Libraries and education 19,285,563 18,446,773 Interest on long-term debt 16,192,299 14,960,865 Total Expenses 477,950,129 403,806,438
Change in Net Position 44,937,498 99,727,272 Net Position, Beginning 1,212,008,887 1,112,281,615 Net Position, Ending 1,256,946,385$ 1,212,008,887$
For the years ended September 30, 2017 and 2016
Primary GovernmentGovernmental Activities
SCHEDULE OF CHANGES IN NET POSITION
At the end of the current fiscal year, the County was able to report a positive balance in net position for the government as a whole. The same situation held true for the prior fiscal year. Governmental activities increased the County’s net position by $44.9 million primarily due to an increase in property taxes of $18.2 million due to an increase in property valuations, offset by an increase in Construction and maintenance expenses of $45.9 million due primarily to county expenses to construct state roads that were not capitalized, other increases were due to position and payroll related costs for a total of $28 million This increase is down from last year’s increase of $99.7 million.

FORT BEND COUNTY, TEXAS MANAGEMENT’S DISCUSSION AND ANALYSIS (continued)
10
Financial Analysis of the County's Funds As noted earlier, fund accounting is used to demonstrate and ensure compliance with finance-related legal requirements. Governmental Funds - The focus of the County’s governmental funds is to provide information of near-term inflows, outflows, and balances of spendable resources. Such information is useful in assessing the County's financing requirements. In particular, unassigned fund balance may serve as a useful measure of the County's net resources available for spending at the end of the fiscal year. The combined governmental fund balance reached $204 million. Of this, $44.7 million is unassigned fund balance and available for day-to-day operations within the General Fund. $11.8 million is committed fund balance for various purposes within the General Fund as listed in Note 13 of the financial statements. Fund balance of $147.5 million is restricted for General ($3.7 million), Debt Service ($9.9 million), Capital Projects ($76.9 million), and the non-major special revenue funds ($57 million). $174.2 thousand is non-spendable fund balance for the General Fund ($152.9 thousand) and the non-major special revenue funds ($21.3 thousand). There was an increase in the combined fund balance of $15.1 million from the prior year for the governmental funds. This overall increase was made up of a decrease in the Capital Projects Funds of $12.6 million, an increase in the Debt Service Fund of $8.8 million, an increase in Non-major Special Revenue Funds of $5.2 million, and an increase in General Fund balance of $13.7 million. This increase in fund balance for the General Fund is primarily due to the following factors:
Increase in General Fund property tax allocation of $10.6 million due to increased property valuations.
Increase in fees of office collections of $1.9 million due to increase in services from all the governmental functions.
Increase in intergovernmental revenues of $4.5 million primarily due to an increase in grant funding Increase in earnings on investments of $0.4 million due to an increase in investable cash and more
aggressive investing. The decrease of 11.1 million in capital outlay due to reduction in capital expenses funded from the
County budget. The factors above were offset by an increase of 28.4 million is due to increase in positions, Cost of
living adjustment, and increase in operating expenses The Debt Service Fund balance increased by $8.8 million as budgeted to increase to prepare for bond issues planned during the 2017 fiscal year. Proprietary Funds - The County's proprietary funds consist of insurance related internal service funds. The Employee Benefits Fund had a net position balance at fiscal year-end of $11 million, which is an increase of $6.6 million over the prior year’s net position of $4.4 million. This increase was primarily caused by a decrease in benefit claims paid during the fiscal year. The Other Self-Funded Insurance Fund has a net position balance of $3.4 million at fiscal year-end, which is an increase of $2.8 million over the prior year's net position balance of $0.5 million. This increase was primarily due to an increase in allocation for the Other Self-Funded Insurance Fund and a decrease in general administrative cost.

FORT BEND COUNTY, TEXAS MANAGEMENT’S DISCUSSION AND ANALYSIS (continued)
11
General Fund Budgetary Highlights During the year there was a net decrease of $20 million in expenditure appropriations between the original and final amended budget. The main components of this decrease were based on the following: $13.8 million decrease for general administration primarily due to allocation for multi-year Capital projects that were transferred to multi-year funds budgeted for fiscal year 2017 along with residual personnel budgets allocated for projects to be initiated by Commissioners Court after fiscal year 2017; $2.4 million decrease for health and welfare; $0.4 million decrease in construction and maintenance; and $3.0 million decrease for public safety. The decreases in health and welfare, construction and maintenance and public safety are primarily due to residual personnel budgets allocated to projects to be initiated by Commissioners Court after fiscal year 2017. General Fund revenues exceeded the amended budget by $7.5 million for the year. The primary reasons for this surplus are detailed as follows:
Property taxes resulted in a $5.5 million excess over budget due to increased collection rate and increased recover of delinquent taxes.
Fees and fines resulted in $1.1 million in excess revenues due to continued increased collections of fines, fees and court costs.
Capital Assets and Debt Administration Capital Assets - At the end of fiscal year 2017, the County's governmental activities had invested $1.9 billion in a variety of capital assets and infrastructure, as reflected in the following schedule. This represents an increase of approximately $119 million over the previous fiscal year.
2017 2016
Non-Depreciable Capital AssetsLand 429,217,807$ 417,808,330$ Construction in progress 69,903,094 48,223,387
Depreciable Capital Assets, NetVehicles 14,883,581 14,564,064Office furniture and equipment 4,569,040 5,510,222Machinery and equipment 11,678,544 11,054,002Buildings, facilities and improvements 275,610,916 262,624,295Infrastructure 1,047,421,192 974,506,946Totals 1,853,284,174$ 1,734,291,246$
Governmental Activities
Construction in progress at year-end represents: Road & parking construction ($46.7 million); facility and parks construction and improvements ($21.7 million), and software projects ($1.5 million).

FORT BEND COUNTY, TEXAS MANAGEMENT’S DISCUSSION AND ANALYSIS (continued)
12
Long-Term Debt - The County had total bonds and notes outstanding of $523.8 million at fiscal year-end. This is an increase of $43.1 million from the prior year due to the issuance of the 2017 Unlimited Tax Road and Refunding Bonds and the 2017 Facilities Limited Tax Road and Refunding Bonds, offset by scheduled debt service payments made during fiscal year 2017. OPEB liability increased by $36.2 million based on the latest actuarial valuation to a total balance of $293.1 million.
2017 2016General obligation bonds 453,690,000$ 410,560,000$ Tax notes 3,808,978Premiums on bonds 66,343,007 62,444,495Accrued compensated absences 9,220,843 7,195,732Other post-employment benefits
("OPEB") obligation 293,135,915 256,897,972Totals 826,198,743$ 737,098,199$
Governmental Activities
The County received an insured rating of Aaa from Moody’s and Standard and Poors on issuances prior to 2009. Subsequent County issuances were not insured and therefore retained the uninsured ratings. The uninsured ratings were Aa1 from Moody’s and AA+ from Fitch. Additional information on capital assets and long-term debt is available in Notes 6 and 8, respectively. Economic Factors and Next Year’s Budgets and Rates The County continues to enjoy growth in various demographic areas as the economy improves. The population of the County is estimated at 741,237 in 2017 and is expected to grow to 824,340 by 2020. The number of households has increased to 236,315 in 2017 and is expected to grow to 259,760 by 2020. Mean household income for 2016 is $191,862 and is estimated to rise to $204,735 by 2020. Income per capita is currently at $60,117 and is expected to grow to $64,840 by 2020. The Commissioners Court approved a $365.5 million total budget for the 2018 fiscal year. This is a 5.54% increase over the adopted 2017 fiscal year budget. The increase in the budget is primarily due to increased payroll costs and increased debt service. The overall tax rate decreased from $0.474 per $100 of assessed valuation for 2017 to $0.469 per $100 valuation for 2018. Requests for Information This financial report is designed to provide a general overview of Fort Bend County, Texas finances for all of those with an interest in the County’s finances. Questions concerning this report or requests for additional financial information should be directed to Ed Sturdivant, County Auditor, 301 Jackson, Suite 701, Richmond, TX 77469, telephone (281) 341-3760.

13
BASIC FINANCIAL STATEMENTS

14

The accompanying notes are an integral part of these financial statements.
15
FORT BEND COUNTY, TEXASSTATEMENT OF NET POSITION
September 30, 2017
Primary Government
Governmental Activities
Component Units
AssetsCash and cash equivalents 249,083,043$ 61,752,855$
Investments 22,053,841 35,504,279
Receivables:
Taxes, net 7,972,596
Grants 13,736,977
Fines and fees 27,563,627
Other 11,432,355 7,719,118
Prepaid items 174,234
Due from component units 4,901,642
Due from primary government 15,423,326
Capital assets, not being depreciated 499,120,901 94,774,576
Capital assets, net of accumulated depreciation 1,354,163,273 319,658,278
Total Assets 2,190,202,489 534,832,432
Deferred Outflows of ResourcesDeferred charges-debt refunding 8,587,949 9,020,661
Deferred outflows related to pension activities 48,148,552
Total Deferred Outflows of Resources 56,736,501 9,020,661
LiabilitiesAccounts payable and accrued expenses 59,768,211 8,702
Retainage payable 2,171,509 278,801
Accrued interest payable 1,818,239 1,564,374
Unearned revenues 6,646,667
Due to component units 15,423,326
Due to primary government 4,901,642
Due to other governments 730,132
Long-term Liabilities:Long-term liabilities due within one-year 28,236,211 6,260,000
Long-term liabilities due in more than one-year 797,962,532 439,163,587
Net pension liability 73,160,316
Total Liabilities 985,917,143 452,177,106
Deferred Inflows of ResourcesDeferred inflows related to pension activities 4,075,462
Total Deferred Inflows of Resources 4,075,462
Net Position (Deficit)Net investment in capital assets 1,414,937,836 5,432,140
Restricted for:
Debt service 8,464,715
Other 60,721,252 23,846,676
Unrestricted (227,177,418) 62,397,171 Total Net Position 1,256,946,385$ 91,675,987$

The accompanying notes are an integral part of these financial statements.
16
FORT BEND COUNTY, TEXASSTATEMENT OF ACTIVITIES
For the Year Ended September 30, 2017
Program Revenues
Functions/Programs ExpensesCharges for
Services
Operating Grants and
Contributions
Capital Grants and
Contributions
Primary Government
Governmental Activities:General administration 67,508,837$ 8,851,604$ 5,450,961$ 175,000$
Financial administration 11,263,933 7,975,576
Administration of justice 115,538,871 8,566,204 10,566,287Construction and maintenance 124,089,221 6,547,329 4,678,766 120,203,650
Health and human services 47,679,907 9,615,495 18,966,638
Cooperative services 1,210,100 15,327
Public safety 69,963,634 9,538,600 3,760,913
Parks and recreation 5,217,764 145,150 95,821
Libraries and education 19,285,563 261,257 62,278
Interest on long-term debt 16,192,299Total Primary Government 477,950,129$ 51,501,215$ 43,581,664$ 120,393,977$
Component Units:FBC Toll Road Authority 24,279,031$ 27,059,416$ $ 492,509$
FB Grand Parkway Toll Road Authority 17,801,584 24,499,686 1,362,346
FBC Housing Finance Corporation 30,680 31,805
FBC Industrial Development Corporation 35,982 Total Component Units 42,147,277$ 51,590,907$ $ 1,854,855$
General Revenues:Property taxes, penalties, and interest
Sales taxes
Earnings on investments
Miscellaneous
Total General Revenues Changes in Net Position
Net Position, Beginning of YearNet Position, End of Year

The accompanying notes are an integral part of these financial statements.
17
Net (Expense) Revenue and Changes in Net Position
Primary Government
Component Units
Governmental Activities
(53,031,272)$ $
(3,288,357)
(96,406,380) 7,340,524
(19,097,774)
(1,194,773)
(56,664,121)
(4,976,793)
(18,962,028)
(16,192,299) (262,473,273)
3,272,894$
8,060,448
1,125
(35,982) 11,298,485
288,588,806
6,858,009
3,460,544 1,180,052
8,503,412
307,410,771 1,180,052
44,937,498 12,478,537
1,212,008,887 79,197,450 1,256,946,385$ 91,675,987$

The accompanying notes are an integral part of these financial statements.
18
FORT BEND COUNTY, TEXASBALANCE SHEETGOVERNMENTAL FUNDSSeptember 30, 2017
General FundDebt Service
FundCapital
Project Funds
Non-major Special Revenue
Funds
Totals Governmental
FundsAssets
Cash and cash equivalents 54,677,568$ 7,720,007$ 106,986,918$ 65,426,991$ 234,811,484$ Investments 22,053,841 22,053,841 Taxes receivable, net 5,383,137 430,199 2,159,260 7,972,596 Grants receivable 13,008,367 728,610 13,736,977 Fines and fees receivable 27,563,627 27,563,627 Other receivables 4,772,548 3,153,540 7,100 2,404,628 10,337,816 Due from other funds 53,839,817 2,094,096 55,933,913 Due from component units 4,887,642 14,000 4,901,642 Prepaid items 152,920 21,314 174,234
Total Assets 164,285,626$ 13,397,842$ 129,047,859$ 70,754,803$ 377,486,130$
Liabilities and Fund BalancesLiabilities
Accounts payable 47,513,762$ $ $ 130,256$ 47,644,018$ Accrued payroll 5,525,678 5,525,678 Retainage payable 133,837 2,037,672 2,171,509 Due to other funds 2,094,096 48,697,796 10,187,047 60,978,939 Due to component units 14,018,633 1,404,693 15,423,326 Due to other governments 638,793 91,339 730,132 Unearned revenues 1,015,444 3,114,888 2,516,124 6,646,456
Total Liabilities 70,940,243 3,114,888 52,140,161 12,924,766 139,120,058
Deferred Inflows of ResourcesUnavailable revenue-property taxes 5,383,137 430,199 951,204 6,764,540 Unavailable revenue-other 27,563,627 27,563,627
Total Deferred Inflows of Resources 32,946,764 430,199 951,204 34,328,167
Fund BalancesNonspendable 152,920 21,314 174,234 Restricted 3,736,150 9,852,755 76,907,698 56,985,102 147,481,705 Committed 11,792,299 11,792,299Unassigned 44,717,250 (127,583) 44,589,667
Total Fund Balances 60,398,619 9,852,755 76,907,698 56,878,833 204,037,905
Total Liabilities, Deferred Inflows of Resources, and Fund Balances 164,285,626$ 13,397,842$ 129,047,859$ 70,754,803$ 377,486,130$

The accompanying notes are an integral part of these financial statements.
19
FORT BEND COUNTY, TEXASRECONCILIATION OF THE BALANCE SHEET TO THE STATEMENT OF NET POSITIONSeptember 30, 2017
Total fund balances, governmental funds 204,037,905$
Amounts reported for governmental activities in the Statement of Net Position are differentbecause:
Capital assets used in governmental activities are not current financial resources and thereforeare not reported in the fund financial statements, but are reported in the governmental activitiesof the Statement of Net Position. 1,852,670,759
Other long-term assets are not available to pay for current period expenditures and aretherefore deferred in the funds. 34,328,166
Some liabilities are not due and payable in the current period and are not included in the fundfinancial statements, but are reported in the governmental activities of the Statement of NetPosition.
Bonds and Notes payable (457,498,978) Deferred charges on debt refunding 8,587,949 Compensated absences (9,220,843) Other post-employment benefits ("OPEB") obligation (293,135,915) Premiums on issuance of debt (66,343,007) Accrued interest payable on bonds (1,818,239)
Net pension liability and related deferred outflows and inflows do not represent assets orliabilities in the current period and are not recognized in the governmental fund financialstatements.
Net pension liability (73,160,316) Deferred outflows related to pension activities 48,148,552 Deferred inflows related to pension activities (4,075,462)
Internal Service Funds are used by management to charge the costs of certain activities, suchas insurance, to individual funds. The assets and liabilities of the Internal Service Funds areincluded in governmental activities in the Statement of Net Position. 14,425,814
Net Position of Governmental Activities 1,256,946,385$

The accompanying notes are an integral part of these financial statements.
20
FORT BEND COUNTY, TEXASSTATEMENT OF REVENUES, EXPENDITURES, AND CHANGES IN FUND BALANCESGOVERNMENTAL FUNDSFor the Year Ended September 30, 2017
General FundDebt Service
FundCapital Project
Funds
Non-major Special Revenue
Funds
Totals Governmental
FundsRevenuesProperty taxes 218,853,835$ 46,202,479$ $ 22,926,718$ 287,983,032$ Sales taxes 6,858,009 6,858,009 Fines and fees 40,359,184 11,377,320 51,736,504 Intergovernmental 32,049,215 649,091 3,987,578 11,048,799 47,734,683 Earnings on investments 1,584,578 155,115 916,211 778,993 3,434,897 Miscellaneous 4,665,143 2,094,096 25 2,464,010 9,223,274 Total Revenues 297,511,955 49,100,781 4,903,814 55,453,849 406,970,399
ExpendituresCurrent:
General administration 59,307,844 125,437 1,235,773 60,669,054 Financial administration 9,446,341 5,084 9,451,425 Administration of justice 72,802,991 23,254,181 96,057,172 Construction and maintenance 3,020,767 37,903,438 33,000,015 73,924,220 Health and human services 38,931,008 2,874,236 41,805,244 Cooperative services 1,048,609 1,048,609 Public safety 56,557,861 1,594,772 58,152,633 Parks and recreation 3,701,092 3,701,092 Libraries and education 15,822,200 67,747 15,889,947
Capital Outlay 14,115,424 49,744,143 2,680,632 66,540,199 Debt Service:
Principal 21,420,000 21,420,000 Interest and fiscal charges 18,914,424 18,914,424 Debt issuance costs 599,813 599,813
Total Expenditures 274,754,137 40,334,424 88,372,831 64,712,440 468,173,832 Excess (Deficiency) of Revenues
Over (Under) Expenditures 22,757,818 8,766,357 (83,469,017) (9,258,591) (61,203,433)
Other Financing Sources (Uses)Transfers in 5,234,785 14,499,843 19,734,628 Transfers (out) (14,282,458) (5,430,401) (21,769) (19,734,628) General obligation bonds isssued 64,550,000 64,550,000 Premium on general obligation bonds issued 7,965,901 7,965,901 Tax Notes issued 3,808,978 3,808,978
Total Other Financing Sources (Uses) (9,047,673) 70,894,478 14,478,074 76,324,879
Net Change in Fund Balances 13,710,145 8,766,357 (12,574,539) 5,219,483 15,121,446 Fund Balances, Beginning of Year 46,688,474 1,086,398 89,482,237 51,659,350 188,916,459
Fund Balances, End of Year 60,398,619$ 9,852,755$ 76,907,698$ 56,878,833$ 204,037,905$

The accompanying notes are an integral part of these financial statements.
21
FORT BEND COUNTY, TEXASRECONCILIATION OF THE STATEMENT OF REVENUES, EXPENDITURES, AND CHANGES IN
FUND BALANCES (GOVERNMENTAL FUNDS) TO THE STATEMENT OF ACTIVITIESFor the Year Ended September 30, 2017
Net change in fund balances - total governmental funds 15,121,446$
Adjustments for the Statement of Activities:
Governmental funds report capital outlays as expenditures. However, in the Statement of Activities, the costof those assets is allocated over their estimated useful lives and reported as depreciation expense. This is theamount by which current year capital outlay ($54,604,753) exceeded depreciation ($50,949,369) in the currentperiod. 3,655,384
Capital contributions of infrastructure are reported in the government-wide financial statements but not in thefund financial statements. 115,715,269
Governmental funds report the entire net sales prices (proceeds) from the sales of capital assets as revenuebecause they provide current financial resources. The change in net position differs from the change in fundbalance by the cost of capital assets sold. (344,009)
The issuance of long-term debt (e.g. bonds, leases) provides current financial resources to governmental funds,while the repayment of the principal of long-term debt consumes the of governmental funds. Neithertransaction, however, has any effect on net position. Also, governmental current financial resources fundsreport the effect of premiums, discounts, and similar items when debt is first issued, whereas these amountsare deferred and amortized in the Statement of Activities. This amount is the net effect of these differences inthe treatment of long-term debt and related items.
Debt issued:General obligation bonds (64,550,000) Premium on bonds issued (7,965,901)
Tax Notes (3,808,978) Repayments:
Principal repayments 21,420,000
Pension contributions made during the year, are treated as expenditures in the governmental funds but aretreated as a reduction in net pension liability in government wide financial statements. 17,417,913
Some expenses reported in the statement of activities do not require the use of current financial resources andtherefore, are not reported as expenditures in the governmental funds.
Compensated absences (2,025,111) Accrued interest (212,894) Pension expense for the pension plan measurement year (26,657,627) Other post-employment benefit ("OPEB") obligation (36,237,943) Amortization of bond premiums 4,067,389 Amortization of deferred charge on refunding (583,523)
Revenues that do not provide current financial resources are not reported as revenues in the governmentalfunds. This adjustment reflects the net change in receivables on the accrual basis of accounting. 466,343
Internal service funds are used by management to charge the costs of certain activities, such as insurance andequipment replacement, to individual funds. The net revenues (expenses) are reported with governmentalactivities. 9,459,740
Change in net position of governmental activities 44,937,498$

The accompanying notes are an integral part of these financial statements.
22
FORT BEND COUNTY, TEXASSTATEMENT OF NET POSITION
PROPRIETARY FUNDS
September 30, 2017
Governmental
Activities
Internal
Service Funds
AssetsCurrent Assets:
Cash and cash equivalents 14,271,559$
Due from other funds 6,209,873
Other receivables 1,094,539
Total Current Assets 21,575,971
Noncurrent Assets:
Capital assets, net of accumulated depreciation 613,415
Total Noncurrent Assets 613,415
Total Assets 22,189,386
LiabilitiesCurrent Liabilities:
Benefits payable 6,598,725
Due to other funds 1,164,847
Total Current Liabilities 7,763,572
Total Liabilities 7,763,572
Net PositionNet investment in capital assets 613,415
Unrestricted 13,812,399
Total Net Position 14,425,814$

The accompanying notes are an integral part of these financial statements.
23
FORT BEND COUNTY, TEXASSTATEMENT OF REVENUES, EXPENSES, AND
CHANGES IN FUND NET POSITION (DEFICIT)
PROPRIETARY FUNDS
For the Year Ended September 30, 2017
Governmental
Activities
Internal
Service FundsOperating RevenuesCharges for services 50,802,481$
Total Operating Revenues 50,802,481
Operating ExpensesContactual services 2,410,490
Benefits provided 38,924,181
Depreciation 33,717
Total Operating Expenses 41,368,388
Operating Income 9,434,093
Non-Operating RevenuesEarnings on investments 25,647
Total Non-Operating Revenues 25,647
Change in Net Position 9,459,740
Total Net Position, Beginning of Year 4,966,074
Total Net Position, End of Year 14,425,814$

The accompanying notes are an integral part of these financial statements.
24
FORT BEND COUNTY, TEXASSTATEMENT OF CASH FLOWS
PROPRIETARY FUNDS
For the Year Ended September 30, 2017
Governmental
Activities
Internal
Service Funds
Cash Flows from Operating ActivitiesCharges for services 43,835,857$
Payment of benefits (38,804,362)
Payment of general administration expenses (1,861,722)
Net Cash Provided by Operating Activities 3,169,773
Cash Flows from Investing ActivitiesInterest earned on investments 25,647
Net Cash Provided by Investing Activities 25,647
Net Increase in Cash and Cash Equivalents 3,195,420
Cash and Cash Equivalents, Beginning of Year 11,076,139
Cash and Cash Equivalents, End of Year 14,271,559$
Reconciliation of Operating Income to Net Cash
Provided by Operating ActivitiesOperating Income 9,434,093$
Adjustments to operations:
Depreciation 33,717
Change in assets and liabilities:
Decrease in other receivables (792,841)
Decrease in due from other funds (6,173,783)
Increase in due to other funds 548,768
Increase in benefits payable 119,819
Total Adjustments (6,264,320)
Net Cash Provided by Operating Activities 3,169,773$

The accompanying notes are an integral part of these financial statements.
25
FORT BEND COUNTY, TEXASSTATEMENT OF FIDUCIARY NET POSITIONSeptember 30, 2017
AgencyFunds
AssetsCash and cash equivalents 39,345,418$ Investments 1,002,307Miscellaneous receivables 437,990
Total Assets 40,785,715$
Liabilities
Due to others 40,785,715$
Total Liabilities 40,785,715$

26

The accompanying notes are an integral part of these financial statements.
27
FORT BEND COUNTY, TEXASSTATEMENT OF NET POSITION (DEFICIT)
COMPONENT UNITS
September 30, 2017
Fort Bend County Surface Water Supply
Corporation
Fort Bend County Toll
Road Authority
Fort Bend Grand
Parkway Toll Road
Authority
Fort Bend County Housing Finance
Corporation
Fort Bend County
Industrial Development Corporation Totals
Assets
Cash and cash equivalents 7,873$ 45,873,638$ 15,632,494$ 113,469$ 125,381$ 61,752,855$
Investments 31,005,272 3,595,287 903,720 35,504,279
Due from primary government 15,423,326 15,423,326
Miscellaneous receivables 3,344,082 4,371,973 3,063 7,719,118
Capital assets, not being depreciated 80,874,474 13,900,102 94,774,576
Capital assets, net of
accumulated depreciation 179,152,666 140,505,612 319,658,278
Total Assets 7,873 355,673,458 178,005,468 1,020,252 125,381 534,832,432
Deferred Outflows of Resources
Deferred charges-debt refunding 9,020,661 9,020,661
Total Deferred Outflows of Resource 9,020,661 9,020,661
Liabilities
Accounts payable and accrued expenses 8,702 8,702
Retainage payable 278,801 278,801
Due to primary government 4,897,142 4,500 4,901,642
Accrued interest payable 966,024 598,350 1,564,374
Long-term liabilities:
Due within one year 6,260,000 6,260,000
Due in more than one year 268,088,234 171,075,353 439,163,587
Total Liabilities 275,314,258 176,849,646 8,702 4,500 452,177,106
Net Position (Deficit)
Net investment in capital assets 19,141,803 (13,709,663) 5,432,140
Debt service 20,822,525 3,024,151 23,846,676
Unrestricted 7,873 49,415,533 11,841,334 1,011,550 120,881 62,397,171
Total Net Position (Deficit) 7,873$ 89,379,861$ 1,155,822$ 1,011,550$ 120,881$ 91,675,987$

The accompanying notes are an integral part of these financial statements.
28
FORT BEND COUNTY, TEXASSTATEMENT OF REVENUES, EXPENSES AND CHANGES IN NET POSITION (DEFICIT)
COMPONENT UNITS
For the Year Ended September 30, 2017
Functions/Programs ExpensesCharges for
Services
Capital Grants and
Contributions
Fort Bend County Toll Road AuthorityToll road operations 13,504,405$ 27,059,416$ 492,509$ Interest on long-term debt 10,748,626
Debt service fees 26,000
Total Fort Bend County Toll Road Authority 24,279,031 27,059,416 492,509
Fort Bend Grand Parkway Toll Road AuthorityToll road operations 11,168,865 24,499,686 1,362,346
Interest on long-term debt 6,627,219Debt service fees 5,500
Total Fort Bend Grand Parkway Toll Road Authority 17,801,584 24,499,686 1,362,346
Fort Bend County Housing Finance CorporationGeneral administration 30,680 31,805
Total Fort Bend County Housing Finance Corporation 30,680 31,805
Fort Bend County Industrial Development CorporationGeneral administration 35,982
Total Fort Bend County Industrial Development Corporation 35,982
Totals Component Units 42,147,277$ 51,590,907$ 1,854,855$
General Revenues:Earnings on investments
Total General RevenuesChanges in Net Position (Deficit)
Net Position (Deficit), Beginning of YearNet Position (Deficit), End of Year
Program Revenues
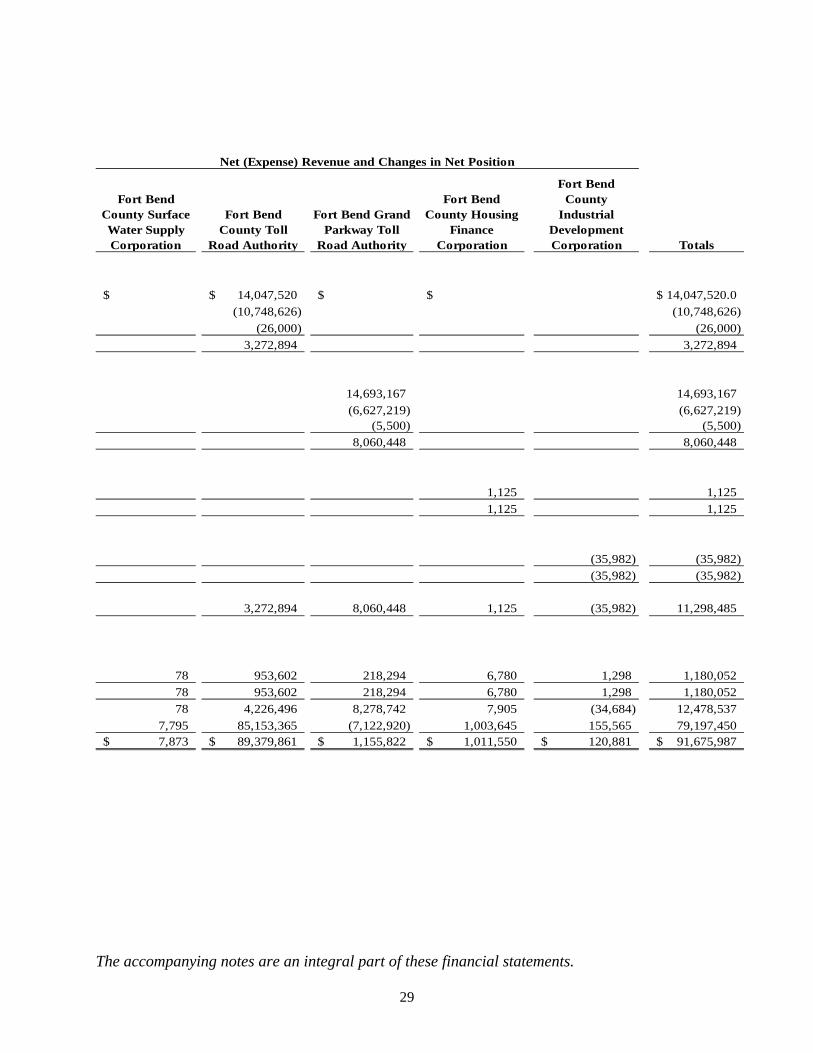
The accompanying notes are an integral part of these financial statements.
29
Net (Expense) Revenue and Changes in Net Position
Fort Bend County Surface Water Supply Corporation
Fort Bend County Toll
Road Authority
Fort Bend Grand Parkway Toll
Road Authority
Fort Bend County Housing
Finance Corporation
Fort Bend County
Industrial Development Corporation Totals
$ 14,047,520$ $ $ 14,047,520.0$ (10,748,626) (10,748,626)
(26,000) (26,000)
3,272,894 3,272,894
14,693,167 14,693,167
(6,627,219) (6,627,219) (5,500) (5,500)
8,060,448 8,060,448
1,125 1,125
1,125 1,125
(35,982) (35,982) (35,982) (35,982)
3,272,894 8,060,448 1,125 (35,982) 11,298,485
78 953,602 218,294 6,780 1,298 1,180,052
78 953,602 218,294 6,780 1,298 1,180,052
78 4,226,496 8,278,742 7,905 (34,684) 12,478,537
7,795 85,153,365 (7,122,920) 1,003,645 155,565 79,197,4507,873$ 89,379,861$ 1,155,822$ 1,011,550$ 120,881$ 91,675,987$

FORT BEND COUNTY, TEXAS NOTES TO FINANCIAL STATEMENTS
30
NOTE 1 – SUMMARY OF SIGNIFICANT ACCOUNTING POLICIES A. Financial Reporting Entity Fort Bend County, Texas, (the "County") is a public corporation and a political subdivision of the State of Texas. The Commissioners Court, composed of four County Commissioners and the County Judge, all of whom are elected officials, govern the County. The County is considered an independent entity for financial reporting purposes and is considered a primary government. As required by generally accepted accounting principles, these financial statements have been prepared based on considerations regarding the potential for inclusion of other entities, organizations, or functions as part of the County's financial reporting entity. Considerations regarding the potential for inclusion of other entities, organizations, or functions in the County's financial reporting entity are based on criteria prescribed by generally accepted accounting principles. These same criteria are evaluated in considering whether the County is a part of any other governmental or other type of reporting entity. The overriding elements associated with prescribed criteria considered in determining that the County's financial reporting entity status is that of a primary government are that it has a separately elected governing body; it is legally separate; and it is fiscally independent of other state and local governments. Additionally, prescribed criteria under generally accepted accounting principles include considerations pertaining to organizations for which the primary government is financially accountable; and considerations pertaining to other organizations for which the nature and significance of their relationship with the primary government are such that exclusion would cause the reporting entity's financial statements to be misleading or incomplete. Blended Component Units Blended component units, although legally separate entities, are, in substance, part of the County's operations and so data of these units are combined with data of the County. Each of the County's blended component units has a September 30 year-end. The following component units have been identified and are presented in a blended format in the government-wide financial statements:
Fort Bend County Drainage District (“District”) Established under Section 59 of Article XVI of the Constitution of Texas, the District includes all of the property within Fort Bend County. The District was created for the purpose of reclamation and drainage of its lands. The District’s governing body is the same as the County’s and there is a financial benefit relationship between the County and the District. Financial information for the District is available at the Fort Bend County Auditor’s Office located at 301 Jackson, Suite 701, Richmond, Texas 77469.

FORT BEND COUNTY, TEXAS NOTES TO FINANCIAL STATEMENTS (continued)
31
NOTE 1 – SUMMARY OF SIGNIFICANT ACCOUNTING POLICIES (continued) A. Financial Reporting Entity (continued)
Fort Bend County Assistance Districts (“CADs”) The CADs are special districts authorized for creation by counties under chapter 387 of the Texas Local Government Code. CADs have the power to impose a sales and use tax for the following purposes: (1) the construction or maintenance of roads and highways; (2) provision of law enforcement and detention services; (3) maintenance or improvement of libraries, museums, parks or other recreational facilities; (4) provision of services that benefit the public health and welfare, including fire-fighting services; and (5) promotion of economic development and tourism. Currently there are ten CADs (#1, #2, #4, #5, #6, #7, #8, #9, #10 and #11) within Fort Bend County. CADs are political subdivisions of the state and each CAD has its own governing body, which is a five member Board of Directors. Each CADs’ governing body is the same as the County’s and there is a financial benefit relationship between the County and the CAD. Financial information is available at the Fort Bend County Auditor’s Office located at 301 Jackson, Suite 701, Richmond, Texas 77469.
Discretely Presented Component Units Discretely presented component units are presented in a separate column in the government-wide financial statements to emphasize that they are legally separate from the County. Each of the County's discretely presented component units has a September 30 year-end. The following component units have been identified and are presented in a discrete format in the County's government-wide financial statements:
Fort Bend County Toll Road Authority (“FBCTRA”) The FBCTRA is organized under the Texas Transportation Corporation Act and the Texas Non-Profit Corporation Act. It was created to assist in the planning, designing, financing and building of county roads and highways. In particular, the FBCTRA is to assist in the building and operation of the Fort Bend Toll Road system that will extend from Sam Houston Parkway in Harris County to the Brazos River and the City of Fulshear in Fort Bend County. The County has financial accountability because it appoints a voting majority of the Board and the County can impose its will. Financial information is available at the Fort Bend County Auditor’s Office located at 301 Jackson, Suite 701, Richmond, Texas 77469. Fort Bend Grand Parkway Toll Road Authority (“FBGPTRA”) The FBGPTRA is organized under the Texas Transportation Corporation Act and the Texas Non-Profit Corporation Act. It was created to assist in the planning, designing, financing and building of county roads and highways. In particular, the FBGPTRA is to assist in the building and operation of the Fort Bend Grand Parkway Toll Road that will extend from the Westpark Tollway along State Highway 99 to US 59. The County has financial accountability because it appoints a voting majority of the Board and the County can impose its will. Financial information is available at the Fort Bend County Auditor’s Office located at 301 Jackson, Suite 701, Richmond, Texas 77469.

FORT BEND COUNTY, TEXAS NOTES TO FINANCIAL STATEMENTS (continued)
32
NOTE 1 – SUMMARY OF SIGNIFICANT ACCOUNTING POLICIES (continued) A. Financial Reporting Entity (continued)
Fort Bend County Surface Water Supply Corporation (“FBCSWSC”) The FBCSWSC was established for the purpose of conducting a feasibility study of a surface water facility in the area. Currently, its revenue sources are primarily from special districts, private corporations, and other entities interested in the study. The County has financial accountability because it appoints a voting majority of the Board and the County can impose its will. Financial information is available at the Fort Bend County Auditor’s Office located at 301 Jackson, Suite 701, Richmond, Texas 77469. Fort Bend County Housing Finance Corporation (“FBCHFC”) The FBCHFC was established under the Texas Housing Finance Corporation Act. It provides down payment assistance programs for individuals meeting certain income guidelines and serves as a conduit for activity related to bond issues for affordable housing in Fort Bend County. The tax-exempt bonds issued by the FBCHFC do not constitute a debt or a pledge of faith by the FBCHFC, but are payable by the user pursuant to terms defined in the loan agreements underlying each issue. The County has financial accountability because it appoints a voting majority of the Board and the County can impose its will. Financial information is available by contacting the Fort Bend County Housing Finance Corporation, Thomas Shirley – President, 2214 Avenue H, Rosenberg, Texas 77471. Fort Bend County Industrial Development Corporation (“FBCIDC”) The FBCIDC was established under the Development Corporation Act of 1979 (“Act”). It facilitates the issuance of obligations in the form of bonds to finance all or part of the cost of one or more projects as defined by the Act. The bonds issued by the FBCIDC do not constitute a debt or a pledge of faith by the FBCIDC, but are payable by the user pursuant to terms defined in the loan agreements underlying each issue. The County has financial accountability because it appoints a voting majority of the Board and the County can impose its will. Financial information is available at the Fort Bend County Auditor’s Office located at 301 Jackson, Suite 701, Richmond, Texas 77469.
B. Implementation of New Standards In the current fiscal year, the County implemented the following new standard. The applicable provisions of these new standards are summarized here. Implementation is reflected in the financial statements and the notes to the financial statements. GASB Statement No. 77, Tax Abatement Disclosures, requires disclosure of tax abatement information about a reporting government’s own tax abatement agreements and those that are entered into by other governments and that reduce the reporting government’s tax revenues. GASB Statement 82, Pension Issues-An amendment of GASB Statements No. 67, No. 68 and No. 73, addresses the presentation of payroll-related measures in required supplementary information, selection of assumptions and the treatment of deviations from the guidance in an actuarial standard of practice for financial reporting purposes, and the classification of payments made by employers to satisfy employee contribution requirements.

FORT BEND COUNTY, TEXAS NOTES TO FINANCIAL STATEMENTS (continued)
33
NOTE 1 – SUMMARY OF SIGNIFICANT ACCOUNTING POLICIES (continued) C. Government-wide and Fund Accounting The basic financial statements include both government-wide (based on the County as a whole) and fund financial statements. While the previous reporting model emphasized fund types (the total of all funds of a particular type), the GASB 34 reporting model focuses on either the County as a whole or on major individual funds (within the fund financial statements). Typically, both the government-wide and fund financial statements (within the basic financial statements) categorize primary activities as either governmental or business-type. All primary activities of the County are considered to be governmental activities; therefore no business-type activities are presented within the basic financial statements. In the government-wide Statement of Net Position, governmental activities are presented on a full accrual, economic resource basis, which incorporates long-term assets and receivables, as well as long-term debt and obligations. The government-wide Statement of Activities reflects both the gross and net cost per functional category (general administration, financial administration, public safety, etc.), which are otherwise being supported by general government revenues (property taxes, earnings on investments, etc.). The Statement of Activities reduces gross expenses (including depreciation) by related program revenues. The program revenues must be directly associated with the function (general administration, financial administration, public safety, etc.). The governmental funds major fund statements in the fund financial statements are presented on a current financial resource and modified accrual basis of accounting. This is the manner in which these funds are normally budgeted. Since the governmental fund statements are presented on a different measurement focus and basis of accounting than the government-wide statements’ governmental column, a reconciliation is presented which briefly explains the adjustments necessary to reconcile fund-based financial statements with the governmental column of the government-wide presentation. The County’s fiduciary funds are presented in the fund financial statements by type. Since, by definition, these assets are being held for the benefit of a third party and cannot be used to address activities or obligations of the government, these funds are not incorporated into the government-wide statements. Since the County only reports agency funds, a statement of changes in fiduciary net position is not presented. All assets reported in agency funds should be offset by a corresponding liability, resulting in zero net position. In the fund financial statements, the accounts of the County are organized on the basis of funds, each of which is considered a separate accounting entity. The operations of each fund are accounted for with a separate set of self-balancing accounts that comprise its assets, liabilities, deferred inflows of resources, fund equity, revenues, and expenditures or expenses, as appropriate. Following is a description of the various funds: The County reports the following major governmental funds:
General Fund The General Fund is the County’s primary operating fund. It is used to account for all financial transactions not properly includable in other funds. The principal source of revenue is local property taxes. Expenditures include all costs associated with the daily operations of the County.

FORT BEND COUNTY, TEXAS NOTES TO FINANCIAL STATEMENTS (continued)
34
NOTE 1 – SUMMARY OF SIGNIFICANT ACCOUNTING POLICIES (continued) C. Government-wide and Fund Accounting (continued)
Debt Service Fund This fund is used to account for the debt service transactions relating to the following bond issues: Unlimited Tax Road Bonds Series 2007, Fort Bend Flood Control Water Supply Corporation Refunding Bonds Series 2010, Facilities Limited Tax Bonds Series 2007, Unlimited Tax Road Bonds Series 2009, Justice Center Limited Tax Bonds Series 2009, Unlimited Tax Road Refunding Bonds Series 2009, Unlimited Tax Road Bonds Series 2012, Unlimited Tax Road Refunding Bonds Series 2014, Unlimited Tax Road and Refunding Bonds Series 2015, Facilities Refunding Bonds Series 2015 , Unlimited Tax Road and Refunding Bonds Series 2016, and Facilities and Justice Center Refunding Bonds Series 2016. Revenues in this fund are comprised of property taxes levied against property located in the County. These funds are restricted for the payment of debt service obligations. Capital Projects Funds These funds are used to account for bond sale proceeds and other revenues, which are being used to finance the construction and/or expansion of numerous roads in the County or the construction or improvement of County facilities. These funds are restricted pursuant to bond covenant.
The County also reports the following nonmajor fund types: Special Revenue Funds These funds are used to account for resources restricted to, or committed for specific purposes. Internal Service Funds These funds are used to account for the County’s employee benefits for employees, retirees, and their dependents, including medical and dental; and self-insurance programs, including workers’ compensation, personal injury and property damage. The principal source of revenue is contributions paid by individual funds. Agency Funds These funds are custodial in nature and do not report operating results. They are used to account for assets held by the County as an agent for various local governments and individuals.

FORT BEND COUNTY, TEXAS NOTES TO FINANCIAL STATEMENTS (continued)
35
NOTE 1 – SUMMARY OF SIGNIFICANT ACCOUNTING POLICIES (continued) D. Measurement Focus, Basis of Accounting and Financial Statement Presentation The accounting and financial reporting treatment applied to a fund is determined by its measurement focus. All governmental fund-types are accounted for using a current financial resources measurement focus. With this measurement focus, only current assets and current liabilities generally are included on the balance sheet. Operating statements of these funds present increases (i.e., revenues and other financing resources) and decreases (i.e., expenditures and other financing uses) in fund balance. The government-wide statements of net position and statements of activities and all proprietary funds are accounted for on a flow of economic resources measurement focus. With this measurement focus, all assets and all liabilities associated with the operations of these activities are included on the balance sheet. Proprietary fund equity consists of net position. Proprietary fund-type operating statements present increases (i.e., revenues) and decreases (i.e., expenses) in total net position. The accounts of the Governmental Fund Types (the General Fund, Special Revenue Funds, Debt Service Fund, and Capital Projects Funds) and certain component units are maintained, and the financial statements have been prepared, on the modified accrual basis of accounting. Under this basis of accounting, revenues are recognized when they become susceptible to accrual (i.e., both measurable and available). Available means collectible within the current year or soon enough thereafter to pay liabilities of the current year. For this purpose, the County considers revenues to be available if they are collected within 60 days of the end of the current fiscal period. Substantially all revenues, except property taxes, are considered to be susceptible to accrual. Expenditures are generally recognized under the modified accrual basis of accounting when the related fund liability is incurred. Principal and interest on long-term debt are recognized as expenditures when due. As a general rule the effect of interfund activity has been eliminated from the government-wide financial statements. An exception to this general rule is that interfund services provided and used within the County are not eliminated in the process of consolidation. Elimination of these services would distort the direct costs and program revenues reported for the various functions concerned. Amounts reported as program revenues include: (1) charges to customers for goods, services, or privileges provided, (2) operating grants and contributions, and (3) capital grants and contributions, including special assessments. Revenues that are generated internally are reported as general revenues, including property taxes. Proprietary funds present operating revenues and expenses as well as non-operating revenues and expenses. Operating revenues and expenses are generally derived from providing services and producing goods as part of ongoing operations. The principal operating revenues of the County’s internal service funds are charges to users for services. The operating expenses for the County’s internal service funds include administrative expenses and all costs associated with providing services. All other revenue and expenses are reported as non-operating revenue. The financial statements of the proprietary fund types and certain component units are presented on the accrual basis of accounting. Under this method of accounting, revenues are recognized in the accounting period in which they are earned, and expenses in the accounting period in which they are incurred.

FORT BEND COUNTY, TEXAS NOTES TO FINANCIAL STATEMENTS (continued)
36
NOTE 1 – SUMMARY OF SIGNIFICANT ACCOUNTING POLICIES (continued) E. Encumbrances Encumbrance accounting, under which purchase orders, contracts, and other commitments for the expenditure of monies are recorded in order to reserve that portion of the applicable appropriation, is used as an extension of formal budgetary control. Significant encumbrances outstanding at year-end are represented in aggregate within the respective fund balance category (restricted or committed) on the face of the balance sheet. Additional information regarding significant encumbrances is included in Note 13 on page 63 in the section entitled “Committed to”. Unencumbered appropriations lapse at the end of the fiscal year. F. Cash and Cash Equivalents The County’s cash and cash equivalents are considered to be cash on hand, demand deposits, balances in privately managed local government investment pools and short-term investments with original maturities of three months or less from the date of acquisition. The County’s local government investment pools are recorded at amortized cost, which approximates fair value, as permitted by GASB Statement No. 79, Certain Investment Pools and Pool Participants. For the purpose of the statement of cash flows, the proprietary fund types consider temporary investments with maturities of three months or less when purchased to be cash equivalents. G. Investments The County's investments, when held, are comprised primarily of U.S. Government Securities. The investments in U.S. Government Securities are generally held to maturity. The County reports investments at fair value. The County categorizes fair value measurements of its investments based on the hierarchy established by generally accepted accounting principles. The fair value hierarchy, which has three levels, is based on the valuation inputs used to measure an asset’s fair value: Level 1 inputs are quoted prices in active markets for identical assets; Level 2 inputs are significant other observable inputs; and Level 3 inputs are significant unobservable inputs. H. Receivables All receivables are reported at their gross value and, where appropriate, are reduced by the estimated portion that is expected to be uncollectible. I. Prepaid Items Certain payments to vendors reflect costs applicable to future accounting periods and are recorded as prepaid items in both government-wide and fund financial statements. The cost of prepaid items is recorded as expenditures/expenses when consumed rather than when purchased.

FORT BEND COUNTY, TEXAS NOTES TO FINANCIAL STATEMENTS (continued)
37
NOTE 1 – SUMMARY OF SIGNIFICANT ACCOUNTING POLICIES (continued) J. Capital Assets Capital assets used in governmental and proprietary fund types of the government are recorded as expenditures of the General, Special Revenue, Capital Projects, and Internal Service Funds and as capital assets in the government-wide financial statements to the extent the County’s capitalization threshold (currently $10,000 on new assets) is met. Betterments to existing assets are capitalized if they meet the $10,000 threshold. Depreciation is recorded on capital assets on a government-wide basis. Major outlays for capital assets and improvements are capitalized as projects are constructed and subsequently depreciated over their estimated useful lives on a straight-line basis at the government-wide levels. All capital assets are valued at historical cost or estimated historical cost if actual cost was not available. Donated capital assets are recorded at acquisition value at the date of donation. The costs of normal maintenance and repairs that do not add to the value of an asset or materially extend assets' lives are charged to operations when incurred. Expenditures that materially change capacities or extend useful lives are capitalized. Upon sale or retirement of capital assets, the cost and related accumulated depreciation, if applicable, are eliminated from the respective accounts and any resulting gain or loss is included in the results of operations. The County applies a half-year convention for depreciation on all capital assets. Therefore, one half of a year of depreciation is charged to operations the first and last year that an asset is in service. Depreciation has been provided for plant and equipment using the straight-line method over the estimated useful life for the type of assets as follows:
EstimatedAsset Description Useful LifeVehicles 5 to 7 yearsOffice furniture and equipment 5 to 7 yearsMachinery and equipment 7 to 15 yearsBuildings, facilities and improvements 5 to 39 yearsInfrastructure 20 to 45 years
K. Deferred Outflows/Inflows of Resources In addition to assets, the statement of financial position will sometimes report a separate section for deferred outflows of resources. This separate financial statement element, deferred outflows of resources, represents a consumption of net position that applies to a future period(s) and so will not be recognized as an outflow of resources (expense/expenditure) until then. The County has two items that qualify for reporting in this category:
Deferred charges on refunding - Reported in the government-wide statement of net position, this deferred charge on refunding results from the difference in the carrying value of refunded debt and its reacquisition price. This amount is deferred and amortized over the shorter of the life of the refunded or refunding debt.

FORT BEND COUNTY, TEXAS NOTES TO FINANCIAL STATEMENTS (continued)
38
NOTE 1 – SUMMARY OF SIGNIFICANT ACCOUNTING POLICIES (continued) K. Deferred Outflows/Inflows of Resources (continued)
Deferred outflows of resources for pension items - Reported in the government wide financial statement of net position, this deferred outflow results from pension plan contributions made after the measurement date of the net pension liability and the results of differences between expected and actual actuarial experiences. The deferred outflows of resources related to pensions resulting from County contributions subsequent to the measurement date will be recognized as a reduction of the net pension liability in the next fiscal year. The other pension related deferred outflows will be amortized over the expected remaining service lives of all employees (active and inactive employees) that are provided with pensions through the pension plan which is currently 6 years for the County plan.
In addition to liabilities, the statement of financial position will sometimes report a separate section for deferred inflows of resources. This separate financial statement element, deferred inflows of resources, represents an acquisition of net position that applies to a future period(s) and so will not be recognized as an inflow of resources (revenue) until that time. The County has only two items that qualifies for reporting in this category:
Deferred inflows of resources for unavailable revenues - Reported only in the governmental funds balance sheet, unavailable revenues from property taxes arise under the modified accrual basis of accounting. These amounts are deferred and recognized as an inflow of resources in the period that the amounts become available.
Deferred inflows of resources for pension – Reported by the County in the government-wide
financial statement of net position, these deferred inflows result primarily from differences between projected and actual earnings on pension plan investments. These amounts will be amortized over a closed five year period.
L. Due To and Due From Other Funds During the course of operations, transactions occur between individual funds for specified purposes, such as lending/borrowing arrangements or amounts. Therefore, a receivable and payable are recorded in the proper funds. These receivables and payables are classified as "due from other funds" or "due to other funds" (or "due from component unit/primary government” or "due to component unit/primary government" if the transactions are between the primary government and a component unit).
M. Accrued Compensated Absences All full-time employees accumulate vacation benefits in varying annual number of days up to a maximum of twenty days a year. Accumulated vacation exceeding twenty days lapses on December 31 of each year. Compensatory time exceeding 80 hours is paid to nonexempt employees. In the event of termination, an employee is paid for all maximum allowable accumulation of vacation and compensatory time. Sick leave benefits are earned by all full-time employees at a rate of eight days per year and may be accumulated without limit. Upon retirement, an employee may be eligible to receive a payment for up to one-half of their unused sick leave balance, not to exceed a maximum of $5,000. In the event of any termination other than retirement, an employee is not paid for any unused sick leave. A liability for accrued compensated absences is recorded in the government-wide financial statements.

FORT BEND COUNTY, TEXAS NOTES TO FINANCIAL STATEMENTS (continued)
39
NOTE 1 – SUMMARY OF SIGNIFICANT ACCOUNTING POLICIES (continued) N. Interfund Transfers The County maintains numerous special revenue and capital project funds to account separately for monies that have been set aside for particular purposes. Often, these monies are initially budgeted in the General Fund during the annual budget process and are then transferred to various funds during the course of the fiscal year. In addition, when these projects are complete, these same funds often transfer residual monies back to the General Fund or some other fund, as determined by where the monies should be returned. These interfund transfers are classified as "transfers in" and "transfers out" within the primary government. O. Net Position and Fund Balance Net Position Classifications Net position in government-wide financial statements are classified in three categories: 1) Net investment in capital assets, 2) Restricted net position, and 3) Unrestricted net position. Net position is shown as restricted if constraints placed on use are either (1) externally imposed by creditors, grantors, contributors, or laws or regulations of other governments or (2) imposed by law through constitutional provisions or enabling legislation. It is the County’s policy to consider restricted – net position to have been depleted before unrestricted – net position is applied. Fund Balance Classifications Governmental funds report fund balance in classifications based primarily on the extent to which the County is bound to honor constraints on the specific purposes for which amounts in the funds can be spent. Fund balances are required to be reported according to the following classifications: Nonspendable Fund Balance – includes amounts that are (a) not in spendable form, or (b) legally or contractually required to be maintained intact. The “not in spendable form” criterion includes items that are not expected to be converted to cash, for example: inventories, prepaid amounts, and long-term notes receivable. Restricted Fund Balance - includes amounts that can be spent only for the specific purposes stipulated by external resource providers, constitutionally or through enabling legislation. Restrictions may effectively be changed or lifted only with the consent of resource providers. When restricted and unrestricted fund balance exists for the same purpose, restricted fund balance will be used first. Committed Fund Balance – includes amounts that can only be used for the specific purposes determined by the County’s Board. The commitment of fund balance requires the highest level action of the Board to constitute a binding constraint on fund balance. This can only be achieved by majority vote of approval of the County’s Board to transfer an amount from fund balance for a specific purpose. This order requires the County Auditor to establish a special project account to manage the use of the committed fund balance over the period for which the purpose is achieved or served. These allocations are primarily made for capital purposes that extend beyond the fiscal year of the County. Commitments may only be changed or lifted by majority vote of approval of the County’s Board. The proposed action of the Board with regard to creation or modification of a commitment must also be clearly posted on the Board’s agenda in advance of taking any action.

FORT BEND COUNTY, TEXAS NOTES TO FINANCIAL STATEMENTS (continued)
40
NOTE 1 – SUMMARY OF SIGNIFICANT ACCOUNTING POLICIES (continued) O. Net Position and Fund Balance (continued) Assigned Fund Balance – comprises amounts intended to be used by the County for specific purposes that are neither restricted nor committed. Intent is expressed by (a) the County’s Board or (b) a body (for example: a budget or finance committee) or official to which the County’s Board has delegated the authority to assign amounts to be used for specific purposes. As of the date of this report, the County’s Board has not authorized any other official to have the authority to assign fund balance; therefore the assignment of fund balance must be made by approval of the Board. Unassigned Fund Balance – is the residual classification for the General Fund and includes all amounts not contained in the other classifications. Unassigned amounts are technically available for any purpose. The General Fund is the only fund that reports a positive unassigned fund balance. When various unrestricted fund balances are available for the same purpose, the County will use committed fund balance first, assigned fund balance next and unassigned fund balance last. GASB 54 requires disclosure of any formally adopted minimum fund balance policies. The County’s policy is to budget to maintain a minimum fund balance of 15% of the County’s General Fund annual operating expenditures. If the actual fund balance drops below 15%, it shall be budgeted for recovery the following year. This policy is reviewed annually. P. Reclassifications Certain reclassifications to prior year balances have been made to conform to current year presentation. Such reclassifications have had no effect on the excess of revenues over expenditures. Q. Estimates The preparation of financial statements in conformity with generally accepted accounting principles requires management to make estimates and assumptions that affect the reported amounts of assets and liabilities and disclosures of contingent assets and liabilities at the date of the financial statements and the reported amounts of revenues and expenditures/expenses during the reporting period. Actual amounts could differ from those estimates. R. Pensions For purposes of measuring the net pension liability, deferred outflows of resources and deferred inflows of resources related to pensions, and pension expense, information about the fiduciary net position of the County’s defined benefit pension plan (the “Plan”) administered by the statewide Texas County and District Retirement System (“TCDRS”) and additions to/deductions from the Plan’s fiduciary net position have been determined on the same basis as they are reported by the Plan. For this purpose, benefit payments (including refunds of employee contributions) are recognized when due and payable in accordance with the benefit terms. Investments are reported at fair value.

FORT BEND COUNTY, TEXAS NOTES TO FINANCIAL STATEMENTS (continued)
41
NOTE 2 – DEPOSITS (CASH) AND INVESTMENTS A. Authorization for Deposits and Investments The Texas Public Funds Investment Act (“PFIA”), as prescribed in Chapter 2256 of the Texas Government Code, regulates deposits and investment transactions of the County. In accordance with applicable statutes, the County has a depository contract with an area bank (depository) providing for interest rates to be earned on deposited funds and for banking charges the County incurs for banking services received. The County may place funds with the depository in interest and non-interest bearing accounts. State law provides that collateral pledged as security for bank deposits must have a market value of not less than the amount of the deposits and must consist of: (1) obligations of the United States or its agencies and instrumentalities; (2) direct obligations of the State of Texas or its agencies; (3) other obligations, the principal and interest on which are unconditionally guaranteed or insured by the State of Texas; and/or (4) obligations of states, agencies, counties, cities, and other political subdivisions of any state having been rated as to investment quality by a nationally recognized investment rating firm and having received a rating of not less than A or its equivalent. County policy requires the collateralization level to be at least 110% of market value of principal and accrued interest. Commissioners Court has adopted a written investment policy regarding the investment of its funds as defined by the PFIA. The investments of the County are in compliance with this policy. State statutes authorize the County to invest in fully collateralized or insured time deposits, direct debt obligations of the United States, and certain repurchase agreements. Investments in security repurchase agreements are authorized when the investment has a defined termination date, is secured by obligations described in the PFIA, is pledged to the County, is deposited with a third party selected and approved by the entity, and is placed through a primary government securities dealer or national bank domiciled in the State of Texas. The County did not invest in repurchase agreements for the year ended September 30, 2017. B. Deposit and Investment Amounts The County's cash and investments are classified as: cash and cash equivalents, and investments. Cash and cash equivalents include cash on hand, deposits with financial institutions, and short-term investments in privately-managed public funds investment pool accounts. As of September 30, 2017, the County’s cash deposits are either insured by FDIC or covered by collateral held by the County’s agent in the County’s name. The following schedule shows the County’s recorded cash and cash equivalents, and investments as of year-end.
Internal TotalsGovernmental Service Governmental Agency
Investments Funds Funds Activities Fund
Cash deposits 205,445,249$ 14,271,559$ 219,716,808$ 24,492,300$ Investment pools:
LOGIC 20,346,947 20,346,947 Texas CLASS 9,017,250 9,017,250 14,853,118 TexasTERM 2,038 2,038
Totals cash and cash equivalents 234,811,484 14,271,559 249,083,043 39,345,418 Governmental securities:
FHLMC 22,053,841 22,053,841 502,307 FFCB 500,000
Totals cash and Investments 256,865,325$ 14,271,559$ 271,136,884$ 40,347,725$

FORT BEND COUNTY, TEXAS NOTES TO FINANCIAL STATEMENTS (continued)
42
NOTE 2 – DEPOSITS (CASH) AND INVESTMENTS (continued) B. Deposit and Investment Amounts (continued) Investment’s fair value measurements are as follows as of September 30, 2017:
Governmental Activities
InvestmentsFair Value/
Amortized Cost
Cash deposits 219,716,808$ Investment pools:
LOGIC 20,346,947 Texas CLASS 9,017,250 TexasTERM 2,038
Totals cash and cash equivalents 249,083,043 FHLMC 22,053,841
Totals cash and Investments 271,136,884$
Agency Funds
InvestmentsFair Value/
Amortized Cost
Cash deposits 24,492,300$ Investment pools:
Texas CLASS 14,853,118 Totals cash and cash equivalents 39,345,418
FHLMC 502,307 FFCB 500,000
Totals cash and Investments 40,347,725$
The fair values for all governmental securities are determined using Level 1 inputs. Local Government Investment Cooperative (“LOGIC”) is a local government investment pool organized under the authority of the Interlocal Cooperation Act, chapter 791, Texas Government Code, and the PFIA. The Pool was created in April, 1994 through a contract among its participating governmental units, and is governed by a board of directors, to provide for the joint investment of participant's public funds and funds under their control. It maintains a Net Asset Value of approximately $1 per share. Texas Cooperative Liquid Assets Securities System Trust (“Texas CLASS”) is a local government investment pool organized under the authority of the Interlocal Cooperation Act, chapter 791, Texas Government Code, and the PFIA. Texas CLASS was established in 1996. Pursuant to the Trust Agreement, Texas CLASS is supervised by a Board of Trustees who are elected by the Participants. The Board of Trustees supervises the Trust and its affairs and acts as the liaison between the Participants, the Custodian and the Program Administrator. Cutwater Investor Services Corp. serves as Program Administrator. Cutwater Investor Services Corp. is a subsidiary of Cutwater Asset Management. It maintains a Net Asset Value of approximately $1 per share.

FORT BEND COUNTY, TEXAS NOTES TO FINANCIAL STATEMENTS (continued)
43
NOTE 2 – DEPOSITS (CASH) AND INVESTMENTS (continued) B. Deposit and Investment Amounts (continued) The TexasTERM Local Government Investment Pool (“TexasTERM”) is organized in conformity with the PFIA. It provides for a fixed-rate, fixed-term investment for a period of 60 days to one year and includes TexasDAILY, a portfolio of the Local Government Pool, providing daily access to funds. An Advisory Board composed of participants in TexasTERM and other parties who do not participate in the Pool, has responsibility for the overall management of the Pool, including formulation and implementation of its investment and operating policies. PFM Asset Management LLC, a leading national financial and investment advisory firm, is the investment advisor to the pool. It maintains a Net Asset Value of approximately $1 per share. In accordance with GASB Statement No. 79, Certain External Investment Pools and Pool Participants, the local government investment pools do not have any limitations and restrictions on withdrawals such as notice periods or maximum transaction amounts. These pools do not impose any liquidity fees or redemption gates. C. Interest Rate Risk As of year-end, the County had the following investments subject to interest rate risk disclosure, under U.S. generally accepted accounting principles:
Governmental Activities Fair Value/ Amortized
Cost
Weighted Average
Maturity (days)
Percentage of Total
PortfolioInvestment pools:
LOGIC 20,346,947$ 39 39.6%Texas CLASS 9,017,250 56 17.5%TexasTERM 2,038 55 0.00%
Governmental securities:FHLMC 22,053,841 167 42.9%
Total Fair Value/Amortized Cost 51,420,076$ Portfolio weighted average maturity 97
Agency Funds Fair Value/ Amortized
Cost
Weighted Average
Maturity (days)
Percentage of Total
PortfolioInvestment pools:
Texas CLASS 14,853,118$ 56 93.7%Governmental securities:
FHLMC 502,307 272 3.2%FFCB 500,000 643 3.2%
Total Fair Value/Amortized Cost 15,855,425$ Portfolio weighted average maturity 81
It is the County’s policy to select any individual investment with a maximum stated maturity of thirty-six (36) months. Portfolio maturities will be structured to meet the obligations of the County first and then to achieve the highest rate of return of interest. When the County has funds not required to meet current year obligations, maturity restraints will be imposed based upon the investment strategy for the group of funds.

FORT BEND COUNTY, TEXAS NOTES TO FINANCIAL STATEMENTS (continued)
44
NOTE 2 – DEPOSITS (CASH) AND INVESTMENTS (continued) D. Credit Risk The County’s investment policy does not require investments to hold certain credit ratings issued by nationally recognized statistical rating organizations. As of September 30, 2017, the County’s investments in Texas CLASS, TexasTERM, and LOGIC were rated “AAAm” by Standard and Poor’s. The County’s investments in the Wells Fargo Money Market Fund was rated “AAAm” and “Aaa-mf” by Standards and Poor’s and Moody’s Investments, respectively. E. Concentration of Credit Risk It is the County’s policy to diversify its portfolio to eliminate the risk of loss resulting from a concentration of assets in a specific maturity (save and except zero duration funds), a specific issuer or a specific class of investments. To achieve this diversification, the County will limit investments in specific types of securities to the following percentages of the total portfolio:
Investment Type Maximum
Investment %
Repurchase Agreements up to 35% Certificates of Deposit up to 50% U.S. Treasury Bills/Notes up to 100% Other U.S. Government Securities up to 80% Authorized Local Government Investment Pools up to 80% No Load Money Market Mutual Funds up to 50% Bankers Acceptances up to 15%
It is the County’s policy to select investments in order to provide stability of income and reasonable liquidity. NOTE 3 - RECEIVABLES Receivables, including applicable allowances for uncollectible accounts, as of September 30, 2017, were as follows:
Debt CapitalGeneral Service Projects Non-major
Fund Fund Funds Funds TotalsReceivables:
Property taxes 5,981,263$ 477,999$ $ 1,056,893$ 7,516,155$ Sales taxes 1,208,056 1,208,056Grants 13,008,682 728,610 13,737,292Fines and fees 89,965,317 89,965,317Other 4,772,548 3,153,540 7,100 2,404,628 10,337,816
Gross receivables 113,727,810 3,631,539 7,100 5,398,187 122,764,636Less: allowance for
uncollectibles (63,000,131) (47,800) (105,689) (63,153,620) Totals 50,727,679$ 3,583,739$ 7,100$ 5,292,498$ 59,611,016$
Governmental Activities

FORT BEND COUNTY, TEXAS NOTES TO FINANCIAL STATEMENTS (continued)
45
NOTE 4 – PROPERTY TAXES The County's tax year covers the period October 1st through September 30th. The County's property taxes are levied annually in October on the basis of the Fort Bend Central Appraisal District's (“CAD”) assessed values as of January 1st of that calendar year. Such taxes become delinquent on February 1st of the subsequent calendar year. The CAD establishes appraised values at 100% of market value less exemptions. The County's property taxes are billed and collected by the County's Tax Assessor/Collector. A. 2016 Tax Year Property taxes are prorated between the General, certain Special Revenue, and Debt Service Funds based on rates adopted for the year of the levy. For the 2017 fiscal year (2016 tax year), the County levied property taxes of $0.47400 per $100 of assessed valuation. The 2016 rates resulted in total adjusted tax levies of approximately $286.6 million based on a total adjusted valuation of approximately $60.5 billion. The total tax rate in the 2016 tax year was prorated as follows:
2016 Rate 2016 Limit
General, certain Special Revenue and Debt Service Funds 0.45800$ 0.80000$ Fort Bend County Drainage District 0.01600$ 0.25000$ Total Tax Rate 0.47400$ 1.05000$
B. Fort Bend Central Appraisal District The Fort Bend Central Appraisal District (“CAD”), a separate governmental entity, is responsible for the recording and appraisal of property for all taxing units in the County. The CAD is required by state law to assess property at 100% of its appraised value. Further, real property must be appraised at least every four years. Under certain circumstances, the taxpayers and taxing units, including the County, may challenge orders of the CAD's Appraisal Review Board through various appeals and, if necessary, legal action may be taken. The Commissioners Court will continue to set the tax rates on the property. State law also provides that, if approved by the qualified voters in the County collection functions may be assigned to the CAD.
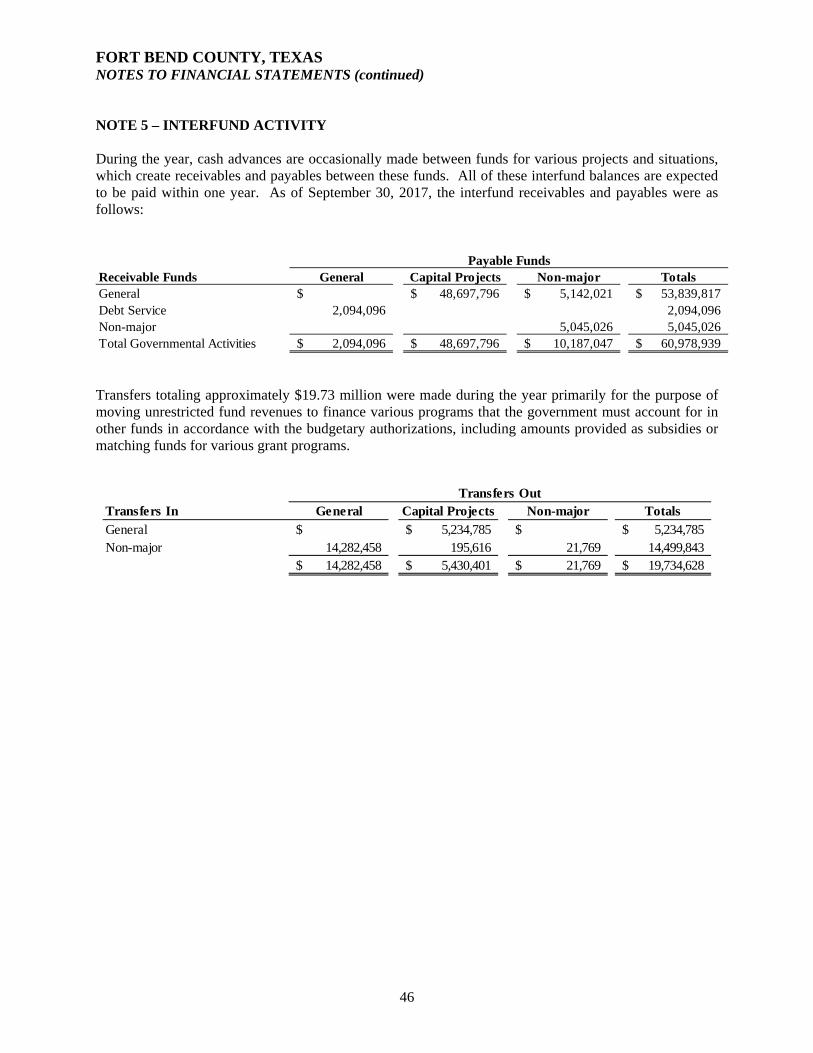
FORT BEND COUNTY, TEXAS NOTES TO FINANCIAL STATEMENTS (continued)
46
NOTE 5 – INTERFUND ACTIVITY During the year, cash advances are occasionally made between funds for various projects and situations, which create receivables and payables between these funds. All of these interfund balances are expected to be paid within one year. As of September 30, 2017, the interfund receivables and payables were as follows:
Payable FundsReceivable Funds General Capital Projects Non-major TotalsGeneral $ 48,697,796$ 5,142,021$ 53,839,817$ Debt Service 2,094,096 2,094,096 Non-major 5,045,026 5,045,026 Total Governmental Activities 2,094,096$ 48,697,796$ 10,187,047$ 60,978,939$
Transfers totaling approximately $19.73 million were made during the year primarily for the purpose of moving unrestricted fund revenues to finance various programs that the government must account for in other funds in accordance with the budgetary authorizations, including amounts provided as subsidies or matching funds for various grant programs.
Transfers OutTransfers In General Capital Projects Non-major TotalsGeneral $ 5,234,785$ $ 5,234,785$ Non-major 14,282,458 195,616 21,769 14,499,843
14,282,458$ 5,430,401$ 21,769$ 19,734,628$

FORT BEND COUNTY, TEXAS NOTES TO FINANCIAL STATEMENTS (continued)
47
NOTE 6 – CAPITAL ASSETS A summary of changes in the primary government’s capital assets for the year ended September 30, 2017, is as follows:
Balances Balances10/1/16 Additions 9/30/17
Governmental activities:Capital assets not being depreciated:
Land 417,808,330$ 11,409,477$ $ 429,217,807$ Construction in progress 48,223,387 21,679,707 69,903,094
Total capital assets not being depreciated 466,031,717 33,089,184 499,120,901
Depreciable capital assets:Vehicles 38,225,408 4,399,180 (2,746,160) 39,878,428 Office furniture and equipment 31,517,694 1,247,837 (1,060,637) 31,704,894 Machinery and equipment 29,343,435 2,409,915 (443,232) 31,310,118 Buildings, facilities and improvements 364,573,714 23,553,862 (637,595) 387,489,981 Infrastructure 1,228,626,251 105,620,045 1,334,246,296
Total other capital assets 1,692,286,502 137,230,839 (4,887,624) 1,824,629,717
Accumulated depreciation for:Vehicles (23,661,344) (3,976,782) 2,643,279 (24,994,847) Office furniture and equipment (26,007,472) (2,112,184) 983,802 (27,135,854) Machinery and equipment (18,289,433) (1,759,373) 417,232 (19,631,574) Buildings, facilities and improvements (101,949,419) (10,428,948) 499,302 (111,879,065) Infrastructure (254,119,305) (32,705,799) (286,825,104)
Total accumulated depreciation (424,026,973) (50,983,086) 4,543,615 (470,466,444) Depreciable capital assets, net 1,268,259,529 86,247,753 (344,009) 1,354,163,273 Total governmental activities
capital assets, net 1,734,291,246$ 119,336,937$ (344,009)$ 1,853,284,174$
Primary Government Retirements/
Transfers
Depreciation expenses were charged to the following functions in the statement of activities:
General administration 2,128,869$ Financial administration 339,130Administration of justice 5,535,456Construction and maintenance 33,148,769Drainage District 1,885,196Health and welfare 1,916,790Cooperative services 74,784Public safety 3,112,238Parks and recreation 1,171,552Library 1,636,585
33,717
Total Depreciation Expense 50,983,086$
Capital assets held by the County's internal service funds are charged to the various functions based on their usage of the assets

FORT BEND COUNTY, TEXAS NOTES TO FINANCIAL STATEMENTS (continued)
48
NOTE 6 – CAPITAL ASSETS (continued) Construction in progress and remaining commitments under related construction contracts for general government construction projects as of September 30, 2017, is as follows:
Increases- DecreasesBalances Retainage Capitalizations Balances Remaining
Project 10/1/16 Included and Adjustments 9/30/17 CommitmentsMobility Projects - Bonds 29,457,549$ 14,109,305$ $ 43,566,854$ 44,288,696 Wespark B Frontage Roads 5,384,704 (5,384,704) 1,750 Congestion Mitigation 1,568,583 93,877 (1,662,460) Utility Relocation - Greenbusch 1,496,929 (1,496,929) Justice Center Expansion 1,190,718 12,364,235 13,554,953 3,390,984 Jail Energy Efficiency Project 1,049,540 4,701,845 (5,751,385) Justice Center Finish Out 973,377 1,776,777 (2,750,154) 6,437 Crabb River Road Expansion 965,620 (965,620) 2011 Public Transportation Grant 762,278 512,791 1,275,069 Parks Infrastructure 2016 632,670 87,170 (704,425) 15,415 37,440 Justice Center Structured Parking 587,920 4,226,281 (4,814,201) 7,299 Lawson Upgrade 506,040 1,691 (507,731) 83,915 2015 County-wide Parks Projects 487,354 800,000 (487,354) 800,000 737,088 Sheriff Txwarn Tower Software 434,145 434,145 Sheriff Helicopter Project 424,911 (424,911) Sheriff Vocational Building #2 312,708 524 (313,232) 74,000 FM762 Landscaping 221,754 221,754 Document Management Steer Team 211,950 595,387 807,337 551,049 LJ Parkway 208,702 208,702 1 Four Corners Community Service Center 178,229 2,076,468 2,254,697 Justice Center Security Upgrade 167,417 42,859 210,276 46,896 Justice Center Courtrooms Buildout 154,067 14,065 (168,132) Fairgrounds Livestock Building 152,606 4,364,399 (4,517,005) 11,036 Missouri City Library Expansion 147,287 215,165 362,452 114,756 Mission Bend Library 143,597 311,384 454,981 4,421,688 CSI Redaction Software 124,798 225 125,023 113 5th Street Community Center Expansion 82,794 541,822 624,616 275,590 Enotices Software 45,000 1,200 (46,200) Kitty Hollow Improvements 40,700 198,950 239,650 West Bellfort Extention 31,706 1,351,369 1,383,075 155,089 Courthouse Renovation Project 29,550 (29,550) Precinct 4 Renovations 26,972 26,972 Mission Bend Community Center 14,657 188,955 203,612 53,605 Sheriff Administratin Building 6,555 604,530 611,085 116,738 NIBRS Software 30,100 30,100 33,840 2016 EOC Technology 11,250 (11,250) Fulshear Bldg Repairs 10,304 (10,304) 162,721 Cash Receipt Software 90,924 90,924 243,262 HVAC Replacement Pct 4 Building 23,559 (23,559) Sienna Annex Buildout 2017 346,284 (346,284) 373 Video Surveillance Upgrade 261,298 261,298 7,625 Old Jail Re-Roof 195,917 (195,917) 1,065 Juv Det Schemat.Design Pkg 395,284 (395,284) 2,216 Old Jail Re-Roof 2017 225,000 (225,000) Juv Youth Ed Hvac Replace 14,335 14,335 Jail Kitchen Floor Replcmt 258,198 (258,198) So Patrol Bldg Reroof 2017 41,875 (41,875) So Emerg. Medical Dispatch 95,481 95,481 16,777 Fair Renovations 2016 24,564 24,564 Jc Park Admin & Dining Fac 484,084 (484,084) Fairgrounds Renov. 2017 305,058 305,058 Jc Park Renovations 24,986 24,986 Parks Restroom Renovations 326,829 326,829 6,692 2015 Mo City Gym Rehab 279,589 279,589 106,330 Cty Wide Parks Land/Impr. 817,819 (601,438) 216,381 737,088 Fg Park./Drain.Livest.Area 1,141,016 (1,141,016) 5,350 So Jail Upgrade Design Ser 78,760 78,760 8,240 Juvenile Gym Renovation 8,500 (8,500) Detention Fence Repair & R 53,866 (53,866) Traff Sig Spring Grn & Roe 39,718 39,718 68,870 Traff Sig Wst Bf & Mason R 39,718 39,718 5,826 Traff Sig Wst Bf & Old Ric 39,837 39,837 5,843 Big Creek 102,098 (102,098) 147,653 Upper Oyster Creek 160,797 (160,797) 99,206 Harlem U-Turn Lanes At Sh9 609,033 609,033 Gml Renovations 92,981 (92,981) Sienna Annex 45,815 45,815 127 Gordon Ranch 7,700 (7,700) Fort Bend Senior Meals on Wheels 14,472 (14,472)
Totals 48,223,387$ 55,878,323$ (34,198,616)$ 69,903,094$ 56,033,274$
2017 CONSTRUCTION COSTS

FORT BEND COUNTY, TEXAS NOTES TO FINANCIAL STATEMENTS (continued)
49
NOTE 7 – AMBULANCE SERVICES OVERPAYMENT LIABILITY Fort Bend County identified a technical compliance deficiency regarding billing of ambulance services to Center for Medicare and Medicaid Services (“CMS”) and other federal payers. This was confirmed with a statistically valid random-sample audit performed in August of 2016. The variance rate was calculated at 26.6%. Based on this error rate, Fort Bend County was overpaid by CMS and other federal payers by approximately $3 million over a period of six years. With the additional penalty, the County will be required to reimburse approximately $4.5 million. The technical deficiency was corrected as of January 31, 2016 and controls have been implemented to ensure full compliance with regard to all requirements of all funding entities of ambulance services provided by Fort Bend County. This liability is included in accounts payable and accrued expenses in the financial statements; the amount is still outstanding as of September 30, 2017. NOTE 8 - LONG-TERM DEBT A. General Obligation Bonds and Long-Term Liabilities Long-term liabilities applicable to the County’s governmental activities are not due and payable in the current period, and accordingly, are not reported as fund liabilities in the governmental funds. Interest on long-term debt is not accrued in governmental funds, but rather is recognized as an expenditure when due. Long-term bonded debt as of September 30, 2017, is as follows:
Original IssueInterest Rate
% MaturesDebt
Outstanding
48,940,000$ Unlimited Tax Road Bonds, Series 2009 3.00 - 5.00 2029 2,165,000$
73,430,000 Justice Center Limited Tax Bonds, Series 2009 3.00 - 5.25 2030 2,970,000
20,780,000 Unlimited Tax Road Refunding Bonds,Series 2009 3.00 - 5.00 2021 7,265,000
9,675,000 Fort Bend Flood Control Water Supply Refunding Bonds, Series 2010 2.50 - 4.00 2021 3,685,000
58,220,000 Unlimited Tax Road Bonds, Series 2012 2.00 - 5.00 2032 48,120,000
18,900,000 Unlimited Tax Road Refunding Bonds, Series 2014 1.00 - 5.00 2026 15,965,000
52,220,000 Unlimited Tax Road and Refunding Bonds, Series 2015A 2.00 - 5.00 2035 48,790,000
93,370,000 Facilities Limited Tax Refunding Bonds, Series 2015B 4.00 - 5.00 2031 93,370,000
75,340,000 Unlimited Tax Road and Refunding Bonds, Series 2016A 2.00 - 5.00 2036 73,915,000
94,420,000 Facilities Limited Tax and Refunding Bonds, Series 2016B 2.00 - 5.00 2036 92,895,000
17,000,000 Certificates of Obligation,Series 2017 2.36 2033 17,000,000
47,550,000 Combination Tax and Revenue Certificatesof Obligation, Series 2017A 5 2029 47,550,000
Total General Obligation Bonds 453,690,000$
Tax Notes3,808,978 Mobility Tax Note
Series 2017 2.36 2023 3,808,978
Total Tax Notes 3,808,978$
Description

FORT BEND COUNTY, TEXAS NOTES TO FINANCIAL STATEMENTS (continued)
50
NOTE 8 - LONG-TERM DEBT (continued) A. General Obligation Bonds and Long-Term Liabilities (continued) The County issues general obligation bonds primarily for the purpose of funding construction projects. The Facilities and Justice Center Limited Tax Bonds were issued to provide funds for the construction of major County facilities. The Unlimited Tax Road Bonds have been issued to fund the acquisition of right-of-way and the construction of roads and bridges that are within the County’s major thoroughfare plan. The Fort Bend Flood Control Water Supply Refunding Bonds were issued to refund and defease the FBFCWSC’s outstanding Revenue Bonds, Series 2001, which were originally issued to fund the improvement of Big Creek as a component of the Drainage District infrastructure. In August 2017, the County issued $47,550,000 in Combination Tax and Revenue Certificates of Obligation, Series 2017A. The proceeds of this bond issue will fund the frontage road improvements to the Westpark B extension that will widen FM1093 eastbound and westbound lanes from SH99 to just east of Fulshear. In July 2017, the County issued $17,000,000 in Certificates of Obligation, Series 2017. The proceeds of this bond issue will fund the construction of a new Library along with two community centers in the Mission Bend/Four Corners area. In January 2017, the County issued approximately $3.8 million in tax notes to fund the construction of West Bellfort Road from Binion Lane to Harlem Road. The debt service on these notes will be paid from a Joint Participation agreement with the Municipal Utility District and a sales tax allocation from the Management District which the new road is located within. All of the County’s outstanding bond issues are subject to federal arbitrage regulations. The County complies with the five year reporting requirements to the Internal Revenue Service for rebate calculation. As of the date of this report, the County has no contingent rebatable arbitrage. A summary of long-term liability transactions of the County for the year ended September 30, 2017, follows:
AmountsBalance Balance Due Within10/1/16 Additions Retirements 9/30/17 One Year
Bonds payable:General obligation bonds 410,560,000$ 64,550,000$ (21,420,000)$ 453,690,000$ 25,425,000$ Tax Notes 3,808,978 3,808,978 506,000 Premiums on bonds 62,444,495 7,965,901 (4,067,389) 66,343,007
Total bonds payable 473,004,495 76,324,879 (25,487,389) 523,841,985 25,931,000
Accrued compensated absences 7,195,732 10,107,509 (8,082,398) 9,220,843 2,305,211 Other post-employment benefits
("OPEB") obligation 256,897,972 43,995,616 (7,757,673) 293,135,915
Total Long-Term Liabilities 737,098,199$ 130,428,004$ (41,327,460)$ 826,198,743$ 28,236,211$
Bonded debt is funded primarily by property taxes from the Debt Service Fund. Accrued compensated absences are payable by the fund in which the individual positions are budgeted. General Fund and the Drainage District Fund have been used to fund current OPEB costs. As of the date of this report, the long-term portion of the OPEB liability is not funded.

FORT BEND COUNTY, TEXAS NOTES TO FINANCIAL STATEMENTS (continued)
51
NOTE 8 - LONG-TERM DEBT (continued) A. General Obligation Bonds and Long-Term Liabilities (continued) Annual debt service requirements to maturity for the general obligation bonds are summarized as follows:
General Obligation BondsPrincipal Interest Totals
2018 25,425,000$ 20,596,304$ 46,021,304$ 2019 25,975,000 19,420,287 45,395,287 2020 27,100,000 18,147,394 45,247,394 2021 28,275,000 16,827,109 45,102,109 2022 26,880,000 15,504,332 42,384,332
2023-2027 154,035,000 55,924,940 209,959,940 2028-2032 128,295,000 20,026,388 148,321,388 2033-2037 37,705,000 3,101,379 40,806,379
Totals 453,690,000$ 169,548,133$ 623,238,133$
Tax Notes
Principal Interest Totals2018 506,000$ 83,921$ 589,921$ 2019 516,000 71,861 587,861 2020 527,000 59,554 586,554 2021 537,000 46,999 583,999 2022 548,000 34,196 582,196
2023-2027 1,174,978 27,930 1,202,908
Totals 3,808,978$ 324,461$ 4,133,439$
B. Defeasance of Debt In fiscal year 2015, the County defeased a large portion of the Facilities Limited Tax Bonds, Series 2007 by placing the proceeds of the refunding bonds in an irrevocable trust to provide for all future debt service on the refunded bonds. The trust account assets and the liability for the defeased bonds are not included in the County’s basic financial statements. As of September 30, 2017, there is no remaining outstanding balance of the Facilities Limited Tax Bonds, Series 2007. In fiscal year 2016, the County defeased a large portion of the Unlimited Tax Road Bonds, Series 2009 and a large portion of the Justice Center Limited Tax Bonds, Series 2009 by placing the proceeds of the refunding bonds in an irrevocable trust to provide for all future debt service on the refunded bonds. The trust account assets and the liability for the defeased bonds are not included in the County’s basic financial statements. As of September 30, 2017, the outstanding balance of the Unlimited Tax Road Bonds, Series 2009 was $32,045,000, and the outstanding balance of the Justice Center Limited Tax Bonds, Series 2009 was $50,315,000.

FORT BEND COUNTY, TEXAS NOTES TO FINANCIAL STATEMENTS (continued)
52
NOTE 9 – EMPLOYEE RETIREMENT SYSTEM General Information about the Pension Plan A. Plan Description The County provides retirement, disability, and death benefits for all of its full-time employees through a nontraditional defined benefit pension plan in the statewide Texas County and District Retirement System (“TCDRS”). The Board of Trustees of TCDRS is responsible for the administration of the statewide agent multiple-employer public employee retirement system consisting of nontraditional defined benefit pension plans. TCDRS in the aggregate issues a comprehensive annual financial report (“CAFR”) on a calendar year basis. The CAFR is available upon written request from the TCDRS Board of Trustees at P.O. Box 2034, Austin, Texas 78768-2034. B. Benefits Provided The plan provisions are adopted by the County’s Commissioners Court, within the options available in the Texas state statutes governing TCDRS (“TCDRS Act”). Members can retire with eight or more years of service at age 60 and above, with 30 years of service regardless of age, or when the sum of their age and years of service equals 75 or more. Members are vested after eight years of service but must leave their accumulated contributions in the plan to receive any County financed benefit. Members who withdraw their personal contributions in a lump sum are not entitled to any amounts contributed by the County. Benefit amounts are determined by the sum of the employee's contributions to the plan, with interest, and County financed monetary credits. The level of these monetary credits is adopted by the County’s Commissioners Court within the actuarial constraints imposed by the TCDRS Act so that the resulting benefits can be expected to be adequately financed by the County's commitment to contribute. At retirement, death, or disability, the benefit is calculated by converting the sum of the employee's accumulated contributions and the County financed monetary credits to a monthly annuity using annuity purchase rates prescribed by the TCDRS Act. All employees are eligible for non-duty disability benefits after 10 years of service and for duty-related disability benefits upon hire. Disability retirement benefits are determined in the same manner as retirement benefits but are payable immediately without an actuarial reduction. Death benefits equal two times the employee’s final full-year salary. An employee who leaves County service may withdraw his or her contributions, plus any accumulated interest. Benefit terms provide for annual cost-of-living adjustments to each employee’s retirement allowance subsequent to the employee’s retirement date. The annual adjustments are one-half of the change in the Consumer Price Index, limited to a maximum increase in retirement allowance of 2 percent for general employees and 3 percent for public safety employees. The County’s Commissioners Court considers providing an additional cost-of-living adjustment after the employee’s retirement date beyond the terms of the plan during the budget process if sufficient funds are available.

FORT BEND COUNTY, TEXAS NOTES TO FINANCIAL STATEMENTS (continued)
53
NOTE 9 – EMPLOYEE RETIREMENT SYSTEM (continued) General Information about the Pension Plan (continued) C. Employees Covered by Benefit Terms As of September 30, 2017, the following employees were covered by the benefit terms:
Inactive employees or beneficiaries currently receiving benefits 861 Inactive employees entitled to but not yet receiving benefits 1,776 Active employees 2,778 Total 5,415
D. Contributions The County has elected the annually determined contribution rate (“ADCR”) plan provisions of the TCDRS Act. The plan is funded by monthly contributions from both employee members and the County based on the covered payroll of employee members. Under the TCDRS Act, the contribution rate of the employer is actuarially determined annually. It was 11.79% for calendar year 2016 and 11.95% for calendar year 2017. The contribution rate payable by the employee members is 7% as adopted by the governing body of the employer. The employee contribution rate and the employer contribution rate may be changed by the governing body of the employer within the options available in the TCDRS Act. The County’s total payroll in fiscal year 2017 was $148.6 million and the County’s contributions were based on a payroll of $139.1 million. Contributions made by employees totaled $10.4 million, and the County made contributions of $17.7 million during the fiscal year ended September 30, 2017. Net Pension Liability The County’s net pension liability was measured as of December 31, 2016, and the total pension liability used to calculate the net pension liability was determined by an actuarial valuation as of that date. A. Actuarial Assumptions The total pension liability in the December 31, 2016 actuarial valuation was determined using the following actuarial assumptions, applied to all periods included in the measurement:
Actuarial InformationActuarial cost methodAmortization methodAmortization periodAsset valuation method
Assumptions:Investment returnProjected salary increasesInflationCost-of-living adjustments
5-year smoothed market
0.0%
level percentage of payroll, closed
12/31/2016Entry age
13.9 years
8.0%4.9%3.0%

FORT BEND COUNTY, TEXAS NOTES TO FINANCIAL STATEMENTS (continued)
54
NOTE 9 – EMPLOYEE RETIREMENT SYSTEM (continued) Net Pension Liability (continued) A. Actuarial Assumptions (continued) The long-term expected rate of return on pension plan investments was determined using a building-block method in which best-estimate ranges of expected future real rates of return (expected returns, net of pension plan investment expense and inflation) are developed for each major asset class. These ranges are combined to produce the long-term expected rate of return by weighting the expected future real rates of return by the target asset allocation percentage and by adding expected inflation. B. Discount rate The discount rate is the single rate of return that, when applied to all projected benefit payments results in an actuarial present value of projected benefit payments equal to the total of the following:
1. The actuarial present value of benefit payments projected to be made in future periods in which (a) the amount of the pension plan’s fiduciary net position is projected to be greater than the benefit payments that are projected to be made in that period and (b) pension plan assets up to that point are expected to be invested using a strategy to achieve the long-term rate of return, calculated using the long-term expected rate of return on pension plan investments.
2. The actuarial present value of projected benefit payments not included in (1), calculated using the municipal bond rate.
Therefore, if plan investments in a given future year are greater than projected benefit payments in that year and are invested such that they are expected to earn the long-term rate of return, the discount rate applied to projected benefit payments in that year should be the long-term expected rate of return on plan investments. If future years exist where this is not the case, then an index rate reflecting the yield on a 20-year, tax-exempt municipal bond should be used to discount the projected benefit payments for those years. The determination of a future date when plan investments are not sufficient to pay projected benefit payments is often referred to as a depletion date projection. A depletion date projection compares projections of the pension plan’s fiduciary net position to projected benefit payments and aims to determine a future date, if one exists, when the fiduciary net position is projected to be less than projected benefit payments. If an evaluation of the sufficiency of the projected fiduciary net position compared to projected benefit payments can be made with sufficient reliability without performing a depletion date projection, alternative methods to determine sufficiency may be applied. In order to determine the discount rate to be used by the employer we have used an alternative method to determine the sufficiency of the fiduciary net position in all future years. Our alternative method reflects the funding requirements under the employer’s funding policy and the legal requirements under the TCDRS Act.
1. TCDRS has a funding policy where the Unfunded Actuarial Accrued Liability (“UAAL”) shall be amortized as a level percent of pay over 20-year closed layered periods.
2. Under the TCDRS Act, the employer is legally required to make the contribution specified in the funding policy.

FORT BEND COUNTY, TEXAS NOTES TO FINANCIAL STATEMENTS (continued)
55
NOTE 9 – EMPLOYEE RETIREMENT SYSTEM (continued) Net Pension Liability (continued) B. Discount Rate (continued)
3. The employer’s assets are projected to exceed its accrued liabilities in 20 years or less. When this
point is reached, the employer is still required to contribute at least the normal cost.
4. Any increased cost due to the adoption of a COLA is required to be funded over a period of 15 years, if applicable.
Based on the above, the projected fiduciary net position is determined to be sufficient compared to projected benefit payments. Based on the expected level of cash flows and investment returns to the system, the fiduciary net position as a percentage of total pension liability is projected to increase from its current level in future years. Since the projected fiduciary net position is projected to be sufficient to pay projected benefit payments in all future years, the discount rate for purposes of calculating the total pension liability and net pension liability of the employer is equal to the long-term assumed rate of return on investments. This long-term assumed rate of return should be net of investment expenses, but gross of administrative expenses for GASB 68 purposes. Therefore, we have used a discount rate of 8.10%. This rate reflects the long-term assumed rate of return on assets for funding purposes of 8.00%, net of all expenses, increased by 0.10% to be gross of administrative expenses. C. Long-Term Expected Rate of Return The long-term expected rate of return on TCDRS assets is determined by adding expected inflation to expected long-term real returns, and reflecting expected volatility and correlation. The capital market assumptions and information shown below are provided by TCDRS’ investment consultant, Cliffwater LLC. The numbers shown are based on January 2016 information for a 7-10 year time horizon. Note that the valuation assumption for long-term expected return is re-assessed at a minimum of every four years, and is set based on a 30-year time horizon; the most recent analysis was performed in 2013.

FORT BEND COUNTY, TEXAS NOTES TO FINANCIAL STATEMENTS (continued)
56
NOTE 9 – EMPLOYEE RETIREMENT SYSTEM (continued) Net Pension Liability (continued) C. Long-Term Expected Rate of Return (continued)
Asset Class Benchmark
U.S. Equities Dow Jones U.S. Total Stock Market Index 13.50% 4.70%Private Equity Cambridge Associates Global Private Equity & Vent 16.00% 7.70%Global Equities MSCI World (net) Index 1.50% 5.00%Int'l Equities - Developed Markets MSCI World Ex USA (net) 10.00% 4.70%Int'l Equities - Emerging Markets MSCI EM Standard (net) Index 7.00% 5.70%Investment-Grade Bonds Bloomberg Barclays U.S. Aggregate Bond Index 3.00% 0.60%High-Yield Bonds Citigroup High-Yield Cash-Pay Capped Index 3.00% 3.70%Opportunistic Credit Citigroup High-Yield Cash-Pay Capped Index 2.00% 3.83%Direct Lending S&P/LSTA Leveraged Loan Index 10.00% 8.15%Distressed Debt Cambridge Associates Distressed Securities Index
(4)3.00% 6.70%
REIT Equities 67% FTSE NAREIT Equity REITs Index + 33% FT 2.00% 3.85%EPRA/NAREIT Global Real Estate Index
Master Limited Partnerships (MLPs) Alerian MLP Index 3.00% 5.60%Private Real Estate Partnerships Cambridge Associates Real Estate Index
(5) 6.00% 7.20%Hedge Funds Hedge Fund Research, Inc. (HFRI) Fund of Funds C 20.00% 3.85%
(1) Target asset allocation adopted at the April 2017 TCDRS Board meeting.(2) Geometric real rates of return equal the expected return minus the assumed inflation rate of 2.0%, per Cliffwater's 2017 capital market assumptions.(3) Includes vintage years 2006-present of Quarter Pooled Horizon IRRs.(4) Includes vintage years 2005-present of Quarter Pooled Horizon IRRs.(5) Includes vintage years 2007-present of Quarter Pooled Horizon IRRs.
Target Allocation
(1)
Geometric Real Rate of Return
(Expected minus Inflation)

FORT BEND COUNTY, TEXAS NOTES TO FINANCIAL STATEMENTS (continued)
57
NOTE 9 – EMPLOYEE RETIREMENT SYSTEM (continued) Net Pension Liability (continued)
D. Changes in the Net Pension Liability
Total Pension FiduciaryLiability Net Position
(a) (b)
Balances as of December 31, 2015 545,684,579$ 475,095,562$ 70,589,017$
Changes for the year:Service cost 19,342,565 19,342,565 Interest on total pension liability 44,158,326 44,158,326 Effect of plan changes - - Effect of economic/demographic gains or losses (838,894) (838,894) Effect of assumptions changes or inputs - - Refund of contributions (1,037,730) (1,037,730) Benefit payments (19,365,607) (19,365,607) Administrative expenses (382,614) 382,614 Member contributions 9,752,784 (9,752,784) Net investment income 35,146,589 (35,146,589) Employer contributions 16,407,504 (16,407,504) Other (833,565) 833,565
Balances as of December 31, 2016 587,943,239$ 514,782,923$ 73,160,316$
Increase (Decrease)Net Pension
Liability (a) – (b)
E. Sensitivity Analysis The following presents the net pension liability of the county/district, calculated using the discount rate of 8.10%, as well as what the Fort Bend County net pension liability would be if it were calculated using a discount rate that is 1 percentage point lower (7.10%) or 1 percentage point higher (9.10%) than the current rate.
1% Current 1%Decrease Discount Rate Increase7.10% 8.10% 9.10%
Total pension liability 669,011,314$ 587,943,239$ 520,772,483$ Fiduciary net position 514,782,923 514,782,923 514,782,923 Net pension liability / (asset) 154,228,391$ 73,160,316$ 5,989,560$

FORT BEND COUNTY, TEXAS NOTES TO FINANCIAL STATEMENTS (continued)
58
NOTE 9 – EMPLOYEE RETIREMENT SYSTEM (continued) Net Pension Liability (continued) F. Pension Expense and Deferred Outflows of Resources and Deferred Inflows of Resources Related to Pensions
For the year ended September 30, 2017, the County recognized pension expense of $26,657,627 as follows:
Pension Expense
Service cost 19,342,565$ Interest on total pension liability 44,158,326 Effect of plan changes - Administrative expenses 382,614 Member contributions (9,752,784) Expected investment return net of investment expenses (38,663,061) Recognition of deferred inflows/outflows of resources
Recognition of economic/demographic gains or losses (997,123) Recognition of assumption changes or inputs 870,232 Recognition of investment gains or losses 10,483,293
Other 833,565
Pension expense 26,657,627$
Measurement Year2016
Deferred Inflows / Outflows of Resources As of the measurement date of December 31, 2016, the deferred inflows and outflows of resources are as follows:
Deferred Inflowsof Resources
Differences between expected and actual experience $ $ 4,075,462 Changes of assumptions 3,480,928 Net difference between projected and actual earnings 30,897,379 Contributions made subsequent to measurement date 13,770,245
48,148,552$ 4,075,462$
Deferred Outflowsof Resources

FORT BEND COUNTY, TEXAS NOTES TO FINANCIAL STATEMENTS (continued)
59
NOTE 9 – EMPLOYEE RETIREMENT SYSTEM (continued) Net Pension Liability (continued) F. Pension Expense and Deferred Outflows of Resources and Deferred Inflows of Resources Related to Pensions (continued)
Amounts currently reported as deferred outflows of resources and deferred inflows of resources related to pensions, excluding contributions made subsequent to the December 31 measurement date, will be recognized in pension expense as follows:
Year ended December 31:2017 10,356,403$ 2018 10,356,403 2019 9,100,606 2020 629,249 2021 (139,816)
Total 30,302,845$
NOTE 10 – DEFERRED COMPENSATION PLAN The County offers all of its full-time employees a deferred compensation plan created in accordance with Section 457 of the Internal Revenue Code. Nationwide Retirement Solutions, Security Benefit Life, and Edward Jones have been appointed as plan administrators. The plan permits employees to defer a portion of their salary until future years. The deferred compensation is not available to the employees until termination, retirement, death, or emergency. Amounts of compensation deferred by employees under the plan provisions are disbursed to the plan administrators after each pay period. The plan administrators hold all funds invested in the plan and disburse funds to employees in accordance with plan provisions. The County does not maintain significant oversight of the plan administrators’ activities. NOTE 11 – OTHER POST-EMPLOYMENT BENEFITS (“OPEB”) A. Plan Description In addition to providing pension benefits through the Texas County and District Retirement System, the County sponsors and administers a single-employer defined benefit health care plan titled “Fort Bend County Employee Benefit Plan” (“Plan”). The Plan was established and approved by Fort Bend County Commissioners Court and Chapter 175 of the Local Government Code which provides eligible employees, retirees, and their eligible dependents with the following post-employment benefits: • Eligible retirees have a portion of their medical and dental insurance premiums paid by the County for
participation with the County’s healthcare provider; and at the County’s cost to cover current employees.
• Eligible dependents of retirees have a portion of their medical and dental insurance premiums paid by
the County for participation with the County’s healthcare provider; and at the County’s cost to cover current employees.
The Plan does not issue a separate, publicly available report.

FORT BEND COUNTY, TEXAS NOTES TO FINANCIAL STATEMENTS (continued)
60
NOTE 11 – OTHER POST-EMPLOYMENT BENEFITS (“OPEB”) (continued) B. Funding Policy and Contribution Rates The contribution requirements of the County and plan members are established and may be amended by Commissioners Court. These contributions are neither guaranteed nor mandatory. The County has retained the right to unilaterally modify its payments toward retiree healthcare benefits. The Plan provides for the payment of a portion of the health and dental insurance premiums for eligible retired employees and their dependents. Plan members receiving benefits contribute a percentage of the monthly insurance premium. Currently, the Plan pays a portion of the retiree’s premiums, as well as his or her dependent coverage. The retiree contributes the premium cost each month, less the Plan subsidy. The County is statutorily required to permit retiree participation in the health insurance program on a pooled non-differentiated basis. The County, therefore, charges both groups an equal, blended rate premium. Although both groups are charged the same rate, GAAP requires the actuarial figures to be calculated using age adjusted premiums approximating claim costs for retirees separately from active employees. The use of age adjusted premiums results in the addition of an implicit rate subsidy into the actuarial accrued liability. However, the County has elected to contribute to the Plan at a rate that is based on an actuarial valuation prepared using the blended rate premium that is actually charged to the Plan. The County recognizes its share of the costs of providing these benefits when paid, on a “pay-as-you-go” basis. These payments are budgeted annually. As of September 30, 2017, there were 801 retirees receiving benefits and approximately 2,122 active members not yet receiving benefits. Commencing in fiscal 2008, the County implemented GASB Statement No. 45 “Accounting and Financial Reporting by Employers for Post-employment Benefits Other Than Pensions.” The County has performed an actuarial valuation of its post-retirement benefit liability. The financial statement disclosures for 2017 are as follows: C. Annual OPEB Costs and Net OPEB Obligation For fiscal year 2017, the County’s annual OPEB cost for the Plan was $43,995,616. The County’s annual OPEB cost, the percentage of annual OPEB cost contributed to the Plan, and the net OPEB obligation for the year ended September 30, 2017, were as follows:
Fiscal Year Ending 9/30/17
Determination of Annual Required ContributionNormal Cost at Fiscal Year End 23,303,760$ Amortization of Unfunded Actuarial Accrued Liability 24,700,971 Annual Required Contribution ("ARC") 48,004,731
Determination of Net OPEB ObligationAnnual Required Contribution 48,004,731 Interest on prior-year Net OPEB Obligation 10,275,919 Adjustment to ARC (14,285,034) Annual OPEB Cost 43,995,616
Less Assumed Contributions Made (7,757,673) Estimated Increase in Net OPEB Obligation 36,237,943
Net OPEB Obligation - Beginning of Year 256,897,972
Net OPEB Obligation - End of Year 293,135,915$
Percentage of OPEB Cost Contributed 17.63%

FORT BEND COUNTY, TEXAS NOTES TO FINANCIAL STATEMENTS (continued)
61
NOTE 11 – OTHER POST-EMPLOYMENT BENEFITS (“OPEB”) (continued) D. Trend Information The following table shows the estimated annual OPEB cost and net OPEB obligation for the prior three years assuming the plan is not prefunded (4% discount):
Fiscal Year Ended
Discount Rate
Annual OPEB Cost
Percentage of OPEB Cost Contributed
Net OPEB Obligation
2015 4% $ 36,980,392 14.76% $ 221,281,360 2016 4% 42,570,952 16.34% 256,897,972 2017 4% 43,995,616 17.63% 293,135,915
E. Funded Status and Funding Progress A schedule of funded status as of the most recent actuarial valuation is as follows:
Actuarial valuation date October 1, 2015Actuarial value of plan assets (a) -$ Actuarial accrued liability ("AAL") (b) 350,708,226$ Unfunded/(Overfunded) actuarial accrued
liability ("UAAL" or "OAAL") (b-a) 350,708,226$ Funded Ratio (a/b) 0.0%Annual Covered Payroll (c) 139,138,120$ UAAL or OAAL as % of covered payroll
((b-a)/c) 252.06%
Actuarial valuations of an ongoing plan involve estimates of the value of reported amounts and assumptions about the probability of occurrence of events far into the future. Examples include assumptions about future employment, mortality, and the healthcare cost trend. Amounts determined regarding the funded status of the plan and the annual required contributions of the employer are subject to continual revision as actual results are compared with past expectations and new estimates are made about the future. The schedule of funding progress, presented as required supplementary information following the notes to the financial statements, presents multi-year trend information about whether the actuarial value of plan assets is increasing or decreasing over time relative to the actuarial accrued liability.

FORT BEND COUNTY, TEXAS NOTES TO FINANCIAL STATEMENTS (continued)
62
NOTE 11 – OTHER POST-EMPLOYMENT BENEFITS (“OPEB”) (continued) F. Actuarial Methods and Assumptions The actuarial cost method used for determining the benefit obligations is a Projected Unit Credit Cost Method. Under this method, the actuarial present value of projected benefits is the value of benefits expected to be paid for current actives and retirees and is calculated based on certain assumptions and census data. The amortization period and method utilized was a 30 year level dollar closed period. The Actuarial Accrued Liability (“AAL”) is the actuarial present value of benefits attributed to employee service rendered prior to the valuation date. The AAL equals the present value of benefits multiplied by a fraction equal to service to date over service at expected retirement. The Normal Cost is the actuarial present value of benefits attributed to one year of service. This equals the present value of benefits divided by service at expected retirement. Since retirees are not accruing any more service, their normal cost is zero. In determining the Annual Required Contribution, The Unfunded AAL is amortized as a level dollar over 30 years. The actuarial assumptions included a 4% per annum discount rate for valuing liabilities. Employees eligible for retiree medical benefits assumed to elect continued medical coverage in retirement for themselves and their spouses is 100% and 40% respectively. The valuation assumes the following:
Healthcare cost trend rates: o Pre-65 trend begins at 6.2% in fiscal year 2011 and falls to 4.7% in 2089. o Post-65 trend begins at 6.2% in fiscal year 2011 and falls to 4.8% in 2099. o Dental trend begins at 5.86% in fiscal year 2011 and falls to 3.95% in 2024.
4% per annum discount rate for valuing liabilities. Employees eligible for retiree medical benefits assumed to elect continued medical coverage in
retirement for themselves and their spouses is 100% and 40% respectively. 2.75% inflation rate. No projected salary increases.
NOTE 12 – NET PENSION OBLIGATION AND OTHER POST-EMPLOYMENT BENEFITS FUNDING IN PRIOR YEARS The governmental funds that have been used to fund the net pension obligation and other post-employment benefit obligations in prior years have been the General Fund and the Drainage District Fund. The Drainage District Fund has only funded these obligations for retirees that worked for that department through the date of their retirement. All other obligations for retirees have been funded within the General Fund.

FORT BEND COUNTY, TEXAS NOTES TO FINANCIAL STATEMENTS (continued)
63
NOTE 13 – FUND BALANCES Fund balances are presented in the following categories: nonspendable, restricted, committed, assigned, and unassigned, as described in Note 1. Fund balances for all the major and non-major governmental funds as of September 30, 2017, were distributed as follows:
Debt Capital Non-majorGeneral Service Project Special Revenue
Fund Fund Funds Funds TotalsNonspendable:
Prepaid items 152,920$ $ $ 21,314$ 174,234$
Subtotal 152,920 21,314 174,234
Restricted for:General administration 2,085,160 3,520,676 5,605,836 Financial administration 22,260 22,260 Administration of justice 1,185,430 2,241,655 3,427,085 Construction and maintenance 76,907,698 47,282,458 124,190,156 Health and welfare 420,580 212,769 633,349 Public safety 44,980 2,366,321 2,411,301 Library 1,338,963 1,338,963 Debt service 9,852,755 9,852,755
Subtotal 3,736,150 9,852,755 76,907,698 56,985,102 147,481,705
Committed to:Facilities and Equipment 2,034,685 2,034,685 Construction & Maintenance 1,152,647 1,152,647 OPEB Liability Funding 2,549,200 2,549,200 IT Infrastructure and Software 4,878,434 4,878,434 Special Projects-Commissioners Court 296,103 296,103 Right-of-way acquisitions 881,230 881,230
Subtotal 11,792,299 11,792,299
Unassigned 44,717,250 (127,583) 44,589,667
Total Fund Balances 60,398,619$ 9,852,755$ 76,907,698$ 56,878,833$ 204,037,905$

FORT BEND COUNTY, TEXAS NOTES TO FINANCIAL STATEMENTS (continued)
64
NOTE 14 – CONTINGENCIES AND COMMITMENTS A. Construction Contract Commitments The County had several capital improvement commitments as of September 30, 2017. A contract between two parties does not result immediately in the recognition of a liability. Instead, a liability is incurred when performance has occurred under the contract. Until such time as performance takes place, these contracts represent a commitment rather than a liability. These commitments and their related construction in progress are summarized in Note 6. B. Litigation and Other Contingencies The County is contingently liable with respect to lawsuits and other claims in the ordinary course of its operations. The settlement of such contingencies under the budgetary process would not materially affect the financial position of the County as of September 30, 2017. NOTE 15 - RISK MANAGEMENT The County is exposed to various risks related to torts: theft of, damage to, and destruction of assets; errors and omissions; and natural disasters. The County's risk management program encompasses various means of protecting the County against loss through self-insurance and obtaining property, casualty, and liability coverage through commercial insurance carriers. Settled claims have not exceeded insurance coverage in any of the previous three fiscal years. There has not been any significant reduction in insurance coverage from that of the previous year. Liabilities have been recorded for workers’ compensation, auto liability, general liability, and employee benefits. These liabilities are recorded when it is probable that a loss has occurred and the amount can be reasonably estimated. Liabilities include an amount for claims that have been incurred but not reported (“IBNR”). The result of the process to estimate the claims liability is not an exact amount as it depends on many complex factors, such as inflation, changes in legal doctrines, and damage awards. Accordingly, claims are reevaluated periodically to consider the effects of inflation, recent claim settlement trends, and other economic and social factors. The estimate of the claims liability also includes amounts for incremental claim adjustment expenses regardless of whether allocated to specific claims. Non-incremental claim adjustment expenses have not been included as part of the liability for claims and judgments. However, estimated recoveries, for example from salvage or subrogation, are another component of the claims liability estimate. A summary of the changes in the balances of claims liabilities for the years ended September 30, 2017 and 2016 is as follows:
Year ended Year ended9/30/17 9/30/16
Unpaid claims, beginning of year 2,927,179$ 2,970,451$ Incurred claims (including IBNRs) 30,476,536 29,534,115 Claim payments (29,726,245) (29,577,387) Unpaid claims, end of year 3,677,470$ 2,927,179$
Other Insurance:Year ended Year ended
9/30/17 9/30/16
Unpaid claims, beginning of year 3,551,727$ 3,475,912$ Incurred claims (including IBNRs) (278,265) 436,046 Claim payments (352,207) (360,231) Unpaid claims, end of year 2,921,255$ 3,551,727$
Amounts Due Within One Year 2,921,255$ 3,551,727$

FORT BEND COUNTY, TEXAS NOTES TO FINANCIAL STATEMENTS (continued)
65
NOTE 16 – DEFICIT FUND BALANCE AND NET POSITION As of September 30, 2017 the County reported a deficit in fund balance of $130,256 in the East Fort Bend Development Authority Special Revenue Fund. The County plans to clear these deficits once the Authority initiates its capital program to begin the construction of infrastructure within its jurisdiction. This will allow the Authority to fully fund the amounts advanced by the County. NOTE 17 – TAX ABATEMENTS Fort Bend County provides property tax abatements for economic development pursuant to Chapter 312 of the Texas Property Tax Code in order to facilitate the creation and retention of job opportunities to the County. Under the terms of the County’s tax abatement guidelines, an abatement may only be granted for the additional value of eligible Improvements made subsequent to and specified in an abatement agreement between the County and the property owner or lessee, subject to such limitations as the County may require. An abatement may be granted for new facilities and improvements to existing facilities for purposes of modernization or expansion. Economic Qualifications: In order to be eligible for designation as a reinvestment zone and receive tax abatement the planned improvement:
1. Must be expected to have an increased appraised ad valorem tax value of at least $1,000,000 based upon the Fort Bend Central Appraisal District’s assessment of the eligible property; and
2. Must be expected to prevent the loss of payroll or retain, increase or create payroll on a permanent basis in the County.
3. Must not have the effect of transferring employment from one part of the County to another, unless there is a substantial threat of economic loss to the County.
Recapture: Any abatement agreement may be terminated and all taxes previously abated by virtue of the agreement will be recaptured and paid within thirty (30) days of the termination in the event that the company or individual:
1. Allows its ad valorem taxes owed the County to become delinquent and fails to timely and properly follow the legal procedures for their protest and /or contest;
2. Violates any of the terms and conditions of the abatement agreement; or 3. Vacates any of the improvements subject to the agreement before the term of the abatement; and
fails to cure during the cure period.
Should the County determine that the company or individual is in default according to the terms and conditions of its agreement, the County shall notify the company or individual of such default in writing at the address stated in the agreement; and if such is not cured within thirty (30) days from the date of such notice (“Cure Period”), then the agreement may be terminated. Taxes Abated: During the 2017 fiscal year the County tax abatement program resulted in the abatement of approximately $1.6 million in property taxes as a result of lowered assessed values on qualified projects.

FORT BEND COUNTY, TEXAS NOTES TO FINANCIAL STATEMENTS (continued)
66
NOTE 18 – SUBSEQUENT EVENTS In October 2017 the County issued $4,952,549 Tax and Revenue Certificates of Obligation, Taxable Series 2017B (QECB). The proceeds of this bond issue will fund the energy efficiency improvements to the County Jail. In February 2018 the County issued $60,000,000 Unlimited Tax Road Bonds, Series 2018 to continue construction of the scheduled road improvements throughout the County over the next 2 years. Hurricane Harvey resulted in the County incurring expenses of over $15 million as of the date of this report. Capital repairs are expected to cost approximately $40 million over the next 3 years. The County expects to recover 90% of these costs from FEMA under four programs.

67
Required Supplementary Information

68
FORT BEND COUNTY, TEXASSCHEDULE OF REVENUES, EXPENDITURES, AND CHANGES page 1 of 10
IN FUND BALANCE - BUDGET AND ACTUALGENERAL FUND - BUDGETARY BASISFor the Year Ended September 30, 2017
Actual VarianceAmounts from Final
Original Final Budgetary PositiveBudget Budget Basis (Negative)
RevenuesProperty taxes 213,301,442 213,301,442$ 218,853,835$ 5,552,393$ Fines and fees 29,907,300 29,990,774 31,068,899 1,078,125 Intergovernmental 6,822,360 6,828,355 6,984,748 156,393 Earnings on investments 901,500 901,500 1,442,145 540,645 Miscellaneous 2,715,600 2,851,166 3,057,811 206,645 Total Revenues 253,648,202 253,873,237 261,407,438 7,534,201
ExpendituresGeneral AdministrationCounty Judge:
Salaries and personnel costs 748,283 708,796 708,736 60 Operating costs 24,180 30,212 29,852 360 Information technology costs 1,252 1,427 1,172 255
Commissioner Precinct 1:Salaries and personnel costs 465,845 513,642 513,533 109 Operating costs 12,092 31,071 31,061 10 Information technology costs 1,656 802 854
Commissioner Precinct 2:Salaries and personnel costs 607,541 594,834 592,910 1,924 Operating costs 32,083 44,335 43,600 735 Information technology costs 275 273 2
Commissioner Precinct 3:Salaries and personnel costs 605,218 587,614 587,520 94 Operating costs 39,877 37,851 36,902 949 Information technology costs 2,500 2,275 225
Commissioner Precinct 4:Salaries and personnel costs 475,481 460,286 459,656 630 Operating costs 11,964 16,699 15,859 840 Information technology costs 60 60
County Clerk: Salaries and personnel costs 4,529,873 4,268,895 4,268,456 439 Operating costs 113,816 197,482 196,112 1,370 Information technology costs 41,926 41,926 41,867 59
Non-Departmental: Salaries and personnel costs 5,588,305 5,866,545 5,865,806 739 Operating costs 11,096,653 9,074,398 8,987,961 86,437 Information technology costs 1,230 1,230 Capital acquisitions
Risk Management/Insurance: Salaries and personnel costs 855,207 828,353 827,538 815 Operating costs 183,297 149,901 144,792 5,109 Information technology costs 2,250 2,004 246

69
FORT BEND COUNTY, TEXASSCHEDULE OF REVENUES, EXPENDITURES, AND CHANGES page 2 of 10
IN FUND BALANCE - BUDGET AND ACTUALGENERAL FUND - BUDGETARY BASISFor the Year Ended September 30, 2017
Actual VarianceAmounts from Final
Original Final Budgetary PositiveBudget Budget Basis (Negative)
Elections Administrator:Salaries and personnel costs 726,756 668,956 668,538 418 Operating costs 137,315 144,945 144,528 417
Elections Services: Salaries and personnel costs 245,663 271,103 271,102 1 Operating costs 318,368 282,368 277,260 5,108 Information technology costs 8,400 8,400 7,340 1,060
Human Resources: Salaries and personnel costs 859,587 840,370 839,591 779 Operating costs 126,557 120,574 119,207 1,367 Information technology costs 2,200 580 1,620 Capital acquisitions
Vehicle Maintenance: Salaries and personnel costs 906,993 884,749 884,628 121 Operating costs (911,278) (890,285) (903,835) 13,550 Information technology costs 395 395 Capital acquisitions 36,600 31,797 31,796 1
Records Management: Salaries and personnel costs 399,993 392,459 391,292 1,167 Operating costs 16,243 23,546 22,837 709 Information technology costs 231 195 36 Capital acquisitions
Central Mailroom: Salaries and personnel costs 225,994 221,594 220,876 718 Operating costs 568,938 570,097 569,929 168 Information technology costs Capital acquisitions
Facilities Management and Planning: Salaries and personnel costs 628,301 619,128 619,052 76 Operating costs 39,391 47,103 46,350 753 Information technology costs 761 761
Facilities Maintenance: Salaries and personnel costs 1,086,612 1,047,562 1,047,560 2 Operating costs 979,307 925,617 922,147 3,470 Information technology costs 14,056 5,056 4,861 195 Capital acquisitions 131,790 100,690 66,000 34,690
Facilities Operations: Salaries and personnel costs 220,809 216,568 215,920 648 Operating costs 4,529,269 4,098,510 4,086,876 11,634
Janitorial: Salaries and personnel costs 601,456 567,050 566,127 923 Operating costs 676,112 678,728 678,478 250
Jail Maintenance:Salaries and personnel costs 723,824 701,964 701,584 380 Operating costs 779,596 674,976 673,217 1,759 Information technology costs 12,315 2,315 2,183 132

70
FORT BEND COUNTY, TEXASSCHEDULE OF REVENUES, EXPENDITURES, AND CHANGES page 3 of 10
IN FUND BALANCE - BUDGET AND ACTUALGENERAL FUND - BUDGETARY BASISFor the Year Ended September 30, 2017
Actual VarianceAmounts from Final
Original Final Budgetary PositiveBudget Budget Basis (Negative)
Interdepartmental Construction: Salaries and personnel costs 1,162,345 1,131,067 1,130,484 583 Operating costs 74,312 75,375 74,593 782 Capital acquisitions 24,500 24,975 24,975
County Attorney: Salaries and personnel costs 2,553,020 2,386,754 2,386,358 396 Operating costs 146,879 191,850 141,238 50,612 Information technology costs 10,223 17,098 14,385 2,713 Capital acquisitions
Information Technology: Salaries and personnel costs 5,370,584 5,107,047 5,106,728 319 Operating costs 3,452,345 3,385,606 3,369,448 16,158 Information technology costs 355,038 463,939 454,731 9,208 Capital acquisitions 58,583 43,769 32,215 11,554
Purchasing: Salaries and personnel costs 921,032 927,422 926,568 854 Operating costs 26,993 52,676 50,488 2,188 Information technology costs 2,500 1,825 675 Capital acquisitions 29,799 29,620 179
Capital Outlay-General Fund: Capital acquisitions 10,665,085
Total General Administration 64,468,084 50,653,057 50,285,395 367,662
Financial AdministrationCounty Auditor:
Salaries and personnel costs 2,276,025 2,218,246 2,217,211 1,035 Operating costs 27,120 98,478 97,980 498 Information technology costs 1,706 2,263 2,237 26
County Treasurer: Salaries and personnel costs 802,289 765,791 765,615 176 Operating costs 185,925 221,343 214,055 7,288 Information technology costs 2,523 9,468 8,536 932
Court Collections: Salaries and personnel costs 126,828 121,956 121,934 22 Operating costs 15,714 17,838 17,009 829 Information technology costs 381 631 627 4
EMS Collections: Salaries and personnel costs 442,020 141,374 141,370 4 Operating costs 164,618 40,882 40,879 3 Information technology costs
Tax Assessor/Collector: Salaries and personnel costs 4,971,373 4,754,542 4,754,094 448 Operating costs 291,334 385,359 385,050 309 Information technology costs 11,350 13,183 13,083 100

71
FORT BEND COUNTY, TEXASSCHEDULE OF REVENUES, EXPENDITURES, AND CHANGES page 4 of 10
IN FUND BALANCE - BUDGET AND ACTUALGENERAL FUND - BUDGETARY BASISFor the Year Ended September 30, 2017
Actual VarianceAmounts from Final
Original Final Budgetary PositiveBudget Budget Basis (Negative)
Budget Office: Salaries and personnel costs 613,482 599,083 598,825 258 Operating costs 13,852 19,248 19,230 18 Information technology costs 100 303 239 64
Total Financial Administration 9,946,640 9,409,988 9,397,974 12,014
Administration of JusticeCounty Court-at-Law #1:
Salaries and personnel costs 592,676 576,484 575,951 533 Operating costs 245,891 398,708 398,703 5 Information technology costs 400 236 164
County Court-at-Law #2: Salaries and personnel costs 587,467 581,110 580,204 906 Operating costs 243,671 408,573 403,152 5,421
County Court-at-Law #3: Salaries and personnel costs 592,403 553,096 552,356 740 Operating costs 243,281 531,893 531,892 1
County Court-at-Law #4: Salaries and personnel costs 597,668 550,254 549,637 617 Operating costs 243,574 769,148 769,041 107
County Court-at-Law #5: Salaries and personnel costs 575,085 588,092 587,742 350 Operating costs 248,653 595,091 594,617 474 Information technology costs 3,054 286 2,768
240th District Court: Salaries and personnel costs 259,864 263,747 263,413 334 Operating costs 235,373 825,218 824,942 276 Information technology costs 4,810 4,770 40
268th District Court: Salaries and personnel costs 279,121 274,041 274,040 1 Operating costs 249,546 589,346 589,344 2 Information technology costs 3,054 2,756 298
328th District Court: Salaries and personnel costs 455,600 446,264 445,318 946 Operating costs 234,025 416,112 416,111 1
387th District Court: Salaries and personnel costs 453,617 448,264 448,263 1 Operating costs 158,965 168,258 165,018 3,240

72
FORT BEND COUNTY, TEXASSCHEDULE OF REVENUES, EXPENDITURES, AND CHANGES page 5 of 10
IN FUND BALANCE - BUDGET AND ACTUALGENERAL FUND - BUDGETARY BASISFor the Year Ended September 30, 2017
Actual VarianceAmounts from Final
Original Final Budgetary PositiveBudget Budget Basis (Negative)
400th District Court: Salaries and personnel costs 259,911 265,064 265,061 3 Operating costs 213,127 1,033,559 1,033,254 305 Information technology costs
434th District Court: Salaries and personnel costs 285,515 270,997 270,026 971 Operating costs 239,862 1,343,194 1,341,732 1,462 Information technology costs Capital acquisitions
505th District Court: Salaries and personnel costs 455,733 438,667 437,100 1,567 Operating costs 252,836 142,589 138,527 4,062 Information technology costs 1,799 4,853 4,178 675
458th District Court:Salaries and personnel costs 13,522 12,588 934 Operating costs 41,575 41,318 257 Information technology costs 4,513 4,480 33
Child Support: Salaries and personnel costs 487,665 441,746 441,673 73 Operating costs 17,571 22,840 18,445 4,395
District Clerk:Salaries and personnel costs 4,415,572 4,347,453 4,346,533 920 Operating costs 234,021 279,552 276,951 2,601 Information technology costs 3,333 46,374 41,632 4,742
District Clerk Jury Payments: Operating costs 275,000 268,000 267,525 475
Justice of the Peace Precinct #1, Place 1: Salaries and personnel costs 530,729 520,479 518,476 2,003 Operating costs 11,800 22,050 21,809 241
Justice of the Peace Precinct #1, Place 2: Salaries and personnel costs 674,345 629,749 628,966 783 Operating costs 22,476 31,772 31,423 349 Information technology costs Capital acquisitions
Justice of the Peace Precinct #2: Salaries and personnel costs 552,434 550,700 550,337 363 Operating costs 19,969 31,658 31,658
Justice of the Peace Precinct #3: Salaries and personnel costs 645,553 633,213 631,493 1,720 Operating costs 11,790 24,130 23,023 1,107
Justice of the Peace Precinct #4: Salaries and personnel costs 556,515 540,977 540,935 42 Operating costs 12,649 23,487 23,000 487
Bail Bond Board: Salaries and personnel costs 93,018 91,675 90,625 1,050 Operating costs 3,551 5,669 5,596 73 Information technology costs 70 70 55 15

73
FORT BEND COUNTY, TEXASSCHEDULE OF REVENUES, EXPENDITURES, AND CHANGES page 6 of 10
IN FUND BALANCE - BUDGET AND ACTUALGENERAL FUND - BUDGETARY BASISFor the Year Ended September 30, 2017
Actual VarianceAmounts from Final
Original Final Budgetary PositiveBudget Budget Basis (Negative)
District Attorney: Salaries and personnel costs 10,831,240 10,571,321 10,570,574 747 Operating costs 663,697 635,505 631,902 3,603 Information technology costs 17,418 17,418 16,764 654 Capital acquisitions 17,900 17,900 16,550 1,350
Public Defender - Mental Health: Salaries and personnel costs 815,296 791,213 790,295 918 Operating costs 409,854 38,568 38,536 32 Information technology costs 750 1,100 993 107
District Judges Fees/Services: Operating costs 2,915,104
Sheriff Detention Operating: Salaries and personnel costs 24,653,489 24,233,428 24,230,149 3,279 Operating costs 6,615,276 7,362,457 7,361,702 755 Information technology costs 53,060 50,060 49,953 107 Capital acquisitions 159,121 88,121 87,605 516
Sheriff - Bailiffs: Salaries and personnel costs 3,153,716 3,133,314 3,133,312 2 Operating costs 60,914 117,506 116,961 545 Information technology costs 10,941 10,941 10,447 494
240th,400th Dist Ct Assoc Jdg:Salaries and personnel costs 256,315 263,187 260,576 2,611 Operating costs 11,784 17,388 14,790 2,598 Information technology costs 264 264 9 255
Indigent Defense Program: Salaries and personnel costs 230,032 224,866 224,379 487 Operating costs 60,592 56,022 55,535 487 Information technology costs 805 802 3
Behavioral Health Services: Salaries and personnel costs 506,601 490,527 490,462 65 Operating costs 12,256 22,220 21,660 560 Information technology costs 1,415 1,415 1,274 141
268th,434th Dist Ct Assoc Jdg: Salaries and personnel costs 256,457 267,028 265,755 1,273 Operating costs 18,699 21,351 20,510 841 Information technology costs 1,601 1,643 1,635 8
Courts AdministrationSalaries and personnel costs 160,506 55,035 54,826 209 Operating costs 12,910 14,041 13,509 532 Information technology costs 2,412 2,412 1,721 691
Associate County Court at Law ASalaries and personnel costs 250,453 258,438 258,435 3 Operating costs 15,615 16,184 14,511 1,673
Associate County Court at Law ASalaries and personnel costs 246,925 219,035 216,892 2,143 Operating costs 16,818 17,918 17,700 218 Information technology costs 2,799 5,853 5,162 691
Death Investigators:Salaries and personnel costs 15,536 15,535 1 Operating costs 70,100 54,070 53,210 860 Information technology costs 30 12 18
Adult Probation Operating: Salaries and personnel costs 81,984 81,718 80,108 1,610 Operating costs 79,430 64,696 64,220 476
CSR Program: Salaries and personnel costs 319,804 317,206 315,628 1,578 Operating costs 28,640 31,238 30,517 721
Drug Court - County: Operating costs 103,000 105,183 105,182 1

74
FORT BEND COUNTY, TEXASSCHEDULE OF REVENUES, EXPENDITURES, AND CHANGES page 7 of 10
IN FUND BALANCE - BUDGET AND ACTUALGENERAL FUND - BUDGETARY BASISFor the Year Ended September 30, 2017
Actual VarianceAmounts from Final
Original Final Budgetary PositiveBudget Budget Basis (Negative)
Juvenile Truancy Court: Salaries and personnel costs 310,430 126,699 126,699 Operating costs 10,400 6,420 6,069 351
Total Administration of Justice 70,219,342 70,892,424 70,809,277 83,147
Construction and MaintenanceEngineering:
Salaries and personnel costs 2,231,628 2,076,148 2,075,415 733 Operating costs 398,606 299,631 283,208 16,423 Information technology costs 20,315 9,315 8,930 385 Capital acquisitions 58,000 50,200 50,198 2
Landfill: Salaries and personnel costs 40,761 26,832 26,674 158 Operating costs 81,044 81,973 95,400 (13,427) Capital acquisitions 60,000 60,000 59,396 604
Recycling Center: Salaries and personnel costs 142,765 170,288 169,348 940 Operating costs 55,179 101,639 100,769 870 Capital acquisitions 20,000 20,000 19,244 756
Household/Ag Waste Program: Salaries and personnel costs 36,072 Operating costs 54,911 Information technology costs Capital acquisitions
Total Construction and Maintenance 3,199,281 2,896,026 2,888,582 7,444
Health and Human Services:Ambulance - EMS:
Salaries and personnel costs 12,397,269 12,545,091 12,543,854 1,237 Operating costs 1,617,449 1,843,890 1,840,240 3,650 Information technology costs 30,560 77,445 77,407 38 Capital acquisitions 1,106,700 1,070,660 1,070,659 1
Public Transportation: Operating costs 2,586,842 24,363 24,243 120
Health Department - County: Salaries and personnel costs 515,256 528,003 527,882 121 Operating costs 44,576 108,882 108,881 1 Information technology costs
Clinical Health Immunization: Salaries and personnel costs 498,968 477,139 477,092 47 Operating costs 14,766 15,683 15,670 13
Animal Control: Salaries and personnel costs 1,113,167 1,006,413 1,005,468 945 Operating costs 188,579 178,761 160,000 18,761 Information technology costs 1,078 1,078 984 94 Capital acquisitions 38,600 27,100 27,073 27

75
FORT BEND COUNTY, TEXASSCHEDULE OF REVENUES, EXPENDITURES, AND CHANGES page 8 of 10
IN FUND BALANCE - BUDGET AND ACTUALGENERAL FUND - BUDGETARY BASISFor the Year Ended September 30, 2017
Actual VarianceAmounts from Final
Original Final Budgetary PositiveBudget Budget Basis (Negative)
Health and Human Services: Salaries and personnel costs 524,499 509,701 509,656 45 Operating costs 742,707 769,815 759,372 10,443 Information technology costs 5,960 5,960
Senior Center: Salaries and personnel costs 281,490 263,489 262,953 536 Operating costs 19,468 24,829 22,851 1,978 Information technology costs
Environmental Services: Salaries and personnel costs 1,437,313 1,353,969 1,353,005 964 Operating costs 126,959 133,680 132,834 846 Information technology costs 1,483 1,483 1,471 12 Capital acquisitions 82,500 75,000 74,945 55
CIHC Coordinator - County: Salaries and personnel costs 625,646 586,358 585,639 719 Operating costs 1,570,482 1,519,187 1,513,326 5,861 Information technology costs
Social Services: Salaries and personnel costs 841,780 826,098 826,096 2 Operating costs 376,011 362,057 361,263 794 Information technology costs 2,682 2,026 656
Total Health and Welfare 26,785,200 24,341,140 24,303,498 37,642
Cooperative ServicesExtension Service:
Salaries and personnel costs 512,609 476,295 475,631 664 Operating costs 363,743 355,124 352,456 2,668 Information technology costs 400 400 384 16 Capital acquisitions
Veterans Service: Salaries and personnel costs 221,958 209,358 209,330 28 Operating costs 10,958 14,082 10,510 3,572 Information technology costs 1,200 297 903
Total Cooperative Services 1,109,668 1,056,459 1,048,608 7,851
Public SafetyCivil Service Commission:
Salaries and personnel costs 87,831 86,093 85,790 303 Operating costs 10,695 8,559 8,202 357 Information technology costs 374 374
Fire Marshal: Salaries and personnel costs 1,264,673 1,164,016 1,163,781 235 Operating costs 1,722,316 1,657,366 1,657,145 221 Information technology costs 5,476 14,623 14,010 613 Capital acquisitions 146,400 182,400 182,176 224

76
FORT BEND COUNTY, TEXASSCHEDULE OF REVENUES, EXPENDITURES, AND CHANGES page 9 of 10
IN FUND BALANCE - BUDGET AND ACTUALGENERAL FUND - BUDGETARY BASISFor the Year Ended September 30, 2017
Actual VarianceAmounts from Final
Original Final Budgetary PositiveBudget Budget Basis (Negative)
Department of Public Safety: Salaries and personnel costs 124,518 132,237 132,124 113 Operating costs 18,503 17,964 16,980 984 Information technology costs 10,693 11,193 9,338 1,855
DPS - License and Weight: Operating costs 5,673 5,673 3,597 2,076 Information technology costs 954 954 695 259
Constable Precinct #1: Salaries and personnel costs 1,661,527 1,692,210 1,691,726 484 Operating costs 274,587 152,545 150,906 1,639 Information technology costs 400 288 112 Capital acquisitions 219,600 203,400 203,400
Constable Precinct #2: Salaries and personnel costs 1,664,051 1,631,602 1,631,602 Operating costs 224,223 182,098 176,062 6,036 Information technology costs 900 396 504 Capital acquisitions 73,200 67,900 67,645 255
Constable Precinct #3: Salaries and personnel costs 1,128,621 1,095,887 1,095,881 6 Operating costs 155,021 137,246 136,840 406 Information technology costs 930 1,254 1,223 31 Capital acquisitions 26,097 31,797 31,576 221
Constable Precinct #4: Salaries and personnel costs 1,169,565 1,144,990 1,144,986 4 Operating costs 174,925 128,967 128,138 829 Information technology costs 1,100 523 577 Capital acquisitions 73,200 67,800 67,800
Sheriff Enforcement Operating: Salaries and personnel costs 32,081,642 30,872,554 30,871,954 600 Operating costs 4,517,511 3,742,730 3,716,062 26,668 Information technology costs 232,075 130,660 127,948 2,712 Capital acquisitions 2,217,412 1,698,380 1,729,856 (31,476)
Commissary Administration:Operating costs 6,391 6,390 1
Emergency Management - County: Salaries and personnel costs 618,177 593,354 593,006 348 Operating costs 115,298 106,057 103,220 2,837 Information technology costs 300 4,830 2,392 2,438 Capital acquisitions
Total Public Safety 50,025,694 46,976,504 46,954,032 22,472

77
FORT BEND COUNTY, TEXASSCHEDULE OF REVENUES, EXPENDITURES, AND CHANGES page 10 of 10
IN FUND BALANCE - BUDGET AND ACTUALGENERAL FUND - BUDGETARY BASISFor the Year Ended September 30, 2017
Actual VarianceAmounts from Final
Original Final Budgetary PositiveBudget Budget Basis (Negative)
Parks and RecreationFairgrounds:
Salaries and personnel costs 557,699 530,270 530,149 121 Operating costs 127,385 122,834 120,870 1,964 Information technology costs Capital acquisitions 77,000 167,450 167,450
Jones Creek Ranch: Salaries and personnel costs 439,164 402,392 402,198 194 Operating costs 107,910 95,267 93,211 2,056 Information technology costs 5,930 5,930 3,074 2,856 Capital acquisitions 24,500 44,675 57,321 (12,646)
Parks Department: Salaries and personnel costs 1,358,342 1,282,015 1,279,595 2,420 Operating costs 656,639 612,737 608,027 4,710 Information technology costs Capital acquisitions 52,700 52,700 51,999 701
Total Parks and Recreation 3,407,269 3,316,270 3,313,894 2,376 Libraries and EducationCounty Library Operating:
Salaries and personnel costs 12,363,632 11,734,726 11,728,872 5,854 Operating costs 3,521,292 3,784,853 3,784,499 354 Information technology costs 221,941 310,352 306,901 3,451 Capital acquisitions 211,184 125,603 254,495 (128,892)
Total Libraries and Education 16,318,049 15,955,534 16,074,767 (119,233)
Total Expenditures 245,479,227 225,497,402 225,076,044 421,375
Excess of Revenues Over Expenditures 8,168,975 28,375,835 36,331,394 7,955,559
Other Financing (Uses)Transfers (out) (15,677,684) (14,436,628) (14,282,458) 154,170 Total Other Financing (Uses) (15,677,684) (14,436,628) (14,282,458) 154,170
Net Change in Fund Balance-Budgetary Basis (7,508,709) 13,939,207 22,048,936 8,109,729
Net Adjustment to ReflectOperations in Accordancewith GAAP (a) (8,338,791)
Fund Balance, Beginning of Year 46,688,474 46,688,474 46,688,474 Fund Balance, End of Year 39,179,765$ 60,627,681$ 60,398,619$ 8,109,729$
(a) See reconciliation on page 81.

78
FORT BEND COUNTY, TEXAS NOTES TO BUDGETARY REQUIRED SUPPLEMENTARY INFORMATION For the Year Ended September 30, 2017 Budgets Formal budgets are legally adopted on a GAAP basis for the General Fund, certain Special Revenue Funds and all Debt Service Funds except for the Fort Bend Parkway Road District Unlimited Tax Bonds Debt Service Fund. The debt service requirements relating to the Parkway bonds are funded solely from property taxes levied on property within the Road District. The County does not present any major Special Revenue Funds as of September 30, 2017, regardless of whether there is a legally adopted budget. Formal budgets (annualized budgeting) are not adopted in the Capital Projects Funds. Effective budgetary control in those funds is achieved through individual project budgeting in conformance with the provisions of bond orders and other sources. The County Budget Officer prepares the proposed budget and submits the data to the Commissioners Court. A public hearing is held on the budget before finalizing it. The Court may increase or decrease the amounts requested by the departments. In the final budget, which is usually adopted in the last quarter of the year, appropriations of the budgeted funds cannot exceed the available fund balances in such funds at October 1, plus the estimated revenues for the ensuing year. During the year, the Court may increase budgeted revenues and expenditures for unexpected revenues or beginning fund balances in excess of budget estimates, provided the Court rules that a state of emergency exists. The legal level of budgetary control takes place at the major operating group level within each department. The four major operating groups are: salary and personnel costs, operating and training costs, information technology costs, and capital acquisition costs. Budgetary transfers between major operating groups within each department require Commissioners Court approval. Amounts reported in the accompanying financial statements represent the original budgeted amount plus all supplemental appropriations. Budgetary Basis
Fort Bend County budgets for operational and capital activity through the fiscal year budget process for the General Fund, Road & Bridge, Drainage, and Debt Service Fund. The General Fund includes a multi-year budget that is not confined to the fiscal year ending September 30. This multi-year budget is used to account for capital projects, grants, and other activity expanding beyond the fiscal year. The funding for these projects and grants originates from a prior or current fiscal year budget allocation that is then transferred to the multi-year project budget. The following schedule shows a reconciliation of the actual activity in the General Fund in the fiscal year from a budgetary to GAAP basis.

79
FORT BEND COUNTY, TEXAS NOTES TO BUDGETARY REQUIRED SUPPLEMENTARY INFORMATION (continued) For the Year Ended September 30, 2017
Actual Amounts Actual AmountsBudgetary Actual GAAP
Basis Multi-Year BasisGeneral FundRevenues 261,407,438$ 36,104,517$ 297,511,955$ Expenditures 225,076,044 49,678,093 274,754,137 Excess (Deficiency) of Revenues
Over (Under) Expenditures 36,331,394 (13,573,576) 22,757,818
Other Financing Sources (Uses)Transfers in 5,234,785 5,234,785 Transfers (out) (14,282,458) (14,282,458) Total Other Financing Sources (Uses) (14,282,458) 5,234,785 (9,047,673)
Net Change in Fund Balance 22,048,936 (8,338,791) 13,710,145 Fund Balance, Beginning of Year 46,688,474 Fund Balance, End of Year 60,398,619$
Excess of Expenditures over Appropriations For the year ended September 30, 2017, significant variances where expenditures exceeded appropriations in the following budget categories are detailed below:
General Fund:Construction and Maintenance
Operating Costs 13,427$
Parks and RecreationCapital acquisition 12,646
Libraries and EducationCapital acquisition 128,892
Landfill Operating expenditures exceeded appropriations due to unplanned landfill maintenance. Jones Creek Ranch Park and County Library capital acquisitions exceeded appropriations due to reclassification of capital expenditures that should have been capitalized. Procedures have been put in place to prevent these occurrences in the future.

80
FORT BEND COUNTY, TEXAS REQUIRED PENSION SUPPLEMENTARY INFORMATION SCHEDULE OF FUNDING PROGRESS TEXAS COUNTY AND DISTRICT RETIREMENT SYSTEM September 30, 2017 FORT BEND COUNTY, TEXASTEXAS COUNTY AND DISTRICT RETIREMENT SYSTEM (UNAUDITED)Schedule of Changes in Net Pension Liability and Related RatiosLast Three Measurement Years
2016 2015 2014Total pension liability:
Service cost 19,342,565$ 17,634,188$ 16,523,133$ Interest on total pension liability 44,158,326 41,231,027 38,158,329 Effect of plan changes (3,757,840) Effect of assumptions changes or inputs 5,221,392 Effect of economic/demographic gains or losses (838,894) (4,826,769) (317,076) Benefit payments, including refunds of employee contributions (20,403,337) (18,596,903) (16,821,825) Net change in total pension liability 42,258,660 36,905,095 37,542,561
Total pension liability - Beginning of Year 545,684,579 508,779,484 471,236,923
Total pension liability - End of Year (a) 587,943,239$ 545,684,579$ 508,779,484$
Plan fiduciary net position:Member contributions 9,752,784$ 8,950,888$ 8,374,898$ Employer contributions 16,407,504 15,499,968 14,592,621 Net investment income 35,146,589 (3,695,830) 29,818,164 Benefit payments, including refunds of employee contributions (20,403,337) (18,596,903) (16,821,825) Administrative expenses (382,614) (341,868) (351,781) Other (833,565) (697,460) (187,536) Net change in plan fiduciary net position 39,687,361 1,118,795 35,424,541
Plan fiduciary net position - Beginning of Year 475,095,562 473,976,767 438,552,226
Plan fiduciary net position - End of Year (b) 514,782,923 475,095,562 473,976,767
Net pension liability - End of Year (a) - (b) 73,160,316$ 70,589,017$ 34,802,717$
Plan fiduciary net position as a percentage of total pension liability 87.56% 87.06% 93.16%
Covered employee payroll (measurement year) 139,138,120$ 127,676,972$ 119,513,775$
Net pension liability as a percentage of covered employee payroll 52.58% 55.29% 29.12%
Note: GASB 68 requires 10 years of net pension liability and related ratios information. This information is not available and has not been calculated prior to the first measurement year ended December 31, 2014. In the future, such information will be used to populate this schedule as it becomes available.

81
FORT BEND COUNTY, TEXAS REQUIRED PENSION SUPPLEMENTARY INFORMATION SCHEDULE OF FUNDING PROGRESS TEXAS COUNTY AND DISTRICT RETIREMENT SYSTEM September 30, 2017 TEXAS COUNTY AND DISTRICT RETIREMENT SYSTEM (UNAUDITED)Schedule of ContributionsLast Ten Fiscal Years
Year ending September 30
Actuarially determined contribution
Actual contributions
Contribution deficiency (excess)
Covered employee
payroll
2017 17,706,379$ 17,706,379$ 148,617,583$ 11.9%2016 16,282,073 16,282,073 141,373,051 11.5%2015 15,237,042 15,237,042 125,320,314 12.2%2014 14,139,360 14,139,360 117,481,100 12.0%2013 12,681,672 12,681,672 110,913,229 11.4%2012 12,127,523 12,127,523 110,352,543 11.0%2011 11,418,711 11,418,711 106,734,729 10.7%2010 11,235,138 11,235,138 105,310,643 10.7%2009 10,187,718 10,187,718 99,913,522 10.2%2008 9,110,858 9,110,858 89,502,142 10.2%
Contributions as a percentage of covered
employee payroll

82
FORT BEND COUNTY, TEXAS NOTES TO PENSION REQUIRED SUPPLEMENTARY INFORMATION For the Year Ended September 30, 2017
Actuarial Cost Method Entry Age
Amortization Method Level percentage of payroll, closed
Remaining Amortization Period 13.9 years (based on contribution rate calculated in 12/31/2016 valuation)
Asset Valuation Method 5-year smoothed market
Inflation 3.00%
Salary Increases Varies by age and service. 4.9% average over career including inflation.
Investment rate of Return 8.00%, net of investment expenses, including inflation
Retirement Age Members who are eligible for service retirement are assumed to commence receiving benefit payments based on age. The average age at service retirement for recent retirees is 61.
Mortality In the 2015 actuarial valuation, assumed life expectancies were adjusted as a result of adopting a new projection scale (110% of the MP-2014 Ultimate Scale) for 2014 and later. Previously Scale AA had been used. The base table is the RP-2000 table projected with Scale AA to 2014.
Changes in Plan Provisions Reflected in the Schedule of Employer Contributions
2015: No changes in plan provisions.2016: No changes in plan provisions.
Methods and assumptions used to determine contribution rates:

83
FORT BEND COUNTY, TEXAS REQUIRED OTHER POST EMPLOYMENT BENEFIT SUPPLEMENTARY INFORMATION SCHEDULE OF FUNDING PROGRESS FORT BEND COUNTY EMPLOYEE BENEFIT PLAN September 30, 2017
Unfunded UAAL asActuarial Actuarial Actuarial Actuarial % of Valuation Value of Discount Accrued Liability Accrued Liability Funded Covered Covered
Date Assets (a) Rate ("AAL") (b) ("UAAL") (b-a) Ratio (a/b) Payroll Payroll
10/1/2007 $ 0 4.0% $ 207,157,655 $ 207,157,655 0.0% $ 92,096,921 224.9%10/1/2009 $ 0 4.0% $ 240,282,297 $ 240,282,297 0.0% $ 104,983,019 228.9%10/1/2011 $ 0 4.0% $ 255,897,447 $ 255,897,447 0.0% $ 108,712,740 235.4%10/1/2013 $ 0 4.0% $ 283,630,840 $ 283,630,840 0.0% $ 112,043,745 253.1%10/1/2015 $ 0 4.0% $ 350,708,226 $ 350,708,226 0.0% $ 127,676,972 274.7%
Note: Actuarial information is only available for Fort Bend County back to fiscal year 2008, the year that the County implemented GASB 45.

84

85
Other Supplementary Information

86

87
Combining and Individual Fund
Statements and Schedules

88

89
FORT BEND COUNTY, TEXAS NON-MAJOR FUND DESCRIPTIONS
Special Revenue Funds Fort Bend County Assistance Districts This fund is used to account for the receipts and disbursements of the Fort Bend County Assistance Districts. Revenues are derived mainly from sales tax. These funds are restricted by state statute. This includes Funds 130, 131, 133, 134, 135, 136, 137, 138, 139 and 140. Fort Bend County ESD 100 Agreement This fund is used to account for the receipts and disbursements from the sales tax allocation derived from the agreement with the Fort Bend County Emergency Services District 100; the term of the agreement is 15 years beginning with Calendar 2010 and extending through Calendar 2025. The District is a political subdivision of Texas that is entrusted with providing emergency medical and fire services to within its District boundaries. These funds are restricted by the interlocal agreement for capital mobility improvements along FM 1093 within the District, to promote efficient traffic flow and enhanced safety of the citizens traveling through the District. This includes Fund 145. Juvenile Operations This fund is used to account for the receipts and disbursements of the Fort Bend County Juvenile Probation Department. Monies deposited into this fund are received from the Fort Bend County General Fund as well as various state and federal agencies. These funds are restricted for the support of juvenile probation pursuant to state statutes and granting agencies with the exception of the nonspendable portion of fund balance which is due to prepaid items. This includes Fund 150. Road and Bridge This fund is used to account for the costs associated with the construction and maintenance of roads and bridges. Revenues are derived mainly from ad-valorem taxes, intergovernmental revenues, and fees and fines. These funds are restricted pursuant to state statute with the exception of the nonspendable portion of fund balance which is due to prepaid items. This includes Fund 155. Drainage District This fund is used to account for the receipts and disbursements related to the reclamation and drainage of lands located within the County. Revenues are derived mainly from ad-valorem taxes. These funds are restricted pursuant to state statute with the exception of the nonspendable portion of fund balance which is due to prepaid items. This includes Fund 160. Lateral Road This fund is used to account for the receipts and disbursements of funds received from the State that are restricted for constructing new County roads and maintaining existing ones. These funds are restricted pursuant to state statute. This includes Fund 165. County Historical Commission This fund is used to account for funds donated to the County by private citizens and is restricted for spending on Texas historical markers. These funds are restricted pursuant to donor requirements. This includes Fund 170. Utility Assistance This fund is used to account for the receipts and disbursements related to private and public donations made to Fort Bend County. The monies are restricted for assisting Fort Bend County residents that demonstrate an inability to pay their various utility bills. These funds are restricted pursuant to grant and donor requirements. This includes Funds 175, 185, and 190.

90
FORT BEND COUNTY, TEXAS NON-MAJOR FUND DESCRIPTIONS (continued)
Special Revenue Funds (continued)
County Law Library The law library fund was created by Commissioners Court pursuant to Article 1702h, Revised Texas Civil Statutes, for the establishment and maintenance of the County Law Library. Revenues are derived from law library fees assessed against each civil case filed in the County Court, County Court-at-Law, and the District Courts, except tax lawsuits. These funds are restricted pursuant to state statute with the exception of the nonspendable portion of fund balance which is due to prepaid items. This includes Fund 195. Gus George Law Academy This fund is used to account for the transactions of the school operations of the County Law Enforcement Academy. The program is mainly funded from reimbursements from the State via the Houston-Galveston Area Council. These funds are restricted pursuant to grant requirements with the exception of the nonspendable portion of fund balance which is due to prepaid items. This includes Fund 200. Library Donations This fund is used to account for donations by private citizens, which are used for the purchase of books and equipment for the County library system. These funds are restricted pursuant to donor requirements. This includes Fund 215. Probate Court Training This fund is used to account for the collection of certain probate fees, which are restricted for the use of continuing education of the probate staff pursuant to state statute. This includes Fund 235. Juvenile Alert Program This fund is used to account for fees collected from the parent, guardian, or custodian of a juvenile who participates in the alternative rehabilitation program administered by Juvenile Probation. These funds are restricted pursuant to state statute. This includes Fund 245. Juvenile Probation Special This fund is used to account for fees collected from the parent, guardian, or custodian of a juvenile who by order of a court, is required to pay the fee. The fees collected may only be used for juvenile probation or correction services or facilities. These funds are restricted pursuant to state statute. This includes Fund 250. District Attorney Bad Check Collection Fee This fund is used to account for the fees earned by the District Attorney for the collection of bad checks issued in the County. The District Attorney has the sole discretion to dispose of the fees. These funds are restricted pursuant to state statute. This includes Fund 260. Gus George Memorial This fund is used to account for the receipts and disbursements of funds that were donated to the County in memory of the late Gus George, former County Sheriff. The funds are restricted for law enforcement activities of the Sheriff's department pursuant to donor requirements. This includes Fund 265.
District Attorney Special Fun Run This fund is used to account for receipts and disbursements from proceeds of an annual fun run sponsored by local merchants through the District Attorney's office. The money is disbursed to Crime Victims Alliance Corporation with Commissioners Court approval. These funds are restricted pursuant to donor requirements. This includes Fund 275.

91
FORT BEND COUNTY, TEXAS NON-MAJOR FUND DESCRIPTIONS (continued)
Special Revenue Funds (continued) County Attorney Salary Supplement This fund is used to account for funds received from the State to supplement the salary of the County Attorney and staff. These funds are restricted pursuant to state statute. This includes Fund 280. Records Management - County This fund is used to account for fees assessed and collected in criminal cases to fund records management and preservation services performed by the County. These funds are restricted pursuant to state statute. This includes Fund 285. VIT Interest This fund is used to account for interest earned on prepayments of vehicle inventory taxes by automobile dealers. The money is held in an escrow bank account by the Tax Collector and the interest is used by the Tax Collector to defray the costs of administration. These funds are restricted pursuant to state statute. This includes Fund 290. Elections Contract This fund is used to account for receipts and expenditures related to money paid to the County Election Officer under an election services contract. As per Section 31.093, Texas Election Code the fund is administered by the Elections Administrator and audited by the County Auditor. These funds are restricted pursuant to state statute. This includes Fund 300. Asset Forfeitures This fund is used to account for the receipts and disbursements of funds awarded by the courts and confiscated from drug traffickers. These forfeitures are restricted for expenditures to deter drug trafficking activities in the County. These funds are restricted pursuant to state statute. This includes Funds 225, 255, 305, 310, 315, 320, 332, and 335. County Child Abuse Prevention This fund is used to account for fees collected by the County which are used to fund child abuse prevention programs in the County where the court is located. These funds are restricted pursuant to donor requirements. This includes Fund 355. Law Enforcement Officer’s Standards Education Grant This fund is used to account for funds provided to law enforcement officers for Texas Certified Law Enforcement Officers Standard Education certification that are restricted to be used for education and training. These funds are restricted pursuant to grant requirements. This includes Fund 360. Juvenile Title IV-E Foster Care This fund is used to account for federal funds received for eligible juvenile probation children and for administrative costs related to administering the Title IV-E program. These funds are restricted pursuant to grant requirements. This includes Fund 385. Child Protective Services This fund is used to account for all monies received by Children’s Protective Services (“CPS”). CPS receives money from the County, the State, and from other miscellaneous sources. These funds are restricted pursuant to donor and grant requirements. This includes Fund 390.

92
FORT BEND COUNTY, TEXAS NON-MAJOR FUND DESCRIPTIONS (continued)
Special Revenue Funds (continued)
Community Development Combined Funds This fund is used to account for monies received from various housing programs. The majority of monies is received from the U.S. Department of Housing and Urban Development (“HUD”) and is to be used for housing rehabilitation projects. The nonspendable portion of fund balance is due to prepaid items. This includes Fund 400. HOPE 3 Implementation and Program Sales These funds are used to account for the Hope 3 Planning Grant money received from the U.S. Department of Housing and Urban Development (“HUD”) to develop a home ownership program for low and moderate income families. These funds are restricted pursuant to grant requirements. This includes Fund 402. Child Support Title IV-D Reimbursement This fund is used to account for monies received for processing child support payments. The amount of receipts depends on the number of child support payments processed. Expenditures from this fund are used for salaries, equipment and other costs related to the processing of child support payments. These funds are restricted pursuant to grant requirements. This includes Fund 410. Local Law Enforcement Block Grants These funds are used to account for federal funds that are to be used by county law enforcement agencies for the purpose of purchasing technological equipment and to assist the agencies in their overall operations. These funds are restricted pursuant to grant requirements. This includes Fund 415. Juvenile Justice Alternative Education This fund is used to account for amounts received to be used as start-up costs for a juvenile justice alternative education program. If funding exceeds start-up costs, the excess may be used for other costs incurred in operating the program. These funds are restricted pursuant to state statute. This includes Fund 425. Juvenile Probation - State Funds This fund is used to account for revenues received from the Texas Juvenile Justice Department ("TJJD"). The funds must be disbursed and restricted for use in accordance with TJJD regulations. This includes Fund 430. CSCD – Pre-trial Bond This fund is used to account for fees collected by the County from defendants participating in the pre-trial bond supervision program. The collected fees are used for costs associated with administering the program. These funds are restricted pursuant to state statute. This includes Fund 452. Adult Probation - State Funds This fund is used to account for revenues received from the Texas Department of Criminal Justice - Criminal Justice Assistance Division (“TDCJ-CJAD”), as well as probation fees collected by the Fort Bend County Community Supervision & Corrections Department (“CSCD”). The funds are disbursed and restricted in accordance with TDCJ-CJAD regulations. This includes Funds 440, 441, 442, 443, 444, 445, 447, 448, 450, 451, 453 and 454.

93
FORT BEND COUNTY, TEXAS NON-MAJOR FUND DESCRIPTIONS (continued)
Special Revenue Funds (continued) Fort Bend County Historical Commission This fund is used to account for funds donated for the purpose of encouraging and assisting historical awareness and appreciation within Fort Bend County. The commission maintains a survey of the county’s historical buildings, sites, cemeteries, archeological sites and other historic features within the county and assists and advises in the application process for Texas historical markers. This fund includes Fund 207. East Fort Bend County Development Authority This fund is used to account for the operating activity of the Authority. These funds are restricted pursuant to state statute with the exception of the nonspendable portion of fund balance which is due to prepaid items.
Internal Service Funds Employee Benefits This fund is used to account for allocations from various County budgets and employee contributions to administer the self-funded medical/dental benefits plan. This includes Fund 850. Other Self-Funded Insurance This fund is used to account for allocations from various County budgets to administer the self-funded pool for the administration of workers' compensation, property and casualty insurance, and unemployment insurance. Unemployment insurance is administered through Texas Association of Counties’ self-funded consortium. This includes Fund 855.
Fiduciary Funds Agency Funds These funds are used to account for collections and disbursements of court costs, fees, fines, and other funds due to other entities for which the County serves as the fiscal agent.

94
FORT BEND COUNTY, TEXASCOMBINING BALANCE SHEETNON-MAJOR SPECIAL REVENUE FUNDSSeptember 30, 2017
FBC Assistance Districts
FBC ESD 100 Agreement
Juvenile Operations
Road and Bridge
AssetsCash and cash equivalents 20,783,996$ 4,819,750$ 4,039,195$ 10,606,519$ Taxes receivable, net 1,208,056 687,953Grants receivable 14,156Other receivables 375,471 10,972 1,592,898Due from component units 14,000Prepaid items 725
Total Assets 21,992,052$ 5,195,221$ 4,065,048$ 12,901,370$
Liabilities and Fund BalancesLiabilities
Accounts payable $ $ $ $ Due to other funds 3,141,044 3,222,225Due to other governmentsUnearned revenues
Total Liabilities 3,141,044 3,222,225
Deferred Inflows of ResourcesUnavailable revenue-property taxes 687,953
Total Deferred Inflows of Resource 687,953
Fund Balances:Nonspendable 725 Restricted 21,992,052 5,195,221 923,279 8,991,192Unassigned
Total Fund Balances 21,992,052 5,195,221 924,004 8,991,192
Total Liabilities, Deferred Inflows of Resources, and Fund Balances 21,992,052$ 5,195,221$ 4,065,048$ 12,901,370$

95
page 1 of 4
Drainage District Lateral Road
County Historical
CommissionUtility
AssistanceCounty Law
LibraryGus George
Law Academy
12,696,515$ 812,494$ 4,356$ 142,151$ 1,251,957$ 504,412$ 263,251
8,615 31,567 17,930
7,300 3,64012,975,681$ 812,494$ 4,356$ 142,151$ 1,283,524$ 525,982$
$ $ $ $ $ $ 2,413,631 8,631 53,935 14,454
2,413,631 8,631 53,935 14,454
263,251263,251
7,300 3,640 10,291,499 812,494 4,356 133,520 1,229,589 507,888
10,298,799 812,494 4,356 133,520 1,229,589 511,528
12,975,681$ 812,494$ 4,356$ 142,151$ 1,283,524$ 525,982$

96
FORT BEND COUNTY, TEXASCOMBINING BALANCE SHEETNON-MAJOR SPECIAL REVENUE FUNDS (continued)September 30, 2017
Library Donations
Probate Court Training
Juvenile Alert Program
Juvenile Probation
SpecialAssets
Cash and cash equivalents 111,019$ 101,556$ 52,193$ 140,241$ Taxes receivable, netGrants receivableOther receivables 41 880 428Due from component unitsPrepaid items
Total Assets 111,060$ 102,436$ 52,193$ 140,669$
Liabilities and Fund BalancesLiabilities
Accounts payable $ $ $ $ Due to other funds 1,686Due to other governmentsUnearned revenues
Total Liabilities 1,686
Deferred Inflows of ResourcesUnavailable revenue-property taxes
Total Deferred Inflows of Resource
Fund Balances:Nonspendable Restricted 109,374 102,436 52,193 140,669Unassigned
Total Fund Balances 109,374 102,436 52,193 140,669
Total Liabilities, Deferred Inflows of Resources, and Fund Balances 111,060$ 102,436$ 52,193$ 140,669$

97
page 2 of 4
District Attorney Bad
Check Collection
FeeGus George Memorial
District Attorney
Special Fun Run
County Attorney
Salary Supplement
Records Management-
County VIT Interest
52,637$ 4,748$ 18,090$ 173,535$ 2,714,215$ 16,837$
86 70,376 5,423
52,723$ 4,748$ 18,090$ 173,535$ 2,784,591$ 22,260$
$ $ $ $ $ $ 1,703 3,319 41,194
1,703 3,319 41,194
51,020 4,748 18,090 170,216 2,743,397 22,260
51,020 4,748 18,090 170,216 2,743,397 22,260
52,723$ 4,748$ 18,090$ 173,535$ 2,784,591$ 22,260$

98
FORT BEND COUNTY, TEXASCOMBINING BALANCE SHEETNON-MAJOR SPECIAL REVENUE FUNDS (continued)September 30, 2017
Elections Contract
Asset Forfeitures
County Child Abuse
Prevention
Law Enforcement
Officers' Standards Education
GrantAssets
Cash and cash equivalents 616,233$ 1,708,814$ 16,165$ 175,143$ Taxes receivable, netGrants receivableOther receivables 4,822 10,975Due from component unitsPrepaid items 9,200
Total Assets 621,055$ 1,728,989$ 16,165$ 175,143$
Liabilities and Fund BalancesLiabilities
Accounts payable $ $ $ $ Due to other funds 18,348 41,247Due to other governmentsUnearned revenues
Total Liabilities 18,348 41,247
Deferred Inflows of ResourcesUnavailable revenue-property taxes
Total Deferred Inflows of Resource
Fund Balances:Nonspendable 9,200 Restricted 602,707 1,678,542 16,165 175,143Unassigned
Total Fund Balances 602,707 1,687,742 16,165 175,143
Total Liabilities, Deferred Inflows of Resources, and Fund Balances 621,055$ 1,728,989$ 16,165$ 175,143$

99
page 3 of 4
Juvenile Title IV-E Foster
Care
Child Protective Services
Community Development
Combined Funds
HOPE 3 Implementation
and Program Sales
Child Support Title IV-D
Reimbursement
Local Law Enforcement Block Grants
409,347$ 55,596$ $ 5,534$ 261,204$ 15,844$
22,347 213,970367 18,138 1,538
449409,347$ 78,310$ 232,557$ 5,534$ 262,742$ 15,844$
$ $ $ $ $ $ 15,226 232,557 1,176
409,347 5,534 262,742 14,668409,347 15,226 232,557 5,534 262,742 15,844
449 63,084
(449) 63,084
409,347$ 78,310$ 232,557$ 5,534$ 262,742$ 15,844$

100
FORT BEND COUNTY, TEXASCOMBINING BALANCE SHEETNON-MAJOR SPECIAL REVENUE FUNDS (continued)September 30, 2017
Juvenile Justice
Alternative Education
Juvenile Probation - State Funds
CSCD Pre-trial Bond
Adult Probation - State Funds
AssetsCash and cash equivalents $ 300,525$ 960,910$ 1,851,040$ Taxes receivable, netGrants receivable 64,523 413,614Other receivables 54,549 199,552Due from component unitsPrepaid items
Total Assets 64,523$ 714,139$ 1,015,459$ 2,050,592$
Liabilities and Fund BalancesLiabilities
Accounts payable $ $ $ $ Due to other funds 64,523 487,828 61,491 361,731Due to other governments 91,339Unearned revenues 226,311 1,597,522
Total Liabilities 64,523 714,139 61,491 2,050,592
Deferred Inflows of ResourcesUnavailable revenue-property taxes
Total Deferred Inflows of Resource
Fund Balances:Nonspendable Restricted 953,968Unassigned
Total Fund Balances 953,968
Total Liabilities, Deferred Inflows of Resources, and Fund Balances 64,523$ 714,139$ 1,015,459$ 2,050,592$

101
page 4 of 4
FBC Historical Commission
East Fort Bend County
Development Authority
Totals Non-major Special
Revenue Funds
4,220$ $ 65,426,991$ 2,159,260
728,6102,404,628
14,000 21,314
4,220$ $ 70,754,803$
$ 130,256$ 130,256$ 1,098 10,187,047
91,3392,516,124
1,098 130,256 12,924,766
951,204 951,204
21,314 56,985,102
3,122 (130,256) (127,583) 3,122 (130,256) 56,878,833
4,220$ $ 70,754,803$

102
FORT BEND COUNTY, TEXASCOMBINING STATEMENT OF REVENUES, EXPENDITURES, AND CHANGES IN FUND BALANCESNON-MAJOR SPECIAL REVENUE FUNDSFor the Year Ended September 30, 2017
FBC Assistance Districts
FBC ESD 100 Agreement
Juvenile Operations
Road and Bridge
RevenuesProperty taxes $ $ $ 13,374,578$ Sales taxes 6,858,009Fines and fees 6,919,984Intergovernmental 1,465,871 248,396 255,765Earnings on investments 204,057 46,172 89,736 186,628Miscellaneous 15,319 534,843Total Revenues 7,062,066 1,512,043 353,451 21,271,798 ExpendituresCurrent:
General administrationFinancial administrationAdministration of justice 13,946,699Construction and maintenance 3,159,845 21,962,743Health and human servicesPublic safetyLibraries and education
Capital Outlay 93,877 76,359 1,121,447Total Expenditures 3,159,845 93,877 14,023,058 23,084,190 Excess (Deficiency) of Revenues Over (Under) Expenditures 3,902,221 1,418,166 (13,669,607) (1,812,392)
Other Financing Sources (Uses)Transfers in 180,959 14,218,884Transfers (out)Total Other Financing Sources (Uses) 180,959 14,218,884
Net Change in Fund Balances 4,083,180 1,418,166 549,277 (1,812,392) Fund Balances, Beginning of Year 17,908,872 3,777,055 374,727 10,803,584
Fund Balances, End of Year 21,992,052$ 5,195,221$ 924,004$ 8,991,192$

103
page 1 of 4
Drainage District Lateral Road
County Historical
CommissionUtility
AssistanceCounty Law
LibraryGus George
Law Academy
9,552,140$ $ $ $ $ $
93,603 382,305 68,40062,635 144,802
142,310 8,050 43 946 12,112 4,784184,960 123,855
9,973,013 70,685 43 124,801 394,417 217,986
361,9267,877,427
31,538164,445
1,258,818 16,5509,136,245 31,538 361,926 180,995
836,768 70,685 43 93,263 32,491 36,991
836,768 70,685 43 93,263 32,491 36,991 9,462,031 741,809 4,313 40,257 1,197,098 474,537
10,298,799$ 812,494$ 4,356$ 133,520$ 1,229,589$ 511,528$

104
FORT BEND COUNTY, TEXASCOMBINING STATEMENT OF REVENUES, EXPENDITURES, AND CHANGES IN FUND BALANCESNON-MAJOR SPECIAL REVENUE FUNDS (continued)For the Year Ended September 30, 2017
Library Donations
Probate Court Training
Juvenile Alert Program
Juvenile Probation
SpecialRevenuesProperty taxes $ $ $ $ Sales taxesFines and fees 9,705IntergovernmentalEarnings on investments 1,287 965 517Miscellaneous 56,283 660 14,954Total Revenues 57,570 10,670 1,177 14,954 ExpendituresCurrent:
General administrationFinancial administrationAdministration of justiceConstruction and maintenanceHealth and human servicesPublic safetyLibraries and education 67,747
Capital OutlayTotal Expenditures 67,747 Excess (Deficiency) of Revenues Over (Under) Expenditures (10,177) 10,670 1,177 14,954
Other Financing Sources (Uses)Transfers inTransfers (out)Total Other Financing Sources (Uses)
Net Change in Fund Balances (10,177) 10,670 1,177 14,954 Fund Balances, Beginning of Year 119,551 91,766 51,016 125,715
Fund Balances, End of Year 109,374$ 102,436$ 52,193$ 140,669$

105
page 2 of 4
District Attorney Bad
Check Collection
FeeGus George Memorial
District Attorney
Special Fun Run
County Attorney
Salary Supplement
Records Management-
County VIT Interest
$ $ $ $ $ $
13,044 926,58517,546
47 180 1,963 18,3358,036
30,590 47 180 1,963 926,585 26,371
61,033 484,6895,084
26,669 4,200
26,669 61,033 488,889 5,084
3,921 47 180 (59,070) 437,696 21,287
3,921 47 180 (59,070) 437,696 21,287 47,099 4,701 17,910 229,286 2,305,701 973
51,020$ 4,748$ 18,090$ 170,216$ 2,743,397$ 22,260$

106
FORT BEND COUNTY, TEXASCOMBINING STATEMENT OF REVENUES, EXPENDITURES, AND CHANGES IN FUND BALANCESNON-MAJOR SPECIAL REVENUE FUNDS (continued)For the Year Ended September 30, 2017
Elections Contract
Asset Forfeitures
County Child Abuse
Prevention
Law Enforcement
Officers' Standards Education
GrantRevenuesProperty taxes $ $ $ $ Sales taxesFines and fees 1,837Intergovernmental 155,491 53,345Earnings on investments 8,082 17,845 1,677Miscellaneous 196,373 1,167,919Total Revenues 204,455 1,341,255 1,837 55,022 ExpendituresCurrent:
General administration 452,899Financial administrationAdministration of justice 77,038Construction and maintenanceHealth and human servicesPublic safety 1,350,146 27,298Libraries and education
Capital Outlay 67,421Total Expenditures 452,899 1,494,605 27,298 Excess (Deficiency) of Revenues Over (Under) Expenditures (248,444) (153,350) 1,837 27,724
Other Financing Sources (Uses)Transfers inTransfers (out)Total Other Financing Sources (Uses)
Net Change in Fund Balances (248,444) (153,350) 1,837 27,724 Fund Balances, Beginning of Year 851,151 1,841,092 14,328 147,419
Fund Balances, End of Year 602,707$ 1,687,742$ 16,165$ 175,143$

107
page 3 of 4
Juvenile Title IV-E Foster
Care
Child Protective Services
Community Development
Combined Funds
HOPE 3 Implementation and Program
Sales
Child Support Title IV-D
Reimbursement
Local Law Enforcement Block Grants
$ $ $ $ $ $
17,131 2,639,976 3,891 65,535703 2,575 408
1,900 23,403 19,734 2,663,379 6,466 65,943
6,466
179,319 2,663,37952,883
13,060 179,319 2,663,379 6,466 65,943
(159,585)
100,000
100,000
(59,585) 122,669
$ 63,084$ $ $ $ $

108
FORT BEND COUNTY, TEXASCOMBINING STATEMENT OF REVENUES, EXPENDITURES, AND CHANGES IN FUND BALANCESNON-MAJOR SPECIAL REVENUE FUNDS (continued)For the Year Ended September 30, 2017
Juvenile Justice
Alternative Education
Juvenile Probation - State Funds
CSCD Pre-trial Bond
Adult Probation - State Funds
RevenuesProperty taxes $ $ $ $ Sales taxesFines and fees 760,254 2,201,603Intergovernmental 223,940 2,412,589 3,281,886Earnings on investments 29,538Miscellaneous 7,998 12,341Total Revenues 223,940 2,412,589 768,252 5,525,368 ExpendituresCurrent:
General administrationFinancial administrationAdministration of justice 223,940 2,412,589 724,155 5,470,499Construction and maintenanceHealth and human servicesPublic safetyLibraries and education
Capital Outlay 33,100Total Expenditures 223,940 2,412,589 724,155 5,503,599 Excess (Deficiency) of Revenues Over (Under) Expenditures 44,097 21,769
Other Financing Sources (Uses)Transfers inTransfers (out) (21,769) Total Other Financing Sources (Uses) (21,769)
Net Change in Fund Balances 44,097 Fund Balances, Beginning of Year 909,871
Fund Balances, End of Year $ $ 953,968$ $

109
page 4 of 4
FBC Historical Commission
East Fort Bend County
Development Authority
Totals Non-major Special
Revenue Funds
$ $ 22,926,718$ 6,858,009
11,377,32011,048,799
8 25 778,99315,166 100,000 2,464,01015,174 100,025 55,453,849
12,052 225,100 1,235,7735,084
23,254,18133,000,015
2,874,2361,594,772
67,7472,680,632
12,052 225,100 64,712,440
3,122 (125,075) (9,258,591)
14,499,843 (21,769) 14,478,074
3,122 (125,075) 5,219,483 (5,181) 51,659,350
3,122$ (130,256)$ 56,878,833$

110
FORT BEND COUNTY, TEXASSCHEDULE OF REVENUES, EXPENDITURES, AND CHANGES
IN FUND BALANCE - BUDGET AND ACTUALROAD AND BRIDGE - BUDGETARY BASISFor the Year Ended September 30, 2017
Actual VarianceAmounts from Final
Original Final Budgetary PositiveBudget Budget Basis (Negative)
RevenuesProperty taxes 13,098,421$ 13,098,421$ 13,374,578$ 276,157$ Fines and fees 6,235,000 6,235,000 6,919,984 684,984 Intergovernmental 300,000 300,000 241,765 (58,235) Earnings on investments 50,000 50,000 186,628 136,628 Miscellaneous 310,000 310,000 534,843 224,843 Total Revenues 19,993,421 19,993,421 21,257,798 1,264,377 ExpendituresCurrent:
Salaries and personnel costs 4,024,093 9,655,489 9,649,117 6,372 Operating costs 13,247,654 12,164,773 11,915,448 249,325 Information technology costs 5,700 11,350 11,315 35 Capital acquisitions 1,006,677 986,677 985,174 1,503
Total Expenditures 18,284,124 22,818,289 22,561,054 257,235 Excess (Deficiency) of Revenues Over (Under) Expenditures 1,709,297 (2,824,868) (1,303,256) 1,521,612
Other Financing Sources (Uses)Transfers (out) (14,000) (14,000) Total Other Financing Sources (Uses) (14,000) (14,000)
Net Change in Fund Balances - Budgetary Basis 1,709,297 (2,824,868) (1,317,256) 1,507,612
Net Adjustment to Reflect Operations in Accordance with GAAP (a) (495,136)
Fund Balances, Beginning of Year 10,803,584 10,803,584 10,803,584 Fund Balances, End of Year 12,512,881$ 7,978,716$ 8,991,192$ 1,012,476$
(a) See reconciliation below.
Actual Amounts Actual AmountsBudgetary Actual GAAP
Basis Multi-Year Basis
Revenues 21,257,798$ 14,000$ 21,271,798$ Expenditures 22,561,054 523,136 23,084,190 Excess of Revenues Over
Expenditures (1,303,256) (509,136) (1,812,392)
Other Financing SourcesTransfers (out) (14,000) 14,000 Total Other Financing Sources (14,000) 14,000
Net Change in Fund Balance (1,317,256) (495,136) (1,812,392) Fund Balance, Beginning of Year 10,803,584 Fund Balance, End of Year 8,991,192$

111
FORT BEND COUNTY, TEXASSCHEDULE OF REVENUES, EXPENDITURES, AND CHANGES
IN FUND BALANCE - BUDGET AND ACTUALDRAINAGE DISTRICT - BUDGETARY BASISFor the Year Ended September 30, 2017
Actual VarianceAmounts from Final
Original Final Budgetary PositiveBudget Budget Basis (Negative)
RevenuesProperty taxes 9,428,642$ 9,428,642$ 9,552,140$ 123,498$ Fines and fees 100,000 100,000 93,603 (6,397) Earnings on investments 50,000 50,000 142,310 92,310 Miscellaneous 85,000 85,000 184,960 99,960 Total Revenues 9,663,642 9,663,642 9,973,013 309,371 ExpendituresCurrent:
Salaries and personnel costs 6,228,441 5,974,995 5,774,419 200,576 Operating costs 2,518,226 2,781,672 2,008,447 773,225 Information technology costs 21,150 21,150 14,043 7,107 Capital acquisitions 1,041,000 1,031,000 995,923 35,077
Total Expenditures 9,808,817 9,808,817 8,792,832 1,015,985 Excess (Deficiency) of Revenues Over (Under) Expenditures (145,175) (145,175) 1,180,181 1,325,356
Other Financing Sources (Uses)Transfers (out) (1,255,000) Total Other Financing Sources (Uses) (1,255,000)
Net Change in Fund Balances - Budgetary Basis (1,400,175) (145,175) 1,180,181 1,325,356
Net Adjustment to Reflect Operations in Accordance with GAAP (a) (343,413)
Fund Balances, Beginning of Year 9,462,031 9,462,031 9,462,031 Fund Balances, End of Year 8,061,856$ 9,316,856$ 10,298,799$ 981,943$
(a) See reconciliation below
Actual Amounts Actual AmountsBudgetary Actual GAAP
Basis Multi-Year Basis
Revenues 9,973,013$ $ 9,973,013$ Expenditures 8,792,832 343,413 9,136,245
Net Change in Fund Balance 1,180,181 (343,413) 836,768 Fund Balance, Beginning of Year 9,462,031 Fund Balance, End of Year 10,298,799$

112
FORT BEND COUNTY, TEXASSCHEDULE OF REVENUES, EXPENDITURES, AND CHANGES
IN FUND BALANCE - BUDGET AND ACTUALDEBT SERVICE - BUDGETARY BASISFor the Year Ended September 30, 2017
Actual VarianceAmounts from Final
Original Final Budgetary PositiveBudget Budget Basis (Negative)
RevenuesProperty taxes 44,948,638$ 44,948,638$ 46,202,479$ 1,253,841$ Intergovernmental 649,091 649,091 Earnings on investments 30,000 30,000 155,115 125,115 Miscellaneous 2,094,096 2,094,096 Total Revenues 44,978,638 44,978,638 49,100,781 4,122,143 ExpendituresDebt Service:
Principal 21,920,000 21,920,000 21,420,000 500,000 Interest and fiscal charges 18,850,363 18,850,363 18,914,424 (64,061)
Total Expenditures 40,770,363 40,770,363 40,334,424 435,939
Net Change in Fund Balances - Budgetary Basis 4,208,275 4,208,275 8,766,357 4,558,082 Fund Balances, Beginning of Year 1,086,398 1,086,398 1,086,398 Fund Balances, End of Year 5,294,673$ 5,294,673$ 9,852,755$ 4,558,082$

113
FORT BEND COUNTY, TEXASCOMBINING STATEMENT OF NET POSITION
INTERNAL SERVICE FUNDS
September 30, 2017
Employee Benefits
Other Self-Funded
Insurance Totals
AssetsCurrent Assets:
Cash and cash equivalents 8,574,735$ 5,696,824$ 14,271,559$
Due from other funds 5,380,282 829,591 6,209,873
Other receivables 1,072,679 21,860 1,094,539
Total Current Assets 15,027,696 6,548,275 21,575,971
Noncurrent Assets:
Capital assets, net of accumulated depreciation 613,415 613,415
Total Noncurrent Assets 613,415 613,415
Total Assets 15,641,111 6,548,275 22,189,386
LiabilitiesCurrent Liabilities:
Benefits payable 3,677,470 2,921,255 6,598,725
Due to other funds 913,751 251,096 1,164,847
Total Current Liabilities 4,591,221 3,172,351 7,763,572
Total Liabilities 4,591,221 3,172,351 7,763,572
Net PositionNet investment in capital assets 613,415 613,415
Unrestricted 10,436,475 3,375,924 13,812,399
Total Net Position 11,049,890$ 3,375,924$ 14,425,814$

114
FORT BEND COUNTY, TEXASCOMBINING STATEMENT OF REVENUES, EXPENSES, AND
CHANGES IN FUND NET POSITION (DEFICIT)
INTERNAL SERVICE FUNDS
For the Year Ended September 30, 2017
Employee Benefits
Other Self-Funded
Insurance Totals
Operating RevenuesCharges for services 44,700,210$ 6,102,271$ 50,802,481$
Total Operating Revenues 44,700,210 6,102,271 50,802,481
Operating ExpensesContactual services 1,292,453 1,118,037 2,410,490
Benefits provided 36,777,909 2,146,272 38,924,181
Depreciation 33,717 33,717
Total Operating Expenses 38,104,079 3,264,309 41,368,388
Operating Income (Loss) 6,596,131 2,837,962 9,434,093
Non-Operating RevenuesEarnings on investments 25,647 25,647
Total Non-Operating Revenues 25,647 25,647
Change in Net Position 6,621,778 2,837,962 9,459,740
Total Net (Deficit), Beginning of Year 4,428,112 537,962 4,966,074
Total Net Position, End of Year 11,049,890$ 3,375,924$ 14,425,814$

115
FORT BEND COUNTY, TEXASCOMBINING STATEMENT OF CASH FLOWS
INTERNAL SERVICE FUNDS
For the Year Ended September 30, 2017
Employee Benefits
Other Self-Funded
Insurance Totals
Cash Flows from Operating ActivitiesCharges for services 38,569,544$ 5,266,313$ 43,835,857$
Payment of benefits (36,027,618) (2,776,744) (38,804,362)
Payments for services (570,855) (1,290,867) (1,861,722)
Net Cash Provided by Operating Activities 1,971,071 1,198,702 3,169,773
Cash Flows from Investing Activities:Interest earned on investments 25,647 25,647
Net Cash Provided by Investing Activities 25,647 25,647
Net Increase in Cash and Cash Equivalents 1,996,718 1,198,702 3,195,420
Cash and Cash Equivalents, Beginning of Year 6,578,017 4,498,122 11,076,139
Cash and Cash Equivalents, End of Year 8,574,735$ 5,696,824$ 14,271,559$
Reconciliation of Operating Income to Net Cash
Provided by Operating ActivitiesOperating Income 6,596,131$ 2,837,962$ 9,434,093$
Adjustments to operations:
Depreciation 33,717 33,717
Change in assets and liabilities:
Decrease (Increase) in other receivables (781,210) (11,631) (792,841)
Decrease in due from other funds (5,349,456) (824,327) (6,173,783)
Increase (Decrease) in due to other funds 721,598 (172,830) 548,768
Increase (Decrease) in benefits payable 750,291 (630,472) 119,819
Total Adjustments (4,625,060) (1,639,260) (6,264,320)
Net Cash Provided by Operating Activities 1,971,071$ 1,198,702$ 3,169,773$

116
FORT BEND COUNTY, TEXASSTATEMENT OF CHANGES IN ASSETS AND LIABILITIES - AGENCY FUNDSFor the Year Ended September 30, 2017
Balances Balances10/1/16 Increases Decreases 9/30/17
AssetsCash and cash equivalents 40,588,013$ 1,704,454,693$ 1,705,697,288$ 39,345,418$ Investments 1,002,295 12 1,002,307 Miscellaneous receivables 1,008,260 1,220,839 1,791,109 437,990 Total Assets 42,598,568$ 1,705,675,544$ 1,707,488,397$ 40,785,715$
LiabilitiesDue to others 42,598,568 1,705,675,544$ 1,707,488,397$ 40,785,715Total Liabilities 42,598,568$ 1,705,675,544$ 1,707,488,397$ 40,785,715$

117
UNAUDITED STATISTICAL SECTION
This part of the County’s comprehensive annual financial report presents detailed information as a context for understanding what the information in the financial statements, note disclosures, and required supplementary information says about the government's overall financial health.
Contents Pages
Financial Trends 118-127
These schedules contain trend information to help the reader understand how the County's financial performance and well-being have changed over time.
Revenue Capacity 128-145
These schedules contain information to help the reader assess the County's most significant local revenue source, the property tax.
Debt Capacity 146-153
These schedules present information to help the reader assess the affordability of the County's current levels of outstanding debt and the County's ability to issue additional debt in the future.
Demographic and Economic Information 154-157
These schedules offer demographic and economic indicators to help the reader understand the environment within which the County's financial activities take place.
Operating Information 158-165
These schedules contain service and infrastructure data to help the reader understand how the information in the County's financial report relates to the services the County provides and the activities it performs.
Sources: Unless otherwise noted, the information in these schedules is derived from the comprehensive annual financial reports for the relevant year.

118
FORT BEND COUNTY, TEXASNET POSITION BY COMPONENT -
ACCRUAL BASIS OF ACCOUNTINGLAST TEN FISCAL YEARS(UNAUDITED)
2008 2009 2010 2011
Governmental Activities
Net investment in capital assets 617,510,083$ 679,586,900$ 714,396,078$ 742,381,602$ Restricted 19,619,706 28,484,196 27,075,799 34,045,913 Unrestricted 26,704,786 (45,217) (25,626,789) (58,294,310)
Total GovernmentalActivities Net Position 663,834,575$ 708,025,879$ 715,845,088$ 718,133,205$
Primary Government:Total Primary Government
Net Position 663,834,575$ 708,025,879$ 715,845,088$ 718,133,205$
Notes:GASB 65 was implemented in fiscal year 2013, and only fiscal year 2013 has been restated.GASB 68 was implemented in fiscal year 2015, and only fiscal year 2014 ending balances have been restated.The beginning carrying value of capital assets were restated in fiscal year 2016, and only fiscal year 2016
ending balances have been restated.
Fiscal Year

119
2012 2013 2014 2015 2016 2017
778,060,953$ 808,054,656$ 751,094,000$ 1,237,335,552$ 1,359,940,461$ 1,414,937,836$ 25,297,612 26,557,346 33,701,957 45,671,162 51,713,877 69,185,967
(87,762,987) (118,726,937) (173,039,698) (170,725,099) (199,645,451) (227,177,418)
715,595,578$ 715,885,065$ 611,756,259$ 1,112,281,615$ 1,212,008,887$ 1,256,946,385$
715,595,578$ 715,885,065$ 611,756,259$ 1,112,281,615$ 1,212,008,887$ 1,256,946,385$
Fiscal Year

120
BASIS OF ACCOUNTING
(UNAUDITED)
2008 2009 2010 2011ExpensesGovernmental Activities:
General administration 35,066,142$ 42,900,684$ 40,543,784$ 42,795,907$ Financial administration 7,581,878 8,841,189 8,059,389 9,441,048 Administration of justice 63,851,167 73,811,398 76,268,255 84,507,797 Construction and maintenance 47,535,293 47,188,776 46,946,163 45,632,055 Health and welfare 21,592,759 25,623,533 28,566,454 30,104,991 Cooperative services 1,143,390 1,188,580 1,123,951 1,177,426 Public safety 50,016,288 61,126,911 55,269,509 55,315,591 Parks and recreation 2,128,502 1,879,525 2,263,280 2,917,574 Libraries and education 12,325,097 12,956,363 13,468,700 14,800,838 Interest on long-term debt 10,621,067 12,338,352 15,494,994 14,887,908
Total Governmental Activities Expenses 251,861,583$ 287,855,311$ 288,004,479$ 301,581,135$
Program RevenuesGovernmental Activities:
Charges for services:General administration 6,962,663$ 6,991,778$ 7,023,114$ 7,054,198$ Financial administration 1,976,033 2,451,191 3,273,137 3,988,371 Administration of justice 6,692,111 6,828,228 7,032,374 7,222,932 Construction and maintenance 8,305,998 8,442,746 6,737,542 6,679,429 Health and human services 4,036,821 5,057,246 5,652,201 6,396,645 Public safety 3,946,125 4,887,245 5,060,714 5,621,993 Parks and recreation 189,273 187,724 136,864 141,893 Libraries and education 262,957 256,730 240,719 246,699
Operating grants and contributions:General administration 6,457,536 6,274,615 2,161,046 5,420,407 Administration of justice 5,924,346 7,225,796 6,679,626 7,556,661 Construction and maintenance 1,137,555 1,509,761 356,447 1,381,572 Health and human services 4,663,836 4,982,855 8,188,534 12,506,581 Cooperative services 1,936 13,136 Public safety 5,754,025 13,784,334 4,464,349 8,623,225 Parks and recreation 102,738 61,023 1,255,743 157,468 Libraries and education 141,938 97,403 194,400 174,204
Capital grants and contributions:General administrationAdministration of justice 2,934 Construction and maintenance 33,540,586 62,012,765 30,355,407 25,214,312 Health and human services 45,000 Cooperative servicesPublic safetyParks and recreationLibraries and education 1,917,000
Total Governmental ActivitiesProgram Revenues 90,096,477$ 133,013,440$ 88,828,287$ 98,386,590$
Fiscal Year
FORT BEND COUNTY, TEXASCHANGES IN NET POSITION - ACCRUAL
LAST TEN FISCAL YEARS

121
page 1 of 2
2012 2013 2014 2015 2016 2017
41,702,254$ 42,034,040$ 47,178,578$ 49,953,700$ 61,923,654$ 67,508,837$ 8,344,714 8,849,251 9,809,215 9,923,190 10,668,228 11,263,933
88,819,892 94,210,925 96,510,853 97,317,659 106,035,587 115,538,87146,468,925 50,078,091 57,430,317 80,574,657 78,151,431 124,089,22130,677,345 34,630,163 34,976,018 36,721,273 43,153,506 47,679,9071,118,341 1,067,104 1,152,222 1,150,926 1,215,874 1,210,100
54,954,201 55,866,404 58,412,120 63,537,941 64,704,958 69,963,6342,578,555 2,069,935 3,379,366 4,133,419 4,545,562 5,217,764
15,708,114 16,156,200 17,170,818 17,638,589 18,446,773 19,285,56315,037,346 15,536,759 14,836,824 14,108,075 14,960,865 16,192,299
305,409,687$ 320,498,872$ 340,856,331$ 375,059,429$ 403,806,438$ 477,950,129$
7,558,755$ 8,181,551$ 8,323,648$ 8,579,034$ 8,561,186$ 8,851,604$ 4,695,710 5,762,439 6,497,643 7,541,956 8,143,353 7,975,5767,522,930 8,918,247 8,400,556 8,485,619 8,700,278 8,566,2047,466,798 7,562,523 6,759,102 7,078,136 7,121,643 6,547,3296,138,679 7,047,993 7,371,859 7,762,002 10,263,992 9,615,4955,642,978 6,140,083 7,125,686 7,721,948 8,733,631 9,538,600
183,406 175,619 193,631 188,437 158,626 145,150269,015 279,570 276,635 280,973 288,193 261,257
4,428,089 3,597,784 3,626,019 3,849,997 4,380,173 5,450,961$ 6,560,970 8,311,676 10,213,349 10,292,737 10,823,506 10,566,287
949,663 293,441 372,129 1,713,376 390,265 4,678,76610,899,781 16,191,142 14,782,021 16,106,462 18,361,326 18,966,638
1,000 200 350 21,586 6,252,054 4,758,606 3,932,646 4,427,337 3,994,478 3,760,913
104,002 86,260 100,286 346,283 98,583 95,821438,841 64,483 69,806 104,658 46,068 62,278
2,052,920 3,500,000 89,000 175,000$ 27,234
23,872,205 28,068,322 32,683,107 32,920,374 125,334,640 120,203,650
15,32710,965 357,373 64,000 28,000
1,403,990
93,011,110$ 107,504,624$ 114,585,696$ 117,463,679$ 216,942,517$ 215,476,856$
Fiscal Year

122
BASIS OF ACCOUNTING
(UNAUDITED)
2008 2009 2010 2011Net (Expense)/RevenueGovernmental Activities (161,765,106)$ (154,841,871)$ (199,176,192)$ (203,194,545)$
Total Primary Government Net(Expense)/Revenue (161,765,106)$ (154,841,871)$ (199,176,192)$ (203,194,545)$
General Revenues and OtherChanges in Net Position
Governmental Activities:Property taxes, penalties, and interest 171,832,680$ 191,467,403$ 198,888,176$ 196,820,339$ Sales taxesEarnings on investments 8,082,178 3,664,184 3,870,155 2,925,202 Miscellaneous 3,486,452 3,901,588 4,237,069 5,954,640
Total Governmental Activities/Primary Government 183,401,310$ 199,033,175$ 206,995,400$ 205,700,181$
Change in Net Position
Total Governmental Activities/Primary Government 21,636,204$ 44,191,304$ 7,819,208$ 2,505,636$
Note: GASB 65 was implemented in fiscal year 2013, and only fiscal year 2013 has been restated.
FORT BEND COUNTY, TEXASCHANGES IN NET POSITION - ACCRUAL
LAST TEN FISCAL YEARS
Fiscal Year

123
page 2 of 2
2012 2013 2014 2015 2016 2017
(212,398,577)$ (212,994,248)$ (226,270,635)$ (257,595,750)$ (186,863,921)$ (262,473,273)$
(212,398,577)$ (212,994,248)$ (226,270,635)$ (257,595,750)$ (186,863,921)$ (262,473,273)$
199,213,697$ 207,458,672$ 222,838,642$ 264,741,926$ 270,349,769$ 288,588,8061,099,103 2,956,560 4,214,553 5,789,362 6,958,956 6,858,0092,584,776 963,652 880,712 904,359 1,761,994 3,460,5446,745,855 5,537,404 4,373,699 7,138,231 7,520,474 8,503,412
209,643,431$ 216,916,288$ 232,307,606$ 278,573,878$ 286,591,193$ 307,410,771$
(2,755,146)$ 3,922,040$ 6,036,971$ 20,978,128$ 99,727,272$ 44,937,498$
Fiscal Year

124
FORT BEND COUNTY, TEXASFUND BALANCES OF GOVERNMENTAL FUNDS -
MODIFIED ACCRUAL BASIS OF ACCOUNTINGLAST TEN FISCAL YEARS(UNAUDITED)
Fiscal Year2008 2009 2010
General FundReserved:
Prepaid Items 197,806$ 100,233$ 111,184$ Unreserved 38,547,536 34,463,474 43,269,189 Total General Fund 38,745,342$ 34,563,707$ 43,380,373$
All Other Governmental FundsReserved:
Debt service 4,370,499$ 6,057,482$ 4,849,712$ Prepaid items 7,879 11,224 4,305 Capital projects 106,937,644 154,475,649 76,694,711
Unreserved, reported in:Special revenue funds 15,585,100 23,120,456 22,906,854 Capital project funds 4,857,926
Total All Other Governmental Funds 131,759,048$ 183,664,811$ 104,455,582$
2011 2012 2013 2014General Fund
Nonspendable 136,007$ 36,826$ 1,233,591$ 386,965$ Restricted 246,021 277,783 209,080 Committed 33,106,759 24,179,874 22,857,602 22,676,941 Unassigned 10,816,215 11,563,846 13,037,646 14,251,514
Total General Fund 44,058,981$ 36,026,567$ 37,406,622$ 37,524,500$
All Other Governmental FundsNonspendable 69,379$ 54,201$ 10,963$ 45,408$ Restricted 39,683,423 78,702,294 55,371,174 41,583,667 Unassigned (4,419,144) (1,663) (3,169)
Total All Other Governmental Funds 35,333,658$ 78,756,495$ 55,380,474$ 41,625,906$
Note:In 2011, the County implemented GASB 54, under which governmental fund balances are reported asnonspendable, restricted, committed, assigned, and unassigned, compared to reserved and unreserved.The County has not restated prior years.
Fiscal Year

125
Fiscal Year2015 2016 2017
359,792$ 270,023$ 152,920$ 217,488 257,923 3,736,150
14,766,773 8,278,285 11,792,299 30,590,003 37,882,243 44,717,250 45,934,056$ 46,688,474$ 60,398,619$
44,468$ 28,044$ 21,314$ 584,412,209 142,212,451 143,745,555
(1,883) (12,510) (127,583) 584,454,794$ 142,227,985$ 143,639,286$

126
FORT BEND COUNTY, TEXASCHANGES IN FUND BALANCES, GOVERNMENTAL FUNDS -
MODIFIED ACCRUAL BASIS OF ACCOUNTINGLAST TEN FISCAL YEARS(UNAUDITED)
2008 2009 2010 2011RevenuesProperty taxes 173,947,606$ 190,558,904$ 199,229,197$ 197,406,898$ Sales taxes (a)Fees and fines 28,948,356 34,591,324 35,306,339 37,371,124 Intergovernmental 27,189,804 35,910,436 28,400,145 36,971,987 Earnings on investments 7,875,929 3,509,046 3,744,027 2,798,039 Miscellaneous 5,397,431 8,396,202 7,256,967 6,635,261 Total Revenues 243,359,126 272,965,912 273,936,675 281,183,309
ExpendituresCurrent:
General administration 37,890,706 40,284,501 42,633,073 44,312,741 Financial administration 6,330,272 7,162,814 6,725,826 7,176,186 Administration of justice 37,064,764 66,125,857 65,405,264 69,878,942 Construction and maintenance 28,584,504 30,896,400 26,775,517 29,542,425 Health and human services 20,369,042 22,539,945 21,124,782 22,067,744 Cooperative services 975,720 1,049,985 933,519 986,392 Public safety 63,081,120 44,578,722 40,895,974 44,156,502 Parks and recreation 1,739,346 1,815,986 2,231,528 2,263,590 Libraries and education 10,422,032 11,398,561 11,354,804 12,176,637
Capital Outlay 78,040,663 102,627,536 99,931,347 88,927,796 Debt Service:
Principal 8,220,000 8,305,000 8,100,000 12,590,000 Interest and fiscal charges 12,266,435 12,149,302 16,341,773 15,528,257 Bond issuance costs (b) 1,176,319 225,979 249,266
Total Expenditures 304,984,604 350,110,928 342,679,386 349,856,478 (Deficiency) of Revenues (Under) Expenditures (61,625,478) (77,145,016) (68,742,711) (68,673,169)
Other Financing Sources (Uses)Transfers in 9,569,698 23,578,390 15,248,368 14,402,786 Transfers (out) (9,569,698) (23,578,390) (15,248,368) (14,402,786) Bonds issued 119,910,000 Refunding bonds issued 2,460,000 20,780,000 9,675,000 Premium on bonds issued 5,241,474 Premium on refunding bonds issued 122,676 2,170,147 784,853 Payments to current refunding bond agent (2,865,000) (24,600,000) (10,230,000) Tax Notes issued Total Other Financing Sources (Uses) 124,869,150 (1,649,853) 229,853
Net Change in Fund Balances (61,625,478)$ 47,724,134$ (70,392,564)$ (68,443,316)$
Debt Service as a Percentage ofNoncapital Expenditures 9.03% 8.26% 10.07% 10.78%
(a) No sales taxes were collected prior to fiscal year 2012.
Fiscal Year

127
2012 2013 2014 2015 2016 2017
200,056,507$ 208,142,339$ 222,992,307$ 242,444,112$ 270,972,401$ 287,983,032$ 1,099,103 2,956,559 4,214,553 5,789,362 6,958,956 6,858,009
39,598,440 44,177,263 45,106,533 47,803,283 50,231,963 51,736,504 29,377,233 42,565,592 36,899,095 39,904,787 39,673,097 47,734,683
2,451,577 930,273 848,534 878,980 1,750,631 3,434,897 7,175,498 5,988,682 8,243,270 7,545,715 7,913,682 9,223,274
279,758,358 304,760,708 318,304,292 344,366,239 377,500,730 406,970,399
37,792,578 37,437,702 41,478,910 44,698,720 56,093,978 60,669,054 7,221,313 7,180,608 7,891,034 8,369,921 9,063,587 9,451,425
73,198,325 73,839,598 77,242,153 81,411,531 89,715,917 96,057,172 28,214,027 27,403,229 35,374,943 59,785,401 43,275,592 73,924,220 27,835,260 30,403,209 30,267,231 32,436,431 38,314,627 41,805,244
960,392 883,324 944,039 973,026 1,050,282 1,048,609 45,463,593 44,991,489 46,688,895 53,652,220 54,393,589 58,152,633
1,957,044 1,979,888 2,411,558 3,051,927 3,307,538 3,701,092 13,012,700 13,034,163 13,613,875 14,460,419 15,215,877 15,889,947 44,845,671 57,223,885 40,964,586 28,911,628 61,611,363 66,540,199
13,300,000 15,630,000 16,250,000 16,750,000 18,480,000 21,420,000 15,571,727 16,749,579 15,893,399 14,391,964 15,506,610 18,914,424
541,944 234,472 1,207,260 1,316,238 599,813 309,914,574 326,756,674 329,255,095 360,100,448 407,345,198 468,173,832
(30,156,216) (21,995,966) (10,950,803) (15,734,209) (29,844,468) (61,203,433)
13,258,127 11,521,941 11,771,144 13,517,505 13,780,670 19,734,628 (13,258,127) (11,521,941) (14,493,144) (13,517,505) (13,780,670) (19,734,628) 58,220,000 37,365,000 96,640,000 64,550,000
18,900,000 108,225,000 73,120,000 3,944,496 18,416,480 7,965,901
7,326,639 2,202,026 18,114,658 15,739,791 (21,065,913) (126,676,501) (89,544,194)
3,808,978 65,546,639 (2,685,887) 40,972,653 114,372,077 76,324,879
35,390,423$ (21,995,966)$ (13,636,690)$ 25,238,444$ 84,527,609$ 15,121,446$
10.89% 12.01% 11.15% 9.40% 9.83% 10.04%
Fiscal Year

128
FORT BEND COUNTY, TEXASASSESSED VALUE OF TAXABLE PROPERTYLAST TEN TAX YEARS(UNAUDITED)
Category 2007 2008 2009 2010Real, Residential, Single-family 26,097,453,310$ 29,960,281,188$ 29,649,115,219$ 29,993,796,370$ Real, Residential, Multi-family 724,480,330 1,036,720,280 953,747,851 970,309,935 Real, Vacant Lots/Tracts 906,501,540 1,128,365,928 1,129,570,008 1,027,648,723 Qualified Ag Land 1,619,246,573 2,622,322,905 Non-Qualified Ag Land 149,627,110 197,166,064 Real, Acreage (Land only) 2,745,455,296 2,629,194,720 Real, Farm and Ranch Improvement 298,618,116 348,641,070 330,298,802 327,283,766 Commercial Real Property 3,606,646,451 6,042,412,301 Industrial Real Property 2,431,755,890 2,512,976,750 Real, Commercial and Industrial 7,798,910,271 7,178,698,624 Oil and Gas 488,114,480 483,549,300 Real, Oil, Gas, and Other Mineral Reserves 288,530,290 319,839,370 Real & Intangible Personal, Utilities 689,009,066 721,569,810 710,328,240 689,401,553 Commercial Personal Property 1,523,192,050 1,519,692,659 Industrial Personal Property 1,810,785,110 1,888,201,580 Tangible Personal, Business 3,955,067,370 3,544,368,206 Tangible Other Personal, Mobile Homes 75,153,055 68,619,455 Tangible Other Personal, Other 65,665,620 56,722,635 Intangible Personal 9,736,015 10,051,655 Real, Inventory 1,125,116,437 1,279,793,460 1,001,220,160 788,688,120 Special Inventory 70,754,490 72,837,620 61,578,930 60,319,760 Total Exempt Property 1,876,101,450 2,349,880,727 2,559,873,420 2,751,636,029 Unidentified Category/Error 19,389,929 11,877,010 8,860
Total Assessed Value per Tax Year 43,511,945,387$ 52,244,908,107$ 51,259,097,492$ 50,347,968,326$
Source of data: Fort Bend County Central Appraisal District Certified Comptrollers Audit Report.

129
2011 2012 2013 2014 2015 201631,039,400,739$ 32,696,769,609$ 34,939,222,040$ 38,197,156,012$ 48,210,660,622$ 52,803,517,963$
985,883,440 1,038,540,000 1,223,124,193 1,492,817,879 1,825,084,868 1,905,243,783 982,287,088 961,783,939 910,690,568 854,963,794 846,058,635 893,236,838
2,536,288,590 2,535,052,048 2,405,933,092 2,455,020,886 2,375,050,069 2,807,243,913 331,068,370 348,241,112 368,553,330 380,697,030 403,688,459 417,241,559
7,050,117,340 7,134,533,264 7,241,630,477 7,759,852,998 8,082,106,852 8,843,529,264
273,529,460 333,441,300 262,592,210 256,495,180 129,149,800 41,228,090 661,509,515 615,750,037 627,521,930 754,452,129 808,967,279 781,178,457
3,611,035,498 3,599,878,815 3,979,309,449 4,181,424,859 4,239,563,234 3,934,401,978
55,860,570 55,486,280 60,883,115 62,049,925 66,002,285 66,519,420 10,398,285 10,398,285 11,233,017 13,398,220 16,435,550 19,162,420
729,776,091 730,016,310 793,911,390 999,071,390 1,082,771,520 1,221,511,856 74,140,120 84,571,490 102,899,736 109,766,186 127,126,210 136,751,320
2,782,972,308 3,243,813,982 3,558,753,941 3,677,487,845 3,808,991,325 4,471,760,395 99,060
51,124,267,414$ 53,388,276,471$ 56,486,258,488$ 61,194,654,333$ 72,021,656,708$ 78,342,626,316$

130

131
Net
Tax Fiscal Estimated Less Assessed Assessment Total Direct
Year Year Actual Value Exemptions Value Ratio Tax Rate2007 2008 40,030,188,967$ 6,548,855,518$ 33,481,333,449$ 83.6% 0.51674$
2008 2009 45,414,424,927 7,350,144,660 38,064,280,267 83.8% 0.49976
2009 2010 46,004,789,281 7,599,334,136 38,405,455,145 83.5% 0.49976
2010 2011 45,090,492,561 7,722,448,765 37,368,043,796 82.9% 0.499762011 2012 45,964,582,256 7,930,095,144 38,034,487,112 82.7% 0.49976
2012 2013 47,665,443,449 8,225,496,395 39,439,947,054 82.7% 0.49976
2013 2014 50,586,160,527 8,608,492,257 41,977,668,270 83.0% 0.48476
2014 2015 54,808,002,219 9,231,100,402 45,576,901,817 83.2% 0.47276
2015 2016 64,167,624,512 10,809,541,312 53,358,083,200 83.2% 0.46500
2016 2017 78,066,394,263 19,819,181,840 58,247,212,423 74.6% 0.46500
Source of data: Fort Bend County Central Appraisal District.
FORT BEND COUNTY, TEXASASSESSED AND ESTIMATED ACTUAL VALUE OF REAL AND
FOR THE LAST TEN FISCAL YEARS(UNAUDITED)
PERSONAL PROPERTY

132
FORT BEND COUNTY, TEXAS PROPERTY TAX RATES - DIRECT AND
OVERLAPPING GOVERNMENTSLast Ten Tax Years(UNAUDITED)
2007 2008 2009 2010
Fort Bend County 0.49874$ 0.48376$ 0.47900$ 0.48016$
Fort Bend County Drainage District 0.01800 0.01600 0.02076 0.01960
Political Subdivision: Arcola, City of 0.73000 0.95258 0.96500 0.99000 Beasley, City of 0.41687 0.44828 0.44828 0.44828 Big Oaks MUD 0.73000 0.73000 0.79000 0.79000 Blue Ridge West MUD 0.43000 0.42000 0.41500 0.41000 Brazoria-Fort Bend MUD 1 0.85000 0.85000 0.85000 0.85000 Brazos ISD **N/A 1.22000 1.36890 1.39510 Burney Road MUD 0.30000 0.30000 0.24250 0.26750 Chelford City MUD **N/A 0.43000 0.43000 0.43000 Cimarron MUD **N/A 0.58000 0.57000 0.57000 Cinco MUD 1 0.88000 0.88000 0.67500 0.64500 Cinco MUD 2 0.52000 0.50000 0.47500 0.47500 Cinco MUD 3 0.51000 0.51000 0.47000 0.47000 Cinco MUD 5 0.57500 0.57500 0.50000 0.49500 Cinco MUD 6 0.59000 0.59000 0.48000 0.48000 Cinco MUD 7 0.57500 0.57500 0.52500 0.52000 Cinco MUD 8 0.89000 0.89000 0.84000 0.85000 Cinco MUD 9 0.65000 0.37000 0.61000 0.59500 Cinco MUD 10 0.65000 0.65000 0.60000 0.61000 Cinco MUD 12 0.53000 0.53000 0.47000 0.43000 Cinco MUD 14 0.79000 0.79000 0.66000 0.63500 Cinco Southwest MUD 1 0.90000 1.50000 1.50000 1.50000 Cinco Southwest MUD 2 1.50000 1.50000 1.50000 1.50000 Cinco Southwest MUD 3 **N/A 1.50000 1.50000 1.50000 Cinco Southwest MUD 4 **N/A 1.50000 1.50000 1.50000 Cornerstone MUD **N/A 0.38000 0.37000 0.37000 Eldridge Road MUD 0.32000 0.25000 0.22000 0.08000 First Colony LID 0.19460 0.19460 0.19460 0.19460 First Colony LID 2 0.31500 0.29500 0.28500 0.27500 First Colony MUD 9 0.30000 0.29500 0.29500 0.30500 First Colony MUD 10 0.75000 0.75000 0.75000 0.49000 Fort Bend County LID 2 0.16500 0.14500 0.13400 0.13400 Fort Bend County LID 6 **N/A 0.50000 0.50000 0.50000 Fort Bend County LID 7 0.21500 0.21500 0.21500 0.21500 Fort Bend County LID 10 0.46000 0.47500 0.47500 0.47500 Fort Bend County LID 11 0.27000 0.27000 0.27000 0.28000 Fort Bend County LID 12 0.25000 0.19000 0.15000 0.14000 Fort Bend County LID 14 0.19000 0.19000 0.20000 0.20000 Fort Bend County LID 15 0.70000 0.70000 0.70000 0.80000 Fort Bend County LID 17 0.57000 0.58000 0.63000 0.63000 Fort Bend County LID 19 0.70000 0.70000 0.70000 0.80000 Fort Bend County LID 20 **N/A 0.45000 0.45000 0.45000 Fort Bend Co Management District 1 **N/A **N/A **N/A **N/A Fort Bend County MUD 1 0.65000 0.65000 0.53000 0.65000 Fort Bend County MUD 2 0.46000 0.44000 0.50000 0.54000

133
page 1 of 5
2011 2012 2013 2014 2015 2016
0.48096$ 0.48076$ 0.48476$ 0.47276$ 0.46500$ 0.46500$
0.01880 0.01900 0.01500 0.02200 0.02100 0.01600
0.95426 0.95426 0.95426 0.91000 0.91000 0.867100.49314 0.49913 0.49913 0.49913 0.49913 0.467140.79000 0.85000 0.85000 0.85000 0.79000 0.750000.41000 0.41000 0.41000 0.41000 0.42500 0.416000.90000 0.85000 0.85000 0.85000 0.85000 0.848001.43285 1.40115 1.39966 1.42172 1.42410 1.499800.26750 0.26750 0.26000 0.26000 0.25500 0.250000.43000 0.43000 0.43000 0.42500 0.42500 0.400000.57000 0.57000 0.57000 0.57000 0.42000 0.385000.59500 0.55000 0.50000 0.48000 0.44000 0.440000.47500 0.47500 0.47500 0.47000 0.45000 0.340000.48000 0.45000 0.42000 0.42000 0.40000 0.370000.49500 0.47500 0.44500 0.41500 0.38000 0.370000.48000 0.48000 0.41000 0.39500 0.35500 0.330000.49000 0.48500 0.48500 0.48000 0.46500 0.440000.59500 0.82000 0.76000 0.71000 0.64000 0.590000.59500 0.59500 0.57000 0.53000 0.43000 0.405000.59000 0.59000 0.58000 0.58000 0.53000 0.495000.43000 0.36000 0.36000 0.30000 0.27000 0.250000.59500 0.55500 0.54500 0.53500 0.52000 0.500001.50000 1.50000 1.29000 1.01000 0.90500 0.850001.50000 1.44500 1.34500 1.20000 1.04000 0.985001.50000 1.50000 1.50000 1.44000 1.03000 1.120001.50000 1.48000 1.40000 1.20000 1.03000 0.960000.36000 0.36000 0.36000 0.34000 0.33000 0.34000
**N/A **N/A **N/A **N/A **N/A **N/A0.19460 0.19460 0.15500 0.15500 0.15250 0.150000.27500 0.27500 0.27500 0.25000 0.25000 0.200000.32000 0.32000 0.31500 0.30000 0.28000 0.255000.49000 0.49000 0.47000 0.41000 0.25000 0.200000.13400 0.12900 0.12900 0.12000 0.11000 0.106700.50000 0.50000 0.50000 0.50000 0.50000 0.500000.21000 0.20500 0.20500 0.23500 0.23500 0.225000.47500 0.62000 0.62000 0.64300 0.64300 0.643000.28000 0.26000 0.25000 0.22500 0.20500 0.200000.13000 0.12500 0.12500 0.11500 0.10000 0.090000.20500 0.20500 0.20500 0.20000 0.19500 0.195000.80000 0.80000 0.80000 0.80000 0.75000 0.730000.63000 0.65000 0.65000 0.63000 0.61000 0.570000.80000 0.80000 0.80000 0.80000 0.72000 0.680000.45000 0.45000 0.55000 0.55000 0.55000 0.55000
**N/A **N/A **N/A **N/A **N/A 0.450000.65000 **N/A **N/A **N/A **N/A **N/A0.65000 0.63000 0.65000 0.68000 0.66000 0.59000

134
FORT BEND COUNTY, TEXASPROPERTY TAX RATES - DIRECT AND
OVERLAPPING GOVERNMENTSLast Ten Tax Years(UNAUDITED)
2007 2008 2009 2010Political Subdivision: (continued) Fort Bend County MUD 5 **N/A **N/A 1.50000 1.50000 Fort Bend County MUD 19 1.20000 1.20000 1.24000 1.38000 Fort Bend County MUD 21 0.39000 0.39000 0.27000 0.26000 Fort Bend County MUD 23 0.95000 0.91000 1.00000 1.03000 Fort Bend County MUD 24 1.29000 1.29000 1.29000 1.29000 Fort Bend County MUD 25 0.82000 0.82000 0.82000 0.82000 Fort Bend County MUD 26 0.72000 0.67000 0.70000 0.71000 Fort Bend County MUD 30 0.88000 0.87000 0.95000 0.98000 Fort Bend County MUD 34 0.72000 0.71000 0.71000 0.69000 Fort Bend County MUD 35 1.05000 0.89000 0.74000 0.69000 Fort Bend County MUD 37 0.59000 0.59000 0.56000 0.52000 Fort Bend County MUD 41 0.58000 0.55000 0.55000 0.55000 Fort Bend County MUD 42 0.43000 0.42000 0.42000 0.43000 Fort Bend County MUD 46 0.90000 0.90000 0.88000 0.88000 Fort Bend County MUD 47 1.09000 1.04000 1.04000 1.04000 Fort Bend County MUD 48 0.89000 0.88000 0.88000 0.88000 Fort Bend County MUD 49 0.80000 0.95000 0.95000 0.95000 Fort Bend County MUD 50 0.90000 0.90000 0.90000 0.90000 Fort Bend County MUD 57 1.50000 1.50000 1.50000 1.50000 Fort Bend County MUD 58 1.50000 1.50000 1.50000 1.50000 Fort Bend County MUD 66 1.35000 1.35000 1.35000 1.35000 Fort Bend County MUD 67 0.45000 0.47500 0.47500 0.47500 Fort Bend County MUD 68 0.40500 0.40500 0.40000 0.40000 Fort Bend County MUD 69 0.33000 0.40000 0.40000 0.40000 Fort Bend County MUD 81 0.42500 0.42500 0.38000 0.37000 Fort Bend County MUD 94 0.71000 0.71000 0.71000 0.77000 Fort Bend County MUD 106 0.47000 0.45000 0.45000 0.49000 Fort Bend County MUD 108 0.40000 0.39000 0.39000 0.42000 Fort Bend County MUD 109 0.51000 0.50700 0.58000 0.63000 Fort Bend County MUD 111 0.30000 0.30000 0.30000 0.30000 Fort Bend County MUD 112 0.39000 0.39000 0.38000 0.38000 Fort Bend County MUD 115 0.59000 0.53000 0.50000 0.50000 Fort Bend County MUD 116 1.13000 1.13000 1.22000 1.22000 Fort Bend County MUD 117 0.67000 0.66000 0.66000 0.66000 Fort Bend County MUD 118 0.89000 0.84000 0.81000 0.78000 Fort Bend County MUD 119 0.75000 0.75000 0.71000 0.71000 Fort Bend County MUD 121 1.25000 1.20000 1.20000 1.20000 Fort Bend County MUD 122 1.00000 1.00000 1.00000 1.00000 Fort Bend County MUD 123 1.00000 1.00000 1.08000 1.14000 Fort Bend County MUD 124 0.99000 0.92000 0.92000 0.92000 Fort Bend County MUD 128 0.80000 0.80000 0.80000 0.70000 Fort Bend County MUD 129 0.80000 0.80000 0.80000 0.70000 Fort Bend County MUD 130 0.79000 0.77000 0.76000 0.76000 Fort Bend County MUD 131 0.90000 1.01000 1.01000 1.01000 Fort Bend County MUD 133 1.50000 1.50000 1.50000 1.50000 Fort Bend County MUD 134 B **N/A **N/A **N/A **N/A Fort Bend County MUD 134 C **N/A 1.25000 1.25000 1.30000 Fort Bend County MUD 134 D **N/A **N/A **N/A **N/A

135
page 2 of 5
2011 2012 2013 2014 2015 2016
1.50000 1.50000 1.50000 1.50000 1.50000 1.480001.38000 1.89940 1.51500 1.40000 1.40000 1.270000.26000 0.24000 **N/A **N/A **N/A **N/A1.03000 1.07000 1.05000 1.05000 0.95000 0.890001.35000 1.43000 1.36000 1.35000 1.30000 1.260000.82000 0.85000 0.86000 0.86500 0.84500 0.840000.86250 0.86250 0.90850 0.87500 0.84000 0.822501.02000 1.00000 1.00000 0.97000 0.92000 0.840000.68000 0.68000 0.68000 0.68000 0.63000 0.620000.63000 0.63000 0.62000 0.57000 0.51500 0.440000.52000 0.52000 0.52000 0.52000 0.50000 0.490000.55000 0.55000 0.55000 0.55000 0.54000 0.490000.43000 0.43000 0.43000 0.43000 0.42000 0.400000.88000 0.89500 0.89500 0.89500 0.90250 0.900001.04000 1.17000 1.12000 1.07000 0.95000 0.945000.88000 0.88000 0.88000 0.98000 0.98000 0.960000.95000 0.95000 0.95000 0.95000 0.94000 0.840000.90000 0.91000 0.91000 0.91000 0.91000 0.910001.45000 1.45000 1.40000 1.27000 1.05000 0.940001.50000 1.50000 1.45000 1.28000 1.16000 1.070001.50000 1.50000 1.47000 1.39000 1.25000 1.210000.46500 0.44500 0.41000 0.36000 0.22250 0.100000.40000 0.40000 0.40000 0.40000 0.39345 0.390000.40000 0.40000 0.38500 0.38500 0.35500 0.080000.37000 0.35000 0.33000 0.33000 0.32000 0.329300.77000 0.77000 0.71000 0.66000 0.58000 0.500000.52000 0.50000 0.49000 0.46000 0.34500 0.300000.44000 0.44000 0.44000 0.41000 0.29000 0.190000.66000 0.65000 0.65000 0.62000 0.44000 0.340000.30000 0.30000 0.30000 0.30000 0.30000 0.290000.38000 0.38000 0.37000 0.34000 0.34000 0.290000.50000 0.50000 0.50000 0.48000 0.46000 0.440001.22000 1.21000 1.18000 1.14000 1.08000 1.070000.69000 0.68000 0.68000 0.65000 0.48000 0.430000.77000 0.77000 0.77000 0.75000 0.70000 0.700000.71000 0.71000 0.71000 0.70000 0.64000 0.600001.20000 1.20000 1.20000 1.17000 1.12000 1.120001.00000 1.04000 1.04000 1.01500 0.99000 0.975001.15000 1.15500 1.15500 1.15500 1.10000 1.099000.99000 0.99000 0.99000 0.95000 0.95000 0.860000.70000 0.70000 0.70000 0.70000 0.70000 0.700000.67000 0.67000 0.65000 0.57000 0.42000 0.340000.75000 0.74000 0.73000 0.72000 0.66000 0.630001.01000 1.01000 1.01000 1.01000 1.01000 1.030001.50000 1.50000 1.50000 1.50000 1.43000 1.43000
**N/A **N/A **N/A 1.45000 1.45000 1.450001.30000 1.35000 1.35000 1.35000 1.30000 1.30000
**N/A **N/A **N/A **N/A **N/A 1.00000

136
FORT BEND COUNTY, TEXASPROPERTY TAX RATES - DIRECT AND
OVERLAPPING GOVERNMENTSLast Ten Tax Years(UNAUDITED)
2007 2008 2009 2010Political Subdivision: (continued) Fort Bend County MUD 136 0.63000 0.62000 0.62000 0.57000 Fort Bend County MUD 137 0.63000 0.62000 0.57000 0.57000 Fort Bend County MUD 138 0.63000 0.62000 0.57000 0.57000 Fort Bend County MUD 139 **N/A **N/A **N/A 0.57000 Fort Bend County MUD 140 1.25000 1.25000 1.25000 1.25000 Fort Bend County MUD 141 1.39000 **N/A **N/A **N/A Fort Bend County MUD 142 1.32000 1.32000 1.32000 1.32000 Fort Bend County MUD 143 1.25000 1.31000 1.35000 1.35000 Fort Bend County MUD 144 0.80000 0.80000 0.80000 0.80000 Fort Bend County MUD 145 1.25000 1.25000 1.25000 1.25000 Fort Bend County MUD 146 1.20000 1.20000 1.15000 1.15000 Fort Bend County MUD 147 0.95000 0.95000 0.95000 0.95000 Fort Bend County MUD 148 0.90000 0.90000 0.90000 0.90000 Fort Bend County MUD 149 0.80000 0.80000 0.80000 0.70000 Fort Bend County MUD 151 1.30000 1.30000 1.30000 1.27000 Fort Bend County MUD 152 1.45000 1.45000 1.45000 1.45000 Fort Bend County MUD 155 1.39000 1.39000 1.39000 1.39000 Fort Bend County MUD 156 **N/A **N/A **N/A **N/A Fort Bend County MUD 158 1.45000 1.45000 1.45000 1.45000 Fort Bend County MUD 159 0.84000 0.84000 0.84000 0.84000 Fort Bend County MUD 161 **N/A **N/A **N/A **N/A Fort Bend County MUD 162 0.55000 0.70000 0.74000 0.80000 Fort Bend County MUD 163 **N/A **N/A **N/A **N/A Fort Bend County MUD 165 1.25000 1.31000 1.35000 1.36000 Fort Bend County MUD 167 0.85000 0.85000 0.85000 0.89000 Fort Bend County MUD 168 1.03000 **N/A **N/A **N/A Fort Bend County MUD 169 **N/A **N/A **N/A 1.29500 Fort Bend County MUD 170 **N/A **N/A 1.29400 1.29500 Fort Bend County MUD 171 **N/A 1.29400 1.29400 1.29500 Fort Bend County MUD 172 **N/A **N/A **N/A 1.29500 Fort Bend County MUD 173 **N/A **N/A **N/A 1.29500 Fort Bend County MUD 176 0.70000 0.65000 0.65000 0.65000 Fort Bend County MUD 182 0.91000 **N/A **N/A **N/A Fort Bend County MUD 184 **N/A **N/A **N/A **N/A Fort Bend County MUD 185 **N/A 1.25000 1.25000 1.25000 Fort Bend County MUD 187 **N/A 1.00000 1.00000 1.00000 Fort Bend County MUD 192 **N/A **N/A **N/A **N/A Fort Bend County MUD 194 **N/A **N/A 1.25000 1.25000 Fort Bend County MUD 199 **N/A **N/A **N/A 0.60000 Fort Bend County MUD 206 **N/A **N/A **N/A **N/A Fort Bend County MUD 207 **N/A **N/A **N/A **N/A Fort Bend County MUD 215 **N/A **N/A **N/A **N/A Fort Bend County WC&ID 2 0.18000 0.18000 0.18000 0.18000 Fort Bend County WC&ID 3 0.50000 0.48000 0.48000 0.45000 Fort Bend County WC&ID 8 0.95000 0.95000 0.95000 0.95000 Fort Bend County WID 24 **N/A **N/A **N/A **N/A

137
page 3 of 5
2011 2012 2013 2014 2015 2016
0.57000 0.54000 0.54000 0.50000 0.43000 0.420000.57000 0.54000 0.48000 0.43000 0.42000 0.415000.57000 0.54000 0.48000 0.44500 0.43500 0.415000.57000 0.54000 0.54000 0.44000 0.41000 0.410001.25000 1.34000 1.34000 1.34000 1.25000 1.25000
**N/A **N/A **N/A 1.15000 1.15000 1.350001.32000 1.27000 1.17000 0.95000 0.85000 0.770001.36000 1.34000 1.30000 1.26000 1.26000 1.240000.80000 0.80000 0.80000 0.80000 0.80000 0.800001.25000 1.25000 1.25000 1.25000 1.23000 1.215001.15000 1.10000 1.02000 1.01000 0.94000 0.870000.95000 0.95000 0.95000 0.95000 0.95000 0.950000.90000 0.90000 0.90000 0.90000 0.88000 0.830000.70000 0.70000 0.70000 0.70000 0.65000 0.500001.26000 1.26000 1.26000 1.22000 1.11000 1.000001.45000 1.45000 1.45000 1.45000 1.37000 1.280001.39000 1.39000 1.39000 1.29000 1.14000 1.04000
**N/A **N/A 1.50000 1.45000 1.25000 1.050001.45000 1.45000 1.45000 1.39000 1.25000 1.120000.84000 0.84000 0.84000 0.78000 0.72000 0.72000
**N/A **N/A 0.90620 0.90620 0.90000 0.900001.00000 1.12000 1.12000 1.12000 1.09000 1.09000
**N/A **N/A 0.90000 0.90000 0.90000 0.900001.37000 1.37000 1.37000 1.37000 1.32000 1.250000.89000 0.87000 0.89000 0.89000 0.85000 0.85000
**N/A **N/A **N/A **N/A **N/A **N/A1.29500 1.29727 1.30380 1.32260 1.33926 1.343991.29500 1.29727 1.30380 1.32260 1.33926 1.343991.29500 1.28328 1.26500 1.22000 1.16000 1.120001.29500 1.29727 1.30380 1.32260 1.28180 1.215001.29500 1.29727 1.30380 1.32260 1.33926 1.342200.65000 0.65000 0.55000 0.55000 0.55000 0.55000
**N/A **N/A **N/A 1.50000 1.50000 1.50000**N/A **N/A **N/A 1.40000 1.50000 1.50000
1.25000 1.25000 1.20000 1.17000 1.04000 1.030001.00000 1.00000 1.00000 1.00000 0.97000 0.93000
**N/A **N/A **N/A 1.50000 1.50000 1.500001.25000 1.25000 1.25000 1.25000 1.25000 1.250000.60000 0.60000 0.60000 0.60000 0.60000 0.60000
**N/A **N/A **N/A 1.40000 1.40000 1.50000**N/A **N/A **N/A 1.00000 1.00000 1.00000**N/A **N/A **N/A **N/A **N/A 1.00000
0.18000 0.18000 0.18000 0.18000 0.18000 0.212500.45000 0.45000 0.45000 0.45000 0.44000 0.440000.95000 1.05000 1.18000 1.10000 1.07000 1.07000
**N/A **N/A 1.45000 1.45000 **N/A **N/A

138
FORT BEND COUNTY, TEXASPROPERTY TAX RATES - DIRECT AND
OVERLAPPING GOVERNMENTSLast Ten Tax Years(UNAUDITED)
2007 2008 2009 2010Political Subdivision: (continued) Fort Bend ESD 1 0.06250 0.06250 0.07500 0.07500 Fort Bend ESD 2 0.09200 0.08830 0.09600 0.09800 Fort Bend ESD 3 0.06750 0.06750 0.07900 0.08460 Fort Bend ESD 4 0.08897 0.08502 0.08234 0.07804 Fort Bend ESD 5 **N/A 0.08000 0.07997 0.07997 Fort Bend ESD 6 **N/A **N/A **N/A **N/A Fort Bend ESD 8 **N/A **N/A **N/A **N/A Fort Bend Fresh Water Supply 1 1.00000 1.00000 1.00000 1.00000 Fort Bend Fresh Water Supply 2 0.50000 0.50000 0.49900 0.50000 Fort Bend-Harris ESD 100 0.10000 0.09473 0.09697 0.09000 Fort Bend-Waller MUD 2 **N/A **N/A **N/A **N/A Fort Bend-Waller MUD 3 **N/A **N/A **N/A **N/A Fort Bend Independent School District 1.25000 1.27000 1.30500 1.34000 Fort Bend Parkway Road District 0.05443 0.05443 0.01483 **N/A Fulshear, City of 0.20592 0.20592 0.20592 0.20592 Fulshear MUD 1 **N/A 1.19000 1.19000 1.19000 Fulshear MUD 2 **N/A **N/A **N/A **N/A Fulshear MUD 3A **N/A **N/A **N/A **N/A Grand Mission MUD 1 1.05000 1.10000 1.10000 1.10000 Grand Mission MUD 2 1.25000 1.31000 1.31000 1.31000 Grand Lakes MUD 1 0.79000 0.79000 0.65000 0.63000 Grand Lakes MUD 2 0.70000 0.70000 0.46500 0.45500 Grand Lakes MUD 4 0.82000 0.82000 0.79000 0.79000 Grand Lakes WCID 0.09500 0.09500 0.08750 0.08250 Harris County MUD 393 **N/A **N/A **N/A **N/A Harris-Fort Bend EMS District **N/A **N/A **N/A **N/A Harris-Fort Bend MUD 1 0.88000 0.88000 0.77000 0.75000 Harris-Fort Bend MUD 3 1.25000 1.25000 1.25000 1.25000 Harris-Fort Bend MUD 4 0.96000 0.96000 0.96000 0.95000 Harris-Fort Bend MUD 5 0.82000 0.82000 0.75000 0.73000 Houston, City of **N/A 0.64375 0.63875 0.63875 HCC Stafford 0.09518 0.09243 0.09222 0.09222 HCC Missouri City 0.09518 0.09243 0.09222 0.09222 Imperial Redevelopment District **N/A 1.00000 **N/A **N/A Katy, City of **N/A 0.60540 0.59372 0.59372 Katy ISD 1.52660 1.52660 1.52660 1.52660 Kendleton, City of 0.76503 0.76632 0.89100 0.70627 Kendleton ISD 1.23170 1.20500 1.20830 **N/A Kingsbridge MUD 0.80000 0.78000 0.78000 0.78000 Lamar Consolidated I.S.D. 1.29765 1.29765 1.29765 1.36455 Meadowcreek MUD 0.10000 0.10000 0.10000 0.10000 Meadows Place, City of 0.79000 0.79000 0.83000 0.89500 Memorial MUD **N/A 0.52000 0.54000 0.55500 Mission Bend MUD 1 0.28000 0.25000 0.25000 0.25000 Missouri City, City of 0.49926 0.51724 0.52840 0.52840 Needville, City of 0.42284 0.39169 0.39153 0.38151 Needville Independent School District 1.27929 1.45600 1.48400 1.51999 North Mission Glen MUD 0.52000 0.52000 0.54400 0.57100

139
page 4 of 5
2011 2012 2013 2014 2015 2016
0.07500 0.07500 0.07500 0.07500 0.07500 0.075000.09800 0.09800 0.09800 0.09800 0.09800 0.098000.09100 0.09100 0.09100 0.09100 0.10000 0.100000.07827 0.08103 0.07964 0.09000 0.10000 0.100000.08298 0.08553 0.08341 0.07904 0.07135 0.07900
**N/A **N/A **N/A **N/A 0.10000 0.10000**N/A **N/A **N/A **N/A 0.10000 0.10000
1.00000 1.00000 1.00000 1.00000 1.00000 1.000000.51000 0.54000 0.54000 0.56000 0.55700 0.552100.09000 0.09000 0.08840 0.08840 0.07951 0.07321
**N/A **N/A 0.80000 0.80000 0.80000 0.80000**N/A **N/A **N/A **N/A 0.93000 0.93000
1.34000 1.34000 1.34000 1.34000 1.34000 1.34000**N/A **N/A **N/A **N/A **N/A **N/A
0.20592 0.20366 0.19713 0.17829 0.16163 0.156901.19000 1.19000 1.19000 1.19000 1.19000 1.17000
**N/A **N/A **N/A **N/A 1.20000 1.20000**N/A **N/A **N/A **N/A 1.50000 1.50000
1.10000 1.15000 1.12000 1.02000 0.90000 0.820001.31000 1.31000 1.31000 1.30000 1.25000 1.200000.54000 0.54000 0.54000 0.54000 0.51500 0.495000.44500 0.43750 0.36950 0.35000 0.32000 0.307500.77000 0.76000 0.73000 0.68000 0.60000 0.572500.08250 0.08250 0.07850 0.07300 0.06650 **N/A
**N/A **N/A 1.02000 0.91000 0.86000 **N/A**N/A **N/A **N/A **N/A **N/A **N/A
0.73000 0.70000 0.68500 0.68500 0.65500 0.610001.25000 1.24000 1.19000 1.07000 0.97000 0.920000.95000 0.88000 0.82000 0.82000 0.82000 0.800000.71000 0.71000 0.70000 0.65000 0.59000 0.540000.63875 0.63875 0.63875 0.63108 0.60112 0.586420.09722 0.09717 0.09717 0.10689 0.10194 0.100260.09722 0.09717 0.09717 0.10689 0.10194 0.10026
**N/A **N/A 1.10000 1.10000 1.10000 1.100000.59372 0.58672 0.56672 0.54672 0.52672 0.506721.52660 1.52660 1.52660 1.52660 1.51660 1.516600.69923 0.63933 0.66908 0.69771 0.78500 0.785001.20830 **N/A **N/A **N/A **N/A **N/A0.78000 0.78000 0.78000 0.78000 0.71000 0.660001.39005 1.39005 1.39005 1.39005 1.39005 1.390050.10000 0.10000 0.10000 0.10000 0.10000 0.100000.89869 0.89500 0.89500 0.89500 0.86800 0.832000.55000 0.54000 0.54000 0.51000 0.48000 0.440000.25000 0.25000 0.28000 0.28000 0.27750 0.260000.52840 0.54480 0.57375 0.56500 0.54468 0.560100.39779 0.40121 0.38551 0.37359 0.38117 0.399991.57958 1.64958 1.64958 1.59995 1.57300 1.540000.64110 0.65110 0.65110 0.60000 0.55000 0.52000

140
FORT BEND COUNTY, TEXASPROPERTY TAX RATES - DIRECT AND
OVERLAPPING GOVERNMENTSLast Ten Tax Years(UNAUDITED)
2007 2008 2009 2010Political Subdivision: (continued) Orchard, City of 0.30750 0.33123 0.39601 0.39267 Palmer Plantation MUD 1 0.68000 0.68000 0.69000 0.73500 Palmer Plantation MUD 2 0.49000 0.49000 0.49800 0.51500 Pearland, City of 0.65260 0.65260 0.65260 0.66510 Pecan Grove MUD 0.47000 0.46800 0.46800 0.55000 Plantation MUD 0.63000 0.63000 0.66000 0.66000 Renn Road MUD **N/A 0.63000 0.63000 0.66500 Richmond, City of 0.79000 0.79000 0.78650 0.78650 Rosenberg, City of 0.54500 0.52020 0.50000 0.50000 Sienna Plantation LID 0.58000 0.49000 0.49000 0.49000 Sienna Plantation Management 0.92000 1.01000 1.01000 1.01000 Sienna Plantation MUD 2 0.72000 0.71000 0.71000 0.71000 Sienna Plantation MUD 3 0.75000 0.75000 0.73000 0.72000 Sienna Plantation MUD 4 **N/A **N/A **N/A **N/A Sienna Plantation MUD 10 0.90000 0.94000 0.94000 0.94000 Sienna Plantation MUD 12 0.90000 0.94000 0.94000 0.94000 Simonton, City of 0.27000 0.27000 0.27000 0.27000 Stafford Municipal School District 1.25000 1.23500 1.23000 1.11000 Sugar Land, City of 0.30000 0.30000 0.30000 0.30000 West Keegans Bayou I.D. 0.12100 0.12100 0.12100 1.05000 West Harris County MUD 4 **N/A 0.90000 0.95000 0.11100 Wharton County Junior College 0.13485 0.13797 0.14666 0.14448 Willow Creek Farms MUD **N/A 1.25000 1.25000 1.25000 Willow Fork Drainage District 0.20000 0.19000 0.19000 0.19000 Willow Point MUD **N/A **N/A **N/A **N/A Woodcreek Reserve MUD 0.60000 0.60000 0.60000 0.60000
Source of data: Fort Bend County Central Appraisal District.
All tax rates are shown per $100 assessed value at 100% assessment ratio.
**N/A - Political entity not in existence at this time or taxes not yet levied. Data provided bythe Fort Bend Economic Development Council.

141
page 5 of 5
2011 2012 2013 2014 2015 2016
0.42380 0.39475 0.37887 0.37887 0.37153 0.347880.73500 0.73500 0.75500 0.75500 0.56000 0.480000.51500 0.54000 0.54000 0.53000 0.49000 0.460000.68510 0.70500 0.70510 0.71210 0.70530 0.681200.55000 0.56000 0.65500 0.65500 0.64000 0.625000.74000 0.74000 0.74000 0.74000 0.68500 0.645000.69000 0.76000 0.76000 0.75000 0.75000 0.720000.78650 0.78650 0.78000 0.77000 0.75500 0.735000.50000 0.51000 0.50000 0.49000 0.47000 0.470000.49000 0.49000 0.49000 0.49000 0.47000 0.450001.01000 1.01000 1.01000 1.01000 1.03000 1.050000.71000 0.71000 0.71000 0.71000 0.65000 0.590000.72000 0.72000 0.71000 0.71000 0.63000 0.59000
**N/A **N/A **N/A 1.01000 1.03000 1.050000.94000 0.94000 0.94000 0.94000 0.94000 0.840000.94000 0.94000 0.94000 0.94000 0.94000 0.880000.27000 0.27000 0.26000 0.26000 0.24000 0.230001.22000 1.25000 1.25000 1.24005 1.23005 1.230050.30245 0.30895 0.30895 0.31595 0.31595 0.315950.11100 0.10000 0.10000 0.10000 0.09500 0.094001.06000 1.09000 1.09000 1.09000 1.08000 1.000000.14414 0.13821 0.13419 0.12656 0.13028 0.137061.25000 1.25000 1.25000 1.25000 1.15000 1.095000.19000 0.19000 0.19000 0.19000 0.18500 0.18500
**N/A **N/A 1.50000 1.50000 1.50000 1.500000.60000 0.60000 0.60000 0.60000 0.60000 0.60000

142

143
FORT BEND COUNTY, TEXASPRINCIPAL PROPERTY TAXPAYERSCurrent Year and Nine Years Ago(UNAUDITED)
Percentage of Percentage ofTotal Net Total Net
Assessed Assessed Assessed Assessed Taxpayer Value Rank Valuation Value Rank Valuation
NRG Texas LP 690,238,490$ 1 1.185 1,799,052,080$ 1 5.373Centerpoint Energy Inc. 294,520,410 2 0.506 221,152,430 2 0.661Katy Mills Mall LTD Partnership 123,078,450 3 0.211 148,319,680 5 0.443Tramontina USA Inc. 96,475,390 4 0.166 98,752,240 7Fairfield Industries 95,618,640 5 0.164LCFRE Sugar Land Town Square LLC 88,627,390 6 0.152AmerisourceBergen Drug Corporation 81,268,740 7 0.140First Colony Mall LLC 81,007,090 8 0.139Brazos Valley Energy 80,960,490 9 0.139Schlumberger Technology Corp 79,235,660 10 0.136
Texas Instruments, Inc. 157,258,290 3 0.47Conocophillips Company 148,455,640 4 0.44STC Manufacturing Group 101,650,560 6 0.30Lakepointe Assets LLC 89,443,550 8 0.27Texas Genco LP 87,398,320 9Jetta Operating Company Inc. 71,518,610 10
Subtotal 1,711,030,750 2.94 % 2,923,001,400 7.96 %
Other taxpayers 56,536,181,673 97.06 30,558,332,049 92.04
Total 58,247,212,423$ 100.00 % 33,481,333,449$ 100.00 %
Source of data: Fort Bend County Central Appraisal District.
Fiscal Year 2008Fiscal Year 2017

144
FORT BEND COUNTY, TEXASPROPERTY TAX LEVIES AND COLLECTIONSFOR THE LAST TEN FISCAL YEARS(UNAUDITED)
Total Total Percentage ofTax Fiscal Original Adjusted Adjusted LevyYear Year Levy Adjustments Levy Amount Collected2007 2008 173,203,701$ (1,085,458)$ 172,118,243$ 169,011,211$ 98.19%
2008 2009 190,430,794 (1,534,628) 188,896,166 186,012,685 98.47%
2009 2010 191,862,995 5,401,838 197,264,833 194,801,626 98.75%
2010 2011 193,704,140 2,110,159 195,814,299 193,251,014 98.69%
2011 2012 197,913,656 413,902 198,327,558 196,106,467 98.88%
2012 2013 198,853,734 7,359,083 206,212,818 204,426,149 99.13%
2013 2014 220,732,237 65,763 220,798,001 219,405,724 99.37%
2014 2015 231,440,796 9,398,486 240,839,282 239,321,688 99.37%2015 2016 261,554,958 7,193,106 268,748,065 267,472,379 99.53%
2016 2017 289,365,323 (2,778,140) 286,587,183 284,725,066 99.35%
Collected within the Fiscal Year of the Levy

145
Total TaxCollections in Total Collections as aSubsequent Tax Percentage of
Years Collections Adjusted Levy2,814,521$ 171,825,733$ 99.83%
2,669,991 188,682,676 99.89%
2,259,122 197,060,747 99.90%
2,354,214 195,605,228 99.89%
1,999,323 198,105,790 99.89%
1,543,279 205,969,428 99.88%
1,102,884 220,508,608 99.87%
1,118,083 240,439,771 99.83%646,130 268,118,509 99.77%
284,725,066 99.35%

146
FORT BEND COUNTY, TEXASRATIO OF NET LONG-TERM DEBT TO ASSESSED VALUE
PERSONAL INCOME, AND LONG-TERM DEBT PER CAPITAFOR THE LAST TEN FISCAL YEARS(UNAUDITED)
Net General TotalTax Fiscal Assessed Obligation Tax Long-TermYear Year Population (1) Value Bonds (2) Notes Debt (2)2007 2008 531,660 33,481,333,449$ 238,044,854$ $ 238,044,854$
2008 2009 547,876 38,064,280,267 350,787,773 350,787,773
2009 2010 581,830 38,405,455,145 343,448,573 343,448,573
2010 2011 606,786 37,368,043,796 330,308,251 330,308,251
2011 2012 639,969 38,034,487,112 381,602,454 381,602,454
2012 2013 643,408 39,439,947,054 364,812,865 364,812,865
2013 2014 652,365 41,977,668,270 347,708,537 347,708,537
2014 2015 685,345 45,576,901,817 376,265,782 376,265,782
2015 2016 716,087 53,358,083,200 473,004,495 473,004,495
2016 2017 741,237 58,247,212,423 520,033,007 3,808,978 523,841,985
(1) Source of data: Fort Bend Economic Development Council.
(2) The figures do not include both long-term debt principal and amounts available fordebt service for the Fort Bend Parkway Road District Unlimited Tax bonds. The levy for those bonds is not calculated on the assessed value of the County propertiespresented in this table.

147
AmountsAvailable Percent Long-Term
in Debt Net of Debt to Long-TermService Long-Term Personal Personal Assessed Debt
Fund (2) Debt Income Income Value Per Capita4,290,890$ 233,753,964$ 20,218,050,000$ 1.18% 0.70% 448$
5,956,061 344,831,712 22,319,780,000 1.57% 0.91% 640
4,844,023 338,604,550 20,455,780,000 1.68% 0.88% 590
5,169,725 325,138,526 22,444,080,000 1.47% 0.87% 544
3,977,092 377,625,362 27,002,708,000 1.41% 0.99% 596
2,461,472 362,351,393 29,242,120,000 1.25% 0.92% 567
2,739,786 344,968,751 30,215,817,000 1.15% 0.82% 533
2,764,772 373,501,010 32,349,654,690 1.16% 0.82% 549
1,071,278 471,933,217 40,162,314,000 1.18% 0.88% 661
9,852,755 513,989,230 43,394,237,691 1.21% 0.88% 707

148
FORT BEND COUNTY, TEXASDIRECT AND OVERLAPPING DEBT page 1 of 4Fiscal Year 2017(UNAUDITED)
Long-Term Applicable OverlappingOutstanding Percentage Debt
Fort Bend County 523,841,985$ (1) 100.00% 523,841,985$
Special Districts:Big Oaks MUD 16,776,108 100.00% 16,776,108 Blue Ridge West MUD 2,380,000 100.00% 2,380,000 Burney Road MUD 9,565,090 100.00% 9,565,090 Cinco MUD # 1 5,851,250 100.00% 5,851,250 Cinco MUD # 2 9,839,938 100.00% 9,839,938 Cinco MUD # 5 7,213,048 100.00% 7,213,048 Cinco MUD # 7 10,911,224 100.00% 10,911,224 Cinco MUD # 8 12,728,584 100.00% 12,728,584 Cinco MUD # 10 9,569,812 100.00% 9,569,812 Cinco MUD # 12 6,278,108 100.00% 6,278,108 Cinco MUD # 14 20,671,238 100.00% 20,671,238 Cinco Southwest MUD # 1 1,155,995 100.00% 1,155,995 Cinco Southwest MUD # 2 74,486,355 100.00% 74,486,355 Cinco Southwest MUD # 3 66,095,663 100.00% 66,095,663 Cinco Southwest MUD # 4 73,242,890 100.00% 73,242,890 First Colony MUD # 9 10,174,065 100.00% 10,174,065 First Colony MUD # 10 13,158,630 100.00% 13,158,630 Fort Bend Co FWSD # 1 23,498,650 100.00% 23,498,650 Fort Bend Co LID # 2 12,290,000 100.00% 12,290,000 Fort Bend Co LID # 6 10,430,000 100.00% 10,430,000 Fort Bend Co LID # 7 24,915,000 100.00% 24,915,000 Fort Bend Co LID # 10 12,598,137 100.00% 12,598,137 Fort Bend Co LID # 11 16,439,242 100.00% 16,439,242 Fort Bend Co LID # 12 12,505,000 100.00% 12,505,000 Fort Bend Co LID # 14 3,465,000 100.00% 3,465,000 Fort Bend Co LID # 15 89,620,414 100.00% 89,620,414 Fort Bend Co LID # 17 56,411,628 100.00% 56,411,628 Fort Bend Co LID # 19 33,356,998 100.00% 33,356,998 Fort Bend Co LID # 20 2,355,526 100.00% 2,355,526 Fort Bend Co Municipal Mgmt # 1 4,570,000 100.00% 4,570,000 Fort Bend Co MUD # 2 13,832,326 100.00% 13,832,326 Fort Bend Co MUD # 5 11,725,840 100.00% 11,725,840 Fort Bend Co MUD # 19 648,959 100.00% 648,959 Fort Bend Co MUD # 23 56,152,589 100.00% 56,152,589 Fort Bend Co MUD # 24 8,203,188 100.00% 8,203,188 Fort Bend Co MUD # 25 95,167,714 100.00% 95,167,714 Fort Bend Co MUD # 26 10,725,000 100.00% 10,725,000 Fort Bend Co MUD # 30 70,291,989 99.97% 70,270,901 Fort Bend Co MUD # 34 16,423,519 100.00% 16,423,519 Fort Bend Co MUD # 35 32,194,242 100.00% 32,194,242 Fort Bend Co MUD # 41 1,982,591 100.00% 1,982,591 Fort Bend Co MUD # 42 9,095,000 100.00% 9,095,000 Fort Bend Co MUD # 46 11,134,808 100.00% 11,134,808 Fort Bend Co MUD # 47 6,051,558 100.00% 6,051,558 Fort Bend Co MUD # 48 15,863,159 100.00% 15,863,159 Fort Bend Co MUD # 49 685,539 100.00% 685,539 Fort Bend Co MUD # 50 53,623,360 100.00% 53,623,360 Fort Bend Co MUD # 57 50,448,113 100.00% 50,448,113 Fort Bend Co MUD # 58 100,333,552 100.00% 100,333,552 Fort Bend Co MUD # 66 1,644,311 100.00% 1,644,311
Taxing Jurisdiction

149
FORT BEND COUNTY, TEXASDIRECT AND OVERLAPPING DEBT page 2 of 4Fiscal Year 2017(UNAUDITED)
Long-Term Applicable OverlappingOutstanding Percentage Debt
Fort Bend Co MUD # 81 4,170,000 100.00% 4,170,000 Fort Bend Co MUD # 94 4,392,308 100.00% 4,392,308 Fort Bend Co MUD # 106 6,080,000 100.00% 6,080,000 Fort Bend Co MUD # 108 1,090,000 100.00% 1,090,000 Fort Bend Co MUD # 109 8,320,000 100.00% 8,320,000 Fort Bend Co MUD # 111 3,324,792 100.00% 3,324,792 Fort Bend Co MUD # 112 3,752,826 100.00% 3,752,826 Fort Bend Co MUD # 115 9,872,491 100.00% 9,872,491 Fort Bend Co MUD # 116 24,580,005 100.00% 24,580,005 Fort Bend Co MUD # 117 14,020,162 100.00% 14,020,162 Fort Bend Co MUD # 118 26,015,780 100.00% 26,015,780 Fort Bend Co MUD # 119 17,035,000 100.00% 17,035,000 Fort Bend Co MUD # 121 31,976,467 100.00% 31,976,467 Fort Bend Co MUD # 122 17,044,820 100.00% 17,044,820 Fort Bend Co MUD # 123 27,757,727 100.00% 27,757,727 Fort Bend Co MUD # 124 9,910,000 100.00% 9,910,000 Fort Bend Co MUD # 128 63,750,439 100.00% 63,750,439 Fort Bend Co MUD # 129 19,405,980 100.00% 19,405,980 Fort Bend Co MUD # 130 9,801,859 100.00% 9,801,859 Fort Bend Co MUD # 131 2,257,628 100.00% 2,257,628 Fort Bend Co MUD # 133 54,703,108 100.00% 54,703,108 Fort Bend Co MUD # 134B 19,287,584 100.00% 19,287,584 Fort Bend Co MUD # 134C 82,498,059 100.00% 82,498,059 Fort Bend Co MUD # 134 10,485,000 100.00% 10,485,000 Fort Bend Co MUD # 136 4,225,623 100.00% 4,225,623 Fort Bend Co MUD # 137 27,737,898 100.00% 27,737,898 Fort Bend Co MUD # 138 38,629,553 100.00% 38,629,553 Fort Bend Co MUD # 139 13,105,925 100.00% 13,105,925 Fort Bend Co MUD # 140 17,686,732 100.00% 17,686,732 Fort Bend Co MUD # 142 65,050,000 100.00% 65,050,000 Fort Bend Co MUD # 143 28,622,427 100.00% 28,622,427 Fort Bend Co MUD # 144 14,777,753 100.00% 14,777,753 Fort Bend Co MUD # 145 4,053,151 100.00% 4,053,151 Fort Bend Co MUD # 146 42,084,401 100.00% 42,084,401 Fort Bend Co MUD # 148 4,610,973 100.00% 4,610,973 Fort Bend Co MUD # 149 25,022,050 100.00% 25,022,050 Fort Bend Co MUD # 151 66,568,405 100.00% 66,568,405 Fort Bend Co MUD # 152 7,954,421 100.00% 7,954,421 Fort Bend Co MUD # 155 23,931,280 100.00% 23,931,280 Fort Bend Co MUD # 156 17,455,622 100.00% 17,455,622 Fort Bend Co MUD # 158 13,318,179 100.00% 13,318,179 Fort Bend Co MUD # 159 4,547,483 100.00% 4,547,483 Fort Bend Co MUD # 161 12,241,321 100.00% 12,241,321 Fort Bend Co MUD # 162 8,452,627 100.00% 8,452,627 Fort Bend Co MUD # 163 5,500,000 100.00% 5,500,000 Fort Bend Co MUD # 165 30,138,471 100.00% 30,138,471 Fort Bend Co MUD # 167 24,505,000 100.00% 24,505,000 Fort Bend Co MUD # 169 595,230 100.00% 595,230 Fort Bend Co MUD # 170 16,914,414 100.00% 16,914,414 Fort Bend Co MUD # 171 47,194,858 100.00% 47,194,858 Fort Bend Co MUD #172 65,755,308 100.00% 65,755,308 Fort Bend Co MUD # 173 12,422,688 100.00% 12,422,688
Taxing Jurisdiction

150
FORT BEND COUNTY, TEXASDIRECT AND OVERLAPPING DEBT page 3 of 4Fiscal Year 2017(UNAUDITED)
Long-Term Applicable OverlappingOutstanding Percentage Debt
Fort Bend Co MUD # 176 3,682,497 100.00% 3,682,497 Fort Bend Co MUD # 182 15,970,000 100.00% 15,970,000 Fort Bend Co MUD # 185 25,130,313 100.00% 25,130,313 Fort Bend Co MUD # 187 29,370,895 100.00% 29,370,895 Fort Bend Co MUD # 194 27,612,909 100.00% 27,612,909 Fort Bend Co MUD # 199 1,797,016 100.00% 1,797,016 Fort Bend Co WC&ID # 3 2,717,893 100.00% 2,717,893 Fort Bend Co WC&ID # 8 1,745,122 100.00% 1,745,122 Fulshear MUD # 1 12,209,401 100.00% 12,209,401 Grand Lakes MUD # 1 9,766,343 100.00% 9,766,343 Grand Lakes MUD # 2 6,305,592 100.00% 6,305,592 Grand Lakes MUD # 4 13,149,995 100.00% 13,149,995 Grand Lakes WC&ID 3,630,000 100.00% 3,630,000 Grand Mission MUD # 1 32,479,319 100.00% 32,479,319 Grand Mission MUD # 2 18,844,975 100.00% 18,844,975 Imperial Redevelopment Dist 12,135,000 100.00% 12,135,000 Palmer Plantation MUD # 2 5,965,578 100.00% 5,965,578 Pecan Grove MUD 50,376,150 100.00% 50,376,150 Plantation MUD 5,480,000 100.00% 5,480,000 Sienna Plantation Levee Improvement Dist 93,971,018 100.00% 93,971,018 Sienna Plantation Management District 30,924,519 100.00% 30,924,519 Sienna Plantation MUD # 2 15,835,047 100.00% 15,835,047 Sienna Plantation MUD # 3 35,364,534 100.00% 35,364,534 Sienna Plantation MUD # 4 20,769,566 100.00% 20,769,566 Sienna Plantation MUD # 10 57,369,338 100.00% 57,369,338 Sienna Plantation MUD # 12 56,290,701 100.00% 56,290,701 Woodcreek Reserve MUD 17,393,756 100.00% 17,393,756
County Line Special Districts:Brazoria-Fort Bend Co MUD # 1 75,827,612 43.16% 32,727,197 Brazoria County MUD # 22 10,214,925 0.68% 69,461 Chelford City MUD 7,904,263 55.83% 4,412,950 Cimarron MUD 28,089,571 3.85% 1,081,448 Cinco MUD # 3 5,752,553 86.55% 4,978,835 Cinco MUD # 6 7,089,323 61.24% 4,341,501 Cinco MUD # 9 6,345,833 57.42% 3,643,777 Cornerstones MUD 2,125,000 17.62% 374,425 Fort Bend Co WC&ID # 2 68,671,803 98.88% 67,902,679 Fort Bend-Waller Cty MUD #2 6,895,787 1.39% 95,851 Harris-Fort Bend Cos MUD # 1 12,245,000 86.11% 10,544,170 Harris-Fort Bend Cos MUD # 3 36,705,689 1.14% 418,445 Harris-Fort Bend Cos MUD # 5 19,183,363 94.69% 18,164,726 Harris County MUD # 393 9,625,249 9.78% 941,349 Katy Management District 6,625,000 71.07% 4,708,388 Kingsbridge MUD 21,085,000 96.88% 20,427,148 Mission Bend MUD #1 2,232,635 97.33% 2,173,024 North Mission Glen MUD 22,626,059 99.22% 22,449,576 Renn Road MUD 7,400,000 31.72% 2,347,280 West Harris Co MUD # 4 2,895,000 15.88% 459,726 Willow Creek Farms MUD 22,087,705 0.63% 139,153 Willow Fork Drainage District 41,379,660 92.90% 38,441,704 Willow Point MUD 8,332,649 85.63% 7,135,247 Total Special District Debt (2) 3,187,659,228$
Taxing Jurisdiction

151
FORT BEND COUNTY, TEXASDIRECT AND OVERLAPPING DEBT page 4 of 4Fiscal Year 2017(UNAUDITED)
Long-Term Applicable OverlappingOutstanding Percentage Debt
Cities:Arcola, City of 3,280,000$ 100.00% 3,280,000$ Beasley, City of 233,000 100.00% 233,000 Kendleton, City of 1,625,000 100.00% 1,625,000 Meadows Place, City of 1,310,000 100.00% 1,310,000 Needville, City of 1,550,000 100.00% 1,550,000 Richmond, City of 20,893,113 100.00% 20,893,113
County Line Cities:Rosenberg, City of 40,487,000 100.00% 40,487,000 Sugar Land, City of 211,997,242 100.00% 211,997,242 Houston, City of 2,680,470,846 0.48% 12,866,260 Katy, City of 17,115,000 37.24% 6,373,626 Missouri City, City of 79,628,339 95.50% 76,045,064 Pearland, City of 302,680,000 4.20% 12,712,560 Total Cities 389,372,865$
School Districts: Fort Bend ISD 831,729,368 100.00% 831,729,368$ Lamar CISD 791,650,000 100.00% 791,650,000 Needville ISD 55,723,285 100.00% 55,723,285
County Line School Districts:Brazos ISD 14,214,987 60.83% 8,646,977 Katy ISD 1,638,667,744 38.80% 635,803,085 Stafford MSD 55,267,615 99.60% 55,046,545 Total School Districts 2,378,599,259$
Other:Houston Community College System 599,540,000 28.18% 168,950,372
Total Other 168,950,372$
Summary of Total Estimated Overlapping Debt: Special Districts 3,187,659,228$ Cities 389,372,865 School Districts 2,378,599,259 Other 168,950,372 Estimated Overlapping Debt 6,124,581,724$
Fort Bend County Fort Bend County - Direct Obligations 523,841,985
Total Direct and Estimated Overlapping Debt 6,648,423,709$
(1) County debt outstanding as of September 30, 2017. Includes the Fort Bend Flood Control WaterSupply Corporation debt.
(2) Total Special District Debt includes numerous special districts with varying amounts of debtapplicable to the County.
The allocation of the county-line jurisdictions is calculated by determining the ratio of the assessed valuation of taxable property that is within Fort Bend County. This rate is then applied to the outstanding debt of the county-line jurisdiction to calculate the overlapping debt amount.
Source of data: Texas Municipal Reports published by the Municpal Advisory Council of Texas.
Taxing Jurisdiction

152
FORT BEND COUNTY, TEXASCOMPUTATION OF LEGAL DEBT MARGINLAST TEN FISCAL YEARS(UNAUDITED)
2008 2009 2010 2011
Assessed value of real property 28,931,048,114$ 33,294,278,049$ 33,574,551,064$ 32,877,992,163$ Assessed value of personal
and other property 4,550,285,335 4,770,002,218 4,830,904,081 4,490,051,633
Total assessed value 33,481,333,449$ 38,064,280,267$ 38,405,455,145$ 37,368,043,796$
Debt Limit, 25% of real property 7,232,762,029$ 8,323,569,512$ 8,393,637,766$ 8,219,498,041$
Amount of debt applicableto debt limit 238,044,854 350,787,773 343,448,573 330,308,251
Less: Assets available inDebt Service Fundsfor payment of principal 4,290,890 5,956,061 4,844,023 5,169,725
Total amount of debt applicableto debt limit 233,753,964 344,831,712 338,604,550 325,138,526
Legal Debt Margin 6,999,008,065$ 7,978,737,800$ 8,055,033,216$ 7,894,359,515$
Total net debt applicable toto the limit as a percentage ofdebt limit 3.23% 4.14% 4.03% 3.96%
Source of data: Fort Bend County Central Appraisal District and County Tax Assessor/Collector.

153
2012 2013 2014 2015 2016 2017
33,530,169,247$ 34,906,683,521$ 36,962,606,903$ 40,220,320,218$ 47,990,163,282$ 53,266,960,793$
4,504,317,865 4,533,263,533 5,015,061,367 5,356,581,599 5,367,919,918 4,980,251,630
38,034,487,112$ 39,439,947,054$ 41,977,668,270$ 45,576,901,817$ 53,358,083,200$ 58,247,212,423$
8,382,542,312$ 8,726,670,880$ 9,240,651,726$ 10,055,080,055$ 11,997,540,821$ 13,316,740,198$
381,602,454 364,812,865 347,708,537 376,265,782 473,004,495 523,841,985
3,977,092 2,461,472 2,739,786 2,764,772 1,086,398 9,852,755
377,625,362 362,351,393 344,968,751 373,501,010 471,918,097 513,989,230
8,004,916,950$ 8,364,319,487$ 8,895,682,975$ 9,681,579,045$ 11,525,622,724$ 12,802,750,968$
4.50% 4.15% 3.73% 3.71% 3.93% 3.86%

154
FORT BEND COUNTY, TEXASDEMOGRAPHIC AND ECONOMIC STATISTICSLAST TEN FISCAL YEARS(UNAUDITED)
Year Population Personal Income
Per Capita Personal Income
Unemployment Rate
2008 531,660 20,218,050,000$ 38,028$ 4.8%
2009 547,876 22,319,780,000 40,739 7.2%
2010 581,830 20,455,780,000 35,158 8.2%
2011 606,786 22,444,080,000 36,988 7.7%
2012 639,969 27,002,708,000 42,194 6.1%
2013 643,408 29,242,120,000 45,449 5.7%
2014 652,365 30,215,817,000 46,317 5.1%2015 685,345 32,349,654,690 (1) 47,202 4.4%2016 716,087 40,162,314,000 56,086 4.9%2017 741,237 43,394,237,691 58,543 4.6%
Source of data: Fort Bend Economic Development Council (1) Estimated using 2014 per capita rate of increase

155
FORT BEND COUNTY, TEXASLARGEST EMPLOYERSCurrent Year and Nine Years Ago(UNAUDITED)
Fiscal Year 2017
Local Local Employer Employees Rank Employees Rank
Fort Bend ISD 10,579 1 9,500 1Lamar CISD 3,188 2 3,016 3Fort Bend County 2,537 3 1,912 5Fluor Corporation 2,430 4 4,000 2Methodist Sugar Land Hospital 2,200 5Schlumberger Technology Corp. 1,750 6 2,200 4Richmond State School 1,300 7 1,396 7United Parcel Service 1,200 8 1,100 9Oak Bend Medical Center 1,164 9Nalco Company Energy Services 1,100 10Texas Instruments 1,400 6SouthWest Water 1,332 8Houston Community College 815 10
27,448 26,671
Source of data: Fort Bend Economic Development Council
Fiscal Year 2008
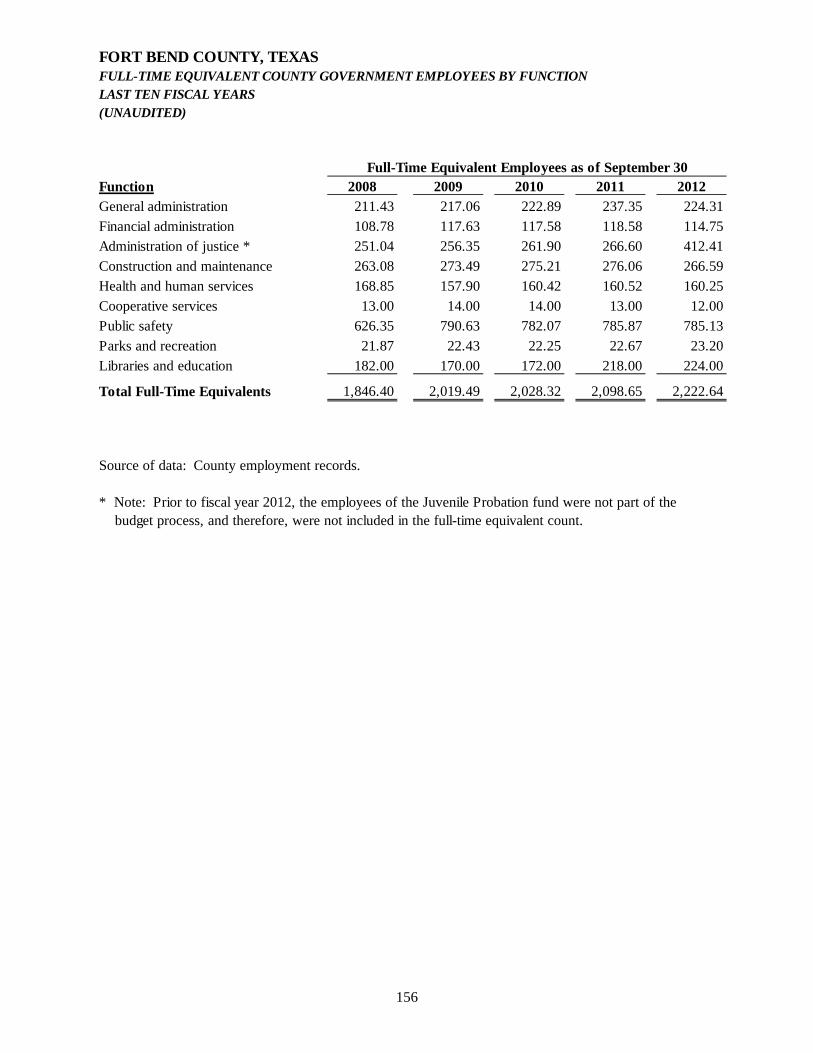
156
FORT BEND COUNTY, TEXASFULL-TIME EQUIVALENT COUNTY GOVERNMENT EMPLOYEES BY FUNCTIONLAST TEN FISCAL YEARS(UNAUDITED)
Function 2008 2009 2010 2011 2012General administration 211.43 217.06 222.89 237.35 224.31
Financial administration 108.78 117.63 117.58 118.58 114.75
Administration of justice * 251.04 256.35 261.90 266.60 412.41
Construction and maintenance 263.08 273.49 275.21 276.06 266.59
Health and human services 168.85 157.90 160.42 160.52 160.25
Cooperative services 13.00 14.00 14.00 13.00 12.00
Public safety 626.35 790.63 782.07 785.87 785.13
Parks and recreation 21.87 22.43 22.25 22.67 23.20
Libraries and education 182.00 170.00 172.00 218.00 224.00
Total Full-Time Equivalents 1,846.40 2,019.49 2,028.32 2,098.65 2,222.64
Source of data: County employment records.
* Note: Prior to fiscal year 2012, the employees of the Juvenile Probation fund were not part of the budget process, and therefore, were not included in the full-time equivalent count.
Full-Time Equivalent Employees as of September 30

157
2013 2014 2015 2016 2017225.71 237.51 242.50 253.27 271.57
114.75 120.00 121.00 127.14 135.14
414.80 429.09 445.02 485.44 506.31
267.71 273.60 269.87 275.19 280.78
163.61 165.84 174.64 199.81 209.40
12.00 12.00 12.00 11.70 11.70
791.98 802.95 805.50 821.01 846.67
23.00 27.34 35.81 36.98 39.06
232.74 232.19 234.86 227.28 235.97
2,246.30 2,300.52 2,341.20 2,437.82 2,536.60
Full-Time Equivalent Employees as of September 30

158
FORT BEND COUNTY, TEXASOPERATING INDICATORS BY FUNCTIONLAST TEN FISCAL YEARS(UNAUDITED)
Function 2008 2009 2010 2011
General AdministrationFull-time equivalent count 210.43 218.45 222.89 239.80 Documents filed with County Clerk 423,350 339,335 326,919 260,017 Copies issued by County Clerk 163,492 72,120 72,300 66,852 Technical support calls to IT 36,770 22,396 18,394 26,020 County web-site visits (avg/day) 5,950 6,605 6,960 7,519 Medical claims filed with Risk Management 45,019 51,121 57,433 56,734 On the job accident claims to Risk Management 181 156 177 149 Voter registrations 36,900 29,026 20,579 20,579 Early voting as a percentage of turnout 42.5% 70.6% 61.2% 60.0%Job openings 308 213 317 317 Employee service awards 5 years 95 95 97 104 10 years 54 81 60 101 15 years 52 42 38 36 20 years 26 33 17 31 25 years 26 10 15 19 30 years 5 3 2 7 35 years 0 1 0 1 Responses to posted job openings 7,763 12,244 15,266 15,266 Pieces of mail processed 1,400,000 1,600,000 1,800,000 1,800,000 Facilities service requests (avg/month) 256 306 306 330 Bids, RFP's, & SOQ's solicited 98 107 124 90 Purchase orders issued 13,077 15,360 13,469 12,830 Public Transportation trips 118,189 193,095 180,409 247,324 Records Management On site storage (cubic footage) 536 211 276 421 Off site storage (cubic footage) 13,279 13,856 12,704 8,219
Financial AdministrationFull-time equivalent count 108.78 111.01 116.58 118.58 Cash receipts processed (count) 10,040 8,250 7,800 7,656 Checks processed (count) 108,500 120,000 120,000 120,000 Expenditures to budget ratio -9.00% -8.00% -9.00% 1.00%Earned GFOA Certificate of Excellence for CAFR Yes Yes Yes YesEarned GFOA Certificate for Distinguished
Budget Presentation Yes Yes Yes YesInvoice payment processing (days) 8 10 10 10 Journal entry count (estimated) 2,500 2,000 1,000 1,000
Source of data: various County departments

159
page 1 of 3
2012 2013 2014 2015 2016 2017
229.55 225.71 237.51 242.50 253.27 271.57 325,059 184,074 142,784 147,236 144,327 144,172
N/A N/A 11,689 16,394 17,148 N/A21,350 N/A N/A N/A N/A N/A
8,175 8,740 7,960 8,794 9,979 13,332 68,234 54,698 55,301 59,264 55,375 N/A
178 168 184 181 166 167 30,381 36,715 25,976 32,265 43,285 N/A
36.0% 73.0% 45.0% 55.4% N/A N/A310 403 398 391 397 327
157 173 188 120 103 121 76 74 71 78 71 100 54 44 62 54 75 56 36 36 33 40 30 36 20 19 20 22 22 20 12 11 8 14 15 11
4 2 0 0 2 7 10,564 8,972 18,976 21,732 22,438 40,217
1,800,000 1,800,000 1,719,770 1,498,773 1,465,761 1,345,878 370 343 418 402 467 625
62 85 71 N/A N/A N/A12,023 11,324 11,240 N/A N/A N/A
320,642 373,685 389,272 382,742 391,372 381,388
857 968 695 N/A N/A N/A10,842 10,235 10,239 N/A N/A N/A
114.75 114.75 120.00 121.00 127.14 133.00 8,210 9,470 9,171 9,731 8,922 9,243
51,384 52,242 32,081 30,713 61,811 65,000 N/A -5.00% -5.00% 1.01% 1.16% 1.00%Yes Yes Yes Yes TBD TBD
Yes Yes Yes Yes Yes TBD10 10 12 12 10 10
1,056 925 937 969 1,067 1,089

160
FORT BEND COUNTY, TEXASOPERATING INDICATORS BY FUNCTIONLAST TEN FISCAL YEARS(UNAUDITED)
Function 2008 2009 2010 2011
Administration of JusticeFull-time equivalent count 250.04 256.35 261.90 266.60 Child Support case inquiries N/A 50,758 49,635 52,100 Passport applications (count) 8,835 3,500 2,792 2,144 Passport fees collected 265,050$ 87,500$ 69,805$ 53,600$ Worthless check clearance rate 74.40% 83.60% 97.80% 84.40%Felony case disposition rate 87.40% 87.70% 101.20% 93.50%Misdemeanor case disposition rate 89.10% 99.50% N/A N/AMisdemeanor case dispositions N/A 104.3 96.6 116.6 Community Service rehabilitation hours 73,578 75,652 77,578 73,456 Justice Court case filings - Precinct 1 Place 1 5,569 5,341 5,592 5,170 Justice Court case filings - Precinct 1 Place 2 11,908 11,771 9,377 9,905 Justice Court case filings - Precinct 2 6,102 6,102 7,577 7,000 Justice Court case filings - Precinct 3 15,109 23,409 19,952 20,739 Justice Court case filings - Precinct 4 5,825 8,959 8,517 7,195 Justice Court cases disposed - Precinct 1 Place 1 4,558 4,537 6,262 4,724 Justice Court cases disposed - Precinct 1 Place 2 9,762 11,713 8,537 10,441 Justice Court cases disposed - Precinct 2 4,789 4,789 5,275 5,100 Justice Court cases disposed - Precinct 3 11,517 16,015 16,215 15,821 Justice Court cases disposed - Precinct 4 4,623 6,973 7,502 7,744
Construction and MaintenanceFull-time equivalent count 263.08 272.49 275.21 276.06 Building & right-of-way permits issued 5,500 4,500 4,826 4,260 Tonnage of recyclable diverted from landfills 699 732 676 676 Pounds of hazardous materials collected 145,238 171,109 160,450 160,500 Mileage of drainage channel maintained 2,206 1,988 2,150 1,850 Mileage of county roads - unincorporated areas 1,263 1,404 1,600 1,664 New County road miles constructed -
unincorporated areas 50 35 N/A 20 Health and Human Services
Full-time equivalent count 168.85 157.90 160.42 160.52 Number of clients receiving Social Service
assistance annually 5,094 8,888 6,012 5,924 Number of child immunizations annually 10,791 14,398 11,776 11,367 Number of reportable diseases documented 3,473 1,893 3,175 1,360 Number of food establishments inspected 1,424 825 787 986 Number of septic system applications submitted 471 330 361 360 Number of licensed aerobic systems 5,302 5,896 6,203 6,588 Number of citations issued for aerobic system
non-compliance 3,604 2,521 3,500 3,535 Number of EMS incident responses 26,242 28,603 26,677 26,850 Number of stray animals impounded 3,613 3,615 4,323 4,141 Number of stray animals euthanized 3,204 2,798 3,599 3,408 Number of stray animals adopted 409 817 727 733 Indigent healthcare clients - annual 1,710 1,314 2,996 2,622

161
page 2 of 3
2012 2013 2014 2015 2016 2017
266.41 267.20 281.09 298.02 328.44 345.71 50,150 36,328 33,908 34,971 36,468 40,130
2,909 4,562 6,061 6,638 8,821 9,162 72,725$ 114,050$ 151,525$ 165,950$ 220,525$ 229,050$ 91.20% 79.00% 95.00% 98.00% 95.00% 77.00%91.90% 100.00% 84.00% 84.00% 99.00% 90.00%
N/A N/A N/A N/A N/A N/A111.0 102.2 93.0 103.0 107.0 105.0
70,270 70,605 89,853 85,296 85,586 78,000 5,582 4,646 3,772 4,234 3,916 3,976
11,513 11,581 10,955 10,365 11,306 12,433 6,851 6,616 5,548 5,583 7,115 6,839
19,895 18,744 13,463 15,968 12,361 13,131 5,041 6,064 3,473 4,607 6,993 7,067 4,615 4,913 3,651 4,184 3,808 4,064
10,274 11,938 10,564 9,828 10,098 10,597 7,239 5,429 4,902 9,702 5,989 6,009
16,647 16,656 15,425 18,775 11,798 12,454 4,414 8,338 3,745 4,494 5,302 5,083
266.59 267.71 273.60 269.87 275.19 280.78 5,032 6,400 7,368 8,961 5,212 5,477
702 687 N/A N/A N/A N/A184,943 176,840 N/A N/A N/A N/A
2,100 2,200 2,200 2,000 2,500 2,000 1,655 1,703 1,762 1,815 1,837 1,882
85 80 60 75 75 20
160.25 163.61 165.84 174.64 199.81 209.40
7,074 N/A N/A N/A N/A N/A8,316 5,417 5,000 10,330 10,924 12,520 1,181 1,142 1,250 1,250 1,598 2,013 1,192 1,301 1,403 1,584 2,799 3,312
373 438 470 471 498 467 6,915 7,364 6,776 7,068 7,686 8,086
6,695 6,224 3,523 4,889 4,372 4,631 29,774 31,426 29,414 N/A 24,750 N/A
4,854 4,586 3,867 3,580 3,757 3,386 3,930 3,252 2,498 895 811 773
604 1,154 935 1,336 1,771 1,784 2,325 2,153 1,997 1,699 2,228 2,024

162
FORT BEND COUNTY, TEXASOPERATING INDICATORS BY FUNCTIONLAST TEN FISCAL YEARS(UNAUDITED)
Function 2008 2009 2010 2011
Cooperative ServicesFull-time equivalent count 13.00 14.00 14.00 13.00 Veterans' Services clients 234 458 645 619 Veterans' Services claims submitted 126 228 348 225
Public SafetyFull-time equivalent count 620.35 784.63 776.07 779.87 Number of civil processes received annually Constable Precinct 1 14,000 15,000 16,093 16,434 Constable Precinct 2 N/A 8,827 5,550 6,921 Constable Precinct 3 N/A 7,635 8,963 8,963 Civil Process 24 hour success rate Constable Precinct 4 N/A 86% 78% 75%TCLEOSE training hours held per officer 853 974 1,014 1,203 Homeland security grant funds expended 1,724,700$ 3,917,747$ 5,004,054$ 355,927$ Fire calls responded to annually 6,278 6,927 5,584 7,901
Parks and RecreationFull-time equivalent count 21.87 22.43 22.25 22.67 Number of facility rentals annually 700 845 651 818 Number of park reservations annually 808 955 955 918
Libraries and EducationFull-time equivalent count 182.00 170.00 172.00 218.00 Number of library transactions annually 4,188,249 4,385,041 4,732,773 4,890,834 Library circulation items per capita 1.64 1.61 1.65 1.51

163
page 3 of 3
2012 2013 2014 2015 2016 2017
12.00 12.00 12.00 12.00 11.70 11.70 479 503 471 448 668 671 249 337 376 N/A N/A N/A
785.13 791.98 802.95 805.50 821.01 846.67
15,070 14,510 13,906 13,684 15,603 16,268 7,660 6,606 6,861 7,135 N/A N/A6,927 5,475 3,264 2,867 N/A N/A
84% 85% 85% N/A N/A N/A1,196 1,361 1,246 1,258 1,249 1,318
3,586,852$ 2,692,134$ 2,790,449$ 2,146,261$ 2,454,267$ 2,774,702$ 7,842 7,388 N/A N/A N/A N/A
23.20 23.00 27.34 35.81 36.98 39.06 908 990 1,939 3,126 3,766 3,850
1,010 1,111 1,222 1,688 2,410 2,550
224.00 232.74 230.13 232.26 224.68 233.37 5,094,324 7,098,423 7,108,212 7,253,708 7,426,609 7,070,627
1.58 1.65 1.68 1.59 1.43 1.40

164
FORT BEND COUNTYCAPITAL ASSETS USED IN THE OPERATION OF GOVERNMENTAL FUNDSSCHEDULE BY ACTIVITYLAST TEN FISCAL YEARS(UNAUDITED)
Function 2008 2009 2010 2011General administration 25,143,119$ 21,386,052$ 27,725,376$ 30,424,429$
Financial administration 1,889,426 6,375,329 8,103,759 7,551,132 Administration of justice 35,161,552 147,292,804 189,617,993 213,531,972
Construction and maintenance 703,697,692 791,157,372 850,839,272 919,567,377
Health and human services 4,908,808 12,995,437 16,185,268 20,751,252
Cooperative services 2,287,024 2,256,940 2,300,936 2,312,616
Public safety 97,267,937 26,227,701 29,744,390 30,849,243
Parks and recreation 17,342,600 17,436,639 18,276,965 18,871,156
Libraries and education 29,238,712 37,076,054 41,604,572 48,525,974
Health and wellness clinic 88,810
Total 916,936,870$ 1,062,204,328$ 1,184,398,531$ 1,292,473,961$
Note: In fiscal year 2011, Fort Bend County opened an Employee Health and Wellness Clinic. The capitalassets of the Clinic are recorded in the Employee Benefits Fund, an internal service fund. These capitalassets are shown separately above.
The beginning carrying value of capital assets were restated in fiscal year 2016, and only fiscal year 2016 ending balances have been restated.

165
2012 2013 2014 2015 2016 201731,053,685$ 38,511,978$ 47,788,376$ 47,712,406$ 62,504,936$ 66,298,660$
8,049,094 8,071,200 8,062,148 8,006,260 7,998,874 8,552,805 211,029,100 212,162,704 210,533,760 211,691,340 216,307,886 240,771,460
973,992,987 1,028,923,374 1,072,802,682 1,017,211,011 1,707,617,590 1,828,669,535
22,661,709 23,996,133 24,798,446 26,937,313 31,860,971 35,246,582
2,342,593 2,349,882 2,349,882 2,331,532 2,346,000 2,361,327
33,796,158 35,412,137 37,482,448 37,753,040 40,167,926 41,802,931
19,754,283 23,483,574 28,995,973 30,901,307 31,434,794 40,870,259
49,423,344 52,890,523 56,294,393 56,737,602 57,276,109 58,373,926
677,097 721,184 721,184 726,989 803,133 803,133
1,352,780,050$ 1,426,522,689$ 1,489,829,292$ 1,440,008,800$ 2,158,318,219$ 2,323,750,618$

166