2018 ACCOMPLISHMENT REPORT - Province of Isabela
13
1 Republic of the Philippines Province of Isabela MILAGROS ALBANO DISTRICT HOSPITAL Ngarag, Cabagan, Isabela Telefax No. (078)-323-2815 PHILHEALTH ACCREDITED 2018 ACCOMPLISHMENT REPORT Brief Background. The Milagros Albano District Hospital, Cabagan, Isabela (formerly the Northern Isabela Emergency Hospital(NIEH) was established in 1961 under the Hospital Financing Act of 1939. The hospital was housed at the then Cabagan Dispensary (now RHU). As there was a need to expand the hospital services and facilities when people from other neighboring towns come for consultation and admission, a 25 bed hospital building was constructed at a 1.1 hectares donated land located along the Maharlika Highway, Brgy. Ngarag. In 1974, a 50 bed capacity general hospital was constructed under RA 6566. This is the Milagros Albano District Hospital. In compliance to RA 7160, known as the Local Government Code of 1993, the hospital was devolved to the Provincial Government of Isabela. A new hospital building was constructed alongside the old building and became operational on December 8, 2004. To date, Milagros Albano District Hospital, located at Brgy. Ngarag, Cabagan, Isabela, along the Maharlika Highway, is a Level I hospital as granted by the DOH Licensing Department and Center of Quality by Philhealth Accreditation. As a Level I hospital with an authorized 50 – bed capacity, it is the referral hospital for the Isabela North Inter Local Health Zone and is comprised of the municipalities of Cabagan, San Pablo, Tumauini, Sta. Maria, Delfin Albano, the coastal towns of Maconacon and Divilacan, and Sto. Tomas. For complicated cases which the facility cannot provide, referral to a tertiary hospital, (e.g. CVMC and GFNDY) is warranted. It is owned and operated by the Provincial Government of Isabela. SCOPE OF SERVICES AVAILABLE: Out-patient Services In-Patient Care Emergency Room Services Surgical Services Laboratory Pharmacy Radiology(X-Ray) Dental New Born Screening Mother-Baby Friendly Hospital(Breastfeeding) Animal Bite Treatment Center TB-DOTS (Referring hospital) Immunization (HepaB and BCG at birth) BEMONC Provider Family Planning Blood Station (new)
-
Upload
khangminh22 -
Category
Documents
-
view
0 -
download
0
Transcript of 2018 ACCOMPLISHMENT REPORT - Province of Isabela

1
Republic of the Philippines
Province of Isabela
MILAGROS ALBANO DISTRICT HOSPITAL Ngarag, Cabagan, Isabela
Telefax No. (078)-323-2815 PHILHEALTH ACCREDITED
2018 ACCOMPLISHMENT REPORT
Brief Background.
The Milagros Albano District Hospital, Cabagan, Isabela (formerly the Northern Isabela Emergency Hospital(NIEH) was established in 1961 under the Hospital Financing Act of 1939. The hospital was housed at the then Cabagan Dispensary (now RHU).
As there was a need to expand the hospital services and facilities when people from other neighboring towns come for consultation and admission, a 25 bed hospital building was constructed at a 1.1 hectares donated land located along the Maharlika Highway, Brgy. Ngarag.
In 1974, a 50 bed capacity general hospital was constructed under RA 6566. This is the Milagros Albano District Hospital. In compliance to RA 7160, known as the Local Government Code of 1993, the hospital was devolved to the Provincial Government of Isabela. A new hospital building was constructed alongside the old building and became operational on December 8, 2004.
To date, Milagros Albano District Hospital, located at Brgy. Ngarag, Cabagan, Isabela, along the Maharlika Highway, is a Level I hospital as granted by the DOH Licensing Department and Center of Quality by Philhealth Accreditation. As a Level I hospital with an authorized 50 – bed capacity, it is the referral hospital for the Isabela North Inter Local Health Zone and is comprised of the municipalities of Cabagan, San Pablo, Tumauini, Sta. Maria, Delfin Albano, the coastal towns of Maconacon and Divilacan, and Sto. Tomas. For complicated cases which the facility cannot provide, referral to a tertiary hospital, (e.g. CVMC and GFNDY) is warranted. It is owned and operated by the Provincial Government of Isabela. SCOPE OF SERVICES AVAILABLE:
Out-patient Services In-Patient Care Emergency Room Services Surgical Services Laboratory Pharmacy Radiology(X-Ray) Dental New Born Screening Mother-Baby Friendly Hospital(Breastfeeding) Animal Bite Treatment Center TB-DOTS (Referring hospital) Immunization (HepaB and BCG at birth) BEMONC Provider Family Planning Blood Station (new)
2
VARIOUS ACCOMPLISHMENTS/ACTIVITIES PARTICIPATED:
January 22, 2018 – Medical and Surgical Mission at GFNDSMH, City of Ilagan, Isabela
January 23, 2018 -CABAGAN TOWN FIESTA – Inter-Agency Night.
MADH personnel participated in the LGU Cabagan Inter-Agency Night Retro Dance Competition.Adjudged as Champion
February 4-9, 2018 - JTA FOUNDATION / LAS VEGASSurgical Medical Mission. Held
at MADH
April 24, 2018 – Farmers’ Congress Medical Dental Mission at San Pablo, Isabela
May 7, 2018 – Conducted OPERATION TULI at MADH
May 11, 2018 – Medical Mission at GFNDSMH, City of Ilagan, Isabela
June 21, 2018 – Farmers’ Congress Medical Dental Mission at Cabagan JTA Sports Complex
July 06, 2018 – Medical Dental Mission at San Agustin, Isabela
July 13, 2018 – Medical Dental Mission at GFNDSMH, City of Ilagan, Isabela
July 17, 2018 – Medical Dental Mission at San Isidro, Isabela
July 28, 2018 - MADH personnel participated in the color fun run of RHU Cabagan with the theme “Go Smoke Free Cabagan”
August 2, 2018 – Medical Dental Mission at Mallig, Isabela
August 3-5, 2018 - MADH personnel participated in the PGI Sport Fest 2018 at Provincial Capitol, City of Ilagan
August 8, 2018 – Medical Dental Mission at Jones, Isabela
August 15, 2018 - Massive clean-up activities, “Todas Dengue, Todonato”(Ikalimang Kagat)
August 18, 2018 – Medical Dental Mission at Sto. Tomas, Isabela
August 22, 2018 – Farmers’ Congress at Brgy. Narra, Echague, Isabela
September 7, 2018 – Bloodletting Activity at MADH
September 28, 2018 - MADH employees participated during tree planting at Cansan, Cabagan, Isabela
October 5, 2018–“OPERATION BINGOT”Cleft LipSurgical Mission A joint Project of Philippine Band of Mercy&Provincial Government of Isabela.. Held at MADH
November 28, 2018 - Medical and Dental Mission–Handogni Vice-Governor Antonio T. Albano. Held at MADH.
November 29, 2018 – Medical Dental Optical Mission at Tumauini, Isabela
December 11, 2018 - PGI Hataw Competition at Provincial Capitol, City of Ilagan, Isabela, Adjudged as Overall Champion
December 14, 2018 – Medical Mission at Brgy. Masipi West, Cabagan, Isabela
SPECIAL AWARDS:
2018 Outstanding New Born Screening Implementer in Region 02

3
OTHER MAJOR PROJECTS/PROGRAM UNDERTAKEN:
Infrastructure: Major Repair/Renovations of the hospital implemented under the Health Facility Enhancement Program of the Department of Health.
For CY 2018, Milagros Albano District Hospital have served:
PHILHEALTH
FORMAL 417
INFORMAL 503
SENIOR CITIZEN 568
INDIGENT 1,935
NON-PHILHEALTH 1,073
HEALTHCARE 53
MEDICAL ASSISTANCE PROGRAM
181
TOTAL ADMISSION 4,730
Animal Bite Treatment Center Total Number of Patients Served 3,878
Newborn Screening Percentage Inborn (94.39%) 741 Outborn 19 Family Planning 1,036 mothers catered TB-DOTS 150 patients referred to
RHU
8.82% 10.63%
12.01%
40.91%
22.68%
1.12% 3.83%
% OF PATIENTS SERVED
FORMAL
INFORMAL
SENIOR CITIZEN
INDIGENT
NON-PHILHEALTH
HEALTHCARE
MEDICAL ASSISTANCEPROGRAM

4
HOSPITAL OPERATIONS.
A. Summary of Patients in the Hospital
Inpatient Care Number
Total Admissions(January 1 to December 31) 4,730
Total Discharges(Alive) including HAMA and Absconded 4,649
Total number of inpatient bed days(service days) 12,879
Total number of inpatients transferred from this facility to another facility for inpatient care
366
Total number of patients remaining in the hospital as of midnight of December 31
31
B. Discharges
TYPE OF SERVICE CONDITION ON DISCHARGE
ALIVE DEATHS
Medicine 1,404 48
Obstetrics 812
Gynecology 67
Pediatrics 1,428 2
Surgery Pedia 59
Surgery Adult 97
Pathologic 109
Non-Pathologic 0
Well Baby 673
TOTAL 4,649 50
% OF DISCHARGES
0%
10%
20%
30%
40%
50%
60%
70%
80%
90%
100%
29.88%
17.28%
1.43%
30.39%
1.26% 2.06% 2.32% 0.00%
14.32%
1.02% 0.00% 0.00% 0.04% 0.00% 0.00% 0.00% 0.00% 0.00%
ALIVE
DEATHS

5
Average Monthly Admission 394
Average Length of Stay of Admitted Patients (2.7 days) 2-3 days
Ten Leading Causes of Morbidity based on final discharge diagnosis
Cause of Morbidity/Illness/Injury(Do not include deliveries) Number 1. PNEUMONIA 837
2. ACUTE GASTROENTERITIS 571
3. URINARY TRACT INFECTION 391
4. DENGUE FEVER 209
5. CHRONIC LOWER RESPIRATORY DISEASES 165
6. HYPERTENSIVE EMERGENCY/URGENCY 151
7. GASTRITIS 91
8. ANEMIA 42
9. CVA 37
10. RESPIRATORY INFECTION 36
Total number of deliveries
Deliveries Number
Total number of in-facility deliveries 797
Total number of vaginal deliveries(normal spontaneous) 794
Total number of live-birth C-section deliveries(Caesarians)
2
Total number of other deliveries(forceps delivery, vacuum extraction)
15
33.08%
22.57%
15.45%
8.26% 6.52% 5.97% 3.60% 1.66% 1.46% 1.42%
0%
10%
20%
30%
40%
50%
60%
70%
80%
90%
100%
% OF TOP 10 CAUSES OF MORBIDITY BASED ON FINAL DISCHARGE DIAGNOSIS

6
Outpatient Visits, including Emergency care, Testing and other Services
Outpatient Visits(Count visits, not patient) Number
Number of outpatient visits, new patient 14,143
Number of outpatient visits, re-visit 4,913
Number of outpatient visits, adult(Age 19 y.o. and above) 11,703
Number of outpatient visits, pediatrics( Age 0 to 18 y.o.) 7,353
Number of adult general medicine outpatient visits 7,517
Number of Specialty(non-surgical)outpatient visits(Ex. ENT, Optha, Urology, Oncology, etc)
17,572
Number of surgical outpatient visits 1,484
Number of antenatal/prenatal visits 214
Number of postnatal care visits until 42nd day post partum/post delivery
360
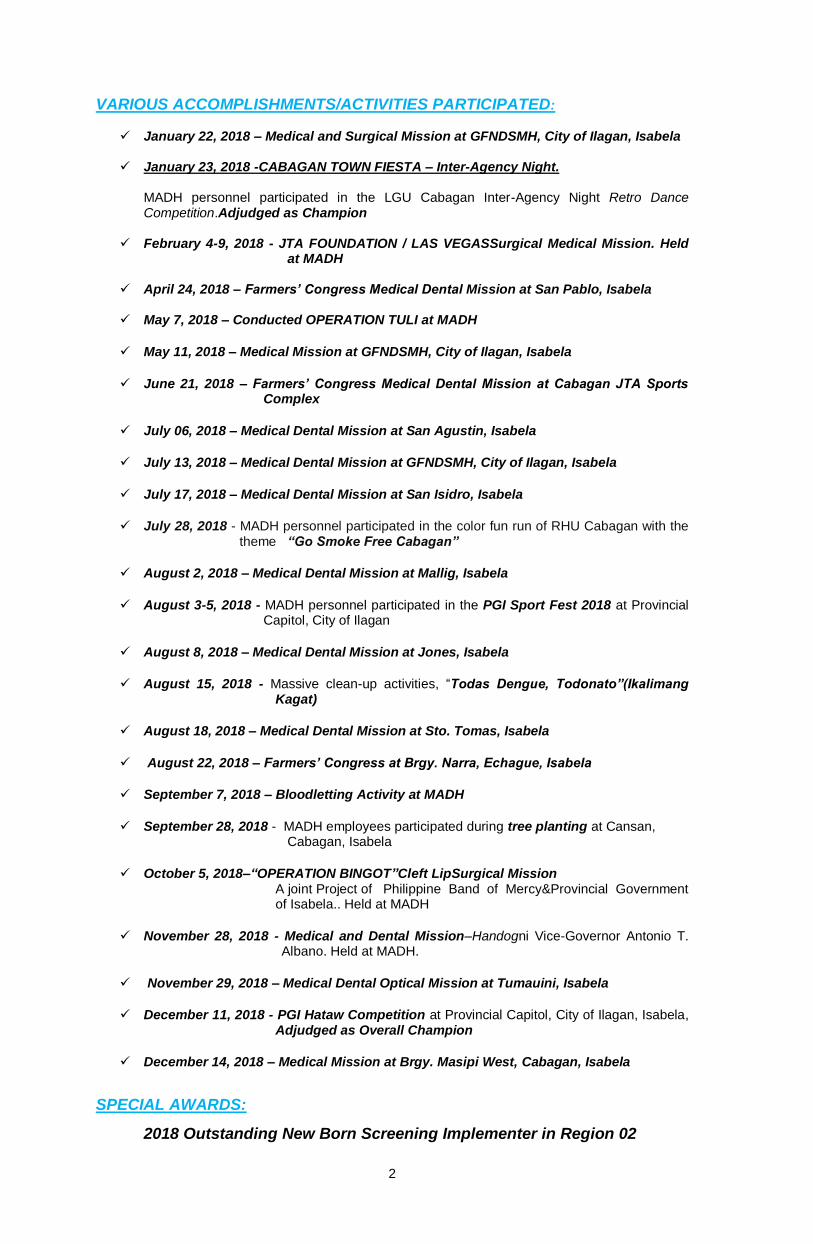
Ten Leading OPD Consultations Number
1. Injury to unspecified body region 3,878
2. Acute upper respiratory infections 3,584
3. Other diseases of the urinary system 1,286
4. Dermatitis and eczema 969
5. ATP 948
6. Other acute lower respiratory infections 724
7. Infections of the skin and subcutaneous tissue 612
8. MSD 588
9. OB/GYNE 570
10. Disease of esophagus, stomach and duodenum 478
49.56% 49.38%
0.12% 0.93%
0%
10%
20%
30%
40%
50%
60%
70%
80%
90%
100%
In-facility deliveries NSD Caesarian Delivery Forceps delivery,vacuum extraction
% OF DELIVERIES
7
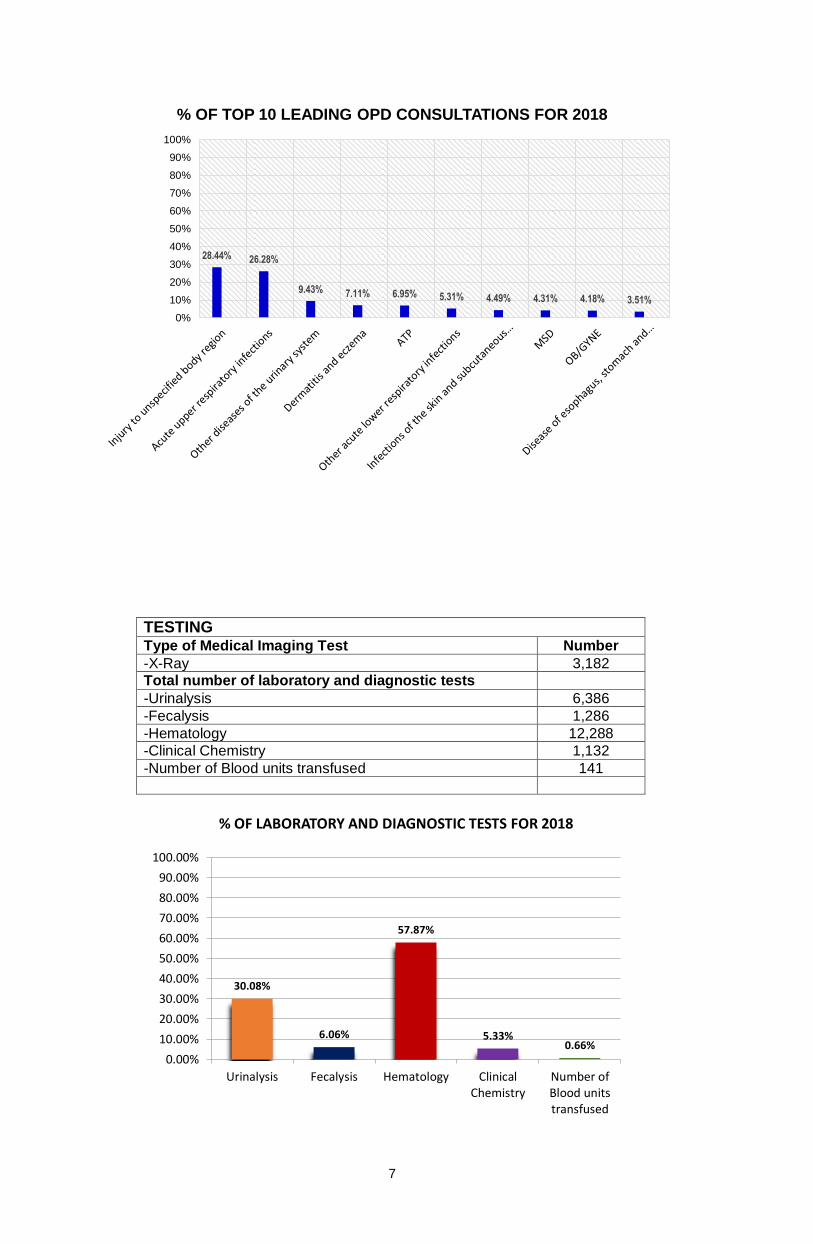
TESTING Type of Medical Imaging Test Number
-X-Ray 3,182 Total number of laboratory and diagnostic tests
-Urinalysis 6,386
-Fecalysis 1,286
-Hematology 12,288
-Clinical Chemistry 1,132
-Number of Blood units transfused 141
28.44% 26.28%
9.43% 7.11% 6.95% 5.31% 4.49% 4.31% 4.18% 3.51%
0%
10%
20%
30%
40%
50%
60%
70%
80%
90%
100%
% OF TOP 10 LEADING OPD CONSULTATIONS FOR 2018
30.08%
6.06%
57.87%
5.33% 0.66%
Urinalysis Fecalysis Hematology ClinicalChemistry
Number ofBlood unitstransfused
0.00%
10.00%
20.00%
30.00%
40.00%
50.00%
60.00%
70.00%
80.00%
90.00%
100.00%
% OF LABORATORY AND DIAGNOSTIC TESTS FOR 2018

8
Emergency Visits Number
Total number of emergency department visits 14,081
Total number of emergency department visits, adult 8,279
Total number of emergency department visits, pediatric 5,802
Total number of patients transported from this facility’s ER department to another facility for inpatient care
402
Ten Leading ER Consultation(excluding non-emergency cases)
Number
1. Injury of unspecified body region 2,008
2. Acute upper respiratory infections 1,239
3. Other diseases of the urinary system 1,191
4. Intestinal infectious diseases 1,037
5. Hypertensive diseases 873
6. Diseases of esophagus, stomach and duodenum 663
7. Influenza and pneumonia 650
8. Chronic lower respiratory diseases 310
9. Other viral diseases 299
10. Arthropod-borne viral fevers and viral hemorrhagic fevers
208
C. Deaths
Types of Death Number
Total deaths 50
Total number of inpatient deaths
Total deaths < 48 hours 48
Total deaths ≥ 48 hours 2
Total number of emergency room deaths (Arrived at ER still with signs of life and died at the ER before patient is admitted. Not included are deaths of admitted patients staying in ER awaiting available room or bed)
13
Total number of cases declared “dead on arrival” (Arrived at ER with no signs of life even after resuscitation)
34
Total number of stillbirths (Newborn delivered with no signs of life even after resuscitation)
1
23.68%
14.61% 14.05% 12.23% 10.30% 7.82% 7.67% 3.66% 3.53% 2.45%
0%
10%
20%
30%
40%
50%
60%
70%
80%
90%
100%
% OF TEN LEADING ER CONSULTATION (EXCLUDING NON-EMERGENCY CASES)

9
1. Gross Death Rate 1.06% 2. Net Death Rate 0.04%
3. Ten Leading Causes of Mortality/Deaths and Total Number of Mortality/Deaths
Mortality/Death(underlying cause of death)(Cardio respiratory arrest no included)
Number
1. Pneumonia 21
2. Chronic Lower Respiratory Diseases 9
3. CVA 5
4. Lung CA 2
5. Sepsis 2
6. Pancreatic CA 1
7. Breast CA 1
8. Acute Gastroenteritis 1
9. CHF 1
10. Myocardial Infarction 1
D. Surgical Operations
10 Leading Major Operations(Excluding Caesarian Section)
Number
1. OR + Pinning 26
2. Removal of Implant 15
3. OR + Plating 13
4. OR + IM Nailing 6
5. CR + RAEF 5
6. PHRA + BC 5
7. DEBT + Pinning 3
8. CR + Pinning 3
9. DEBT + RAEF 2
10. Debridement + Arthrotomy 2
42.00%
18.00% 10.00%
4.00% 4.00% 2.00% 2.00% 2.00% 2.00% 2.00%
0%10%20%30%40%50%60%70%80%90%
100%
% OF TEN LEADING CAUSES OF MORTALITY

10
10 Leading Minor Operations Number
1. MINILAP BTL 4
2. Debridement 4
3. Excision of Mass 3
4. Excision 2
5. Excision of Lypoma 2
6. Excision of Hernia 2
7. Excision of Total Hysterectomy 1
8. Excision of Lypoma Back 1
9. Excision Biopsy Bakers Cyst 1
10. Excision of Anal Fistula 1
21.67% 12.50% 10.83%
5.00% 4.17% 4.17% 2.50% 2.50% 1.67% 1.67%
0%10%20%30%40%50%60%70%80%90%
100%
% OF TEN LEADING SURGICAL OPERATIONS
19.05% 19.05% 14.29%
9.52% 9.52% 9.52% 4.76% 4.76% 4.76% 4.76%
0%10%20%30%40%50%60%70%80%90%
100%
% OF TEN LEADING MINOR OPERATIONS

11
PERFORMANCE REPORT OF CY 2018
I. GENERAL INFORMATION Classification General
Authorized Bed Capacity 50
Actual Implementing 50
Service Capability Level I as DOH License
Accreditation Primary Care by PHIC
Nature of Ownership Provincial Government of Isabela II. UTILIZATION OF HOSPITAL SERVICES
Total in-patients Admission(excluding New Born 3,945
New Born 785
Total Discharges (Alive) 4,649
PHIC 3,397
NON-PHIC 1,302
Isabela Provincial Health Care 53
Bed Occupancy Rate(Standard 85%) 70.57%
Consultation Rate 100%
Admission-Consultation Ratio 1:6
Average Length of Stay 2-3 days
TOTAL SURGICAL OPERATIONS
Ceasarian Section 2
Major Operation 120
Minor Operation 21
TOTAL NUMBER OF DELIVERIES
Normal Spontaneous Delivery 795
TOTAL LABORATORY TEST PERFORMED
Urinalysis 6,386
Fecalysis 1,286
Hematology 12,288
Clinical Chemistry 1,132
Blood Banking 141
New Born Screening(Standard 85%) 741
Total X-ray Performed 3,142
TOTAL PRESCRIPTION FILLED (Standard 80%) 100%
TOTAL REFERRALS
Referred to other hospital 366
Referred from RHU
TOTAL DEATHS (In-patient including Neonatal deaths)
Dead on arrival 34
ER Death 13
Net Death Rate .04% GROSS DEATH RATE 1.06%
GROSS INFECTION RATE 0
MATERNAL MORTALITY RATE 0
NEONATAL MORTALITY 0 INFANT MORTALITY RATE 0
STILLBIRTH 1 TOTAL NUMBER OF PATIENTS SERVED AT ER 14,458 TOTAL NUMBER OF PATIENTS SERVED AT OPD 19,056
TOTAL NUMBER OF ADMISSIONS 4,730

12
LGU SCORECARD
INDICATORS
Performance Standard
2018
ACCOM. ACHIEVED (Green Color)
NOT ACHIEVED (Red color)
OUTCOME/OUTPUT MEASURES
Actual Bed Occupancy 42 35
Bed Occupancy Rate 85% 70.57%
Average Length of Stay 3 days 2-3 days
Consultation Rate 50-100% 100%
Laboratory utilization rate 200-300% 261.5%
Net Death Rate (total number of deaths less than 48 hours in the hospital) 4-5% 0.04%
Gross Death Rate (all deaths in the hospital including deaths less than 24 hours) 3-4% 1.06%
Maternal Death Rate 0 0
Neonatal Death Rate <2% 0
Fetal Death Rate <2% 0
Infant Death Rate <2% 0
Post-Op Death Rate Up to 1% 0
Post-Op Infection Rate 10-15% 0
Gross Infection Rate (ratio of infections following clean wound operations or births or have developed in medical cases after admission to hospital) 10-15% (?) 0
Cesarean Section Rate 2 cases
Filled Prescription Rate 80% 100%
% of Indigent Patients served 10-15% 40.91%
Admission : Consultation Ratio 1:10 1:6
PUBLIC HEALTH PROGRAMS IMPLEMENTATION (Hospital as Center of Wellness)
TB-DOTS
1. No. of TB cases diagnosed by sputum microscopy 22
2. No. of TB cases diagnosed by sputum microscopy referred to RHU for treatment 0
3. No. of TB cases diagnosed by X-ray (assumed / to be consider) 64
4. No. of TB cases diagnosed by X-ray referred for sputum microscopy 64

13
INDICATORS
Performance Standard
2018
ACCOM. ACHIEVED (Green Color)
NOT ACHIEVED (Red color)
5. No. of sputum positive cases initiated treatment 0
6. No. of TB patients under-going DOTS 86
MALARIA Program
1. No. of malaria cases diagnosed by thick and thin smear - 0
2. BSMP accuracy rate 85% 100%
MOTHER BABY FRIENDLY CERTIFIED
1. No. of newborns initiated breast feeding 100% 100%
NEWBORN SCREENING
1. No. of newborn with newborn screening 85% 94.39%
FAMILY PLANNING
1. No. of BTL performed 12
2. No. of Implant inserted 83
3. No. of IUD clients 139
REFERRAL SYSTEM
1. % of cases admitted with referral slip from RHU 148
2. % of cases discharged with referral slip to RHU 153
3. % of cases referred to higher facilities 350
Category of DOH-LTO Level I
Category of PHIC Accreditation Level I
PHIC patients served:
1. Percent indigent PHIC cardholder 40.91%
2. Percent IP PHIC cardholder 10.63%
3. Percent PHIC formal sector members 8.82%
4. Percent PHIC non-paying members 22.68%
Prepared by:
ARLENE M. LAZARO, MD, MSPH, FPSMS PHO I – FHS & OIC – Chief of Hospital