2017/18 Knowledge Sharing Program with Visegrad Group:
351
2017/18 Knowledge Sharing Program with Visegrad Group: I nnovati on P oli cy f or SMEs in the Er a of I ndustry 4. 0
-
Upload
khangminh22 -
Category
Documents
-
view
0 -
download
0
Transcript of 2017/18 Knowledge Sharing Program with Visegrad Group:

2017/18 Knowledge Sharing Programwith Visegrad Group:
Innovation Policy for SMEs in the Era of Industry 4.0

2017/18 Knowledge Sharing Program with Visegrad Group

2017/18 Knowledge Sharing Program with Visegrad Group
Project Title
Prepared by
Supported by
Prepared for
In Cooperation with
Program Directors
Project Manager
3URMHFW�2I¿FHUV
Senior Advisor
Principal Investigator
Authors
English Editor
Innovation Policy for SMEs in the Era of Industry 4.0
Korea Development Institute (KDI) Ministry of Economy and Finance (MOEF), Republic of Korea
Visegrad Group (Czech Republic, Hungary, Republic of Poland, Slovak Republic)
Czech Republic, Ministry of Industry and Trade (MIT) Technology Agency of Czech Republic (TACR)Hungary, Ministry of Foreign Affairs and Trade (MFA)� 1DWLRQDO�5HVHDUFK��'HYHORSPHQW��DQG�,QQRYDWLRQ�2I¿FH�RI�+XQJDU\��15',�Republic of Poland, Ministry of Entrepreneurship and Technology (MET) World Economy Research Institute at Warsaw School of Economics (WERI, SGH)Slovak Republic, Ministry of Economy (MOE) Slovak Innovation and Energy Agency (SIEA)
Youngsun Koh, Executive Director, Center for International Development (CID), KDI Kwangeon Sul, Visiting Professor, KDI School of Public Policy and Management, Former Executive Director, CID, KDI
Kwangeon Sul, Visiting Professor, KDI School of Public Policy and Management
Jinyoung Pack, Senior Research Associate, Division of Development Research, CID, KDIDaehong Kim, Senior Research Associate, Division of Development Research, CID, KDI
Ho-Jin Lee, Senior Advisor, Yulchon LLC.
6XQJFKXO�&KXQJ��3UHVLGHQW��.RUHD�$VVRFLDWLRQ�IRU�WKH�$GYDQFHPHQW�RI�6FLHQWL¿F�&XOWXUH
Chapter 1. Jin Gyu Jang, Senior Research Fellow, Science and Technology Policy Institute (STEPI)Chapter 2. Richard Hlavatý, Director General, Ministry of Industry and Trade Martin Hromada, Professor, Tomas Bata University in Zlin Vladimir Kebo, Expert, TACRChapter 3. Joonmo Ahn, Professor, Sogang University&KDSWHU����0iUWRQ�3HWH��&RQVXOWDQW��1DWLRQDO�5HVHDUFK��'HYHORSPHQW��DQG�,QQRYDWLRQ�2I¿FHChapter 5. 6XQJFKXO�&KXQJ��3UHVLGHQW��.RUHDQ�$VVRFLDWLRQ�IRU�WKH�$GYDQFHPHQW�RI�6FLHQWL¿F�&XOWXUHChapter 6. Marzenna Anna Weresa, Professor, WERI, SGH� $UNDGLXV]�0LFKDá�.RZDOVNL��$VVRFLDWH�3URIHVVRU��:(5,��6*+ Marta Mackiewicz, Assistant Professor, WERI, SGHChapter 7. Heejun Park, Professor, Yonsei UniversityChapter 8. Artur Bobovnicky, Director, SIEA
IVYFORCE
Government Publications Registration Number 11-1051000-000826-01ISBN 979-11-5932-311-9 94320ISBN 979-11-5932-302-7 (set)
Copyright ⵑ 2018 by Ministry of Economy and Finance, Republic of Korea

2017/18 Knowledge Sharing Program with Visegrad Group:
Innovation Policy for SMEs in the Era of Industry 4.0
(PWFSONFOU�1VCMJDBUJPOT�3FHJTUSBUJPO�/VNCFS
��������������������

Preface
Knowledge is a vital ingredient that determines a nation’s economic growth and social
development. Its true value was brought to light by the advent of the knowledge economy and a key
question policymakers now face, especially in developing countries, is how an environment can be
established that encourages and facilitates the creation and dissemination of knowledge across the
nation. This need has led many countries to engage themselves in active policy dialogue to share their
development experiences and benefit from mutual learning.
Korea’s development has also depended heavily on knowledge. Its remarkable transition from
a predominantly agrarian economy to an industrialized country was made possible by its well-
rounded and extensive understanding of technology, management, public policy, and other diverse
issues acquired from domestic and foreign sources and through trial and error. Building on these rich
experiences, the Korean Ministry of Economy and Finance (MOEF) launched the Knowledge Sharing
Program (KSP) in 2004 to assist partner countries to improve their policymaking. KSP, as implemented
by Korea Development Institute (KDI), focuses on providing solutions customized to each country’s
economic, social and administrative settings, building capacity for effective policymaking and
strengthening global networks for development cooperation. In 2017/18, KSP policy consultations
were organized with 31 partner countries, with Mekong River Commission joining the partnership for
the first time.
The 2017/18 KSP with Visegrad Group (V4) was undertaken by the MOEF and the Ministry of
Industry and Trade of Czech Republic (MIT), Technology Agency of Czech Republic (TACR), Ministry of
Foreign Affairs and Trade of Hungary (MFA), National Research, Development, and Innovation Office
of Hungary (NRDI), Ministry of Entrepreneurship and Technology of Poland (MET), World Economy
Research Institute at Warsaw School of Economics (WERI), Ministry of Economy of Slovak Republic (MOE),
and Slovak Innovation and Energy Agency (SIEA) with the aim of sharing “Innovation Policy for SMEs
in the Era of Industry 4.0.” To that end, the KDI research team and the V4 counterpart made a range of
collaborative efforts by exchanging development experiences, conducting joint studies and designing
a policy action plan in line with the countries’ development targets.

With that, it is with great optimism for the future of the V4 that the results of the 2017/18 KSP
are presented. I firmly believe that KSP will serve as a stepping stone to further elevate the mutual
learning and economic cooperation between the two countries and hope it will contribute to the V4’s
sustainable development in the future.
I wish to convey my sincere gratitude to Senior Advisor Ambassador Ho-Jin Lee, Principal
Investigator Dr. Sungchul Chung as well as project consultants Dr. Jin Gyu Jang, Prof. Heejun Park, and
Prof. Joonmo Ahn for their extensive contributions to the successful completion of the 2017/18 KSP
with Visegrad Group (V4). I am also grateful to Executive Director Dr. Youngsun Koh, Project Manager Dr.
Kwangeon Sul, Project Officer Ms. Jinyoung Pack and Mr. Daehong Kim and all members of the Center
for International Development for their hard work and dedication. Lastly, I extend my warmest thanks
to the MIT and TACR of Czech Republic, MFA and NRDI of Hungry, MET and WERI of Poland, MOE and
SIEA of Slovakia and related V4 agencies for their active cooperation and great support.
Jeong Pyo Choi
President
Korea Development Institute (KDI)

2017/18 KSP with Visegrad Group 019
Executive Summary 024
Part I R&D and Innovation Policies to Enhance Energy Security
Summary 032
1. Introduction 035
2. Changes in the Perspective of Energy Security in Korea 037
2.1. Conventional Perspective of Energy Security 037
2.2. Changes in Energy System to Affect the Perspective of Energy Security 037
3. Energy Security and R&D and Innovation (RDI) 041
3.1. Strategies for Energy RDI in Korea 041
3.2. RDI Investment Policy for Energy Industry by the Ministry of Trade, Industry,
and Energy (MOTIE) 042
3.3. RDI to Secure and Stable Energy Supply 048
3.4. RDI to Improve Efficiency of Energy Consumption 052
3.5. RDI to Strengthen Protection of Energy Facilities or Infrastructure 057
4. Policy suggestions 068
5. Suggestions for Cooperation with Czech Republic in RDI Activities 070
References 072
1. Introduction 074
1.1. Topic Identification 074
1.2. Research Design 075
2. Current Policy Issues in Czech Republic 078
2.1. Background 078
Contents
..........................................................................................
.............................................................................................................
..........................................................................................................................
............................................................................................................
...................................................
............................................................
........................
..............................................................
.........................................................................
............................................................................................
..................................................................
....................................................
..............................
.....................................................................................................
...................................
........................................................................................................................
............................................................................................................
.............................................................................................
.................................................................................................
.........................................................................
.......................................................................................................
Chapter 1
R&D and Innovation Policies to Enhance Energy Security (Korea)
Chapter 2
R&D and Innovation Policies to Enhance Energy Security (Czech Republic)

2.2. Policy and Regulation 078
2.3. Literature Review 079
3. Recommended Types of Procedures, Principles and Measures for Resolving
a Crisis Situation 086
4. SWOT Analysis 087
5. Discussion and Policy Implications 089
5.1. Role of R&D and Innovation for Strengthening Energy Security 089
5.2. RDI to Strengthen Energy Security and Future Tasks 090
5.3. Energy Security and Role of SMEs 091
5.4. Policy Suggestions to Activate RDI for Energy Security 093
5.5. Follow-up Plans (Short-term/Long-term) 095
6. Conclusions 100
References 101
Part II Fostering Innovative SMEs: With a Focus on Technology Transfer
Summary 106
1. Introduction 107
2. Challenges of Technology Transfer in Hungary 110
2.1. Overview 110
2.2. External Evaluation 111
2.3. Qualitative Analysis 113
3. Analysis on Korean Experience 117
3.1. Legal Foundation for Technology Transfer 117
3.2. Case Study: Sogang University 131
3.3. Absorptive Capacity: SME Accreditation 135
3.4. Government-funded Institutions 138
..........................................................................................
...............................................................................................
......................................................................................................
.........................................................................................................
...............................................................................
..................................
.................................................
..........................................................................
...............................................
.................................................................
.............................................................................................................
........................................................................................................................
..........................................................................................................................
............................................................................................................
..............................................................
..........................................................................................................
.............................................................................................
............................................................................................
...................................................................................
..............................................................
...............................................................................
.................................................................
...........................................................................
Chapter 3
Fostering Innovative SMEs: With a Focus on Technology Transfer (Korea)

Contents
4. Conclusions and Policy Implications 146
4.1. Implications from Korean Experience 146
4.2. Policy Roadmap 151
4.3. Further Consideration 152
References 155
Appendix 157
Summary 162
1. Introduction 163
1.1. Topic Identification 163
1.2. Research Design 164
2. Current Status and Policy Issues 164
2.1. Background 164
2.2. Current Status in Various Aspects 170
2.3. Strategic Responses 176
2.4. Strengths, Weaknesses, Opportunities, and Threats (SWOT) Analysis based on
the Current State Identification 180
3. Conclusions and Policy Implications 181
References 183
Part III Policy Incentives for R&D and Innovation in SMEs
Summary 188
1. Introduction 190
1.1. Why Innovation Policy for SMEs? 190
1.2. Study Objective 191
.............................................................................
.....................................................................
..................................................................................................
.........................................................................................
........................................................................................................................
..........................................................................................................................
..........................................................................................................................
............................................................................................................
.............................................................................................
.................................................................................................
..................................................................................
.......................................................................................................
..........................................................................
.............................................................................................
.............................................................................
.............................................................................
........................................................................................................................
..........................................................................................................................
............................................................................................................
...........................................................................
..................................................................................................
Chapter 4
Fostering Innovation in SMEs: Focus on Technology Transfer in Hungary (Hungary)
Chapter 5
Policy Incentives for R&D and Innovation in SMEs: Accomplishments and Issues (Korea)

1.3. Structure of the Report 192
2. SMEs in Korea’s National Innovation System 192
2.1. National Innovation System: Key Features 192
2.2. R&D and Innovation Capacity of SMEs 195
2.3. Role of SMEs in Industrial R&D and Innovation 199
3. Policy Incentives for SMEs’ R&D and Innovation 202
3.1. Evolution of Innovation Policy for SMEs: A Brief Review 202
3.2. Structure of Incentives for Industrial R&D and Innovation 204
3.3. Key Features of the Incentive System 213
4. The Effectiveness of the Major Incentive Programs: Tax Incentives and R&D Grants 214
4.1. An Overall Assessment 214
4.2. Effectiveness of Tax Incentives for R&D and Innovation 216
4.3. Effectiveness of R&D Grants for SMEs 223
4.4. Accomplishments and Issues 229
5. Conclusion: Policy Implications for the V4 and Korea 234
5.1. Summary 234
5.2. Issues 236
5.3. Policy Implications 237
References 239
1. Introduction 244
1.1. Industry 4.0 in Poland 245
1.2. Why Support Digitalization of SMEs? 248
2. Existing Programs Supporting SMEs Innovation in Poland: An Overview 250
3. Analysis of the Effects of Selected Policy Instruments 252
3.1. Tax Incentives 252
3.2. The De minimis Guarantee Scheme 258
.......................................................................................
.................................................................
..............................................................
...................................................................
........................................................
.............................................................
............................................
..........................................
.....................................................................
.............
........................................................................................
.............................................
.....................................................................
.................................................................................
......................................................
...........................................................................................................
................................................................................................................
..............................................................................................
........................................................................................................................
............................................................................................................
..........................................................................................
.....................................................................
............................
......................................................
....................................................................................................
.......................................................................
Chapter 6
Innovation Policy for SMEs in the Era of Industry 4.0: Policy Measures to Strengthen Innovation Capacity of SMEs (Poland)

3.3. Grants for Industrial Research and Development Works Carried out by Enterprises 263
4. Comparative Analysis of Selected Policy Measures 267
5. Conclusions 272
6. Policy Implications 274
References 281
Part IV Promotion of Smart Production Systems for SMEs: Robotics and Automotive Industry
Summary 286
1. Introduction 287
1.1. Topic Identification 287
1.2. The Importance of Smart Production Systems 288
1.3. Structure of the Paper 290
2. Current Policy Issues in Slovakia 290
2.1. Policy for SMEs 290
2.2. Robotics Industry 292
2.3. Automotive Industry 293
3. Experience of Korea 302
3.1. Policy for SMEs 302
3.2. Robotics Industry 313
3.3. Automotive Industry 318
4. Conclusions and Policy Implications 323
4.1. Implications 323
4.2. Follow-up Plans 325
References 326
Contents
........
..........................................................
.............................................................................................................
....................................................................................................
........................................................................................................................
..........................................................................................................................
............................................................................................................
.............................................................................................
..........................................................
.........................................................................................
..................................................................................
...................................................................................................
................................................................................................
...........................................................................................
.................................................................................................
...................................................................................................
................................................................................................
...........................................................................................
.............................................................................
.......................................................................................................
..................................................................................................
........................................................................................................................
Chapter 7
Promotion of Smart Production Systems for SMEs: Robotics and Automotive Industry (Korea)

Summary 330
1. Introduction 332
1.1. Objective of the Study: Smart Production Systems for SMEs 334
1.2. Organization of Study and Report 336
2. EDP and Results with Impact on Promotion of Smart Production Systems 336
2.1. Megatrends and Their Impact on Slovak Enterprises 337
2.2. R&D Infrastructure - Identification of Current State 343
2.3. Specific Development Trends for Industry 4.0 and Areas of Future R&D Support 344
3. Conclusions and Policy Implications 346
References 349
..........................................................................................................................
............................................................................................................
.......................................
.........................................................................
..........................
.................................................
..................................................
...........
.............................................................................
........................................................................................................................
Chapter 8
Promotion of Smart Production Systems for SMEs: Robotics and Automotive Industry (Slovakia)

Chapter 1
Chapter 3
Chapter 5
Contents | List of Tables
<Table 1> 2017/18 Korea-V4 KSP Team 021
<Table 1-1> Major Direction of Energy R&D Investment 042
<Table 1-2> Strategy for Energy R&D Investment by Area 043
<Table 1-3> Total Energy R&D Investment during 2012-2016 045
<Table 1-4> Scientific and Technological Output from the Energy R&D Program 046
<Table 1-5> Economic and Social Effects from the Energy R&D Program 046
<Table 1-6> Government R&D Investment in Six Clean Energy Areas 047
<Table 1-7> Government R&D Investment in 14 Clean Energy Technology Areas 047
<Table 3-1> Innovation Capacity Comparisons 111
<Table 3-2> Innovation Index Change 113
<Table 3-3> Institution List for In-depth Interviews 114
<Table 3-4> Various Cases of Technology Transfer 117
<Table 3-5> Evaluation Criteria for Industry–University Cooperation Professors 129
<Table 3-6> Entrepreneurship Promotion 130
<Table 3-7> Incentives for Corporate R&D Center Accreditation 136
<Table 3-8> Industry Distribution of Corporate R&D Centers 138
<Table 3-9> Tax Benefit 145
<Table 5-1> Resource Allocation by the Nature of R&D 194
<Table 5-2> Industrial R&D by Sector 194
<Table 5-3> Focus of Manufacturing R&D 194
<Table 5-4> Concentration of Industrial R&D Activities 195
<Table 5-5> Objectives of Business R&D and Innovation 199
<Table 5-6> Average Sales per Enterprise and SMEs’ Share of BERD by Industry in 2015 200
<Table 5-7> SMEs’ Share of R&D in Industries of Different Technology Intensities 201
<Table 5-8> Number of Incentive Programs by Sponsoring Agencies 206
<Table 5-9> Number of Incentives by Eligibility 206
<Table 5-10> Tax Incentive for SMEs’ R&D and HRD 208
..............................................................................
.........................................................
.......................................................
...................................................
.........................
....................................
........................................
........................
.......................................................................
..................................................................................
................................................................
..................................................................
...........................
.............................................................................
...............................................
...................................................
.....................................................................................................
...........................................................
...................................................................................
............................................................................
...........................................................
..........................................................
...............
.......................
.........................................
.....................................................................
.................................................................

Chapter 6
<Table 5-11> Government R&D Grants for SMEs 209
<Table 5-12> Requirements for R&D Centers and R&D Divisions 212
<Table 5-13> Eligibility for R&D and Innovation Incentives 213
<Table 5-14> SMEs’ Evaluation of the Incentive Programs 215
<Table 5-15> SMEs’ Awareness and Utilization of R&D Incentive Programs 216
<Table 5-16> Tax Deductions by Major Programs: 2016 217
<Table 5-17> Tax Deductions for R&D and Innovation 218
<Table 5-18> Distribution of Tax Deductions between SMEs and LEs* 218
<Table 5-19> Summary of Empirical Studies on the Effectiveness of the Tax Subsidy Programs 222
<Table 5-20> Allocation of Government R&D Funds 224
<Table 5-21> R&D and Innovation Grants for SMEs: 2011-2015 225
<Table 5-22> Number of R&D Grant Projects and SME Awardees 226
<Table 5-23> Summary of Empirical Studies on the Effectiveness of R&D Grants on Business
R&D and Innovation 228
<Table 5-24> Structural Shift of SMEs 231
<Table 5-25> Contribution of SMEs and LEs to the Growth of Employment and Value Addition:
Manufacturing Industry 232
<Table 6-1> Percentage of Companies Declaring High Level of Digitization in the Selected Area:
Poland Compared to the World 247
<Table 6-2> The Use of Tax Relief for Buying New Technologies in Poland,
Corporate Income Tax (CIT), 2006-2016 253
<Table 6-3> The Use of Tax Relief for Buying New Technologies in Poland,
Personal Income Tax (PIT), 2007-2015 254
<Table 6-4> Tax Relief for R&D in Poland – Evolution, 2016-2018 256
<Table 6-5> The Use of Tax Relief for R&D in Poland, 2016 257
<Table 6-6> Measure 1.1 R&D Projects of Enterprises 264
<Table 6-7> Level of Funding (The Highest Level of Support Intensity) 265
<Table 6-8> Basic Data on Applications and Agreements Signed 266
<Table 6-9> SWOT Analysis 268
<Table 6-10> Selection of the Most Highly Evaluated Policy Measures with Respect
to Adopted Criteria 270
.....................................................................
................................................
........................................................
.........................................................
..................................
.............................................................
..............................................................
..........................................
........
.................................................................
..................................................
...............................................
........................................................................................
....................................................................................
....................................................................................
.........................................................................
...............................................................
..................................................................
..............................................
......................................................
..............................................................
......................................
..............................................
................................................................................................
..........................................................................................

Contents | List of Tables
Chapter 7
<Table 6-11> Evaluation of Analyzed Policy Measures in terms of their Effectiveness, Efficiency, and
Usefulness for SMEs, Together with Justification 271
<Table 6-12> Selection of the Most Highly Evaluated Policy Measures with Respect to Each Criterion 272
<Table 7-1> R&D Expenditures of the Slovak Automobile Industry Firms 299
<Table 7-2> Expectations of Slovak Automobile Production and Sales 300
<Table 7-3> Top 40 Suppliers in the Slovak Automotive Sector (in 2014) 300
<Table 7-4> Result of the Smart Factory Demonstration Project 306
<Table 7-5> Issues Impeding SMEs from Using Robotic Automation 309
<Table 7-6> Number of Robots Produced for Manufacturing Industry by Country 315
<Table 7-7> Status of Korean Domestic Automotive Parts Industry 319
<Table 7-8> Smart Factory Diffusion Rate in Each Manufacturing Industry 319
<Table 7-9> Industries that Consider Smart Factory as a Priority Task 320
...................................................
...
....................................
.......................................
.....................................
...............................................
..........................................
.......................
...........................................
.................................
.........................................

Chapter 1
Chapter 2
Chapter 3
[Figure 1-1] Korea’s Rate of Energy Dependence on Imports 035
[Figure 1-2] Establishing New Energy Industry through Construction of Smart Cities 044
[Figure 1-3] Fostering Brokerage Market, ESS, and Fuel Cells for Distributed Power 045
[Figure 1-4] Suggestion for RDI Cooperation between Czech and Korea 070
[Figure 2-1] Relative Economic Level 075
[Figure 2-2] Evaluation of Outputs and Structure of R&D in the Czech Republic 076
[Figure 2-3] Energy Demand for the Production of 1 EUR GVA in EU28 (MJ/EUR) in 2013 077
[Figure 3-1] % of Value Added Over Time in Korean SMEs and Large Firms 108
[Figure 3-2] Closed vs. Open Innovation 108
[Figure 3-3] Comparison of National Characteristics 114
[Figure 3-4] Changes in the Role of Universities 116
[Figure 3-5] TTOs in the United States 118
[Figure 3-6] R&D Investment per GDP 119
[Figure 3-7] The Purpose of the Korean Bayh–Dole Act 120
[Figure 3-8] Human Resources in Industry–University Cooperation Foundations 121
[Figure 3-9] Patent Application by Universities 122
[Figure 3-10] Technology Transfer by Universities 122
[Figure 3-11] Total Revenue of Industry–University Cooperation Foundations 123
[Figure 3-12] Collaboration Projects with SMEs 123
[Figure 3-13] The Concept of the Technology Holding Company 124
[Figure 3-14] Technology Holding Companies and their Subsidiaries 125
[Figure 3-15] The Growth of Subsidiary Companies 125
[Figure 3-16] The Increase of Industry–University Cooperation Professors 128
[Figure 3-17] Collaboration by Industry–University Cooperation Professors 129
[Figure 3-18] Contract-based Curriculum 130
[Figure 3-19] Patent Service Procedure 131
[Figure 3-20] Overview of SURBDF TTO Program 132
[Figure 3-21] Sherpa Program 132
...................................................
...................
....................
...................................
....................................................................................
..........................
..............
................................
...............................................................................
...............................................................
.....................................................................
.................................................................................
..................................................................................
..........................................................
..........................
......................................................................
....................................................................
...............................
.......................................................................
................................................
...........................................
..................................................................
....................................
..................................
................................................................................
...................................................................................
.....................................................................
..............................................................................................
Contents | List of Figures

Chapter 4
Contents | List of Figures
[Figure 3-22] Technology Search Service 133
[Figure 3-23] Commercialization Platform 134
[Figure 3-24] Layout of Ladder Lab and Bullpen 135
[Figure 3-25] Corporate R&D Centers 137
[Figure 3-26] Industrial Researchers in Corporate R&D Centers 137
[Figure 3-27] The Establishment of KIST 139
[Figure 3-28] Korean GRIs 139
[Figure 3-29] Technology Commercialization Division in ETRI 140
[Figure 3-30] Business Model of ETRI Holdings 141
[Figure 3-31] Shareholders of KST 143
[Figure 3-32] Shareholders of Mirae Holdings 143
[Figure 3-33] Innopolis (Special R&D Cluster) 144
[Figure 3-34] Types of Establishment 145
[Figure 3-35] Economic Contribution in Innopolis 145
[Figure 3-36] Two Different Innovation Models 146
[Figure 3-37] The Dilemma in the Movie Armageddon 148
[Figure 3-38] Agreement of V-KIST Establishment in Hanoi, Vietnam 150
[Figure 3-39] Policy Roadmap 152
[Figure 3-40] TIPs Program 154
[Figure 4-1] Frames for Technology and Technology Transfer 166
[Figure 4-2] SMEs with Product or Process Innovations 167
[Figure 4-3] SMEs Innovating In-house 167
[Figure 4-4] Innovative SMEs Collaborating with others 168
[Figure 4-5] Higher Education and Industry Cooperation Centers in Hungary 173
[Figure 4-6] Financial Instruments that Support Knowledge Transfer Purposes in Hungary,
2015-2017 174
[Figure 4-7] The Main Barriers Identified in Hungary 175
[Figure 4-8] Objective: Fostering Researchers’ Inter-sectoral Mobility 178
[Figure 4-9] Objective: Introducing the Open Innovation System 179
................................................................................
.............................................................................
......................................................................
.....................................................................................
..................................................
.................................................................................
...................................................................................................
....................................................
........................................................................
.........................................................................................
.........................................................................
..........................................................................
.....................................................................................
....................................................................
.......................................................................
.............................................................
..........................................
..............................................................................................
..................................................................................................
...................................................
...........................................................
.................................................................................
.........................................................
.............................
......................................................................................................
..............................................................
........................................
..............................................

Chapter 5
Chapter 6
Chapter 7
[Figure 5-1] Growth of the Number of Industrial R&D Centers 195
[Figure 5-2] Growth of BERD: SMEs vs. LEs 196
[Figure 5-3] Flow of R&D Funds in 2015 197
[Figure 5-4] Private Business Sector Researchers 198
[Figure 5-5] Current Structure of Policy Incentives for Industrial R&D and Innovation 205
[Figure 5-6] Government’s Direct and Indirect Funding of BERD: 2015 219
[Figure 5-7] Implied Tax Subsidy Rate on R&D Expenditures: Korea 1-B Index by Size of Firm and
Performance 220
[Figure 5-8] Growth of R&D and Innovation Grants for SMEs 225
[Figure 5-9] Government Support and BERD: An International Comparison (in 2014) 230
[Figure 5-10] Shares of Industrial Patent Applications: LEs vs. SMEs 231
[Figure 6-1] Advancement of SMEs in Poland in Implementing Solutions of Industry 4.0
(percentage of respondents that use new technologies) 247
[Figure 6-2] The Most Important Barriers to the Introduction of New Technologies in Poland 248
[Figure 6-3] Challenges and Barriers in Building Ability in Digital Operations 249
[Figure 6-4] Structure of Implementation of the De minimis Guarantee Scheme 260
[Figure 6-5] Top 10 Areas of R&D (Number of Grants) 266
[Figure 6-6] Policy Mix Supporting the Development of Industry 4.0 275
[Figure 7-1] Status of the Robot Market 289
[Figure 7-2] The Ratio of Slovak Automotive Industry in Total Production 294
[Figure 7-3] Automobile Production Status of EU Nations in 2016 294
[Figure 7-4] Number of Vehicles Produced per Direct Manufacturing Worker in 2016 295
[Figure 7-5] The Trend of Automobile Production in Slovakia 296
[Figure 7-6] The Structure of Supply Network in the Slovak Automobile Industry 297
[Figure 7-7] Number of Employees Related to the Automotive Industry in Slovakia 298
[Figure 7-8] Total Exports and Automobile Exports of Slovakia 299
[Figure 7-9] Overview of Each Level of Smart Factory 303
[Figure 7-10] Status of Companies where Constructed Smart Factory 304
.................................................
...........................................................................
...............................................................................
....................................................................
...................
.......................................
...................................................................................................
...................................................
...................
.............................................
........................................
.......
.............................
.........................
............................................................
.........................................
...............................................................................
..................................
............................................
..................
..................................................
........................
.....................
................................................
.............................................................
..........................................

Chapter 8
[Figure 7-11] Procedures for Supporting Smart Factory Construction for SMEs 305
[Figure 7-12] Procedure for Supporting Process Innovation in SMEs by Using Robots 310
[Figure 7-13] Production Status of the Korean Robotics Industry 314
[Figure 7-14] Composition of the Korean Industrial Robot Market 315
[Figure 7-15] SWOT Analysis of the Korean Industrial Robotics Industry 318
[Figure 7-16] Use Status of Industrial Robots Globally and in Korea 322
[Figure 8-1] Employment Structure of Automotive Industry in Slovakia 332
[Figure 8-2] Top 50 Technologies 335
[Figure 8-3] Split of Respondents According the Size/Type of Company 338
[Figure 8-4] Survey: Are you Prepared for Predictable Changes? 339
[Figure 8-5] Survey: Are you Prepared for Unpredictable Changes? 340
[Figure 8-6] Climate Change Impact 340
[Figure 8-7] Automation and Robotization Impact 341
[Figure 8-8] Changing Demographics and Global Knowledge Society 342
[Figure 8-9] Access to R&D Infrastructure 343
..............................
.....................
................................................
.............................................
......................................
............................................
.....................................
........................................................................................
.....................................
...............................................
...........................................
....................................................................................
.................................................................
........................................
.............................................................................
Contents | List of Figures

The Visegrad Group (V4) is a regional cooperation group consisting of the Czech Republic, Hungary, the Republic of Poland, and the Slovak Republic. It was established through a summit meeting between the three countries of Czechoslovakia, Hungary, and Poland in 1991. However, after Czechoslovakia was dissolved into the Czech Republic and Slovakia in 1993, the V4 remains as a cooperative relationship among the four countries. All four countries were successfully transformed into a market economy in the 1990s and are now members of the Organization for Economic Cooperation and Development (OECD) and the Development Assistance Committee (DAC). They are particularly strong in basic sciences, with high education levels, and have good infrastructure and geographical advantages in Europe, which are considered to entail high potential for economic cooperation and growth. The V4 has grown rapidly since joining the European Union in 2004 and has been participating in various projects and operational programs (OPs) that are suitable for national development strategies through the EU fund. The national development strategies of the four countries follow EU policy strategies and key principles, with priority being given to R&D, SMEs, innovation, and infrastructure sectors, especially during the 2014–2020 program period. Although the V4 has achieved a relatively stable transition and economic growth, it faces the challenges such as strengthening the competitiveness of SMEs, commercializing science and technology, promoting innovation and entrepreneurship, and revitalizing the labor market.
As the importance of economic and political cooperation between the Republic of Korea and the V4 has been increased recently, the Knowledge Sharing Program
2017/18 KSP with Visegrad Group
Jinyoung Pack (Project Officer, Korea Development Institute)
2017/18 KSP with Visegrad Group�ˍ�019

020�ˍ�2017/18 Knowledge Sharing Program with Visegrad Group
(KSP) with the V4 was launched to promote sharing economic development experiences and knowledge as well as to strengthen the ties between the two. In consultation with the four countries in 2015, we sought the demand for sharing experiences in “Innovation Policy”, the area in which all countries put high policy priorities and have, at the same time, various mutually beneficial experiences. In particular, on the 3rd of December 2015, the leaders of the Republic of Korea and the V4 reaffirmed their intention to work together within the KSP at their first summit meeting, and the 2016/17 Korea-V4 KSP was launched in July, 2016. Through this first year of cooperation, Korea and the V4 completed joint research on 1) The National Innovation System of Korea and Visegrad Group Countries, 2) National R&D Project and Program Evaluation Methods and Monitoring Mechanisms, 3) Promotion of Technology Transfer and Revitalization of R&D Private Sector: Public Policies Supporting Technology-Inspired Start-ups and Their Outcome, and 4) Robotics in Factory Automation.
Based on the result of the 2016/17 KSP, the V4 proposed subtopics for the 2017/18 Korea–V4 KSP, under the overarching topic of “Innovation Policy for SMEs in the Era of Industry 4.0“ according to the policy priorities of each country: 1) R&D and Innovation Policies to Enhance Energy Security (Czech Republic), 2) Fostering Innovation SMEs: With a Focus on Technology Transfer (Hungary), 3) Policy Incentives for R&D and Innovation in SMEs: Accomplishments and Issues (Poland), and 4) Promotion of Smart Production Systems for SMEs: Robotics and Automotive Industry (Slovakia). In the first year of the study, the researchers and policy practitioners determined that the V4 countries are highly dependent on Foreign Direct Investment (FDI) and that the share of SMEs in the national economy is very large. However, they found that the value added created by and the innovation performance of the local SMEs are low and that FDI is not closely linked with local companies. Given these structural characteristics and current status, Korea and the V4 partners concluded that innovation policy and institutional improvement are needed for improving SMEs' technological innovation capacity for sustainable growth of the V4.
The 2017/18 Korea-V4 KSP team comprised four Korean researchers and eight V4 researchers, along with a senior advisor, program director, program manager, and program officer, as presented in the table below:

As the first stage of the 2017/18 KSP, the Launching Seminar and High-level Meeting was conducted from 12 to 14 September 2017 in Budapest, Hungary (the country holding the 2017/18 Presidency of the V4). During this stage, the Korean delegation and V4 counterparts identified the research topics and acquired an in-depth understanding of the topics while building networks among experts and relevant organizations. Specifically, a delegation of Korean experts headed by Director Junho Shin, director of the International Economy Cooperation Strategy Division at the Ministry of Economy and Finance of Korea, and the representatives from all the V4 countries gathered for the seminar and meetings. At the seminar, government officials and researchers from each country shared views and ideas on selected topics and discussed research frameworks for joint research.
Subsequently, the KSP Policy Seminar and In-depth Study were carried out twice. Firstly, Korean researchers for topics two and three visited Hungary and Poland, respectively, from 5 to 9 November, 2017. Secondly, Korean researchers for
Project Title: Innovation Policy for SMEs in the Era of Industry 4.0Senior Advisor: Ho-Jin Lee, Former Ambassador to Hungary, Senior Advisor of Yulchon LLC.Project Manager: Kwangeon Sul, Visiting Professor, KDI School of Public Policy and ManagementPrincipal Investigator: Sungchul Chung, President, Korea Association for the Advancement of Scientific Culture
No CountrySub-topics
(Participating Ministry/Institution)
Researchers
1 CzechR&D and Innovation Policies to
Enhance Energy Security (MIT/TACR)
Jin Gyu Jang (STEPI)Richard Hlavatý (MIT),
Martin Hromada (Tomas Bata University in Zlin),
Vladimir Kebo (TACR)
2 HungaryFostering Innovation SMEs: With a
Focus on Technology Transfer(MFA/NRDI)
Joonmo Ahn (Sogang University)Márton Pete (NRDI)
3 Poland
Policy Incentives for R&D and Innovation in SMEs:
Accomplishments and Issues(MET/WERI, SGH)
Sungchul Chung (Korea Association for the
Advancement of Scientific Culture)Marzenna Anna Weresa,
Arkadiusz Michał Kowalski,Marta Mackiewicz (WERI, SGH)
4 SlovakiaPromotion of Smart Production Systems for SMEs: Robotics and Automotive Industry (MOE/SIEA)
Heejun Park (Yonsei University)Artur Bobovnicky (SIEA)
�Table 1� 2017/18 Korea–V4 KSP Team
2017/18 KSP with Visegrad Group�ˍ�021

022�ˍ�2017/18 Knowledge Sharing Program with Visegrad Group
topics one and four visited Czech Republic and Slovakia, respectively, from 26 to 29 November, 2017. Each delegation shared the progress of the research and discussed future research plans. During these visits, the delegations also had meetings with representatives from several institutions in the public and private sectors, such as The Hearts, Bay Zoltan Non-profit for Applied Research, Bosch Campus, Mobility and Multimedia Cluster, Budapest University of Technology and Economics, Czech Technical University, PREdistribuce, Energy Regulatory Office of Czech Republic, Slovak Investment and Trade Development Agency, DITIS, CEIT, Robotec, Stella Group, and Kia motors, to gain in-depth understanding about each country.
Then, the Interim Reporting and Policy Practitioners’ Workshop was conducted from 4 to 9 February 2018 in Seoul, Korea, to present interim research findings and share the Korean experience. Delegations comprised of the government officials and researchers from the V4 countries visited Korea and attended the Interim Reporting Workshop held on 5 February, 2018. During the workshop, the researchers from Korea and the V4 presented the interim results of the research and engaged in discussions while the ambassadors of the V4 in Seoul were in attendance. During the Policy Practitioners’ Workshop, the delegation visited the Electronics and Telecommunications Research Institute (ETRI), Ministry of SMEs and Startups, Korea Electronic Power Corporation (KEPCO), Korea Smart Factory Foundation, Commercialization Promotion Agency, Thirautech Co., Sogang University, Korea Energy Technology Evaluation and Planning (KETEP), Korea Industrial Technology Association (KOITA), and Korea Institute for Advancement of Technology (KIAT) to learn about the Korean experience in SME supporting policies in general as well as for promoting technology transfer, energy security, and factory automation. Through this stage, the V4 delegations were able to learn about Korea’s current status and actual policy experience, establish networks with Korean institutions and discuss future cooperation. In particular, the Czech Republic and Slovakia will continue to discuss follow-up cooperation with the KETEP and the KIAT.
As the final stage of the 2017/18 Korea-V4 KSP, the Final Reporting Workshop and Senior Policy Dialogue were conducted from 25 to 30 March, 2018, in Budapest, Hungary. The Korean delegation, led by Director Kyusik Suh, director of the International Economy Cooperation Strategy Division at the Ministry of Economy and Finance of Korea, and the V4 delegations gathered to present the final results of the research to policy makers and various stakeholders. During the Final Reporting Workshop, government officials and researchers from each country delivered presentations and discussed results, with high-level officials and various stakeholders in attendance. In particular, the Korean delegation had an in-depth discussion with Deputy Minister of the Ministry of Foreign Affairs and Trade of Hungary Istvan Ijgyarto about the implications of the project and ways of bringing the Korea-V4 KSP to a successful conclusion. In addition, Korea and the V4 representatives promised

full cooperation with partner countries to further strengthen the cooperative relationship between Korea and the V4 through the KSP.
Such efforts by both the V4 and Korea not only enriched this 2017/18 Korea–V4 joint policy research report, but also fostered knowledge exchange and strengthened the partnership between the two. The implications derived through the two years of KSP cooperation between Korea and the V4 are well aligned with the policy priorities of each country, and it is expected to benefit all participating countries. The KDI is grateful for the sincere cooperation and facilitation from the MIT and TACR of the Czech Republic, the MFA and NRDI of Hungary, the MET and WERI of Poland, and the MOE and SIEA of Slovakia. We also wish to express our gratitude for the heartfelt support from the Korean embassies in the V4 countries as well as the V4 embassies in Seoul for its publication.
2017/18 KSP with Visegrad Group�ˍ�023

024�ˍ�2017/18 Knowledge Sharing Program with Visegrad Group
1. BackgroundsKorea and the V4 countries have gone through entirely different processes of
development, and therefore differ from each other in many ways, which suggests that they have much to offer each other for mutually beneficial cooperation. In short, Korea was a late latecomer to the world of modern science and technology, starting from scratch only in the 1960s. Being a late-starter with huge gaps in development, Korea had to be more strategic in catching up with the advanced countries. Under such pressure, Korea has achieved an economic transformation. Korea has now become an STI-oriented country, spending 4.3% of its GDP (2014) on R&D, and emerged from nowhere to become a new global player in science, technology, and innovation, establishing a world prominence in such areas as telecommunications, automobiles, ships, iron and steel, and others. In contrast, the V4 countries have long and strong traditions of science and research as well as rich accumulations of scientific achievements: (1) Being located in central Europe, they have had active interactions with the center of world development as well as opportunities to contribute to the advancement of modern science and technology. (2) Yet, the V4 countries had not been able to translate their scientific potentials fully into economic prosperity, mainly because of the delay in the adoption of the market system. (3) Since the change in the economic system in the region, the V4 countries have made remarkable strides in making their innovation systems work.
Executive Summary
Sungchul Chung (Korea Association for the Advancement of Scientific Culture)

Executive Summary�ˍ�025
However, in the face of diverse emerging new challenges, Korea and the V4 countries need to explore new paths for advancement in a longer-term perspective, to which the Korea–V4 KSP can contribute through exchanges of policy experiences for mutual learning. Under this understanding, the two sides agreed in 2016 to launch a KSP to exchange policy experiences in innovation, which holds the key to sustainable developments of both Korea and the V4 countries. In the first year’s work of the multi-year KSP project, the two sides focused on promoting mutual understanding of the innovation systems of Korea and the V4 countries. The study also looked into several priority issues of the V4 countries: Evaluation system of public R&D in Hungary, promotion of innovation in the private sectors in Poland, and robotics in Slovakia.
Among many other findings, the first-year study found that the innovation systems of Korea and the V4 countries differ from each other in several ways: the V4 countries excel in sciences and have university-centered R&D innovation systems, with industrial R&D systems dominated by large FDI companies, most of which are MNCs. In contrast, Koreas has relatively strong capability in industrial technology, and has an industry-oriented innovation system, where the role of universities is very limited. Yet, we have also found that Korea and the V4 countries face similar issues: (1) The industrial innovation systems of the V4 countries are dominated by large FDI enterprises, with local small and medium enterprises (SMEs) remaining in the backwaters of innovation. Under such an environment, the impacts of STI policy may be very limited; (2) Korea’s innovation system also suffers from a similar problem: large enterprises play the dominant role in innovation, while SMEs are a minority in the system. (3) In addition, both countries share the problem of weak industry–science linkages.
As such, Korea and the V4 countries share common policy interests in promoting SMEs’ R&D and innovation, as they suffer from the problems stemming from the duality of the industrial innovation system, in which an extremely large number of non-innovative SMEs coexist with a very small number of highly innovative large global enterprises (LEs). In many cases, technological gaps between the two are too wide for them to get engaged in spontaneous technological interactions, and thus contribute to the polarization of the economy. There is no question that technological weakness of SMEs is one of the major barriers for Korea and the V4 countries to overcome in order to grow further. This is because technologically strong and dynamic SMEs constitute the very foundation for healthy and sustainable industrial development.

026�ˍ�2017/18 Knowledge Sharing Program with Visegrad Group
2. Summary of the 2017/18 KSP with Visegrad Group
s It was in this perspective that Korea and the V4 countries agreed to focus the
2017/18 KSP on the issues of innovation policy for SMEs, and to exchange policy experiences for joint exploration of policy options to promote SMEs’ R&D and innovation.
s Of diverse policy issues on SMEs, the Czech Republic chose to look into innovation aspects of energy security issues from the SMEs’ point of view; Hungary focused on exploring policy measures to promote technology transfer between public sector (universities and public research institutes) and private sectors (SMEs); Poland aimed to analyze the effectiveness of policy incentives for SMEs’ R&D and innovation; and Slovakia continued working on policy issues related to factory automation of SMEs (robotics, specifically). On each of these issues, the Korean study team worked with each of the partner countries and completed reports containing policy experiences and policy implications.
What follows are the main policy implications that the Korean study team derived for the V4 countries as well as for Korea:
A. The Korean team collaborated with the team of the Czech Republic on the
issues of energy security. They looked into the energy security issues and related innovation policy measures, and derived the following policy suggestions from the Korean experiences:s As a means to ensure stability of energy supply, a realistic approach may be
to enlarge small- and medium-scale distributed generation (DG) that not only contributes to the reduction of transportation costs but also facilitates the diversification of energy sources.
s In order to achieve a stable system of energy supply, it is important to develop an energy storage system and energy management system based on the integration of energy technologies and ICT.
s To protect energy facilities, it is suggested to place R&D priority on the development of technologies required to protect the system from physical and cyber threats, such as technologies for power line communication (PLC).
B. Korea-Hungary collaboration focused on how to promote and facilitate technology transfer from the public sector to the private sector, in particular, SMEs. Based on the review of the Korean policy experience in technology transfer, they derived several specific policy suggestions that may be applicable to the V4 countries:s The major barriers to technology transfer between public and private sectors
are lack of motivations (or incentives) on the side of universities and weak

Executive Summary�ˍ�027
absorptive capacity of SMEs. Thus, these issues have to be addressed by the government most of all.
s Legal actions (such as the Bayh-Dole Act of the US; Industrial Education Enhancement and Industry-Academia-Research Cooperation Promotion Act) are required to motivate the public sector to engage more actively in commercially meaningful R&D activities as well as technology transfer.
s As a means to enhance entrepreneurship in the university sector, Korean universities offer a faculty position that requires ample business experiences as a qualification. The position is called “Industry-Academia” professor, whose performance is evaluated not by academic publications but by such activities as technology transfer, technology spinoffs, and so on.
s In order to strengthen SMEs’ technological absorptive capacity, the government may use incentive schemes to induce SMEs to establish and operate corporate R&D centers that meet the standards set by the government or other relevant bodies.
C. The Korean–Polish team evaluated the effectiveness of the policy incentive programs for SMEs’ R&D and innovation in their countries for mutual policy learning, on the basis of which they derived the following policy implications.s Incentive programs should be designed and adjusted based on interactions
between the government and SMEs who are the policy beneficiaries.s Incentive programs should be made simple and easy for SMEs to comprehend
and inter-linked to each other in a way to attain synergistic effects.s Incentives for SMEs in high-tech industries with small economies of scale
appear to work more effectively. s Excessive, long-lasting supports may sometimes lead to deepening SMEs’
reliance on government for survival rather than promoting R&D and innovation.
s In order to prepare SMEs for the industry 4.0, support programs need to be geared to strengthening digital capabilities of SMEs, in particular to improving SMEs’ access to skills and talents capable of navigating the development towards Industry 4.0.
D. Lastly, Korea and Slovakia continued the work on automation of production system of SMEs, with a focus on robotics. The main suggestions they put forward are:s The Slovak government needs to implement the RIS3 strategy consistently
for the diffusion of smart production system among SMEs. For effective implementation of the strategy, it is critical to enhance SMEs’ awareness of the strategy, in particular of the benefits the strategy would bring to SMEs.
s The Slovak government is recommended to create an institution to help SMEs adopt the new system so as to reduce the adoption costs, such as learning cost, trial and error time, etc.

028�ˍ�2017/18 Knowledge Sharing Program with Visegrad Group
s For healthy and sustainable growth of the Slovak industries, it is recommended to place policy emphasis on promoting and facilitating domestic SMEs’ R&D and innovation, such as encouraging the creation of in-house R&D centers through industry-academia partnership, which may, in turn, make it easier for local SMEs to adopt smart production systems.
s For the sake of effectiveness, it is suggested to concentrate the policy efforts on strategic industries and/or systems (robotics for automation, smart factory, etc.).
3. Policy Suggestions and Issues AheadEven though the four studies differ from each other in focus, they suggest one
important issue common to Korea and the V4 countries, which is that the major source of problem is the lack of technological linkages among the key players of innovation – on the one hand between the public and private sectors, and on the other between SMEs and LEs. Between universities and industries, the lack of interactions stems from differences in interest in R&D, while the lack of cooperation between SMEs and LEs is basically due to the gaps in technological capability between the two. But the weak system-linkages in the national innovation system is also attributable to the insufficient policy actions to make up for the system failure. Therefore, it seems rather clear that what governments should do to solve this problem are: first, promote SMEs’ R&D and innovation through policy measures that include incentives and assistances; second, pay more policy attentions to strengthening private-public linkages and collaboration in technology and innovation, and also on fostering technological linkages between SMEs and LEs. This is not an easy policy task, in particular, for the V4 countries where FDI companies are the key player in innovation, and this is where new policy ideas are required: How to foster technological partnership between SMEs and LEs, or in the case of the V4 countries, what should be done to develop technological linkages between local SMEs and Large FDI companies?

PART IR&D and Innovation Policies to
Enhance Energy Security
Chapter 1 _ R&D and Innovation Policies to Enhance Energy Security (Korea)
Chapter 2 _ R&D and Innovation Policies to Enhance Energy Security
(Czech Republic)


Chapter 12017/18 Knowledge Sharing Program with Visegrad Group: Innovation Policy for SMEs in the Era of Industry 4.0
R&D and Innovation Policies to Enhance Energy Security (Korea)
���*OUSPEVDUJPO
���$IBOHFT�JO�UIF�1FSTQFDUJWF�PG�&OFSHZ�4FDVSJUZ�JO�,PSFB
���&OFSHZ�4FDVSJUZ�BOE�3�%�BOE�*OOPWBUJPO�3%*
���1PMJDZ�4VHHFTUJPOT
���4VHHFTUJPOT�GPS�$PPQFSBUJPO�XJUI�$[FDI�3FQVCMJD�JO�3%*�"DUJWJUJFT

032�ˍ�2017/18 Knowledge Sharing Program with Visegrad Group
SummaryIt is time to change our viewpoint of energy security in tandem with continuous
evolvement of energy systems. Energy policy makers of the government need to improve understanding of opportunities and challenges due to expansion of digitalization in the energy sector. As digitalization is expanding in the energy sector, it gives new opportunities and risks at the same time. In order to promote a policy to integrate changes in digitalization and the energy sector most efficiently and cost-effectively, we need quality data and more thorough analysis.
According to such change in trends, the definition of energy security has been changed to incorporate securing stable and sustainable energy supply, improving efficiency of energy consumption and upgrading protection of energy facilities and infrastructure.
Strategies for energy R&D and Innovation (RDI) in Korea are as follows. First, Korea wants to establish a new energy RDI system to strengthen business-oriented RDI, breakthrough-style RDI, and international cooperative RDI, and to perform RDI related with energy supply, demand management, and convergence technologies. Second, Korea will strengthen commercialization of RDI results to create new market by enlarging application-RDI, preparing package-style support system, creating a
R&D and Innovation Policies to Enhance Energy Security (Korea)
Jin Gyu Jang (Science and Technology Policy Institute)
乇#Chapter 01
Keywords: Energy Security, Stable Energy Supply, Efficiency of Energy Consumption, Protection of Energy Facilities, Energy R&D and Innovation

Chapter 1 _ R&D and Innovation Policies to Enhance Energy Security (Korea)�ˍ�033
new market by boosting application of energy technologies in areas of defense, SOC, etc. and boosting new energy industry through increase in production of new parts and materials. Third, Korea will prepare the eco-system for promoting cooperative energy RDI by improving cooperation-governance among public companies, GRIs, and ministries to perform RDI efficiently, improving regionalization of energy industry ecosystem by developing region-specific RDI projects and strengthening co-growth of LEs and SMEs. Forth, Korea will try to establish RDI infrastructure for strengthening RDI capabilities, especially by cultivating creative human resources for new energy industry and boosting international cooperation for energy RDI.
The Korean RDI Policy direction to secure stable energy supply is to secure new and stable energy sources by enhancing capability of resource exploration and development, and to enlarge distributed generation (DG) by more than 15% and to increase supply of new and renewable energy by up to 20% by year 2030. Some examples of technologies to be developed for securing stable energy supply are as follows.
Korean government will try to develop technologies for exploration of resources, drilling, production, etc. to secure next-generation strategic resources. Technologies to establish clean thermal power generation system to attain higher efficiency and, therefore, to mitigate GHG emission compared to conventional thermal will be developed. Korea will also develop technologies for safety-first operation of nuclear power plants and strengthen export-competitiveness of new-type nuclear power generators. Technologies will be developed for such as integration of renewable energy production and storage system in the area of new & renewable hybrid system. In order to get next-generation clean fuels, Korea will try to develop technologies to produce clean liquid fuels using biomass, waste resources, etc. Technologies for next-generation Transmission and Distribution (T&D), including a high-voltage, direct current (HVDC) system and north-east Asian super grid, will also be developed.
The Korean RDI policy direction to upgrade energy efficiency is to decrease demand for electricity by 15% through ICT integration and to increase supply of Energy Storage System (ESS) and Energy Management System (EMS) substantially in the near future. Core technologies related to smart homes and buildings will be developed to integrate renewable energy, ESS, EMS, and ICT into homes and buildings to maximize energy efficiency and create a new energy-market. Technologies for smart Factory Energy Management System (FEMS) will be secured to provide energy-saving solutions to heavy energy-consuming industries and factories. Technologies for smart microgrid will also be developed for operation system solutions to manage distributed energy resources and load in an integrated way. For energy negawatt systems, technologies to integrate and control various energy systems including electricity, gas and heat, etc. will be developed. As for ESS adapting

034�ˍ�2017/18 Knowledge Sharing Program with Visegrad Group
to demand, technologies to improve electricity storage and utilization by securing Vehicle to Grid (V2G) and various ESS technology portfolios will also be developed. Technologies in the area of Carbon Capture, Utilization and Storage (CCUS) will be developed to capture CO2 from power plants or other manufacturing plants and to utilize or store captured CO2.
The Korean RDI policy direction to strengthen protection of energy facilities is to develop more innovative technological solutions to power line communication, and to improve technologies to protect critical energy infrastructure. To follow this policy direction, related technologies will be developed to upgrade future data communication architecture, energy data communication quality, and standards and interoperability. As for upgrading cyber security, Korea will try to develop technologies to prevent cyber attacks to cause control system failure due to communication obstacle or tampering among control centers.
Korea will also perform RDI to upgrade protection of information such as electric system operation data generated from integrated energy network. In order to upgrade defense against Electromagnetic Pulse (EMP), Korea will try to develop technologies to protect electric power systems such as Supervisory Control and Data Acquisition (SCADA) main facilities from EMP and to develop EMP protection filters, and parts and components.
In order to improve energy security, first of all, we need an integrated approach, considering interaction among energy technologies. Core solutions should be found for demand and supply optimization based on IoT and to turn surplus energy into demand resources. Thus, it is advisable better carry out both technology-push and demand-pull policies together to facilitate the diffusion of new technologies
At the sector level, it is important to expand objects to which energy efficiency standards for buildings apply and to strengthen the existing Minimum Energy Performances Standard (MEPS) system. We need active government support to achieve the goal of GHG mitigation and need to try to mitigate Green House Gas (GHG) emission through public–private cooperation. It is very important to secure price competitiveness of low carbon fuel through price policy measures, etc.
We also need to implement technological innovation activities, considering various conditions for development of specific low-carbon electric power technologies. It is very necessary to supply strong policy support, such as a powerful carbon price policy, in order to induce investment by the private sector. We also need to carry out appropriate policies and related technological innovation activities in a timely manner to facilitate the decarbonization.

Chapter 1 _ R&D and Innovation Policies to Enhance Energy Security (Korea)�ˍ�035
1. IntroductionEnergy is a driving force of industrial activities and a basic necessity of the national
economy to satisfy living desires of the people. Energy has a value as strategic goods for economic development, industrial security, and public welfare stability. The government needs policy efforts to supply energy reliably for the people and the national economy. Due to such reasons, energy security has been adopted as one of the top-priority tasks in terms of national strategy in every country around the world.
Korea imports almost 96% of its energy from foreign countries, about 25% of which is crude oil. Conventional thermal power generation accounts for approximately 70% of electricity produced in Korea. High dependency on fossil fuel and high price volatility of oil tend to increase energy risk in Korea. Due to all these facts, energy security vulnerability is very high in Korea.
It is a good thing that Korea joined the Paris Climate Agreement in 2015 and submitted the Intended Nationally Determined Contribution (INDC) to the UN. Korea’s INDC is to reduce greenhouse gas (GHG) emission by 37% from the Business As Usual (BAU) level by 2030 (25.7% domestic, 11.3% overseas). In order to achieve this goal and also to upgrade energy security, Korea should pursue an eco-friendly transition in energy mix structure.
100
82
64
46
28
102014.07 2014.08 2014.09 2014.10 2014.11 2014.12 2015.01 2015.02 2015.03
Conventional Thermal (69.1%)Nuclear (29.4%)Hydroelectric (0.9%)Other Renewables (0.6%)
2015.04
Energy
Rate of Dependence on Imports (%) Diversity of Electricity Generation(South Korea)
Oil
29.4
69.1
[Figure 1-1] Korea’s Rate of Energy Dependence on Imports
Source: World Energy Council (2015).

036�ˍ�2017/18 Knowledge Sharing Program with Visegrad Group
There appear to be four future industrial issues in the energy sector in Korea: “competition to secure additional energy resources”; “stable energy supply to meet ever-increasing domestic energy demand”; “improvement of demand management technologies by integrating ICT and Big Data, etc.”; and “globalization of energy industry by developing break-through technologies.” There should be many technological needs related with each industrial issue. Examples of technological needs related with the issue of competition to secure additional energy resources are to advance energy exploration technology to secure additional resources, and to develop technologies to give high added-value to low-quality resources. Examples of technological needs related with the issue of stable energy supply to meet ever-increasing domestic energy demand are to develop technologies to attain high-efficiency of existing thermal power generation, to increase safety of nuclear power generation, and to upgrade technologies for protection of energy facilities and cyber security. An example of technological needs related with the issue of improvement of demand management technologies by integrating ICT and Big Data, etc., is to upgrade efficiency of consumption by developing high-capacity ESS technologies. Examples of technological needs related with the issue of globalization of energy industry by developing break-through technologies are to cultivate global companies through future energy technology and demonstration, and to create synergy effect by developing inter-industry convergence technologies.
The traditional definition of energy security is mostly related with the stable supply of energy. For example, energy security is “supply availability of necessary energy at an acceptable price” (IEA, 2001) or “to secure energy necessary for the national life, the national economy, and the national defense at an acceptable price” (IEEJ, 2011).
However, it is time to change our viewpoint of energy security in tandem with continuous evolvement of energy system. The concept of energy security should be changed into a comprehensive one handling the energy and the environment together in the new energy climate era. The policy for energy security should also change the focus from supply to consumption. That is, reduction of energy demand through efficient consumption of energy is becoming more important. As the digitalization of the energy sector is being accelerated, cyber and physical securities to protect energy facilities and infrastructure should also be dealt with as an important security factor.
According to the changes in trends as mentioned, the definition of energy security has been changed to incorporate securing stable and sustainable energy supply, improving efficiency of energy consumption, and upgrading protection of energy facilities and infrastructure.

Chapter 1 _ R&D and Innovation Policies to Enhance Energy Security (Korea)�ˍ�037
2. Changes in the Perspective of Energy Security in Korea
2.1. Conventional Perspective of Energy Security
A. Securing the diversity of supply sources: The most important factor in energy security is to secure the diversity of supply sources. That is, it is necessary to meet the demand of energy through various supply sources. Without diverse supply infrastructure, when an accident takes place from one source, it will directly lead to supply disruptions.
B. Securing spare capacity of output: In a broad sense, this means spare capacity to guarantee the security of supply. Concretely, it is defined as spare capacity of output to supplement the interrupted supply. Spare capacity could be classified into spare capacity and strategic petroleum reserve. First, “spare capacity” means margin capacity to produce petroleum beyond usual output. Second, the “strategic petroleum reserve (SPR)” functions as a way to protect the front line for serious supply disruptions of petroleum.
C. Maintaining reliability: This revers to avoidance of sudden disruption of supply. The point of securing reliability is diversification: diversification of supply sources, diversification of supply network, and securing spare supply chain.
D. Remaining affordability and low price volatility: The point is how to deal with economic impact caused by a spike in oil prices rather than only low prices. Many governments promote policy to supply energy at low prices through various types of aids due to the political sensitivity of energy.
2.2. Changes in Energy System to Affect the Perspective of Energy Security
2.2.1. Continuous Evolvement of Energy System
As energy systems evolve, various energy technologies interact with each other. Thus, they should be developed and distributed together. Economical, reliable, and sustainable energy systems need more diverse energy sources, and their dependence on distributed development will be increased. The systems should be integrated and managed more closely from the perspective of the system. By doing so, it is possible to increase efficiency and lower system cost. The systems still need various technologies and energy sources. However, the success of such energy systems depends on not only each technology, but also the entire energy system. The most

038�ˍ�2017/18 Knowledge Sharing Program with Visegrad Group
important challenging task for policy makers is to get out of the disconnected and supply-centered mindset and to approach them from the viewpoint of system integration. Accordingly, the expansion of policy tools, regulation system, and policy dialogue is necessary.
For the demand part, innovative transportation technology is getting momentum; thus, electricity demand will be increased. As living standards improve, more people will purchase home appliances, electronic products, and various electrically operated goods. Consequently, electricity demand is expected to grow.
In the future, integrated and connected power systems will be the core part of innovation in the energy sector. Increasing electrification will enhance flexibility and efficiency of power systems, and give opportunity to strengthen sustainability. System integration technology of energy storage is developing through lower costs, supportive regulatory measures, and improved understanding of potential benefits of technologies. Storage amount of new energy was increased by over 50% in 2016. Diffusion of digital technology could accelerate such innovation.
Under the circumstances that electrification of end-use is expanding, decarbonization of power systems offers new challenges and opportunities. If current trends are continued, power percentage from global energy demand of entire end-use will grow from 18% now to 26% by 2060.
It is meaningful that electrification of end-use makes it possible to convert from direct dependence on fossil fuels to decarbonized power. Thus, decarbonized power will be the basis of the clean energy innovation in the future. According to the 2ġ scenario of IEA, it is expected that global power will reach net zero of CO2 emission. To this end, it needs to expand and distribute a technology portfolio consisting of 74% new renewable energy of power supply, 15% nuclear energy, and 7% thermal power, with CCS and natural gas for the rest.
In order to ensure continuous system efficiency and reliability, we need a long-term and harmonizing plan for stronger and smarter investment in infrastructure. We should invest continuously in various infrastructure areas to build an efficient and low-carbon energy system. In large-scale markets like Germany and China, a bottleneck is already present in power transmission. It concerns us because expansion of electrification and variable renewable energy could be threatened.
It is time to change our viewpoint on energy security in tandem with continuous evolvement of energy system. Energy policy makers of the government need to improve understanding of opportunities and challenges due to expansion of digitalization in the energy sector. As digitalization is expanding in the energy sector,

Chapter 1 _ R&D and Innovation Policies to Enhance Energy Security (Korea)�ˍ�039
it brings new opportunities and risk factors at the same time. In order to promote a policy to integrate changes in digitalization and the energy sector most efficiently and cost-effectively, we need quality data and more thorough analysis.
2.2.2. Conversion to Electricity Should be Accelerated in Full Speed for Sustainable Energy System
Electricity is one of the energies that can be produced most easily through renewable energy sources and the most energy-efficient source. Thus, we need to maximize the use of electricity (including the use of direct heating) in the process of energy conversion.
According to ETP 2017 of IEA, use of electricity will be expanded to industry, transportation, and buildings due to improved convenience, efficiency, and sustainability. Then, electricity is expected to emerge as the primary energy carrier. That is, the percentage of electricity from the final energy demand shall increase from 18% in 2014 to 35-41% in 2060.
Unlike other areas where it is hard to apply green technology though it emits lots of GHGs, electricity can reduce direct emission through efficiency improvement and large-scale green technology. The IEA presumes that 40% of total emissions of GHGs could be reduced in the sector of power generation alone.
Especially, transportation is the main target of electrification because that industry is one of the areas that consume a lot of energy and emits a large amount of GHGs. That is, we need to prepare laws, investment, and incentives to encourage manufacturers and consumers to change power source of transportation, such as cars and trains, into electricity and electric cars.
The structure of energy consumption of our country in 2014 is petroleum 48.1% > electricity 19.2% > coal 16.6% > city gas 10.8% > renewable 4.4% > thermal energy 0.7% > natural gas 0.2%.Petroleum consumption was the highest because it was used as fuel for manufacturing, petrochemical industry and cars, and electricity consumption was the next highest.
Compared with the OECD averages, Korea and Japan showed that coal and petroleum took up a large portion of consumption differently from other countries. They also indicated that average power consumption was more than 25%, compared with 20% of other countries. The point of change in energy security policy is a conversion of the structure of petroleum consumption and power generation and consumption.

040�ˍ�2017/18 Knowledge Sharing Program with Visegrad Group
For petroleum, which takes up the largest part of consumption, half of it is used in the petrochemical industry and it is only for production in the industry. The core part of reduction in petroleum consumption is to expand distribution of eco-friendly vehicles such as electric cars and hydrogen-powered cars in transportation in land, which accounts for 30% of petroleum consumption.
For electricity, the point is to change the structure of generation and consumption into the structure of eco-friendly and low-carbon generation, and energy-efficient consumption.
2.2.3. Integrated and Connected Power System as the Core Part of Energy Innovation
Due to expansion of electrification and increased power supply from renewable energy, it is the time for technology development and investment to enhance flexibility and reliability of power systems.
Sunlight and hydraulic power will produce 9,000TWh and wind power will produce 10,500TWh from total generation of 53,100TWh in 2060. For generation of renewable energy and demand balance, energy storage technology is necessary. Global storage capacity is expected to increase from 153GW in 2014 to 450GW in 2060. In addition, new technologies should be developed, such as lithium batteries based on high concentration of nickel, lithium-sulfur battery, lithium-air battery, and long-term storage battery.
To secure cost reduction and flexibility thanks to expansion of renewable energy, it is necessary to discover active demand response technology and business models. In 2060, demand response is expected to increase to 410GW in the areas of transportation, industry, buildings, and conversion.
Digital network of homes and electrical grid through connection with advanced metering infrastructure (AMI) and ICT should be built to expand participation from the demand side.
In preparation for connection of large-scale distributed power, we need to develop technology for connection of high-voltage power network, like HVDC and power grids. Global HVDC installation capacity is 250GW now, and it is expected to increase to 2.4TW in 2060. In EU, they plan to invest 140 billion euros in HVDC-relevant projects.
Optimization of demand and supply based on IoT and demand response of idle energy have emerged as the core solution. Demand response will create new

Chapter 1 _ R&D and Innovation Policies to Enhance Energy Security (Korea)�ˍ�041
opportunities of optimization of demand and supply and efficiency improvement by offering participation service to consumers. It will contribute to energy reduction through voluntary participation by offering participation incentives without damaging convenience of consumers. After smart meter infrastructure, remote load control and smart EV charge and discharge are to be built (2045-), and a large-scale demand response market is expected to be formed around the world. It will take a long time to build the infrastructure of demand response of idle energy, integrated control of communication and power grid, and interactive transaction. Subsequently, however, the scale of demand response is expected to expand sharply. That is, the scale of demand response will increase from 11GW in 2015 to 82GW in 2045 and 322GW in 2060.
3. Energy Security and R&D and Innovation (RDI)
3.1. Strategies for Energy RDI in Korea
A. Establish New Energy RDI System
s Strengthen business-oriented RDI, breakthrough-style RDI, and international cooperative RDI
s Perform RDI related with energy supply, demand management, and convergence technologies
B. Strengthen Commercialization of RDI Results to Create New Market
s Enlarge application-RDI and prepare package-style support systems Create new market by boosting application of energy technologies in areas of
defense, SOC, etc.s Boost energy new industry by increasing production of new parts and materials
C. Prepare Eco-system for Promoting Cooperative Energy RDI
s Improve cooperation-governance among public companies, GRIs, and ministries to perform RDI efficiency
s Improve regionalization of energy industry ecosystem by developing region-specific RDI projects
s Strengthen co-growth of large companies and SMEs (e.g., co-use of large companies’ patents)

042�ˍ�2017/18 Knowledge Sharing Program with Visegrad Group
D. Establish RDI Infrastructure for Strengthening RDI Capabilities
s Cultivate creative human resources for new energy industrys Boost international cooperation for energy RDI
3.2. RDI Investment Policy for Energy Industry by the Ministry of Trade, Industry, and Energy (MOTIE)
The Ministry of Trade, Industry, and Trade of Korea (MOTIE) has set up RDI investment policy for energy industry. The overall goal of this policy is to induce the transition into the low-carbon energy system by boosting economic development through the stable domestic supply of energy and the cultivation of new energy industry. Specific investment directions and goals are presented in the following table.
The MOTIE has also derived detailed RDI investment strategies by energy sector as a reference for making a substantive investment decision. Some examples of the detailed RDI investment strategies by energy sector are presented in the following table.
In 2017, the Korean government drew up “An Implementation Plan on Renewable Energy 3020.” According to the plan, the proportion of renewable energy among total electric power generation in Korea should reach 20% by 2030.
Investment Direction Goal of Investment
Cleaner Energy Supply Technology
s Attain higher efficiency of existing thermal power generations Increase competitiveness of renewable energy production
Higher Efficiency of Power Transmission and
Distribution
s Cope with electricity demand following electrification of energy system and increasing electricity consumption due to economic growth
s Invest into next-generation T/D and advanced micro-grid technologies
Innovation for Energy Consumption
s Induce efficient energy consumption to reduce GHG emissions Improve energy efficiency by applying AI, loT and ESS, etc.
Creation of Energy Platform Business
s Create new energy business through linking & sharing energy industries
s Develop business platform by using BigData and integration with other industries
Verification R&D for Global Leading-edge Energy Technology
s Secure track-record and verification of developed technologies for global export
s Invest into sustainable verification and certification areas
�Table 1-1� Major Direction of Energy R&D Investment
Source: KETEP (2017b).

Chapter 1 _ R&D and Innovation Policies to Enhance Energy Security (Korea)�ˍ�043
In order to attain this goal, solar and wind power facilities will take up more than 95% of new facilities and urban-style private solar power generation systems will be substantially increased through the expansion of certification for zero-energy buildings, etc. Solar power systems in the rural area will be also vitalized through the active participation of farmers and the integration of solar power into farming. Some large-scale projects such as floating solar power and offshore wind power systems will be implemented.
The Korean government has also established the plan on promoting the new energy industry based on the 3020 renewable energy strategy. In order to implement
Area Investment Strategy
Resources Development
s Support to develop technologies for remote operation and management of oil fields and to develop operation and maintenance technologies for marine resources development
Solar Photovoltaic
Power
s Develop high-efficiency and cost-reducing technology and secure track-record and verification
s Develop future breakthrough core-technologies for weight reduction, flexibility, and pellucidity
ESSs Support development and verification of ESS to realize stability of quality
of renewable energy and electricity service BM s Support to develop highly credible products with zero failure rate
Smart Grid
s Develop technologies to reduce GHG emission by inducing power consumption reduction, improving efficiency of electricity transmission, and integrating distributed electrical systems
s Develop technologies to facilitate economic transaction of electricity from renewable sources
s Develop e-prosumer technologies, which can make consumers directly participate in transactions of electricity as important stakeholders
Demand Management
s Develop technologies for smart energy network system and higher efficiency of consumption to contribute to realizing low energy consumption society and GHG emission reduction
s Support to develop technologies for zero-energy building and eco-friendly manufacturing process to secure new market
Nuclear Power
s Support to develop technologies for nuclear waste decontamination and reduction of pollutants
s Strengthen safety of nuclear power plants and support to develop technologies for domestic production of equipment and facilities for nuclear power plants
Protection of Facilities and
Infrastructures
s Improve technologies for physical protection of power plantss Upgrade cyber security and protection from EMP
�Table 1-2� Strategy for Energy R&D Investment by Area
Source: KETEP (2017b).

044�ˍ�2017/18 Knowledge Sharing Program with Visegrad Group
the plan, an energy R&D roadmap centered on solar and wind power will be established.
The cooperation among public sectors will be strengthened. Especially, cooperation between government and public enterprises will be improved. Inter-ministerial links for energy RDI will be highly facilitated by performing cooperative RDI among related ministries and improving cooperation among local governments.
Links among R&D, demonstration, and product supply will be strengthened by implementing market-oriented RDI to secure commercial success and by preparing commercialization bases through the demonstration and certification.
The Korean government will try to expand the proportion of distributed power generation up to 18.4% in 2030 from 11.2% in 2017, according to the 8th Basic Plan on the Supply and Demand of Electricity. The electric power system will be reinforced, especially for the expansion of renewable energy. For example, the brokerage market, ESS, and fuel cells will be strongly fostered to enlarge the distributed power generation.
During 2012-2016, a total of 1,183 energy R&D projects were finished and total R&D investments (including both government and private investments) in these 1,183 projects amounted to about 3.7 trillion KRW, among which government's investment accounts for about 2.3 trillion KRW and private investment for 1.4 trillion KRW.
Electronic VehiciesHome, Bullding
Intelligent Network+
Open and Use of Data
AutonomousVehicies
MicrogridHospital/Campus
EV Charging Station
Smart Factory
Power Generation
[Figure 1-2] Establishing New Energy Industry through Construction of Smart Cities
Source: MOTIE (2017).

Chapter 1 _ R&D and Innovation Policies to Enhance Energy Security (Korea)�ˍ�045
Power to Gas
Fuel Cell
Broker will collect, manage and trade distributed power(solar, wind, ESS, etc.)* Prepare law(revise the electric utility law)�Ņ�Start pilot project of distributed power brokerage
Enlargegrid-linked ESS-
Overcome powerintermittency,increase utilizationrate of distribution line
Install fuel cells atplaces withoutcity gas
Enlarge supply offuel cells
Surplus power hydrogem gas use by home, car, etc
Develop operation tech. based on ICTEfficient maintenance
Efficient use of energy
(’17) 0.4GW Ņ(’30) 1GW
Collect & analyze data on weather and generation from small solar power plant, etc.Improvement of forecasting error on power generation from renewable sources
*Vitalizing re-powering business(replacement of old renewable energy facilities)
Create profit from replacement of facilities
BrokerageMarket
ESS
Maintenance
ForecastGeneration
MarketCreation
Enlarge-ment ofSupply
ImprovingSustain-ability
[Figure 1-3] Fostering Brokerage Market, ESS, and Fuel Cells for Distributed Power
Source: MOTIE (2017).
(Unit: hundred million KRW, %)
Classification
Government R&D Invest.
(Cash)(a)
Private R&D Investment (b)
Total (a+b)
Cash In-Kind Sub Total Amount Proportion
Total of Energy R&D 23,196.6 4,406.0 9,017.5 13,423.4 36,620.0 100
Demand Management 6,768.0 1,251.5 2,721.9 3,973.4 10,741.4 29.3
Resource Development 439.3 112.4 153.8 266.2 705.5 1.9
Nuclear 2,652.8 547.8 959.8 1,507.7 4,160.4 11.4
New & Renewable 8,261.4 1,437.0 2,874.1 4,311.1 12,572.5 34.3
Smart Grid 2,205.6 633.9 1,335.6 1,969.5 4,175.1 11.4
Clean Thermal 1,166.5 330.2 584.7 914.9 2,081.3 5.7
Radioactive Wastes 303.2 5.9 37.5 43.3 346.5 0.9
International Energy R&D 745.5 55.0 159.4 214.4 959.9 2.6
Resource Circulation 608.3 32.0 188.4 220.4 828.7 2.3
Establish Base for Resource Circulation 46.0 0.3 2.3 2.6 48.6 0.1
�Table 1-3� Total Energy R&D Investment during 2012–2016
Source: KETEP (2016a).

046�ˍ�2017/18 Knowledge Sharing Program with Visegrad Group
According to the results of performance evaluation on national energy R&D program, performed in 2016, a total of 7,553 scientific papers had been published and 2,900 patents registered due to the project support from the R&D program.
The proportion of projects that were successfully commercialized among the total finished projects is about 28.4%, creating total amount of sales of about 2.9 trillion KRW and producing the cost-down effect of about 111 billion KRW.
The MOTIE has especially established “Strategies to develop clean energy technologies” in 2016 and invested R&D budget in six clean energy areas. According to the following table, MOTIE’s R&D investment in six clean energy areas keeps increasing every year from total of 453.6 billion KRW in 2016 to 592.8 billion KRW in 2018, which shows about a 30.7% increase.
(Unit: number)
Total Number Average Number per Project
Number per 1 Billion KRW
Papers 7,553 6.39 3.26
Patents 2,900 2.45 1.25
�Table 1-4� Scientific and Technological Output from the Energy R&D Program
Source: KETEP (2016a).
Classification Effects
Economic EffectsProportion of Commercialization 28.4%
Creation of Sales 2.9 trillion KRW
Other Effects
Inducement of Investment 530 billion KRW
Creation of Employment 22,619
Reduction of Energy Consumption 1,939 thousand TOE
Reduction of GHG Emission 913 thousand TC
�Table 1-5� Economic and Social Effects from the Energy R&D Program
Source: KETEP (2016a).

Chapter 1 _ R&D and Innovation Policies to Enhance Energy Security (Korea)�ˍ�047
The following table shows the government R&D investment in 14 clean energy technology areas. Compared to the R&D amounts of 2016, the R&D investment in such areas ESS, improvement of efficiency in transportation and industry, and smart grid is much higher in 2018.
(Unit: billion KRW))
Classification 2016 2017 2018
New & Renewable Energy 175.4 197.5 216.0
Improvement of Efficiency 90.1 138.4 140.8
Demand Management 53.3 69.4 67.3
Nuclear Safety & Decommissioning 19.7 23.7 27.6
Thermal Power Generation/Transmission and Distribution 57.8 62.2 69.7
CCUS 57.3 71.6 71.4
Total 453.6 562.8 592.8
�Table 1-6� Government R&D Investment in Six Clean Energy Areas
Source: MOTIE (2018).
(Unit: billion KRW))
Classification 2016 2017 2018
Solar 60.4 65.8 71.3
Wind 29.5 28.0 34.2
Hydrogen Fuel Sell 40.4 46.3 49.0
Biomass 33.9 37.4 39.9
Other Renewable 11.1 20.0 21.6
Improve Efficiency in Industry 35.9 46.8 54.8
Improve Efficiency in Transportation 32.8 61.5 55.8
Improve Efficiency in Building 21.4 30.1 30.2
Smart Grid 35.2 43.5 49.5
Clean Thermal 22.7 18.7 20.1
ESS 26.8 46.1 50.3
e-Prosumer 26.6 23.3 17.0
Nuclear Safety & Decommissioning 19.7 23.7 27.6
CCUS 57.3 71.6 71.4
Total 453.6 562.8 592.9
�Table 1-7� Government R&D Investment in 14 Clean Energy Technology Areas
Source: MOTIE (2018).

048�ˍ�2017/18 Knowledge Sharing Program with Visegrad Group
3.3. RDI to Secure and Stable Energy Supply
3.3.1. Policy Direction to Secure Stable Energy Supply
For the policy of energy security, the country is promoting diversification of energy and stockpiling of oil, expansion of energy supply facilities, and development of overseas resources based on non-petroleum energy going through two oil shocks.
A. Diversification of energy: The country is promoting energy diversification continuously to meet various energy demands and to increase reliability of energy supply at the same time. Diversification of energy supply is of primary importance in establishing the foundation of energy security.
B. Strategic stockpiling of oil: We need to stockpile a certain amount of crude oil or petroleum in preparation for oil crises, such as outbreak of war, or cutback or disruption of oil supply. The government established the plan of oil stockpiling and has promoted it since 1980, keeping enough petroleum for 190 days.
C. Expansion of energy supply facilities: We need to expand petroleum refinement facilities, generating plants, energy supply chain, and district heating facilities successfully to meet increasing energy demand efficiently due to the limit of geographic isolation. For the electricity industry and natural gas industry, public enterprises will lead plans, investment, and expansion of relevant facilities. For the petroleum industry, private enterprises will do so.
D. Promotion of developing overseas resources: As reliable securing of energy and mineral resources depending on imports from abroad is directly related with economic growth, the government has actively developed overseas resources. As of the end of 2011, the self-development rate of petroleum and natural gas is 13.7%, while it is 29.0% for strategic minerals.
3.3.2. Cases of Korean RDI Policies to Secure Stable Energy Supply
A. Direction: secure new and stable energy sources by enhancing capability of resource development, enlarge DG by more than 15%, and increase supply of new and renewable energy up to 20% by 2030.
B. Secure next-generation strategic resources: develop technologies for exploration of resources, drilling, production, etc.
C. Highly efficient clean thermal: technologies to establish clean thermal power generation system to attain higher efficiency and, therefore, to mitigate GHG emission compared to conventional thermal

Chapter 1 _ R&D and Innovation Policies to Enhance Energy Security (Korea)�ˍ�049
D. Safe nuclear power generation: develop technologies for safety-first operation of nuclear power plants and strengthen export-competitiveness of new-type nuclear power generators
E. New and renewable hybrid system: develop technologies for integration of renewable energy production and storage systems
F. Next-generation clean fuel: develop technologies for producing clean liquid fuels using biomass, waste resources, etc.
G. Next-generation T&D: develop technologies related to HVDC systems and the north-east Asian super grid
3.3.2.1. Development of Solar Photovoltaic Power Generation
$��7HFKQLFDO�'H¿QLWLRQ
s A futuristic technology of distributed generation to be compatible with the development of fossil fuels by transforming solar energy – a clean source of infinite energy – to electric power, and solve energic/environmental problems at the same time
B. Policy Trends
s The government planned that renewable energy would take up to 11% by 2035 with the vision for renewable energy industry power based upon the Second National Master Plan for Energy (2014). However, it recently raised the goal to 20% by 2030 with the launch of the new government.
s Select the renewable energy technology, including solar power, as a core technology for competitive power of future energy.
s Set up “The Fourth Renewable Energy Basic Plan” and plan to promote the use of solar power by abolishing RPS classification, giving weighted value according to the types of installation and sizes, increasing the selected quantities of solar distributors, and assigning adequate quantities to small business operators (under 100KW).
3.3.2.2. Development of Wind Power Generation Technology
$��7HFKQLFDO�'H¿QLWLRQ
s The wind turbine is a device that converts the wind’s kinetic energy into to electrical energy through mechanical movement. It consists of blades, axial transmission systems, and power conversion systems.

050�ˍ�2017/18 Knowledge Sharing Program with Visegrad Group
B. Policy Trends
s The second national master plan for energy- Increase dispersed generation in order to supply more than 15% of electricity
generation through distributed power generation systems by 2035 - Expand renewable energy to 11% of primary energy consumption by 2035 as
a way of enhancing national energy security to escape from energy isolation- Expand wind power among renewable energy to 11.3% of primary energy
consumption by 2020, 12.5% by 2025, and 18.2% by 2035s The fourth renewable energy basic plan
- Reduce waste disposal, and foster solar PV and wind power as core energy sources
- Provide 13.4% of the total electricity generation with renewable energy in 2035
- Invest in development of practical technology such as cost management applicable for early supply, feasibility, etc.
s National strategy for new energy industry 2030- Develop renewable energy in order to encourage low-carbon technologies,
and sets up industrial ecology.- Create a new market by applying a HVDC electric power transmission system
to an offshore wind power complex in the west sea.
3.3.2.3. ESS Technology Development
$��7HFKQLFDO�'H¿QLWLRQ
s ESS technology promotes low costs, high efficiency, and stabilization of electricity by improving the quality of renewable energy and using resources of fossil fuels productively.
B. Policy Trends
s The Second National Master Plan for Energy (2014)- The government planned to reduce 15% of the electricity demand by 2035 in
the Second National Master Plan for Energy (Jan. 2014).- Relevant regulations and systems to promote the market of ESS have been
arranged.- Transaction in the electric power market, especially dealing with electricity
stored in ESS, was temporarily allowed (electricity trading market) with the discount on the ESS-charged power for three years, from 2015 to 2017 (ESS charge rates).

Chapter 1 _ R&D and Innovation Policies to Enhance Energy Security (Korea)�ˍ�051
- The government supports 50% of the installation cost when setting up ESS with the renewable energy facility, and applies the REC weighting method yearly on the electricity produced by ESS when operated in wind power plants. ESS is given the same legal status to the one of emergency power plants (emergency power supply).
- Since 2015, the weighing method has been applied to the amount of electricity discharged from wind power plants operating ESS at peak time: 5.5 in 2015, 5.0 in 2015, 5.0 in 2016, 4.5 in 2017.
- Environment-friendly energy sources, a combination of renewable energy and ESS, were established and operated. The energy-independent island model was also developed to reduce GHGs produced by diesel power plants on islands.
- ESS was added to the list of high-efficiency apparatuses in April, 2013. Since then, ESS has been included in “Energy Efficient Loans” and “Investment Tax Deduction for Energy Saving Facilities” in 2014.
s A microgrid system was established on islands depending on diesel power plants. Hybrid system projects including wind power, solar PV, geothermal heating, and ESS are planned to be carried out.
s The government has supported export promotion models such as the fusion model combining service with equipment, the service model for developing countries, etc. It has acknowledged the reduced amount of CO2 in export businesses as a domestic offset target, and promoted supporting projects of international organizations and official development assistance (ODA).
3.3.2.4. Development of Multi-energy Trading System & Infrastructure
$��7HFKQLFDO�'H¿QLWLRQ
Infrastructure and systems support various energy types, including electricity and heat produced from DR and dispersed generation resources to be effectively traded in the energy-trading market and among individual merchandisers.
s Develop ambient devices in home display reflecting the energy-aware clock concept to support energy consumers to actively participate in the DR market by perceiving the trend of energy consumption intuitively.
s Set up a context-awareness platform to control itself according to the manual, perceiving the pattern of energy consumption automatically.
s Set up a smart heat grid platform to offer two-way switchgear to energy consumers utilizing renewable energy.
s Develop technology for multi-energy management based upon economical assessment in order to create an energy industry using various energy sources such as electricity, heat, or gas.

052�ˍ�2017/18 Knowledge Sharing Program with Visegrad Group
B. Policy Trends
The Korean government encouraged participation in the e-prosumer market, announcing the “2030 New Energy Industry Advancement Policy Package” in order to cope with the new climate system preemptively.
The government has prepared grounds for the transaction of small-scale distributed resources, enacting a special law for new energy industry to lower barriers to entry.
It activates spontaneous new energy industry by expanding various distributed resources, encouraging participation in the electric power market, and minimizing the effects on the Korean electricity systems.
It operates programs in which small-scale electricity consumers can participate by opening DR, and plans to implement energy ICT convergence by stages from 2016 to 2020.
As the Revised Electricity Business Act, including “vesting contracts” and “intelligent demand markets”, was passed in April 2014, the government has prepared grounds for the transaction of demand resources in the electric power market.
�����5',�WR�,PSURYH�(I¿FLHQF\�RI�(QHUJ\�&RQVXPSWLRQ
3.4.1. Current Status of Energy Consumption
The policy of energy security should move focus from supply to consumption. That is, reduction of energy demand through efficient use of energy is becoming important in energy security.
South Korea is the 8th country in primary energy consumption in the world and spends lots of energy relative to GDP. In advanced countries in Europe, syntonization of energy consumption and economic growth are weakened, and energy consumption is already tied up or is decreasing. However, in Korea, energy consumption is still growing.
In 2014, major OECD countries showed that they were entering a new phase of low growth, around 3%, including our country (3%), the UK (3%), and the United States (2.4%). Consumption of other major OECD countries has decreased, but that of our country is increasing rapidly. This means that we have a structure of excessive consumption compared with level of economic growth.

Chapter 1 _ R&D and Innovation Policies to Enhance Energy Security (Korea)�ˍ�053
Total primary energy supply (TOE/1,000 USD), meaning energy efficiency, of our country is 0.24, which is 2.4 times higher than the 0.10 of Japan. Energy efficiency is a measure to get two effects of increasing industrial competitiveness and decreasing energy demand.
In addition to the growth of total power consumption, the problem is that the gap between average power consumption and peak power consumption is becoming wide. The gap between average power consumption and peak power consumption was 17GW in 2010, but the gap increased to 23GW in 2015, meaning an extra 6GW consumption.
�������&DVHV�RI�.RUHDQ�5',�3ROLFLHV�WR�8SJUDGH�(QHUJ\�HI¿FLHQF\
s Direction: decrease demand for electricity by 15% through ICT integration and increase supply of ESS and EMS substantially.
s Smart homes and buildings: secure core-technologies to integrate renewable energy, ESS, EMS, and ICT into homes and buildings to maximize energy-efficiency and create a new energy market.
s Smart FEMS: develop technologies for providing energy saving solutions to heavy energy consuming industries and factories.
s Smart microgrid: develop technologies for operation system solutions to manage distributed energy resources and load in an integrated way.
s Energy negawatt system: technologies to integrate and control various energy systems including electricity, gas and heat, etc.
s ESS adapting to demand: develop technologies for improving electricity storage and utilization by securing V2G and various ESS technology portfolios.
s CCUS: develop technologies to capture CO2 from power plants or other manufacturing plants and to utilize or store captured CO2.
3.4.2.1. Development of Technology for Thermal Power Generation
$��7HFKQLFDO�'H¿QLWLRQ
High efficiency compared with existing thermal power, green future thermal power generation used for fuel diversification, reducing CO2 levels
B. Policy Trends
s 2030 New Energy Industry Activation Plan (2015) - Encourages coal-fired power plants to adopt A-USC systems for low-carbon
generation, and develops high-efficiency LNG.- Verifies gas turbine technologies (LNG, cogeneration power plants), and sets
up global target market strategies (F-class gas turbines)

054�ˍ�2017/18 Knowledge Sharing Program with Visegrad Group
s The 2nd National Basic Energy Plan (2014)- Applies the best available technology such as USC or CCS to thermal power
plants, and assesses the efforts to reduce GHG emissions- Invests in R&D to purify traditional energy based on fossil fuels: high
efficiency and eco-friendly development systems, localizing component material, safety management and monitoring systems
s National Master Plan for Korea’s Future Growth Engine (2015)- Selects “Supercritical CO2 Power System” as a promising field for the future
growth engine- Improves generation efficiency compared with existing electricity
technologies by using supercritical CO2.
���������'HYHORSPHQW�RI�7HFKQRORJLHV�IRU�,PSURYLQJ�(QHUJ\�(I¿FLHQF\�LQ�WKH�Building Sector
$��7HFKQLFDO�'H¿QLWLRQ
Develops technologies of core components, and optimizes landmark buildings to popularize zero-energy buildings that are an essential agenda in reducing GHG emissions
B. Policy Trends
Plans to apply the zero-energy policy to all new buildings from 2025 in order to save energy and reduce GHG emissions.
s A passive building design is mandatory for all residential buildings from 2017, and the zero-energy policy is applies to all new buildings from 2025.
s All non-residential buildings have an obligation to follow Building Energy Simulation from 2017 and the zero-energy policy from 2025.
s Public buildings should be certified as zero-energy buildings from 2020. Korea Heat Map is set up.
���������'HYHORSPHQW�RI�7HFKQRORJLHV�IRU�,PSURYLQJ�(QHUJ\�(I¿FLHQF\�LQ�WKH�Industrial Sector
$��7HFKQLFDO�'H¿QLWLRQ
Integrates dispersed energy used in the industries that are main consumers of energy resources (e.g., heat, electricity, and etc.) and establishes infrastructure for a new industrial structure to reduce energy consumption and carbon levels by developing new high-efficiency procedures.

Chapter 1 _ R&D and Innovation Policies to Enhance Energy Security (Korea)�ˍ�055
B. Policy Trends
As a follow-up to the Basic Act on Low Carbon Green Growth (April, 2010), the government has implemented the Target Management Enterprises for Green House Gases and Energy, regulating carbon dioxide with the introduction of carbon trading in 2015.
s Activates new energy industry through new energy business models and policy development, and suggests strategies and roadmaps to cope with various energy fields in the future (e.g., energy networks, smart factories, etc.)
s Promotes low-cost structures through unused thermal energy between plants and energy business operators (IES Baseline Supply Plan, 2014)
s Supports eco-friendly procedures as follows: improvement of energy consumption efficiency through smart factories, new technology development to reduce GHG emissions, creation of new industry using the unused heat, etc. (2030 New Energy Industry, 2015)
s Promotes building of 10,000 smart factories by 2020 through innovative procedures on the basis of IT, SW, and internet of things in order to create convergence-type new manufacturing industry (Manufacturing Industry Innovation 3.0 Strategy for Creative Economy, 2015)
���������'HYHORSPHQW�RI�7HFKQRORJLHV�IRU�,PSURYLQJ�(QHUJ\�(I¿FLHQF\�LQ�WKH�Transportation Sector
$��7HFKQLFDO�'H¿QLWLRQ
Coping with climate changes through the development of eco-friendly cars
B. Policy Trends
s Set up the target to supply 1M eco-friendly vehicles, including 200,000 electric vehicles, by 2020 (20% of the total domestic market) according to Project of the Development and Deployment of Environmentally Friendly Vehicles (2016–2020).- Plans to establish 1,400 EV charging stations and 80 hydrogen fueling stations
to expand low-cost and high-efficiency infrastructure- Supports a subsidy if purchasing eco-friendly vehicles and installing charging
stations
s Set up the target to supply 1M electric vehicles by 2030, according to New Energy Industry- Plans to reduce 104,100,000 tons of GHG in the transportation sector by 2030

056�ˍ�2017/18 Knowledge Sharing Program with Visegrad Group
- Form industry ecology: leasing batteries, charging service, riding bicycles, utilizing waste batteries, manufacturing electric vehicles, and purchasing electric car insurance
3.4.2.5. Smart Microgrid
$��7HFKQLFDO�'H¿QLWLRQ
Set up large-scale dispersed autonomic electric grids based on multiple microgrids, such as campus microgrid, group microgrid, utility microgrid, and optimally managing various resources (electricity, heat, gas, or water)
s Develop a platform technology to improve energy efficiency of the whole city considering the transfer between energy sources (electricity Ň heat), conversion (batteries, thermal energy storage, water tanks), and sharing (dispersed power resources, arrays, waste heat) based upon information technologies
s Set up intelligence microgrids in order to improve stability, quality, credibility, and availability of the electric power system
B. Policy Trends
s Proceed with core technologies to set up distributed generation systems and cope with climate change- The 2nd Energy Master Plan (Jan. 2014): Set up electricity supply systems by
regions based on the dispersed energy through technological development and verification, as microgrids were selected as a technology to improve electricity reliability of renewable energy, which was the essence of the distributed generation system
- The 4th New and Renewable Energy Master Plan (Sep. 2014): Replace diesel-engine generators used in the islands with renewable energy+ESS convergence microgrid technologies through energy-independent islands, which is one of the new energy industry business models
s The Plan on Activation of New Energy Industry and Development Strategy of Core Technologies to Cope with Climate Changes (Apr. 2015): Set up the target to supply EMS to houses, buildings, and factories, and develop energy-independent models by applying hybrid renewable energy systems
s The 7th Basic Plan for Electricity Supply and Demand (July 2015): Expand incentive programs or selective rate systems to support new industry markets of V2G, energy storage devices, and microgrids as the center of energy policies moves to demand management
s The 2030 New Energy Industry Strategy (Nov. 2015): Apply microgrid businesses to colleges (more than 10), industrial complexes (more than 100), and islands

Chapter 1 _ R&D and Innovation Policies to Enhance Energy Security (Korea)�ˍ�057
(half of the total residential islands) in order to expand e-prosumer businesses across the country by 2030
3.5. RDI to Strengthen Protection of Energy Facilities or Infrastructure
3.5.1. Necessity of Maintaining Security of Integrated Energy System
The critical issue in integrated energy networks is that boundaries between supply and consumption of energy will become blurred in the future. Existing consumers only have consumed energy, but they are expected to expand their participation through demand response programs in the future. There will be a kind of e-prosumers who have similar generation facilities such as fuel cell, wind power, sunlight and produces energy by himself/herself. Consequently, the unidirectional communication network of existing point-to-point method should be expanded or changed into an interactive network.
As energy network technologies in the future, such as smart meter and IoT, will generate a lot of data in a short time, communication networks need to transmit large amounts of data without delay and requires a higher level of reliability than the present level.
As components are increased to connect with communication infrastructure, there will be millions of components from hundreds of manufacturers. Similarly, in software, various solutions developed by many developers shall be used. Consequently, it is very important to prepare interface standard and standardization of communication protocols to secure interoperability among communication devices.
Since communication technology continues to evolve after installation of these devices, assessment and examination of interoperability should be conducted consistently. In addition, as newly developed devices should interwork with existing equipment, backward compatibility is to be guaranteed even though there will be limits on new functions.
Many different types of hardware and software are connected in an integrated energy network, and the integrated energy network could be weakened from the perspective of cyber security. Such problems could happen easily when existing hardware, new hardware, and software are operating simultaneously. Increase of interfaces makes systems complicated and also causes a rise of cyber weak points.

058�ˍ�2017/18 Knowledge Sharing Program with Visegrad Group
In addition, ownership and operation of integrated energy networks could be controversial. That is, it is not easy to conclude whether to use integrated energy networks in the future through the network owned by utilities or rented communications network from telecommunication companies. This problem is not only the matter of ownership. Some requirements should be considered, such as economics of investment in network, reliability, affordability, and controllable level. Under the circumstance of competing with ordinary citizens for access privileges like in commercial communications network, utility companies generally prefer to own their communications network because they are concerned that they cannot use the network when data traffic from commercial communications network is congested in a crisis situation of demand and supply of energy. In addition, when using commercial communications network for operation of power grid, problems could happen in maintaining security and reliability because interdependence between the telecommunications industry and energy industry increases. If their interdependence increases, vulnerability in security of one side could be passed directly on to the other side, and then failures could happen from both sides. On the other hand, telecommunication companies want to operate commercial communications network meeting requirements of integrated energy network and to make commercial wireless data communications networks play a pivotal role in smart grids.
As digitalization has improved, the need for security against EMP attacks in energy network increases. EMP does not affect the human body, but affects digital systems using electric circuit extensively. It is classified into two types: artificial EMP and natural EMP. Artificial EMP is produced from explosion of nuclear bombs, EMP bombs, or by electromagnetic waves generators. Natural EMP is generated from lightning strikes or explosions of sunspots. Recently, EMP generators are getting smaller and getting easy to make; thus, terrorism risk using EMP is increasing.
Until now, EMP protection technology study has focused on the military field of nuclear EMP. However, as risk of non-nuclear EMP increases, it is time to discuss and study in cooperation on various types of EMP damages to national infrastructure including energy, transportation, finance, and communication.
According to the EMP threat report published by the congressional EMP commission in 2008, if a nuclear bomb setting off EMP explodes about 300km above the central United States, approximately 70% of power equipment would be damaged, which would take up to 33 months to restore.

Chapter 1 _ R&D and Innovation Policies to Enhance Energy Security (Korea)�ˍ�059
3.5.2. Cases of Korean RDI Policies to Strengthen Protection of Energy Facilities
s Direction: develop a more innovative technological solution to power line communication and improve technologies to protect critical energy infrastructure
s Data communications: develop technologies to upgrade future data communication architecture, energy data communication quality, and standards and interoperability
s Cyber security: upgrade technologies to prevent cyber attacks to cause control system failure due to communication obstacle or tampering among control centers
s Information protection: perform RDI to upgrade protection for information, such as electric system operation data generated from integrated energy network
s Defense against EMP: develop technologies to protect electric power system, such as SCADA main facilities from EMP and develop EMP protection filters and parts and components
3.5.3. Data Communications in Integrated Energy Network
A. Data Communications Architecture in the Future
Studies on network architecture of data communications in the future anticipate that communications between energy network devices shall be connected more closely in generator, power transmission network, substation, local data collection system, smart meter, home appliances, and other devices by utilizing interactive broadband communication technology. In addition, it is expected to connect market operator, enterprise solution, and a basic system of utilities and utility equipment planning system through flexible, reliable, and faster communication infrastructure.
The critical point in relation with operation and regulation of communications network is that the boundaries between “development” and “consumption” will become blurred in the future. Existing consumers only consume power, but they are expected to expand their participation through demand response programs in the future. In addition, they have similar generation facilities such as fuel cell, wind power, and sunlight and even produce power by themselves. In order to play such various roles for consumers in data communications system, a unidirectional communication network of existing point-to-point methods should be expanded or changed into interactive networks.

060�ˍ�2017/18 Knowledge Sharing Program with Visegrad Group
B. Requirements for Quality of Energy Data Communications
As energy network technologies in the future will generate a lot of data in a short time, the data communication network needs to transmit large amounts of data without delay and requires a higher level of reliability than the present level. Data and network requirements to be utilized in various fields are as below.
Requirements suggested here are estimated by industries. Thus, some of the contents of requirements could be different depending on industries. In addition, we need to evaluate carefully whether the level of requirements is appropriate or not. For example, regarding reliability, the range could be wide, from 99% (365 days of breakdown among 365 days) to 99.9999% (21 seconds of breakdown among 365 days). In case of the same 3-day breakdowns, 3 days of intense heat in midsummer are different from 3 days in spring or fall.
s Home networks that control and monitor home appliances and HVAC equipment could transmit individual measured data in dozens of kbps or 100 kbps speed to a concentrator (a control point).
s To have a broadband monitoring system that can control distribution and transmission networks precisely, the system could collect and send data of operating parameters such as voltage, current, phase, and frequency less than one second. In addition, the system needs a high level of reliability, backup power supply, and other supplementary installations.
In a bid to meet the requirements, a more innovative technical solution is necessary for designing the communication networks of power grids. Close cooperation among utilities, manufacturers, System Integration (SI) operators, and consumers is essential.
Standards and interoperability as components are increased to connect with communication infrastructure, it is very important to prepare interface standard and standardization of communication protocols to secure interoperability among communication devices.
For example, all devices such as smart meters, most sensors, and main equipment of power plants and substations should have communication modules. There will be millions of components from hundreds of manufactures. Similarly, in application software, various solutions developed by many developers will be used. Since communication technology continues to evolve after installation of these devices, assessment and examination of interoperability should be conducted consistently. In addition, as newly developed devices should interwork with existing equipment, backward compatibility has to be guaranteed, even though this entails limits on new functions.

Chapter 1 _ R&D and Innovation Policies to Enhance Energy Security (Korea)�ˍ�061
Many different types of hardware and software are connected in an integrated energy network, and the integrated energy network could be weakened from the perspective of cyber security. Such problem could happen easily when existing hardware, and new hardware and software are operating simultaneously.
Standardization of a series of communication protocols is indispensable for securing interoperability. Here, the key point is a trade-off between restrictions on innovative activities of various technologies caused by rushing into standardization and problems in interoperability caused by carrying out standardization too late. The main point is whether it is possible to continue technology innovation inside or outside of standardization work.
C. Ownership of Data Communication Network
Ownership of integrated energy networks could be controversial. That is, it is not easy to conclude whether to use integrated energy networks in the future through the network owned by utilities or rented communications network from telecommunication companies. Usually, utilities build their own communication networks and conduct main communication activities related to reliability and security requirements, and have used the commercial communications network for relatively less-restricted tasks.
Eventually, conclusion of utilities depends on costs (investment vs. operating cost, it could be different depending on utility regulations), reliability, affordability and controllable level. In consideration of all these factors, utilities prefer to have their own communications network because they want to secure reliability of the network operation. For example, under the circumstance of competing with ordinary citizens for access privileges, like in a commercial communications network, they are concerned that they cannot use the network when data traffic from commercial communications network is congested in a crisis situation of demand and supply of energy. In addition, when using a commercial communications network for energy network operation, problems could happen in maintaining security and reliability because interdependence between telecommunications industry and energy industry increases. If interdependence between them increases, vulnerability in security of one side could be passed directly on to the other side, and then failures could happen from both sides.
On the other hand, telecommunication companies want to operate commercial communications networks in an integrated energy network and to make commercial wireless data communications networks play a pivotal role in smart grids. They claim that it is possible to prove reliability and resilience of communication network required by utilities. A regulation issue related to this is how to allocate frequency bands of an energy network.

062�ˍ�2017/18 Knowledge Sharing Program with Visegrad Group
3.5.4. Cyber Security in Integrated Energy Network
A. Risks of Cyber Security in Integrated Energy Networks
Cyber security means all kind of methods to protect data, system, and network from intentional attacks or accidents and to prepare system recovery. When data communications increase in energy networks, new types of cyber security risks or challenges could happen, and problems occurring from small regional units could be spread into an entire network. Risk cases are as below.
s Collapse of control system: power supply is devastated completely in a wide area. This could happen due to a failure or tampering between grid controller and central control center.
s Problems in customer unit: errors in charging caused by tampering smart meter, interruptions in power supply for customers
s EV commute disorder: when a charging program of an EV charging station is changed intentionally, EV owners may be unable to use vehicles at a proper time.
s Leakage of confidential data: confidential data of an individual or a company is leaked and used by thieves (e.g., providing information about empty houses), corporate spies, or terrorists (e.g., providing information about the most important line in a distribution network).
In an integrated energy network, as weak points increase, vicious individuals and bodies increase too. The possibility that these risks could lead to accidents or illegal acts is growing. To minimize the possibility of attacks or the extent of damage, we need a process to check the suitability of cyber security strictly when we design and adopt components of energy network or operation procedures.
Challenges to maintaining cyber security of energy network come from such features of integrated networks in the future.
s New control systems and processes: new control and operation system and new processes are necessary to control a vast amount of data produced in the process of grid operation by each utility or to control by individual customer unit.
s Grid components: energy network consists of grid components provided by various manufacturers and requires multiple interfaces and protocols. These components are manufactured in accordance with diverse standards.
s Continuous upgrade of network: the development speed of ICT technology used in energy network is faster than that of components. For this reason, problems such as intercompatibility and security vulnerability occur between existing components and new ICT.

Chapter 1 _ R&D and Innovation Policies to Enhance Energy Security (Korea)�ˍ�063
Connection points in energy networks are growing rapidly. In addition, as threats to cyber security evolve day-by-day, it is impossible to protect the energy network completely from cyber accidents. Then, it is important to reduce ripple effect of accidents and to increase resilience to accidents. It is impossible to protect networks completely from all kinds of threats and attackers. In order to control such threats and all kinds of risks to grid efficiently, we need an approach focusing on preparation of an appropriate balance point for restoration, recovery, and protection of the grid, especially from a holistic point of view.
B. Vulnerability of Energy Network
An efficient response system to cyber attacks should be handled with particular significance for reliable operation of the energy network. However, to alleviate vulnerability of cyber security in a network is a key issue at the moment, and all the stakeholders of manufacturer, utilities, and the government should take responsibility.
Vulnerability of cyber security comes from human error, procedures, and technical and physical environment. Security issues are caused by disgruntled employees or by hackers and attackers who try to attack outside of grid. Especially, inside attackers could cause serious damage depending on their level of knowledge on internal information. According to studies, 38% of cyber security accidents of control systems are committed by insiders.
Security for procedures is required to guarantee that all kinds of methods related to grid operation protects companies, equipment, and goods to the full extent. In case of cyber security of energy networks, there are ways to protect them, as below. For example, to review and check security with various items before purchasing equipment, to check security features of IT and communication equipment by external institutions, to implement a software development process including security checks, and to conduct physical security checks for districts where computer and communication equipment are installed.
Technology security deals with IT hardware, application software, embedded software (usually firmware for which a manufacture offers), communication protocol, and design, installation, and interoperability of communication interfaces. In power grids of the future, millions of programmable devices, which are vulnerable to software application and firmware, are to be operated in EVs and PMUs, transforming equipment and other equipment including smart meters.
Communication security is to alleviate vulnerability of network communication protocols in order to ensure reliable data transmission. Issues and solutions related to security could be different depending on the protocol being used at the moment.

064�ˍ�2017/18 Knowledge Sharing Program with Visegrad Group
As an energy network is very broad and complicated, cyber attacks and accidents could be unavoidable. In case of an accident, a function to deal with digital forensic is required for the concerned organization to find out the cause of a cyber problem and to seek directions of system improvement.
3.5.5. Information Security
A. Information Security
In relation to cyber security, information protection and security are important issues. With use information of millions of users, energy networks in the future will obtain detailed operation data from tens of thousands of sensors, and communicate and store it. Data could be provided to those who want data excluding those who do not want data causing some issues here. In relation to this matter, the main questions from industries and regulatory agencies are as follow:
s Which data should be dealt with carefully?s How can you classify people for whom access to data is allowed? When? s How can you be convinced that data is controlled and protected properly? s How can you balance between concerns for privacy and industrial and social
benefits caused by providing data? %��&ODVVL¿FDWLRQ�RI�3ULYDF\�DQG�6HFXULW\
Main data in energy networks are classified into operational data for network and the energy consumption data for individual consumers.
(a) Operational Data
Operational data is related to generation, transmission, distribution grid, and components. It has nothing to do with general users. It includes schematics of network, specification of components and control signals, operation procedure, analysis results of power flow in transmission line, and output history of generator in a hydraulic plant. Improper leakage of operational data and other information brings about negative results that spread over the entire society.
In relation to information leakage, controversy over power consumption data of individuals is a matter of interest. However, it is more important to control operational information from the perspective of impact on network operation. Leakage of operational information of grid such as network configurations, control signal and load analysis information causes security threats bringing about physical or cyber attacks.

Chapter 1 _ R&D and Innovation Policies to Enhance Energy Security (Korea)�ˍ�065
(b) Energy Consumption Data
Energy consumption data could be obtained by measuring commercial and household energy consumption of individual consumers. Leakage of consumer information like power consumption per minute could set off somehow subjective emotional injury, besides apparent objective damages. A simple fact that a third organization has sensitive personal information could inflict pain on a consumer besides damages of theft or housebreaking.
In relation to acquisition and use of data, subjective and objective privacy issues could be identity theft, surveillance by a government agency, monitoring energy consumption of competitors or a third service provider, use as criminal tools, and data misuse. Enterprises, the government, and criminals are the most likely groups to use energy consumption data for legal or illegal purposes.
C. Ownership, Access, Use and Leakage of Data Privacy for information means that it is possible for the owner of data to control
access and use of data. The DOE of the United States conducted a survey for opinions from industries and consumers on access to energy network data, use by third parties, and privacy. The survey showed that “a lot of people thought that data access was the more important issue rather than the ownership of data.”
Consumers of power could offer collected information to those who they want to give it to by installing an electric meter at homes and workplaces or appliances. However, ownership of metering information is somewhat uncertain because utilities own smart meters and other devices, and measure consumption. Naturally utilities know how much energy they supply is consumed and have the right to use the information for grid operation or for the original purpose. However, if they use detailed metering information for other purposes, it should be regulated properly.
The point is that consumers want to and should have the right to control their information to be used helpfully or maliciously by the third party. Regulations and guidelines are necessary for utilities about how to carry out the consumer’s right to control. Utilities adopt and apply appropriate information security technology to ensure that such control is implemented properly.
Unlike other areas, energy consumers can rarely choose a supplier and have to accept any policy suppliers’ offer. For this reason, regulatory agencies need to check additionally if utilities collect, store, and protect customer information properly.

066�ˍ�2017/18 Knowledge Sharing Program with Visegrad Group
3.5.6. EMP Protection Technology
A. Summary of EMP
EMP refers to a powerful gamma-ray electromagnetic storm that can be generated naturally from explosion of sunspot and lightning strike or can be produced artificially by nuclear bombs or EMP bombs. All the electronic equipment within the area of influence will be damaged and it will cause a serious crisis to the country such as collapse of national and private infrastructure.
EMP is classified into nuclear EMP and non-nuclear EMP. As nuclear EMP explodes at a height of over 40km, it is also called high-altitude EMP (HEMP). HEMP and High Power Electro Magnetic (HPEM) are kinds of EMP generated artificially, and they are also called International Electro Magnetic Interference (IEMI).
B. Generation Principle and Damage of EMP
LEMP generated by lightning could be solved substantially by installing a surge protector. The impact of a geomagnetic storm by explosion of sunspot appears mainly in Polar Regions, such as northern Canada and the southern part of South Africa. It is known that our country is outside of the area of influence, but we need to prepare for this because the strength of sunspot explosions is getting powerful.
HEMP uses large-scale electromagnetic waves generated from explosion of a nuclear bomb. The damage area is wide and damage degree is fatal. It generates three kinds (HPEM, LEMP, geomagnetic storm) of electromagnetic waves from non-nuclear EMP stage by stage. Gamma rays are emitted by nuclear explosion and head for the surface of the earth where air density is increased gradually. The rays collide with air molecules and collided air molecules produce an electric field by developing current flow with the Compton effect. Through a continuous process by which magnetic fields are generated by the electric field around it, high-power electromagnetic waves are generated. The waves cause damages and malfunctions of unspecified electronic equipment over a large area. Eventually, the waves impact on all infrastructure such as electricity, railroad, finance, etc.
Electric field intensity of nuclear EMP is about 50k V/m, and it corresponds to 250 times 200 V/m, the EMI electric field intensity that the military allows for vessels and aircraft. According to the EMP threat report published by the congressional EMP commission in 2008, if a nuclear bomb setting off EMP explodes about 300km above the central United States, approximately 70% of power equipment would be damaged and it would take up to 33 months to restore them.

Chapter 1 _ R&D and Innovation Policies to Enhance Energy Security (Korea)�ˍ�067
HPEM among EMPs is classified into EMP bomb, which uses pulse power by explosive energy, and HPM, which uses repetitive pulse power by electric energy. EMP bomb forms magnetic field by putting primary power into electric coils inside of flux compression generator (FCG). Then output current from FCG is applied into pulse shape circuit and impulse voltage waves are produced. Again, impulse voltage waves are put into a microwave generator and electromagnetic waves are produced. Finally, electromagnetic waves are radiated through an antenna.
Nuclear EMP is produced mainly at less than 300Mhz. For non-nuclear EMP, as it is generated from unspecified frequencies up to 18Ghz; thus, we need to prepare protection measures understanding features of each EMP.
For damages from EMP, radiative EMP in the first place spreads into the atmosphere and penetrates into buildings and windows, causing malfunctions or damaging interelement. Secondly, conductive EMP joins with electric cables and communication cables inducing instant overvoltage/transient current pulse, and penetrates into systems, causing malfunctions or damaging interelement. For protection measures against EMP, respective mechanics should be applied to radiant and conductive EMPs. Areas should be separated into outdoor space, building, room, equipment, etc., and each part requires respective measures. Protection measures could be electromagnetic wave shield, filter addition to power lines and signal lines, and change into linear and nonlinear components against overvoltage and transient current.
C. Standardization Trends of EMP Protection
The International Electronical Committee (IEC) completed technology standards documents such as guidelines for test and measurement technology for HEMP and HPEM, installation of EMP protective equipment, and mitigation instructions. Especially, IEC 61000-5 describes the specification of protective equipment for HEMP and protection methods of infrastructure. Though it explains impacts and test method for HPEM, technology standards for protective equipment and method are not yet prepared.
Although the International Telecommunications Union Telecommunication (ITU-T) established EMP tolerance standards (ITU-T K.78) and HPEM guidelines for communications and prepared basic protective tolerance and guidelines, it lacks substantiation to use for EMP protection by applying to information technology equipment.
For national defense, EMP protection facilities has been built and they are in use applying HEMP protection standards (MIL_STD-188-125-1) for fixed installation and

068�ˍ�2017/18 Knowledge Sharing Program with Visegrad Group
HEMP protection standards (MILSTD-188-125-2) for mobile facilities established by the US armed forces. But protection standards for HEMP are not yet established. In relation to HEMP protection standards, “studies on efficient EMP protection facilities considering protection object” are in process to prepare cost estimation by protection object, scale and type, budget request guidelines, and design standards in the context of domestic situation.
4. Policy suggestionsA. Need for an integrated approach considering interaction among
energy technologies
s Increase in importance of system integration amid enlargement of distributed power generation based on various energy sources to secure economics, stability, and sustainability of energy system
s Seek to decrease the cost of system and to increase the efficiency through integrated control of overall energy system rather than trying to upgrade the efficiency of each individual technology- Minimizing construction of additional power plants by demand and supply
optimization through smart control of electric power load- (supply side) Virtual Power Plant, (demand side) power demand management
technologies (xEMS/WAMS/GMS), (storage) securing additional power generating sources by using ESS, V2G, etc.
s Advance technological innovation in view of system integration, such as renewable energy + ESS, power demand + central grid + central power generation, electric power + communication + heat network, etc.- Emergence of ESS as the core technology of system integration and fast
diffusion of ESS supply due to lowering cost, policy support, and technological value advance (total installation of ESS amounts to about 1GW in 2016)
B. Core solutions are to achieve demand and supply optimization based on IoT and to turn surplus energy into demand resources
s DR creates new opportunities for optimizing energy demand and supply, upgrading efficiency by providing consumer participation service: attain reduction of energy consumption through inducement of voluntary participation by providing incentives to consumers while maintaining consumer convenience
s Prospecting development of large-scale resource-demand market after construction of infrastructure such as smart meter, remote load control, charge or discharge of smart EV, etc. (year 2045-): scale of demand for resources

Chapter 1 _ R&D and Innovation Policies to Enhance Energy Security (Korea)�ˍ�069
will be substantially enlarged after finishing construction of infrastructures such as turning surplus energy into demand resource, integrated control of communication and electricity network, two-way trade of electricity, etc.- Scale of demand resources (based on 2DS): (‘15) 11GW Ņ (‘45) 82GW Ņ (‘60)
322GW
C. Increase in importance of emission-absorbing technologies to achieve zero net GHG emissions
s Necessary to secure emission-absorbing technologies represented by BECCS to achieve the goal of zero carbon intensity(CO2/kWh) or even negative intensity
s In order to achieve zero or negative net GHG emissions, expansion of only CCS is not enough. We need to apply and commercialize negative emission technologies, such as BECCS.- Proportion of BECCS compared to total power generation (‘60): (RTS) 0% Ņ�
(2DS) 2% Ņ (B2DS) 2%
D. Carry out both technology-push and demand-pull policies together to facilitate the diffusion of new technologies
s In order to facilitate the diffusion of new technologies in the market, demand-pull policy measures such as introduction of incentive system and strengthening of regulations, etc., are just as important as technological innovation efforts themselves.
s Necessary to make clear energy-policy goals in various points of views such as taxes, international trades and urban planning, etc., because diffusion of new technologies through market mechanism alone is limited.
s Induce enlargement of the new market by carrying out both relaxation and reinforcement of regulations according to the goals of government’s policy implementation: to mitigate such regulations as qualification standards, administrative procedures, redundant regulations, which are working as barriers to entry and to strengthen regulations on environmental effects or greenhouse gas emission and price or quality related regulations.
E. As the energy supply system is evolved into an integrated energy network focusing on power, digitalization of the energy sector is also accelerated. Therefore, cyber security and information security in digitalized energy networks should be dealt with as important security factors.

070�ˍ�2017/18 Knowledge Sharing Program with Visegrad Group
s Cyber security means all kind of methods to protect data, systems, and networks from intentional attacks or accidents and to prepare system recovery. When data communications increase in energy networks, new types of cyber security risks or challenges could take place. In addition, problems occurred from small regional units could be spread into the entire network.
s To solve the abovementioned problem related to cyber security is of importance not only to individual companies, but also to the entire society. Therefore, close cooperation is necessary between energy companies, the government, and academia. To alleviate vulnerability of cyber security is a key issue at the moment, and all the stakeholders of manufacturers, utilities, and the government should take responsibility.
s As application of ICT to energy networks increases, numerous users connect to the networks, and new types of attacks appear in cyber space, relative significance of specific vulnerability can change from hour to hour.
s In relation to cyber security, information protection and security are also important issues. With use of information of millions of users, energy network in the future shall obtain detailed operation data from tens of thousands of sensors, and communicate and store it. Accordingly, it is necessary to separate operation data from private information clearly. In addition, security issue related to privacy protection of user data has emerged. We need to establish clear principles for acquisition, ownership, security, storage, and use of data.
5. Suggestions for Cooperation with Czech Republic in RDI Activities$��1HHG�WR�VWUHQJWKHQ�KXPDQ�LQWHUDFWLRQ�¿UVW�EHWZHHQ�&]HFK�
Republic and Korea in the areas of energy technologies
Strengthen Human Interaction
Identify potential areas and topics forcooperative RDI
Set priorities
How to fund
Participants
How to share the outcome
Realize RDI Cooperation
Design short term, mid to long term cooperative RDI projects based onpriority setting
Implement cooperative RDI pojects (academia-industry-research institute)
Implement Mutually Beneficial Cooperative RDI Works
[Figure 1-4] Suggestion for RDI Cooperation between Czech and Korea
Source: Author.

Chapter 1 _ R&D and Innovation Policies to Enhance Energy Security (Korea)�ˍ�071
B. Need to hold regular meetings, forum or conferences for DSSURSULDWH�JRYHUQPHQW�RI¿FLDOV��5',�DJHQWV��DQG�LQGLYLGXDO�67�personnel in the energy sector
s Need to change and upgrade priority setting, funding method, etc by evaluating the output from the cooperative programs through such meetings, forums, and conferences
s Related ministries in Korea: MOTIE and MSIT; Funding agencies: KETEP, KIAT, and NRF
s Related research institutes in Korea: KERI, KAERI, KIER, and KEPRI under MSIT
C. Short-term S&T personnel interaction program in the energy sector
s Short-term S&T personnel interaction program for a period of 3 months up to 1 year in the form of performing short-term international cooperative RDI activities
s Exchange of relatively inexperienced and young S&T personnel in both countries in energy security-related technology areas
s Related ministries in Korea: MOTIE and MSIT; Funding agencies: KETEP, KIAT, and NRF
D. Mid- to long-term international cooperative RDI program in energy sector
s Mid- to long-term (more than one-year period) international cooperative RDI program for relatively more experienced and mature S&T personnel in the energy sector
s Priority setting, funding, participants, etc. should be pre-determineds Related ministries in Korea: MOTIE and MSIT; Funding agencies: KETEP, KIAT,
and NRF

072�ˍ�2017/18 Knowledge Sharing Program with Visegrad Group
References
Bielecki, J. (2002), Energy Security : Is the Wolf at the Door?
IEA(2001), Oil Supply Security : The Emergency Response potential of IEA Countries in 2000 (Paris:OECD/IEA)
IEA (2017), Energy Technology Perspectives 2017.
IEC, IEC White Papers on Energy Challenges, ESS, Integration of Renewable Sources, Microgrid, Smart City, IoT, Factory of the future, 2010-2016.
IEEJ (2012), Energy Security and Challenges for Japan.
Korea Development Institute (KDI) (2013), 2012 Modularization of Korea’s Development Experience: Energy Policies.
Korea Institute of Energy Technology Evaluation and Planning (KETEP) (2016a), Report on Applications of Energy R&D Results.
Korea Institute of Energy Technology Evaluation and Planning (KETEP) (2016b), Clean Energy Technology Roadmap 2016: Infrastructure, Solar, Wind, Industry, Building, Transportation, ESS, Smartgrid, Clean Thermal Power, E-prosumer.
Korea Institute of Energy Technology Evaluation and Planning (KETEP) (2017a), 2016 Statistics on Energy R&D.
Korea Institute of Energy Technology Evaluation and Planning (KETEP) (2017b), Report on R&BD Strategy of Energy Industry
Ministry of Trade, Industry, and Energy (MOTIE) (2015), Study on the Establishment of 3rd Plan on Energy Technology Development.
Ministry of Trade, Industry, and Energy (MOTIE) (2017), Implementation Plan for Renewable Energy 3020.
Ministry of Trade, Industry, and Energy (MOTIE) (2018), Setting Up R&D Investment Strategy for Clean Energy Technology.
MIT (2012), The Future of the Electric Grid.
World Energy Council (2015), 2015 Energy Trilemma Index: Benchmarking the sustainability of national energy systems.

Chapter 22017/18 Knowledge Sharing Program with Visegrad Group: Innovation Policy for SMEs in the Era of Industry 4.0
R&D and Innovation Policies to Enhance Energy Security
(Czech Republic)
���*OUSPEVDUJPO�
���$VSSFOU�1PMJDZ�*TTVFT�JO�$[FDI�3FQVCMJD
���3FDPNNFOEFE�5ZQFT�PG�1SPDFEVSFT �1SJODJQMFT�BOE�.FBTVSFT�GPS�
3FTPMWJOH�B�$SJTJT�4JUVBUJPO
���4805�"OBMZTJT
���%JTDVTTJPO�BOE�1PMJDZ�*NQMJDBUJPOT
���$PODMVTJPOT

074�ˍ�2017/18 Knowledge Sharing Program with Visegrad Group
1. Introduction
�����7RSLF�,GHQWL¿FDWLRQ�
Innovation and support for small and medium-sized enterprises (SMEs) in the context of energy security are very important factors for the future prosperity of any country. The Office of the Government of the Czech Republic (CR)’s Department of Sustainable Development published a very interesting strategic study called the Strategic Framework Czech Republic 2030 (Office of the Government of the Czech Republic, 2017).
Its strength and convincingness stems from the fact that it captures a consensual view of the strengths and weaknesses of the country and formulates goals that are crucial for the long-term development of the CR. Thanks to this approach, the CR has proven that it belongs to the family of well-developed countries that are responsible not only for themselves, but also for global development. As a frame for our study, we provide some basic ideas from this top-level strategic document.
The CR is an open, medium-sized economy within the EU and sensitive to developments in the global economy. It falls within a group of countries economically linked to Germany, which has been its business partner for a long time. If its business partners were ranked according to the volume of trade, the volume of German imports to the CR is greater than the two following countries combined,
R&D and Innovation Policies to Enhance Energy Security (Czech Republic)
Richard Hlavatý (Ministry of Industry and Trade, Czech Republic)
Martin Hromada (Tomas Bata University in Zlin, Czech Republic)
Vladimir Kebo (Technology Agency of Czech Republic, Czech Republic)
乇#Chapter 02

Chapter 2 _ R&D and Innovation Policies to Enhance Energy Security (Czech Republic)�ˍ�075
and the volume of exports to Germany is greater than the three following countries combined. Nearly half of all non-financial enterprises and almost the entire banking sector are owned by multinational companies. The dependence of the CR on foreign resources is well illustrated in the area of research and development. One third of all resources come from European funds, and one third of its value comes from projects implemented in companies with a foreign owner (Office of the Government of the Czech Republic, 2017).
1.2. Research Design
The CR has moved closer to the average EU economic level in last decade (2005-2015) as measured in Gross Domestic Product (GDP) per capita in purchasing power parity adjusted for different price levels, as shown in sections (a) and (b) of [Figure 2-1], and the exchange rate, as shown in sections (c) and (d). CR is ranked as the 16th
(Unit: current prices per purchasing power parity per person, EU28 = 100(%))
90%
80%
70%
60%
50%
40%
80%
86%
(A) GDP in Purchasing Power Parity
2005
CZ
2006 2007 2008 2009 2010 2011 2012 2013 2014 2015
HU PO SL SK
90%
80%
70%
60%
50%
40%
76%
(B) GNI in Purchasing Power Parity
2005
CZ
2006 2007 2008 2009 2010 2011 2012 2013 2014 2015
HU PO SL SK
80%
80%
70%
60%
50%
40%
30%
20%
46%54%
(C) GDP in Nominal Exchange Rate
2005
CZ
2006 2007 2008 2009 2010 2011 2012 2013 2014 2015
HU PO SL SK
80%
70%
60%
50%
40%
30%
20%
44%
(D) GNI in Nominal Exchange Rate
2005
CZ
2006 2007 2008 2009 2010 2011 2012 2013 2014 2015
HU PO SL SK
50%
[Figure 2-1] Relative Economic Level
Source: EC, Database AMECO, European Commission (online), Office of the Government of the Czech Republic (2017).

076�ˍ�2017/18 Knowledge Sharing Program with Visegrad Group
country in terms of GDP per capita measured in purchasing power parity and the 15th in terms of Gross National Income (GNI) in the EU (Office of the Government of the Czech Republic, 2017).
In recent years, the CR has significantly increased its total R&D expenditure (GERD). It has risen from less than 1.5% of the GDP in 2010 to almost 2.0% in 2014 and 2015. Thus, CR has reached the ninth position in the European Union, sitting just below the EU average. The main factor contributing to the growth of R&D expenditure between 2011 and 2013 was the increase in the use of EU funds. The CR uses more European funds for research and development (45 EUR per capita per year) than any other EU country. One of the benchmarks for the use of R&D expenditure is the innovation index. The development of the summary part of the innovation index for the CR has been positive since 2007 both in the value of the indicator and the relative position vis-à-vis the EU28, which exceeded 80% in 2014. [Figure 2-2] shows the development of the Summary Innovation Index in (a) and the development of the complementary Innovation Output Indicator in part (b) (Office of the Government of the Czech Republic, 2017).
The largest share of R&D expenditure in the business sector is attributable to industry (59%), mainly automotive, engineering and electrical engineering; these are followed by information and communication activities (17%). Foreign-owned companies contribute the most investment to R&D in terms of resources and workers.
0.60
0.50
0.40
0.30
0.20
105
100
95
90
85
80
75
70
65
85%
80%
75%
70%
(a) Summary Innovation Index
CZ rel. EU28 (right asix) PLHU
2007SI
2009 2011 2013
CZSKEU28 2010
(b) Indicator of Innovation Outputs-Relative (EU 28 2020 = 100)
SK PL HU EU28 CZ
2011 2012
[Figure 2-2] Evaluation of Outputs and Structure of R&D in the Czech Republic
Sources: EC, The Innovation Union Scoreboard, European Commission (online) and EC, Innovation Output Indicator, European Commission (online), Office of the Government of the Czech Republic (2017).

Chapter 2 _ R&D and Innovation Policies to Enhance Energy Security (Czech Republic)�ˍ�077
Public support for the research and development of business sector entities is twofold. Direct support is provided through subsidies aimed at specific projects and in the form of institutional support and indirect tax relief. Indirect support is used in two-thirds of cases by large enterprises (over 250 employees) which often have foreign owners. Conversely, direct support is mostly targeted at small and medium-sized enterprises, which tend to have domestic ownership. Less than half of all companies with more than 10 employees work on their own research activity, whereas in Germany, this is the case for two out of three such companies (Office of the Government of the Czech Republic, 2017).
The most important infrastructure for supporting industry in CR is energy. The CR has the highest proportion of industry to Gross Value Added (GVA) in the EU28. It falls within the countries with an economy that is above average in terms of energy, but is not extremely demanding. Germany stands out from comparable industrialized countries since its proportion of industry to GVA is lower by 5 pp, but its energy consumption for the production of EUR 1 of industrial value is almost half that of the Czech Republic (Office of the Government of the Czech Republic, 2017).
(Unit: MJ/EUR, % = GVA)
[MJ/EUR] SumAverage EU Consumption of Energy
31%CZ
29%RO
27%SL
26%HU
26%DE
25%SK
25%PO
23%LT
23%IR
23%BG
22%AU
22%EE
21%HR
21%SE
21%FI
19%DK
18%IT
17%NL
17%LV
17%ES
17%PR
17%BE
15%UK
14%FR
13%GR
12%MA
8%CY
6%LU
[MJ/EUR] IndustryAverage EU Consumption of Industry
14
12
10
8
6
4
2
0
[Figure 2-3] Energy Demand for the Production of 1 EUR GVA in EU28 (MJ/EUR) in 2013
Sources: EUROSTAT, Dataset National Accounts aggregates by industry (up to NACE A*64), Eurostat (online) and EUROSTAT, Dataset simplified energy balances—annual data, Eurostat [online], Office of the Government of the Czech Republic (2017).

078�ˍ�2017/18 Knowledge Sharing Program with Visegrad Group
2. Current Policy Issues in Czech Republic
2.1. Background
Industry 4.0 is one the strongest challenges and drivers for society and future innovation. There are key questions and problems connected to the interconnection and cooperation of SMEs and people with Cyber Physical Systems (CPS), as well as the interconnection between the Internet of Things (IoT), Internet of People (IoP) and Industrial IoT (IIoT). All smart systems and the entire smart society need energy resources to keep key infrastructure alive— they need to be connected.
We need the security and protection of key infrastructure, as well as the protection of privacy and many further assurances in parallel with the intelligent systems and smart technology represented by CPS. This task is very complex and progresses in a bottom-up fashion from smart objects, technology and CPS to the SMEs at the business level and political level up to global challenges and problems. Sustainable society development needs synergy and knowledge sharing to find the best solutions for the smart society of the future. Our KSP project should be positive for global cooperation, especially regarding the next topics:
A. Developing and ensuring the stability of network systems and infrastructuresB. Improving the resilience of network systems and infrastructures and SME
innovationC. Increasing the preparedness and potential of network infrastructure operating
staffD. Increasing the security and protection of network-critical infrastructure.
2.2. Policy and Regulation
The following text will discuss the most important legal regulations for creating institutional framework that increases energy security and resilience in a wider context.
A. Policies and Strategies
s The State Energy Concept approved by the government in May 2015.s The National Action Plan for Smart Grids (NAP SG).s The National Research, Development and Innovation Policy of the Czech
Republic 2016-2020.s The National Priorities of Oriented Research, Experimental Development and
Innovation.

Chapter 2 _ R&D and Innovation Policies to Enhance Energy Security (Czech Republic)�ˍ�079
s The National Research and Innovation Strategy for Smart Specialization—National RIS3 Strategy.
s The Reform of the System of Research, Development and Innovation of the Czech Republic.
B. Law
s Act No. 458/2000 Coll.—On the conditions of business and the performance of state administration in the energy sectors and on the amendment of certain laws (Energy Act).
s Act No. 240/2000 Coll.—On crisis management and on the amendment of certain acts (Crisis Act), as amended by Act No. 320/2002 Coll.
s Act No. 241/2000 Coll.—On economic measures for crisis situations and on amendment of some related acts, as amended by Act No. 320/2002 Coll.
s Act No. 222/1999 Coll.—The defence of the Czech Republic.s Act No. 239/2000 Coll.—An integrated rescue system.s Act No. 238/2000 Coll.—The Fire Brigade of the Czech Republic.s Act No. 133/1985 Coll.—On fire protection (the full text was published as No.
67/2001 Coll.).s Act No. 254/2001 Coll.—On water (Water Act).s Act No. 258/2000 Coll.—On the protection of public health.
C. Others
s Decree of the State Material Reserves Administration No. 498/2000 Coll.—On the planning and implementation of economic measures for crisis situations, as amended by Decree No. 542/2002 Coll.
s Decree of the Ministry of Industry and Trade No. 219/2001 Coll.—On the procedure in the event of an imminent or present emergency in the electricity sector.
s Act No. 181/2014 Coll.—Cyber Security Law.s Type plan for solving the crisis situation of a large-scale supply disruption.s Type plan for solving the crisis situation of a large-scale gas supply disruption.s Type plan for solving the crisis situation of a large-scale heat supply disruption.
2.3. Literature Review
In all likelihood, the main reason for the emergence of the current developed society (including the high status of the global population) is the discovery of the use of fossil energy sources. Historical and archaeological analyses of the causes of the ups and downs of previous civilizations are increasingly being conducted for energy relations, particularly regarding primary production and energy return—

080�ˍ�2017/18 Knowledge Sharing Program with Visegrad Group
what a territory is capable of providing and how to use this potential to invest in and acquire energy. If we wanted to narrow the question of the collapse of civilizations to two basic causes, it would be a concurrence of a decline in primary productivity and environmental change. Historical analyses have also shown that richer societies with pluralistic and liberal features (Central Europe after 1250, the Netherlands in the 16th century, England at the end of the 18th century, the USA at the end of the 19th century, etc.) developed during periods of energy sufficiency and were subject to internal crises, civil wars and invasions in periods of energy shortage (Cílek, 2009).
Energy security has been a common term in the past few years and began to be used in the last two decades. The frequency of its use is related, among other things, to a phenomenon called Peak Oil (or so-called Peak Oil), which is a state where energy reserves, such as fossil fuels, are lost. It may also be used to describe the rising price of energy raw materials as well as the behavior of some producer countries that use their mineral raw materials as a weapon in their foreign policy (e.g., the so-called oil weapon).
Defining energy security is not easy; there is no generally accepted definition. Even a professional in the field of energy security does not have a perfect concordance with the basic definitions by which the union defends its existence and from which it subsequently derives its research activity.
The term “energy security” is generally defined as the availability of sufficient supplies (energy or its raw materials) at an acceptable (or reasonable) price (International Energy Agency). The essence of the definition is the balance between the guaranteed amount of energy and the price that the recipient is willing to pay (Gruberová, 2011).
Defining the notion of energy security cannot be achieved without a broader scope in the context of specific security concepts, such as safety, threat, risk and securitization.
The threat is a “primary, externally occurring external phenomenon that can or wants to damage a particular value.” This threat is proportional to the nature of the value and how seriously we consider the threat, which can be a phenomenon that is natural or physically defined. Another threat is caused by, or intended by, an agent with will or intent (intentional threat); a threat may be intended, prepared, triggered or executed by a human individual or a collective actor (Gruberová, 2011).
The risk is the likelihood that a harmful event occurs and affects a value. There may also exist a risk that an event unlike the one that we want may occur. Risk is a derived, dependent variable and can be determined or estimated via risk analysis.

Chapter 2 _ R&D and Innovation Policies to Enhance Energy Security (Czech Republic)�ˍ�081
Risk is a response to a threat and to the state of our preparedness (vulnerability) and is also associated with decision-making (Gruberová, 2011).
Securitization can be considered a more radical form of politicization. It is an intersubjective process in which a particular security theme is transformed into a threat, often with multiple facets requiring specific measures and justifying actions that deviate from standard policy mantinelles. Simply put, the existence of a threat often does not depend on its objective nature, but on the subject being presented as a threat. Securitization takes place within the securitization process (security-oriented speech acts) through securitization actors (Gruberová, 2011).
Security themes, which can also be seen as a form of crisis in relation to a lack of energy resources and which will be further elaborated on in the text, may primarily relate to the following areas:
s Electricitys Gass Production and supply of heats Petroleum and petroleum products
The next section will describe the level of general energy security of the state and the level of need to ensure the supply of strategic energy resources within the defined areas. (In terms of scope, the text will focus on the first three areas.) This can be perceived as a phenomenon and aspect of energy security in relation to the needs of society and its interests.
2.3.1. Electricity
The simplest and most permanent risk is the danger of a collision in the transmission system resulting in a large blackout. The solution on the part of the government lies in the long-term strengthening and securing of the transmission system. The solution on the part of the population and the company lays in the parallel development of simple operations that help people survive the early days of this danger—for example, the possibility of using manual water from surrogate sources, manually opening doors and windows, and replacing money or quickly selling food from freezers. Blackouts stop televisions, most radio and other media sources, phones, water pumps, lifts, metros, bank services, and the like from operating (Cílek, 2009).
It follows that the power system is very sensitive to the proper function and the desired interaction of its individual elements, which are closely interconnected and interdependent. Since electricity cannot be stored, a balance must always be

082�ˍ�2017/18 Knowledge Sharing Program with Visegrad Group
maintained between production and consumption. The electrical system as a whole must continually provide what is required to ensure that, in time-varying conditions, electricity consumption needs are met.
There are events that, depending on their severity, the extent of the territory in which they operate and the frequency of occurrence can cause damage or loss of function to one or more elements and lead to accidents of a regional or national nature.
Large-scale incidents may exceed the real possibilities of operators of the system to ensure immediate restoration of operation or may require a shutdown of the system, thus leading to a crisis situation in the supply of electricity to consumers. The risk of secondary crisis situations is significant in this case (Ministry of Industry and Trade, 2014a).
2.3.2. Gas
The role of natural gas in the CR’s energy balance is growing. Its share of primary energy consumption in recent years has reached about 16%. Natural gas sources in the CR are very small, and annual gas production is about 250 mil. m³ represents about 3% of its total annual domestic consumption. The CR is almost completely dependent on the import of natural gas, mainly from two different sources—the Russian Federation and Norway. Following the liberalization of the gas market in 2007, natural gas has begun to be imported via a number of companies that compose the 20th largest importer of natural gas, RWE Transgas, a.s. In order to secure the consumption of the CR, the incumbent importer, Transgas, entered long-term contracts with Norwegian producers from 1997 to 2017 and entered long-term contracts with Russian producers from 1998 to 2013. In 2006, RWE Transgas a.s. entered a new agreement with Russian producers to supply gas until 2035.
The domestic average consumption of natural gas represents approximately CZK 8.3 billion m³:
s Energy conversion (public and energy): 15%s Energy sector (oil refinery gas): 1%s Industry (the manufacture of steel and iron, non-ferrous metals and processing
of other minerals, chemical industry, including petrochemistry, mechanical engineering, and the food industry): 35%
s Business & Public Services: 19%s Households: 30%s Agriculture: 1%

Chapter 2 _ R&D and Innovation Policies to Enhance Energy Security (Czech Republic)�ˍ�083
Due to import dependence, the CR’s reliable supply of natural gas ensures the diversification of resources and the conclusion of long-term contracts with its producers. In this context, it should be noted that, in the event of emergencies with international dimensions, gas will not be imported from other nearby territories (EU countries) since they will have to depend on their own resources.
When assessing the impact of a possible technological accident, it is necessary to highlight the consequences of a serious technological breakdown of the transit gas pipeline, which, in addition to the source function, fulfills the transit function. Approximately 28% of gas consumed in Germany and 23% of gas from the total consumption of France are transported through the CR. The disruption of gas supplies to Central and Western Europe could thus cause disruption of the route to Russia, the Ukraine or Slovakia.
A certain advantage of natural gas is the possibility of its storage in underground storage facilities. In addition to domestic contracts, Transgas has also concluded gas storage contracts abroad. Its total storage capacity today accounts for 33% of domestic annual gas consumption case (Ministry of Industry and Trade, 2014b).
2.3.3. Production and Heat Supply
Heating systems are predominantly local-municipal and not interconnected. Heat production is an important part of the energy complex, characterized by the huge amount of energy supplied, variety of fuels used and types of resources. The total annual heat consumption in the CR is approximately 181 PJ*. Households account for 27% of heat consumption, 65% is used by industry and agriculture, and 8% is used for services and public facilities.
35% of thermal energy is provided by central sources that produce heat as well as electricity via industrial cogeneration. These are power plants, district heating plants and public heat sources. The total fuel consumption is 65% solid fuels, 6% liquid and 29% gaseous fuels.
37% of thermal energy is provided by other central sources, such as heating, block and large home boilers. These are present in plants and as public heat sources.
Centralized heat sources use 49% brown coal, 20% black coal, 21% natural gas, 8% liquid fuels, and 2% renewable sources to produce thermal energy. Individual heating uses 50% natural gas.
The severity of the disruption of large-scale heat supply and its assessment as a crisis situation results from the fact that 70% of the heat is used to provide hot

084�ˍ�2017/18 Knowledge Sharing Program with Visegrad Group
water heating and 30% from the technology needs of the industry. 80% of the total annual heat consumption is concentrated during the heating period, which spans from October to April. Even during this period, however, withdrawals are strongly dependent on the ambient air temperature. As far as the technological needs of the industry are concerned, heat consumption is evenly distributed throughout the year and may only be affected by planned technological shutdowns by, in particular, large customers in some industries.
In relation to the presented facts, it can be said that the energy dependence of companies are significant, which has increased the pressure on the creation of the relevant legal, institutional and organizational tools to ensure the required level of energy security. In this context, one may discuss:
s Crisis Type Plans: Disruption of large-scale electricity supplys Crisis Type Plans: Disruption of large scale gas suppliess Crisis Type Plans: Disturbance of large-scale heat supply
The above-mentioned plans are, to a certain extent, a set of facts reflecting the important factors that enter the process of ensuring the CR’s energy security. These are the definitions of crisis situations, their causes, development scenarios, and impacts due to the definition of their conditions, respectively. Regarding the prerequisites for solving these crisis situations, one important aspect is the formulation of recommended types of procedures, principles and measures for managing each type of crisis.
Energy security performs the following functions:s Identifications Reactivenesss Protection
The identification function is perceived from the point of view of the definition of the system elements, where to a certain extent, the process of identifying and the designation of the critical infrastructure enters the scope stipulated by "Government Regulation no. 432/2010 Coll. Criteria for Determining Critical Infrastructure Criteria." Outside the scope of this regulation, the basic systems are considered to be electricity generation, transmission system elements, electricity distribution system elements and technical dispatching. The supply of gas refers to the production, transmission and distribution system, gas storage and dispatching of the gas system. Heat energy is represented by sources, pipelines, heat connections and grids to take-off points. Subsequently, a threat list (potential crisis situations) and set of measures are specified for each of these systems. The identifying function in this context represents philosophy, asset, threat and measure.

Chapter 2 _ R&D and Innovation Policies to Enhance Energy Security (Czech Republic)�ˍ�085
In this case, the reactive function can be understood as a process of defining the procedures for the responsible authorities in the event of a threat and the emergence of a crisis situation where the basic procedural acts are, for example:
s Analyzing the situations Determining the cause of the occurrences The obligation to informs Continually assessing the situation’s development
The reactive function is practically related both to the entities operating the energy facilities and to the authorities and bodies designated for rescue and liquidation work.
The protective function is fulfilled by setting preventive measures, which, as in the previous function, pass through and make a connection with the operators, the authorities and those in charge of rescue and the liquidation work. The basic areas of preventive response protection measures, for example, may include:
s Ensuring sufficient installed powers The establishment and establishment of legislative conditionss Maintaining reserve fundss Determination and observance of technical requirements for the construction
of energy facilities
Obviously, this requires a set of comprehensive approaches to security and reliability, where safety, security, and, to some extent, preparedness is virtually put in place.
2.3.4. Energy Security Measures
The scope of energy security measures is considerable and may ultimately be seen in a wider context of security, security and preparedness. However, in general, measures can be broken down into type procedures, principles and measures for:
A. Process activities at the time of the threat and when a crisis situation arises from the point of view of:
s Energy subjectss Authoritiess Territorial administrative authorities

086�ˍ�2017/18 Knowledge Sharing Program with Visegrad Group
B. Procedural activities for solving a crisis situation and at the stage of liquidation of its consequences from the point of view of:
s Energy subjectss Authoritiess Territorial administrative authorities
C. Preventive measures
In the following text, we will create approaches and elaborate on the selected measures to increase the relevance and objectivity of the individual aspects of energy security. For a greater level of detail, these actions will be described in relation to the power and electricity system.
3. Recommended Types of Procedures, Principles and Measures for Resolving a Crisis Situation
The principle of introducing type procedures and measures for solving the selected crisis situation is ultimately the provision of the target state of the power and electricity system. In this context, the target is understood to be the fastest possible renewal of electricity supply to all customers in full. The procedures, principles and measures adopted should make it possible to:
s Activate crisis management authoritiess Analyze the situation and implement the appropriate crisis measures (both
own and contractual)s Ensure the existence of the forces and resources necessary to address the crisis
situations Secure the supply of priority customers with electricitys Perform necessary repairs on electrical equipments Restore electricitys Analyze the causes of the crisis situation and implement measures to increase
the resistance of the power system
The presented facts are meant to describe and formulate the basic energy security philosophy as well as the requirements and principles for the protection of selected areas falling within the subject matter. At the beginning of the chapter, a general and essentially political perception of the concept and issues of energy security was presented. Subsequently, there was a hierarchically lower description of systems

Chapter 2 _ R&D and Innovation Policies to Enhance Energy Security (Czech Republic)�ˍ�087
that have an impact on the socially significant energy supply. The identification and designation of energy systems has created a prerequisite for defining selected security threats and the resulting risks that are systemically reflected in a set of legislative, normative and institutional measures that are elaborated on in more detail with regards to increasing the resilience of the electricity supply as a significant aspect of energy security.
4. SWOT AnalysisThe analysis of the current situation has created the basis for formulating the
various aspects of the SWOT analysis, enabling the perspectives and focus of other common activities of the Korea-V4 KSP to be determined.
A. Strengths
s High-quality, reliable energy supplys The transformation of the production base to electricity in order to preserve its
stability and sufficient capacity has beguns A public acceptance of nuclear energys Extensive heat energy supply systemss Relatively favorable import energy dependence indicators Full self-sufficiency in electricity and heat generations Know-how in building complex technological units
B. Weaknesses
s Market distortions and distorted investment signalss Aging source base and networking infrastructures Aging highly educated human resourcess Limited potential for higher extensions of renewable sourcess High share of local resources using low-grade fuels with high emission of
pollutants into the air, in particular in densely populated areass High proportion of municipal landfilling wastes Expecting a selfishly high standard of quality and reliabilitys Currently fulfilling any binding targets of EU climate and energy policy,
contrary to the principle of technology neutrality when filling decarbonization commitments that would cause disproportionate financial costs to the state budget and economy of the CR

088�ˍ�2017/18 Knowledge Sharing Program with Visegrad Group
C. Opportunities
s Transit roles of network infrastructures for energy commodities in Central and Eastern Europe
s Conceptual recycling and utilization of secondary raw materials, including energy waste recovery
s Use of alternative fuels (electricity, CNG, etc.) in urban, suburban and railway transport
s Reducing the energy performance of buildings and increasing the energy efficiency of technological processes in industry
s Engaging Czech research and academic entities in international energy research programs
s Enhancing the technical education and opportunities of employing graduates in the energy science and research field
s Intelligent network developments Restructuring the source base towards modern high-performance technologies
and fuelss Development of unconventional mining methods for hydrocarbons in the
world and the EU (e.g., in Poland)
D. Threats
s Uncertainty of the legal frameworks Unilateral and uncoordinated capacity deployment within the EU, especially in
the countries surrounding the CRs Limited disposable reserves of brown coal and the associated security of heat
supply for the populations Time-intensive progress in building modern, high-capacity resources as a
substitute for existing resourcess Safe and reliable power supply in a gradually organizationally and economically
demanding implementation of an emergency situation island regimes Deterioration of the operational reliability of the power system due to massive
development of intermittent RES without introducing additional measuress The risk of non-compliance with the adequacy parameters of production
capacities (generation adequacy) due to the shutdown of the aging, high emission sources and sources without a collateral supply of coal
s Continuing the dynamic development of intermittent RES in Europe uncoordinated with the appropriate development of network infrastructure

Chapter 2 _ R&D and Innovation Policies to Enhance Energy Security (Czech Republic)�ˍ�089
5. Discussion and Policy Implications
5.1. Role of R&D and Innovation for Strengthening Energy Security
The role of R&D and Innovation (RDI) for strengthening energy security may be seen from the perspective of:
s Increasing the involvement of research capacities in existing and future international activities and projects such as nuclear reactors for generation, nuclear fusion, the development of new materials usable in energy and energy engineering and other science, research and innovation possibilities.
s Improving and deepening the cooperation between basic and applied research in the field of energy to build on results and obtain the maximum support by focusing on applied research and development for a limited number of human resources and scientific and research potential. In the field of basic research, defining and supporting areas that are currently competitive both in Europe and globally.
s Supporting research and development of projects in the field of new innovative materials, equipment, technologies, information, and control systems.
s Promoting research and development of projects specifically geared toward increasing energy efficiency, reducing energy transmission losses, more sophisticated network management and developing more energy efficient appliances, drives and energy storage. In this context, this includes the development of a new generation of transport systems using energy sources (electric vehicles and hydrogen systems) and the development and building of the necessary infrastructure, including pilot projects for transmission and distribution networks.
s Strengthening the links between research, education, government and practice in the form of a long-term strategy defining priority areas and targets. Coordinating state programs and public support with private resources to maximize efficiency. Promoting cooperation between research organizations and industry.
s Developing activities for technology platforms (e.g., Sustainable Energy of the CR), focusing on setting and achieving specific goals.
s Creating a list of energy R&D priorities for the time horizon of 2020 and a list of long-term priorities within the EU Energy Concept horizon.
s Increasing interest in the study of disciplines suitable for the training of professionals in energy and its related sectors and to encourage interest in applying to these sectors among young people.
s Improving the structure of the knowledge and skills of graduates in order to better meet the changing demands of employers and ensure the development

090�ˍ�2017/18 Knowledge Sharing Program with Visegrad Group
of new fields of study according to industry’s needs. Providing technical experts with a higher degree of multidisciplinary knowledge.
5.2. RDI to Strengthen Energy Security and Future Tasks
In relation to the need to formulate future tasks and challenges (project support), the selected areas have been defined and have a significant impact on the level of energy security and resilience on an international level.
5.2.1. Renewable (Alternative) Energy Sources
Project support will focus on the more efficient use of biomass, the development of advanced biofuels made from non-food biomass and waste, new photovoltaic systems, including control elements, geothermal resources depending on the geological conditions of the Member States and the production and energy utilization of hydrogen, including fuel cells. Heat pumps of all categories with high efficiency will also receive focus.
5.2.2. Nuclear Technologies
Project support will focus on the research of promising third and fourth generation nuclear technologies. It will also focus on enhancing the efficiency, durability and safety of nuclear resources, including the management of radioactive waste and spent nuclear fuel and end-of-pipe fuel cycle solutions. This area is expected to be involved in wider international projects. Engineering and special building technologies for nuclear power engineering in connection with material engineering will be developed.
�������0RUH�(I¿FLHQW�8VH�RI�)RVVLO�(QHUJ\�6RXUFHV��&RDO��1DWXUDO�JDV�
Project support will focus researching more efficient and new combustion technologies for traditional fossil fuels, such as clean coal technology with BAT-compliant parameters or better as well as future economic and environmental requirements. In this context, high-temperature materials and applied research, gas and steam turbine innovation, heat exchangers, cogeneration systems and the geological storage of carbon dioxide will be developed.

Chapter 2 _ R&D and Innovation Policies to Enhance Energy Security (Czech Republic)�ˍ�091
�������,QFUHDVLQJ�WKH�(I¿FLHQF\�DQG�5HOLDELOLW\�RI�3RZHU�6\VWHPV�DQG�Grids
s Project support will be aimed at increasing the efficiency and reliability of energy systems and distribution networks of energy media, including the integration of decentralized energy sources and their back-ups in case of risk situations. Special attention will be given to the development of control systems at the transmission and distribution network levels.
s For distribution networks, particular focus will be given to the development of smart grids and the use of decentralized networks, production and consumption management, including management of accumulation in central and local systems.
s At the transmission network level, particular focus will be given to systems for system reliability and their regional integration, network maintenance and operation systems based on element monitoring and risk management and emergency island subsystem management mechanisms.
s Particular attention will be paid to the development of protection devices against cyber-attacks and the protection of telecommunications systems.
s Pilot projects on electro-accumulation will be supported.
5.2.5. Energy Recovery of Waste
Project support will focus on the research and development of new technologies for the energy use of secondary raw materials and waste that cannot be materially exploited.
5.2.6. Transport Systems
R&D support will be directed to increasing the efficiency of public transport systems and means, including electric traction vehicles and their drives, the development of fuel cells and batteries for electric vehicles, the development of infrastructure for electro-mobiles and hydrogen economy and the development of telematics traffic management systems aimed at automating and optimizing individual transport. Projects to reduce losses in power systems and electrical traction equipment in transport will also be supported.
5.3. Energy Security and Role of SMEs
Like Korea and other V4 countries, the CR is aware of the importance and position of small and medium-sized enterprises, which has been the starting point for active involvement and cooperation within the Korea-V4 KSP. The expected benefits of this active discussion and cooperation were identified and are expressed in the following deliveries.

092�ˍ�2017/18 Knowledge Sharing Program with Visegrad Group
5.3.1. Deliveries of Energy Components
s Following the systems for the support of RES development and the maximum participation of domestic and EU suppliers will increase the technological level of their production.
s By targeting research, development and innovation support programs, investment incentives and effective, internationally respected certification procedures, the development of high-tech energy component production will be supported.
s The involvement of energy engineering companies in international energy research programs will be encouraged, both through the level of membership of international agencies and associations and the co-financing of research and development projects by the EU Structural Funds. To this end, the consultancy activity of the state administration towards the companies and the effective administration of the projects should be directed.
�������'HOLYHULHV�RI�,QYHVWPHQW�8QLWV�DQG�/LQN�WR�WKH�&RQVWUXFWLRQ�Industry
s Large and medium-sized engineering businesses will be promoted while maintaining market conditions in energy engineering, particularly in the area of public procurement. Conditions and technical parameters in the framework of authorization procedures for the construction of energy facilities will be determined.
s Conditions will be created for the comprehensive support of energy producers in order to strengthen the transfer of new scientific and technical knowledge into practice.
s The construction of demonstration units and pilot projects will be encouraged for new high-tech projects regarding authorization procedures and the involvement of the state in the field of support for research, development and innovation. European Structural Funds such as the European Agricultural Rural Development Fund (EAFRD) will also be addressed by the energy field.
5.3.3. Export/Import of Energy Equipment
s The export/import of energy equipment and units abroad will be promoted. State support and economic and trade diplomacy support for the export/import of energy units to third countries and the inclusion of energy engineering in offset programs will also be ensured.
s The export/import capabilities of energy engineering companies will be supported and export opportunities for Czech energy engineering will be sought. Support for finding suitable opportunities and export/import credits

Chapter 2 _ R&D and Innovation Policies to Enhance Energy Security (Czech Republic)�ˍ�093
will be ensured, and instruments provided by the EGAP credit insurance company and the Czech Export Bank will be guaranteed.
s Cooperation will be strengthened between individual exporting/importing producers, professional universities and research institutes in the EU and abroad in order to increase the commercial and technical knowledge of the workers.
s In the context of the development of EU legislation, an open environment will be promoted, enabling engineering firms to participate in energy procurement in EU countries as well as supplies for EU-funded development and demonstration projects.
5.4. Policy Suggestions to Activate RDI for Energy Security
The following text will present relevant and objective policy suggestions for activating RDI for energy security. The most important are:
s Promote the timely exchange of information and coordination of energy policies of the countries of the region, but also within the EU, and their link to joint analyses of security and the reliability all forms of energy supply.
s The creation of a regional electricity and gas market in the EU in Central Eu-rope, ensuring full, open-market access without barriers for final customers. In line with the conclusions of the European Council, completing the integration of the EU internal energy market and removing all barriers between Member States and regions.
s Promote rapid integration of the electricity market on the principle of implicit auctions throughout the CEE region and its interconnection with the North-West Europe region as well as the development of electricity markets, services and financial instruments to ensure the stability of the electricity market. The geostrategic position of the region should be taken into account to support the role of the CR in the integration of markets and the creation and coordination of market mechanisms and institutions.
s Improve cooperation between the member countries of the region in monitoring the electricity and gas markets by promoting competition and ensuring market transparency. Support the development of effective coordination mechanisms and institutions in the field of energy network management and development and regulation based on the principles of the equality of all Member States and ensuring the security of supply in all countries.
s Establish an effective joint mechanism for the planning of the development of transmission networks in the CEE region, ensuring optimal network development with respect to the development of electricity in the whole

094�ˍ�2017/18 Knowledge Sharing Program with Visegrad Group
region and in relation to the development of other regions. Promote the coordination of procedures (especially in the area of permitting procedures and access to land), ensuring the timely implementation of adopted development plans at the level of all the countries of the region.
s Promote the emergence and efficient functioning of common mechanisms for coordination and management of energy networks, ensuring reliability and joint management of congestion and other emergencies.
s Support the diversification of European natural gas and LNG terminals relevant to the potential supplies to the Member States and their interconnection within the Member States transmission system.
s When setting any other binding greenhouse gas emission reduction targets, making decisions on the involvement of other major global issuers, including economically advanced developing countries.
s The setting of additional administrative constraints and EU measures on the production, transport and final use of energy should only be supported after a full, high-quality analysis of the economic impacts on industrial competitiveness and household standards of living.
s To develop the cooperation of the CR in the field of energy, including the supply of investment units from domestic producers and the export of energy equipment, with major energy supply and transit countries from both inside and outside of the EU.
s Utilize specialists from Czech industrial and energy companies with experience in the field of energy legislation and international energy cooperation during EU institution activities.
s Actively cooperate with energy regional associations and organizations. Maintain active cooperation within the V4 countries and coordinate attitudes in areas of common interest. Strengthen the role and weight of the V4 within the EU.
s Continue strategic energy dialogue with countries outside the EU.s Integrate the electricity and gas market in the CEE region and the EU. s Ensure the full implementation of the directives and internal market regulation
in all EU countries, particularly in the area of non-discriminatory access to cross-border capacities and respect for cross-border effects.
s Integrate network development (including participation in the European Transmission Infrastructure Development and Electricity Highway).
s Make effort to eliminate distortions in the electricity market and set equal conditions for all energy sources on the market. Until subsidy schemes are eliminated, the harmonized implementation of regulatory mechanisms and subsidy schemes should be promoted to ensure the adequacy of production capacities and system reliability, or regional solutions and so as not to jeopardize the interests of Czech energy and Czech companies.
s Ensure the promotion of nuclear energy as an accepted, carbon-free

Chapter 2 _ R&D and Innovation Policies to Enhance Energy Security (Czech Republic)�ˍ�095
technology via national policy. s Ensure the development of legislation and regulation in the field of nuclear
safety, liability for damages, international negotiations, deposition of VHS and other regulatory measures in the field of nuclear energy on a purely professional basis without reflecting ideological intentions and approaches.
s Promote appropriate changes in EIA-permitting processes and processes for EIA investment projects (including inter-state) so that these processes are as efficient as possible.
s Promoting the diversification of European transport routes and source territories, including the promotion of greater interconnectivity (oil, gas, electricity) and appropriate financial participation by European funds.
s Strengthen the V4 energy cooperation and strive to coordinate attitude of all relevant documents and decision-making processes in the energy sector within the EU while targeting ad hoc coalitions across the EU to promote Czech interests.
s In the context of European negotiations, strongly advocate national sovereignty over the choice of energy mixing and consistent technological neutrality as well as cost-effectiveness in meeting European decarbonization commitments in the context of engaging with other world greenhouse gas emitters in decarbonization efforts.
s Support the development of crisis plans for energy crises and exceptional situations at the level of the Central European region.
s Ensure active participation in IEF and IEA and promote the interests of the CR in the field of oil market stability. Ensure support for contracts with new gas producers in connection with the use of the North-South Corridor and future LNG access opportunities.
s Co-ordinate cooperation with major producer and transit countries. s Promote cooperation regarding the security of oil, oil products and related
emergency measures. s Strengthen “energy diplomacy,” especially in the producer or transit countries,
the traditional destinations of our energy industry and emerging countries with great market potential for energy, especially for energy engineering. Focus on information support of Czech companies and actively search for business opportunities and political support at a local level.
5.5. Follow-up Plans (Short-term/Long-term)
Plans are divided into the following categories based on the current state of discussion and the preparation of the project areas:
s Research, Development, and Expertises Education and Training

096�ˍ�2017/18 Knowledge Sharing Program with Visegrad Group
s Standardizations Selected Specific Areas of Interest
�������5HVHDUFK��'HYHORSPHQW��DQG�([SHUWLVH
s Research, development, and design of the crisis and recovery plans and risk analysis and management
s Research, development, and deployment of simulators for the internal training of operation staff
s Simulation of critical events in energy networks and proposing ways to handle such events
s Security testing and forensic expertize s Other R&D (internal or external on demand)
5.5.2. Education and Training
s Training – critical situation awareness and preparedness (cyber-attacks, social engineering, penetration testing, system overload, etc.)
s Specialists’ testing (simulator-based)s On-site and tabletop exercises and testings Formulation and verification of crises and recovery planss Legal and normative environment (national/EU) evaluation and suggestionss Security Liaison Officer education and training programs Legislative frameworks Identification and designation of critical activitiess Risk assessment
- Threats identification- Selection of appropriate risk assessment methods- Risk assessment- Case studies
s Risk management/protection (security and safety) management system development- Standardization and implementation of:
◆ Physical protection systems◆ Information Security Management Systems◆ Administrative security◆ Personnel security◆ Crisis management system structures
- Practical implementation of standardized security system/case studys Business Continuity Management System implementation
- Business Continuity Planning (Implementation to Operator Security Plan)- Case Study/Example of practical implementation

Chapter 2 _ R&D and Innovation Policies to Enhance Energy Security (Czech Republic)�ˍ�097
s Possible application of Selected Information/Decision support systems- Incident Modeling and Simulation- Incident Assessment and Management
s Practical cases and incident management (Scenarios)- Adversary in protected areas- Cyber-security incidents- Prevention and Detection of Insider Threats- Competitive Intelligence
5.5.3. Standardization
s Active involvement in the processes of standardization related to critical energy infrastructure through national and international standardization organizations- Development and evaluation of unified Energy Infrastructure Security
Standardss Active participation in relevant expert and working groups at national and
international levelss Developing its own certification activities (certification lab and certification
body)
�������6HOHFWHG�6SHFL¿F�$UHDV�RI�,QWHUHVW
A. Blackout – Prevention and Subsequent Reaction during Blackout Situations
In the case of wide power failures (large institutions, region, county, state, etc.) we request that comprehensive security and communication is ensured among different critical sectors to minimize potential losses and to attempt an organized return to normality as soon as possible. This is requested to ensure proper procedures are followed when shutting down sensitive technologies. The necessary part of these procedures remains providing information about available options in deployed backup resources, obtaining information about the scope of power failures, the detection and possible provision of functionalities in other critical sectors such as water, gas, access roads, functional IRS components, etc.
Proposed Solutions
s Area Business Continuity Management and Disaster Recoverys The development of scenarios and use cases for events with negative impacts Development of Business Continuity Planss System support for creating and maintaining plans

098�ˍ�2017/18 Knowledge Sharing Program with Visegrad Group
s The DRP development of systems that support rapid recovery (e.g. automated overhead deployment configurations)
s Construction of backup locations based on e.g. cloud solutions
B. Borders Protection
s The application of virtual fences or mobile virtual fences. s The deployment of unique technologies for person detection. s The superstructure of scenarios and responses to situations. s The deployment of unmanned aerial vehicles to monitor areas.
Proposed Solutions
s Area radio resource utilization surveys Development of scenarios and use cases for detection and responses to
penetration; this also means integration with the police.s Perimeter intrusion detection including the number of adversaries and their
movement direction combined with biometric data collection (such as face recognition)
s Research the possibility of using UAVs1) — there will be a need for an intergovernmental agreement to prevent the unauthorized penetration of foreign state airspace; consider the possibility of using AEROSTAT2).
&��8UEDQ�7UDI¿F�0DQDJHPHQW��,QFLGHQW�+DQGOLQJ��DQG�&ULVLV�6LWXDWLRQV�LQ�&LWLHV
s Covering Smart City development s Information collection on the state of intersections s The location of specific vehicles and incidents s The deployment of V2V3) and V2I4) technologies s Supplementary system development for situational management (e.g., the
Glasgow projects)
1) The UAV acronym means Unmanned Aerial Vehicle, which is an aircraft without a pilot. UAVs can be remote controlled aircraft (e.g. flown by a pilot from a ground control station) or can fly autonomously based on pre-programmed flight plans
2) An aerostat (From Greek ਕȒȡ aer (air) + ıIJĮIJȩȢ statos (standing) through French) is a lighter-than-air craft (the average density of such a craft is lower than the density of atmospheric air) that gains its lift through the use of a buoyant gas. Aerostats include unpowered balloons and powered airships.
3) Vehicle-to-vehicle (V2V) is an automobile technology that is designed to allow automobiles to “talk” to each other.
4) Vehicle-to-Infrastructure (V2I) Communications for Safety is the wireless exchange of critical safety and operational data between vehicles and roadway infrastructure that is primarily intended to avoid motor vehicle crashes.

Chapter 2 _ R&D and Innovation Policies to Enhance Energy Security (Czech Republic)�ˍ�099
Proposed Solutions
s Smart City projects usually focus on either the management of municipal property or on specific tasks such as traffic management, energy consumption, and crime prevention. No present solution covers all of the above functionality.
s The integration of existing sensor systems using ESB5) and central data processing
s The distribution of process results and the preparation of solution design scenarios
s The development of scenarios and use casess The central crisis management system (various incompatible systems are used)
D. Information Security
s Cyber and physical security interconnections Interconnection of SIEM6) systems, overarching cyber security, and physical
security systems management PSIM s Effective integration of cyber and physical security information systems that
allow—for example—the advanced detection of abuse adversary identity, monitoring, access to technology, or shutting down their connections, preventing theft, etc.
Proposed Solutions
s Development of use cases that cover a combination of physical and information security and defined correlation rules
s Proposal communication protocol logs from various purpose sensors (For example, entrance systems generate logs differently than IPS7)) including methods for log processing normalization.
s Visualization of anomalous situations and physical intrusion detection correlations with the results of behavioral analysis
5) An Enterprise Service Bus (ESB) is a software architecture model that is used to design and implement communication between mutually interacting software applications in Service-oriented Architecture (SOA).
6) Security information and event management (SIEM) software products and services combine security information management (SIM) and security event management (SEM). SIEM technology provides real-time analyses of security alerts generated by network hardware and applications. (https://www.csoonline.com/article/2124604/network-security/what-is-siem-software-how-it-works-and-how-to-choose-the-right-tool.html)
7) Intrusion prevention systems (IPS)—also known as intrusion detection and prevention systems (IDPS)—are network security appliances that monitor networks and/or system activities for malicious activity. (https://www.techopedia.com/definition/15998/intrusion-prevention-system-ips)

100�ˍ�2017/18 Knowledge Sharing Program with Visegrad Group
6. ConclusionsInnovation has become a key “technology” of the 21st century in all spheres of
society as a tool to reflect the effective use of research and development results in practice. Applying the principles of cybernetics associated with the use of artificial intelligence led to the start of the Fourth Industrial Revolution, which became the current momentum of the transformation of the whole society. We are building a “global society 4.0”, a company based on the use of creativity and ubiquitous innovation, a society exposed to wide-ranging social and ethical challenges and opportunities.
The European Commission, in its strategy “Europe 2020”, which aims to significantly strengthen the smart, sustainable and inclusive economy, calls for the intensive use of innovation and innovation systems as a means of achieving economic and social goals. “Innovation has been placed at the heart of the strategy”, as it provides the “best means of successfully tackling major societal challenges.” (European Commission, 2010)
The example of using international experience and best practice for transforming society is Korea nowadays. After the Korean War, this country belonged to the poorest agrarian countries in the world. Korea, with its purposeful efforts to work and exploit foreign experience and investment, has gradually become one of the world's technological leaders. The route was not easy, the country underwent several transformations. Firstly, it was the construction of an industrial base with the use of large-scale foreign loans. The stage was followed to build R&D infrastructure and its use for further economic growth. At present, Korea is focusing on transforming a company with intensive use of innovation and creative capabilities of human resources.
One of the tools that Korea uses to share and seek out lessons in the outside world is the Knowledge Sharing Program (KSP). One of the specific projects under the KSP is Korea-V4 KSP, aiming at supporting innovation with industry 4.0 reflection. This exceptional approach and project enabled the Czech Republic to actively participate in the KSP project in 2016 thanks to the initiative of the Czech Technology Agency, and the MIT was actively involved in this cooperation in 2017. This collaboration and discussion have identified project areas of energy security as an important aspect and approach to industry 4.0 implementation.
The presented text is therefore to a certain extent a summary and consensus of the KSP program on possible cooperation in the field of energy security.

Chapter 2 _ R&D and Innovation Policies to Enhance Energy Security (Czech Republic)�ˍ�101
References
Act No. 458/2000 Coll. – On the conditions of business and the performance of state administration in the energy sectors and on the amendment of certain laws (Energy Act),
Act No. 240/2000 Coll. – On Crisis Management and on the Amendment of Certain Acts (Crisis Act), as amended by Act No. 320/2002 Coll.
Act No. 241/2000 Coll. – On economic measures for crisis situations and on amendment of some related acts, as amended by Act No. 320/2002 Coll.
Act No. 258/2000 Coll. – On the protection of public health.Act No. 181/2014 Coll. Cyber Security Law.
Act No. 222/1999 Coll. – The defense of the Czech Republic.
Act No. 239/2000 Coll. – An integrated rescue system.
Act No. 238/2000 Coll. – The Fire Brigade of the Czech Republic.
Act No. 133/1985 Coll. – On fire protection (the full text published as No. 67/2001 Coll.).
Act No. 254/2001 Coll. – On water (Water Act)
Cílek (2009), Václav. Energy Security of the Czech Republic: Risks and Perspectives. Natural Science Journal Vesmír, 2008/9 (87) [cit. 2015-08-18]. ISSN 1214-4029. (http://casopis.vesmir.cz/clanek/energeticka-bezpecnost-ceske-republiky)
Decree of the State Material Reserves Administration No. 498/2000 Coll. – On the planning and implementation of economic measures for crisis situations, as amended by Decree No. 542/2002 Coll.
Decree of the Ministry of Industry and Trade No. 219/2001 Coll. – On the procedure in the event of an imminent or present emergency in the electricity sector.
Deloitte (2012), Critical Infrastructure Critical Infrastructure Protection Methodology in the Field of Generation, Transmission and Distribution of Electricity, Praha, 55 s. [Cit. 2015-08-18], (http://www.hzscr.cz/soubor/metodika-zajis-te-ni-ochrany-kriticke-infrastruktury-v-oblasti-vy-roby-pr-enosu-a-distribuce-elektricke-energie-pdf.aspx)
Gruberová Daniela (2011), The Security Dimension of the Energy Relations of the Czech Republic and the Russian Federation. Brno, Diploma thesis. Masaryk University. Mgr. Tomáš Šmíd, Ph.D.
International Energy Agency [online]. [Cit. 2015-08-18]. Available from: https://www.iea.org/topics/energysecurity/
Ministry of Industry and Trade (2014a), Czech Republic Type plan: Type of Crisis Situation: Disturbance of Large-scale Electricity Supply, Prague (http://download.mpo.cz/get/26093/58202/615552/priloha007.doc)

102�ˍ�2017/18 Knowledge Sharing Program with Visegrad Group
Ministry of Industry and Trade (2014b), Czech Republic Type plan: A Plan to Deal With the Crisis Situation of a Large-scale Gas Supply Disruption. Prague (http://download.mpo.cz/get/26093/58202/615554/priloha005.doc)
Ministry of Industry and Trade (2014c), Czech Republic Type plan: A plan for addressing the crisis situation of a large-scale supply of thermal energy supply, Prague (http://download.mpo.cz/get/26093/58202/615556/priloha003.doc)
Ministry of the Interior (2010), Czech Republic Prescription no. 432/2010 Sb: Government Regulation on Criteria Critical Infrastructure Criteria. Prague (https://www.zakonyprolidi.cz/en/2010-432)
National Action Plan for Smart Grids (NAP SG), https://www.mpo.cz/assets/cz/energetika/elektroenergetika/2016/11/NAP-SG_EN_Abstract.pdf
National Research, Development, and Innovation Policy of the Czech Republic 2016–2020, http://www.vyzkum.cz/FrontClanek.aspx?idsekce=782691
National priorities of oriented research, experimental development and innovations, http://www.vyzkum.cz/FrontClanek.aspx?idsekce=782681
National Research and Innovation Strategy for Smart Specialization – National
Office of the Government of the Czech Republic (2017), Department of Sustainable Development: Strategic Framework Czech Republic 2030, Appendix 2: Development Analysis (www.cr2030.cz)
Reform of the System of Research, Development, and Innovation in the Czech Republic, http://www.vyzkum.cz/FrontClanek.aspx?idsekce=535919
RIS3 Strategy, http://www.vyzkum.cz/FrontClanek.aspx?idsekce=753765
State Energy Concept, approved by Government in May 2015
Type plan for solving crisis situation of large-scale supply disruptions
Type plan for solving with the crisis situation of large-scale gas supply disruptions
Type plan for solving the crisis situation of disruptions of large-scale heat supply
Other Websites:
https://www.techopedia.com/definition/15998/intrusion-prevention-system-ips
https://www.csoonline.com/article/2124604/network-security/what-is-siem-software-how-it-works-and-how-to-choose-the-right-tool.html

PART IIFostering Innovative SMEs:
With a Focus on Technology Transfer
Chapter 3 _ Fostering Innovative SMEs: With a Focus on Technology Transfer
(Korea)
Chapter 4_ Fostering Innovation in SMEs: Focus on Technology Transfer in
Hungary (Hungary)


Chapter 32017/18 Knowledge Sharing Program with Visegrad Group: Innovation Policy for SMEs in the Era of Industry 4.0
Fostering Innovative SMEs: With a Focus on Technology Transfer
(Korea)
���*OUSPEVDUJPO
���$IBMMFOHFT�PG�5FDIOPMPHZ�5SBOTGFS�JO�)VOHBSZ
���"OBMZTJT�PO�,PSFBO�&YQFSJFODF
���$PODMVTJPOT�BOE�1PMJDZ�*NQMJDBUJPOT

106�ˍ�2017/18 Knowledge Sharing Program with Visegrad Group
SummarySmall and medium-sized enterprises (SMEs) play a vital role in a national economy
in terms of value creation and employment. However, despite their importance, many SMEs lack not only financial but also technological resources. In this regard, governments across the globe have attempted to enhance their innovation capacity by promoting technology transfer from universities, and Hungary and Korea are no exception. However, the complex nature and tacit aspect of innovation make it difficult to promote technology transfer, and, in Hungary, university culture focusing heavily on scientific research and insufficient innovation capacity in SMEs have been challenges for technology transfer. To address this issue, the current research investigates the Korean experience, in the sense that, as in Hungary, Korea has also suffered from low university entrepreneurship, though it has actively implemented many policies to encourage industry–university cooperation. In-depth qualitative analysis of Korean experience suggests the followings as potential policy interventions. First, strong motivation and incentive are imperative to encourage entrepreneurship; thus, the benchmark Korean Bayh–Dole Act is suggested to allow universities to make their additional income from technology transfer. Second, recruiting well-prepared external experts rather than pushing current internal members to develop the necessary entrepreneurial skills can be a better approach for universities. As it takes substantial time for an academic scholar
Fostering Innovative SMEs: With a Focus on Technology Transfer (Korea)
Joonmo Ahn (Sogang University)
乇#Chapter 03
Keywords: Hungary, Korea, Industry-University Collaboration, Technology Transfer, Technology Commercialization

Chapter 3 _ Fostering Innovative SMEs: With a Focus on Technology Transfer (Korea)�ˍ�107
to change their behavior, the Korean government introduced a concept of the industry–academic cooperation professor, who will play a facilitator role in grey areas. Third, it is necessary to consider various technology transfer routes, such as spin-offs or investment via technology holding companies. Last, it is imperative to nurture experts who understand the technology transfer process and will play a facilitator role not only in universities but also in private companies, particularly in SMEs that lack talented employees. For this, graduate schools of Management of Technology (MOT) have been established in a few key universities in Korea, and they are playing an important role in nurturing experts, establishing entrepreneurship education platform, and supporting Technology Transfer Offices (TTOs). Based on these implications, a policy roadmap embracing short-, mid-, and long-term plans is suggested.
1. IntroductionSmall and medium-size enterprises (SMEs) play one of the most important roles
in a national economy, in particular, in terms of economic growth and employment (Hoffman et al., 1998, Rothwell, 1991). For example, in Korea, between 1994 and 2014, SME1) employees increased from 75.1% of the workforce to 87.9%, while that of large firms decreased from 24.9% to 12.1% (KBIZ, 2016). SMEs accounted for 99.9% (3 millions) of all firms in 2014, and the percentage of value added by SMEs has increased over time. In 2010s, as shown in [Figure 3-1], SMEs contributed to the creation of value added more than 80%, but the contribution of large firms was less than 20% in the 2010s (KBIZ, 2016).
The importance of SMEs is global phenomenon. In the UK, SMEs employed 58.8% in the private sector, and accounted for 99.9% of all companies (BIS, 2011). SMEs have also contributed to innovation. Between 1945 and 1983, the proportion of innovation made by small firms (1-199 employees) increased sharply (from 16.8% to 26.3%), while innovations made by large firms (1,000-9,999 employees) decreased from 28.6% to 14.9% (Rothwell and Dodgson, 1994). The National Science Foundation (NSF)’s finding that small companies are better at developing new products given the same amount of investment implies that SMEs’ R&D can be more efficient than that of large companies (NSF, 2010).
1) The definition of an SME differs from country to country. In Korea, a manufacturing SME is defined as having fewer than 300 employees, while it is defined as having between 0-249 employees in the EU.

108�ˍ�2017/18 Knowledge Sharing Program with Visegrad Group
Because of this importance of SMEs, encouraging SME innovation has been regarded as a key policy for stimulating local, regional, and national level economic growth (Jones and Tilley, 2003). However, it does not necessarily mean that every country has successfully promoted innovation in SMEs. Many countries have faced substantial challenges and hurdles in this process, and Hungary is one of them. Hungary is an emerging East European country. Since joining in European Union in 2004, Hungary has implemented many policy interventions to boost its economy. Hungarian government has recognized SMEs as an important source of innovation. However, as noted by many EU and external evaluation reports, there exist many challenges to be addressed. The high dependence on foreign direct investment (FDI)
(Unit: %)
SMEs
9080706050403020100
1960s 1970s 1980s 1990s 2000s 2010s
Large Firms
[Figure 3-1] % of Value Added Over Time in Korean SMEs and Large Firms
Source: KBIZ (2016).
Markets
Markets
ExistingMarkets
New Companies
OrganizationalBoundary Organizational
Boundary
DevelopmentResearch
Closed Innovation Open Innovation
DevelopmentResearch
Research Projects
ResearchProjects
[Figure 3-2] Closed vs. Open Innovation
Source: Chesbrough (2003).

Chapter 3 _ Fostering Innovative SMEs: With a Focus on Technology Transfer (Korea)�ˍ�109
in the economy and insufficient entrepreneurship in universities and low innovation capacity in SMEs are such difficulties.
As innovation is a kind of multi-player game in which many different actors are involved (Fagerberg et al., 2005), it is necessary to look at interactions between other actors around a firm’s boundary. In this context, Gregory (1995)’s framework includes major important external interactions, such as technology protection, identification, and exploitation, and this idea of these practical interrelationships with the external environment is more highly developed within the concept of “open innovation” (Chesbrough, 2003). This study adopts these perspectives, emphasizing complex innovation activities in a system. A firm cannot independently implement a whole innovation process due to the increasing complexity of technological development, and this challenge will play a more important role in SMEs, which typically lack innovation resources. In this regard, this study attempts to investigate technology spill-over from public sectors – Hungarian universities. This perspective is based on Gregory (1995)’s “technology management Process framework” and Chesbrough (2003)’s “open innovation” concept, which emphasizes the importance of knowledge flow between each innovation actor. Considering that national-level innovation is heavily skewed to foreign multinational corporations (MNCs) in Hungary, promoting technology transfer from university to SMEs would be necessary to balance the national innovation and enhance SME innovation capacity. Therefore, this study investigates the challenges in knowledge spill-over from public sectors to answer the question of “How can we promote technology transfer for Hungarian SMEs?” For this, the current Knowledge Sharing Program (KSP) aims to compare Korean innovation experiences with those of Hungary. Korea is one of the leading countries in terms of innovation, and due to its successful industrialization and high investment in innovation, it has achieved immense economic growth for the last fifty years. The Korean government is spending approximately 17.7 billion US dollar2) (USD) a year for innovation, and it has implemented numerous policies to enhance SMEs’ innovation capacity and support their innovation activities. Through this, Korea has accumulated substantial know-how for SME innovation policy, which can effectively contribute to the innovation policy design for Hungarian SMEs. In this study, the definition of technology transfer covers both IP licensing and technology spin-off (i.e., start-up creation). Although IP plays an important role in knowledge transfer, the technology transfer process is very complicated due to the tacit nature of innovation. The literature has shown that technology transfer can even occur without IP licensing, and sometimes spin-offs can be more effective than licensing (Chesbrough et al., 2014). Considering this, the current research explores both IP licensing and spin-offs.
2) Estimated national budget for R&D in 2018.

110�ˍ�2017/18 Knowledge Sharing Program with Visegrad Group
2017/18 Korea-V4 KSP is a multiple bi-lateral program, so two researchers are allocated for one subject of a V4 member country. For Hungarian themes, both the Korean and Hungarian researcher independently (but with a strong tie) explore technology transfer issue in Hungary and recommend policy suggestions as results. Therefore, to avoid overlap and redundancy, this study will focus on illustrating Korean experiences, while the Hungarian researcher will provide in-depth details about past and current hurdles of technology transfer in Hungary.
The remainder of the current research comprises three sections. The next section will evaluate innovation in Hungary, and the following section will provide Korean experiences. The last section will conclude this report by illustrating policy implications and suggestions.
2. Challenges of Technology Transfer in Hungary
2.1. Overview
Hungary joined the OECD in 1996 and EU in 2004, and with the successful economic transformation, Hungary’s GDP per capita reached 15,669 USD in 2005, but since then it has slightly decreased and trapped between 12,000 and 14,000 USD In 2015, R&D intensity was 1.4% of GDP (Growth Domestic Production) and its total intermural R&D expenditure (GERD) was 1.511 million EUR. Nevertheless, those figures are below the OECD average due to a lack of both private and public investment.
Hungary has strong industrial sectors, but business innovation capacities are concentrated in foreign-owned companies and some large domestic companies. BERD was approximately 1.01% in 2015. Manufacturing industry BERD was 0.45% and service industry BERD was 0.4%. The main industries in Hungary are agriculture, automobile, electronics, pharmaceutical, and food processing, in which foreign MNCs, such as Audi, Nokia, Foxconn, Daimler, and Opel, have aggressively invested (OECD, 2016). In the manufacturing industry, the pharmaceutical sector accounts for 60% of the total manufacturing R&D expenditure, but Gedeon Richter is the only Hungarian pharmaceutical firm. In 2014, the amount of FDI was approximately 71.6 billion EUR, most of which was invested in service industry and assembly manufacturing firms. 76.4% of FDI comes from European countries, and German FDI plays a particularly important role in the sense that it accounts for 23.2% (EC, 2017b). Foreign MNCs contributed to the creation of 57.4% of the nation’s total value in 2014, and innovation capacity is also heavily concentrated in them. Foreign MNCs spent 56.6% of total business R&D expenditure, and they hired 52.2% of researchers. Public investment in research displays 33% of GERD, but the national priorities are

Chapter 3 _ Fostering Innovative SMEs: With a Focus on Technology Transfer (Korea)�ˍ�111
strongly influenced by EU programs, especially structural funds. Comparisons of national-level innovation capacity between Hungary and Korea are shown in <Table 3-1>.
2.2. External Evaluation
There are many country-focused in-depth reports and comparable indicators developed by the EU, and those reports and statistics reveal the challenges Hungary is facing in terms of SME innovation and technology transfer.
2.2.1. Research and Innovation Observatory Report 2016
This report is made to identify Hungary’s challenges in research and innovation, and it points out the following four factors as the main policy hurdles (EC, 2017b).
A. Low innovation capacity: innovation competence in the private sector is lower than that in European countries. The main reasons for this are high dependency on foreign MNCs in R&D activities and low innovation capacity of SMEs.
B. Weak university-industry collaboration: promoting innovation collaboration between university and industry has been continuously raised as an important agenda. The report pointed out that collaboration sustainability is a critical.
C. Frequent Innovation governance restructuring: the report identified that the frequent institutional set-ups of the Hungarian innovation system impede smooth implementation of innovation policy. This governance restructuring will result in a lack of knowledge and skill accumulation in innovation agencies.
Hungary Korea
Business R&D Expenditure* 0.98% 3.36%
Public R&D Expenditure* 0.37% 0.87%
Higher Education Expenditure on R&D** 0.17% 0.39%
R&D Personal*** 8.6 17.0
Researchers Employed in the Public Sector 30% 57%
Patents filed by University & Public Lab**** 0.003% 0.103%
�Table 3-1� Innovation Capacity Comparisons
Note: * % of GDP, 2014 / ** % of GDP, 2015. *** Per-thousand total employment, 2015. **** % of all IP5 patent families applications, 2013.Source: OECD (https://www.innovationpolicyplatform.org).

112�ˍ�2017/18 Knowledge Sharing Program with Visegrad Group
D. Lack of highly skilled researchers: highly skilled R&D researchers are an important source of innovation. Both quality and quantity of science and technology human resources, particularly at master’s and Ph.D. level, is not enough to foster and stimulate innovation activities.
2.2.2. Hot Issues in the Hungarian Innovation System
OECD STIO (Science Technology and Innovation Outlook)’s self-reported questionnaire suggested the following four issues as challenges to be addressed for the promotion of innovation (OECD, 2016).
A. Public research system: OECD STIO pointed out that the competence of Hungarian public research institutions is considerably lower than those in other European countries due to lack of R&D investment.
B. Tertiary education system: many key issues, such as performance-based teaching and learning, achieving world-class research, involving higher education in urban and regional development, making institutional changes, developing innovative management, and adequately funding higher education, are raised as topics to be addressed.
C. SME and entrepreneurship: due to the importance of SMEs in economic growth, supporting SMEs has increasingly been a focus of innovation policy. However, due to low R&D intensity of SMEs, their low absorptive capacity has impeded not only their growth but also technology acquisition from public sectors.
2.2.3. Innovation Score Comparison
European Innovation Scoreboard (EC, 2017a) enables us to understand general issues of technology transfer and SMEs in Hungary.

Chapter 3 _ Fostering Innovative SMEs: With a Focus on Technology Transfer (Korea)�ˍ�113
According to this report, the overall innovation index of Hungary was below the EU average in 2016, it decreased 3.5% compared to the same index in 2010. Further, as shown in <Table 3-2>, not only did public sector R&D expenditure decrease, but also the majority of SME innovation activities diminished. For example, four types of SME innovation – product, process, marketing, and organizational – decreased compared to those in 2010. In addition, both internal and external innovation decreased between 2010 and 2016. Applications of intellectual properties (except for trademark) have decreased, and interaction between private and public sector has weakened; both co-publications and co-funding decreased over the six-year period.
2.3. Qualitative Analysis
To investigate various hurdles of technology transfer, in-depth interviews were conducted with the help of the Hungarian National Office of Research Development and Innovation. The target institutions were selected to cover many different innovation actors from a university to MNC; the final list is shown in <Table 3-3>. Semi-structured interviews were conducted for 1 to 1.5 hours for each interview, and all the interviews are audio-recorded or noted for further analysis. Most of the interviewees pointed out the same issues raised by the EU or OECD reports (i.e., weak innovation capacity of SMEs and MNC-driven innovation). Yet, in addition to this, we were able to draw some important policy implications in terms of challenges impeding technology transfer from universities to SMEs. Key points are illustrated as follows.
IndexRelative to EU
Change2010 2016
Overall Index 70.9 67.4 -3.5
R&D Expenditure in the Public Sector 55.6 34.3 -21.3
SME Product/Process Innovation 21.2 13.7 -7.5
SME Marketing/Organizational Innovation 32.4 14.0 -18.4
SME In-house Innovation 19.5 15.5 -3.9
Innovative SMEs Collaborating with Others 59.7 50.0 -70.4
Public–Private Co-publications 76.9 76.5 -0.4
Private Co-funding of Public R&D Expenditure 125.3 54.9 -70.4
PCT Patent Applications 60.5 59.6 -0.9
Trademark Applications 52.3 59.5 7.2
Design Applications 21.4 20.1 -1.3
�Table 3-2� Innovation Index Change
Source: European Innovation Scoreboard (2017a).

114�ˍ�2017/18 Knowledge Sharing Program with Visegrad Group
A. Entrepreneurship
Many interviewees pointed out low entrepreneurship as an important challenge for technology transfer. Particularly in universities, entrepreneurship is not highly appreciated among faculty members. It seems that this phenomenon is related to historical and cultural characteristics of the nation. As shown in [Figure 3-3], Hofstede et al. (1997)’s results suggest that the uncertainty avoidance index in Hungary is higher than other European countries‘ (e.g., the United Kingdom). Considering that risk-taking propensity plays an important role in forming entrepreneurial orientation
46
Power Distance
35
80
Individualism
89 88
Masulinity
Hungary
66
82
UncertaintyAvoidance
35
58
Long TermOrientation
51
31
Indulgence
69
United Kingdom
[Figure 3-3] Comparison of National Characteristics
Source: Hofstede et al. (1997). https://www.hofstede-insights.com/country-comparison/hungary,the-uk/
Institution Name Type
Ministry of Foreign Affairs
Government AgencyNational Office of Research Development
National Trade House
Intellectual Property Office
Hungarian Academy of Science, Institute for Computer Science and Control Public Research
OrganizationBay Zoltan Non-profit for Applied Research
Robert Bosch R&D Campus Private Firm, MNC
Mobility and Multimedia Cluster Innovation Intermediary
Budapest University of Technology and Economics, Technology Transfer Office Public University, TTO
�Table 3-3� Institution List for In-depth Interviews
Source: Author.

Chapter 3 _ Fostering Innovative SMEs: With a Focus on Technology Transfer (Korea)�ˍ�115
(Naman and Slevin, 1993), it is suggested that further policy intervention is needed to promote entrepreneurship, particularly among academic faculties.
B. Research Focus
Many universities in Hungary have focused on basic/scientific rather than applied/industrial research. This may be a global phenomenon, but it is necessary for Hungarian universities to change their research directions in a way that addresses the current gaps between industry needs and academic research. Many interviewees pointed out that there is a university culture that values basic science or theoretical research rather than applied research. They also pointed out that, generally, academic faculties are not inclined to be engaged in technology commercialization projects.
C. Public Research Institutions
The role of universities has expanded from teaching to research and technology commercialization (Minshall et al., 2008) (see Figure 3-4), but these additional roles can be complemented by other institutions. To accelerate this transition and complement the second (i.e., research) and third (commercialization) role, many countries have established public research institutions. In Hungary, research institutions under the Hungarian Academy of Science are conducting many research projects with European companies and organizations. However, to avoid overlap and redundancy with universities, more emphasis must be put on applied research and collaboration with SMEs rather than pure scientific discovery.
Moreover, to encourage technology transfer, it is necessary to guarantee basic funds for public research institutions, such as the Bay Zoltan Non-profit for Applied Research. SMEs typically lack of financial resources for innovation. However, because the service of Bay Zoltan Non-profit for Applied Research is on a user-charge basis, it is not easy for SMEs to access this service. To increase accessibility of SMEs and help Zoltan Non-profit for Applied Research to develop new SME friendly services, minimum operating cost has to be allocated using public funds or by the government.

116�ˍ�2017/18 Knowledge Sharing Program with Visegrad Group
D. Technology Transfer System and IP Experts
Technology transfer is a very complicated process. Indeed, the importance of IP cannot be neglected, in the sense that it captures and measures technological and commercial potential. However, this does not necessarily mean that IP is a prerequisite for technology transfer. As shown in <Table 3-4>, in some cases (e.g., contransformant technology), important knowledge was already available via an academic paper, so IP did not play a vital role. Yet, in other cases (e.g., Zalatan), IP was very important, in that commercialization was conducted based on exclusive licensing. In addition, the role of inventors and TTOs was different from case to case. Richard Alex did not engage in commercialization for contransformant technology, but Colombia University TTO strongly supported the whole technology transfer. However, Steven DenBaars in UC Santa Barbara strongly engaged in the commercialization process of Gallium Nitride (blue LED) by making a start-up. It must also be noted that licensing is not a unique route for commercialization. Technology transfer can be achieved by various routes, such as consulting and spin-offs. However, because in Hungary it is not allowed for pubic organizations to possess equity or shares of firms, spin-offs are not actively considered as an option for technology transfer. Recognizing the complex nature of technology transfer, a systematic approach is necessary to deal with tacit aspect in innovation. Yet, because TTOs lack experience and experts, they may face various difficulties in finding the best route for each commercialization project.
Delivery of ExistingKnowledge New Knowledge Creation New Knowledge
Dissemination & Application
1st Role 2nd Role 3rd Role
Teaching Research Commercialization
[Figure 3-4] Changes in the Role of Universities
Source: Author.

Chapter 3 _ Fostering Innovative SMEs: With a Focus on Technology Transfer (Korea)�ˍ�117
E. Lack of Public Innovation Funds
To cope with the lack of innovation capacity in SMEs and insufficient motivation for technology transfer in universities, public financial support would be necessary. However, many interviewees pointed out that national innovation grants are highly dependent on EU structural funds. Yet, because there are many localized challenges, special public funding is needed to address the innovation hurdles Hungary’s characteristics reflect.
3. Analysis on Korean Experience
3.1. Legal Foundation for Technology Transfer
3.1.1. Bayh–Dole Act
In 1980, the United States government established the Bayh–Dole Act to promote technology transfer from university to industry. The main point of this law lies in the ownership of inventions made with federal funding. Before this act, federal research funding contracts and grants obligated inventors to assign inventions they made using federal funding to the federal government. However, the Bayh-Dole Act allowed a university, small business, or non-profit institution to implement ownership of an invention. The essence of the Bayh-Dole Act can be summarized as follows.
Case IP Importance LicensingThe Role of Inventors in
CommercializationField
Contransformant Technology None
Non-exclusive licensing
Very weak(Strong involvement
of TTO)Biomedicine
Gallium Nitride(Blue LED) Not important Strong
(Through know-how) Semiconductor
Zalatan(Glaucoma Treatment) Very important Exclusive
licensing Strong Medicine
Ames II Test Not essentialStrong
(Strong involvement of TTO)
Bioengineering
Water Soluble CD4 Not essentialWeak
(Strong involvement of TTO)
Biomedicine
�Table 3-4� Various Cases of Technology Transfer
Source: National Research Foundation.

118�ˍ�2017/18 Knowledge Sharing Program with Visegrad Group
s March-in right: the federal government can intervene to promote the licensing of technology funded by federal government
s SME preference: a priority of technology licensing is given to SMEss Domestic market preference: exclusive licensing only in domestic markets Non-profit use of licensing income: income from licensing must be used for
research and education in universitiess Transparency: university must establish transparent accounting system
The Bayh-Dole Act resulted in two important changes. First, it became an important legal foundation for technology transfer. This law encouraged universities to recognize the importance of knowledge management organization. As show in [Figure 3-5], the number of TTOs in the US rapidly increased after 1980. Second, this law helped universities to establish a sounder innovation ecosystem. As it enabled universities to create new revenue based on research results, it contributed to not only the increase of research funding in universities but also the establishment of a virtuous cycle. The Bayh-Dole Act generated many success cases (see Table 3-4), which stimulated researchers in universities and changed the recognition of industry managers. Huge commercial success of technology transfers encouraged entrepreneurship of academics, and firms, particularly, and SMEs effectively exploited universities’ technology to lighten their internal R&D investment.
3.1.2. Korean Bayh–Dole Act: Legal Foundation
As in Hungary, Korea has faced many difficulties in the transition of the role of
(Unit: number)
1935Ye
ar
12
10
8
6
4
2
0
180
150
120
90
60
30
Accumulative Number of TTOs per YearNewly Created TTOs per Year
1940
1957
1970
1973
1976
1978
1980
1982
1984
1986
1988
1990
1992
1994
1996
1998
2000
2002
2005
2007
Bayh-DoleAct of 1980
[Figure 3-5] TTOs in the United States
Source: Association of University Technology Managers.

Chapter 3 _ Fostering Innovative SMEs: With a Focus on Technology Transfer (Korea)�ˍ�119
the university (see Figure 3-4). The main role of the university was teaching before industrialization, but the research function has thereafter been emphasized to develop new technologies. In this respect, the Korean government has increased R&D funding immensely, which made Korea one of the leading innovative countries in the world (see Figure 3-6). Korea was ranked as the 9th in scientific publications and 4th in patent applications by applicant’s origin according to an IMD report (IMD, 2015). However, despite huge investment on R&D, the efficiency of R&D investment has been raised continuously. There has been a considerable gap between industry needs and academic research, and systems in university were not mature enough to
promote entrepreneurship and technology transfer until the late 1990s. To address this gap, the Korean government bench-marked the US Bayh-Dole Act
and established its Korean version entitled the “Industrial Education Enhancement and Industry-Academia-Research Cooperation Promotion Act.” The main motivation of this law was the promotion of the entrepreneurial university; thus, it aimed to bridge the gap between industry and academia, as shown [Figure 3-7]. Although this law was inspired by the US Bayh-Dole Act, it embraced broader concepts in addition to technology licensing. Further developments compared to the US Bayh-Dole Act are the establishment of the “industry-academic cooperation foundation,” “technology holding company,” and “industry-university cooperation professor.”
(Unit: %)
4.0
3.5
3.0
2.5
2.0
1.5
1.0
0.5
2000 2002 2004 2006 2008 2010 2012 2014
KOREA
OECD Average
[Figure 3-6] R&D Investment per GDP
Source: OECD STI Outlook 2016.

120�ˍ�2017/18 Knowledge Sharing Program with Visegrad Group
A. Industry–Academic Cooperation Foundation: Main Control Tower
The industry-academic cooperation foundation is an independent organization that solely focuses on technology transfer and industry-academic cooperation and a legal entity that has its own corporate registration number. The Industrial Education Enhancement and Industry-Academia–Research Cooperation Promotion Act defines industry-academic cooperation foundation and provides a legal foundation for the establishment of this organization (see Box 1). In 2016, 354 among 422 universities (approximately 83.9%) established their own industry-academic cooperation foundations. Such foundations help with research contracts and manage all the IP created from the research projects. The main roles of the foundation are categorized to the following three. First, it leads and supports all kinds of industry-university cooperation. A foundation makes its plan and strategy for cooperation promotion and creates basic statistics to evaluate its performance. Second, the foundation manages and supports all kinds of research projects. By law, it is prohibited that university faculty members make a research contract individually. The foundation is an appropriate legal entity that makes a research or any external contract by delegating university faculty members. Therefore, the foundation manages all the research or industry-university cooperation projects and provides the necessary service, such as balance accounting. Third, the foundation implements all kinds of activities for industry-university cooperation. The TTO belongs to the foundation, and TTO and the foundation provide IP management service and support technology transfer and start-up incubating. Many of the industry-academic cooperation foundations in leading universities hire in-house patent attorneys to
1. Technology patent and licensing2. Consultation for industry: promoting existing industries3. Spin-offs: firm formation4. Entrepreneurship education: training top-level workforce5. providing rare facilities for R&D
“Bridging the gap by systematical knowledge management and entrepreneurship!”
EntrepreneurialUniversity
Industry
[Figure 3-7] The Purpose of the Korean Bayh–Dole Act
Source: Author.

Chapter 3 _ Fostering Innovative SMEs: With a Focus on Technology Transfer (Korea)�ˍ�121
provide professional services for knowledge management. [Figure 3-8] illustrates the manpower distribution in industry-university cooperation foundations. The three tasks mentioned above are the main functions of the foundation, and the fact that the manpower for cooperation has increased continuously suggests that cooperation is being actively implemented in practice.
(Unit: number of people)
3,000
2,500
2,000
1,500
1,000
500
02012
996
Planning
975 889 957
1,5521,4311,5391,337
1,743 1,847 2,012 2,038
2,257
2,7832,620
2,4482,1991,907
951
1,532
2013 2014 2015 2016
Management Cooperation Etc.
[Figure 3-8] Human Resources in Industry–University Cooperation Foundations
Source: National Research Foundation.
Article 1 (Purpose) The purpose of this Act is to contribute to the development of communities and the State by training creative industrial human resources meeting the needs of the industrial world, by setting up an efficient research and development system, and by developing, spreading, diffusing, and commercializing new knowledge and technologies necessary for the growth of industries based on linkage between education and research through the promotion of industrial education and the acceleration of industry-academia-research cooperation
Article 2 (Definitions)6. The term “industry–academia–research cooperation” means the following activities
conducted by industrial educational institutions, the State, local governments, research institutes, and industrial enterprises, etc. through mutual cooperation among them:
(a) Train human resources meeting the demand of industrial enterprises, and future industrial development;
(b) Research, development, and commercialization for creating and disseminating new knowledge and technologies;
(c) Transfer technologies to industrial enterprises, etc. and provide industrial advice, etc.;(d) Jointly use tangible and intangible resources held by research institutes, such as human
resources, facilities, equipment, and/or research and development information
�Box 3-1� Industrial Education Enhancement and the Industry- Academia Research Cooperation Promotion Act
Source: www.moleg.go.kr.

122�ˍ�2017/18 Knowledge Sharing Program with Visegrad Group
The establishment of industry-academic cooperation foundation contributed to the increase of research activities and systematic knowledge management, which promoted technology transfer. As shown in [Figure 3-9] and [Figure 3-10], both patent applications and technology transfer in universities have drastically increased since 2005, which has made universities’ financial status sound and healthy (see Figure 3-11). It is also noteworthy that research collaboration between universities and SMEs has continuously increased (see Figure 3-12).
(Unit: number)
25,000
20,000
15,000
10,000
5,000
0
6,000
5,000
4,000
3,000
2,000
1,000
02005
Domestic Patent Application
PCT Application
2006 2007 2008 2009 2010 2011 2012 2013 2014 2015 2016
Overseas Patent Application (net)
Dom
estic
Pat
ent A
pplic
atio
n
PCT A
pplicationO
verseas Patent Application (net)
[Figure 3-9] Patent Application by Universities
Source: National Research Foundation.
(Unit: number, thousand USD)
6,000
5,000
4,000
3,000
2,000
1,000
0
90,000
80,000
70,000
60,000
50,000
40,000
30,000
20,000
10,000
02005
Technology Transfer
2006 2007 2008 2009 2010 2011 2012 2013 2014 2015 2016
Revenue
Tech
nolo
gy T
rans
fer
Revenue
[Figure 3-10] Technology Transfer by Universities
Source: National Research Foundation.

Chapter 3 _ Fostering Innovative SMEs: With a Focus on Technology Transfer (Korea)�ˍ�123
B. Industry–Academia–Research Cooperation-based Technology Holding Company and its Subsidiary Companies: Spin-off Promotion
Industry–academia–research cooperation-based technology holding company means a company that controls a third company upon holding the third company’s stocks (including stakes) for the purposes of commercializing the technology being held by an industry–academic cooperation foundation. Based on the Industrial Education Enhancement and Industry-Academia-Research Cooperation Promotion Act, many research universities hold many subsidiary companies (companies
(Unit: million USD)
6,400
6,200
6,000
5,800
5,600
5,400
5,200
5,0002012 2013 2014 2015 2016
[Figure 3-11] Total Revenue of Industry–University Cooperation Foundations
Source: National Research Foundation.
(Unit: number)
14,000
12,000
10,000
8,000
6,000
4,000
2,000
0 2014 2015 2016
Education projects Research projects
[Figure 3-12] Collaboration Projects with SMEs
Source: National Research Foundation.

124�ˍ�2017/18 Knowledge Sharing Program with Visegrad Group
established based on the technologies held by a university or research institute, the main business of which is controlled by a technology holding company.)
As described in [Figure 3-13], the main purpose of the technology holding company is creating university start-ups. As in Hungary, Korean universities are non-profit organizations that are prohibited from profit-oriented activities. Thus, Korean universities were not able to spin-off their start-ups. To resolve this contradicting issue, the Industrial Education Enhancement and Industry-Academia-Research Cooperation Promotion Act allowed universities to establish a parent company (technology holding company) by investing3) their IP and capital. Therefore, a university itself cannot pursue profit creation, but it can indirectly govern subsidiary companies in which IP and financial assets of the university are invested. As shown in [Figure 3-14], Industrial Education Enhancement and Industry-Academia-Research Cooperation Promotion Act encouraged universities to make spin-offs using their IP. In 2016, 58 universities established their technology holding companies, which span-off 529 subsidiary companies in total. In 2014, the average sales of subsidiary companies reached 715 thousand USD, and these companies hired 910 employees in total (see Figure 3-15). In 2013, it was reported that 261 patents were transferred to subsidiary companies and their business areas covered mainly high-tech (30.8%), manufacturing (37.3%), and S/W - ICT (20.9%).
3) University must possess more than 50% of the equity.
Subsidiary Company-More than20% of Capital, Technology, and Goods
(More than 30% of Capital Investment)
Holding’sCompany
ExternalInvestmentUniversity
Nanobio MaterialComponents Software Semiconductor Information and
Communications Energy Education
[Figure 3-13] The Concept of the Technology Holding Company
Source: Hanyang University, http://www.hanyang.ac.kr/.

Chapter 3 _ Fostering Innovative SMEs: With a Focus on Technology Transfer (Korea)�ˍ�125
Technology holding companies and their subsidiaries have made many outstanding results, and one of the best practices is illustrated in <Box 3-2>.
(Unit: number)
600
500
400
300
200
100
02008
2 2
Holdings Subsidary
2009
8 18
2010
13 44
2011
16
76
2012
23
119
2013
28
144
2014
35
201
2016
58
529
[Figure 3-14] Technology Holding Companies and their Subsidiaries
Source: National Research Foundation.
(Unit: thousand USD, number)
1,000900800700600500400300200100
0 2010
Average Sales Total Employees Patents from Universities
2011 2012 2013 2014
[Figure 3-15] The Growth of Subsidiary Companies
Source: National Research Foundation.

126�ˍ�2017/18 Knowledge Sharing Program with Visegrad Group
(1) Company Name: Raphas (www.raphas.co.kr)(2) University: Yonsei University Technology Holding Company(3) Business Area: Bio and cosmetics(4) Research Area: drug delivery system, microstructure, DAB (Droplet-born Air Blowing)
production method(5) Technology Transfer: Microstructure production technology of Professor Jung in Yonsei
University was transferred to the Raphas, and the firm developed for a further 4 years, which lead to successful commercialization of smart pillar patch technology
(6) Main Product: Acropass (cosmetics)
(7) Performance
s Selected as a global top-10 technology by SERI (Samsung Economic Research Institute) in 2011
s Acquired NET (New Emerging Technology) certificate issued by the KOITA (Korea Industrial Technology Association) in 2012
s Drastic increase in sales and net profits (see the diagram below)
�Box 3-2� Case Illustration of Subsidiary Company
Source: http://www.raphas.com.
Permeation
PATCH
Dead Skin Cell
The dissolving microstructural technology, which was developet and successfully launched by raphas,is an advanced transdermal delivery system.
Dissolving microstructures are a combination of high-molecular materials that dissolve into the body and medicalsubstances(active ingredients), which are solidified in the form of microneedles, These physically penetrate thestratum corneum(outermost layer of the epidermis), effecively delivering the ingredients into the skim.
Epidermis
Dermis
PATCH
Existing Syrings
Dissolvable Microstructures
PATCH
Dissolve Active ingredient isabsorbed skin tissue

Chapter 3 _ Fostering Innovative SMEs: With a Focus on Technology Transfer (Korea)�ˍ�127
C. Industry–University Cooperation Professor
The Industrial Education Enhancement and Industry-Academia–Research Cooperation Promotion Act aimed to encourage entrepreneurship in university, so this law allowed universities to recruit a new type of university faculty member: the industry-university cooperation professor. The concept of the industry-university cooperation professor was introduced to bridge the gap between university and industry. From the late 1990s, some universities provided entrepreneurship lectures, but most of them were theory-driven, so they did not meet the practical needs of industry. To cope with this difficulty, the Industrial Education Enhancement and Industry-Academia-Research Cooperation Promotion Act defined a new university faculty member who can focus on industry-university cooperation and industry-needs-based teaching (e.g., new product development team projects, business model generation consulting). Based on the law, universities have recruited many industry-university cooperation professors who have substantial industry experiences, such as high-level R&D managers, or former CEOs (Chief Executive Officers) or CTOs (Chief Technology Officers). As shown in [Figure 3-16], in 2016 there were 6,452 industry-university cooperation professors, and this figure was 47.1% higher than that in 2012.
(Unit: thousand USD)
�Box 3-2� Case Illustration of Subsidiary Company
Source: Ministry of Science and ICT.
10,000
8,000
6,000
4,000
2,000
0
-2,0002011 2012 2013 2014
Sales Net Profits

128�ˍ�2017/18 Knowledge Sharing Program with Visegrad Group
To encourage activities of industry–university cooperation professors, universities established a faculty evaluation system. The main roles of traditional academic faculties are teaching (the 1st role of university) and research (the 2nd role of university). However, the roles of these industry–university cooperation professors were set as teaching and industry–university collaboration (the 3rd role of the university, see Figure 3-4). Therefore, the Key Performance Index (KPI) of industry–university cooperation professors was different from that of traditional tenure-track professors. The performance of tenure-track faculty members are evaluated by their teaching and research performance (e.g., how many classes did s/he teach, or how many SCI/SSCI4) academic journal papers did s/he published?) However, instead of research, industry–university cooperation professors are encouraged to engage in industry–university cooperation, so their performance is evaluated by commercialization-related performance (e.g., whether was s/he involved in start-up of students or other faculties, how many IP did s/he transfer to industry, or how many external contracts did s/he win for research or industry-university cooperation?) There is no general rule for this, because each university establishes its own faculty evaluation criteria. However, industry–university cooperation performance is a general KPI for industry–university cooperation professors, while research performance is emphasized for tenure-track professors. For example, the Sogang University case is shown in <Table 3-5>.
4) Science Citation Index and Social Science Citation Index (Thomson Reuter)
(Unit: number)
8,000
7,000
6,000
5,000
4,000
3,000
2,000
1,000
02012 2013 2014 2015 2016
[Figure 3-16] The Increase of Industry–University Cooperation Professors
Source: National Research Foundation.

Chapter 3 _ Fostering Innovative SMEs: With a Focus on Technology Transfer (Korea)�ˍ�129
Based on this cooperation-based performance evaluation, industry-university cooperation professors have actively engaged in commercialization projects. As shown in [Figure 3-17], it was found that the majority of collaboration done by industry–university cooperation professors were the projects with SMEs in local areas, which suggests that the concept of the industrial professors has resulted in positive effects for the establishment of a sound innovation ecosystem.
(Unit: number)
1,8001,6001,4001,2001,000
800600400200
0Large Firms
2012 2013 2014 2015 2016
SMEs Local Non Local
[Figure 3-17] Collaboration by Industry–University Cooperation Professors
Source: National Research Foundation.
Area Details
Education for Industry-University Cooperation
s Developing of a new industry needs based curriculums Teaching of practical lecturess Supervision of internships Supporting student/faculty start-upss Supervision of capstone design projects
Practical Research for Industry-University
Cooperation
s Application of overseas patents Application of domestic patents Application of other IPs (e.g., design and utility model, etc.)s Amount of external funds secureds Number of technology transferss Amount of revenue from IP licensings Number of contract related to industry-university cooperation
Various Activities for Industry-University
Cooperation
s Consulting for technology, start-ups and practical lawss Supporting family companiess Number of MOU for industry-university cooperations Other activities related to industry-university cooperation
�Table 3-5� Evaluation Criteria for Industry–University Cooperation Professors
Source: Sogang University.

130�ˍ�2017/18 Knowledge Sharing Program with Visegrad Group
D. Various Entrepreneurship Promotion
The Industrial Education Enhancement and Industry–Academia–Research Cooperation Promotion Act encourages universities to implement various industry-friendly education programs to meet various industry needs. As shown <Table 3-6>, Korean universities introduced various practical coursework elements, such as capstone design, and they even permitted a special leave for students who established their own start-ups.
The contract-based curriculum is a tailor-made coursework based on companies‘ needs, and there are two sub-categories. The first is designed for the education for current company employees, and second type is designed for potential new employees who will be recruited by the company after graduation. As shown in [Figure 3-18], the number of contract-based curricula and students registered thereto has increased continuously.
(Unit: number)
2012 2016
The Number of SMEs that Requested Contract-based Curriculum 6,735 8,031
Students who Completed Capstone Design Coursework 86,107 200,563
Student Start-ups with Sales 236 351
Universities Allowing Start-up Leave for Students 68 217
SMEs Providing Industry Field Training Program 63,566 97,413
�Table 3-6� Entrepreneurship Promotion
Source: National Research Foundation.
(Unit: number)
900
800
700
600
500
400
300
200
100
0
20,00018,00016,00014,00012,00010,0008,0006,0004,0002,0000
Curriculum Students
20132012 2014 2015 2016
Cur
ricul
um
Students
[Figure 3-18] Contract-based Curriculum
Source: National Research Foundation.

Chapter 3 _ Fostering Innovative SMEs: With a Focus on Technology Transfer (Korea)�ˍ�131
To make and maintain close relationships with industry, many universities are operating their own memberships, known as “Family Companies.” In 2016, there were 74,179 Family Companies in total, and they have participated in a field-training program for students, R&D collaboration projects, and contract-based curriculum.
3.2. Case Study: Sogang University
Sogang University Research & Business Development Foundation (SURBDF) was established in 2004 as an industry-academic cooperation foundation. The Sogang TTO is a sub-division of the SURBDF, and it provides IP management service and supports commercialization projects (technology transfer).
3.2.1. IP Management Service
The SURBDF TTO provides IP management consulting service for faculties. An executive patent attorney from attorney pools in each specific field helps a faculty member to identify an appropriate technology domain by offering special service, such as IP R&D planning, a survey of patent trends, and the creation and utilization of intellectual property rights. The overall procedure of this IP management is illustrated in [Figure 3-19].
3.2.2. Technology Transfer Program
The SURBDF TTO has implemented various programs to support technology transfer and boost entrepreneurship. [Figure 3-20] illustrates the overview of the commercialization program. SURBDF TTO programs can be categorized to individual programs (yellow circles in Figure 3-20) and integrated-platform programs (navy circles in Figure 3-20).
Prepare aninvention report
precedingtechnical survey
Request forapplication
process
Prepare adetailed
description ofthe invention
Complete anapplication for
IP right
Review andresponse to
progress
Complete theregistration of
IP right
Request forapplication
process
Technicaltransfer and
commercialization
Inventorcompensation
[Figure 3-19] Patent Service Procedure
Source: Sogang University, http://www.sogang.ac.kr/.

132�ˍ�2017/18 Knowledge Sharing Program with Visegrad Group
3.2.2.1. Individual Technology Transfer Programs
A. Sherpa Program
In 2010, the SURBDF TTO launched a visiting consulting service for SMEs, Sherpa. The key concept of this program is the ‘5-3-1 strategy’ which means ‘3’ members of SURBDF TTO visit a SME to provide ‘1’ solution in ‘5’ days.
Ladder Lab, Bullpen’s Idea Commercialization SpaceFree of charge, Rent-free for 2 years → Good Idea!
Since 2010A program for visiting company (5.3.1)TLO managers achieve technology transfer
IdeaCommercial-
izationPlatform
SherpaProgram
TechnologyMarketing(On-line,Off-line)
The Programfor Supporting
R&D
BRIDGE(Support a
trialproduct)
Project forTechnologyPackaging
TechnologyLicensing
Office(TLO)
Industry-UniversigyCooperateResearch
& Development
SogangIndustry-University
CollaborativeResearch
Support a trial product from university fundsAbout 15~30 million USD budgetAbout 100 million USD budget
Sogang Search Technology WebsiteOn-line : www.sogangtech.comOff-line : Small seminar for the technology units
Support the R&D project focused on the companySupport to plan new business + Simulate assessment of the presentationSupport premium service for the company : Improving the chance to select business
Support service aligned withMinistry of EducationSupport to make the trial productAbout 15S~30 million USD budget
Support service aligned withMinistry of Science and ICTIoT, Cloud, Biadata, MobileIncrease the technology marketingability by technology packagingwith other university
Support service aligned withMinistry of SMEs and startupsSupport the first step R&D project(100 million USD~/year )
[Figure 3-20] Overview of SURBDF TTO Program
Source: Sogang University.
<Search Company> < Visit Company>
Manager
Research& Business
Development
Sherpa Program(2010)- A program for visiting company (5.3.1)- 5.3.1 Strategy: In 5 days, 3 people, get 1 solution- Support 102 companies (until now)
<Link Company>
[Figure 3-21] Sherpa Program
Source: Sogang University.
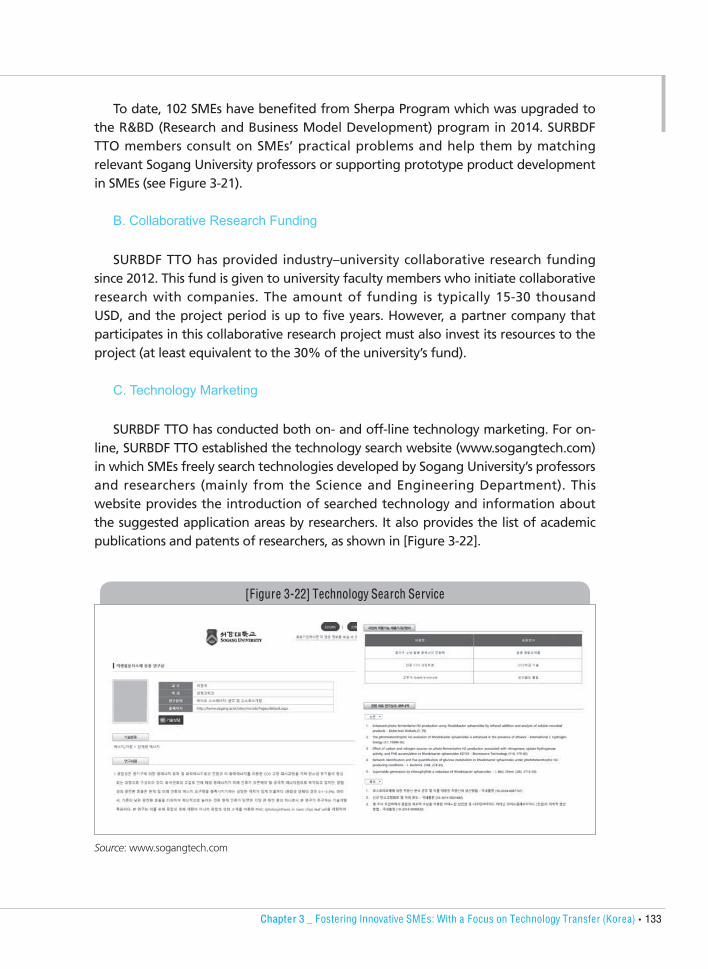
Chapter 3 _ Fostering Innovative SMEs: With a Focus on Technology Transfer (Korea)�ˍ�133
To date, 102 SMEs have benefited from Sherpa Program which was upgraded to the R&BD (Research and Business Model Development) program in 2014. SURBDF TTO members consult on SMEs’ practical problems and help them by matching relevant Sogang University professors or supporting prototype product development in SMEs (see Figure 3-21).
B. Collaborative Research Funding
SURBDF TTO has provided industry–university collaborative research funding since 2012. This fund is given to university faculty members who initiate collaborative research with companies. The amount of funding is typically 15-30 thousand USD, and the project period is up to five years. However, a partner company that participates in this collaborative research project must also invest its resources to the project (at least equivalent to the 30% of the university’s fund).
C. Technology Marketing
SURBDF TTO has conducted both on- and off-line technology marketing. For on-line, SURBDF TTO established the technology search website (www.sogangtech.com) in which SMEs freely search technologies developed by Sogang University’s professors and researchers (mainly from the Science and Engineering Department). This website provides the introduction of searched technology and information about the suggested application areas by researchers. It also provides the list of academic publications and patents of researchers, as shown in [Figure 3-22].
[Figure 3-22] Technology Search Service
Source: www.sogangtech.com

134�ˍ�2017/18 Knowledge Sharing Program with Visegrad Group
D. Success Cases of the SURBDF TTO
The SURBDF TTO has supported innovation of local SMEs, and detailed stories are illustrated in Appendix.
3.2.2.2. Commercialization Platform
In addition to various industry–university cooperation programs, the SURBDF TTO has operated a technology transfer and spin-off platform. As shown in [Figure 3-23] and [Figure 3-24], the platform consists of four steps. The first step is a preparation stage, and in this step a pre-start up generates business ideas. There are six pre-start-ups in this step. The second step is called ‘Ladder Lab’. If pre-start-ups are mature enough to start their own business, the SURBDF TTO evaluates their status and incubates them in Ladder Lab. Ladder Lab is an open space zone for start-ups, and the SURBDF TTO provides free office facilities and a commercialization evaluation service. Five start-ups are currently being incubated in Ladder Lab. The third step is called Bullpen. If start-ups are ready to graduate Ladder Lab, the SURBDF TTO provides independent office facilities depending on their preference. There are nine start-ups in Bullpen. If start-ups graduate the business incubation (i.e., Ladder Lab
[Figure 3-23] Commercialization Platform
Source: SURBDF TTO.

Chapter 3 _ Fostering Innovative SMEs: With a Focus on Technology Transfer (Korea)�ˍ�135
and Bullpen), they move to the last step. Currently, there is one company – Blue Kite. Its sales were approximately 12 million USD in 2015 and 19 million USD in 2016.
This four-step platform adopted a graduation system, so the SURBDF TTO selects promising start-ups and evaluates their status and progress to decide whether it will incubate them in the next stage. Currently the acceptance rate of Ladder Lab is 64% and that of Bullpen is 63%. Moreover, to provide various technology-transfer consulting services, the Ladder Lab and Bullpen offices are located in the building of the Graduate School of Management of Technology, which teaches and researches entrepreneurship, technology transfer, and business model generation.
3.3. Absorptive Capacity: SME Accreditation
Absorptive capacity is an important prerequisite for technology acquisition (Cohen and Levinthal, 1990). Knowledge transfer firstly assumes excellent research conducted by universities or research institutions, in the sense that research outcome is a starting point of technology transfer. However, if an SME is not ready to digest and integrate this external knowledge, the SME will fail to acquire the necessary technology (Ahn et al., 2016; Zobel, 2017).
In this sense, the Korean government has tried to enhance absorptive capacity of SMEs by encouraging them to establish internal corporate R&D centers. Corporate R&D center accreditation is an official program of Ministry of Science and ICT, and
[Figure 3-24] Layout of Ladder Lab and Bullpen
Source: SURBDF TTO.

136�ˍ�2017/18 Knowledge Sharing Program with Visegrad Group
accredited companies can enjoy many benefits. As shown in <Table 3-7>, accredited companies can claim tax deductions for their R&D investments, which is one of the most important incentives. The Korean government has provided many R&D programs and HR training programs, and accredited companies receive additional points when they apply for government programs, which will increase their acceptance rates. In addition, the fact that they can hire young talented employees using the ‘alternative military service program’ is an important incentive. In Korea, military service is mandatory, and qualified young scientists and engineers who have industrial engineer license and are permitted by Military Manpower Administration can work in SME corporate R&D centers for three years to conduct their alternative military service. For SMEs lacking of skilled workers, it is a great opportunity to hire talented young engineer for a certain period.
Corporate R&D center accreditation has encouraged SMEs to invest in their internal R&D and changed their perception towards innovation. The accreditation system was introduced in 1981, and the total number was just 1,000 in 1990. However, as shown in [Figure 3-25], it has shown a drastic increase since then. In January 2018, this number reached 39,656, and 96% (38,048) of them were SME corporate R&D centers. Corporate R&D center accreditation has contributed to the enhancement of national-level innovation capacity; companies accounted for 77.5% of national R&D investment (i.e., 45,390 million USD) and 70.1% of the total R&D personnel (i.e., 317,842 researchers) in 2015 (see Figure 3-26). Corporate R&D centers cover almost all industry areas from food to life science (see Table 3-8).
Tax Incentives
Tax credit for qualified R&D costs
Exemption from local taxes on real estate for R&D (Acquisition, property taxes)
Financial SupportDirect funding through various national R&D programs
Technology guarantee service, Loan
Manpower Support
Labor costs support for hiring new R&D personnel
Matching service for R&D personnel and companies
Alternative military service program
�Table 3-7� Incentives for Corporate R&D Center Accreditation
Source: KOITA, http://eng.koita.or.kr.

Chapter 3 _ Fostering Innovative SMEs: With a Focus on Technology Transfer (Korea)�ˍ�137
The corporate R&D center accreditation system has contributed to the development of innovation capability and many empirical studies have shown that the tax incentive in particular has effectively stimulated R&D activities in firms. For example, Won and Kim (2006) investigated the impact of tax benefits on R&D investment, and the results showed that tax deduction positively affect the increase of R&D investment in both large firms and SMEs. Choi and Jo (2013) also investigated this issue and they found that a 1% increase in tax deduction results in a 0.167-0.229% increase in internal R&D expenditure in firms.
(Unit: number)
50,000
40,000
30,000
20,000
10,000
0
R&D Center SME
2010 2011 2012 2013 2014 2015 2016 2017 2018.01
[Figure 3-25] Corporate R&D Centers
Source: KOITA, http://eng.koita.or.kr.
(Unit: number)
350,000
300,000
250,000
200,000
150,000
100,000
50,000
0
Total Industrial Researcher Researchers in SMEs
2010 2011 2012 2013 2014 2015 2016 2017 2018.01
[Figure 3-26] Industrial Researchers in Corporate R&D Centers
Source: KOITA, http://eng.koita.or.kr.

138�ˍ�2017/18 Knowledge Sharing Program with Visegrad Group
3.4. Government-funded Institutions
3.4.1. Government-sponsored Research Institutes (GRIs)
As shown in [Figure 3-4], universities have been required to expand their roles from teaching to commercialization. However, this shift is a time-consuming process and also demands substantial financial and human resources. Therefore, to compensate universities insufficient capability, a third-party organization that will play the second and third role of universities will be necessary; Korea adopted and implemented this strategy. In the 1960s, when the Korean government initiated industrialization, universities were not prepared for research. Not only did they lack of experienced researchers, they also lacked laboratory facilities for research. In this situation, the Korean government established the first Government-sponsored Research Institute (GRI) – Korea Institute of Science and Technology (KIST) – in 1966 to complement insufficient research and innovation capacity of universities (see Figure 3-27). As the nation’s first GRI, KIST has played a vital role in developing key industrial technologies and disseminating them to companies. In 1970s and 1980s, it has developed many industrial technologies, such as color TV, aramid fiber, and solar cells. However, as the research capacity of Korean companies was enhanced in 1990s, KIST has steered its focus from applied research to basic science research and the development of emerging technology. With its highly competitive research capacity, in 2016 KIST was ranked as the 6th global innovator by Thomson Reuter.
Industry Area Total R&D Centers SMEs
Construction (C) 1,163 1,106
Metal (Me) 1,710 1,639
Machinery (Ma) 6,338 6,008
Life Science (LS) 1,275 1,210
Textiles (T) 368 350
Material (MAT) 1,229 1,162
Food (F) 1,163 1,099
Electronics/Electrics (E) 8,855 8,481
Chemicals (Ch) 2,744 2,470
Environment (En) 935 922
Industrial Design (ID) 2,500 2,460
Etc. 2,600 2,518
�Table 3-8� Industry Distribution of Corporate R&D Centers
Source: KOITA, http://eng.koita.or.kr/.

Chapter 3 _ Fostering Innovative SMEs: With a Focus on Technology Transfer (Korea)�ˍ�139
[Figure 3-27] The Establishment of KIST
Source: Science, March 6th 1970.
Ministry of S&T and ICT PMO
NRC
Ministry of Maritime
NST
Korea Institute of Machinery & Materials
Korea Institute of Science and Technology Information
Korea Research Institute ofBioscience & Biotechnology
Electronics and TelecommunicationsResearch Institute
National Security Research Institute
Korea Institute of Industrial Technology
Korea Institute of Materials Science
Korea Institute of S&T Evaluation and Planning
Korea Institute of OceanScience & Technology
Science & Technology Policy Institute
Korea Polar ResearchInstitute
KAIST
Korea Institute of Toxicology
Korea Research Institute ofChemical technology
World Institute of Kimchi
Green Technology Center
Korea Food Research Institute
National Fusion Research Institute
Korea Institute of Orental Medicine
Korea Basic Science Institute
Korea Research Institute ofStandards and Science
Korea Atomic Energy Research Institute Korea Railroad Research Institute
Korea Electro-technology Research Institute
Korea Institute of Geoscience and Mineral Resources
Korea Institute of Civil Engineering and Building Technology
Korean Institute of Energy Reasearch
Korean Aerospace ReasearchInstitute
University of S&T
Korea DevelopmentInstitute
National Research FoundationKorea Astronomy and Space Science Institute
[Figure 3-28] Korean GRIs
Note: Bold font institutions are spun-off from KIST.Source: Author.

140�ˍ�2017/18 Knowledge Sharing Program with Visegrad Group
Encouraged by the success of the first GRI (KIST), Korean government has established many GRIs in various disciplines. As shown in [Figure 3-28], there are twenty-five GRIs that belong to National Research Council of Science & Technology (NST) and other institutions that belong to the Prime Minister Office (PMO), Ministry of Maritime, and Ministry of S&T and ICT. Among them, 16 GRIs were spun-off from KIST, which means that KIST has become a very important foundation of the GRI system in Korea.
These GRIs have complemented the second (research) and third (commercialization) roles of the university. Each GRI has a R&D commercialization department and it has managed research outputs and IP and supported R&D in SMEs. For example, ETRI (Electronics and Telecommunications Research Institute) has a Technology Commercialization Division. In this division, there are three sub-departments, R&D Commercialization Strategy Department, Intellectual Property Management Department, and SME Cooperation Department (see Figure 3-29), and they have tried to disseminate the R&D outputs of ETRI.
The R&D Commercialization Department promotes commercialization with using TTO-based technology marketing and ETRI’s Start-ups. To facilitate start-ups using ETRI’s technologies, the department helps with establishing and nurturing (prospective) start-ups and research institute companies via its online/offline mentoring programs. The Intellectual Property Management Department focuses on strategic planning to facilitate commercialization of core technologies developed by ETRI. It also plays key roles in acquiring excellent IP and boosting success rates
Commercialization Strategy SectionR&BD Cooperation Section Start-up Incubation Section
Technology Commercialization Division
Projet Supporting Section
R&D Commercialization Department
Technology Transfer management SectionIntellectual Property Management SectionIntellectual Property Business Section
Intellectual Property ManagementDepartment
R&D Equipment Support SectionR&D Manpower Support SectionTechnology Commercialization Support Section
SMEs Cooperation Department
[Figure 3-29] Technology Commercialization Division in ETRI
Source: ETRI.

Chapter 3 _ Fostering Innovative SMEs: With a Focus on Technology Transfer (Korea)�ˍ�141
of commercialization through building and implementing business strategies. The department makes its IP portfolio based on ETRI’s technologies and generates revenue through a variety of IP licensing and transactions. The SMEs Cooperation Department provides various technological support programs e.g., E-family SMEs Technical Support, Technical Difficulty Support, Research Equipment Sharing Center, SMEs Technology Counseling Center) to SMEs. In addition, to overcome the SMEs manpower difficulty, the department provide various manpower support programs (e.g., On-site Commercialization Support, On-site Research Personnel Support, On-site Research Personnel Dispatch, ICT Mentoring Service) to SMEs.
In addition to this TTO organization, ETRI has its own technology holding company, ETRI Holdings. It has established joint ventures or invested in existing company using ETRI’s technology and ETRI Holdings’ capital (see Figure 3-30). ETRI holdings focus on four fields: software and content, IT convergence (e.g., car and ship area, etc.), components and materials, and broadcasting, communications, and the Internet.
Joint Venture
Investment in an Existing Company
ETRI Holdings has twotypes of investment modelbased-on technologycommercialization.
[Figure 3-30] Business Model of ETRI Holdings
Source: ETRI.

142�ˍ�2017/18 Knowledge Sharing Program with Visegrad Group
3.4.2. Government-funded Program for Technology Transfer Promotion
A. Commercialization Promotion Agency for R&D Outcomes (COMPA)
Industry–academic cooperation foundations have played an important role in encouraging technology transfer in universities, but there has been a structural weakness that only technologies in an individual university are considered for a technology transfer. However, given increasing complexity of technology and necessity of multidisciplinary integration, the needs to combine different technologies from multiple universities and research institutions have continuously increased. To address this issue, the Ministry of Science and ICT established a government-funded institution, the Commercialization Promotion Agency for R&D Outcomes (COMPA). The COMPA has implemented various businesses to help and facilitate technology transfer in universities and GRIs, but it has particularly played an important role in formulating integrated IP portfolios based on technologies from multiple organizations. Each technology in a university may be promising and mature for transfer, but in some circumstances, its commercial potential can be further enhanced when a technology is combined with other complementary technologies (Holgersson et al., 2017). In this regard, by collaborating with TTOs in universities and GRIs, the COMPA has established a technology database and captured industrial needs from regular meetings and workshops with companies. Then, to meet industrial demands, the COMPA combined various technologies and IP from universities, GRIs, and individual national R&D projects. This increased the possibility of successful technology transfer and enhanced the value of the combined portfolio compared to a single technology/IP.
B. Special Technology Holdings As shown in [Figure 3-14], many universities established their own technology
holding companies. However, to accelerate technology spin-offs and achieve synergy from multiple organizations, the Ministry of Science and ICT established two special technology holding companies – the Korea Science and Technology Holdings (KST) and Mirae Holdings.
The KST was established in 2013 and its starting capital was approximately 51 million USD. The KST was made to overcome individual TTO in GRIs, so it plays a joint technology holding company of 17 GRIs (see Figure 3-31). Therefore, the main role of the KST is investing assets or technologies from 17 shareholder GRIs to accelerate the commercialization of R&D outcome from GRIs. To date, the KST has invested in 38 start-ups.

Chapter 3 _ Fostering Innovative SMEs: With a Focus on Technology Transfer (Korea)�ˍ�143
Mirae Holdings is a technology holding company established by four special science and technology-oriented universities,5) KAIST (Korea Advanced Institute of Science and Technology), GIST (Gwangju Institute of Science and Technology), DGIST (Daegu Gyeongbuk Institute of Science and Technology), and UNIST (Ulsan National Institute of Science and Technology). The concept of Mirae Holdings is very similar to that of KST (see Figure 3-32). As a joint technology holding company, Mirae Holdings establishes a technology pool based on R&D outcomes of the four science and technology-oriented universities and invests its assets and technologies in start-ups.
5) Unlike other universities governed by the Ministry of Education, those four universities were established by the Ministry of Science and ICT(MSI). They are regulated by special laws, and the MSI provides basic operating funds every year to support stable research activities.
Korea Atomic Energy Research InstituteKorea Institute of Materials ScienceKorea Institute of Industrial TechnologyKorea Institute of Machinery and MaterialsKorea Electro-technology Research InstituteKorea Research Institute of Bioscience and BiotechnologyKorea Institute of Geoscience and Mineral ResourcesKorea Institute of Civil Engineering and Building TechnologyKorea Research Institute of Standards and Science
Korea Institute of Science and Technology InformationElectronics and Telecommunications Research InsituteKorea Research Institute of Chemical TechnologyKorea Institute of Science and TechnologyKorea Railroad Research InstituteKorea Food Reaearch InsituteKorea Institute of Energy ResearchNational Security Research Institute
[Figure 3-31] Shareholders of KST
Source: KST, http://www.kstholdings.co.kr/index_eng.php.
[5 billion KRW] 33.3%
[5 billion KRW] 33.3% [1 billion KRW] 6.7%
[4 billion KRW] 26.7%
Gwangju Institute ofScience and Technology
Korea Advanced Institute ofScience and Technology
ULSAN NATIONAL INSTITUTE OFSCIENCE AND TECHNOLOGY
Daegy GyeongbokInstitute of Science & Technology
[Figure 3-32] Shareholders of Mirae Holdings
Source: Mirae Holdings, http://www.miraeholding.com/.

144�ˍ�2017/18 Knowledge Sharing Program with Visegrad Group
C. Innopolis Research Institute Spin-off Company
To promote the commercialization process in Innopolis, the Ministry of Science and ICT introduced the “Innopolis Research Institute Spin-off Company”, an enterprise established by a legally qualified body (public research institute, industry-academia cooperation technology holding company, etc.) within an Innopolis to commercialize its technology. An Innopolis Research Institute Spin-off Company is
INNOPOLIS Daedeok
INNOPOLIS Gwangju
INNOPOLIS Busan
INNOPOLIS Daege
INNOPOLIS Jeonbuk
The Korean government established the ”Special Act on Promotion of Special Research and Development Zones” to designate a special R&D zone, Innopolis. According to this law, the Korean government designated the first Innopolis at Daeduk and more recently Busan, Daegu, Gwang-ju, and Jeon-buk were also designated, as shown in [Figure 3-33]. Innopolis is designed as an innovation cluster in which many GRIs, cooperate research centers, universities, and companies interact for innovation collaboration. Innopolis provides land with cheaper prices and offers special tax discount and deduction for R&D activities of those organizations located in this special R&D cluster.
[Figure 3-33] Innopolis (Special R&D Cluster)
Source: https://www.innopolis.or.kr.

Chapter 3 _ Fostering Innovative SMEs: With a Focus on Technology Transfer (Korea)�ˍ�145
established by IP investment from research organizations in Innopolis (see Figure 3-34), and it receives substantial tax benefits, as shown in <Table 3-9>. The first Innopolis Research Institute Spin-off Company was established in 2006, and 548 firms had been established by January 2018. As shown in [Figure 3-35], the Innopolis Research Institute Spin-off Companies showed drastic increases in terms of their sales and employment.
Type 1) Joint Venture
Researchinstitute
IP Capital
Privatecompany
Innopolis ResearchInstitute Spin-off
Company
Type 2) Investment Type 3) Start-up
Researchinstitute
IP Changeover
Privatecompany
Innopolis ResearchInstitute Spin-off
Company
Researchinstitute
IP establishment
Entrepreneur
Innopolis ResearchInstitute Spin-off
Company
[Figure 3-34] Types of Establishment
Source: https://www.innopolis.or.kr.
National Tax Local Tax
Corporate Tax Property Tax Registration Tax
100% discount for the first 3 years and 50% for the next 2 years
100% discount for the first 7 years and 50% for the next 3 years 100% discount
�Table 3-9� Tax Benefit
Source: https://www.innopolis.or.kr.
(Unit: million KRW, number)
5,000
4,000
3,000
2,000
1,000
0
Sales (million KRW) Employees
2011 2012 2013 2014 2015 2016
[Figure 3-35] Economic Contribution in Innopolis
Source: https://www.innopolis.or.kr.

146�ˍ�2017/18 Knowledge Sharing Program with Visegrad Group
4. Conclusions and Policy Implications
4.1. Implications from Korean Experience
When discussing innovation models, there has been a long debate between ‘technology-push’ and ‘demand-pull’ (see Figure 3-36). The essence of the technology-push model is that the driver of innovation is spill-over effect from outstanding R&D outcomes. However, this supplier-side perspective has often failed, so the demand-pull model was suggested to cope with such an issue. The demand-pull model recognizes customers and users as an important source of innovation, triggering and stimulating R&D activities in companies. Both models illustrate the mechanism of innovation to some extent, but, after a long debate, nowadays it is perceived that innovation is a combination of both models rather than one or the other. In this context, for successful technology transfer, the supplier-side perspective must be realigned and reformed such that it embraces various industrial needs. To accelerate this realignment, policy intervention is necessary to stimulate entrepreneurship and change individual academic faculty members’ behaviors.
Korea experienced this problem in the 1990s. In [Figure 3-3], the uncertainty avoidance index of Hungary is 82, which is higher than other Western European countries’. However, this indicator of Korea is also 85. For cultural and historical reasons, Koreans generally preferred stable circumstances, which has hampered and impeded the development of strong entrepreneurship in Korea. In this situation, the Korean government wanted to change atmosphere extensively in universities, so it benchmarked the US system, the Bayh–Dole Act. As illustrated in Section 3.1.1, the Bayh–Dole Act became an important turning point in technology transfer, and this law has further developed in Korea by embracing other concepts, such as the industry–university cooperation professor. Korea’s effort, exemplified as “industry-academic cooperation foundation,“ is not the only and ultimate solution.
Technology-push Model
Demand-pull Model
R&D Production Marketing Need
R&D Production Marketing Need
1
1
2
2 3
3
[Figure 3-36] Two Different Innovation Models
Source: Martin (1994).

Chapter 3 _ Fostering Innovative SMEs: With a Focus on Technology Transfer (Korea)�ˍ�147
Admittedly, Korea is still facing many challenges and hurdles in the promotion of technology transfer. However, it must be noted that the Korean Bayh–Dole Act, became an important milestone and legal foundation that pushed universities to align their research directions with industrial needs. There are various factors that the Hungarian government must consider when it aims to stimulate entrepreneurship, and thereby promote technology transfer. However, it is recommended to recognize the following three elements in the policy development process.
A. How to Make an Incentive System
It is not easy for an individual to change his/her behavioral pattern, and the same is true for an organization. Like a personal habit, an organization is bounded by its routine, which is defined as “a smooth sequence of coordinated behavior which embodies a firm’s capabilities” (Nelson and Winter, 1982). As noted by Ahn et al. (2018), it is not easy for an organization to abandon an old and establish a new routine. The setting up of a new routine can increase risk (Gavetti et al., 2012), in the sense that companies also have to cope with the new uncertainties involved. In addition, routine change involves internal conflict and resistance (Dosi and Marengo, 2007). As an organizational routine represents well-setup procedures, which internal members have already agreed to follow, a strong driving force is necessary in order to win over individuals and divert them from their (former) path-dependent behavior (Nelson and Winter, 1982). Consequently, strong motivation and incentives are imperative to change an entrepreneurship-unfriendly atmosphere, and a Hungarian version of the Industry-Academia-Research Cooperation Promotion Act can be such a solution. An important lesson from the US and Korean Bayh-dole Acts is that the law allowed universities make their additional income from technology transfer. Based on this new income, universities have enhanced their research capacity (e.g., they can launch their own internal R&D programs to encourage more industry-aligned research). In addition, universities can provide financial incentives for those who greatly contributed to IP licensing. Such incentives and motivations are important drivers encouraging both organizations (universities) and individuals (academic faculty members) to deviate from a current routine and engage in a new technology-transfer-friendly routine. Therefore, policy intervention providing structural incentives is strongly required, and a Hungarian Industry-Academia-Research Cooperation Promotion Act can be the first step in achieving this.
B. Entrepreneurship: Nurture vs. Nature
In the entrepreneurship literature, there has been a debate about the source of personal entrepreneurship in terms of nature vs. nurture: whether the characteristics of an entrepreneur may be able to be learned or are inherited with birth (White et al., 2007). Thus, to promote technology transfer, universities

148�ˍ�2017/18 Knowledge Sharing Program with Visegrad Group
can push current academic faculty members to engage in industry-university cooperation, but alternatively they can recruit a new type of faculty member who is already entrepreneurial and has much experience in industry. The latter will be an ‘industry-academic cooperation professor’ system in Korea. In the Hollywood movie Armageddon, to demolish a comet heading to the earth, it was required to dig a big hole and bury an atomic bomb in the moon, and there were two options for this - whether astronauts learn drilling skills or oil drilling engineers learn space travel skills (see Figure 3-37). In the movie, the decision was made to train oil drilling engineers. This is an imaginary movie synopsis. Yet, there is a thread of connection between the movie and Korea’s attempt, in the sense that both decided to recruit well-prepared external experts rather than pushing current internal members to develop the necessary skill sets. As it takes substantial time for an academic scholar to change his or her behavior, the Korean government introduced the concept of the industry-academic cooperation professor, who will play a facilitator role in grey areas. As they have extensive experience in business, they have comparative advantages in terms of interpreting industrial needs and aligning them with university research. Therefore, they have been important translators for technology transfer and seeds disseminating entrepreneurial culture in universities. However, to accelerate their industry-oriented activities, Hungarian universities must renew their HR and payment system. As shown in <Table 3-5>, many Korean universities established a new HR and payment system for industry–academic cooperation professors and changed a current HR and payment system for academic faculties in a way of promoting for industry-academic cooperation research by giving additional financial incentives. Thus, it is recommended for Hungarian universities to introduce the industry-academic cooperation professor system as well as a renewal of the HR and incentive system.
[Figure 3-37] The Dilemma in the Movie Armageddon
Source: https://en.wikipedia.org/wiki/Armageddon_(1998_film).

Chapter 3 _ Fostering Innovative SMEs: With a Focus on Technology Transfer (Korea)�ˍ�149
C. Various Routes for Technology Transfer: Beyond IP Licensing
The mechanism of technology transfer is very complicated. One of the important practical challenges in technology transfer is that there is no universal formula. As shown in <Table 3-4>, IP plays a vital role in technology transfer, but occasionally it does not play any role, and technology can be even achieved beyond IP licensing. Therefore, it is necessary for the Hungarian government to consider this complicated nature of and various routes for technology transfer. However, because the current Hungarian legal system does not allow public organizations to make profits or spin-off subsidiary organizations, technology transfer beyond IP licensing has not been seriously considered. As in the case of Hungary, Korean law also prohibited universities’ profit-making activities, but the Industry-Academia-Research Cooperation Promotion Act resolved this limitation to technology transfer. Thanks to this law, many Korean universities have established technology holding companies that govern their subsidiary companies or even invest new start-ups. Before this law, universities focused on IP licensing, but now they consider various options - not only licensing but also start-up acceleration and even IPOs (Initial Public Offerings) of invested companies. Consequently, the technology holding company system has enriched the innovation ecosystem in Korea, and this attempt can be also considered as an important policy for Hungary. Thus, if the Hungarian Bayh-Dole Act relaxes regulations in the National Property Act by allowing public universities to do spin-offs or establish technology holding companies, the innovation ecosystem in Hungary will be more vibrant.
D. Nurturing Technology Transfer Experts
If industry–academic cooperation foundation is a hardware embracing all the necessary systems, technology transfer experts will be the software that will operate this hardware. Hungarian TTOs have trouble due to the lack of experienced experts, and this issue has also been raised in Korea. In the long term, it is imperative to nurture experts who understand the technology transfer process and will play a facilitator role not only in universities but also in private companies, particularly in SMEs that lack talented employees. One of Korea’s solutions for this is the establishment of MOT graduate schools. The Ministry of Trade, Industry and Energy initiated the MOT school program in 2010 by providing funds to encourage universities to establish MOT schools. The main goal of the MOT schools is to nurture technology-transfer experts and promote entrepreneurship and industry–university cooperation. Their curriculum is organized based on surveys of private companies and is renewed every two years by reflecting the results of surveys. In addition to academic scholars, MOT schools have recruited industry–university cooperation professors and former CEOs and famous people with work experience and expertise in a variety of fields as adjunct professors to promote business projects as well as

150�ˍ�2017/18 Knowledge Sharing Program with Visegrad Group
practical field-driven education. One of the success factors of MOT schools is that they deal with very trendy issues in multidisciplinary domains. Employees in SMEs hope to study in MOT schools how to develop a new business model and to absorb new trends in technological development. For example, Sogang University MOT started AI (artificial intelligence) coursework in collaboration with IBM Watson. In this course, SME employees learn how to make a new business model using AI recognition technology. With the advent of the era of the 4th industrial revolution, the needs of MOT schools are increasing.
E. Other Government Institution
In the short-term, changes in public university are urgent, but government-funded institution can be considered as being for a mid-long-term policy. As illustrated in Section 3.4, technology transfer can be promoted by public research organizations. To complement the second and third roles of university, the Korean government established GRIs and later introduced various technology-transfer promotion systems, such as the technology holding company and Research Institute Spin-off Company in Innopolis. Although all the Korean experiences cannot be directly transferred to Hungary due to different innovation system and socio-cultural context, some key policies, such as the establishment of GRIs, may well be applied in Hungary (see Vietnam case in Figure 3-38). For example, the Bay-Zoltan applied research center can be reformed as a GRI, and for this it is recommended that the Hungarian government
[Figure 3-38] Agreement of V-KIST Establishment in Hanoi, Vietnam
Source: KIST.

Chapter 3 _ Fostering Innovative SMEs: With a Focus on Technology Transfer (Korea)�ˍ�151
secure and provide stable R&D funding to the Bay-Zoltan applied research center. In this process, the main mission of Hungarian GRIs must be clearly set as a support of innovation in SMEs.
4.2. Policy Roadmap
Promoting technology transfer requires substantial resources and time commitment, which implies that a systematic long-term plan must be designed. In this regard, based on Korean experience, this research attempts to suggest a useful roadmap of technology transfer policy for Hungary (see Figure 3-39).
A. Short-term Policy
The Korean Bayh–Dole Act (i.e., the Industrial Education Enhancement and Industry-Academia-Research Cooperation Promotion Act) was an important turning point encouraging entrepreneurship. This law has become an important legal foundation pushing universities and academic faculties to change their research direction and behavior towards industry. Admittedly, it will take some time to convince academics and achieve a national consensus, but the introduction of this legal system will be a starting point.
B. Mid-term Policy
If the Hungarian government successfully introduces a Hungarian Industrial Education Enhancement and Industry-Academia–Research Cooperation Promotion Act, various follow-up activities, such as the recruitment of industry-university cooperation professors, the reform of TTOs, and the establishment of technology holding companies, can be pursued as mid-term policy. To nurture technology transfer experts and accelerate the new transition in universities, the establishment of MOT schools in a few leading universities can also be considered as an important policy intervention. Further, to enhance absorptive capacity of SMEs and increase their technology-acceptance level, it is necessary to introduce an SME accreditation system. This will be important for the demand-side, in the sense that a one-sided push from supplier-side does not guarantee successful technology transfer.

152�ˍ�2017/18 Knowledge Sharing Program with Visegrad Group
C. Long-term Policy
If short-and mid-term policies are implemented, then the Hungarian government can consider more long-term-oriented policy to enhance the nation’s innovation capacity and address various gaps in technology transfer. In Korean history, the first GRI KIST and the current 25 science and technology GRIs have played an important role not only in promoting technology transfer but also in enhancing Korea’s innovation capacity at the national level. Recently, Vietnam participated in the KSP program ten times and, based on benchmarking through KSP, it successfully launched its first GRI program, V-KIST (see Figure 3-38), with the help of the Korean government. This case can be considered as a long-term policy for Hungary.
In addition, COMPA and a joint technology holding company model (see section 3.4.2) that can make an IP pool based on technologies from multiple universities can be considered as a long-term policy for technology transfer promotion.
4.3. Further Consideration
Although this report provides some policy suggestions based on Korean experiences, it must be admitted that the Korean remedy is not an ultimate solution. Korea has also experienced many challenges and hurdles, which can be important implications for Hungary.
OtherInstitutions
Short-term
Legalfoundation:Hungarian
Bayh-dole Act
Mid-term Long-term
SMEs
University
2019 2020 2021 2022 2023 2024 2025
Introduction of SME accreditationabsorptive capacity enhancement
Industry-universitycooperation professor
Strengthen TTOs
National level R&D fund foraccredited SMEs and tax incentives
Government-funded researchinstitutions(GRIs)
Umbrella cencept TTO andtechnology holding company
Technology holdingcompany Subsidiary companies
Graduate School of MOT: nurturing experts
Various entrepreneurshipplatform
[Figure 3-39] Policy Roadmap
Source: Author.

Chapter 3 _ Fostering Innovative SMEs: With a Focus on Technology Transfer (Korea)�ˍ�153
First, on the government side, the Hungarian Industry-University Cooperation Act must be legislated and implemented by powerful leadership. In Korea, this law was originally initiated by the Ministry of Education. However, in 2007 by government reform, two ministries, Ministry of Education and Ministry of Science and Technology merged to form the Ministry of Education, Science, and Technology (MEST). Because MEST governed the higher education system and allocated national R&D funding, substantial synergy was created in entrepreneurship education and technology transfer. However, in 2013 due to government reform, MEST was divided to the Ministry of Education and Ministry of Science, ICT, and Future Planning. Since then, education policy and innovation policy occasionally did not aligned well and sometimes failed to make synergy effects. Therefore, cooperation among government ministries is an important factor, in the sense that technology transfer in university covers both innovation and education. Owing to this interdisciplinary characteristic, strong government leadership has to be guaranteed for the success of technology transfer.
Second, technology transfer demands substantial time and efforts. As noted by Narula (2004), trust building plays a vital role for innovation cooperation, but dissimilarities in innovation protocol (e.g., time frame, purpose, etc.) hamper trust-building (Kitchell, 1997). Fifteen years have passed since the establishment of the Korean Bayh-Dole Act, and substantial quantitative growth has been achieved in technology transfer (e.g., see Figure 3-10). However, mistrust between industry and academia is still regarded as one of the important impeding factors in technology transfer. There are many reasons for this, such as late response of government policy, complicated administrative process for government funding, but a short time-frame of government R&D funded project is one of the important challenges. Because of the government’s fiscal year system, the project period of many government-funded R&D programs is less than a year, which is for university and industry to establish sufficient trust and reach mutual understanding. Some anecdotal cases suggest that successful cooperation outputs are made through 3-5 year intimate relationships. Thus, it is recommended for the Hungarian government to design some mid-term block funding program for technology transfer promotion.
Third, the Hungarian Bayh-Dole Act will be a first step for technology transfer promotion, but follow-up supports from the government will be necessary. In Korea, many government ministries, such as Ministry of SMEs and Startups (MSS), Ministry of Science and ICT, have designed and implemented various start-up and incubating program. For example, the Tech Incubator Program for startup Korea (TIPs) is one of the representative programs of the MSS. As illustrated in [Figure 3-40], TIPs is designed to identify and nurture the most promising startups with innovative ideas and ground-breaking technologies. In order to support them when they are entering the global marketplace, it appoints and designates successful venture founders – who

154�ˍ�2017/18 Knowledge Sharing Program with Visegrad Group
are now angel investors and leaders of technological enterprises – as their incubators/accelerators. It then offers seamless service encompassing angel investor networking, incubating, mentoring/professional support, and matching R&D funds.
Pay royaltypayments ifthe startup
succeeds
(10% of the R&D fund
provided bythe government)
R&D fund+³(500 million KRW)
(approx.500,000 USD)
Investment(100 million KRW)
(approx.100,000 USD)
Obtain meaningfulequity interest in thestartup businesswith minimalinvestments
Develop and securea portfolio for follow- up investments
Start a businessthat incorporatestechnology andideas with a lowrisk of failurt
At least 60% equityinterest to be heldby the tech startup
Share the risk ofbusiness failurt with the techstartups andinvestors
Promote techstartups andcreate jobs
Equity interestto be held
TIPSPartners
TechStartup Government
[Figure 3-40] TIPs Program
Source: http://www.jointips.or.kr/global/.

Chapter 3 _ Fostering Innovative SMEs: With a Focus on Technology Transfer (Korea)�ˍ�155
References
AHN, J. M., JU, Y., MOON, T. H., MINSHALL, T., PROBERT, D., SOHN, S. Y. & MORTARA, L. (2016), Beyond absorptive capacity in open innovation process: the relationships between openness, capacities and firm performance. Technology Analysis & Strategic Management, 28, 1009-1028.
AHN, J. M., MINSHALL, T. & MORTARA, L. (2018), How Do Entrepreneurial Leaders Promote Open Innovation Adoption In Small Firms? In: W., V., F., F., N., R. & U., M. (eds.) Researching Open Innovation in SMEs. Singapore: World Scientific.
BIS (2011), Business Population Estimates for the UK and Regions [Online]. London: Department for Business Innovation & Skills. Available: http://www.bis.gov.uk/assets/biscore/statistics/docs/b/bpe_2011_stats_release.pdf [Accessed 2012].
CHESBROUGH, H., VANHAVERBEKE, W. & WEST, J. (2014), New Frontiers in Open Innovation, Oxford, Oxford University Press.
CHESBROUGH, H. W. (2013), Open innovation: The new imperative for creating and profiting from technology, Harvard Business Press.
CHOI, D.-S. & JO, Y. (2003), Emprical analysis of R&D tax incentives on internal R&D investment in firms. Korea Technology Innovation Society Conference.
COHEN, W. M. & LEVINTHAL, D. A. (1990), Absorptive capacity: A new perspective on learning and innovation. Administrative science quarterly, 128-152.
DOSI, G. & MARENGO, L. (2007), On the evolutionary and behavioral theories of organizations: A tentative roadmap. Organization Science, 18, 491-502.
EC (2017a), European Innovation Scoreboard. Brussel: European Commission.
EC (2017b), RIO Country Report 2016: Hungary. Brussel: European Commisson.
FAGERBERG, J., MOWERY, D. C. & NELSON, R. R. (eds.) (2005), The Oxford Handbook of Innovation, Oxford: Oxford University Press.
GAVETTI, G., GREVE, H. R., LEVINTHAL, D. A. & OCASIO, W. (2012), The Behavioral Theory of the Firm: Assessment and Prospects. Academy of Management Annals, 6, 1-40.
GREGORY, M. J. (1995), Technology Management - a Process Approach. Proceedings of the Institution of Mechanical Engineers Part B-Journal of Engineering Manufacture, 209, 347-356.
HOFFMAN, K., PAREJO, M., BESSANT, J. & PERREN, L. (1998), Small firms, R&D, technology and innovation in the UK: a literature review. Technovation, 18, 39-55.
HOFSTEDE, G., HOFSTEDE, G. J. & MINKOV, M. (1997), Cultures and organizations, McGraw-Hill New York.
HOLGERSSON, M., GRANSTRAND, O. & BOGERS, M. (2017), The evolution of intellectual property strategy in innovation ecosystems: Uncovering complementary and substitute

156�ˍ�2017/18 Knowledge Sharing Program with Visegrad Group
appropriability regimes. Long Range Planning.
IMD (2015), IMD World Competitiveness Yearbook. IMD.
JONES, O. & TILLEY, F. (eds.) (2003), Competitive Advantage in SMEs: organizing for innovation and change, Chichester: Wiley.
KBIZ (2016), SME Status Indicators 2016. Seoul: Korea Federation of SMEs.
KITCHELL, S. (1997), CEO characteristics and technological innovativeness: A Canadian perspective. Canadian Journal of Administrative Sciences-Revue Canadienne Des Sciences De L Administration, 14, 111-125.
MARTIN, M. (1994), Managing Innovation and Entrepreneurship in Technology-Based Firms, New York, Wiley.
MINSHALL, T., WICKSTEED, B., DRUILHE, C., KELLS, A., LYNSKEY, M. & SIRALIOVA, J. (2008), The role of spin-outs within university research commercialisation activities: Case studies from 10 UK universities. New Technology-Based Firms in the New Millennium, 6, 185-201.
NAMAN, J. & SLEVIN, D. P. (1993), Entrepreneurship and the concept of fit: A model and empirical tests. Strategic Management Journal, 14, 137-154.
NARULA, R. (2004), R&D collaboration by SMEs: new opportunities and limitations in the face of globalisation. Technovation, 24, 153-161.
NELSON, R. & WINTER, S. (1982), An Evolutionary Theory of Economic Change, Cambridge, MA, Belknap Harvard Press.
NSF (2010), Science and Engineering Indicators. In: FOUNDATION, N. S. (ed.). Washington DC: NSF.
OECD (2016), STI OUTlook 2016 country profile. Paris: OECD.
ROTHWELL, R. (1991), External networking and innovation in small and medium-sized manufacturing firms in Europe. Technovation, 11, 93-112.
ROTHWELL, R. & DODGSON, M. 1994. Innovation and size of firm. In: DODGSON, M. (ed.) Handbook of Industrial Innovation. Aldershot: Edward Elgar.
WHITE, R. E., THORNHILL, S. & HAMPSON, E. (2007), A biosocial model of entrepreneurship: The combined effects of nurture and nature. Journal of Organizational Behavior, 28, 451-466.
WON, J. & KIM, J. (2006), A study on the Effect of the Tax Incentive System for the R&D Investment. Korean Industrial Economic Association Journal, 19, 1653-1679.
ZOBEL, A. K. (2017), Benefiting from open innovation: A multidimensional model of absorptive capacity. Journal of Product Innovation Management, 34, 269-288.

Chapter 3 _ Fostering Innovative SMEs: With a Focus on Technology Transfer (Korea)�ˍ�157
Appendix
Local SME Support Cases of Sogang University
A. Collaboration with a Local Bakery
SURBDF TTO identified collaboration needs from a local bakery that aimed to develop rice-based bread. In 2015, SURBDF TTO made a match for this bakery with a Sogang Business School professor who provided research material for a rice-based bread market feasibility evaluation. In 2016, SURBDF TTO made a second match with a mechanical engineering professor. Thanks to this collaboration, the bakery developed a special ricotta cheese for rice-based bread. In 2017, SURBDF TTO made a third match with a bioscience professor to develop a freeze-drying technology for rice fermentation species (see Appendix Figure Ch 3-1). SURBDF TTO also provided a research fund (10,000 USD) which enabled this bakery and the bioscience professor to develop a special freeze-drying device for the rice fermentation species. The bakery and the bioscience professor are preparing an application for an external collaborative research project funded by the Korean government agency.
B. New Business Creation for a Non-R&D Company
The CEO of a local printing company searched for a new business opportunity, because he recognized a decline of the traditional printing industry. Since 2014, the company and SURBDF TTO had idea meetings to identify appropriate business domains. After reviewing many business items (56 manufacturing and 18 service industries), the company decided to expand its business to the digital contents and publication area, which can be connected to
[Appendix Figure Ch 3-1] Local Bakery and its Pilot Device Concept
Source: SURBDF TTO.

158�ˍ�2017/18 Knowledge Sharing Program with Visegrad Group
the current business. Although the company has no experience in R&D, the CEO strongly wanted to transform it. SURBDF TTO made a match with a Sogang University computer engineering professor who provided image search algorithm technology. Thanks to this research collaboration, the company developed a design contents search and IP protection technology for the open market, which enabled the company to expand its business domain from traditional printing to digital contents distribution (see Appendix Figure Ch 3-2). For further technology development, the company and the professor applied for the government R&D funding and they successfully secured 380,000 USD. SURBDF TTO earned 50 thousand USD for a technology transfer fee from the company.
C. Development of AI Chat-bot Technology
The needs of the company were identified in the Sherpa Program in 2016. The company wanted to upgrade the current human-based chatting secretary service to an artificial intelligence (AI) chatting service. Thus, SURBDF TTO made a first match with a professor in computer engineering department who developed a natural language processing algorithm; however, the initial attempt did not make good results due to low interest and weak engagement from the professor. To cope with this problem, SURBDF TTO made a
Search
Search Algorithmwith Data Protection
Digital Open Market
Upload Digital Contents
Fee Fee
UserFreelancer Graphic Designer
Download
[Appendix Figure Ch 3-2] New Business Creation Case
Source: Sogang University, Author.

Chapter 3 _ Fostering Innovative SMEs: With a Focus on Technology Transfer (Korea)�ˍ�159
second match with another professor and requested an industry–university cooperation professor to be engaged in the entire technology transfer process as a facilitator. Thanks to strong involvement of the matched professor and active orchestration of the industry–university cooperation professor, the company successfully developed an AI-based conversation system. Based on Natural Language Understanding (NLU) and Natural Language Generation (NLG) technology, this system analyzes the meaning of customer messages and creates optimized responses automatically. The company secured 100,000 USD R&D funding from the Korean Ministry of SMEs and Start-ups (MSS) and was chosen as a best R&D collaboration project by MSS.


Chapter 42017/18 Knowledge Sharing Program with Visegrad Group: Innovation Policy for SMEs in the Era of Industry 4.0
Fostering Innovation in SMEs:Focus on Technology Transfer
in Hungary (Hungary)
���*OUSPEVDUJPO
���$VSSFOU�4UBUVT�BOE�1PMJDZ�*TTVFT
���$PODMVTJPOT�BOE�1PMJDZ�*NQMJDBUJPOT

162�ˍ�2017/18 Knowledge Sharing Program with Visegrad Group
SummaryKnowledge transfer has been and remains a significant issue in Hungarian RDI
policy. It plays a key role in connecting knowledge producers such as academia and non-profit research institutions with knowledge-intensive manufacturing and service activities, whether in the automotive industry, healthcare services, or telecommunication. However, there are major challenges and barriers to overcome: Knowledge transfer has always been and is still seen by stakeholders as underachievement. Bodies (e.g., tech transfer offices) that were created to support knowledge flow are only partly able to work as efficient platforms between potentially interested parties. Among others, these are considered important causes that have led to Hungary’s relatively unfavorable situation in the international race. The national RDI policy places a distinct emphasis on enhancing knowledge transfer. The dedicated programs of the National Research, Development, and Innovation Office have the aim of fostering industry-academia cooperation and knowledge flow and have key important roles in this respect. The next step is the recent mid-term assessment and renewal of the National Research, Development, and Innovation Strategy (2013-2020) is an important step forward that highlights transfer activities as a key priority for the future. The experiences gained through the 2017/18 Korea-V4 Knowledge Sharing Program will have a catalyzing effect on this process.
Fostering Innovation in SMEs:Focus on Technology Transfer in Hungary (Hungary)
Márton Pete (National Research, Development, and Innovation Office, Hungary)
乇#Chapter 04

Chapter 4 _ Fostering Innovation in SMEs: Focus on Technology Transfer in Hungary (Hungary)�ˍ�163
1. IntroductionConnecting the activities of knowledge production with knowledge intensive
economic branches is a key factor in enabling the development of new or significantly improved products and services. Knowledge transfer usually involves intersectoral exchanges. Knowledge production is still mostly carried out by state-run universities and public research institutes, while knowledge-intensive manufacturing and service activities are predominantly carried out by private firms such as multinational companies, small and medium enterprises, or even start-ups.
However, networking between sectors is loaded with burdens that hamper the efficient transfer of knowledge between potential partners. Therefore, the flow of knowledge between RDI activity participants requires constant support by RDI policies. As will be shown in this study, the assessment and renewal of the National Research, Development and Innovation Strategy (2013-2020) plays a significant role here.
This study briefly presents these recent shifts in domestic RDI policy priorities and the analysis of the current state-of-play of knowledge transfer in Hungary. The main trends and changes in recent years are also to be displayed and conclusions are to be drawn.
�����7RSLF�,GHQWL¿FDWLRQ
This study’s main focus is knowledge transfer or in other words, knowledge flow. “Knowledge flow” was defined by the National Research, Development, and Innovation Strategy (2013-2020) as the “diffusion of the accumulated knowledge in the institutional and corporate network and in the broader economy for the purpose of maximum utilization. The knowledge can be transferred in an easier or more difficult way based on the codified or tacit nature of knowledge” (Ministry for National Economy 2013, p.75). Together with knowledge bases and knowledge utilization, knowledge flow is one of the three main pillars of Hungary’s RDI system (Ministry for National Economy 2013, p.23). Nevertheless, this same strategic paper reveals that a series of shortcomings have been identified in this field, which appear as a weakness in the domestic RDI system. Knowledge transfer should play a key role in connecting knowledge producers such as academia and non-profit research institutions with knowledge-intensive manufacturing and service activities, whether in the automotive industry, healthcare services, or telecommunication. However, knowledge transfer has been and is still seen by stakeholders as underachieving and bodies created to support knowledge flow are only partially able to work as efficient joint platforms between potentially interested parties. This is all considered one of the most important causes of Hungary’s relatively unfavorable situation in

164�ˍ�2017/18 Knowledge Sharing Program with Visegrad Group
international competition. In this sense, knowledge transfer has been a target of interventions in recent years, which are to be dealt with in detail as follows.
1.2. Research Design
This study is predominantly based on literature review. Reports and studies of the Hungarian RDI system—along with the relevant strategic documents about domestic policy—are to be analyzed in detail. The focus is set on the findings on the flow of knowledge between stakeholders in the RDI system, its channels, intermediaries, transfer mechanisms, and environment, along with potential and already-implemented initiatives for the enhancement of knowledge transfer and best and worst practices. This study intends to trace a timeline of the evolution of knowledge transfer as an area of intervention in successive strategies. This should reveal progress made in this field and the efficiency of interventions, and the adequacy of policy instruments should be assessed.
The literature review is planned to be completed through a statistical analysis of relevant facts and figures.
2. Current Status and Policy Issues
2.1. Background
Technology transfer is per definition a process of sharing skills, knowledge, technologies, and methods to develop and exploit technology in new products, processes, applications, materials, and services.
Technology transfer does not exist without knowledge transfer, which covers a range of activities that support collaborations between universities, businesses, and the public sector.
Technology Transfer processes can be classified into several categories:
A. International/regional technology transfer: Knowledge and technologies are transferred either across national boundaries or between regions.
B. Cross-industry or cross-sector technology transfer: Knowledge and technology are transferred from one industry sector to another and from industry to commerce.
C. Inter-firm technology transfer: Knowledge and technology are transferred from one firm to another in the same sector.

Chapter 4 _ Fostering Innovation in SMEs: Focus on Technology Transfer in Hungary (Hungary)�ˍ�165
D. Intra-firm technology transfer: Knowledge and technology are transferred inside a firm from one location to another or between different units.
E. University–firm technology transfer: Knowledge and technology transfer takes place between a university and firm or the university establishes a spin-off company to commercialize R&I results.
When discussing channels of knowledge and technology transfer, the following eight channels should be considered the main ones:
A. Internal R&D: A company relies on its own human and technical resources to develop technology in house (e.g., GE, AT&T, and Du Pont have their own laboratories in which they develop new technology).
B. Sub-contracting: A company gets technology developed from outside the organization (such as R&D laboratories, technical institutes, manufacturing organizations, experts, etc.)
C. Licensing: The receiver purchases the rights to utilize someone else’s technology.
D. Franchise: A form of licensing with continual support of the receiver (marketing support, raw material supply, training, etc.)
E. Joint Venture: Two or more entities combine their interests in a business enterprise (they share knowledge and resources to develop technology, produce products, or use their respective expertise to complement each other).
F. Turnkey projects: A country buys a completed project from an outside source and the project is designed, implemented, and delivered ready to operate.
G. Foreign Direct Investment (FDI): A multinational firm decides to produce products or invest resources overseas.
H. Technical consortium and joint R&D projects take place between two countries or two conglomerates where they combine their technical and financial resources to develop expensive technology.
When realizing technology transfer, the technology need should first be identified and the sources of technology should then be identified. Identifying the sources of technology means that a company identifies the sources from which the required technology can be acquired, the mode of transfer, the choice of potential partners, clients, and typical agreements. After the technology need and sources of technology have been identified, the technology should be evaluated, during which a company evaluates the price of technology including what guarantees are offered, training, R&D and marketing support, buyback arrangements, intellectual property, packaging, the quality and efficiency of technology, payment terms, etc. Finally, negotiations should be conducted and an agreement should be achieved.

166�ˍ�2017/18 Knowledge Sharing Program with Visegrad Group
2.1.1. The Situation of Technology Transfer in Hungary
The overall level of innovation in the Hungarian economy is rather low compared to the European average. This is expressed by the fact that SMEs introduce few products or process innovations. The performance of SMEs in terms of product or process innovations1) in Hungary is among the poorest across all indicators of the European Innovation Scoreboard (EIS). This share was 15.1%, which is far below the EU average of 30.9% in 2017 (European Commission, 2017b).
The persistently low share of innovative enterprises is a structural challenge. Regarding the share of SMEs that innovate in-house, it can be stated that “even though these innovative entities might engage in active collaboration with scientific organizations, the occurrence of such partnerships across the broader business sector is limited” (European Union, 2016). This figure stood at 11.7% against the EU’s average of 28.8% in 2017 (European Commission, 2017b). This was also manifested in the fact that the few innovative Hungarian companies that generated patents mostly did so based on in-house research rather than through collaborations with universities or units of the Hungarian Academy of Sciences’ research network (European Union, 2016).
1) This indicator reflects the number of SMEs that have introduced at least one new product or process to one of their markets. Source: European Innovation Scoreboard 2017 – Methodology Report, p.15.
Strategicapproach
toinnovationpolicy for
SMEs
Promote TechnologyDissemination
Foster TechnologyCooperation to Develop
R&D focused onCommercialization of
Knowledge
PromoteClusters and
BusinessNetworks
Finance and Technology
Development
Informationon
innovationsupportservices
Standardscertification Incubators
Technologysuport in
Universities, R&D Labs
andIncubatorswith SMEsLinkages
IntellenctualProperthRights(IPRs)
System
Sciences/industrial
parkscompetitive
chustersand
facilities(agglomera
-tion)
FinancialIncentives
andLevies
PublicR&D
grants
Broadbandinfrastructure
to supportsmooth
commectionand
coor dinationof knowledge
flows inchuster
[Figure 4-1] F rames for Technology and Technology Transfer
Sources: ERIA and OECD (2014), http://www.eria.org/Key_Report_FY2012_No.8_chapter_5.pdf.

Chapter 4 _ Fostering Innovation in SMEs: Focus on Technology Transfer in Hungary (Hungary)�ˍ�167
The share of innovative SMEs that collaborate with others2) was 6.2% in 2017, which is significantly lower than the EU average (11.2%). This concentration of cooperation clearly hinders the enhancement of science-industry cooperation and technology transfer. “SMEs rarely engage in deeper, commercially-driven and mutually beneficial collaboration with knowledge providers including universities and the Hungarian Academy of Sciences, even though statistics confirm the occurrence of some forms of cooperation” (European Union, 2016).
2) Number of SMEs with innovation co-operation activities, i.e. those firms that had any co-operation agreements on innovation activities with other enterprises or institutions in the three years of the survey period. Source: European Innovation Scoreboard 2017 – Methodology Report, p.16.
RO
60.0
50.0
40.0
30.0
20.0
10.0
0.0
1.000
0.900
0.800
0.700
0.600
0.500
0.400
0.300
0.200
0.100
0.000
Indi
cato
r
Norm
alised Scores
Indicator Normalised Scores
UA LV PL BG HU SK EE ES IL HR MT RS SI CZ EU TR UK IT CY LT EL DK FR LU MK SE AT NO DE PT NL FI IS IE CH BE
[Figure 4-2] SMEs with Product or Process Innovations
Source: European Union (2016).
RO PL LV BG MK HU SK ES EE UA UK HR IL TR MT PT SI RS CZ DK EU LT CY IT EL FR LU AT NL SE NO DE FI BE IE CH
45.0
40.0
35.0
30.0
25.0
20.0
15.0
10.0
5.0
0.0
1.000
0.900
0.800
0.700
0.600
0.500
0.400
0.300
0.200
0.100
0.000
Indi
cato
r
Norm
alised Scores
Indicator Normalised Scores
[Figure 4-3] SMEs Innovating In-house
Source: European Union (2016).

168�ˍ�2017/18 Knowledge Sharing Program with Visegrad Group
2.1.2. Main Findings of the Peer Review of the Hungarian Research and Innovation System Related to Technology Transfer3)
The Policy Support Facility of the Horizon 2020 Program is a tool set up by the European Commission that supports EU Member States improving the design, implementation, and evaluation of national research and innovation policies.
The Peer Review, which was prepared within the framework of the Policy Support Facility, is a new initiative of the European Commission to support Member States in developing, implementing, and assessing RDI policies. The process which can be launched on a voluntary basis, supports decision-makers of Member States concerned with reforming and further developing their RDI policies and provides advice for the assessment of national RDI strategies, programs, and institutional systems and for identifying key areas for development.
The predecessor of the National Research, Development, and Innovation Office requested that the Peer Review Process was carried out in Hungary. It started in 2015 with the pre-peer review, followed by the Peer Review in 2016 when two country visits had taken place and resulted in the publication of the final report in September 2016.
3) European Union (2016), Peer Reviews of the Hungarian Research and Innovation System, Brussels
UA RO LV BG PL MT HU TR ES IT HR PT SK RS CH LU MK CZ DE EE EU CY IL SI FR DK SE IE EL LT FI NL NO AT IS UK BE
35.0
30.0
25.0
20.0
15.0
10.0
5.0
0.0
1.000
0.900
0.800
0.700
0.600
0.500
0.400
0.300
0.200
0.100
0.000
Indi
cato
r
Norm
alised Scores
Indicator Normalised Scores
[Figure 4-4] Innovative SMEs Collaborating with Others
Source: European Union (2016).

Chapter 4 _ Fostering Innovation in SMEs: Focus on Technology Transfer in Hungary (Hungary)�ˍ�169
�������7KH�0DLQ�2EVWDFOHV�,GHQWL¿HG�E\�WKH�3HHU�5HYLHZ�LQ�WKH�$UHD�of Technology Transfer in Hungary:
As the Peer Review pointed out, interactions between science and industry show a mixed picture and Technology Transfer Offices still have limited relevance across the system. In addition, the administrative procedures and governance processes of universities remain an obstacle to broad and open inter-sectoral cooperation.
Government decree No. 395/201532, which lists the criteria for assessing the performance of individual researchers in their scientific careers, does not offer incentives to engage in industry collaboration or technology transfer.
Although there are cases of science-industry collaboration, technology transfer, and academic spin-offs, they are not fully integrated into companies’ commercial activities and did not result from systematic policy efforts.
According to stakeholders, the dual character of Hungary’s business sector inhibits progress towards more active science-industry cooperation and technology transfer. Multinational companies rarely use Hungary’s output R&I system, while domestic companies rarely engage in deeper cooperation with universities and the Hungarian Academy of Sciences. In addition, the need for technology transfer and research commercialization is still not fully recognized by university leadership. Therefore, the commercial exploitation of public research results—including through knowledge transfer and spin-off creation—remains limited. There are no uniform standards for TTO operations, procedures or methodologies when managing contracted R&D projects, technology transfer, or spin-off creation.
The Peer Review presents various recommendations for overcoming these barriers. One recommendation says that cooperation between universities, public research organizations, and industry—including at the level of individual entrepreneurs—should be further promoted through targeted means.
These can include: (1) dedicated grant programs to foster the mobility of researchers to industry and vice versa and closer-to-market-oriented research; (2) the provision of appropriate physical infrastructure (e.g. shared laboratories, incubators, accelerators, science parks, and innovation clusters); (3) the introduction of transparent and adequate incentives for intersectoral mobility including adequate appointment and promotion criteria in the public sector to recognize the value of business exposure for researchers; (4) the involvement of private-sector representatives in the governance of public-sector R&I performers; the promotion of knowledge transfer programs at the institutional and system level.

170�ˍ�2017/18 Knowledge Sharing Program with Visegrad Group
According to another recommendation, the design of support measures intended to stimulate science-industry cooperation should take into account the lessons learned from past experiences and from existing policy actions, including the results of the independent evaluations of programs and the views of stakeholders (both beneficiaries and non-users of these support measures).
Equally, Hungary should learn from successful European schemes that support science–industry cooperation. National support schemes for science-business cooperation should undergo regular impact evaluations to promote their further incremental improvement.
These recommendations of the PSF Peer Review have been taken into account when the new RDI programs of the NRDI Office have been elaborated; the following chapter introduces some of these programs.
�����&XUUHQW�6WDWXV�LQ�9DULRXV�$VSHFWV
�������1DWLRQDO�5HVHDUFK��'HYHORSPHQW��DQG�,QQRYDWLRQ�2I¿FH�DQG�Programs Related to Technology Transfer
Frequent changes in the institutional set-up of the Hungarian RDI system over the past two decades have been a major difficulty in reaching long-term strategic objectives. The need to tackle this issue and provide a stable background for RDI policy planning and implementation eventually led to the establishment of the National Research, Development, and Innovation Office (NRDI Office) in January 2015. This office has been charged with the government-level coordination of research and innovation policies and with providing a stable institutional background for transparent and excellence-based domestic RDI funding. This includes strategy planning and the programming of all major financial constructions that target the research objectives, including development and innovation activities. Consequently, the NRDI Office’s program portfolio embraces the innovation chain in its entirety from basic research through applied and experimental research to the commercialization of innovative products and services. Support targets three main pillars: business RDI activities; collaboration between enterprises and research institutes, higher education, and technology transfer activities; and research infrastructure ('ĘU\, T., Csonka, L., Slavcheva, M. 14).
Supporting cooperation between businesses and academia while also enhancing transfer activities between them has been a core priority of Hungarian STI policy. Accordingly, a growing number of positive project outcomes such as corporate research centers and R&D labs that are predominantly run by multinational companies have engaged in joint work with academic partners. In parallel, several

Chapter 4 _ Fostering Innovation in SMEs: Focus on Technology Transfer in Hungary (Hungary)�ˍ�171
RDI incentives such as new financial constructions and institutional frameworks have been set up to support these partnerships. Recent measures that aim to support science-industry collaboration and technology transfer activities include:
$��&RPSHWLWLYHQHVV�DQG�([FHOOHQFH�&RRSHUDWLRQ�3URJUDP
Since 2015, around Ft150 billion HUF (around 482 milion EUR) has been made available for consortia consisting of business enterprises, research centers and higher education institutions for implementing new digital production technologies, agricultural innovations, and biotechnology development projects.
The schemes supporting these above target settings are grouped into a twofold structure. Some calls primarily emphasize basic research activities; accordingly, these enable both public, private, or non-profit research institutions and enterprises to act as a consortium leader. Three major calls are listed here. GINOP-2.2.1-15 is financed by the Economic Development and Innovation Operational Program and is therefore only available for applicants based in convergence regions (i.e., all Hungarian regions except Central Hungary). As its mirror schemes, VEKOP-2.2.1-16 and NVKP_16 both target the Central Hungary region and thus extend the territorial scope of the same policy instrument and enable full coverage of Hungary’s territory. VEKOP-2.2.1-16 is financed from the Competitive Central Hungary Operational Program (i.e. community support), while the National Competitiveness and Excellence Program (NVKP_16) is based on domestic resources that are allocated from the NRDI Fund.
In contrast, Competitiveness and Excellence Cooperation calls (VKE_17, 2018-1.3.1-VKE) focus more explicitly on applied research and experimental product development activities that are expected to result in marketable outcomes. By virtue of their market-oriented nature, these calls only allow market actors to undertake the role of consortium leader to submit project proposals. Similar to NVKP_16, this funding scheme is also financed from the NRDI Fund.
Apart from these, the National Excellence Program (NKP_17; 2018.1.2.1-NKP) has been launched to facilitate the social and economic utilization of discovery research findings by defining strategic areas in which Hungary has a sufficient level of scientific excellence for implementing tasks, so that such goals can be reached faster and more efficiently.
The call is open for the consortia of research and knowledge-dissemination organizations and businesses to submit project proposals involving research activities that address large-scale interdisciplinary scientific and technological challenges that, due to their comprehensive nature and volume, are implemented in long-term cooperation between scientific, industrial, and social stakeholders and decision-makers.

172�ˍ�2017/18 Knowledge Sharing Program with Visegrad Group
These above programs have had various different thematic focuses over the years as listed below:
In 2016:s Leading mortality causess Ecologys Material sciences
In 2017:s Development of digital production technology s Agri-innovation and biotechnology projectss National Brain Research Programs National Quantum Technology Program
In 2018:s Research related to ELIs Artificial Intelligences Securitys Water efficiency and water safetys Protein research
B. Supporting Innovation in International Cooperation
This category encompasses a wide range of calls for proposals covered by the project portfolio of the NRDI Office that targets the implementation of RDI projects or the enhancement of mobility and networking on an international level. Since 2015, around Ft15 billion HUF (roughly 48 million EUR) has been allocated to such purposes. Several of the included financial instruments promote Hungarian participation in programs and initiatives related to Horizon 2020 or other multilateral programs such as EUREKA and program-based bilateral R&D cooperation projects with several countries (e.g., India, China, Vietnam, Israel, Turkey, and Russia). It must be admitted that although all these calls for international cooperation are expected to contribute to the flow of knowledge, they are primarily performed between domestic and foreign participants. Although exchanges also occasionally occur in intersectoral terms, they do not a general rule.
C. Higher Education–Industrial Cooperation Centers (HEICC, in Hungarian: FIEK)
The main objective of this initiative is linking up RDI capacities at public and non-profit research institutions with the financial and human resources of market actors to enhance the creation and marketization of innovative products and services. In 2016, five HEICC projects from Hungarian convergence regions were deemed eligible for funding in the framework of the Economic Development and Innovation Operational Program (GINOP-2.3.4-15 scheme). A mirror project scheme has been

Chapter 4 _ Fostering Innovation in SMEs: Focus on Technology Transfer in Hungary (Hungary)�ˍ�173
set up for Central Hungary on the basis of the NRDI Fund (FIEK_16) which enabled the establishment of three further HEICCs in the capital city region. Centers at convergence regions have been awarded with F27 billion HUF (ca. 87 million EUR), while HEICCs in Central Hungary received Ft8 billion HUF (25.7 million EUR) in total.
Cooperation Centers are expected to act as permanent platforms of knowledge flow with skilled staff and dedicated budgets, and would be able to harmonize what academic and non-profit research organizations on the one hand and market actors on the other hand can invest in and benefit from in joint work.
The figure below shows the budget distribution of programs that support knowledge transfer purposes in Hungary for 2015-2017.
[Figure 4-5] Higher Education and Industry Cooperation Centers in Hungary
Source: NRDI.

174�ˍ�2017/18 Knowledge Sharing Program with Visegrad Group
2.2.2. Steps to Foster Knowledge Flow
Further steps have also been taken to enhance the flow of knowledge between different sectors. In March 2016, the Ministry for National Economy released the 2016-2020 Industrial Development Strategy (Irinyi Plan in common use) with the aim of further increasing the share of manufacturing in the Hungarian GDP through the dedicated support of seven key industries: vehicle and special machine production, the green economy, ICT hardware production, the health and food industries, and the defense industry. This targeted development of the industrial sector makes further demands on the enhanced cooperation of public and non-profit research institutes with companies. For such purposes, governmental programs that support the strengthening of business RDI capacities and start-up and high-tech innovation ecosystems have also been elaborated (Ministry for National Economy, 2016).
In June 2016, the Ministry for Human Capacities and the Hungarian Academy of Sciences signed an agreement to deepen cooperation between the Academy and higher education institutions through different paths such as the establishment of joint research groups and shared access to research infrastructures among others.
Nevertheless, knowledge transfer in Hungary still faces significant burdens that have only partially been tackled by the above initiatives. The next chapter enumerates some of the most significant obstacles in detail.
(Unit: million EUR)
600
500
400
300
200
100
0R&D Competitiveness
and Excellence Cooperation
482
Supporting Innovation inInternational Cooperation
48
Higher Education-IndustrialCooperation Centers
(HEICC/FIEK)
112.7
[Figure 4-6] Financial Instruments that Support Knowledge Transfer Purposes in Hungary, 2015-2017
Source: NRDI.

Chapter 4 _ Fostering Innovation in SMEs: Focus on Technology Transfer in Hungary (Hungary)�ˍ�175
2.2.3. Key Challenges and Barriers in Hungary
The pursuit of the enhanced flow of knowledge saw the foundation of a wide range of new institutionalized bodies that aim to focus on knowledge transfer tasks. A series of innovation intermediary bodies such as regional innovation agencies and university technology transfer offices were established in recent years; however, in most cases attempts to bring about the necessary cultural shift and overcome old attitudes was inadequate. They were neither capable of reaching a critical mass in size and specialization nor properly strengthening their role within their home institution. This is largely because they lacked their own eligible financial assets; partnerships usually remained active until they ran out of public funding. Therefore, sustainability is a real challenge for these initiatives, which can be attributed to the lack of longer-term financial and/or professional vision or commitment. Accordingly, the lifecycle of business–academia partnerships is usually relatively short (1-2 years) and mainly focused on one-off developments or problem-solving (DĘry, T., Csonka, L., Slavcheva, M., p.12-13). Partnerships are not necessarily based on the mutual interest of participating parties but much more on short-term advantages such as external funding opportunities for universities and a cheap—though skilled—labor force for market actors. This opportunistic manner of thinking is deeply rooted in the wider Hungarian social context in which economic and social institutions and environments have not always enjoyed long-term stability in the country’s history; this barrier caused by short-term thinking is yet to be overcome.
The burdening effects of frequent changes in the institutional set-up of the Hungarian R&I system over the past decades was supposed to be tackled through the establishment of the NRDIO in January 2015 and the centralization of all major R&I
TTO’s financial problems
Entrepreneurial transformation: no interest and energy
SMEs can not become suppliers
University structures are incentives for publication not for patent protection
Partnerships last until they run out of public funding
Technology transfer is not a priority for the university management
[Figure 4-7] The Main Barriers Identified in Hungary
Source: Author.

176�ˍ�2017/18 Knowledge Sharing Program with Visegrad Group
resources under the new office with the aim of speeding up and simplifying access to RDI funding resources. However, it should be noted that in the cases of the Economic Development and Innovation Operative Program (EDIOP) and the Competitive Central Hungary Operational Program (CCHOP), responsibility for the preparation of funding decisions and contracting was held by the Ministry for National Economy as a Managing Authority. The procedure often takes precious time and thus occasionally discourages potential applicants from submitting proposals.
Another important issue related to the relative weakness of knowledge transfer is the lack of growth and internationalization ambitions among Hungarian firms. Even though Hungary has made significant steps forward in becoming one of the manufacturing centers of the European vehicle industry with prominent international players (e.g. Suzuki, Audi, and Mercedes-Benz) as well as their suppliers having established manufacturing capacities in the country, only a few of them have raised strong demand that domestic RDI services be delivered by Hungarian SMEs and public institutions. This phenomenon is also true in other branches that are dominated by multinational companies such as the pharmaceutical industry, information and telecommunication technologies, and electrical engineering. Some companies have launched their own research and technology centers in Hungary, while others still rely on the RDI capacities of their parent companies; very few of them have established firm links with academic and non-profit research institutions. Furthermore, the interchange of personnel between companies and academic institutions is not widely practiced (DĘry, T., Csonka, L., Slavcheva, M., p.13). This result is partly due to the lack of longer-term funding for such initiatives and also because academic promotion remains largely based on publication output rather than innovation and patenting activities. Staff mobility is more likely unidirectional toward the market sector, mainly because of the low salaries involved in public research. The loss of experienced staff both in terms of researchers and administrative workers is a perpetual problem.
2.3. Strategic Responses
The most recent set of aligned responses for the challenges that Hungarian RDI policy must face has been elaborated in the wake of the mid-term evaluation and renewal of the National Research Development and Innovation Strategy 2013-2020. The assessment of the applicable strategy was launched in May 2017 and the conclusions drawn from the situational analysis brought about the necessity of completely rethinking the strategic direction along with the means of intervention. The renewed strategy was released for public consultation in January 2018 and the final version has been scheduled for government approval in March 2018 (National Research, Development, and Innovation Office, 2018).

Chapter 4 _ Fostering Innovation in SMEs: Focus on Technology Transfer in Hungary (Hungary)�ˍ�177
The renewed strategic document placed increased emphasis on the issue of knowledge transfer among other things. As the situation analysis reaffirms, the flow of knowledge is barely efficient. While multinational companies have implemented significant investments in recent years to enhance their R&D capacities and the BERD/GDP ratio has also seen a remarkable rise—growing from 0.4% of the gross domestic product in 2005 to 1.0% in 2015—other participants in the RDI system such as public and non-profit research institutions or SMEs have seemingly benefited very little from this development. Public research institutions still rely heavily on state budget allocations, the volume of which has shown a declining trend (at least in real prices) in recent years; meanwhile, working for market demand at academic institutions and thus securing additional financing is still slightly exploited. Although growing interest has been shown by public research institutions and market actors for joint work in recent years, both sides still face difficulties in finding common interests and objectives. At public research institutions, scientific performance is still overwhelmingly measured in terms of publications and (to a minor extent) invention activity, while the first and foremost objective for market actors is the adaptation and marketization of innovation outcomes. Although these are successive elements of the same innovation chain, establishing the linkage between them is hampered by constraints based on administrative and human resource problems. The former one here is due to the centrally regulated and largely hierarchical structure of public research institutes, which often makes them inflexible when trying to cooperate with non-academic actors; the long duration of the administrative workflow is a significant burden that takes into account that time factors are key for competitive market actors. The latter covers the lack of managerial skills for a large share of scientific staff that show excellence in research activities but are generally less capable of contemplating what users and/or consumers need.
The renewed strategy gives an encompassing overview of the recent state of the art of knowledge transfer in Hungary. As of this overview, the most important features in the Hungarian RDI system in the context of knowledge transfer are as follows:
s The willingness of innovative SMEs to cooperate with other companies decreased by 15% between 2010 and 2015, but increased by 5.7% in 2016 (European Commission, 2017).
s The volume of patent registrations has stagnated since 2010 at around 600-700 per year and the number of applications under consideration (PCT and domestic registration in total) has reduced by two thirds (Hivatal, 2016; Hivatala, 2016). Patents generated by companies are mostly based on their in-house research, not through collaborations with universities or HAS (European Union, 2016).

178�ˍ�2017/18 Knowledge Sharing Program with Visegrad Group
s The rate of the private co-funding of public R&D expenditures has declined by about 70% since 2010 (Hivatal, 2016), which is clearly in line with the shrinking share of domestic sources and stands out compared to the EU average Hivatal, 2016).
A more detailed analysis that introduces the strengths and weaknesses of knowledge flow in Hungary is performed in Section 2.4.
Besides knowledge production and knowledge use, the renewed strategy identifies knowledge flow as one of three major priority areas. The long-term overall strategic objective in this area is set as the promotion of transparent and stable partnerships. In this sense, the share of knowledge is expected to be performed on the basis of trust to enable participants from different sectors to harmonize their goals and become able build powerful and long-lasting partnerships rather than ad hoc cooperation on projects. The overall strategic objective is further translated by the document into specific objectives.
Specific objective no. 1 targets the motivation of the intersectoral mobility between the spheres of basic research and experimental development. Thus, industrial and academic career tracks are expected to become more penetrable and staff members are enabled to be equipped with multiple skills.
Specific objective no. 2 promotes knowledge transfer within the industry–research–university triangle. This is to be reached by developing intangible assets such as trust, common approaches, and interest systems on the one hand and support the establishment and fine tuning of joint platforms such as excellence centers and innovation nodes on the other hand.
Understanding each other’s work culture;establishing personal contactsGood and positive practices in
knowledge flow, strengthening“greenfield” cooperations betweenuniversities and companies
CHALLENGES CONTENTS
At the same time, the mobilitybetween the players of NIS, the transitionbetween the industrial and academiccareer and the transit between thevarious sectors(re-training, mobility) isproblematic. To this end, regulation(e.g. labour) should also be
reviewed.
Fostering mutual learning: researchers gainknowledge of the cutting-edge practicesand achievement of the sector concerned, whilethe company gains access to the knowledge produced at universities, academic institutions andother research organisations.
[Figure 4-8] Objective: Fostering Researchers’ Inter-sectoral Mobility
Source: NRDI.

Chapter 4 _ Fostering Innovation in SMEs: Focus on Technology Transfer in Hungary (Hungary)�ˍ�179
Specific objective no. 3 aims at the systematic introduction of open innovation. This embraces the sharing of scientific output and research results among the actors in an RDI system. Open access has a crucial role in this respect; therefore, the elaboration of an open access strategy is highly recommended.
Specific objective no. 4 suggests the adaptation of effective knowledge and technology transfer models. Both foreign and domestic best practices may serve as models for enhancing the use of state-funded research outcomes in the entrepreneurial sector. This necessitates the mutual introduction of R&D capacities and market needs.
Specific objective no. 5 targets the reinforcement of intellectual property protection. The question of intellectual property rights is a sensitive issue in both state-funded Hungarian R&D activities and in public–private RDI partnerships. Rethinking the current legal regulations and raising awareness of patent activities are the most important steps forward.
Specific objective no. 6 promotes efficient participation in EU-level and global knowledge transfer as the likely decrease of community funds after 2020 forces actors in the RDI system to search for new funding opportunities. A shift toward EU-level and global large projects has been an important trend in recent years, which is expected to continue in the near future. Therefore, preparing Hungarian RDI actors to join such projects is essential.
Specific objective no. 7 aims to support multi-disciplinary research activities. The constant development and compoundable technologies necessitate the cooperation of different research areas; this need is even greater in Hungary where the relatively
Preparing a cross-cutting open access strategy.Access to previous scientific informationis a precondition for any research andimprovement.
CHALLENGES CONTENTS
Several significant international research projects are implemented in networks, with mutual access to open information assets.
Regulatory environment suporting open innovationin order to foster knowledge flow among companies.
Access to the national information assets
Free availability of and open access to new scientific advances provided for SMEs and the interested population (stakeholders)
The introduction offers huge economicpotential
[Figure 4-9] Objective: Introducing the Open Innovation System
Source: NRDI.

180�ˍ�2017/18 Knowledge Sharing Program with Visegrad Group
small size of independent research areas and market branches is imperative for them to join forces and build effective partnerships across sectors. The facilitation of such networking activities has to be taken up by RDI policy.
Upon the approval of the renewed National RDI Strategy by the government in March 2018, the next work phase for policy planning is the elaboration of detailed policy interventions. These are to be specified in the Action Plan, which is scheduled to be drafted by mid-2018.
2.4. Strengths, Weaknesses, Opportunities, and 7KUHDWV��6:27��$QDO\VLV�EDVHG�RQ�WKH�&XUUHQW�6WDWH�,GHQWL¿FDWLRQ
Strengths (S) Weaknesses (W)
s Professional working culture at multinational companies, emergence of knowledge centers, concentrated and coordinated R&D programs
s Emerging “non-greenfield” cooperation between academia and the business sector
s Supportive ecosystem for high-tech start-ups and spin-offs (a “born global” attitude)
s The scientific elite are more involved in non-academic projects
s The reaction to the different imperatives of participants in the Hungarian RDI system is to move in opposing directions
s Open and precompetitive social innovation initiatives are weak
s Lack of common language and innovation culture, trust, and cooperation readiness between actors from different sectors
s Shortage of joint foci, the fragmented nature of research fields, lack of embeddedness
Opportunities (O) Threats (T)
s Connection to emerging and/or reconfiguring global value chains
s Shift toward long-term thinking and quality in policy expectations
s The already existing international RDI partnerships of multinational companies provide further networking opportunities
s The expansion of open access to data and research outcomes facilitates the flow of knowledge
s The decrease of EU funds after 2019 means that highly qualified and skilled RDI staff may leave for non-RDI companies or abroad
s Infrastructural developments implemented in recent years may became unsustainable and the utilization rate of high-tech infrastructure eventually drops
s The number of effective cooperation initiatives cannot be increased for various reasons (e.g. unacknowledged common interests, intellectual property regulations act as a barrier, poor management skills)

Chapter 4 _ Fostering Innovation in SMEs: Focus on Technology Transfer in Hungary (Hungary)�ˍ�181
3. Conclusions and Policy ImplicationsThis study argues that the flow of knowledge is both a weakness and opportunity
for the Hungarian RDI system and knowledge transfer is therefore a crucial point of intervention for domestic RDI policy.
Knowledge transfer is one of the three major pillars of Hungarian RDI policy. Its significance lies in its role of forging a bridge between the pillars of knowledge production (research and development activities) and knowledge utilization (product and service innovation and marketization). Nevertheless, knowledge transfer remains far behind its potential role and is relatively underdeveloped compared to the two other main pillars of the domestic RDI system, knowledge bases and knowledge utilization, which is a major impediment to the knowledge economy’s competitiveness. From a strategy planning perspective, this also means that there are many opportunities for enhancement.
Therefore, the enhancement of knowledge transfer has been and is targeted by a wide range of policy interventions in the national RDI policy. Numerous tools have been elaborated to support the cooperation of public universities and research institutes with market actors, multinational companies, and small and medium enterprises. Among others, calls for cooperation have been announced, financial tools for international mobility and networking have been made available, and joint competence centers for potential participants from higher education and industry have been launched to facilitate their interchange of knowledge. Remarkable achievements such as the emergence of new platforms, innovative initiatives, and promising partnerships have already been accomplished in recent years.
The 2017/18 Korea-V4 Knowledge Sharing Program provided the opportunity to gain insights into the Korean RDI system with a special focus on the innovation of SMEs, knowledge flow, and technology transfer. We were able to identify similarities including the rather weak internationalization of SMEs and the importance of strengthening SME’s innovation capacity and to learn the best practices from Korea for promoting industry-academia cooperation and technology transfer (e.g., government-sponsored research institutes and the Korean Bayh-dole ACT). The experience we gathered will help us place special emphasis on knowledge transfer in Hungarian policy planning in RDI. Based on the identification of major strengths and weaknesses, policy documents, first and foremost Hungary’s Renewed 2013-(2017)-2020 Research, Development, and Innovation Strategy will define the most important intervention areas. The outlines of future interventions have been set out by the renewed strategy for years to come and the interventions themselves are to be specified by the Action Plan of the strategy, which is scheduled to be drafted by mid-2018. In the ongoing drafting process, multiple interventions are being

182�ˍ�2017/18 Knowledge Sharing Program with Visegrad Group
elaborated upon that explicitly target the enhancement of knowledge transfer bodies and activities. The future monitoring and evaluation of ongoing actions are also expected to bring about significant outcomes. Throughout these activities, the adaptability of Korean best-practice solutions are expected to be scrutinized, and elements thereof may be incorporated.

Chapter 4 _ Fostering Innovation in SMEs: Focus on Technology Transfer in Hungary (Hungary)�ˍ�183
References
'ĘU\, T., Csonka, L., Slavcheva, M. (2017), Rio Country Report 2016: Hungary, European Union.
European Commission (2017a), European Innovation Scoreboard 2017, Main Report, Brussels.
European Commission (2017b), European Innovation Scoreboard 2017, Database (Annex C), Brussels.
European Union (2016), Peer Review of the Hungarian Research and Innovation System, Brussels.
Central Statistical Office (Központi Statisztikai Hivatal) (2016), Research & Development (Kutatás-fejlesztés), Budapest.
Ministry for National Economy (2013), Investment in the future: National Research, Development and Innovation Strategy (2013-2020), Budapest.
Ministry for National Economy (2016), Irinyi Plan: The Directions of Innovative Industrial Development in Hungary, Budapest.
National Research, Development and Innovation Office (2018), Investment in Knowledge, Investment in the Future. Hungary’s Renewed Research, Development and Innovation Strategy, Budapest.
Hungarian Intellectual Property Office (Szellemi Tulajdon Nemzeti Hivatala) (2016), Facts and figures (Tények és adatok), Budapest.
What is knowledge transfer? (http://www.cam.ac.uk/research/news/what-is-knowledge-transfer).
ERIA and OECD (2014), http://www.eria.org/Key_Report_FY2012_No.8_chapter_5.pdf.


PART IIIPolicy Incentives for R&D and
Innovation in SMEs
Chapter 5_ Policy Incentives for R&D and Innovation in SMEs: Accomplishments
and Issues (Korea)
Chapter 6_ Innovation Policy for SMEs in the Era of Industry 4.0: Policy Measures
to Strengthen Innovation Capacity of SMEs (Poland)


Chapter 52017/18 Knowledge Sharing Program with Visegrad Group: Innovation Policy for SMEs in the Era of Industry 4.0
Policy Incentives for R&D and Innovation in SMEs:
Accomplishments and Issues (Korea)
���*OUSPEVDUJPO
���4.&T�JO�,PSFBďT�/BUJPOBM�*OOPWBUJPO�4ZTUFN
���1PMJDZ�*ODFOUJWFT�GPS�4.&Tď�3�%�BOE�*OOPWBUJPO
���5IF�&GGFDUJWFOFTT�PG�UIF�.BKPS�*ODFOUJWF�1SPHSBNT��5BY�*ODFOUJWFT�BOE�
3�%�(SBOUT
���$PODMVTJPO��1PMJDZ�*NQMJDBUJPOT�GPS�UIF�7��BOE�,PSFB

188�ˍ�2017/18 Knowledge Sharing Program with Visegrad Group
SummaryThis study’s objective is to analyze the effectiveness of the major incentive
programs for SMEs in Korea with a view to exchanging and sharing policy experiences in promoting R&D and innovation between and among Korea and the Visegrad Group (V4) countries.
SMEs in Korea account for 96.4% of industrial R&D labs and 51.3% of the industrial R&D workforce yet conduct only 23.9% of the industrial R&D, which suggests that the average R&D expenditure per SME and per researcher is much smaller than that of LEs. Therefore, the R&D capacity of SMEs lags far behind that of LEs in terms of both financial and human resources, which makes active and spontaneous technological interactions between the two players very difficult.
SMEs’ R&D behaviors are very much affected by both internal factors such as financial and human resource availability and contextual factors including scale effects and the technology intensity of the industries in which they operate. This suggests that the government can promote SMEs as active players in innovation by helping SMEs improve internal capabilities and easing external barriers through policy support programs. In this perspective, this study looks into the government incentive programs to promote and facilitate SMEs’ R&D and innovation.
Policy Incentives for R&D and Innovation in SMEs: Accomplishments and Issues (Korea)
Sungchul Chung (Korea Association for the Advancement of Scientific Culture)
乇#Chapter 05
Keywords: SME, Innovation, Tax Subsidy, R&D Grant, Incentive

Chapter 5 _ Policy Incentives for R&D and Innovation in SMEs: Accomplishments and Issues (Korea)�ˍ�189
The incentive programs for industrial R&D and innovation in Korea cover all stages of innovation from R&D planning to the marketing of the final outputs of innovation. However, greater policy weight is placed upon the early stages of innovation including R&D and commercialization, to which R&D grants and tax credits—the biggest chunks of incentives—are directed. This is quite reasonable, as it means that government intervention is focused on the segments of innovation processes in which uncertainties and risks are higher and market failure is more likely. Second, incentive programs rely more on direct than indirect means of intervention, such as R&D grants, policy loans, technical assistance, and human resource assistance. Third, the system is tuned to helping SMEs strengthen internal capacities for growth through systems such as R&D grants, tax credits for R&D and HRD, and technical assistance. Fourth, the incentive system encompasses too many programs that are not systematically linked together and managed independently of others based on individual ministries’ and agencies’ policy goals.
Korea’s policy experience in promoting R&D and innovation through such policy incentive programs suggests that if properly designed and implemented, tax credits and R&D grants for SMEs can effectively promote R&D and innovation in SMEs. However, Korea’s experience also suggests that to make the incentive system more effective:
s Programs should be designed and adjusted based on interactions between the government and SMEs that are policy beneficiaries
s Programs should be designed in accordance with the national development strategy and structured to achieve development goals
s Programs should be inter-linked together in a way that attains synergistic effects
s Programs should be made simple and easy for SMEs to comprehends Programs should be clear about terms and processes s Excessive long-lasting support may sometimes lead to deepening SMEs’ reliance
on the government for survival rather than promoting R&D and innovations Preparing SMEs for industry 4.0 requires that support programs are geared
towards strengthening the digital capabilities of SMEs, particularly towards improving SMEs’ access to skills and talents that are capable of navigating development towards Industry 4.0.
s R&D and innovation incentives may be more effective with SMEs that operate in high-technology industries with smaller scale effects (economies of scale).

190�ˍ�2017/18 Knowledge Sharing Program with Visegrad Group
1. Introduction
1.1. Why Innovation Policy for SMEs?
The Korean economy suffers from what is known as a dual economic structure, where it has an extremely large number of low-productive small and medium enterprises (SMEs) and very few large global enterprises (LEs). SMEs1) accounted for an astounding 99.9% of enterprises in the country in 2013, which is the highest among OECD countries. In addition, SMEs employ 87.9% of workers (2013), which makes a stark contrast with the situations of other developed economies. For example, SMEs in the United States account for 48% of the private workforce (SUSB, 2014). However, the mere fact that SMEs are dominant in terms of number and employment would not be a problem if they were as productive as LEs. The problem is that SMEs in Korea are woefully inefficient; their share in the production of value-added remains at 51.3%, and they account for only 36% of the nation’s exports, with their labor productivity standing at only 30% that of the LEs (KOSIS, 2013). This means that SMEs, the absolute majority of Korean enterprises, suffer huge problems due to their extremely low productivity. This alone is sufficient to suggest that the Korean economy’s sustainability depends critically on the growth of SMEs.
Despite their importance in the Korean economy, SMEs face many barriers that hold them back from growth. Growing SMEs requires internal capacity, both technological and managerial, and an external environment that is conducive to innovation and investment. Externally, they face imperfect factor markets—limited access to financial resources and high-quality talents. Opportunities for SMEs to mobilize funds through equity financing are extremely limited in the financial market, so they have to rely on bank loans that are tagged with higher prices than those applied to LEs. SMEs also experience enormous difficulty recruiting high-quality talent who can navigate technological developments, simply because they can hardly compete with LEs in terms of salary and career prospects. Furthermore, SMEs are weaker in networks that affect their capability to access and assess markets and technological information. All these environmental disadvantages are largely accountable for SMEs’ weak internal growth capacity. As SMEs operate in imperfect markets with imperfect information, their decisions are far from optimal—they tend to invest less in R&D and innovation, which contributes to their weak internal capacity to grow. The barriers appear to be even higher in Korea than other countries, as evidenced by the fact that only 41% of SMEs survive after three years in business in Korea (OECD, 2015), which is the lowest among OECD countries. Indeed, Korean SMEs have to weather a harsh climate to grow, gain competitive advantages, and win market competition. In the expression of Atkinson and Storey, SMEs in Korea
1) SMEs in the manufacturing sector are defined as firms with fewer than 300 employees or capital of less than 8 billion KRW (about 7.7 million USD).

Chapter 5 _ Policy Incentives for R&D and Innovation in SMEs: Accomplishments and Issues (Korea)�ˍ�191
both “have to run to stand still” and have “a long way to run” (Atkinson & Storey, 1994, p. 100).
The above discussions provide a rationale for government intervention in SME affairs; the government needs to step in to help SMEs overcome market failure that limits their performance and productivity and to boost their special contributions to economic development such as job creation and inclusive growth. Out of the diverse problems that confront SMEs, the key barriers are directly and indirectly associated with technology and innovation, which suggests that SMEs’ low performance stems from their weak capability with regard to technology and innovation.
Despite their critical role in the national economy, Korean SMEs remain in the backwater of R&D and innovation because the majority operate in traditional sectors and because they cannot to afford to engage in risky activities due to their severe financial constraints and weak technological capacity. Moreover, as the economic development strategy has been oriented in favor of LEs, business R&D in Korea has become concentrated to a limited number of large global companies in manufacturing sectors. LEs, which account for only 0.13% of business enterprises and 13% of employment, are dominant players in R&D and innovation, conducting more than 76% of business R&D. In contrast, SMEs that comprise over 99% of business enterprises and employ more than 87% of workers account for only 24% of business R&D. This suggests two important implications: (1) Korea has to look to SMEs that offer great room for development and growth for sustainable growth and employment, and (2) SME growth requires them to strengthen their internal capacity, which is determined by R&D and innovation.
This explains why innovation policy for SMEs is so important for the Korean economy’s long-term growth. The Korean economy can hardly attain long-term sustainability without the growth of SMEs. In other words, the Korean economy has reached a stage where it can hardly move forward without well-growing SMEs. Industrial polarization or an imbalance between SMEs and LEs should be corrected to sustain growth into the future. Growing SMEs requires both a strong internal capacity that is largely determined by R&D and innovation and an external environment that is conducive to innovation. Therefore, one of the critical challenges ahead of modern Korea is how to make its SMEs grow, which suggests that nurturing innovative SMEs is a key policy challenge.
1.2. Study Objective
Innovation among SMEs is an issue in which Korea and the V4 countries share common policy interests and they have agreed to exchange policy experiences. Similar to Korea, industrial innovation among the V4 countries is dominated by LEs

192�ˍ�2017/18 Knowledge Sharing Program with Visegrad Group
that are owned by foreign investors, while local SMEs are less actively engaged in R&D and innovation. In other words, Korea and the V4 countries share the same problem of a dual structure in industrial innovation systems. The difference between the two is that large Chaebol companies in Korea are dominant players in R&D and innovation with SMEs at the fringe, while the V4 countries have large FDI companies that lead industrial innovations without active technological interactions with local SMEs. The problem with the V4 countries is that the effectiveness of government innovation policies may be substantially limited as key players in industrial innovation are foreign-owned companies that are subject to the policies of their owner companies in their home countries. Therefore, innovation policies for SMEs are more important in the case of the V4 countries.
One of the projects of the 2017/18 KSP with the V4 countries has the theme of “Innovation Policy for SMEs in the Era of Industry 4.0”; this study aims to draw policy implications for the V4 countries from the Korean experiences in promoting R&D and innovation among SMEs. The study focuses on the analysis of the effectiveness of major policy incentive programs for R&D and innovation in Korean SMEs, specifically tax incentives and R&D grants for SMEs.
1.3. Structure of the Report
The report begins with a brief review of the role of SMEs in Korea’s national innovation system (Section 2), with a view to identifying issues that require policy attention. Section 3 analyzes the R&D and innovation incentive programs for SMEs in Korea; it first discusses the changes in innovation policy for SMEs and then presents the overall structure of incentive programs, along with the operational details of major programs. Section 4 is devoted to discussions on the effectiveness of tax incentives and R&D grants in Korea; we evaluate the performances of the policy incentive programs and review and synthesize existing empirical studies on the policy effectiveness of incentive programs. Section 5 concludes the report by summarizing it and deriving policy implications for both Korea’s R&D and innovation incentive systems and those of the V4 countries.
2. SMEs in Korea’s National Innovation System
2.1. National Innovation System: Key Features
Korea is currently one of world’s major R&D powers, investing 4.3% of its GDP or 64 billion USD in R&D, which accounts for 3.6% of global R&D expenditure in 2014 (IRI, 2016). Out of Korea’s gross expenditures on R&D (GERD) in 2015, 74.5% was funded by private industry, 24.7% by the government and less than 1% by foreign

Chapter 5 _ Policy Incentives for R&D and Innovation in SMEs: Accomplishments and Issues (Korea)�ˍ�193
sources. Korea is also ahead of other countries in terms of R&D workforce, with 317,842 researchers (full time equivalent) in total, or 13.2 researchers per thousand of population, which is one of the highest in the world (NTIS, 2015).
However, being a latecomer to science and technology, Korea only started paying policy attention to indigenous R&D and take proactive measures to promote R&D and innovation in both public and private sectors in the 1980s. From the start, Korea’s R&D policy has been consistently linked to industrial development, and thus has evolved in response to changes in industrial development strategies. Essentially, Korea’s policy has been tuned to a very pragmatic goal of catching up with advanced industrial economies through R&D-based innovation. Korea has sought to achieve the goal under resource constraints by concentrating R&D efforts on a few strategically selected areas and focusing on applied research and technology development.
Korea has been focusing its R&D and innovation efforts on selected areas to develop strategic industries as a foundation for export-oriented growth. In the 1970s, it launched an ambitious move (known as the Heavy and Chemical Industry (HCI) Development) to raise industries into higher value-added segments along the value chain. For example, in the chemical–textile value chain, Korea built links backward from the export of textiles to the production of synthetic fibers and the development of basic petrochemicals. Due to efforts for the development of the strategic industries that were initiated by the HCI policy and continued into later decades with adjustments, Korea has been able to attain global competitiveness in industries such as steel, automobiles, shipbuilding, machinery, electronics, and petrochemicals, which are now the economy’s locomotives. Though maybe unintentional, as these industries are naturally capital- and technology-intensive, the strategy ended up promoting the economy’s LE-orientation.
Korea’s current innovation system is an outgrowth from the industrial policy of the past decades and can be characterized as:
A. Korea’s innovation system is highly industry-oriented: In 2015, private industries conducted 78% of GERD, while the government sector (Government R&D Institutes: GRIs) conducted 13%, and universities conducted 9%.
B. R&D focused on industrial technology: The application and development of research consistently took up over 82% of R&D funds, while basic research received 18% or less of the funding (Table 5-1).
C. Manufacturing-oriented innovation system: Almost 90% of industrial R&D funds were used by the manufacturing industry (Table 5-2).
D. Strategic focus: Resources were concentrated on strategically chosen technologies, particularly electronics/ICT, automobiles, and petrochemicals,

194�ˍ�2017/18 Knowledge Sharing Program with Visegrad Group
which took up approximately 80% of industrial R&D expenditures (Table 5-3).E. Large enterprise-dominance: The top five companies accounted for 37.3% of
Business Expenditures on R&D (BERD), the top 10 companies accounted for 41.7%, and the top 20 companies 49.3% (Table 5-4).
Therefore, the dominance of LEs in the Korean economy can be partially attributed to the R&D and innovation policy’s strategic focus on nurturing technology- and capital-intensive industries such as electronics/ICT, automobiles, iron and steel, petrochemicals, and shipbuilding in which the economies of scale are so significant that SMEs cannot be major players.
(Unit: billion KRW, %)
2010 2011 2012 2013 2014 2015
Total R&D 43,854 49,890 55,450 59,301 63,734 65,959
B : A : D 18:20:62 18:20:62 18:19:63 18:19:63 18:19:63 17:21:62
�Table 5-1� Resource Allocation by the Nature of R&D
Note: B-Basic, A-Application, D-Development.Source: NTIS.
(Unit: %)
2010 2011 2012 2013 2014 2015
Agriculture/Forestry 0.08 0.09 0.06 0.06 0.06 0.06
Mining 0.06 0.06 0.08 0.05 0.04 0.04
Manufacturing 87.61 87.54 87.82 88.60 88.92 89.61
Others 12.25 12.31 12.04 11.29 10.98 10.29
Total 100.00 100.00 100.00 100.00 100.00 100.00
�Table 5-2� Industrial R&D by Sector
Source: NTIS.
(Unit: billion KRW, %)
2010 2011 2012 2013 2014 2015
Manufacturing Total 28,737 33,425 37,960 41,254 44,328 45,822
Share of the Key
Industries
Petrochemicals 11.2 12.2 10.9 11.5 10.1 7.2
Electronics/ICT 55.1 53.8 54.8 56.8 58.4 54.4
Automobiles 13.9 13.6 12.9 12.8 13.3 14.2
�Table 5-3� Focus of Manufacturing R&D
Source: MSIT (2017).

Chapter 5 _ Policy Incentives for R&D and Innovation in SMEs: Accomplishments and Issues (Korea)�ˍ�195
2.2. R&D and Innovation Capacity of SMEs
2.2.1. R&D Funds
Industrial R&D activities in Korea have undergone rapid growth, as reflected in the number private industrial R&D centers that have increased more than 2.6-fold over the past decade from 13,324 in 2006 to 35,288 in 2015. Out of the R&D centers, 34,022 (or 96.4%) belong to SMEs and the remaining 1,266 to LEs2) (Figure 5-1). The growth is almost totally attributable to the massive new entry of SMEs into the R&D race (21,624 centers in that period). In contrast, the number of LEs’ R&D centers has increased by only about 37% in the same period. Out of the SME R&D centers, 98.6% (or 33,542) reported that they had conducted and expended R&D resources in 2015, while only 86.9% (1,100) of LE R&D centers reported so in the same year (MSIT, 2017).
2) According to the 2017 Survey on the Technology of SMEs (KBIZ, 2017), 26.7% of SMEs operate R&D centers and 27.1% R&D divisions (As certified by MSIT and registered with the Korea Industrial Technology Association).
(Unit: number)
40,000
35,000
30,000
25,000
20,000
15,000
10,000
5,000
02006
926
12,398
13,324
961
14,014
14,975
Total
1,023
15,696
16,719
1,070
17,703
18,773
1,126
20,659
21,785
1,415
22,876
24,291
1,617
24,243
25,860
1,617
27,154
28,771
1,421
30,746
32,167
1,266
34,022
35,288
2007 2008 2009 2010 2011 2012 2013 2014 2015
SMEsLEs
[Figure 5-1] Growth of the Number of Industrial R&D Centers
Source: MSIT (2017).
(Unit: %)
2010 2012 2014 2015
Top 5 31.5 32.2 33.5 37.3
Top 10 40.2 39.0 44.1 41.7
Top 20 45.4 45.4 51.6 49.3
�Table 5-4� Concentration of Industrial R&D Activities
Source: NTIS.

196�ˍ�2017/18 Knowledge Sharing Program with Visegrad Group
BERD has also increased remarkably, by 2.4 times over the same period. However, the growth pattern of BERD differed significantly from that of R&D centers. The growth of the number of SME R&D centers greatly exceeded the increases in SME BERD, decreasing the average R&D expenditures of SME R&D centers. In contrast, R&D expenditures have outgrown the number of R&D centers for LEs, deepening their dominance in industrial R&D and innovation.
The 2017 Survey on Technology of SMEs confirms that the most critical barriers to R&D and innovation that SMEs face are a lack of high-quality researchers and funds. Reflecting this situation, even though SMEs expended 18.5% of the GERD (12,206 billion KRW) in 2015, only 86.6% of the funds were self-financed; the remainder came from external sources.
Therefore, SMEs rely heavily on external sources for R&D funds, particularly the government, which allocates over 14% of its R&D budget to SMEs (NTIS, 2015). However, the actual reliance may be even higher as SMEs also receive financial assistance in the form of policy loans and other forms that might not have been counted in the flow of R&D funds.3)
3) For example, according to the 2017 Survey on Technology of SMEs, SMEs financed 6.2% of R&D with policy loans.
(Unit: billion KRW)
60,000
50,000
40,000
30,000
20,000
10,000
0
Les
2006
16,021
4,103
21,126
17,511
6,353
23,864
18,713
7,286
26,001
19,969
8,196
28,165
24,212
8,590
32,803
28,346
9,837
38,183
32,070
11,152
43,222
35,778
10,782
46,560
38,617
11,237
49,854
38,930
12,206
51,136
2007 2008 2009 2010 2011 2012 2013 2014 2015
SMEs
BERD
[Figure 5-2] Growth of BERD: SMEs vs. LEs
Source: NTIS.

Chapter 5 _ Policy Incentives for R&D and Innovation in SMEs: Accomplishments and Issues (Korea)�ˍ�197
2.2.2. Human Resources
SMEs employ 51.3% of the industrial-sector R&D workforce (2015). It is interesting to note that LEs’ share of the industrial R&D workforce, which was 56.9% in 2006, has been declining continuously and fell to 48.7% in 2015. This owes more to the increases in SMEs’ researchers due to the rapid growth of the number of SME R&D centers than to other causes associated with LEs. This is certainly a very positive trend because limited access to technological talents is widely considered to be one of the major barriers that constrain SMEs’ R&D and innovation. However, a closer look into the composition of the research workforce at SMEs gives us a totally different picture. According to the 2017 Survey on Technology of SMEs (KBIZ, 2017), the proportion of PhD-level researchers among SMEs’ R&D workers remains only 2.7%, which is less than one eighth of the proportion of the national total. In the case of SMEs, researchers with graduate degrees (master’s or higher degrees) make up only 18.2% of the research workforce.4)
The degree composition of SMEs’ R&D workforce explains many problems that SMEs face. To promising young scientists and engineers, SMEs are by no means a preferred place to work, simply because they fall far short of providing what is required to attract desirable people due to a low salary, low stability, an unclear
4) The composition of research manpower by degree: (1) National total – PhD 21.7%, Master’s 28.5%, Bachelor’s 43.9%, others 5.85; SMEs – PhD 2.7%, Master’s 15.5%, Bachelor’s 71.3% and others 10.6% (NTIS and KBIZ, 2017).
Government/Public Sectors8,824 (13.4%)
Universities5,998 (4.3%)
Large Enterprises38,930 (59.0%)
65,959 billion KRWR&D Expenditures
65,959 billion KRWR&D Fund Sources
Small-Medium Enterprises
12,206 (18.5%)
Government/Public Sectors
16,294 (24.7%)
Government Enterprises583 (0.9%)
Private Enterprises48,587 (73.7%)
Foreign Sectors496 (0.8%)
496 (0.8%)10,568 (86.6%)38 (0.6%)1,615 (12.3%)
[Figure 5-3] Flow of R&D Funds in 2015
Source: Based on a 2015 survey of R&D in Korea.

198�ˍ�2017/18 Knowledge Sharing Program with Visegrad Group
future, limited learning opportunities, limited networking, and many other issues. Not only is the average salary of researchers at SMEs less than half that given at LEs,5) but they also offer far more limited opportunities to learn new skills and develop professional networks that are critical to the development of careers as a research scientist and an engineer. A survey conducted by the Korea Association of SME Studies found SMEs are the least-preferred workplace among university students in Korea (Hankyung, November 1, 2017, A1)6). This may be why SMEs place ‘the difficulty to recruit qualified technical personnel’ at the top of the list of constraints they face.
2.2.3. R&D Capacity of SMEs
As discussed above, SMEs in Korea, accounting for 96.4% of industrial R&D centers and 51.3% of the industrial R&D workforce, conduct only 23.9% of industrial R&D, which suggests that the average R&D expenditure per SME as well as per researcher is much smaller than that of LEs. Furthermore, even though SMEs employ more than half of the business-sector R&D manpower, if the quality of the manpower is taken into account, it falls far below that of LEs in real terms. The proportion of PhDs in SMEs’ R&D manpower is only 2.7%, while the proportion is 21.7% in the case of the nation’s total R&D manpower, which means that the statistics hugely overstate the R&D capacity of SMEs. Combining R&D financial and human resources, we can easily conclude that the R&D capacity of SMEs lags far behind that of LEs, which makes active, spontaneous technological interactions between the two players very difficult.
5) Korea SME Institute (2014), p.21.6) Only 2.1% of the respondents chose SMEs as a preferred workplace.
(Unit: number)
400,000
300,000
200,000
100,000
0
Les
2006
99,029
74,875
173,904
102,473
83,160
185,633
106,007
91,016
197,023
108,136
102,167
210,303
120,105
106,063
226,168
132,004
118,622
250,626
141,775
143,211
275,986
147,123
134,751
281,874
157,430
147,378
304,808
154,809
163,033
317,842
2007 2008 2009 2010 2011 2012 2013 2014 2015
SMEs
Total
[Figure 5-4] Private Business Sector Researchers
Source: NTIS.

Chapter 5 _ Policy Incentives for R&D and Innovation in SMEs: Accomplishments and Issues (Korea)�ˍ�199
2.3. Role of SMEs in Industrial R&D and Innovation
2.3.1. Objectives of SMEs’ R&D
Given the R&D capacity and other constraints, it is not surprising that SMEs’ main motivations for R&D and innovation cannot go beyond the expansion of the domestic market share and maintaining and/or strengthening competitiveness in the domestic market. According to the 2017 Survey on Technology of SMEs, 51.2% of SMEs conduct R&D for the expansion of the domestic market and 22.6% do this to stay competitive, with only 6.5% aiming at developing new businesses through R&D and innovation (KBIZ, 2017). Therefore, most R&D and innovation activities of SMEs are directed toward improving existing products (65.1%) or processes (7.0), while only 22.5% are directed toward developing new products and 2.7% at new processes (KBIZ, 2017). In contrast, according to the Survey of R&D in Korea 2015, the majority of business R&D activities (62.4%) in Korea aim at developing new products (42.5%) or new processes (19.9%), with the remaining 37.6% geared towards improving existing products (22.6%) and processes (15.0%). As such, significant differences exist between SMEs and LEs in terms of the motivations and objectives of R&D and innovation, which may be the cause and, at the same time, effect of the gap in R&D resources and capacity between SMEs and LEs.
2.3.2. Scale Effect, Technology Intensity, and SMEs’ Role in R&D and Innovation
Being more constrained by resource limitations than LEs, SMEs are relatively more active in R&D and innovation in industries with lower technology intensity and smaller-scale economies. According to the Survey of R&D in Korea 2015, LEs explain dominant shares of BERD in industries where scale is a key source of competitiveness and in industries of higher technology intensity. In contrast, SMEs play a relatively more important role in R&D and innovation in agriculture, forestry and fisheries, and services sectors, in which the scale effect is insignificant and technology intensity is low.
(Unit: %)
Development of New Improving Existing
Products Processes Products Processes
All Enterprises 42.5 19.9 22.6 15.0
SMEs 25.2 2.7 65.1 7.0
�Table 5-5� Objectives of Business R&D and Innovation
Sources: MSIT (2017), KBIZ (2017).

200�ˍ�2017/18 Knowledge Sharing Program with Visegrad Group
More specifically, in the services sector, where the average scale of operation (sales) is only 0.5 billion KRW, SMEs account for 65.0% of the sector’s BERD. On the other hand, in the case of the mining industry, with average sales of 167.7 billion KRW, SMEs are negligible (5.8% of the industry’s BERD) in the R&D arena (Survey of R&D in Korea 2015) (see Table 5-6). Overall, it can be said that SMEs play a relatively more important role in industries where scale is a less important determinant of efficiency, such as agriculture, fisheries and forestry, sewage and waste management, construction, and services (shaded industries in Table 5-6). Additionally, within the manufacturing sector, we can find a similar pattern among the sub-sectors; that is, the smaller the average sales per enterprise of the industry, the larger the share of SMEs in the industry’s BERD.
Another factor that affects SMEs’ R&D and innovation is the technology intensity of the industries in which they operate. In other words, SMEs’ behavior in R&D and innovation varies across industries of different technology intensities. We looked into the manufacturing industries with different technology intensities as classified by the OECD7). As expected, it was found that LEs are leading R&D and innovation in high-technology industries, but the prominence of LEs declines as we move along the industries with declining technology intensity. In high-technology industries, LEs’ share in R&D is 88.94%, but the share is reduced to 70.1% in mid-high-technology industries, to 62.87% in mid-low-technology industries, and to 52.62% in low-technology industries. Conversely, the role of SMEs in R&D becomes more important
7) The OECD classified manufacturing industries based on technology intensity as high-technology industries, medium-high-technology industries, medium-low-technology industries, and low-technology industries (OECD, 2011).
(Unit: billion KRW, %)
Industry Number of Enterprises* Sales Average Sales SMEs’ Share of
BERD (%)
Whole Industry 34,642 1,690,760 23.9 23.9
Agriculture/Forestry 44 387 8.8 57.5
Mining 9 1,509 167.7 5.8
Manufacturing 23,227 1,226,450 52.8 19.7
Electricity/Water 46 108,637 2,361.7 1.5
Sewage/Waste 181 2,948 38.4 90.0
Construction 2,474 154,033 62.3 56.5
Services 8,661 4,117 0.5 65.0
�Table 5-6� Average Sales per Enterprise and SMEs’ Share of BERD by Industry in 2015
Note: * Number of enterprises that conducted R&D in 2015.Source: Tabulated based on the Survey of R&D in Korea 2015.

Chapter 5 _ Policy Incentives for R&D and Innovation in SMEs: Accomplishments and Issues (Korea)�ˍ�201
in industries of lower technology intensity, suggesting that SMEs’ R&D relative to that of LEs is negatively related to the technology intensity of industries (see Table 5-7).
However, there are exceptions, too. Interestingly, it has been found that SMEs’ share of BERD is unexpectedly high (91.7%) in the case of the medical, precision, and optical instruments industry, which belongs to the high-technology sector. Similarly, SMEs’ share of R&D expenditures in the electric machinery and apparatus industry and other machinery and equipment industries is much higher (41.4% and 60.9%) than that (29.9%) expected of SMEs in the industries belonging to the mid-high-technology sector. What characterizes these industries is relatively low average sales per enterprise8), which appears to suggest that the scale effects on production efficiency are not that significant in these industries. From the above, it may be construed that the effect of scale on SMEs’ R&D and innovation behavior more than offsets that of technology intensity.
8) Average sales per enterprise are 8.46 billion KRW in the medical, precision, and optical instruments industry, 20.1 billion KRW in the electrical machinery and apparatus industry, and 16.8 billion KRW in other machinery and equipment industries, which are far lower than the average sales per enterprise of the whole manufacturing industry (52.8 billion KRW) (Survey of R&D in Korea 2015).
High-technology Industries: 11.1% Medium-high-technology Industries: 9.9%
s Aircraft and spacecraft: 12.3s Pharmaceuticals: 28.2s Office, accounting, and computings Machinery, Radio, TV, ands Communications equipment: 7.3s Medical, precision, and optical instruments:
91.7
s Electrical machinery and apparatus, nec: 41.4
s Motor vehicles, trailers, and semi-trailers: 11.4
s Machinery and equipment, nec: 60.9
Medium-low-technology Industries: 37.1% Low-technology Industries: 47.4%
s Building and repairing of ships and boats: 12.6 Rubber and plastic products: 45.2
s Coke, refined petroleum products, and nuclear fuel: 6.3
s Other non-metallic mineral products: 48.5s Basic metals and fabricated metal products:
44.9.1
s Manufacturing, nec.; Recycling: 95.7s Wood, pulp, paper, paper products,s Printing, and publishing: 79.5s Food products, beverages, and tobacco:
21.2s Textiles, textile products, leather,s and footwear: 78.8
�Table 5-7� SMEs’ Share of R&D in Industries of Different Technology Intensities
Sources: OECD (2011), MSIT (2017).

202�ˍ�2017/18 Knowledge Sharing Program with Visegrad Group
2.3.3. Policy Implications
The above discussions imply that the R&D behavior of SMEs is very much affected not only by internal factors, such as financial and human resource availability, but also by contextual factors, including the scale effect and technology intensity of the industries in which they operate. This leads to the argument that the role of SMEs in R&D and innovation is determined in large part by the nature of industries. SMEs play a leading role in R&D and innovation in industries where the scale effect is insignificant and the technology intensity is low. However, it appears that SMEs can claim a leadership role even in high-technology industries if the scale effect is not overwhelming.
A very similar pattern of role division between SMEs and LEs is found in European countries. It has been found that, in France, SMEs’ role is negligible in high-technology industries in the manufacturing sector, where R&D is dominated by the major companies, while SMEs account for more than half of the total R&D expenditure in the service sector in 2012 (Abel-Koch, 2015). This pattern of role division in R&D between SMEs and LEs may shed light on how to design incentive programs for SMEs’ R&D and innovation.
3. Policy Incentives for SMEs’ R&D and Innovation
3.1. Evolution of Innovation Policy for SMEs: A Brief Review
Korea’s SME policy has been shifting from fostering and protecting SMEs toward promoting R&D and innovation, which are critical to the enhancement of productivity. In the 1960s, the focus of SME policy was placed on promoting the modernization of SMEs, almost all of which were then operating in traditional sectors, and transforming them into exporters of light industrial products. As a specialized institution to financially support the policy, the government created the Industrial Bank of Korea (IBK) (1961) and launched a policy to develop SMEs as export industries (1964) (KSBI, 2006).
The government’s drive for the development of heavy chemical industries in the 1970s shifted the policy focus toward developing SMEs as local suppliers for heavy machinery and chemical companies that relied on imports for the acquisition of materials as well as parts and components. To nurture SMEs’ capacity to supply high-quality parts and components, the government encouraged the establishment

Chapter 5 _ Policy Incentives for R&D and Innovation in SMEs: Accomplishments and Issues (Korea)�ˍ�203
of complementarities between SMEs and LEs through subcontracts and other technological/financial linkages between the two (the Law for the Promotion of SME-LE Linkages, 1975). This change in policy entailed two major issues in SME policy: (1) how to strengthen the technological capabilities of SMEs and (2) how to ensure a mutually beneficial relationship between LEs and SMEs or how to protect SMEs from the possible dominance of LEs. The government responded to these issues by designating SME-exclusive industries9) in 1979 to protect SMEs from the market power of LEs on the one hand, while on the other, launching tax incentive programs in 1981 to encourage SMEs to actively engage in R&D and innovation.
The 1990s brought new challenges to Korea: Externally, the change in the international trade regime (WTO) placed Korean SMEs under increased competitive pressure, but internally, the democratization of Korean society allowed SMEs a louder political voice. This compelled the government to redirect the policy toward promoting autonomy, opening, and competition in economic activities, while at the same time, reinforcing support for R&D and innovation for SMEs. The major policy measures taken to encourage SMEs’ R&D and innovation included (1) the SME Technology Innovation Program, the first R&D program exclusively for SMEs launched by the Small and Medium Business Administration (SMBA) in the year (1996) it was created; (2) the Korean Small Business Innovation Research (KOSBIR) Program (launched in 1998) benchmarking the SBIR program of the USA; and (3) the opening of KOSDAQ (Korean Security Dealers Automated Quotation) in 1996 as an SME market division of the Korea Exchange (KRX), among many others.
Another external force that made it inevitable that Korea would change its SME policy was the Asian financial crisis, which hit the Korean economy hard at around the end of the 1990s. Many debt-stricken companies, small and large, were dissolved, which led to massive shrinkages in investment and employment, placing SMEs under even fiercer competitive pressure. The government opted to solve the problem by promoting new technology-based start-ups, particularly IT-based new businesses. The policy efforts bore fruit: The Korean economy started to gain dynamism and recovered from the crisis in three years.
Entering the 2000s, Korea’s policy for SMEs was directed more toward strengthening technological competitiveness. In summary, the traditionally protection-oriented policy was replaced by an innovation-oriented policy that places greater weight on encouraging SMEs to engage in R&D and innovation to attain competitiveness than on protecting them from competition. The incentives range from financial grants for technology development to a public purchase program to
9) The SME-exclusive industries refer to segments of markets where the entry of LEs is banned by law. The number of the SME-exclusive industries was 23 in 1982 which increased continuously to peak at 236 in 1989, and gradually decreased since then. It was removed in 2007.

204�ˍ�2017/18 Knowledge Sharing Program with Visegrad Group
make it easier for SMEs’ new products to enter the market. However, as mentioned earlier, the political voice of SMEs has grown to such a level that SME policies appear to be driven more by political rationale than economic reasoning. For example, the SME-exclusive industry that was removed in 2006 was revived in 2011 under the name of the “SME-proper” industry.
3.2. Structure of Incentives for Industrial R&D and Innovation
The Korean government’s policy incentives for industrial R&D and innovation cover all the stages of innovation from R&D to marketing the new products resulting from R&D. As R&D and innovation involve risks and uncertainties, both financial and technological, the policy incentives are tuned to reduce the risks and uncertainties, such as easing financial constraints by providing funds for R&D, lowering the cost of R&D by reducing tax burdens, and compensating for technical/managerial weaknesses through technical assistance. Technical assistance includes direct and indirect as well as monetary and non-monetary support that covers all the processes of innovation from R&D planning to the development of marketing strategies at the end. To promote the commercialization of technologies, the government also offers programs to promote and facilitate technology transfer from the public sector to SMEs as well as policy loans and credit guarantee services to help finance commercialization. At the marketing stage, a traditional way for the government to promote industrial innovation is to purchase the new products resulting from R&D and innovation to ease their way into the market. In addition, the government issues a ‘new technology certificate’ and ‘new product certificate’ as a means to promote new technology-based products in the market. For the structure of policy incentives, see [Figure 5-5].

Chapter 5 _ Policy Incentives for R&D and Innovation in SMEs: Accomplishments and Issues (Korea)�ˍ�205
Currently (2017), the government offers a total of 153 incentive programs for industrial R&D and innovation, of which 10 are tax incentives, 62 are R&D grants, 19 are financial assistance, 15 are subsidies for human resources, etc. (see Table 3-8). The programs are sponsored by various ministries: 38 by the Ministry of Science and ICT (MSIT); 42 by the Ministry of SMEs and Startups (MSS); 33 by the Ministry of Trade, Industry and Energy (MOTIE); and 40 by other ministries or agencies, suggesting that industrial R&D and innovation are a government-wide top policy issue (see Table 5-8).
Even though not all of the programs are exclusively for SMEs, the government incentives have been structured heavily in favor of SMEs. For example, SMEs are eligible for 152 of the 153 programs, while only 69 are accessible to large enterprises. In particular, technical and financial assistance programs have been designed to compensate for the weaknesses common to SMEs (see Table 5-8).
R&D Commercialization Marketing
Technology Transfer
Income tax exemption forforeign R&D staff
Property tax exemption onproperties related to R&D
Income tax exemption ordeduction on the expenditures related to R&D and innovation
Policy financing for thecommercialization of newtechnologies
Public purchase
Quality certification
New technology/product certification
Tax credits for the expenditures on R&D and HRD
R&D grants, matching funds
Funding for collaborative R&D: SME–Academia, SME–GRI
Technical assistance/Human resource assistance
Credit guarantee for investment financing
[Figure 5-5] Current Structure of Policy Incentives for Industrial R&D and Innovation
Source: Author, based on KOITA (2017).

206�ˍ�2017/18 Knowledge Sharing Program with Visegrad Group
Nature of ProgramsNumber of Programs by Sponsoring Agencies
TotalMSIT MITIE MSS Others
Tax Incentives - - - 10 -
R&D Grants* 20 16 16 10 62
Technical Assistance 6 3 10 5 24
Human Resources 6 4 1 4 15
Financial Assistance 1 1 9 8 19
Certification 5 8 2 1 16
Marketing - 1 4 2 7
Total 38 33 42 40 153
�Table 5-8� Number of Incentive Programs by Sponsoring Agencies
Note: *Includes KOSBIR programs.Source: Based on KOITA (2018).
Incentive Programs (Number of Programs)
Number of Programs Accessible to
SMEs HPEs* LEs
Tax Incentives (10) 10 10 10
R&D Grants (62) 62 48 34
Technical Assistance(24)
Tech Development 12 5 2
Commercialization 4 1 -
IPR 4 - -
Others 3 1 -
Human Resources (15) 15 13 6
Financial Assistance (19)
Investment Funds 12 3 2
Credit Guarantee 5 1 -
Others 2 - -
Certification (16)
Enterprise 6 4 3
Products 6 6 6
Awards 4 4 4
Marketing (7) 7 2 2
Total 152 98 69
�Table 5-9� Number of Incentives by Eligibility
Note: * High-potential enterprise: enterprise on the verge of becoming LE. In the case of manufacturing, enterprises with more than 300 employees and paid-in capital of over 8 billion KRW are categorized as HPEs.
Source: Based on KOITA (2017).

Chapter 5 _ Policy Incentives for R&D and Innovation in SMEs: Accomplishments and Issues (Korea)�ˍ�207
3.2.1. Tax Incentives
The Ministry of Economy and Finance (MOEF) is responsible for the program policy, but it is the National Tax Service that administers the practical processes of the programs. Tax incentives were first introduced into the law10) in 1981 when Korea began to shift its S&T policy from promoting learning to promoting indigenous R&D. Since the incentive system was first implemented in 1982, there have been numerous revisions, additions, and removals in the contents of the programs. As of 2017, there are 10 tax incentive programs:
(1) Tax credits for expenditures on R&D and HRD (launched in 1982, no sunset)(2) Tax credits (special) for R&D and HRD in the areas of new-growth technologies
(launched in 2011, sunset December 2018)(3) Tax credits for investments in facilities for R&D and HRD (launched in 1974,
sunset December 2018)(4) Local property tax exemptions/deductions on real estates for industrial R&D
centers (launched in 2002, sunset December 2019)(5) Special tax exemption/deductions on royalty receipts and payments (launched
in 1982, sunset December 2018)(6) Corporate income tax deduction for technology-based companies operating in
the special R&D zones (launched in 2006, sunset December 2018)(7) Special tax exemptions on R&D grants received (launched in 2006, sunset 2018) (8) Income tax deduction on the salaries of foreign R&D staff (launched in 1982,
sunset December 2018)(9) Income tax deduction on the expenditures on R&D-related activities by R&D
staff (launched in 1982, no sunset)(10) Tariff deduction on the imports of materials/equipment for R&D (launched in
1983, no sunset)
Of the above ten programs, tax credits for R&D and HRD (1–3) were responsible for more than 97% of the total tax deducted for R&D and innovation in 2015. The R&D and HRD tax incentive offers enterprises two options: R&D tax relief based on the volume or increment of R&D expenditures (a hybrid system) and, in the case of investments in R&D facilities, a volume-based tax credit is given. As such, they choose the larger of either the volume-based or the incremental tax offset. If tax liability is too low to use R&D tax credit, they can carry forward the unused tax credit for five years (see Table 3-10). It is noteworthy that all the programs, except programs (1), (9), and (10), are bound to expire by the end of 2018 unless any legal measures are taken.
10) Law on the Regulation of Tax Exemption and Deduction.

208�ˍ�2017/18 Knowledge Sharing Program with Visegrad Group
R&D and HRD activities are defined as activities to develop technology for the company, trademark design and development, manpower training, and quality control. R&D and HRD costs that qualify for tax subsidies include labor costs (salaries, wages, bonuses, etc.), materials costs (samples, parts, and raw materials used in conducting R&D), rent for R&D equipment, commissions paid to the qualifying body, training costs, and other costs (trademark development costs, design development costs, consulting fees, and quality guarantee costs). Companies can claim all direct and indirect R&D expenditures in the tax credit computation regardless of the location of the R&D activities. There is one exception: R&D contracted out to institutions outside the country is not eligible for the subsidy.
To be eligible for the tax credit programs, the company has to have and operate an R&D center or R&D division that meets the requirements set by the law11) and that is entirely for R&D and innovation (see Table 5-12 for the requirements). To obtain the tax credits and/or deductions, individual enterprises should submit the following documents to the local tax offices: the application for tax credits, list of expenditures on R&D and HRD, R&D plan, and supporting documents (evidence). The National Tax Service reviews the applications submitted with a corporate income tax return and processes the expenditure claims. The R&D expenditure claims may also be subject to written information requests or a tax audit in the future.
11) Law on the Promotion of Basic Research and Support for Technology Development
R&D and HRD Tax Credit Investment in R&D and HRD Facilities
Type Hybrid (volume and increments) Volume-based
Eligible Expenditures R&D and HRD expenditures Machinery, building, etc.
Rates Applied* 25% of volume** or 50% of increment 6%***
Refund Not applicable
Carry-over Five years
�Table 5-10� Tax Incentive for SMEs’ R&D and HRD
Note: * SMEs can choose the larger of the two options (volume or increment-based deduction); different deduction rates are applied to LE and HPE (high-potential enterprises): HPEs: 10% of volume or 40% of increment; LEs: 1-3% of volume or 30% of increment
** 30% for SMEs in the growth industries *** LEs: 1%, HPEs: 2%, In addition, local property taxes are exempted.Source: Author, based on KOITA (2017).

Chapter 5 _ Policy Incentives for R&D and Innovation in SMEs: Accomplishments and Issues (Korea)�ˍ�209
3.2.2. R&D Grants for SMEs
R&D grants for industries took up over 18% of government expenditures on R&D in 2015 - 14.8% for SMEs and 3.3% for LEs (NTIS). R&D grant programs provide awardees with full or matching funds for R&D and innovation. Grantees are selected through a competition, which is administered by funding agencies under sponsoring ministries or agencies. There are two major umbrella programs of R&D and innovation grants for SMEs: one is the SME Technology Innovation Program of the Ministry of SMEs and Startups (MSS), which is in charge of SME affairs, including technology and innovation, and the other is Korea Small Business Innovation Research (KOSBIR), a program that integrates individual government agencies’ R&D and innovation programs designed to support SMEs.
KOSBIR was launched in 1998, benchmarking SBIR of the United States and based on the Law for the Promotion of Technology Innovation of SMEs. The law makes it compulsory for government agencies and corporations whose annual R&D expenditures exceed 30 billion KRW to allocate a certain proportion of the funds to support SMEs’ R&D and innovation.12)
Currently, 13 ministries and agencies and six government-owned corporations take part in the KOSBIR program, which accounts for 10.26% of the total government R&D expenditures.13) KOSBIR programs are basically open to all SMEs, as defined by the Basic Law for Small and Medium Enterprises (2016) article 2, but individual ministries or funding agencies may set their own rules on the eligibility of
12) In the beginning, support for SMEs’ R&D was a recommendation of the law, but the law later made it compulsory. The proportion varies across agencies as it is set based on the past practices of the individual agency.
13) Excluding the grants provided by government-owned corporations.
(Unit: billion KRW, %)
Source 2011 2012 2013 2014 2015
KOSBIR*Amount 1,507.8 1,741.2 1,728.3 1,726.4 1,936.8
Share 70.0 70.0 66.8 66.1 66.9
MSS ProgramAmount 644.4 745.0 858.7 885.0 957.4
Share 30.0 30.0 33.2 33.9 33.1
TotalAmount 2,152.2 2,486.2 2,587.0 2,611.4 2,894.2
Share 100.0 100.0 100.0 100.0 100.0
�Table 5-11� Government R&D Grants for SMEs
Note: *Excluding the programs funded by public corporations.Source: Oh and Kim (2017).

210�ˍ�2017/18 Knowledge Sharing Program with Visegrad Group
applicants and selection processes in accordance with the nature and objectives of the programs.
The SME Technology Innovation Program is exclusively for SMEs. The program started in 1996 with an annual budget of a mere 7 billion KRW, which has grown to KRW 957.4 billion or 5.07% of the total government R&D expenditures in 2015. The program is administered by MSS and accessible to all SMEs.
3.2.3. Financial Assistance
Financial support is given in the form of policy loans or credit guarantee services. Policy loans are mostly for SMEs in the early stage of growth that have high technological potential but are unable to finance investments required for the realization of growth (through the commercialization of the technologies). The policy loans are to help SMEs meet financial needs, such as (1) investments required to start new technology-based businesses (fund amount: 1,650 billion KRW), (2) the global marketing of new products (fund among: 575 billion KRW), (3) building a foundation for new technology-based growth (fund amount: 1,030 billion KRW), and others related to the commercialization and marketing of new technologies (approximately 10,986 billion KRW). Thus, the total size of the policy loan program for 2017 amounted to 43,563 billion KRW (KOITA, 2017).
Credit guarantee programs are also intended to help SMEs finance their innovation activities, from R&D to marketing. The Korea Technology Finance Corporation (KOTEC) provides technology credit guarantees based on (1) the potential of SMEs’ technologies, (2) intellectual properties that SMEs own, and (3) the potential of SMEs’ R&D projects. As of the end of 2015, KOTEC’s guarantee balance was 20,709.6 billion KRW (2015 Annual Report, KOTEC). For SMEs that are unable to provide collaterals in any forms required to obtain loans, the Korea Credit Guarantee Fund (KODIT) issues credit guarantees.
As of 2017, there are 19 programs to help ease the financial constraints that industries face, of which only two of the policy loan programs are available to LEs (KOITA, 2017).
3.2.4. Human Resources Assistance
One of the most serious problems that SMEs face is limited access to well-trained technical talents. The human resource assistance programs are not only to ease SMEs’ access to high-quality technical manpower, but to provide technical and managerial training for SMEs. Currently, the government offers 15 policy programs to help ease their problems, of which the most widely used include:

Chapter 5 _ Policy Incentives for R&D and Innovation in SMEs: Accomplishments and Issues (Korea)�ˍ�211
(1) The Special Military Service Program: This program gives young scientists and engineers with MS or higher degrees an opportunity to fulfill their military service duty by working at SMEs as researchers for 3 years. To SMEs, this program means a good channel for recruiting well-trained young scientists and engineers who would be otherwise unavailable. SMEs operating R&D centers certified by MSIT and registered with KOITA are eligible for the program.
(2) Support for the employment of retired scientists and engineers: This program offers financial assistance (half the salaries not exceeding 50 million KRW/person a year) to SMEs that employ scientists and engineers with ample technical experience either in the private or public sector.
(3) The Science Card Program: This is a special program to help SMEs and R&D organizations that seek to employ foreign nationals (with an MS degree and more than 3 years of experience or higher degrees) as research workers. If the application of an SME or R&D organization to bring in a foreign scientist or engineer is approved by MSIT, the invitee may be given temporary resident status that is extendable.
3.2.5. Technical Assistance
Currently, the government offers four categories of technical assistance that include:
(1) The promotion of technology partnerships between and among SMEs, universities, and GRIs, such as support for industry-academia-GRI clusters, SME-university collaborative R&D centers, and technical assistance for startups in the ICT field.
(2) Consulting on R&D planning for SMEs: The development of the R&D strategy, drawing up of R&D plans, and other consulting services for SMEs on R&D and innovation.
(3) Support for the commercial utilization of public technologies: Transfer of public-sector technologies to SMEs for commercial application as well as the provision of training and consultancy to strengthen SMEs’ capacity for technology commercialization.
(4) IPR management and the protection of SMEs’ technologies: Help SMEs develop IPR strategies to fully utilize the potential value of their intellectual properties.
3.2.6. Marketing Assistance
To help SMEs commercialize the outputs of R&D and innovation, the government offers various types of support. At the commercialization stage, the support is geared

212�ˍ�2017/18 Knowledge Sharing Program with Visegrad Group
mainly toward helping SMEs meet the financial requirements linked to upscaling, building pilot plants, and so on. The government may provide direct support in in the form of policy loans with lenient conditions or help SMEs by providing credit guarantees so that they can borrow funds without collaterals.
A typical incentive for SMEs that governments offer at the stage of marketing new products is the public purchase program. This program encourages and/or requires government organizations to purchase SMEs’ new technology products that have passed due certification processes. To compensate for SMEs’ weakness in brand image, the government also plays the role of a quality guarantor by issuing a “new product certificate” and “new technology certificate” and/or confers an award recognizing the quality of SMEs’ products or technology. In addition, the government has been encouraging ministries and agencies to purchase SMEs’ new products by establishing the Technology-based Product Purchase Target System (2005).
3.2.7. Eligibility for the Incentive Programs
Basically all enterprises are eligible for the incentive programs for R&D and innovation. However, the specific terms and conditions regarding the qualification of applicants and execution processes are set by the ministries or agencies sponsoring the programs. In the case of the programs of a trans-ministerial nature, eligibility is limited only to the enterprises that operate R&D centers or divisions that meet the requirements set by the Basic Research Promotion and Technology Development Support Act. To be certified as an “R&D center” or “R&D division,” the enterprises have to report the establishment of the centers or divisions to the Korea Industrial Technology Association (KOITA), which is an association of enterprises with R&D centers and mandated by the law to verify the reports and certify them as R&D organizations. The enterprises with such R&D centers become members of KOITA automatically. This scheme is to minimize misbehaviors in the course of the program execution processes as well as the costs of verifying applications and related documents.
Minimum Number of R&D Personnel by Size of Firm Separate Physical FacilityVenture Small Medium Offshore HPE Large
R&D Center 2 3 5 5 7 10 Required
R&D Division 1 regardless of size Not required
�Table 5-12� Requirements for R&D Centers and R&D Divisions
Source: The Basic Research Promotion and Technology Development Support Act, Article 14-2.

Chapter 5 _ Policy Incentives for R&D and Innovation in SMEs: Accomplishments and Issues (Korea)�ˍ�213
3.3. Key Features of the Incentive System
The incentive programs for industrial R&D and innovation in Korea cover all the stages of innovation from R&D planning to the marketing of the final innovation output. However, a greater policy weight is placed on the early innovation stages, including R&D and commercialization, to which R&D grants and tax credits, the biggest chunks of incentives, are directed. This is quite reasonable as it means that the government intervention is focused more on the segments of innovation process where uncertainties and risks are higher and market failure is more likely to occur.
Second, the incentive programs rely more on direct than indirect means of intervention, such as R&D grants, policy loans, technical assistance, and human resource assistance, which are meant to directly compensate for the deficiencies of SMEs instead of inducing the self-correcting efforts of SMEs through indirect measures.
Third, the system is tuned more toward helping SMEs strengthen their internal capacities for growth (e.g., R&D grants, tax credits for R&D and HRD, and technical assistance) without being complicated with policy measures to improve external environments (e.g., the financial market, labor market, and information system) that affect the R&D and innovation behaviors of SMEs.
Fourth, there are too many programs that are not systematically linked to each other and managed independently of each other based on the policy goals of individual ministries and agencies. This creates confusion and misunderstanding among policy clients and discourages SMEs’ participation in the programs, thus contributing to making the programs less effective.
Category IncentivesEligibility
Center Division
Tax
Tax Credits for Expenditures on R&D and HRD Ƞ Ƞ
Tax Credits for Investments in R&D Facilities Ƞ Ƞ
Local Property Tax Deduction/Exemption Ƞ X
Tariff Imports of R&D-related Materials Ƞ Ƞ
R&D Grants National R&D Programs Ƞ Ȗ
HR Military Duty Exemption for R&D Personnel Ƞ X
�Table 5-13� Eligibility for R&D and Innovation Incentives
Source: KOITA (2017).

214�ˍ�2017/18 Knowledge Sharing Program with Visegrad Group
Lastly, one of the unique features of Korea’s incentive system for R&D and innovation is the role of KOITA, an association of industrial R&D centers. KOITA has dual roles as an organization representing the interests of industrial R&D centers to the government and as an agent mandated by the government with implementing certain parts of government support programs for private industrial R&D and innovation. Therefore, KOITA is in an ideal position to mediate between industries and the government for mutually agreeable program design and execution.
4. The Effectiveness of the Major Incentive Programs: Tax Incentives and R&D Grants
4.1. An Overall Assessment
Government support for SMEs’ R&D and innovation is based on the argument that without government intervention, SMEs cannot overcome market failure, which limits their performance and productivity. This argument holds not just because R&D and innovation involve risks and uncertainties, but also because SMEs in Korea are operating in imperfect factor markets (financial and labor markets) with imperfect information. This rationale also suggests that government intervention is more required at the innovation stage, when risks and uncertainties are higher.
Interestingly, Korean SMEs’ pattern of demand for government support is almost exactly the same as what the theory suggests. A recent survey of SMEs in Korea found that government support is most often sought at the R&D stage,14) when uncertainty and risks are highest, and then the need declines as they move toward the marketing stage, when innovation ends. According to the survey, SMEs prefer more than two thirds (69.0%) of support resources to be allocated to the R&D stage (including R&D planning), 24.3% to commercialization, and 6.7% to marketing, which is the final stage of innovation (KBIZ, 2017). Actually, the structure of the Korean government’s incentive program is not so different from being what is desired by the policy clients, as the R&D grants and tax incentives that account for the majority of resources are directed toward promoting R&D and commercialization activities.
With regard to the necessity of incentive programs, SMEs gave the highest score (80.2 out of 100) to tax incentives, 79.2 to R&D grants, 71.3 to human resource assistance, and 66.7 to technical assistance (KBIZ, 2017). This is consistent with KOITA’s 2010 report that tax incentives are most favored by SMEs as a support scheme for R&D and innovation. Following tax incentives were R&D grants, human resource assistance, credit guarantee, and policy loans in order of rating by SMEs (KOITA,
14) Including the R&D planning stage

Chapter 5 _ Policy Incentives for R&D and Innovation in SMEs: Accomplishments and Issues (Korea)�ˍ�215
2010). Tax incentives are favored mainly because they simply offer rewards for R&D and innovation without interfering in the decision processes of the beneficiaries. It seems that such demands of SMEs have been also effectively taken into consideration in the current incentive system as tax credits and R&D grants make up the core of the whole scheme. Thus, it follows that the effectiveness of the incentives for SMEs’ R&D and innovation depends heavily on the effectiveness of the two programs – tax incentives and R&D grants.
Nevertheless, it appears that higher necessity is not necessarily linked to a higher utilization rate. Some programs remain out of the reach of many SMEs, partly because of low awareness among SMEs and partly because of the problems associated with the programs themselves. The 2017 Survey on Technology of SMEs shows that only 30.9% of the respondents had used the tax incentive program, only 10% in the case of R&D grants, 7.1% for technical support for R&D planning, 3.1% for assistance related to commercialization, and so on (2016). On the other hand, KOITA’s 2010 report presents a somewhat different picture: in 2009, the proportions of SMEs that benefited from the tax incentives, R&D grants, and credit guarantees were 65.8%, 35.4%, and 25.4%, respectively, which are significantly higher overall than those reported by the 2017 KBIZ survey. This may stem from the difference in samples between the two surveys: KOITA’s sample was made up of its member enterprises, all of which had R&D centers certified by the law and eligible for the incentive programs; on the other hand, the 2017 KBIZ survey’s sample represents the nation’s population of SMEs. Therefore, it is highly probable that some of the respondents to the KBIZ survey were not only less informed regarding the programs, but also simply ineligible for them. This may be why the KBIZ survey reports a much lower rate of utilization of the programs among SMEs. Nevertheless, the 2017 KBIZ report contains another set of data that seems to justify the low utilization rate: The major reasons that they do not or cannot take advantage of the incentive programs
Incentive Program Necessity (0–100 score) % of Beneficiaries*
Tax Incentives for R&D 80.2 30.9
R&D Grants 79.2 10.0
Support for R&D Planning 78.0 7.1
Commercialization 78.0 3.1
Marketing Assistance 73.9 4.4
Human Resource Assistance 71.3 4.1
Information Assistance 66.7 4.4
�Table 5-14� SMEs’ Evaluation of the Incentive Programs
Note: *% of SMEs that responded that they benefited from the program in 2016.Source: Tabulated based on KBIZ (2017).

216�ˍ�2017/18 Knowledge Sharing Program with Visegrad Group
are administration costs (complicated application processes and documentation requirements), lack of information, and rigid screening processes (KBIZ, 2017). However, what bothers them most appears to be the inconvenience and confusion that the fragmentation of the incentive programs creates.
4.2. Effectiveness of Tax Incentives for R&D and Innovation
4.2.1. An Overview
Tax incentives for R&D and innovation claim the second-largest share of the total national tax deductions (9.04%, 2015), second only to the tax support program for low income earners (Table 5-16). Additionally, the tax credit for R&D and HRD expenditures explains 82-85% of the total tax rewards for business expenditures related to R&D and innovation. The tax credit program for R&D and HRD was first introduced in 1981 and is now one of the longest-surviving tax programs in Korea with no sunset clause.
Tax incentives for R&D and innovation increased continuously after the inception of the program and peaked at 3,498.3 billion KRW in 2013, but have since been declining. This trend is expected to continue into the coming years as many of the tax incentive programs for R&D and innovation are set to expire at the end of 2018 (see 3.2.1. Tax Incentives). This suggests that the effectiveness of tax incentive programs
SMEs’ Level of Knowledge of the
Program*
% of SMEs that Benefited from the
Program**
Evaluation of the Beneficiaries***
Tax Credits 3.1 65.8 96.4
R&D Grants 3.0 35.4 96.0
Credit Guarantee 2.3 14.5 90.2
Policy Loans 2.4 13.3 89.3
Human Resources 3.2 37.1 94.3
Marketing(Product Certification) 2.8 6.9 75.8
�Table 5-15� SMEs’ Awareness and Utilization of R&D Incentive Programs
Note: *0-5 scale: 0 no knowledge, 5 full knowledge **% of SEMs that have benefited from the program ***0-100 gradeSource: KOITA (2010) Analysis and Evaluation of Corporate R&D Centers.

Chapter 5 _ Policy Incentives for R&D and Innovation in SMEs: Accomplishments and Issues (Korea)�ˍ�217
will be in large part determined by the effectiveness of the tax credit for R&D and HRD.
As of 2016, the government offers 48 tax support programs for SMEs, some of which are exclusively for SMEs and others with conditions more favorable to SMEs. However, 71.7% of SMEs do no use them partly because of a lack of information (59.4%) and partly for other reasons (Song, 2017). The tax credit for R&D and HRD is one of the only two tax programs for SMEs that are utilized by more than 50% of eligible users. In 2016, 23,830 SMEs received 10,830 billion KRW as tax credit for R&D and HRD, which is the second-highest among the tax programs for SMEs only after the Special Tax Deduction for SMEs (1,864.3 billion KRW). As such, the tax credit program for R&D and HRD claims to be one of the major tax programs for SMEs, accounting for 18.1% of the total tax benefits given to SMEs in 2016 (Song, 2017).
Even though the tax credit program for R&D and HRD is the major source of tax deduction for SMEs, LEs benefit more. In 2015, SMEs took only 35.7% of the tax deductions accrued from the program, while LEs claimed 64.3%. In the case of the tax credit for investment in facilities for R&D and HRD, the dominance of LEs is even more pronounced – they took 96.4% of the deductions in the same year (Table 5-17). This implies (1) that LEs spend incomparably more on R&D and HRD than SMEs, despite the lower tax credit rate applied to them15), and (2) that LEs are much better informed of the programs and more capable of utilizing them. Tax deductions on R&D and innovation are concentrated in a few large global enterprises much more
15) Tax incentives are by nature favorable to LEs if the same credit rate is applied to SMEs and LEs, because LEs, being stronger both financially and technologically, are more capable of investing in risky and uncertain projects.
(Unit: billion KRW, %)
Tax Deducted Share
Tax Support for Low-income Group 11,134.2 31.01
Tax Incentives for R&D/Innovation 3,254.0 9.06
Tax Support for Regional Balance 1,818.7 5.06
Tax Incentives for Works 1,718.0 4.78
Tax Incentives for Savings 1,740.2 4.84
Tax Incentives for Investments 1,286.6 3.58
Others 14,950.0 41.64
Total National Tax Revenue Foregone 35,901.7 100.00
�Table 5-16� Tax Deductions by Major Programs: 2016
Source: NABO (2017).

218�ˍ�2017/18 Knowledge Sharing Program with Visegrad Group
than suggested by the concentration of R&D investments. As shown in <Table 5-17>, the top company took 25.1% of the total deductions for investing 25.4% of BERD, the top five companies took 36.4% for 39.7% of BERD, and all LEs took 61.1% for 74.2% of BERD.
(Unit: billion KRW, %)
Tax Incentive Programs 2012 2013 2014 2015
Tax Credit for R&D/HRD S* 37.6 48.1 64.3 95.4
Tax Credit for R&D/HRD 2,576.5 2,885.0 2,786.0 2,815.8
Tax Credit for R&D Facilities 155.2 160.0 201.2 150.9
SMEs in Special R&D Zone 20.5 11.8 7.0 4.1
Income Tax Deduction FR** 22.3 21.8 22.1 18.8
Others 340.2 371.6 228.7 169.0
Total Tax Revenue Foregone for R&D (A) 3,152.3 3,498.3 3,309.3 3,254.0
Total National Tax Revenue Deducted (B) 33,380.9 38,350.3 34,838.3 35,901.7
(A/B)x100 9.44 9.12 9.50 9.06
�Table 5-17� Tax Deductions for R&D and Innovation
Note: *Special tax credits for R&D in new-growth technologies (11 areas, 155 technologies, such as future automobiles, AI, next-generation S/W, next-generation ICT, bio-health
** Income tax deduction for researchers who are foreign nationalsSource: NABO (2017).
(Unit: billion KRW, %)
LEs SMEs Total
Tax Credits for R&D and HRD1,776.4 986.6 2,763.0
64.3% 35.7% 100.0%
Tax Credits for Investments in R&D and HRD Facility
145.6 4.7 150.3
96.4% 3.6% 100.0%
Total1,992.0 1991.3 2,913.3
68.4% 31.6% 100.0%
Concentration Ratio**
Top 1 Top 5 Top 10 LEs
Tax Deductions 25.1% 36.4% 40.4% 61.1%
R&D 25.4% 39.7% 45.2% 74.2%
�Table 5-18� Distribution of Tax Deductions between SMEs and LEs*
Note: * Based on 2015 data ** Based on 2011 data Source: NTS data; Noh and Lee (2014, pp.59-60).

Chapter 5 _ Policy Incentives for R&D and Innovation in SMEs: Accomplishments and Issues (Korea)�ˍ�219
Tax deductions for R&D and innovation are the amount of tax revenue that the government abandons to induce R&D and innovation in business sectors. In this sense, tax deductions for R&D and innovation are not different from indirect investments in business R&D and innovation to the government; therefore, they are called ‘tax expenditures’ on R&D and innovation. According to the OECD data, the Korean government’s direct and indirect funding of BERD amounts to over 0.36%, with indirect funding (52%) exceeding direct funding (48%) by 4% (OECD, 2018). The question here is: “Is the R&D tax incentive effective enough to justify the loss of tax revenue?” Alternatively, “How much has the incentive program contributed to the promotion of R&D and innovation in the business sector?”
4.2.2. Effectiveness of the Tax Incentives
The attractiveness of tax incentives is determined by the generosity of tax relief per additional unit of expenditures on R&D and innovation, which is legally set based on economic and political calculations. The Korean tax incentive system for R&D and innovation offers tax subsidy rates that vary depending on the size of the enterprise and business performance. The OECD (2018) estimates that the marginal R&D tax subsidy rate in Korea is 0.26 for profitable SMEs and 0.21 for loss-making SMEs, which are higher than the respective OECD medians 0.19 and 0.15. In the case of LEs, the estimated marginal tax subsidy rate is much lower – 0.03 for profitable firms and 0.02 for non-profitable firms. Even though Korea’s average marginal tax subsidy rate for SMEs is higher than the OECD average, the average tax subsidy rate applied to LEs is lower than the OECD average. It is notable that the marginal subsidy rate of Korea’s tax incentives for loss-making firms is one of the lowest among OECD countries. As such, Korea’s R&D and innovation tax incentive system is more generous to SMEs, particularly to profit-making SMEs (Figure 5-7).
0.60
0.50
0.40
0.30
0.20
0.10
0.00
Direct Government Funding of BERD
Data on Tax Support Not Available
Tax Incentive Support for BERD
Total Government Support for BERD, 2006
RUS
FRA BEL
KOR
HUN IRNAUTGBRUSA SV
NAUSNORCAN ISL NLD JPNDNKPR
TCHNCZESW
E ISR BRA ESP ITAGRC NZL FIN TUR
DEU EST
MEX LUX
POL
ROU
CHELTU SV
KZA
FCHLARG LVA
[Figure 5-6] Government’s Direct and Indirect Funding of BERD: 2015
Source: OECD (2018).

220�ˍ�2017/18 Knowledge Sharing Program with Visegrad Group
In 2015, the R&D and innovation tax subsidy was 3,038.8 billion KRW or 8.5% of the total tax deducts of 35,901.7 billion KRW, which is equivalent to 5.9% of the BERD (51,136.4 billion KRW). Of the R&D and innovation tax subsidy, SMEs’ share was 36.9%, which is slightly higher than SMEs’ share of BERD, which perhaps owes to the R&D and innovation tax incentive system designed in favor of SMEs (see Figure 5-7).
The tax subsidy rate is the rate by which the marginal R&D cost is lowered due to the tax support. Given the tax subsidy rates, two theoretical predictions are possible: (1) BERD will increase more with the tax subsidy than without the subsidy, or the higher the subsidy rate, the higher the rate of increase in BERD; (2) with the subsidy system designed in favor of SMEs, ceteris paribus, SMEs’ share in BERD will increase more relative to that of LEs. Prediction (1) requires rigorous analyses to verify, but prediction (2) may be verified through simple comparisons of data on the BERD of SMEs and LEs.
The Korean government raised the volume-based tax credit rate for SMEs from 15 to 25% in 2009, while lowering the incremental tax credit rate for LEs from 50 to 40% in 2003. If there have not been significant changes in other institutional factors that affect the R&D and innovation behaviors of enterprises, the above changes would have increased SMEs’ share in BERD relative to LEs over the period since the changes took place. If that happened, it may be interpreted that the tax subsidy has been effective in promoting R&D and innovation in SMEs. As predicted, there has been a significant change in SMEs’ share of BERD – it increased from 19.4% in 2006 to 23.8% in 2015, which is partly attributable to the tax subsidy program, which is more favorable to SMEs.
0.30
0.25
0.20
0.15
0.10
0.05
0.00
Large, Proftable SME, Profitable Large, Los-Making SME, Los-Making
2000 2001 2002 2003 2004 2005 2006 2007 2008 2009 2010 2011 2012 2013 2014 2015 2016 2017
[Figure 5-7] Implied Tax Subsidy Rate on R&D Expenditures: Korea 1-B Index by Size of Firm and Performance
Source: OECD (2018).

Chapter 5 _ Policy Incentives for R&D and Innovation in SMEs: Accomplishments and Issues (Korea)�ˍ�221
There have been many attempts to verify prediction (1). There is a general but shaky agreement among the existing studies that the tax credit stimulates business R&D and innovation. Many studies have shown that BERD responds elastically to changes in the tax subsidy or that the tax subsidy induces enterprises to make additional expenditures on R&D and innovation. Despite extensive research and a general agreement on the effectiveness of tax incentives on R&D and innovation, the literature is still in a state of uncertainty owing to several major problems, such as incomplete data, flawed definitions, and price deflators.
Studies on Korea’s tax incentive programs for R&D and innovation are also in agreement on the relationship between the tax subsidy rate and business R&D and innovation. Almost all of the studies found that the tax subsidy promotes business R&D and innovation. For example, Sohn (2002) used data covering the early phase (1981-2000) of the tax incentive program to calculate the B-index with which to examine the response of businesses in R&D and innovation to the changes in the subsidy rate. The study found a positive relationship between the tax subsidy rate and business R&D expenditures. Kim and Sohn (2006) present similar results showing that an increase in the tax subsidy leads to increases in BERD. Won and Kim (2005) examined 2002–2003 data on tax deductions and found a positive relationship between BERD and the tax subsidy rate. The study also shows that the elasticity of BERD with respect to the tax subsidy rate is higher for LEs than for SMEs. Shin’s study (2004) also employed the B-index to examine the relationship between the tax subsidy rate and BERD. The study showed that a 1% decrease in the effective tax rate led to an increase of 1,688 KRW in BERD. Kim (2007) used the panel data of enterprises for an empirical investigation of enterprises’ response to the tax subsidy and found a negative relationship between the R&D cost and BERD. Song (2007) also concurs with other studies on the relationship between the user cost of R&D and BERD.
More recently, Choi (2013) attempted to estimate the effects of the tax subsidy when it is complemented with the R&D grant. The study found that both the tax subsidy and R&D grants have positive impacts on BERD, but that the tax subsidy is more effective than the R&D grant. Almost all of the existing studies concur that tax subsidies lower the user cost of R&D investments and stimulate R&D and innovation activities in the private industrial sector (Table 5-19).

222�ˍ�2017/18 Knowledge Sharing Program with Visegrad Group
As a real-world confirmation of the validity of the research results, the vast majority of enterprises engaged in R&D rate the tax incentive program as highly effective (70.1% of LEs and 64.7% of SMEs) or effective (28.6% of LEs and 31.7% of SMEs), which means policy clients appreciate the program (KOITA, 2015).
4.2.3. Evaluation: Policy Issues
The tax subsidy is very positive in that it is a policy tool that does not intervene in the market processes, does not, in theory, discriminate against enterprises based on size or any other traits, and can be implemented at no or a very low administrative cost. However, the tax incentive is basically more favorable to LEs as far as it treats SMEs and LEs equally, because LEs have stronger innovation capacity (human and financial resources as well as technological capability), are less subject to risks and uncertainties than SMEs, and thus tend to invest more in R&D and innovation, based on which the tax credit amount is determined. In addition, SMEs encounter obstacles in utilizing the subsidy program because of a lack of information, high administration costs, high compliance costs, etc. This justifies Korea’s tax incentive system for R&D and innovation, which applies different subsidy rates to SMEs and LEs.
Korea’s R&D and HRD tax credit program employs a hybrid system allowing enterprises to choose the larger of either volume-based or increment-based tax credit. Korea opted for this system to promote the R&D and innovation activities of both enterprises in the early growth stage when increment-based tax credit may be more favorable and those in the mature stage when the volume of R&D expenditures reaches stable levels.16)
16) The volume-based tax subsidy is more effective than the increment-based tax subsidy in promoting R&D and innovation activities, but may result in larger dead-weight loss by paying for R&D expenditures that would have happened anyway. On the other hand, the increment-based subsidy
Study Main Findings
Sohn, W. (2002) 1% increase in Tax subsidy Ņ 0.364% increase in BERD
Kim, S. and Sohn, W. (2006) Increase in tax deduction rate Ņ Increase in BERD
Won, J. and Kim, J. (2005) LEs respond more elastically than SMEs to changes in tax subsidy rates
Shin, T. (2004) 1% decrease in effective tax rate Ņ 1,688 KRW increase in R&D
Kim, H. (2007) 1% decrease in R&D cost Ņ 0.46–1.1% increase in R&D
Song, J. (2007) 1% decrease in user cost of R&D Ņ 0.16% increase in R&D
Choi, D. (2013) Both tax subsidy and R&D grants have positive effects on BERD, but tax subsidy is more effective in promoting BERD
�Table 5-19� Summary of Empirical Studies on the Effectiveness of the Tax Subsidy Programs
Source: $XWKRU�

Chapter 5 _ Policy Incentives for R&D and Innovation in SMEs: Accomplishments and Issues (Korea)�ˍ�223
Overall, as the survey of Korean literature shows, the R&D and innovation tax incentive programs have been very effective in promoting R&D and innovation in the business sector, which is very encouraging, but there are problems, too.
(1) Fragmentation of programs: There are currently 10 tax incentive programs for R&D and innovation with different rates. In addition, 48 more tax subsidy programs are available to SMEs. This means that SMEs would incur substantial costs to utilize the programs offered by the government (information and learning costs, etc.).
(2) Even though the tax credit rate for LEs is much lower than that for SMEs, LEs’ shares of tax deductions are almost the same as their shares of BERD, which means that LEs are more capable of reaping the opportunities offered. To make the program more effective, it is desirable to make the program simpler and easier to use to make it easier for SMEs to use the incentive programs.
(3) Overall, the tax system is in favour of profit-making SMEs, which means it is not favorable to SMEs at the earlier stage of business, when profit-making is more difficult but SMEs are more in need of assistance.
(4) The tax credit program for R&D and HRD in strategic technology areas may overlap with the R&D grant programs that provide funds for the development-targeted technologies. Basically, tax incentives, being neutral in nature, are not an effective tool for attaining pre-set technological targets. Thus, they should be replaced by the R&D grant program.17)
4.3. Effectiveness of R&D Grants for SMEs
4.3.1. An Overview
The Korean government allocates more than 20% of its R&D budget to the private business sector, which is already the largest funder (approximately 75%) of GERD (Table 5-9 and 5-10). According to the OECD, the Korean government’s direct and indirect support for private business R&D and innovation amounts to 0.36% of the GDP, which is among the highest in the OECD (Table 5-7). In addition to the tax incentives, the government transfers more than 20% of its R&D budget to the business sector through grant programs (e.g., 62 programs in 2017), as discussed earlier – 14.8% to SMEs, 3.2% to HPEs, and 3.3% to LEs. Thus, the government grant is also very much oriented toward helping SMEs.
may incur less dead-weight loss, but it has little effect on R&D price elasticity and thus is not very effective at accelerating R&D and innovation.
17) The tax credit for R&D and HRD in strategic technology areas expires at the end of 2018.

224�ˍ�2017/18 Knowledge Sharing Program with Visegrad Group
R&D and innovation grants for SMEs are packaged in two umbrella programs: (1) the Korea Small Business Innovation Research (KOSBIR) program, which is an integration of R&D and innovation grant programs for SMEs of individual ministries and agencies, and (2) the SME Technology Innovation Program of MSS. The MSS program was launched in 1996 together with the opening of the Small and Medium Business Administration (SMBA),18) and it was joined by the KOSBIR program in 1998. The SME Technology Innovation Program is administered by MSS, while KOSBIR programs are administered by R&D funding and management agencies under individual ministries and agencies. Therefore, in the case of KOSBIR, the terms and conditions of grants vary across programs, which is the source of one of the complaints of SMEs. It was also in 1996 that the Koran government institutionalized a stock market for SMEs (particularly new technology-based SMEs,) KOSDAQ (Korean Security Dealers Automated Quotation), as an SME market division of the KRX.
During the period of 1998-2016, when the government pushed ahead with the SME policies for R&D and innovation, grants for SMEs increased by more than seven times from 386.7 billion KRW to 2,943.1 billion KRW. In particular, the growth of the MSS program was phenomenal – from a mere 42.5 billion KRW in 1998 to KRW 942.9 billion 2016.
18) The SMBA has been reorganized into the Ministry of SMEs and Startups (MSS).
(Unit billion KRW, %)
2011 2012 2013 2014 2015
R&D Budget 14,853 15,904 16,914 17,639 18,875
Public Laboratories 4.9 4.8 4.8 5.0 5.1
GRIs 38.4 40.4 41.3 42.5 41.4
Universities 25.4 23.4 23.5 23.3 22.6
LEs 9.3 9.1 5.1 3.9 3.3
HPE - - 3.9 3.1 3.2
SMEs 12.4 13.2 13.0 13.7 14.8
Government Agencies 2.5 2.7 2.6 2.5 3.3
Others 7.0 6.4 5.7 6.0 6.3
Total 100.0 100.0 100.0 100.0 100.0
�Table 5-20� Allocation of Government R&D Funds
Source: NTIS.

Chapter 5 _ Policy Incentives for R&D and Innovation in SMEs: Accomplishments and Issues (Korea)�ˍ�225
Over five recent years (2011-2015), the government has provided SMEs with a total of 12,731 billion KRW of R&D and innovation grants, of which KOSBIR accounts for 67.9%. During this period, the programs have awarded 54,031 projects to 73,475 SMEs: 28,319 MSS program projects (4,090 billion KRW) to 30,909 SMEs and 25,712 KOSBIR projects (8,641 billion KRW) to 54,031 SMEs. The average project size of the KOSBIR program was 336 million KRW (approximately 300 thousand USD) and, in the case of the MSS program, 144 million KRW (approximately 120 thousand) (Oh and Kim, 2017).
Oh and Kim (2017) classified the projects by objective into 4 groups:
(1) Building R&D capacity: Strengthening the R&D and innovation capacity of SMEs by financially complementing the R&D activities of SMEs;
(2) Promotion of growth: Supports focused on the commercialization of technologies;
(3) Promotion of SMEs’ entry into global market: Supports for the development of new technologies or improvement of existing technologies to expand SMEs’ participation in the global value chain;
(Unit: hundred million KRW)
30,000
25,000
20,000
15,000
10,000
5,000
-1999 20001998 2001
MSSKOSBIR
2002 2003 2004 2005 2006 2007 2008 2009 2010 2011 2012 2013 2014 2015 2016
425
3,442
580
3,518
810
4,358
1,311
5,147
1,587
5,596
1,740
5,844
2,121
6,624
2,350
8,275
2,670
8,717
3,599
9,770
4,290
10,465
4,870
12,249
5,607
12,905
5,444
15,078
7,450
17,412
8,587
17,283
8,850
17,264
9,574
19,968
9,429
20,002
[Figure 5-8] Growth of R&D and Innovation Grants for SMEs
Source: Oh and Kim (2017).
(Unit billion KRW, number)
2011 2012 2013 2014 2015 Total Projects(number)
SMEs (number)
KOSBIR 1,508 1,741 1,728 1,726 1,937 8,641 25,712 54,031MSS 644 745 859 885 957 4,090 28,319 30,909Total 2,152 2,486 2,587 2,611 2,894 12,731 54,031 73,475
�Table 5-21� R&D and Innovation Grants for SMEs: 2011–2015
Source: Tabulated based on Oh and Kim (2017).

226�ˍ�2017/18 Knowledge Sharing Program with Visegrad Group
(4) mission-oriented project: Development of technologies required to solve policy issues of individual ministries or agencies.
According to Oh and Kim (2017), 29.7% of the grants went to category (1), 39.6% to category (2), 24.7% to category (3), and 6.0% to category (4). This seems to explain that R&D and innovation efforts of SMEs in Korea are still focused on R&D capacity building and/or attaining competitiveness in the domestic market. In addition, 66.7% of the grants have been awarded to SMEs in manufacturing sectors.
4.3.2. Effectiveness of R&D and Innovation Grants for SMEs
The increases in the volume of R&D and innovation grants for SMEs have been accompanied by more-than-proportionate increases in questions about the effectiveness of the grant programs. As the rationale for government support is based on the market failure argument that without government intervention, SMEs may end up investing in R&D and innovation less than optimally, leading to economic and social losses, the question is whether the programs have contributed to the growth of R&D and innovation in the private business sectors.
The effectiveness of a support program is basically determined by the response of the program clients, SMEs. Due to lack of data, it is hard to know how many SMEs have applied for the grants. Noh (2014) compiled data on SMEs that received the R&D and innovation grants19) during the period 2008-2013. According to the data, a total of 26,012 project grants were awarded to 15,935 SMEs, which means that, on average, 17.6% of the SMEs with R&D centers benefited from the programs. If all the SMEs with R&D centers have tried one way or another to obtain the grants, it means that about 17% (weighted average) of the SMEs with R&D centers have benefited from the programs. This is indirectly supported by the Jeonja Shinmoon (Nov. 2, 2016), which reports one out of 5.2 applications was awarded the grant in 2016. This also may mean that the R&D and innovation grant programs are very popular among SMEs in Korea.
19) The data include only the projects of which SMEs’ shares are 50% or larger.
(Unit: number, %)
2008 2009 2010 2011 2012 2013
Awardees (A) 3,290 3,021 3,241 3,501 5,013 5,302
Projects 3,568 3,265 3,562 3,975 5,776 5,858
R&D Centers (B) 16,717 18,772 21,785 24,291 25,860 28,771
A/B (%) 19.7 16.1 14.9 14.4 19.4 18.4
�Table 5-22� Number of R&D Grant Projects and SME Awardees
Sources: Noh (2014, p.38) and KOITA (2015).

Chapter 5 _ Policy Incentives for R&D and Innovation in SMEs: Accomplishments and Issues (Korea)�ˍ�227
Then, is the growth of BERD due to the growth of the grants? How much is the growth of SMEs’ BERD attributable to the increases in the government grants? Many have attempted to investigate the effectiveness of government direct subsidies to influence private decisions on R&D and innovation investments. The results are mixed: Some studies found that government subsidies crowd out private investments, while others reached the opposite conclusion that government subsidies have additionality effects on private R&D investments. Studies to evaluate the Korean government grant programs also differ little from the existing literature in that they have not been able to present conclusive analytical evidence to verify the effectiveness of direct subsidies.
Shin (2004) used a 20-year time-series dataset to statistically examine the relationship between government grants and business R&D and innovation. The study estimates that 1 KRW increase in grant leads to an increase of 2.27 KRW in business R&D and innovation investment. Lee (2004) also presents a result supporting the additionality argument that there exists a positive relationship between government grant and business R&D and innovation (based on 1995-1998 cross-section time–series data). Kim (2008) looked into the cases of new start-ups and found government grants do promote R&D and innovation activities of newly founded companies. Choi and Kim (2007) found that a 1% increase in grant brings about 0.03% increase in internal funding of R&D and innovation of businesses. Oh and Chang (2008) also derived similar results from an analysis of 2000–2003 data.
However, Kwon and Koh (2005) derived a quite different result from an analysis of 1995–1998 data. From a statistical analysis controlling for simultaneity, they found that an increase in grant results in a decrease in business R&D and innovation – a crowding-out effect. Kim (2007) found that government grants crowd out business R&D and innovation investment. Song and Kim (2009) presents a mixed result that there exist an additionality effect in the case of grants to LEs, but grants to SMEs crowd out internal R&D and innovation funding.
A study at the Science and Technology Policy Institute (STEPI) looked into the innovation performances of SMEs that benefitted from the grant programs and those that did not during the period of 2011-2015. The comparative analysis of R&D and innovation performances of beneficiaries (47,149) and non-beneficiaries (119,323) shows: (1) the average R&D intensity (R&D/sales) of beneficiaries (14.9%) was much higher than that of the non-beneficiaries (1.2%); and (2) the government R&D grant programs have been effective in promoting R&D and innovation in SMEs, and (3) more interestingly, the additionality effect continued for more than three years after grants were given (Oh and Kim, 2017).

228�ˍ�2017/18 Knowledge Sharing Program with Visegrad Group
Similar statistical evidence in favor of government grants is presented by a study done at the Korea Institute of S&T Evaluation and Planning (KISTEP). They found: (1) the elasticity of SMEs’ R&D expenditures with respect to government grants is 0.2187, which mean that R&D grants do promote SMEs’ R&D and innovation, and (2) the elasticity of R&D expenditures at time t with respect to a government grant at t-1 and t-2 turned out to be greater than “0,” which means the effect continues for 3 years (Choi, 2014). The National Assembly Budget Office (NABO) reports similar effects of R&D grants. A study by Noh and Lee (2014) for NABO estimates that the elasticity of private R&D investment with respect to government grants ranges between 0.089 and 0.145.
Overall, the existing studies in Korea appear to be in agreement on that government R&D grants have positive effects on R&D and innovation performances of SMEs.
Study Main Findings
Shin T. (2004) Increase of 1 KRW in grant Ņ 2.27 KRW increase in business R&D
Lee, B. (2004) Positive relationship between grant and BERD
Kim, K. (2008) Grant to startups Ņ promotion of R&D and innovation of startups
Choi, S., & Kim, S. (2007) 1% increase in grant Ņ 0.031% increase in business R&D
Oh, J., & Chang, W. (2008) Positive relationship between grant and business R&D & innovation
Song, J., & Kim, H. (2009) No significant relationships
Kwon, N., & Koh, S. (2005) Grants crowd out business R&D investments
Kim, H. (2007) 1% increase in grant Ņ�0.06–0.09% decrease in business R&D
Oh, S. Kim, S. (2017) Additionality effect continues on for 3 years
Choi, D. (2014) Additionality effect continues on for 2 years
Noh, M., & Lee, S. (2014) 1% increase in grant Ņ 0.089–0.145% increase in business R&D
�Table 5-23� Summary of Empirical Studies on the Effectiveness of R&D Grants on Business R&D and Innovation
Source: Author.

Chapter 5 _ Policy Incentives for R&D and Innovation in SMEs: Accomplishments and Issues (Korea)�ˍ�229
4.3.3. Evaluation: Policy Issues
Unlike the existing literature globally that presents mixed evaluations on the effect of direct subsidies on SMEs’ R&D and innovation, the majority of empirical studies in Korea find that direct subsidies have been effective in accelerating business R&D and innovation in Korea. Theoretically, direct subsidy is an effective tool to promote the development of strategic goals, and one of its merits is that decisions can be made based on pre-estimated costs. However, it may distort R&D resource allocation and incur high planning and implementing costs. Therefore, to make the programs more effective, policy attention should be given to the following:
A. Korea has too many grant programs for SMEs’ R&D and innovation that are fragmented and not systematically interlinked. Their being too many fragmented programs creates confusion and discourages the eligible users from using the programs.
B. Direct subsidy programs should be clear about the goals and processes, and should not last too long, as long-lasting subsidies may just deepen the private sector’s dependence on the government instead of contributing to attaining the policy goals.
C. KOSBIR programs need to be simplified, systemized, and interlinked. The problems may be corrected, if the MSS is given the role of coordinating and monitoring KOSBIR programs, which are currently implemented in a very fragmented manner by individual ministries and agencies.
D. It is also important to link the direct subsidy programs to indirect subsidy programs to reap a synergy effect between the two.
4.4. Accomplishments and Issues
4.4.1. Accomplishments
Korea’s incentive system for SMEs’ R&D and innovation seeks to achieve two objectives: (1) Promote SMEs’ R&D and innovation activities by lowering R&D costs through tax subsidies (about 55-60% of the total subsidies), (2) simultaneously pursuing strategic technological development through R&D grants (40-45% of the total subsidies).
Based on the analyses on the effectiveness of the incentive programs for SMEs’ R&D and innovation, one can conclude:

230�ˍ�2017/18 Knowledge Sharing Program with Visegrad Group
(1) The government support programs, direct and indirect, have contributed to the growth of SMEs’ R&D and innovation expenditures as well as BERD as a whole. As of 2014, Korea’s BERD reached almost 3.5% of GDP, one of the highest in the world; this is attributed to various factors, but one of the most direct contributors are tax subsidies and government grants for R&D and innovation (Figure 5-9).
(2) Not only have the support programs accelerated the growth of R&D and innovation activities of SMEs, but also they have contributed to the significant improvement of the quality of R&D and innovation, which is well-evidenced by the increase in the share of SMEs in industrial patents (2005-2015) (Figure 5-10). SMEs’ share of patent applications increased remarkably between 2005 and 2014, from 21% (or 9,789 cases) to 43% (26,327 cases).
4.0
3.5
3.0
2.5
2.0
1.5
1.0
0.5
0.0
(%)
0.00 0.05 0.10
BERD
, as %
of G
DP
0.15 0.20 0.25 0.30 0.35 0.40 0.45(%)
RUS
FRA
Total Government Support (direct and tax) to Business R&D, as % fo GDP
No Incentive
IRL
HUN
BEL
AUT
SVN
KOR
USA
JPN
GBR
CAN
AUSNLD
ISL
SWE
ISR
DNKCHN
FIN
DEU
CHE
75 million USD (PPP) 250 million USD (PPP) 2,500 million USD (PPP)No Data Available
CZE
NOR
PRTESP
BRAGRCMEX
AZF
TURNZLESTPOL
ITAMLTHRV
BGRSVKCYP
LVA CHLLIT ROU
[Figure 5-9] Government Support and BERD: An International Comparison (in 2014)
Source: OECD (2017).

Chapter 5 _ Policy Incentives for R&D and Innovation in SMEs: Accomplishments and Issues (Korea)�ˍ�231
(3) The growth of technological capabilities of SMEs has pushed SMES toward industries of higher technology intensity — say, from low-technology light industries to more technology-intensive heavy and chemical industries. In 2000, 38% of SMEs belonged to low-technology light industries, but the proportion was reduced to 30.5% in 2014.
(4) These developments have enabled SMEs to surpass LEs in terms of contribution to the growth of not only employment but also production as well as value-addition for the manufacturing industry. In the early stages of development (1960s-1970s), it was LEs that led the growth of both production of value added and employment, but the pattern was reversed in the 1990s when government shifted SME policy focus toward promoting innovation.
(Unit: %)
90.0
80.0
70.0
60.0
50.0
40.0
30.0
20.0
10.0
0.02005
79.0
2010 2014
LEs SMEs
21.0
40.2
39.3
57.0
41.0
[Figure 5-10] Shares of Industrial Patent Applications: LEs vs. SMEs
Source: KIPO (2015).
(Unit: %)
2000 2004 2014
Light Industries% of Manufacturing 25.3 23.0 18.0
% of SMEs 38.0 35.1 30.5
H-C Industries% of Manufacturing 74.7 77.0 80.0
% of SMEs 62.0 64.9 69.5
�Table 5-24� Structural Shift of SMEs
Source: KOSIS.

232�ˍ�2017/18 Knowledge Sharing Program with Visegrad Group
4.4.2. Factors that Enable the Support Programs to Work
Several factors may explain how the incentive programs could work as effective policy tools in promoting R&D and innovation in SMEs in Korea.
First of all, the successful performance of the programs owes much to the fact that the government and SMEs share common interests in promoting R&D and innovation. For example, the grant programs are linked closely to the policy issues of the sponsoring ministries, and tax incentives were designed to serve the policy goal of inclusive development, and thus allocate more policy resources for the promotion of SMEs’ R&D and innovation.
Second, the programs have been designed and implemented based on mutual interactions between the government and SMEs (and LEs). For the interactions, KOITA, an association of policy beneficiaries (corporate R&D centers), has been playing a unique and very important role as an intermediary between the government and SMEs.
Third, the government support programs offer a balanced mix of incentives: (1) Tax subsidies (about 60% of the government support) to lower the cost of R&D and innovation and R&D and innovation grants (about 40%) aimed at attaining technological capability in strategic areas are combined together to accelerate SMEs’ R&D and innovation as well as structural transformation; (2) Tax incentives: Volume-based credit for the established enterprises that maintain stable levels of R&D expenditures over time, and increment-based credit for those at the growth stage, when R&D expenditures grow by leaps and bounds, and so on.
Fourth, the programs have been designed and implemented in such a way to minimize frauds or misbehaviors, such as the certification system of corporate R&D centers, clear definition of terms and processes, and so on.
(Unit: %)
1963-1969 1970-1979 1980-1989 1990-1999 2000-2009 2010-2014
EmploymentSMEs 38.1 47.1 81.9 Ȗ6.8 128.7 80.3
LEs 61.9 52.9 18.1 Ȗ93.2 Ȗ28.7 19.7
Value-addedSMEs 25.7 35.7 47.4 50.5 50.8 83.1
LEs 74.3 64.3 52.6 49.5 49.2 26.9
�Table 5-25� Contribution of SMEs and LEs to the Growth of Employment and Value Addition: Manufacturing Industry
Source: KOSIS.

Chapter 5 _ Policy Incentives for R&D and Innovation in SMEs: Accomplishments and Issues (Korea)�ˍ�233
Lastly, the most important is the consensus on the importance of SMEs’ innovation capacity for the growth and sustainability of the economy, especially in terms of the role of political leaders in translating the consensus into political actions.20)
4.4.3. Issues
Despite the positive performance of the incentive programs for SMEs’ R&D and innovation, there remain problems that may constrain the growth of SMEs.
First of all, the support programs have contributed to the promotion of R&D and innovation activities of SMEs, but have simultaneously helped deepen SMEs’ reliance on government intervention, financial and non-financial. That is particularly so in the case of small firms (employing less than 50) that depend on government grants for more than 18% of their R&D expenditures. The Korean government gives out about 17% of its R&D budgets and generous tax reliefs for R&D and innovation to SMEs (SMEs+HPEs), which add up to 0.36% of GDP (highest among OECD countries). SMEs are so accustomed to government supports that they tend to call for government intervention to solve even the problems that can best be fixed through market processes.
Second, there are too many government R&D support programs that are more or less fragmented and not effectively interlinked, which creates confusions and misunderstanding among potential beneficiaries. For R&D grants alone, 13 ministries and agencies and six public corporations offer more than 60 programs, in addition to the MSS programs, which are executed under different terms and conditions. It may be very hard for SMEs to comprehend the diverse processes and to comply with the requirements that vary across ministries. This may be redressed if the MSS is made responsible for coordinating and monitoring KOSBIR programs, which are currently implemented by individual ministries and agencies in a very fragmented manner.
Third, the tax subsidy is very generous to profit-making SMEs, while it is rather stingy to unprofitable SMEs. It would be unfair if SMEs in the early stage of growth could not fully take advantage of the tax incentives for their R&D and innovation expenditures because they failed in making profits, which is very likely for those in the early phase of business.
Fourth, the incentive programs are focused too much on strengthening the internal innovation capacities of SMEs: Policy attention needs to be shared with making the external environment more conducive to innovation, such as by (1) widening SMEs’ access to skills and talents, (2) making financial market friendlier to SMEs, and (3) developing a system that provides SMEs with easier access to information on technology and market.
20) No doubt, the political support may be in part a kind of response to the political pressure of SMEs.

234�ˍ�2017/18 Knowledge Sharing Program with Visegrad Group
Fifth, however effective the support programs are, they should not be left unchanged for long, because, if they last too long without being adjusted to changes in market, they may do more harm and good for the healthy growth of SMEs in the long-run.
Lastly, the incentive system needs to be adjusted to newly emerging policy demand with the advance of Industry 4.0. As the majority of SMEs in Korea are not ready, technologically and in other ways, to reap the opportunities and meet the challenges that Industry 4.0 offers, the government may use the incentive system to help SMEs prepare for the imminent sea-change in industry (SBC, 2017). In particular, SMEs are badly in need of well-trained technical manpower who can navigate SMEs through the processes of digital transformation.
5. Conclusion: Policy Implications for the V4 and Korea
5.1. Summary SMEs in Korea comprise over 99% of business enterprises and employ more than
87% of workers but account for only 24% of business R&D and innovation. This suggests two important implications: (1) For sustainable growth and employment, Korea has to look to SMEs that offer great rooms for development and growth, and (2) for SMEs to grow requires internal capacity, which is determined by R&D and innovation. In addition, SMEs’ R&D and innovation behavior is bound by internal resource availability and contextual factors, including scale effect and technology intensity of industries in which they operate. This leads to an argument that the role of SMEs in R&D and innovation is determined in large part by the nature of the industries in which they operate. SMEs play a leading role in R&D and innovation in industries where scale effect is insignificant and technology intensity is low. However, it appears that SMEs may also claim a leadership role even in high-technology industries if the scale effect is not overwhelming. This pattern of role division in R&D between SMEs and LEs may shed some light on how to design incentive programs for SMEs’ R&D and innovation.
The incentive programs for industrial R&D and innovation in Korea cover all stages of innovation, from R&D planning to the marketing of the final output of innovation. Nevertheless, a greater policy weight is placed on the early stages of innovation, including R&D and commercialization, to which R&D grants and tax credits, the biggest chunks of incentives, are directed. This is quite reasonable as it means that the government intervention is focused more on the segments of innovation process where uncertainties and risks are higher and market failure is

Chapter 5 _ Policy Incentives for R&D and Innovation in SMEs: Accomplishments and Issues (Korea)�ˍ�235
more likely. Tax credits and R&D grants make up the core of the whole scheme. Thus, the effectiveness of the whole incentive system for SMEs’ R&D and innovation depends heavily on the effectiveness of these two programs.
Korea’s incentive system for SMEs’ R&D and innovation seeks to achieve two objectives: (1) Promote SMEs’ R&D and innovation activities by lowering R&D costs through tax subsidies (about 55-60% of the total subsidies), (2) while simultaneously pursuing strategic technological development through R&D grants (40-45% of the total subsidies).
Based on the analyses on the effectiveness of the incentive programs for SMEs’ R&D and innovation, one can conclude:
s The government support programs, direct and indirect, have contributed to the growth of SMEs’ R&D and innovation expenditures as well as BERD as a whole. As of 2014, Korea’s BERD reached almost 3.5% of GDP, one of the highest in the world, which is attributed to various factors but for which one of the most direct contributors are tax subsidies and government grants.
s Not only have the support programs accelerated the growth of R&D and innovation, but they have also strengthened the technological capabilities of SMEs. This has enabled SMEs to move toward higher technology-intensive industries - say, from low-technology light industries to more technology-intensive heavy and chemical industries. These developments have enabled SMEs to surpass LEs in terms of contribution to the growth of employment as well as value-added production.
The factors that explain the accomplishments of the incentive system may include the following:
s Government-SMEs interaction: The government and SMEs interacted for the design of the system, with KOITA as an intermediary. - Linkage of the programs to national development goals: Programs have been
designed in accordance with the national development strategy.- Effective program mix: balanced mix of incentives and R&D grants, mix of
volume-based and increment-based tax credits, etc.- The programs have been designed in a way to minimize misbehaviors and/or
frauds, such as clear definition of terms and conditions, system to verify R&D and innovation activities, etc.
- The most important factor that contributed to making the incentive programs for SMEs’ R&D and innovation effective is the consensus of the Korean society about the critical role SMEs in the national economy.

236�ˍ�2017/18 Knowledge Sharing Program with Visegrad Group
5.2. Issues
Despite the positive performance of the incentive programs for SMEs’ R&D and innovation, there remains room for improvement, such as:
s The incentive system relies more on direct than indirect means of intervention, such as R&D grants, policy loans, technical assistance, human resource assistance, and so on, that are meant to directly compensate for the deficiencies of SME instead of inducing self-correcting efforts of SMEs through indirect measures.
s The support programs have been effective in promoting R&D and innovation activities of SMEs on the one hand, but on the other, they helped deepen SMEs’ reliance on public funds.- Small firms (employment size less than 50) depend on government grants for
more than 18% of their R&D expenditures.- The Korean government allocates about 17% of its R&D budgets for SMEs
(SMES+HPEs).- Government R&D subsidies (direct and indirect) for private industries amount
to 0.42% of GDP, which is the highest among OECD countries.- If this lasts too long, SMEs may get addicted to the subsidies, without which
they would not be able to grow.s The excessive diversity and numerousness of the R&D support programs create
more problems than opportunities to SMEs:- For R&D grants alone, 13 ministries and agencies and six public corporations
offer over 60 programs, in addition to the MSS programs.- It would be very hard for SMEs to comprehend the diverse processes and
comply with the requirements that vary across ministries and agencies.s The incentive programs are focused too much on strengthening the internal
innovation capacities of SMEs: More policy attention needs to be given to improving external environment. - In particular, SMEs’ access to skills and talents needs to be made much easier
than it is now. s The tax subsidy is very generous to profit-making SMEs, while it is rather
stingy to unprofitable SMEs. It would be unfair if SMEs in the early stage of growth could not fully take advantage of the tax incentives for their R&D and innovation expenditures because they failed in making profits, which is very likely for those in the early phase of business.
s Lastly, the incentive system needs to be adjusted to newly emerging policy demand generated by the advance of Industry 4.0. It has been found that SMEs in Korea are not ready, technologically and in other respects, to take advantage of the business opportunities Industry 4.0 is promising. Thus, the incentive system ought to be adjusted to facilitate SMEs’ digital transformation.

Chapter 5 _ Policy Incentives for R&D and Innovation in SMEs: Accomplishments and Issues (Korea)�ˍ�237
In particular, SMEs are badly in need of well-trained technical manpower that can navigate SMEs through the rapid digital transformation.
5.3. Policy Implications
The Korean government’s subsidy programs, direct and indirect, have contributed to the growth of SMEs’ R&D and innovation expenditures as well as BERD as a whole. As of 2014, Korea’s BERD reached almost 3.5% of GDP, one of the highest in the world, which is attributed to various factors, including tax subsidies and government grants. The subsidy programs have not only accelerated the growth of R&D and innovation but also enhanced the technology-intensity of SMEs, facilitating the growth of innovative SMEs.
Korea’s policy experience of last 2-3 decades to promote SMEs’ R&D and innovation suggests several policy implications for the V4 countries:
(1) For a successful implementation of the policy programs, it would be very helpful to engage the policy clients (SMEs) in the whole processes of the program development and implementation. In the case of Korea, this has been done through KOITA, an association of corporate R&D centers.
(2) To accelerate SMEs’ R&D and innovation through incentives, it is desirable to offer a mix of different programs for the same purpose to meet the diverse needs of SMEs.s For example, SMEs in the early phase of business tend to prefer direct
grants to tax subsidies, because tax subsidies are in general not favorable to non-profit-making SMEs. If direct and indirect subsidies are offered, SMEs may choose one of the two or both, depending on their needs and interests.
s In the case of tax incentives, volume-based credit is more favorable to those that have reached a stage where annual R&D and innovation outlays stay stable, while an increment-based credit system is better for those in the early stages of business. Therefore, to serve diverse policy demands of SEMS, it would be desirable to offer a mix of the two schemes.
(3) Incentive programs for SMEs should be designed to be simple and clear so that SMEs can comprehend easily and use the programs at low cost.s Too many programs administered by diverse government agencies may not
only create confusion and misunderstanding but also increase SMEs’ cost of compliance with the diverse requirements.
s The problems may be corrected by institutionalizing a system of coordinating and monitoring the programs for SMEs that are offered by diverse ministries and agencies.

238�ˍ�2017/18 Knowledge Sharing Program with Visegrad Group
(4) Another important lesson form Korea is that even though consistency in policy is very desirable, too long-lasting subsidy programs may do more harm than good to the long-term health of SMEs. Excessively long-lasting subsidies may help SMEs develop a kind of habitual reliance on the government for the solution of whatever problems they face in the market. Many in Korea are pointing to the problem of what they call “Peter Pan Syndrome,”21) which refers to the behavior of SMEs that avoid growth to remain eligible for the government subsidies for SMEs.
(5) It has been found that SMEs are doing better in R&D and innovation in high-technology industries with smaller economies of scale.22) So, R&D and innovation incentives may work more effectively with SMEs operating in high-technology industries where the economies of scale are not significant.
(6) The incentive system needs to be adjusted to newly emerging policy demand generated by the advance of Industry 4.0. It has been found that SMEs in Korea are not ready, technologically and in other respects, to take advantage of the business opportunities Industry 4.0 is promising. Thus, the incentive system ought to be geared more toward:s Strengthening digital capabilities of SMEs (digital transformation)s Improving SMEs’ access to skills and talents capable of navigating through
the increasingly digitalizing industrial developmentss Resetting the relationship between LEs and SMEs from vertical inter-firm
linkages to horizontal technological cooperations Promoting globalization of SMEs’ R&D and innovation so that they can play
a significant role in the global value chain.
21) “A regulatory environment in which firms prefer to stay small rather than grow. A Peter Pan syndrome is characterized by a significant portion of firms remaining small, even though the firms could be more productive and profitable if they were larger.” (Investopia Academy, http://www.investopia.com)
22) Ref. discussions in subsection 2.3.

Chapter 5 _ Policy Incentives for R&D and Innovation in SMEs: Accomplishments and Issues (Korea)�ˍ�239
References
Abel-Koch, Jennifer (Ed) (2015) SME Investment and Innovation, France, Germany, Italy and Spain, Frankfurt: KfW Bankengruppe
Aitkinson, J., and Storey, D. (1994) Small firms and employment, in Aikinson, J. and Storey, D, (Ed) Employment, the Small Firm and the Labour Market, London: Routeledge
Cho, D. (2013) Analysis on the Policy Effects of Government Support for Industrial R&D, Research Report 2014-303, Seoul: KISTEP (Korean)
Choi, J. (2014) Innovation-Oriented Public Purchase System for Innovative SMEs, STEPI Insight 143, STEPI (Korean)
Choi, S. and Kim, S. (2007) Effects of Government R&D Grants on Firms’ Internal Funding of R&D, Innovation Studies 10 (4) pp.706-726 (Korean)
Hankyung (November 1, 2017, A1) (Korean)
IRI (2016) Global R&D Funding Forecast, A supplement to R&D Magazine Jeonja Shinmoon (Nov. 2, 2016) (Korean)
KBIZ (2017) 2017 Survey on Technology of SMEs, Seoul: KBIZ
Kim, H. (2007) Analysis of the Effects of Tax Incentives for R&D Investments, Research Report 07-4, Seoul: KERI (Korean)
Kim, K. (2008) Analysis of the Effects of Government R&D Subsidies on Firms’ Performance, Policy Research 2008-07, Seoul: KDI (Korean)
Kim, M. (2011) The Impacts of Policy Tools on Firms’ Innovation: Tax Expenditures and Direct Subsidies, Hankuk Jeongchaek Hakhoi Bo (Bulletin of the Korea Society Policy of Policy Studies) 20 (47), pp.1-26 (Korean)
Kim, S., and Sohn, W. (2006) The Effects of Tax subsidies on Firms’ R&D: An Analysis based on Firms’ Tax Deduction Data, Gongong Gjeongje (public Economy) 11 (2), pp. 139-156 (Korean)
KIPO (2015) The Patent Trend in Korea 2014-2015, Daejeon: KIPO (Korean)
KOITA (2010) Analysis and Evaluation of Corporate R&D Centers, Seoul: KOITA (Korean)
KOITA (2017) Support Programs for Technology Innovation for Innovation-based Growth, Seoul: KOITA (Korean)
KOSBI (2017) Improvement of Tax Incentives for the Promotion of SMEs’ R&D, KOSBI SME-Focus 17-05, Seoul: KOSBI (Korean)
KOSBI (2006) The Evolution of SME Policy and Issues for Reform, Seoul: KOSBI (Korean)
KOSBI (2014) Polices to Protect SMEs’ Technology: Current State and Issues, KOSBI SME-Focus 14-17, Seoul: KOSBI (Korean)

240�ˍ�2017/18 Knowledge Sharing Program with Visegrad Group
Kwon, N., and Ko, S. (2004) The Effect of Direct Government Subsidies on Firms’ R&D Investment, KukJe Kyungje Yeon-gu Won, Vol.10, No. 2. pp.157-181 (Korean)
Lee, B. (2004) Analysis of the Effects of Government R&D Subsidies on Private Industrial R&D Investment, Seoul: KERI (Korean)
MSIT (2017) Survey of R&D in Korea 2015, Gwacheon: MSIT
National Assembly Budget Office (2017) 2017 Special Tax Treatment: Analysis and Interpretation of the Programs, Seoul: NABO (Korean)
Noh, M. S., and Lee, S. Y. (2014) Study on the Improvement of the Tax Incentives for R&D, Innovation Studies 9-2 (Korean)
OECD (2011) ISIC Rev. 3 Technology Intensity Definition (https//www.oecd.org/sti/ind/48350231.pdf)
OECD (2015) Survival of Employer Enterprises in Entrepreneurship at a Glance 2015, Paris: OECD Publishing (http//dx.doi.org/10.1787/entrepreneur_aag-2015-en)
OECD (2018) R&D Tax Indicators, http://oe.cd/rdtax
OECD (2017) OECD Review of National R&D Tax Incentives and Estimates of R&D Tax Subsidy Rates, 2016, TAX4INNO Project 674888 Version 12
Oh, S., and Kim, S. (2017) Analysis of the Effectiveness of the Government R&D Programs for SMEs, STEPI Insight 211, Sejong: STEPI (Korean)
Oh, S. and Kim, S. (2017) R&D Grants for SMEs: Analysis of the Achievements, STEPI Insight Vol. 211, Sejong: STEPI (Korean)
SBC (2017) SMEs’ Strategy and Government Supports for SMEs in Response to Industry 4.0 (final report), unpublished informal document (Korean)
Shin, T. (2004) Government R&D Strategy to Strengthen Private Industrial Innovation Capacity: the Effect of Government R&D on Private Sector R&D Investment, Seoul: STEPI (Korean)
Shin, T. (2006) Analysis of the Effectiveness of Incentives for Technology Innovation and Suggestions for Improvement, Seoul: STEPI (Korean)
Sohn, W. (2002) A Study on the Effectiveness of Tax Incentives for R&D Investment, Seoul: Korea Institute of Public Finance (Korean)
Sohn, W. (2006) A Study on the Effectiveness of Tax Incentives Promoting R&D, Policy Research 2006-9, Gwacheon: MOST (Korean)
Song, M. (2017) Tax Subsidies for SMEs: Current State and Issues for Improvement, Policy and Legislative Issues No. 9 (December, 2017), Seoul: National Assembly Research Service (Korean)

Chapter 5 _ Policy Incentives for R&D and Innovation in SMEs: Accomplishments and Issues (Korea)�ˍ�241
Won, J., and Kim, J. (2005) A Study on Tax Incentives for Firms’ R&D, Seoul: Korea Institute of Public Finance (Korean)
Annual Report of KOTEC 2015 (http://www. kibo.or.kr) (Korean)
KOITA www.koita.or.kr
KOSIS www.kosis.kr
MSS www.mss.go.kr
NTIS www.ntis.go.kr
NTS www.nts.go.kr
SUSB (Statistics of US Business), http://www.census.gov


Chapter 62017/18 Knowledge Sharing Program with Visegrad Group: Innovation Policy for SMEs in the Era of Industry 4.0
Innovation Policy for SMEs in the Era of Industry 4.0:
Policy Measures to Strengthen Innovation Capacity of SMEs (Poland)
���*OUSPEVDUJPO
���&YJTUJOH�1SPHSBNT�4VQQPSUJOH�4.&T�*OOPWBUJPO�JO�1PMBOE��"O�0WFSWJFX
���"OBMZTJT�PG�UIF�&GGFDUT�PG�4FMFDUFE�1PMJDZ�*OTUSVNFOUT
���$PNQBSBUJWF�"OBMZTJT�PG�4FMFDUFE�1PMJDZ�.FBTVSFT
���$PODMVTJPOT
���1PMJDZ�*NQMJDBUJPOT

244�ˍ�2017/18 Knowledge Sharing Program with Visegrad Group
1. IntroductionRecent developments in information and communication technologies (ICT)
have revolutionized products and processes, not only in manufacturing and service operations, but also in management practices. This phenomenon, called Internet 4.0, also transforms competition (Porter, Heppelmann 2014). The term Industry 4.0 stands for the fourth industrial revolution, the next stage in the organization and control of the entire value creation dynamic along the life cycle of a product. Digital transformation of production processes driven by ICT has many different dimensions, such as the Internet of Things, big data analytics, artificial intelligence, and cloud computing (Kagermann et al., 2013; Armengaud et al., 2017).
The idea of Industry 4.0 is new in Poland and requires investigation. Thus, there is a need to define the new dimensions of policy measures contributing to the competitiveness of SMEs, especially instruments related to the development of digital technologies.
The main objective of this chapter is to describe and compare selected policy measures that support innovation in small- and medium-size enterprises (SMEs). This analysis is conducted against the background of the recent developments of Industry 4.0 in Poland. The results will constitute a basis for providing recommendations that help to design a new policy instrument aimed at transition from traditional industries to Industry 4.0.
Innovation Policy for SMEs in the Era of Industry 4.0: Policy Measures to Strengthen Innovation Capacity of SMEs (Poland)
Marzenna Anna Weresa (World Economy Research Institute, Poland)
Arkadiusz Michał Kowalski (World Economy Research Institute, Poland)
Marta Mackiewicz (World Economy Research Institute, Poland)
乇#Chapter 06

Chapter 6 _ Innovation Policy for SMEs in the Era of Industry 4.0: Policy Measures to Strengthen Innovation Capacity of SMEs (Poland)�ˍ�245
1.1. Industry 4.0 in Poland
This subchapter investigates the extent to which Polish companies have already transformed from traditional to digital manufacturing and services considered part of Industry 4.0.
The whole idea of Industry 4.0 is based on the following pillars:
s Internet of Things (IoT)s Cyber-physical system (CPS)s Cloud computings Digitization and integration of horizontal and vertical value chainss Digitization of services and productss Digitization of business models.
Companies need to adapt their processes to this digital change in order to face competition. They should start to offer products and services based on new technologies such as real-time optimization, big data, augmented or virtual reality and integration of digital ecosystems. This leads to innovations that are often data-driven and adjusted individually to the specific customer.
The emergence of Industry 4.0 has made it possible to shorten the distance between the producer and the customer. Products and production processes are becoming cognitive, which allows better adaptation to individual needs of customers (Armengaud et al., 2017). In addition to sensors or robots equipped with artificial intelligence, so-called augmented reality technology has emerged. This allows linking the real world with virtual world in an interactive way and facilitates an exchange and processing of information and data. The significance of this particular concept is enormous, as it opens up new methods of doing business as well as changing approaches to science (Russmann et al., 2015). Furthermore, entrepreneurs constantly have to cope with the increasing flow of information, which should be acquired, processed, and used in their business activity. While once the problem was to collect certain data, create the databases, and use them, today, selection of appropriate methods of combining relevant data bases, data processing, analysis, and drawing conclusions is a key factor in success in the market (Breuning et al., 2016).
In this context, the question arises: to what extent are enterprises in Poland that have already transformed to the digital world able to pave the way for innovative approaches to production and management? The next paragraph gives a brief overview of the development trends of Industry 4.0 in Poland.

246�ˍ�2017/18 Knowledge Sharing Program with Visegrad Group
The analysis of the development of Industry 4.0 takes into account economic entities that create and offer new digital technologies as well as enterprises that buy and implement these technologies. The issues that should be looked into here are related to the type of innovations implemented by Polish enterprises and their readiness to go digital as well as cooperation in research and development (R&D) activities, in particular those that lead to the implementation of digital technologies.
The results of the project carried out in March-April 2017 jointly by the Ministry of Economic Development and Siemens “Smart Industry Polska 2017”1) show that, in 2016, 58.6% of SMEs in Poland implemented innovative solutions. The majority of them (37.8%) were product innovations, followed by process innovations (32.7%) and marketing innovations (15.5%) (Ministry of Economic Development/Siemens 2017, p. 28). The report also shows that nearly 1/3 of surveyed companies are doing business in Poland and abroad, which proves that they are able to face strong competition in foreign markets (Ministry of Economic Development/Siemens 2017, p. 20).
When it comes to the use of new technologies, the report revealed that the most common technology solution implemented in recent years is automation of production using single machines. This was implemented in 48.6% of companies, while 10.4% declared that they include automation in their implementation plans for the year 2018. More advanced automation of production using machines cooperating with each other was implemented in over 27% of companies. Other solutions often used by Polish SMEs include mobile technologies, reported by over 30% of surveyed firms. The robotization of the entire production line is not that popular in Polish SMEs. Only 14.3% of surveyed companies declared usage of robots, while 3.6% of enterprises plan to implement robots in the near future. Technologies such as Internet of Things, big data, cloud computing, 3D printing, and micro and nanoelectronics are not common yet in Polish SMEs. [Figure 6-1] shows the scope of implementation of Industry 4.0 innovative solutions by SMEs in Poland.
The advancement of digitalization was also assessed globally by a survey conducted by PwC and presented in the report entitled “Global Industry 4.0 Survey: Building the digital enterprise” (PwC, 2016a), and a more detailed picture for Poland was presented in “Przemysł 4.0 czyli wyzwania współczesnej produkcji” (PwC, 2016b). It appeared that Polish enterprises are more optimistic in the assessment of their level of digitization compared to average assessment in the whole world. A PwC survey conducted among 2000 senior executives from industrial product companies, of which 50 were from Poland, showed that Polish companies declared high levels of
1) The survey was executed by Kantar Millward Brown Institute in March–April 2017 and covers a sample of 251 SMEs in manufacturing sector in Poland. Most of them have 100% Polish capital; only 10% of surveyed firms are entities with foreign capital (for detailed methodology, see Ministry of Economic Development/Siemens (2017), pp.19-21).

Chapter 6 _ Innovation Policy for SMEs in the Era of Industry 4.0: Policy Measures to Strengthen Innovation Capacity of SMEs (Poland)�ˍ�247
digitization in the area of products and technology development, customer’s access, sales channels, and marketing, as well as value chain integration (Table 6-1).
Summing up the overview of the Industry 4.0 development in Poland, it can be concluded that many small enterprises are still at an initial stage of automation, lacking a whole interactive ecosystem. Furthermore, is seems that Polish companies focus rather on quick effect than long-term perspective; only more advanced enterprises are implementing key elements of Industry 4.0. Therefore, there is a need
(Unit: %)
Automation Using Single Machines
Mobile Technologies
Automation Using Machines Cooperating with Each Other
Robotization of the Entire Production Line
Internet of Things
Big Data
Cloud Computing
3D Printing
Micro and Nanoelectronics; Nanotechnology
0 10 20 30 40 50
48.6
30.7
27.1
14.3
13..1
11.6
11.2
8.4
7.6
60 (%)
[Figure 6-1] Advancement of SMEs in Poland in Implementing Solutions of Industry 4.0(percentage of respondents that use new technologies)
Source: Own elaboration based on Ministry of Economic Development/Siemens 2017, p.35).
Areas of Digitalization Poland World
Vertical Value Chain 52% 41%
Horizontal Value Chain 46% 34%
Digital Business Models 36% 29%
Development of Products and Technology 53% 42%
Customer’s Access, Sales Channels, and Marketing 47% 35%
�Table 6-1� Percentage of Companies Declaring High Level of Digitization in the Selected Area: Poland Compared to the World
Note: Percentage of surveyed senior executives reporting high level of digitization (4 or 5 out of 5 – very advanced); The PwC Global Industry 4.0 Survey conducted among 2000 senior executives from industrial product companies, of which 50 were from Poland.
Source: PwC, “Industry 4.0 – challenges of the contemporary production”, https://www.pwc.pl/pl/pdf/przemysl-4-0-raport.pdf, p.32.

248�ˍ�2017/18 Knowledge Sharing Program with Visegrad Group
to recognize the most important barriers that hamper Industry 4.0 implementation in Poland, which will be the focus of the next section.
1.2. Why Support Digitalization of SMEs?
According to Poland’s Central Statistical Office, SMEs in Poland constitute over 99% of registered business, but are less innovative than large companies (GUS, 2017). Therefore, it is important to identify the barriers hampering their innovation activity and to design policy instruments that address them properly. The support for SMEs should be aimed at removing barriers hampering the emergence and scaling up of these firms.
A survey conducted in 2017 among 251 SMEs in Poland (Ministry of Economic Development/Siemens 2017, p. 57) revealed that the main barriers to introduction of new technologies in manufacturing companies are:
s Bureaucracy (40.6% of responses)s Lack of incentives from public authorities (36.7%)s Limited financing possibilities of digital investment (33.9%)s Lack of access to qualified personnel (32.3%)s Risk regarding the return on investment (31.9%)
The detailed results of the survey are presented in [Figure 6-2].
A similar picture appears in the research conducted globally by PwC, which identified challenges and barriers in building ability in digital operations; these challenges held true across industries and countries, including Poland (PwC,
(Unit: %)
Bureaucracy
Lack of incentives from public authorities
Tax regulations unfriendly to SMEs
Limited financing possibilities of digital investment
Lack of access to qualified personnel
Risk regarding the return on investment
0 5 10 15 20 25 30 35 40 45
41
37
34
34
32
32
(%)
[Figure 6-2] The Most Important Barriers to the Introduction of New Technologies in Poland
Source: Own elaboration based on survey conducted in 2017 among 251 SMEs in Poland (Ministry of Economic Development/Siemens 2017, p.57).

Chapter 6 _ Innovation Policy for SMEs in the Era of Industry 4.0: Policy Measures to Strengthen Innovation Capacity of SMEs (Poland)�ˍ�249
2016a). The most important barrier in both surveys was related to policy and its implementation. In the survey conducted globally by PwC, about 40% of surveyed enterprises pointed out that there is no clear digital vision and that there is not enough support to digitalization. In a survey conducted by Siemens in Poland, 40% of firms complained about bureaucracy, and 36.7% of respondents see lack of incentives from public authorities as a barrier to go digital. Financing of digital development is another important barrier – a global survey revealed that high financial investment requirements are perceived as a challenge by 36% of respondents. In Poland, financing digital investment was also perceived as a key barrier – about 34% of firms surveyed by Siemens pointed out that limited financial resources hamper their investment in new technologies. Lack of digital culture and training is also one of the biggest challenges for the development of Industry 4.0. 32% of surveyed enterprises in Poland complained about a lack of access to qualified personnel; in a survey conducted globally by PwC, insufficient talent was perceived as a challenge to digitalization by 25% of respondents (Figure 6-2 and 6-3).
Summing up, financial burden related to new technologies’ implementation coupled with unclear economic benefits of digital investments as well as insufficient skills were regarded as important factors hampering Industry 4.0 development, both globally and in Poland. Data security, and lack of digital standards, norms, and certification, also slow the process of digitalization (Figure 6-3).
(Unit: %)
Lack of clear digital vision and support
Unclear economic benefit from digital investment
High financial investment reqirements
Insufficient talent
Unresolved questions around data security anddata privacy
Lack of digital standards, norms and certification
Slow expansion of basic infrastructure technologies
Business partners are not able to collaboratearound digital solutions
Loss of control over company’s intellectual property 14
16
18
21
25
25
36
38
40
(%)0 5 10 15 20 25 30 35 40 45
[Figure 6-3] Challenges and Barriers in Building Ability in Digital Operations
Source: PwC (2016a), https://www.pwc.com/gx/en/industries/industries-4.0/landing-page/industry- 4.0-building-your-digital-enterprise-april-2016.pdf, p.17.

250�ˍ�2017/18 Knowledge Sharing Program with Visegrad Group
The analyzes of barriers conducted above allows concluding that policy intervention is needed to support the development of digitalization in Poland to boost its development. In the digital age, maintaining competitiveness requires constant innovation (Kadar et al., 2014). Introduction of digital technologies can be treated as innovation itself, but it also can lead to further innovations as it changes the whole business model. Moreover, support for implementation of digital technologies is important in particular for SMEs as they are less innovative than large firms (GUS, 2017, p.17) and, as shown in the previous section, the majority of SMEs in Poland are still at an initial stage of automation, lacking a whole interactive ecosystem. In this context, the most important objectives for supporting the digitalization of SMEs in Poland are:
s To increase the impact of SMEs on the development of Industry 4.0;s To increase innovation activity of Polish SMEs;s To remove barriers for introducing new technologies.
2. Existing Programs Supporting SMEs Innovation in Poland: An Overview
Currently SMEs in Poland can get support from different programs financed with EU structural funds - for research funding, competitiveness, and innovation. Typical forms of support are grants, loans and in some cases, guarantees. SMEs can also benefit from a series of non-financial assistance measures in the form of business support services. There are also domestic programs that help businesses carry out innovative projects representing various scientific areas and industrial sectors or that provide support for the implementation of projects encouraging R&D commercialization.
There are no specific instruments that support Industry 4.0 development in Poland yet apart from the recently introduced facilitations concerning depreciation of machinery and equipment (the so-called law on robotization), but it is too early to assess their use and efficiency. Therefore, studying examples of existing instruments that support any innovation (not necessarily digital) and identifying their strengths and weaknesses may help to design a new measure directly focused on digitalization of SMEs.
Concerning the above-mentioned regulation on robotization, which may be treated as the first step to formulating policy supporting the implementation of Industry 4.0 solutions in Poland, it was introduced by the Act of July 7th, 2017 amending the Personal Income Tax Act and Corporate Income Tax Act. This instrument gives entrepreneurs the possibility to make one-off depreciation write-

Chapter 6 _ Innovation Policy for SMEs in the Era of Industry 4.0: Policy Measures to Strengthen Innovation Capacity of SMEs (Poland)�ˍ�251
offs from the initial value (of at least 10,000 PLN) of newly acquired fixed assets included in groups 3–6 and 8 of the Classification of Fixed Assets (KST; i.e., machinery and equipment) in the amount of up to 100,000 PLN yearly. The delivery of the goods shall be carried out in the following settlement periods. The limit of 100,000 PLN includes both payments on the purchase of fixed assets (advances) and depreciation write-offs on acquired fixed assets (advance payment will be taken into account by reducing the amount of one-off depreciation write-offs). In the case of a company, which is not a legal person, the limit of 100,000 PLN applies jointly to all partners of the company. The law on robotization may be treated as an important instrument supporting the implementation of Industry 4.0 solutions in Polish economy, as the purchase cost of, for example, digital tools, industrial robots, or 3D printers can now be written off more quickly. These rules are expected to encourage companies, especially SMEs, to invest in new technologies and solutions. However, as this instrument came into force on August 12, 2017, it is not yet be possible to evaluate the practical effects of its implementation in a longer-term perspective.
This chapter provides information on a set of diverse instruments strengthening innovation capacity of SMEs (grants, financial instruments, and tax incentives).The objective is to present and discuss one instrument representing each of three different groups of policy measures:
A. Tax incentives: Tax incentives were not very effective in Poland in the past; however, during the last 2 years, momentous reforms have been introduced in Polish tax system with regard to tax incentives for innovative enterprises. Furthermore, tax burden was reported by SMEs as one of the barriers to digitalization in Poland (see Figure 6-2); therefore, it is worth examining how tax incentives work in Poland.
B. Financial instruments: In the light of the limitation of EU funds after 2020, financial instruments are expected to play a stronger role than in the past. Financial instruments are also worth examining in the context of support to Industry 4.0 development, because digitalization cannot be implemented without investment. An instrument of this type can be an example of how to find necessary resources to digital upgrading of a company. The biggest single program making use of financial instruments available in Poland is the De minimis Guarantee Scheme implemented by Bank Gospodarstwa Krajowego (a Polish development bank). Thanks to the scheme, SMEs may obtain loan repayment guarantees to finance their working capital and investment needs for innovative activities.
C. Grants: The proposed measure “Industrial research and development works carried out by enterprises” provides funds for the development of new

252�ˍ�2017/18 Knowledge Sharing Program with Visegrad Group
products and technologies that require experimental development work or industrial research. It is popular among SMEs due to the short decision-making time on the appraisal. Merits and drawbacks of this example could serve as guidelines for designing a grant scheme supporting enterprises’ involvement in development of digital technologies.
In particular, the evaluation of the selected policy measures to strengthen innovation capacity of SMEs is based on three criteria: effectiveness, efficiency, and usefulness for SMEs. In general, efficiency is related to how economically resources are converted into results, whereas effectiveness refers to the extent to which the intervention’s objectives were achieved, or are expected to be achieved, taking into account their relative importance. The third criterion, usefulness, judges the results obtained in relation to broader societal and economic needs. It helps to assess the extent to which the public intervention satisfies (or not) stakeholders’ needs, which is mostly about how the instrument responds to its users’ needs.
3. Analysis of the Effects of Selected Policy Instruments
3.1. Tax Incentives
R&D tax incentives are widely applied in many countries over the world. The key policy goal of this instrument is to raise R&D spending by enterprises, and consequently to encourage long-run economic growth, promote investment, and smooth business cycle fluctuations (Chang, 2018). This makes this instrument very important for Poland, where level of R&D expenditures in relation to GDP remains rather low relative to other European countries’.
During the last 2 years, momentous reforms have been introduced in the Polish tax system with regard to tax incentives for innovative enterprises. In 2016, tax-resident companies gained the possibility to make an extra deduction from their tax base for costs incurred on R&D, and in 2017 and 2018, the possible entrepreneurs’ benefits were significantly increased. The R&D tax incentive introduced in 2016 replaced the previous tax relief for buying new technologies, introduced by the Act of July 29th, 2005, on Certain Forms of Support for Innovative Activities, which aimed to:
(1) Stimulate competitiveness and innovativeness of the Polish economy by raising private R&D expenditures,
(2) Increase the effectiveness of managing public resources allocated to R&D.

Chapter 6 _ Innovation Policy for SMEs in the Era of Industry 4.0: Policy Measures to Strengthen Innovation Capacity of SMEs (Poland)�ˍ�253
Tax relief for buying new technologies, introduced in 2005, allowed the taxpayers to use 50% of the expense of the purchase to reduce the tax burden, in addition to the standard tax cost reported through depreciation write-offs. New technology was understood as technology not used in the world for a period longer than the last 5 years, which had to be confirmed by the opinion of a scientific unit independent from the taxpayer.
In fact, tax relief for buying new technologies was the first case in Polish history of a tax instrument aiming to stimulate innovation activities being proposed to entrepreneurs. From this perspective, it can be interpreted as a revolutionary step in encouraging private companies to participate in financing innovation processes. However, tax relief for buying new technologies did not prove popular among businesses in Poland, as presented in <Table 6-2> and <Table 6-3>.
(Unit: number, %, PLN)
Year
Total Number of CIT
Taxpayers in Poland
Total Number of CIT
Taxpayers that Used the
Instrument
Number of CIT Deductions per 100,000
Firms
Deductions from the Tax Base in CIT
(PLN)
The Average Amount
Deducted from the Tax Base by CIT Taxpayers
(PLN)
2006 276,169 12 4.3 9,780 815
2007 288,263 19 6.6 4,426 233
2008 312,356 26 8.3 7,847 302
2009 327,292 25 7.6 20,046 802
2010 343,165 33 9.6 31,289 948
2011 357,067 97 27.2 270,961 2,793
2012 378,964 94 24.8 439,385 4,674
2013 400,944 75 18.7 306,724 4,090
2014 434,398 80 18.4 283,846 3,548
2015 456,190 79 17.3 389,682 4,933
2016 483,176 40 8.3 45,406 1,135
�Table 6-2� The Use of Tax Relief for Buying New Technologies in Poland, Corporate Income Tax (CIT), 2006–2016
Source: Data derived from annual reports regarding the settlement of Corporate Income Tax (CIT), available at the Ministry of Finance, http://www.finanse.mf.gov.pl/cit/statystyki.

254�ˍ�2017/18 Knowledge Sharing Program with Visegrad Group
As <Table 6-2> shows, the total number of CIT taxpayers that deducted the costs incurred on buying new technologies from their tax base was below 100 each year when this instrument was in operation. This gives a nearly negligible number of 4.3 firms (minimum number reported in 2006) to 27.2 firms (in 2011, when the maximum number of CIT taxpayers used this instrument) per 100 thousand companies. The average amount deducted from the tax base by CIT taxpayers was ranging from 233 PLN (around 65 EUR) in 2007 to only 4,933 PLN (around 1,150 EUR) in 2015.
With regard to Personal Income Tax (PIT), tax relief for buying new technologies applied only to taxpayers conducting business activity under the general tax rules (according to the progressive tax scale). As part of this allowance, they could deduct up to 50% of the amount of expenses incurred for the purchase of new technology from the tax base. Data showing the use of tax relief on PIT for buying new technologies in Poland are presented in <Table 6-3>.
(Unit: number, %, PLN)
Year
Total Number of PIT
Taxpayers in Poland
Deductions from the Tax Base in PIT -
Number
Number of Deductions
from the Tax Base in PIT
per 1,000,000 Taxpayers
Deductions from the Tax Base in PIT
(in PLN)
The Average Amount
Deducted from the Tax Base by PIT Taxpayers(in PLN)
2007 24,454,995 117 47.8 66,000 564
2008 24,747,173 11 4.4 51,000 4,636
2009 24,740,297 15 6.1 25,000 1,667
2010 24,907,974 398 159.8 258,000 648
2011 24,654,420 250 101.4 262,000 1,048
2012 24,324,790 42 17.3 140,000 3,333
2013 24,694,043 31 12.6 885,000 28,548
2014 24,764,126 37 14.9 754,000 20,378
2015 24,944,845 472 189.2 779,000 1,650
2015 456,190 79 17.3 389,682 4,933
2016 483,176 40 8.3 45,406 1,135
�Table 6-3� The Use of Tax Relief for Buying New Technologies in Poland, Personal Income Tax (PIT), 2007–2015
Source: Data derived from annual reports regarding the settlement of Personal Income Tax (PIT), available at the Ministry of Finance website: http://www.finanse.mf.gov.pl/pit/statystyki.

Chapter 6 _ Innovation Policy for SMEs in the Era of Industry 4.0: Policy Measures to Strengthen Innovation Capacity of SMEs (Poland)�ˍ�255
According to data presented in <Table 6-3>, the total number of entrepreneurs, legally acting as natural persons, that deducted the costs incurred on buying new technologies from their tax base was below 500 each year during the whole analyzed period. The maximum number was reached in 2015, when 472 entrepreneurs used the instrument (which constitutes only 189.2 deductions per 1 million PIT taxpayers).The average amount deducted from the tax base by CIT taxpayers was ranging from 564 PLN (around 150 EUR) in 2007 to 28,548 PLN (just below 7,000 EUR) in 2013.
The analysis of data on the use of tax relief for buying new technologies proves that it was a rather unpopular instrument among CIT and PIT taxpayers. OECD (2010, p. 165) indicated two reasons for that:
(1) Lack of promotion and information of the instrument among entrepreneurs, as the survey showed that only 41% of them known about the tax relief concerning new technology, while 41% admitted not knowing anything about it;
(2) Small number of companies in Poland using modern technologies.
Even among tax payers who had some knowledge about the instrument, the general conviction was that the tax relief could be applied only in case of the purchase of extremely advanced technologies, which are not frequently used by Polish companies. Moreover, some entrepreneurs may have feared that the application of the tax relief may be connected with the necessity to complete substantial paperwork, including the obligation to obtain the required opinions from a scientific unit. According to ZwierzyĔski (2013, p. 141), low uptake of tax relief for buying new technologies may be connected with additional regulations that exclude a very large group of entrepreneurs (e.g., those who chose to be taxed at the linear income tax rate of 19%).
In addition to the fact that tax relief for buying new technologies was not popular among taxpayers, its main weakness was that it was focused mostly on technology absorption, not technology creation. As a result, Poland was among the countries that rewarded mainly importing of innovation instead its generation inside domestic businesses. These were the main reasons to introduce since January 2016 new instrument, a tax relief for R&D activities (known also as an R&D tax credit), based on the Amendments to Certain Acts Related to Supporting Innovation Act, and amendments to the PIT Act and the CIT Act. The difference between the old and new tax incentive is that, until 2016, tax relief was granted for purchasing new technological solutions, while since 2016, it has been granted for producing new R&D-based solutions by Polish companies. The latter seems to be more in line with a model followed by more technologically advanced countries. This allows the claim that introduction of a system of tax incentives that can have a real impact on the

256�ˍ�2017/18 Knowledge Sharing Program with Visegrad Group
level of R&D expenditures in Poland started in 2016, when entrepreneurs gained the possibility of additional deduction (from 10% to 30%) of costs incurred for R&D activities from the tax base. This is applied to expenses of a certain amount that have already been included in the tax-deductible costs under the general rules, which means that companies could deduct from 110% to 130% of qualifying R&D costs from their tax base. Over the next 2 years, the benefits in the R&D tax relief have been significantly increased, as presented in <Table 6-4>.
Considering the dynamics of changes, it should be noted that the tax incentive system for R&D in Poland is in a state of strong transformation. Apart from increasing the level of eligible R&D expenditures for tax base reductions between 2016 and 2018 (as shown in Table 6-4), the list of eligible costs was extended and clarified. This reform, especially the increase, as from 2018, in the level of tax deduction from 30% in 2016 (50% in 2017) to 100% of eligible personal costs (150% for RDC), makes the R&D relief an attractive tool for companies running activities with an innovative angle. In the case of transnational corporations, the new instrument may support the choice of Poland as a location attractive for establishing a R&D centre. However, even with relatively small levels of cost deductions enjoyed by entrepreneurs in 2016, R&D tax relief in that year (Table 6-5) was more popular than the use of previous tax relief for buying new technologies in 2006-2016.
Costs Eligible for Deduction from the Tax Base of the Income Tax
2016 2017 2018
Personal Costs 30% 50%s 100% s 150% for enterprises with the RDC
status
Other Costs
SMEs 20% 50% s 100%s 150% for enterprises with RDC
status (with exemption of big enterprises with RDC status: 100% of patents’ costs)
Big Enterprises (employ>250
persons)10%
30%(no
patents)
�Table 6-4� Tax Relief for R&D in Poland – Evolution, 2016-2018
Note: RDC - Research and Development Center (in Polish: CBR). Source: Own compilation based on the analysis of the evolution of regulations related to tax relief for R&D in
Poland in 2016-2018.

Chapter 6 _ Innovation Policy for SMEs in the Era of Industry 4.0: Policy Measures to Strengthen Innovation Capacity of SMEs (Poland)�ˍ�257
In 2016, 556 taxpayers used tax relief for R&D. Among these, the number of PIT taxpayers (279) was higher than CIT taxpayers (277), but the costs incurred on R&D by CIT taxpayers were much higher (1,125 million PLN, which is around 250 million EUR) than by PIT taxpayers (32 million PLN, which is around 7 million EUR). Personal costs were the most important type of cost incurred for R&D (899 million PLN, or 80%), whereas other costs accounted for the remaining 20% (226 million PLN). As the changes introduced in 2016 and 2017 provided enhanced benefits under the R&D tax relief program, it may be expected that financial data for 2017 and 2018 will display an increasing number and value of tax deductions, and that this trend will continue in the next years.
Based on the conducted analysis for 2016, tax relief for R&D may be evaluated highly in terms of its effectiveness, as it achieved the goal of increasing private R&D expenditures in Poland. Of course, long-term effects of this instrument will be observed in a longer perspective, but it must be noted that the results of its implementation in the first year are very promising. However, its efficiency may be questionable as even the costs of unsuccessful R&D projects are also eligible.
(Unit: number, million PLN, %)
CIT PIT Total Subject to Deduction
Effects of Deduction
Number of taxpayers that used the instrument 227 279 556 - -
Eligible costs incurred on R&D (in millions PLN), out of which:
1,125 (97%)
32(3%) 1,157 206 39
1. Personal costs (million PLN) 899 15 914 179 -
2. Other costs (million PLN), out of which: 226 17 243 27 -
2.1. Depreciation of intangible and fixed assets - - 110 - -
2.2. Acquisition of materials and raw materials - - 88
(45%) - -
2.3. Expertises, opinions, advisory, and equivalent services - - 42
(18%) - -
2.4. Payments for use of research equipment - - 3
(1%) - -
2.3. Expertises, opinions, advisory, and equivalent services - - 42
(18%) - -
2.4. Payments for use of research equipment - - 3
(1%) - -
�Table 6-5� The Use of Tax Relief for R&D in Poland, 2016
Source: Based on Ministry of Finance presentation.

258�ˍ�2017/18 Knowledge Sharing Program with Visegrad Group
Nonetheless, it is a widely available instrument, and its usefulness for companies may be evaluated highly, because of the main strengths of tax relief for R&D, which are as follows:
s Universal nature of that measure, and quite simple mechanism,s No need to make an application to use this instrument, and no criteria for
selection of the projects,s High attractiveness for companies, as it may diminish their tax burdens,s Raising the net present value of prospective research projects,s No need to organize a dedicated R&D department,s Eligibility of all industries, s Including cumulatively all the costs incurred on R&D activities, and no need for
prior notification of the use of tax relief for R&D during the year,s Possibility to combine tax relief for R&D with other instruments, like grants.
Despite all the benefits to taxpayers, the usefulness of tax reliefs for R&D for SMEs is sometimes questioned (e.g., Busom, Corchuelo, Martínez-Ros 2014; Radas et al., 2015). Main weaknesses (with the first three especially relevant in case of SMEs) are:
s Company must first possess and spend money on R&D activities, and then it may deduct the incurred costs from its tax base. This may be problematic for SMEs, which usually lack financial resources;
s High registration and reporting obligations, including the verification of the work and tasks performed, devising a tracking scheme for R&D-related costs, and reporting the right amount of expenses on R&D in the annual income tax declaration;
s Lack of certainty as to whether firm’s activity definitely qualifies as R&D, and the fear of potential tax inspection and its consequences;
s According to the OECD (2002, p.9, 16), tax incentives might not subsidize new R&D, but support the R&D a firm would have done anyway. Moreover, there are usually weaker spillover benefits to other firms and industries from tax incentives in comparison to R&D directly financed by governments. According to OECD, unlike direct funding of business R&D, tax-based mechanisms do not typically allow governments to direct business R&D into areas with high social returns (e.g., technological fields with significant spillovers or basic research).
3.2. The De minimis Guarantee Scheme
The “De minimis Guarantee Scheme (PLD)” is the biggest single program making use of financial instruments available in Poland. It was launched by the Polish government in 2013 and was intended as a temporary countermeasure redressing the ongoing slowdown of the economy. However, it was later extended on a yearly

Chapter 6 _ Innovation Policy for SMEs in the Era of Industry 4.0: Policy Measures to Strengthen Innovation Capacity of SMEs (Poland)�ˍ�259
basis regardless of economic conditions. As for February 2018, the scheme is planned to be replaced with a permanent facility called Krajowy Fundusz Gwarancyjny (National Guarantee Fund) by mid-2018.
The stated purpose of the scheme is to facilitate access to financing for SMEs. Firms are able to obtain a guarantee from the state-owned Bank Gospodarstwa Krajowego (BGK) to ensure repayment of working capital or an investment loan granted by a participating bank. The guarantee covers up to 60% of the requested loan, excluding interest and other costs that may be incurred in relation to the loan. A fee of 0.5% per annum is charged; however, for the several first months of the program, participation is free of charge. The maximum guarantee duration is 27 months in case of the working capital loan and 99 months for the investment loan. The guarantee is secured with a blank promissory note from the entrepreneur (or the company in case of legal persons). To be granted the guarantee, the company must be judged creditworthy by a participating bank according to its internal procedures and regulations, with an exception of ability to present proper collateral.
The part of the loan covered by the guarantee caries no capital charge for a participating bank. In case of default, any recovery proceeds (recovery activities are performed by the participating bank) are shared on a pari passu basis. According to BGK data, by the end of January 2018 guarantees totaling 45.5 billion PLN were granted, allowing for 80.9 billion PLN of loans to be issued and for more than 133 thousand firms to take part in the scheme. Currently more than 20 banks participate, ensuring wide accessibility and national coverage. Terms and procedures related to the guarantee (not the loan itself) are unified. Banks are obliged to report to the scheme operator on daily (loan and guarantee sales), monthly (additionally non-performing loans), and quarterly bases (portfolio quality according to banking regulations).
As its name suggests, the scheme takes advantage of the European de minimis framework, which allows for limited public support without triggering the EU state aid procedures. The scheme should be considered public support, as the state clearly subsidizes it and the current guarantee price does not cover its cost (including both operational expenses and calls of guaranties). The picture below illustrates the basic structure of the scheme.
The most comprehensive information on the scheme results and effectiveness is based on a cyclical research carried out and published by BGK, based on surveys of companies, interviews, and desk-research. According to those reports, the scheme has a positive impact both on the level of the single participating company and the economy as a whole.

260�ˍ�2017/18 Knowledge Sharing Program with Visegrad Group
The most recent study (dated December 2017, covering the period from 2016H2 to 2017H1) shows that the smallest firms (i.e., those employing up to nine persons) constitute the majority of participants (78%, which is less than in the country’s SME population) (Kowalczyk, Kaczor, 2017). The scope of activity of participants is predominantly local or regional, and they are usually experienced firms with 10 years or longer history. The median guaranteed loan amounted to 87,000 PLN, which can be considered indicative of an impact, as it is higher than the median loan in the general population. According to the study, most of the participants (85%) had encountered some form of financial gap (defined as having reduced or no access to external finance, including those companies that decided not to apply for a loan while in need) before applying for the guaranteed loan. That was mostly due to a lack of appropriate collateral (75% of those who tried to reach for external finance) or insufficient operation history (21%). The study also shows that only 11% of respondents would have received exactly the same loan without the guarantee. Roughly one out of three firms (32%) would have been granted a loan on worse conditions than those actually received, it would take more time to obtain one, or/and the amount would be lower. Almost two in five companies (39%) judged they would not have been granted a loan without the guarantee. Half of the companies responded that their reason for using the guarantee had been a lack of appropriate collateral.
Covers cost of guarantees and of runnig the schemeGeneral supervision of the scheme
MINISTRY OF FINANCE
Carrying the loans and individual guarantees (credit worthiness assessment)Carrying out the recovery process in case of default
PARTICIPATING BANK
Provides collateral for part of the loan not covered with guaranteeSME deals only with a participating bank
SME
Running day to day operations of the schemeGranting guarantee quotas for banks, monitoring portfolio qualityPaying out called guarantees
BANK GOSPODARSTWA KRAJOWEGO (A State Development Bank)
[Figure 6-4] Structure of Implementation of the De minimis Guarantee Scheme
Source: Authors.

Chapter 6 _ Innovation Policy for SMEs in the Era of Industry 4.0: Policy Measures to Strengthen Innovation Capacity of SMEs (Poland)�ˍ�261
According to the study, participating companies experienced actual positive benefits of the guaranteed loan in terms of various performance measures. Those include an improvement to (53%) or maintaining of (45%) the market position and creating or saving jobs (24% and 10%, respectively). Companies also expected further positive developments in those areas. Roughly one third of respondents reported introducing an innovation that would not have been possible without a loan. Working capital loans are reported to have stabilized the financial position of most respondents (84%) and increased turnover in just over half (53%). In case of around half of recipients of those loans, favorable changes in financial condition resulted in investments. Companies that were granted an investment loan with the guarantee increased turnover (78%) and were able to inject additional equity to the project being financed (68%). BGK estimates that the scheme resulted in additional credit amounting to 20.2 billion PLN from March 2013 until end of 1st quarter of 2017. The dead weight effect of the program, defined as loans that would have been granted on similar conditions without the guarantee, is estimated at 13.1 billion PLN. The remaining of the total of 65.3 billion PLN of loans falls into a sort of a grey area – according to BGK, it was extremely difficult to quantify how much of those loans had been truly additional. BGK also estimates that, thanks to the scheme, an additional 60,600 jobs were created and 69,900 layoffs were averted.
The instrument is not focused on innovative companies. Nevertheless, the survey conducted among beneficiaries points outs that is has had a positive impact on innovativeness of SMEs. In the survey carried out in 2016, 43% of SMEs that obtained working capital loans backed up with de minimis guarantees declared that the loan was used to make innovations, especially with regard to products, at the company level (49%) or in the market where the company is present (44%). Innovations at a global level were declared by 6% of SMEs that used the working capital loan. In 2017, 32% of companies introduced innovations thanks to the guaranteed credit, usually at the company level (72%) (Bank Gospodarstwa Krajowego, 2016, 2017). The decrease may be explained to some extent by a change in the structure of the sample.
Effects achieved thanks to the investment loans backed up with de minimis guarantees may also be linked with the innovativeness of SMEs. In 2016, 41% of the supported projects were innovative. These were mainly product innovations. These were usually innovations at the market where the company was active (47%) or solely to the company itself (45%). A global level of innovations was declared by 7% of the respondents. In 2017, 29% of the completed projects were innovative in nature. These were mainly innovations at the company level (50%) (Bank Gospodarstwa Krajowego, 2017).

262�ˍ�2017/18 Knowledge Sharing Program with Visegrad Group
There is limited information on effectiveness and results of the scheme from sources other than BGK. The cyclical survey of credit risk officers run by National Bank of Poland indicates that its introduction might have resulted in increased demand for credit and was a reason behind easing of loan eligibility criteria by some banks (National Bank of Poland, 2013). The IMF mentions a successful implementation of the scheme as a factor behind the growth of loans to enterprises in 2013/2014 (IMF, 2014). Various publications underline the scheme’s usefulness basing judgment on large sales attained comparing to other guarantee schemes introduced previously (Karpowicz, 2014).
Data on paid guarantees and related to costs of running the scheme are scant. According to press information, the cost of running the scheme and payments of guarantees since starting the programme until mid-October 2017 was below 1 billion PLN2). Earlier data indicate that, between March 2013 (beginning of the scheme) and August 15th 2017, state budget spending covering operational costs of the system and guarantee payments amounted to 882.5 million PLN.3) According to representatives of BGK and the Ministry of Finance, the loss ratio of the scheme is lower than initially assumed, at 6.2% of guarantees granted.
In Poland, the scheme is generally considered a successful policy. Its popularity may be linked with its very simple procedure and easy access for SMEs as well as a very universal character of the instrument. Nevertheless, some shortcomings and limitations have been mentioned. The system excludes firms from several branches of the economy, leaving some SMEs without a support. In addition, bigger companies are excluded from the scheme (with no comparable alternatives), although research by BGK shows that medium-sized companies close to the SME threshold find it quite useful. As is a case of many policies, supporting SME sector companies growing out of the sector is particularly affected by that sharp threshold. Another drawback results from the employment of the de minimis framework. From the company point of view, participating in the programme uses up the allowed limit of de minimis support, therefore resulting with limited possibility or even inability to take advantage of other opportunities based on the framework. Moreover, the provisory nature of the scheme might be considered disadvantageous, as the sunset of the system approaching at the end of each year (and regularly postponed until next year) might have caused suboptimal choices by companies willing to participate. All the same, it is a feature of the particular implementation and has been corrected in the new system mentioned before. Finally, it has been argued that the system undermines operations of local and regional guarantee funds, created by local
2) https://businessinsider.com.pl/firmy/zarzadzanie/gwarancje-kredytow-dla-msp-od-2018-roku/e6kzb1g http://biznesspot.pl/blog/gwarancje-de-minimis-pol-roku-dluzej/3) Rationale to the government bill amending the Act on sureties and guarantees granted by the State
Treasury and certain legal entities and certain other acts, No 1965, 2017-10-24, http://www.sejm.gov.pl/sejm8.nsf/druk.xsp?nr=1965.

Chapter 6 _ Innovation Policy for SMEs in the Era of Industry 4.0: Policy Measures to Strengthen Innovation Capacity of SMEs (Poland)�ˍ�263
governments with EU funding. Interestingly, BGK (the operator of the scheme) was and remains a shareholder of many of those funds, making it an illustrative example of deficient policy coordination.
3.3. Grants for Industrial Research and Development Works Carried out by Enterprises
Measure 1.1 “R&D projects of enterprises” is being implemented under the Smart Growth Operational Programme 2014-2020, which is the largest national program financing research, development, and innovation in the European Union. The institution responsible for calls for proposals and evaluation of applications is the National Centre for Research and Development (NCRD). The project selection procedure is based on a competitive procedure.
Measure 1.1 consists of two sub-measures:
s Sub-measure 1.1.1 - Industrial R&D work implemented by enterprises – referred to as the “fast track,” which will be further investigated in this chapter (the colloquial name comes from a shortened project evaluation period of 60 days for SMEs and 90 days for large companies),
s Sub-measure 1.1.2 - R&D work related to manufacturing a pilot/ demonstration installation.
Measure 1.1 is aimed at supporting R&D projects implemented by enterprises. Support is addressed to both large enterprises and SMEs; however, it is possible to organize calls for proposals addressed only to one of the two groups.
As part of the “fast track,” entrepreneurs can apply for funding for projects involving industrial R&D (or only the latter) on technological solutions and products that serve the development of business activity and strengthening the company's competitive position. The formalities have been reduced to the minimum, which encourages SMEs to apply for the support for innovation. The procedure is intuitive, and the entire application can be completed and submitted electronically.
According to the programme assumptions, R&D projects should comprise industrial R&D or development only. In order to be eligible for co-financing, R&D results need to be commercialized. This is understood as the implementation of a project resulting in the entrepreneur’s own economic activity or granting a license or selling project results in order to implement them into another entrepreneur’s economic activity.4)
4) Detailed Description of Priority Axes of Smart Growth Operational Programme 2014-2020, Ministry of Infrastructure and Development, Warsaw 2015.

264�ˍ�2017/18 Knowledge Sharing Program with Visegrad Group
Projects supported under Measure 1.1 must comply with National Smart Specialization (NSS). There are 17 smart specializations grouped into five thematic areas: healthy society, agriculture and food, forest-based and environmental bioeconomy, innovative technologies and industrial processes, natural resources and waste management, and sustainable energy industry.
Sub-measure 1.1.1 is very popular among Polish SMEs. The instrument is focused on companies that seek funding for projects involving industrial research and / or development of technological solutions and products conducive to the development of their business and to strengthen their competitive position. Beneficiaries are not required to return the income generated by the project, including the income from the prototype’s commercial use.
The company can carry out R&D work independently by using its own resources or outsourcing work to external entities (scientific units, other companies, scientific networks, scientific and industrial consortia, etc.) Only R&D institutions, selected on a competitive basis, may become subcontractors. Private entities (e.g., other companies) can be outsourced to conduct research works upon being accepted by the NCRD. Contract workers are also considered subcontractors.
The value of works performed based on subcontracting may not exceed:
s 60% of the total eligible costs of industrial R&D works;s 70% of the total eligible costs of pre-implementation work financed under the
de minimis aid.
Measure 1.1 R&D Projects of Enterprises
Sub-measure 1.1.1 Called “Fast Track” Sub-measure 1.1.2
Co-financing is granted for the implementation of projects that comprise industrial R&D or development (projects that do not provide for development are not eligible for co-financing).
Co-financing is granted for the implementation of projects that comprise development only, including the creation of a demonstration installation.
�Table 6-6� Measure 1.1 R&D Projects of Enterprises
Source: Ministry of Infrastructure and Development (2015).

Chapter 6 _ Innovation Policy for SMEs in the Era of Industry 4.0: Policy Measures to Strengthen Innovation Capacity of SMEs (Poland)�ˍ�265
SMEs have the opportunity to finance the so-called pre-implementation work, which is preparatory activities for the implementation of research results and enable to bring the solution being the subject of the project to the stage when it can be commercialized. In particular, such works may include, for example, preparation of implementation documentation, patent agent services, tests, certification, or market research. The amount of eligible costs for implementation of pre-implementation works may not exceed 20% of the total eligible costs of the project. The maximum level of general costs may be 17% of eligible costs excluding subcontracting.
Project selection criteria consist of access criteria and scored criteria. The proposals are evaluated by independent business and science experts. Their task is to verify whether the project is innovative and the extent to which it responds to market demand.
The intention of the NCRD is to select the innovative projects, which are well inscribed into R&D-based development strategies of companies, not those submitted just to receive a grant per se. However, many companies became frequent beneficiaries of public support, which can cause a negative effect of becoming dependant on public grants.
A total of 3,950 eligible proposals were submitted from the start of implementation by the end of February 2018. These proposals requested a total EU financial contribution of 8.9 billion EUR. Of the 3,950 proposals, 678 proposals were accepted for funding. The overall success rate of proposals is around 17%.
Company Status Industrial Research
Industrial Research Including
Bonuses*
Experimental Development
Experimental Development
Including Bonuses*
Micro 70 % 80 % 45 % 60 %
Small 70 % 80 % 45 % 60 %
Medium 60 % 75 % 35 % 50 %
Large 50 % 65 % 25% 40 %
�Table 6-7� Level of Funding (The Highest Level of Support Intensity)
Note: * Bonuses can be granted if the outcomes of industrial research are publicized.Source: National Center for Research and Development, www.ncbr.gov.pl

266�ˍ�2017/18 Knowledge Sharing Program with Visegrad Group
The measure is horizontal – SMEs representing different sectors can benefit from the support.
Number of Submitted Applications 3,950
Total Value of Submitted Projects 37,545,124,473 PLN - ca. 8,942,296,116 EUR
Requested Public Support 24,257,325,717 PLN - ca. 5,777,479,569 EUR
Number of Grants 678
Total Value of Projects Financed under the Fast Track Scheme 5,731,985,026 PLN - ca. 1,365,213,411 EUR
Total Value of Grants 3,470,494,374 PLN - ca. 826,583,712 EUR
Success Ratio (Applications Submitted to the Number of Grants) 17%
�Table 6-8� Basic Data on Applications and Agreements Signed
Source: The Central Information System SL 2014, accessed 23 February, 2018.
(Unit: %)
Medical Engineering Technologies,Including Medical Biotechnology
Automation and Robotics ofTechnological Processes
Intelligent Networks and GeoinformationTechnologies
Environmentally Friendly TransportSolutions
Low-emission and Integrated Systems for Generation,Storage, Transmission and Distribution of Energy
Materials and Composites with Advanced Properties,Including Nanoprocesses and Nanoproducts
Processes and Products of the Agri-foodand Forest-wood Sectors
Intelligent and Energy-savingConstruction
Medicine (Diagnosis and Therapy of Diseases andManufacture of Medicinal Products)
Sensors (Including Biosensors) andIntelligent Sensor Networks
(%)0 10 20 25 35 45
[Figure 6-5] Top 10 Areas of R&D (Number of Grants)
Source: The Central Information System SL 2014, accessed 23 Feb 2018.

Chapter 6 _ Innovation Policy for SMEs in the Era of Industry 4.0: Policy Measures to Strengthen Innovation Capacity of SMEs (Poland)�ˍ�267
The data on the results of the scheme is not available as the projects are still in the implementation phase. Therefore, it is too early for the entrepreneurs who participated in the scheme to observe any benefits that their companies gained because of the grant.
However, it should be noted that the interest of applicants is very high. One incentive for SMEs is the easy application procedure and the opportunity to reduce the risk related to R&D works. Its usefulness for companies may be evaluated highly, because of the main strengths, which are the following:
s Relatively simple formal requirements,s Intuitive procedure, s The entire application can be completed and submitted electronically,s Short decision-making time (on the appraisal).
Weaknesses are linked with a relatively low elasticity – it is difficult to change the scope of works once the grant agreement had been signed. This is a drawback in the case of R&D projects, as the results of some experiments may change the concept of the project. Another weakness is related to limitations with regard to the minimum and maximum values of eligible expenditures. In particular, micro and small companies complain that the projects are beyond the investment limit they can afford, even if they must cover only a part of the costs.
4. Comparative Analysis of Selected Policy Measures
The comparative analysis of policy measures aiming at strengthening innovation capacity of SMEs, selected for investigation in this report, is started with SWOT analysis, allowing identification of strengths, weaknesses, opportunities, and threats of fiscal instruments (tax incentives), financial instruments (De minimis guarantee), and grants for industrial R&D. Based on identification of the current state of analyzed policy measures in Poland from previous sections of the present report, the SWOT analysis is presented on <Table 6-8>, <Table 6-9>, and <Table 6-10>.

268�ˍ�2017/18 Knowledge Sharing Program with Visegrad Group
Measures Strengths Weaknesses Opportunities Threats
Tax Incentives
s Very universal measure, and high degree of neutrality with respect to firm’s allocation decisions
s Low barriers to access – there is no need to make an application to use tax incentives
s High attractiveness for companies, as it may diminish their tax burdens
s Raising the net present value of prospective research projects
s No need to organize a dedicated R&D department
s In many cases, less relevant for SMEs as the company must first invest money in R&D
s High registration and reporting obligations
s Loss of tax revenue for the state budget, which may lead to compensatory taxation distorting the allocation of resources
s Increasing complication of the tax code
s Supporting the choice by transnational corporations of Poland as a location appropriate to establish R&D centre
s Possibility to combine tax relief for R&D with other instruments, like grants
s Significant increase in private R&D spending in Polish economy in the next years
s Limited number of tax payers using the instrument, because of entrepreneurs’:- Lack of knowledge
about the instrument, especially among SMEs
- Misconception that firm’s activities may be classified as R&D and are eligible for tax relief
- Fear of potential tax inspection and its consequences
s May not only subsidize new R&D, but may also support the R&D a firm would have done anyway
s May favor R&D activities characterized by high private returns, with weaker spillover benefits to other firms and industries (lower social returns)
De minimis
Guarantee Scheme
s Relatively simple formal requirements prevent deterring potential applicants
s Intuitive procedure - easy to enter
s The entire application can be completed and submitted electronically
s Quick decision-making time (on the appraisal), reducing uncertainty and risk of unfavorable external developments
s Limitations with regard to the minimum and maximum values of eligible expenditures
s The subject of the work must fit one of the National Smart Specializations, potentially distorting company decision and guiding towards unnecessary activities to fit requirements
s Relatively low elasticity - difficult to introduce changes once the grant agreement has been signed
s SMEs can undertake R&D projects that they could neither finance themselves nor obtain market financing
s Obtaining a grant provide firms with an incentive to start conscious R&D effort resulting in further unrelated actions
s Beneficiaries get used to grants and become dependent on public support
s Grants require relatively high capital resources
�Table 6-9� SWOT Analysis

Chapter 6 _ Innovation Policy for SMEs in the Era of Industry 4.0: Policy Measures to Strengthen Innovation Capacity of SMEs (Poland)�ˍ�269
There are many factors behind the success or the failure of policy measures, and different stakeholder groups ascribe different weights to those dimensions. Performance measures can be grouped under a variety of classifications. In this section, the evaluation of the selected policy measures to strengthen innovation capacity of SMEs is based on three criteria: effectiveness, efficiency, and usefulness for SMEs. The properties of these criteria are provided in <Table 6-10>.
Measures Strengths Weaknesses Opportunities Threats
Grants for Industrial Research
and Develop-
ment Works
s Relatively simple formal requirements prevent deterring potential applicants
s Intuitive procedure - easy to enter
s The entire application can be completed and submitted electronically
s Quick decision-making time (on the appraisal), reducing uncertainty and risk of unfavorable external developments
s Limitations with regard to the minimum and maximum values of eligible expenditures
s The subject of the work must fit one of the National Smart Specializations, potentially distorting company decision and guiding towards unnecessary activities to fit requirements
s Relatively low elasticity - difficult to introduce changes once the grant agreement has been signed
s SMEs can undertake R&D projects that they could neither finance themselves nor obtain market financing
s Obtaining a grant provide firms with an incentive to start conscious R&D effort resulting in further unrelated actions
s Beneficiaries get used to grants and become dependent on public support
s Grants require relatively high capital resources
�Table 6-9� Continued

270�ˍ�2017/18 Knowledge Sharing Program with Visegrad Group
Based on the analysis from previous section, and SWOT analysis, effectiveness, efficiency, and usefulness for SMEs of tax incentives, de minimis guarantee, and grants for industrial R&D implemented by enterprises, are presented in <Table 6-10>.
Criteria The Properties Questions
Effectiveness
The extent to which the policy measure’s objectives were achieved or are expected to be achieved, taking into account their relative importance. Effectiveness is also used as judgement about the merit or worth of an instrument and if it has a positive institutional impact.
s Has the policy measure produced the expected effects?
s Could more results be obtained by using different instruments?
Efficiency
The relationship between the resources used by an intervention and the changes generated by the intervention (which may be positive or negative). This could be input in terms of money, time, staff, equipment, etc.
s How economically are inputs/resources converted to outputs/results?
s Is the relationship between input of resources and results achieved appropriate and justifiable?
s Have the objectives been achieved at lowest cost, or are there any alternatives for achieving the same results with lesser inputs/funds?
Usefulness
The extent to which the objectives of an intervention are consistent with the needs of enterprises, and national economy
s How does the instrument respond to its users’ needs?
s Do users have the ability to use the policy measure?
s Are users likely to use the policy measure?
�Table 6-10� Selection of the Most Highly Evaluated Policy Measures with Respect to Adopted Criteria
Source: Authors.

Chapter 6 _ Innovation Policy for SMEs in the Era of Industry 4.0: Policy Measures to Strengthen Innovation Capacity of SMEs (Poland)�ˍ�271
Policy Measures Effectiveness Efficiency Usefulness for SMEs
Tax Incentives
Tax Relief for Buying New Technologies
ssFocused mostly on technology
absorption, not technology
creation, and thus did not contribute
significantly to higher innovativeness of
firms
ssIt could subsidize
buying new technologies a firm would have bought anyway; however,
because of low uptake, the cost of
this instrument to the budget was relatively
small
sIt did not prove popular among
businesses in Poland
Tax Relief for R&D
sssEffective in raising the level of private
R&D spending in the economy
ssMay not only
subsidize new R&D, but may also support the R&D a firm would
have done anyway, and may lead to a needless loss of tax
revenue for the state budget
ssMore relevant for bigger companies
with an unrestricted access to finance
rather than SMEs, as the company must
first invest money in R&D
De minimis Guarantee Scheme
ssMacroeconomic effects (new jobs created), relatively
high leverage effect, positive unexpected effects like creating
innovation
sssHigh, as guarantees
do not require engaging high
financial capital and effort on the part of
companies
ssVery useful for SMEs, especially those falling into the financial gap, but not adjusted to the particular needs of innovative SMEs
Grants for Industrial R&D Works
ssHard to assess at the moment(the rating is
based on the evaluation of
instruments having the same or similar
objectives)
sRelatively high
financial resources required (which is a common feature of
grants)
sssRisk related to R&D is significantly reduced
and results with enormous return on capital in the case of
successVery popular
instrument among SMEs (proved by the number of applications)
�Table 6-11� Evaluation of Analyzed Policy Measures in terms of their Effectiveness, Efficiency, and Usefulness for SMEs, Together with Justification
Note��sss�n�%XCELLENT�RATING� ss�n�!VERAGE�RATING� s�n�0OOR�RATINGSource: Authors.

272�ˍ�2017/18 Knowledge Sharing Program with Visegrad Group
Based on the evaluation of investigated policy measures in terms of their effectiveness, efficiency, and usefulness for SMEs, the selection of the most highly evaluated policy measures with respect to each criterion, together with justification, is presented in <Table 6-12>.
5. Conclusions This chapter aimed at describing and comparing selected policy measures
that support innovation in SMEs in Poland. This sector is very important for the development of Poland’s economy as SMEs constitute nearly 99% of all economic entities. Speeding up innovation nowadays requires advancing the processes of digital transition, including creating networks between products, production process, and business models, which is referred to as Industry 4.0. Emerging economies like Poland have the most to gain through implementing as Industry 4.0. Leveraging digitization allows gaining efficiency in value chain as well as increasing operational efficiency, reducing cost, and upgrading quality of products. However, driving digital transformation requires investment in technologies, skills, and competences of people and building digital culture. Therefore, appropriate innovation policy supporting investment in these innovative activities becomes extremely important.
The analysis how SMEs in Poland position themselves in relation to the digital world and how they perceive opportunities to switch to the Industry 4.0 paradigm reveled that although Polish enterprises are more relatively optimistic in the assessment of their level of digitization, majority of them still use mainly automation systems limited to single machines. Accordingly, there is a need to increase automation that use machines cooperating with each other, as well as speed up implementation of robotics, micro- and nanoelectronics, cloud computing, and big
Criteria Most Highly Evaluated Policy Measure Justification
Effectiveness Tax relief for R&D Very effective in raising the level of private R&D spending in the economy
Efficiency De minimis Guarantee Scheme
Requires relatively small resources (in terms of financial capital and effort) compared to effects
Usefulness for SMEs Grants for industrial R&D works SMEs’ risk related to R&D is reduced
�Table 6-12� Selection of the Most Highly Evaluated Policy Measures with Respect to Each Criterion
Source: Authors.

Chapter 6 _ Innovation Policy for SMEs in the Era of Industry 4.0: Policy Measures to Strengthen Innovation Capacity of SMEs (Poland)�ˍ�273
data usage. Overcoming financial and infrastructural aspects requires additional support and introduction of new policy measures that could help to implement Industry 4.0 solutions.
The analysis carried out in this chapter covered three existing innovation policy instruments that have been designed to strengthen innovation of Polish SMEs, showing their efficiency and effectiveness for SMEs in the context of Industry 4.0 development. In-depth analysis of different types of policy measures was conducted representing three basic groups of policy instruments: fiscal instruments (tax incentives), financial instruments (de minimis guarantee), and grants for industrial R&D implemented by enterprises. The analysis allowed identification of strengths, weaknesses, opportunities, and threats of selected policy measures, and to evaluate them with respect to three criteria: effectiveness, efficiency, and usefulness for SMEs.
When it comes to effectiveness, tax relief for R&D was evaluated as the most effective instrument, which is explained by the fact that it results in raising the level of private R&D spending in the economy (both in terms of R&D effort of existing companies and as a lure for companies with no established activity in Poland).However, this policy measure is less useful for SMEs, which usually face financial barriers. In this case, a company must first possess and spend money on R&D activities, and then it may deduct the incurred costs from its tax base. Efficiency of tax relief for R&D is high, but somehow limited as it may happen that tax expenditure not only subsidizes new R&D, but also supports R&D activities a firm would have done anyway. This is why in some cases the instrument may create additional costs for the state budget, without additional impact on innovativeness of the economy.
When it comes to efficiency, the De minimis Guarantee Scheme was identified as the most efficient policy measure, which does not require engaging high financial capital or huge effort from its participants, and employs relatively small resources compared to the effects. However, although it is very useful for SMEs, in particular those falling into the financial gap, its usefulness with regard to innovativeness is diminished by the fact that it is not adjusted to the needs and specifics of innovative SMEs. Nevertheless, the conducted analysis showed that it has had a positive impact on innovativeness of SMEs. In general, the De minimis Guarantee Scheme is considered a successful policy in Poland, which may be traced to a very simple procedure and easy access for SMEs; however, firms from several branches of the economy are excluded.
When it comes to usefulness for SMEs, grants for industrial R&D works carried out by enterprises were identified as the most useful policy measure. The key reason is that it significantly reduces the risk related to R&D activity, which makes it a very popular instrument among SMEs, as proved by the high number of applications.

274�ˍ�2017/18 Knowledge Sharing Program with Visegrad Group
However, the efficiency of this instrument is limited, because of the relatively high financial resources required, as well as its effectiveness, because of a relatively low elasticity connected with the fact that is difficult to change the scope of R&D works during project implementation.
6. Policy ImplicationsThe conducted analysis allowed formulating some implications with regard to
development of policy measures aiming to strengthen innovation capacity of SMEs in Poland. New instruments of innovation policy should be designed to address the most important barriers that hamper the implementation of Industry 4.0 solutions.
The key elements that can contribute to improvement of the implementation of this type of instruments are easy access and simple formal requirements. This will reduce bureaucracy, which was indicated by Polish SMEs as the most important barrier in implementation of new technologies (see Figure 6-2). An important role is also played by the promotion of and information about the instrument among entrepreneurs (as shown in case of tax relief for buying new technology), and their education, so they know about possible state support and are able to use it. Focus on education and upgrading skills will help to reduce the lack of access to qualified personnel, which was reported as a barrier by over one third of Polish SMEs. Financial instruments (like the De minimis Guarantee Scheme, focused on innovative SMEs) could ensure high efficiency in the development of innovation capabilities, although they may be not preferred by entrepreneurs, who are eager to benefit from grants. An important role in developing affective support systems for innovative companies is played by linkages and synergies between different instruments, and a proper coordination between them.
Policy makers will need to look for a balance between supporting the development of Industry 4.0 technologies and mitigating risks related to this digital innovation. On the one hand, it is necessary to support creation and broad adoption of digital technologies by SMEs, since digitalization can increase productivity, economic growth, and societal prosperity. The policy instruments include public investments in R&D, special funds for implementation of Industry 4.0 solutions (robotization, automation, and etc.), as well as support for a variety of training programs, which can help nurture talents. On the other hand, however, emergence of Industry 4.0 also raises a challenge for policy makers to introduce new supporting instruments, as historical measures may not be adequate. Therefore, some institutional innovations in the area of policymaking are needed to cope with these rapidly evolving digital technologies.

Chapter 6 _ Innovation Policy for SMEs in the Era of Industry 4.0: Policy Measures to Strengthen Innovation Capacity of SMEs (Poland)�ˍ�275
In this context, a new policy mix supporting Industry 4.0 development and implementation by SMEs is proposed. It consists of the three following instruments, which can be offered to SMEs separately or as a combined program. They are complementary to each other, addressing different needs and reducing the identified barriers. The proposed policy mix consists of:
(1) R&D grants (InnoGrant)(2) Loans for the purchase of necessary equipment and/or software (CyberLoan)(3) Vouchers for training (GoDigital)
The detailed descriptions of these three instruments are given in tables below.
Risk regarding the return oninvestment
Limited financing possibilitiesof digital investment
Lack of incentives frompublic authorities
Lack of access to qualifiedpersonnel
Bureaucracy
Reducing risk related to R&Dworks on new digitaltechnologies and products
Strengthening the infrastructural base for the development of Industry 4.0
Strengthening knowledgedissemination about Industry4.0 solutions among Polish SMEs
Simple procedure and shortdecision-making time
InnoGrant
CyberAccelerator
GoDigital
[Figure 6-6] Policy Mix Supporting the Development of Industry 4.0
Source: Authors.

276�ˍ�2017/18 Knowledge Sharing Program with Visegrad Group
A. Instrument Supporting the Development of Industry 4.0: Grants for R&D (InnoGrant)
Specification Description
Needs / Reasons for
Implementation
s The overview of the Industry 4.0 development in Poland shows that the majority of Polish SMEs are still at an initial stage of automation, lacking a whole interactive ecosystem. Polish companies focus rather on a short-term than long-term perspective; accordingly, only more advanced enterprises are implementing key elements of Industry 4.0. Therefore, risk related to creation of new digital products and digital technologies should be reduced by public co-financing of industrial research or development in the fields of digital technologies, automation, and robotics of technological processes
s According to the study carried out by the Ministry of Economic Development and Siemens, among the main barriers to introduction of new technologies in manufacturing companies are lack of incentives from public authorities, limited financing possibilities of digital investment, and risk regarding the return on investment. The instrument - Grants for R&D - addresses these barriers
s In order to face international competition, Polish SMEs should start creating innovation based on new technologies such as real-time optimization, big data, augmented or virtual reality, and integration of digital ecosystems. There is a need to support enterprises’ involvement in development of innovative digital technologies and products
Objective of the Instrument
s Increase the number of R&D projects in the field of digital technologies, automation, and robotics of technological processes
Target Group and Type of Beneficiary
s SMEs, including start-ups, registered in Poland from any sector with innovative projects developing digital technologies and products.
Types of Projects / Activities
s Co-financing for creation of new digital technologies and innovative products in a given field
s Co-financing for the development of digital technologies, in particular: Internet of Things (IoT), cyber-physical system (CPS), cloud computing, digitization and integration of horizontal and vertical value chains, digitization of services and products, and digitization of business models
s Eligibility for co-financing should be based on costs related to industrial research or development in the fields of digital technologies, automation, and robotics of technological processes
s Projects may be implemented by SMEs alone or in partnerships between one academic and one industry actor
Project-selection Procedure
s Proposals will be submitted online and evaluated by the Evaluation Panel, consisted of five evaluators according to the following criteria:- Justification for implementation of the new technology / product- Concept of commercialisation- Cooperation with research units or big companies implementing Industry 4.0
solutionss Scores in all criteria will range from 0 to 5; the standard threshold for
individual criteria is 3; the most successful proposals will be invited to negotiations over the implementation plan with the programme manager, which will lead to signing the financing agreement
s The process from proposal submission deadline until the end of evaluation process should take max. 6 months

Chapter 6 _ Innovation Policy for SMEs in the Era of Industry 4.0: Policy Measures to Strengthen Innovation Capacity of SMEs (Poland)�ˍ�277
B. Instrument Supporting the Development of Industry 4.0: Loans for Investment (CyberLoan)
Specification Description
Expected Results
s Increased number of enterprises implementing solutions of Industry 4.0s Increased level of digitalization among Polish SMEss Increased contribution of SMEs to the development of Industry 4.0s Increased number of new digital technologies / products implemented in the
entrepreneur’s own economic activitys Increased number of commercialised new digital technologies / products
(implemented in another entrepreneur’s economic activity)s Increased digitisation of industry and economy
Indicators
s Number of developed innovative products supporting implementation of Industry 4.0
s Number of patent applications (as a result of supported projects)s Percentage of SMEs that implement digital technologies, in particular:
Internet of Things (IoT), cyber-physical system (CPS), cloud computing, digitization and integration of horizontal and vertical value chains, digitization of services and products, and digitization of business models
Source: Authors.
Specification Description
Needs / Reasons for Implementation
s Need to strengthen the infrastructural base for the development of Industry 4.0
Objective of the Instrument
s To encourage/support investment in digital technologies; help enterprises to adopt automation, robotization, as well as ICT hardware and software, which professionalize business processes (e.g., e-commerce, 3D printing) or business management (cloud computing, data analytics, etc.)
Target Group and Type of Beneficiary
s SMEs, including start-ups, registered in Poland from any sector with innovative projects implementing digital technologies
Types of Projects / Activities
s The focus is on equipment and software purchase necessary for automation, robotization, and industrial adoption of digital technologies.
s Projects may last up to 3 years. Loan repayments will be required over a further period of up to 3 years
Project-selection Procedure
s Proposals will be submitted online and evaluated by the Evaluation Panel, consisted of five evaluators according to the following criteria:- Concept- Implementation- Impact
s Scores in all criteria will range from 0 to 5; the standard threshold for individual criteria is 3. The most successful proposals will be invited to negotiations regarding the implementation plan with the programme manager, which will lead to signing the financing agreement
s The process from proposal submission deadline until the end of evaluation process should take max. 3 months

278�ˍ�2017/18 Knowledge Sharing Program with Visegrad Group
C. Instrument Supporting the Development of Industry 4.0: Vouchers for Training (GoDigital)
Specification Description
Needs / Reasons for
Implementation
s The analysis conducted revealed that one of the biggest challenges for the development of Industry 4.0 is lack of digital culture and training. At the same time, lack of access to qualified personnel is indicated as one of the main barriers to introduction of new technologies in manufacturing companies. This means there is a special need to develop strong capabilities of Polish entrepreneurs to tackle changes to the environment connected with Industry 4.0. Vouchers for training (GoDigital) are planned as policy instruments in order to: - Build awareness of Polish entrepreneurs about the technological and
business opportunities made available by the Industry 4.0 - Strengthen the knowledge base about Industry 4.0 solutions among Polish
SMEs, and available policy programs supporting their implementation- Develop SMEs skills required for Industry 4.0- Adapt the labour market to the needs of Industry 4.0
Objective of the Instrument
s The objective of “Industry 4.0 Vouchers for training” is to increase entrepreneurs’ propensity to implement Industry 4.0 solutions, by developing skills and rising awareness about existing technological and business opportunities and available policy programs in that area
Target Group and Type of Beneficiary
s SMEs, including start-ups, registered in Poland, from any sector, involved in developing and implementing digital technologies or products
Types of Projects / Activities
s Training, coaching, or consulting services in the field of Industry 4.0 solutions, delivered in Poland or abroad
Specification Description
Expected Results
s Increased number of enterprises implementing solutions of Industry 4.0s Increased contribution of SMEs to the development of Industry 4.0s Increased number of commercialised new digital technologies / products s Increased digitisation of industry and economy
Indicators
s Number (percentage) of SMEs that implemented: - Robotization of entire production line- Automation with single machines and machines cooperating with each
other- Cloud- computing- 3D printing- Big-data analytics
Source: Authors.

Chapter 6 _ Innovation Policy for SMEs in the Era of Industry 4.0: Policy Measures to Strengthen Innovation Capacity of SMEs (Poland)�ˍ�279
Specification Description
Project-selection Procedure
s Competition procedures Proposals will be submitted online and should include:
- Detailed information on training, coaching, or consulting services in the field of Industry 4.0 solutions, and on the units offering them
- Justification for the need for training: how does it fit firm’s profile and the current or planned implementation of Industry 4.0 innovative solutions
s Proposals will be evaluated by the Evaluation Panel, consisted of three evaluators according to the following criteria: - The quality of training, coaching, or consulting services- Potential impact on SMEs competencies in Industry 4.0 solutions, and
future actions in that areas Scores in all criteria will range from 0 to 5; the standard threshold for
individual criteria is 3. The most successful proposals will be granted the Vouchers for training that will cover 80% of the costs, up to a maximum of 20,000 PLN. Additional rules: - Only one voucher may be supplied to each company- The voucher is valid for half a year - The company cannot enter into any commitments with the knowledge
provider prior to receiving the voucher (in order to ensure additionality of the instrument)
Expected Results
s Increased awareness of Polish SMEs about the technological and business opportunities brought by Industry 4.0
s Increase of workers with Industry 4.0 skills s Increased implementation of Industry 4.0 solutions among Polish SMEss Increased number of Polish enterprises applying for support from other policy
measures supporting the implementation of Industry 4.0 solutions
Indicators
s Employment in knowledge-intensive activities as a % of total employments Employment dynamism of fast-growing enterprises in innovative sectorss Share of SMEs using 3D printing in various stages of the production processs Share of SMEs using industrial or professional service robots in various stages
of the production processs Share of SMEs using CAD and virtual reality tools in various stages of the
production process or in trainings Share of SMEs analysing big data
Source: Authors.

280�ˍ�2017/18 Knowledge Sharing Program with Visegrad Group
It should be also pointed out that not only design, but also management of these new instruments and relevant evaluation criteria are of key importance to ensuring their usefulness for SMEs. Taking into account the whole policy cycle, from the design of new policy instruments to their evaluation, and analyzing how new policy interventions fit to the existing policy mix, seems to be increasingly important. Innovation processes have become all-encompassing; therefore, adopting a holistic viewpoint to supporting innovation seems to be indispensable.

Chapter 6 _ Innovation Policy for SMEs in the Era of Industry 4.0: Policy Measures to Strengthen Innovation Capacity of SMEs (Poland)�ˍ�281
References
Act of 29th July 2005 on Certain Forms of Support for Innovative Activities (Journal of Laws of 19.09.2005, No. 179, Item 1484).
Act of 9th November 2017 on Amending Some Acts to Improve Legal Environment for Innovative Activities (Journal of Laws of 29.11.2017, Item 2201).
Armengaud E., Sams C., von Falck G., List G., Kreiner C., Riel A. (2017), Industry 4.0 as Digitalization over the Entire Product Lifecycle: Opportunities in the Automotive Domain. In: Stolfa J., Stolfa S., O'Connor R., Messnarz R. (eds) Systems, Software and Services Process Improvement. EuroSPI 2017. Commun Sications in Computer and Information Science, vol. 748. Springer, Cham, pp.334-351.
Bank Gospodarstwa Krajowego (2017), Outcomes of the “De minimis Guarantee Scheme” implemented by Bank Gospodarstwa Krajowego 2016.
Bank Gospodarstwa Krajowego, Outcomes of the “De minimis Guarantee Scheme” implemented by Bank Gospodarstwa Krajowego 2017.
Breunig M., Kelly R., Mathis R., Wee D. (2016), Getting the most out of Industry 4.0, Survey April, McKinsey.
Busom I., Corchuelo B., Martínez-Ros E. (2014), Tax incentives… or subsidies for business R&D?, Small Business Economics, 43(3), 571-596.
Chang A.C. (2018), Tax policy endogeneity: evidence from R&D tax credits, Economics of Innovation and New Technology, pp.1-25.
Ministry of Infrastructure and Development (2015), Detailed Description of Priority Axes of Smart Growth Operational Programme 2014-2020, Ministry of Infrastructure and Development, Warsaw.
GUS (2017), DziałalnoĞü innowacyjna przedsiĊbiorstw w latach 2014-2016 (Innovative activity of enterprises in the years 2014-2016), Główny Urząd Statystyczny (Statistics Poland).
IMF Country Report No. 14/173, International Monetary Fund (2014).
Kadar M., Moise A.I., Colomba C. (2014), Innovation Management in the Globalized Digital Society, Procedia- Social and Behavioral Science Vol.143, pp.1083-1089.
Kagermann, H., Helbig, J., Hellinger, A., & Wahlster, W. (2013) Recommendations for implementing the strategic initiative INDUSTRIE 4.0: securing the future of German manufacturing industry; final report of the Industrie 4.0 working group, Forschungsunion.
Karpowicz J. (2014), A system of preferential lending to the development of small and medium-sized enterprises in Germany (System preferencyjnego kredytowania rozwoju małych i Ğrednich przedsiĊbiorstw w Niemczech), Gospodarka Narodowa 3 (271).

282�ˍ�2017/18 Knowledge Sharing Program with Visegrad Group
Kowalczyk A., Kaczor T. (2017), Outcomes of the “De minimis Guarantee Scheme” implemented by Bank Gospodarstwa Krajowego 2017, Bank Gospodarstwa Krajowego.
Ministry of Economic Development/Siemens (2017), A smart industry Poland 2017. Adaptation of innovations in the activities of micro and small and medium-sized production enterprises in Poland. Research report, Warsaw (A Smart Industry Polska 2017. Adaptacja innowacji w działalnosci mikro oraz małych i Ğredncih przedsiĊbiorstw produkcyjnych w Polsce. Raport z badaĔ, Warszawa).
OECD (2002), “Science Technology Industry. Tax Incentives for Research and Development: Trends and Issues,” http://www.oecd.org/sti/inno/2498389.pdf
OECD (2010), OECD Studies on SMEs and Entrepreneurship. Poland: Key Issues and Policies, Paris: OECD Publishing.
Porter M.E., Heppelmann J., (2014), How Smart Connected Products Are Transforming Competition, Harvard Business Review, 2014/11
PwC (2016a), “Global Industry 4.0 Survey: Building the digital enterprise”, https://www.pwc.com/gx/en/industries/industries-4.0/landing-page/industry-4.0-building-your-digital-enterprise-april-2016.pdf
PwC (2016b), “Przemysł 4.0 czyli wyzwania współczesnej produkcji” (Industry 4.0 – challenges of the contemporary production), https://www.pwc.pl/pl/pdf/przemysl-4-0-raport.pdf.
Radas S., Aniü I.D., Tafro A., Wagner V. (2015), The effects of public support schemes on small and medium enterprises, Technovation, 38, 15-30.
Russmann M., Lorenz M., Gerbert P., Waldner M., Justus J., Engel P., Harnisch M., (2015), Industry 4.0., The future of Production and Growth in Manufacturing Industries, BCC.
National Bank of Poland (2013), The situation on the credit market the results of a survey for chairmen of loan committees (Sytuacja na rynku kredytowym wyniki ankiety do przewodniczących komitetów kredytowych), Q3 2013, National Bank of Poland, Warsaw.
ZwierzyĔski R. (2013), Ulga podatkowa na zakup nowych technologii jako szansa dla przedsiĊbiorcy (Tax relief for the purchase of new technologies as a chance for an entrepreneur, Management Sciences), Nauki o Zarządzaniu, Vol. 14, Iss. 1, 135-143.

PART IVPromotion of Smart Production
Systems for SMEs: Robotics and Automotive Industry
Chapter 7_ Promotion of Smart Production Systems for SMEs: Robotics and
Automotive Industry (Korea)
Chapter 8_ Promotion of Smart Production Systems for SMEs: Robotics and
Automotive Industry (Slovakia)


Chapter 72017/18 Knowledge Sharing Program with Visegrad Group: Innovation Policy for SMEs in the Era of Industry 4.0
Promotion of Smart Production Systems for SMEs: Robotics and
Automotive Industry (Korea)
���*OUSPEVDUJPO�
���$VSSFOU�1PMJDZ�*TTVFT�JO�4MPWBLJB
���&YQFSJFODF�PG�,PSFB
���$PODMVTJPOT�BOE�1PMJDZ�*NQMJDBUJPOT

286�ˍ�2017/18 Knowledge Sharing Program with Visegrad Group
SummaryThe importance of smart production systems is increasing because of the
intensified competition in manufacturing industry since the 2008 global financial crisis. Large firms have the funds to implement smart production systems into the production process; however, for small- mid-sized enterprises (SMEs) the implementation is almost impossible without governmental aid. Nations that are advanced in manufacturing industry such as Korea, the USA, and Germany, are implementing strategies to strengthen competitiveness in the manufacturing sector. In case of Slovakia, the government is implementing the Research and Innovation Strategy for Smart Specialization (RIS3) to diffuse smart production system domestically and to foster SMEs for economic competitiveness. However, the strategy is not sufficiently effective at the national level.
The automotive industry is developing steadily in Slovakia. With the lead of investment of foreign firms such as Volkswagen and KIA Motors, the number of automobiles produced in Slovakia is consistently increasing, and various auto parts firms are founded in the nearby area. In addition, the global robotics market is expanding, as robots are essential to the implementation of smart production systems. The number of robots in Slovakia is also increasing with the development of the automotive industry. Therefore, this research focuses on the robotics industry and automotive industry.
Promotion of Smart Production Systems for SMEs: Robotics and Automotive Industry (Korea)
Heejun Park (Yonsei University)
乇#Chapter 07
Keywords: Smart Production System, Automotive Industry, Robotics Industry, Smart Factory, Factory Automation

Chapter 7 _ Promotion of Smart Production Systems for SMEs: Robotics and Automotive Industry (Korea)�ˍ�287
In the case of Korea, the government is implementing the “Manufacturing Innovation 3.0” strategy to implement smart production systems in SMEs. With the lead of Korea Smart Factory Foundation (KOSF) in smart factory diffusion and the Korea Institute for Robotics industry Advancement (KIRIA) in robotics automation diffusion, the diffusion of smart production systems seems successful. The SMEs that have received assistance from these organizations are showing remarkable improvements. Due to the diffusion of smart production systems, the robotics industry in Korea is also developing. The Korean government is supporting the development of the Korean robotics industry with intensive care. SMEs in the automotive industry (all of them are auto parts corporates) are benefitting from the implementation of the “Manufacturing Innovation 4.0” strategy.
Thus, this research analyzes the smart production system diffusion strategies for SMEs in the robotics industry and automotive industry that are implemented in Korea and Slovakia. The current implementation status in Slovakia will be analyzed, followed by the status and experience in Korea. Based on the analysis result of both countries, Korea and Slovakia will share expertise and knowledge about implementation of smart production system. The knowledge sharing program will result in improvement of competitiveness in robotics and automotive industry, and it will eventually impact the development of the manufacturing industry and economy.
1. Introduction
�����7RSLF�,GHQWL¿FDWLRQ�
The previous research analyzed the current status of the manufacturing industry in Korea and Slovakia from a broad perspective. “Manufacturing Innovation 3.0” is a strategy in Korea, and Research and Innovation Strategy for Smart Specialization (RIS3) is a strategy in Slovakia, to improve innovation in the manufacturing industry and thereby enhance global competitiveness. Not only Korea and Slovakia but also other leading manufacturing nations such as the USA and Germany are implementing various strategies and government policies to develop their manufacturing industries.
The previous research defined that three parts are important to the industry: Research & Development (R&D), human resource development, and fostering SMEs. All the four nations mentioned above are focusing on strengthening the competitiveness in these three sections. Among these three parts, this research will establish plans to strengthen the competitiveness of manufacturing industry SMEs by adopting smart production systems. Smart production systems can be divided into smart factories and automation using robotics. The smart factory focuses on software

288�ˍ�2017/18 Knowledge Sharing Program with Visegrad Group
features, such as utilizing advanced solutions and methods, and robotics automation is about automating the manufacturing process through applying robotics to the whole system.
In Slovakia, the automotive industry is playing an important role in economic growth. It has been growing for years, and under existing future plans the industry will consistently develop. Therefore, this research concentrates on the automotive industry, and for the acceleration of manufacturing process automation it will also focus on the robotics industry.
1.2. The Importance of Smart Production Systems
Smart production systems can be divided into two branches: software and hardware. Software in smart production systems is solutions and methods that assist the production process to improve productivity and the decision-making process of the firm’s manager. Such software has been developed for a long time. The representative examples of global software corporates are SAP and Oracle. The hardware means machines that are installed into the production process to improve productivity, which mostly are robots.
Utilizing robots to increase efficiency of the manufacturing process is a global trend. In the manufacturing industry, development of intelligent manufacturing facilities and construction of smart production system and automation of manufacturing process are the main means of achieving competitiveness. In all three issues, robots and robotics occupy an important position. Actually, robots are divided into two types: industrial robots and service robots. In the field of manufacturing industry, industrial robots are much more important and, considering the market volume difference of industrial and service robots, industrial robots are leading the global robot market. The industrial robot market reached 11 billion USD by 2014, with an annual growth rate of 12%.
The importance of adopting smart production systems to the manufacturing industry has been growing since the global financial crisis in 2008. Reshoring of manufacturing sites has become a global trend after the crisis due to rising costs such as labor and shipping costs. Even though reshoring cuts the shipping costs, the labor costs remain as a burden to the firm. Improving productivity and producing high-value-added products are the solutions for firms to reducing other costs. Change in the population structure that has come from global aging and the low fertility trend is also threatening the manufacturing industry. The decrease of production population necessitates productivity improvement. Lastly, intensified competition between the manufacturing firms has shortened the product lifecycle, meaning

Chapter 7 _ Promotion of Smart Production Systems for SMEs: Robotics and Automotive Industry (Korea)�ˍ�289
that the firm needs to produce a greater number of products. Improvement of productivity and management of the production process thereby became necessary.
Adoption of a smart manufacturing system can solve these issues. The system is constructed based on three technologies and has three major characteristics. Automation technology, ICT technology, and production technology are the core technologies, and high productivity, high flexibility, high resource awareness are the core characteristics. Automation technology is about robotics and flexible production module technology; ICT technology is about Internet of Things (IoT) technology, cyber physical system (CPS), big data, and cloud systems; and production technologies are application of new materials and adoption of energy-saving techniques.
As mentioned in the first part, countries that have high dependency on their manufacturing industry, such as the US, Germany, Japan, and China, are implementing various policies to accelerate the development of smart production systems. The US has presented Advanced Manufacturing Partnership (AMP) and National robotics Initiative (NRI) with a fund of 31.5 million UDS to promote robot development and support reshoring of manufacturing firms. Germany announced “Industrie 4.0” to develop human–robot joint work system to invigorate manufacturing SMEs. In Japan, more than 200 diverse firms are participating in promotion of the new industrial revolution and in standardizing key parts of industrial robots under the governmental policy “Robot Strategy.” Lastly, China announced “China Manufacturing 2025” to promote the construction of smart factories and digital work sites in major industries through smart manufacturing project, with five specific major projects.
12,000
10,000
8,000
6,000
4,000
2,000
-
100
80
60
40
20
02010
3,890 4,205 4,860 5,365
Industrial Personal ServiceService
5,965
10,737
(Unit: million USD) (Unit: %)
<Growth of Global Robot Market> <Composition of Global Robot Market>
9,5078,4968,278
5,678
2011 2012 2013 2014 2010 2011 2012 2013 2014
59.4
35
5.6
66.3
28.6
5.1
63.6
27.2
9.2
63.9
24.6
11.5
64.3
22.6
13.1
Professional Service Industrial
[Figure 7-1] Status of the Robot Market
Source: World Robotics (2015).

290�ˍ�2017/18 Knowledge Sharing Program with Visegrad Group
1.3. Structure of the Paper
The paper is divided into four parts: first chapter describes the importance of smart production system and structure of the research. The second chapter is about current status in Slovakia. The third chapter analyzes the current status and the ongoing SME foster policies in Korea. In the last chapter the research will propose implications based on the experience of Korea to Slovakia. Throughout the chapters, the research will analyze the weakness of Slovakia’s strategy and share Korea’s experience to improve the strategy.
The second chapter is separated into three sub-chapters. First, the present study analyzes the current strategy in Slovakia. Research on Slovakia’s strategy will be analyzed. Second, the robotics industry in Slovakia will be analyzed. Last, as the automotive industry is important in Slovakia, it will be analyzed in detail, including the structure of the industry and the market.
The third chapter is about Korea’s experience. Policies for SMEs, the robotics industry, and automotive industry are the three sub-chapters. The sub-chapter for SME-fostering policy is separated into two sub-sections: the policies that support implementation of smart factory and then policies for application of robots in the manufacturing process for automation. Next, the robot market in Korea will be analyzed. Lastly, the automotive sub-chapter is also divided into two sub-sections, preceded by a summary of the Korean automotive industry. The first sub-section will introduce actual automotive firms that implemented smart factories. The last sub-section will discuss examples of application robots for production automation.
In the last chapter, the study will derive implications. Based on the analysis of the current status of Slovakia and the experience of Korea, it will propose customized SME-fostering policies, especially for the robotics and automotive industries.
2. Current Policy Issues in Slovakia
2.1. Policy for SMEs
The Slovak government has established an integrated Research & Innovation (R&I) strategy called RIS3. This strategy focuses on the R&D sector, technology sector, and social sector. However, as analyzed in the previous study, the strategy is lacking in specific implementation instructions. The R&D projects that are ongoing are mainly led by the foreign firms that have entered the Slovak economy. Traditionally, Slovakia showed strength in the basic science field R&D but not in the applied science sector. In addition, the large companies that are in Slovakia originally belonged to other companies. These current statuses are undermining the effectiveness of the strategy.

Chapter 7 _ Promotion of Smart Production Systems for SMEs: Robotics and Automotive Industry (Korea)�ˍ�291
Interreg Europe has conducted research entitled “Critical Factor SME Diagnosis Report for Slovakia.” The research has surveyed production-oriented SMEs in Slovakia. The survey took place from April to May, 2017. The research reached 312 SMEs to receive the survey; however, only 32 firms completed the questionnaires. The survey examined respondents’ awareness on the innovation of the overall manufacturing industry.
First, the research questioned about how well the SME is aware of the RIS3 strategy (the research mentions that RIS3 strategy is also known as Smart Manufacturing Policy, Smart Specialization Strategy, Industry 4.0 Policy, Regional Innovation Strategy for Intelligent Specialization and Smart Factory). Although the RIS3 strategy is implemented by the Slovak government, only 30% of the SMEs were aware of the strategy. Only 10% of the respondents indicated that they are involved in the strategy.
Second, 45% of the respondents are aware of the benefits and impacts of smart manufacturing. However, only 25% of the SMEs were actually utilizing smart manufacturing systems or solutions in their firms.
Third, 58% of the SMEs agreed that the main challenge in applying smart manufacturing technologies and systems is the costs related to implementation. The next is lack of information (55%), difficulty in accessing to new solutions (27%), risks associated with new solutions (25%), resistance from employees (20%), lack of interest from the management (7%), and, lastly, high complexity (3%). This means that the firm is experiencing difficulties in practical problems rather than personal barriers such as lack of interest or will to adopt the systems.
The respondents generally agree that improved product quality and decreased manufacturing cost will be important to their competitiveness. Improvement of agility and responsiveness in the production process, improvement of coordination with customers, and improvement of compliance with customer specifications followed. However, development of visualization capabilities and improved remote monitoring capabilities were not that important to the SME managers. It states that, rather than developing techniques for convenience, it is more important to develop technologies and systems that can be applied in the manufacturing process.
Fifth, the survey result shows that 81% of the respondents have applied at least one smart manufacturing technology to their company. Of the SMEs, 30–40% have adapted cloud storage and processing, data analytics, or next-generation manufacturing systems. More than 50% of the SMEs were planning to implement a next-generation manufacturing system in the future. However, still 11% of the respondents have not and are not planning to implement any smart manufacturing technology.

292�ˍ�2017/18 Knowledge Sharing Program with Visegrad Group
Among the respondents, 62% of them are implementing solutions or methods related to production process. The most implemented method is Failure Mode and Effects Analysis (FMEA). In addition, 62% of the reached SMEs are planning to implement additional solutions to the production process in the future. Lean manufacturing was the most popular solution to be adopted. However, 38% of the respondents were not currently implementing any solutions, and 38% of them were not planning to implement any solutions in the future.
Implementation status of Human Resource Management (HRM)-related solutions and methods was also surveyed. 77% of the SMEs were using HRM-related solutions, among which 59% were implementing employee motivation systems. 32% of the total were planning to introduce digital working instruction via a mobile device system, online labor performance evaluation system, or life-long learning system in the near future. 15% were not planning to apply any systems. The percentage related with the HRM solutions application was generally higher than the percentage of production system implementations.
Lastly, 77% of the responding SMEs were interested in cooperating with the RIS3 strategy. They were interested in implementing new technologies in the production process. Moreover, 31% expected to cooperate as a position of offering solutions or best practices to other companies. Most of the interested companies (62%) were hoping to cooperate at the production-floor level.
To sum up, the research shows that even though the SMEs are not familiar with the idea of smart manufacturing, the SMEs are interested in adopting these technologies to improve productivity and gain competitiveness. The Slovak government is implementing the RIS3 strategy to assist the diffusion of smart manufacturing technologies in the industry. However, as the SMEs are not aware of the existence of the RIS3 strategy, the priority task for the government will be promotion of the RIS3 strategy. To be a successful strategy, it will have to deal with the difficulties that the target entities, SMEs in this case, are facing. Offering financial support so that SMEs can implement the cutting-edge production technologies, and providing appropriate information and knowledge through related government organizations should be top priority according to the survey results.
2.2. Robotics Industry
According to industrial classification lists, the robotics industry belongs in the machinery industry category. Regarding the data in 2015, the machinery industry is responsible for 1.6% of the total added value of Slovakia. Considering International Standard of Industry Classification (ISIC) Rev.3, the robotics industry belongs to code 29, which is manufacture of machinery and equipment. In terms of the

Chapter 7 _ Promotion of Smart Production Systems for SMEs: Robotics and Automotive Industry (Korea)�ˍ�293
Revealed Comparative Advantage (RCA) index, which is frequently used to compare competitiveness of the industry considering the nation’s economic scale difference, the manufacturing of machinery and equipment sector is showing a 1.053 RCA index. This means that the sector is a little bit better than other countries on average considering the overall economy.
As smart manufacturing is diffusing all around the world, the automation of production processes is ongoing. Due to this trend, the number of robots is steadily increasing. In 2018, the robot density has reached 74 robot units per 10,000 employees. Comparing to the number in 2015, 66 units, it implies that the overall number is rapidly increasing. By region, the average robot density in Europe is 99 units, in the Americas 84, and in Asia 63 units. Korea is holding the highest robot density position since 2010. There are 631 units per 10,000 employees, more than eight times more than the world average. In Europe, Germany is showing 309 units per 10,000 employees, taking first place. The amount in Slovakia is 135 units per 10,000 employees, ranking it at 17th place worldwide. The reason that there are so many robots in Slovakia is because the automotive industry is consistently developing in the area.
In Slovakia, R&D in the mechanical engineering is active due to the national RIS3 strategy. In addition, the environment that Slovakia has highly qualified workforce at low cost, technology clusters, and many R&D centers where companies and domestic universities collaborate, makes companies attracted to invest R&D in Slovakia. Regarding the mechanical engineering industry, in which the robotics industry is included, there are 35 R&D centers of excellence, nine science parks and research centers, and three centers of competence. For example, KUKA Systems develops robotized production lines and is a successful R&D story of foreign companies. In addition, the National Robotics Center, which is in the Slovak University of Technology, is successful in R&D.
2.3. Automotive Industry According to the Automotive Industry Association of the Slovak Republic (ZAP SR),
the Slovak manufacturing industry accounts for 26% of the total GDP and, especially, the automotive manufacturing industry creates 12% of the total GDP. Regarding the manufacturing industry, the automotive industry occupied 28.73% in the year 2015. This proportion was 20.60% in 2010, and the percentage is continuously increasing.

294�ˍ�2017/18 Knowledge Sharing Program with Visegrad Group
The automotive industry in Central and Eastern European (CEE) nations has developed rapidly since the late 1990s. Especially, Slovakia and Czech Republic are the main manufacturing countries among the European Union (EU) nations. According to the European Automobile Manufacturers’ Association (ACEA) there are 225 automobile assembly plants in 19 EU nations, and three are located in Slovakia. The 19 nations produced 18 million cars in 2015, of which Slovakia manufactured 910 thousand, accounting for 4.9% of the total. Slovakia is the 7th largest manufacturing nation in the EU. Considering the number of motor vehicles produced per direct manufacturing worker, Slovakia becomes the 2nd nation in the EU.
(Unit: %)
40.00
30.00
20.00
10.00
0.002010
20.60 22.0424.76 26.29 26.48
28.73
2011 2012 2013 2014 2015
[Figure 7-2] The Ratio of Slovak Automotive Industry in Total Production
Source: The Slovak Spectator (2015).
(Unit: number)
7,000,000
6,000,000
5,000,000
4,000,000
3,000,000
2,000,000
1,000,000
-Germany
6,126,206
2,923,064
2,138,122 1,824,0181,344,137
1,081,074 942,546
Spain France UK Czech SlovakiaItaly
[Figure 7-3] Automobile Production Status of EU Nations in 2016
Source: ACEA (2018).

Chapter 7 _ Promotion of Smart Production Systems for SMEs: Robotics and Automotive Industry (Korea)�ˍ�295
The Slovak automobile industry started to develop with the Volkswagen (VW) group acquiring the preexisting assembly plant, BAZ, in the 1990s. PSA Peugeot Citroën (PSA) established their plant in 2003, and KIA Motors started production in Slovakia in 2004. Jaguar Land Rover is also planning to complete their plant establishment by 2018.
Volkswagen Slovakia was launched in 1991, and the VW group has scheduled to expand the plant with more than 1 billion euro investment. In 2014, the automobile production number reached 394,474, and the revenue from Volkswagen Slovakia was 6.2 billion EUR. More than 9,900 workers are involved in the plant manufacturing Volkswagen, Audi, Skoda, SEAT, Porsche, and Bentley automobiles.
PSA Group entered the Slovak economy in 2003. Automobile models such as the Peugeot 208 and Citroën C3 Picasso are being produced, and in 2018, it is expected to adopt new model manufacturing lines. PSA Slovakia produced 303,025 automobiles and made 2.1 billion EUR of revenue.
KIA Motors is operating auto-assembly plants and engine-producing plants in Slovakia. Starting in 2004, KIA Motors Slovakia accomplished 4.6 billion EUR by 2014 with 3,800 workers by producing the KIA Cee’d, KIA Sportage, and KIA Venga. KIA produced 338,000 automobiles and 582,000 engines by 2015 and is planning to expand the plant to increase production capacity.
Until 2017, there were only three car assembly plants in Slovakia. However, in 2018, Jaguar Land Rover is opening a new plant in Slovakia. It is for producing
(Unit: %)
25
20
15
10
5
0
8.9
France
9.93
UK
10.11
Slovenia
10.96
Finland
12.83
Belgium
13.71
Slovakia
19.2
Spain
[Figure 7-4] Number of Vehicles Produced per Direct Manufacturing Worker in 2016
Source: ACEA (2018).

296�ˍ�2017/18 Knowledge Sharing Program with Visegrad Group
premium SUVs and expected to produce 300,000 cars a year and expected to create more than 2,800 jobs in the area.
Until 2005, only Volkswagen Slovakia was producing complete cars in Slovakia. Therefore, the total number of automobile produced in Slovakia was only 220,000. As PSA Group and KIA Motors started to operate their plants in 2007, the annual numbers rose to 570,000, which is a 159.1% increment. In 2012, Volkswagen increased the number of automobiles produced for export purpose, and PSA and KIA Motors launched new car models and started to utilize a three-shift system in the plant. After the transition, the number grew to 926 thousand, which is a 62.2% growth compared to the number 5 years previous. The number exceeded a million in 2015, and it is expected to constantly grow after the opening of the Jaguar Land Rover plant.
According to ZAP SR, there are 343 auto-part manufacturers in Slovakia. Of these, 279 are in the west part of Slovakia, and the other 64 are in the east. This is because the three major car manufacturers (VW, PSA, KIA) are located in the west side. The export amount generated by these car component manufacturing firms reached 5,401 million EUR in 2012. The number of auto-part manufacturers and the amount of exports of car components are expected to considerably increase after the opening of the Jaguar Land Rover plant. The structure of the automotive industry in Slovakia is explained in [Figure 7-6] with examples for each stage of the supply chain.
(Unit: number)
1,200
1,000
800
600
400
200
02016
942.5
2015
1,038.5
2014
971.2
2013
987.7
2012
926.6
2011
639.8
2010
561.9
2009
463.1
2008
575.8
2007
571.1
2006
295.4218.3
2004
223.5
2003
281.2
2002
225.4
2001
181.6
2000
180.8
2005
[Figure 7-5] The Trend of Automobile Production in Slovakia
Source: ZAP SR (2016).

Chapter 7 _ Promotion of Smart Production Systems for SMEs: Robotics and Automotive Industry (Korea)�ˍ�297
The development of the automotive industry in Slovakia is also contributing to the creation of jobs. The establishment of foreign car assembly plants created jobs directly, and as suppliers to these plants are located nearby, more jobs are created directly and indirectly. In 2002, only 50,200 workers were working for the automotive industry in Slovakia. As PSA Group and KIA Motors join the Slovak automotive industry, the number of workers rose to 71,500 in 2011. In 2018, the participation of Jaguar Land Rover will increase this number by the direct employment of Jaguar Land Rover and related auto-part manufacturers, and there will be another large number of indirectly created jobs.
Car manufacturers
ManufacturersWith their own established production or assembly and JIT capabilities
(seat systems, interior systems, gearboxes) + local engineering and development centers(ex. JohnsonControls International)
Suppliers of the chain Tier-2With their own estabilished local pr oduction or
assembly and JIT capacities (Suppliers of modules or components) or with their own established
development(ex. HBPO, Brose)
Suppliers of the chain Tier-3Suppliers of parts and components, unprocessed
material such as metal parts, plastics, aluminum parts
Integrated suppliers of engineering services
(ex. EDAG, Car Technology)
Small engineering companies, university science
departments, research institutes of SAS
specialized services, design, rapid prototyping, etc.
Consulting ServicesProject management, TQM,
production systems, optimization (ex. IPA Slovakia)
Suppliers of software services
(ex. Technodat CAE Systems)
Clusters(ex. Automotive clusterwest
Slovakia, Plastic cluster and others)
Technology Suppliers Automation, robotics, etc.
Local research-development
[Figure 7-6] The Structure of Supply Network in the Slovak Automobile Industry
Source: SARIO (2016).

298�ˍ�2017/18 Knowledge Sharing Program with Visegrad Group
As the growth of the Slovak automotive industry is continuous, automobile products have become a major export category of Slovakia. Except the years 2009 and 2010, which were when the economy was hit by the global financial crisis, the Slovak exports have been steadily expanding. Regarding the 2015 exports, the automotive sector exports account for 26.8% of the total. As shown in [Figure 7-8], most of the exports, and even the most of the automotive sector exports, occur to EU nations. In 2015, the within-EU automotive export amount was 3.5 times larger than offshore export amount. The automotive sector export is not only about exporting completed automobiles. Even the Slovak auto-part industry accounts for a large amount. Regarding the numbers in 2012, among the automotive field export, 14,697 million EUR, the auto-part industry is making 5,401 million EUR, which is about 36.7%.
(Unit: number)
90,000
80,000
70,000
60,000
50,000
40,000
30,000
20,000
10,000
0201120102009200820072006200420032002
50,20054,700 55,000
57,40066,900
76,90074,000 71,50069,80068,000
2005
[Figure 7-7] Number of Employees Related to the Automotive Industry in Slovakia
Source: SARIO (2016).

Chapter 7 _ Promotion of Smart Production Systems for SMEs: Robotics and Automotive Industry (Korea)�ˍ�299
In addition, the R&D investment amount has sky rocketed in the automotive industry. The figure was only 19.62 million EUR in 2009, and 5 years later, in 2013, had increased 434% into 85.20 million EUR. According to the data in <Table 7-1> the automotive industry R&D investment is 0.1% of the total Slovak GDP. Compared to the ratio of the largest automobile-producing country, Germany, which is 0.6%, it is still not enough; however, considering the growth between 2009 and 2013, the data shows that Slovakia is putting emphasis on automobile R&D. Actually, the Slovak government is encouraging automobile sector R&D through promoting industry–university cooperation.
(Unit: million EUR)
80,000
70,000
60,000
50,000
40,000
30,000
20,000
10,000
02011 2012 2013 2014 2015201020092008
Total: Intra
Total: Offshore
Automotive: Intra
Automotive: Offshore
200720062005
9663,727
3,182
22,450
1,630
5,045
4,233
29,1062,013
7891
5,463
22,4502,680
7,721
6,884
41,505
1,876
5,999
5,510
346982,903
6,930
7,448
41,329
3,726
8,539
8,540
48,810
4,046
10,651
9,953
52,790
4,627
11,061
11,009
53,557
4,124
11,815
10,172
54,909
4,031
14,222
9,861
58,150
[Figure 7-8] Total Exports and Automobile Exports of Slovakia
Source: Eurostat (2016).
2009 2010 2011 2012 2013 2014
Expense per capita (EUR) 3.6 6.1 4.5 7.4 15.7 13.7
Total Amount (million EUR) 19.62 32.99 24.12 40.08 85.20 74.16
Ratio to GDP 0.03 0.05 0.03 0.06 0.12 0.1
�Table 7-1� R&D Expenditures of the Slovak Automobile Industry Firms
Source: Eurostat (2016).

300�ˍ�2017/18 Knowledge Sharing Program with Visegrad Group
According to Business Monitor International (BMI), the number of cars produced will grow at least until 2020 with a 5% growth rate, and the revenue will increase with a 6% growth rate.
Although the whole automotive industry in Slovakia is growing, Slovakia is not reaping all the benefits. <Table 7-3> is a list of the top-40 auto-part manufacturing firms in Slovakia. First, all the automobile assembly plants that are in Slovakia are foreign firms. According to the list, the top-10 firms originally belong to Korea, Germany, USA, France, and Belgium. There are only two Slovak firms that are listed in the top 40, ranked 13th and 38th, respectively. This is only 5% of the top-40 firms. Regarding the amount of revenue, the figure drops more. Considering the sales revenue data in 2014, 10,812,532,000 EUR was made by the top-40 auto-part firms. However, only 371,473,000 EUR originated from Slovak firms, which is 3.4% of the total revenue.
2016(E) 2017(E) 2018(E) 2019(E) 2020(E)
Car Production (EA) 1,068,649 1,140,249 1,222,347 1,301,799 1,377,304
Revenue (million EUR) 83,815 90,269 96,768 103,349 109,860
�Table 7-2� Expectations of Slovak Automobile Production and Sales
Note: (E) Estimated.Source: BMI (2016).
(Unit: thousand EUR)
Company Name Country of Origin
Sales Revenue Company Name Country of
OriginSales
Revenue
Mobis Slovakia Korea 1,135,821 ZF Slovakia Germany 192,411
Continental Matador Rubber Germany 792,017 Sungwoo Hitech
Slovakia Korea 186,282
Johnson Controls International USA 633,341 Hanil E – HWA
automotive Slovakia Korea 176,440
Continental Matador Truck Tiers Germany 572,569 U-Shin Slovakia Japan 174,476
Faurecia Slovakia France 528,031 Sejong Slovakia Korea 168,421
SAS Automotive Germany 495,637 Plastic Omnium Auto Exteriors France 161,814
INA Skalica Germany 448,815 ZKW Slovakia Austria 155,997
INA Kysuce Germany 447,996 Leoni Slovakia Germany 153,850
�Table 7-3� Top 40 Suppliers in the Slovak Automotive Sector (in 2014)

Chapter 7 _ Promotion of Smart Production Systems for SMEs: Robotics and Automotive Industry (Korea)�ˍ�301
(Unit: thousand EUR)
Company Name Country of Origin
Sales Revenue Company Name Country of
OriginSales
Revenue
Yura Corporation Slovakia Korea 275,147 Lear Corporation
Seating Slovakia USA 150,286
Bakaert Belgium 271,620 Hella Slovakia Signal-Lighting Germany 148,768
Johnson Controls Luþenec USA 267,342 Brose Bratislava Germany 141,572
Hanon Systems Slovakia Korea 257,716 HBPO Slovakia Germany 139,517
Železiarne Podbrezová Slovakia 240,211 Donghee Slovakia Korea 137,553
Continental Automotive Systems
SlovakiaGermany 228,519 Magna Slovteca Canada 135,694
Getrag Ford Transmissions
SlovakiaCanada 221,400 Osram Germany 132,572
Emerson USA 208,248 Iljin Slovakia Korea 132,152
Hella Slovakia Front-Lighting Germany 201,395 Inergy Automotive
Systems Slovakia France 132,113
Inteva Products Slovakia Netherlands 199,373 Matador Automotive
Vráble Slovakia 131,262
TRW Automotive Slovakia USA 197,166 Tower Automotive USA 123,971
ArcelorMittal Gonvarri SSC
SlovakiaLuxembourg 194,315 Magneti Marelli
Slovakia Italy 120,702
�Table 7-3� Continued
Source: SARIO (2016).

302�ˍ�2017/18 Knowledge Sharing Program with Visegrad Group
3. Experience of Korea
3.1. Policy for SMEs
The Korean government is implementing various polices to strengthen competitiveness of SMEs by adopting smart factory systems and to gain technological competitiveness in the global robotics industry by encouraging robot manufacturing SMEs. Both aspect shares a common basis: robotics. This sub-chapter will briefly explain about the two types of policies, and the specific contents will be in the subsequent sub-chapters.
The Korean government has established the Korea Smart Factory Foundation (KOSF), which is participated in by the industry, government, and academia jointly. The main purpose of the KOSF is to diffuse smart factory systems. It establishes smart factory supportive policies by cooperating with the relevant government ministries. The KOSF installs the smart factory system into the production site of the SME and even consults on how to operate it. The foundation also offers human resource education program so that the preexisting employees can handle the system.
On the robotics industry aspect, the government has established the Korea Institute for Robotics industry Advancement (KIRIA). The KIRIA supports the domestic robot-manufacturing firms to gain competitiveness and develop advanced robotics. For the marketing purposes, the institution identifies the supply and demand of robots domestically and internationally. It even discovers or trains human resources so that robot firms can hire from a sufficient labor pool and gives advice on productivity and quality enhancement.
3.1.1. Smart Factory
In 2014, only 57% of the firms in Korea were aware of the importance of smart factories. However, by 2016 the figure rose to 91.9%. The KOSF is advertising smart factories to domestic companies so that they can be more aware about them and diffusing the smart factory system domestically. Until 2014, only 227 factories were installed in Korea. The number increased to 1,240 by 2015 and 2,800 by 2016, and it was expected to reach 5,000 by 2017. The foundation is scheduling to implement smart factory systems in more than 10,000 factories by 2020.

Chapter 7 _ Promotion of Smart Production Systems for SMEs: Robotics and Automotive Industry (Korea)�ˍ�303
Regarding the 1,861 factories that had finished installing the smart factory system in 2016, 79% of them belong to the basic level mentioned in [Figure 7-9]. Basic level means only partial management system operation is ongoing in sales, inventory, and accounting sectors. 19% belong to middle level 1, in which partial linkage is available between sector management systems, and only 2% belong to middle level 2, in which the firm is able to link between sector management systems in real-time. There is still no sophistication-level factory due to technological shortage issues. In terms of the company status, only 5% of the 1,861 companies have more than 100 million USD in sales; 48% have sales under 10 million USD. The statistics in the aspect of number of employees is similar to those on sales. Firms with more than 100 employees account for only 21%, with 52% having 10 to 50 employees. Through the statistics, it is obvious that most of the firms that have constructed smart factories belong to the SME class according to the Korean company valuation rules (firms with less than 10 million USD sales or fewer than 100 employees).
DivisionLocal
AutomationFactory
OperationEnterprise Resour ce Management (ERP)
Product Development
(PLM)
Sulpply Chain Management
(SCM)
Sophistication
Internet of Things (IoT) / Internet of Services (IoS) - based Cyber PhysicalSystems (CPS)
Business in internet,
CPS network cooperationIoT/IoS Big data-based diagnosis and operation
Middle level2 Automation of facility control
Real-time factory control
Integration of fatory operation
Automation of turn-key process
Cooperation in development of multiple items
Middle level1Automation
totaling facility data
Real-time decision making
Integration between functions
Automation of generating technical data
Cooperation in producing
multiple items
Basic levelAutomation of tataling
performance
Process logistics management
(POP)
Managerial function focused operation
of function development
Technology/Delivery
management through server
Depend on single parent company
Not applying ICT Manual Manual Manual Manual Manual
[Figure 7-9] Overview of Each Level of Smart Factory
Source: KOSF (2016).

304�ˍ�2017/18 Knowledge Sharing Program with Visegrad Group
Smart factory system is constructed with various components, such as, Manufacturing Execution System (MES), Product Lifecycle Management (PLM), and Supply Chain Management (SCM). MES is a manufacturing site management system that has control automation function and data aggregation function. The PLM system provides information needed for product development and process development, and the SCM system optimizes manufacturing operation such as demand forecasting and operational scheduling. An Enterprise Resource Planning (ERP) system manages enterprise resources in a holistic perspective. Manufacturing automation is a component to improve productivity and quality competitiveness by using sensors and robots. Through process simulation, the factory can assure quality by analyzing factory and process layout simulation and data interpretation. Precise molding technique provides solutions for precise design, machining, and assembly of metal materials.
The KOSF supports SMEs in adopting smart factory systems by a series of phases. First, the KOSF considers the own will of the firm and the likely effect of supporting construction. Second, the KOSF establishes a smart factory construction custom-made plan only for a particular SME through a smart factory coordinator. Lastly, the smart factory system is established in terms of software, hardware, and human resource. Applications of smart devices (RFID, sensor, etc.) and solutions are deployed with the fund from the corporate and government jointly. Facilities are replaced to be automated with the support of government loans and, lastly, the KOSF provides human resource fostering programs for operational capability training.
Number ofEmployees
10-50, 52%
Under 10,48%
10-50, 39%
50-100, 7%
50-100,24%
Over 100,21%
Under 10, 3%Over 100, 5%
Sales
[Figure 7-10] Status of Companies where Constructed Smart Factory
Source: KOSF (2016).

Chapter 7 _ Promotion of Smart Production Systems for SMEs: Robotics and Automotive Industry (Korea)�ˍ�305
As a result of the continuous effort of the KOSF, SMEs gained improved competitiveness in the manufacturing industry. By the end of 2016, the productivity of the 1,861 SMEs that implemented the smart factory systems increased by 23% compared to pre-implementation. In addition, the defect rate and production cost decreased by 46% and 16%, respectively, which lead to a decrease in overall production time by 35%. The results of implementing the system were more evident when compared to the entire manufacturing industry. While the sales of the manufacturing industry rose by only 3.8% from 2013 to 2015, the sales of the 2,777 SMEs who implemented the smart factory system in 2014 rose by 5.3%. During the same period, the employment scale of these SMEs also increased by 6%, which is almost twice to rate of the total industry. This implies that the smart factory system had a significant impact on helping SMEs in the manufacturing industry.
The following are the examples of smart factory system distributions by the KOSF:
Younam Electric Co produces filter dryers, which are a crucial component when making refrigerators or air conditioners. By implementing the smart factory system, the company planned to create a better work environment. After adopting the system, the firm was able to create an MES system, resulting in improved product quality. In addition, they optimized the factory layout, which helped increase productivity while improving the overall work environment for their workers.
Plumbfast manufactures plastic pipes for industrial and constructional purposes. The objective of taking part in the KOSF project was to minimize the minor errors in the manufacturing process. The smart factory system helped the firm optimize and control the process by recording crucial data in real time. Before the implementation of the system, workers had to write down the data, which was time- and cost-consuming and was vulnerable to human error. Furthermore, since the entire process was controlled by the newly adopted system, there was no need for human workers to inspect every line, meaning that these workers could focus on making products.
Consider firm’sown will and
effect of support
KOSF
Establishment of smart factory
construction plan
Smart FactoryCoordinator
Application of amart device(RFID, sensor)
and solution(SW)
Cooperate Funding +Government Support
Facility replacementautomation
Government Loans
Operationalcapabilitytraining
Programsby KOSF
[Figure 7-11] Procedures for Supporting Smart Factory Construction for SMEs
Source: KOSF (2016).

306�ˍ�2017/18 Knowledge Sharing Program with Visegrad Group
Other than the effort to distribute smart factories in Korea by the KOSF, the Korean government and other private, public sectors are collaborating to help SMEs implement smart factories.
The Ministry of Trade, Industry, and Energy (MOTIE) along with the Korea Chamber of Commerce and Industry (KCCI) and the Korea Technology and Information Promotion Agency (TIPA) conducted a demonstration project in 2014 targeting 277 SMEs in Korea. The objective of the project was to implement a smart factory system in these SMEs and compare the improvement of productivity, quality, cost, and sales. The project ended successfully with a 15% increase in labor productivity, 27% decrease in total production time, 16% increase in items being produced, and 33% decrease in prototype production time. The overall sales also increased by 17%, while the defect rate and production cost decreased by 33% and 23%, respectively.
Another case of successful smart factory system implementation was conducted in Gwangju, Korea. The Gwangju Center for Creative Economy and Innovation worked together with Hyundai Motors to help 20 local SMEs construct smart factories. The project began in 2015 with a total investment of 5.4 billion USD. The project targeted 10 automotive industry SMEs and 10 non-automotive-industry SMEs.
The project resulted in significant success with a total 10.8 billion USD financial performance due to increase in productivity. The average increase of all evaluation index including productivity, quality, cost-reduction, and work-environment improvement recorded 111.3%, which is more than double the original goal of 53.5%.
Evaluation Index Result
Productivity
Labor Productivity 15% ń
Delayed Delivery 27% ņ
Items Produced 16% ń
Prototype Production Time 33% ņ
Quality Defect Rate 33% ņ
Cost Production Cost 23% ņ
Sales Sales 17% ń
�Table 7-4� Result of the Smart Factory Demonstration Project
Sources: MOTIE (2014), KCCI (2014), TIPA (2014).

Chapter 7 _ Promotion of Smart Production Systems for SMEs: Robotics and Automotive Industry (Korea)�ˍ�307
However, despite the success of the demonstration projects listed above, smart factory implementation in Korea still lacks competitiveness compared to developed countries like the US and Japan. The gap between these countries is largely due to Korea’s lacking in technologies critical to building a smart factory. The competitiveness of critical technologies such as basic smart-factory-related technology, hardware, and software technology is only about 70% of developed countries. In the industrial robot hardware and software design area, the percentage drops to about 20%. Due to the lack of competitiveness in these areas, most Korean smart factories use parts made in Korea for less-important parts.
In addition, the use of ICT and other smart factory systems is mostly concentrated on a few major companies is lesser among SMEs, 66.7% of which replied that they do not use any ICT or related systems in their manufacturing field. Especially SMEs in the basic manufacturing industry such as welding and casting, which is about 99.6% of all the SMEs in Korea, significantly lack the related technologies and desperately need to be innovated.
To solve the issues related to smart factory implementation in Korea, the need for the “Korean Smart Factory Model” is emphasized. Innovation models from other developed countries lack the understanding of the Korean manufacturing industry. The manufacturing industry in Korea is dependent on the electric and automotive industry, and the technological gap between major companies and SMEs is large. Considering these situations, a model based on Korea needs to be developed. In addition, as we can see from successful cases of smart factory implementation in Germany, the model should be strongly pushed ahead while continuously addressing any problems that arise.
To raise the level of competitiveness in smart-factory-related technologies, such as hardware and software, while improving the overall implementation of smart factories in the manufacturing industry, a two-track policy needs to be carried out. First of all, focusing on software technologies with high dependency on foreign companies and the localization of these technologies is required. Secondly, the 19 Centers for Creative Economy and Innovation should encourage SMEs to implement these technologies and help local SMEs network with each other. Centers in Gwangju and Jeonnam are already cooperating with local SMEs and funding them to implement smart factory systems.
The efforts to nurture smart-factory-related industries in Korea is successfully leading to continuous growth of the domestic smart-factory-related market. As a result, the annual average growing rate of the market recorded 11.2% from 2011 to 2017, which is much higher than the global average of 8.0%. With continuous support and funding from the government, the KOSF, and major companies with

308�ˍ�2017/18 Knowledge Sharing Program with Visegrad Group
a high level of smart factory technology, SMEs in Korea are implementing smart factories at a fast pace.
3.1.2. Robotics Automation
The major strongpoint for the Korean manufacturing industry is price competitiveness rather than technological competitiveness. This leaves the industry vulnerable to cutthroat competition and changes in the global economic status. Energy/environmental issues, population aging, and structural change in the global trade environment are also factors that negatively affect the Korean manufacturing industry. In a survey conducted by the Korea Institute of Industrial Technology (KITECH), SMEs in Korea responded that technology development, work environment improvement, and production process improvement are important in raising productivity. Therefore, it is clear that SMEs are in desperate need of a solution to these problems.
Other countries facing similar problems, such as the US, Germany, and France, are using robotics automation to overcome such problems. The US announced the Advanced Manufacturing Partnership 2.0 and is developing and funding use of Co-Robot, a collaborating robot that works with human workers. Germany has developed the SME Robotics Work System as part of their “Industrie 4.0” project. France aims to raise competitiveness of its own SMEs by using robots as part of their Robot start PME project and is funding up to 10% of the cost needed for SMEs to implement robots in their production line.
Korea, on the other hand, still lacks robotic automation systems in manufacturing SMEs. SMEs use the automation system due to the rise in demand for major companies that develop smartphones and automotive products. However, only 5% of these SMEs actually use robots in their automation process. The major issues impeding SMEs from using robots are cost-related issues, lack of robots with necessary functions, lack of workers with professional knowledge related to robot operation, and uncertainty of the effects of using robots. Other responses are presented in <Table 7-5>. In order to encourage SMEs to use robotics automation, low-price robots with optimized functions for SME-scale manufacturing should be developed.

Chapter 7 _ Promotion of Smart Production Systems for SMEs: Robotics and Automotive Industry (Korea)�ˍ�309
In response to the problems concerning robotics automation, MOTIE executed a project to test newly developed robots on certain SMEs and verify whether it has market value. This project helped SMEs in various industries. The manufacturing industry took part in the project from 2011 to 2013. The aim of the project was to use robots to improve the overall manufacturing process, thus raising productivity. The 44 SMEs that took part in the project showed an average 20% rise in productivity and a significant drop in defect rate. It also made it easier to establish a manufacturing plan, and increased responsiveness to change in the market, which eventually made it possible for SMEs to implement the small-quantity batch-production systems. After the successful execution of the project, an additional 55 companies purchased 449 robots. The accumulative sales recorded 62.3 million USD.
From 2014 to 2015, a new project was carried out in order to help manufacturing SMEs innovate their weak process using robots. The aim of the project was to strengthen these SMEs while encouraging the supply and diffusion of domestically made robots. The term “weak process” refers to the part of the whole process that takes up a lot of manpower and has high sales but is struggling due to low productivity.
In addition, the Korean government established KIRIA to efficiently and systematically promote various projects for fostering the intelligent robotics industry and developing related policies. Another major duty is to support process innovation in the manufacturing SMEs through utilizing robots. In other words, it supports adoption of robots and robotic engineering knowledge into manufacturing process of SMEs. The KIRIA links manufacturing SMEs and robot suppliers that can supply appropriate robots after identifying the specific robots required by the SME and
(Unit: number, %)
Items Number of Responses Percentage
Cost Related to Using Robots 143 42.6%
Lack of Robot with Operation Method 89 26.5%
Difficult Operation Method 16 4.8%
Lack of Workers with Related Knowledge 28 8.3%
Frequent Breakdown 18 5.4%
Uncertainty of Effects 40 11.9%
Other 2 0.6%
Total 336
�Table 7-5� Issues Impeding SMEs from Using Robotic Automation
Source: KITECH (2016).

310�ˍ�2017/18 Knowledge Sharing Program with Visegrad Group
ascertaining the cost of purchasing and operating those robots. The project started in 2015 and received applicants from various SMEs. Firms within industries where use of robots is a global trend, firms lacking labor force and that are in need of robots to fill their place, and firms with high growth expectancy when robots are used were chosen. After thorough inspection from a group of experts, 11 manufacturing SMEs were selected: nine automotive parts manufacturers, one cosmetics container manufacturer, and one kitchen container manufacturer.
The KIRIA also has a certain procedure of selecting appropriate SME for the supporting project, as the KOSF does. First, the KIRIA recruits demand firms that need production process improvement and robot suppliers and connects them as appropriate. Next, the robot supplier designs an automated process system using robots specialized for the demand firm. Based on the design, the robot supplier installs the robot system and provides knowledge about the operation. Finally, the automated system is fully operated by the demand firm and the robot supplier constantly provides maintenance service.
The 11 SMEs that have received support from KIRIA have received 2.5 million USD in total for the adoption of manufacturing robots from May 2016 to April 2017. The project resulted in almost double the number of items produced compared to before implementing robotics automation. In total, these 11 firms experienced 55% productivity enhancement, 5.65% defect rate reduction, 56.8% cost reduction, and 6.6% improvement in due-date compliance rate. In addition, these firms benefitted from the results that industrial disasters decreased and because the workers, which were exposed to high-risk, have been replaced.
The following are examples of successful robotics adoption in SMEs by the KIRIA:
Yonwoo, a cosmetics container manufacturing company, installed 4 x 6-axis articulated robots together with related smart factory systems. This procedure
Projectparticipation
Demand FirmRobot Supplier
Robot automated
process design
Robot Supplier
Robot systeminstallation
Robot Supplier
Robot operation
Demand Firm
Maintenance
Robot Supplier
[Figure 7-12] Procedure for Supporting Process Innovation in SMEs by Using Robots
Source: KIRIA (2017).

Chapter 7 _ Promotion of Smart Production Systems for SMEs: Robotics and Automotive Industry (Korea)�ˍ�311
improved work environment since workers were able to avoid direct contact with various harmful chemicals used in the manufacturing process. In addition, productivity increased by 58%, while the rate of industrial accidents dropped by 2.8% during the same period.
Sungwoo Metal produces various kitchen containers. The installed three 6-axis articulated robots in the spray painting production line in order to minimize loss of raw material. As a result, they were able to cut costs by 112 thousand USD and increase productivity by 50% at the same time. In addition, lack of manpower due to poor work environment was also resolved using the newly implemented robots.
Apart from the direct participation of KIRIA in installation of robot systems, KIRIA is also implementing projects to develop human resources that have robotics knowledge. A project to foster human resources that are creative and professional in robotics is ongoing with a linkage with industries. The human resources will have capability to plan, develop, and manage new products based on the fusion of robot technology with other technologies. Firms propose research assignments to the educational institute and participate in the development of curriculum. The educational institutes accomplish the research assignments and provide proper education so that the graduates are employed. This project targets master course students, and 838 human resources were fostered; 596 students graduated, of whom 404 of them were employed. Another project is to train current employees so that they can apply robotics in their jobs. Customized training programs are developed for employees who work in robot-related industries and other industries. This project is one of the National Human Resource Development plans. Through the customized program KIRIA is expecting the training program graduates will spread out the knowledge into the firms they originally belong to.
As shown from the examples of the MOTIE and the KIRIA, the implementation of robots in manufacturing SMEs has significant effects. Other than the obvious results of productivity increase and cost reduction, robot developing companies are able to test their new robots and cut related costs. Second, the continuous struggle for SMEs in need of competent workers could be resolved by using robots. In addition, the use of robots could draw the attention of high-quality workers as they could provide a better work environment. During the MOTIE project from 2011 to 2015, a total of 325 workers were employed with an annual average growth rate of 3.7%. In addition, the 1.0% decrease of workers in the production department and increase in those in the office department suggest that the overall quality of labor also increased. Furthermore, a survey conducted after the project ended showed that the robots are continuously used, while SMEs with high operating ratio of these robots showed the largest increase in overall competitiveness.

312�ˍ�2017/18 Knowledge Sharing Program with Visegrad Group
In order to spread the use of smart factory systems in SMEs, the MOTIE developed the “Manufacturing Innovation 3.0” plan. The plan is to build 10,000 smart factories by the end of 2020 by optimizing the production processes using technologies such as software and IoT. However without the use of robots, optimization of the actual production environment is difficult. Therefore, in order for the plan to work efficiently, it should be carried out together with robotics automation implementation. If the plan succeeds, it will have an impressive impact on increasing competitiveness of SMEs.
In addition, the fact that companies with large production size show the greatest improvement when using robots should be considered when choosing which SME to help implement the robotics automation system. After the system is successfully implemented, a follow up investigation should be made to see if the robots are being properly and efficiently used. If there is any problem regarding this matter, a thorough analysis of the causes should be conducted.
�������'LI¿FXOWLHV
Although the smart production system diffusion projects implemented by the KOSF and the KIRIA seems successful, the projects are encountering critics due to few concerns.
First, improving productivity by adopting a smart factory system and robotics is the only aspect that is being emphasized. The Korean government is defining the smart production system as a factory system that targets automation of the production process for improvement in productivity and a factory system that is available to produce customized products. However, the KOSF and KIRIA projects are only concentrating on improving productivity. The outcomes by the support projects are being expressed as increased percentage in productivity. As these projects are only focused on productivity, SMEs are experiencing difficulty in developing their factories to produce customized products.
Second, the projects by KOSF and KIRIA are only focusing on diffusing the smart production systems and increasing the number of factories that have these systems. They are not interested in developing and improving the existing smart factories. According to the number from KOSF, 79% of the smart factories are remaining at the basic level. Only the numbers in the basic level are growing, the numbers of middle level smart factories are stagnant. As the SMEs even struggle in adopting basic level smart factory systems, they cannot even imagine improving their systems further.
Lastly, the Korean suppliers of smart production systems are lacking in competitiveness. The competitiveness of Korean smart factory technology was

Chapter 7 _ Promotion of Smart Production Systems for SMEs: Robotics and Automotive Industry (Korea)�ˍ�313
evaluated as 83.4 when USA was considered as 100 in 2017. In addition, most of the suppliers in Korea are not competitive enough to install total packages of smart manufacturing systems. Due to these reasons, to adopt a smart manufacturing system, assistance from other firms or institutes are essential. For development of advanced smart production systems and further diffusion thereof, the government should support the development of suppliers.
3.2. Robotics Industry
The robotics industry in Korea has been developed since the late 1900s which is quite late compared to other leading countries in robotics. The importance of the robotics industry and robotics has been emphasized with the growth of the automotive industry. As the importance of robotics grows, the Korean government is establishing policies related to the robotics industry from the early 2000s. These policies helped the rapid growth of the Korean robotics industry market and at the same time reduced the technological gap with other countries. Currently, robots are applied to the manufacturing industry in the early stage, which is gradually expanding to even cover service industries such as post offices and hospitals.
The year 1978 could be considered as the starting point of the Korean robotics industry. From 1978 to 1996, basis for the industrial robot market was arranged. Robots are activated in automotive and semiconductor industry, and support projects about core technology related to robots have been launched. After this period, the robot paradigm has shifted to utilization of intelligent robots from traditional simple robots. This has occurred based on development of IT technology. Personal robot technology development also became active in this time.
From 2002, the government ministries proposed support policies for the robotics industry. The government designated the robot technology as the next growth engine of economy and established robotics industry visions and developmental strategies. From 2008 to 2015, the Korean government established special laws for the robotics industry to construct a basis for the development of industrial robots. The development was accelerated with the implementation of 1st and 2nd basic plans for robotics research. The 1st basic plan for robotics research was carried out from 2009 to 2013. The objective of the plan was to create systematic infrastructure, product development, and distribution of these products. The 2nd basic plan, from 2014 to 2018, aims at further improvement of robotics technology and the convergence of robots into other manufacturing and service industries.
In 2010, the KIRIA was established as part of the robotics industry fostering policy. In addition, in 2012 the Pohang Institute of Intelligent Robotics, which was a local institute, changed its name to the Korea Institute of Robot and Convergence (KIRO), taking on a higher authority.

314�ˍ�2017/18 Knowledge Sharing Program with Visegrad Group
The highest authority related to establishing policies related to fostering the robotics industry is done at the ”Robotics Industry Policy Conference.” The conference, consisting of 14 mandarins from related government departments, decides the overall direction of the policies related to the robotics industry. Since the first conference in 2012, they have gathered a total of five times. The specific projects adopted at the conference are then carried out by the MOTIE.
Diffusion of robots in the industrial division was reinforced by a specific diffusion master plan. In 2017, robots were expanding from manufacturing industry to service industries. Robots are being applied in hospital services, and the government demonstrated service robots in the PyeongChang Olympic Winter Games in 2018. Future plans expect the robots to be utilized in national institutions for service purposes and also be utilized in power generation facilities and in large-scale warehouses.
The robotics industry was steadily expanding with advanced ICT technology and AI technology, and with the introduction of the fourth industrial revolution, the growth rate has been boosted. The domestic robot production scale increased by 19.2% from 2013 to 2014. The industrial robotics industry recorded 1,967.2 million USD, which is a 16% increase year on year. The robot parts manufacturing industry also recorded a 53.3% growth year on year.
(Unit: billion KRW)
25,000
20,000
15,000
10,000
5,000
02011 2012 2013
Industrial
Service
Parts
20142010
[Figure 7-13] Production Status of the Korean Robotics Industry
Source: Korea Association of Robot Industry (2015).

Chapter 7 _ Promotion of Smart Production Systems for SMEs: Robotics and Automotive Industry (Korea)�ˍ�315
According to <Table 7-6>, the number of robots for manufacturing industry produced in Korea will have become about 1.6 times that in 2013 by 2017 compared to numbers in 2013. This is the second largest percent increase after China. The production number in China is explosively increasing under the “China Manufacturing 2025” strategy. However, the number of robots in the manufacturing industry is increasing in every country with the expectation that robots will bring improved productivity and chance of production of high-added-value products.
Regarding the domestic robot market of Korea, the service robot market is stagnated but the industrial robot market continues growing. The market sales have risen from 1,585 million USD to 1,864 million USD during just a year from 2013. 56.4% of the industrial robot manufacturing companies in Korea are related to the automotive industry, and 26.8% to the electronics industry. The composition of the industrial robot market is shown in [Figure 7-14].
(Unit: number)
Country 2013 2014 2015 (E) 2016 (E) 2017 (E)
Korea 21,307 24,271 29,000 32,000 35,000
Japan 25,110 29,797 33,000 35,000 38,000
China 36,560 57,096 75,000 95,000 120,000
Taiwan 5,457 6,912 8,500 7,500 9,000
North America 28,668 31,029 35,000 36,000 38,000
Germany 18,297 20,051 21,000 21,000 22,000
�Table 7-6� Number of Robots Produced for Manufacturing Industry by Country
Note: (E) Estimated.Source: World Robotics (2015).
Automotive
Electronics
Material
Mechanical
Other
3.70%4.30%
56.40%26.80%
8.80%
[Figure 7-14] Composition of the Korean Industrial Robot Market
Source: Korea Association of Robot Industry (2015).

316�ˍ�2017/18 Knowledge Sharing Program with Visegrad Group
In 2014, there were 499 robot manufacturers in Korea, among which 466 were small-sized enterprises and 20 were mid-sized enterprises. Only 13 firms were major firms. This is the reason why the Korean government should concentrate on SME fostering to gain competitiveness in robotics.
Industrial robots are especially important in Korea due to the large market size. Before the IMF economic crisis in 1997, many firms produced industrial robots based on in-house experience. However, after the IMF economic crisis, most major firms shut down their industrial robot development departments. Recently, thanks to the funding of the government, many SMEs are participating in producing various industrial robots, and specific results of these projects are expected to come out in the near future.
Considering the lack of original technology and crucial components for building widely used industrial robots, Korea decided to use the niche market strategy. By producing industrial robots for special use, a stronger bond between supplier and customer will be created. For example, the IT industry is in need of robots with the ability to accurately assemble various parts at fast speed. The marine ship building industry needs robots that can replace human workforce due to the aging population. For example, robots specialized at cleaning ships and robots with the ability to work underwater need to be developed. This will help the Korean industrial robotics industry avoid direct competition with the global market.
The research for developing such specialized industrial robots is led by national research institutes such as the Korea Institute of Machinery and Materials (KIMM) and KITECH. These institutes host industry, university, and institute collaborated consortiums where they discuss and develop basic and core technologies. The fostering of a professional workforce is mostly done by universities.
The government is also enforcing policies related to cutting-edge industrial robot development, which is considered to be the next-generation growth engine. At the same time, they are establishing local robot developing centers that will focus on creating related infrastructure in the area and training a professional workforce.
In order to efficiently foster the industrial robotics industry, a thorough analysis of the industry is needed. Therefore, a SWOT analysis was conducted.
The strength of the Korean industrial robotics industry is the high industrial robot density. Recent research ranked Korea 3rd globally in density of industrial robots. This means that there is a strong domestic market base and, therefore, a constant market demand. In addition, the automotive, shipbuilding, and IT industries, where most industrial robots are used, are very active and working as growth engines

Chapter 7 _ Promotion of Smart Production Systems for SMEs: Robotics and Automotive Industry (Korea)�ˍ�317
with a global-scale competitiveness. The high-level IT infrastructure and cutting edge production technology is also a strongpoint for the Korean industrial robotics industry. Finally, a cooperative relation between supplier and customer will help the continuous growth of the industry.
The major weakness of the Korean industrial robotics industry is the insufficient amount of core components and materials needed for building such robots. Importing theses major parts leaves Korea vulnerable to changes in the global market and raised production cost. Another weakness of the industry is the lack of original technologies. This causes insufficient design technology, meaning that it becomes difficult to design various types of robots. Korea is also deprived of infrastructure such as professional workforce and facilities.
The opportunity for the Korean industrial robotics industry to continue growing comes from the fact that almost 80% of the profit comes from the domestic market. In 2014, the proportions of sales made in the domestic market and foreign market were 70.2%:29.8%. A reliable source of profit leads to steady funding and enriches the entire industry. The aging population and insufficient number of employees working in the manufacturing industry also works as an opportunity for the robotics industry. Robots could successfully replace human workers and at the same time attract more intelligent, high-quality workers due to the new and safer work environment. Recent trends like production line automation and smart factory system adoption are also great opportunities for developing the robotics industry. Finally, government policies such as niche market targeting and localized strategies based on the specific market are also expected to help the robotics industry.
The largest threat regarding the Korean industrial robotics industry is the unstable global market due to low growth rate. In addition, most original technologies from foreign firms are not obtainable since they are classified information. Monopoly of the core materials needed by a few developed countries is also a threat to the Korean industry. Lastly, the limit in technological development due to the insufficient number of skilled technicians in Korea is a major threat to the industry. The SWOT analysis of the Korean industrial robotics industry is presented in [Figure 7-15].

318�ˍ�2017/18 Knowledge Sharing Program with Visegrad Group
3.3. Automotive Industry
The automotive industry takes a large portion of the total Korean manufacturing industry, accounting for 6.5% of the total manufacturing. It also has 8.5% of the total number of employees and accounts for 4.7% of the total amount of exports. Other than the 7 car assembly firms, 858 primary vendors exist in the automotive industry. While 26 of them are major firms, 216 are mid-sized firms and 616 are SMEs. The sales of the tier 1 supplier industry in 2014 were about 77 billion USD, which is about a 2.5% increase compared to 2013. The sales were consisted mainly of OEM to assembly firms, while export and repair sales also played a role.
However due to the recent stagnant sales growth of major assembly firms such as Hyundai and Kia, the automotive parts industry is experiencing a decrease in sales. This is mostly due to the high dependency of domestic suppliers on major automotive assembly firms. Therefore, in order to overcome this crisis, some automotive parts suppliers are signing contracts for technology transfer with major foreign automotive parts supplying companies. Also, increasing amount of export and establishing foreign branches is becoming a trend. Finally, efforts to raise product quality to increase competitiveness, such as smart factory adoption or automaton, are becoming a must for the automotive parts industry.
Strength Weakness
s 3rd in global industrial robot densitys Stable and active growth engine industies
such as IT, automotives Cuttingedge manufacturing technologys Cooperative relation between supplier and
customer
s Imports most core materialss Lack of original technologys Not enough infrastructure
Opportunity Threat
s 80% of profit based on domestic markets Increase in demand due to aging populations Firms adopting automation is increasings Various government policies
s Unstable global markets Difficulty in obtaining original technologys Monopoly of core materials by developed
countriess Insufficient number of skilled professionals
[Figure 7-15] SWOT Analysis of the Korean Industrial Robotics Industry
Source: Korea Institute for Industrial Economics and Trade (2007).

Chapter 7 _ Promotion of Smart Production Systems for SMEs: Robotics and Automotive Industry (Korea)�ˍ�319
In other words, the automotive industry has a high status in the Korean manufacturing industry, and the automotive parts industry, which is a major portion of the automotive industry, is mainly consisted of SMEs. However, due to the recent recession of the domestic automotive industry, innovation in various aspects is needed for the automotive parts industry. The status of the Korean automotive parts industry is presented in <Table 7-7>.
3.3.1. Smart Factory
Although the adoption rate of the smart factory system in the Korean manufacturing industry remains low, the automotive industry has the highest adoption rate, recording 9.8% compared to the remaining industries’ 1.5% average. As mentioned above, the recent crisis in the automotive industry acted as a major stimulant for automotive firms to implement the smart factory system. The managers are well aware of the importance of the system, and SMEs who implemented the system show improvement in management results. 14.7% of automotive firms consider smart factory system adaptation as the number one priority in innovation. Another 46.8% consider it to be at least in the top three tasks. This percentage is just below that of the electronics industry. This implies that although the automotive industry has the highest smart factory system adoption rate, many firms are still in need of the system in order to innovate their production process and increase competitiveness.
Volume of Production Value-added Number of
EmployeesNumber of Companies
Volume of Export
Auto Part Industry
97 trillion KRW
29 trillion KRW 247,000 4,340 26.6 billion
USD
Manufacturing Industry
1,489 trillion KRW
285 trillion KRW 2,905,000 68,640 572.8 billion
USD
Portion 6.50% 5.90% 8.50% 6.30% 4.70%
�Table 7-7� Status of Korean Domestic Automotive Parts Industry
Source: Statistics Korea (2014).
(Unit: %)
Automotive Electronics Machines Chemicals Textile Metals Overall
Diffusion Rate 9.80 1.90 1.40 1.30 1.00 1.20 1.50
�Table 7-8� Smart Factory Diffusion Rate in Each Manufacturing Industry
Source: MOTIE (2017).

320�ˍ�2017/18 Knowledge Sharing Program with Visegrad Group
In response to these situations, the KOSF carried out projects to support SMEs in the automotive industry to adopt the smart factory system. The project focused mainly on production process innovation, discovering new businesses with high potential, developing and expansion of export routes, and creating new jobs.
The project resulted in great success. Through production process innovation, SMEs were able to improve productivity, increase product quality, and cut production costs due to a shorter production time. For example, an automotive air conditioner part production firm implemented a new MES system. This decreased the defect rate by 39%, raised availability by 2%, and recorded a 28.6% increase in sales. Discovering new businesses with high potential resulted in a wider business field through production line automation and ICT collaboration. Expansion of export routes was made possible by improving work environment and improved production rate. Finally, the increased export amount led to increased employment.
The following companies are examples of smart factory construction completed with KOSF support:
DaeKwang is a company that produces casting material for automobile parts. It has established a flexible production system by adopting MES. Systematic data management and real-time monitoring became possible through the system and resulted as reduction of prototype production time, 79% reduction of defect rate, and expansion of product variety.
Daesung ING produces automotive power transmission devices. Through the smart factory system, it was available to acquire reliable data and analyze it. This allowed the firm to improve productivity and achieve innovation in the process management process. Consequently, the defect rate decreased by 39% and the power consumption was reduced by 5%.
Jeonwoo produces various automotive parts such as airbags, door hinges, and motor cases. Adopting the smart factory system improved facility efficiency by 11%
(Unit: %)
Electronics Automotive Machines Chemicals Precision Instrument
Food & Beverage Metals
1st Rank 24.80 14.70 2.80 9.20 9.20 11.00 5.50
1st+2nd+3rd Rank 58.70 46.80 29.40 26.60 26.60 19.30 11.90
�Table 7-9� Industries that Consider Smart Factory as a Priority Task
Source: KISTEP (2017).

Chapter 7 _ Promotion of Smart Production Systems for SMEs: Robotics and Automotive Industry (Korea)�ˍ�321
and achieved a 75% decrease in time needed to prepare raw material. This resulted in the firm saving 4.21 million USD originally needed for production. In addition, they were able to increase production quantity, making it possible to handle additional orders and resulting in sales increase of 2.5 million USD. The firm also participated in the employment program conducted with the collaboration of Gyeongbuk Center for Creative Economy and Innovation (CCEI) and Gumi University. The program resulted in employment of 12 new workers.
Lastly, ITOPS Automotive manufactures active hood lift systems and related sensors for the automobile industry. With the introduction of ERP, they could control all logistics flow from receipt to delivery. After adopting the system, the company experienced a 50% decrease in time needed to prepare production, 60% decrease in defect rate, and 200% increase in sales due to improved brand awareness. Consequently, the evaluation of parts manufactured from ITOPS upgraded from B to A.
Overall, the 1,861 firms that have finished adopting the smart factory system have shown a 23% improvement in productivity, 46% reduction in the defect rate, 16% cost decrease, and 35% shortened delivery time. These manufacturing process improvements resulted in a 5.3% increase in sales (compared to a 3.0% decrease regarding the whole manufacturing industry) and 6.0% increase in the number of employees (compared to a 3.0% increase in the whole manufacturing industry).
3.3.2. Robotics Automation
A large portion of the industrial robots worldwide are used in the automotive industry, and the same situation is true in Korea. A total of 34% of robot manufacturers have a relation to the automotive industry, meaning that they supply their robots to firms in the automotive industry. Additionally, many SMEs are beginning to adopt robot-automated systems in their production line to show improvements in the manufacturing process.
Although Korea does not have the highest actual number of industrial robots used, Korea shows the highest robot density in the manufacturing industry. The average global robot density is approximately 74 industrial robots per 10,000 employees. Korea recorded about 631 robots per 10,000 employees in 2016. The number has almost doubled since 2010 (311 units per 10,000 employees). This is much higher than in Singapore, which is ranked second in industrial robot density. Korea shows more impressive records when considering only the automotive industry. In 2016, the Ministry of Employment and Industry announced that the number of industrial robots in operation in the automotive industry was 2,145 per 10,000 employees. This may be due to the numerous projects related to manufacturing

322�ˍ�2017/18 Knowledge Sharing Program with Visegrad Group
batteries for hybrid and electric cars. The following graphs show the status of industrial robot use both globally and in Korea.
However, most of the robots used in the automotive industry are focused on a few major firms. On the other hand, SMEs still show a low robotics automation adoption rate. Therefore, government departments and institutes are helping SMEs in the automotive industry implement the robotics automation system in their production line.
In accordance with the Korean government’s “Manufacturing Industry Innovation 3.0” plan, which emphasizes the importance of developing leading collaboration technology, MOTIE collaborated with KIRIA, KIMM, and KITECH in executing projects to install robotics automation systems in SMEs in various industries, including the automotive industry. They focused on using robots in processes such as cutting, polishing, welding, packaging, and other processes with an insufficient labor force or a harmful work environment. The goal of the project was to improve overall product quality, productivity, workforce efficiency, and the work environment.
The following are examples of robot system adoption:
Geowon Industry Co. manufactures floor carpets, dashboards, and other parts used for car interiors. Before the implementation of robotics, the trimming process was performed by human workers. This caused unstable product quality due to human error and high labor costs. By implementing the robotic automation system, such as 6-axis articulated robots, in this process, the processing time for each product shortened from 200 seconds to just 90 seconds. Furthermore, the number of human employees needed decreased from 12 to 2. This allowed the efficient reallocation of the workforce.
Automotive34%
Automotive38%
Automotive39%
Electronics25%
Electronics49%
Metals12%
Display10%Semiconductor
18%
Shipbuilding 5%
Food &Beverage
3%
Etc 3%Metals 4%
Chemicals5%
Consumer electronics
5%
Etc.28%
Etc.14%
Chemicals 8%
[Figure 7-16] Use Status of Industrial Robots Globally and in Korea
Sources: World Robotics (2016), KIRIA (2011).

Chapter 7 _ Promotion of Smart Production Systems for SMEs: Robotics and Automotive Industry (Korea)�ˍ�323
Yoowon, a firm that produces automobile parts and other components used in electronic devices and construction, applied robots to the production system to automate the press process. They installed 42 6-axis articulated robots and 42 vacuum grippers. The company experienced a 94% increase in productivity, 0.1% decrease in the defect rate, 85% reduction in cost, and 4% increase in on-time delivery.
Hwasin Co. automated multiple processes in producing automobile parts. Six 7-axis articulated robots and six articulated autonomous navigation units were installed in the factory. Productivity increased by 36.8%, the defect rate decreased by 0.16%, the cost reduced by 42.6%, and on-time delivery increased by 6%.
Youdong Metal produces automobile parts and automated projection welding. The robot supplier installed two 6-axis articulated robots, two vacuum units, two grippers, and two conveyers. The productivity and on-time delivery rate improved by 43% and 10%, and the defect rate and cost decreased by 0.53% and 30%, respectively.
Obara Korea is a tier-2 supplier in the automotive industry that manufactures spot welding guns. The original process when producing welding guns is time-consuming due to the repeated cooling, grinding, and analysis of raw material. In addition, the process must be conducted at high temperatures of over 100 degrees Celsius with exposure to chemical and dust particles. After installing a 6-axis articulated robot that could transport up to 5 kilograms and two specialized controllers, the installation resulted in an increased process time (44 seconds) and a safer, optimized work environment.
After the success of a few SMEs, MOTIE and other institutions promised continuous support and funding. This will help the further diffusion of robotics automation systems in SMEs in the automotive and various other manufacturing industries.
4. Conclusions and Policy Implications
4.1. Implications
Although the Slovak government is implementing the RIS3 strategy in the manufacturing industry to gain competitiveness, the results seem insufficient. In the meantime, the AMP in USA, “Industrie 4.0” in Germany, and “Manufacturing Innovation 3.0” in Korea are showing progress in the diffusion of smart production systems. The partner nation, Korea, is dividing the strategy into two tracks, smart factories and robotics automation, to implement it effectively.

324�ˍ�2017/18 Knowledge Sharing Program with Visegrad Group
First, according to the research of Interreg Europe, the awareness of SMEs regarding the RIS3 strategy is too low. As the noticeable problem in implementing the smart production system is the costs related to installation, the help of the government is essential. Although the RIS3 strategy possesses funds for SME foster aid, if the SMEs are not aware of it, the strategy becomes useless. As the SMEs in Slovakia are interested in smart manufacturing solutions and systems, if the government supports these SMEs, the smart production system will diffuse rapidly enough in the industry. Therefore, the priority task of the government will be promoting the existence of the RIS3 strategy so that SMEs can cooperate.
Second, although the RIS3 strategy is ongoing, related government organizations do not exist. In the case of Korea, KOSF and KIRIA are leading the implementation of smart production systems. KOSF is concentrating on the diffusion of smart factory systems and KIRIA is supporting firms to adopt robots to automate their production systems. Both of the organizations have their own procedure of installation support, and various firms are participating in the progress. As mentioned in the research, all of the firms that had support from KOSF or KIRIA are showing improvements in productivity, sales, and all kinds of indexes related to management. The establishment of these kinds of organizations will lead to the successful diffusion of smart production systems.
Even though the RIS3 strategy is succeeding, the other problem is that most of the successful firms that exist in Slovakia are originally from other countries. The auto assembly plants (Volkswagen Slovakia, PSA Group, KIA Motor, and Jaguar Land Rover) are foreign cooperates, and among the top 40 auto parts firms, 38 originate from foreign nations. For the qualitative growth of the economy of Slovakia, more domestic firms have to gain competitiveness. As smart productions systems can result in unemployment, the advantage of attracting foreign firms to invest might be halved. The implementation of smart production systems in domestic firms will be the most effective path to grow the economy in a healthy way.
Fourth, domestic applied science R&D centers are lacking. Like the automotive industry, most R&D centers originated from foreign countries. The successful R&D case in the robotics sector, KUKA Systems, is a foreign firm, too. This might appear as providing inexpensive quality human resources to foreign companies for their R&D. Promoting Slovak R&D centers to achieve better R&D results must be the best practice for the successful implementation of the RIS3 strategy.
Lastly, the RIS3 strategy should be specified into several streams for efficient implementation. Korea has divided the smart production system into the smart factory aspect and the robotics automation sector. Smart factories and robotics automation might be similar, but there is definitely a difference. Smart factories

Chapter 7 _ Promotion of Smart Production Systems for SMEs: Robotics and Automotive Industry (Korea)�ˍ�325
involve solutions and software, such as ERP, MES, and SCM, which help the management of the production process. This can replace the role of the manager or offer assistance in the decision-making process. On the other hand, robotics automation involves automating the production process, as the term suggests. Applying industrial robots to the production line to replace the human workforce in certain processes or in the whole process is the purpose of this. Hardware machines will be installed in the plant to accomplish particular tasks. Through dividing the smart production system into two distinctive sectors, Korea is implementing their strategy efficiently. The Slovak government will have to decide how to divide the progress of smart production system diffusion for efficiency.
4.2. Follow-up Plans
The first-year research has provided implications in a broad perspective to the Slovak manufacturing industry. The cases of Korea, the USA, and Germany were analyzed to provide proper information to the Slovak government and for the progress of the RIS3 strategy.
This year’s research provides implications concentrating on four main points. The importance of the smart production system is described with the focus on manufacturing SMEs. Among various specific manufacturing industries, the robotics industry, which is vital for the development of the smart production system, and the automotive industry, which is vital for the Slovak economy, are the main part of the research.
Future research will be successful if it handles the implementation of the smart production system in the firm scale. Comparing a firm in Korea that had a similar situation to a Slovak firm before introducing a smart production system will provide practical implications and present the importance of smart production systems clearly.

326�ˍ�2017/18 Knowledge Sharing Program with Visegrad Group
References
ACEA (European Automobile Manufacturers' Association) (2016), The Automobile Industry Pocket Guide.
Apps Run the World (2015), “Top 100 ERP Software Vendors,” accessed February 2, 2018, https://www.appsruntheworld.com/top-100-erp-vendors-in-2012/
AutoNet, “Notes on the Automotive industry in Central Europe: Slovakia, Slovenia, Italy, Czech Republic, Poland, Germany, Hungary,” accessed January 22, 2018, http://www.central2013.eu/fileadmin/user_upload/Downloads/outputlib/Autonet_Framework_Policy_Document.pdf
Bitkom, VDMA, AVEI (2016), “Implementation Strategy Industrie 4.0: Report on the Results of the Industrie 4.0 Platform.
Business Monitor International (BMI) (2015), “Slovakia Infrastructure Report 2016”.
Business Monitor International (BMI) (2016), “Slovakia Autos Report Q2 2016”.
Business Sweden (2016), “Automotive Sector in Slovakia”
Eurostat, “Balance of payments by country-quarterly data (BPM6),” accessed January 22, 2018, http://appsso.eurostat.ec.europa.eu/nui/show.do?dataset=bop_c6_q&lang=en
Eurostat, “Business enterprise R&D expenditure (BERD) by economic activity (NACE Rev. 2) (rd_e_berdindr2),” accessed January 27, http://ec.europa.eu/eurostat/web/science-technology-innovation/data/database
Eurostat, “GDP and main components,” accessed January 12, 2018, http://appsso.eurostat.ec.europa.eu/nui/show.do?dataset= nama_10_gdp&lang=en
Eurostat, “GDP per capita in PPS,” accessed January 4, 2018, http://ec.europa.eu/eurostat/tgm/table.do?tab=table&init=1&language=en&pcode=tec00114&plugin=1
Germany BMBF (Federal Ministry of Education and Research) (2014), “The new High-Tech Strategy Innovations for Germany”.
IFR (International Federation of Robotics) (2017), “IFR World Robotics 2017”.
IFR (International Federation of Robotics), Robot density rises globally – International Federation of Robotics, accessed February 10, 2018, https://ifr.org/img/uploads/2018-FEB-07-IFR-Press_Release_Robot_density_EN.pdf
IPDAP (2017), “Evaluation of the Development of the Slovak Automotive Industry in 2016/2017”.
Joo, Hyun, Doo Yong Kang, Dong Hyuk Seo, Young Seok Oh, Yoon Hee Choi (2015), “Megatrends and Policy Tasks in Manufacturing Industry”, KIET(Korea Institute for Industrial Economics & Trade).

Chapter 7 _ Promotion of Smart Production Systems for SMEs: Robotics and Automotive Industry (Korea)�ˍ�327
Kia Motors Slovakia, s.r.o. “Company at a Glance,” accessed January 15, 2018, http://eng.kia.sk
KIAT (Korea Institute for Advancement of Technology) (2015), “Smart Manufacturing R&D Mid-long Term Roadmap”.
Kim, Chulyoung (2015), “Robotics industry – Rise of Robotics” Hyundai Securities
Kim, JaeHong (2015), “Manufacturing Promotion Policies and Implications of Major Countries”, KOTRA(Korea Trade-Investment Promotion Agency)
Korea Ministerial Meeting on Economics (2015a), “Efficiency improvement project of government start-up support business: integrated brand ‘k-startup’ launch”.
Korea Ministerial Meeting on Economics (2015b), “First (2015~2019) Middle Standing Business Promotion Basic Plan”.
Korea MOTIE (Ministry of Trade, Industry and Energy) (2015), “Ministry of Industry Restructures Human Resource Development Framework to Execute ‘Manufacturing Innovation 3.0’”.
KPMG (2016a), “Investment in Slovakia”.
KPMG (2016b), “Startup Ecosystem Survey: Slovakia”.
KPMG in Slovakia (2016c), “Investment in Slovakia”.
Lee, Cheol Won, Hyun Jean Lee, You Jin Lim (2016), “Slovakia’s major industries and promotion plans for industrial cooperation between Slovakia and Korea”, KIEP (Korea Institute for International Economic Policy).
Ministry of Finance (2016), “National Reform Programme of the Slovak Republic 2016,” Ministry of Finance of the Slovak Republic.
Niku, Saeed B. (2001), “Introduction to Robotics: Analysis, Systems, Applications,” Prentice Hall
PWC (2014), “The new hire: How a new generation of robots is transforming manufacturing”.
PWC Slovakia (2016), “Automotive Suppliers Survey Slovakia, 2016”
PWC Slovakia (2016), “Automotive Suppliers Survey: Slovakia, 2016”.
PWC, “Investing in Slovakia,” accessed January 3, 2018, http://www.pwc.com/sk/en/investicie.html
Sander, Alsion and Meldon Wolfgang (2014), “The Rise of Robotics,” The Boston Consulting Group, accessed January 17, 2018, https://www.bcgperspectives.com/content/articles/business_unit_strategy_innovation_rise_of_robotics/

328�ˍ�2017/18 Knowledge Sharing Program with Visegrad Group
SARIO (2014) “Automotive Industry,” accessed January 16, 2018, http://ukrexport.gov.ua/i/imgsupload/file/Slovautomotive_industry.pdf.
SARIO (2016a), “Automotive Industry,” accessed January 3, 2018, http://www.sario.sk/sites/default/files/content/files/automotive_industry_0.pdf.
SARIO (2016b), “Automotive Sector in Slovakia,” accessed January 3, 2018, http://www.sario.sk/sites/default/files/content/files/sario-automotive-sector-inslovakia-2016-web.pdf.
SARIO (2017), “Automotive Sector in Slovakia”.
Smart Factory Hub (2017), “Critical Factor SME Diagnosis Report for Slovakia,” Danube Transnational Programme.
The Slovak Spectator, “Slovakia stays strong in automotive,” 28 December 2015.
UK-RAS (2016), “Manufacturing Robotics: The next robotics industrial revolution”.
United Nations (2017), “Trade and Development Report 2017,” United Nations Conference on Trade and Development.
US Executive Office of the President National Science and Technology Council Advanced Manufacturing National Program Office (2016), “National Network for Manufacturing Innovation Program: Strategic Plan”.

Chapter 82017/18 Knowledge Sharing Program with Visegrad Group: Innovation Policy for SMEs in the Era of Industry 4.0
Promotion of Smart Production Systems for SMEs: Robotics and Automotive Industry (Slovakia)
���*OUSPEVDUJPO
���&%1�BOE�3FTVMUT�XJUI�*NQBDU�PO�1SPNPUJPO�PG�4NBSU�1SPEVDUJPO�4ZTUFNT�
���$PODMVTJPOT�BOE�1PMJDZ�*NQMJDBUJPOT

330�ˍ�2017/18 Knowledge Sharing Program with Visegrad Group
SummaryTechnology has changed the way we live and it is rapidly changing the way
we work. Europe is the global leader in many sectors that supply high-value jobs today, including the automotive, aeronautics, engineering, chemical, and pharmaceutical industries. European companies also play a leading role in markets for future technologies, which include advanced manufacturing, nanotechnology, biotechnology, micro- and macro-electronics, photonics, and advanced materials. However, rapid advances in technology and the need to foster a sustainable, circular, and low-carbon economy provide challenges as well as opportunities.
Tomorrow’s factories will use highly energy- and material-efficient processes, employ renewable and recycled materials, and adopt increasingly sustainable business models. Such business models bring together different components of the value chain, including customers, to optimize the use of materials and convert waste, heat, or other byproducts into useful energy.
To be innovative, competitive, and in a strong position to tackle society's challenges, Slovak industry needs the right framework conditions.
To clarify the current view, needs, and expectations of Slovak entrepreneurs, a profound Entrepreneurial Discovery Process (EDP) has been run, and we have asked the Slovak enterprises how they perceive the impact of some of the megatrends
Promotion of Smart Production Systems for SMEs: Robotics and Automotive Industry (Slovakia)
Artur Bobovnicky (Slovak Innovation and Energy Agency, Slovak Republic)
乇#Chapter 08

Chapter 8 _ Promotion of Smart Production Systems for SMEs: Robotics and Automotive Industry (Slovakia)�ˍ�331
(we have selected trends Changing Demographics, Globalization & Future Markets, The Challenge of Climate Change, Dynamic Technology & Innovations, and Global Knowledge Society) on their businesses.
In the EDP process, key development trends have also been identified in each domain platform that will influence the development of individual industrial segments for the next five years or more. In accordance with these, specific areas (in the form of the so-called product lines) have been identified to be supported either from state budget sources or from Operating Program Development & Innovations (financed from the European Structural and Investment Fund-ESIF).
The key development trends for Industry 4.0 have been identified mainly in the following domains: automotive, industry, and information and communication technology (ICT). However, some trends could also be spotted in the domains of agriculture and healthcare.
The competitiveness of industry in Europe is increasingly dependent on the knowledge, skills, and creativity of its workforce and citizens. A large and diverse talent pool with appropriate skills is needed to avoid negative impacts on innovation, growth, and employment. People will increasingly need to work across a variety of complex subject areas with ease and confidence.
The automotive industry, the key industry for Slovakia, is experiencing a growing need for suitable workers, with approximately 100,000 additional jobs needing to be filled annually across Europe for at least the next eight years (as stated, in Slovakia alone, 12,000 positions have been vacant since 2017). This is mainly due to an ageing workforce and the forecasted growth of production in the sector. In addition, it is expected that a significant number of assembly-line jobs will disappear, partly due to the introduction of new production technologies and “clean” vehicles.
In Slovakia, we are reflecting these changes with a more focused approach toward research and development (R&D) support from public sources as shown above. In both research and practice, we find that transformations stand the best chance of success when they focus on four key actions to change mindsets and behaviors: fostering understanding and conviction, reinforcing changes through formal mechanisms, developing talent and skills, and role modeling, collectively labeled the “influence model.” We provide some examples of the measures within these four areas in Slovakia.

332�ˍ�2017/18 Knowledge Sharing Program with Visegrad Group
1. Introduction Slovakia recognizes that we are living through a new industrial revolution. This
revolution is a technological one, breaking down the barriers between supply chains as well as customers and businesses. Technology has changed the way we live and it is rapidly changing the way we work. Europe is the global leader in many sectors that supply high-value jobs today, including the automotive, aeronautics, engineering, chemical, and pharmaceutical industries. European companies also play a leading role in markets for future technologies, which include advanced manufacturing, nanotechnology, biotechnology, micro- and macro-electronics, photonics, and advanced materials. However, rapid advances in technology and the need to foster a sustainable, circular, and low-carbon economy provide challenges as well as opportunities.
Europe must continually innovate to remain competitive in a global marketplace. In some sectors, traditional jobs are being replaced with new forms of work or are being automated. This is especially true for Slovakia, which has become a car production hub of Europe. Automotive production represents over 30% of overall industry production in Slovakia. In Tier 1-Tier 3, there are over 80,000 jobs, and there are an additional 20,000 jobs directly at the car producers. Indirect suppliers for the automotive industry are reporting 11,000 jobs. Altogether, this translates to 111,000 jobs in the automotive sector.
The automation of factories created by these changes in work and technology has led to new high-added-value jobs. The overall net effect on jobs in the EU is likely to be positive provided that significant reskilling, upskilling, and optimal allocation take place.
(Unit: number)
VW, Kia, PSA
Tier 1
Tier 2
Tier3
Other
20,300
46,890
21,873
10,862
11,307
[Figure 8-1] Employment Structure of Automotive Industry in Slovakia
Source: http://www.ipdapgroup.com/sk/2017/11/08/vyvoj-automobilovy-priemysel-sr-2016/.

Chapter 8 _ Promotion of Smart Production Systems for SMEs: Robotics and Automotive Industry (Slovakia)�ˍ�333
New technologies also generate new markets. This is especially true of the integrated development of digital technology and advanced manufacturing. These trends define our current industrial revolution.
Tomorrow’s factories will use highly energy- and material-efficient processes, employ renewable and recycled materials, and adopt increasingly sustainable business models. Such business models bring together different components of the value chain, including customers, to optimize the use of materials and convert waste, heat, or other byproducts into useful energy.
The internet has already changed our everyday lives and is now changing the ways industries produce and people consume. The customer is deeply involved in supply chains, products are being customized, and industries provide platforms to comprehensively integrate digital technologies into their working methods. Ultimately, companies will have relationships with their end customers who drive demand. Value chains are increasingly global, bringing significant opportunities to companies of all sizes.
These opportunities demand that a business is ready to integrate into chains with international partners. For companies, especially small ones, digital technology is the key to opening this door.
In this new interconnected, digital world, consumers and business customers increasingly demand a complete package of products and services. The distinction between product and service markets is a thing of the past. Value creation and innovation increasingly take place together. Business-related services are often decisive in making products attractive to the consumer and they generate most of the added value in growth and employment.
To be innovative, competitive, and in a strong position to tackle society’s challenges, Slovak industry needs the right framework conditions. Key stakeholders across Europe have emphasized this and the current European Commission has adopted initiatives that are highly relevant for European industry’s current challenges.
A limited number of substantial policy initiatives that stimulate change in areas where Europe can make a real difference are presented herein:
The first pillar in the Investment Plan is the European Fund for Strategic Investments (EFSI), which has been in place since July 2015. As of the end of January 2017, 420 transactions supported by the EFSI had been approved by the European Investment Bank Group for a total investment value of EUR 168.8 billion (54% of

334�ˍ�2017/18 Knowledge Sharing Program with Visegrad Group
the overall objective of 315 billion EUR by mid-2018). These transactions cover all 28 Member States and are expected to benefit over 388,000 small and medium-sized enterprises (SMEs) and mid-caps.
The second pillar of the Investment Plan comprises the European Investment Advisory Hub (EIAH) and the European Investment Project Portal (EIPP).
These help to create a stable pipeline of bankable projects and attract potential investors worldwide. In addition to the Investment Plan, the EU is investing in measures to support industry through the following:
s Horizon 2020 (the biggest EU Research and Innovation (R&I) program ever with nearly 80 billion EUR of funding available over seven years (2014 to 2020) - in addition to the private investment that this money will attract. It promises more breakthroughs, discoveries, and world-firsts by taking great ideas from the lab to the market, with 16 billion EUR already invested in more than 9,000 projects, including support for industrial leadership and the European Institute of Innovation and Technology.
s The European Structural and Investment (ESI) Funds, with a budget of EUR 454 billion for the period 2014-2020, contribute directly to creating jobs and growth. This contribution includes over 120 billion EUR, which will be strategically invested in R&I and provide support for small businesses and digital technologies. The ESI Funds will directly support 2 million enterprises throughout Europe to increase their competitiveness and help them develop innovative products and create new jobs.
For Slovakia and its goal to achieve long-term sustainable competitiveness, it is crucial to utilize all opportunities arising from the vast amount of financial resources available. To gain a more focused approach, a new R&I smart specialization strategy for Slovakia has been prepared in the last few months (May 2017–January 2018). This study presents some of the results, mainly linked to the promotion of smart production systems (Industry 4.0).
1.1. Objective of the Study: Smart Production Systems for SMEs
Economic growth is expected to remain well above the EU average (real GDP continued to grow at a robust pace of 3.4% in 2017, and it is expected to strengthen even further, led by private consumption). However, some regions have failed to attract major investments, which has exacerbated regional disparities in many economic and social areas. Boosting innovations and resource efficiency can ease

Chapter 8 _ Promotion of Smart Production Systems for SMEs: Robotics and Automotive Industry (Slovakia)�ˍ�335
the transition to a knowledge-based and more diversified economy. However, total R&D investment fell in 2016 and business R&D intensity remains very low. The governing framework for R&D policy is weak and measures to improve the cooperation between business and academia are advancing only slowly. The lack of skilled workers in the ICT sector is being addressed via a “digital coalition” initiative. Meanwhile, the rollout of e-government services is proceeding slowly, the services sector is highly regulated, and the framework does not appear to function effectively. Energy efficiency is low and the use of landfills is extensive. Recycling rates are very low and air quality remains relatively poor.
As clearly shown in the following picture, advanced manufacturing, the topic of our study, is among the Top 50 technologies analyzed by Frost & Sullivan’s Global Tech Vision Program. These 50 technologies represent those having the maximum potential for wide-scale launch and mass commercialization and with the highest potential to influence the future. This further confirms the importance of our effort to promote this area.
AdvancedLasers for Manufacturing
Digital Manufacturing
Intelligent Robots
Micro and Nanomanufacturing
Medical Robotics Combination Devices
Optical ImagingTechnologies
Hybrid ImagingTechnologies
Smart Pills
Energy Harvesting Smart Sensors
Wireless SensorNetworksCBRN Detection
TechnologiesSmart Textiles
Compostable PackagingSuperhydrophoblc Coatings
Enzyme Technology
Breathable AntibacberiaCoatings
Clean CoalAdvanced
Hydrocracking
Lightweight Composites
Enhanced OilRecovery
Virtualization Semantic WebCloud
ComputingFabric Computing
Long-TermEvolution
LED Lighting Technologies
3D Integration
Flexible Electronics
Haptics & TouchTechnologies
Emerging Data StorageTechnologies
Wireless PowerTransmission
Advanced Filtration
NanocatalystsAlgae-basedIngredients
Digital Pathology
Genome Sequencing
Biosensing
Adult Stem Cells
Smart Grid
Thin Film Photovoltaic
Renewable Chemicals
Green Buildings
2nd GenerationBiofuels
Green Vehicles
Advanced EnergyStorage Next Generation
Displays
3D Cell CultureSystemsNanofluidics &
BioNEMS
Lasers for Manufacturing
ADVANCEDMANUFACTURING
SENSORS & AUTOMATION
MATERIALS & COATINGS
CONVENTIONAL ENERGY
INFORMATION &COMMUNICATION TECHNOLOGY
MICROELECTRONICSCLEAN & GREENTECHNOLOGY
LIFESCIENCES &BIOTECHNOLOGY
MEDICAL DEVICES& IMAGING
TECHNOLOGY
[Figure 8-2] Top 50 Technologies
Source: Frost & Sullivan (2017).

336�ˍ�2017/18 Knowledge Sharing Program with Visegrad Group
1.2. Organization of Study and Report
This document presents an overview of the R&I challenges and needs, the latter as proposed by stakeholders.
This report starts with a discussion on the current development in the area of industry revolution and how the EU is tackling this development.
In the next part, we discuss the megatrends that will be shaping the next decade and how the Slovak entrepreneurs see the impact of these trends. We present data collected through our extensive work with the stakeholders between the summer of 2017 and beginning of 2018 in Slovakia known as the Entrepreneurial Discovery Process (EDP), which led to the new set of priorities and goals with a focus on particular details in R&D support within the so-called R&I smart specialization strategy for Slovakia (RIS 3 SK).
It is then followed by a recommendation related to the smart industry strategy that has been prepared by Ministry of Economy and is closely related to the objective of the study.
2. EDP and Results with Impact on Promotion of Smart Production Systems
Some of the key features that have been pointed out by leading scholars and policymakers dealing with innovation policies to define the EDP are as follows:
s The EDP is an inclusive and interactive bottom-up process in which participants from different environments (policy, business, academia, etc.) discover and produce information about potential new activities and identify potential opportunities that emerge through this interaction while policymakers assess outcomes and ways to facilitate the realisation of this potential.
s The EDP pursues the integration of entrepreneurial knowledge fragmented and distributed over many sites and organizations, companies, universities, clients and users, and specialized suppliers (some of these entities being located outside of the region) through the building of connections and partnerships.
s The EDP consists of the exploration and opening up of a new domain of opportunities (technological and market), potentially rich in numerous innovations that emerge as feasible and attractive.
The importance of the EDP is related to the recognition that the government does not have innate wisdom or ex-ante knowledge about future priorities.

Chapter 8 _ Promotion of Smart Production Systems for SMEs: Robotics and Automotive Industry (Slovakia)�ˍ�337
Policymakers must guard against the intellectual logic imposed by the principal–agent model, according to which the principal, that is, the government, knows from the start which specialization domains should be developed and therefore confines it to setting up the incentives for private industry to carry out the plan. However, what if there is no principal with the robust and panoramic knowledge needed for this leading role? This uncertainty is the main reason administrators and politicians need to be prepared to listen to entrepreneurs, researchers, and citizens in order to identify priorities and facilitate the emergence and growth of new activities.
2.1. Megatrends and Their Impact on Slovak Enterprises
Megatrends can be perceived as fundamental catalysts that influence market growth by influencing a variety of determinants, such as consumer behavior, as well as business processes. This may be the reason for the emergence of new products or services, affecting the price, performance, availability, and quality of innovation. They can affect latent demand; revitalize growth in existing, stagnant, and mature markets; and unblock resources to secure the growth of new market opportunities. However, they may also increase the costs needed to mitigate the potential negative effects of megatrends on the functioning of companies.
However, if we focus on positive aspects, then megatrends can facilitate growing industrial segments. They can accelerate their opportunities and provide the basis for above-average growth over a longer period. Some of the trends we are examining have a truly significant direct impact on the entire ecosystem: consumers, businesses, the whole economy, logistics, mobility, energy. The growing use of IT, for example in logistics firms, has led to not only increased operational efficiency but also their ability to provide e-commerce services. In addition, these changes have once again had an impact on the entire ecosystem, changing consumer behavior using e-commerce: selection, comparison, payments, complaints, delivery method, route tracking and delivery time, after-sales services, and customer satisfaction analysis. Megatrends are generally interconnected and their effects are generally synergistic and able to multiply. On the other hand, because they are megatrends, they generally have a global reach and therefore represent the most interesting opportunities because they allow for scalability to the greatest possible extent. Therefore, companies should have strategic leadership in their strategic teams and people who will be able to identify and use these opportunities.
�������,GHQWL¿FDWLRQ�RI�0HJDWUHQGV
According to renowned German consultant Roland Berger (2011), seven global megatrends will shape the face of the world in 2030:

338�ˍ�2017/18 Knowledge Sharing Program with Visegrad Group
s Changing demographics (growing world population, ageing societies, increasing urbanization)
s Globalization & future markets (ongoing globalization, BRIC (Brasil, Russia, India and China) : the new powerhouses, beyond BRIC)
s Scarcity of resources (energy, water, other commodities)s The challenge of climate change (increasing CO2 emissions, global warming, at-
risk ecosystem)s Dynamic technology & innovations (technology diffusion, power of innovation,
the age of life science)s Global knowledge society (knowledge base, gender gap, war for talent)s Sharing global responsibility (shift to global cooperation, growing power of
NGOs, increasing philanthropy)
2.1.2. Impact Perceived in Slovakia
During the EDP, we asked 576 Slovak enterprises how they perceived some of these megatrends (we have selected trends Changing Demographics, Globalization & Future Markets, The Challenge of Climate Change, Dynamic Technology & Innovations, and Global Knowledge Society) and their impact on their businesses.
Surprisingly, the Slovak companies do not strongly feel the impact of these megatrends yet (with some exceptions: those active in agriculture see the impact of global warming and those in industry, mainly in ICT, see the impact of war of talent (partly due to the megatrend Global Knowledge Society and partly due to demographic change):
Small (less than 50 employees and turnover lessthan 10 million EUR); 40.2%
Other (state, budgetary, etc.); 9.3%
Medium (less than 250 employeesand turnover less than50 million EUR); 29.5%
Large (more than 250 employees and turmover is more than 50 million EUR); 21%
9.3%
21%
40.2%
29.5%
[Figure 8-3] Split of Respondents According the Size/Type of Company
Source: Bobovnicky et al. (2018).

Chapter 8 _ Promotion of Smart Production Systems for SMEs: Robotics and Automotive Industry (Slovakia)�ˍ�339
Roland Berger also provides some suggestions for the corporate world and policymakers in relation to these megatrends that we combined with data collected in Slovakia:
Globalization & Future Markets: The strongest indicator for continuing globalization is FDI growth above the GDP growth rate. However, there is no long-term forecast for FDI flows for the period up to 2030. However, even though the speed of FDI growth prior to 2030 is uncertain, it is very likely that it will be faster than the world´s GDP growth. Emerging countries such as China and India will eventually catch up to the developed countries by 2030, attracting a large amount of FDI as well as investing in foreign markets themselves. The strong economic growth in many developing countries will reshape the playing ground.. Investments (e.g., in marketing & sales, R&D, and human capital) need to be intensified in foreign markets, especially in growth markets such as China, India, and the Next Eleven (the largest among them being Mexico, Indonesia, Turkey, and South Korea). Besides their auspicious economic prospects, these countries also face certain risks, such as political instability. Companies therefore need to consider, analyze, and evaluate political, social, and cultural aspects in addition to external economic development to make sure they enter the right markets. Because most globalized companies will be affected by, for example, international crisis, it is a question of who is best prepared and who recovers most.
When we asked the Slovak entrepreneurs if they were prepared for expected and unexpected changes, they were very positive about their level of preparedness:
Fully agree
11%
Agree
40%
Rather agree
41%
Rather disagree
7%
Disagree
1%
[Figure 8-4] Survey: Are you Prepared for Predictable Changes?
Source: Bobovnicky et al. (2018).

340�ˍ�2017/18 Knowledge Sharing Program with Visegrad Group
The challenge of climate change: New business opportunities will arise from climate change in terms of products (new eco-friendly products or technologies will open up business opportunities and dominate the markets. Companies should focus on using greener materials, reducing packaging, and compensating for their carbon footprint), emissions brokering, and regulation/brand value (companies must communicate their achievement in terms of environmental friendliness and thus improve their reputation and brand value). At the same time, companies must focus on the potential risks arising from climate change and include them in future business planning.
The Slovak companies do not perceive climate change as a vital challenge with rather natural and expectable deviation in the agriculture industry.
In terms of the size of the respondents’ companies, the impacts of climate change (global warming) are most likely to be felt by respondents from SMEs (especially from
Fully agree
11%
Agree
40%
Rather agree
41%
Rather disagree
7%
Disagree
1%
[Figure 8-5] Survey: Are you Prepared for Unpredictable Changes?
Source: Bobovnicky et al. (2018).
Automotive
Industry
ICT
Health
Agro
7%
13%
9%
6%
53%
Very strong impact Moderate impact Impact not seen yet
16%
28%
16%
16%
78%
58%
75%
78%
37% 11%
[Figure 8-6] Climate Change Impact
Source: Bobovnicky et al. (2018).

Chapter 8 _ Promotion of Smart Production Systems for SMEs: Robotics and Automotive Industry (Slovakia)�ˍ�341
the domain of healthy food and the environment). This can be explained by their greater vulnerability to the external factors that require investment/interventions to reduce the possible impacts of such factors.
Dynamic Technology & Innovations: Robotics will dramatically change our lives by carrying out tasks that humans normally do themselves today. ICT will remain critically important over the next 20 years, influencing our private and business lives with innovations such as cloud computing and virtual reality. Companies, especially mid-sized ones, must strengthen their R&D positions. To avoid heavy investment in R&D, they should look at the possibility of establishing cooperative partnerships and networks (businesses with universities or research institutions). On a political level, networking will facilitate business and partnership. Another option is to distribute innovations along the value chain and thus reduce their costs and usher new products to market faster by eliminating the bottlenecks that come with total control. They must also watch the latest technology trends and become more sensitive to their relevance.
The impact of robotics and automation is most likely to have the largest impact on the business of large enterprises (almost half) and the smallest impact on state-owned enterprises. Most SMEs do not feel the impact of robotics, but about a quarter mentioned a slight impact.
Changing Demographics: Due to the rising life expectancy and declining birth rates, the global median age is rising. In many developed countries, people aged 60 and over will become the largest segment. By 2030, 29% of people in the developed world will be older than 60, compared to 22% today. Besides changing consumer behavior, they do not want products branded for elderly people but still enjoy certain features addressing the three S´s: simplicity, service, and safety. As more of the working population will belong to the over-60 age group, it is also important to adapt organizational structures and processes to improve their experience.
Automotive
Industry
ICT
Health
Agro
31%
15%
33%
5%
6%
24%
31%
33%
23%
44%
54%
33%
73%
30% 64%
Very strong impact Moderate impact Impact not seen yet
[Figure 8-7] Automation and Robotization Impact
Source: Bobovnicky et al. (2018).

342�ˍ�2017/18 Knowledge Sharing Program with Visegrad Group
With increasing urbanization, smart solutions are very much needed, not only for new megacities but for all cities. They need to establish an appropriate infrastructure, and demand for security is likely to rise.
Global Knowledge Society: We have to be aware of the fact that the war for talent will intensify up to 2030. Serious skill gaps are forecast, for instance in engineering and healthcare. Globalization will trigger a migration of human capital. There will be winners (brain gain) and losers (brain drain). Open innovations will play an important role in sharing and generating knowledge. Companies must create appropriate structures that will allow combining knowledge from different areas in an efficient, up-to-date network.
In our research, we have combined megatrend 1 and megatrend 6 into one item.
All sectors are facing demographic changes and a lack of an available and skilled labor force and perceive these megatrends as vitally impacting their businesses.
As indicated, the impacts of changing demographics and the war for talent are perceived mainly in the automotive industry and other industries. In particular, in the automotive industry, the number of vacant posts reached 12,000 in 2017.
According to SMEs, they do not yet see the impact of demographic developments or they have a modest impact on their businesses. Demographic developments have a very strong impact on large businesses and on most state-owned enterprises.
Automotive
Industry
ICT
Health
Agro
58%
42%
37%
35%
22%
31%
43%
39%
40%
11%
15%
24%
25%
39% 39%
Very strong impact Moderate impact Impact not seen yet
[Figure 8-8] Changing Demographics and Global Knowledge Society
Source: Bobovnicky et al. (2018).

Chapter 8 _ Promotion of Smart Production Systems for SMEs: Robotics and Automotive Industry (Slovakia)�ˍ�343
�����5'�,QIUDVWUXFWXUH���,GHQWL¿FDWLRQ�RI�&XUUHQW�6WDWH
New technologies generate new markets. This is especially true of the integrated development of digital technology and advanced manufacturing. These trends define our current industrial revolution: rapid, comprehensive changes in technology are transforming our economy. Moreover, the pace of change is creating demand for R&D, including access to R&D infrastructure.
Slovak companies in general have very good access to R&D infrastructure. Moreover, 70% of the companies without their own R&D facilities are planning to invest in their own R&D infrastructure.
In the financing of projects in this area, it will be necessary to focus not on general projects but on so-called unique infrastructure, which according to the respondents of some domains is most lacking. (Unique Infrastructure: Within all types of research infrastructures, research infrastructures that can be described as unique have been installed in Slovak research institutions. These are smaller units at the level of individual laboratories, respectively, individual unique devices. The uniqueness of such infrastructures lies in the uniqueness of their parameters/performance/accuracy, etc., not only within the Slovak Republic but also on the international scale - at least within the V4 countries. The unique research infrastructure should represent the qualitative top of the research infrastructures of the Slovak Republic where there is and will be the greatest potential for cooperation with the practice as well as engaging in international scientific and technical cooperation and international networks of infrastructures.)
Very good access
Sufficient access
Limited access
No access
26%
38%
25%
11%
[Figure 8-9] Access to R&D Infrastructure
Source: Bobovnicky et al. (2018).

344�ˍ�2017/18 Knowledge Sharing Program with Visegrad Group
�����6SHFL¿F�'HYHORSPHQW�7UHQGV�IRU�,QGXVWU\�����DQG�Areas of Future R&D Support
In the EDP process, key development trends have been identified in each domain platform that will influence the development of individual industrial segments for the next five years or more. In accordance with these, areas have been identified that should be supported either from state budget sources or from Operating Program Development & Innovations (financed from the ESIF) in the form of the so-called product lines.
In this chapter, we summarize the development trends directly linked to Industry 4.0. Specific development trends for Industry 4.0 have been identified mainly in the following domains: automotive, industry and ICT. However, some trends could also be spotted in the domains of agriculture and healthcare.
Automotive: The automotive industry is the flagship of the Slovak economy. Domain trains for the 21st century show the highest export shares and the highest values of the comparative advantage coefficients. The automotive industry also shows the highest corporate R&D expenditure in the Slovak Republic. Another major component of the means of transport produced in Slovakia are rail and rail vehicles, represented by several manufacturers, who have their competitiveness built on the R&D of complete products or parts thereof. This segment includes the manufacture of motor vehicles, semi-trailers, and trailers SK NACE 29, where at the end of 2016 there were 136 enterprises and the industry manufacture of other transport equipment SK NACE 30 with 18 enterprises with 20 or more employees.
The key importance of production of means of transport for industrial production in both sales and employment is also documented by statistical data. Based on the available data, the share of the two industries represented 26% of the total value added of industrial production in 2016. In terms of number of employees, this figure accounted for 19.35%.
Compared with other industry sectors, domestic automotive accounted for 39.29% of total revenues for own products and goods in 2016, 42.19% of total foreign sales, and a 20.19% share in the total average number of employees of the industrial production in Slovakia.
The above figures document the key importance of manufacturing means of transport for industrial production in both sales and employment. This contributes to the fact that 37.34% of total acquisitions in industrial production accounted for the aforementioned sectors.

Chapter 8 _ Promotion of Smart Production Systems for SMEs: Robotics and Automotive Industry (Slovakia)�ˍ�345
Industry: The manufacturing and processing of metals, metal structures, and electrical equipment and mechanical engineering are traditionally strong and competitive industries in the Slovak industry. From the point of view of economic specialization, these sectors show high export shares and high values of comparative advantage compared to the EU28 as well as the neighboring small and open economies. The branches have high corporate spending on R&D in the Slovak Republic. A considerable part of the allocations of OP R&D and OP C & H is also directed to these sectors. The domain also has the second-highest number of patents and trademarks. In nanotechnology, metallurgy, and mechatronics, Slovakia has a comparative advantage in the EU markets.
The field of intelligent specialization consists of six branches of industrial production: manufacture of chemicals and chemical products (SK NACEC20), manufacture of rubber and plastic products (SK NACEC22), manufacture of fabricated metal products (SK NACE C24), and manufacture of fabricated metal products, except machinery and equipment (SK NACEC27) and machinery and equipment (SK NACEC28).
The share of these industries was 48.49% of the total value added of industrial production, with C24 and C25 dominating (14.82%). In terms of number of employees, the share of smart specialization represented almost half of the number of employees in industrial production: 49.44%, dominated by C24 and C25 (15.23%). From the point of view of the investments made in 2016, the combined industries achieved a 44.5% share of the entire manufacturing sector.
Domestic sector revenues amounted to 21.569 million in 2016. The share of sales from abroad was 77%. The average registered number of employees in these sectors reached 165,384 in 2016.
Compared to other industries, the Group 6 sector accounted for 32.07% of total industrial production revenues for own outputs and goods and 33.65% of total foreign sales. The average registered number of employees accounted for 45.23% of the total average number in the manufacturing sector.
The aforementioned development trends are as follows:
s New construction materials, components, and technologies for the automotive industry, railway production, and production of vehicles and other transportation means
s Progressive (non-constructive) materials, elements, structures, and nanotechnologies for the needs of the automotive industry, the production of railway vehicles, and the manufacturing industry of other means of transport, including their functional bonds

346�ˍ�2017/18 Knowledge Sharing Program with Visegrad Group
s Basic organic and polymeric materials and products for the needs of the automotive industry, the production of railway vehicles, and the production industry of other means of transport, including their functional linkages
s Quality, testing, metrology, and related processes for the needs of the automotive industry, the production of railway vehicles, and the production industry of other means of transport, including their functional links
s Quality, testing, metrology, and related processes for the needs of ICT products for automotive and industry needs, the production of railway vehicles, and the production industry of other means of transport, including their functional links
s Alternative drives in vehicless New construction materials, construction parts, and technologies for the needs
of industry and energys Progressive (non-structural) materials, elements, structures, and
nanotechnologies and biotechnology for industry and energy needs, including their functional links
s Basic organic, inorganic, polymeric, and pharmaceutical materials and products for the needs of industry and energy, including their functional linkages
s Biotechnologys New technologies of mechanical, chemical, and energy processing of
agricultural and forest biomass for products with high added values Comprehensive technologies and systems to reduce the negative impacts of
farming on the environment and ensure the protection and sustainable use of soil and water in changing climatic conditions
s ICT tools for Industry 4.0
3. Conclusions and Policy ImplicationsThe competitiveness of industry in Europe is increasingly dependent on the
knowledge, skills, and creativity of its workforce and citizens. A large and diverse talent pool combined with skills shortages and mismatches negatively impacts innovation, growth, and employment. People will increasingly need to work across a variety of complex subject areas with ease and confidence.
The automotive industry, the key industry for Slovakia, is experiencing a growing need for suitable workers with approximately 100,000 additional jobs needing to be filled annually across Europe for at least the next eight years (as stated, in Slovakia alone, 12,000 positions have been vacant since 2017). This is mainly due to an ageing workforce and the forecasted growth of production in the sector. In addition, it is expected that a significant number of assembly-line jobs will disappear, partly due to the introduction of new production technologies and “clean” vehicles.

Chapter 8 _ Promotion of Smart Production Systems for SMEs: Robotics and Automotive Industry (Slovakia)�ˍ�347
From energy-intensive industries to the agro-food sector, from the space industry to bio-based industries, and from the defense industry to the construction sector, Europe’s industries are vital for sustained economic performance and employment across our continent.
Manufacturers in Europe represent 77% of private R&D investments. In other words, if we lose manufacturing, we lose our capacity to shape the future for the better.
The new industrial revolution is redesigning the foundations of many industries, tearing down the walls between industrial sectors as borders between producers, suppliers, and consumers shift. There are great opportunities for innovators, industry, and investors to deploy the technologies of this industrial revolution. Some examples include advanced materials for reducing heat absorption in buildings, 3D printing for local production reducing transportation costs, and delivering solutions that benefit people and the planet while, at the same time, creating a commercial advantage.
While previous industrial revolutions prompted greater demand for resources and put a strain on the climate, biodiversity, and water, this revolution is about sustainability. This will mean clean power, circular economy models for industrial waste management, advanced materials for health technology and construction, and 3D printing for local production.
However, as in the past, the current transformations require investments in skill development and actions to counter rising inequalities that come with technological development.
The transformation of global industry is a reality at every level: local, regional, national, and European. We must embrace this transformation and make it work for both Europe’s industry and citizens. Tackling these challenges positively and seizing the opportunities generated by new technologies and environmental imperatives will ensure that industry in Europe is successful.
The development of Europe and the EU is based on industry. We have undergone industrial revolutions before and have come out stronger. This is happening now and, as before, with preparation and readiness to adapt, Europe’s industry and its citizens will emerge better off.
In Slovakia, we are reflecting these changes with a more focused approach toward R&D support from public sources as shown above. In addition, although it could seem that there are too many development trends that are subject of support, this new approach achieved enormous improvement in comparison with the previous

348�ˍ�2017/18 Knowledge Sharing Program with Visegrad Group
RIS3 document, gaining a much more focused approach in supporting R&D activities from public sources.
So what has to be done? In both research and practice, we find that transforma-tions stand the best chance of success when they focus on four key actions to change mindsets and behaviors: fostering understanding and conviction, reinforcing changes through formal mechanisms, developing talent and skills, and role modeling. Collectively labeled the “influence model,” these ideas were introduced more than a dozen years ago in an article of Lawson and Price, “The psychology of change management.” They were based on academic research and practical experience.
In the case of the SIEA and Slovakia, we can present the following initiatives fulfilling these four actions through the well-funded national project aimed at increasing the innovation performance of the Slovak economy, implemented by the SIEA:
s Fostering understanding and conviction: massive building of awareness of the innovations and their impact on the national economy and well-being of the country in the future via over 500 events across the whole country.
s Reinforcing changes through formal mechanisms: program of innovation-related mentoring for over 540 entrepreneurs in Slovakia.
s Developing talent and skills: How can we find and generate an innovative idea? How can we transform it into a project proposal? How can we sell it to potential investors/stakeholders? These topics create the content of the innovation workshop that will run within 240 schools (secondary and tertiary educational institutions), providing, in many cases, the first real innovation task for kids aged 16-17.
s Role modeling: Innovation deed of the year – promoting the best commercial-ized innovations in the country.

Chapter 8 _ Promotion of Smart Production Systems for SMEs: Robotics and Automotive Industry (Slovakia)�ˍ�349
References
Artur Bobovnicky, Hains Marian, HomoĐa Juraj, Vokounova Dana (2018), EDP for RIS3, Bratislava
Emily Lawson and Colin Price (2003), The psychology of change management, McKinsey Quarterly (June)
Frost & Sullivan (2017), Global Tech Vision Program
Industry in Europe (2017), Facts & Figures on Competitiveness & Innovation (ISBN: 978-92-79-55267-0)
Roland Berger (2011), Trend Compendium 2030, Munchen
http://www.ipdapgroup.com/sk/2017/11/08/vyvoj-automobilovy-priemysel-sr-2016/

ISBN 979-11-5932-311-9ISBN 979-11-5932-302-7(set)
Ministry of Economy and Finance Government Complex-Sejong, 477, Galmae-ro, Sejong Special Self-Governing City 30109, Korea
Tel. 82-44-215-7741 www.moef.go.krKorea Development Institute263 Namsejong-ro, Sejong Special Self-Governing City 30149, Korea
Tel. 82-44-550-4114 www.kdi.re.kr
Knowledge Sharing Program www.ksp.go.kr
Center for International Development, KDIcid.kdi.re.kr
ww
w.k
sp.g
o.kr