2015 NPDES MS4 ANNUAL REPORT
261
Submitted to: Water Management Administration Maryland Department of the Environment 1800 Washington Boulevard Baltimore, MD 21230 Submitted by: Maryland State Highway Administration Office Of Environmental Design 707 North Calvert Street, C-303 Baltimore, MD 21202 National Pollutant Discharge Elimination System Phase I & II Municipal Separate Storm Sewer System Permit No. 99-DP-3313 MD0068276 Permit Term October 2005 to October 2010 Annual Report Update October 21, 2015
-
Upload
khangminh22 -
Category
Documents
-
view
4 -
download
0
Transcript of 2015 NPDES MS4 ANNUAL REPORT

Submitted to:Water Management AdministrationMaryland Department of the Environment1800 Washington BoulevardBaltimore, MD 21230
Submitted by:Maryland State Highway Administration
Office Of Environmental Design707 North Calvert Street, C-303
Baltimore, MD 21202
National Pollutant Discharge Elimination SystemPhase I & IIMunicipal Separate Storm Sewer System
Permit No. 99-DP-3313 MD0068276Permit Term October 2005 to October 2010
Annual Report Update October 21, 2015


National Pollutant Discharge Elimination System Phase I and II Municipal Separate Storm Sewer System
Permit No. 99-DP-3313 MD0068276 Permit Term October 2005 to October 2010
Annual Report Update
October 21, 2015
Submitted to:
Water Management Administration Maryland Department of the Environment
1800 Washington Boulevard Baltimore, MD 21230
Submitted by: Maryland State Highway Administration
Office of Environmental Design 707 North Calvert Street, C-303
Baltimore, MD 21202
Prepared by:
Johnson, Mirmiran and Thompson, Inc. 72 Loveton Circle
Sparks, Maryland 21152


10/21/2015 Maryland State Highway Administration i NPDES MS4 Phase I and II Annual Report
Executive Summary
This is the final annual report for the Maryland State Highway Administration (SHA) National Pollution Discharge Elimination System (NPDES) Phase I Municipal Separate Storm Sewer System (MS4) permit issued in October 2005 and Phase II MS4 Permit issued in November 2004 by the Maryland Department of the Environment (MDE) Water Management Administration (WMA). MDE issued SHA a new Phase I MS4 permit that is effective beginning October 9, 2015 through October 8, 2020 and the next annual report will discuss compliance under the new permit authority. SHA properties in Phase I and II jurisdictions are combined under this new permit.
This report covers the time period of October 1, 2014 to September 30, 2015. The following is a general overview and highlights significant achievements during the reporting period.
Source Identification
Impervious accounting and 25 project restoration requirements under the expired permit have been completed for the eleven Phase I and II counties and the three Phase II municipalities. The MDE document entitled Accounting for Stormwater
Wasteload Allocations and Impervious
Acres Treated was issued in August 2014 and SHA has worked to adjust our accounting to meet these new guidelines.
GIS data for both the SHA storm drain systems and stormwater management facilities was completed under the expired permit term and regular schedules for updating asset data are included here. Restoration project data has been added to our overall GIS system as well in
anticipation of increased restoration requirements with the new permit.
On March 19, 2015, MDE issued a new geodatabase design and User’s Guide. SHA is working towards compliance with these new data reporting standards and they will be incorporated into the next annual report.
Discharge Characterization
SHA continues to investigate and research topics to maximize water quality in our construction methods, permanent stormwater runoff controls, decisions in design, and maintenance techniques. SHA is conducting additional research activities related to meeting the anticipated waste load allocations for designated watersheds with a Total Maximum Daily Load (TMDL). Current research studies include: Management of Nitrogen in Stormwater Runoff Using a Modified Conventional Sand Filter; Enhancements for N and P Removal from Stormwater Management Facilities for Multi-Modal Transportation Infrastructure in Maryland: Multi-Criteria Plant Selection for Vegetated Stormwater Control Measures; Evaluation of Compost Addition to Stormwater Control Measure Performance; NASA Satellite Imagery for Highway Runoff Stormwater Management Potential; Street Cleaning Research; Outfall Stabilization Sediment Reduction Credit Analysis; and Bioretention Soil Assessment.
Management Program
The SHA NPDES program continues to effectively incorporate all permit components. We have successfully

ii Maryland State Highway Administration 10/21/2015 NPDES MS4 Phase I and II Annual Report
integrated the stormwater environmental site design (ESD) regulations into roadway design and construction projects. SHA continues to measure and improve our performance in the areas of erosion and sediment control (ESC) during construction. Internal business goals to decrease pollutant discharges to the Chesapeake Bay and maximize the number of functionally adequate stormwater facilities statewide continue to be measured and reported.
SHA and MDE have entered into an agreement for delegated authority of SWM and ESC permitting. This agreement was implemented over the past year and required reporting is included here.
Watershed Assessment
SHA has incorporated watershed assessment
efforts as described by the permit in the overall business process by continuing to evaluate highway drainage areas for stormwater management retrofit opportunities and coordinate with local jurisdictions on watershed restoration plans to maximize water quality benefits.
SHA exchanges the latest available geographic information system (GIS) highway data with permitted NPDES municipalities and provides the most recent spatial database of drainage assets and stormwater infrastructure to MDE. SHA completed the impervious surface accounting by the fourth annual report and continues systematically updating this dynamic layer. In preparation for increased restoration requirements under the new permit, SHA has been assessing areas that lack highway runoff control and treatment and implementing water quality improvement projects to maximize water quality benefits.
SHA also participates in a number of endeavors to expand and maximize watershed assessment initiatives and build partnerships with Federal, State, and local agencies.
Watershed Restoration
SHA continues to construct stormwater management retrofits to increase pollutant control associated with highway runoff. Requirements for this permit condition to implement twenty-five significant stormwater management retrofit projects to improve water quality of highway runoff has been met. Watershed restoration projects include functional enhancements and upgrades of stormwater facilities that do not meet current design standards as well as construction of additional stormwater BMPs to treat currently untreated impervious surfaces. Stream restoration and stabilization projects have also been implemented.
Assessment of Controls
The Long Draught Branch stream restoration project was designated early in the permit term as the watershed restoration project for assessing pre- and post- construction controls. Pre-construction monitoring has been completed. The original project design did not receive Wetland and Waterways approval and the project has been redesigned to address agency comments. SHA will proceed with the joint permit application and advertise for construction in February 2017, so the project can be constructed in 2017-2018. For the new permit requirement, SHA will develop a new watershed project for monitoring.
Program Funding
SHA’s NPDES program remains fully funded, and is a priority. SHA and MDOT

10/21/2015 Maryland State Highway Administration v NPDES MS4 Phase I and II Annual Report
have begun funding Bay TMDL efforts and also supported procurement of NPDES engineering contracts.
Total Maximum Daily Loads
The SHA MS4 Phase I permit for this reporting period states that owners of storm drain systems that implement the requirements of the permit will be controlling stormwater pollution to the
maximum extent practicable. However, the current mandate to restore the Chesapeake Bay by 2025 and the recently issued MS4 Phase I permit requirement for 20% impervious restoration by 2020 are significant efforts that SHA has anticipated. We have increased our funding, staffing and program initiatives in order to meet these deadlines.


10/21/2015 Maryland State Highway Administration iv NPDES MS4 Phase I and II Annual Report
Table of Contents
Page Number
Executive Summary ............................................................................................................... i Table of Contents ................................................................................................................. iv List of Tables ........................................................................................................................ v List of Figures ....................................................................................................................... v
Part 1 Standard Permit Conditions and Responses .................................................... 1-1
A Administration of Permit .......................................................................... 1-1 B Legal Authority ........................................................................................ 1-4 C Source Identification ................................................................................ 1-4 D Discharge Characterization..................................................................... 1-10 E Management Program ............................................................................ 1-17 F Watershed Assessment ........................................................................... 1-43 G Watershed Restoration ........................................................................... 1-51 H Assessment of Controls .......................................................................... 1-62 I Program Funding ................................................................................... 1-64 J Total Maximum Daily Loads (TMDLs) .................................................. 1-65
Part 2 Stormwater and Drainage Asset Program ........................................................ 2-1 A Planning .................................................................................................. 2-1 B Engineering .............................................................................................. 2-4 C Construction ............................................................................................. 2-7 D Operations ................................................................................................ 2-8 E Summary.................................................................................................. 2-8
Appendix A Geospatial Database and Data Dictionary ................................................... A-1 Appendix B Delegated Authority First Quarterly Report. ............................................... B-1 Appendix C Assessment of Stream Restoration Projects in Maryland, 2014 - 2015
Report ........................................................................................................ C-1
CD Digital Copies of the Annual Report Update and Appendices, Geospatial Database, and Data Dictionary

10/21/2015 Maryland State Highway Administration v NPDES MS4 Phase I and II Annual Report
List of Tables
Table Page Number
1-1 GIS Application Development ........................................................................................... 1-5 1-2 Source ID Schedule ........................................................................................................... 1-6 1-3 SHA Impervious Restoration Accounting by County ......................................................... 1-8 1-4 Impervious Layer Update Status ........................................................................................ 1-9 1-5 SHA ESC Training .......................................................................................................... 1-20 1-6 SHA Deicing Materials .................................................................................................... 1-25 1-7 SHA Snow College Training............................................................................................ 1-26 1-8 Industrial NPDES Permit Status ....................................................................................... 1-27 1-9 Capital Expenditures for Pollution Prevention BMPs ....................................................... 1-28 1-10 Current SHA Outfall Stabilization Projects ...................................................................... 1-30 1-11 Discharges Investigated from February 2001 to Date ....................................................... 1-34 1-12 Illicit Discharge Requiring Follow-up .............................................................................. 1-34 1-13 Adopt-a-Highway Program .............................................................................................. 1-36 1-14 Sponsor-a-Highway Program ........................................................................................... 1-37 1-15 Partnership Planting Program ........................................................................................... 1-37 1-16 Pesticide Applicator Registration (ENV100) .................................................................... 1-40 1-17 Maryland Pesticide Recertification (ENV200) ................................................................. 1-41 1-18 Pesticide Core and Right of Way Certification Preparation (ENV210) ............................. 1-41 1-19 Summary of SHA and County Coordination Efforts ......................................................... 1-46 1-20 Watershed Restoration Projects ........................................................................................ 1-52 1-21 SHA Capital Expenditures for NPDES (State Fiscal Years).............................................. 1-64 1-22 Fund 82 Programmed Funding by Fiscal Year.................................................................. 1-64
2-1 Stormwater Asset Management Program in MS4 Counties ................................................. 2-3
List of Figures
Figure Page Number
1-1 Municipal Separate Storm Sewer System (MS4) Jurisdictions ............................................ 1-2 1-2 2015 Organizational Chart for SHA NPDES MS4 Permit Administration .......................... 1-3 1-3 Google Earth Screenshot of SHA NPDES Data Uploaded as KML .................................... 1-5 1-4 SHA Impervious Restoration Progress by County .............................................................. 1-8 1-5 Eupatorim dubium (Joe Pye Weed) .................................................................................. 1-13 1-6 Iris versicolor (Blue Flag Iris) .......................................................................................... 1-13 1-7 Panicum virgatum (Switchgrass) ...................................................................................... 1-13 1-8 Juncus effusus (Soft Rush) ............................................................................................... 1-13 1-9 ENVI Software showing Visualizer Feature Extraction .................................................... 1-14 1-10 Outfall in need of Stabilization, I-97 in Anne Arundel County ......................................... 1-16 1-11 Stabilized Outfall, I-97 in Anne Arundel County .............................................................. 1-16 1-12 Erosion and Sediment Control Reviews Performed for FY2015 ....................................... 1-19 1-13 Erosion and Sediment Control Quality Assurance for FY2015 ......................................... 1-19 1-14 Street Sweeping often takes place at night due to high traffic volumes in urbanized
counties ........................................................................................................................... 1-22

vi Maryland State Highway Administration 10/21/2015 NPDES MS4 Phase I and II Annual Report
1-15 SHA Shop Personnel Operating Vacuum Truck to Clean Roadside Debris ....................... 1-22 1-16 Inlet Before and After Vacuuming ................................................................................... 1-23 1-17 Outfall Remediation at I-270 in Montgomery County ....................................................... 1-32 1-18 Swan Creek Stabilization in Harford County .................................................................... 1-33 1-19 Tagged rare freshwater mussels during relocation in Harford County ............................... 1-35 1-20 Example of Volunteer Landscaping Results at SHA Headquarters .................................... 1-36 1-21 Adopt-A-Highway Volunteers along MD 45 in Baltimore County .................................... 1-36 1-22 Cecil County Partnership Planting Project at MD 213 ...................................................... 1-37 1-23 Volunteer Boy Scouts Stenciling Storm Drains and Rain Barrels ...................................... 1-38 1-24 Finished Stencil Design on Storm Drain ........................................................................... 1-38 1-25 Excerpt from District Coordination Presentation about Local Projects for MS4
Compliance ...................................................................................................................... 1-39 1-26 SHA Chesapeake Bay Field Trip and Environmental Awareness Training in October,
2014 ................................................................................................................................ 1-40 1-27 Screen Capture of the SHA Bay Restoration Viewer Interactive Map ............................... 1-41 1-28 SHA Sand Filter BMP Example used on the Website ....................................................... 1-41 1-29 SHA Promoted Bike to Work Day of May 15, 2015 ......................................................... 1-42 1-30 SHA Representatives Presenting at the National WRR Workshop .................................... 1-48 1-31 Existing Conditions at Minebank Run .............................................................................. 1-58 1-32 Stormwater Retrofit Site at Minebank Run ....................................................................... 1-58 1-33 Biological Monitoring Efforts at Minebank Run ............................................................... 1-58 1-34 Westminster Pond Stormwater Retrofit ............................................................................ 1-58 1-35 Existing Conditions of Broad Creek ................................................................................. 1-59 1-36 Degraded Stream Banks along Jabez Creek ...................................................................... 1-59 1-37 Existing Conditions at Israel Creek in Frederick County ................................................... 1-60 1-38 Existing Conditions at Little Tonoloway Creek in Washington County ............................. 1-60 1-39 Biological Monitoring Efforts .......................................................................................... 1-62 1-40 Bioswale Monitoring Equipment ...................................................................................... 1-63 1-41 Grass Swale Pavement Disconnection .............................................................................. 1-65 1-42 Local TMDLs within MS4 Jurisdictions with an SHA Responsibility ............................... 1-66
2-1 Stormwater Asset Management Program ............................................................................ 2-1 2-2 Infiltration Sand Filter Rated I ............................................................................................ 2-4 2-3 Infiltration Trench Rated II requiring vegetation and trash removal .................................... 2-5 2-4 Infiltration Basin Rated III (Infiltration is hampered and flooding beginning) ..................... 2-5 2-5 Infiltration Basin Rated IV (significant flooding and water not able to be retained in the
original footprint.) .............................................................................................................. 2-5 2-6 Major maintenance performed on BMP 030181 in Baltimore County ................................. 2-6 2-7 SWM Facility 160883 Under Retrofit Construction ............................................................ 2-6 2-8 SWM Facility 160800 After Construction .......................................................................... 2-7 2-9 SWM Inventory Functional Rating and Projected Trend ..................................................... 2-9


Part 1Standard Perm
it Conditions & Responses
Part 1
Standard Permit Conditions and Responses


10/21/2015 Maryland State Highway Administration 1-1 NPDES MS4 Phase I and II Annual Report
PART ONE
Standard Permit Conditions and Responses
1 Introduction
The Maryland State Highway Administration (SHA) is committed to continuing our National Pollutant Discharge Elimination System (NPDES) Program efforts, and is pleased to partner with the Maryland Department of the Environment (MDE), the Environmental Protection Agency (EPA) and other NPDES jurisdictions in order to achieve the program goals.
The original NPDES Phase I and II permit guided SHA through establishing our NPDES program. (The permit, MS-SH-99-011, was issued on January 8, 1999 and expired in 2004.) The next permit (99-DP-3313, MD0068276, issued October 21, 2005 and expired on October 21, 2010) focused on improving water quality benefits, developing an impervious accounting database and developing a watershed-based outlook for stormwater management and NPDES program elements. SHA submitted a re-application for the NPDES Phase I Municipal Separate Storm Sewer System (MS4) permit on October 21, 2009 and a new permit was recently issued to SHA on October 9, 2015. This report covers compliance with the expired permit that was issued in 2005.
This is the fifth and final annual update to the final annual report that was submitted October 21, 2010 for the expired permit. This report covers the period from October 1, 2014 through September 30, 2015, and combines reporting for both Phase I and II jurisdictions. Geographically, this report covers SHA compliance for storm drain systems, industrial shops and management programs within Anne Arundel, Baltimore, Carroll, Cecil, Charles, Frederick, Harford, Howard, Montgomery, Prince Georges and Washington Counties as well as Cumberland, Cambridge and Salisbury
municipalities. (See Figure 1-1 on the following page)
Part One lists permit conditions and explains SHA activities over the last year to comply with each one. Wherever possible, future activities and schedules for completion are provided. Part Two of this report discusses the SHA Stormwater Management (SWM) Facility Program in depth. Appendices are included at the end of the report that contain information on data, research, and monitoring reports.
A CD is included that contains portable document format (PDF) files of the report, database tables and GIS spatial data. The SHA storm drain and stormwater management data included is an update only from last year’s delivery. The entire geodatabase will be delivered next year when we have achieved compliance with the new MDE geodatabase design delivered to the MS4 jurisdictions on March 19, 2015.
A Administration of Permit
Administration coordinator for the NPDES Program is listed below and an organizational chart detailing personnel responsible for major program components is included on page 1-3 as Figure 1-2.
Mr. Robert Shreeve Deputy Director Office of Environmental Design (410) 545-8644 [email protected] The SHA coordinator for the MS4 permit is:
Ms. Karen Coffman Chief, Water Programs Division Office of Environmental Design (410) 545-8407 [email protected]

1-2 Maryland State Highway Administration 10/21/2015 NPDES MS4 Phase I and II Annual Report
Figure 1-1: NPDES Municipal Separate Storm Sewer System (MS4) Jurisdictions

10/21/2015 Maryland State Highway Administration 1-3 NPDES MS4 Phase I and II Annual Report
Figure 1-2: 2015 Organizational Chart for SHA NPDES MS4 Permit Administration

1-4 Maryland State Highway Administration 10/21/2015 NPDES MS4 Phase I and II Annual Report
B Legal Authority
A description of the legal authority maintained by SHA was restated in the fourth annual report dated October 21, 2009 and remains unchanged.
C Source Identification
According to the permit language, source identification deals with identifying sources of pollutants and linking those sources to specific water quality impacts on a highway district basis. Source identification is also tied to impervious surfaces and land uses.
For this permit term, MDE has defined the source identification effort as completing the description of the SHA storm drain and BMP system, submitting BMP data to MDE, and creating an impervious surface account.
Maryland SHA has successfully completed the GIS development of SHA storm drain systems within the nine Phase I MS4 counties, two Phase II counties, and three Phase II municipalities. Maryland SHA has initiated identification of SHA storm drain systems outside of the permit areas. We are utilizing advances in technology and software improvements to more effectively and efficiently collect and maintain data sets. These process improvements will enhance communication between offices regarding the goals and needs for NPDES.
C.1 Describe Storm Drain System
Requirements under this condition include:
a) Complete Source identification requirements by October 21, 2009;
b) Address source identification data compatibility issues with each jurisdiction where data are collected. Data shall be organized and stored in formats compatible for use by all governmental entities involved;
c) Continually update its source identification data for new projects and from data gathered during routine inspection and repair of its municipal separate storm sewer system; and
d) Submit an example of source identification for each jurisdiction where source identification is being compiled.
C.1.a Complete Source Identification
SHA completed the identification and GIS development for our storm drain systems and stormwater management facilities in 2008, well before the October 21, 2009 deadline. Our focus has shifted to updating our source identification information for the Phase I and II MS4 jurisdictions. We have also added in a similar protocol for tracking the same information in eleven additional counties and only exclude Garrett County at this time from these efforts. We are also preparing to update our current data structure to integrate new data standards provided in the final version 1.0 of MDE MS4 Geodatabase and documentation requirements in the Accounting for Stormwater Wasteload
Allocations and Impervious Acres Treated guidance published by MDE in August 2014. Information on source identification updates and updates to the data structure are included under section C.1.c, Update Source Identification Data.
C.1.b Data Compatibility
SHA continues to share information with other MS4 jurisdictions and MDE, specifically providing and acquiring data to support planning, management, and monitoring activities. The storm drain and restoration project data generated by SHA is deployed using the Esri geodatabase format in an ArcSDE enterprise environment. It is either natively compatible with other jurisdictions, or can be exported to Esri shapefile format. The current SHA geodatabase and data dictionary can be reviewed in Appendix A and on the included CD.
SHA has supported MDE efforts to update their NPDES data and reporting requirements by coordinating with their consultant, Maryland Environmental Services (MES), and providing our TMDL data standards, NPDES Standard Procedures, and geodatabase structure to them. Since MDE has released the MS4 geodatabase v1.0, SHA is adopting this structure and is working to standardize our data to ensure compliance.

10/21/2015 Maryland State Highway Administration 1-5 NPDES MS4 Phase I and II Annual Report
Geospatial Database Development
SHA has developed a geospatial database for our source identification and inspection data. This database will be expanded to include other components of the program as they are brought together and as we update our standard procedures and inspection manuals. All of the SHA MS4 data including source identification, SWM facility inspections, outfall screening, outfall inspections, and impervious area acre amounts are currently housed in the database.
A SHA-wide web-based application, known as Enterprise GIS (eGIS), was developed to display content themes for decision making purposes. Content themes allow the user to overlay datasets without extensive knowledge of the Esri tool sets. MS4 data has been included as a content theme in eGIS.
Google Earth is an alternative method to present and communicate storm drain asset information to parties outside of the SHA firewall. It provides a user-friendly framework for information to be communicated to SHA Districts and the consultant community through the distribution of KML and KMZ files that open directly in Google Earth (See Figure 1-3 below).
Figure 1-3: Google Earth Screenshot of SHA NPDES Data Uploaded as KML
Software Development
The 2010 Annual Report contains a description of the SHA GIS field software application developed for gathering data to populate the database. Software application updates are performed using available resources and employing new technological advances as needed. Table 1-1 represents the upgrade status.
Table 1-1: GIS Application Development
Phase of Development % Complete
SWM Program Module 100
SWM Facility Numbering Module (eGIS)
100
eGIS Integration 100
eGIS IDDE Module Initiated
SHA Data Development Procedures and
Standards
SHA has available standard procedures for data development, asset inspections, illicit discharge investigations and stormwater facility remediation. These are combined into the MD
SHA Stormwater NPDES Program Standard
Procedures Manual. This manual will be updated to include new geodatabase requirements, restoration asset management and updates to illicit discharge compliance procedures. The current manual includes the following chapters:
1. Introduction 2. Source Identification and Inventory 3. BMP Inspections 4. Storm Drain Outfall Inspection Program 5. Illicit Discharge Detection and Elimination
Procedures 6. BMP Assessment Guidelines for
Maintenance and Remediation 7. Rapid Assessment Guidelines for Outfall
Channels
A more recent addition to SHA standardized procedures for the NPDES program is the Maryland SHA Stormwater NPDES Program Data Management and Editing Tools Manual. This manual outlines the data management workflow, discusses office and field editing applications that are used to assist in data collection, and discusses the procedures and process for quality control of the stormwater database. SHA data managers and editors utilize the procedures outlined in the manual to manage data and GIS needs for the SHA MS4 stormwater program.

1-6 Maryland State Highway Administration 10/21/2015 NPDES MS4 Phase I and II Annual Report
C.1.c Update Source Identification Data
Since the initial source identification has been completed for all the NPDES MS4 Phase I and II counties, the permit activity requirement for this condition now focuses on updating the storm drain asset data.
Source identification updates are performed with the goal to meet the required three-year inspection cycle and we have improved our processes in order to meet this timeframe. Future updates have been scheduled to meet this goal once the maintenance and remediation efforts have been completed for SHA assets in a particular county. The process for performing GIS data updating has been revised and will be performed in four phases for each county.
• SWM Features- This phase includes verification, inspection, and updating data
attributes for existing SHA stormwater facilities
• IDDE Update – This phase includes the verification and inspection of all major and minor outfalls within SHA right-of-way to meet requirements of Illicit Discharge Detection and Elimination (IDDE).
• Data Quality - This additional step was recently added to the process due to the overall scale to the information. The phase includes quality control and assurance for the data set.
• New Feature Update- This phase includes the inputting, verification, and inspection of newly constructed SWM and drainage assets.
The schedule for initiation of these phases and future updates are specified in Table 1-2. The latest data collected is as follows:
Table 1-2: Source ID Schedule
Jurisdiction SWM Feature IDDE Update Data Quality Update New Feature Update
Anne Arundel County
July-16 August-14 November-14 December-14
Baltimore County July-16 February-12 February-15 May-15
City of Cambridge April-14 December-14 August-17 December-16
Carroll County July-16 March-12 July-15 July-15
Cecil County July-16 October-14 January-15 May-15
Charles County July-16 March-12 July-15 September-15
City of Cumberland September-14 January-15 September-17 May-17
Frederick County July-16 September-15 May-18 August-17
Harford County July-16 September-14 May-17 May-17
Howard County July-16 February-12 March-15 June-15
Montgomery County October-15 December-14 November-14 December-14
Prince George’s County
July-14 October-14 November-14 December-14
City of Salisbury April-14 December-14 August-17 December-16
Washington County July-16 April-12 April-15 June-15
Phase I
Anne Arundel County – Updated identifications of the separate storm water system and outfall and BMP inspections were completed during this reporting period and are included in this report.
Inspections within this county are underway and will be completed during spring 2016.
Baltimore County – Updated identifications of the separate storm water system and outfall and BMP inspections were completed in 2012.

10/21/2015 Maryland State Highway Administration 1-7 NPDES MS4 Phase I and II Annual Report
Inspections within this county are kicking off and will be completed during spring 2016.
Carroll County – Updated identifications of the separate storm water system and outfall and BMP inspections were completed in 2012.
Charles County – Updated identifications of the separate storm water system and outfall and BMP inspections were completed in 2012. Inspections within this county are kicking off and will be completed during spring 2016.
Frederick County – Updated identifications of the separate storm water system and outfall and BMP inspections were completed and included in the 2011 Report. Inspections within this county are kicking off and will be completed during spring 2016.
Harford County – Updated identifications of the separate storm water system and outfall and BMP inspections were completed and included in the 2011 Report. Inspections within this county were started in September 2015 and will be completed during early 2016.
Howard County – Updated identifications of the separate storm water system and outfall and BMP inspections were completed in 2012. Inspections within this county are kicking off and will be completed during spring 2016.
Montgomery County – Updated identifications of the separate storm water system and outfall and BMP inspections were included in the 2011 Report. IDDE screenings were completed in December 2014. Inspections within this county are underway and will be completed in October 2015.
Prince George’s County – Updated identifications of the separate storm water system and outfall and BMP inspections were completed during this reporting period and are included in this report. Inspections within this county were completed in October 2014.
Phase II
Cambridge, Cumberland and Salisbury Cities – This original inventory work was completed in 2014.
Cecil County – The GIS inventory of SHA storm drain, BMP and outfall information, and inspections in Cecil County was completed in 2008. Inspections within this county were completed in October 2014.
Washington County –The GIS inventory of SHA storm drain, BMP and outfall data and inspections in Washington County were completed in 2012.
C.2 Submit BMP Data
Database tables are included on the attached CD as noted in the Introduction.
C.3 Create Impervious Surface Account
This condition requires that SHA provide a detailed account of impervious surfaces owned by SHA and an account of those acres of impervious surface controlled by stormwater management, broken out by SHA engineering district. This account will be used to identify potential areas for implementing restoration activities.
We completed the impervious accounting requirement and the baseline accounting numbers were reflected in the 2010 report. Table 1-3 (on the following page) displays the baseline untreated impervious numbers for SHA by county and progress of the restoration based on the requirement for twenty-five restoration projects (permit condition G.1). Figure 1-4 (on the following page) provides a graphic illustration of the progress.
Our impervious accounting is currently being updated based on the August 2014 MDE NPDES Accounting Guidance. Restoration projects identified in this report as complying with the expired permit requirements will be placed in the baseline ‘treated’ accounting for the new permit term.

1-8 Maryland State Highway Administration 10/21/2015 NPDES MS4 Phase I and II Annual Report
Table 1-3: SHA Impervious Restoration Accounting by County
County
Baseline Total
Impervious
Baseline Untreated
Impervious (AC)
Baseline Treated
Impervious (AC)
Impervious Acres
Restored by Permit
Condition (AC)
Impervious Acres
Restored by Permit Condition
(%)
Adjusted Untreated
Impervious
(AC)
Total Impervious
Treated
(%)
Anne Arundel 3979 3096 883 67 2.2% 3029 23.9%
Baltimore 4140 3790 350 460 12.1% 3330 19.6%
Carroll 1312 1198 114 0 0% 1198 8.7%
Cecil 1189 1174 15 0 0% 1174 1.3%
Charles 1323 1156 167 2 0.2% 1154 12.8%
Frederick 2396 2091 305 2 0.1% 2089 12.8%
Harford 1665 1487 178 21 1.4% 1466 12.0%
Howard 2144 1729 415 15 0.9% 1714 20.1%
Montgomery 3686 3058 628 8 0.3% 3050 17.3%
Prince George’s 4535 4001 534 26 0.6% 3975 12.3%
Washington 2168 2073 95 0 0% 2073 4.4%
Totals 28,537 24,853 3,684 601 2% 24,252 15.0%
0%
10%
20%
30%
40%
50%
60%
70%
80%
90%
100%
Untreated Pre-2005 Treated Restored by Permit Condition
Figure 1-4: SHA Impervious Restoration Progress by County

10/21/2015 Maryland State Highway Administration 1-9 NPDES MS4 Phase I and II Annual Report
Impervious Layer Updates
The GIS spatial layer delineating and quantifying impervious surfaces owned and treated by SHA has been updated during the past reporting cycle. Over the past year, a number of adjustments were made to the impervious data to improve both the spatial and reporting accuracy. These efforts will continue as we finalize our impervious accounting under the new permit and include:
• Research has been performed to verify that only SHA roads are included in the data and to identify SHA owned roads that were not originally collected. Also, roadways discovered not to be owned by SHA were removed.
• Howard County data was updated using 2011 orthophotos to be consistent with data developed for SHA properties in the other Phase I counties.
• SHA-owned stormwater management facility data and associated drainage areas were updated. This allowed for a more precise assessment of treated and untreated impervious surfaces. Updates for drainage areas in Howard, Montgomery, Prince Georges and Anne Arundel counties are under development.
• The data was reviewed and corrected for any additional anomalies and automated tools were used to eliminate data overlaps and slivers.
During this reporting period, SHA has initiated updates in Anne Arundel, Howard, Montgomery and Prince George’s counties.
In accordance with the August 2014 MDE Accounting Guidance, SHA has initiated efforts to research documentation for existing stormwater facilities such as permits and stormwater reports. This information allows us to verify the impervious surfaces treated and quantify the amount and type of water quality treatment provided. The result will be updated numbers for pavement treated against which new baseline treatment requirements can be calculated for the next permit term.
Table 1-4 indicates the current status of impervious layer updates in each Phase I and II MS4 County.
Table 1-4: Impervious Layer Update Status
County Impervious Layer Update Status
Anne Arundel In Progress
Baltimore Complete
Carroll Complete
Cecil Complete
Charles Complete
Frederick Complete
Harford Complete
Howard In Progress
Montgomery In Progress
Prince George’s In Progress
Washington Complete

1-10 Maryland State Highway Administration 10/21/2015 NPDES MS4 Phase I and II Annual Report
D Discharge Characterization
SHA continues to research the impacts of various controls on highway stormwater runoff. Discharges to and from stormwater control measures (SCMs) and other treatment methods are measured and analyzed. Over the permit term, we have investigated several areas of concern including:
• Grass swales
• Thermal impacts
• Pollutant removal efficiencies
• Urban runoff
• Wet infiltration
• Bioretention soil
• Sand filters
• Outfall Stabilization
Typically, the pollutants measured include:
• pH
• Temperature
• Total suspended solids (TSS)
• Nutrients o Total phosphorus (TP) o Total Kjeldahl nitrogen (TKN) o Oxidized nitrogen
• Heavy metals (total) o Copper (Cu) o Lead (Pb) o Zinc (Zn)
• Chlorides
In some instances, other monitored parameters include oil, grease, petroleum, and other hydrocarbons; turbidity; and fecal coliforms.
To ensure consistency, test methods adhere to standards specified by Federal Regulations under CFR 136. Auto-samplers are used as much as possible since it is difficult to determine exactly when and where precipitation events will occur and to allow sufficient travel time to sampling locations..
The data from our research efforts and discharge characterization activities may be used towards new designs and evaluations of both existing and proposed SCMs. The information is also used to assess the effectiveness of current SWM asset
function and can inform future implementation strategies and long-term decisions..
Characterization of SHA highway runoff was completed in the previous permit term (1999 to 2004) and results were reported in the following documents.
Annual Report: Pindell School Road Storm
Sampling, KCI, March 7, 2000.
National Highway Runoff Study: Comparison to
MSHA Sampling Results, KCI, December 2001.
Dulaney Valley Road I-695 Interchange Stream
Monitoring at the Tributary to Hampton Branch,
KCI, Annual Reports dating 2000 to 2003.
Research activities that were completed during this permit term (2005-2010/15) and reported in previous annual reports include the following.
First Annual Report (October 2006):
Low Impact Development Implementation
Studies in Mt. Rainier, MD, University of Maryland, December 2005.
Grassed Swale Pollutant Removal Efficiency
Studies (Part II – MDE/SHA Swale
Comparison), University of Maryland, October 2006.
Mosquito Surveillance/Control Program for
SWM Facilities in Baltimore, Howard,
Montgomery and Prince Georges Counties
(2003-2005), Millersville University, October 2006.
Second Annual Report (October 2007):
Grassed Swale Pollutant Removal Efficiency
Studies (Part III – Grass Check Dams), University of Maryland, August 2007.
Literature Review: BMP Efficiencies for
Highway and Urban Stormwater Runoff,
Progress Report, University of Maryland, September 2007.
10/21/2015 Maryland State Highway Administration 1-11 NPDES MS4 Phase I and II Annual Report
Underground SWM Thermal Mitigation Studies,
Progress Report, University of Maryland, August 2007.
Prediction of Temperature at the Outlet of
Stormwater Sand Filters, Progress Report, University of Maryland, August 26, 2007.
Third Annual Report (October 2008):
Grassed Swale Pollutant Removal Efficiency
Studies: Field Evaluation of Hydrologic and
Water Quality Benefits of Grass Swales with
Check Dams for Managing Highway Runoff
(Part III continuation), Progress Report, University of Maryland, October 2008.
Thermal Impact of Underground Stormwater
Management Storage Facilities on Highway
Stormwater Runoff, Progress Report, University of Maryland, October 2008.
Fourth Annual Report (October 2009):
Field Evaluation of Water Quality Benefits of
Grass Swale for Managing Highway Runoff
(Part III – Grass Check Dams), Progress Report, University of Maryland, July 2009.
Nutrient Removal Optimization of Bioretention
Soil Media, Progress Report, University of Maryland, August 2009.
Field Evaluation of Wet Infiltration Basin
Transitional Performance, Progress Report, University of Maryland, August 2009.
Fifth Annual Report (January 2010):
Field Evaluation of Water Quality Benefits of
Grass Swale for Managing Highway Runoff, Progress Report, University of Maryland, July 2009.
Field Evaluation of Wet Infiltration Basin
Transitional Performance, Progress Report, University of Maryland, August 2009.
Nutrient Removal Optimization of Bioretention
Soil Media, Final Report, University of Maryland, September 2010.
Annual Report Update (October 2011):
Although there were no reports or findings that were included, new studies on enhancing nitrogen and phosphorus removal in existing and proposed SWM facilities were initiated and work on the field evaluation of wet infiltration basin transitional performance continued.
Annual Report Update (October 2012):
Field Evaluation of Wet Infiltration Basin
Transitional Performance, Progress Report, University of Maryland, July 2012.
Management of Nitrogen in Stormwater Runoff
Using a Modified Conventional Sand Filter, University of Maryland, August 2012.
Denitrification Optimization in Bioretention
Using Woodchips as a Primary Organic Carbon
Source, First Year Progress Report, University of Maryland, July 2012.
Annual Report Update (October 2013)
Final Report: Evaluation of Transitional
Performance of an Infiltration Basin Managing
Highway Runoff, University of Maryland, 2012
Final Report: Advanced Denitrification in
Bioretention Systems Using Woodchips as an
Organic Carbon Source, University of Maryland, 2013
Management of Nitrogen in Stormwater Runoff
Using a Modified Conventional Sand Filter and Enhancements for N and P Removal from
Stormwater Management Facilities for Multi-
Modal Transportation Infrastructure in
Maryland, University of Maryland, 2013
Multi-Criteria Plant Selection for Vegetated
Stormwater Control Measures, University of Maryland, 2013
Annual Report Update (October 2014)
Final Report: Recommendations for the State
Highway Administration on Stormwater Control
Measures and Research Efforts for Multimodal

1-12 Maryland State Highway Administration 10/21/2015 NPDES MS4 Phase I and II Annual Report
Transportation Infrastructure in Maryland that
Promote More Effective and Sustainable
Stormwater Runoff Management. University of Maryland, 2014
Final Report: Advanced Denitrification in
Bioretention Systems using Woodchips as an
Organic Carbon Source. University of Maryland, 2014
Ongoing Studies
Current research continues and progress is discussed below.
Management of Nitrogen in Stormwater
Runoff Using a Modified Conventional Sand
Filter
The surface sand filter is a common SWM facility type that was frequently used between 2003 and 2010. They continue to be a popular choice when conditions are appropriate for its use, such as the means of SWM for salt barn facilities. However, sand filters are not necessarily an optimal choice for reducing nutrient concentrations in stormwater runoff. Because of the number of sand filters in our asset inventory, and because we are interested in techniques to enhance existing facilities to increase nitrogen and phosphorus removal efficiencies, the University of Maryland has continued to examine ways in which nitrogen removal may be improved in sand filter facilities.
To reduce nitrogen loading, the proposed design divides the sand filter into three zones to promote ammonification, nitrification, and denitrification. Nitrification was observed to automatically occur during low nitrogen loadings and dry periods, without any modifications to sand filter design. However, to achieve adequate media contact time for key biological denitrification processes to occur, sorptive materials must be incorporated into the sand filter bed.
The first phase of the project focused on the selection of adsorbents to increase the uptake of ammonium. Clays, recycled materials, and sands were selected for study. The time
necessary for sorption to reach equilibrium with these materials was found to be 24 hours. However, due to the low sorption capacity and instability in the structure of clay agglomerates, testing of Georgia attapulgite and brown montmorillonite soils were abandoned. Sorption tests continued with California aluminosilicate (CA), crushed brick (BR), red montmorillonite (MR), and clinoptilolite zeolite (ZT). The sorption capacity of ZT was found to be the greatest of all adsorbents, followed by MR.
The second phase focused on small scale column studies for the sorption of ammonium to provide more comprehensive determinations on adsorbent performance. Based on the results, the column studies were expanded for further study in the third phase to better examine nitrification and sorption simultaneously to quantify the rate of nitrification and determine the optimum media thickness.
In the third phase, it was found that zeolite added to sand results in greater nitrogen removal. However, the presence of road salts, often a result of winter deicing operations, significantly impairs and eliminates the enhanced nitrogen removal capacity of the zeolite. Even without the presence of road salts, the enhancement only appears to be viable for about 18 months.
In the fourth phase, it was found that the media mix, depending on the additive used, may last from 5 to 108 months. This estimated value also depends on roadway deicing operations and the amount of chlorides released. It may also be possible for the media to regenerate itself depending on the viability and health of denitrifying biota living in the soil. A fifth phase was recommended, but we were unable to obtain funding to continue this study.
Enhancements for N and P Removal from
Stormwater Management Facilities for Multi-
Modal Transportation Infrastructure in
Maryland: Multi-Criteria Plant Selection for
Vegetated Stormwater Control Measures
The University of Maryland continues to examine vegetation selection used in bioretention and similarly-related vegetated SCMs (swales,

10/21/2015 Maryland State Highway Administration 1-13 NPDES MS4 Phase I and II Annual Report
bioswales, rain gardens, and planter boxes). While current criteria for plant selection are primarily based on survival, aesthetics and context, there may be facility performance benefits associated with specific plant species that may be quantified.
In the relationship between plants and soils, vegetation is known to help maintain soil porosity through root building and decay, promote nutrient extraction, and host beneficial microbial consortia in the rizosphere. However, we have found that during construction activities, successful vegetation establishment has also been a challenge, and we are concerned that this may also affect facility performance as well as aesthetic appeal and sustainability.
In phase one of the study, a full literature synthesis and review was completed and several
plant species were identified that appear to better remove nitrogen (and various forms thereof), phosphorus, hydrocarbons, and heavy metals. Vegetation appears to offer other benefits as well, such as providing habitats within SWM facilities along with shade, which may reduce thermal impacts to waterways. However, some vegetation may not meet expected aesthetic appeal. Specifically, it appears that Eutrochium (Joe Pye) species, Iris versicolor, Juncus effusus, and Panicum virgatum are very hardy and acceptable (see Figures 1-5 through 1-8.) Juncus
effusus tends to appear messy and may not be suitable for high-visibility areas. Panicum
virgatum may also get too tall and interfere with sight-distance. Species that appear to consistently fail to survive are Ilex verticillata (winterberry), Ilex glabra ‘shamrock’, and Onoclea sensibilis (sensitive fern)
Figure 1-5: Eupatorim dubium (Joe Pye Weed)
Figure 1-6: Iris versicolor (Blue Flag Iris)
Figure 1-7: Panicum virgatum (Switchgrass)
Figure 1-8: Juncus effusus (Soft Rush)
1-14 Maryland State Highway Administration 10/21/2015 NPDES MS4 Phase I and II Annual Report
The study continues its second phase, which was extended a few more months to complete the work. Examination of plant species will continue. The completion of a recommended plant list, and possibly a recommended plants-to-avoid list, is anticipated to be completed at the end of phase two.
Evaluation of Compost Addition to
Stormwater Control Measure Performance
To simultaneously achieve the goals of greater incorporation of recycled materials into our projects as well as facilitate meeting new requirements established by recent legislative mandates, research continues with the University of Maryland to examine how compost may be used in SWM facilities.
Laboratory experiments to identify compost leachate composition and concentrations were performed, along with some initial experiments to determine how the infiltration rate through filter media may change with variable compost concentrations that replace portions of the shredded hardwood bark amounts. A final report detailing findings and future research and study needs will ultimately be generated. Preliminary results indicate leachate in the forms of nitrogen and phosphorus occurs, particularly in compost derived from biosolids and manure.
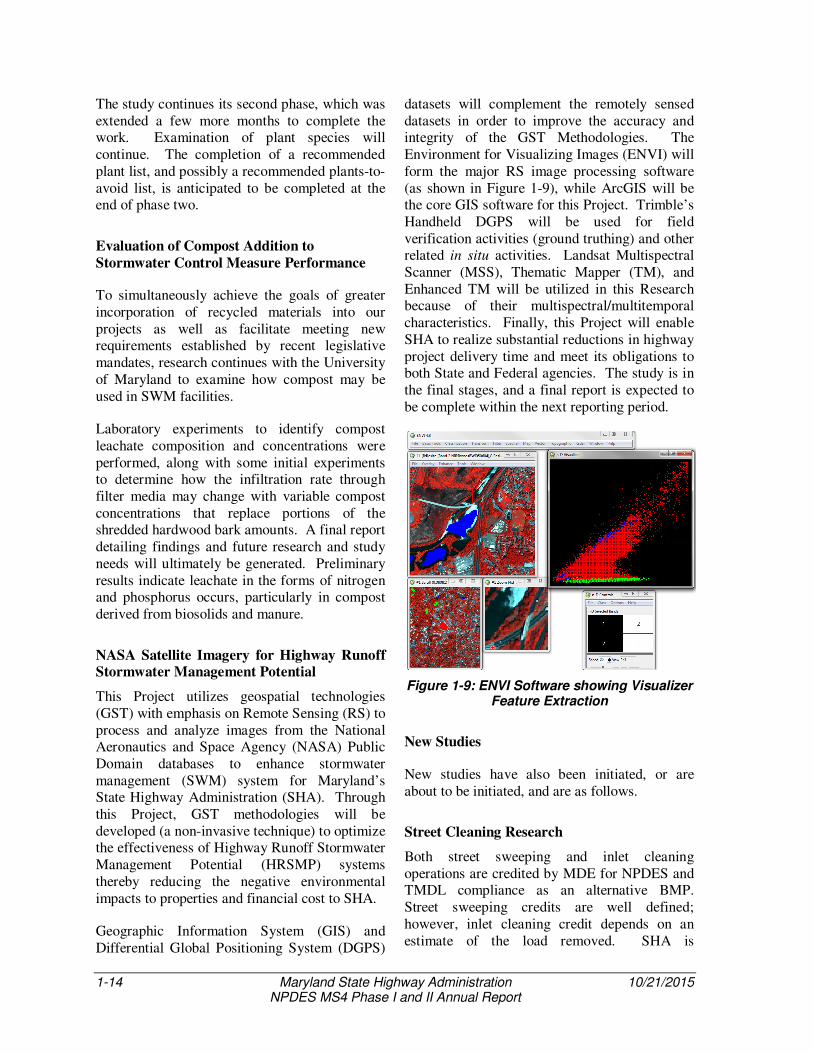
NASA Satellite Imagery for Highway Runoff
Stormwater Management Potential
This Project utilizes geospatial technologies (GST) with emphasis on Remote Sensing (RS) to process and analyze images from the National Aeronautics and Space Agency (NASA) Public Domain databases to enhance stormwater management (SWM) system for Maryland’s State Highway Administration (SHA). Through this Project, GST methodologies will be developed (a non-invasive technique) to optimize the effectiveness of Highway Runoff Stormwater Management Potential (HRSMP) systems thereby reducing the negative environmental impacts to properties and financial cost to SHA.
Geographic Information System (GIS) and Differential Global Positioning System (DGPS)
datasets will complement the remotely sensed datasets in order to improve the accuracy and integrity of the GST Methodologies. The Environment for Visualizing Images (ENVI) will form the major RS image processing software (as shown in Figure 1-9), while ArcGIS will be the core GIS software for this Project. Trimble’s Handheld DGPS will be used for field verification activities (ground truthing) and other related in situ activities. Landsat Multispectral Scanner (MSS), Thematic Mapper (TM), and Enhanced TM will be utilized in this Research because of their multispectral/multitemporal characteristics. Finally, this Project will enable SHA to realize substantial reductions in highway project delivery time and meet its obligations to both State and Federal agencies. The study is in the final stages, and a final report is expected to be complete within the next reporting period.
Figure 1-9: ENVI Software showing Visualizer Feature Extraction
New Studies
New studies have also been initiated, or are about to be initiated, and are as follows.
Street Cleaning Research
Both street sweeping and inlet cleaning operations are credited by MDE for NPDES and TMDL compliance as an alternative BMP. Street sweeping credits are well defined; however, inlet cleaning credit depends on an estimate of the load removed. SHA is

10/21/2015 Maryland State Highway Administration 1-15 NPDES MS4 Phase I and II Annual Report
undertaking an assessment of its operations to determine the appropriate level of credit from this practice and to collect information that could support enhancements to the existing credit allowed by MDE.
A prime challenge of meeting TMDL requirements is the mandate to quantify the pollutants captured and removed from inlets and road surface. Defining the composition of those captured solids is of major interest for SHA for compliance planning, implementation, and reporting. The results of this analysis will assess and recommend how SHA can optimize their inlet cleaning operations to maximize nutrient, sediment, and trash load reduction credits under MDE’s current MS4 Guidelines.
Outfall Stabilization Sediment Reduction
Credit Analysis
SHA is currently studying an alternative outfall credit protocol to more accurately predict TMDL credit for outfall restoration projects, and will be made available once complete. Outfall channels are first order channels with direct infrastructure interface. Previous studies found that a majority of material eroded from first order streams is not stored in the valley bottoms of second- to fifth-order streams. This indicates that the majority of sediment from outfall channels in the Chesapeake Bay watershed is transported into the Bay.
In order to quantify the amount of material that is available to erosion at an outfall site, methods provided in Stream Restoration Design NRCS
2007 for finding equilibrium bank and bed slope are used in conjunction with field data for base
level control and equilibrium bottom width. Together these data provide an approximate equilibrium condition that accounts for vertical and lateral erosion associated with outfall systems. Comparison between equilibrium and existing conditions provides a volume of material expected to be eroded and transported out of the outfall channel. This entire volume of material is adjusted by the bulk density and measured nutrient concentrations to determine the total reduction of pollutants provided by the outfall restoration project. In order to annualize the total reduction, two probable timeframes were evaluated based on engineering judgment of channel realignment.
As a case study the I-97 southbound Outfall Stabilization project is described, as seen in Figures 1-10 and 1-11 on the following page. This project is being designed by SHA-OED for TMDL crediting as part of their Capital Improvements projects. The I-97 outfall channel drains a 30 acre, 55% impervious watershed, and contains variable bank heights up to 21 ft consisting of primarily sand. Comparison between existing and equilibrium conditions indicates that 10,296 tons of material is expected to be eroded before the channel reaches equilibrium. Pollutant reductions using the alternative method are compared to the methods provided in CBP 2014 and the alternative method predicts eight times higher pollutant reduction on average than Protocol 1, assuming a 20 year timeframe. An imperious restoration equivalency that will allow the SHA to align outfall stabilization projects to the MS4 permit imperious restoration requirements is under development.

1-16 Maryland State Highway Administration 10/21/2015 NPDES MS4 Phase I and II Annual Report
Figure 1-10: Outfall in need of Stabilization, I-97 in Anne Arundel County
Figure 1-11: Stabilized Outfall, I-97 in Anne Arundel County
Bioretention Soil Assessment
This research activity would use some of these less successful bioswale sites as test plots to research various elements of bioswale design, including soil mixes, vegetation, and design criteria. The goal of the proposed study is to identify improvements that could reduce maintenance and improve pollutant removal for future bioswale sites.
The solutions will take into account the practical requirements of installation and long-term maintenance. The research results will be needed in order to determine how to restore or rehabilitate failed installations .
10/21/2015 Maryland State Highway Administration 1-17 NPDES MS4 Phase I and II Annual Report
E Management Program
A management program is required to limit the discharge of stormwater pollutants to the maximum extent practicable. The idea is to eliminate pollutants before they enter the waterways. This program includes provisions for environmental design, erosion and sediment control, stormwater management, industrial facility maintenance, illicit connection detection and elimination, and personnel and citizen education concerning stormwater and pollutant minimization.
E.1 Environmental Design Practices
This permit condition requires that SHA take necessary steps to minimize adverse impacts to the environment through the roadway planning, design, and construction process. Engaging the public in these processes is also required.
The Maryland State Highway Administration has a strong environmental commitment that has only increased as the new Stormwater Management Act of 2007 was implemented in May 2010. Through this legislation, emphasis was placed on the use of environmental site design (ESD) techniques. We are actively working ESD measures into roadway projects.
SHA also continues to adhere to processes that ensure that environmental and cultural resources are evaluated in the planning, design, construction and maintenance of our roadway network. This includes providing opportunity for public involvement and incorporating context sensitive solutions. We also ensure that all environmental permitting requirements are met by providing training to our personnel (see E.6.b on page 1-38) and creating and utilizing software to track permitting needs on projects as they move through the design, advertisement and construction processes.
NEPA/MEPA Process
SHA’s National Environmental Policy Act/ Maryland Environmental Policy Act (NEPA/MEPA) design and planning process, includes developing and obtaining approval on environmental documentation for any project
proposed utilizing state or federal funding. SHA also assists local jurisdictions through the environmental documentation process so they remain eligible to receive state/federal funds, such as Transportation Alternatives Program funds. An early step in the process is to identify the natural, community, and cultural resources that exist in the project study area and determine the level of environmental documentation and stakeholder involvement needed. The final environmental document may be a Categorical Exclusion (CE) for minor impacts, Finding of No Significant Impact (FONSI) for more substantial impacts, or Environmental Impact Statement (EIS) and Record of Decision (ROD) for major impacts or when significant stakeholder controversy surrounds the project.
Increasingly, SHA is evaluating stormwater needs during the NEPA process to address Environmental Site Design requirements. This movement requires that stormwater concepts be developed during the planning process, and has affected the development process in several ways. Beginning the stormwater process earlier allows more realistic concepts to be presented during public meetings and allows more accurate assessments of right-of-way needs. The drawback to this approach, however, can be that assumptions made in terms of the stormwater requirements may not be the final approved requirements as plans change during the design process. This can have negative impacts on the permit approval process, public expectations, right-of-way acquisitions, and design schedules. SHA encourages the stormwater regulatory reviewers to participate in the planning process by attending interagency meetings, reviewing concept plans, and providing valid comments and concept approvals at the planning stage of design. It should be noted, however, that the planning process for major projects and the project development timeline can be greater than cycles of regulatory changes for water quality. This further introduces complexity in decision making and public perception of accuracies of SHA projects and processes.

1-18 Maryland State Highway Administration 10/21/2015 NPDES MS4 Phase I and II Annual Report
Effort is made to avoid or minimize environmental impacts. If impacts are unavoidable, however, mitigation is provided and monitored per regulatory requirements.
E.2 Erosion and Sediment Control
Requirements under this condition include:
a) Use of MDE’s 2011 Standards and Specifications for Soil Erosion and Sediment Control, or any subsequent revisions, evaluate new products for erosion and sediment control, and assist MDE in developing new standards; and
b) Perform responsible personnel certification (‘Green Card’) classes to educate highway construction contractors regarding erosion and sediment control requirements and practices. Program activity shall be recorded on MDE’s “green card” database and submitted as required in Part IV of this permit.
E.2.a MDE ESC Standards
SHA continues to comply with Maryland State and Federal laws and regulations for erosion and sediment control (ESC) as well as MDE requirements for permitting. We maintain compliance with the NPDES Stormwater Construction Activity permit for projects that disturb one acre or more of land.
We continue compliance with the Maryland Erosion & Sediment Control Guidelines for State and Federal Projects published in January 1990 and revised in January 2004. In December 2011, MDE published the 2011 Maryland Standards and Specifications for Soil Erosion and Sediment Control. Projects are designed and constructed in compliance with the new specifications. SHA updated their Erosion and Sediment control field guide to support the 2011 MDE specifications. The laminated book version is used as a field tool where users have the option of writing (dry erase) notes in the book.
SHA has implemented changes to construction inspection practices to maintain compliance with the NPDES Construction Activity Permit by drafting a new evaluation form (QA-2) to
measure NPDES and Stormwater Management (SWM) requirements. We continue to submit applications for coverage under this general permit for all qualifying roadway projects.
SHA ESC Quality Assurance Ratings
SHA continues to use our improved Quality Assurance rating system for ESC on all roadway projects. This effort is designed to improve field implementation of ESC measures through a rating system (by issuing grades A – F) and by including incentive payments to the contractor for excellent ESC performance. Under this system, the contractor incurs liquidated damages for poor ESC performance.
SHA tracks quality assurance inspections and ratings for reporting to our business plan and StateStat. Increased numbers of inspections and better documentation have improved the overall performance of our ESC program. Incentive payments are made when the contractor receives an ESC rating score of 85% or greater over the course of each rating quarter (three months). A final incentive payment is also made for projects with an overall (average) rating of 85% or better.
On SHA design-build projects compensation for erosion and sediment response action related to severe weather is addressed by specification. This compensation is in addition to the incentive for excellent performance as stated above.
Liquidated damages are imposed on the contractor if the project receives a ‘D’ or ‘F’ rating. If two ratings of ‘F’ are received on a project, the ESC certification issued by SHA will be revoked from the contractor project superintendent and the ESC manager for a period of six months and upon successful completion of the certification training. This system of rewarding good performance and penalizing poor performance has shown to improve contractor responsibility for ESC practices. It has also improved water quality associated with earth disturbing and construction activities.
In FY 2015, a record number of inspections (4233) on a record number of projects (342)

10/21/2015 Maryland State Highway Administration 1-19 NPDES MS4 Phase I and II Annual Report
reviewed, yielded an overall compliance of 99.6 percent (See Figures 1-12 and 1-13).
In the past year, SHA prepared a revised standard form (OOC61/QA-1) – Independent Quality Assurance Erosion and Sediment Control Field Investigation Report used for ESC
and NPDES construction tracking in an effort to increase compliance with both State and Federal ESC regulations. This form is currently being used statewide.
Figure 1-12: Erosion and Sediment Control Reviews Performed for FY2015
Figure 1-13: Erosion and Sediment Control Quality Assurance for FY2015

1-20 Maryland State Highway Administration 10/21/2015 NPDES MS4 Phase I and II Annual Report
E.2.b Responsible Personnel Training for
Erosion and Sediment Control
(Green Card Certification)
MDE has developed a new training which is only available as an on line application.
SHA Basic Erosion and Sediment Control
Training (Yellow Card Certification)
SHA continues to present updated Erosion and Sediment Control training initiated in 2004. This Level I training is recommended for contractors and field personnel. It covers key requirements of the NPDES construction activity permit. Also covered are resources and personnel for construction projects, ESC specifications and inspections, process for ESC modifications during construction, stabilization, SWM and ESC/SWM plan review and approval Delegated Authority. This certification expires three years from the date of issuance. In FY2015, SHA updated and provided on-line training for Yellow Card (YC) and YC re-certification. Table 1-5 below details the number of personnel certified for each of the training levels for the reporting period.
Table 1-5: SHA ESC Training
Type of Training Number Certified
Responsible Personnel (Green Card)
0
Level I (Yellow Card)
516
Level I (Yellow Card
Recertification) 249
E.2.c Delegated Authority and the Quality
Assurance Toolkit
In February 2015, MDE approved delegation of ESC and SWM plan review and approval authority to SHA which includes inspection and compliance. In regards to compliance the SHA Quality Assurance Program (QAP) will perform inspections. The SHA QA toolkit was enhanced to track, sort and store ESC and
SWM compliance issues. A new revised OOC62/QA-3 form will require all modifications to ESC to be done electronically through the QA toolkit. With this standardization, increased compliance is expected. Quarterly Reports document SHA projects and compliance, and the most recent Quarterly Report is included in Appendix B.
E.3 Stormwater Management
The continuance of an effective stormwater management program is the emphasis of this permit condition. Requirements under this condition include:
a) Implement the stormwater management design principles, methods, and practices found in the 2000 Maryland Stormwater Design Manual, the 2009 update, and COMAR;
b) Implement a BMP inspection and maintenance program to inspect all stormwater management facilities at least once every three years and perform all routine maintenance (e.g., mowing, trash removal, tarring risers, etc.) within one year of the inspection; and
c) Document BMPs in need of significant maintenance work and prioritize these facilities for repair. The SHA shall provide in its annual reports detailed schedules for performing all significant BMP repair work.
E.3.a Implement SWM Design Manual
and Regulations
SHA continues to comply with Maryland State and Federal laws and regulations for stormwater management (SWM) as well as MDE requirements for permitting. We also continue to implement the practices found in the 2000 Maryland Stormwater Design
Manual and the Maryland Stormwater
Management and Erosion & Sediment Control
Guidelines for State and Federal Projects,
February 2015 for all projects. We have also implemented the requirements in the revised Chapter 5 of the 2000 Manual for Environmental Site Design (ESD) and the Stormwater Management Act of 2007 for all

10/21/2015 Maryland State Highway Administration 1-21 NPDES MS4 Phase I and II Annual Report
new projects. In the past year, SHA has been granted Delegated Authority for ESC and SWM plan review and approval, as discussed in Section E.2.c. To satisfy the requirements of SHA’s delegated review and approval authority, SHA submitted its First Quarterly Report to MDE covering the period February 24, 2015 through May 1, 2015 and is included in Appendix B.
E.3.b Implement BMP Inspection &
Maintenance Program
Our continuing Stormwater and Drainage Asset Program inspects, evaluates, maintains, remediates and enhances SHA BMP assets to maintain and improve water quality and protect sensitive water resources. Inspections are conducted on a cyclical basis as part of the NPDES source identification and update effort (see Section C, above). Maintenance and remediation efforts are accomplished after the inspection data has been evaluated and ranked according to SHA rating criteria.
Details of the Stormwater and Drainage Asset Program are included as Part 2 of this document. Discussion of inspection results and maintenance, remediation, retrofit and enhancement efforts undertaken over the past year is included in that section.
Stormwater As-Built Certification
Process
SHA continues to improve the SWM facility as-built certification process in order to comply with the SWM approval and COMAR. This process assures verification of proper construction of SWM facilities to meet the design intent. Throughout the construction process, the design engineer coordinates with the Office of Construction and the contractor to perform required inspections during construction and to document the information in the MDE approved as-built tabulations. The contactor’s engineer certifies the SWM facility was constructed according to the approved design plans and within allowed tolerances as stated in the SHA issued Special Provision included in the contract documents. SHA has
made the delivery of this certification a separate pay/bid item in the construction estimate.
The SHA project engineer coordinates with MDE on the review and approval of the as-built certified plan. The construction project cannot be closed and accepted for maintenance until the as-built plans have been accepted by MDE. Copies of the final approved as-built certifications are retained by SHA and integrated into the storm drain and BMP GIS/database. This information is then used as source identification updates.
E.3.c Document Significant BMP
Maintenance
See Part 2 for Stormwater and Drainage Asset Program updates on major maintenance, remediation and BMP retrofits.
E.4 Highway Maintenance
Requirements under this condition include:
a) Clean inlets and sweep streets;
b) Reduce the use of pesticides, herbicides, and fertilizers through the use of integrated pest management (IPM);
c) Manage winter weather deicing operations through continual improvement of materials and effective decision making;
d) Ensure that all SHA facilities identified by the Clean Water Act (CWA) as being industrial activities have NPDES industrial general permit coverage; and
e) Develop a “Statewide Shop Improvement Plan” for SHA vehicle maintenance facilities to address pollution prevention and treatment requirements.
E.4.a Inlet Cleaning and Street Sweeping
Mechanical sweeping of the roadway is essential in the collection and disposal of loose material, debris, and litter into approved landfills. This material, such as dirt and sand, collects along curbs and gutters, bridge parapets/curbs, inlets, and outlet pipes.

1-22 Maryland State Highway Administration 10/21/2015 NPDES MS4 Phase I and II Annual Report
Sweeping prevents buildup along sections of roadway and allows for the free flow of water from the highway, to enter into the highway drainage system. See Figure 1-14 below for an example of SHA’s street sweeping activity.
Figure 1-14: Street Sweeping often takes place at night due to high traffic volumes in
urbanized counties
The SHA desired maintenance condition is 95% of the traveled roadway clear of loose material or debris. In addition, 95% of closed section roadways (curb and gutter) should
have less than 1 inch depth of loose material, debris, or excessive vegetation that can capture debris, in the curb and gutter.
In addition to street sweeping, SHA owns and operates four vacuum pump trucks that routinely clean storm drain inlets along roadways. Sediment and trash make up the majority of the material that is removed. The vacuum trucks operate in central Maryland, spanning the following counties: Anne Arundel, Baltimore, Calvert, Carroll, Charles, Frederick, Harford, Howard, Montgomery, Prince Georges and St. Mary's. This practice ensures safer roadways through maintaining proper drainage and improves water quality in Maryland streams by removing captured sediment and trash before they enter adjacent waterways.
See Figures 1-15 (below) and 1-16 (following page) for examples of street vacuuming and inlet cleaning.
Figure 1-15: SHA Shop Personnel Operating Vacuum Truck to Clean Roadside Debris

10/21/2015 Maryland State Highway Administration 1-23 NPDES MS4 Phase I and II Annual Report
Figure 1-16: Inlet Before and After Vacuuming
Pollutant Reductions for Inlet Cleaning and
Street Sweeping
Sweeping and inlet cleaning are recognized as valid pollutant source reduction BMPs, however the means for crediting reductions is not well defined at this point. We are evaluating appropriate load reductions that can be claimed by SHA in meeting local and Bay TMDLs. This accounting will be added to reports for the next permit term.
The SHA Water Programs Division (WPD) is working with the SHA Office of Maintenance (OOM) to document current routes, to extend these activities to watershed-based, priority roadways and to characterize and quantify material and debris removed as a result of these activities. The result will be the development of procedures to optimize reporting of reductions associated with each of these activities and to better understand pollutant loads gathered from highways. It is hoped that this understanding will result in additional impervious surfaces treatment.
E.4.b Reduction of Pesticides, Herbicides
and Fertilizers
SHA has standards for maintaining the highway system and one of these standards is the SHA
Integrated Vegetation Management Manual for
Maryland Highways, October 2003 (IVMM).
This manual incorporates the major activities involved in the management of roadside vegetation including application of herbicides, mowing and the management of woody vegetation. In order to maximize the efficiency of funds and to protect the roadside environment, an integration of these activities is employed.
Herbicide Application
The majority of SHA’s vegetation management is accomplished mechanically, through the use of mowers and brush axes. However, in areas where mechanical control is not practical or feasible, SHA manages vegetation through the use of targeted applications of herbicide. Vegetation controlled by SHA includes noxious weeds, invasive weeds and plant material that is a safety hazard.
SHA promotes the safe and responsible use of herbicide for the control of vegetation. All SHA employees and contractors who apply herbicide on SHA rights-of-way must be registered with the Maryland Department of Agriculture (MDA) and operate under the supervision of a MDA-certified pesticide applicator.
Environmental stewardship is a primary focus of SHA’s business plan, and SHA uses selective herbicides when available and targeted application, rather than broad application of non-selective herbicides. SHA uses the lowest

1-24 Maryland State Highway Administration 10/21/2015 NPDES MS4 Phase I and II Annual Report
pressure and largest droplet size for each application. Along with the addition of anti-drift agents these measures reduce the potential for drift, runoff and non-point source contamination. The selection of herbicide is based on the plant species that is being targeted. This ensures the effects on other plants are minimized and soil residual activity is limited. Application rates are based on the label minimum amount required to control the targeted plant species, which further reduces the potential for runoff and non-point source contamination.
Herbicide application equipment is routinely inspected and calibrated to ensure that applications are accurately applied in accordance to the IVMM, Maryland State law, and the herbicide label.
Nutrient Management Plans
The Maryland Lawn Fertilizer Law limits the total amount and restricts the timing of fertilizer applications associated with turfgrass establishment and maintenance. SHA uses slow-release nitrogen fertilizers when establishing turf, meadows, and other vegetation. Topsoil is sampled and tested for major and minor plant nutrients, pH, organic matter, and soluble salts. The test results are used to develop a nutrient management plan (NMP) to ensure optimal nutrient levels and growing conditions, and to avoid the application of excess fertilizer.
Mowing Reduction & Native Vegetation
Establishment
A major initiative at the SHA is to reduce the extent of mowed areas within our right-of-way. SHA’s Turfgrass Management Policy has been revised to provide consistent guidance to decrease the size of mowed areas and the number of mowing cycles per year.
Several projects have been completed throughout the state to install and maintain reforestation and native meadow areas. Reforestation and native
meadow areas require no mowing, preserve native vegetation, and enhance erosion control and nutrient uptake.
E.4.c Winter Deicing Operations
SHA continues to test and evaluate new winter materials, equipment and strategies in an on-going effort to improve the level of service provided to motorists during winter storms while at the same time minimizing the impact of its operations on the environment.
One method employed to decrease the overall application of deicing materials is to increase application of deicing materials prior to and in the early stages of a winter storm (anti-icing). This prevents snow and ice from bonding to the surface of roads and bridges and ultimately leads to lower material usage at the conclusion of storm events, thus lessening the overall usage of deicers.
SHA is also piloting Liquid Only Snow Routes at one of its facilities. This operation is a designated snow route that only uses a critically measured salt brine solution to prevent the snow and ice from bonding to the pavement. Unlike anti-icing, which takes place prior to the event, this operation continues for the duration of the event and has proven to be quite effective. Data has shown that at an average application rate of 120 lbs / lane mile / inch exceeded not only our level of service metric by 17 percent but also help reduce that facility’s usage rate by 61 percent this past season.
In addition, SHA is continuing its ‘sensible salting’ training of State and hired equipment operators in an on-going effort to decrease the use of deicing materials without jeopardizing the safety and mobility of motorists during and after winter storms. Table 1-6 on the following page lists materials used by SHA in winter deicing operations.

10/21/2015 Maryland State Highway Administration 1-25 NPDES MS4 Phase I and II Annual Report
Table 1-6: SHA Deicing Materials
Material Characteristics
Sodium Chloride (Rock and Solar Salt)
The principle winter material used by SHA. Effective down to 20° F and is relatively inexpensive.
Abrasives These include sand and crushed stone and are used to increase traction for motorists during storms. Abrasives have no snow melting capability.
Calcium Chloride A solid (flake) winter material used during extremely cold winter storms. SHA uses limited amounts of calcium chloride.
GEOMELT 55
A de-sugared sugar beet molasses may be blended with the brine. Also known as "beet juice," this organic material lowers the freezing point of the brine to –30º F. The light brown material is environmentally safe and does not stain roadway surfaces
Salt Brine
Liquid sodium chloride or liquefied salt is a solution that can be used as an anti-icer on highways prior to the onset of storms, or as a deicer on highways during a storm. Used extensively by SHA. Freeze point of -6° F.
Magnesium Chloride (Mag)
A liquid winter material used by SHA for deicing operations in its northern and western counties. It has a freeze point of -26° F and has proven cost effective in colder regions.
New Road Salt Management
On May 20, 2010 the Governor approved Senate Bill 775, requiring SHA, in consultation with the Maryland Department of the Environment (MDE), to develop a best practices road salt management guidance document by October 2011. This document is necessary to reduce the adverse environmental impacts of road salt storage, application and disposal on Maryland’s water and land resources.
SHA posted the Statewide Salt Management Plan on its website in October 2011. The plan was subsequently updated on October 1, 2012. The plan provides guidance on snow and ice control operations with an emphasis on lessening the impact of salt on the environment. The plan covers all aspects of winter operations including:
• Safety and mobility of motorists during and after winter storms,
• Defining levels of service provided during winter storms,
• Establishing long-term goals to lessen the usage of salt, and reduce its impact on the environment,
• Salt and other winter materials,
• Material storage and handling,
• Winter storm fighting equipment,
• Training initiatives,
• Winter storm management from pre-storm preparations through post-storm operations,
• Post-storm material and equipment cleanup,
• Post-storm and post-season data analysis,
• Public education and outreach, and
• Testing and evaluation of new materials, equipment, and strategies for continual improvement.
Winter Operations Training
SHA Annual Snow College – This training is offered every fall for new maintenance shop hires as well as 20% of veteran shop forces. The goal is to train all maintenance personnel over a five year period and repeat the process. This
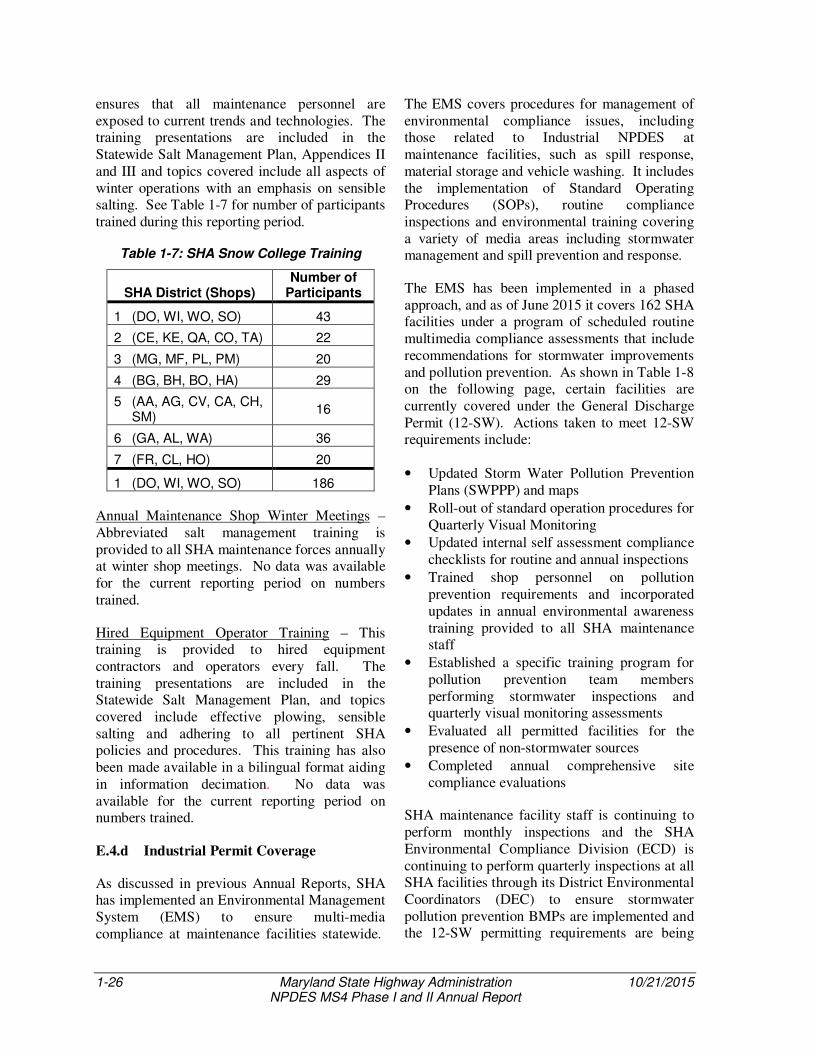
1-26 Maryland State Highway Administration 10/21/2015 NPDES MS4 Phase I and II Annual Report
ensures that all maintenance personnel are exposed to current trends and technologies. The training presentations are included in the Statewide Salt Management Plan, Appendices II and III and topics covered include all aspects of winter operations with an emphasis on sensible salting. See Table 1-7 for number of participants trained during this reporting period.
Table 1-7: SHA Snow College Training
SHA District (Shops) Number of
Participants
1 (DO, WI, WO, SO) 43
2 (CE, KE, QA, CO, TA) 22
3 (MG, MF, PL, PM) 20
4 (BG, BH, BO, HA) 29
5 (AA, AG, CV, CA, CH, SM)
16
6 (GA, AL, WA) 36
7 (FR, CL, HO) 20
1 (DO, WI, WO, SO) 186
Annual Maintenance Shop Winter Meetings – Abbreviated salt management training is provided to all SHA maintenance forces annually at winter shop meetings. No data was available for the current reporting period on numbers trained.
Hired Equipment Operator Training – This training is provided to hired equipment contractors and operators every fall. The training presentations are included in the Statewide Salt Management Plan, and topics covered include effective plowing, sensible salting and adhering to all pertinent SHA policies and procedures. This training has also been made available in a bilingual format aiding in information decimation. No data was available for the current reporting period on numbers trained.
E.4.d Industrial Permit Coverage
As discussed in previous Annual Reports, SHA has implemented an Environmental Management System (EMS) to ensure multi-media compliance at maintenance facilities statewide.
The EMS covers procedures for management of environmental compliance issues, including those related to Industrial NPDES at maintenance facilities, such as spill response, material storage and vehicle washing. It includes the implementation of Standard Operating Procedures (SOPs), routine compliance inspections and environmental training covering a variety of media areas including stormwater management and spill prevention and response.
The EMS has been implemented in a phased approach, and as of June 2015 it covers 162 SHA facilities under a program of scheduled routine multimedia compliance assessments that include recommendations for stormwater improvements and pollution prevention. As shown in Table 1-8 on the following page, certain facilities are currently covered under the General Discharge Permit (12-SW). Actions taken to meet 12-SW requirements include:
• Updated Storm Water Pollution Prevention Plans (SWPPP) and maps
• Roll-out of standard operation procedures for Quarterly Visual Monitoring
• Updated internal self assessment compliance checklists for routine and annual inspections
• Trained shop personnel on pollution prevention requirements and incorporated updates in annual environmental awareness training provided to all SHA maintenance staff
• Established a specific training program for pollution prevention team members performing stormwater inspections and quarterly visual monitoring assessments
• Evaluated all permitted facilities for the presence of non-stormwater sources
• Completed annual comprehensive site compliance evaluations
SHA maintenance facility staff is continuing to perform monthly inspections and the SHA Environmental Compliance Division (ECD) is continuing to perform quarterly inspections at all SHA facilities through its District Environmental Coordinators (DEC) to ensure stormwater pollution prevention BMPs are implemented and the 12-SW permitting requirements are being

10/21/2015 Maryland State Highway Administration 1-27 NPDES MS4 Phase I and II Annual Report
met. The DEC and facility staff are responsible for ensuring compliance with all applicable permits, plans and regulations at facilities in their region.
Table 1-8: Industrial NPDES Permit Status
District Maintenance
Facility Permit Type
1
Berlin General
Cambridge General
Princess Anne General
Salisbury General
Snow Hill General
2
Centreville Individual
– SW
Chestertown General
Denton General
Easton General
Elkton General
3
Fairland General
Gaithersburg General
Laurel General
Marlboro General
4
Churchville Individual
– SW
Golden Ring General
Hereford General
Owings Mills General
5
Annapolis General
Glen Burnie General
La Plata General
Leonardtown General
Prince Frederick General
Hanover Auto Shop General
6
Hagerstown General
Keyser’s Ridge Individual
– GW
District Maintenance
Facility Permit Type
La Vale General
Oakland General
7
Dayton General
Frederick General
Thurmont General
Westminster General
Notes: SW = Surface Water, GW = Groundwater
The SHA ECD also continues to encourage maintenance facilities to present funding requests for stormwater related improvements such as erosion stabilization, material storage improvements, and spill prevention/containment devices.
E.4.e Statewide Shop Improvement Plans
As described above, SHA continues to maintain an effective Industrial Stormwater NPDES Program through ECD to ensure pollution prevention and permit requirements are being met at SHA maintenance facilities. Annually, and as change dictates, SHA updates it’s combined Storm Water Pollution Prevention Plans (SWPPP)/ Spill Prevention, Control, and Countermeasure (SPCC) Plans. As a continuing best management practice SHA has developed SWPPPs for facilities not required to have one (e.g. salt storage facilities). Throughout the reporting year, SHA continued to address potential stormwater pollution issues by implementing Best Management Practices (BMPs) and designing/constructing capital improvements. BMPs were identified during pollution prevention plan updates and routine facilities inspections. The status of BMP implementation for maintenance facilities is tracked by each District Environmental Coordinator during routine inspections. Potential capital improvements are prioritized based on risk to human health and the environment and funding availability. The following list details the major pollution

1-28 Maryland State Highway Administration 10/21/2015 NPDES MS4 Phase I and II Annual Report
prevention efforts and maintenance facility improvements since the last annual report.
Completed Projects:
• 12-SW quarterly visual monitoring and annual comprehensive site compliance evaluations
• Update of all associated SWPPPs
• Standard Operating Procedure creation and updates to ensure compliance with 12-SW permit
• Updating existing and creation of a new training program to ensure compliance with 12-SW permit
• Petroleum storage tank system upgrades at various SHA maintenance facilities
• Vacuum Truck Dewatering Station (VTDS) construction at La Plata shop and Mt. Airy Salt Storage Facility
• OWS Upgrades at Princess Anne and Thurmont facilities
Ongoing Projects / Efforts:
• Statewide stockpile management assessment, planning, and design for new structural controls, including covered/roofed storage structures for erodible material
• Statewide brine secondary containment assessment
• Design and construction of new wash bays to ensure indoor vehicle washing
• Salt barn repair plan and development of on-call repair contracts
• Initial assessment reports and preliminary design completed for erosion issues noted at various facilities statewide
• Statewide discharge sampling and reporting program for facilities with Individual Discharge Permits
• Routine compliance inspections at all SHA facilities
• Annual multimedia compliance training provided to maintenance shop personnel
Table 1-9: Capital Expenditures for Pollution Prevention BMPs
Fiscal Year Expenditure
2005 $ 613,210 - actual
2006 $ 592,873 - actual
2007 $ 450,608 - actual
2008 $ 590,704 - actual
2009 $ 478,889 – actual
2010 $ 613,766 - actual
2011 $ 595,984 - actual
2012 $ 664,577 - actual
2013 $ 917,902 - actual
2014 $641,512 - actual
2015 $2,339,971 - actual
2016 $2,338,000 - projected
Table 1-9 above shows the SHA capital expenditures towards industrial pollution prevention BMPs from the current and past 11 fiscal years. Projected expenditures for Fiscal Year 16 are also included.
E.5 Illicit Discharge Detection and Elimination
Requirements under this condition include:
a) Conduct visual inspections of stormwater outfalls as part of its source identification and BMP inspection protocols
b) Document each outfall’s structural, environmental and functional attributes;
c) Investigate outfalls suspected of having illicit connections by using storm drain maps, chemical screening, dye testing, and other viable means;
d) Use appropriate enforcement procedures for eliminating illicit connections or refer violators to MDE for enforcement and permitting.
e) Coordinate with surrounding jurisdictions when illicit connections originate from beyond SHA’s rights-of-way; and

10/21/2015 Maryland State Highway Administration 1-29 NPDES MS4 Phase I and II Annual Report
f) Annually report illicit discharge detection and elimination activities as specified in Part IV of this permit. Annual reports shall include any requests and accompanying justifications for proposed modifications to the detection and elimination program.
E.5.a Visual Inspections and
Remediation of Outfalls
The SHA Storm Drain and Outfall Inspection and Remediation Program (SOIRP) has seen an expansion from the original focus on the physical conditions and structural functionality of NPDES defined major outfalls (which were documented using Chapter 4 of the SHA NPDES
Standard Procedures) to performing comprehensive inspections of all SHA pipe outfalls. This expansion was initiated in an effort to locate and eliminate significant sources of pollution within the SHA highway drainage systems as well as address issues with degraded drainage infrastructure. In addition to assessing the current structural condition of the pipe and outfall structure, the inspections also identify eroded downstream channels that are contributing to the pollution of Maryland’s waterways and the Bay, with the intent to restore these sites to reduce the pollutant loads.
The outfall channel assessment criteria has been incorporated into the SOIRP through programmatic outfall inspections and assessment protocols and included in Chapter 8, Rapid
Assessment Guidelines for Outfall Channels. This approach has been developed to assess outfall stability through various highway corridors, to identify and prioritize restoration and stabilization projects as well as locate opportunities for water quality improvement projects. This protocol describes the standard data collection and documentation required for performing outfall channel assessments and is used in conjunction with Chapter 4 by targeting unstable outfalls with poor ratings for further assessment for remediation.
SHA incorporated the outfall assessment protocol into county-wide MS4 inspections and will continue assessment of outfalls and outfall
channels in the cyclical inspections statewide. In addition, corridor wide pipe video inspection will be added to the assessments to collect additional information required for comprehensive performance assessment and project prioritization. The record management system is currently under development with the intent to include the collected data within the structure of the SHA NPDES Geodatabase.
Outfall channel inspections have been completed along twenty four SHA road corridors within the following MS4 Phase I and II Permit counties:
Anne Arundel County (6 corridors)
MD 2, MD 3, MD 4, I097, MD 32, MD 10
Baltimore County (4 corridors)
I-83, MD 151, I-70, US 40
Cecil County (1 corridor)
US 40
Harford County (1 corridor) MD 24
Howard County (3 corridors)
MD 32, US 40, MD 100
Montgomery County (2 corridors)
MD 119, MD 97
Prince Georges County (7 corridors)
I-495, MD 210, US 301, MD 5, MD 4, MD 214, MD 202
SHA is taking a proactive approach to address failing infrastructure issues to prevent emergency repair situations. The results of these investigations and assessments have been evaluated, outfall stabilization needs have been systematically prioritized and design projects initiated. SHA has procured design of twenty-five outfalls that are currently under construction or have been completed and continues designing and permitting an additional seventy-four outfalls as listed on the following page in Table
1-10 starting on the following page.
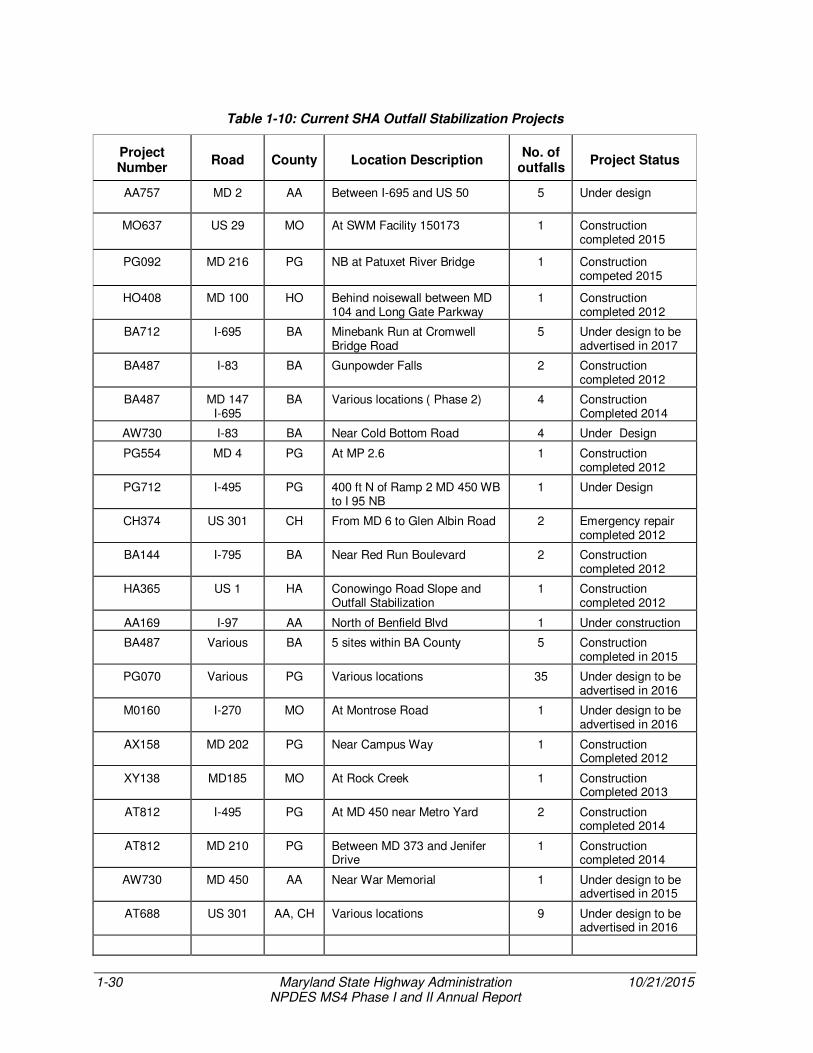
1-30 Maryland State Highway Administration 10/21/2015 NPDES MS4 Phase I and II Annual Report
Table 1-10: Current SHA Outfall Stabilization Projects
Project Number
Road County Location Description No. of
outfalls Project Status
AA757 MD 2 AA Between I-695 and US 50 5 Under design
MO637 US 29 MO At SWM Facility 150173 1 Construction completed 2015
PG092 MD 216 PG NB at Patuxet River Bridge 1 Construction competed 2015
HO408 MD 100 HO Behind noisewall between MD 104 and Long Gate Parkway
1 Construction completed 2012
BA712 I-695 BA Minebank Run at Cromwell Bridge Road
5 Under design to be advertised in 2017
BA487 I-83 BA Gunpowder Falls 2 Construction completed 2012
BA487 MD 147 I-695
BA Various locations ( Phase 2) 4 Construction Completed 2014
AW730 I-83 BA Near Cold Bottom Road 4 Under Design
PG554 MD 4 PG At MP 2.6 1 Construction completed 2012
PG712 I-495 PG 400 ft N of Ramp 2 MD 450 WB to I 95 NB
1 Under Design
CH374 US 301 CH From MD 6 to Glen Albin Road 2 Emergency repair completed 2012
BA144 I-795 BA Near Red Run Boulevard 2 Construction completed 2012
HA365 US 1 HA Conowingo Road Slope and Outfall Stabilization
1 Construction completed 2012
AA169 I-97 AA North of Benfield Blvd 1 Under construction
BA487 Various BA 5 sites within BA County 5 Construction completed in 2015
PG070 Various PG Various locations 35 Under design to be advertised in 2016
M0160 I-270 MO At Montrose Road 1 Under design to be advertised in 2016
AX158 MD 202 PG Near Campus Way 1 Construction Completed 2012
XY138 MD185 MO At Rock Creek 1 Construction Completed 2013
AT812 I-495 PG At MD 450 near Metro Yard 2 Construction completed 2014
AT812 MD 210 PG Between MD 373 and Jenifer Drive
1 Construction completed 2014
AW730 MD 450 AA Near War Memorial 1 Under design to be advertised in 2015
AT688 US 301 AA, CH Various locations 9 Under design to be advertised in 2016

10/21/2015 Maryland State Highway Administration 1-31 NPDES MS4 Phase I and II Annual Report
Project Number
Road County Location Description No. of
outfalls Project Status
CE403 MD 272 CE N. of Rogues Harbor Road 1 Under design to be advertised in 2016
AA757 MD 2 AA Between I-695 and US 50 5 Under design
MO637 US 29 MO At SWM Facility 150173 1 Construction completed 2015
PG092 MD 216 PG NB at Patuxet River Bridge 1 Construction competed 2015
HO408 MD 100 HO Behind noisewall between MD 104 and Long Gate Parkway
1 Construction completed 2012
BA712 I-695 BA Minebank Run at Cromwell Bridge Road
5 Under design to be advertised in 2017
BA487 I-83 BA Gunpowder Falls 2 Construction completed 2012
BA487 MD 147 I-695
BA Various locations ( Phase 2) 4 Construction Completed 2014
AW730 I-83 BA Near Cold Bottom Road 4 Under Design
PG554 MD 4 PG At MP 2.6 1 Construction completed 2012
PG712 I-495 PG 400 ft N of Ramp 2 MD 450 WB to I 95 NB
1 Under Design
CH374 US 301 CH From MD 6 to Glen Albin Road 2 Emergency repair completed 2012
BA144 I-795 BA Near Red Run Boulevard 2 Construction completed 2012
HA365 US 1 HA Conowingo Road Slope and Outfall Stabilization
1 Construction completed 2012
AA169 I-97 AA North of Benfield Blvd 1 Under construction
BA487 Various BA 5 sites within BA County 5 Construction completed in 2015
PG070 Various PG Various locations 35 Under design to be advertised in 2016
M0160 I-270 MO At Montrose Road 1 Under design to be advertised in 2016
AX158 MD 202 PG Near Campus Way 1 Construction Completed 2012
XY138 MD185 MO At Rock Creek 1 Construction Completed 2013

1-32 Maryland State Highway Administration 10/21/2015 NPDES MS4 Phase I and II Annual Report
Project Number
Road County Location Description No. of
outfalls Project Status
AT812 I-495 PG At MD 450 near Metro Yard 2 Construction completed 2014
AT812 MD 210 PG Between MD 373 and Jenifer Drive
1 Construction completed 2014
AW730 MD 450 AA Near War Memorial 1 Under design to be advertised in 2015
AT688 US 301 AA, CH Various locations 9 Under design to be advertised in 2016
CE403 MD 272 CE N. of Rogues Harbor Road 1 Under design to be advertised in 2016
HA356 AW HA Various locations 11 Under design to be constructed in 2016
SHA continues to undertake projects related to outfall channel stabilization with drainage system improvements. The goal of these improvements is to protect receiving streams, improve the water quality within the watershed, restore failing drainage infrastructure and extend the drainage asset’s service life. Less complex or urgent sites are addressed with open end construction contracts after the design plan is developed and permits have been obtained. This is one of the innovative contracting mechanisms that
allow SHA to efficiently deliver projects of an urgent nature such as emergency repairs. SHA typically manages three or four area wide contracts for drainage and stormwater asset remediation with annual expenditures of $5-$7 million. Examples projects constructed using these contracts are outfalls at I-270 in Montgomery County and Swan Creek stream stabilization in Harford County as shown in Figures 1-17 below and 1-18 on the following page.
Figure 1-17: Outfall Remediation at I-270 in Montgomery County
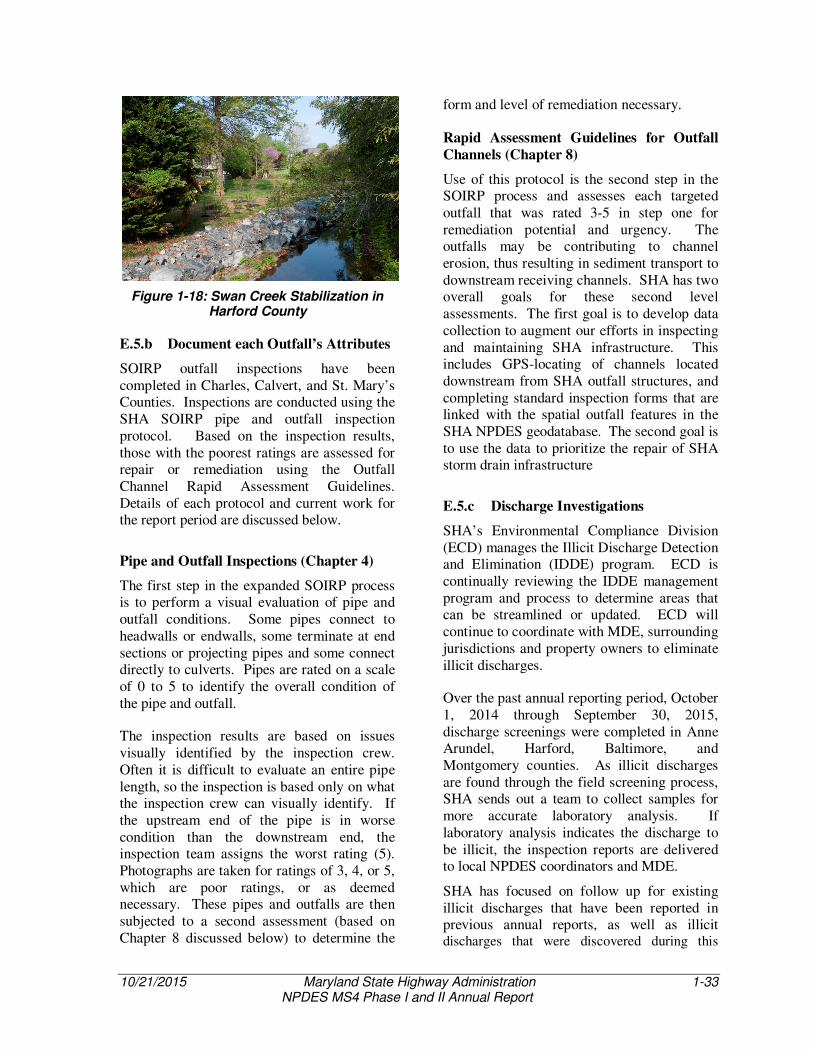
10/21/2015 Maryland State Highway Administration 1-33 NPDES MS4 Phase I and II Annual Report
Figure 1-18: Swan Creek Stabilization in Harford County
E.5.b Document each Outfall’s Attributes
SOIRP outfall inspections have been completed in Charles, Calvert, and St. Mary’s Counties. Inspections are conducted using the SHA SOIRP pipe and outfall inspection protocol. Based on the inspection results, those with the poorest ratings are assessed for repair or remediation using the Outfall Channel Rapid Assessment Guidelines. Details of each protocol and current work for the report period are discussed below.
Pipe and Outfall Inspections (Chapter 4)
The first step in the expanded SOIRP process is to perform a visual evaluation of pipe and outfall conditions. Some pipes connect to headwalls or endwalls, some terminate at end sections or projecting pipes and some connect directly to culverts. Pipes are rated on a scale of 0 to 5 to identify the overall condition of the pipe and outfall.
The inspection results are based on issues visually identified by the inspection crew. Often it is difficult to evaluate an entire pipe length, so the inspection is based only on what the inspection crew can visually identify. If the upstream end of the pipe is in worse condition than the downstream end, the inspection team assigns the worst rating (5). Photographs are taken for ratings of 3, 4, or 5, which are poor ratings, or as deemed necessary. These pipes and outfalls are then subjected to a second assessment (based on Chapter 8 discussed below) to determine the
form and level of remediation necessary.
Rapid Assessment Guidelines for Outfall
Channels (Chapter 8)
Use of this protocol is the second step in the SOIRP process and assesses each targeted outfall that was rated 3-5 in step one for remediation potential and urgency. The outfalls may be contributing to channel erosion, thus resulting in sediment transport to downstream receiving channels. SHA has two overall goals for these second level assessments. The first goal is to develop data collection to augment our efforts in inspecting and maintaining SHA infrastructure. This includes GPS-locating of channels located downstream from SHA outfall structures, and completing standard inspection forms that are linked with the spatial outfall features in the SHA NPDES geodatabase. The second goal is to use the data to prioritize the repair of SHA storm drain infrastructure
E.5.c Discharge Investigations
SHA’s Environmental Compliance Division (ECD) manages the Illicit Discharge Detection and Elimination (IDDE) program. ECD is continually reviewing the IDDE management program and process to determine areas that can be streamlined or updated. ECD will continue to coordinate with MDE, surrounding jurisdictions and property owners to eliminate illicit discharges.
Over the past annual reporting period, October 1, 2014 through September 30, 2015, discharge screenings were completed in Anne Arundel, Harford, Baltimore, and Montgomery counties. As illicit discharges are found through the field screening process, SHA sends out a team to collect samples for more accurate laboratory analysis. If laboratory analysis indicates the discharge to be illicit, the inspection reports are delivered to local NPDES coordinators and MDE.
SHA has focused on follow up for existing illicit discharges that have been reported in previous annual reports, as well as illicit discharges that were discovered during this

1-34 Maryland State Highway Administration 10/21/2015 NPDES MS4 Phase I and II Annual Report
reporting period. Maryland Environmental Service (MES) is contracted to revisit both previously identified and recently reported illicit discharges to confirm an illicit discharge is still occurring and collect a sample for laboratory analysis. Those discharges determined to be illicit will then follow the elimination process.
During this reporting period, it was determined that out of the 133 outfalls screened, 42 had a discernible dry-weather flow and were sampled. One new identified illicit discharge required additional follow-up to be eliminated. Table 1-11 below summarizes past and present illicit discharges.
In addition, MES also performs on-call inspections of potential illicit discharges that are reported by SHA field staff or the public. SHA continues to remain committed to detecting and eliminating illicit discharges throughout our system.
Table 1-11: Discharges Investigated from February 2001 to Date
County Discharges Field
Sampled
Illicit Discharges requiring follow-up
Anne Arundel
6 0
Baltimore 13 0
Carroll 22 0
Cecil 7 0
Charles 7 0
Frederick 16 0
Howard 19 0
Montgomery 107 0
Harford 6 1
Totals 203 1
E.5.d Use Appropriate Enforcement
Procedures
Currently, SHA notifies MDE and the appropriate county NPDES coordinator, or their IDDE designee, when illicit discharges to SHA storm drain system are discovered. In order to achieve better elimination results and increase public awareness of the issue, SHA has implemented a process to notify property owners that are determined to be the origin of the illicit discharge as discussed in the previous Annual Report. Educational materials on non-stormwater discharges and MS4 permits are included with the initial notification. SHA continues to work with local jurisdictions and MDE to eliminate illicit discharges. If attempts to eliminate the discharge fail after working with the local jurisdiction and MDE/WMA, then MDE has the option of coordinating with the State Office of Attorney General (OAG) Environmental Crimes Unit (ECU) to resolve the illicit discharge.
E.5.f Annually Report Illicit Discharge
Detection and Elimination
Activities
Over the reporting period, outfalls were screened in four Phase I counties for illicit discharges including Montgomery, Harford; Baltimore; and Anne Arundel. The geodatabase containing this data is included on the attached CD. During the reporting year, a total of twelve discharges were closed out. Two discharges were determined to not have dry weather flow; five discharges were sent for laboratory analysis and identifying parameters were within acceptable limits; four discharges were eliminated by property owners, and one discharge was determined not to be in SHA right-of-way.
Table 1-12 below shows information for the one remaining illicit discharge requiring follow-up. SHA is currently coordinating with MDE to address the open illicit discharge.
Table 1-12: Illicit Discharge Requiring Follow-up
Number County SHA-Structure # Date Identified Potential Pollutant
1 Harford 1202700.001 04/22/2014 Detergents

10/21/2015 Maryland State Highway Administration 1-35 NPDES MS4 Phase I and II Annual Report
E.6 Environmental Stewardship
Requirements under this condition include:
a) Environmental Stewardship by Motorists
i) Provide stream, river, lake, and estuary name signs and environmental stewardship messages where appropriate and safe,
ii) Create opportunities for volunteer roadside litter control and native tree plantings; and
iii) Promote combined vehicle trips, ozone alerts, fueling after dark, mass transit and other pollution reduction actions for motorist participation.
b) Environmental Stewardship by Employees
i) Provide classes regarding stormwater management and erosion and sediment control;
ii) Participate in field trips that demonstrate links between highway runoff and stream, river, and Chesapeake Bay health;
iii) Provide an environmental awareness training module for all areas of SHA;
iv) Provide pollution prevention training for vehicle maintenance shop personnel;
v) Ensure Integrated Pest Management instruction and certification by the Maryland Department of Agriculture for personnel responsible for roadside vegetation maintenance; and
vi) Promote pollution prevention by SHA employees by encouraging combined vehicle trips, carpooling, mass transit, and compressed work weeks.
E.6.a Environmental Stewardship by
Motorists
SHA continues many initiatives that encourage or target public involvement and participation in water quality programs. These initiatives cover the areas of litter control, watershed partnerships, community planting efforts and public education.
SHA public involvement and participation initiatives for the past year include:
Annual Earth Day Celebration – To commemorate this year’s Annual Earth Day celebration, the SHA Earth Day Team sponsored two Lunch and Learn sessions to promote environmental awareness and stewardship. The Learning Sessions were held at SHA Headquarters in May 2015. A presentation was given by a DNR biologist on a rare freshwater mussel in Deer Creek in Rocks State Park. The mussels were relocated upstream to avoid impacts from a stream bank stabilization project. See Figure 1-19 below.
Figure 1-19 - Tagged rare freshwater mussels during relocation in Harford County
Also, a session titled “Landscape 411” provided an opportunity for employees to ask one-on-one design and plant guidance questions from landscape architects, biologists, and foresters from the Office of Environmental Design. This was very popular, and will likely be repeated in the future. As in previous years, a service project to enhance the plantings at the entrances to the SHA Headquarters drew many volunteers. For some who had not participated before, it was a learning experience, and it was enjoyable for all who contributed their time to improve the environment. See Figure 1-20 on the following page for a view of finished landscaped areas.

1-36 Maryland State Highway Administration 10/21/2015 NPDES MS4 Phase I and II Annual Report
Figure 1-20 – Example of Volunteer Landscaping Results at SHA Headquarters
Adopt-a-Highway Program
The Adopt-a-Highway (AAH) program encourages volunteer groups (family, business, school, or civic organizations) to pick up litter along one to three mile stretches of non-interstate roadways four times a year for a two year period as a community service. Table 1-13 identifies the participation for the AAH program over the current reporting period, and Figure 1-21 below shows a volunteer group working in Baltimore County along MD 45.
Table 1-13: Adopt-a-Highway Program
Jurisdiction Groups # Bags Miles
Adopted
Anne Arundel 8 161 7.12
Baltimore 53 697 57.71
Carroll 15 93 16.14
Cecil 24 342 26.16
Charles 17 168 18.09
Frederick 15 146 15.65
Harford 18 213 18.61
Howard 0 0 0
Montgomery 6 43 6.15
Prince
George’s 0 0 0
Washington 20 198 22.01
Cumberland,
Cambridge,
Salisbury
0 0 0
Totals 176 2061 186.74
Data extracted from the Adopt-A-Highway database
for the period 9/11/2014 to 8/12/2015
Figure 1-21: Adopt-A-Highway Volunteers along MD 45 in Baltimore County

10/21/2015 Maryland State Highway Administration 1-37 NPDES MS4 Phase I and II Annual Report
Sponsor-a-Highway Program
SHA also has a program that allows corporate sponsors to sponsor one-mile sections of Maryland roadways. Table 1-14 shows the miles currently being sponsored. The Sponsor enters into an agreement with a maintenance provider for litter removal from the sponsored highway segment.
Table 1-14: Sponsor-a-Highway Program
Jurisdiction
Available
Miles
Miles
Sponsored
Anne Arundel 62.23 68.58
Baltimore 11.53 92.40
Carroll 0 0
Cecil 0 0
Charles 21.64 3.80
Frederick 12.19 9.99
Harford 6.99 2.43
Howard 19.02 30.96
Montgomery 6.94 43.75
Prince
George’s 50.66 58.09
Washington 12.91 4.05
Cumberland,
Cambridge,
Salisbury
0 0
Totals 204.11 314.05
Data extracted from the Sponsor-A-
Highway database for the period 9/11/2014
to 08/12/2015.
Partnership Planting Program
SHA develops partnerships with local governments, community organizations, and garden clubs for the purpose of beautifying highways and improving the environment. Community gateway plantings, reforestation plantings, streetscapes, and highway beautification plantings are examples of the types of projects that have been completed within the Partnership Planting Program. Table 1-15 lists the number of plants, counties, and numbers of volunteers for the last reporting period. See Figure 1-22 for an example.
Figure 1-22: Cecil County Partnership Planting Project at MD 213
Table 1-15: Partnership Planting Program
NPDES County or
Municipality
Number of Plants
Number of Volunteers
Anne Arundel Baltimore Cambridge Carroll
Cecil
154 Shrubs and
Perennials 25
Charles Cumberland Frederick 25 shrubs 12 Harford
Howard
50 Trees, 50 Shrubs and 3300 Bulbs
16
Montgomery Prince George’s
Salisbury Washington Data extracted from the Partnership Planting Program database for the period 10/01/2014 to 09/30/2015
Maryland Quality Initiative (MdQI) 2015
Conference: ‘Continuous Quality
Improvement by Maryland’s Transportation
Industry’
The mission of MdQI is to provide the Maryland transportation industry a forum that fosters coordinated and continuous quality improvement

1-38 Maryland State Highway Administration 10/21/2015 NPDES MS4 Phase I and II Annual Report
in order to ensure safe, efficient, and environmentally sensitive transportation networks to meet the needs of all transportation stakeholders. This industry conference is held annually each winter and brings together public and private design and construction industry professionals in a forum of workshops, round table discussions, exhibits, and networking. The 22nd Annual Conference was held February 4 and 5, 2015 at the Baltimore Convention Center. SHA presented a session focused on NPDES related issues titled Changes in SHA
Environmental Business: This session reviewed SHA’s new programs for the TMDL Program, delegated permit review authority, and stormwater management and erosion and sediment control reviews.
Storm Drain Stenciling
SHA supported the Howard County Watershed Stewards Academy (WSA) who initiated a storm drain stenciling program in collaboration with local Boy Scout organizations. The goal of the project was to educate middle school-aged students about sources of stormwater pollution, provide them with information to help solve stormwater pollution problems, and reduce polluted runoff into the Chesapeake Bay. The first storm drain stenciling occurred at the Scaggsville Park and Ride off of MD 216 in Howard County. The stencil designs were developed by local Boy Scout Troops for competition with SHA staff serving as one of the judges. The winning designs were applied to the storm drains at the the Park and Ride to help raise awareness of the general public about water quality issues within our communities, the adverse impacts of urban pollutions to the water resources and potential stewardship measures. Figures 1-23 and 1-24 show stenciled inlets painted by local Boy Scout volunteers.
Figure 1-23: Volunteer Boy Scouts Stenciling Storm Drains and Rain Barrels
Figure 1-24: Finished Stencil Design on Storm Drain
E.6.b Environmental Stewardship by
Employees
SHA continues to provide environmental awareness training to its personnel and is committed to continuing these efforts in the future. We have provided updated data for these efforts through the following training and awareness programs listed below:
District Coordination Meetings
In the past year, representatives from SHA’s Water Programs Division reached out to various District Offices across the State to discuss watershed restoration initiatives. These meetings occurred from January through April in district offices responsible for efforts within MS4 counties, including Districts 3, 4, 5, 6, and 7. The purpose of these meetings were to introduce the newly established Water Programs Division,

10/21/2015 Maryland State Highway Administration 1-39 NPDES MS4 Phase I and II Annual Report
provide a review of the Chesapeake Bay TMDL and MS4 regulatory requirements, discuss trash reduction strategies, review watershed restoration goals, and discuss local watershed restoration projects. These meetings also served as a venue to discuss project issues and increase collaboration between the districts and Water Programs Division. This is particularly important
as projects move forward to ensure districts are aware of the program goals, assist with site selection efforts, review project submissions, and respond to public inquiries related to SHA’s watershed restoration efforts. See Figure 1-25 for an excerpt of the presentation to review local compliance and watershed restoration projects with District staff.
Figure 1-25: Excerpt from District Coordination Presentation about
Local Projects for MS4 Compliance
SHA Recycles Campaign
In support of the SHA Business Plan, the Environmental Compliance and Stewardship Key Performance Area launched the SHA Recycles Campaign on April 22, 2008 to raise awareness and encourage change in consumer culture throughout the organization. The goal of this campaign is to reduce waste and litter by making conservation a priority, reusing what we previously discarded, and recycling as much as possible.
The SHA Recycles Campaign is working to build a consortium of stakeholders across the entire SHA organization towards this collective goal. The campaign encourages all employees to give feedback on what can be done to save energy and fuel, reduce or eliminate waste, improve current recycling efforts, or change business practices to conserve resources. It provides education and outreach through displays and presentations at SHA events such as the Annual Earth Day Celebration, and office-wide training and recognition days.

1-40 Maryland State Highway Administration 10/21/2015 NPDES MS4 Phase I and II Annual Report
A statewide Recycling Task Force has also been formed at SHA to examine key issues in recycling and identify ways to improve the SHA Statewide Recycling Program.
Environmental Awareness Training
(Chesapeake Bay Field Trips)
This training is provided to all new employees and other employees seeking to improve their environmental awareness. This field trip demonstrates the link between highway runoff and its impacts on streams, rivers, and on the health of the Chesapeake Bay. The field trip includes visits to important environmental sites including wetlands, streams, forests, and a boat trip on the Bay. Three trips were taken this reporting period on October 22, 2014, April 29 and April 30, 2015 with approximately 75 participants attending in all. See Figure 1-26 for an image from training in October, 2014.
Figure 1-26: SHA Chesapeake Bay Field Trip and Environmental Awareness Training in
October, 2014
Office of Highway Development (OHD)
University
Our Office of Highway Development continues its OHD-University training program for employees. Although primarily developed for engineers within OHD, others throughout the organization are invited to participate. The annual technical training sessions provide staff with the latest policy and design updates, including any changes to permitting requirements that affect policies and procedures. A myriad of key topics associated with the
planning, design, construction, and maintenance phases of roadway network development are discussed, including SWM, ESC, permits, specific NPDES concerns, and TMDLs. During the current reporting period, the relevant trainings were not offered, but presentations for 2016 classes are under development.
Statewide Pesticide/Vegetation Management
Training
There are several types of internal training sessions for pesticide management that SHA provides annually. They include registration, re-certification, right-of-way pre-certification preparation, aquatic pre-certification preparation, and herbicide updates. The number of participants at each of these training sessions is listed below in Tables 1-16 (below), 1-17, and 1-18 (following page). There was no Vegetation Management Conference or Aquatic Pesticide Certification Preparation training held in 2015. There were 7 Re-certification classes (ENV200), 2 Pesticide Core and Right-of-Way certification preparation classes (ENV210), and 3 Pesticide registration classes (ENV100) held in 2015.
Table 1-16: Pesticide Applicator Registration (ENV100)
SHA District Number Trained
District 1 (DO,WI,WO,SO)
18
District 2 (TA,CO,QA,KE,CE)
0
District 3 (MO,PG) 0
District 4 (BA,HA) 8
District 5 (AA,CA,SM,CH)
0
District 7 (HO,CL,FR)
17
OFSD-Headquarters
0
OM-FMD 0
Other 0
Total 43

10/21/2015 Maryland State Highway Administration 1-41 NPDES MS4 Phase I and II Annual Report
Table 1-17: Maryland Pesticide Recertification (ENV200)
SHA District Number Trained
District 1 (DO,WI,WO,SO)
8
District 2 (TA,CO,QA,KE,CE) 20
District 3 (MO,PG) 6 District 4 (BA,HA) 15 District 5 (AA,CA,SM,CH)
5
District 6 (WA,AL,GA)
7
District 7 (HO,CL,FR)
17
Total 83
Table 1-18: Pesticide Core and Right-of-Way Certification Preparation (ENV210)
SHA District Number Trained
District 1 (DO,WI,WO,SO)
2
District 2 (TA,CO,QA,KE,CE)
District 3 (MO,PG) District 4 (BA,HA) District 5 (AA,CA,SM,CH)
1
District 6 (WA,AL,GA)
District 7 (HO,CL,FR)
Total 3
Maryland Department of Transportation
(MDOT) Water Quality Policies and Water
Quality Clearing House Web Page
This is a continuing effort that provides information on department-wide water quality policies and other regulations applicable to transportation projects. This webpage is periodically updated with regulatory/policy changes and can be accessed at www.mdot.maryland.gov and clicking on the ‘Environment’ link at the top of the page. The tabs at the top of the page lead to information on state and environmental self-audit program; regulations for transportation facility operations such as storage tanks and spill prevention and response; environmental resources such as
Smart, Green & Growing, MDE, MDNR and EPA; MDOT’s environmental management system (EMS), environmental stewardship and sustainability efforts, and environmental planning initiatives.
SHA Environment and Community Web Page
SHA has developed an environmental awareness web page that is located on the SHA website (www.marylandroads.com). SHA continues to update this site with up to date information about various NPDES related topics, including:
Chesapeake Bay and Local Waterway Restoration
• Bay Restoration Viewer Interactive Map (See Figure 1-27)
• Bay Restoration Strategies (See Figure 1-28 for a photo example from the website)
• Frequently Asked Questions
• Documents and Reports
Figure 1-27: Screen Capture of the SHA Bay Restoration Viewer Interactive Map
Figure 1-28: SHA Sand Filter BMP Example
used on the Website

1-42 Maryland State Highway Administration 10/21/2015 NPDES MS4 Phase I and II Annual Report
Environmental Stewardship and Mitigation
• Reforestation and Planting Programs
• Invasive Plant Control
• Wetlands and Waterways
Initiatives
• Recycling
• Litter Education
Maintenance
• Winter Operations • Mowing Reduction
• Idling Policy
• Vehicle and Equipment Fleet
• Road Sweeping
• Ditch/Culvert Cleanings
• Litter Removal
Employee Commuter Reduction Incentives
SHA offers several incentives to reduce the number of drivers and/or number of commuter days/miles per week by Administration employees. Fewer commuter days and miles mean less vehicle pollutants entering the watershed.
Alternate work schedules include flexible work hours allowing employees to work compressed workweeks reducing the total number of commuting days and miles.
Teleworking allows employees to work from a remote location (presumably at or close to home) and also reduces the number of commuting days and miles per week. Each office has or is developing a teleworking policy.
Car-pooling has been encouraged at SHA for many years and reduces the number of commuters on the road. SHA car-pooling incentives include prioritizing parking space allocation to those in a designated car pool and
Administration assistance in locating a carpool within the employee’s residential area.
Bicycle commuting is also encouraged with SHA’s support to promote bicycle safety laws, implementing new bike facilities throughout the state. SHA also participated in a number of bicycle safety events and campaigns across the state year round. See Figure 1-29 for an image from Bike to Work Day.
Figure 1-29: SHA Promoted Bike to Work Day on May 15, 2015
Finally, employee ID badges allow state employees to acquire a free State Transit Employee Pass (STEP) that allows free access to MTA mass transit including the Baltimore area subway, light rail, and buses. This encourages the use of mass transit by SHA employees who live within the Baltimore area.
SHA Vehicle and Equipment Idling Policy
On September 22, 2009, the SHA issued a policy regarding reduction in idling of engines for state equipment and vehicles. The purpose is to reduce fuel consumption by state forces, and if adhered to, will result in pollutant load reduction as well.

10/21/2015 Maryland State Highway Administration 1-43 NPDES MS4 Phase I and II Annual Report
F Watershed Assessment
Requirements under this condition include:
1. Continue providing available geographic information system (GIS) highway data to permitted NPDES municipalities and MDE;
2. By the fourth annual report, complete SHA’s Impervious Surface Account as described in Part III.C. (Source Identification);
3. Select for retrofitting impervious areas with poor or no runoff control infrastructure. These projects shall be implemented where water quality improvements can be achieved; and
4. Work with Maryland’s NPDES municipalities to maximize water quality improvements in areas of local concern
SHA has incorporated watershed assessment effort as described by the permit in the overall business process by contiguous evaluation of highway drainage areas for stormwater management retrofit opportunities and coordinating with local jurisdictions on their watershed restoration plans to maximize water quality benefits.
SHA exchanges the latest available geographic information system (GIS) highway data with permitted NPDES municipalities and provides the most recent spatial database of drainage assets and stormwater infrastructure to MDE. SHA completed the impervious surface accounting by the fourth annual report and continues to systematically update this data. SHA is assessing the areas that lack highway runoff control and treatment and implementing water quality improvement projects in cooperation with the Maryland NPDES jurisdictions to maximize water quality benefits in areas of local concern.
F.1 GIS Highway Data to NPDES
Jurisdictions and MDE
SHA makes the GIS database of drainage and stormwater assets available to NPDES jurisdictions, and provides the most recent updates when the data is requested. SHA annually submits the latest version of the
NPDES Geodatabase to MDE to incorporate into the statewide database for the Chesapeake Bay and local TMDL modeling. In addition, SHA provided the NPDES Geodatabase datasets to MDE for the required Historical BMP Cleanup deliverable on May 29, 2015.
F.2 Complete Impervious Accounting by
Fourth Annual Report
SHA completed the impervious accounting requirement for all of the Phase I counties, by the fourth annual report, October 2009.
The issue of treatment credit accounting for impervious surfaces treated by entities other than the jurisdiction that has ownership of the surfaces is still not resolved between MDE and the MS4 jurisdictions. SHA has currently taken credit only for SHA-owned surfaces and not included in the accounting of any non-SHA impervious surfaces to date. Although it is anticipated that this additional treatment credit will be applied to SHA in the future, thus increasing treatment currently provided. The impervious accounting has been expanded to include Phase II counties (Washington and Cecil) and three municipalities (Cambridge, Cumberland, and Salisbury), and the results are included in this report under Section C.3.
F.3 Impervious Area Retrofits
SHA developed a protocol for site searches to identify most suitable location for stormwater management facilities that would directly treat the highway impervious surfaces runoff, preferably within existing SHA controlled right of way. SHA has also implemented alternative BMPs such as Tree Planting, Stream Restoration, Outfall Stabilization, and Pavement Removal as part of our Chesapeake Bay TMDL implementation plan discussed in Section J.

1-44 Maryland State Highway Administration 10/21/2015 NPDES MS4 Phase I and II Annual Report
F.4 Maximize Water Quality Improvements
in Areas of Local Concern
SHA is a transportation agency focusing on providing and maintaining a highway system that supports local and statewide economic development, but also focuses on ensuring that highway projects meet all necessary SWM and water quality regulations. In addition, as part of the terms of the permit conditions, SHA adheres to the watershed restoration goals and priorities that have been established by local NPDES jurisdictions.
Past achievements to maximize water quality improvements within areas of local concern have been discussed in detail in annual reports of previous reporting periods. Past activities have included the following.
• Documenting watershed goals and priorities.
• Piloting a watershed-based SWM assessment on US 301 in partnership with Prince George’s and Charles counties during the evaluation of transportation improvements within the corridor.
• Commencing work on a draft framework for implementing a watershed-based approach for SWM using a grant from the Environmental Protection Agency (EPA) and as part of the Green Highways Partnership (GHP) between SHA, the EPA, and the Federal Highway Administration (FHWA).
• Completion of watershed assessment and a retrofit study of the Indian Creek watershed in partnership with Prince George’s County.
• Conducting watershed wide water quality site searches to maintain a positive balance in the SHA Water Quality bank.
• Incorporating stormwater management practices into SHA major highway projects to maximize the water quality treatment of highway runoff; implementing environment site design and other innovative practices to maximum extent practicable
• Implementing an outfall inspection protocol and rating system, to systematically prioritize outfall channels stabilization projects in conjunction with stream restoration projects
• Initiating outfall restoration projects and drainage improvements projects to preserve and restore SHA stormwater and drainage infrastructure and eliminate potential pollution sources
• Preparing for TMDL milestones and allocation reduction strategies.
Updates for on-going or recently-reported endeavors are as follows:
Water Quality Bank
The Water Quality (WQ) Bank was established in 1992 as part of a Memorandum of Agreement (MOA) between SHA and MDE with the intent to facilitate construction of smaller roadway improvements where hardship in meeting the full water quality requirements can be demonstrated and allowing debiting an established bank to meet water quality requirements if credit exists in the 6-digit watershed account. Proposed updates to terms and conditions for WQ bank are under review. Credit is achieved by over managing water quality on other projects. The bank tracks, on a project basis, the amount of impervious area required to be treated and how much is actually treated. For any project in which WQ treatment cannot be provided, in part or in full, a debit may be incurred. For projects that provide WQ treatment in excess of what is required, credits may be earned. Credits provide the means for debits to be possible. This flexibility not only allows SHA to deliver projects more efficiently, but also ensures that WQ management of SHA impervious areas is ultimately provided within each 6-digit watershed within the state. In addition, the tracking of watershed credits allows SHA the opportunity to consistently exceed the regulatory requirements and provide additional WQ treatment to regularly increase the percentage of the amount of impervious surfaces managed. Credits and debits are tracked by acres of impervious surface and includes parking lots, roadways, sidewalks, and any other impervious surfaces within designated watersheds.
A strict set of rules of how credits and debits may be applied are well-defined in the MOA:

10/21/2015 Maryland State Highway Administration 1-45 NPDES MS4 Phase I and II Annual Report
• For impervious areas to be considered treated for WQ, stormwater runoff must be managed for the first inch of rainfall.
• If the existing impervious surface amount within limits of disturbance (LOD) of a project is greater than 40%, 50% of the existing impervious surfaces and 100% of net change (new) in impervious surfaces must be managed for WQ.
• If the existing impervious surface amount is less than 40%, 100% of impervious areas within LOD must be managed for WQ, regardless of whether or not the impervious surface is existing or new.
• Based on the current SWM requirements, all potential opportunities to implement Environmental Site Design (ESD) to the Maximum Extent Practicable (MEP) must be exhausted and it must be demonstrated that structural and non-structural SWM facilities are not practicable to install before debits may be incurred from the WQ Bank.
• When the amount of impervious surfaces managed for WQ exceed the requirements of a project, the excess may be applied as a credit to the WQ Bank only if ESD practices are implemented resulting in excess treatment.
• Credits to the WQ Bank are applied as follows: 100% for management of SHA-owned impervious surfaces and 50% for management of non-SHA-owned impervious surfaces.
As an additional effort to ensure enough credits are available in the WQ Bank should the need for debits arise, SHA initiates projects
to specifically identify locations of unmanaged impervious surfaces in various locations throughout the 6-digit watersheds and implements retrofit projects to install SWM facilities to manage impervious surfaces for WQ. This allows SHA to provide more meaningful and effective management of WQ improvements within watershed areas in which WQ balances are low. This concept is parallels a working framework for watershed-based stormwater management. SHA submitted its accounting for balances to MDE as part of its quarterly report according to Delegated Authority MOU and is waiting for reconciliation conformation from MDE. SHA expects major credit record in SHA statewide bank.
County Coordination
SHA has been regularly meeting with permitted MS4 jurisdictions to discuss watershed needs, current assessments, and potential partnering projects. SHA has also been invited by local groups to discuss the Chesapeake Bay restoration program and SHA’s plan to meet pollution reduction goals established by MDE. This outreach has helped SHA identify local needs for watershed restoration efforts, and has been very instrumental as SHA develops the TMDL program, as discussed in Section J. Below is a list of meetings attended this reporting period. Table 1-19 on the following page summarizes the meetings held in the past year. More details about partnering projects are further discussed in Section G.

1-46 Maryland State Highway Administration 10/21/2015 NPDES MS4 Phase I and II Annual Report
Table 1-19: Summary of SHA and County Coordination Efforts
Jurisdiction/Group Meeting Date(s) Main Topics and Comments
Anne Arundel County 11/18/14, 2/27/15, 5/13/15, 8/19/15, 9/16/15
SHA and Anne Arundel County DPW regularly meet and discuss project opportunities and implementation. Broad Creek stream restoration is one partnering project.
Anne Arundel County, Jabez Watershed Assessment Stakeholder Group
4/30/15, 9/29/15 Anne Arundel County and SHA are collaborating on a watershed assessment and restoration plan for the Jabez Branch 3.
Baltimore County 1/29/15, 7/7/15 SHA and Baltimore County have met several times. SHA gave a presentation of their grass swale assessment procedures and credit determination.
Town of Hancock 6/30/15 Met with Town Manager to discuss stream restoration partnering project at Kirkwood Park in Washington County.
Harford County's Environmental Advisory Board
11/18/14 Presentation of SHA’s Chesapeake Bay Restoration program.
Mount Saint Mary’s University
2/24/15 SHA and Mount Saint Mary’s University are partnering to plant several acres of trees on the campus in Frederick County.
M-NCPPC Montgomery County Parks
6/7/15 SHA and M-NCPPC discussed project opportunities on parkland.
Prince George’s County
5/7/15 Discussed restoration and mitigation opportunities and collaboration.
Washington County 5/12/15 Discussed stream restoration opportunities in Washington County.
Town of Woodsboro 3/20/15 Discussed a stream restoration opportunity in Woodsboro Park, Frederick County.
Maryland Association of Counties
8/31/15 & 9/24/15 Discuss permit Streamlining for TMDL and MS4 restoration projects
Green Highways Partnership
A Green Highways Partnership has been established between EPA and the Federal Highway Administration (FHWA). The partnership creates a voluntary public/private network focusing on effective green transportation partnering, innovation, and collaboration between the environmental and transportation communities. SHA, as a leading partner in the Green Highways Partnership, has become involved in a number of demonstration projects promoting innovative stormwater management practices, including low impact development strategies and water quality banking. In addition to the SHA transportation mission, SHA has incorporated this significant
component in the business process in all aspects of project development including planning, design, and permitting.
Watershed Resources Registry
The Watershed Resources Registry (WRR) is a national pilot to integrate land-use planning, regulatory, and non-regulatory decision making using the watershed approach. SHA, through the Green Highways Partnership, developed a GIS-based pilot Registry in close collaboration with all regulatory agencies including DNR, MDE, ACOE, USFWS, and EPA, along with FHWA, Charles County, Prince George’s County, and Maryland Environmental Service (MES).

10/21/2015 Maryland State Highway Administration 1-47 NPDES MS4 Phase I and II Annual Report
The WRR is a GIS based targeting tool that was developed to analyze watersheds and identify the best opportunities for the protection of high quality resources, restoration of impaired resources, resource conservation and environmental resource planning, and improvement of stormwater management. The WRR is intended to integrate the Clean Water Act (CWA) authorities by facilitating implementation of CWA Sections 319, 401, 402, and 404, TMDL implementation practices, and multiple state programs.
WRR is a comprehensive web based mapping tool and replicable framework with a user friendly interface that:
• Integrates regulatory and non-regulatory programs
• Guides resource planners
• Conserves program resources
• Highlights for multiple environmental benefits
• Maximizes watershed benefits
• Is transparent and predictable
The objective of the Registry is to map natural resource areas that are a priority for preservation and to identify sites best-suited for ecosystem preservation and restoration. A major effort of the WRR process is a set of suitability analyses developed with sound science and the best professional judgment of regional experts, which will be used as a screening tool to target opportunity sites for the protection of high quality resources, restoration of impaired resources, and improvement of water resources. The analyses will specifically identify for:
• Upland Preservation, Upland Restoration
• Wetland Preservation, Wetland Restoration
• Riparian Preservation, Riparian Restoration
• Natural Stormwater Infrastructure Preservation
• Compromised Stormwater Infrastructure Restoration
By having both regulatory and non-regulatory agencies base decisions from a WRR, integration and the use of the watershed approach will
become implicit and “stovepipe” processes in decision making will become obsolete. The results will streamline the regulatory and non-regulatory processes and ensure maximum environmental results. The benefits of WWR in greater detail include the following:
• Helps agencies identify watershed restoration and protection opportunities to target improvements and evaluate results.
• Helps “connect the dots” between agencies, fostering shared vision and stronger relationships that produce better government and improved services to customers.
• Provides a wide variety of labor and cost efficiencies associated with streamlined processes, collaboration and shared resources.
• Helps provide a consistent evaluation framework that each state can establish based on stakeholder consensus (a data-driven “star” rating) through which watershed/geography/context sensitive decisions can be made.
• Helps agencies avoid or minimize negative environmental and natural resource impacts and informs decision-making.
• Fosters continuous improvement in the quality of data outputs through opportunities for collective intelligence and feedback (with appropriate controls).
• Significantly streamlines regulatory review processes and workflow for a variety of stakeholders, including state agency departments of natural resources, environmental protection, and planning, as well as federal organizations such as the Federal Highway Administration, US Army Corps of Engineers, Environmental Protection Agency, Natural Resources Conservation Service, and US Fish and Wildlife Service.
• Also significantly streamlines the evaluation of projects by users, including conservation groups, permit applicants, and others, since it provides valuable information on existing resources and realities.
• Improves collaboration and coordination between agencies occurs because everyone is using the same data and tool. This promotes

1-48 Maryland State Highway Administration 10/21/2015 NPDES MS4 Phase I and II Annual Report
an upfront understanding of all of the issues by all of the stakeholders and reduces surprises along the way.
• Helps transportation planners identify potential impacts to resources early in the process.
• The transparency and collaboration central to WRR helps promote optimal watershed actions.
• Helps significantly streamline, integrate and enhance a variety of regulatory permitting processes and requirements
• Helps agencies identify and address data gaps, which improves data integrity and quality over time.
• The Registry’s flexible data layers permit highly customizable outputs depending upon business user needs, providing a highly dynamic evaluation approach.
• Supplies a transferrable framework that can be used by states across the nation
In the past year, the members of the WRR Technical Committee have been working on the nationwide promotion of this new technology through the AASHTO Innovation Initiative (AII). This program, formerly known as Technology Implementation Group (TIG), provided funding for the first national WRR Workshop that was held in Baltimore on October 16 and 17, 2014 (See Figure 1-30). The more than 70 attendees at the workshop included resource, regulatory, and transportation agency staff from both State and federal agencies. In addition to the workshop, the WRR will hold a webinar in October 2015 to reach out to the intended targeted audience for adoption of this technology, including: Federal and State Transportation Agencies.
• State Natural Resource & Environmental Quality Agencies
• State Regulatory Agencies
• Local Government Agencies and Authorities (cities/counties/toll road authorities)
• Private Sector Stakeholders (Architectural Engineering Firms, Mitigation Banks, Environmental Services Firms, Utility Companies, Developers, etc.)
SHA adopted the WRR in spring 2012. The WRR application has been valuable for gathering environmental inventory information, assessing watershed needs, identifying potential mitigation sites, and avoidance and minimization efforts. The future use of this tool is for suitable stormwater management site searches to meet regulatory requirements and for TMDL projects implementation.
Figure 1-30: SHA Representatives Presenting at the National WRR Workshop
Framework to Implement a Watershed-Based
Approach for Managing Stormwater
The watershed approach framework for managing stormwater represents coordination and environmental management that focuses public and private sector efforts to address the highest priority problems within hydrologically-defined geographic areas.
SHA has recognized the need for integrated environmental management through watershed –based approach for treatment of highways as well as off-site runoff to effectively reduce pollutant loads delivered to downstream reaches lakes, rivers, wetlands, estuaries, coastal waters, and ground water. Successful stormwater management can be achieved primarily by controlling point sources of pollution in many case outside of SHA controlled Right-of-Way, therefore close coordination and cooperation with all stakeholders in the watershed is unavoidable. SHA has developed a framework for implementing a watershed-based approach with recommendations how to cultivate partnerships, assess specific watershed needs, establish accountability, optimize budget

10/21/2015 Maryland State Highway Administration 1-49 NPDES MS4 Phase I and II Annual Report
spending, and promote sustainable systems within the transportation network and local communities.
SHA has been a leading supporter of watershed based stormwater management and has defined this vision as of stormwater management concept to recognize that highways coexist with other land uses in watersheds. SHA adopted this collaborative approach as it provides opportunity to plan and deliver the most effective protection and improvements to the watersheds. In support of this concept, SHA has taken significant steps towards creating GIS database of more than 3300 stormwater facilities and associated drainage infrastructure that allows systematic evaluation of the effectiveness of stormwater controls on a watershed scale.
Close and frequent coordination with various local Programs and their watershed implementation plans results in better environmental benefits, positive socioeconomic impacts, and more accurate financial planning. Data sharing and joint review can help program managers from all levels of government and regulatory agencies to better understand the cumulative impacts of land development, highway construction, and other human impacts. This helps to determine the most critical problems within each watershed related to protection, pollution control, fish and wildlife habitat, and other aquatic resource programs. Using this information to set priorities for action allows public and private managers from all levels to allocate appropriate funding and human resources to address the most critical needs. Part of the action is establishing environmental indicators to select appropriate activities to prioritize and address high priority issues as well as measure the success through implementation of appropriate and effective improvements rather than simply fulfilling programmatic requirements. SHA is committed to continue working within this framework as it has been in close coordination with local jurisdictions, regulatory agencies, local watershed groups, and the public throughout all phases of project development process to effectively address stormwater issues that result in significant and measurable environmental benefits.
The watershed based approach results in significant cost savings by leveraging and building upon the financial resources and the willingness of the stakeholders with interests in the water quality improvements to take action. Through improved communication and coordination, the watershed approach can reduce costly duplication of efforts and conflicting actions. Implementation of water quality banking, wetland mitigation, and stream restoration, as well as establishment of trading mechanism among various sectors, results in significant environmental benefits, a streamlined permitting process, more efficient and timely delivery of projects, cost saving of public funds, and reduction of potential adverse impacts.
Finally, SHA recognizes that the watershed approach strengthens teamwork between the public and private sectors at the federal, state, and local levels to achieve the greatest environmental improvements with the resources available. The watershed approach builds a sense of community, reduces conflicts, increases commitment to the actions necessary to meet societal goals, and improves the likelihood of sustaining long-term environmental improvements.
Green Asset Management System
Maryland State Highway Administration (SHA) Office of Planning and Preliminary Engineering (OPPE) Program Development Division Asset Management Section has developed and deployed an asset management data warehouse for data integration and storage. It provides both editing and viewing capabilities as a component to SHA’s current Enterprise GIS (eGIS) application. The ADW Asset Editor Widget provides an enterprise, centralized suite of tools and functionality integrated within the eGIS framework to streamline the maintenance of SHA-owned assets. The eligible assets that may be managed using an enterprise asset management approach include bridges / structures, pipes and small culverts, standard roadway and mowable areas, guardrails, and dynamic message signs, and traffic control mechanisms.

1-50 Maryland State Highway Administration 10/21/2015 NPDES MS4 Phase I and II Annual Report
The Asset Editor Widget is a flexible, easy-to-use widget that provides functionality to add, move, and update location details and delete asset information. Currently, the Asset Editor Widget has been implemented for managing Lighting Assets (such as poles, panels, and structures), Signage Assets (such as sign installations, and sign panels), Traffic Barrier Assets, Rumble Strip Assets, and Line Striping (Pavement Marking) Assets, Park and Ride and Raised Pavement Markings (RPM). Future consideration will be given for opportunities to implement the Asset Editor Widget for additional applicable SHA asset maintenance programs
The existing eGIS widget suite includes the Green Asset Management System (GAMS). The GAMS widget allows the desktop user to manage green assets (such as invasive species) along SHA owned right of ways. After that widget had been developed, a supplemental feature was added to facilitate the collection of data about green assets using a mobile device, such as a tablet or smartphone. A user guide was developed to focus on the mobile field editor and eGIS widget functionality to checkout, search, add, update, delete, and check-in GAMS assets.
Recycled Materials Task Force
The Office of Materials and Technology created a task force to review, analyze, and implement greater use of recycled materials in transportation projects. Pertinent design offices actively participate in quarterly meetings. Design expertise includes materials, hydrology, environmental regulations, habitats and ecosystems, and highways. Members of regulatory agencies, industry manufacturers, and material suppliers also participate. As a result of these meetings, SHA has continued to increase opportunities to use recycled and reclaimed materials in transportation projects. SHA has identified multiple recyclable materials that can be incorporated into highway projects.
Local 8-Digit Impairments and TMDLs
With the TMDL requirements anticipated for the next permit term, which is expected to focus on
treatment of untreated impervious surfaces and waste load reductions for urban stormwater runoff, SHA will be shifting efforts to prioritize key segments of the Chesapeake Bay watershed along with local TMDL watersheds in which SHA is named as a contributor to the waste load allocation (WLA). Establishment of the 2-year milestones has begun and SHA has been making progress towards meeting set goals to achieving Bay TMDL requirements while demonstrating compliance with local TMDLs and treating impervious surfaces. SHA is programming and developing policies to coincide with the anticipated load reduction goals, which are further discussed in Section J. Additional endeavors in which SHA is currently involved are covered in Section G.

10/21/2015 Maryland State Highway Administration 1-51 NPDES MS4 Phase I and II Annual Report
G Watershed Restoration
Requirements under this condition include:
1. Construct or fund 25 significant stormwater management retrofit projects during the course of this permit for impervious areas with poor or no runoff control infrastructure. These projects shall be implemented where water quality improvements can be achieved and shall not include typical stormwater management maintenance. Innovative alternatives to conventional stormwater management methods will be considered by MDE. Alternative practices shall be submitted to MDE for approval prior to implementation;
2. Contribute to local watershed restoration activities by constructing or funding stormwater management retrofits in watersheds targeted by local NPDES municipalities when feasible; and
3. Submit annual reports containing pertinent information on its watershed restoration activities such as stormwater management retrofit proposals, costs, schedules, implementation status, and impervious acres proposed for management.
SHA continues to construct stormwater management retrofits to increase pollutant control associated with highway runoff, although requirements for this permit condition to implement 25 significant stormwater management retrofit projects has been met. In addition, SHA continues to partner with local jurisdictions on various watershed restoration initiatives and activities. The watershed restoration projects mostly include functional enhancements and upgrades of outdated stormwater facilities that are currently not meeting the latest design standards, as well as construction of additional stormwater BMPs to treat currently untreated impervious surfaces. The watershed restoration projects include innovative approaches to conventional stormwater management methods such as stream restoration projects. Projects also include drainage outfall stabilization to restore degrading channels, prevent sediment and other pollutants
transport to the downstream reaches, and provide significant water quality benefits.
SHA continues to support local watershed activities by constructing and funding water quality projects such as stormwater retrofits and stream restoration projects within targeted watersheds. To comply with the permit conditions, SHA annually reports on watershed restoration activities, progress, costs, schedules, implementation status, and impervious acres proposed to be treated.
G.1 Implement 25 Significant SWM
Retrofit Projects
SHA has met the goal to complete the required 25 significant SWM Retrofit projects within this expired permit term, and has been reported in the past annual reports. However, SHA has been continuing efforts to maximize treatment of untreated impervious surfaces in anticipation of the increased restoration requirements under the new permit.
Stormwater Facility Functional Upgrades,
Enhancements, Retrofits, and Restoration
Projects.
These projects are not developed to meet stormwater management requirements of major highway projects, but they were specifically initiated to upgrade stormwater BMPs to meet current regulations and provide maximum water quality treatment, or to construct new SWM facilities for additional impervious surface treatment. SHA continues design and permitting activities for a SWM retrofit project at I-695 and Cromwell Bridge Interchange to treat over 80 acres of impervious surface and off site runoff from highly urbanized watershed. This water quality improvement project is designed in conjunction of four outfall stabilizations at tributaries to Minebank Run, as well as main channel restoration. The project is scheduled to advertise in the spring of 2017.
Several functional enhancement projects were initiated in Harford County to improve water quality of existing SWM facilities and provide

1-52 Maryland State Highway Administration 10/21/2015 NPDES MS4 Phase I and II Annual Report
maximum treatment of SHA highway runoff. The design is in final stages and the projects will be completed with areawide construction contracts.
In addition to SWM retrofit and enhancement projects, stream restoration and drainage outfall channel stabilization projects were initiated to address adverse impacts of urbanization to further reduce pollutant loads and improve water quality within targeted watersheds.
All restoration projects initiated or completed to meet the 25 project requirement are listed in Table 1-20. A total of 124 water quality improvement projects were designed to treat approximately 1089.79 acres of impervious
surface (not including the Chester River Area projects, which are in Queen Anne’s County).
SHA continues design and construction activities within medians of divided highways to address water quality of legacy pavement– the pre-1985 impervious surfaces. The detailed progress will be reported in the next reporting period after construction completion when as-built information is available to assure full functionality. Our current level of treatment by stormwater controls completed is 420 acres at 1.7% (See Table 1-3 in Section C). Design efforts are underway to increase restoration to 1089.79 acres at 4%.
Table 1-20: Watershed Restoration Projects
Projects by Watershed Retrofit Type Status Restored Impervious Acres
Lower Susquehanna River – 02-12-02
BMP 120076 SWM Retrofit Complete 2.82
Total Treated: 2.82
Bush River Area – 02-13-07
BMP 120069 SWM Retrofit Complete 4.16 BMP 120072 SWM Retrofit Complete 4.68
BMP 120073 SWM Retrofit Complete 3.99 BMP 120075 SWM Retrofit Complete 1.77 BMP 120081 SWM Retrofit Complete 2.39 BMP 120082 SWM Retrofit Complete 1.00
Total Treated: 17.99
Gunpowder River – 02-13-08
I-83 Outfall Stabilization of Tribs. to Gunpowder Falls
Stream stabilization Complete 7.85
Minebank Run Restoration, & WQ Improvements
Stream restoration, outfall stabilization, SWM retrofit***
Design 236.8
BMP 030389 SWM Retrofit Complete 2.43
Total Treated: 247.08
Patapsco River – 02-13-09
BMP 020120 SWM Retrofit Complete 17.73
BMP 020121 SWM Retrofit Complete 0.96 BMP 020122 SWM Retrofit Complete 0.92 BMP 020625 SWM Retrofit Design 2.46 BMP 030281 SWM Retrofit Complete 8.35 MD 139 Tributary to Stream Stabilization Complete 260.30

10/21/2015 Maryland State Highway Administration 1-53 NPDES MS4 Phase I and II Annual Report
Projects by Watershed Retrofit Type Status Restored Impervious Acres
Towson Run Stabilization BMP 020111 SWM Retrofit Complete 6.04 BMP 020112 SWM Retrofit Complete 0.56 BMP 020098 SWM Retrofit Complete 0.68 BMP 020099 SWM Retrofit Complete 0.75 BMP 020476 SWM Retrofit Complete 3.79
BMP 020477 SWM Retrofit Complete Combined with
020476 BMP 130197 SWM Retrofit Complete 0.44 BMP 130207 SWM Retrofit Complete 1.57 BMP 130221 SWM Retrofit Complete 0.17 BMP 130210 SWM Retrofit Complete 0.24
BMP 130217 SWM Retrofit Complete 0.10 I-695 Tributary to Steamers Run
Stream Stabilization Complete 182.00
Total Treated: 487.06
West Chesapeake Bay – 02-13-10
BMP 020019 SWM Retrofit Complete 1.22 BMP 020022 SWM Retrofit Complete 1.06 BMP 020027 SWM Retrofit Complete 1.59 BMP 020029 SWM Retrofit Complete 0.88 BMP 020031 SWM Retrofit Complete 2.29
BMP 020088 SWM Retrofit Complete 3.53
BMP 020481 SWM Retrofit Complete 2.09 BMP 020522 SWM Retrofit Complete 1.70 BMP 020273 SWM Retrofit Complete 1.18 BMP 020491 SWM Retrofit Complete 1.79 BMP 020185 SWM Retrofit Complete 0.48 BMP 020198 SWM Retrofit Complete 0.68
BMP 020201 SWM Retrofit Complete 1.01 BMP 020205 SWM Retrofit Complete 1.16 BMP 020206 SWM Retrofit Complete 0.49 BMP 020210 SWM Retrofit Complete 0.36 BMP 020220 SWM Retrofit Complete 0.72 BMP 020258 SWM Retrofit Design 3.27 BMP 020260 SWM Retrofit Design 1.41 BMP 020268 SWM Retrofit Design 7.08 BMP 020393 SWM Retrofit Design 4.35 BMP 020394 SWM Retrofit Design 3.27 BMP 020014 SWM Retrofit Construction 1.9 BMP 020015 SWM Retrofit Construction 0.73 BMP 020016 SWM Retrofit Construction 0.72 BMP 020017 SWM Retrofit Construction 0.16 BMP 020018 SWM Retrofit Construction 0.65
Total Treated: 45.5
Patuxent River – 02-13-11
BMP 160059 SWM Retrofit Complete 3.2 BMP 020488 SWM Retrofit Complete 5.56

1-54 Maryland State Highway Administration 10/21/2015 NPDES MS4 Phase I and II Annual Report
Projects by Watershed Retrofit Type Status Restored Impervious Acres
BMP 160217 SWM Retrofit Complete 0.64 BMP 160219 SWM Retrofit Complete 0.91 BMP 160380 SWM Retrofit Complete 3.42 BMP 020301 SWM Retrofit Complete 2.30 BMP 020311 SWM Retrofit Complete 0.28 BMP 020437 SWM Retrofit Complete 4.13 BMP 020299 SWM Retrofit Complete 1.09 BMP 130149 SWM Retrofit Complete 0.48 BMP 130150 SWM Retrofit Complete 1.02
BMP 130154 SWM Retrofit Complete 0.47 BMP 130159 SWM Retrofit Complete 0.02 BMP 130160 SWM Retrofit Complete 0.52 BMP 130162 SWM Retrofit Complete 0.66 BMP 130179 SWM Retrofit Complete 2.10 BMP 130180 SWM Retrofit Complete 0.43 BMP 130187 SWM Retrofit Complete 0.13 BMP 130188 SWM Retrofit Complete 0.12 BMP 130189 SWM Retrofit Complete 0.03 BMP 130190 SWM Retrofit Complete 0.03 BMP 130191 SWM Retrofit Complete 0.05 BMP 130192 SWM Retrofit Complete 0.05 BMP 130193 SWM Retrofit Complete 0.10
BMP 130194 SWM Retrofit Complete 0.22
BMP 130232 SWM Retrofit Complete 0.03 BMP 130242 SWM Retrofit Complete 0.72 BMP 130243 SWM Retrofit Complete 3.49 BMP 150228 SWM Retrofit Complete 0.13 BMP 150331 SWM Retrofit Complete 0.23 BMP 130047 SWM Retrofit Complete 1.39
Total Treated: 24.77
Lower Potomac River – 02-14-01
BMP 160456 SWM Retrofit Complete 1.70 BMP 080014 SWM Retrofit Complete 0.24 BMP 080039 SWM Retrofit Complete 0.10 BMP 080040 SWM Retrofit Complete 0.10 BMP 080041 SWM Retrofit Complete 0.12 BMP 080042 SWM Retrofit Complete 0.11 BMP 080043 SWM Retrofit Complete 0.28 BMP 080044 SWM Retrofit Complete 0.20 BMP 080083 SWM Retrofit Complete 0.06 BMP 080095 SWM Retrofit Complete 0.48
Total Treated: 3.39
Washington Metropolitan – 02-14-02
BMP 160607 SWM Retrofit Complete 0.41
BMP 160609 SWM Retrofit Complete Combined with
160607 BMP 160653 SWM Retrofit Complete 15.80

10/21/2015 Maryland State Highway Administration 1-55 NPDES MS4 Phase I and II Annual Report
Projects by Watershed Retrofit Type Status Restored Impervious Acres
Long Draught Branch Restoration
Stream Stabilization Design 228
BMP 150002 SWM Retrofit Complete 0.31 BMP 150003 SWM Retrofit Complete 1.69
BMP 150004 SWM Retrofit Complete Combined with
150003
BMP 150005 SWM Retrofit Complete Combined with
150003 BMP 150172 SWM Retrofit Design 1.25 BMP 150173 SWM Retrofit Complete 1.18 BMP 150301 SWM Retrofit Complete 0.28 BMP 150362 SWM Retrofit Complete 1.03 BMP 150380 SWM Retrofit Complete 1.05 BMP 150550 SWM Retrofit Complete 1.26 BMP 150076 SWM Retrofit Complete 1.25 BMP 150059 SWM Retrofit Design** 0
BMP 150556 SWM Retrofit Design 5.65
Total Treated: 259.16
Middle Potomac River – 02-14-03
Tributary to Tuscarora Creek Stabilization at US 340 and US 15
Stream Stabilization Complete 1.94
BMP 150270 SWM Retrofit Complete 0.08 Total Treated: 2.02
TOTAL 1089.79
*Projects added since last report. ** Retrofit will be included in major highway projects
Pavement Retrofit Projects
SHA has been working with MDE to finalize Bay TMDL requirements for SHA in order to establish funding and resource needs for the future retrofit and implementation projects. SHA continues development and implementation of enhancement projects of existing SWM facilities as well as continues site search for water quality improvement projects. Funding has been allocated for design and construction of SWM retrofit projects to meet both the future waste load reductions and impervious treatment requirement. Future projects include conversion of older SWM facilities originally designed to manage water quantity into water quality sites. In addition,
SHA is actively working on implementation of water quality treatment of legacy pavement through median bioswales designed within the open section roadway medians in Phase I and Phase II jurisdictions.
Stream Project Assessments
SHA has been designing stream restoration and stabilization projects as part of larger highway projects for fulfilling mitigation requirements, to ensure safe roadside areas for travelling public, and to ensure new bridge opening is in sync with the geomorphology and have long term stability. Other times these projects are implemented to provide stable conveyances from roadway outfalls or to minimize sediment transport

1-56 Maryland State Highway Administration 10/21/2015 NPDES MS4 Phase I and II Annual Report
beyond stream’s natural rate such that these projects result in water quality improvements. These projects addressing mostly physical degradation issues of natural stream channels have been often perceived as additional impacts to aquatic resources even though some of the projects are remediating unintended past human impacts and the new impacts may be intended to result in some improvement to either physical, biological or both indexes. Additionally, actual environmental benefits are challenging to implement, prove, or quantify without monitoring data and scientific analysis. Therefore, SHA initiated assessment and monitoring study of completed and proposed stream restoration projects to make recommendations for design or construction changes as well as potential improvements to restoration strategies and methods. The data has been collected since 1998 at a total of 14 sites for benthic, macro invertebrates, fishes and physical habitat. The stream assessments have been performed by Dr. R. P. Morgan and his students from the University of Maryland Frostburg, Center for Environmental Service.
The study in FY 2015 focused on biological monitoring and assessment of two selected streams that have been already restored to evaluate the effectiveness of restoration in terms of revitalization of the physical and biological habitat. In addition, three streams that will be restored in the future have been assessed in order to determine the pre-restoration baseline that will be used to assess post-restoration functional rehabilitation and habitat quality improvement.
Assessment of benthic macroinvertebrates followed MBSS protocols in order to qualitatively describe the community composition and relative abundance in favorable habitats. Baseflow water quality samples were taken at each SHA site for the determination of water quality parameters following the standard analyses performed for the MBSS.
Stream physical habitat data is an essential component of any biological assessment program. Habitat data is normally used to assess trends in water quality and to investigate the influence of land use practices that may affect
stream water quality. A number of variables were assessed qualitatively at each site. These include the following with scores assigned for each metric:
• In stream habitat
• epifaunal substrate
• velocity/depth diversity
• pool/glide/eddy quality
• riffle quality
• channel alteration
• bank stability
• embeddedness
• channel flow status, and
• shading
Observations of the surrounding area were used to evaluate aesthetic value (based on amounts of human refuse) and remoteness (based on ease of access and presence of human activity). The presence, or absence, of other stream habitat features (i.e., morphological characteristics, stream channelization, woody debris, and land uses visible from each site) was also recorded for each site. In the field, physical habitat assessments were integrated across controls and across the stream restoration area.
The overall project objective is to assess and monitor completed and proposed SHA stream restoration projects and to make recommendations for future monitoring needs and restoration strategy, as well as for the improvement and revitalization of current restoration projects. The full monitoring report is included in Appendix C. The following five sites were monitored in 2015:
• Montgomery County - MD117 Long Draught Branch: Pre construction monitoring
• Harford County - Plumtree Run from east of Ring Factory Rd. to north of MD 24: Post-construction monitoring
• Montgomery County – Tributary to Seneca Creek at Watkins Mill Boulevard: Pre-construction monitoring
• Howard County – Upper Little Patuxent River: Pre and Post Construction Monitoring
10/21/2015 Maryland State Highway Administration 1-57 NPDES MS4 Phase I and II Annual Report
• Prince George’s County – Tributary at Marbury Drive: pre-construction monitoring
Restoration Project Database Delivery
Data related to the retrofit projects was submitted with previous reports and can be made available upon request.
G.2 Contribute to Local NPDES
Watershed Restoration Activities
SHA actively participates in local water quality improvement projects and supports watershed interest groups and local jurisdictions in their watershed restoration activities. SHA has participated directly or indirectly in developing watershed plans as well as provided funding.
Additionally, SHA oversees the Federal Transportation Alternatives Program (TAP) within the state, and encourages the use of these funds by local jurisdictions and interest groups to fund water quality projects to mitigate the adverse impacts of roadway runoff. This program was formerly known as the Transportation Enhancements Program (TEP). Under the MAP-21 legislation enacted in 2012, TAP does not fund MDOT or SHA projects anymore. The TAP funding is dedicated entirely to locally sponsored projects. However, the TAP funding can be used towards water quality initiatives when sponsored by a local jurisdiction. This year, TAP funded seven water quality initiatives including:
• Cowhide Branch Stream Restoration and Fish Passage – Anne Arundel County $1,000,000
• Elderwood SWM Basin #2 and Oklahoma Phase IV SWM Facility – Carroll County $1,047,466
• Finksburg Industrial Park Stormwater Management Facility – Carroll County $760,708
• Hwy 301 Stream Restoration – Cecil County $440,000
• MD 2/4 SWM Facilities Functional Upgrades – Calvert County $482,887
• Rutland Road Fish Passage – Anne Arundel County $747,924
• Westminster Community Pond Stormwater Management Facility – Carroll County $933,125
The following is a summary of watershed activities undertaken by SHA during the report period:
I-695 at Minebank Run Stream Restoration,
Drainage and Water Quality Improvements
Design activities continue for this project addressing multi outfall stabilization, stream restoration and SWM retrofits. Minebank Run is within the Gunpowder River Watershed that is targeted by Baltimore County for restoration. This reach is located between two stream restoration projects lead by Baltimore County, therefore SHA has been coordinating with Baltimore County on the restoration effort as well as relocation of sanitary sewer that is currently greatly impacted by the degrading channel. The final design plans will be developed in 2016. The project is scheduled for construction in 2017-18. This project will result in significant pollutant load reductions for the Gunpowder River Watershed as well as improve local drainage infrastructure issues and adverse impacts of the upstream urbanization through upland SWM water quality retrofit within I-695 interchange, providing stable conveyance of the surface drainage, stabilizing 4 degraded outfall channels and restoration of the main channel to address the stream degradation. See Figures 1-31 through 1-33 on the following page.
.

1-58 Maryland State Highway Administration 10/21/2015 NPDES MS4 Phase I and II Annual Report
Figure 1-31: Existing Conditions at Minebank Run
Figure 1-32: Stormwater Retrofit Site at Minebank Run
Figure 1-33: Biological Monitoring Efforts at Minebank Run
Westminster SWM Regional Pond
This project has been developed by Carroll County and the construction is completed. SHA’s function was to provide a technical guidance through the procurement process and funding through Transportation Alternatives Program (TAP). The project is a SWM retrofit of a regional pond originally designed for flood control to treat currently untreated impervious surfaces within a 250 acre watershed. A total of 25 acres of SHA owned impervious surface will receive treatment when the project is completed. See Figure 1-34 below.
Figure 1-34: Westminster Pond Stormwater Retrofit
Finksburg Industrial Park Regional SWM
Facility
This project is a retrofit of a regional SWM facility proposed by Carroll County at MD 91 and MD 140 in the Liberty Reservoir Watershed. The project was initiated to improve water quality treatment capacity to meet local pollutant reduction goals. SHA functions as a project sponsor providing portion of the funding through Transportation Alternatives Program

10/21/2015 Maryland State Highway Administration 1-59 NPDES MS4 Phase I and II Annual Report
(TAP) funding. The proposed facility will treat 22 acres of impervious surfaces within a 152 acre drainage area out of which 4 acres are SHA owned impervious surfaces at MD 91 and MD140. The project design is complete and should be constructed in 2015-2016.
South River Federation
SHA and South River Federation have partnered to restore the headwaters of Broad Creek, a significant source of sediment to downstream waterways including the Chesapeake Bay. See Figure 1-35 for a view of existing conditions of a steeply cut bank along Broad Creek.
Figure 1-35: Existing Conditions of Broad Creek
South River Federation is providing funds for design through Department of Natural Resources Chesapeake & Atlantic Coastal Bays Trust Funds. SHA will fund and manage construction and have collaborated with South River Federation’s consultant designers to provide geotechnical, permitting, right-of-way, and technical assistance. The project will reduce sediment and nutrient delivery by restoring stream and wetland functions through the promotion of stream and floodplain connectivity and increasing density of native vegetation. A failed dam will also be removed. Advertisement for construction is anticipated in January 2015. Sediment and nutrient reductions will be calculated and reported once design is finalized.
SHA is currently managing the construction contract with Diversified Site Works, LLC of Odenton MD. Approximately 2,700 LF of stream channel is being restored at a cost of approximately $1.4 million. SHA and South
River Federation continue to collaborate on design during construction. SHA is also coordinating with MVA for access and Anne Arundel County on overall water quality/Bay Restoration initiatives. The project should be completed by spring 2016, weather permitting.
Jabez Branch 3 Watershed Study
SHA is conducting a watershed assessment of Branch 3 of Jabez Creek to identify restoration opportunities. SHA is funding the study, which includes an existing conditions evaluation for the entire watershed, assessment of stream conditions to identify stability issues, prioritization of restoration areas, identify retrofit opportunities, and community outreach. The initial assessment was completed in April 2015. Then, SHA will collaborate with Anne Arundel County and the Severn River Watershed Association to identify and prioritize potential restoration projects based on the assessment, and determine partnership opportunities for SHA and Anne Arundel County to collaborate on BMP implementation.
SHA has completed the watershed assessment and restoration plan. We are working with the county to implement projects and will meet with the stakeholder group in late September to inform the groups of progress and opportunities for watershed group participation. The meeting is a continuation of ongoing dialogue and a March 2015 meeting where the watershed assessment was presented. SHA will be pursuing several projects and monitoring of downstream reaches. See Figure 1-36 for a photo of existing conditions.
Figure 1-36: Degraded Stream Banks along Jabez Creek

1-60 Maryland State Highway Administration 10/21/2015 NPDES MS4 Phase I and II Annual Report
Mount Saint Mary’s University Tree Planting
SHA has partnered with Mount Saint Mary’s University and The Journey Through Hallowed Ground (JTHG) to plant trees along the college campus. The JTHG is a non-profit organization who is orchestrating the planting of 620,000 trees for each fallen soldier of the Civil War. The JTHG will not be part of a formal partnership; they served as a medium to connect SHA and Mount Saint Mary’s University. The non-profit will hold a dedication ceremony when the tree planting is complete and geotag the trees for their website. Each tree planted will have a clickable datapoint on JTHG website whereby each tree is dedicated to a particular fallen soldier. The campus is adjacent to US 15 in Frederick County. The University identified suitable areas for plantings and SHA will develop a design that meets the University’s needs and goals.
The plantings will be designed and installed by SHA and maintained by SHA during the 2 year establishment period. Upon completion of the 2-year establishment period in the planting contract, the sites will be included in a series of three 3-year establishment contracts by SHA that will include maintenance such as mowing, invasive species control, mulching, and other activities to ensure successful establishment of the tree planting sites. The establishment contracts will include replanting if the density of trees drops below 100 trees per acre. SHA will retain perpetual access privileges to the plantings as the health of the trees will be evaluated every 3 years after the establishment period. SHA will perform maintenance in perpetuity.
Stream Restoration of Israel Creek in Woodsboro Park
A stream restoration of Israel Creek in Frederick County will extend into Woodsboro Park. SHA will partner with the Town of Woodsboro to repair and stabilize the reach within the park. SHA will begin design in late 2015 and construction will begin in 2019. See Figure 1-37.
Figure 1-37: Existing Conditions at Israel Creek in Frederick County
Stream Restoration of Little Tonoloway
Creek in Kirkwood Park
Little Tonoloway Creek in Kirkwood Park is actively eroding threatening park facilities. SHA will partner with the Town of Hancock to stabilize the stream. SHA will begin design in early January 2016 and construction will begin 2018. See Figure 1-38 below.
Figure 1-38: Existing Conditions at Little Tonoloway Creek in Washington County

10/21/2015 Maryland State Highway Administration 1-61 NPDES MS4 Phase I and II Annual Report
G.3 Report and Submit Annually
SHA had completed and submitted information on the twenty-five required watershed restoration projects and other activities to meet the permit requirement in the past reports. This included retrofit proposals, costs, schedules, implementation status, and impervious acres receiving treatment through project implementation. Documentation in the form of construction plans, cost estimates, and schedules for additional projects can be provided to MDE upon request. SHA continues planning, design, and construction activities to address various drainage, stormwater management, and water quality issues throughout the watersheds within the 11 NPDES MS4 counties and watersheds statewide.
SHA also continues to reach out to the local agencies, watershed groups, and jurisdictions to partner on a variety of environmental mitigation and water quality improvement projects. SHA participates in local watershed steering committees and attends field meetings with watershed groups to discuss opportunities for stream restoration and stormwater retrofits to address stream degradation and reduce sediment transport in highly urbanized and sensitive watersheds. SHA continues evaluating opportunities to implement watershed restoration projects in cooperation with local jurisdictions as well as address citizens’ concerns regarding drainage issues, flooding, erosion, sediment, highway runoff, stormwater management, TMDL compliance, and other environmental issues.

1-62 Maryland State Highway Administration 10/21/2015 NPDES MS4 Phase I and II Annual Report
H Assessment of Controls
Requirements under this condition include:
1. Continue providing available geographic information system (GIS) highway data to permitted NPDES municipalities and MDE;
2. By the fourth annual report, complete SHA’s Impervious Surface Account as described in Part III.C. (Source Identification);
3. Select for retrofitting impervious areas with poor or no runoff control infrastructure. These projects shall be implemented where water quality improvements can be achieved; and
4. Work with Maryland’s NPDES municipalities to maximize water quality improvements in areas of local concern.
This permit condition requires SHA to assess the effectiveness of the NPDES stormwater program and progress towards improving water quality. SHA was required to develop and receive approval for a monitoring plan that should include chemical, biological, and physical monitoring according to parameters specified in the permit and to submit data annually.
H.1 Restoration Site Approved by
October 21, 2006
SHA developed a proposal and received approval for a watershed restoration project by October 21, 2006 for Long Draught Branch restoration. This project has been fully designed and prepared for advertisement, but it has undergone difficulties in obtaining the joint permit approval for construction and therefore has never been implemented. The monitoring plan for chemical, biological, and physical data has been developed and pre-construction monitoring has been completed. The biological monitoring has continued, while chemical and physical monitoring has been put on hold until the project design is restarted and funded again for construction. The new concept design has been developed in 2014 to address the concerns of multiple agencies and obtain the required permits. SHA will proceed with the joint permit
application and advertise for construction in February 2017, so the project can be constructed in
2017-2018. Post construction monitoring data will be collected after the project completion for several consecutive years in accordance with the permit requirements and the previous delivered monitoring plan (See SHA First Annual Report, 2006, Appendix K). Meanwhile, biological monitoring continues, as mentioned in the Section G and Section D of this report.
H.2 Monitoring Requirements
Based on the previous approval of the Long Draught Branch project by MDE-WMA, significant pre-construction monitoring (physical, chemical and biological) was performed (See Figure 1-39). The final report for the pre-construction monitoring data was included in the SHA Third Annual Report, 2008, Appendix I. Since the project has been delayed, the post-construction monitoring data will not be available until after the construction is completed.
Figure 1-39: Biological Monitoring Efforts
In the interim, SHA performed monitoring of a failed infiltration basin at MD 175 in Howard County to assess pollutant removal efficiency of a

10/21/2015 Maryland State Highway Administration 1-63 NPDES MS4 Phase I and II Annual Report
technically deficient SWM BMP. The study has been concluded and is summarized in the 2012 and the final report with monitoring results was included in Appendix A of the 2012 Annual Report.
As noted earlier in Section D, SHA initiated bioswale monitoring study as well to evaluate effectiveness of this widely used BMP and its pollutant removal efficiency. The study site is located along US 40, west of I-81 in Washington County, at BMP 210197, 210198, and 210199. Monitoring equipment has been installed and the samplers are logging data. The research team has also completed the soil infiltration capacity measurements at all three sites. In the laboratory, the team has completed the digestion on the soil samples provided and measured the basic soil parameters. Testing for heavy metals in the samples is currently underway. Soil samples will be sieved and classified. A draft report was received in December 2014. See Figure 1-40 below for an image of the US 40 Bioswale monitoring equipment.
Figure 1-40: Bioswale Monitoring Equipment
H.3 Annual Data Submittal
Monitoring data for Long Draught Branch pre-construction monitoring was included with previous reports. The 2014 biological monitoring data is included in the Appendix C of this report. The new monitoring data will be delivered to MDE according to permit database format requirements,
as it becomes available.

1-64 Maryland State Highway Administration 10/21/2015 NPDES MS4 Phase I and II Annual Report
I Program Funding
This condition requires that a fiscal analysis of capital, operation and maintenance expenditures necessary to comply with the conditions of this permit be submitted, and that adequate program funding be made available to ensure compliance.
This report represents end of fiscal responsibility for this permit term. SHA has been able to fund its obligations for the all past years with some adjustments. Fiscal analysis is therefore not needed until a new permit is issued. SHA has seen requirements presented for the Bay TMDL as part of WIP process and also has reviewed MS4 permits issued to others. In the near future, SHA will perform funding needs as the next SHA permit is finalized.
In 2006, SHA had procured open-end consultant contracts in the amount of $9 million in order to accomplish both the Phase I and Phase II NPDES permits. SHA has procured open-ended consultant contracts for NPDES services in the amount of $48 million for the next six years to continue our engineering efforts for the future. Contracts totaling $48 million for environmental design services may also be utilized for NPDES related efforts over the next six years.
SHA utilizes Capital Funds (Fund 74 – Drainage and Fund 82 - TMDL) for engineering and construction related activities associated with the NPDES MS4 Permit. In addition to the funding commitment from these two funds, SHA seeks additional funding from a variety of sources such as the Chesapeake Bay Trust fund, State Planning and Research funds (SPR), and SHA
Operations and Maintenance funds in completing NPDES requirements. SHA no longer uses TEP for state project funding. Under the new MAP-21 legislation enacted in 2012, TEP was modified into TAP, and TAP funding is dedicated for locally sponsored projects only. However, SHA serves as a partner in administering these funds and encouraging their use for water quality initiatives.
Currently, SHA tracks only capital fund spending for the NPDES program as a whole. According to our current records, the total spent for the MS4 NPDES, the Stormwater Facility Program and the Industrial NPDES are listed in Table 1-21 below, and Fund 82 projections are shown in Table 1-22.
Table 1-21: SHA Capital Expenditures for NPDES (State Fiscal Years)
Fiscal Year Expenditure (Millions)*
2005 $ 3.40
2006 $ 7.26
2007 $ 5.74
2008 $ 5.73
2009 $ 6.42
2010 $ 8.68
2011 $ 11.62
2012 $ 19.20
2013 $ 28.54
2014 $33.73
2015 $54.57
* Includes Fund 74, 82, Industrial, and SPR Funds. TEP Funds were included through 2012.
Table 1-22: Fund 82 Programmed Funding by Fiscal Year
Fiscal Year
2014* 2015* 2016 2017 2018 2019
GO Bond -- $41.4 M $3.6 M $0 M $100 M $100 M
TTF $25.8 M $0M $59.4 M $74.0 M $23.2M $9.7 M
Total Dollars Allocated
$25.8 M $41.4M $63.0 M $74.0 M $123.2 M $109.7. M
*Actual Expenditures

10/21/2015 Maryland State Highway Administration 1-65 NPDES MS4 Phase I and II Annual Report
J Total Maximum Daily Loads (TMDLs)
The SHA NPDES Phase I permit covering this reporting period states that MDE has determined that owners of storm drain systems that implement the requirements of the permit will be controlling stormwater pollution to the maximum extent practicable. However, the current mandate is to restore the Chesapeake Bay by 2025, and the recently issued MS4 Phase I permit requires that SHA meet assigned waste load allocations (WLAs) for local watershed TMDLs. Therefore, SHA has taken many steps in order to position ourselves to meet these requirements. SHA is developing funding and activities, and updates on SHA’s watershed restoration efforts will be included in future milestone progress reports, data submissions, and annual reports. Expenditures reflected in Table 1-21 on the previous page reflects this increased activity.
Impervious Accounting
Although the SHA permit covering this reporting period does not include a 10% restoration requirement, as was included with other jurisdictions, SHA has been building momentum to address the anticipated requirements in the permit recently issued on October 9, 2015. The target required by SHA’s recently issued permit is to treat 20% of all untreated surfaces within the five year permit term.
In the past year, SHA initiated developing the Impervious Baseline in anticipation for the requirement to submit an impervious surface area assessment. SHA is setting the baseline of October 21, 2010 to coincide with the permit term. Currently, SHA is developing the impervious surfaces and drainage area data layers. The team is also conducting field reviews and reviewing stormwater computations and maintenance records to determine treatment. This effort has been used to develop a preliminary accounting for use in programming
project funds for upcoming watershed restoration projects.
The impervious accounting effort has also included:
• Researching redevelopment credits from the water quality bank
• Ensuring all BMPs are inspected as part of the three year inspection and remediation schedule
• Assessing the protocol for grass swale pavement disconnection (See Figure 1-41 below for example of a Grass Swale Pavement Disconnection)
• Coordinating with Counties to split impervious treatment credits
Figure 1-41: Grass Swale Pavement Disconnection
Restoration Plan Development
SHA has implemented a coordinated effort to meet the anticipated requirement to treat 20% of untreated surfaces as well as the TMDL WLAs. BMPs are being targeted in watersheds with pollutant load reduction needs and to treat impervious surfaces to gain efficiency with both requirements. Furthermore, SHA is actively coordinating with other MS4 jurisdictions to conduct watershed assessments, collaborate on projects, and split credits.
BMP protocols are being developed to allow SHA greater flexibility in cost effective BMP selection. A new protocol is being developed for an Outfall Stabilization BMP, and a revised protocol is being developed for the Tree Planting BMP to better address the restrictions of SHA

1-66 Maryland State Highway Administration 10/21/2015 NPDES MS4 Phase I and II Annual Report
right-of-way. An automated modeling protocol and calculation tool are also under development to improve data management.
See Figure 1-42 below for a map of current TMDL watersheds with an SHA pollution reduction requirement.
Figure 1-42: Local TMDLs within MS4 Jurisdictions with an SHA Responsibility

Part 2Storm
water Facilities Program
Part 2
Stormwater Facilities Program


10/21/2015 Maryland State Highway Administration 2-1 NPDES MS4 Phase I and II Annual Report
PART TWO
Stormwater and Drainage Asset Program
Introduction
Maryland State Highway Administration (SHA) owns, operates, and maintains an extensive roadway network with a significant drainage and stormwater system. The Stormwater and Drainage Asset Management Program is established to operate and remediate permanent drainage and stormwater assets that convey and treat highway runoff. The program goal is to provide preventive and remedial solutions for the drainage and stormwater infrastructure within the right-of-way. As of 2015, SHA owns and maintains approximately 3638 permanent stormwater management facilities, 180,000 hydraulic structures, and over 100,000 conveyances statewide. Since 1999, SHA has had a comprehensive asset management program to locate, inspect, evaluate, and remediate these assets to sustain their functionality, improve water quality and stability, protect sensitive water resources, and provide an aesthetic and safe transportation system. SHA has developed a detailed inspection and rating system to prioritize and plan remedial activities and preventive maintenance to extend the life expectancy of each asset.
Functionality criteria and business plan objectives have been established for the program. These criteria and objectives provide feedback and allow for result oriented actions and adoptable managing techniques. The business objective of the program is to have 90% of the assets functioning as originally intended.
The Program’s primary goal, which is directly tied to the SHA Business Plan goal of providing a positive contribution to the water quality of the Chesapeake Bay, is to ensure that SHA's SWM facilities are fully functional and perform as intended. In addition, the Program has a secondary goal of strategically enhancing the overall function of existing facilities to meet or exceed the latest SWM standards. During 2015 a rather significant shift in the enforcement of the
SWM Standards took place which will have an impact on facility design and retrofitting activities in the future.
The Program, represented in Figure 2-1, is divided into four major components. These are, planning, design, construction, and operations.
Figure 2-1 - Stormwater Asset Management Program
A. Planning
The SHA Highway Hydraulics Division inspects hydraulic assets (pipes, channels, inlets, and manholes) and stormwater facilities for functionality. The overall goal is to have an up to date inventory, conduct inspections and perform rating assessments based on the MD SHA
Stormwater NPDES Program Standard
Procedures Manual. This enables SHA to prioritize the repair, remediation, and retrofit of SHA-owned SWM facilities and infrastructure.
Engineering
Remediation Rating
Work Order Generation
Retrofit Design
Construction
Area Wide Contracts
Bid -Build Contracts
Immediate Response
Operations
Minor Maintenance
Routine Maintenance Procedures
PlanningInspections & Performance
Rating
Inventory
Data Management
Business Process Improvement

2-2 Maryland State Highway Administration 10/21/2015 NPDES MS4 Phase I and II Annual Report
Assets receive a performance rating that is related to its asset type. For example, pipes and outfalls are rated based on the structural integrity.
The NPDES Municipal Separate Storm Sewer System (MS4) permit requires SHA to identify all storm drainage conveyance infrastructure that captures, treats, and conveys stormwater runoff from SHA properties in certain areas of the State. SHA is strategically expanding its program to cover all areas of the State within its right-of-way. In 2015 we were able to make strides in this effort with the completion of SWM inventory inspections in all counties outside the NPDES permit area with the exception of Garrett County. The properties associated with this drainage infrastructure include roadways, welcome centers, SHA shops, parking lots, and park and rides. Data includes identification and inspection of hydraulic structures, pipe conveyances, stormwater management facilities, and outfalls. In particular, inspections address:
• Visual, functional, and environmental enhancement, upgrade, and retrofit of SWM facilities, including upgrades related to safety.
• Site and SWM facility monitoring, research, and innovative technology tool development.
A.1. Inspection and Performance Ratings
Initial SWM facility field inspections and inventories have been completed for all counties, both MS4 and non-MS4 counties. The information is used to verify existing data in the SHA database as well as determine the SWM facilities functional rating and provide any necessary remedial action recommendations. The statewide inventory is continuously updated on a county-by-county basis.
The inspection protocol is documented in Chapter 3 of “Maryland State Highway Administration
Stormwater NPDES Program, Standard
Procedures – Performance Rating.”
During initial field assessments, individual parameters of each SWM facility are scored (on a scale 1 to 5). Scores are used to establish an
overall SWM facility performance rating as follows:
A No Issues. The SWM facility is functioning as designed with no adverse conditions identified. There are no signs of impending deterioration.
B Minor Problems. The SWM facility functions as designed, but minor issues are observed that may worsen to the next rating level if not repaired in a reasonable timeframe.
C Moderate Problems. The SWM facility functions as designed, but efficiency, performance and function have been significantly compromised and may worsen to the next rating level if not repaired in a reasonable timeframe.
D Major Problems. The SWM facility no longer functions as designed and efficiency has been compromised. Repair or remediation should be performed.
E Severe Problems. The SWM facility no longer functions as designed and efficiency as well as several critical parameters have been compromised. The SWM facility shows signs of deterioration and/or failure, requiring immediate remedial action.
Major effort for NPDES database and SWM inspections updates have been underway in 2015 in order to maintain the most current status of the SWM assets inventory functionality. SHA initiated re-inspection in most NPDES Counties, including Baltimore, Harford, Howard, Anne Arundel and Montgomery Counties. All updates should be completed by October 2016.
The inventory inspections are used to develop action ratings and prioritization for remediation. The remedial inspection protocol describing field assessment methodologies used for determining the observed functionality of a SWM facility and providing guidance for remedial actions is included in Chapter 7 of the “Maryland State
Highway Administration Stormwater NPDES
Program Standard Procedures.” The

10/21/2015 Maryland State Highway Administration 2-3 NPDES MS4 Phase I and II Annual Report
assessments and recommended action ratings provide consistency that enables SHA to adequately allocate sufficient timing and funding that ensures an appropriate schedule of remediation activities.
A.2. Inventory
SHA’s SWM facility inventory database is frequently updated as new facilities are brought online. Updates occur statewide for SHA’s entire highway and facility infrastructure in each Maryland county, including all Phase I and II MS4 locations as well as those locations not presently covered under the Phase I or II permits. Inventoried SWM facilities include those owned and maintained by SHA. SHA also inventories
facilities owned and maintained by other jurisdictions, municipalities, or other entities if they receive and manage stormwater runoff from SHA right-of-way. Table 2-1 summarizes the total number of SWM facilities that intercept and manage stormwater runoff from the SHA highway network and highway-related assets; the information is grouped by county.
Compared to the previous reporting period, several counties show an increase in the total number of SWM facilities managing runoff from SHA roadway networks and assets. Increases may occur for several reasons, including but not limited to, new developments adjacent to SHA roadways, improvements to the SHA roadway network, and construction of new SWM facilities in areas of the roadway network previously not serviced by adequate SWM facilities.
Table 2-1 – Stormwater Asset Management Program in MS4 Counties
County No Action Routine Major Remedial Retrofit Design % Funct. Total Invent.
Anne Arundel 195 281 91 23 80.7% 590
Baltimore 118 92 44 3 81.7% 257
Carroll 84 18 3 0 97.1% 105
Cecil 3 12 6 0 71.4% 21
Charles 179 10 0 0 100.0% 193
Frederick 174 19 0 0 100.0% 193
Harford 100 61 0 6 96.4% 167
Howard 459 84 32 3 93.9% 578
Montgomery 111 214 23 4 92.3% 352
Prince George’s 209 167 75 1 83.2% 452
Washington 181 15 5 2 96.6% 203
Totals 1813 973 279 42 89.7% 3107
SHA conducts Stormwater Asset Management Statewide, however, the information in this table represents MS4 Phase I and II jurisdictions only.
A.3. Data Management
SHA has performed an inventory of all SWM drainage infrastructure in each NPDES MS4 county, and performs SWM facility inspections in all twenty-three counties statewide. A new data collection effort has begun in non MS4 counties. The statewide SWM facility inventory
database was finalized in 2011. SHA continues the re-inspection effort, which involves continuous updates of GIS data for source identification and database records of inspection and remediation activities.
SHA has finalized the structure of the ESRI geodatabase and detailed schema that allows for the establishment and enforcement of topologic

2-4 Maryland State Highway Administration 10/21/2015 NPDES MS4 Phase I and II Annual Report
and/or network rules and unique data entry. Domain rules are updated as needed. The database format has resulted in improved data intelligence and integrity. SHA integrates the geodatabase with other organizational initiatives such as eGIS and iMAP (discussed below) to improve communication between offices. This is an ongoing process that continues to improve.
SHA uses two custom software programs to collect and store geospatial information: the Office Tool and the Field Tool. The Office Tool is used to input data as well as perform quality assurance (QA) reviews. The Field Tool is used with GPS coordinate units to collect and edit field data.
Along with the database format, the customized data viewer tool known as the NPDES Viewer,
has been recently enhanced. The tool allows a user to view spatial information as well as digital images associated with each SWM facility, including as-built plans, photographs, inspection reports and other pertinent documents. NPDES
Viewer is used to view data at various focus levels, such as highway corridors, SHA districts, counties, or watersheds.
A new component for SWM facility maintenance tracking, called the Remediation Tool, has been added to the NPDES Viewer. The application allows the tracking of routine upkeep and major repair activities, associated costs, retrofit project progress, and current functionality of SWM facilities. It can also output data reports that can be shared with managers and administrators.
A.4. Business Process Improvement
The program is undergoing a strategic planning effort to improve business processes, better serve our customers and efficiently use available resources. The planning effort will be completed in four phases
• Review of existing business processes and technical documents
• Review of new industry technologies and similar business processes for asset management
• Develop revised business processes and technical documents
• Implement business processes and new technology
B. Engineering
Assets with major deficiencies that entail more than minor maintenance require a detailed Remedial Assessment to determine specific causes of deficiencies and to develop a remedial action plan. Procedures have been developed that assist with decisions on maintenance, repair, and remediation of drainage and SWM assets. These assessment guidelines document the methodologies to be used in the field for assessing and determining remedial actions necessary for restoring stability and functionality. Also, the procedures provide information on field preparation, data management of collected information, as well as development of remedial assessment reports and work orders for maintenance crews.
B.1. Remediation Rating System
Response actions are divided into various categories of activities: no action, minor or routine upkeep and preventative maintenance, major repair, and retrofit or enhancement. The following outlines the official ratings that help determine the next steps in the process.
. I No Response Required - The asset is functioning as designed. Re-schedule for the next multi-year inspection assessment period.
Figure 2-2: Infiltration Sand Filter Rated I
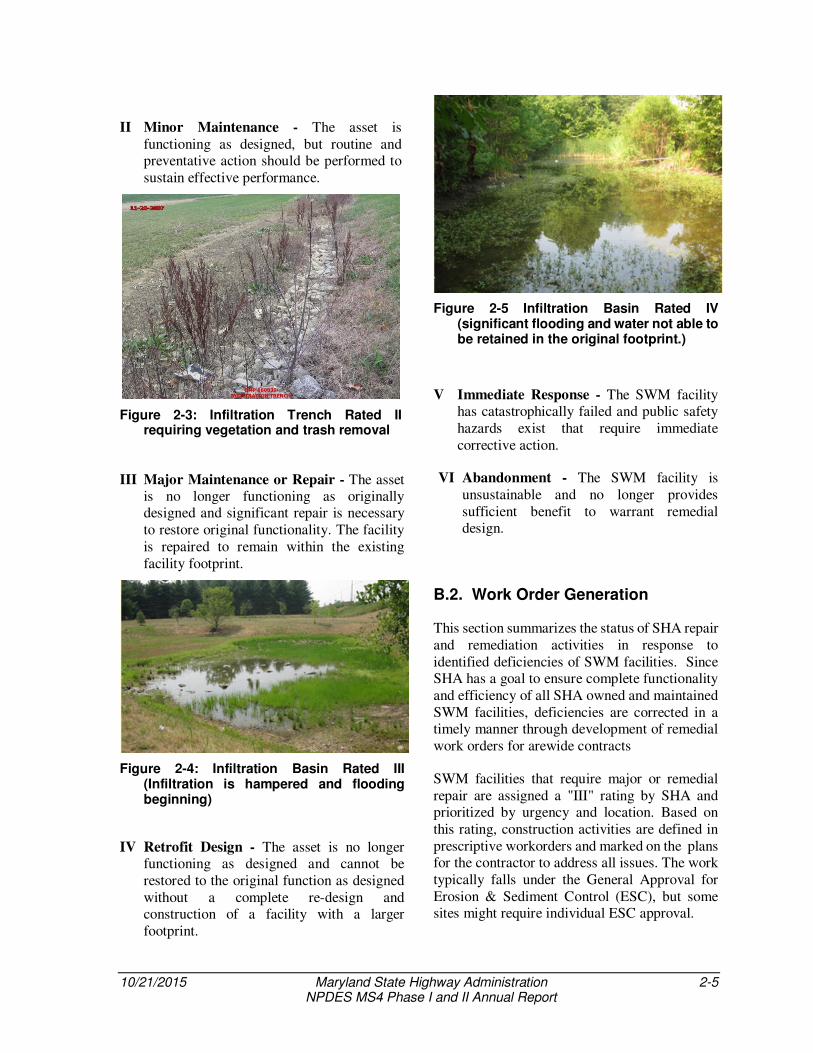
10/21/2015 Maryland State Highway Administration 2-5 NPDES MS4 Phase I and II Annual Report
II Minor Maintenance - The asset is functioning as designed, but routine and preventative action should be performed to sustain effective performance.
Figure 2-3: Infiltration Trench Rated II requiring vegetation and trash removal
III Major Maintenance or Repair - The asset is no longer functioning as originally designed and significant repair is necessary to restore original functionality. The facility is repaired to remain within the existing facility footprint.
Figure 2-4: Infiltration Basin Rated III (Infiltration is hampered and flooding beginning)
IV Retrofit Design - The asset is no longer functioning as designed and cannot be restored to the original function as designed without a complete re-design and construction of a facility with a larger footprint.
Figure 2-5 Infiltration Basin Rated IV (significant flooding and water not able to be retained in the original footprint.)
V Immediate Response - The SWM facility has catastrophically failed and public safety hazards exist that require immediate corrective action.
VI Abandonment - The SWM facility is unsustainable and no longer provides sufficient benefit to warrant remedial design.
B.2. Work Order Generation
This section summarizes the status of SHA repair and remediation activities in response to identified deficiencies of SWM facilities. Since SHA has a goal to ensure complete functionality and efficiency of all SHA owned and maintained SWM facilities, deficiencies are corrected in a timely manner through development of remedial work orders for arewide contracts
SWM facilities that require major or remedial repair are assigned a "III" rating by SHA and prioritized by urgency and location. Based on this rating, construction activities are defined in prescriptive workorders and marked on the plans for the contractor to address all issues. The work typically falls under the General Approval for Erosion & Sediment Control (ESC), but some sites might require individual ESC approval.
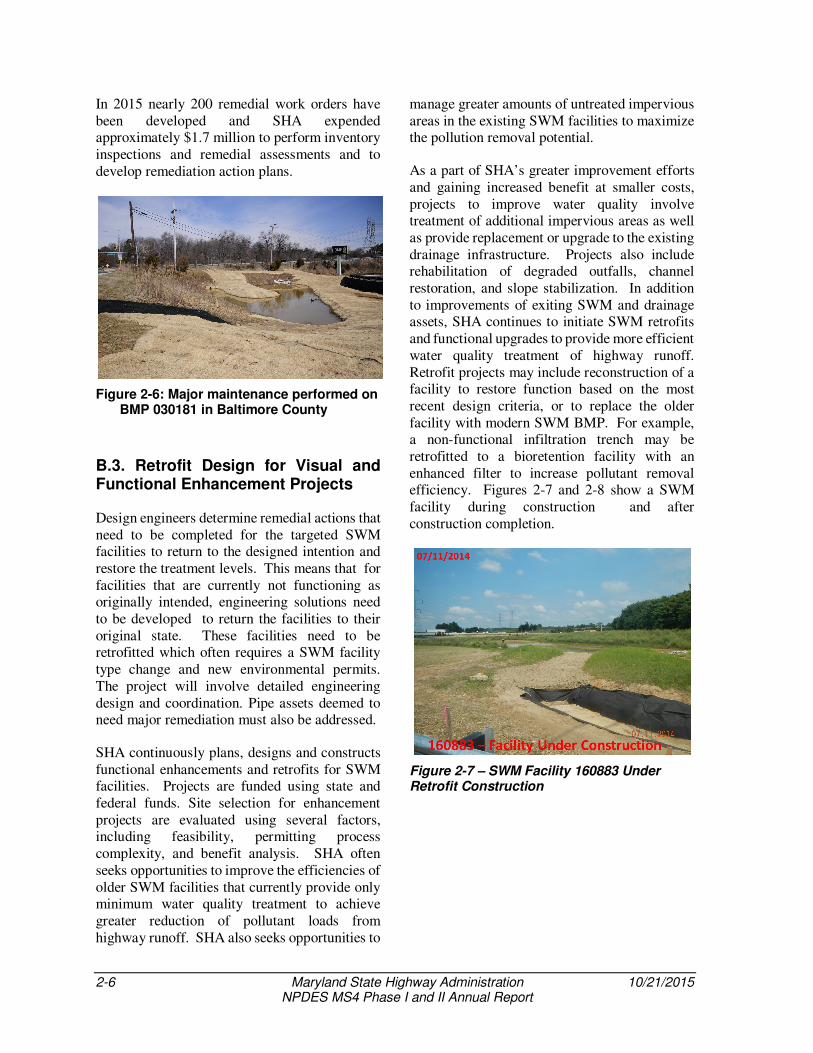
2-6 Maryland State Highway Administration 10/21/2015 NPDES MS4 Phase I and II Annual Report
In 2015 nearly 200 remedial work orders have been developed and SHA expended approximately $1.7 million to perform inventory inspections and remedial assessments and to develop remediation action plans.
Figure 2-6: Major maintenance performed on BMP 030181 in Baltimore County
B.3. Retrofit Design for Visual and Functional Enhancement Projects
Design engineers determine remedial actions that need to be completed for the targeted SWM facilities to return to the designed intention and restore the treatment levels. This means that for facilities that are currently not functioning as originally intended, engineering solutions need to be developed to return the facilities to their original state. These facilities need to be retrofitted which often requires a SWM facility type change and new environmental permits. The project will involve detailed engineering design and coordination. Pipe assets deemed to need major remediation must also be addressed.
SHA continuously plans, designs and constructs functional enhancements and retrofits for SWM facilities. Projects are funded using state and federal funds. Site selection for enhancement projects are evaluated using several factors, including feasibility, permitting process complexity, and benefit analysis. SHA often seeks opportunities to improve the efficiencies of older SWM facilities that currently provide only minimum water quality treatment to achieve greater reduction of pollutant loads from highway runoff. SHA also seeks opportunities to
manage greater amounts of untreated impervious areas in the existing SWM facilities to maximize the pollution removal potential.
As a part of SHA’s greater improvement efforts and gaining increased benefit at smaller costs, projects to improve water quality involve treatment of additional impervious areas as well as provide replacement or upgrade to the existing drainage infrastructure. Projects also include rehabilitation of degraded outfalls, channel restoration, and slope stabilization. In addition to improvements of exiting SWM and drainage assets, SHA continues to initiate SWM retrofits and functional upgrades to provide more efficient water quality treatment of highway runoff. Retrofit projects may include reconstruction of a facility to restore function based on the most recent design criteria, or to replace the older facility with modern SWM BMP. For example, a non-functional infiltration trench may be retrofitted to a bioretention facility with an enhanced filter to increase pollutant removal efficiency. Figures 2-7 and 2-8 show a SWM facility during construction and after construction completion.
Figure 2-7 – SWM Facility 160883 Under Retrofit Construction

10/21/2015 Maryland State Highway Administration 2-7 NPDES MS4 Phase I and II Annual Report
Figure 2-8 – SWM Facility 160800 After Construction
C. Construction
Major repair activities are performed to address significant deficiencies of SWM facilities. Activity schedules are based on local needs. In addition, geospatial data is also used to help combine activities together so they can be performed on multiple facilities in proximity to one another. This allows work to be completed with greater efficiency and lower costs. Entire roadway corridors can often be completed within a few weeks. The purpose of the construction activities is to restore the performance of the asset as well as prevent failure of specific functional elements. Actions may include dredging, sediment removal, and obstruction removal within pipes. Work also may include removal of sediment from facilities to maintain the required water volume. Often larger scale activities include total reconstruction to upgrade a facility in an attempt to enhance function and increase treatment capacity.
C.1. Area Wide Contracts
Many drainage systems and stormwater facilities remediation activities are performed through open-end construction contracts. Typically SHA administers concurrently 2-4 areawide contracts in value of $3-$4 million each to address deficiencies of stormwater facilities, drainage
system repairs or outfall channel stabilization. Over the years, this construction mechanism has been proven to be the most efficient and effective construction method to timely address urgent drainage and stormwater needs. The annual expenditures of the AW contracts vary from $5 to $7 million. SHA procured 2 new AW contracts in 2015 to keep up with the rapidly increasing demand of growing SWM inventory and the SWM facilities functionality, therefore an additional contract is under development for 2016 advertisement.
In the past year, SHA performed major remediation of 73 stormwater management facilities in Anne Arundel, Prince George’s Baltimore, Howard and Montgomery Counties. The total construction cost of SWM major remediation under arewide contracts was $2.7 million.
C.2. Immediate Response
In the event of an emergency, SHA immediately performs work to ensure public safety. SHA responds to any outfall or SWM facility that requires immediate repair and remediation. Roadways are closed as necessary and detour routes are implemented as needed. Site assessment and investigation occurs at the subject location within hours by a multi-disciplinary team. On-call contractors are mobilized and plans for repairs are initiated within 24-hours.
C.3. Bid -Build Contracts
Most of the SWM major retrofit projects have been implemented through traditional bid-build contracts. Currently 10 SWM facility retrofits are under construction along MD 32 in Anne County, and one project at US 29 has been recently completed. Four additional projects are under design in Anne Arundel and Saint Mary’s County and will be advertised in 2016 to restore the facilities’ functionality.

2-8 Maryland State Highway Administration 10/21/2015 NPDES MS4 Phase I and II Annual Report
SHA continues to search for potential SWM sites to provide treatment of currently untreated impervious surface and maintain positive balance in the SHA Water Quality Bank. Several suitable sites have been identified, retrofit projects are in planning stage and the design will be initiated in the upcoming years.
D. Operations
District operations are key in preventive maintenance of the SWM facilities as a whole to assure long term sustainability. By developing a systematic approach over time, costs have been saved, planning for better spending is ramped up and the overall approach shifts from a reactive approach to drainage complaints to a proactive approach to asset management.
D.1. Minor Maintenance
SWM facilities requiring minor upkeep are assigned "II" rating by SHA. Minor repair activities are performed by District Operational staff to better address the routine maintenance needs of the growing inventory. Routine upkeep or minor and preventive repairs are generally activities that address minor deficiencies and may include actions such as mowing, brush cutting, vegetative thinning, unwanted woody vegetation removal, invasive weed removal, and trash or debris removal. The purpose of the maintenance activities is to maintain the performance of the SWM facilities and prevent or eliminate conditions that deteriorate function. SWM facilities that are functioning as designed are kept on a schedule with District Maintenance in order to maintain their assigned “I” rating.
D.2. Routine Maintenance Procedures
SHA is currently developing a statewide operational manual for stormwater and drainage assets. The first draft of this manual has been completed for a Pilot District and is currently under review by the District Maintenance, the
Highway Hydraulics Division, the Office of Environmental Design, the Office of Maintenance and others. Once the first draft is complete the same format will be used for the shops statewide.
E. Summary
The NPDES MS4 permit requires SHA to identify all infrastructure that captures, treats, and conveys stormwater runoff from SHA facilities such as roadways, welcome centers, and park and rides, including hydraulic structures and stormwater management facilities. SHA owns and maintains approximately 3638 SWM facilities statewide. Based on current estimates, SHA also owns and maintains over 130,000 hydraulic structures and 85,000 conveyances in MS4 Counties. Since 1999, SHA has maintained and expanded a comprehensive asset management program to locate, inspect, evaluate, and remediate stormwater facilities to sustain their functionality, improve water quality, and protect sensitive water resources. SHA has developed a comprehensive inspection and rating system to prioritize and plan remedial activities and preventive maintenance to extend the life expectancy of each asset.
The SHA Business Plan goals exceed the NPDES Phase I permit requirements by promoting a complete statewide inventory and maintaining high-efficiency SWM facility performance. A key goal is to maintain 90 percent of all SHA-owned SWM facilities at full functionality. Currently, 90.3% of the SHA-owned and maintained facilities within the inventory meet the functionality goal. Figure 2-9 on the following page shows the functional ratings and the projected SWM inventory growth and trend.
Key program components and structures exemplify a strategic approach to meet NPDES permit requirements, allowing for the enhancement of SWM facility performance

10/21/2015 Maryland State Highway Administration 2-9 NPDES MS4 Phase I and II Annual Report
efficiency and reducing the pollutant loads contained in highway runoff. The integration of these components significantly improves
water quality in the local waterways and the sensitive Chesapeake Bay Watershed overall.
Figure 2-9: SWM Inventory Functional Rating and Projected Trend


Appendix AGeospatial Database & Data Dictionary
Appendix A
Geospatial Database and Data Dictionary


10/20/2015 Maryland State Highway Administration A-1 NPDES MS4 Phase I and II Annual Report
Appendix A: SHA Database Dictionary
A Introduction
The NPDES Annual Report database submittal includes an Esri file geodatabase and several Microsoft Excel files prepared in compliance with table specifications detailed in the SHA’s National
Pollutant Discharge Elimination System
(NPDES) Municipal Separate Storm Sewer
System (MS4) Discharge Permit, Attachment A:
Annual Report Databases, which was provided to SHA on June 26, 2012.
This database dictionary for the submittal incorporates the existing specifications for the required attribute definitions within each table specification and includes additional fields and associated descriptions provided by SHA. Supplemental information for each layer is provided, as necessary, to detail the lineage of the datasets.
B File Formats
The 2015 Annual Report databases for each table exhibit detailed in Attachment A of the permit are provided in Microsoft Excel and an ArcGIS 10.1 file geodatabase named SHA_AttachmentA_Geodatabase.gdb. This information was exported from the enterprise SDE geodatabase environment and processed into the required Attachment A table structures. A supplemental ArcGIS 10.1 file geodatabase of the full SHA stormwater facilities enterprise database has also been provided with this submittal.
C Contents
Within the “Databases” folder on the CD deliverable, the following Microsoft Excel files are provided:
• Table A - Storm Drain Outfalls.xlsx
• Table B - Urban BMP SWM Facilities.xlsx
• Table C - Impervious Surfaces.xlsx
• Table C1 - Impervious Watershed Acreages.xlsx
• Table D - Water Quality Improvement Projects.xlsx
• Table E - Monitoring Site Locations.xlsx
• Table E1 - Monitoring Site Locations - Land Use.xlsx
• Table E2 - Monitoring Site Locations - SWMBMP.xlsx
• Table F - Chemical Monitoring Results.xlsx
• Table H - Biological Habitat Monitoring.xlsx
• Table I - IDDE.xlsx
The associated spatial databases are provided in support of the deliverable within two separate Esri file geodatabases:
• SHA_AttachmentA_Geodatabase.gdb - Includes all Attachment A spatial datasets.
• SHA_NPDES_2015geodatabase.gdb - Includes a full export of the SHA enterprise structural stormwater facility database.
Contents of the SHA_AttachmentA_Geodatabase.gdb are listed below and the contents and data structures are described in the following pages:
• TABLE_A_STORM_DRAIN_OUTFALLS (feature class)

A-2 Maryland State Highway Administration 10/20/2015 NPDES MS4 Phase I and II Annual Report
• TABLE_B_URBAN_BMP_SWM_FACILITIES (feature class)
• TABLE_C_IMPERVIOUS_SURFACES (feature class)
• TABLE_C1_IMPERVIOUS_WATERSHED_ACREAGES (table)
• TABLE_D_WATERQUALITY_IMPV_PROJECTS (feature class)
• TABLE_E_MONITORINGSITES_LOCATIONS (feature class)
• TABLE_E1_MONITORINGSITES_LANDUSE (table)
• TABLE_E2_MONITORINGSITES_SWMBMP (table)
• TABLE_E3_MONITORINGSITES_DRAINAGEAREAS (feature class)
• TABLE_F_CHEMICAL_MONITORING_RESULTS (table)
• TABLE_H_BIOLOGICAL_HABITAT_MONITORING (table)
• TABLE_I_IDDE (table)
The contents of the SHA_NPDES_2015geodatabase.gdb are detailed below in Table A-1.
Table A-1 SHA NPDES Geodatabase Contents
DATABASE SPATIAL LAYERS TYPE DESCRIPTION
SWMFAC Feature Class
Polygon feature class that stores the spatial representation outline and tabular information pertaining to structural BMPs. Information includes location, BMP type, feature status, and other overlay attributes such as watershed.
BMP_CENTROID Feature Class
Point feature class that stores the spatial representation of the SWMFAC polygon feature class records.
STRUCTURES Feature Class
Point feature class that stores the spatial representation and tabular information pertaining to storm water structures (i.e., inlets, manholes, outfalls, control structures). Information includes structure type, feature status, major outfall (T/F), and other overlay attributes such as watershed.
CONVEYANCE Feature Class
Line feature class that stores the spatial representation and tabular information pertaining to storm water conveyance (i.e., pipe and ditch). Information includes conveyance type, feature status, invert elevations, and other overlay attributes such as watershed.
DRAINAGE_STRUCTURE Feature Class
Polygon feature class that stores the spatial representation and tabular information pertaining to structure features, mainly major outfalls. The drainage areas, in acres, is stored in the table.
DRAINAGE_SWMFACILITY Feature Class
Polygon feature class that stores the spatial representation and tabular information pertaining to structural BMPs. The drainage areas, in acres, is stored in the table.
DATABASE TABLES TYPE DESCRIPTION
END_HEADWALL Table
Contains the outfall and open upstream structures for a storm drain system, such as endsections, projection pipes, headwall, and endwalls. Information includes the type and material of the end structure.
INLET Table Contains the inlet features within the storm drain systems. Information includes the type and material of the inlet, the top of grate, and the length for COG and COS type inlets.
MANHOLE_CONN Table Contains the manhole and other connection features within the storm drain system. Information includes the material and top of manhole lid, when applicable.
PUMPSTN Table Contains the pump stations within the storm drain system. Information includes the station name, install date, number of pumps, and maximum capacity for the station.
DATABASE TABLES TYPE DESCRIPTION

10/20/2015 Maryland State Highway Administration A-3 NPDES MS4 Phase I and II Annual Report
Table A-1 SHA NPDES Geodatabase Contents
SWMRISER Table Contains the storm water BMP control structure, such as box risers and pipe barrel risers. Information includes the material, if a trash rack exists, riser type, and the stage storage elevation.
WEIR Table Contains the weirs and emergency spillways related to storm water BMP storage controls. Information includes the material, if a trash rack exists, and the stage storage elevation.
STRUCTURE_ISSUE Table
Contains issues related to the storm water structure features, and ranks the issue as non-emergency and hazard to public. Selected issues can be buried outfalls, broken grates, damaged slabs, or manhole missing.
FLDSC_SITE Table
Contains the feature and site location information pertaining to an outfall structure, mainly major outfalls, which are being inspected for damage and screened for illicit discharge. Information included includes location and type of outfall.
INSPECTION Table
Contains the inspection records for outfall structures that are inspected and screened for illicit discharge. Information includes date inspected, flow observed (Y/N), and scoring values for odor, deposits, vegetation condition, structure condition, and erosion.
FLOW_CHAR Table
Contains the water sampling results for an illicit discharge chemical sampling of an outfall structure. Information includes a scoring value for the color and clarity of flow, floatable present, water and air temperature, and results for chemical parameters tested for, such as ammonia and chlorine.
FILE_ATTACH_STR Table Contains photographs and filenames related to the outfall structure inspection and screening recorded in the INSPECTION table.
BMP_INSPECTION Table
Contains the inspection records for SWM BMPs that are inspected. Information includes inspection scores for structural, environmental, safety, and functionality parameters. These parameters include riser, embankment, vegetation, performance, safety, and ponding factors.
BMP_INSPECTION_ACTION Table
Contains records related to maintenance actions observed during a BMP inspection. These actions include removal of sediment, fixing structural issues related to the BMP, and maintenance of vegetation and erosion issues.
CONCERNS Table Contains records related to invasive vegetation and/or contaminants, such as oil, observed during the BMP inspection.
FILE_ATTACH_SWM Table Contains photographs and filenames related to the BMP inspection recorded in the BMP_INSPECTION table.
DITCH Table Contains the ditch features within the storm drain conveyance. Information included includes ditch material and dimensions.
PIPES Table Contains the pipe features within the storm drain conveyance. Information includes the type, length, and dimension of the pipe.
PIPE_INSPECTION Table Contains the information about the location and overall rating of a pipe that is inspected.
P_INSP_REC Table Contains high level information pertaining to a pipe inspection, such as if the pipe discharges to water of the US, if the pipe is blocked, or if scour is occurring.
P_INSP_SUBRATING Table Contains detailed rating pertaining to a pipe inspection, such as severe rusting on base of pipe, invert deterioration, complete collapse of the pipe.
P_INSP_PHOTO Table Contains photographs and filenames related to the pipe inspection recorded in the PIPE_INSPECTION table.
CONTRACT Table Contains the list of contract plan sets related to storm drain features. Information includes the contract number, year, and the location and limits of the project.
FILE_SCAN Table Contains the list of contract plan sheets that relate to a storm water management facility. These sheets include title, profiles, details, grading, and/or landscaping plan sheets.
OWNER Table Contains a list of owners that maintain the storm drain features within SHA's NPDES database. Information includes contact information of the owner.
METADATA_INFO Table Contains information pertaining to how and when the storm drain features was added or edited in the SHA NPDES database.
DATABASE TABLES TYPE DESCRIPTION
REF_SWMFAC_BASELINE Table Contains information that associates each SWM Facility record to the 2009 baseline or 2011 current capacity indicator.

A-4 Maryland State Highway Administration 10/20/2015 NPDES MS4 Phase I and II Annual Report
Table A-1 SHA NPDES Geodatabase Contents
REF_RESTORATIONBMPS Table Contains permit restoration projects and associates SWM Facility information
REF_STRUCTURE_OVERLAYS Table Contains all structures with associated overlay information such as District, County, and other geographic information.
REF_SWMFAC_OVERLAYS Table Contains all stormwater facilities with associated watershed and land use information.
D Data Projection
These file geodatabase submittals have been re-projected from SHA’s standard projection into the required projection for MDE, specifically NAD_1983_StatePlane_Maryland _FIPS_1900_Meters. The submittal geodatabases are developed in the following original spatial projection: NAD_1983_StatePlane_Maryland _FIPS_1900_Feet.
E BMP / Structure System Numbering Convention
The BMP system numbering methodology applies a unique seven-digit identification number to each asset. The first two (2) digits indicate the county where the system is located. Table A-2 lists the county code numbers for Maryland. For county codes that begin with a zero (ex. Baltimore County 03), the leading zero is not dropped from any naming convention. The remaining five (5) digits represent the unique system number. For example, 130140 is system 140 located in Howard County (County Code 13).
Table A-2 Maryland County Codes
Code Abbreviation County Name Code Abbreviation County Name
01 AL Allegany 13 HO Howard
02 AA Anne Arundel 14 KE Kent
03 BA Baltimore 15 MO Montgomery
04 CA Calvert 16 PG Prince Georges
05 CO Caroline 17 QA Queen Anne’s
06 CL Carroll 18 SM St. Mary’s
07 CE Cecil 19 SO Somerset
08 CH Charles 20 TA Talbot
09 DO Dorchester 21 WA Washington
10 FR Frederick 22 WI Wicomico
11 GA Garrett 23 WO Worcester
12 HA Harford 24 BC Baltimore City
99 SW Statewide
The individual drainage structures located within a system receive a unique three (3) digit identification number. For example, 1300140.007 is the seventh (.007) structure in the 140th drainage system in Howard County.
Numbering begins with the most downstream structure, usually the outfall, which is assigned the structure number of .001. Structures are then numbered as the system is traced upstream. For initial data collection or adding new systems, the

10/20/2015 Maryland State Highway Administration A-5 NPDES MS4 Phase I and II Annual Report
most downstream structure in any system should be numbered .001. This is convention only, and structures may be numbered out of sequence in the existing geodatabase.
Each system that flows into a BMP is a separate system. The control structure and outfall for a stormwater BMP also starts a new system. Figures A-1 and A-2 show examples of system, structure, and BMP numbering.
Figure A-1 System No. Ex. 1 Figure A-2 System No. Ex. 2
The STRU_ID field definition in Attachment A tables requires a text field with a maximum length of 8 characters. MDE has requested that the STRU_ID number have the designation ‘SHA’ somewhere in the number. As defined above, SHA’s unique STRU_ID values assigned are currently eight characters. SHA has added a field to the layers with Structure and BMP numbers called MDE_STRU_ID (text, 20) that has been processed to include the “SHA” prefix.
F Attachment A - Table Specifications Attribute Definitions
The following tables provide the table specifications for the layers in the
SHA_AttachmentA_Geodatabase.gdb. In the database specification table below, SHA provides a Double number field type in compliance with the required number field designations.
TABLE_A_STORM_DRAIN_OUTFALLS:
The data (See Table A-3) provided is a point feature class representing all existing major outfalls statewide within SHA drainage systems. The drainage area layer is provided as a reference feature class layer in the SHA_NPDES_2015geodatabase.gdb named “DRAINAGE_STRUCTURE”. The outfalls can be joined to this layer using the STRUCTURE_ID common field. The list of outfall type codes are provided below in Table A-4.
Table A-3. Storm Drain System Outfalls (Table A from Attachment A) - Attribute Structure Feature Class Name: TABLE_A_STORM_DRAIN_OUTFALLS
Column Name Data Type Length Description
YEAR DOUBLE Annual report year
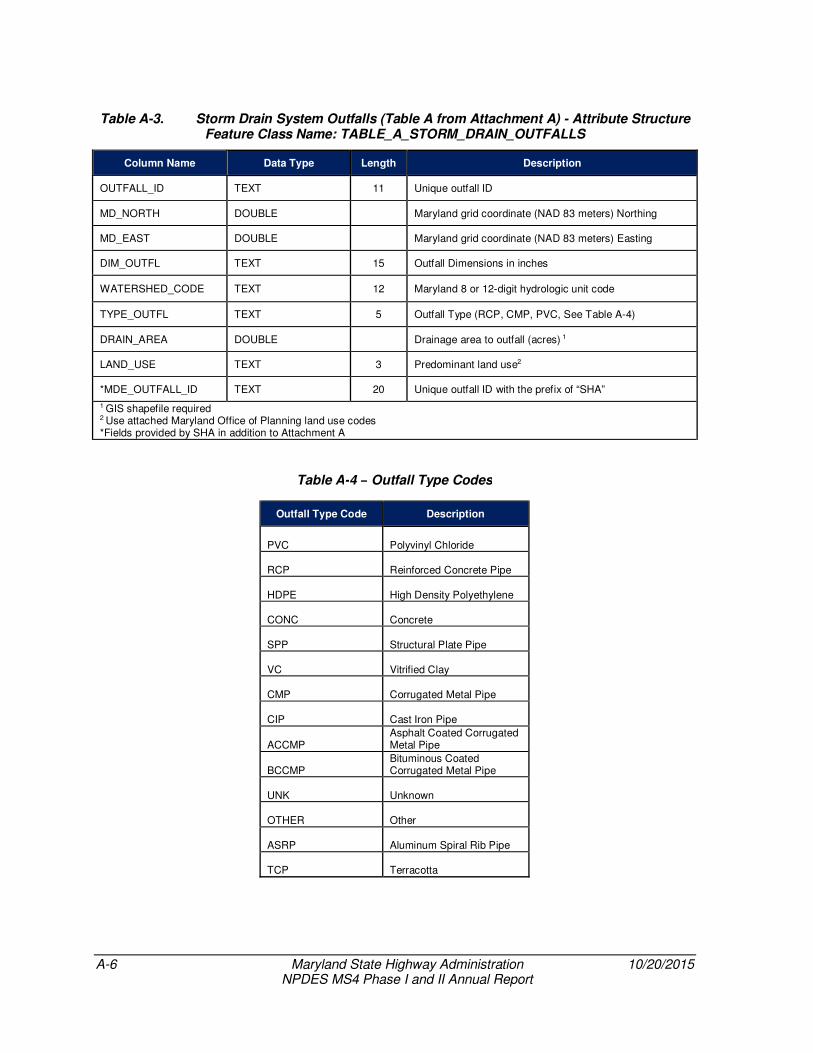
A-6 Maryland State Highway Administration 10/20/2015 NPDES MS4 Phase I and II Annual Report
Table A-3. Storm Drain System Outfalls (Table A from Attachment A) - Attribute Structure Feature Class Name: TABLE_A_STORM_DRAIN_OUTFALLS
Column Name Data Type Length Description
OUTFALL_ID TEXT 11 Unique outfall ID
MD_NORTH DOUBLE Maryland grid coordinate (NAD 83 meters) Northing
MD_EAST DOUBLE Maryland grid coordinate (NAD 83 meters) Easting
DIM_OUTFL TEXT 15 Outfall Dimensions in inches
WATERSHED_CODE TEXT 12 Maryland 8 or 12-digit hydrologic unit code
TYPE_OUTFL TEXT 5 Outfall Type (RCP, CMP, PVC, See Table A-4)
DRAIN_AREA DOUBLE Drainage area to outfall (acres) 1
LAND_USE TEXT 3 Predominant land use2
*MDE_OUTFALL_ID TEXT 20 Unique outfall ID with the prefix of “SHA”
1 GIS shapefile required 2 Use attached Maryland Office of Planning land use codes *Fields provided by SHA in addition to Attachment A
Table A-4 – Outfall Type Codes
Outfall Type Code Description
PVC Polyvinyl Chloride
RCP Reinforced Concrete Pipe
HDPE High Density Polyethylene
CONC Concrete
SPP Structural Plate Pipe
VC Vitrified Clay
CMP Corrugated Metal Pipe
CIP Cast Iron Pipe
ACCMP Asphalt Coated Corrugated Metal Pipe
BCCMP Bituminous Coated Corrugated Metal Pipe
UNK Unknown
OTHER Other
ASRP Aluminum Spiral Rib Pipe
TCP Terracotta

10/20/2015 Maryland State Highway Administration A-7 NPDES MS4 Phase I and II Annual Report
TABLE_B_URBAN_BMP_SWM_FACILITIES:
The data (see Table A-5) provided is a polygon feature class representing all existing baseline SHA owned and maintained stormwater facilities in MS4 Phase I and Phase II counties within SHA drainage systems. The drainage area layer is provided as a reference feature class layer in the SHA_NPDES_2015geodatabase.gdb named “DRAINAGE_SWMFACILITY”. The stormwater facility BMPs can be joined to this layer using the FACILITY_ID common field. The impervious area information associated to the stormwater facilities is currently being updated to support the establishment of an accurate baseline.
There are some facilities in the MS4 counties which do not have an impervious area acreage assigned due to limitations in the existing legacy data that is currently being processed with update improvements. The baseline facilities are being researched to determine existing treatment provided in accordance with the August 2014 Accounting for Stormwater Wasteload
Allocations and Impervious Acres Treated.
This layer includes the BASELINE_YEAR field which indicates if the facility is associated with the 2011 existing treatment baseline (representing the baseline date of October 21, 2010).
Table A-5 Urban Stormwater BMPs (Table B from Attachment A) – Attribute Structure Feature Class Name: TABLE_B_URBAN_BMP_SWM_FACILITIES
Column Name Data Type Length Description
YEAR DOUBLE Annual report year
STRU_ID TEXT 6 Unique structure ID5
PERMIT_NO TEXT 15 Unique permit number
STRU_NAME TEXT 254 Structure name
ADDRESS TEXT 254 Structure address
CITY TEXT 254 Structure address
STATE TEXT 254 Structure address
ZIP TEXT 254 Structure address
MD_NORTH DOUBLE Maryland grid coordinate (NAD 83 meters) Northing
MD_EAST DOUBLE Maryland grid coordinate (NAD 83 meters) Easting
ADC_MAP TEXT 20 ADC map book coordinate (optional if BMP has MD Northing\Easting)
WATERSHED_CODE TEXT 12 Maryland 8 or 12-digit hydrologic unit code
STRU_TYPE TEXT 254 Identify structure or BMP type3
LAND_USE TEXT 3 Predominant land use2
CON_PURPOSE TEXT 254 New development (NEWD), Redevelopment (REDE), or Restoration (REST)
DRAIN_AREA DOUBLE Structure drainage area (acres)1
IMP_ACRES DOUBLE Structure impervious drainage area (acres)1
TOT_DRAIN TEXT 254 Total site area (acres)
WQ_VOLUME TEXT 254 Volume of rainfall depth in inches managed by the practice
RCN TEXT 254 Runoff curve number (weighted)
ON_OFF_SITE TEXT 254 On or offsite structure
APPR_DATE TEXT 254 Permit approval date
BUILT_DATE DOUBLE Construction completion date
INSP_DATE DATE/TIME Record most recent inspection date
GEN_COMNT TEXT 120 General comments

A-8 Maryland State Highway Administration 10/20/2015 NPDES MS4 Phase I and II Annual Report
Table A-5 Urban Stormwater BMPs (Table B from Attachment A) – Attribute Structure Feature Class Name: TABLE_B_URBAN_BMP_SWM_FACILITIES
Column Name Data Type Length Description
LAST_CHANGE TEXT 254 Date last change made to this record
*COUNTY TEXT 2 Codes for MD county.
*LOCATION TEXT 120 Location descriptions
*BASELINE_YEAR TEXT 100 2009 baseline or 2011 current capacity indicator, for MS4 counties only.
*MDE_STRU_ID TEXT 20 Unique structure ID with the prefix of “SHA” 1 GIS shapefile required 2 Use attached Maryland Office of Planning land use codes 3 Use attached urban BMP type code 5 Use attached unique structure identification codes *Fields provided by SHA in addition to Attachment A
TABLE_C_IMPERVIOUS_SURFACES:
The data provided (see Table A-6) is a polygon feature class representing all existing impervious area with SHA right-of-way. The layer identifies the impervious area that is treated by SHA facilities. Within the dataset provided, the data for all Phase I & II permitted counties have been updated and represent current impervious and treatment conditions. The drainage area layer is provided
as a reference feature class layer in the SHA_NPDES_2015geodatabase.gdb named “DRAINAGE_SWMFACILITY”. The stormwater facility BMPs can be joined to this layer using the FACILITY_ID common field. The restoration fields are null at this point in time and will be prepared after the planned completion of the impervious data development updates.
Table A-6. Impervious Surfaces (Table C from Attachment A) – Attribute Structure
Feature Class Name: TABLE_C_IMPERVIOUS_SURFACES
Column Name Data Type
Length Description
YEAR DOUBLE Annual report year
WATERSHED_CODE TEXT 12 Maryland 8 or 12-digit hydrologic unit code
IMP_ACREAGE DOUBLE Total impervious acreage in watershed1
IMP_CONTROLLED DOUBLE Impervious acreage controlled to the maximum extent practicable1
IMP_BASELINE DOUBLE Impervious acreage not controlled to the maximum extent practicable 1, 2
RESTORATION_P DOUBLE Impervious acreage proposed for watershed restoration1
RESTORATION_UC DOUBLE Impervious acreage under construction for watershed restoration1
RESTORATION_C DOUBLE Impervious acreage completed (since program inception) 1
*SHA_OWNED TEXT 5 Impervious ownership by SHA (Yes or No)
*STATUS TEXT 15 Determines if the impervious area is within a treatment drainage area (Inside or Outside)
*COUNTY TEXT 50 County name

10/20/2015 Maryland State Highway Administration A-9 NPDES MS4 Phase I and II Annual Report
Table A-6. Impervious Surfaces (Table C from Attachment A) – Attribute Structure Feature Class Name: TABLE_C_IMPERVIOUS_SURFACES
Column Name Data Type
Length Description
*SOURCE_DESC TEXT 200 Identifies the imagery used to compile the impervious area (source year of aerial imagery)
*CAPTURE_METHOD TEXT 50 Describes the capture method
*ACREAGE DOUBLE Acreage of impervious surface
*IMPERVIOUS_ID TEXT Unique ID used to identify each impervious polygon
1 GIS shapefile required 2 Fixed baseline based on MDE Guidance and approval *Fields provided by SHA in addition to Attachment A
TABLE_C1_IMPERVIOUS_WATERSHED_ACRE
AGES: The data (see Table A-7) provided is a table of records that summarizes the impervious acreage by watershed.
Table A-7. Impervious Surface Acreages by Watershed (Table C1 from Attachment A) – Attribute Structure
Table Name: TABLE_C1_IMPERVIOUS_WATERSHED_ACREAGES
Column Name Data Type Length Description
YEAR DOUBLE Annual report year
WATERSHED_CODE TEXT 12 Maryland 8 or 12-digit hydrologic unit code
*SUM_IMPERVIOUS_ACREAGE DOUBLE Total impervious acreage per watershed
*Fields provided by SHA in addition to Attachment A
TABLE_D_WATERQUALITY_IMPV_PROJECTS: The data (see Table A-8) provided is a polygon feature class representing the watershed restoration projects presented in the Table 1-19 - Watershed Restoration Projects. This layer references specifically the retrofit projects for stormwater facilities. There are six projects for stream restoration and stabilization that are not mapped yet, as these layers are under
construction and the information has been provided in the Microsoft Excel file for those projects. The drainage area layer is provided as a reference feature class layer in the SHA_NPDES_2015geodatabase.gdb named “DRAINAGE_SWMFACILITY”. The stormwater facility BMPs can be joined to this layer using the FACILITY_ID common field.
Table A-8. Water Quality Improvement Project Locations (Table D from Attachment A) – Attribute Structure
Feature Class Name: TABLE_D_WATERQUALITY_IMPV_PROJECTS
Column Name Data Type Length Description
YEAR DOUBLE Annual report year
STRU_ID TEXT 6 Unique structure ID5
STRU_NAME TEXT 254 Structure name
MD_NORTH DOUBLE Maryland grid coordinate (NAD 83 meters) Northing
MD_EAST DOUBLE Maryland grid coordinate (NAD 83 meters) Easting
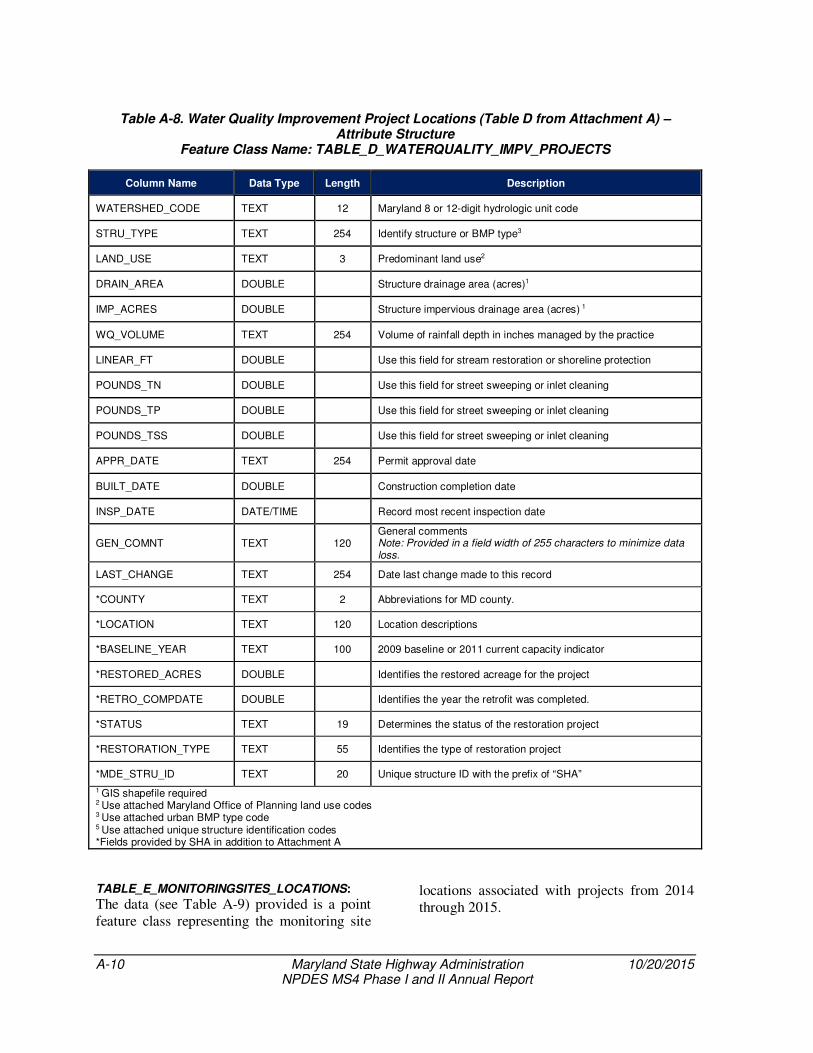
A-10 Maryland State Highway Administration 10/20/2015 NPDES MS4 Phase I and II Annual Report
Table A-8. Water Quality Improvement Project Locations (Table D from Attachment A) – Attribute Structure
Feature Class Name: TABLE_D_WATERQUALITY_IMPV_PROJECTS
Column Name Data Type Length Description
WATERSHED_CODE TEXT 12 Maryland 8 or 12-digit hydrologic unit code
STRU_TYPE TEXT 254 Identify structure or BMP type3
LAND_USE TEXT 3 Predominant land use2
DRAIN_AREA DOUBLE Structure drainage area (acres)1
IMP_ACRES DOUBLE Structure impervious drainage area (acres) 1
WQ_VOLUME TEXT 254 Volume of rainfall depth in inches managed by the practice
LINEAR_FT DOUBLE Use this field for stream restoration or shoreline protection
POUNDS_TN DOUBLE Use this field for street sweeping or inlet cleaning
POUNDS_TP DOUBLE Use this field for street sweeping or inlet cleaning
POUNDS_TSS DOUBLE Use this field for street sweeping or inlet cleaning
APPR_DATE TEXT 254 Permit approval date
BUILT_DATE DOUBLE Construction completion date
INSP_DATE DATE/TIME Record most recent inspection date
GEN_COMNT TEXT 120 General comments Note: Provided in a field width of 255 characters to minimize data loss.
LAST_CHANGE TEXT 254 Date last change made to this record
*COUNTY TEXT 2 Abbreviations for MD county.
*LOCATION TEXT 120 Location descriptions
*BASELINE_YEAR TEXT 100 2009 baseline or 2011 current capacity indicator
*RESTORED_ACRES DOUBLE Identifies the restored acreage for the project
*RETRO_COMPDATE DOUBLE Identifies the year the retrofit was completed.
*STATUS TEXT 19 Determines the status of the restoration project
*RESTORATION_TYPE TEXT 55 Identifies the type of restoration project
*MDE_STRU_ID TEXT 20 Unique structure ID with the prefix of “SHA”
1 GIS shapefile required 2 Use attached Maryland Office of Planning land use codes 3 Use attached urban BMP type code 5 Use attached unique structure identification codes *Fields provided by SHA in addition to Attachment A
TABLE_E_MONITORINGSITES_LOCATIONS:
The data (see Table A-9) provided is a point feature class representing the monitoring site
locations associated with projects from 2014 through 2015.

10/20/2015 Maryland State Highway Administration A-11 NPDES MS4 Phase I and II Annual Report
Table A-9. Monitoring Site Locations (Table E from Attachment A) – Attribute Structure Feature Class Name: TABLE_E_MONITORINGSITES_LOCATIONS
Column Name Data Type Length Description
YEAR DOUBLE Annual report year
STATION TEXT 50 Unique station and stream name
OUTFALL_OR_INSTREAM TEXT 10 Outfall or instream station
WATERSHED_CODE TEXT 12 Maryland 8 or 12-digit hydrologic unit code
MD_NORTH DOUBLE Maryland grid coordinate (NAD 83 meters) Northing
MD_EAST DOUBLE Maryland grid coordinate (NAD 83 meters) Easting
DRAIN_AREA DOUBLE Drainage area in acres1
*STUDY_YEARS TEXT 50 Range of years for the study
1 GIS shapefile required *Fields provided by SHA in addition to Attachment A
TABLE_E1_MONITORINGSITES_LANDUSE: The data (see Table A-10) provided is a table of records representing the associated land use records for each specific monitoring site
location during the period of 2014 through 2015. The STATION field can be used to associate the BMP records to the distinct monitoring site location.
Table A-10. Monitoring Site Locations – Multiple Land Use Values in Drainage Areas (Table E.1 from Attachment A) - Attribute Structure
Table Name: TABLE_E1_MONITORINGSITES_LANDUSE
Column Name Data Type Length Description
YEAR DOUBLE Annual report year
STATION TEXT 50 Unique station ID (associated with unique station ID in section E)
LAND_USE_RANK DOUBLE Ranking of land use from predominant to least
LAND_USE DOUBLE Identify land use2
DRAIN_AREA DOUBLE Drainage area in acres1
1 GIS shapefile required 2 Use attached Maryland Office of Planning land use codes
TABLE_E2_MONITORINGSITES_SWMBMP:
The data (See Table A-11) provided is a table of records representing the associated stormwater BMPs for each specific monitoring
site location during the period of 2014 through 2015. The STATION field can be used to associate the BMP records to the distinct monitoring site location.
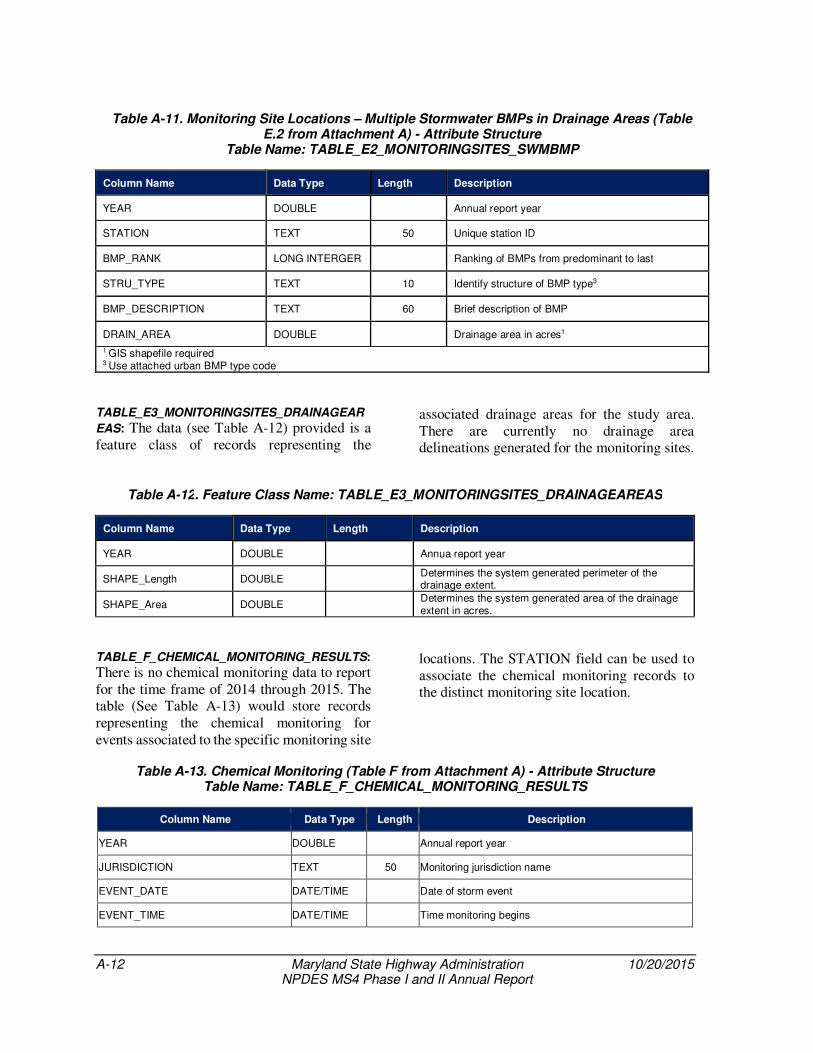
A-12 Maryland State Highway Administration 10/20/2015 NPDES MS4 Phase I and II Annual Report
Table A-11. Monitoring Site Locations – Multiple Stormwater BMPs in Drainage Areas (Table E.2 from Attachment A) - Attribute Structure
Table Name: TABLE_E2_MONITORINGSITES_SWMBMP
Column Name Data Type Length Description
YEAR DOUBLE Annual report year
STATION TEXT 50 Unique station ID
BMP_RANK LONG INTERGER Ranking of BMPs from predominant to last
STRU_TYPE TEXT 10 Identify structure of BMP type3
BMP_DESCRIPTION TEXT 60 Brief description of BMP
DRAIN_AREA DOUBLE Drainage area in acres1
1 GIS shapefile required
3 Use attached urban BMP type code
TABLE_E3_MONITORINGSITES_DRAINAGEAR
EAS: The data (see Table A-12) provided is a feature class of records representing the
associated drainage areas for the study area. There are currently no drainage area delineations generated for the monitoring sites.
Table A-12. Feature Class Name: TABLE_E3_MONITORINGSITES_DRAINAGEAREAS
Column Name Data Type Length Description
YEAR DOUBLE Annua report year
SHAPE_Length DOUBLE Determines the system generated perimeter of the drainage extent.
SHAPE_Area DOUBLE Determines the system generated area of the drainage extent in acres.
TABLE_F_CHEMICAL_MONITORING_RESULTS: There is no chemical monitoring data to report for the time frame of 2014 through 2015. The table (See Table A-13) would store records representing the chemical monitoring for events associated to the specific monitoring site
locations. The STATION field can be used to associate the chemical monitoring records to the distinct monitoring site location.
Table A-13. Chemical Monitoring (Table F from Attachment A) - Attribute Structure Table Name: TABLE_F_CHEMICAL_MONITORING_RESULTS
Column Name Data Type Length Description
YEAR DOUBLE Annual report year
JURISDICTION TEXT 50 Monitoring jurisdiction name
EVENT_DATE DATE/TIME Date of storm event
EVENT_TIME DATE/TIME Time monitoring begins

10/20/2015 Maryland State Highway Administration A-13 NPDES MS4 Phase I and II Annual Report
Table A-13. Chemical Monitoring (Table F from Attachment A) - Attribute Structure Table Name: TABLE_F_CHEMICAL_MONITORING_RESULTS
Column Name Data Type Length Description
STATION TEXT 30 Station name (associated w/ unique station ID in section E.)
OUTFALL_OR_INSTREAM TEXT 10 Outfall or instream station
STORM_OR_BASEFLOW TEXT 10 Storm or base flow sample
DEPTH DOUBLE Depth of rain in inches
DURATION DOUBLE Duration of event in hours and minutes
INTENSITY DOUBLE Intensity = depth/duration
TOTAL_STORM_FLOW_VOLUME DOUBLE Total storm flow volume in gallons
WATER_TEMP DOUBLE Flow weighted average of water temperature (Fahrenheit)
pH DOUBLE Flow weighted average of pH
BOD_dt DOUBLE Biological Oxygen Demand detection limit used in analysis
BOD_EMC0 DOUBLE EMC for Biological Oxygen Demand in mg/l using (0)*
BOD_EMC_dt DOUBLE EMC for Biological Oxygen Demand in mg/l using (dt)**
TKN_dt DOUBLE Total Kjeldahl Nitrogen detection limit used in analysis
TKN_EMC0 DOUBLE EMC for Total Kjeldahl Nitrogen in mg/l using (0)*
TKN_EMC_dt DOUBLE EMC for Total Kjeldahl Nitrogen in mg/l using (dt)**
NITRATE_NITRITE_dt DOUBLE Record Nitrate + Nitrite detection limit used in analysis
NITRATE_NITRITE_EMC0 DOUBLE Enter EMC for Nitrate + Nitrite in mg/l using (0)*
NITRATE_NITRITE_EMC_dt DOUBLE Enter EMC for Nitrate + Nitrite in mg/l using (dt)**
TOTAL_PHOSPHORUS_dt DOUBLE Record Total Phosphorus detection limit used in analysis
TOTAL_PHOSPHORUS_EMC0 DOUBLE Enter EMC for Total Phosphorus in mg/l using (0)*
TOTAL_PHOSPHORUSEMC_dt DOUBLE Enter EMC for Total Phosphorus in mg/l using (dt)**
TSS_dt DOUBLE Total Suspended Solids detection limit used in analysis
TSS_EMC0 DOUBLE EMC for Total Suspended Solids in mg/l using (0)*
TSS_EMC_dt DOUBLE EMC for Total Suspended Solids in mg/l using (dt)**
COPPER_dt DOUBLE Record Total Copper detection limit used in analysis
COPPER_EMC0 DOUBLE Enter EMC for Total Copper in ug/l using (0)*
COPPER_EMC_dt DOUBLE Enter EMC for Total Copper in ug/l using (dt)**
LEAD_dt DOUBLE Record Total Lead detection limit used in analysis
LEAD_EMC0 DOUBLE Enter EMC for Total Lead in ug/l using (0)*
LEAD_EMC_dt DOUBLE Enter EMC for Total Lead in ug/l using (dt)**
ZINC_dt DOUBLE Record Total Zinc detection limit used in analysis
ZINC_EMC0 DOUBLE Enter EMC for Total Zinc in ug/l using (0)*

A-14 Maryland State Highway Administration 10/20/2015 NPDES MS4 Phase I and II Annual Report
Table A-13. Chemical Monitoring (Table F from Attachment A) - Attribute Structure Table Name: TABLE_F_CHEMICAL_MONITORING_RESULTS
Column Name Data Type Length Description
ZINC_EMC_dt DOUBLE Enter EMC for Total Zinc in ug/l using (dt)**
HARDNESS_dt DOUBLE Record detection limit used in analysis
HARDNESS_EMC0
DOUBLE Enter EMC for Hardness in ug/l using (0)*
HARDNESS_EMC_dt
DOUBLE Enter EMC for Hardness in ug/l using (dt)**
TPH_dt DOUBLE Record detection limit used in analysis
TPH_EMC0 DOUBLE EMC for Total Petroleum Hydrocarbons in mg/l using (0)*
TPH_EMC_dt DOUBLE EMC for Total Petroleum Hydrocarbon in mg/l using (dt)**
ENTEROCOCCI_dt DOUBLE Record detection limit used in analysis
ENTEROCOCCI_EMC0 DOUBLE EMC for enterococci in MPN/100 using (0)*
ENTEROCOCCI_EMC_dt DOUBLE EMC for enterococci in MPN/100 using (dt)**
ECOLI_dt DOUBLE Record E. Coli detection limit used in analysis
ECOLI_EMC0 DOUBLE Enter EMC for E. Coli in MPN/100ml using (0)*
ECOLI_EMC_dt DOUBLE Enter EMC for E. Coli in MPN/100ml using (dt)**
*LOCALCONCERN1_CHEM_TYPE TEXT 50 Type of Chemical for Local Concern
LOCALCONCERN1_dt DOUBLE Record detection limit used in analysis
LOCALCONCERN1_EMC0 DOUBLE Enter EMC for in mg/l using (0)*
LOCALCONCERN1_EMC_dt DOUBLE Enter EMC for in mg/l using (dt)**
*LOCALCONCERN2_CHEM_TYPE TEXT 50 Type of Chemical for Local Concern
LOCALCONCERN2_dt DOUBLE Record detection limit used in analysis
LOCALCONCERN2_EMC0 DOUBLE Enter EMC for in mg/l using (0)*
LOCALCONCERN2_EMC_dt DOUBLE Enter EMC for in mg/l using (dt)**
*LOCALCONCERN3_CHEM_TYPE TEXT 50 Type of Chemical for Local Concern
LOCALCONCERN3_dt DOUBLE Record detection limit used in analysis
LOCALCONCERN3_EMC0 DOUBLE Enter EMC for in mg/l using (0)*
LOCALCONCERN3_EMC_dt DOUBLE Enter EMC for in mg/l using (dt)**
*LOCALCONCERN4_CHEM_TYPE TEXT 50 Type of Chemical for Local Concern
*LOCALCONCERN4_dt DOUBLE Record detection limit used in analysis
*LOCALCONCERN4_EMC0 DOUBLE Enter EMC for in mg/l using (0)*
*LOCALCONCERN4_EMC_dt DOUBLE Enter EMC for in mg/l using (dt)**
*LOCALCONCERN5_CHEM_TYPE TEXT 50 Type of Chemical for Local Concern
*LOCALCONCERN5_dt DOUBLE Record detection limit used in analysis

10/20/2015 Maryland State Highway Administration A-15 NPDES MS4 Phase I and II Annual Report
Table A-13. Chemical Monitoring (Table F from Attachment A) - Attribute Structure Table Name: TABLE_F_CHEMICAL_MONITORING_RESULTS
Column Name Data Type Length Description
*LOCALCONCERN5_EMC0 DOUBLE Enter EMC for in mg/l using (0)*
LOCALCONCERN5_EMC_dt DOUBLE Enter EMC for in mg/l using (dt)**
GEN_COMNT TEXT 255 Monitoring comments/documentation
*Fields provided by SHA in addition to Attachment A key: mg/l = milligrams per liter ug/l = micrograms per liter MPN = most probable number per 100 milliliters
Table A-14. Pollutant Load Reductions (Table G from Attachment A) Table Name: N/A (no data available)
This data is currently under construction and is not available at this time. The information will
be provided with the next Annual Report submission.
TABLE_H_BIOLOGICAL_HABITAT_MONITORING: The data (See Table A-15) provided is a table of records representing the associated
biological and habitat monitoring projects performed during the period of 2013 through 2014.
Table A-15. Biological and Habitat Monitoring (Table H from Attachment A) Table Name: TABLE_H_BIOLOGICAL_HABITAT_MONITORING
Column Name Data Type Length Description
YEAR DOUBLE Annual report year
STATION TEXT 50 Unique station ID
WATERSHED_CODE TEXT 50 Maryland 8 or 12-digit hydrologic unit code
MD_NORTH DOUBLE Maryland grid coordinate (NAD 83 Meters) Northing
MD_EAST DOUBLE Maryland grid coordinate (NAD 83 Meters) Easting
DRAIN_AREA DOUBLE Drainage area in acres
BIBI DOUBLE Benthic index of biological indicators
EMBEDDEDNESS DOUBLE Rapid bioassessment protocol score for embeddedness
EPIFAUNAL DOUBLE Rapid bioassessment protocol score for epifaunal
HABITAT DOUBLE Rapid bioassessment protocol score for habitat
LAND_USE SHORT INTEGER Predominant land use
STUDY_DATE DATE/TIME Date the monitoring project occurred
TABLE_I_IDDE:
The IDDE results provided cover the period of September 2013 through September 2014 and represent screenings and samplings performed on major outfalls in Montgomery County. See Table A-16 for data descriptions. The drainage
area layer is provided as a reference feature class layer in the SHA_NPDES_2015geodatabase.gdb named “DRAINAGE_STRUCTURE”. The outfalls can be joined to this layer using the STRUCTURE_ID common field.

A-16 Maryland State Highway Administration 10/20/2015 NPDES MS4 Phase I and II Annual Report
Table A-16. Illicit Discharge Detection and Elimination (Table I from Attachment A) – Attribute Structure
Table Name: TABLE_I_IDDE
Column Name Data Type Length Description
YEAR DOUBLE Annual report year
OUTFALL_ID TEXT 15 Unique outfall ID used in Section A. database
SCREEN_DATE DATE/TIME Field screening date
TEST_NUM TEXT 5 Initial screening, follow-up test, 3rd, etc.
LAST_RAIN DATE/TIME Date of last rain > 0.10”
SCRTIME DATE/TIME Field screening time
OBSERV_FLOW TEXT 3 Was flow observed? (yes/no)
CFS_FLOW DOUBLE Flow rate in cubic feet per second (CFS)
WATERTEMP DOUBLE Water temperature (Fahrenheit)
AIRTEMP DOUBLE Air temperature in (Fahrenheit)
CHEM_TEST TEXT 3 Was chemical test performed? (yes/no)
pH DOUBLE pH meter reading
PHENOL DOUBLE Milligrams per Liter (mg/l)
CHLORINE DOUBLE mg/l
DETERGENTS DOUBLE mg/l
COPPER DOUBLE mg/l
AMMONIA DOUBLE Mg/l
ALGAEGROW TEXT 3 Was algae growth observed? (yes/no)
ODOR TEXT 2 Type of odor4
COLOR TEXT 2 Discharge color4
CLARITY TEXT 2 Discharge clarity 4
FLOATABLES TEXT 2 Floatables in discharge4
DEPOSITS TEXT 2 Deposits in outfall area4
VEG_COND TEXT 2 Vegetative condition in outfall area4
STRUCT_COND TEXT 2 Structural condition of outfall4
EROSION TEXT 2 Erosion in outfall area4
COMPLA_NUM TEXT 3 Is screening complaint driven? (yes/no)
ILLICIT_Q TEXT 3 Was illicit discharge found? (yes/no)
ILLICIT_ELIM TEXT 3 Was illicit discharge eliminated? (yes/no)
*DRAINAGE_AREA DOUBLE Structure Drainage Area1
*COUNTY TEXT 2 Codes for MD county. 1 GIS shapefile required 4 Use Attached Pollution Prevention Activities Codes * Fields provided by SHA in addition to Attachment A

Appendix BQuarterly Report
Appendix B
Quarterly Report


FIRST QUARTERLY
REPORT
Covering February 24th
thru May 1st
2015
Prepared by the Maryland State Highway Administration and submitted to the Maryland Department of the Environment. Prepared to satisfy requirements of SHA’s delegated review and approval authority for Erosion and Sediment Control and Stormwater Management.


TABLE OF CONTENTS I. Introduction ................................................................................................................................................................ 1
II. Project Status Report ................................................................................................................................................. 1
III. QA/QC Activities and Summaries of Site Inspections ............................................................................................... 1
IV. Design Elements Not Meeting ESD to the MEP ........................................................................................................ 2
V. Modifications to the Guidelines and Administrative Procedures ............................................................................. 2
VI. Significant Staffing Changes ..................................................................................................................................... 2
VII. Local Agency Comments and Responses ................................................................................................................. 2
VIII. Summaries of Public Outreach Meetings ............................................................................................................... 2
IX. Investigations of Citizen Complaints and Inquiries ................................................................................................... 2
X. Plan Review Program Activity Findings ..................................................................................................................... 3
LIST OF APPENDIXES
Appendix A. Project Status Reports
Appendix B. Quality Assurance Inspection and Non-Compliance Findings/Actions Taken
Appendix C. Plan Review Division Organizational Chart
Appendix D. Summaries of Public Outreach
Appendix E. Investigations of Citizen Complaints and Inquiries


First Quarterly Report February 24, 2015 through May 1, 2015
Maryland State Highway Administration Page 1
I. INTRODUCTION The Maryland State Highway Administration (SHA) and the Department of the Environment (MDE) signed a
Memorandum of Understanding (MOU), dated July 8, 2014, designating SHA as an approving authority for erosion
and sediment control and stormwater management plans for SHA projects in accordance with the applicable
sections of the Code of Maryland (COMAR). This authority was given by a letter of authorization from MDE on
February 24, 2015. The MOU includes several conditions and this report is written to satisfy the condition
pertaining to reporting which requires SHA to report on relevant activities on a quarterly basis for the first year of
delegated authority including:
Project status reports detailing the progress of design, review, approval, and
construction activity achieved to date
Findings related to plan review program activities
Explanations and justifications for any design elements not meeting Environmental
Site Design to the Maximum Extent Practicable according to the Design Manual or
the 2011 standards
Changes or modifications to the Guidelines and Administrative Procedures
Significant staffing changes
Summaries of site inspections conducted
The letter of authorization, in addition to the previous reporting requirements, requires SHA to report:
Comments received and written responses provided to local agencies
Findings related to quality assurance and quality control activities
Summaries of public outreach meetings
Investigations of citizen complaints and inquiries
For the purpose of this report, summaries of site inspections conducted have been combined with findings related
to quality assurance and quality control activities.
II. PROJECT STATUS REPORT
Project status reports detail and show the progress of design, review, approval and construction activity achieved
during the reporting period. The Plan Review Division maintains a database to track submittals and design
progress on all projects. During this reporting period, the Plan Review Division received 53 submissions on 31
projects, provided 40 comment memorandums, and approved eleven concept design stage submittals and one site
development stage submittal. No projects were issued a final design approval during the reporting period. The
applicable information from this database is included in Appendix A.
III. QA/QC ACTIVITIES AND SUMMARIES OF SITE INSPECTIONS
SHA ensures quality assurance and control of approved erosion and sediment control plans through inspections of
SHA construction projects for compliance with the approved Erosion and Sediment Control Plans, utilizing a
checklist and rating system. During this period, SHA performed 727 inspections on 193 projects to check for
compliance with the approved erosion sediment control plans and found two projects to be non-compliant. These
non-compliance issues were subsequently corrected.
Appendix B includes details and findings regarding the quality assurance and quality control program.

First Quarterly Report February 24, 2015 through May 1, 2015
Maryland State Highway Administration Page 2
IV. DESIGN ELEMENTS NOT MEETING ESD TO THE MEPThe Maryland Legislature enacted the Stormwater Management Act of 2007 which established stringent
requirements to implement Environmental Site Design (ESD) to the Maximum Extent Practicable (MEP). Whenever
the Plan Review Division approves design elements not meeting this criterion at the Final Design stage, these will
be reported. There are no projects that have been approved at the Final Design stage and therefore nothing to
report for this section.
V. MODIFICATIONS TO THE GUIDELINES AND ADMINISTRATIVE PROCEDURES During the reporting period, there have been no documented changes or modifications to the Guidelines,
Administrative Procedures or other documents submitted to obtain authorization.
VI. SIGNIFICANT STAFFING CHANGES
The Plan Review Division had one significant staffing change during this reporting period. At the start of the period
there were two open Team Leader positions. The Office of Highway Development used a competitive selection
process including interviews and offered Mr. Jeffrey Knaub, PE a team leader position. He accepted and joined the
Plan Review Division on April 1, 2015. There remains one vacant team leader position which the division is actively
looking to fill. Appendix C includes an organizational chart for the Plan Review Division as of May 1, 2015.
VII. LOCAL AGENCY COMMENTS AND RESPONSES
State Highway Administration staff from the Plan Review Division and Highway Hydraulics Division met with
Montgomery, Prince George’s and Baltimore County to discuss county waiver concurrence for stormwater quantity
management. SHA has received some resistance from counties regarding requests from SHA for concurrence for
stormwater management waivers. They have expressed concern about the associated liability for their respective
county. SHA is working closely with several counties to resolve this issue.
VIII. SUMMARIES OF PUBLIC OUTREACH MEETINGS
SHA values opinions of the public, our most important customer, and holds numerous public outreach meetings to
solicit input to add value to our designs and to obtain useful feedback. Appendix D includes a summary of
scheduled meetings on various projects during the reporting period. This summary was compiled from monthly
lists prepared by SHA’s Office of Planning and Preliminary Engineering Environmental Planning Division’s Public
Involvement Section. SHA holds public outreach meetings for projects in all phases of the design and delivery
process including planning, design and construction. Many of these projects are not under review by the Plan
Review Division and may not be at Maryland Department of Environment for review.
IX. INVESTIGATIONS OF CITIZEN COMPLAINTS AND INQUIRIES
SHA strives to provide outstanding customer service; the Highway Hydraulics Division utilizes a tracking tool to
assist in providing this. There were twenty-six inquiries and complaints received between February 24, 2015 and
May 1, 2015 with twelve being brought to a resolution. A report from the tracking tool is included in Appendix D
and shows all incoming drainage and erosion complaints and inquiries to the Highway Hydraulics Division during
the reporting period.

First Quarterly Report February 24, 2015 through May 1, 2015
Maryland State Highway Administration Page 3
X. PLAN REVIEW PROGRAM ACTIVITY FINDINGS There are several findings and activities to report:
There is general confusion amongst designers regarding the new process and procedures and the Plan
Review Division is developing training and outreach for designers to explain the process to SHA offices
and districts.
SHA is investigating the Q2 and Q10 year flow quantity management table and has determined there are
discrepancies between Table 1 and the respective county stormwater management ordinances.
The Plan Review Division has met with three counties to discuss quantity management and, at this time,
the Guidelines are being followed. The guidelines specify that concurrence should be obtained from the
county for all variances for quantity control.
In addition to reviewing projects, the Plan Review Division is working towards reconciling the SHA/MDE
water quality bank, developing water quality summary sheet definitions, developing review procedures
for projects within the Anne Arundel Soil Conservation District and procedures for SHA compliance.


APPENDIX A.
PROJECT STATUS REPORT


PRD# Stage
Sub
mis
sio
n
Contract # Route NameReceived
Submission
Admin
Complete
Notice Co
mp
lete
(Y/N
) Draft
Comments
Comment
Memo Date
Concept
Approved
Site Dev
Approved
Final
Approved
15-PR-0001 Concept 1 CE4035174 MD 272 MD 272, North of Rogues Harbor Rd 01/07/2015 01/20/2015 Y 02/24/2015 02/24/2015
15-PR-0001 Concept 2 04/21/2015 04/24/2015 Y
15-PR-0002 Concept 1 BA5155184 US 1 US 1, Baltimore City Line to I-695 01/21/2015 01/23/2015 Y 02/24/2015 03/06/2015
15-PR-0002 Concept 2 04/22/2015 04/23/2015 Y 04/24/2015 04/29/2015
15-PR-0003 Concept 1 BA7295470 MD 140 MD 140, Culvert Break-out 02/13/2015 02/19/2015 Y 02/24/2015 02/24/2015
15-PR-0003 Concept 2 03/13/2015 03/17/2015 Y 03/13/2015 03/13/2015 03/19/2015
15-PR-0003Site
Development0 Submission withdrawn by HHD 4/15/15
04/09/2015
(withdrawn
04/15/15)
N/A N/A N/A N/A
15-PR-0003Site
Development1 04/21/2015 04/24/2015 Y 04/24/2015 04/27/2015
15-PR-0003Site
Development2 04/30/2015 Y
15-PR-0004 Concept 1 CE2915279 MD 267MD 267, Market St to W. Old Philadelphia Rd,
Sidewalk Retrofit01/23/2015 02/24/2015 Y 02/24/2015 02/24/2014
15-PR-0005 Concept 1 PG8235177 I-95 From I-495 to 1000' N of Old Gunpowder Road 01/30/2015 02/02/2015 Y 02/24/2015 03/06/2015
15-PR-0005 Concept 2 03/13/2015 03/13/2015 Y N/A N/A 03/13/2015
15-PR-0005Site
Development1 03/23/2015 03/26/2015 Y 03/25/2015 03/25/2015
15-PR-0006 Concept 1 PG5115177 MD 210MD 210, from MD 373 (Livingston Road) to
Farmington Road01/30/2015 02/24/2015 Y 02/24/2015 02/24/2015
15-PR-0006 Concept 2 04/08/2015 04/08/2015 Y 04/09/2015 04/09/2015 04/09/2015
15-PR-0006Site
Development1 04/14/2015 04/17/2015 Y N/A N/A 04/16/2015
15-PR-0006 Final Design 1 04/20/2015 04/24/2015 Y 04/24/2015
15-PR-0007 Concept 1 BA5415277 I-695
Withdrawn and submitted to MDE
I-695, W of Stevenson Rd Br to W of
Greenspring Ave
01/30/2015 02/03/2015 Y 02/24/2015 02/24/2015
15-PR-0008 Concept 1 BA0365177 MD 7 MD 7, From Golden Ring Rd to Rossville Blvd 01/30/2015 02/20/2015 Y 02/24/2015 02/24/2015
15-PR-0008 Concept 2
15-PR-0009 Concept 1 PG4675223 I-95I-95/I-495 College Park Truck Weigh and
Inspection Station02/10/2015 02/12/2015 N 02/24/2015 03/06/2015
15-PR-0009 Concept 2 04/27/2015 04/29/2015 Y 04/29/2015 04/30/2015
15-PR-0010 Concept 1 BA6855176 US 40US 40, Chesaco Ave to Todds Lane, Safety &
Spot Improvements02/11/2015 02/12/2015 Y 02/24/2015 03/06/2015
15-PR-0010 Concept 2 04/17/2015 04/21/2015 Y 04/21/2015 04/21/2015 04/21/2015
15-PR-0011 Concept 1 AX7665582 variesSWM at Various Locations in Washington
County - Group 102/11/2015 02/24/2015 Y 02/24/2015 02/24/2015
15-PR-0012 Concept 1 AW730A21 MD346MD 346, 12-DM-WO-002
Slope Stabilization and Repair02/12/2015 02/13/2015 Y 02/24/2015 03/06/2015
15-PR-0012 Concept 2 04/24/2015 04/24/2015 Y 04/27/2015 04/27/2015 04/27/2015
15-PR-0013 Concept 1 AW730A21 MD 589MD 589, 12-DM-WO-003, Turvill Creek
Slope Stabilization & Repair02/12/2015 02/19/2015 Y 02/24/2015 02/26/2015
15-PR-0013 Concept 2 04/27/2015 Y
15-PR-0014 Concept 1 AT0445182 varies TMDL Grass Swales, Anne Arundel Co 02/13/2015 02/18/2015 Y 02/24/2015 02/26/2015
15-PR-0014 Concept 2 04/08/2015 04/09/2015 Y 04/09/2015 04/14/2015 04/14/2015
15-PR-0015 Concept 1 HA4265177 MD 924 MD 924, Holly Wreath Drive to St. Clair Dr 02/19/2015 02/20/2015 Y 02/24/2015 02/24/2015
15-PR-0015 Concept 2 03/06/2015 03/09/2015 Y 03/09/2015 03/09/2015
15-PR-0015 Concept 3 03/19/2015 03/19/2015 Y 03/25/2015 03/25/2015
15-PR-0015 Concept 4 04/10/2015 04/17/2015 Y 04/14/2015 04/16/2015 04/16/2015
15-PR-0015Site
Development1 04/21/2015 04/27/2015 Y
15-PR-0016 Concept 1 WA2815123 I-81I-81 SB Escort Vehicle Area Geometric
Improvements02/25/2015 02/26/2015 Y N/A N/A 02/26/2015
15-PR-0017 Concept 1 PG3335172 I-95 I-95/I-495 Greenbelt Metro Interchange 02/25/2015 03/13/2015 Y 03/13/2015 03/20/2015
15-PR-0018 Concept 1 WO1915174 US 113Critical Area Mitagation at Firehouse wetland
site03/03/2015 03/03/2015 Y 03/06/2015 03/06/2015
15-PR-0018 Concept 2 04/07/2015 04/08/2015 Y N/A N/A 04/09/2015
15-PR-0019 Concept 1 AA7955282 variousTMDL SWM Design,
Group 1, Anne Arundel County03/03/2015 03/03/2015 Y 03/10/2015 03/23/2015
15-PR-0020 Concept 1 MO1665187 I-270 I-270 Slip Ramp South of Gude Dr. 03/13/2015 03/26/2015 Y03/26/2015
04/06/201504/08/2015
15-PR-0021 Concept 1 XX1115180 MD 950Emergency Replacement of Str. 16097X0 MD
950 over Beaverdam Cr03/13/2015 03/13/2015 N/A
site mtg
3/18/15N/A
15-PR-0021 Concept 2 03/19/2015 03/19/2015 N/A N/A N/A 03/19/2015
15-PR-0021Site
Development1
submission returned - no plan, report,
application or checklist provided04/23/2015 04/23/2015 N N/A N/A
15-PR-0022 Concept 1 PG5105177 MD 210 MD 210NB Farmington to Old Fort Rd 03/23/2015 03/24/2015 Y 03/25/2015 03/26/2015
15-PR-0023 Concept 1 AA4365471 MD 175 West of Reece Rd to East of Disney Rd 03/23/2015 03/23/2015 Y 03/27/2015 04/08/2015
15-PR-0024 Concept 1 WA2515176 I 680.9 Miles East of Mountain Rd to Sideling Hill
Rest Area03/25/2015 03/26/2015 Y 03/30/2015 03/30/2015
15-PR-0025 Concept 1 CE3395176 MD 272 MD 272 South of US 40 to Rogers Ave 03/31/2015 04/03/2015 Y 04/20/2015 04/22/2015
15-PR-0026 Concept 1 AL2735177 MD 51 Pack Horse Road to Town Creek 04/06/2015 04/07/2015 Y 04/08/2015 04/09/2015 04/09/2015
15-PR-0027 Concept 1 CL3045130 MD 26 At Oakland Mills Road 04/06/2015 04/08/2015 Y 04/17/2015 04/22/2015
Appendix A.
Page 1 of 2

PRD# Stage
Sub
mis
sio
n
Contract # Route NameReceived
Submission
Admin
Complete
Notice Co
mp
lete
(Y/N
) Draft
Comments
Comment
Memo Date
Concept
Approved
Site Dev
Approved
Final
Approved
15-PR-0028 Concept 1 FR3905184 MD 180 US 340 to Old Holter Road 04/15/2015 04/15/2015 Y 04/16/2015 04/17/2015
15-PR-0029 Concept 1 HO1905181 I-95 Welcome Center Truck Parking Expansion 04/17/2015 04/17/2015 Y 04/17/2015 04/17/2015
15-PR-0030 Concept 1 WA2785187 I-81 I-81 from I-70 to Halfway Blvd 04/27/2015 04/27/2015 Y 04/29/2015 04/30/2015
15-PR-0031 Concept 1 BA5005249 N/AHereford Shop-Storage Tank Removal and
Replacement04/27/2015 Y
Totals 53 50 40 40 11 1 0
Appendix A.
Page 2 of 2

APPENDIX B.
QUALITY ASSURANCE
AND
NON-COMPLIANCE FINDINGS/ACTIONS TAKEN


Quality Assurance Inspections By District
2/24/2015 To 4/30/2015
District: 1
Contract No Project Description # Inspections # Non-Compliance (D-F)
DO3485129 Replacement of the Administration's Cambridge
Maintenance Facilities- Dorchester County
4 0
SO4095171 MD 675 (Somerset Ave.) from MD 362 to MD 822
(UMES Blvd.)
5 0
WI2205177 Grind & Resurfacing on US 50, Old Railroad Rd to E.
of Rockawalkin Rd in Wic. Co.
2 0
WI2335130 U.S. 13 Business at South Division St. Intersection
Improvements, Wic. Co.
5 0
WI3095176 Geometric Improvements U.S. 50 at Walston Switch
Rd.
3 0
WI3285274 US 13 Bus. Drainage Improvements from E. Church
St. to N. of London Ave
4 0
WI3285574 U.S. 13 Business Drainage Improvement from W.
College Ave. to N. of South Blvd. (Phase 5)
4 0
WI3835130 MD Route 349 (Nanticoke Road) at Crooked Oak
Lane Intersection Improvements
4 0
WO2035176 US 113 at MD 12 and MD 365 (Widen and
Resurface)
4 0
WO2235180 Bridge Rehabilitation Dual Steel Beam Bridge No.
2301601 and 2301602 on US 13 (Ocean Highway)
over Pocomoke River
4 0
XY2335177 Miscellaneous concrete work for ADA compliance at
various locations in Dorchester, Somerset,
Wicomico, and Worcester Counties
1 0
Project Count: Total Inspections: 40 0 11
Appendix B. Page 1 of 13

Quality Assurance Inspections By District
2/24/2015 To 4/30/2015
District: 2
Contract No Project Description # Inspections # Non-Compliance (D-F)
AW8965270 MD 404 Dualization West of 309 to Cemetry Road
phase 1B
5 0
CE2895177 From Md 273-A to the Pennsylvania Line 4 0
CE3925177 Safety & Resurfacing MD282 from West of
Corporate Town Limits of Cecilton to MD 213
1 0
CE4005123 TC-35 at MD 299 CCTV Camera Installation at
Cecilton Weigh Station
1 0
CE4465180 Replacement of Bridge No. 07036 on MD 272 over
AMTRAK
4 0
KE2955177 Md. 213, Md. 290 & Md. 313A at Corp. Limits of
Galena-Proposed Resurfacing and Safety
Improvements
4 0
KE2965130 MD 20 at MD 291 in Kent County proposed
Geometric improvements roundabout
2 0
QA2105185 Reconstruction of Lighting Systems East of MD 8 to
West of US 50/301 split (GAP - OOTS)
4 0
QA2655170 US 301 at Md. 304 Interchange Improvements 7 0
QA4845180 Replacement of deck and Rehabilitation of Bridge
No. 17030 on Md. 313 over Chester River
5 0
QA4865177 US. 50 from 301 to .05 miles west of Md. 40-mill and
Resurface
4 0
TA3925171 Steel and Prestressed Concrete Girder Bridge No.
2003400 On MD 331 (Dover Road) Over Choptank
River
6 0
XX5275233 Sidewalk Project Side Walk-ADA Project - Dist. 2
Area Wide
4 0
XY1315185 Modification/ Installation/ Reconstruction of Traffic
Signals in Districts 1 & 2 (GAP- OOTS)
1 0
XY2345133 Area wide ADA Compliance 4 0
XY4055177 Mill/ Grind Patch and resurface Roadway Pavements
var. Locations
1 0
XY4145177 Mill/ Grind Patch and resurface Roadway Pavements
Var. Locations Kent County
1 0
XY4175177 Mill/ Grind Patch and resurface Roadway Pavements
Var. Locations -Queen Anne County
1 0
Project Count: Total Inspections: 59 0 18
Appendix B. Page 2 of 13

Quality Assurance Inspections By District
2/24/2015 To 4/30/2015
District: 3
Contract No Project Description # Inspections # Non-Compliance (D-F)
AT0655474 Drainage & System Preservation at Various
Locations Statewide (GAP-ICD)
5 0
AT0865182 Drainage improvements at various locations in
District 3
4 0
AT0905180 Invert Paving and Restoration of Various Structures 3 0
AX0805124 Integrated Rdside Vegetation Mngm., Invasive
Species Cntrl & Native Plant Est.- I-95/I-495 Corridor
from MD Rt 202 to I-95 & I-95 Corridor from I-495 to
Ho./PG County Line, & Specified Wetland Mitigation
Sites throughout PG & Mont. Counties (GAP-LOD)
4 0
AX2645282 Construction of Stormwater Management Quality
Control Facilities Throughout D-3 (GAP - ICD)
5 0
AX3765H60 ICC PG-C Fish Passage Improvements Indian Creek 5 0
AX3765L60 Intercounty County Connector NW-4 Stream
Restoration of Cricket Lane Tributary
3 0
AX3785R60 Intercounty Connector ES Hollywood Branch Stream
Restoration at Site PB-12
4 0
AX9295182 TMDL Legacy Pavement Improvements in Prince
Georges County (GAP - ICD)
5 0
MO1155177R MD RT 185 From DC Line to North of MD RT 410.
(Safety & Resurface)
2 0
MO1315477 Safety and Resurfacing On MD 28, From Monroe St.
MD 911 and on MD 355, From MD 28 to MD 911
2 0
MO1315677 MD185 (Connecticut Ave) Off Ramp 6 Off I-495 to
Dupont Ave (Safety and Resurfacing)
2 0
MO1405129 Construction of a Salt Storage Facility at the
Administration's Clarksburg Facility in Montgomery
County
3 0
MO1495179 MD 355 Wisconsin Ave. From Grafton St. to MD 191
(Bradley Lane) Sidewalk Retrofit / Montgomery
County (GAP-OOTS)
5 0
MO1595877 MD 124 from MD28 to Orchard Ridge Drive Safety
and Resurfacing
3 0
MO2145186 Chart Depot at Kensington Satelite Maintenance
Shop in Montgomery County
3 0
MO2635177 MD Rt 97 / US 29 From DC / Montgomery Co. Line
to MD 390, Safety & Resurfacing Improvements
3 0
MO4235180 Bridge Deck Replacement on MD RT 650 over Sligo
Creek
3 0
MO4325176 MD124 (MidCounty Highway) at Saybrooke Oaks
Blvd Woodfield Road Safety and Spot Improvements
2 0
MO5825180 Superstructure Replacement with Substructure
Rehabilitation for Bridge # 1513600 on Maryland RT.
193 over I-495
4 0
MO5935270 MD 355 (Rockville Pike) at Ceder Land (Phase 2 and
3) Intersection Reconstruction
3 0
MO5935370 MD 187 (Old Georgetown Road) from South of
Center Dr. to North of W. Cedar Ln. /Oakmont Ave.
Intersection Reconstruct
2 0
MO6735174 US 29-RETROFIT OF SWM FACILITY 150173 AND
SLOPE STABILIZATION
3 0
MO8355176 MD 586 (Veirs Mill Road) at Ferrara Ave - Geometric
Improvements
3 0
MO8545171 Interchange Reconstruction MD 97 at Randolph Rd. 4 0
MO9745277 MD 182 From MD 97 to Longmead Road (Safety and
Resurfacing)
3 0
Appendix B. Page 3 of 13

Quality Assurance Inspections By District
2/24/2015 To 4/30/2015
District: 3
Contract No Project Description # Inspections # Non-Compliance (D-F)
MO9745477 MD 190 River Road From I-495 to MD 614
(Goldsboro Road) Safety and Resurfacing
2 0
PG0785126 Sound Barrier at US 50 and MD 410 4 0
PG0925174 MD RT 216 NB Outfall Improvement at the Patuxent
River-Drainage Improvement
4 0
PG3655176 MD Rt 197 from MD Rt 295 Southbound off ramp To
Brock Bridge Rd. (Safety, Spot Improvements &
Resurfacing)
4 0
PG4195172 I-95 at Contee Road - Interchange Construction 4 0
PG4945172 Phase 2-Reconstruct MD 5 (Branch Ave.) from Auth
Way to South of I-495\I-95 & Construction of Access
Road to Branch Ave. Metro Station
4 0
PG5395177 I-95/I495 (Capital Beltway) from Glenarden Parkway
to North of US 50
4 0
PG5405177 I-95 / I-495 (Capital Beltway) From D’Arcy Rd. to
Arena Dr., Safety and Resurfacing
4 0
PG5435174 US-1 (Baltimore Avenue) Ammendale Road
Drainage Improvements
4 0
PG5465184 MD 500 from MD 208 to MD 410 - Neighborhood
Conservation
3 0
PG6645180 Replacement of Bridge #1618101, and #1618102, on
MD Rt 4 (Pennsylvania Ave.) over MD Rt 223
(Woodyard Rd.), and Resurfacing MD Rt 4 from
Ritchie Marboro Rd. To 0.13 Miles North of Dower
House Rd.
5 0
PG7785284 MD 201 from Kenilworth Towers to Riverdale Rd. 4 0
PG7825184 MD 5 from Curtis Drive to North of Suitland Parkway 5 0
PG7865577 US 301 Safety & Re-surfacing - From MD 5 to
Westwood Drive
4 0
PG7865777 MD RT. 458 (Silver Hill Road) from MD RT 5 to
Walker Mill Road, Safety & Resurface
4 0
PG7945126 I-595 Sound Absorptive Material Removal and
Protective Coating Application
4 0
PG9055177 MD 301 (Robert S Crain Hwy South) from Old Crain
Hwy to Railroad Crossing 529 579U
1 0
PG9795377 MD RT 414 (St. Barnabas Road) from I-95 to MD RT
5-Safety & Resurface.
4 0
PG9795577 MD 5 (Branch Ave.) From MD 223 to South of I-95
Safety & Re-surface
5 0
PG9795677 MD 201 (Kenilworth Ave.) From Good Luck Road to
I-95 Safety & Resurfacing
4 0
XX1115180 Preservation and Minor Rehab of Movable
Bridges,Fixed Bridges,Culverts,and Noise Walls
Area Wide (GAP-SIRE)
7 0
XX2255480 Preservation and Minor Rehab of moveable bridges,
fixed bridges, soundwalls, culverts, retaining walls
statewide (GAP-SIRE)
7 0
XX5265233 Placement and Replacement of Sidewalks and ADA
Ramps at various locations in District 3 Area Wide
(GAP-OOTS)
4 0
XY1515185 Area Wide Traffic Signal Modification, Installation
APS, Reconstruct CPS (GAP-OOTS)
4 0
XY1555185 TS Modify /Reconstruction with APS/CPS in Districts
3,4,7
1 0
Appendix B. Page 4 of 13

Quality Assurance Inspections By District
2/24/2015 To 4/30/2015
District: 3
Contract No Project Description # Inspections # Non-Compliance (D-F)
XY2385185 Traffic Signal/MOD/Install/Reconstruct/APS/CPS in
District 3/Area Wide (GAP-OOTS)
5 0
Project Count: Total Inspections: 193 0 52
Appendix B. Page 5 of 13

Quality Assurance Inspections By District
2/24/2015 To 4/30/2015
District: 4
Contract No Project Description # Inspections # Non-Compliance (D-F)
AT0905280 Invert Paving and Restoration of Various Structures
(Statewide- Baltimore, Cecil, Frederick, Garrett,
Harford, Prince Georges's, Queen Anne's, Talbot,
and Washington Counties)
2 0
AX0705124 Integrated Roadside Vegetation Management,
Invasive Species Control and Native Plant
Establishment along the I-83 corridor from I-95 (SW
Blvd.) to US-40 (Pulaski Hwy) in Baltimore County
and at Specific Wetland Mitigation Sites (GAP-LOD)
2 0
BA0335185 I-695 at Hollins Ferry Road/Washington Boulevard
(GAP-OOTS)
4 0
BA0335285 I-83 at Padonia Road (Interchange Lighting)
Baltimore County (GAP-OOTS)
4 0
BA0495177 I-195 From the Park & Ride to the Bridge over
Francis Avenue Rehabilitation and Resurfacing
3 0
BA0515177 US-40 From East of Patapsco River Bridge to Pine
Street
3 0
BA0545177 MD-150 From North Point Boulevard to Diamond
Point Road Resurfacing and Rehabilitation
4 0
BA0585177 MD 587 from MD 150 to Strawberry Point Road
(Safety and Resurfacing) Baltimore County
4 0
BA0595177 US 40 (Pulaski Highway) from Todds Lane to Md 700
(Martin Boulevard) Safety and Resurfacing
4 0
BA0615174 I-695 Drainage Improvement from Double Rock
Townhouses to US 1 Southbound
1 0
BA0725185 I-83 at Shawan Road Interchange Lighting
(GAP-OOTS)
4 0
BA0785288 US 1 (Southwestern Blvd) Bicycle and Sidewalk
Retrofit Fron US 1 Alt to Baltimore City Line.
1 0
BA0915177 Safety and Resurfacing on I-695 From MD 122 to
2,000 Feet South of MD 26
4 0
BA0935181 I-83 at MD 439 East of Interchange Park and Ride
Lot Expansion
4 0
BA3665170 Replacement of Bridge No. 0311305 on I-695 Inner
Loop over Benson Avenue and Bridge No. 0311405
on I-695 inner Loop over Leeds Avenue, US 1,
Amtrack, and Herbert Run, Realignment of I-695
Inner Loop Ramp 8 Bridge No. 03116 from US 1
over Leeds Avenue.
4 0
BA4055277 Safety and Resurfacing US-40 Eastbound from
Ebenezer Rd to Days Cove Road
5 0
BA4215180 Replacement of Bridge No. 03214 on Middletown
Road over I-83
4 0
BA4585172 I-695 From 41 (Perring Pkwy) to MD 147 (Harford
Rd.)
3 0
BA4625280 Replacement of Bridge on I-695 over Milford Mill
Road
5 0
BA5025180 Deck Replace/Rehab of Bridge MD 129 over I-695 5 0
BA5215176 Reconstruct Interstate Lighting I-695 at I-795,
Perring Pkwy and Providence Rd.in Baltimore
County (GAP - OOTS)
4 0
BA5965177 MD 26 from I-695 to City/County Line Resurfacing
and Rehabilitation - Baltimore County
4 0
BA5975177 Safety and Resurface on MD 45 from North of
Timonium Road to South of Padonia Road in
Baltimore County
3 0
Appendix B. Page 6 of 13

Quality Assurance Inspections By District
2/24/2015 To 4/30/2015
District: 4
Contract No Project Description # Inspections # Non-Compliance (D-F)
BA7275380 Frederick Road (MD 144) Interchange
Reconstruction Baltimore County
4 0
BA7725187 MD 145 & MD 146 Intersection Improvements
Baltimore County
3 0
BA8405149 Pipe Yard Facility Removal Action 4 0
BA8555180 Replacement of Deck for Bridge No. 03095 On MD
150 Over MD 700
4 0
BA8735277 I-83 From I-695 to Shawan Road Safety Resurfacing
and Rehabilitation
5 0
BA9015171 New Salt Storage and Brine Manufacturing Facilities
at the Administration's Route 7 Maintenance Yard,
Baltimore County
3 0
BA9885185 I-83 & Timonium Road and I-695 Edmondson
Avenue (GAP-OOTS)
5 0
HA1075176 Safety & Spot Improvements WB US 40 Parking /
Service Road; Between MD 132 & Robinson Ave.
4 0
HA2145184 MD 755 (Edgwood Road) Phase II from Willoughby
Beach Road to MARC Edgewood Station Harford
County.
4 0
HA2425180 Prestressed Concrete Slab Bridge No.12009 on MD
7 over James Run in Harford County
3 0
HA3345171 MD 24 from Deer Creek Bridge to 1000 feet South of
Bridge- Section A
4 0
HA3485270 Intersection Improvements @ US 40 & MD7 /
MD159
4 0
HA3485570 MD 22 @ Old Post Road Capacity Improvements 4 0
HA3515176 Widening and Resurfacing I-95 Northbound Off
Ramp at MD 543
3 0
HA4995177 US 40 East Bound from Long Bar Harbor Road. to
Spesutia Rd.; Safety & Resurface
2 0
XX2255180 Preservation and minor rehab of moveable and fixed
bridges, retaining walls, culverts, retaining walls state
wide (GAP-SIRE)
8 0
XX4505180 Replacement of Concret Arch on Grey Rock Drive
over tributary of Jones Falls (MD 129) (GAP-SIRE)
4 0
XY1365185 Area Wide Sign Structure Replacement - District 4 5 0
XY1435185 I-695- MD 45, MD 147, MD 139 Sign Structure
Replacement - District 4 - Area Wide (GAP-OOTS)
1 0
XY1475133 Areawide ADA Sidewalk Compliance in D4-
Baltimore and Harford Counties
4 0
XY1485176 Areawide Safety and Operational Improvements In
District 4 at Various Locations in Baltimore and
Harford Counties Area Wide
3 0
XY1545185 MOD/Install/Recon of Signals Area Wide
(GAP-OOTS)
5 0
Project Count: Total Inspections: 167 0 45
Appendix B. Page 7 of 13

Quality Assurance Inspections By District
2/24/2015 To 4/30/2015
District: 5
Contract No Project Description # Inspections # Non-Compliance (D-F)
AA1375133 MD 424 From MD 3 to MD 450 Pedestrian Access
Upgrades, AA County.
5 0
AA1545180 Cleaning and Painting of Existing Bridge #'s
0211011, 0201102, 0208000, 0208203, 0208204,
0208403, 0208404, 0208503, 0208504, 02100303
and 0210304 on various routes in AA county
4 0
AA2705130 MD 2 @ Harwood Drive left turn lane improvements 2 1
AA2785187 MD 2 (Governor Ritchie Highway) At Earliegh
Heights/Magothy Bridge Road Intersection
Improvements
4 0
AA4315181 MD 424 @ US 50 Park & Ride Addition 5 0
AA4915130 MD 2 @ MD 256 (Deale Road) Geometric
Improvements AA County
5 0
AA4925130 MD 2 at MD 255 Intersection Improvements AA
County
5 1
AA5805670 MD 175 @ Reece Rd. & Mapes Rd./Charter Oaks
Blvd. Intersection Improvements
4 0
AT0655374 Drainage and Stormwater Remediation at Various
Locations Statewide (GAP-ICD)
5 0
AT0875182 TMDL Stormwater Enhancements in AA county 3 0
AT7995382 TMDL- Legacy Pavement Improvements AA and CH
Counties Area Wide (GAP - ICD)
5 0
AT8125274 Drainage, Erosion, and Sediment Control, and
Remediation at Various Locations Statewide
(GAP-ICD)
6 0
CA3825176 MD 2 at Mount Harmony Road Geometric
Improvement CA County
3 0
CA4805180 Bridge Replacement Prestressed Concrete Girder
Bridge No. 0401100 On MD 261 (Bayside Road)
Over Fishing Creek
3 0
CH2045129 Installation and Construction of a Vactor Truck
Dewatering Station at the La Plata, MD Shop.
4 0
CH2095180 Emergency Bridge Replacement Prestressed
Concrete Girder Bridge No. 8036 on MD 234 over
Allens Fresh Run
5 0
SM2165176 MD 4 (Patuxent Beach Rd.) from MD 235 (Three
Notch Rd.) to Patuxent Blvd. Widening and
Resurface SM County
4 0
SM3665180 Bridge Replacement Prestressed Concrete Slab
Bridge # 18008 on MD 5 over Eastern Branch SM
County
2 0
XX2255380 Preservation and Minor Rehabilitation of Fixed
Bridges, Culverts, Retaining Walls and Noise walls
(GAP- SIRE)
7 0
XX5295178 Pedestrian Access to Transit in District #5 Area Wide
(GAP-ICD)
5 0
Project Count: Total Inspections: 86 2 20
Appendix B. Page 8 of 13

Quality Assurance Inspections By District
2/24/2015 To 4/30/2015
District: 6
Contract No Project Description # Inspections # Non-Compliance (D-F)
AL2925177 Safety and Resurfacing on US 40 From West
Shipley Rd. to 0.13 Miles E. of Structure 01175
1 0
AL4095180R Rehabilitation of Bridge No. 0108200 on MD 51 over
CSX and Canal Parkway and Bridge No. 0109600 on
I-68 over Wills Creek, CSX & Municipal
4 0
AL4215180 Deck Replacement and Substructure Rehabilitation
for Steel Beam Bridge No. 01102 and 01103 on I-68
5 0
AL4395177 Safety & Resurfacing on MD 51 from Town Creek
Bridge to 0.16 mi west of Comerford Drive
5 0
AW5515280 Cleaning and Painting of Existing Bridges No.s
0101900, 0110000, 0110600, 1100500, 1104103,
1104104, 1104400, 1104800, and 1105400 on
Various Routes in Allegany and Garrett Counties
4 0
GA2065229 Keysers Ridge Maintenance Shop Complex 5 0
GA3255177 Safety and Resurfacing on I-68 0.54 miles East of
Lower New Germany Road Bridge No. 11 041 00to
1.01 miles West of MD 546 Bridge no. 11 012 00
1 0
GA3505130 MD 495 at New Germany Road Intersection
Improvement Garrett County
5 0
GA3555180 Replacement Bridge No, 11023 on US 219 (Garrett
Highway) over Cherry Creek
2 0
WA2405149 Remove Existing Storage Tanks and Install New
Above ground Tanks at the Administrations
Hagerstown Maintenance Facility in Washington
County
2 0
WA4165180 Replacement of bridge 21108 over Md. 63 6 0
WA4205180 Deck Replacement for Bridge No. 2113600 on US 40
over I-70
5 0
XY1345185 Modify/Installation/Reconstruction of Signing Districts
6 and 7 (GAP-OOTS)
5 0
XY4215177 Mill/Grind, Patch & Resurface Roadway Pavements
@ Various locations - Washington County
1 0
Project Count: Total Inspections: 51 0 14
Appendix B. Page 9 of 13

Quality Assurance Inspections By District
2/24/2015 To 4/30/2015
District: 7
Contract No Project Description # Inspections # Non-Compliance (D-F)
AT0885182 TMDL Improvements, MD 32 and MD 100 Howard
County, US 15 and MD 144 Frederick County District
7
5 0
AX0315132 Traffic Barrier Improvements from East of Bethany
Lane to Tyson Road and from Johnny Cake Road to
Coleridge Road in Baltimore and Howard County.
5 0
AX2645482 Total Maximum Daily Load (TMDL) Legacy
Pavement Improvements in Carroll, Frederick,
Howard and Washington Counties. (GAP - ICD)
3 0
BA6075180 Widening and Superstructure Replacement for
Bridge No. 0308300 on Md 140 (Westminster Pike)
over North Branch of Patapsco River
4 0
CL2105177 MD 140 From West of MD 91 to West of
Sandymount Road Safety and Resurfacing Carroll
County
4 0
CL2365130 Relocation of Stone Road at MD 97 4 0
FR2255181 MD 75 at I70 Park & Ride Expansion in Frederick
County
5 0
FR3275184 MD-144 From West Royal Oak Drive to Bye Alley
Community Safety Enhancement
4 0
FR4185180 Replacement of Bridge No. 10098 on Motter Avenue
over US 15 including Improvements along Motter
Avenue and Oppossumtown Pike in Frederick
County
4 0
FR4575180 Replacement of Bridge No. 10094 on MD 550 over
Isreal Creek
4 0
FR5045180 Replacement of Bridge No. 10065 on MD 140 over
Monocacy River
4 0
FR6085181 MD 17 at Ventrie Court Ridesharing Facilities 4 0
FR6705175 US-15 at MD-77 Emergency Stream Repair 5 0
HO2065182 Upper Little Patuxent River Stream Restoration
Project in Howard County
5 0
HO2195129 Construction of a Salt Storage Facility at the
Administration's Jessup Maintainance Facility
4 0
HO2425185 Reconstruct Interstate Lighting (I-95 @ MD 100 and
MD 175 Howard County (GAP - OOTS)
2 0
HO2435185 US 29 at MD 103, MD 108 and US 40 Interchange
Lighting
1 0
HO2485126 Extension of Existing Southbound I-95 Timberview
Community Noise Barrier (13027NO) 5000 Feet
North of MD 100 to Maontgomery Road
4 0
HO2935181 I-95 South Welcome Center Truck Parking
Expansion in Howard County
4 0
HO2945181 MD 175 At Snowden River Parkway - Park and Ride
Lot Expansion in Howard County
4 0
HO3175170 US 29 Northbound Widening Phase I from South of
Md 175 (Phase 1B Northbound Widening and Noise
Barriers)
4 0
HO3175270 US 29 Northbound Widening Phase I From South of
Seneca Drive to South of Md 175 (Phase IA - Old
Columbia Road Access Only
4 0
HO3915170 MD 32 at Linden Church Road Interchange
Construction - Design/Build
3 0
HO4725176 MD 32 (Sykesville Road) from Day Road to West
Friendship Road in Howard County - Widening for
Left Turn Lane and SWM
4 0
Appendix B. Page 10 of 13

Quality Assurance Inspections By District
2/24/2015 To 4/30/2015
District: 7
Contract No Project Description # Inspections # Non-Compliance (D-F)
XX2255280 Preservation and Minor Rehab of Fixed Bridges,
Culverts, Retaining Walls, and Noise Walls
Statewide (GAP-SIRE)
8 0
XX5245185 Mod/Install/Recon of Traffic Signals - District 6 & 7 -
Area Wide (GAP-OOTS)
4 0
XX6305279 Areawide Sidewalk Project in District 7 5 0
XY1305185 Sign Structure Replacement - District 7 - Area Wide
(GAP-OOTS)
5 0
Project Count: Total Inspections: 116 0 28
Appendix B. Page 11 of 13

Quality Assurance Inspections By District
2/24/2015 To 4/30/2015
District: 8
Contract No Project Description # Inspections # Non-Compliance (D-F)
AT3765D60 ICC Contract D/E 5 0
AX3765560 RC-A, NB-1 and NB-3, Stabilize the Cherrywood
Manor Tributary and Manor Run reducing sediment
input into the North Branch of Rock Creek
4 0
AX3765T60 Northwest Branch and Patuxent River Stormwater
Management and Stream Restoration Sites NW-39
and PR-257 in Montgomery County
4 0
AX3775460 MO-B Northwest Branch Recreational Park 1 0
AX3785T60 ICC SWM Ponds NW-32 and NW-40 Pond Retrofits 1 0
Project Count: Total Inspections: 15 0 5
Appendix B. Page 12 of 13

QA Non-Compliance Findings
Project
Inspection Date InspectorContract AA2705130 4/22/15 1:00 pm Walker Martin
MD 2 @ Harwood Drive left turn lane improvements
FRating 35.70
This Non-Compliance was the result of a low score. The identified issues included failing to install controls
prior to disturbing area of intended control, Failing to seek necessary modifications, stagging and stockpiling
in an unapproved area, ESCM duties not in conformance with the specifications along with incorrect
installation of Diversion Fence, Gabion Outlet Structures and Super Silt Fence. There were also stabilization
issues on the site.
Contractor : Francis O. Day Co., Inc.
Project Engineer : Greta Hartman
Reason
The administration shut down the project and directed the contractor to correct the issues noted. The issues
were corrected within 48 hours.
The contract documents specify for the administration to seek liquidated damages in the amount of
$3,666.00 for each day of the non-compliance for a total of $7,332.00.
Action Taken
Follow-up Date83.4Follow-up Rating B 3:02 pm4/27/15
Project
Inspection Date InspectorContract AA4925130 4/19/15 3:34 pm Walker Martin
MD 2 at MD 255 Intersection Improvements AA County
DRating 64.70
This non-compliance was the result of a follow-up to a "C" rating. The contractor did not complete all of the
items listed on the previous "C" report. The outstanding issues were Earth Dike maintenance, Temporary
Stone Outlet Structure maintenance and Super Silt Fence maintenance. Improper stabilization also
contributed to the low score.
Contractor : Ardent Co. LLC.
Project Engineer : Greta Hartman
Reason
The Administration shut down grading operations and directed the contractor to correct the outstanding
environmental issues. The correction were complete within 24hrs.
The contract documents specify for the administration to seek liquidated damages in the amount of
$3,823.00 for each day of the non-compliance for a total of $3,823.00.
Action Taken
Follow-up Date96.0Follow-up Rating A 3:28 pm4/20/15
Appendix B. Page 13 of 13
Feb 24 - April 30, 2015


APPENDIX C.
PLAN REVIEW D IVISION
ORGANIZATIONAL CHART


Office of Highway Development - Plan Review Division Organizational Chart
Date: May 1, 2015
Division Chief
Team Leader
Tesfamichael Bogale, PE
Team Leader
Jeffrey Knaub, PE
Team Leader
Parley Hess, PE
Team Leader
Vacant
Assistant Division Chief
Laura Ridler, PE
Karuna Pujara, PE
Appendix C.
Page 1 of 1


APPENDIX D.
SUMMARIES OF PUBLIC OUTREACH


Public Outreach Meetings
ROUTE DESCRIPTION / PROJECT NAME Meeting Type/Purpose Meeting Date City/County
MD 54 MD 54 over Mockingbird Creek Informational 04/20/15 Wicomico
MD 4 MD 4 Thomas Johnson Bridge Informational 04/22/15 St. Mary's
MD 370 MD 370 over Miles River Informational 05/12/15 Talbot
US 220 US 220 Informational 06/15/15
(Tentative)Allegany
MD 4MD 4-Silver Hill Road to Forestville
Road Preconstruction
06/16/15
(Tentative)Prince George's
MD 97 MD 97 Montgomery Hills Hearing 06/23/15
(Tentative)Montgomery
MD 500MD 500 Community Safety &
Enhancement ProjectInformational 03/18/15 Prince George's
MD 625MD 625 Hughesville Community Safety
Enhancement ProjectInformational 03/18/15 Charles
MD 28/MD 198 MD 28/MD 198 Informational 03/19/15 Montgomery
US 29US 29 – Interchange Improvements at
Fairland Road and Musgrove RoadInformational 03/24/15 Montgomery
MD 16MD 16 from Brannock Neck Road to MD
335 Community Safety & Enhancement
Project
Informational March/April 2015 Dorchester
MD 4 MD 4 Thomas Johnson Bridge Informational04/22/2015
(Tentative)St. Mary's
MD 54 MD 54 over Mockingbird Creek Informational04/20/2015
(Tentative)Wicomico
US 220 US 220 Informational June Allegany
MD 97 MD 97 Montgomery Hills Hearing June Montgomery
I-695 I-695 Southwest Outer Loop Widening Informational 02/24/15 Baltimore
US 29US 29 – Interchange Improvements at
Fairland Road and Musgrove RoadInformational 02/26/15 Montgomery
US 301/MD 228 US 301/MD 228 Informational 03/05/15 Charles
MD 2/MD 4 MD 2/MD 4 Informational 03/11/15 Calvert
MD 500MD 500 Community Safety &
Enhancement ProjectInformational
03/18/2015
(Tentative)Prince George's
MD 625MD 625 Hughesville Community Safety
Enhancement ProjectInformational
03/18/2015
(Tentative)Charles
MD 28/MD 198 MD 28/MD 198 Informational 03/19/2015
(Tentative)Montgomery
MD 16MD 16 from Brannock Neck Road to MD
335 Community Safety & Enhancement
Project
Informational March/April 2015 Dorchester
MD 4 MD 4 Thomas Johnson Bridge Informational April St. Mary's
Appendix D.Page 1 of 1

APPENDIX E.
INVESTIGATIONS OF CITIZEN COMPLAINTS AND INQUIRIES


Route LocationSHA
DistrictStatus
Resolution
Date
MD-3 Priestbridge Salt Barn/MD 3 drainage erosion 3Initial Customer
Contact
MD-17 9019 Myersville Rd- Ditch Erosion 7 Initial Field Visit
US-301 Pipe washout along NB US 301 1.1 miles northeast of Potomac River 5 Initial Field Visit
MD-7Homeowner unhappy with BMP and ditches constructed as part of
intersection improvement project4 Report Complete 4/24/2015
MD-135 MD 135 at Vine Street 6 Initial Field Visit
MD-151 Request for pipe installation at Baltimore Towing Company 4 Assigned
I-495 Severe outfall erosion adjacent to ramp from SB MD 650 to WB I 495 3 Initial Field Visit
I-270 Pipe Outfall Failure into Montgomery County Detention Center SWM Pond 3 Initial Field Visit
MD-10 Erosion Beneath Noise Wall 5 Assigned
MD-316 Failing 26" CMP 2Initial Customer
Contact
MD-346 Poor Drainage at 8133 Old Ocean City Road 1 Report Complete 3/31/2015
MD-117 Intersection Flooding, MD 117 and Firstfield 3 Report Complete 5/13/2015
MD-32 1585 Sykesville Rd, flooding of property 7 Assigned
MD-632 Yard flooding at 8818 Downsville Pike 6 Report Complete 4/23/2015
MD-950 Culvert Failure, Ardwick Ardmore Ramp to US 50 WB 3 Report Complete 3/9/2015
MD-36 MD 36 in Midland (Wilson Property) 6 Report Complete 3/23/2015
US-11 Yard sinking along Pennsylvania Ave (US 11) in Hagerstown 6 Report Complete 4/23/2015
MD-495 Pipe Separation, 48" RCP north of Str 11063X0 6 Initial Field Visit
MD-129 Drainage Investigation Request for 10625 Park Heights Ave 4 Report Complete 5/13/2015
MD-97 Erosion along guardrail on MD-97 7 Report Complete 3/18/2015
US-219 US 219 at Rock Lodge Road 6 Report Complete 3/23/2015
US-201 Slope Failure along US201, Town of Edmonston 3 Report Complete 3/3/2015
US-1 Water running down and eroding along the edge of shoulder on US 1. 4 Report Complete 2/11/2015
MD-5 Drainage Evaluation for Roadway Transfer of MD 5G 5 Report Complete 3/16/2015
I-695 Slope Failure along inner loop of I-695 4 Initial Field Visit
I-695 I-695 Slope Failure 4 Report Complete 4/23/2015
Appendix E.
Page 1 of 1

First Quarterly Report Covering February 24, 2015 to May 1, 2015
Submitted To: Submitted by:
Water Management Administration Maryland Department of the Environment 1800 Washington Boulevard Baltimore, Maryland 21230
Maryland State Highway Administration 707 North Calvert Street
Baltimore, Maryland 21202
Appendix CM
onitoring Report
Appendix C
Monitoring Report


Appendix C
1
Assessment of Stream Restoration
Projects in Maryland
2014-2015 Report
Prepared for:
Maryland Department of Transportation
State Highway Administration
Highway Hydraulics Division
707 North Calvert Street
Baltimore, MD 21202
Prepared by:
Principal Investigator
R. P. Morgan II
Contributing Staff
J. E. Garlitz
D. M. Gates
K. M. Kline
J. E. Needham
B. C. Rice
I. M. Smith
University System of Maryland
Center for Environmental Science
Appalachian Laboratory
301 Braddock Road
Frostburg, MD 21532-2307
June 2015


Appendix C
2
Table of Contents
Introduction...............................................................................................................................3
Rationale ....................................................................................................................................3
Project Objective .......................................................................................................................4
Materials and Methods .............................................................................................................5
Site Locations ..................................................................................................................................................... 5
Benthic Macroinvertebrates ................................................................................................................................ 5
Benthic Field Sampling Protocols ....................................................................................................................... 5
Benthic Laboratory Protocols .............................................................................................................................. 6
Benthic Macroinvertebrate Statistical Protocols ................................................................................................... 6
Physical Habitat Assessment ............................................................................................................................... 7
Water Quality ..................................................................................................................................................... 8
Results and Discussion ............................................................................................................ 11
Long Draught Branch (LDB) ............................................................................................................................ 11
Marbury Drive (MAR)...................................................................................................................................... 20
Plumtree Run (PTR) ......................................................................................................................................... 27
Upper Little Patuxent River (ULPR) ................................................................................................................. 34
Watkins Mill Road (UTSC) .............................................................................................................................. 40
SHA Site Water Chemistry ............................................................................................................................... 47
Literature Cited ...................................................................................................................... 53
APPENDIX A. ................................................................................................................................................. 56


Appendix C
3
Introduction
The Maryland Department of Transportation, State Highway Administration (SHA) receives state
and federal funding for assessment of stream restoration projects in Maryland. SHA requires
scientific support (primarily biological) to assess and/or to monitor a selected set of stream
restoration projects already completed, or projected to be done in the future, by the administration.
Information collected from these studies, undertaken by the Appalachian Laboratory of the
University of Maryland Center for Environmental Science, provides a framework and historical
database of recommendations for future SHA stream restoration projects, and for assessment and
potential revitalization of existing SHA restoration projects throughout Maryland.
Rationale
Stream restoration is of critical importance to the State of Maryland, as well as to the entire
Chesapeake Bay watershed. The overall quality of life, now and in the future, is highly dependent
on aquatic ecosystem integrity for both the quantity and quality of freshwater (Simon 1999). The
integrity of surface water resources is dependent on chemical variables, flow regimes, biotic
factors, energy sources, and habitat structure (Karr et al. 1986). Over the last quarter century,
numerous surveys of fish and benthic communities assessed freshwater ecosystem health (Simon
1999). Significant advances in this arena led to the development of integrative ecological indices,
such as Indices of Biotic Integrity (IBIs), which relate fish communities to both biotic and abiotic
ecosystem components (Karr 1981, Karr et al. 1986). Coupled with chemical-physical water
quality attributes, habitat quality (and often quantity) is important to consider when examining fish
and benthic communities, especially for any and all derived IBIs (Yoder and Smith 1999).
Stream restoration strongly focuses on revitalization of the physical habitat. However, indices of
habitat quality to assess post-restoration processes have lagged behind both fish and benthic IBI
development. In part, this is because of the difficulty in developing accurate, precise and complete
methodologies to quantitatively and qualitatively habitat assess characteristics (Platts 1976, Platts
et al. 1983). The impetus for including stream habitat as an important measure came initially from
western U.S. restoration activities (reviewed in Platts et al. 1983). For example, Binns (1979)
developed a Habitat Quality Index for trout streams, soon to be followed by both Habitat
Evaluation Procedures models (HEP) and Habitat Suitability Index models (HSI) for use with the
U. S. Fish and Wildlife Service in-stream flow models. Important improvements in more
generalized habitat models came with the development of EPA’s Rapid Bioassessment Protocols
(Plafkin et al. 1989) and the Ohio EPA’s Qualitative Habitat Evaluation (Rankin 1989).
Wallace (1990) points out that there are a number of factors to consider in looking at stream
recovery, especially in light of recent restoration attempts for lotic systems. Recolonization of a
disturbed or restored area is a function of many factors, often depending on stream size. Implicit
in restoration is that long-term stream physical stability eventually recovers. However, benthic
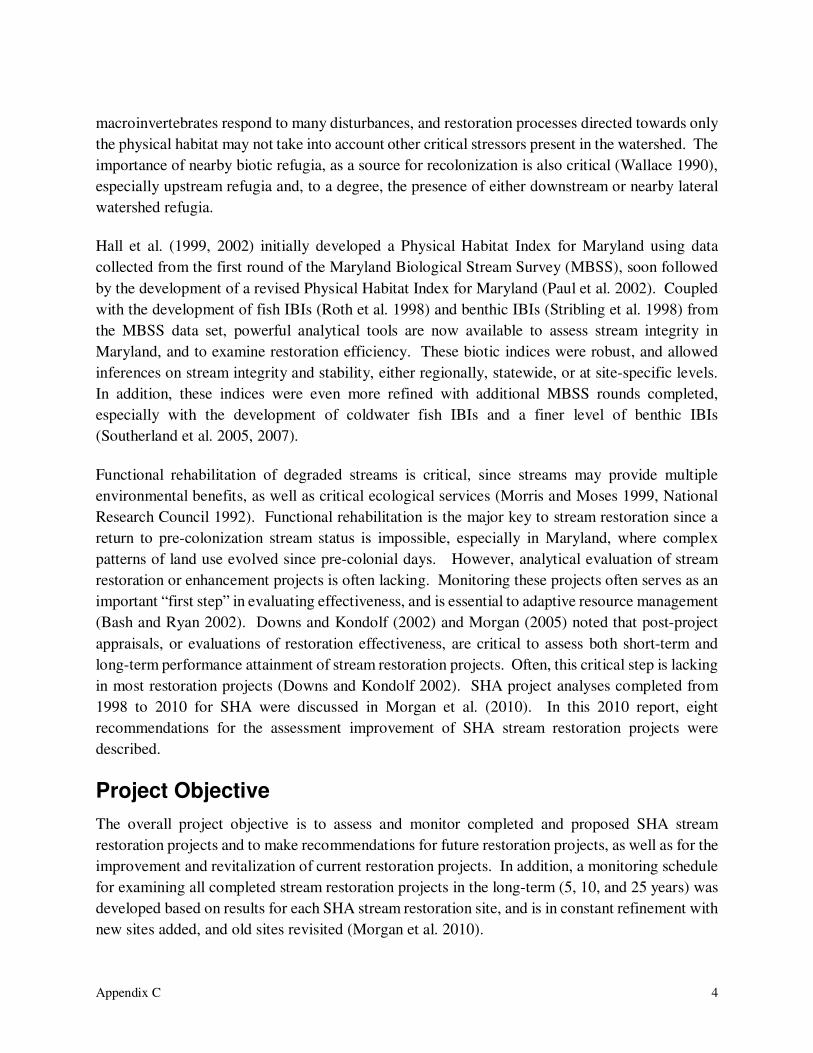
Appendix C
4
macroinvertebrates respond to many disturbances, and restoration processes directed towards only
the physical habitat may not take into account other critical stressors present in the watershed. The
importance of nearby biotic refugia, as a source for recolonization is also critical (Wallace 1990),
especially upstream refugia and, to a degree, the presence of either downstream or nearby lateral
watershed refugia.
Hall et al. (1999, 2002) initially developed a Physical Habitat Index for Maryland using data
collected from the first round of the Maryland Biological Stream Survey (MBSS), soon followed
by the development of a revised Physical Habitat Index for Maryland (Paul et al. 2002). Coupled
with the development of fish IBIs (Roth et al. 1998) and benthic IBIs (Stribling et al. 1998) from
the MBSS data set, powerful analytical tools are now available to assess stream integrity in
Maryland, and to examine restoration efficiency. These biotic indices were robust, and allowed
inferences on stream integrity and stability, either regionally, statewide, or at site-specific levels.
In addition, these indices were even more refined with additional MBSS rounds completed,
especially with the development of coldwater fish IBIs and a finer level of benthic IBIs
(Southerland et al. 2005, 2007).
Functional rehabilitation of degraded streams is critical, since streams may provide multiple
environmental benefits, as well as critical ecological services (Morris and Moses 1999, National
Research Council 1992). Functional rehabilitation is the major key to stream restoration since a
return to pre-colonization stream status is impossible, especially in Maryland, where complex
patterns of land use evolved since pre-colonial days. However, analytical evaluation of stream
restoration or enhancement projects is often lacking. Monitoring these projects often serves as an
important “first step” in evaluating effectiveness, and is essential to adaptive resource management
(Bash and Ryan 2002). Downs and Kondolf (2002) and Morgan (2005) noted that post-project
appraisals, or evaluations of restoration effectiveness, are critical to assess both short-term and
long-term performance attainment of stream restoration projects. Often, this critical step is lacking
in most restoration projects (Downs and Kondolf 2002). SHA project analyses completed from
1998 to 2010 for SHA were discussed in Morgan et al. (2010). In this 2010 report, eight
recommendations for the assessment improvement of SHA stream restoration projects were
described.
Project Objective
The overall project objective is to assess and monitor completed and proposed SHA stream
restoration projects and to make recommendations for future restoration projects, as well as for the
improvement and revitalization of current restoration projects. In addition, a monitoring schedule
for examining all completed stream restoration projects in the long-term (5, 10, and 25 years) was
developed based on results for each SHA stream restoration site, and is in constant refinement with
new sites added, and old sites revisited (Morgan et al. 2010).

Appendix C
5
Materials and Methods
Site Locations
Site details for each SHA restoration location are described in the results and discussion section,
with benthic macroinvertebrate data summaries found in Appendix A. Control sites are often very
difficult to find in highly developed urban watersheds or in headwater streams. We always
attempted to find control sites upstream of pre-restoration or post-restoration sites; however, many
of these restoration sites were in the extreme upper part of a watershed and did not reflect the
restoration area, or there were changes in control sites during the study. To compensate for this
problem, we employed data from all rounds of the MBSS for comparison to the restoration site.
Normally, one would try to collect samples where the condition is present and where it is absent,
with all other factors being the same (Green 1979). This approach determines an effect at a site
relative to a control. However, there is so much anthropogenic activity in the landscape of the
coastal plain and Piedmont, as well as other physiographic provinces of Maryland, that watersheds
are strongly altered through time and space. It may be necessary at some sites to move downstream
into the lower part of a watershed and then determine current conditions to assess the upstream
site. However, this is not the desired approach.
Benthic Macroinvertebrates
Assessment of benthic macroinvertebrates at each sampling site followed benthic
macroinvertebrate protocols for MBSS sampling (Kazyak 1996, Stranko et al. 2010). At each pre-
construction or post-construction project, two samples (~ 10-20 sweeps each with D-nets
depending on stream size) were taken within the project boundary after site surveys (lower and
middle sections, if possible). One sample was always collected near the lower (downstream
boundary) of the project. The middle sample was collected approximately one-third to one-half
of the distance from the upper upstream boundary of the project (benthic sampling was frequently
modified dependent on specific site characteristics). Two additional samples, serving as replicate
controls, were collected upstream of the stream restoration project, assuming that the upstream
area served as a suitable control area. If no suitable upstream control was present, one or two site
samples were taken downstream. For any pre-construction sites, two benthic samples were taken
within the proposed project boundaries, along with two controls from an upstream area (or
downstream area) if possible. We also identified a number of MBSS reference streams to provide
baselines for benthic invertebrate quality for the project.
Benthic Field Sampling Protocols
A series of D-net samples (a total of ~ 1-2 m2) were taken at each sampling location (Kazyak
1996), with an emphasis on selecting riffle/run habitat. Benthic macroinvertebrate sampling was
conducted in order to qualitatively describe the community composition and relative abundance in
favorable habitats. All survey methods for benthic macroinvertebrates followed MBSS protocols
(Kazyak 1996), with benthic samples, as often as possible, collected from stream riffle areas

Appendix C
6
because this is typically the most productive habitat in stream ecosystems. When riffle habitat was
not present, other habitats sampled in the following order of preference were: gravel/broken peat
and/or clay lumps in run areas; snags/logs that create partial dams or are in run habitat; undercut
banks and associated root mats in moving water; submerged aquatic vegetation and associated
bottom substrate in moving water; and detritus/sand areas in moving water. In the field, samples
were transferred to polyethylene bottles and preserved in denatured ethanol. These benthic
samples were collected during the MBSS spring index period and during the MBSS fall index
period (Kazyak 1996), weather conditions permitting.
Benthic Laboratory Protocols
In the laboratory, samples were washed, picked, and organisms stored in 70% isopropyl alcohol.
The first 300 organisms (to the nearest grid) were picked for identification to the lowest taxon
possible (Plafkin et al. 1989), with the first 100 organisms separated for the calculation of the
MBSS BIBI. Only the 100 organism sample was used for MBSS metric calculations since the
MBSS BIBI development was based on this sample number. The first 300 organisms were used
for the EPA RBP III calculations. If the sample contained less than 300 organisms, the sample
was picked completely. In any report table, an asterisk denotes either a lack of 100 organisms for
the MBSS BIBI, or a lack of 300 organisms for the EPA RBP III protocol.
Benthic Macroinvertebrate Statistical Protocols
MBSS - A revised Maryland benthic index of biotic integrity (BIBI) was employed for this project
(Southerland et al. 2005, 2007). The new BIBI was broken into Coastal Plain, Eastern Piedmont
and Combined Highlands (Table 1). For any of the three MBSS strata, BIBI scores were
determined by adding the threshold score for each metric, and then dividing by the number of
metrics for each stratum. The BIBI collected at each station was compared to the control area as
well as to MBSS reference stations in the vicinity of the SHA project. A BIBI score range of 4.0
- 5.0 is rated as good, 3.0 - 3.9 is fair, 2.0 - 2.9 is poor, and 1.0 - 1.9 is very poor (Table 2).
EPA – Benthic metrics were derived using the EPA RBP III procedures using a 300 + organism
count (Plafkin et al. 1989, Klemm et al. 1990, Barbour et al. 1999). The derived metrics are: taxa
richness = total number of taxa recognized; Hilsenhoff Biotic Index = tolerance value of each
macroinvertebrate multiplied by the number of those individuals and then the sum of the products
divided by the total number of specimens; ratio of scraper and filtering collector functional feeding
groups; ratio of shredder functional feeding group to total number of individuals; ratio of total
number of Ephemeroptera, Plecoptera, and Trichoptera (EPT) individuals to total Chironomidae;
EPT Index = number of distinct taxa within the orders Ephemeroptera, Plecoptera and Trichoptera;
and the percent contribution of the dominant taxon in the riffle community.

Appendix C
7
Physical Habitat Assessment
Stream physical habitat data is an essential component of any biological assessment program.
Habitat data is normally used to assess trends in water quality and to investigate the influence of
land use practices that may affect stream water quality. Habitat assessments, based on an earlier
MBSS protocol (Kazyak 1996), were performed at all SHA sites in order to determine biological
integrity and fishability. Although there are now revised physical habitat metrics for the MBSS
(Paul et al. 2002), the Maryland physical habitat index (MPHI), developed by Hall et al. (1999,
2002) based on MBSS fish IBI data sets, was calculated and compared to control areas and to
MBSS reference data in the vicinity of the SHA project. This approach was used to maintain
consistency in the physical habitat index measurement over time, especially for those SHA sites
being revisited since the earliest sites were initiated in Fall 1998 (Morgan et al. 2010).
A number of variables were assessed qualitatively at each site. These include the following:
instream habitat, epifaunal substrate, velocity/depth diversity, pool/glide/eddy quality, riffle
quality, channel alteration, bank stability, embeddedness, channel flow status, and shading (scores
assigned for each metric). Observations of the surrounding area were used to evaluate aesthetic
value (based on amounts of human refuse) and remoteness (based on ease of access and presence
of human activity). The presence, or absence, of other stream habitat features (i.e., morphological
characteristics, stream channelization, woody debris, and land uses visible from each site) was also
recorded for each site. In the field, physical habitat assessments were integrated across controls
and across the stream restoration area.
Physical habitat metrics with the best discriminatory power for SHA coastal plain sites were:
instream habitat, velocity/depth diversity, pool/glide/eddy quality, embeddedness, maximum
depth and aesthetic rating. The final index calculations for the coastal plain weighed all metrics
equally except embeddedness, maximum depth, and aesthetics that were weighted ½. The final
equation used for the coastal plain habitat index (CPPHI) was:
CPPHI= (instream habitat + velocity/depth diversity + pool quality
– embeddedness/10+ maximum depth/10+ aesthetics/2)/ 6.
Physical habitat metrics with the best discriminatory power for SHA non-coastal plain sites
(primarily Piedmont) were: instream habitat, velocity/depth diversity, riffle/run quality,
embeddedness, number of rootwads and aesthetic rating. All metrics were weighted equally except
embeddedness (weighted ½) and aesthetics (weighted 1/3). The final equation used for the non-
coastal plain habitat index (NCPHI) was:
NCPHI= [instream habitat + velocity/depth diversity + riffle/run quality –
embeddedness/10 + 3(number of rootwads) + aesthetics/3]/ 6.

Appendix C
8
Each metric was calculated by site (metrics were integrated across the controls and the restoration
sites) and a statistically based algorithm was used to convert the physical habitat score to centiles
(Hall et al. 1999, 2002). Physical habitat categories were defined as: good being > 72 (> 50th
centile), fair 42-72 (30th to 50th centile), poor 12-42 (10th to 30th centile) and very poor < 12 (10th
centile).
In addition, digital images were periodically taken at each site to document selected stream habitat
features, and then these images forwarded to SHA. All site maps were generated through
GoogleTMEarth and PowerPoint.
Water Quality
Baseflow water quality samples were taken at each SHA site for the determination of water quality
parameters following the standard analyses performed for the MBSS, in addition to some new
MBSS analytes for the fourth round of random sampling. These samples were taken following
current MBSS protocols during the Spring and Fall sampling at each site, with samples transported
to the Appalachian Laboratory for analyses. We calculated the 10-90th percentile range for each
analyte based on the data base for all random sites in the MBSS program during the first three
random site rounds.
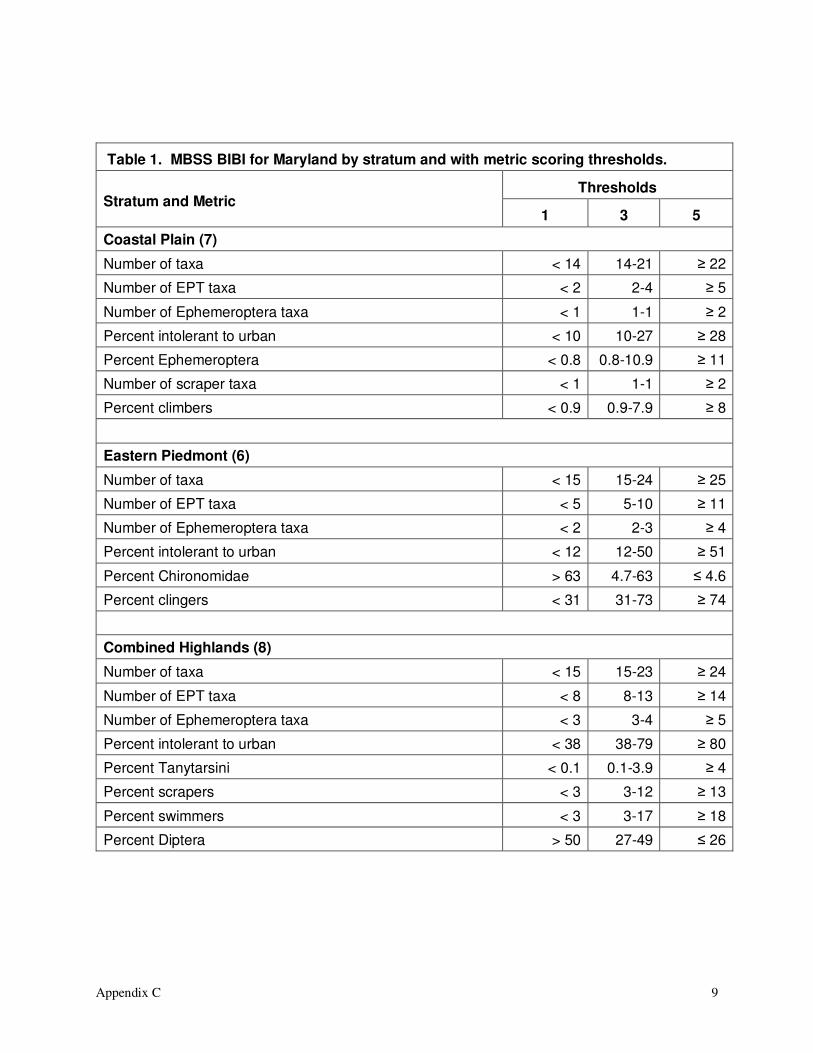
Appendix C
9
Table 1. MBSS BIBI for Maryland by stratum and with metric scoring thresholds.
Stratum and Metric Thresholds
1 3 5
Coastal Plain (7)
Number of taxa < 14 14-21 ≥ 22
Number of EPT taxa < 2 2-4 ≥ 5
Number of Ephemeroptera taxa < 1 1-1 ≥ 2
Percent intolerant to urban < 10 10-27 ≥ 28
Percent Ephemeroptera < 0.8 0.8-10.9 ≥ 11
Number of scraper taxa < 1 1-1 ≥ 2
Percent climbers < 0.9 0.9-7.9 ≥ 8
Eastern Piedmont (6)
Number of taxa < 15 15-24 ≥ 25
Number of EPT taxa < 5 5-10 ≥ 11
Number of Ephemeroptera taxa < 2 2-3 ≥ 4
Percent intolerant to urban < 12 12-50 ≥ 51
Percent Chironomidae > 63 4.7-63 ≤ 4.6
Percent clingers < 31 31-73 ≥ 74
Combined Highlands (8)
Number of taxa < 15 15-23 ≥ 24
Number of EPT taxa < 8 8-13 ≥ 14
Number of Ephemeroptera taxa < 3 3-4 ≥ 5
Percent intolerant to urban < 38 38-79 ≥ 80
Percent Tanytarsini < 0.1 0.1-3.9 ≥ 4
Percent scrapers < 3 3-12 ≥ 13
Percent swimmers < 3 3-17 ≥ 18
Percent Diptera > 50 27-49 ≤ 26
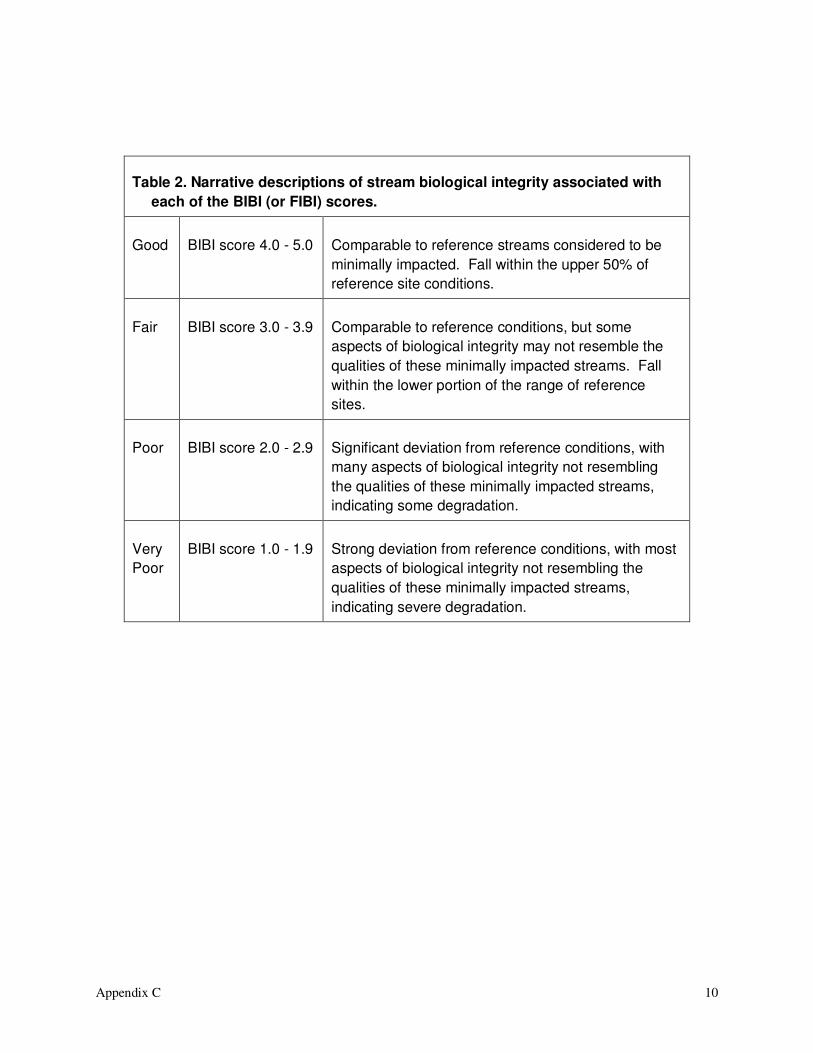
Appendix C
10
Table 2. Narrative descriptions of stream biological integrity associated with
each of the BIBI (or FIBI) scores.
Good
BIBI score 4.0 - 5.0
Comparable to reference streams considered to be
minimally impacted. Fall within the upper 50% of
reference site conditions.
Fair
BIBI score 3.0 - 3.9
Comparable to reference conditions, but some
aspects of biological integrity may not resemble the
qualities of these minimally impacted streams. Fall
within the lower portion of the range of reference
sites.
Poor
BIBI score 2.0 - 2.9
Significant deviation from reference conditions, with
many aspects of biological integrity not resembling
the qualities of these minimally impacted streams,
indicating some degradation.
Very
Poor
BIBI score 1.0 - 1.9
Strong deviation from reference conditions, with most
aspects of biological integrity not resembling the
qualities of these minimally impacted streams,
indicating severe degradation.

Appendix C
11
Results and Discussion
Each current SHA restoration project evaluated in 2014-2015 will be reviewed, discussed and
synthesized into the context of regional Maryland values, as derived from the Maryland Biological
Stream Survey (all rounds). Basic information collected at each site for FY15 is included in each
site summary. In the past, summary lists of benthic invertebrates collected at each restoration site
(all controls plus middle restoration and lower restoration samples) were included within each site
discussion. These benthic taxa lists are now placed in Appendix A to reduce excessive tables
within each section. Any cell within the benthic summary tables marked with an asterisk indicates
fewer than 100 organisms were present in the sample for that site (for the 300 + samples, metric
calculations were not done if less than 100 organisms were present in the sample).
Long Draught Branch (LDB)
Site Description: Long Draught Branch is a small first-order stream located in a very highly
urbanized area of Montgomery Country that includes residential development, large and small
office complexes, numerous shopping centers and very large amounts of impervious surface due
to parking lots, extensive road systems and numerous buildings (Figure LDB 1). There is a small
dam located in the upstream area of Long Draught Branch (Note: In lower Long Draught Branch,
there is another small dam located along Rabbit Road that is slated for future removal to enhance
downstream connectivity).
A segment of Long Draught Run flows through a park area with a swimming pool and playground.
Many of the parking areas adjacent to the numerous apartment units have direct flow pathways
into the stream through rip-rapped drainage swales. In the spring, there is significant refuse found
in the stream after winter. Often, this trash forms small blockage dams throughout the stream with
significant pooling, especially in the area between the two restoration sites. Part of the restoration
area is heavily wooded.
Throughout its stream course until it enters Clopper Lake, there are numerous storm drains
discharging into the stream as well as overland drainage from parking lots and roads. There is
also a major sewage line paralleling the stream throughout the proposed restoration area with a
few surface seeps present.
Long Draught Branch Site Coordinates:
Site coordinates for Long Draught Branch (Figure LDB 1).
Station Latitude (N) Longitude (W) Comments:
Middle 39.142313 -77.225865 Projected middle restoration site.

Appendix C
12
Lower 39.144377 -77.228521 Projected lower restoration site.
Alpha Control 39.143820 -77.222785 Upstream Control One
Beta Control 39.143660 -77.222066 Upstream Control Two

Appendix C
13
6
MIDDLE
(Pre- restoration)
LOWER
(Pre-restoration)
ALPHA Control
BETA Control

Appendix C
14
Figure LDB 1. Site locations for sampling of Long Draught Branch (LDB) in Montgomery County.

Appendix C
15
Fall 2014 Benthic Community (LDB) - For subsamples with the MBSS 100 + macroinvertebrate
count, total EPT taxa, number of ephemeroptera taxa, and the percent intolerant urban
macroinvertebrates were low (Table LDB 1). Taxa richness and percent clingers were moderate
at the Lower Restoration site and low at the remaining stations. The percent of chironomids
collected was low at the Alpha Control site and moderate at the three remaining stations.
Cheumatopsyche sp. dominated the EPT taxa and was the dominant clinger at the Lower
Restoration site, but was in low numbers or nonexistent at the remaining sites. The IBI value
ranged from 1.3 at the Beta Control and Middle Restoration sites to 2.0 at the Lower Restoration
site on Long Draught Run – these values fall into either the poor or very poor category based on
MBSS criteria.
Although in a heavily urbanized area, the number of benthic taxa present in the stream was
surprising (8-22 in the 100 + organism count), with higher numbers present in the proposed
restoration area (Table LDB 1). However, there were a high percentage of the organisms present
as chironomids at three stations, with a high percent of clingers present at the Lower Restoration
site. EPT taxa were low, reflecting the poor water quality in Long Draught Branch, variability in
the flow regime due to impervious surface, and loss of connectivity with any EPT source
populations in the immediate area.
Table LDB 1. Data summary of benthic macroinvertebrates collected in D-frame samples on 22
September 2014 at four stations in Long Draught Branch.
MBSS Piedmont Metrics
Riffle Community (MBSS 100 + subsample)
Alpha
Control
Beta
Control
Lower
Restoration
Middle
Restoration
Taxa Richness 8 13 22 13
Total EPT Taxa 0 1 4 1
Ephemeroptera taxa 0 0 1 1
% Intolerant Urban 4.5% 0.0% 0.0% 2
% Chironomidae 2.7% 16.4% 16.7% 21.4%
% Clingers 0.0% 2.7% 70.6% 9.2%
BIBI 1.7 1.3 2.0 1.3
For subsamples with a 300 + count, taxa richness ranged from 26 at the Lower Restoration site to
12 at the Alpha Control site (Table LDB 2). The Hilsenhoff Biotic Index was lowest at the Lower
Restoration site and highest at Alpha Control. The ratio of scrapers to filtering collector functional
feeding groups was lowest (0.00) at the Beta Control site and highest (0.50) at Alpha Control site.

Appendix C
16
Scraper taxa were in low numbers at all sites. Filtering collectors, Sphaeridae, trichopteran larva,
and Simulid larva, varied among the sites, but were in lowest numbers at the Alpha Control.
Shredder numbers were low at all stations. The ratio of total EPT to chironomids was highest at
the Lower Restoration site (2.9) and lowest at Alpha Control (0.00). The number of EPT taxa was
highest (4) at the Lower Restoration site and nonexistent at the Alpha Control site.
Naididae oligochaetes were the dominant (59.6% and 32.1%, respectively) macroinvertebrate
collected at the Alpha and Beta Control sites. Cheumatopsyche sp. larvae were the predominant
(25.9%) macroinvertebrate collected at the Lower Restoration site while Turbellaria were
abundant in the Alpha Control, Beta Control and at the Middle Restoration site, but low at the
Lower Restoration site.
Table LDB 2. Data summary of benthic macroinvertebrates collected in D-frame samples on 22
September 2014 at stations in Long Draught Branch.
RBP III Metrics
Riffle Community (RBP III 300 + subsample)
Alpha Control
Beta Control
Lower Restoration
Middle Restoration
Taxa Richness 12 17 26 19
Hilsenhoff Biotic Index 8.9 8.3 5.9 7.6
Ratio Scrapers to Filtering Collectors (%)
0.50
(50.0%)
0
(0.0%)
0.01
(1.1%)
0.13
(13.3%) Ratio Shredders to Total Individuals (%)
0.01
(0.7%)
0
(0.0%)
0.02
(2.4%)
0.01
(1.1%)
Total EPT Individuals to Total Chironomids (%)
0
(0.0%)
0.13
(12.7%)
2.89
(289%)
0.70
(71%)
EPT Index 0 2 4 3
Percent Contribution of Dominant Taxon
59.6% 32.1% 25.9% 29.6%
Spring 2015 Benthic Community (LDB) - For subsamples with a 100 + macroinvertebrate count,

Appendix C
17
taxa richness was moderate at the Middle Restoration and low at the remaining stations (Table
LDB 3). The number of EPT taxa, number of ephemeroptera taxa, and percent of intolerant
macroinvertebrates was low at all stations. Cheumatopsyche sp., when present, was the dominant
EPT taxon collected. No ephemeroptera or intolerant urban taxa were collected at any of the sites.
The percent of chironomids collected was high at the Lower Restoration site and moderate at the
remaining stations. The percent of clingers was low at all stations, with Cheumatopsyche sp.
being most abundant at the Lower Restoration site. The BIBI value ranged from 1.0 at the Lower
Restoration site to 1.8 at the Beta Control site.
Table LDB 3. Data summary of benthic macroinvertebrates collected in D-frame samples on 30
March 2015 at stations in Long Draught Branch.
MBSS Piedmont Metrics
Riffle Community (MBSS 100 + subsample)
Alpha
Control
Beta
Control
Lower
Restoration
Middle
Restoration
Taxa Richness 12* 10* 13 17*
Total EPT Taxa 0* 0* 3 1*
Ephemeroptera taxa 0* 0* 0 0*
% Intolerant Urban 0.0%* 0.0%* 0.0% 0.0%*
% Chironomidae 29.4%* 37.5%* 63.7% 48.3%*
% Clingers 0.0%* 2.5%* 21.6% 8.0%*
BIBI 1.3 1.8 1.0 1.7
For subsamples with a 300 + count, low abundance resulted in no EPA RBP III analyses for the
two control sites. Taxa richness ranged from 18 at the Middle Restoration site to 20 at the Lower
Restoration site (Table LDB 4). The Hilsenhoff Biotic Index was 6.1 at the Lower Restoration
site and 7.1 at the Middle Restoration site. The ratio of scrapers to filtering collector functional
feeding groups was 0.03 at the Lower Restoration site and 0.47 at the Middle Restoration site

Appendix C
18
station. Scraper taxa were low in numbers at both sites, while Cheumatopsyche sp. dominated the
filtering collector functional feeding group. The number of shredder macroinvertebrates was low
at both sites. The ratio of total EPT individuals to chironomids ranged from 0.40 at the Lower
Restoration site to 0.10 at the Alpha Control station. The number of EPT taxa four (4) at the Lower
Restoration site and one (1) at the Middle Restoration site. The trichopteran larva,
Cheumatopsyche sp., dominated the EPT macroinvertebrates. Orthocladius sp. larvae were most
abundant macroinvertebrate seen at both sites.
Table LDB 4. Data summary of benthic macroinvertebrates collected in D-frame samples on 30
March 2015 at stations in Long Draught Branch.
EPA RBP III Metrics
Riffle Community (EPA RBP III 300 + subsample)
Lower Restoration
Middle Restoration
Taxa Richness 20 18*
Hilsenhoff Biotic Index 6.1 7.1*
Ratio Scrapers to Filtering Collectors (%)
0.03 (2.5%)
0.47* (47.1%)
Ratio Shredders to Total Individuals (%)
0.00 (0.0%)
0.01* (0.6%)
Total EPT Individuals to Total Chironomids (%)
0.40 (39.5%)
0.10* (10.0%)
EPT Index 3 1*
Percent Contribution of Dominant Taxon 56.0% 45.4%*

Appendix C
19
Physical Habitat: Physical habitat in the control area was good, although there was a limited
buffer width along the stream. Shading was good for most of the control area. However, there
were three problems that we observed during all benthic sampling in the upper control region, and
reported on in earlier reports. First, there was a dam upstream of the control area that formed a
small pond clogged with cattails (dam coordinates: 39.142686° N; -77.219645° W). During the
summer, this shallow pond could create high temperature spikes downstream during storm events
and may even create excessive stream temperatures during the summer without storm events. In
addition, there were several outfalls from pavement discharging into the stream that would
generate significant temperature spikes during summer rain events. Second, Long Draught Branch
flows underground through large culverts for a significant distance (an estimate of ~ 0.18 km).
Third, the stream originated very close to I-270 and West Diamond Avenue from spring seeps in
this area. Consequently, the upstream characteristics of Long Draught Branch affected both the
control and the potential stream restoration area.
The stream area to be restored on Long Draught Branch was truly an urban chaos. There were
numerous, large (~1 m high) undercut banks and large amounts of large urban debris, including
shopping carts, bicycles, mattresses and springs as well as smaller refuse. More of this material
was present in 2015 than in earlier years. There was some shading along the stream, but the stream
buffer was broken in most areas, with a fairly large expanse of grass in the park area. In past
surveys, we observed some whitish-brown effluent draining from a culvert into the stream, as well
as some surface drainage problems from a stream sewer system very close to Long Draught
Branch.
The MPHI was 21.1 for the control area and 8.1 for the restoration area – a drop in both metrics
from previous years. Basically, the restoration area was a classic example of the effects of
urbanization on stream physical habitat structure.
Assessment Recommendation: Long Draught Branch is a contentious pre-restoration site.
Prior to the construction of any proposed stream stabilization projects, it should be
resampled at least one more time, and then 2-4 years after the completion of stream
restoration construction.

Appendix C
20
Marbury Drive (MAR)
Site Description: The Marbury Drive SHA site is located in the Coastal Plain of Prince Georges
County in the town of District Heights. This first order perennial stream is an unnamed tributary
to Ritchie Branch, then flowing to the Southwest Branch of Western Branch, and onward to
Western Branch which eventually flows into the Patuxent River. The stream restoration site
parallels Marbury Drive; MAR will be used as the code for this SHA site rather than UTRB. This
stream is in the extreme headwaters of the Western Branch of the Patuxent River and arises from
a series of headwater springs and seeps.
The stream is a SHA pre-restoration site (Figure MAR 1). However, it appeared that there was
some past work on this site since there was some rip-rap present as well as some other in-stream
structures, including small dam structures. There are a number of large drainage pipes feeding
into the site as well as drainage from roads and other impervious surfaces. During the Fall 2014
sampling, we sampled two sites in the Middle Restoration area to obtain some sense of the benthic
community present throughout this long reach. The Lower Restoration site is below the Kipling
Parkway road crossing (a potential restoration problem since there is a very large pool formed by
the stream downstream).
Site Coordinates:
Site coordinates for (Figure MAR 1).
Station Latitude (N) Longitude (W) Comments:
MR 1 38.859162 -76.879542 Middle restoration site 1
MR 2 38.858251 -76.878081 Middle restoration site 2
Lower 38.868398 -76.881420 Lower restoration site
Alpha Control 38.857690 -76.877063 Upstream control one
Beta Control 39.857051 -76.875914 Upstream control two
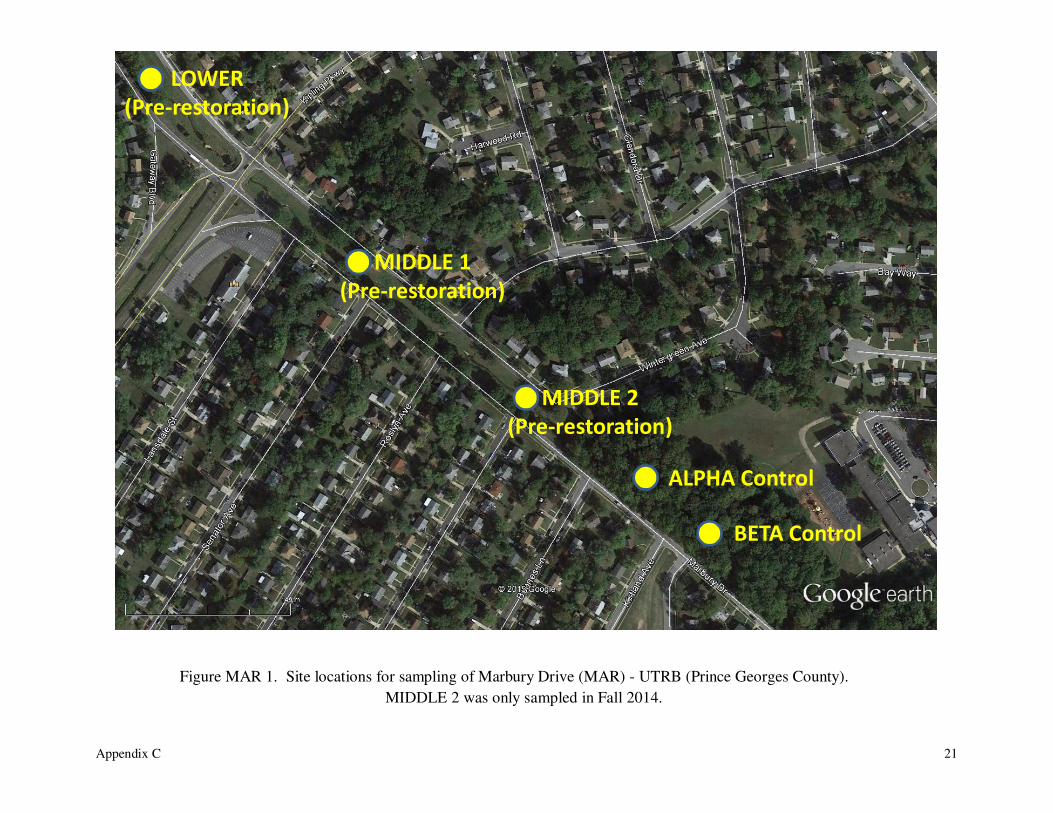
Appendix C
21
Figure MAR 1. Site locations for sampling of Marbury Drive (MAR) - UTRB (Prince Georges County).
MIDDLE 2 was only sampled in Fall 2014.
ALPHA Control
BETA Control
MIDDLE 1
(Pre-restoration)
LOWER
(Pre-restoration)
MIDDLE 2
(Pre-restoration)
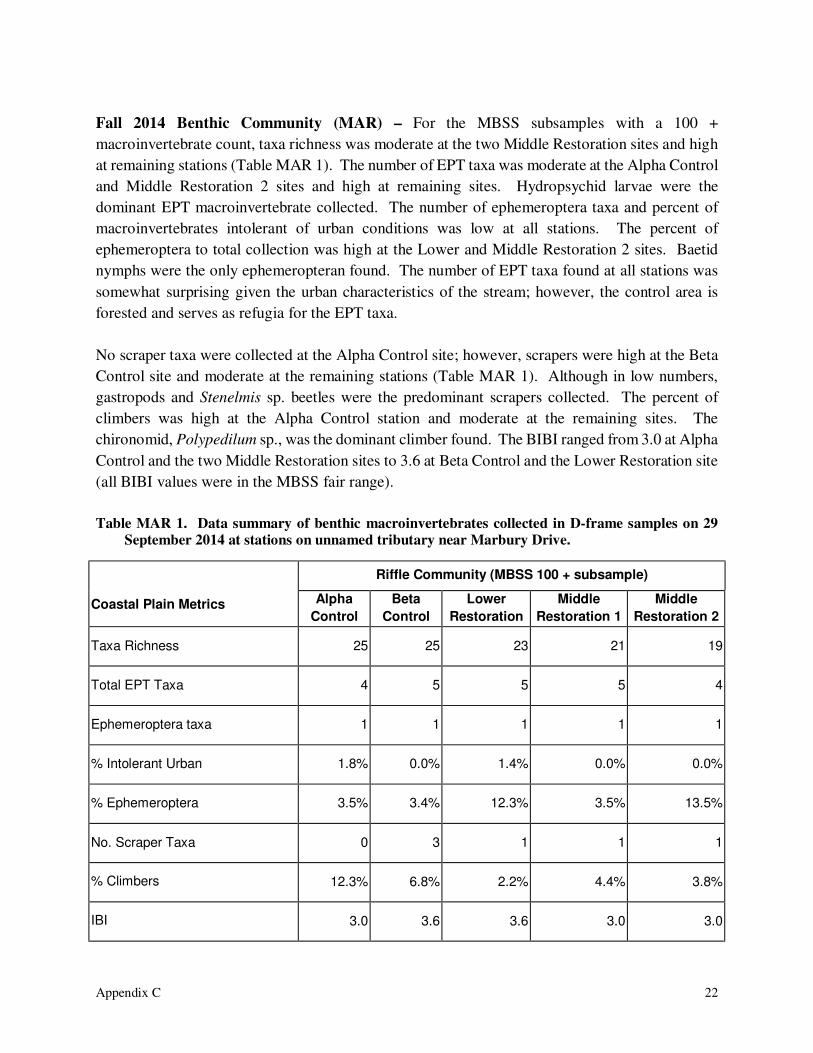
Appendix C
22
Fall 2014 Benthic Community (MAR) – For the MBSS subsamples with a 100 +
macroinvertebrate count, taxa richness was moderate at the two Middle Restoration sites and high
at remaining stations (Table MAR 1). The number of EPT taxa was moderate at the Alpha Control
and Middle Restoration 2 sites and high at remaining sites. Hydropsychid larvae were the
dominant EPT macroinvertebrate collected. The number of ephemeroptera taxa and percent of
macroinvertebrates intolerant of urban conditions was low at all stations. The percent of
ephemeroptera to total collection was high at the Lower and Middle Restoration 2 sites. Baetid
nymphs were the only ephemeropteran found. The number of EPT taxa found at all stations was
somewhat surprising given the urban characteristics of the stream; however, the control area is
forested and serves as refugia for the EPT taxa.
No scraper taxa were collected at the Alpha Control site; however, scrapers were high at the Beta
Control site and moderate at the remaining stations (Table MAR 1). Although in low numbers,
gastropods and Stenelmis sp. beetles were the predominant scrapers collected. The percent of
climbers was high at the Alpha Control station and moderate at the remaining sites. The
chironomid, Polypedilum sp., was the dominant climber found. The BIBI ranged from 3.0 at Alpha
Control and the two Middle Restoration sites to 3.6 at Beta Control and the Lower Restoration site
(all BIBI values were in the MBSS fair range).
Table MAR 1. Data summary of benthic macroinvertebrates collected in D-frame samples on 29
September 2014 at stations on unnamed tributary near Marbury Drive.
Coastal Plain Metrics
Riffle Community (MBSS 100 + subsample)
Alpha
Control
Beta
Control
Lower
Restoration
Middle
Restoration 1
Middle
Restoration 2
Taxa Richness 25 25 23 21 19
Total EPT Taxa 4 5 5 5 4
Ephemeroptera taxa 1 1 1 1 1
% Intolerant Urban 1.8% 0.0% 1.4% 0.0% 0.0%
% Ephemeroptera 3.5% 3.4% 12.3% 3.5% 13.5%
No. Scraper Taxa 0 3 1 1 1
% Climbers 12.3% 6.8% 2.2% 4.4% 3.8%
IBI 3.0 3.6 3.6 3.0 3.0

Appendix C
23
For subsamples with a 300+ count, taxa richness ranged from 25 at Lower and Middle Restoration
1 sites to 28 at the Beta Control station (Table MAR 2). The Hilsenhoff Index ranged from 5.5 at
the Lower Restoration site to 6.7 at the Beta Control. The ratio of scrapers to filtering collectors
was lowest (0.02) at the Lower and two Middle Restoration sites and highest (0.06) at the Beta
Control station. Gastropods and the elmid larva, Stenelmis sp., were the most common scrapers
collected while hydropsychid larvae were the dominant filtering collectors seen. The ratio of
shredders to total number of macroinvertebrates collected ranged from 0.03 at the Lower
Restoration site to 0.09 at the two control stations. The chironomid larva, Polypedilum sp., and
tipulid larvae were the dominant shredders collected. The ratio of EPT macroinvertebrates to total
chironomids ranged from 0.42 at Alpha Control to 1.01 at the Middle Restoration 1 site. The
number of EPT taxa was 5 at all the stations with hydropsychid larvae and baetid nymphs
dominating the EPT macroinvertebrate collections. The percent contribution of the dominant taxon
ranged from 10.3% (Rheocricotopus sp.) at the Beta Control site to 27.7% (Symphytopsyche sp.)
at the Lower Restoration site.
Table MAR 2. Data summary of benthic macroinvertebrates collected in D-frame samples on 29
September 2014 at the Marbury Drive.
EPA RBP III Metrics
RIFFLE COMMUNITY (300 + subsample)
Alpha Control
Beta Control
Lower Restoration
Middle Restoration
1
Middle Restoration
2
Taxa Richness 26 28* 25 25 27
Hilsenhoff Biotic Index 6.4 6.7* 5.5 6.3 6.4
Ratio Scrapers to Filtering Collectors (%)
0.04 (4.3%)
0.06* (5.7%)
0.02 (1.7%)
0.02 (1.9%)
0.02 (1.6%)
Ratio Shredders to total Individuals (%)
0.09 (9.3%)
0.09* (8.6%)
0.03 (3.3%)
0.04 (3.7%)
0.04 (3.8%)
Total EPT Individuals to Total Chironomids (%)
0.42 (42%)
0.76* (76%)
0.78 (78%)
1.01 (101%)
0.71 (71%)
EPT Index 5 5* 5 5 5
Percent Contribution of Dominant Taxon
11.2% 10.3%* 27.7% 15.5% 20.9%

Appendix C
24
Spring 2015 Benthic Community (MAR) - For subsamples with a 100 + macroinvertebrate
count, taxa richness and EPT taxa were moderate at all the stations (Table MAR 3). The number
of ephemeroptera taxa, percent ephemeroptera, and percent intolerant were low at all sites.
Hydropsyche sp. larvae were the dominant EPT macroinvertebrate collected. Gastropods were the
dominant scraper collected at the Middle Restoration site and no scraper taxa were collected at the
remaining stations. The percent of climbers was moderate at all sites, with the chironomid,
Polypedilum sp., the dominant climber found. The BIBI ranged from 1.6 at Beta Control to 2.4 at
the Middle Restoration site – these values are in the very poor and poor range. This was a steep
decline in the BIBI scores versus the Fall sampling; however, this trend is commonly observed in
the headwater streams where the Fall BIBI is often higher than the Spring BIBI (Morgan et al.
2010).
Table MAR 3. Data summary of benthic macroinvertebrates (100 + sample) collected in D-frame
samples on 30 March 2015 at stations on unnamed tributary near Marbury Drive.
Coastal Plain Metrics
Riffle Community (MBSS 100 + subsample)
Alpha
Control
Beta
Control
Lower
Restoration
Middle
Restoration
Taxa Richness 16 15* 17 19
Total EPT Taxa 3 1* 3 3
Ephemeroptera taxa 0 0* 0 0
% Intolerant Urban 0.0% 0.0%* 0.0% 0.0%
% Ephemeroptera 0.0% 0.0%* 0.0% 0.0%
No. Scraper Taxa 0 0* 0 5
% Climbers 2.8% 5.2%* 5.7% 7.2%
BIBI 1.9 1.6 1.9 2.4
For subsamples with a 300 + count, abundance was low so less than 300 macroinvertebrates were
collected for analysis at the two control sites (Table MAR 4). Taxa richness was 21 at both
restoration sites. The Hilsenhoff Index ranged from 6.6 at the Middle Restoration site to 6.7 at the
Lower Restoration site. The ratio of scrapers to filtering collectors and shredders to total

Appendix C
25
individuals collected was lower at the Lower Restoration site than at the Middle Restoration
station. The number of scrapers was low to nonexistent at the stations while Hydropsyche sp.
larvae dominated the filtering collector functional feeding group.
The ratio of shredders to total individuals collected was higher at the Middle Restoration site.
Tipula sp. and Polypedilum sp. larvae were the dominant shredders collected (Table MAR 4). The
ratio of EPT individuals to total chironomids was higher at the Lower Restoration station.
Hydropsychid larvae were the dominant filtering collectors seen. The number of EPT taxa
collected was three (3) at both stations. The number of EPT taxa was 5 at all the stations with
Hydropsychid larvae dominating the EPT macroinvertebrate collections. The percent contribution
of the dominant taxon was approximately 27% at both sites with Hydropsyche sp. larvae
dominating the collection at the Lower Restoration site and Orthocladius sp. dominating the
Middle Restoration station.
Table MAR 4. Data summary of benthic macroinvertebrates (300 + sample) collected in D-frame
samples on 30 March 2015 at stations on unnamed tributary near Marbury Drive.
EPA RBP III Metrics
RIFFLE COMMUNITY (300 + subsample)
Lower Restoration
Middle Restoration
Taxa Richness 21* 21*
Hilsenhoff Biotic Index 6.7* 6.6*
Ratio Scrapers to Filtering Collectors (%)
0.02 (1.7%)*
0.23 (22.7%)*
Ratio Shredders to total Individuals (%)
0.04 (4.4%)*
0.07 (7.0%)*
Total EPT Individuals to Total Chironomids (%)
1.05 (105.3%)*
0.47 (46.8%)*
EPT Index 3* 3*
Percent Contribution of Dominant Taxon 26.8%* 26.6%*

Appendix C
26
Physical Habitat: The SHA restoration area (Figure MAR 1) is generally devoid of shading
throughout most of its stream reach, with only limited trees, mainly planted along the roadsides,
to provide any stream shading. In this area, the stream is bordered by roads on both sides of the
stream, with the control area bordered by a road on one side of the stream. The restoration area is
basically a grassy swale. However, the upstream control area is well-shaded with a mixture of
large trees and shrubs along the stream. There are a few exotic species present at the control and
restoration sites.
There are a number of large stormwater drains along the stream in the restoration area, as well as
a few small dam structures and some rip-rap material. There are a few places where there is
significant bank slumping. In addition, there is a sewage line running along the stream that could
potentially affect water quality. The MPHI was 40.4 for the control area and 30.3 for the
restoration area – both falling into the poor category.
Recommendations: This site is a SHA pre-restoration site slated for stream work in FY 2016
(or beyond). It is recommended that this site be re-assessed one year (or two) after the stream
restoration work is totally completed.

Appendix C
27
Plumtree Run (PTR)
Site Description: Plumtree Run (pre-construction in the FY12-13 work, early post-construction
in Spring 2014 and mostly completed in Fall 2014 and Spring 2015) is a first-order stream located
in Harford County near Bel Air, MD (Figure PTR 1). It parallels Route 24 from its headwaters to
West Ring Factory Road and then crosses under Route 24. The stream area restoration scheduled
to be completed in 2014 is between West Ring Factory Road and Route 24. At the lower end of
the restoration area, Plumtree Run crosses back under Route 24 (a high-density roadway with a
significant median) and then eventually flows into the Atkisson Reservoir (the headwaters of
Winters Run draining into the Bush River).
Plumtree Run presented a past problem in benthic analyses since it is located on the Fall Line in
Maryland, with the Piedmont to the west and the western Coastal Plain to the east of the site. After
consultation with MBSS personnel and examining the MBSS data base, we assigned Plumtree Run
to the eastern Piedmont for all current and future reports.
The upper headwaters of Plumtree Run are heavily affected by urbanization, with numerous, large
residential and commercial developments on either side of the stream, along with a large hospital
complex, road infrastructure, and numerous shopping centers. There is an overabundance of
parking for the hospital, MD DMV and the shopping centers, as well as an overall high road density
in the Atkisson Run watershed (~ 4.0 km/km2).
Site Coordinates:
Site coordinates for Plumtree Run (Figure PTR 1).
Station Latitude (N) Longitude (W) Comments:
Middle 39.509828 -76.339641 Middle site.
Lower 39.507872 -76.338807 Lower site.
Alpha Control 39.511721 -76.342286 Upstream control one.
Beta Control 39.512320 -76.342612 Upstream control two.
Gamma Control 39.506910 -76.339581 Downstream control one.
Delta Control 39.506712 -76.339755 Downstream control two.

Appendix C
28
LOWER
(Pre-restoration)
MIDDLE
(Pre-restoration)
ALPHA Control
BETA Control
GAMMA/DELTA Control
Figure PTR 1. Site locations for sampling on Plumtree Run (Harford County).

Appendix C
29
Fall 2014 Benthic Community: For subsamples with a 100 + macroinvertebrate count and
Piedmont metrics, taxa richness (13 – 20) and total EPT taxa (4 - 5) were moderate at most sites
(Table PTR 1). Numbers of ephemeropteran taxa and percent macroinvertebrates intolerant of
urban conditions were low at all stations. The percent of chironomids was moderate at all the sites
while the percent of clingers was moderate at the Beta Control site and high at the remaining
stations. The BIBI for Piedmont metrics ranged from 2.3 at Beta, Gamma, and Delta Control
stations to 2.7 at the remaining sites (Alpha Control and Lower and Middle Restoration sites).
These values all fall into the poor range for the MBSS BIBI.
Table PTR 1. Data summary of benthic macroinvertebrates (MBSS 100 + sample) collected in D-
frame samples on 22 September 2015 at stations on Plumtree Run.
Piedmont Metrics
Riffle Community (MBSS 100 + subsample)
Alpha
Control
Beta
Control
Gamma
Control
Delta
Control
Lower
Restoration
Middle
Restoration
Taxa Richness 15 19 15 13 18 20
Total EPT Taxa 5 5 4 5 5 5
Ephemeroptera taxa 1 1 1 1 1 1
% Intolerant Urban 4.2% 2.1% 2.8% 2.7% 0.8% 4.1%
% Chironomidae 10.0% 26.6% 12.5% 9.1% 8.1% 15.7%
% Clingers 90.0% 64.9% 88.9% 89.1% 91.1% 75.2%
BIBI 2.7 2.3 2.3 2.3 2.7 2.7
For benthic subsamples with a 300 + count (EPA RBP III), taxa richness ranged from 22 at the
Delta Control to 31 at the Beta Control (Table PTR 2), with the Hilsenhoff Index ranging from 4.7
at Delta Control to 5.2 at Beta Control. The ratio of scrapers to filtering collectors was lowest
(0.02) at Beta Control and highest (0.14) at Alpha Control. Stenelmis sp. and Phesphenus sp. were
the most common scrapers collected while hydropsychid and philopotomatid larvae were the
dominant filtering collectors. The ratio of shredders to total number of macroinvertebrates
collected ranged from 0.02 at Delta Control and the Lower Restoration site to 0.05 at the Middle
Restoration site.
Chironomid larvae (Polypedilum sp.) were the dominant shredders collected. The ratio of EPT
macroinvertebrates to total chironomids ranged from 1.8 at Beta Control to 10.2 at the Delta

Appendix C
30
Control site. The number of EPT taxa ranged from 5 to 7 with both hydropsychid and
philopotomatid larvae dominating the EPT macroinvertebrate collections. The percent
contribution of the dominant taxon ranged from 17.9% (Cheumatopsyche sp.) at the Middle
Restoration site to 46.8% (Chimerra sp.) at the Delta Restoration site.
Table PTR 2. Data summary of benthic macroinvertebrates collected in D-frame samples on 22
September 2014 at control stations in Plumtree Run.
RBP III Metrics
Riffle Community (EPA RBP III 300 + subsample)
Alpha Control
Beta Control
Gamma Control
Delta Control
Lower Restoration
Middle Restoration
Taxa Richness 24 31 28 22 23 28
Hilsenhoff Biotic Index 4.9 5.2 5.0 4.7 4.8 5.1
Ratio Scrapers to Filtering Collectors (%)
0.14 (14.3%)
0.02 (1.7%)
0.06 (5.8%)
0.04 (3.6%)
0.03 (3.5%)
0.03 (30.0%)
Ratio Shredders to total Individuals (%)
0.01 (0.7%)
0.03 (3.3%)
0.0 (1.6%)
0.02 (1.5%)
0.02 (2.0%)
0.03 (2.5%)
Total EPT Individuals to Total Chironomids (%)
4.70 (470%)
1.82 (182%)
5.21 (521%)
10.2 (1024%)
8.81 (881%)
4.47 (447%)
EPT Index 6 5 7 5 5 7
Percent Contribution of Dominant Taxon
28.9% 27.5% 30.6% 46.8% 26.6% 17.9%
Spring 2015 Benthic Community: For subsamples with a 100 + macroinvertebrate count and
MBSS Piedmont metrics, taxa richness was moderate at the Beta Control and Middle Restoration
sites and low at the remaining stations (Table PTR 3). The number of EPT ranged from 2-4 taxa,
but ephemeropteran taxa and percent of intolerant macroinvertebrates were nonexistent at all PTR
sites. The percent of chironomids was high at all stations with the percent of clingers low at all the
stations. Cheumatopsyche sp., Chimarra sp., and Antocha sp. were the dominant
macroinvertebrates in the clinger habit category collected. The BIBI for the Piedmont metrics
ranged from 1.0 at the Alpha, Gamma, and Delta Control and Lower Restoration sites, to 1.3 at
the two remaining sites. These BIBI values fall into the very poor range.

Appendix C
31
Table PTR 3. Data summary of benthic macroinvertebrates (MBSS 100 +) collected in D-frame samples on 31
March 2015.
Piedmont Metrics
Riffle Community (MBSS 100 + subsample)
Alpha
Control
Beta
Control
Gamma
Control
Delta
Control
Lower
Restoration
Middle
Restoration
Taxa Richness
13 18 11 7 13 16
Total EPT Taxa
3 3 2 2 4 4
Ephemeroptera taxa
0 0 0 0 0 0
% Intolerant Urban
0.0% 0.0% 0.0% 0.0% 0.0% 0.0%
% Chironomidae
75.0% 78.4% 81.4% 92.7% 76.4% 78.0%
% Clingers
24.1% 11.3% 16.7% 6.3% 23.6% 17.4%
BIBI
1.0 1.3 1.0 1.0 1.0 1.3
For benthic subsamples with a 300 + count, taxa richness ranged from 11 at Delta Control to 24 at
the Lower Restoration site (Table PTR 4). The Hilsenhoff Index ranged from 5.7 at the Lower
Restoration site to 6.3 at Beta Control. The ratio of scrapers to filtering collectors was lowest
(0.00) at Delta Control and highest (0.38) at Beta Control. Stenelmis sp. was the most common
scraper collected while hydropsychid and Chimarra sp. larvae were the dominant filtering
collectors. The shredder, Polypedilum sp., was the most common shredder collected, but in low
numbers at the Lower and Middle Restorations sites, and not at all of the remaining stations. The
ratio of EPT macroinvertebrates to total chironomids ranged from 0.03 (Delta Control) to 0.23
(Lower Restoration). The number of EPT taxa ranged from 3 to 5 with hydropsychid and
Chimarra sp. larvae dominating the EPT macroinvertebrate collections. The percent contribution
of the dominant taxon ranged from 56.6% (Orthocladius sp.) at the Middle Restoration site to
84.4% (Orthocladius sp.) at the Delta Restoration site.

Appendix C
32
Table PTR 4. Data summary of benthic macroinvertebrates collected in D-frame samples on 31
March 2015 at stations in Plumtree Run.
RBP III Metrics
Riffle Community (EPA RBP III 300 + subsample)
Alpha Control
Beta Control
Gamma Control
Delta Control
Lower Restoration
Middle Restoration
Taxa Richness 18 21 15 11 24 22
Hilsenhoff Biotic Index 5.8 6.3 5.8 5.9 5.7 5.9
Ratio Scrapers to Filtering Collectors (%)
0.36 (36.0%)
0.38 (38.5%)
0.09 (9.1%)
0.00 (0.0%)
0.04 (3.8%)
0.02 (2.1%)
Ratio Shredders to total Individuals (%)
0.00 (0.0%)
0.00 (0.0%)
0.00 (0.0%)
0.00 (0.0%)
0.01 (0.1%)
0.01 (0.6%)
Total EPT Individuals to Total Chironomids (%)
0.11 (10.6%)
0.07 (7.0%)
0.13 (12.5%)
0.03 (2.6%)
0.23 (22.9%)
0.21 (21.3%)
EPT Index 5 4 4 3 5 5
Percent Contribution of Dominant Taxon
70.5% 57.3% 68.3% 84.4% 60.2% 56.6%
Physical Habitat: For Plumtree Run, the upstream control area (Figure PTR 1) is bounded by
heavy development for a distance of ~ 1.2 km upstream to its approximate spring source. For most
of the stream length, the stream is well shaded with relatively good stability along the banks, and
with a variety of plant species present (both native and introduced). This stream corridor varies
greatly in width as a function of housing developments and commercial properties. The eastern
bank of Plumtree Run is in close proximity to Route 24 in the lower section, and is effectively
forced into a channel with some gradient. There appeared to be some minimal stream stabilization
work in the past when Route 24 was constructed. In the control area, the stream bottom is a mixture
of boulders, cobble, gravel, and some fine sediment.
The restoration area, ~ 0.64 km in length, is downstream of the junction of Route 24 and West
Ring Factory Road, and ends where Plumtree Run crosses under Route 24 again. In this area,
Plumtree Run has more of a flood plain than in the control area. Substrate throughout this control
area was quite variable, ranging from large cobble to fine silt and clay.
Before restoration work, there were a number of large root wads present along the banks with deep
pools present that provided adequate fish habitat (fish were observed throughout the restoration

Appendix C
33
area). Shading was good throughout the restoration reach, but bank stability was poor reflecting
the flashy nature of the stream. There was an abundance of multiflora rose as well as other native
and non-native plant species.
During the Fall 2014 benthic collections, fishes were present throughout the restoration area, with
numerous fish present near the in-stream structures. The restoration work completely changed the
nature of the stream, and bank stability was significantly improved. The MPHI was 22 for the
control area (poor) and 59 for the restoration area (fair).
Assessment Recommendation: Now that the construction phase is completed for the
Plumtree Run restoration, sampling should be done for the next year, followed by either a
five or ten year cycle.

Appendix C
34
Upper Little Patuxent River (ULPR)
Site Description: The Upper Little Patuxent River (ULPR) was a pre-restoration site sampled in
the 2012 – 2013 work (FY 13). It is located to the south of Route 144 (Old Frederick Road) in
Ellicott City, with one control site near Route 144 and one near Route 40 (Figure ULPR 1). The
restoration area is located in a broad floodplain, with residential housing on both sides of the
stream. There is some commercial development along Route 40 at the junctions of Bethany Lane,
Centennial Lane, Route 144 and Route 40 that may potentially affect the Upper Little Patuxent
River.
This site was resampled in the 2014 – 2015 work. In the Fall, we observed some construction
activities near Frederick Road, essentially the construction of a stormwater management pond.
However, most stream work was done after that Fall sample period, and was fairly complete by
the Spring sampling.
Site Coordinates:
Site coordinates for Upper Little Patuxent River (Figure ULPR 1).
Station Latitude Longitude Comments:
Middle 39.273403 -76.852169 Projected middle site.
Lower 39.271883 -76.852429 Projected lower site.
Alpha Control 39.275718 -76.852465 Upstream control I.
Beta Control 39.278771 -76.852984 Upstream control II.

Appendix C
35
MIDDLE
(Pre-restoration)
LOWER
(Pre-restoration)
ALPHA
BETA
Figure ULPR 1. Site locations for sampling of Upper Little Patuxent River (Howard County).

Appendix C
36
Fall ULPR 2014 Benthic Community – For subsamples with the MBSS 100 + macroinvertebrate
count, taxa richness, total EPT taxa, and percent chironomids were moderate (Table ULPR 1).
Hydropsychid larvae dominated the EPT collections at all sites and also were the dominant clinger
observed. The number of ephemeroptera taxa was moderate at the Alpha Control site and low at
the remaining three sites. Chironomids dominated the two restoration sites, but were lower at the
two control sites. A reverse pattern was seen with % clingers, where the percentages were higher
at the two control sites and less at the two restoration sites. The percent of macroinvertebrates
intolerant of urban conditions was low at all sites. The BIBI ranged from 2.3 at the Lower and
Middle Restoration sites to 3.0 at the Alpha Control site.
Table ULPR 1. Data summary of benthic macroinvertebrates collected in D-frame samples on 22
September 2014 at stations in Upper Little Patuxent.
Piedmont Metrics
Riffle Community (MBSS 100 + subsample)
Alpha
Control
Beta
Control
Lower
Restoration
Middle
Restoration Taxa Richness 18 17 17 23
Total EPT Taxa 6 5 6 6
Ephemeroptera taxa 2 1 1 1
% Intolerant Urban 1.4% 3.9% 1.0% 3.1%
% Chironomidae 15.2% 11.7% 50.5% 26.8%
% Clingers 85.5% 84.5% 58.7% 68.0%
BIBI 3.0 2.7 2.3 2.3
For subsamples with the RBP III 300 + count, taxa richness ranged from 24 at the Alpha Control
site to 32 at the Middle Restoration site (Table ULPR 2). The Hilsenhoff Biotic Index was lowest
at the Beta Control site and highest at the Lower Restoration site. The ratio of scrapers to filtering
collector functional feeding groups was lowest (0.02) at the Middle Restoration site and highest
(0.08) at Beta Control site. Scraper taxa, primarily elmid larvae, were most abundant at the Beta
Control site. Hydropsychid larvae were the dominant filtering collector at all sites. The shredder,
Polypedilum sp., was most abundant at the Lower Restoration site and in low numbers at remaining
sites. The ratio of total EPT to chironomids was highest at the Beta Control site (6.5) and lowest
at the Lower Restoration site (0.84). Seven EPT taxa were collected at the Lower Restoration site
and six EPT taxa at the remaining sites. Cheumatopsyche sp. larvae were the dominant (15.1%)
macroinvertebrate collected at the Alpha Control while Chimerra sp. larvae predominated (25.0%)

Appendix C
37
the collections at Beta Control. Baetid nymphs were the most abundant (17.0% and 21.5%,
respectively) macroinvertebrate seen at the Lower and Middle Restoration sites.
Table ULPR 2. Data summary of benthic macroinvertebrates collected in D-frame samples on 22
September 2014 at stations in Upper Little Patuxent.
RBP III Metrics
Riffle Community (RBP III 300 + subsample)
Alpha Control
Beta Control
Lower Restoration
Middle Restoration
Taxa Richness 24 24 26 32
Hilsenhoff Biotic Index 5.3 5.1 6.0 5.5
Ratio Scrapers to Filtering Collectors (%)
0.03 (2.8%)
0.08 (8.5%)
0.05 (4.5%)
0.02 (2.3%)
Ratio Shredders to total Individuals (%)
0.03 (2.9%)
0.02 (1.7%)
0.17 (16.7%)
0.05 (5.5%)
Total EPT Individuals to Total Chironomids (%)
4.52 (451.8%)
6.50 (650.0%)
0.84 (83.8%)
2.75 (275.0%)
EPT Index 6 6 7 6
Percent Contribution of Dominant Taxon 15.1% 25.0% 17.0% 21.5%
Spring ULPR 2015 Benthic Community - For subsamples with the MBSS 100 +
macroinvertebrate count, taxa richness was moderate at the Lower Restoration site and low at all
remaining sites (Table ULPR 3). The total number of EPT taxa, the number of ephemeropteran
taxa, and the percent intolerant macroinvertebrates were low at all sites. The hydropsychid larva,
Cheumatopsyche sp., dominated the EPT collections at all sites. The number of ephemeroptera
taxa was low to nonexistent at all sites, and no intolerant urban macroinvertebrates were collected
at any of the four sites.
The percent of chironomid larvae collected was moderate at the Alpha Control site and higher at
remaining sites (Table ULPR 3). The percent of clingers was high at the Alpha Control site and
low at remaining sites. The dominant clingers collected were Cheumatopsyche sp., Chimarra sp.,
and Polypedilum sp. larvae. The BIBI ranged from 1.0 at the Beta Control and Middle Restoration
sites to 2.0 at the Alpha Control site.

Appendix C
38
Table ULPR 3. Data summary of benthic macroinvertebrates collected in D-frame samples on 31
March 2015 at stations in Upper Little Patuxent River.
Piedmont Metrics
Riffle Community (MBSS 100 + subsample)
Alpha Control
Beta
Control
Lower
Restoration
Middle
Restoration
Taxa Richness 12 8 15 11
Total EPT Taxa 4 3 3 0
Ephemeroptera taxa 0 1 0 0
% Intolerant Urban 0.0% 0.0% 0.0% 0.0%
% Chironomidae 21.1% 84.5% 86.1% 90.9%
% Clingers 79.8% 15.5% 14.8% 10.1%
BIBI 2.0 1.0 1.3 1.0
For subsamples with the RBP III 300 + count, abundance was low at the Middle Restoration site
so no analysis was available. Taxa richness ranged from 19 at Alpha Control to 30 at the Lower
Restoration site (Table ULPR 4). The Hilsenhoff Biotic Index was lowest (5.2) at Alpha Control
and highest (6.0) at the Beta Control site. The ratio of scrapers to filtering collector functional
feeding groups was lowest (0.00) at the Alpha Control site and highest (0.27) at the Lower
Restoration site. Elmid larvae were the dominant scraper taxa collected and Cheumatopsyche sp.
larvae the most abundant filtering collector seen.
The ratio of shredders was highest at the Lower Restoration site, with Polypedilum sp. the most
abundant shredder collected (Table ULPR 4). The ratio of total EPT to Chironomids was highest
(3.3) at the Alpha Control site and lowest (0.09) at the Lower Restoration site. The dominant EPT
taxon collected was Cheumatopsyche sp. at all sites. The number of EPT taxa collected was highest
(7) at the Lower Restoration site and lowest (4) at the Alpha Control site. Orthocladius sp. larvae
dominated the collections at Beta Control and Lower Restoration sites while Cheumatopsyche sp.
larvae dominated the collections at the Alpha Control station.

Appendix C
39
Table ULPR 4. Data summary of benthic macroinvertebrates collected in D-frame samples on 31
March 2015 at stations in Upper Little Patuxent River.
RBP III Metrics
Riffle Community (RBP III 300+ subsample)
Alpha Control
Beta Control
Lower Restoration
Taxa Richness
19 30 27
Hilsenhoff Biotic Index 5.2 6.0 5.9
Ratio Scrapers to Filtering Collectors (%)
0.00 (0.3%)
0.06 (6.0%)
0.27 (26.9%)
Ratio Shredders to total Individuals (%)
0.02 (1.5%)
0.02 (2.0%)
0.06 (5.56%)
Total EPT Individuals to Total Chironomids (%)
3.31 (330.6%)
0.18 (17.6%)
0.09 (8.86%)
EPT Index 4 5 7
Percent Contribution of Dominant Taxon 28.0% 65.9% 59.2%
Physical Habitat: For the Upper Little Patuxent River stream restoration project, the proposed
restoration area below MD Route 144 is in a broad flood plain (historically, was there a small dam
and reservoir in this area sometime in the past?). The stream bottom was primarily fine sands and
clay with very little solid substrate present, and there were areas with deep entrenchment of the
stream into the softer materials present. There was great difficulty in finding riffle areas suitable
for benthic sampling, not only in the restoration site, but also in the control area. There was poor
shading in the restoration area since most of the vegetation was low understory plants. A number
of exotic plants were observed in the proposed restoration area.
For both the control and restoration area, there was a gas pipeline located along the eastern side of
the stream. In addition, there was also a sewage line running through both the control and
restoration areas. It appears that the area between Route 40 and Route 144 is mowed frequently,
and there is evidence of human disturbance throughout both areas. The MPHI was 68 for the
control area (fair) and 30 for the restoration area (poor).
Assessment Recommendation: The ULPR sites should be assessed after the stream
restoration is completed for two complete sample cycles, and then be placed on a revisit
schedule of either 5 or 10 years.

Appendix C
40
Watkins Mill Road (UTSC)
Site Description: This SHA pre-restoration site is located in Montgomery County, and is adjacent
to I-270 – the major high-traffic density road between Frederick, MD and I-495 – the Washington
Beltway (Figure UTSC 1). In addition, it is close to the interchange of I-270 and SR 124 (Quince
Orchard Road), and also close to the SHA pre-restoration site on Long Draught Branch.
The current construction plan is for the building of a bridge across I-270 that will link the southern
and northern extensions of Watkins Mill Road. During the bridge construction, stream restoration
work will be done with the upper limit of work being where the stream crosses under I-270. The
lower work area limit is the power line corridor that crosses I-270 to the west of SR 124. The
UTSC flows into Seneca Creek just to the west of Game Preserve Road.
During the 2014-2015 work, we noted that this unnamed tributary flows under I-270 through a
large culvert. During the Fall 2015 work, we plan on assessing the feasibility of sampling UTSC
to the north of I-270. However, there is very limited access to the stream and it is located next to
the westbound on-ramp for I-270, which may create safety problems. In addition, access (and
permission) may be difficult since a major defense contractor has a fenced perimeter that may
cross into the headwaters of UTSC.
Site Coordinates:
Site coordinates for the Unnamed Tributary to Seneca Creek (UTSC) site at Watkins
Mill Road (Figure UTSC 1).
Station Latitude Longitude Comments:
Middle 39.156352 -77.226806 Projected middle site.
Lower 39.158406 -77.229986 Projected lower site.
Alpha Control 39.152463 -77.221602 Upstream control I.
Beta Control 39.151496 -77.220157 Upstream control II.
Potential Control Area 39.150461 -77.217267 Control area

Appendix C
41
Fall
BETA Control
MIDDLE
(Pre-restoration)
LOWER
(Pre-restoration)
ALPHA Control
Potential Control Area
Figure UTSC 1. Site locations for sampling of unnamed tributary to Seneca Creek at
Watkins Mill Road (Montgomery County).

Appendix C
42
Fall 2014 UTSC Benthic Community - For subsamples with a 100+ macroinvertebrate count,
the number of EPT taxa, number of ephemeroptera taxa, and percent intolerant macroinvertebrates
were low (Table UTSC 1). Taxa richness was moderate at the Alpha Control and low at the
remaining stations. The percent of chironomids was moderate at all the stations. The percent
clingers was moderate at the two control sites and high at the restoration sites The trichopterans
Cheumatopsyche sp. and Chimerra sp. dominated the EPT taxa and they were also the dominant
macroinvertebrate clinger collected. The IBI value ranged from 1.7 (very poor) at the Beta Control
site to 2.3 (poor) at the Middle Restoration site.
Table UTSC 1. Data summary of benthic macroinvertebrates collected in D-frame samples on 22
September 2014 at stations in an unnamed tributary to Seneca Creek at Watkins Mill Rd.
Piedmont Metrics
Riffle Community (MBSS 100 + subsample)
Alpha
Control
Beta Control
Lower
Restoration
Middle
Restoration
Taxa Richness 15 13 13 11
Total EPT Taxa 4 4 4 5
Ephemeroptera taxa 1 0 1 1
% Intolerant Urban 4.2% 1.0% 2.8% 2.1%
% Chironomidae 17.7% 22.0% 9.4% 8.3%
% Clingers 46.9% 65.0% 85.8% 76.0%
BIBI 2.0 1.7 2.0 2.3
For subsamples with a 300 + count (Table UTSC 2), taxa richness was higher (23 and 25,
respectively) at the two control sites than at the restoration sites (18 and 20, respectively). The
Hilsenhoff Biotic Index was higher at the two control sites and lower at the two restoration sites.
The ratio of scrapers to filtering collector functional feeding groups was lower at the two
restoration sites compared to the two control sites. The dominant scrapers were physid snails and
the elmid Stenelmis sp. while the dominant filtering collectors were the trichopteran larvae
Cheumatopsyche sp. and Chimerra sp. The chironomid, Polypedilum sp., was the dominant
shredder collected and was highest at the Alpha Control site. Alpha and Beta Controls and the
Lower Restoration sites had proportionally more total EPT macroinvertebrates than chironomids,
resulting in higher ratios there than at the Middle Restoration Site. Cheumatopsyche sp. and
Chimerra sp. were the dominant EPT macroinvertebrates collected. The EPT index (5) was the

Appendix C
43
same at all stations. The percent contribution of the dominant taxon was highest (40.2%) at the
Lower Restoration Site and lowest (22.8%) at the Alpha Control Site. The dominant taxon
collected was Cheumatopsyche sp. at the two control sites and Chimerra sp. at the two restoration
sites.
Table UTSC 2. Data summary of benthic macroinvertebrates collected in D-frame samples on 22
September 2014 at stations in an unnamed tributary to Seneca Creek at Watkins Mill Rd.
RBP III Metrics
Riffle Community (RBP III 300 + subsample)
Alpha Control
Beta Control
Lower Restoration
Middle Restoration
Taxa Richness 23 25 18 20
Hilsenhoff Biotic Index 6.5 6.3 5.3 5.4
Ratio Scrapers to Filtering Collectors (%)
0.04 (4.2%)
0.10 (9.9%)
0.05 (4.5%)
0.0 (0.0%)
Ratio Shredders to total Individuals (%)
0.08 (8.2%)
0.06 (5.6%)
0.03 (3.3%)
0.03 (3.1%)
Total EPT Individuals to Total Chironomids (%)
1.66 (166%)
2.5 (250%)
55.7 (574%)
0.70 (70.3%)
EPT Index 5 5 5 5
Percent Contribution of Dominant Taxon 22.8% 34.1% 40.2% 32.6%
Spring 2015 UTSC Benthic Community - For subsamples with a 100 + macroinvertebrate count,
number of ephemeroptera taxa and percent intolerant macroinvertebrates was low (Table UTSC
3). Taxa richness was low at the Control sites and moderate at the restoration sites. Total EPT taxa
were moderate at the Lower Restoration site but low at the remaining sites. The percent of
chironomids and percent of clingers was moderate at all the stations. The trichopterans
Cheumatopsyche sp. and Chimarra sp. dominated the EPT taxa collected. The BIBI value ranged
from 1.7 (very poor) at the Alpha and Beta Control sites to 2.3 (poor) at the Lower Restoration
site.

Appendix C
44
Table UTSC 3. Data summary of benthic macroinvertebrates collected in D-frame samples on 30
March 2015 at stations in an unnamed tributary to Seneca Creek at Watkins Mill Rd.
Piedmont Metrics
Riffle Community (MBSS 100 + subsample)
Alpha
Control
Beta
Control
Lower
Restoration
Middle
Restoration Taxa Richness
10 10* 15 17 Total EPT Taxa
4 2* 5 4 Ephemeroptera taxa
0 0* 0 0 % Intolerant Urban
0.0% 0.0%* 1.0% 0.0% % Chironomidae
50.4% 44.3%* 26.0% 41.7% % Clingers
36.5% 40.5%* 63.5% 44.7% BIBI
1.7 1.7 2.3 2.0
For subsamples with a RBP III 300 + count, low abundance resulted in no macroinvertebrates for
the two control stations (Table UTSC 4). Taxa richness was higher (23) at the Middle Restoration
site than at the Lower Restoration site (18). The Hilsenhoff Biotic Index and ratio of scrapers to
filtering collectors was higher at the Middle Restoration site than at the Lower Restoration site.
However, the ratio of shredders to total individuals collected, and the total EPT to chironomids
was higher at the Lower Restoration as compared to the Middle Restoration site.
Although in low abundance, the dominant scrapers were physid snails and the elmid, Stenelmis
sp., while the dominant filtering collectors were the trichopteran larvae Cheumatopsyche sp. and
Chimarra sp. (Table UTSC 4). Both Cheumatopsyche sp. and Chimerra sp. were also the
dominant EPT macroinvertebrates collected. The number (5) of EPT taxa was the same at both
stations. The percent contribution of the dominant taxon was highest (36.2%) at the Lower
Restoration Site and lowest (20.5%) at the Middle Restoration site. The dominant taxon collected
was Cheumatopsyche sp. at both sites.

Appendix C
45
Table UTSC 4. Data summary of benthic macroinvertebrates collected in D-frame samples on 30
March 2015 at stations in an unnamed tributary to Seneca Creek at Watkins Mill Rd.
Metrics
Riffle Community (RBP III 300 + subsample)
Lower Restoration
Middle Restoration
Taxa Richness 18 23
Hilsenhoff Biotic Index 5.2 5.6
Ratio Scrapers to Filtering Collectors (%)
0.01 (0.9%)
0.02 (2.3%)
Ratio Shredders to total Individuals (%)
0.01 (1.1%)
0.01 (0.7%)
Total EPT Individuals to Total Chironomids (%)
5.89 (588.9%)
1.32 (131.7%)5
EPT Index 5 5
Percent Contribution of Dominant Taxon 36.2% 20.5%
Physical Habitat: The UTSC arises from a series of springs on the north side of I-270 adjacent
to Quince Orchard Road, and then flows under I-270 through a long culvert. After passing under
I-270, the stream is well-shaded until it reaches the treeless power line corridor (~ 113 m in width
at stream crossing of corridor). Through the proposed restoration reach, there are mature trees
present of several species, as well as significant undergrowth and several exotic species. Numerous
trees have fallen into the stream, creating a number of stable pools. In the upper part of the stream
reach, there is strong evidence of impervious surface effects with erosion of bed material down to
bedrock, as well as deep incisions into bed material throughout the entire restoration reach. There
are abundant debris bars, of small stones to moderate cobble, formed in the stream. Numerous
pool-riffle zones are present, with many of the larger, deeper pools having fishes present.
Bank slumping was observed in the upper reaches, as well as numerous perched tree roots in many
areas, indicating a severing of the riparian zone from the stream. Sections of the stream appeared
to have had some past stabilization work, with several rip-rap areas present. In addition, there was
also a sewage line running through both the stream reach. The MPHI was 60 for the control area
(fair) and 57 for the restoration area (fair).
Assessment Recommendation: The UTSC site should be assessed for one more cycle (2015-
2016). After the bridge is finished and all stream restoration work is completed and

Appendix C
46
stabilized, the site should be visited for two complete FY sample cycles, and then be placed
on a revisit schedule of either 5 or 10 years.

Appendix C
47
SHA Site Water Chemistry
Water Quality (WQ): All five FY 15 sites were sampled for MBSS water quality parameters
during the September 2014 and March 2015 SHA field work. In addition, we collected water
quality samples from the Little Paint Branch and Muddy Bridge Branch SHA sites (sampled during
the Fall and Spring of the SHA FY 14 work) in September 2014 in order to continue to develop a
stream water quality database for use in all SHA restoration site evaluations, both pre-construction
and post-construction.
Specific conductance and ANC values for several of these SHA sites fell outside of the upper 90th
percentile (Table WQ 1). All TN and TP values fell within the 10-90th percentile range, with only
one high value (5.7 mg/l) observed for TSS at the Muddy Bridge Branch site. Closed pH was
within the 10-90th percentile for all sites, both in the Fall and Spring water quality sampling. ANC
was generally elevated at all SHA sites, with the Upper Little Patuxent River and Long Draught
Branch being high in both Fall and Spring, with Long Draught Branch having the highest ANC
observed of 1713 µeq/L. Although the Plumtree Run site was below the 90th percentile of 1292
µeq/L, the ANC was 1149 µeq/L (Fall) and 934 µeq/L (Spring) – both well elevated over the 50th
ANC percentile (610 µeq/L). For the Marbury Drive site, ANC values for both the Fall and Spring
sampling were below the 90th percentile (Table WQ 1).
For Long Draught Branch, Plumtree Run, the Upper Little Patuxent River and Watkins Mill
(UTSC), specific conductance (457-1564 µS/cm) was elevated in both the Fall and Spring
sampling, with the highest value found at Long Draught Branch with a specific conductance over
1500 µS/cm (Table WQ 1). The Marbury Drive site had the lowest specific conductance values
(~ 400 µS/cm) in both Fall and Spring sampling. Stream specific conductivity exceeded the 25th
percentile (145 µS/cm) for the Northern Piedmont (EPA Level III) ecoregion sites (all SHA sites
except for Muddy Bridge Branch and Marbury Drive which fall into EPA Level III Southeastern
Plains) by a factor of 3.2-10.8 times (Morgan et al. 2012). Both Muddy Bridge Branch and
Marbury Drive exceeded the Southeastern Plains 25th percentile (103 µS/cm) by a factor of
approximately 4.0 times.
This elevated stream specific conductivity (and possibly the high ANC values) observed for the
SHA restoration sites potentially reflects the urban stream syndrome (Walsh et al. 2005) where
there is frequently high stream conductivity due to inputs from road salts (primarily sodium
chloride) and many other urban-related sources. In particular, many of these SHA sites are in very
close proximity to several major metropolitan road systems (I-270, I-70, I-97, I-495, I-695, I-95,
Route 40, Route 144, Route 24 and others) that are excessively salted during ice and snow events.
Other contributions to stream conductivity may come from leaking sewage pipes, runoff from
impervious surfaces and fertilizers, as well as legacy salt along roads and in groundwater.

Appendix C
48
Although all TN and TP values fell within the 10-90th percentile range (Table WQ I), several sites
exceeded the TN 25th percentile estimates (Morgan et al. 2013) for the Northern Piedmont (1.6
mg/L) and Southeastern Plains (0.33 mg/L) ecoregions of Maryland for both the Fall and Spring
sampling. In addition, numerous sites also exceeded the TP 25th percentile estimates (Morgan et
al. 2013) for the Northern Piedmont (0.010 mg/L) and Southeastern Plains (0.016 mg/L)
ecoregions of Maryland, also for both the Fall and Spring sampling. Indeed, many sites exceeded
both the TN and TP values similarly derived using the EPA Y-intercept and 75th percentile
estimations (Morgan et al. 2013). These exceedances of the derived TN and TP criteria, based on
EPA methodology, may be a major concern for any stream restoration project since eutrophic
stream conditions would not be favorable for either stream recovery or recolonization over time
(Morgan et al. 2013, Ashton et al. 2014).
For DOC, ortho-phosphate, ammonia, nitrite and nitrate (Table WQ 2), none of the values, except
one for ammonia, exceeded the calculated 90th percentile value. There was one exceedance of
ammonia (0.1084 mg/L) at Muddy Bridge Branch in September. Nitrate was elevated at several
sites, mimicking the TN levels observed at the SHA sites, and possibly a strong signal for urban
effects.
Chloride concentrations at the SHA sites exceeded the 10-90th percentile ranges for all September
and March sites, except for Muddy Bridge Branch in September 2014 (Table WQ 3). These
chloride levels correlate to the specific conductance measurements at these sites (Table WQ 1) as
expected since there is a strong relationship between chloride concentration and specific
conductance in Maryland non-tidal streams (Morgan et al 2012). For the Northern Piedmont SHA
sites, chloride exceeded the derived 25th Cl percentile (17.8 mg/L) by factors ranging from 4.7 to
21.0. For the Southeastern Plains SHA sites, chloride exceeded the derived 25th Cl percentile (10.9
mg/L) by factors ranging from 5.3 to 8.4. In SHA stream restoration sites, these elevated chloride
levels illustrate the latent salt effects observed in September and March, presumably from the
salting of road systems. These elevated chloride levels have a number of potential biological
effects on the SHA restoration sites.
For sulfate, there were no exceedances of the 90th percentile at all SHA sites (Table WQ 3).
Bromide values exceeded the 90th percentile at several site/date combinations, with Watkins Mill
(UTSC) having the highest bromide, followed by Long Draught Branch in both the Fall and Spring
sample periods. Calcium and magnesium concentrations (from many potential urban sources)
exceeded the 90th percentile at four of the five sites, with Watkins Mill (UTSC) having the highest
values for both calcium (71 mg/L) and magnesium (27 mg/L), while the Marbury Drive site did
not exceed the 90th percentiles for either magnesium or calcium (Table WQ 3).
Although elevated at several SHA sites, copper (4.7 µg/L) exceeded the 90th percentile at only
Long Draught Branch during the 22 September sampling (Table WQ 3). The same pattern was

Appendix C
49
observed for zinc at Long Draught Branch where the Fall value (36.8 µg/L) exceeded the 90th
percentile, and not during the Spring sampling. In contrast, zinc (also many potential urban
sources) exceeded the 90th percentile at six of the seven SHA sites for either the Spring or Fall
sample (or both), with Muddy Bridge Branch (39.4 µg/L) being double the 90th percentile for zinc
(Table WQ 3).
Water Quality Summary: Specific conductance and ANC values for several SHA sites fell
outside of the upper 90th percentile for MBSS random site data. ANC was generally elevated at
all SHA sites, with Long Draught Branch having the highest ANC observed of 1713 µeq/L as well
as the highest specific conductance of over 1500 µS/cm. Stream specific conductivity exceeded
the 25th percentile (145 µS/cm) for the Northern Piedmont (EPA Level III) ecoregion sites by a
factor of 3.2-10.8 times (Morgan et al. 2012); Muddy Bridge Branch and Marbury Drive (EPA
Level III Southeastern Plains) exceeded the Southeastern Plains 25th percentile (103 µS/cm) by a
factor of approximately 4.0 times. For the Northern Piedmont SHA sites, chloride exceeded the
derived 25th Cl percentile (17.8 mg/L) by factors ranging from 4.7 to 21.0. For the Southeastern
Plains SHA sites, chloride exceeded the derived 25th Cl percentile (10.9 mg/L) by factors ranging
from 5.3 to 8.4. Elevated stream specific conductivity, ANC and chloride for the SHA restoration
sites potentially reflect the urban stream syndrome (Walsh et al. 2005), and are of concern for all
past, present and future SHA stream restoration projects.
Several sites SHA exceeded the TN 25th percentile estimates (Morgan et al. 2013) for the Northern
Piedmont (1.6 mg/L) and Southeastern Plains (0.33 mg/L) ecoregions of Maryland for both the
Fall and Spring sampling. In addition, numerous sites also exceeded the TP 25th percentile
estimates (Morgan et al. 2013) for the Northern Piedmont (0.010 mg/L) and Southeastern Plains
(0.016 mg/L) ecoregions of Maryland. These exceedances of derived TN and TP criteria may be
a major concern for any stream restoration project since eutrophic stream conditions would not be
favorable for either stream recovery or biotic recolonization over time (Morgan et al. 2013, Ashton
et al. 2014).
Water Quality Recommendations: It is recommended that the MBSS chemistry be continued
at all scheduled FY 16 SHA sites for both Fall and Spring site efforts, with the potential to
expand the chemical analyses of transportation-linked chemicals in the future if funding
allows. Successful stream restoration is dependent on a number of factors, including
acceptable water quality.

Appendix C
50
Table WQ 1. Summary of total nitrogen (TN), total phosphorus (TP), total suspended solids
(TSS), specific conductance (SPC), closed pH and acid neutralizing capacity (ANC)
parameters for FY 15 SHA stream restoration sites (Bold = outside of 10-90th percentile
range; NA = not applicable).
Sample ID/Date TN
(mg/L) TP
(mg/L) TSS
(mg/L) SPC
(µS/cm) Closed
pH (STU) ANC
(µeq/L)
10-90th Percentile Range (MBSS)
0.29-4.6 0.007-0.092
NA 62-416 6.07-7.85 71-1292
Little Paint Branch 9.29.14
0.94 0.0128 0.8 494.6 7.67 874.2
Marbury Drive 9.29.14
1.42 0.0060 1.2 397.3 7.58 597.1
Muddy Bridge Branch 9.29.14
0.97 0.0113 5.7 408.8 6.58 1304.9
Long Draught Branch 9.22.14
2.01 0.0140 1.7 1563.6 7.56 1712.8
Plumtree Run 9.22.14
2.35 0.0071 1.9 840.5 7.21 1149.3
Upper Little Patuxent 9.22.14
1.83 0.0181 2.9 457.2 7.58 1627.3
Watkins Mill 9.22.14
1.30 0.0119 1.9 968.9 7.82 990.6
Long Draught Branch 3.30.15
1.77 0.0237 2.9 1298.6 7.57 1240.9
Marbury Drive 3.30.15
1.43 0.0145 2.9 403.7 7.27 720.4
Watkins Mill 3.30.15
1.96 0.0149 3.0 1419.4 7.41 1052.9
Plumtree Run 3.31.15
2.26 0.0143 2.2 907.3 7.41 933.6
Upper Little Patuxent 3.31.15
1.68 0.0150 4.0 516.0 7.60 1353.7

Appendix C
51
Table WQ 2. Summary of dissolved organic carbon (DOC), orthophosphate (Ortho-PO4),
ammonia-N, nitrite-N, and nitrate-N for SHA stream restoration sites (Bold = outside of 10-
90th percentile range; NA = not applicable).
Sample ID/Date DOC
(mg/L)
Ortho-PO4
(mg/L)
Ammonia-N (mg/L)
Nitrite-N (mg/L)
Nitrate-N + Nitrite-N (mg/L)
Nitrate-N (mg/L)
10 - 90th Percentile Range (MBSS)
1.0-9.0 0.0007-
0.023 0.0033-
0.085 0.0004-
0.016 NA 0.13-4.6
Little Paint Branch 9.29.14 2.1 0.0084 0.0103 0.0021 0.82 0.74 Marbury Drive 9.29.14 2.2 0.0025 0.0144 0.0039 1.29 1.20 Muddy Bridge Branch 9.29.14 3.2 0.0018 0.1084 0.0044 0.75 0.68 Long Draught Branch 9.22.14 2.0 0.0079 0.0058 0.0098 1.95 1.96 Plumtree Run 9.22.14 1.3 0.0031 0.0062 0.0044 2.34 2.39 Upper Little Patuxent 9.22.14 1.4 0.0085 0.0125 0.0041 1.76 1.81 Watkins Mill 9.22.14 1.5 0.0027 0.0313 0.0111 1.19 1.17 Long Draught Branch 3.30.15 1.4 0.0027 0.0074 0.0095 1.51 1.47 Marbury Drive 3.30.15 2.8 0.0036 0.0381 0.0056 1.20 1.18 Watkins Mill 3.30.15 1.0 0.0022 0.0060 0.0061 1.78 1.73 Plumtree Run 3.31.15 1.4 0.0019 0.0057 0.0071 1.99 1.92 Upper Little Patuxent 3.31.15 1.5 0.0045 0.0134 0.0046 1.50 1.47

Appendix C
52
Table WQ 3. Summary of chloride, bromide, sulfate, magnesium, calcium, copper and zinc
levels for SHA stream restoration sites (Bold = outside of 10-90th percentile range; NA = not
applicable).
Sample ID/Date Chloride (mg/L)
Bromide (mg/L)
Sulfate (mg/L)
Mg (mg/L)
Ca (mg/L)
Cu (µg/L)
Zn (µg/L
)
10 - 90th Percentile Range (MBSS)
3.8-68 0.0032-
0.062 5.5-28 1.1-13 2.6-40 0.40-2.4
0.8-19
Little Paint Branch 9.29.14 99.0 0.071 7.8 6.1 20.2 1.03 21.4 Marbury Drive 9.29.14 85.6 0.047 16.7 5.0 16.8 1.16 14.5 Muddy Bridge Branch 9.29.14 58.0 0.100 20.2 3.8 9.2 2.15 39.4
Long Draught Branch 9.22.14 348.2 0.139 21.8 24.6 65.2 4.74 36.8
Plumtree Run 9.22.14 182.1 0.077 25.3 15.8 47.3 1.19 11.9 Upper Little Patuxent 9.22.14 82.8 0.008 9.9 8.7 33.6 0.45 5.1 Watkins Mill 9.22.14 229.2 0.088 13.9 19.3 59.7 0.78 8.8 Long Draught Branch 3.30.15 342.6 0.134 15.5 23.3 60.6 2.2 14.9 Marbury Drive 3.30.15 92.0 0.041 17.8 5.5 17.4 1.3 37.9
Watkins Mill 3.30.15 374.2 0.175 17.9 27.2 71.3 2.0 20.9
Plumtree Run 3.31.15 220.7 0.077 23.7 17.1 46.1 1.4 21.6
Upper Little Patuxent 3.31.15 113.0 0.041 12.1 9.6 37.4 0.79 17.1
Appendix C
53
Literature Cited
Ashton, MJ, RP Morgan II and SA Stranko. 2014. Relations between macroinvertebrates,
nutrients, and water quality criteria in wadeable streams of Maryland, USA. Environmental
Monitoring and Assessment. 186:1167-1182.
Barbour, MT, J Gerritsen, BD Snyder and JB Stribling. 1999. Rapid bioassessment protocols for
use in streams and wadeable rivers: Periphyton, benthic macroinvertebrates and fish, Second
Edition. EPA 841-B-99-002. U.S. Environmental Protection Agency, Office of Water,
Washington, DC.
Bash, JS and CM Ryan. 2002. Stream restoration and enhancement projects: Is anyone
monitoring? Environmental Management 29:877-885.
Binns, NA. 1979. A habitat quality index for Wyoming trout streams. Fish. Res. Rep. Monogr.
Ser. No. 2, Wyoming Game and Fish Department, Cheyenne, WY.
Chang, CYC, C Kendall, SR Silva, WA Battaglin and DH Campbell. 2002. Nitrate stable isotopes:
tools for determining nitrate sources among different land uses in the Mississippi River Basin.
Canadian Journal of Fisheries and Aquatic Sciences 59:1874-1885.
Downs, PW and GM Kondolf. 2002. Post-project appraisals in adaptive management of river
channel restoration. Environmental Management 29:477-496.
Green, RH. 1979. Sampling design and statistical methods for environmental biologists. John
Wiley and Sons, New York, NY.
Hall, LW, R P Morgan II, E Perry, and A Walz. 1999. Development of a provisional physical
habitat index for Maryland freshwater streams. Final Report CBWP-MANTA-EA-99-12.
Prepared for: State of Maryland, Department of Natural Resources, Tidewater Administration,
Chesapeake Bay Research and Monitoring Division, Annapolis, MD.
Hall, LW, RP Morgan II, E Perry, and A Walz. 2002. Development of a provisional physical
habitat index for Maryland freshwater streams. Environmental Monitoring and Assessment
77:265-291.
Karr, JR. 1981. Assessment of biotic integrity using fish communities. Fisheries 6:21-27.
Karr, JR, KD Fausch, PL Angermeier, PR Yant, and IJ Schlosser. 1986. Assessing biological
integrity in running waters: A method and its rationale. Illinois Natural History Survey Special
Publication Number Five, Champaign, IL.
Kazyak, PF. 1996. Maryland biological stream survey sampling manual. Prepared for: State of
Maryland, Department of Natural Resources, Tidewater Administration, Chesapeake Bay
Research and Monitoring Division, Annapolis, MD.

Appendix C
54
Kendall, C, EM Elliott and SD Wankel. 2007. Tracing anthropogenic inputs of nitrogen to
ecosystems. Pages 375-449 in R Michener and K Lajtha (eds.) Stable Isotopes in Ecology and
Environmental Science, Blackwell Publishing, Malden, Maine.
Morgan II, RP. 2005. Are we failing at stream restoration? First International Conference on
Environmental Science and Technology, American Academy of Sciences, New Orleans, LA.
Morgan II, RP, DM Gates, MJ Kline, MR Lutmerding and MR Sell. 2010. Assessment of stream
restoration projects in Maryland: 1998-2010. Prepared for: Maryland Department of
Transportation, State Highway Administration, Highway Hydraulics Division, Baltimore, MD.
Morgan II, RP, KM Kline, MJ Kline, SF Cushman, MT Sell, RE Weitzell and JB Churchill. 2012.
Stream conductivity: relationships to land use, chloride, and fishes in Maryland streams.
North American Journal of Fisheries Management 32:941-952.
Morgan II, RP, KM Kline and JB Churchill. 2013. Estimating reference nutrient criteria for
Maryland ecoregions. Environmental Monitoring and Assessment 185:2123-2137.
Morris, S and T Moses. 1999. Urban stream rehabilitation: A design and construction case study.
Environmental Management 23:165-177.
National Research Council. 1992. Restoration of aquatic ecosystems: Science, technology, and
public policy. National Academy Press, Washington, DC.
Paul, MJ, JB Stribling, RJ Klauda, PF Kazyak, MT Southerland and NE Roth. 2002. A physical
habitat index for wadeable streams in Maryland. Prepared by Tetra Tech, Inc., Owings Mills,
MD, Versar and Maryland Department of Natural Resources, Monitoring and Non-Tidal
Assessment Program. CBWP-MANTA-EA-03-4.
Plafkin, JL, MT Barbour, KD Porter, SK Gross, RM Hughes. 1989. Rapid Bioassessment
Protocols for Use in Streams and Rivers. Benthic Macroinvertebrates and Fish. EPA/444/4-
89-001. Office of Water, U. S. Environmental Protection Agency, Washington, D.C.
Platts, WS. 1976. Validity of methodologies to document stream environments for evaluating
fishery conditions. Pages 267-284 in Instream flow needs procedures, Volume Two, American
Fisheries Society, Bethesda, MD.
Platts, WS, WF Megahan, and GW Minshall. 1983. Methods for evaluating stream, riparian, and
biotic conditions. General Technical Report INT-138. Intermountain Forest and Range
Experiment Station. U.S. Forest Service, USDA, Ogden, UT.
Rankin ET. 1989. The qualitative habitat evaluation index (QHEI): Rationale, methods and
application. Ohio Environmental Protection Agency, Division of Water Quality Planning and
Assessment, Ecological Assessment Section, Columbus, OH.
Appendix C
55
Roth, NE, MT Southerland, SB Weisberg, JC Chaillou, PF Kazyak, SA Stranko, RJ Klauda, LW
Hall, and RP Morgan II. 1998. Development and evaluation of a fish index of biotic integrity
for Maryland streams. Environmental Management and Assessment. 51:89-106.
Simon, TP. 1999. Introduction: Biological integrity and use of ecological health concepts for
application to water resource characterization. Pages 3-16 in TP Simon (ed.), Assessing the
sustainability and biological integrity of water resources using fish communities. CRC Press,
Boca Raton, FL.
Southerland MT, GM Rogers, MJ Kline, RP Morgan, DM Boward, PF Kazyak, RJ Klauda and SA
Stranko. 2007. Improving biological indicators to better assess the condition of streams.
Ecological Indicators 7:751-767.
Southerland MT, GM Rogers, MJ Kline, RP Morgan, DM Boward, PF Kazyak, RJ Klauda and SA
Stranko. 2005. New biological indicators to better assess the condition of Maryland streams.
Maryland Department of Natural Resources, Monitoring and Non-Tidal Assessment Program,
Annapolis, MD.
Stranko, S, D Boward, J Kilian, A Becker, M Ashton, A Schenk, R Gauza, A Roseberry-Lincoln
and P Kazyak. 2010. Maryland Biological Stream Survey, Round Three Sampling Manual,
Maryland Department of Natural Resources, Monitoring and Non-Tidal Assessment Program,
Annapolis, MD.
Stribling, JB, BK Jessup, JS White, D Boward, and M Hurd. 1998. Development of a benthic index
of biotic integrity for Maryland streams. Prepared by Tetra Tech, Inc., Owings Mills, MD and
Maryland Department of Natural Resources, Monitoring and Non-Tidal Assessment Program.
CBWP-MANTA-EA-98-3.
Sun, Y and MG Genton. 2011. Functional boxplots. Journal of Computational and Graphical
Statistics 20:316-334.
Wallace, JB. 1990. Recovery of lotic macroinvertebrate communities from disturbance.
Environmental Management 14:605-629.
Walsh, CJ, AH Roy, JW Feminella, PD Cottingham, PM Groffman and RP Morgan II. 2005. The
urban stream syndrome: current knowledge and search for a cure. J. North American
Benthological Society 24:706-723.
Yoder, CO and MA Smith. 1999. Using fish assemblages in a state biological assessment and
critical program: Essential concepts and considerations. Pages 17-56 in TP Simon (ed.),
Assessing the sustainability and biological integrity of water resources using fish communities.
CRC Press, Boca Raton, FL.


Appendix C
56
APPENDIX A.
Basic benthic invertebrate summary sheets for all SHA restoration sites sampled in 2014-2015
throughout the Maryland Piedmont and Coastal Plain.


Appendix C
57
LDB 1. Numbers of macroinvertebrates (MBSS 100 organism sample) collected in benthic samples by
combining 9-15 D-frame aquatic net samplings (total sampling area approximately ~ 1 m2) at sites in Long
Draught Branch on 22 September 2014. Insect quantities represent numbers of larvae or nymphs unless
designated otherwise by a P for pupa or A for adult.
TAXA
Long Draught Branch Sampling Sites (100 + subsample)
Alpha
Control
Beta
Control
Lower
Restoration
Middle
Restoration
Turbellaria
Cura sp. 40 29 1 30
Hoplonemertea 4 6 1 4
Annelida
Oligochaeta
Lumbriculidae 1 5 2
Naididae 61 46 21
Enchytraeidae 1
Hirudinae
Glossiphoniidae 1
Gastropoda
Planorbidae 1 1
Pelecypoda
Sphaeridae 1 6 1
Insecta
Ephemeroptera
Baetidae 6 5
Odonata
Coenagrionidae
Enallagma sp. 1
Trichoptera
Hydropsychidae 24
Cheumatopsyche sp. 1 40
Symphytopsyche sp. 3
Philopotomatidae 1
Chimarra sp. 1
Coleoptera
Elmidae
Stenelmis sp. 1
Hydrophilidae 1
Diptera
Ceratopogonidae
Atrichopogon sp. 1 1
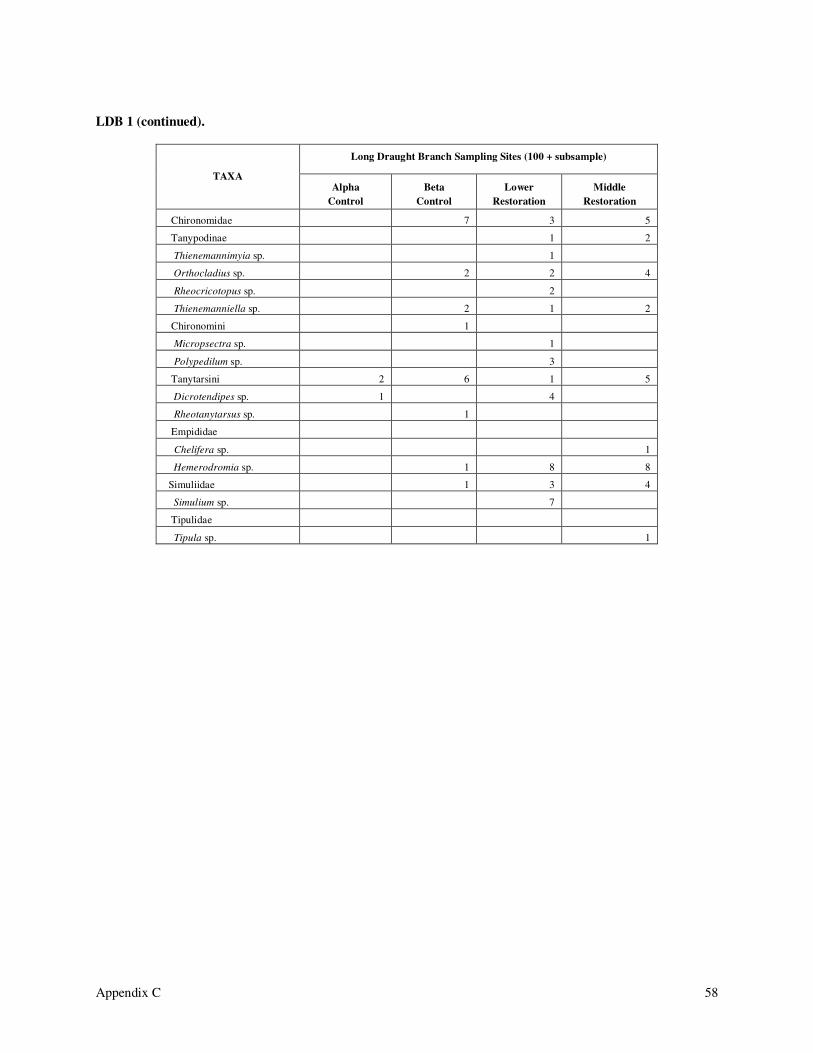
Appendix C
58
LDB 1 (continued).
TAXA
Long Draught Branch Sampling Sites (100 + subsample)
Alpha
Control
Beta
Control
Lower
Restoration
Middle
Restoration
Chironomidae 7 3 5
Tanypodinae 1 2
Thienemannimyia sp. 1
Orthocladius sp. 2 2 4
Rheocricotopus sp. 2
Thienemanniella sp. 2 1 2
Chironomini 1
Micropsectra sp. 1
Polypedilum sp. 3
Tanytarsini 2 6 1 5
Dicrotendipes sp. 1 4
Rheotanytarsus sp. 1
Empididae
Chelifera sp. 1
Hemerodromia sp. 1 8 8
Simuliidae 1 3 4
Simulium sp. 7
Tipulidae
Tipula sp. 1

Appendix C
59
LDB 2. Numbers of macroinvertebrates (EPA 300 organism sample) collected in benthic samples by combining
9-15 D-frame aquatic net samplings (total sampling area approximately ~ 1 m2) at sites in Long Draught
Branch on 22 September 2014. Insect quantities represent numbers of larvae or nymphs unless designated
otherwise by a P for pupa or A for adult.
TAXA
Long Draught Branch Sampling Sites (300 + subsample)
Alpha
Control
Beta
Control
Lower
Restoration
Middle
Restoration
Turbellaria
Cura sp. 85 78 7 84
Hoplonemertea 8 20 2 10
Nematoda 2
Annelida
Oligochaeta
Lumbriculidae 2 3 6 6
Naididae 165 90 5 73
Entrachidae 1
Hirudinae
Glossiphoniidae 1
Gastropoda
Ancylidae
Ferrissia sp. 1
Planorbidae 1 1
Pelecypoda
Sphaeriidae 1 14 1
Insecta
Collembola
Isotomidae 1
Ephemeroptera
Baetidae 3 22 29
Odonata
Coenagrionidae
Enallagma sp. 1
Trichoptera
Hydropsychidae 3 75
Cheumatopsyche sp. 1 80 1
Symphytopsyche sp. 3
Hydrophilidae 1
Philopotomatidae 1
Chimarra sp. 1

Appendix C
60
LDB 2 (continued).
TAXA
Long Draught Branch Sampling Sites (300 + subsample)
Alpha
Control
Beta
Control
Lower
Restoration
Middle
Restoration
Coleoptera
Elmidae
Stenelmis sp. 1
Hydrophilidae 1
Diptera
Ceratopogonidae
Atrichopogon sp. 1 1 4
Chironomidae 3 16 9 9
Diamesinae
Potthastia sp. 1
Tanypodinae 3 3
Thienemannimyia sp. 1
Orthocladinae 3 2 5
Corynoneura sp. 1
Eukiefferiella sp. 2
Orthocladius sp. 4 6 4
Rheocricotopus sp. 3
Thienemanniella sp. 1 6 7 5
Chironomini 2 1 1
Polypedilum sp. 2 7 2
Tanytarsini 2 23 10 14
Dicrotendipes sp. 3 9
Rheotanytarsus sp. 1 1 1
Empididae 2 1
Hemerodromia sp. 2 3 18 15
Chelifera sp. 1
Simuliidae 2 7 8
Simulium sp. 1 3 11 5
Tipulidae
Tipula sp. 1

Appendix C
61
LDB 3. Numbers of macroinvertebrates (MBSS 100 organism sample) collected in benthic samples by
combining 9-15 D-frame aquatic net samplings (total sampling area approximately ~ 1 m2) at sites in Long
Draught Branch on 30 March 2015. Insect quantities represent numbers of larvae or nymphs unless
designated otherwise by a P for pupa or A for adult.
TAXA
Long Draught Branch Sampling Sites (100 + subsample)
Alpha
Control
Beta
Control
Lower
Restoration
Middle
Restoration
Turbellaria 8 2 5
Nemertea 13 11 1 4
Nematoda 1
Annelida
Oligochaeta
Entrachidae 2
Lumbricidae
Eiseniella sp. 2 5
Lumbriculidae 8 3 3
Naididae 10 3 2 3
Tubificidae 3 1 2 4
Gastropoda
Lymnaeidae 1 3
Planorbidae 2 3
Pelecypoda
Sphaeriidae 2 2 2
Trichoptera
Hydropsychidae 1 1
Cheumatopsyche sp. 18 4
Hydropsyche sp. 1
Symphytopsyche sp. 2
Diptera
Ceratopogonidae
Culicoides sp. 1 2
Dasyhelea sp. 1
Chironomidae 1 2
Tanypodinae
Orthocladinae 1 2
Orthocladius sp. 17 14 61 37

Appendix C
62
LDB 3 (continued).
TAXA
Long Draught Branch Sampling Sites (100 + subsample)
Alpha
Control
Beta
Control
Lower
Restoration
Middle
Restoration
Chironomini 1
Polypedilum sp. 1
Pseudochironomus sp. 2 2
Tanytarsini 1
Empididae
Chelifera sp. 1 1
Hemerodromia sp. 1 5 3
Simuliidae
Simulium sp. 1
Tipulidae
Antocha sp. 1

Appendix C
63
LDB 4. Numbers of macroinvertebrates (EPA 300 organism sample) collected in benthic samples by combining
9-15 D-frame aquatic net samplings (total sampling area approximately ~ 1 m2) at sites in Long Draught
Branch on 30 March 2015. Insect quantities represent numbers of larvae or nymphs unless designated
otherwise by a P for pupa or A for adult.
TAXA
Long Draught Branch Sampling Sites
(300 + subsample)
Lower Restoration Middle Restoration
Turbellaria 5 8
Nemertea 5 11
Annelida
Oligochaeta
Entrachidae 3 6
Naididae 6 5
Lumbricidae
Eiseniella sp. 5
Lumbriculidae 9 11
Tubificidae 4 5
Gastropoda
Lymnaeidae 1 4
Physidae 1
Planorbidae 4
Pelecypoda
Sphaeriidae 1 8
Physidae 1
Insecta
Trichoptera
Hydropsychidae 7 2
Cheumatopsyche sp. 60 7
Hydropsyche sp. 3
Symphytopsyche sp. 9
Diptera
Ceratopogonidae
Culicoides sp. 2
Dasyhelea sp. 1

Appendix C
64
LDB 4 (continued).
TAXA
Long Draught Branch Sampling Sites
(300 + subsample)
Lower Restoration Middle Restoration
Chironomidae 2 5
Diamesinae
Tanypodinae 1 1
Orthocladinae 2
Orthocladius sp. 188 79
Chironomini 1
Pseudochironomus sp. 5 2
Tanytarsini 3
Empididae
Chelifera sp. 5 1
Hemerodromia sp. 10 5
Tipulidae
Antocha sp. 4 1

Appendix C
65
Table MAR 1. Numbers of macroinvertebrates (MBSS 100 organism sample) collected in benthic samples by
combining 9-15 D-frame aquatic net samplings (total sampling area approximately ~ 1 m2) at sites on
Marbury Drive (UT) on 15 September 2014. Insect quantities represent numbers of larvae or nymphs
unless designated otherwise by a P for pupa or A for adult.
TAXA
Marbury Drive Sampling Sites (100 + subsample)
Alpha
Control
Beta
control
Lower
Restoration
Middle
Restoration
#1
Middle
Restoration
#2
Turbellaria
Cura sp. 2 1
Nematoda 1
Annelida
Oligochaeta
Lumbriculidae 7 11 1 2 9
Naididae 8
Hirudinae
Glossiphoniidae 4
Gastropoda
Ancylidae 1
Lymnaeidae 1 1
Physidae 1 1
Insecta
Ephemeroptera
Baetidae 11 4 17 4 17
Baetis sp. 1
Heptageniidae
Odonata 1
Hydropsychidae 9 11 8 10 10
Cheumatopsyche sp. 1 2 11 8 8
Hydropsyche sp. 13 8 25 12 13
Symphytopsyche sp. 5 7 42 16
Philopotomatidae
Chimerra sp. 1 1 1 2
Coleoptera
Elmidae
Stenelmis sp. 1 2
Hydrophilidae
Enchorus sp. 2

Appendix C
66
MAR 1 (continued).
TAXA
Marbury Drive Sampling Sites (100 + subsample)
Alpha
Control
Beta
control
Lower
Restoration
Middle
Restoration
#1
Middle
Restoration
#2
Diptera
Ceratopogonidae
Culicoides sp. 1
Chironomidae 11 6 2 16
Tanypodinae 5 1 2 3 1
Ablabesmyia sp. 2
Zavrelimyia sp. 1 1
Thienemannimyia sp. 1 1 1 2
Orthocladinae 1 6
Corynoneura sp. 1 1
Eukiefferiella sp. 3 1
Orthocladius sp. 4 1 3 10 21
Parametriocnemus sp. 1
Rheocricotopus sp. 4 13 5 3
Thienemanniella sp. 1 4 8
Chironomini 4 1 2
Apedilum sp. 1 1 3 1
Crypytochironomus sp. 2 1 3
Polypedilum sp. 10 6 1 3 3
Pseudochironomus sp. 3 3 1 6 1
Tanytarsini 9 3 1 1 2
Dicrotendipes sp. 9 1
Micropsectra sp. 4 1 1
Rheotanytarsus sp. 2
Empididae 2
Chelifera sp. 2
Hemerodromia sp. 4 5 4 2 1
Simuliidae
Simulium sp. 3
Syrphidae
Chrysogaster sp. 1
Tipulidae
Hexatoma sp. 2
Pseudolimnophila sp. 2
Tipula sp. 2 6 2 2 2

Appendix C
67
Table MAR 2. Numbers of macroinvertebrates (EPA 300 organism sample) collected in benthic samples by
combining 9-15 D-frame aquatic net samplings (total sampling area approximately ~ 1 m2) at sites on
Marbury Drive (UT) on 15 September 2014. Insect quantities represent numbers of larvae or nymphs
unless designated otherwise by a P for pupa or A for adult.
TAXA
Marbury Drive Sampling Sites (300 + subsample)
Alpha
Control
Beta
Control
Lower
Restoration
Middle
Restoration #1
Middle
Restoration #2
Turbellaria
Cura sp. 2 1
Nematoda 2
Hoplonemertea 1
Annelida
Oligochaeta
Lumbriculidae 16 16 4 7 25
Naididae 1 12 1
Hirudinae
Glossiphoniidae 8
Gastropoda
Ancylidae 1
Lymnaeidae 1 1
Physidae 3 1 2 2
Insecta
Ephemeroptera
Baetidae 26 7 57 17 40
Baetis sp. 1
Odonata 1
Trichoptera
Hydropsychidae 27 17 24 33 35
Cheumatopsyche sp. 1 5 20 23 35
Hydropsyche sp. 21 10 51 59 30
Symphytopsyche sp. 17 10 85 42 14
Philopotomatidae 1 1
Chimerra sp. 1 1 3 2
Coleoptera
Elmidae
Stenelmis sp. 1 2
Hydrophilidae
Enchorus sp. 2

Appendix C
68
MAR 2 (continued).
TAXA
Marbury Drive Sampling Sites (300 + subsample)
Alpha
Control
Beta
Control
Lower
Restoration
Middle
Restoration #1
Middle
Restoration #2
Diptera
Ceratopogonidae
Atrichopogon sp. 2
Culicoides sp. 1
Chironomidae 20 13 15 37
Tanypodinae 10 2 3 5 5
Ablabesmyia sp. 2
Larisa sp. 2
Zavrelimyia sp. 2 1 1 1
Thienemannimyia sp. 3 1 4 4 3
Orthocladinae 7 4 7
Brillia sp. 1
Corynoneura sp. 16 2 8
Eukiefferiella sp. 6 3 2 1
Orthocladius sp. 41 1 2 45 88
Paracladopelma sp. 3
Parametriocnemus sp. 1
Rheocricotopus sp. 10 18 10 11
Thienemanniella sp. 9 1 14 16
Chironomini 13 1 1 6
Apedilum sp. 1 1 9 1
Crypytochironomus sp. 11 1 12
Phaenopsectra sp. 2
Polypedilum sp. 26 8 5 6 10
Pseudochironomus sp. 12 3 1 17
Tanytarsini 16 5 5 6 11
Dicrotendipes sp. 21 4
Micropsectra sp. 18 2 3 1
Paratendipes sp. 3
Rheotanytarsus sp. 2 1
Tanytarsus sp. 1 5
Empididae 1 2
Chelifera sp. 2 1
Hemerodromia sp. 12 7 15 8 6

Appendix C
69
MAR 2 (continued).
TAXA
Marbury Drive Sampling Sites (300 + subsample)
Alpha
Control
Beta
Control
Lower
Restoration
Middle
Restoration #1
Middle
Restoration #2
Simuliidae 1 2
Simulium sp. 1 5
Syrphidae
Chrysogaster sp. 1
Tipulidae
Antocha sp.
Hexatoma sp. 2
Pseudolimnophila sp. 4
Tipula sp. 8 6 5 8 6

Appendix C
70
Table MAR 3. Numbers of macroinvertebrates (MBSS 100 organism sample) collected in benthic samples by
combining 9-15 D-frame aquatic net samplings (total sampling area approximately ~ 1 m2) at sites on
Marbury Drive (UT) on 30 March 2015. Insect quantities represent numbers of larvae or nymphs unless
designated otherwise by a P for pupa or A for adult.
TAXA
Marbury Drive Site Sampling Stations (MBSS 100 + subsample)
Alpha
Control
Beta
Control
Lower
Restoration
Middle
Restoration
Turbellaria 1
Nematoda 2 2
Hoplonemertea 3 1
Annelida
Oligochaeta
Enchytraeidae 2 7
Naididae 2 3 1
Lumbricidae
Eiseniella sp. 1 1 1 1
Lumbriculidae 7 3
Tubificidae 1 13 6
Gastropoda
Lymnaeidae 3
Physidae 2
Insecta
Odonata
Coenagrionidae
Argia sp. 1
Trichoptera
Hydropsychidae 1 6 3
Cheumatopsyche sp. 1 4 3
Hydropsyche sp. 29 4 25 13
Symphytopsyche sp. 1 1 4
Diptera
Chironomidae 8 3 10
Tanypodinae 1 1 1
Thienemannimyia grp. 2
Orthocladinae 1 2 2
Eukiefferiella sp. 1
Limnophyes sp. 4
Orthocladius sp. 23 12 31 19
Smittia sp. 1
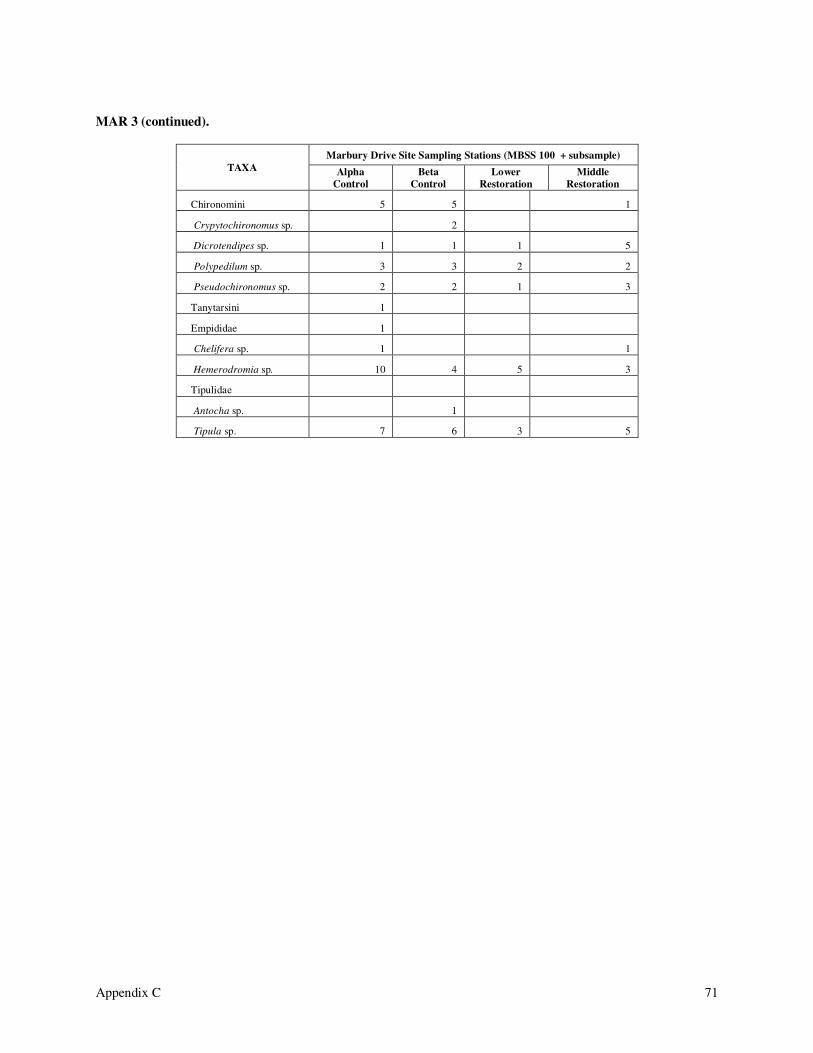
Appendix C
71
MAR 3 (continued).
TAXA
Marbury Drive Site Sampling Stations (MBSS 100 + subsample)
Alpha
Control
Beta
Control
Lower
Restoration
Middle
Restoration
Chironomini 5 5 1
Crypytochironomus sp. 2
Dicrotendipes sp. 1 1 1 5
Polypedilum sp. 3 3 2 2
Pseudochironomus sp. 2 2 1 3
Tanytarsini 1
Empididae 1
Chelifera sp. 1 1
Hemerodromia sp. 10 4 5 3
Tipulidae
Antocha sp. 1
Tipula sp. 7 6 3 5

Appendix C
72
Table MAR 4. Numbers of macroinvertebrates (EPA 300 organism sample) collected in benthic samples by
combining 9-15 D-frame aquatic net samplings (total sampling area approximately ~ 1 m2) at sites on
Marbury Drive (UT) on 30 March 2015. Insect quantities represent numbers of larvae or nymphs unless
designated otherwise by a P for pupa or A for adult.
TAXA
Marbury Drive Site Sampling Stations
(300 + subsample)
Lower
Restoration
Middle
Restoration
Turbellaria 1
Nematoda 2
Hoplonemerta 2
Annelida
Oligochaeta
Enchytraeidae 11
Lumbricidae
Eiseniella sp. 1 2
Lumbriculidae 5
Naididae 3 3
Tubificidae 19 11
Gastropoda
Lymnaeidae 1 6
Physidae 4
Insecta
Odonata
Coenagrionidae
Argia sp. 1 1
Trichoptera
Hydropsychidae 8 12
Cheumatopsyche sp. 6 3
Hydropsyche sp. 42 23
Symphytopsyche sp. 4 6
Diptera
Chironomidae 3 10
Tanypodinae 1 2
Thienemannimyia grp. 2
Orthocladinae 1 5
Limnophyes sp. 4
Orthocladius sp. 41 53
Smittia sp. 1

Appendix C
73
MAR 4 (continued).
TAXA
Marbury Drive Site Sampling Stations
(300 + subsample)
Lower
Restoration
Middle
Restoration
Chironomini
Crypytochironomus sp. 1
Dicrotendipes sp. 1 8
Polypedilum sp. 4 6
Pseudochironomus sp. 1 6
Empididae
Chelifera sp. 4
Hemerodromia sp. 5 9
Tipulidae
Tipula sp. 3 8

Appendix C
74
Table PTR 1. Numbers of macroinvertebrates (MBSS 100 organism sample) collected in benthic samples by
combining 9-15 D-frame aquatic net samplings (total sampling area approximately 1 m2) at sites in Plumtree
Run on 22 September 2014. Insect quantities represent numbers of larvae or nymphs unless designated
otherwise by a P for pupa or A for adult.
TAXA
Plumtree Run Sampling Sites (100 + subsample)
Alpha
Control
Beta
Control
Gamma
Control
Delta
Control
Lower
Restoration
Middle
Restoration
Turbellaria
Cura sp. 1 1
Nematoda
Annelida
Oligochaeta
Lumbriculidae 1 1
Naididae
Entrachidae 1
Tubificidae
Gastropoda
Physidae 1
Crustacea
Amphipoda 1
Crangonyctidae 8
Synurella sp. 1
Isopoda 1
Aesilidae
Caecidotea sp. 1 1
Decapoda
Cambridae
Orconectes sp. 1 1
Insecta
Ephemeroptera
Baetidae 2 2 15 3 10 4
Acentrella sp. 1
Baetis sp. 1 2
Hemiptera
Gerridae
Trepobates sp. 1

Appendix C
75
PTR 1 (continued).
TAXA
Plumtree Run Sampling Sites (100 + subsample)
Alpha
Control
Beta
Control
Gamma
Control
Delta
Control
Lower
Restoration
Middle
Restoration
Trichoptera
Hydropsychidae 7 9 4 7 8 9
Cheumatopsyche sp. 29 4 8 10 23 24
Hydropsyche sp. 7 3 3 6 10 14
Symphytopsyche sp. 3 3 14 9 14 7
Philopotomatidae 5 2 4 3 1 5
Chimerra sp. 35 29 57 58 40 24
Coleoptera
Elmidae
Oulimnius sp.
Stenelmis sp. 10 1 2 3 1
Psephenidae
Psephenus sp. 4 1 1
Diptera
Culicoides sp.
Chironomidae 1 4 5 2 1
Tanypodinae 1 1
Thienemannimyia sp. 1 1 1 3
Larsia sp. 1
Orthocladinae 1
Corynoneura sp. 5 1
Eukiefferiella sp. 2 1 1 2
Orthocladius sp. 3 2 1 6
Parametriocnemus sp. 1 1 1
Rheocricotopus sp. 1 1
Thienemanniella sp. 2 2 1
Tvetenia sp. 1
Chironomini 4 5 4 1
Crypytochironomus sp. 1
Dicrotendipes sp.
Polypedilum sp. 2 3 1 2
Pseudochironomus sp. 5 1 1

Appendix C
76
PTR 1 (continued).
TAXA
Plumtree Run Sampling Sites (100 + subsample)
Alpha
Control
Beta
Control
Gamma
Control
Delta
Control
Lower
Restoration
Middle
Restoration
Tanytarsini 1 1 2
Micropsectra sp. 1
Rheotanytarsus sp. 1
Empididae
Chelifera sp. 1
Clinocera sp. 2 1
Hemerodromia sp.
Simuliidae 2
Simulium sp. 3 2 15 1
Tipulidae
Antocha sp. 2 1
Hexatoma sp. 5
Tipula sp. 1

Appendix C
77
Table PTR 2. Numbers of macroinvertebrates (EPA 300 organism sample) collected in benthic samples by
combining 9 D-frame aquatic net samplings (total sampling area approximately 1 m2) at sites in Plumtree
Run on 22 September 2014. Insect quantities represent numbers of larvae or nymphs unless designated
otherwise by a P for pupa or A for adult.
TAXA
Plumtree Run Sampling Sites (300 + subsample)
Alpha
Control
Beta
Control
Gamma
Control
Delta
Control
Lower
Restoration
Middle
Restoration
Turbellaria
Cura sp. 1 3 7
Nematoda
Annelida
Oligochaeta
Lumbriculidae 2 1
Naididae 2 3
Entrachidae 2
Tubificidae 1
Gastropoda
Ancylidae
Ferrissia sp. 1
Physidae 1
Crustacea
Amphipoda 1 1 1 2
Crangonyctidae 1 16
Synurella sp. 2 2
Isopoda 1
Aesilidae
Caecidotea sp. 1 1 3
Decapoda
Cambridae
Orconectes sp. 1 1
Insecta
Collembola
Isotomidae
Semicerura sp. 1
Ephemeroptera
Baetidae 13 15 56 14 21 20
Acentrella sp. 2 1
Baetis sp. 1 1 7 2

Appendix C
78
PTR 2 (continued).
TAXA
Plumtree Run Sampling Sites (300 + subsample)
Alpha
Control
Beta
Control
Gamma
Control
Delta
Control
Lower
Restoration
Middle
Restoration
Odonata
Aeshnidae 1
Calyopterygidae
Calyopteryx sp. 1
Hemiptera
Gerridae
Trepobates sp. 1
Veliidae
Microvelia sp. 3
Rhagovelia sp. 1 1
Trichoptera
Hydropsychidae 24 23 41 27 47 47
Cheumatopsyche sp. 72 23 32 32 71 64
Hydropsyche sp. 35 12 12 24 24 25
Symphytopsyche sp. 14 10 37 44 42 27
Hydrophilidae
Hydroptila sp. 1
Philopotomatidae 14 10 10 10 15 7
Chimerra sp. 127 93 151 187 105 61
Psychomyidae 1
Psychomyia sp. 1 1
Coleoptera
Elmidae 1
Oulimnius sp.
Stenelmis sp. 33 3 4 9 9 4
Psephenidae
Psephenus sp. 10 15 1 2 1
Diptera
Ceratopogonidae 1
Atrichopogon sp. 1 1
Culicoides sp.

Appendix C
79
PTR 2 (continued).
TAXA
Plumtree Run Sampling Sites (300 + subsample)
Alpha
Control
Beta
Control
Gamma
Control
Delta
Control
Lower
Restoration
Middle
Restoration
Chironomidae 8 9 13 6 2 7
Tanypodinae 1 4 1 1 2
Thienemannimyia sp. 3 3 1 8
Larsia sp. 1
Orthocladinae 1 1 2 6 2
Brillia sp.
Corynoneura sp. 9 4 8 1
Eukiefferiella sp. 13 13 2 1 1 4
Orthocladius sp. 16 4 5 2 8
Parametriocnemus sp. 8 7 2 2 3 4
Rheocricotopus sp. 1 4 1 2
Thienemanniella sp. 6 15 3 2 3
Tvetenia sp. 1
Xylotopus sp. 1
Chironomini 3 7 8 7 1 2
Apedilum sp. 1
Crypytochironomus sp. 3
Dicrotendipes sp.
Polypedilum sp. 3 8 5 6 6 6
Pseudochironomus sp. 11 9 2 1 1
Tanytarsini 4 11 5 1 4
Micropsectra sp. 2 1
Rheotanytarsus sp. 4 1
Empididae 1
Chelifera sp. 2 1 1
Clinocera sp. 1 6 2 2
Hemerodromia sp. 2
Simuliidae 4 6 4 2 1
Simulium sp. 11 5 39 3 9 1
Tipulidae 1 1
Antocha sp. 9 3 1 2
Hexatoma sp. 4 14
Limonia sp. 1
Tipula sp. 1 1 3

Appendix C
80
Table PTR 3. Numbers of macroinvertebrates (MBSS 100 organism sample) collected in benthic samples by
combining 9-15 D-frame aquatic net samplings (total sampling area approximately 1 m2) at sites in Plumtree
Run on 31 March 2015. Insect quantities represent numbers of larvae or nymphs unless designated
otherwise by a P for pupa or A for adult.
TAXA
Plumtree Run Sampling Sites (100+ subsample)
Alpha
Control
Beta
Control
Gamma
Control
Delta
Control
Lower
Restoration
Middle
Restoration
Turbellaria 1
Hoplonemertea 1
Annelida
Oligochaeta
Entrachidae 2
Lumbricidae
Eiseniella sp. 3
Lumbriculidae 1
Naididae 1 2
Tubificidae 2
Crustaceae
Isopoda
Aesilidae 1
Insecta
Trichoptera
Hydropsychidae 1 1 1
Cheumatopsyche sp. 3 8 2 8 4
Hydropsyche sp. 5 1 2 3
Symphytopsyche sp. 2 3 2
Philopotomatidae
Chimarra sp. 4 2 4 9 6
Coleoptera
Elmidae 1
Stenelmis sp. 4 1 1
Psephenidae
Psephenus sp. 1
Diptera
Chironomidae 2 6 4 2 3 3
Diamesinae
Diamesa sp. 3 3 3 3

Appendix C
81
PTR 3 (continued).
TAXA
Plumtree Run Sampling Sites (100+ subsample)
Alpha
Control
Beta
Control
Gamma
Control
Delta
Control
Lower
Restoration
Middle
Restoration
Tanypodinae 1 1
Thienemannimyia grp. 1
Orthocladinae 5 4 1
Eukiefferiella sp. 4 8 4 5
Orthocladius sp. 65 50 66 82 61 63
Parametriocnemus sp. 4 2
Chironomini 1 3 1 5
Apedilum sp. 3
Crypytochironomus sp. 1
Polypedilum sp. 1 1 1
Pseudochironomus sp. 1 1 2 2 1 1
Tanytarsini 1 2 1 3 3
Micropsectra sp. 1
Empididae
Chelifera sp. 1 2 1
Clinocera sp.
Hemerodromia sp. 1 1 2
Tipulidae
Antocha sp. 9 4 4 3 2
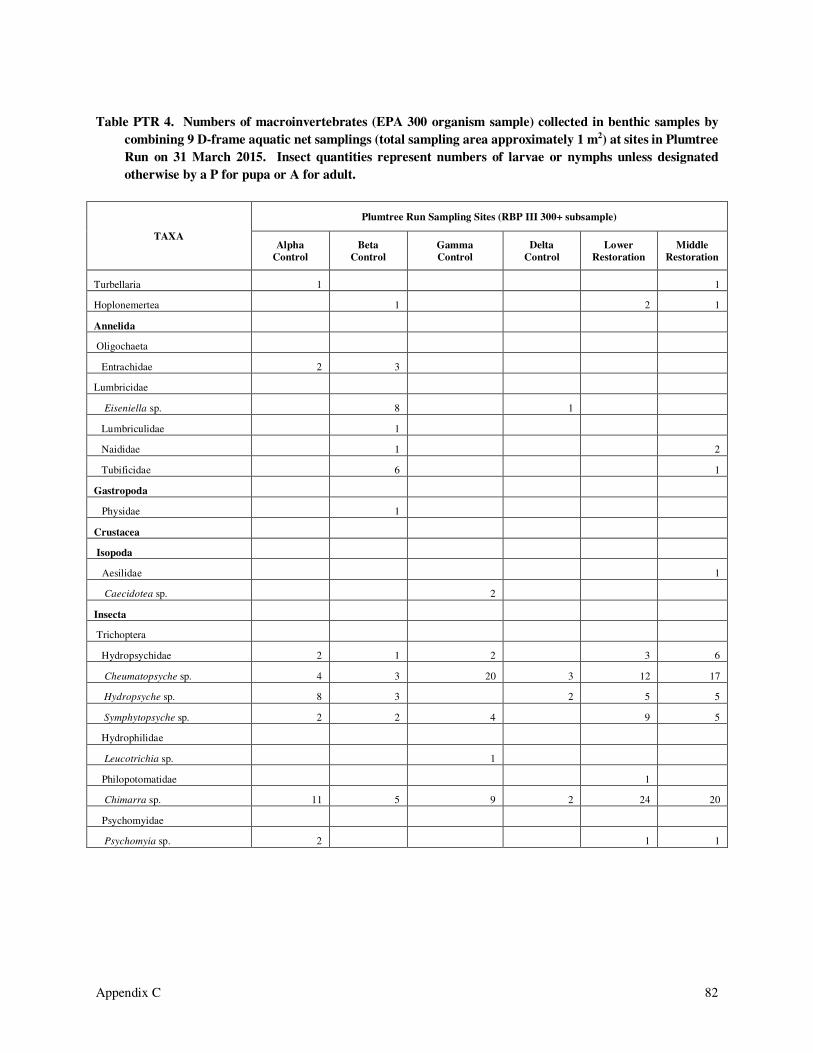
Appendix C
82
Table PTR 4. Numbers of macroinvertebrates (EPA 300 organism sample) collected in benthic samples by
combining 9 D-frame aquatic net samplings (total sampling area approximately 1 m2) at sites in Plumtree
Run on 31 March 2015. Insect quantities represent numbers of larvae or nymphs unless designated
otherwise by a P for pupa or A for adult.
TAXA
Plumtree Run Sampling Sites (RBP III 300+ subsample)
Alpha
Control
Beta
Control
Gamma
Control
Delta
Control
Lower
Restoration
Middle
Restoration
Turbellaria 1 1
Hoplonemertea 1 2 1
Annelida
Oligochaeta
Entrachidae 2 3
Lumbricidae
Eiseniella sp. 8 1
Lumbriculidae 1
Naididae 1 2
Tubificidae 6 1
Gastropoda
Physidae 1
Crustacea
Isopoda
Aesilidae 1
Caecidotea sp. 2
Insecta
Trichoptera
Hydropsychidae 2 1 2 3 6
Cheumatopsyche sp. 4 3 20 3 12 17
Hydropsyche sp. 8 3 2 5 5
Symphytopsyche sp. 2 2 4 9 5
Hydrophilidae
Leucotrichia sp. 1
Philopotomatidae 1
Chimarra sp. 11 5 9 2 24 20
Psychomyidae
Psychomyia sp. 2 1 1

Appendix C
83
PTR 3 (continued).
TAXA
Plumtree Run Sampling Sites (RBP III 300 + subsample)
Alpha
Control
Beta
Control
Gamma
Control
Delta
Control
Lower
Restoration
Middle
Restoration
Coleoptera
Elmidae 1
Stenelmis sp. 7 4 2 1
Psephenidae
Psephenus sp. 1 1
Diptera
Chironomidae 5 11 15 8 12 7
Diamesinae
Diamesa sp. 13 14 6 4 2
Tanypodinae 1 1 1 2 1
Thienemannimyia grp. 1 1 3 2
Orthocladinae 3 9 7 1 2
Brillia sp. 1
Eukiefferiella sp. 4 8 2 4 14
Orthocladius sp. 234 141 231 244 186 184
Parametriocnemus sp. 4 9 5 4
Thienemanniella sp. 1 1
Chironomini 1 6 2 8
Apedilum sp. 10 3
Crypytochironomus sp. 1 1 1 2
Pseudochironomus sp. 2 8 3 8 7 12
Tanytarsini 6 9 8 2 5 9
Micropsectra sp. 1 1
Empididae
Chelifera sp. 2 3 2 1
Clinocera sp. 1 1
Hemerodromia sp. 1 1 2 3
Simuliidae
Simulium sp. 1
Tipulidae
Antocha sp. 16 5 6 5 5 8
Tipula sp. 1

Appendix C
84
Table ULPR 1. Numbers of macroinvertebrates (MBSS 100 organism sample) collected in benthic samples by
combining 9-15 D-frame aquatic net samplings (total sampling area approximately 1 m2) at sites on the
Upper Little Patuxent River on 22 September 2014. Insect quantities represent numbers of larvae or
nymphs unless designated otherwise by a P for pupa or A for adult.
TAXA
Upper Little Patuxent River Sites (100+ subsample)
Alpha
Control
Beta
Control
Lower
Restoration
Middle
Restoration
Turbellaria
Cura sp. 2
Nematoda 1 1
Hoplonemertea 2
Annelida
Oligochaeta
Lumbriculidae 2
Naididae 2 1
Tubificidae 1
Pelecypoda
Sphaeriidae 2 2 7 3
Insecta
Ephemeroptera
Baetidae 5 3 16 12
Baetis sp. 3 3
Heptageniidae 1
Odonata
Aeshnidae
Boyeria sp. 1
Hemiptera
Veliidae
Rhagovelia sp. 3 1
Megaloptera
Corydalidae
Nigronia sp. 1 4 1
Trichoptera
Glossosomatidae
Glossosoma sp. 1 2
Hydropsychidae 20 3 9 8
Cheumatopsyche sp. 24 11 4 16
Hydropsyche sp. 17 4 1 1
Symphytopsyche sp. 14 20 5 11

Appendix C
85
ULPR 1 (continued).
TAXA
Upper Little Patuxent Sites (100+ subsample)
Alpha
Control
Beta
Control
Lower
Restoration
Middle
Restoration
Hydrophilidae
Hydroptila sp. 1
Philopotomatidae 2
Chimerra sp. 15 28 4
Coleoptera
Elmidae
Optioservus sp. 2
Stenelmis sp. 1 6
Diptera
Chironomidae 1 7 2
Tanypodinae 1
Nilotanypus sp. 1
Thienemannimyia sp. 2 2
Orthocladinae 1 2
Corynoneura sp. 1 1
Eukiefferiella sp. 1 1
Orthocladius sp. 2 2
Parametriocnemus sp. 1
Rheocricotopus sp. 1
Thienemanniella sp. 1 5
Chironomini 1 4
Apedilum sp. 3
Polypedilum sp. 4 2 20 4
Tanytarsini 8 5 9 8
Micropsectra sp. 2 1
Rheotanytarsus sp. 2
Chelifera sp.
Hemerodromia sp. 1
Simuliidae 5 1 2
Simulium sp. 1 1
Tipulidae
Antocha sp. 3 1
Hexatoma sp. 1
Tipula sp. 1

Appendix C
86
Table ULPR 2. Numbers of macroinvertebrates (EPA 300 organism sample) collected in benthic samples by
combining 9-15 D-frame aquatic net samplings (total sampling area approximately 1 m2) at sites on the
Upper Little Patuxent River on 22 September 2014. Insect quantities represent numbers of larvae or
nymphs unless designated otherwise by a P for pupa or A for adult.
TAXA
Upper Little Patuxent River Sampling Sites (300 + subsample)
Alpha
Control
Beta
Control
Lower
Restoration
Middle
Restoration
Turbellaria
Cura sp. 1 1 2
Nematoda 1 1
Hoplonemertea 3 5
Annelida
Oligochaeta
Lumbriculidae 2
Naididae 2 1
Tubificidae 2 1
Pelecypoda
Sphaeriidae 3 2 14 3
Insecta
Ephemeroptera
Baetidae 13 12 53 56
Baetis sp. 7 3
Heptageniidae 1 1
Odonata
Aeshnidae
Boyeria sp. 1
Calyopterygidae
Calopteryx sp. 1
Gomphidae 1
Hemiptera
Veliidae
Microvelia sp. 3
Rhagovelia sp. 3 6 1
Megaloptera
Corydalidae
Nigronia sp. 3 6 1

Appendix C
87
ULPR 2 (continued).
TAXA
Upper Little Patuxent River Sampling Sites (300 + subsample)
Alpha
Control
Beta
Control
Lower
Restoration
Middle
Restoration
Trichoptera
Glossosomatidae
Glossosoma sp. 1 1 1 2
Hydropsychidae 75 12 30 21
Cheumatopsyche sp. 52 41 17 36
Hydropsyche sp. 23 2 4
Symphytopsyche sp. 41 47 23 37
Hydrophilidae 29
Hydroptila sp. 1
Leucotrichia sp.
Philopotomatidae 9 3 3
Chimerra sp. 31 75 2 14
Coleoptera
Elmidae
Macronychus sp. 1
Optioservus sp. 2
Stenelmis sp. 4 14 2 1
Diptera
Chironomidae 7 1 15 10
Tanypodinae 1
Nilotanypus sp. 1
Thienemannimyia sp. 2 2 1 2
Orthocladinae 4 3 3
Corynoneura sp. 3 2
Eukiefferiella sp. 5 4 1 2
Orthocladius sp. 6 5
Parametriocnemus sp. 2
Rheocricotopus sp. 1 3
Thienemanniella sp. 1 5 10

Appendix C
88
ULPR 2 (continued).
TAXA
Upper Little Patuxent River Sampling Sites (300 + subsample)
Alpha
Control
Beta
Control
Lower
Restoration
Middle
Restoration
Chironomini 2 5 1
Apedilum sp. 8
Crypytochironomus sp. 15 1
Phaenopsectra sp. 1
Polypedilum sp. 10 5 49 15
Pseudochironomus sp. 27
Tanytarsini 18 16 15
Dicrotendipes sp. 1
Micropsectra sp. 2 4 3
Rheotanytarsus sp. 4 1 3
Empididae 3
Chelifera sp. 1
Hemerodromia sp. 2 6
Simuliidae 6 1 4
Simulium sp. 4 2 3
Tipulidae 1
Antocha sp. 5 3 1 3
Hexatoma sp. 1
Tipula sp. 3

Appendix C
89
Table ULPR 3. Numbers of macroinvertebrates (MBSS 100 organism sample) collected in benthic samples by
combining 9-15 D-frame aquatic net samplings (total sampling area approximately 1 m2) at sites on the
Upper Little Patuxent River on 31 March 2015. Insect quantities represent numbers of larvae or nymphs
unless designated otherwise by a P for pupa or A for adult.
TAXA
Upper Little Patuxent Sampling Sites ( MBSS 100 + subsample)
Alpha
Control
Beta
control
Lower
Restoration
Middle
Restoration
Nematoda 1
Annelida
Oligochaeta
Tubificidae 4
Insecta
Ephemeroptera
Heptageniidae
Stenonema sp. 1
Trichoptera
Hydropsychidae 4
Cheumatopsyche sp. 32 11 4
Hydropsyche sp. 7
Symphytopsyche sp. 21 1
Philopotomatidae
Chimarra sp. 17 4 2
Coleoptera
Elmidae
Optioservus sp. 1
Stenelmis sp. 1
Diptera
Chironomidae 2 9 3
Diamesinae
Diamesa sp. 1
Tanypodinae 1
Thienemannimyia grp. 1
Orthocladinae 2 2
Corynoneura sp. 1
Eukiefferiella sp. 1 1
Orthocladius sp. 13 76 68 71
Parametriocnemus sp.
Psectrocladius sp. 4
Thienemanniella sp. 5

Appendix C
90
ULPR 3 (continued).
TAXA
Upper Little Patuxent Sampling Sites ( MBSS 100+ subsample)
Alpha
Control
Beta
control
Lower
Restoration
Middle
Restoration
Chironomini 1 3 6
Apedilum sp. 2 2 2
Crypytochironomus sp. 1
Polypedilum sp. 1 6 5
Pseudochironomus sp. 2
Tanytarsini 2
Dicrotendipes sp. 2 1
Micropsectra sp.
Rheotanytarsus sp. 1 1
Chelifera sp. 1 3
Clinocera sp. 2 2
Hemerodromia sp. 1
Simuliidae
Prosimulium sp. 1
Tipulidae
Antocha sp. 4 1
Dicranota sp. 1
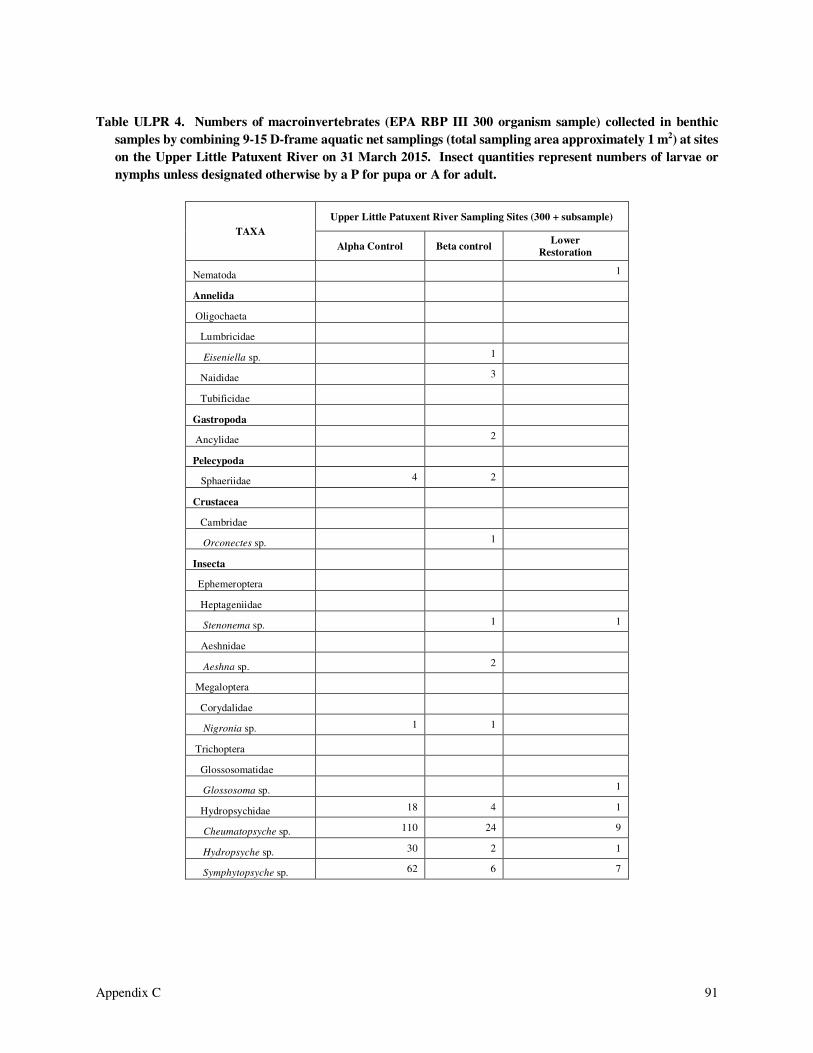
Appendix C
91
Table ULPR 4. Numbers of macroinvertebrates (EPA RBP III 300 organism sample) collected in benthic
samples by combining 9-15 D-frame aquatic net samplings (total sampling area approximately 1 m2) at sites
on the Upper Little Patuxent River on 31 March 2015. Insect quantities represent numbers of larvae or
nymphs unless designated otherwise by a P for pupa or A for adult.
TAXA
Upper Little Patuxent River Sampling Sites (300 + subsample)
Alpha Control Beta control Lower
Restoration
Nematoda 1
Annelida
Oligochaeta
Lumbricidae
Eiseniella sp. 1
Naididae 3
Tubificidae
Gastropoda
Ancylidae 2
Pelecypoda
Sphaeriidae 4 2
Crustacea
Cambridae
Orconectes sp. 1
Insecta
Ephemeroptera
Heptageniidae
Stenonema sp. 1 1
Aeshnidae
Aeshna sp. 2
Megaloptera
Corydalidae
Nigronia sp. 1 1
Trichoptera
Glossosomatidae
Glossosoma sp. 1
Hydropsychidae 18 4 1
Cheumatopsyche sp. 110 24 9
Hydropsyche sp. 30 2 1
Symphytopsyche sp. 62 6 7

Appendix C
92
ULPR 4 (continued).
TAXA
Upper Little Patuxent River Sampling Sites (300 + subsample)
Alpha Control Beta control Lower
Restoration
Philopotomatidae
Chimarra sp. 61 12 6
Polycentropidae
Polycentropus sp. 1
Coleoptera
Elmidae
Promoresia sp. 1
Stenelmis sp. 1 2 4
Diptera
Ceratopogonidae
Culicoides sp. 1
Chironomidae 7 13 17
Diamesinae
Diamesa sp. 4 3 12
Tanypodinae 1 1
Potthastia sp. 1
Thienemannimyia grp. 1 1 1
Orthocladinae 2 3 2
Brillia sp. 5
Corynoneura sp. 1
Eukiefferiella sp. 1 6
Orthocladius sp. 57 232 213
Parametriocnemus sp.
Psectrocladius sp. 4
Thienemanniella sp. 1 14
Chironomini 1 1 6
Apedilum sp. 1 2 4
Crypytochironomus sp. 1
Polypedilum sp. 6 2 13
Pseudochironomus sp. 1 4 7
Tanytarsini 2 2 5
Dicrotendipes sp. 2 4
Micropsectra sp. 1
Rheotanytarsus sp. 1

Appendix C
93
ULPR 4 (continued).
TAXA
Upper Little Patuxent River Sampling Sites (300 + subsample)
Alpha Control Beta control Lower
Restoration
Empididae
Chelifera sp. 2 3 7
Clinocera sp. 4 8
Hemerodromia sp. 2 1 3
Simuliidae
Prosimulium sp. 1
Tipulidae
Antocha sp. 17 6
Dicranota sp. 1
Tipula sp. 2

Appendix C
94
Table UTSC 1. Numbers of macroinvertebrates (MBSS 100 organism sample) collected in benthic samples by
combining 9-15 D-frame aquatic net samplings (total sampling area approximately 1 m2) at sites on an
unnamed tributary to Seneca Creek (Watkins Mill Road) on 22 September 2014. Insect quantities represent
numbers of larvae or nymphs unless designated otherwise by a P for pupa or A for adult.
TAXA
UTSC Sites (MBSS 100 + subsample)
Alpha
Control
Beta
Control
Lower
Restoration
Middle
Restoration
Turbellaria
Cura sp. 1 1
Nemertea 2
Annelida
Oligochaeta
Lumbriculidae 28 10 7 16
Entrachidae 3
Hirudinae
Glossiphoniidae 1
Gastropoda
Physidae 3
Insecta
Ephemeroptera
Baetidae 1 6 3
Hemiptera
Mesoveliidae
Mesovelia sp. 1
Trichoptera
Hydropsychidae 7 8 4 8
Cheumatopsyche sp. 20 29 11 21
Hydropsyche sp. 4 7 2
Symphytopsyche sp. 3 1 3
Philopotomatidae 4 3 2
Chimarra sp. 3 2 50 28
Coleoptera
Elmidae
Stenelmis sp. 4
Diptera
Chironomidae 2 1 1

Appendix C
95
UTSC 1 (continued).
TAXA
UTSC Sites (MBSS 100 + subsample)
Alpha
Control
Beta
Control
Lower
Restoration
Middle
Restoration
Tanypodinae 1 6
Thienemannimyia sp. 12 9 1 3
Zavrelimyia sp. 2
Orthocladinae 1
Thienemanniella sp.
Chironomini 1
Chironomus sp. 1
Pseudochironomus sp. 1 1
Polypedilum sp. 1 5 4 3
Tanytarsini
Micropsectra sp. 1
Empididae
Hemerodromia sp. 1 5
Simuliidae 1 1
Simulium sp. 5 13 2 2
Tipulidae
Pseudolimnophila sp. 1
Tipula sp. 1 1 1

Appendix C
96
Table UTSC 2. Numbers of macroinvertebrates (RBP III 300 organism sample) collected in benthic samples
by combining 9-15 D-frame aquatic net samplings (total sampling area approximately 1 m2) at sites on an
unnamed tributary to Seneca Creek (Watkins Mill Road) on 22 September 2014. Insect quantities represent
numbers of larvae or nymphs unless designated otherwise by a P for pupa or A for adult.
TAXA
Watkins Mill Sampling Sites (300 + subsample)
Alpha
Control
Beta
Control
Lower
Restoration
Middle
Restoration
Turbellaria
Cura sp. 2 1 1
Nemertea 4 4 6
Annelida
Oligochaeta 2
Lumbriculidae 52 25 24 30
Naididae 1
Tubificidae 1 1
Entrachidae 3
Hirudinae
Glossiphoniidae 1
Gastropoda
Physidae 5 12
Planorbidae
Insecta
Ephemeroptera
Baetidae 2 28 8
Baetis sp. 1 2
Odonata
Coenagrionidae 1
Ischnura sp. 1
Hemiptera
Mesoveliidae
Mesovelia sp. 1
Trichoptera
Hydropsychidae 18 16 10 23
Cheumatopsyche sp. 61 91 25 74
Hydropsyche sp. 1 10 12 4
Symphytopsyche sp. 9 7 4 3
Hydrophilidae 2
Hydroptila sp. 1
Philopotomatidae 9 1 15 18
Chimarra sp. 8 2 123 114

Appendix C
97
UTSC 2 (continued).
TAXA
Watkins Mill Sampling Sites (300 + subsample)
Alpha
Control
Beta
Control
Lower
Restoration
Middle
Restoration
Coleoptera
Elmidae
Stenelmis sp. 9
Diptera
Ceratopogonidae
Atrichopogon sp. 1
Chironomidae 5 5 2
Tanypodinae 3 11 1 2
Thienemannimyia sp. 38 18 6 7
Zavrelimyia sp. 1
Orthocladinae 1 1 1
Corynoneura sp. 2
Eukiefferiella sp. 1 2
Orthocladius sp. 1 2
Paracladopelma sp. 1
Rheocricotopus sp. 1
Thienemanniella sp. 1 6 3
Chironomini 1
Chironomus sp. 1
Pseudochironomus sp. 3 1 5 13
Polypedilum sp. 17 11 9 11
Tanytarsini 1
Micropsectra sp. 2
Rheotanytarsus sp. 1 1
Culicidae 1
Empididae
Chelifera sp. 2 1 1
Clinocera sp. 2
Hemerodromia 3 12 4
Simuliidae 1 1 1 2
Simulium sp. 13 22 9 12
Tipulidae
Pseudolimnophila sp. 2 2
Tipula sp. 5 4 1

Appendix C
98
Table UTSC 3. Numbers of macroinvertebrates (MBSS 100 organism sample) collected in benthic samples by
combining 9-15 D-frame aquatic net samplings (total sampling area approximately 1 m2) at sites on an
unnamed tributary to Seneca Creek (Watkins Mill Road) on 30 March 2015. Insect quantities represent
numbers of larvae or nymphs unless designated otherwise by a P for pupa or A for adult.
TAXA
Watkins Mill Sampling Sites (MBSS 100 + subsample)
Alpha
Control
Beta
Control
Lower
Restoration
Middle
Restoration
Turbellaria 1
Annelida
Oligochaeta
Entrachidae 6 1
Lumbricidae
Eiseniella sp. 1
Lumbriculidae 2 2 3
Naididae 3 1
Tubificidae 1 1 1
Insecta
Trichoptera
Hydropsychidae 2 2 4
Cheumatopsyche sp. 36 26 31 24
Diplectrona sp. 1
Hydropsyche sp. 4 4 6 4
Symphytopsyche sp. 1 4 3
Philopotomatidae
Chimarra sp. 1 22 10
Diptera
Chironomidae 1 1 2 2
Tanypodinae 9 2 3
Thienemannimyia grp. 30 8 4 4
Orthocladinae 2 1
Orthocladius sp. 25 16 16 24
Eukiefferiella sp. 2 3
Parametriocnemus sp. 2
Chironomini 1
Pseudochironomus sp. 1 1 1
Polypedilum sp. 1
Tanytarsini 1
Empididae
Chelifera sp. 3 2 1 1
Hemerodromia sp. 6 1 2 7

Appendix C
99
UTSC 3 (continued).
TAXA
Watkins Mill Sampling Sites (MBSS 100 + subsample)
Alpha
Control
Beta
Control
Lower
Restoration
Middle
Restoration
Simuliidae
Simulium sp.
Tipulidae
Tipula sp. 5 2
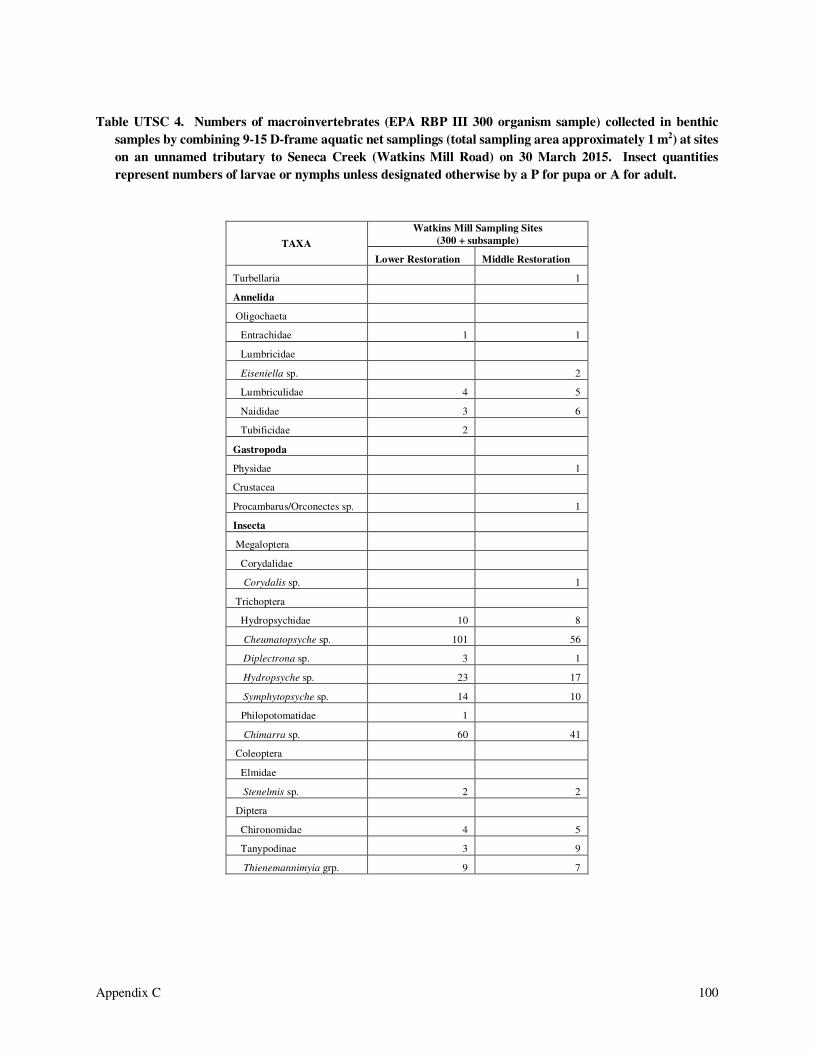
Appendix C
100
Table UTSC 4. Numbers of macroinvertebrates (EPA RBP III 300 organism sample) collected in benthic
samples by combining 9-15 D-frame aquatic net samplings (total sampling area approximately 1 m2) at sites
on an unnamed tributary to Seneca Creek (Watkins Mill Road) on 30 March 2015. Insect quantities
represent numbers of larvae or nymphs unless designated otherwise by a P for pupa or A for adult.
TAXA
Watkins Mill Sampling Sites
(300 + subsample)
Lower Restoration Middle Restoration
Turbellaria 1
Annelida
Oligochaeta
Entrachidae 1 1
Lumbricidae
Eiseniella sp. 2
Lumbriculidae 4 5
Naididae 3 6
Tubificidae 2
Gastropoda
Physidae 1
Crustacea
Procambarus/Orconectes sp. 1
Insecta
Megaloptera
Corydalidae
Corydalis sp. 1
Trichoptera
Hydropsychidae 10 8
Cheumatopsyche sp. 101 56
Diplectrona sp. 3 1
Hydropsyche sp. 23 17
Symphytopsyche sp. 14 10
Philopotomatidae 1
Chimarra sp. 60 41
Coleoptera
Elmidae
Stenelmis sp. 2 2
Diptera
Chironomidae 4 5
Tanypodinae 3 9
Thienemannimyia grp. 9 7

Appendix C
101
UTSC 4 (continued).
TAXA
Watkins Mill Sampling Sites
(300 + subsample)
Lower Restoration Middle Restoration
Orthocladinae 4
Corynoneura sp.
Eukiefferiella sp. 2 7
Orthocladius sp. 16 53
Parametriocnemus sp. 6
Chironomini 1
Pseudochironomus sp. 2 7
Polypedilum sp. 1
Tanytarsini 1
Empididae
Chelifera sp. 5 6
Hemerodromia sp. 9 13
Simuliidae
Simulium sp. 2
Tipulidae
Tipula sp. 3