
hassacc 2015
220
The 3 rd Human And Social Sciences at the Common Conference HASSACC 2015 Proceedings in Human and Social Sciences at the Common Conference Slovak Republic 5. - 9. October 2015
-
Upload
khangminh22 -
Category
Documents
-
view
1 -
download
0
Transcript of hassacc 2015

The 3rd
Human And Social Sciences at the Common Conference
HASSACC 2015
Proceedings in
Human and Social Sciences at the Common Conference
Slovak Republic
5. - 9. October 2015

Published by:
EDIS - Publishing Institution of the University of Zilina Univerzitna 1 01026 Zilina Slovak Republic
Editors: Ing. Michal Mokrys; Ing. Stefan Badura, Ph.D.
ISBN: 978-80-554-1124-8
cdISSN: 1339-522X
eISSN: 2453-6075
DOI: 10.18638/hassacc.2015.3.1
Pages: 218
Printed in: 150 copies
Publication year: 2015
All published papers undergone single blind peer review.
All published papers are in English language only. Each paper had assigned 2 reviewers and each paper went through two-tier approval process.
Papers are published as delivered by authors without content modification. All accepted papers have been formally checked by the conference Technical Committee and regularly reviewed in single blind peer reviewing process by the conference Scientific Committee (Reviewers Committee).
The publication contents are the sole responsibility of the publication author and it does not reflect the Publishing Society, Zilina, Slovakia.
Open Access Online archive is available at: http://www.hassacc.com/archive (proceedings will be available online one month after the publication release).
In case of any questions, notes or complaints, please contact us at: info(at)hassacc.com.com.
Paper Citation Example: In (Eds.) S. Brown, S. Larsen, K. Marrongelle, and M. Oehrtman, Proceedings of the 3rd International Virtual Conference in
Human And Social Sciences at the Common Conference (HASSACC-2015), Vol. 3, pg #-#. Zilina, Slovakia.
Warning
Copyright © The authors mentioned in the table of contents, Publishing Society, Zilina, Slovakia, All rights reserved.
The 3rd Human and Social Sciences at the Common ConferenceOctober, 5. - 9. 2015, www.hassacc.com
eISSN: 2453-6075, cdISSN: 1339-522X- 2 - ISBN: 978-80-554-1124-8

Section Chairman Committee
Balázs Kotosz
• About:
Balazs Kotosz is Associate Professor in Institute of Economics and Economic Development at University of Szeged
(Hungary). His research fields include macroeconomics, macroeconometrics, and regional economic modeling. He's author of
60 publications, member of 9 scientific associations, has been member of Scientific Committee of 24 conferences in 9
countries, reviewer for 11 journals, and member of the editorial board for 6 journals.
• Affiliation:
University of Szeged, Faculty of Economics, Institute of Economics and Economic Development
• Scientific specialization:
Economic theory, Econometrics
• Country:
Hungary
Noelia Malla García
• About:
Noelia Malla Garcia is a Doctorate Student at the Department of Anglo-American Literature and Cultural Studies at
Complutense University of Madrid. She graduated in English Philology in 2010 and holds an MA in Literary Studies. Her MA
dissertation dealt with the revaluation of the tragic heroic figure in Joseph Conrad's fiction focusing on Heart of Darkness and
Lord Jim as case studies.She has participated in several national and international conferences. Her fields of research include
British Romanticism (special focus on William Blake, William Wordsworth and S. T. Coleridge), British Modernism (Joseph
Conrad), and American Modernism. To complete the final stage of her PhD predoctoral research, she is carrying out a research
stay at the Joseph Conrad Research Centre of the Jagiellonian University of Krakow (Poland).
• Affiliation:
Univeristy Complutense of Madrid
• Scientific specialization:
English Linguistics, Anglo-American Literatures, Modernist Literature
• Country:
Spain
Helena Neves Almeida
• About:
Helena finished PhD in Arts (major in Social Work), Faculty of Arts - University of Fribourg (Switzerland), Dec 2000. “
Sociall Mediation”; Master of Psychology (specialization in Educational Psychology), Faculty of Psychology and Educational
Sciences - University of Coimbra February 1996.
She has 39 years of teaching experience in higher education (in private and public universities), and large experience in
management of social and community projects. Participation in Educational Institutions management, namely the Scientific
Council, Pedagogical Council, Advisory Councils and Assembly of Representatives
Actually is Professor and Researcher of the Faculty of Psychology and Educational Sciences, University of Coimbra
(FPCEUC) in Social work degrees (bachelor, master and doctorate/Phd studies); Coordinator of the Master- Degree in Social
Work, the FPCEUC; Researcher and Coordinator of the Centre for Citizenship and Social Intervention (OCIS/FPCEUC);
Member of the Faculty Assemble; External Evaluator for grants of Science and Technology Foundation (Portugal); External
Evaluator of the Agency for Assessment and Accreditation of Higher Education - A3ES; Researcher and scientific
coordination of dissertations , doctoral and post-doc studies.
The 3rd Human and Social Sciences at the Common ConferenceOctober, 5. - 9. 2015, www.hassacc.com
eISSN: 2453-6075, cdISSN: 1339-522X- 3 - ISBN: 978-80-554-1124-8
Keynote Speaker in Scientific International Meetings, European and National conferences, being invited by the promoters, or
by application and submission of proposals for peer review; Member of Direction board of 2 scientific journals; Experience as
Scientific Peer reviewer and International Evaluator of Conferences, Congress and scientific Journals.
• Affiliation:
University of Coimbra
• Scientific specialization:
Social work, Pedagogical Psychology, Social Sciences. Actual Thematic areas of current interest: Alternative Dispute
Resolution; Social, Community and School Mediation; Social impacts of public policies, Support the promotion of
employment, Social Intervention in critical contexts; Planning and Project Social Management; Socio-therapy; Art, Creativity
and Social Intervention: Participatory Methodologies in Social Intervention and Research
• Country:
Portugal
Ioan-Gheorghe Rotaru
• About:
Dr. Ioan-Gheorghe Rotaru is Associate Professor (in Romanian the title is: Conf.univ.dr.dr.) of „Timotheus‟ Brethren
Theological Institute of Bucharest, Romania and President of Education Society for Romanian People, Bucharest, Romania. He
is Licentiate in theology (B.Th.-1997), at the Faculty of Reformed Theology at the “Babes-Bolyai” University, Cluj-Napoca,
Romania; Graduated from the Faculty of Law, Ecological University of Bucharest, Romania; Master of Art in Theology
(M.Th.-2003), at “Babes-Bolyai” University Cluj-Napoca, Romania; Doctor of Philosophy (Ph.D.-2002) at the Institute of
Philosophy and Psychology “Constantin Rădulescu Motru”, Romanian Academy, Bucharest, Romania, with the thesis
Anthropological aspects in the patristic thinking; Doctor in Theology (Ph.D.-2009), with the distinction Magna cum laude, at
“Babes-Bolyai” University Cluj-Napoca, Romania, with the thesis Sabbatarians in the context of Transylvanian life (XVI-XX
centuries). He is the author of six books, of more than 200 studies and articles (over 30 articles indexed in major data base
(ISI/BDI), of 6 university courses, present with a significant number of scientific papers at national (70) and international (20)
conferences, member in various scientific organizations in the country and abroad. He serves on the boards of numerous
international conferences and journals.
• Affiliation:
„Timotheus‟ Brethren Theological Institute of Bucharest, Faculty of Pastoral Theology
• Scientific specialization:
History of philosophy and religion
History of philosophy
Theology
Church law
Religious education
• Country:
Romania
The 3rd Human and Social Sciences at the Common ConferenceOctober, 5. - 9. 2015, www.hassacc.com
eISSN: 2453-6075, cdISSN: 1339-522X- 4 - ISBN: 978-80-554-1124-8

Marco Sorrentino
• About:
Marco Sorrentino is an Assistant Professor of Business Administration at the Department of Law and Economic Sciences at
Pegaso Telematic University, Naples, Italy (since 2011). Prior to joining the Pegaso Telematic University he was a research
fellow at the Second University of Naples, where he holds a Ph.D. in Accounting (in 2006). In 2005 he spent six months as
visiting research fellow at School of Business (Accounting Department) of the Faculty of Economics and Business of the
University of Sydney (Supervisor: Prof. G.W. Dean). He has published several chapters in edited books and articles in referred
journals. He has many conference presentations. His core research interests and experiences include financial reporting, with
particular reference to international accounting standards, both in private (IAS/IFRS) and in public sector (IPSAS), firm
valuation and management of Small and Medium Enterprises.
He is Chief Editor of Advances in Research (Section: Economic Sciences) and member of the Open Journal of Accounting and
of the Journal of Modern Accounting and Auditing Editorial Boards. He also serves as reviewer for the Journal of China-USA
Business Review, Chinese Business Review, Universal Journal of Accounting and Finance, Asian Journal of Finance and
Accounting and has been member of the Scientific Committee of different international conferences (SCIECONF 2014 and
2015; EIIC 2014; HASSACC 2014).
He is member of European Accounting Association (EAA) and of Italian Academy of Economia Aziendale Giovani (AIDEA-
Youth).
In 2007, he got his qualifications as Italian Certified Public Accountant and Legal Auditor.
• Affiliation:
Pegaso Telematic University
• Scientific specialization:
ACCOUNTING; BUSINESS ADMINISTRATION
• Country:
Italy
The 3rd Human and Social Sciences at the Common ConferenceOctober, 5. - 9. 2015, www.hassacc.com
eISSN: 2453-6075, cdISSN: 1339-522X- 5 - ISBN: 978-80-554-1124-8
International Scientific Committee and Reviewers Committee
Antoaneta Alipieva Konstantin Preslavsky University of Shumen, Bulgaria
Mário André Assis Ventura University of Porto, Portugal
Laura Arosio University of Milano Bicocca, Italy
Stefan Badura Publishing Society, Slovakia
Snejana Bacheva University of National and World Economy, Bulgaria
Margarita Vives Barceló University of Balearic Islands, Spain
Maria del Carmen Bellido Márquez University of Granada, Spain
Ana-Maria Bercu UNIVERSITY OF IASI, Romania
Ovidiana Bulumac Romanian Academy /versus/ University of Bucharest, Romania
Luiza Caraivan "Dimitrie Cantemir" Christian University, Romania
Ubaldo Comite University “Giustino Fortunato”, Italy
Carla Sofia Costa Freire Polytechnic of Leiria, Portugal
Sónia de Carvalho Universidade Portucalense Infante D. Henrique, Portugal
Maria DOLORES SANCHEZ-FERNANDEZ UNIVERSITY OF A CORUÑA, Spain
Tímea Drinóczi University of Pécs, Hungary
Izabela Emerling University of Economics in Katowice, Poland
Francisco Javier Blanco Encomienda University of Granada, Spain
Gabriela Fotache George Bacovia University of Bacau, Romania
Jacek Gad University of Lodz, Poland
Esther Luna González University of Barcelona, Spain
Giuseppe Granata University of Cassino and Southern Lazio, Italy
Hemant Chimanlal Parikh Govt Medical College, India
Manuela Ingaldi Czestochowa University of Technology, Poland
Martina Jakábová Institute of Industrial Engineering, Management and Quality,
Slovak Republic
George Katsadoros University of the Aegean, Greece
Morteza Khazaei Pool, Iran
Amir Ahmed Khuhro Shah Abdul Latif University, Pakistan
Balázs Kotosz University of Szeged, Hungary
Nikolaos Koutras Macquarie Law School, Greece
Maciej Laskowski Lublin University of Technology, POLAND
Anna Liduma Riga Teacher Training and Educational Management Academy,
Latvia
Jolanta Maj Opole University of Technology, Poland
Noelia Malla García Univeristy Complutense of Madrid, Spain
Catarina Mangas Polytechnic Institute of Leiria, Portugal
Eliana Mariela Werbin National University of Cordoba, Argentina
Daniel Markovič Catholic University in Ruzomberok, Slovakia
Anssi Mattila Laurea University of Applied Sciences, Finnland
Elisabete Mendes Duarte Polytechnic Institute of Leiria, Portugal
Martha Méndez ISPA-University Institute, Colombia
Isabel Mª Martín Monzón Universidad de Sevilla, Spain
Sónia Morgado Instituto Superior de Ciências Policiais e Segurança Interna,
Portugal
Eduard V. Musafirov Yanka Kupala State University of Grodno, Belarus
Dorothy Nduku Hodson Marketing Strategy Services, Kenya
Janusz Nesterak Cracow University of Economics, Poland
Helena Neves Almeida University of Coimbra, Portugal
Florian Nuta Danubius University from Galati
Alina Nuta Danubius University from Galati
Artur Gomes Oliveira Sergipe Federal Institute of Education Science and technology,
Brazil
Rafal Parvi Opole School of Banking, Poland
Krzysztof Piasecki Poznań University of Economics, Poland
Rumiana Pojarevska Savova University of National and World Economy, Bulgaria
Amir Khazaei Pool Islamic Azad University, Iran
Andrius Puksas Mykolas Romeris University, Lithuania
The 3rd Human and Social Sciences at the Common ConferenceOctober, 5. - 9. 2015, www.hassacc.com
eISSN: 2453-6075, cdISSN: 1339-522X- 6 - ISBN: 978-80-554-1124-8

Marcin Relich University of Zielona Gora, Poland
Donna L. Roberts Embry-Riddle Aeronautical University
Angela Roman UNIVERSITY OF IASI, Romania
Ioan-Gheorghe Rotaru „Timotheus‟ Brethren Theological Institute of Bucharest,
Romania
Hynek Roubik Czech University of Life Sciences, Czech Republic
Oana Rusu Alexandru Ioan Cuza University of Iasi, Romania
Agnieszka Rzepka Lublin University of Technology, Poland
Fernando José Sadio Ramos Polytechnic of Coimbra
Sandro Serpa Universidade dos Açores, Portugal
Elsida Sinaj European University of Tirana, Albania
Michał SOLIWODA Institute of Agricultural and Food Economics - National
Research, Poland
MARCO SORRENTINO Pegaso Telematic University, Italy
Rute Sousa Matos University of Evora, Portugal
Radu D. Stanciu University Politehnica of Bucharest, Romania
Renata Stasiak-Betlejewska Czestochowa University of Technology, Poland
Andrea Székely University of Szeged, Hungary
Jacek Szmalec Maria Curie-Skłodowka University in Lublin, Poland
Agnieszka Tłuczak Opole University, Poland
Dominika Topa-Bryniarska University of Silesia, Poland
Victorița Trif University of Bucharest, Romania
Zahir Uddin Arif Jagannath University, Bangladesh
Violeta Urban George Bacovia University in Bacau, Romania
Maria Vlachadi University of Crete
Ewa Wanda Maruszewska University of Economics in Katowice, Poland
Irina Z. Yarygina Financial University under the Government of the Russian
Federation, Russia
The 3rd Human and Social Sciences at the Common ConferenceOctober, 5. - 9. 2015, www.hassacc.com
eISSN: 2453-6075, cdISSN: 1339-522X- 7 - ISBN: 978-80-554-1124-8

Sections discussed at the Conference
Family and divorce
Psychology
Economics, Business and Financing
Management and Marketing
Educational sciences
Social Science
Law
Political science
Other social sciences
History and Archaeology
Philosophy, Ethics and Religion
Other humanities
The 3rd Human and Social Sciences at the Common ConferenceOctober, 5. - 9. 2015, www.hassacc.com
eISSN: 2453-6075, cdISSN: 1339-522X- 8 - ISBN: 978-80-554-1124-8

Conference Sponsors and Partners
Publishing Society
Slovak Republic
www.The-Science.com
Science & Technology Park Zilina
Slovak Republic
European Center for Ethnic Studies
University 'Giustino Fortunato'
European Center of New Technologies
and Financial Innovations
The School of Banking and
Management in Cracow
Published by
EDIS
Publishing Institution of the University of Zilina
Univerzitna 1
01026 Zilina
Slovak Republic
The 3rd Human and Social Sciences at the Common ConferenceOctober, 5. - 9. 2015, www.hassacc.com
eISSN: 2453-6075, cdISSN: 1339-522X- 9 - ISBN: 978-80-554-1124-8

Summary
Dear Reader,
it is our pleasure to introduce you this proceedings. This book contains all accepted papers from
conference, which is described below in more details. We hope published papers contribute to the
academic society and provide interesting information for researchers world wide.
Conference details:
Conference full name: Human And Social Sciences at the Common Conference
Conference short name: HASSACC
Conference edition: 3rd
Conference dates: October 5 - 9, 2015
Conference web page: www.hassacc.com
Conference online archive: www.hassacc.com/archive
Conference paper approval process:
Each registered paper was evaluated in double tier approval process.
1. Scientific Committee evaluation (in average 2 reviews were prepared per paper).
2. Conference Editorial Board.
Only papers recommended by these committees were accepted for online presentation at the
conference and for publication in this conference book.
Conference presentation:
All accepted papers were presented at the conference during conference dates. Asynchronous online
chat was prepared for each paper, where all conference members could freely discuss the topic. During
the conference, the Section Chairmen Committee steered the conference discussion. Short presentation
were proposed for effective conference discussion.
Conference post processing:
Each published paper is available in CDRom and online proceedings (online archive).
All papers in online archive are available for downloading for potential readers (open access policy).
For effective linking and citation each paper is provided with DOI, we recommend to use DOI for
referencing.
The online archive may be possibly evaluated by several Abstracting and Indexing services in future.
Authors of around 20% of top rated papers were recommended for preparing extended version into
academic journals.
Sincere thanks for:
Scientific Committee and Section Chairmen Committee for their volunteer work during reviewing.
Conference partners for promotional work and their contribution.
Editorial Board for enormous workload and patience.
Michal Mokrys
Conference Organizing Committee The-Science.com community Publishing Society
October, 2015
The 3rd Human and Social Sciences at the Common ConferenceOctober, 5. - 9. 2015, www.hassacc.com
eISSN: 2453-6075, cdISSN: 1339-522X- 10 - ISBN: 978-80-554-1124-8

Table of Contents
Family and divorce
A comparison between marriage and cohabitation in Italy (Gender differences in the allocation of the domestic labor) ............ 14
Laura Arosio
Psychology
Understanding the emotional reactions of women after voluntary abortion .................................................................................. 17
Adelina Kakija
The karate culture as the regulator of interdependence between permitted level of violence in different kumite systems and
personality of contestants .............................................................................................................................................................. 23
Paweł Piepiora, Zbigniew Piepiora
THE ROLE OF COUNSELLING IN MEDICAL SETTINGS ..................................................................................................... 28
Dukata Radoja
Romantic Red Effect in the Attractiveness Perception.................................................................................................................. 31
Tatjana Seibt
Health-related locus of control and health behaviour among adults in Albania ............................................................................ 35
Elsida Sinaj
Economics, Business and Financing
Non-financial Reporting in Bulgaria – Status and Challenges ...................................................................................................... 40
A. Filipova-Slancheva
The Use of Economic Modeling for Interprovincial Comparisons of House Prices (A Comparison Between Gauteng, Western
Cape And South Africa) ................................................................................................................................................................ 44
B.J. Liebenberg, J. Erasmus, E. Erasmus, Douw Boshoff
The Conditions of Appropriate Measurement of the Cost of Capital ............................................................................................ 61
Aneta Michalak
The 2008 Economic Recession (Impact on the Residential Real Estate Market) .......................................................................... 65
Elizabeth Musvoto, Douw G. B. Boshoff
Forecasting correctness of incurring credit with the aid of E.I. Altman‟s, J. Gajdka‟s and D. Stos‟s discriminant analysis models
on the example of 200 studied companies from Opole and Pomorskie provinces ........................................................................ 79
Rafał Parvi
Management and Marketing
Human resource marketing approach and its possible deduction from the generic sales marketing concept ............................... 86
Susanna Minder
The local disaster management system: the crisis cluster in the face of natural disasters ............................................................. 90
Zbigniew Piepiora, Oliver Belarga
Educational sciences
Ideal of cognition in Dao philosophy and education ..................................................................................................................... 94
Maria Butucea
Methodological innovation for learning mediation ....................................................................................................................... 98
Esther Luna González
The intercultural curriculum: an educational need ...................................................................................................................... 103
Olga Gonzàlez Mediel, Esther Luna González
Crash course for new online faculty orientation .......................................................................................................................... 107
Anssi Mattila
Relationship between enrolment criteria and first-year students‟ study-success ......................................................................... 111
Dušan Munđar, Damira Keček, Darko Matotek
The 3rd Human and Social Sciences at the Common ConferenceOctober, 5. - 9. 2015, www.hassacc.com
eISSN: 2453-6075, cdISSN: 1339-522X- 11 - ISBN: 978-80-554-1124-8

Social Science
Fuel Poverty Challenges in Serbia: Evidence from the Suburban Settlement of Kaluđerica ...................................................... 116
Tanja Bajić, Jasna Petrić
EDUCATION AND PHRASEOLOGY ...................................................................................................................................... 122
Margarita Dedej
Care drain strategies in transnational families ............................................................................................................................. 127
Maria Petronela Munteanu
MEDIATION FOR WHAT? (REFLECTIONS ON EDUCATIONAL FIELD) ........................................................................ 131
Helena Neves Almeida
Variability of Suburban Preference in a Post-socialist Belgrade ................................................................................................. 134
Jasna Petrić, Tanja Bajić
Analyses of Labor Market Development in Bulgaria (Role of active policies for social and economic development) .............. 140
Venelin Terziev, Ekaterina Arabska
Opportunities of Quality and Efficiency Improvement in Public Employment Services (Application of a new process model in
Bulgarian labour offices) ............................................................................................................................................................. 146
Venelin Terziev, Ekaterina Arabska
Legislative background and civil activities of NGOs in different countries (Based on materials of sociological research on the
Internet) ....................................................................................................................................................................................... 152
Aleksander Voronov, Edita Albova, Natalia Zhukova, Elena Kapustina, Elena Voronova
Law
IMPACT OF FOREIGN INVESTMENT IN THE REHABILITATION OF THE COUNTYR ECONOMY, THE CASE OF
KOSOVO .................................................................................................................................................................................... 158
Salihu Vjollca
Political science
Strategy Development in Latvian Trade Unions: Leaders‟ Assessment ..................................................................................... 162
Antra Line
Exploring the political economics of microfinance (A case study of Uganda (East-Africa), 2000-2005) .................................. 166
Oliver Schmidt
Other social sciences
The simulation of the bottom-up/top-down dialectics (Through the use of descriptive tools and models) ................................. 175
Lorenzo Cioni
History and Archaeology
Pottery finds from survey of Apice territory: first results ........................................................................................................... 181
Assunta Campi
Philosophy, Ethics and Religion
Biblical-historical aspects about the Decree of the Persian king Cyrus, for the reconstruction of the Temple in Jerusalem and its
consequences (537BC) ................................................................................................................................................................ 188
Ioan-Gheorghe Rotaru
Historical-biblical aspects about the development and completion of the reconstruction works of the Temple in Jerusalem,
following the Decrees given by the emperors Cyrus (538/537BC) and Darius (520/519BC) ..................................................... 194
Ioan-Gheorghe Rotaru
Evolution of life, death, rebirth: the theory of Absolutivity ........................................................................................................ 200
Mahesh Man Shrestha
Business Ethics and Social Media (Framing Moral Cosmopolitanism in Facebook‟s Statement of Rights
and Responsibilities) ................................................................................................................................................................... 209
Spyridon Stelios
The 3rd Human and Social Sciences at the Common ConferenceOctober, 5. - 9. 2015, www.hassacc.com
eISSN: 2453-6075, cdISSN: 1339-522X- 12 - ISBN: 978-80-554-1124-8

Other humanities
Greenways – an alternative mobility structure and an urban development strategy ................................................................... 213
Rute Sousa Matos, Rita Calhau, Alexandre Lisboa
The 3rd Human and Social Sciences at the Common ConferenceOctober, 5. - 9. 2015, www.hassacc.com
eISSN: 2453-6075, cdISSN: 1339-522X- 13 - ISBN: 978-80-554-1124-8
A comparison between marriage and cohabitation
in Italy Gender differences in the allocation of the domestic labor
Laura Arosio
Dept. Sociology and Social Research
University of Milano Bicocca
Milano, Italy
Abstract—This article examines whether the couple arrangement
in which partners live in may affect individual levels of
participation in domestic work. Our hypothesis is that married
and cohabiting individuals show a different pattern of
involvement into domestic labour. In particular, we investigate if
cohabiting partners present a less traditional framework as
opposed to those in marriage. We also hypothesize that this may
be worth differently for men and for women. The data used in
the analyses come from the national representative survey
―Multi-Purpose Family Survey – Aspects of Daily Life‖, carried
out in 2012 by the Italian National Institute of Statistics (ISTAT).
The results suggest that all other conditions considered in the
model being equal, women who cohabit spend less time on
housework than married women do, whereas cohabiting men do
not appear to be more willing to take on a larger amount of
domestic labor.
Keywords- cohabitation, marriage, gender differences, domestic
labor, Italy
I. COHABITATION AND MARRIAGE: TWO DIFFERENT
REALITIES?
In this paper we consider differences in marriage and cohabitation. There are various aspects of the marriage or cohabitation relationship which could be compared. Amongst the principal aspects are: the type of relationship the partners have, the expectations of each partner (what they expect from each other and what they expect from the relationship), the roles that each partner assumes within the couple and in the social environment, the level of commitment to the relationship, the level of satisfaction, the risk of instability, fertility rates, the degree to which finances are shared and the division of chores and work both inside and outside the domestic sphere (amongst others, see [1] for a summary).
The differences between cohabitation and marriage may be more or less accentuated depending on geographical or temporal context. Much depends on the status of cohabitation in the country: for example, in Scandinavia, where cohabitation is virtually indistinguishable from marriage, the two types of union are more similar than in southern Europe where cohabitation is less frequent and the differences are more accentuated [2].
One area of comparison between cohabitation and marriage is the type of relationship which the partners have. The fact that
the relationship between cohabiting partners is poorly institutionally recognised suggests that there is a greater degree of freedom but there is also a degree of ambiguity: it could be unclear what the partners expect from each other or what their respective roles are [3]. Moreover, some research reveals that in comparison with married couples, the partners in cohabiting couples tend to show lower levels of commitment to the relationship, be less satisfied and have a less profound relationship with the family of the other partner [3].
Another question is that of the stability and durability of the relationship: some studies suggest that cohabiting couples are more likely to divorce [4, 5, 6]. Fertility rates may differ: cohabiting couples are more likely to remain childless or tend in any case to have fewer children [7, 8].
The degree to which a couple share their income and expenditure is also to be considered. Some research shows that cohabiting couples are less likely to share finances, it being less probable that they would, for example, have a shared bank account or have property in both names [7, 9, 10]. A lower degree of financial commitment between cohabiting partners could be due to the fact that investment is considered too risky in a relationship which is not institutionally recognised [11].
Important differences can be identified in the division of domestic labor between partners [11, 12; in Italy 13, 14]. This is a critical area of comparison as it ties in with important sociological issues such as cultural and social norms, gender roles, relationships within the family. In particular, it is commonly assumed that there is a greater degree of role equality between partners in cohabiting couples. As far as work outside the domestic sphere is concerned, it would appear that women who cohabit are in fact more likely to be in paid employment than married women are. In this respect the cohabiting couple would present a less traditional model than that based on marriage. Following this, it seems that partners who cohabit are less likely to accept the gender roles which are established in the traditional family [see eg. 7, 12]. Some studies suggest that cohabiting couples divide domestic chores more equally than married couples do [12, 15, 16]. It is not clear however what happens as far as gender division of domestic labor is concerned and whether or not the cohabiting couple follow the traditional pattern or adopt different arrangements.
The 3rd Human and Social Sciences at the Common ConferenceOctober, 5. - 9. 2015, www.hassacc.com
Family and divorce eISSN: 2453-6075, cdISSN: 1339-522X10.18638/hassacc.2015.3.1.150 - 14 - ISBN: 978-80-554-1124-8

II. MARRIAGE, COHABITATION AND THE PARTICIPATION IN
DOMESTIC LABOR: OUR HYPOTHESIS
Our hypothesis is that married and cohabiting individuals show a different pattern of involvement into domestic labor. In particular, we want to test if cohabiting partners present a less traditional framework as opposed to those in marriage. We also hypothesize that this may be worth differently for men and for women.
The analysis was carried out on contemporary Italian society because it offers several interesting characteristics for the study of the differences between marriage and cohabitation. It has already been shown (paragraph 1) how the differences between marriage and cohabitation are more or less accentuated in different geographical locations or in different periods. In particular, the two types of union are more similar in countries where cohabitation is common practice, whereas the differences are more marked in countries where cohabitation is a marginal practice [2]. Italy is a country which, despite showing considerable change in certain aspects, maintains a traditional family structure. In comparison with other European countries, cohabitation in Italy is still a limited phenomenon and without legal recognition [17]. In addition, comparative studies show that Italian women spend more time on average doing domestic work than other European women, whereas Italian men spend less time doing that than their counterparts in other European countries [18]. It would therefore be expected that the differences between marriage and cohabitation will be even more clearly observed.
Data used for the analyses come from the national representative survey “Multi-Purpose Family Survey – Aspects of Daily Life”, carried out in 2012 by the Italian National Institute of Statistics (ISTAT). This survey covers various aspects of daily life and social behavior: family, living conditions, schooling, work, free time, health conditions, social services and crime rates. It contains detailed information on the weekly amount of average time dedicated to work in the house and outside by the members of the households (a sample of around 20,000 households involving around 50,000 people)1.
These data have the advantage of being very recent. In addition
the use of this dataset allows a form of methodological
triangulation with other recent studies on contemporary Italy
using other sources from official statistics [e.g. 13, 14]. The
data were made available by ADPSS Sociodata (Data Archive
for Social Sciences, Department of Sociology and Social
Research, University of Milano Bicocca).
III. THE ANALYTICAL MODEL
The model developed here involves estimating parameters of a linear regression which can be used to evaluate how personal and family factors affect the amount of domestic labor carried out by women and men in different family arrangements. The aim is to evaluate the effect that the type of relationship (marriage or cohabitation) has on this, after taking into account other factors which can influence the propensity to enter into cohabitation and the amount of time which is spent on unpaid work.
1 For details see http://www.istat.it/it/archivio/96427
The dependent variable of the model is the average time spent each week on domestic labor (expressed in hours). This variable includes housework, shopping and caring for family members. The variable provides an aggregate information about different types of household tasks. This may be seen as a limit, also because we know that men and women tend to share domestic work differently (for example, men are more likely to perform expressive tasks such as caring for children, while women specialize in other tasks such as housework [19]. Nevertheless, the aggregate data is very useful for our purposes because it provides an overall assessment of the domestic workload of men and women.
The regression model was calculated separately for women (N=3809) and for men (N=2937) in the sample who at the time of the interview were either married or cohabiting in a nucleus without outsiders and were aged between 18 and 45. The decision to focus on a restricted age group is based on the need to analyse what is usually the first period of a couple’s life together and in particular to exclude cohabitation following an earlier marriage. The factors that can push individuals toward cohabitation without marriage and to have a less traditional distribution of domestic work have been controlled for. Taking the type of family arrangement as independent variable, the differences can be seen between individuals who are married and those who cohabit.
IV. RESULTS
The results of the regression models offer interesting insights on cohabitation and marriage and suggest a comparison between women and men (tab. 1 and 2).
TABLE I. LINEAR REGRESSION MODEL OF PARTICIPATION IN DOMESTIC
LABOR ON SELECTED INDEPENDENT VARIABLES. ESTIMATED PARAMETERS. WOMEN, ITALY 2012 (N=3809)
Non standardized co-
efficients
B
Std.
Error t Sig.
Constant 32.829 2.567 12.789 .000
Cohabiting -2.219 .897 -2.474 .013
Age (in years) .173 .060 2.864 .004
Education (in years) -.458 .074 -6.163 .000
Hours of paid
employment per
week
-.396 .017 -23.321 .000
Northern and
central Italy
-3.027 .623 -4.856 .000
Town population over 10000/ city
suburb
-1.614 .582 -2.774 .006
Partner empoyed in the LM
1.827 0.890 2.053 .040
At least 1 child 0-5 11.778 .823 14.317 .000
1 or more children over 5
6.930 .916 7.562 .000
The 3rd Human and Social Sciences at the Common ConferenceOctober, 5. - 9. 2015, www.hassacc.com
Family and divorce eISSN: 2453-6075, cdISSN: 1339-522X10.18638/hassacc.2015.3.1.150 - 15 - ISBN: 978-80-554-1124-8

TABLE II. LINEAR REGRESSION MODEL OF PARTICIPATION IN DOMESTIC
LABOR ON SELECTED INDEPENDENT VARIABLES. ESTIMATED PARAMETERS. MEN, ITALY 2012 (N=2937)
Non standardized co-
efficients
B
Std.
Error t Sig.
Constant 3.436 1.718 2.000 .046
Cohabiting .633 .519 1.220 .223
Age (in years) .021 .039 .534 .593
Education (in years) .107 .047 2.280 .023
Hours of paid
employment per
week
-.084 .012 -7.237 .000
Northern and
central Italy
0.872 .383 2.274 .023
Town population
over 10000/ city suburb
.446 .354 1.261 .207
Partner empoyed in
the LM
2.340 .377 6.212 .000
At least 1 child 0-5 3.325 .472 7.039 .000
1 or more children over 5
.626 .544 1.150 .250
As far as women are concerned (tab. 1), cohabitation appears to have a statistically significant negative effect compared to marriage with respect to the amount of hours spent on domestic labor. Cohabiting interviewees declared an average of two hours per week fewer dedicated to housework than married interviewees, net to other factors included in the model.
As far as men are concerned (tab. 2), cohabitation as opposed to marriage has a not statistically significant effect on the amount of involvement in domestic labor. This is a main point in our analyses. Table 1 and 2 suggest that the cohabitation may constitute a different pattern compared to marriage as regards women. As for the men living together and marriage are not different, at least as regards participation in the domestic work.
V. CONCLUSIONS
From the analyses carried out in this paper, it appears that cohabiting tend to offer a different model of organization with respect to marriage as far as women experience is concerned. All other conditions considered in the model being equal, women who cohabit spend less time on housework than married women do, whereas cohabiting men do not appear to be more willing to take on a larger amount of domestic labor.
This result suggests that the dynamics of transformation taking place in family life are deeply intertwined with persistent gender differences. Marriage and cohabitation may be different arrangements, but differences are mediated by gender. Future research - which will be carried out on the dynamics of change involving families and different areas of experience - will be called to persist in taking account of gender differences. This is because social change appear to
involve in a different way the lives of men and women in contemporary societies.
Since this work has studied the domestic labor in aggregate form, it would be very important to continue the analytical study of specific activities (child care, household chores...). Comparative studies would be very important, taking into account the spread of cohabitation and the gender models in different countries. Finally, it would be very useful to have longitudinal data to study changes over time and to better understand the interplay that ties the events in the different fields of experience of the individual life course.
REFERENCES
[1] D. Hamplová, “Marriage and Cohabitation: Qualitative Differences in Partnership Arrangements”, Czech Sociological Review, 38, No. 6, pp. 771–788, 2002.
[2] M. Domínguez Folgueras, “Is cohabitation more egalitarian? The Division of Household Labor in Five European Countries”, Journal of Family Issues, 16, 2012
[3] S. L. Nock, “A Comparison of Marriages and Cohabiting Relationships”, Journal of Family Issues, 16 no. 1, pp. 53-76, 1995.
[4] W. Axinn, and A.Thornton, “The Relationship Between Cohabitation and Divorce: Selectivity or Casual Influence?”, Demography, 29, pp. 357–374, 1992.
[5] A. DeMaris, and W. MacDonald, “Premarital Cohabitation and Marital Instability : A Test of the Unconventionality Hypothesis”, Journal of Marriage and the Family, 55, 2, pp. 399–408, 1993.
[6] E. Thomson, and U. Collela, “Cohabitation and Marital Stability: Quality or Commitment?” , Journal of Marriage and the Family, 54, 2, pp. 259–268, 1992.
[7] R. R. Rindfuss, and A.VandenHeuvel, “Cohabitation: Precursor to Marriage or an Alternative to Being Single?”, Population and Development Review, 16, pp. 703–726, 1990.
[8] J. Zhang and X. Song, “Fertility Differences between Married and Cohabiting Couples: A Switching Regression Analysis”, IZA Discussion Paper No. 3245, 2007.
[9] K. Heimdal, and S.Houseknecht, “Cohabiting and Married Couples’ Income Organization Approaches in Sweden and the United States”, Journal of Marriage and Family, 65, pp. 539-549, 2003.
[10] A. E. Winkler, “Economic Decision-Making by Cohabitors: Findings Regarding Income Pooling”, Applied Economics, 29, pp. 1079-1090, 1997.
[11] J. Brines, and K. Joyner, “The Ties That Bind: Principles of Cohesion in Cohabitation and Marriage”, American Sociological Review, 64, pp. 333–355, 1999.
[12] S.J. South, and G. Spitze, “Housework in Marital and Nonmarital Households”, American Sociological Review, 59, pp. 327–347, 1994.
[13] A. Menniti, and P. Demurtas, “Disuguaglianze di genere e attività domestiche”, IRPPS Working Papers, Italia, 2012, http://www.irpps.cnr.it/e-pub/ojs/index.php/wp/article/view/47/99.
[14] S. Meggiolaro, “Household Labor Allocation Among Married and Cohabiting Couples in Italy”, Journal of Family Issues, 35, pp.851-876, 2014.
[15] J. A. Batalova, and P. N. Cohen, “Premarital Cohabitation and Housework: Couples in Cross-National Perspective”, Journal of Marriage and Family, 64(3), pp. 743-755, 2002.
[16] J. Baxter, “To Marry or Not to Marry: Marital Status and the Household Division of Labor”, Journal of Family Issues, 26(3), pp. 300-321, 2005.
[17] L. Arosio, Sociologia del matrimonio, Roma, Carocci, 2004.
[18] Eurostat (2006), “How women and men spend their time. Results from 13 European countries”, Statistics in focus
[19] L. Todesco, Quello che gli uomini non fanno, il lavoro familiare nelle società contemporanee, Carocci, Roma, 2014.
The 3rd Human and Social Sciences at the Common ConferenceOctober, 5. - 9. 2015, www.hassacc.com
Family and divorce eISSN: 2453-6075, cdISSN: 1339-522X10.18638/hassacc.2015.3.1.150 - 16 - ISBN: 978-80-554-1124-8

Understanding the emotional reactions of women
after voluntary abortion
Adelina Kakija (Bylyku)
Counseling psychologist
Lecturer at University "Wisdom University”, Department of Educational Sciences
Tirana, Albania
Abstract – Voluntary abortion is an uncharted topic in Albanian
studies. Previous studies of foreign literature have argued that
one of the women responds to this phenomenon is similar to grief,
which can lead to destruction, due to the memories of the event
and that the child did not come to life. It happens that for other
women, voluntary abortion offers a pragmatic solution, "Pro
choice" and comes with relief. The aim of the study is: exploring
the phenomenon in Albania over the last years. The emotional
reactions after voluntary abortion reported by women themselves
even in the subsequent years. Method: 10 interviews were
conducted with women who had had voluntary abortions in the
first quarter of pregnancy, in the period 1 to 5 years from the
abortion. In analyzing the interviews it was used the qualitative
method and more specifically phenomenological method
(Moustakas, 1994). Results: The majority of the interviewed
women have experienced abortion as a grief, which pursues them
even in the present moment.
Keywords - voluntary abortion, grief, phenomenological
methods, and emotional reaction, guilt
I. INTRODUCTION
Voluntary abortion is an induced termination of pregnancy, usually before the fetus is developed enough to live if born, deemed necessary by the woman and conducted at her request (bpas 2010). Many researchers have addressed the emotional consequences of abortion: Coleman, Reardon, Strahan, & Cougle (2005). The consequences of abortion on an emotional point of view and the continuity of a healthy life cannot be neglected. Grief is not only experienced if the event is a phenomenon of "choice" or "accidental" (Bagarozzi 1994 Salvesen et al.1997). It is attempted to think that everyone who chooses to have an abortion believes that they will not try feelings of grief and it is difficult for them to understand that this choice, although voluntary, it is thus painful and can be experienced as an "undesirable” choice (Congleton & Calhoun 1993). Women experience continual feelings of intensive guilt, which accompanies them for many years. After abortion the psyche of women is generally vulnerable to stress psycho / physical and has been described as a symptomatic pain so complicated where the typical symptoms of pain are attached to signs and pathological structured symptoms (Kersting et al., 2004, Kersting et al. 2005). Frequently possible symptoms of this syndrome are depressive aspects, typical symptoms of panic, concerns in the way of feeding or use of substances (Bradshaw & Slade 2003). Many women exhibit symptoms such as confusion typical of sadness, guilt, nervousness, vacuum and bearing a very high level of suffering (Demicheli
Bianchi et al. 2002). However in most cases this remains an unspoken pain because women do not feel worthy and free of suffering. The grief of abortion, much more than other sorrows, is experienced often in silence without asking or expecting support from outsiders: The judgment regarding to this process dictates timidity and fear. Exactly for this motive support is required, which would affect in softening or release of such feelings.
Many women isolate their grief in conscious and unconscious level in keeping distance and denying the effect of their suffering against the purpose of self-help. Studies on trauma and on loss situations claim that to pass through this event in a personal way it is needed the family support, social support, and institutional safeguards. Unfortunately, in the grief of abortion these sources are absent. Women often fail to express thoughts freely for such phenomenon and they suffer in terms of loss and sometimes when they try to explicit themselves the appropriate interlocutor is not found. What is required from women is to not think too much about the phenomenon and that other children will come in the future (it is not the end of the world). In many cases, other people fail to recognize the great pain you are experiencing in reacting in a critical way by saying: "You should have thought it before". A woman who terminates a pregnancy suffers not only for the loss of a child but also for the loss of the image for herself in the role as a mother, wife, civil etc. On the social level, family, cultural and religious issues, abortion is associated with a wide array of opinions, judgments, prejudices, and absolutisms; a decision taken in the wake of the guilt or shame and fear, deprived of necessary consciousness conditions the opportunity for a much-complicated grief.
What are the emotional responses?
Emotions are a conscious reaction, out of mind, experiencing a strong feeling about an object or event. These feelings are usually accompanied by physiological and behavioral changes in the body, also called "the connection mind - body "(Merriam- Webster, 2010). Changes in the body can be temporary or long term and may be presented as pain, nausea, diarrhea, stomach ulcers, hypertension, sexual dysfunction etc. (American Academy of Family Physicians, 2010). Ignoring negative feelings can cause adverse reactions in the body and further lead to emotional distress. Addressing the issue of emotional reactions of women after abortion can help ease the welfare of women, both physically and emotionally. Below we will stop at one of the most common
The 3rd Human and Social Sciences at the Common ConferenceOctober, 5. - 9. 2015, www.hassacc.com
Psychology eISSN: 2453-6075, cdISSN: 1339-522X10.18638/hassacc.2015.3.1.170 - 17 - ISBN: 978-80-554-1124-8
emotional responses, which are a sense of sadness, a feeling that was identified in the current study.
Figure 1. emotional responses, Source: LifeSiteNews.com
What happens during the tribulation?
Grief is the space of time following the event; in which people experience the thoughts and emotions characterized by confusion, pain, guilt, nervousness, and irritability. In the case of abortion difficult periods are those most significant dates, diagnosis or time of ultrasound pregnancy, birth date, etc. Unfortunately today's society tends to trivialize any form of grief in trying to carry the loss and suffering. There is always the risk to remain jailed in the past and leaving the present. During this period in which we can learn to accept the reality of losing it is developed a new relation with the lost child. The pain of loss continues to accompany the woman, but while this loss ratio changes, increasing awareness and ability to cope with the experience of suffering. Grief is a dynamic process, the suffering fades little by little and life convalescents by recovering.
The burden of guilt
Subsequent emotional reaction to loss is the central aspect of the process of grief (Bowlby, 1983). Grief is a set of thoughts, moods and experiences that we go through when we feel that we have lost a part of ourselves together with the person who is gone from our lives. The loss of a child, even if desired by the women themselves, it can dictate the loneliness and pain, bankruptcy as woman or mother and being guilty in the face of the lost, present or future child. Some of these thoughts and emotions are deep part of the process of pain. To elaborate the pain is essential to accept the experiences of life, to accept the suffering that will follow and gain the respect of the rights of themselves. This is not to rationalize the event but to be with the mental pain, her experience and keeping close and not let it to dominate you. Eliminating all the pain looking to not prove the negative emotions, which contribute in complicating the grief.
Later feelings
Pity, irritation, blame, complaint, loss of interest to the surrounding reality and situation of abandonment are among
the most common emotions and destabilizing. Feelings of grief can have physical effects as well as muscular tension or chest pain, profound fatigue, anxiety, loss of appetite or increased drastically. It may awaken the loss of the earlier experiences. Humor will be volatile. With time agonizing emotions and thoughts may arise, but each time more ease and with a shorter duration.
Figure 2. Later feelings, Source: WordPress.com
The meaning that the interviewed women give to their experience of voluntary abortion.
Feelings of sadness appear in various ways for many women. Methodology: The study used a qualitative methodology of phenomenological tradition, to explore the experiences of women after voluntary termination of pregnancy. Participants who have met the following criteria were included in the study: a) are female, b) have at least a voluntary interruption of pregnancy for one to five years ago, and c) occurred abortion during the first trimester of pregnancy. Participants were different with respect to race, religion, socioeconomic status, age, marital status, and number of children. The names of the participants used this study are not the real ones (matter of privacy).
Participants were interviewed until they reached saturation. Creswell, (2009) saturation is reached when additional data do not provide any further insight. Creswell, (2009) recommends the inclusion of up to ten interviews, while others suggest up to the time of filling (Searight and Yung, 1994). Saturation was reached in the current study, after interviewing ten participants.
Figure 3. Source: imgarcade.com
The 3rd Human and Social Sciences at the Common ConferenceOctober, 5. - 9. 2015, www.hassacc.com
Psychology eISSN: 2453-6075, cdISSN: 1339-522X10.18638/hassacc.2015.3.1.170 - 18 - ISBN: 978-80-554-1124-8

The meaning of voluntary abortion for each woman is examined, where participants shared the emotional aspects of their decisions. The current study focused not only in theory but also in gaining an understanding of how each woman perceives her mental health in relation to its voluntary abortion. Emotional reactions are likely to be varied and fluid for women experiencing miscarriage and can be intense at some point and more submission at other times. Participants showed a wide range of emotional reactions when talking about their abortions and their mental well being in the coming years.
Participants reported a range of emotions that are possible and normal in the years following the voluntary termination of pregnancy. Three women in the present study expressed the prevailing feeling of relief when thinking about their abortion, five others expressed feelings of regret, harrowing after the procedure.
For some women, like Shpresa and Luci, life events changed how they saw their abortion, displaying different emotions at different points of time.
At one end of the spectrum were women like Anna and Viola, which said that abortion had a positive impact on welfare.
Mira says: "I experience a mixed emotional experience " - saying it was largely eased for the moment, but that time was experiencing deep feelings of grief and guilt. "What had made me sad, what made me sorrowful was thinking that he was a human, a lost potential ".
Four participants said they were sad in one way or another after voluntary abortion process. For Monda, grief was somewhat short, but an important aspect of the experience, it allowed her to be herself. She said, "When the first time I faced with abortion I felt sorrowful too. I remember that I used to light candles and pray which now is turned into habit."
For Moza, Marta and Meri their pain has been constant, they stated, - "I will always feel bad, when I think about it. I grieve not for myself, but for my child. I did not give my child even a chance. This is what mostly makes me suffer.
"I continue to wonder if everything will be restored. I have confidence in my ability but I think it is necessary to seek help ".
"Eli reported that she felt some feelings of sorrow, and says:" I now grieve not because of the loss, but because of what I need to feel forgiven "I happened to have an abortion three years ago. The pain that underwent is constant, especially for the fact that you know that you are alone."
TABLE I. PARTICIPANTS
Experience Description
Looking back with
gratification
Participants:
This narrative is about
women who never felt or experienced upset or negative feelings associated to the voluntary abortion because it
Ana
Viola
was right at that moment
Slight effort with the loss over
time
Participants:
Shpresa
Luci
These women had a
slightly negative response to the voluntary abortion at first but they were able to move forward. Sometimes these feelings reappeared with precise signs such as a marriage, a friend’s birth or when they go to church. These women try to find ways to deal with these emotions at the moment they performed the ritual.
Looking back with complexity,
heaviness and grief
Participants:
Mira
Moza
Eli
Marta
Meri
These women often felt
grief, which was followed after the voluntary abortion and currently keep on holding those same emotions. Theses particular women watched their pregnancy as a real life but did not have the conditions to sustenance and support another additional life. They embrace the life from their pregnancy on their conscience. The feelings of guilt for ending it are tremendous.
Searching for a safe place
where they might explore
buried emotions
Participants:
Monda
Moza
Eli
Marta
Meri
These women initially
didn’t have any response to the abortion because they state that they suppressed their feelings at that moment to deal with some other situations. One to five years after elective abortion, women have shown a negative response about abortion and they have been very difficult to deal with their feelings.
II. DISCUSSION
The study examined that the feelings experienced by women related to abortion were mainly "grief". My current research goal is to overcome the gap that exists in the literature, and to provide support to issues that are important to women who have terminated a pregnancy. In addition, I hope the information will be useful for therapists who inevitably will encounter this issue during the course of their clinical work. This study showed the experiences of women who undergo abortion are unique and different. Women in the current study reported a series of reactions and experiences related to their
The 3rd Human and Social Sciences at the Common ConferenceOctober, 5. - 9. 2015, www.hassacc.com
Psychology eISSN: 2453-6075, cdISSN: 1339-522X10.18638/hassacc.2015.3.1.170 - 19 - ISBN: 978-80-554-1124-8

voluntary abortions, ranging from full release of long-term emotional pain.
Abortion in Albania
Under the legislation in force in our country abortions are performed only in hospitals within the criteria and rules defined by the law on termination of pregnancy. Which means that it cannot be performed in non-private clinics, which are not licensed by the Ministry of Health. But there is a significant number of non-private clinics that operate in the capital (and other cities of Albania), generally positioned in the entrances of palaces, unfortunately, abortions are carried out freely.
In our country, the number of abortions carried out is about 9 times higher than the average of EU countries. If Albania recorded 230 abortions per 1 thousand live births, the EU average is only 28 abortions per one thousand live births. And among dozens of reasons, the newly married couples are frequent cases where the desire for a boy becomes a reason for the decision of removal of a child conceived with the opposite sex. Health authorities recognize that this practice is pretty widespread.
The table below, taken from INSTAT, Albanian Civil Office, Institute of Public health, shows: live births, abortions, abortion rate and births per one abortion from 2004 until 2013. As we can see, the number of abortions during 2013 is much lower in comparison with the years before it.
At the second table, taken from INSTAT, the abortion rate and births per one abortion from 2004 until 2013 are described in graphs.
As mentioned above, the statistics about voluntary abortion are not accurate. Reason, in this data are not included statistics on the number of abortions carried out in private clinics.
Figure 4. live births, abortions, abortion rate and births per one abortion
from 2004 until 2013
III. CONCLUSIONS AND RECOMMENDATIONS
With an emotionally charged topic there is rarely an agreement; however researchers agree that most women have an emotional response following an abortion.
Ignoring negative feelings can cause negative responses in the body and further lead to emotional distress. Of these women who had an abortion, not all experienced the same
The 3rd Human and Social Sciences at the Common ConferenceOctober, 5. - 9. 2015, www.hassacc.com
Psychology eISSN: 2453-6075, cdISSN: 1339-522X10.18638/hassacc.2015.3.1.170 - 20 - ISBN: 978-80-554-1124-8

emotional response or the same severity. As seen in this study, 2 participants looked back with gratification, 2 participants felt slight effort with the loss over time, 5 out of 10 looked back with complexity, depth and grief and 5 out of 10 searched for a safe place where they might explore buried emotions.
The emotional effect of grief diminishes significantly if a woman fail to live in continuity avoiding loneliness, what they do is "close their mind and soul". Actively seeking support and sharing in respect of freedom of choice and her dignity is mostly what often happens. It is possible to design entity of guilt and responsibility, softening impact of shame and social support through a greater acceptance of their decisions and timing of recoveries. The possibility of expressing suffering to reliable persons who do not tend to formulate judgments or criticism, having care of physical health, living in the present time seeking support and no insulation helps in understanding the emotions of harrowing. These will help you to live constructively suffering in respect of yourself of on life. Healthcare providers need to be aware of the range of responses that women may encounter at a later time in their lives. They should educate women about a subject that affects more than one third of them and it can improve the care that is delivered. By identifying the risk factors of negative reactions, healthcare workers are provided an opportunity to effectively counsel women involved.
REFERENCES
[1] Ainsworth, M. D. ( 1962). 'The effects of maternal deprivation: a review of findings and controversy in the context of research strategy.' In Deprivation of Maternal Care: A Reassessment of its Effects. Public Health Papers No. 14. Geneva: WHO.
[2] Brockington, I. F. (2000 January). Post-abortion mania. The British Journal of Psychiatry, 176, 92.
[3] Bowlby J (1980). Loss: Sadness & Depression. Attachment and Loss (vol. 3); (International psycho-analytical library no.109). London: Hogarth Press. ISBN 0-465-04238-4. OCLC 59246032
[4] Bowby J (1973). Separation: Anxiety & Anger. Attachment and Loss (vol. 2); (International psycho-analytical library no.95). London: Hogarth Press. ISBN 0-7126-6621-4.O CLC 8353942.
[5] Bradshaw &Slade( 2003); Brockington (2000). The effects of induced abortion on emotional experiences & relationships
[6] Bianchi -Demicheli ,F;et al.( 2002)Termination of pregnancy and women’s sexuality (48-53)
[7] Coleman, P. K., Coyle, C. T., & Rue, V.M. (2010). Late-Term Elective Abortion and Susceptibility to Posttraumatic Stress Symptoms, Journal of Pregnancy, vol. 2010, Article ID 130519
[8] Coleman, P. K., Coyle, C. T., & Rue, V.M. (2010). Late-Term Elective Abortion and Susceptibility to Posttraumatic Stress Symptoms, Journal of Pregnancy, vol. 2010, Article ID 130519
[9] Creswell, J. W. (1998). Qualitative inquiry and research design: Choosing among five traditions. Thousand Oaks, CA: SAGE.
[10] Creswell, J. W. (2009). Research Design: Qualitative, Quantitative, and Mixed Methods Approaches (3rd edition). Thousand Oaks, CA: Sage
[11] Congleton, G. K. & Calhoun, L. G. (1993). Post-abortion perceptions: a comparison of self-identified distressed and non-distressed populations. International Journal of Social Psychiatry, 39(4), 255-265.
[12] Cozzarelli, C. (1993 December). Personality and self-efficacy as predictors of coping ëith abortion. Journal of Personality & Social Psychology, 65(6), 1224-1236.
[13] Goodwin, P, & Ogden, J. (2007). Women's reflections upon their past abortions: an exploration of how and why emotional reactions change over time.
[14] Handy, J. A. (1982).Psychological and social aspects of induced abortion. British Journal of Clinical Psychology, 21, 29-41.
[15] Moustakas, C. (1994). Phenomenological Research Methods. Thousand Oaks, CA: Sage
[16] Reardon, D.C., Ph.D. (1999). Exposing deceptive abortion practices a neë collaborative pro-life project. The Post-Abortion Revieë, 7(3).
[17] Speckhard, A., Ph.D. & Rue, V., Ph.D. (1993). Complicated mourning: dynamics of impacted post abortion grief. Pre- and Perinatal Psychology Journal, 8(1), 5-32
[18] Women and Men in Albania, 2015”, Author: INSTAT, ISBN: 978-9928-188-27-4
The 3rd Human and Social Sciences at the Common ConferenceOctober, 5. - 9. 2015, www.hassacc.com
Psychology eISSN: 2453-6075, cdISSN: 1339-522X10.18638/hassacc.2015.3.1.170 - 21 - ISBN: 978-80-554-1124-8

APPENDIX:
Questions during the interview:
The main question: What has been your experience of abortion?
What were the circumstances that accompanied the concept?
What were the circumstances that led to the interruption of pregnancy?
If you have to experience again, you will receive the same decision or will you do something different?
Was there a moment, by the time you have aborted where you have had difficulty with the choice you made or the consequences of that decision?
Was there a moment when you've been very pleased with the decision you have taken to terminate the pregnancy?
Have there been actual moments that abortion has affected your life?
How have you experienced the feeling of the abortion scene, in the years that followed?
What kind of difficulties you experienced?
Did those experiences occur before abortion?
Do you believe that your emotional status is in any way related to abortion?
How important people of your life have effected in your adapting after the abortion?
If you have wanted to keep it as a "secret”, did you keep it?
At the time of termination of pregnancy, what kind of social support did you have?
Did your friends and family supported your decision?
Was there any aspect of your life that did not support your decision (school, friends, etc.)?
Does your abortion affected in any of your relationships in a positive or negative way? At any point of time, have you experienced abortion as a "loss"?
Were you ever upset of having an abortion?
Did you feel okay initially but then regret your decision or felt sad after the abortion?
Did you initially felt sad and regret but after that you feel healed?
Do you felt sad and regret since the beginning of abortion until now?
Check what did you feel after abortion Nothing ____ Satisfied ____ Relief ____ Joy/Happiness ____ Upset ____ Depressed ____ Regret ____ Anxious ____
The 3rd Human and Social Sciences at the Common ConferenceOctober, 5. - 9. 2015, www.hassacc.com
Psychology eISSN: 2453-6075, cdISSN: 1339-522X10.18638/hassacc.2015.3.1.170 - 22 - ISBN: 978-80-554-1124-8

The karate culture as the regulator of interdependence
between permitted level of violence in different
kumite systems and personality of contestants
Paweł Piepiora
University School of Physical Education in Wrocław
Wrocław, Poland
Zbigniew Piepiora
Wrocław University of Environmental and Life Sciences
Wrocław, Poland
Abstract—The aim of the research is to determine whether the
karate culture is an regulator of relationship between an
acceptable level of violence in different kumite systems and
contestants (competitors) personality traits. To conduct the
research five samples were taken. To each sample were chosen
deliberately thirty seniors – men (male) aged from 18 to 39 years;
of four systems of kumite sportsmanship – Shotokan, kyokushin,
Oyama, Shidokan; and orienteering runners. To conduct the
research the NEO-FFI Personality Inventory was used. The
Social Approval (KAS) was used in order to verify the reliability
of questionnaire respondents. The test analysis was performed
using Statistica 10’s statistical methods. The results of the
research indicates that karatekas of different systems of kumite
with different levels of violence do not stand out with superlative
personality traits comparing with non-contact sports athletes and
non-training male population. The karatekas are characterized
by the indicators similar to the orienteering runners.
Keywords- karate culture, violence, personality, contestant,
competitor, kumite system
I. INTRODUCTION
The karate is now one of the most popular martial arts in the world. The Karate-jutsu, Okinawan martial art has evolved into the karate-do – the martial art where the physical and spiritual aspect merged into one. The karate-do is consequently the effect of including karate-jutsu among the Japanese Budo martial arts. The Far Eastern martial arts’ fashion fulfilled the rest. The karate-do, under the merciless’ requirement for the survival of art through sport has evolved into the karate. The boundaries between the karate-jutsu, the karate-do and the karate have been blurred. Regardless of training goals, all aspects merged into one – karate. The reason for this is the fact that karate can be trained by everyone, regardless of age, sex, somatic building, mental and motor development. The karate appeals to everyone. Everyone can find here something interesting: an effective self-defense, sport competition, as well as a form of recreation, and rehabilitation. Then, there are the moral values stemming from the philosophy of karate. All these aspects cause that the students of karate (karatekas) can be described as people of the karate culture.
The karate culture has a positive effect on the physical and mental sphere of people. For its special features stand out the specific psychosocial climate – a system of hierarchy degrees kyu and dan, emotional approach to training, discipline, respect
for authority and traditional values, codes of ethics, terminology, philosophy, indications hygiene, meditation exercises and high physical fitness of exercisers.
People from the area of the karate culture practice the karate as a method of self-realization. Their overall objective is to develop and improve their lives by continuous ‘spiritual’- and physical-improvement. They are characterized by their industriousness, perseverance and consistency in the pursuit of success, respect for moral norms, self-control and mental strength.
II. PERSONALITY IN SPORTS
The personality psychology seeks to grasp what makes that various processes, arrangements and mental functions create a specific whole in man form, and their activity is a coherent and integrated nature. It is therefore a knowledge of what is specifically human, and also general – it concerns a man or groups of people – and it is also the knowledge what is individual – it refers to ‘John’ or ‘Mary’ and describes the individuality and uniqueness of each person (Oles, Drat-Ruszczak 2010, p. 652).
In the field of physical culture – generally speaking – the personality issues are raised during describing and explaining inter-individual variety of psychophysical and behavioral characteristics of training people or people that are pursuing the aims of physical culture, in the position of the organizing personnel, teachers and educators (Gracz, Sankowski 2007, p. 245). Ultimately, the aim of personality theory is to organize and explain ways of thinking, feeling, and behavior.
The theoretical background of the research of personality in sport were often the trait theories, called also the dispositional theories. According to M. Jarvis (2003) the trait theory may be very useful in diagnosing the psychological image of individual athletes. Thereby, the sport psychologist can recognize the difficulties with which a person have to deal. Diagnosing the personality involves performing a series of personality tests and creating an image both the weak and strong sides of contestant (competitor). One can, for example, say that only weakness of a promising athlete is the low motivation for achievements or the anxiety associated with competition. Such information can be particularly valuable for the trainer who will lead such a contestant in an appropriate manner.
The 3rd Human and Social Sciences at the Common ConferenceOctober, 5. - 9. 2015, www.hassacc.com
Psychology eISSN: 2453-6075, cdISSN: 1339-522X10.18638/hassacc.2015.3.1.174 - 23 - ISBN: 978-80-554-1124-8

Schurr et al (1977) searched for relationships between the involvement in sport, the choice of sport discipline and the level of sport achievements and the measurable personality traits. Effects proved that there are differences between athletes and non-athletes. Athletes were more independent and disinterested. It was also proved that athletes are marked by the lower level of anxiety than non-athletes. This study revealed relatively little differences between athletes and non-athletes, and helped to discover the wide disparity between the contestants who practice individual and team sports. The team sports contestants were characterized by the higher level of anxiety and extroversion than the individual sports athletes.
Clingman and Hiliard (1987) found that the particular endurance athletes – distinguished by the great effects in sport such as triathlon – were marked by an usually high level of motivation, autonomy, domination over others and ease of avoiding harm. McGill et al (1986) observed people that trained climbing. These authors have discovered that climbers were a particular opened to experience and a low level of anxiety.
The intentional dominance proved to be particularly effective in distinguishing athletes in various disciplines. Chirivella and Martinez (1994) compared the tennis contestants (low risk), karatekas (medium risk) and sailors (high risk). There were significant differences in the scale of avoiding anxiety. The sailors gathered fewer scores than the representatives of other disciplines.
Garland and Barry (1990) conducted a study and they have searched for differences between succeed-relating athletes and non-succeed-relating athletes. Garland and Barry proved that the extraversion, dependence on the group and emotional stability are responsible for the differences in the physical fitness in 29 %. It indicates that the personality can be an important determinant of success in the sport.
Rychta (1998) described the personality profiles of athletes of various disciplines with different levels of sport. He also revealed the differences in personality between non-training sport individuals. The Athletes compared with the non-training sport individuals are more extroverted and emotionally balanced – they are marked by the slow neuroticism.
Krawczyński (2004) examined the footballers from first and second league by the NEO-FFI’s test and he did not find the differences in personality profiles of contestants. Namely, the contestants were low neurotic, average opened to experience and conciliatory, highly extroverted and agreeable. Similar results in the NEO-FFI’s scales of personality were obtained by Pawlak-Kubasek and Szmajke (2008) in exploration of the Olympic team rowers. In addition, the authors extracted two subgroups of rowers: the medalists of Olympic Games and the rest of staff. The test’s results were compared with the average results of male population (20-29 years) and the rowing amateurs. It has been shown that the rowing athletes are differed from the average population and the amateurs by the low neuroticism, high extraversion and conscientiousness. The rowing medalists are highlighted from the rest by the extremely low neuroticism.
The results of examination indicate the possibility of existing differences in personality traits depending on the sport discipline. According to Botwiny (2004), the persons training combat sports are characterized by the higher activity, extraversion and neuroticism than the team sport contestants. Mroczkowska and Kownacka (2004) found that female athletes in combat sports are more active and lively than their counterparts practicing other sports.
Bernatek et al (2006) compared the differences in personality traits among athletes practicing martial arts and athletes practicing the team sport games. The results shoved a moderate dependence of selected personality dimensions of sport. Significant differences were observed only in the scales of extraversion and neuroticism. Practicing martial arts athletes are characterized by the better endurance, liveliness, activity and extraversion than the team sport contestants. However, the first examined group is less emotionally reactive and neurotic than the second group.
The competition in martial arts is marked by the individual nature. There is a direct, physical contact with an opponent. There is a substantial risk of trauma and injuries. All this things increase the stimulative value of the examined activity. Also, the direct contact with a rival rarely takes place in team sport games. The responsibility lies with the whole team. The more volatile nature and intensity of effort takes place during the training and competition. This form of activity is less stimulating than the previously described. The sexual dimorphism in the terms of personality traits is much smaller among those athletes. Women revealing stronger demand for stimulation than average women in the general population are involved in the sport activity. It is especially true in the martial arts. Women practicing mentioned sports do not differ significantly in the terms of emotional reactivity than men, despite the clear differentiation according to the sex in the case of the general population. The fact that the personality traits are more diversified by the practiced sport discipline than the sex further supports this assumption.
III. THE PURPOSE OF RESEARCH, THE HYPOTHESIS AND THE
RESEARCH QUESTIONS
The aim of the research is to determine whether the karate culture is an regulator of relationship between an acceptable level of violence in different kumite systems and contestants personality traits.
Reflections on the karate culture provide an opportunity to present the psychological profile of people practicing karate. The values and ideals of karate culture should shape the psyche of people practicing karate regardless of the training goals – the self-improvement, sport competition, self-defense or recreation. Namely, karate-athletes (kumite contestants) and the other students of the ‘empty hands’ art as the people of karate culture should stand out with the superlative indicators of personality in relation to other athletes and the population.
If we assume that the cultural values of karate are the regulator of interdependence between the acceptable levels of violence in different kumite systems, the karateka should be characterized by above average, ‘ideal’ or ‘model’ in the light of social norms and values, personality (described and
The 3rd Human and Social Sciences at the Common ConferenceOctober, 5. - 9. 2015, www.hassacc.com
Psychology eISSN: 2453-6075, cdISSN: 1339-522X10.18638/hassacc.2015.3.1.174 - 24 - ISBN: 978-80-554-1124-8

measured in terms of NEO-FFI): the low neuroticism and high extraversion, openness to experience, agreeableness, conscientiousness (see the figure I).
Modern karatekas are primarily active athletes. It cannot be ruled that their psyche and behavior are more strongly determined by the requirements and specific values of sportsmanship than the 'pure' cultural ideals of karate.
Figure 1. The personality of karate athletes in the relation to the population –
option 1. Source: Own study.
If the sport is a regulator of interdependence between the kumite systems and its ethical, aesthetic, social, political and anthropological values, the karatekas should have been characterized by a personality (see the figure II), similar to athletes in other disciplines (less ‘excellent’ than it would appear of the postulated values of karate culture).
Figure 2. The personality of karate athletes in the relation to the population –
option 2. Source: own study.
Regarding the aim of the research, the following hypotheses were accepted to verify:
1. the practice of different karate styles that are characterized by the different kumite rules, differentiates athletes competing in them regarding personality traits,
2. the karate culture or the sport competition in kumite has an effect on karatekas’ personality. Does the karate culture or do the sportsmanship principles of various kumite systems shape the contestants’ personality? The hypothesis verifies the following options:
• The contestants of different karate styles have different personality traits;
a) Do, depending on the kumite’s competition system, the personality traits of karate athletes are formed in the different way?
• The contestants of different karate styles have a similar personality;
b) Are, regardless of the kumite’s competition system, the personality traits of athletes on the same level?
c) Are karatekas marked by a different personality in the relation to the representatives of other sport discipline and population?
The hypothesis assumes that the karatekas shaped their personality under the influence of sporty lifestyle or the karate culture. The hypothesis does not verify whether the persons training karate chose a specific style of karate to suit their personality traits.
In general: the purpose of the conducted research was to try to verify the competing predictions derived from two opposing general hypotheses. The first one assumes that the psyche and behavior of modern karate are strictly subordinated to and in accordance with the traditional system of ideals and values of the karate culture; the second – the psyche and behavior of modern karate are more strongly associated with the specifics of the standards and requirements set by the necessity of making competitive sports (not the karate culture). At the purely empirical level, the goal of the study was to answer the question whether the personality profiles of modern karate turn out to be more similar to the hypothetical profiles derived from the hypothesis of subordination of the karate culture’s values or the profiles derived from the hypothesis of subordination to the requirements of competitive sports.
IV. THE RESEARCH METHODS, THE STUDY GROUPS AND THE
RESEARCH PROCEDURE
To conduct the research the NEO Personality Inventory-FFI was used. The Social Approval (KAS) was used in order to verify the reliability of questionnaire respondents. The test analysis was performed using Statistica 10’s statistical methods (using the analysis of variance as the primary method). The one-group T-student test and post-hoc tests were also used to compare the personality traits of respondents in the data samples with average figures of the population.
Among the many styles of karate practiced in Poland, the four most developed and well-known styles of karate in the country was chosen deliberately to the research. They represent different systems of kumite sportsmanship: from the strongest limited contact’s style – Shotokan (semi-contact), through the contact systems – kyokushin (knockdown), Oyama (full contact), to the system with minimal reduction of combat rules – Shidokan (mix fighting). The contestants of the mentioned styles, as opposed to other styles practiced in Poland, have achieved significant results at national and international events such as the European and World Championships.
To each sample were chosen deliberately thirty seniors – men (male) aged from 18 to 39 years (mean age of the respondents – 27.7). Most of the contestants is at the level of a master, ie. they have black belts and a significant competes
The 3rd Human and Social Sciences at the Common ConferenceOctober, 5. - 9. 2015, www.hassacc.com
Psychology eISSN: 2453-6075, cdISSN: 1339-522X10.18638/hassacc.2015.3.1.174 - 25 - ISBN: 978-80-554-1124-8

internship. Among them, they are the current or former members of the national senior team of each style. In addition, the obtained results were compared with the results of orienteering competitors (30 orienteering runners – men (male) aged 18-39 years, contestants with significant sporting achievements), as the representatives of some other sport (the non-contact sport); and compared with the average scores of men – non-training population derived from the research conducted by the NEO-FFI’s authors.
V. REMARKS
Correlations of the results in the test NEO-FFI terms of KAS are not significant. Data are not dependent on KAS-in. They are not exposed to public approval.
A. Neuroticism
There were not significant differences in the level of neuroticism among athletes who practice different styles of karate (see the figure III). The level of karatekas’ neuroticism was (in absolute terms) lower than the level of neuroticism of orienteering runners; significantly lower in the case of representatives of karate shotokan (p < 0.021), kyokushin (p < 0.026) and karate shidokan (p < 0.008). Contestants of Oyama karate were only marked by a trend (p > 0.059) for such a difference. It has been also found that all karatekas were significantly less neurotic (shotokan p < 0.000002, kyokushin p < 0.00005, Oyama p < 0.0003, Shidokan p < 0.0001) than the average non-training male population. There have not been such trends between the orienteering runners and the population.
Figure 3. The summary analysis of the results of all samples in the scales of
personality NEO-FFI. Source: own study.
B. Extroversion
Only the kyokushin’s karatekas were significantly more extroverted (p < 0.025) to the competitors of Oyama Karate. Moreover, the athletes of shotokan (p < 0.0002), kyokushin (p < 0.000005) shidokan (p < 0.00004) and orienteering (p < 0.044) demonstrated a significantly higher extroversion than the average extroversion of the non-training male population. This statistically significant difference was not showed by the contestants of Oyama karate.
C. Openness to experience
The karatekas and orienteering runners did not significantly differ from each other. In addition, only athletes of kyokushin karate (p < 0.007) and orienteering (p < 0.0004) were characterized by the significantly lower score than the average level of openness to experience of the non-training male population.
D. Agreeableness
Contestants of karate shidokan were markedly more agreeable than the orienteering runners (p < 0.032) and the average non-training male population (p < 0.001). Other statistically significant difference was not found.
E. Conscientiousness
The karatekas of different styles and the orienteering runners did not differ significantly from each other on a scale conscientiousness. On the other hand, each group of athletes differed significantly (the greater conscientiousness) from the average level of conscientiousness in the non-training male population (shotokan p < 0.00003, kyokushin p < 0.00006, Oyama p < 0.00006, shidokan p < 0.000003, orienteering runners p < 0.00003).
F. The next step in the procedure
The next step in the procedure was to compare the results of all karate style (shotokan, kyokushin, Oyama, shidokan as one sample) with the orienteering runners and with the average results of the non-training male population. The analysis (see the figure IV) resulted that the karatekas were significantly less neurotic than the orienteering runners (p < 0.0000001). The average non-training male population (p < 0.00000001) was revelantly more extroverted (p < 0.0000001) than the average non-training male population, significantly more opened to experience than runners orientation (p < 0.0004). Less than the average non-training male population (p < 0.002) was relevantly more agreeable than the orienteering runners (p < 0.001) and the average non-training men population (p < 0.0004), significantly more conscientious (p < 0.00000001) than the average non-training male population.
Figure 4. The summary analysis of the results of all karatekas, the
orienteering runners and the non-training population in the scales of the NEO-
FFI personality. Source: own study.
The personality analysis in the form of sten scores resulted that karatekas were average neurotic (4 stens), highly extroverted (7 stens), average opened to experience (5 stens), average
The 3rd Human and Social Sciences at the Common ConferenceOctober, 5. - 9. 2015, www.hassacc.com
Psychology eISSN: 2453-6075, cdISSN: 1339-522X10.18638/hassacc.2015.3.1.174 - 26 - ISBN: 978-80-554-1124-8

agreeable (6 stens), highly conscientious (7 stens). The orienteering runners have shown only the conscientiousness (7 stens) at the high level (the other scales with the average result). The average indicators of the non-training male population of any sport are within the average range at all scales (5.5 stens).
In addition, the data of the athletes (the karatekas and the orienteering runners as one sample) were compared with the ratios of the average non-training male population (see the figure V). The athletes were significantly less neurotic (p <0.0000002), more extroverted (p <0.0000003), less opened to experience (p <0.00002), more agreeable (p <0.001) and more conscientious (p <0, 00000001) than the average non-training male population.
Figure 5. The statement of analyzed results of all the athletes with the non-training population in the scales of personality NEO-FFI. Source: own study.
VI. CONCLUSION
The karatekas of different systems of kumite with different levels of violence do not stand out with superlative personality traits, comparing with non-contact sports athletes and non-training male population. The karatekas are characterized by indicators similar to the orienteering runners. For existing results of research of personality in sport, the results of the conducted research confirm the possibility of the existence of differences between athletes and the non-training population in a low level of neuroticism and a high level of extraversion and conscientiousness. Other personality traits and temperament are dependent on the sport discipline.
Therefore, it can be assumed that the sporting activity is a regulator of the interdependence between an acceptable levels of violence in different kumite systems. The impact of culture on people training karate did not have reference to the karate-athletes, kumite-athletes. The study rather confirms the supposition that the psychological profile of students of karate-do is different than the profile of karate-athletes. The results obtained in this study suggest quite clearly that the psychological characteristics of outstanding Polish karatekas fighting in different kumite systems are actually very similar to the psychological characteristics of contestants practicing different sports (eg. orienteering, football, rowing). At the same time they are not the same as the characteristics of the ‘statistical non-training young man’ (the population). The karatekas, in the same way as other athletes, compared with a ‘statistical non-training young man’, are less neurotic, more extroverted and more conscientious. Generalizing: the results
of research suggest rather the thesis that psychological profile of karateka, regardless of practiced kumite system, is the typical profile for an athlete – the contestant, and it is not the one what would be expected at the assumption in their entirety foundation for a fully successful impact of the value system of the karate culture.
REFERENCES
[1] Bernatek P., Cwyl S., Dudziak D., Szastarek I., Guszkowska M. (2006). Cechy temperamentu i osobowość zawodników sportów walki i zespołowych gier sportowych [in:] D. Parzelski (ed.) Psychologia w sporcie. Wydawnictwo Uniwersytetu Warszawskiego, Warszawa, p. 50-57.
[2] Botwina R. (2004). Osobowościowo-temperamentalne uwarunkowania sukcesu w zapasach juniorów i seniorów, [in:] M. Mikołajczyk (ed.) Korelaty psychologiczne aktywności ruchowej i sukcesów w sporcie. Z badań nad osobowością sportowców i studentów uczelni wychowania fizycznego, PTNKF, Warszawa, p. 41-47.
[3] Chirivella E. C., Martinez L. M. (1994). The sensation of risk and motivational tendencies in sports: an empirical study. Personality and Individual Differences No. 16, p. 777-786.
[4] Clingman J. M., Hiliard D. V. (1987). Some personality characteristic of super-adherer: following those who go beyond fitness. Journal of Sport Behaviour No. 10, p. 123-136.
[5] Costa Jr P., McCrae R. (2007). Inwentarz Osobowości NEO-FFI. Adaptacja polska: B. Zawadzki, J. Strelau, P. Szczepaniak, M. Śliwińska, Pracownia Testów Psychologicznych, Warszawa.
[6] Drwal R. Ł., Wilczyńska J. T. (1980). Kwestionariusz Aprobaty Społecznej, Ossolineum, Warszawa.
[7] Garland D. J., Barry J. R. (1990). Personality and leader behaviors in collegiate football: a multidimensional approach to performance, Journal of Research in Personality No. 24, p. 355-370.
[8] Gracz J., Sankowski T. (2007). Psychologia aktywności sportowej, Akademia Wychowania Fizycznego im. Eugeniusza Piaseckiego w Poznaniu, Seria: Podręczniki, p. 58.
[9] Jarvis M. (2003). Psychologia sportu, Gdańskie Wydawnictwo Psychologiczne, Gdańsk.
[10] Krawczyński M. (2004). Osobowość, lęk i motywacja osiągnięć u zawodników I i II ligi piłki nożnej, [in:] M. Mikołajczyk, M. Mikicin (ed.), Korelaty psychologiczne aktywności ruchowej i sukcesów w sporcie: z badań nad osobowością sportowców i studentów uczelni wychowania fizycznego, Polskie Towarzystwo Naukowe Kultury Fizycznej Sekcja Psychologii Sportu, Warszawa, p. 57-63.
[11] McGill J. C., Hall J. R., Ratliff W. R., Moss R. F. (1986). Personality characteristics of professional rodeo cowboys. Jurnal of Sport Behaviour No. 9, p. 143-151.
[12] Mroczkowska H., Kownacka I. (2004). Kulturowy wzorzec męskości a temperamentalne wskaźniki wydolności psychofizycznej w sportach walki, [in:] M. Mikołajczyk (ed.), Korelaty psychologiczne aktywności ruchowej i sukcesów w sporcie. Z badań nad osobowością sportowców i studentów uczelni wychowania fizycznego, PTNKF, Warszawa, p. 31-40.
[13] Oleś P., Drat-Ruszczak K. (2010). Osobowość [in:] J. Strelau, D. Doliński (ed.) Psychologia akademicka. Tom 1, Gdańskie Wydawnictwo Psychologiczne, Gdańsk, p. 651-764.
[14] Pawlak-Kubasek M., Szmajke A. (2008). Badanie profilu osobowości mistrzów Igrzysk Olimpijskich w wioślarstwie na tle elity, amatorów i populacji mężczyzn w wieku 20-29 lat – wyniki przedstawione przez A. Szmajke 18.01.2014 r. w Szkole Wyższej Psychologii Społecznej we Wrocławiu w wykładzie pt. ‘Czy istnieje osobowość mistrza? Osobowość i poczucie dobrostanu psychicznego polskich wioślarzy o różnym poziomie osiągnięć sportowych’.
[15] Rychta T. (1998). Osobowość a zachowanie celowe sportowców, COS, Warszawa.
[16] Schurr K. T., Ashley M. A., Joy K. L. (1977). A multivariante analysis of male athlete characterstics: sport type an success, Multivariante Experimental Clinical Research, p. 53-68.
The 3rd Human and Social Sciences at the Common ConferenceOctober, 5. - 9. 2015, www.hassacc.com
Psychology eISSN: 2453-6075, cdISSN: 1339-522X10.18638/hassacc.2015.3.1.174 - 27 - ISBN: 978-80-554-1124-8

THE ROLE OF COUNSELLING IN MEDICAL
SETTINGS
Dukata Radoja
European University of Tirana
Tirana, Albania
Abstract – The World Health Organization defines Counseling
like a well-focused process, limited in time and specific, which
uses the interaction to help people deal with their problems and
respond in a proper way to specific difficulties in order to
develop new coping strategies.
In medical settings, the process of Counseling represents a valid
intervention made of a quality interaction between the counselor
and the patient, characterized by the capacity of the counselor to
empathize with the interior world of the patient.
The main purpose of counseling is to help the patient amplify the
vision of the specific situation and discover the proper potential
in dealing with the conditions of disease, in order to promote a
better quality of life. The aim of this article is to propose a
combined intervention that includes all the actors of the medical
and social settings, in a counselor- medical staff- patient
cooperation. In this paper, the proposal is to show the importance
of a combined and co-relationship between the various
professionals bringing concrete and important advantages to all
the actors of the social system we are living. Specifically in the
world of health and medicine, this requirement it is shown quite
clearly and it seems one of the best solutions of this long struggle
in which he entered more than thirty years ago in the world of
car.
Keywords: Psychological counseling, communication, patient,
doctor, nurse, family.
I. INTRODUCTION
The role of counseling in hospitals.
The hospital in recent decades has been a growing interest towards the rehabilitation, defined as the ability of the individual to achieve a level of functioning and well-being as high as possible, despite the history and course of the disorder, using the tools of counseling. Especially in African Americans and Anglo-Saxon, counseling is used by nurses or even by professional counselors in hospitals in emergency departments (18). Recent researchs (Pavilainen, Salminen-Tuomala, Kurikka, et al. 2009), show that the counseling in the context of the emergency room, it is proposed as a useful approach to give support and information to the patient, and as a useful tool for giving social and emotional support to family members or carers of victims of accident or traumatic events, in the possibility of giving them a professional hearing according to the emotions they feel [8]. Physical pain also leads to a tense and emotional stress that can be overcome really quickly (Danon 2009). As we will see there are many areas of health / disease, played by bio-medical, psychological and social
perspective, where counseling may have a positive impact (19). This multi-sectorial application of the counselor is mainly due to its formation from many sides, first of which is communication. Counseling is a co-established process, in which "the operator is the essential tool of the interview and the outcome of the trail is the result of the dynamic specification, established between the customer and the operator [2]. The counselor assists the client in his search, without guiding it, without replacing him, without showing him ready-made solutions, using this brief intervention to make sure that the patient discovers and develops his personal techniques to cope with the problems, first of all the specific which he asked for the help of the counselor, collecting new information and broadening its hypotheses.
II. THE COMMUNICATION DIFFICULTIES OF HEALTH CARE
WORKERS AND COUNSELING
You experience every day the need for intermediate figures, bridges between different languages, nuanced roles inspired by multidisciplinary and tolerance, seeking integration. In healthcare, the need of counseling comes mainly from some communicative difficulties of healthcare professionals including[12]:
The Subjective sense of the word (the meaning of a word is in fact the result of his personal history, the culture to which it belongs, of the emotions that those terms are linked with, the language of the family or friendship and consequently health care sometimes experiences difficulty in understanding the hidden meanings in the expressions of the patient):
The use of numbers to convey information: This issue has been widely discussed, especially by the epidemiologists, who have questioned the best mode for transmitting information through a numeric comparison; thus, for example, it is better to quantify the probability (in 1 case out of 10, 100, 1000). The patient has difficulty in seeing how a number, is being more than just a part of the statistics.
The acceptance of message: It has to do with the principles of the individual, whether their religious, cultural or ethical. Often the person fully understands the meaning of the message, but can not put it into practise because they don’t accept the premise.
The coherence between the verbal and nonverbal language, between narrative and symbolic communication, modulated according to the
The 3rd Human and Social Sciences at the Common ConferenceOctober, 5. - 9. 2015, www.hassacc.com
Psychology eISSN: 2453-6075, cdISSN: 1339-522X10.18638/hassacc.2015.3.1.169 - 28 - ISBN: 978-80-554-1124-8

characteristics of the listener. Often the health professional uses the same type of message to all patients, elder to young, from heart disease to dialysate [13].
III. VARIOUS WAYS TO READ THE DISEASE
The three possible ways to interpret and read the disease, is through three different communication approaches, which are taken together to avoid the risk of losing important details and information to act about it and relieve the distress experienced.
A. The medical approach:
At the base is the origin search of physio-organic (disease) of the disease / disorder, you can define that the epistemological is aimed to know each other as a patient. This first level of communication with the patient may be more or less medicalized and use only the scientific instruments of the clinical interview, which constitutes the specific professionalism of physicians is updated, and that the medical history, physical examination and various diagnostic research, which produce information based on scientific facts ,can be challenged only by other scientific facts. The intervention of the counselor or the knowledge of counseling are important in understanding the psychosomatic disease. It allows you to work on two different fronts without wasting time, resources and without facing useless and harmful treatment programs as drug therapies or medical tests [5].
B. The socio-cultural approach
This approach is aimed to change some scripts of behavior, sometimes also established such as, for example, abandon unhealthy and damaging lifestyles, or more simply encourage the individual to assume a different approach towards himself, for example when it comes to being correct and accurate in taking certain medications [9].
C. The psychological approach
In this type of approach you get into direct contact with the psycho-subjective experience related to the problem of health (illness. The figure of the counselo is critical, to know the personality structure of the patient, to understand the intimate expectations, his/her wishes and fears. Actually this is a task only to a reliable professional who has developed deep capabilities of empathy [4].
D. The counselor multifunctional figure in health care
The counselor is a multifunctional figure in health care, whose work, besides the individual support in situations of need, includes [8]:
- Analysis of the relational climate of a department or an operating unit: This type of analysis is applicable both to the work team (doctors, nurses, technicians), both to patients in order to improve their interpersonal relationship and prevent the burn out of professionals [6].
- The design of programs to improve the quality of relationships: the counselor can indicate the response strategies to try to improve the relationship between the individuals belonging to a particular group [1].
- Service orientation; soft skills are also useful in the work of front-office, socially despised and considered minor, but which results in a substantial judgment on the patient's quality of service received [11].
- The Cultural mediation and meaning: the counselor attached to the doctor allows communication between two different cultures, the biomedical scientist and medical scientist.
- The Mediation in conflicts: the counselor makes possible the encounter between different points of view, personality and pretensions, promoting clarification [16].
- The social educator in the situations of behavioral disorder or personality, giving psychosocial support in difficult situations.
- The design of soft environmental strategies: the meeting and the confidence of vital world with users and operators makes the counselor able to perceive the needs and expectations, explicit and latent of the subjects [3].
- The systemic intervention, involving patients and families, aimed at alleviating the suffering psycho-relational linked to the disease situation, the rediscovery of the individual resources of the sick person, encouragement to face the problems arising from the pathology, patient empowerment. etc.
-The Collaboration with experts in social research in the design and conduct analysis of the perceived quality and user needs.
IV. CONCLUSION
The proposal put forward in this paper is to show the importance of a combined co-relationship between the various professionals, to bring concrete and important advantages to all the actors of the social system we live.
Specifically in the world of health and medicine this need it seems that clearly shows a solution of this long struggle in which he entered for more than thirty years in the world of care. The counseling advances intervention strategies, which are based in the idea of fund to always improve the individual, in whatever context it is found, from the employee at the factory to the patient in the hospital, tracking resources and limitations and to work on the awareness of these, obviously taking into consideration the situation.
REFERENCES
[1] Masini D. – Masini V., Narrative medicine e medicine complementari nella percezione degli studenti di medicina, in Medicina/Medicine. Le cure "altre" in una società che cambia, “Salute e Società”, FrancoAngeli, Milano, 2005.
[2] Mazzoni E., Essere un counselor, in M. Martelli (2005) (a cura di), Orientare perché, “I quaderni della della valtiberina”, Toscana n.15, Sansepolcro, 2005.
[3] Rogers C. R., La terapia centrata sul cliente, Martinelli, Firenze Studio Associato Prevenire e Possibile (2005), Dizionario Tascabile del Counseling, Arezzo, 1970.
[4] La qualità educativa, relazionale e dell’apprendimento nella scuola, Prevenire è Possibile, Isernia, 2001.
[5] Troiani D., Il colloquio clinico, Dispense del corso, 2005.
The 3rd Human and Social Sciences at the Common ConferenceOctober, 5. - 9. 2015, www.hassacc.com
Psychology eISSN: 2453-6075, cdISSN: 1339-522X10.18638/hassacc.2015.3.1.169 - 29 - ISBN: 978-80-554-1124-8

[6] La sociologia della salute. Il rapporto umano tra medico e paziente, le medicine alternative nella percezione dello studente di medicina, (Tesi di Laurea in Scienze della Comunicazione, Università degli Studi di Perugina), 2004.
[7] Il malessere della medicina. Un confronto internazionale, FrancoAngeli, Milano, 2003
[8] Organizzazione Mondiale della Sanità, Carta di Ottawa per la promozione della salute. (in italiano), 1986.
[9] Bert G, Novara A, Quadrino S. Il medico di famiglia e le abilità di counselling: competenze comunicative, 2003.
[10] Bert G, Novara A, Quadrino S. Il medico di famiglia e le abilità di counselling: competenze comunicative e counselling in medicina generale, Change, 2005
[11] Good B.J., Narrare la medicina. Lo sguardo antropologoco sul rapporto medico-paziente, Edizione di Comunità, Milano, 1999.
[12] Cipolla C. – Giarelli G. - Altieri L.(a cura di), Valutare la qualità in sanità, Franco Angeli, Milano, 2002.
[13] Bert G, Quadrino S. Il counselling nelle professioni di aiuto, Change, 2006.
[14] Edoardo Giusti, Lucia Masiello, Il counselling sanitario. Manuale introduttivo per gli operatori della salute. Ed. Carrocci Faber, 2004.
[15] Danon M., Counselling, Novara, Como, Red, 2003.
[16] Danon M., L’arte di aiutare ad aiutarsi, Como, Red, 2000.
The 3rd Human and Social Sciences at the Common ConferenceOctober, 5. - 9. 2015, www.hassacc.com
Psychology eISSN: 2453-6075, cdISSN: 1339-522X10.18638/hassacc.2015.3.1.169 - 30 - ISBN: 978-80-554-1124-8

Romantic Red Effect in the Attractiveness Perception
Tatjana Seibt
University of Applied Management
Department of Business Psychology
Erding, Germany
Abstract - The effect of the red color was a subject of investigation
in different domains, including achievement (e.g. Elliot et al.,
2007) and interpersonal perception (e.g. Pazda et al., 2012). In
specific, red color was found to enhance attractiveness perception
of the opposite-sex targets in the mating behavior (e.g. Elliot et
al., 2010; Elliot & Niesta, 2008). Red is considered to act as a non
lexical prime, reinforcing behavior relevant for reproduction.
Inconsistent results were found by other researchers (e.g. Kirsch,
2015). The present article aims to replicate Romantic Red Effect
in the interpersonal perception of females. Participants rated
attractiveness level of the selected pictures of young female
targets presented either on a red or green background. Results
revealed no red effect in the opposite-sex attractiveness
perception.
Keywords - attractiveness, red color, romantic red effect,
interpersonal perception, rivalry
I. INTRODUCTION
Evaluative perception of colors is known to be present in almost all animal lives (Schneirla, 1959). This perceptive ability helps to determine the level of hostility or hospitability of the subject (Elliot & Covington, 2001). The effect of the red color was investigated in such domains, as achievement (e.g. Elliot et al., 2007) and interpersonal perception (e.g. Pazda et al., 2012). Overall, red was found to enhance approaching behavior in the positive context (expecting a date) and to cause avoidance in more negative or stressful (job interview) situations (Meier et al., 2012). In one experiment, using the Holtzmann Inkblot Technique (Holtzmann et al., 1961; cited in Leichsenring), this color was found to increase emotional expressions of both love and anger, with no impact on anxiety and depression. The functional meaning of the Red Color Effect was formulated by Elliot and Maier (2007, 2012). According to the authors, people perceive and interpret colors automatically (Friedman & Forster, 2010). And this interpretation of the color function is more than just affective evaluation of nice and pleasant or ugly and disgusting. The central postulation of the theory is that the meaning of color and its effects is context-dependant. Against the opinion of Goldstein (1942), red does not generally stimulate the nervous system, but is functioning in dependence on the context situation. Colors might appear different and carry different meanings in various complex situations (Shevell & Kingdom, 2008). Such, in a survey conducted by Feinman & Gill (1978), both genders reported strong aversion against red hair color (about 80%). For instance, red impeded intellectual performance of participants. When people were confronted with the red color, they were likely to select easier tasks and choose less complicated questions (Elliot, Maier, Moller, et al.,
2007). The authors used electroencephalography (EEG) to measure prefrontal cortical activity of participants and found stronger activation on the right only in the red condition (Elliot & Maier, 2007). This area is associated with the avoidance motivation behavior. In another example, in those groups, were experimenter wore a red shirt, participants demonstrated avoidance motivation and preferred to select easier tasks (Tanaka & Tokuno, 2011). In sum, it could be stated, that red color enhances approaching behavior in the positive context and causes avoiding in a more negative context (Meier et al., 2012).
II. RED COLOR EFFECT
In a relationship context, red color was consistently found to have an impact on mating attraction (Elliot & Niesta, 2008). It was noticed to enhance attractiveness perceptions of the opposite-sex targets (e.g. Elliot et al., 2010; Elliot & Niesta, 2008). Subjects, viewing pictures of the opposite-sex targets for instance, wearing a red T-shirt, rated their attractiveness level higher than of the same targets both in achromatic (gray) as well as other chromatic colors (green, blue) conditions (e.g. Kayser et al., 2010; Elliot et al., 2010). This influence was found to occur automatically, as long as participants were not aware of it. Roberts et al. (2010) noted, that red clothes increases attractiveness ratings of male targets in the eyes of female participants. Status perception of the male target was responsible for this effect. A similar pattern was found in male participants. Wearing red also influences one`s own perceived attractiveness. This effect was found in the study by Burtin and colleagues (2011), men considered themselves to look more attractive in case of wearing red vs blue T-shirt. Women, expecting to meet an attractive man (against unattractive man or an average attractive woman), were also more likely to choose red clothes (Elliot et al., 2013). Thus, females use red to signal their interest in a romantic relationship (Elliot & Pazda, 2012) and it pays off - men were found to sit closer to women wearing red closes, leave more tips in restaurants as well to offer them a car ride (see Elliot, Greitemeyer, Pazda, 2013). When females wear red, this color is linked to sexual signal (Elliot & Niesta, 2008), most probably as an indicator of the current sexual receptivity (Elliot et al., 2013). This notion was supported by the finding of Schwarz and Singer (2013). In the experiment, conducted by the researchers, red background played had no impact on the attractiveness judgments of the older female targets.
Additional effect of wearing red is to accentuate one`s presence to other proximate females to be perceived as a noteworthy competitor (Elliot & Pazda, 2012). In the experiment conducted by Buunk and Dijkstra (2004), women
The 3rd Human and Social Sciences at the Common ConferenceOctober, 5. - 9. 2015, www.hassacc.com
Psychology eISSN: 2453-6075, cdISSN: 1339-522X10.18638/hassacc.2015.3.1.186 - 31 - ISBN: 978-80-554-1124-8

rated attractive female rivals as more socially dominant than their unattractive counterparts. This message could be interpreted in the frames of the female intrasexual competition, which might lead to a more promiscuous, outgoing manner in the intersexual communication (Roberts et al., 2010). Although red effect causes similar consequences in the opposite-sex perception, recent findings revealed different mechanisms to be responsible for it among genders. This effect was not moderated by perceived attractiveness of the opposite-sex target (Guéguen, 2011). Longer attention effects for the attractive same-sex targets were found solely among chronically jealous participants (Maner et al., 2009). Although, the research on the influence of the red color effect on the same-sex interpersonal perception is still scarce, no Red Effect was found for the attractiveness judgments of the same-sex targets (Elliot et al., 2010; Elliot & Niesta, 2008).
Overall, the main weakness of this research field, also mentioned by the other authors, is the low power of the red-attractiveness effect (Elliot & Maier, 2013), as well as small sample sizes (Francis, 2013). Despite of the big sample size and compatible methodology and experimental procedure, inconsistent results were obtained also by Fabian Kirsch (2015). Romantic Red Effect was solely observed in the condition when male subjects were evaluating attractiveness level of female targets wearing red T-shirts. Opposite results were obtained in the condition when females were asked to rate attractiveness of male targets wearing red piece of clothes.
The aim of the current study was to replicate Romantic Red Effect by showing pictures with young female targets presented either on a red or a green background. Green color was selected for the purposes of this study, as long as it is an achromatic color and due to its functional role, different from red in the nature (saliency against masking) as well as culturally (trafffic light).
III. METHOD
Participants
Participants were recruited among the students of the University of Applied Management in Erding, Germany and their networks. No incentives were paid for their participation. Participants were allowed to drop out at any time during the experiment.
Materials: Stimuli and Design
The study was conducted online, attractiveness ratings as well as demographical data were distributed to each subject using link to the SoSci Survey Plattform (SoSci Survey GmbH, 2014). The questionnaire included was aimed to gather information regarding relationship status, education and profession, followed by attractiveness evaluations of the attractive level of the female targets. Pictures showing attractive female targets were presented either with red or green background color. Attractiveness judgments consisted of ratings in terms of perceived attractiveness measured on a five-point Likert scale (e.g. 1 = highly unattractive; 5 = highly attractive). For the sake of comparability, 41 pictures with female targets from the experiment of Kayser and colleagues
(2013) were used in this experiment. This study had considered a 2 (red vs green condition) x 2 (gender of participants) between-subjects factorial design.
IV. RESULTS
Participants
Two hundred twenty participants have taken part in the experiment, 183 have completed it fully. Participants were between 15 and 55 years old, with a mean age of 25.5 years old (SD = 8.96), 96 females (52.5%) and 87 males (47.5%). Nineteen participants (10.4%) were married. One was divorced. Most subjects were singles (82 participants), the others reported to be in a relationship. Twenty participants had a University degree, most of them had an Abitur (a Diploma from the German secondary school), and 21 have graduated from a Realschule. Eleven have reported to have a vocational qualification. Seventy three were students, 66 already hat at least a part-time job and 28 were still visiting school. Participants were randomly assigned to the red vs green condition. Fifty females and 46 males have taken part in the red condition, 46 vs 41 were selected for the green condition respectively.
Attractiveness Ratings
The overall mean attractiveness level across all the targets, measured on a 5-point Likert scale (α = .88), ranged between 1.6 and 4.2, (M = 2.9, SD = 0.52). Females tended to rate same-sex targets slightly better (M = 2.9; SD =.53) than males (M = 2.8; SD = .50), the difference was not significant. Age of the participants had no impact on the attractiveness ratings. No correlation was found between the attractiveness ratings and age of the participants (r = .07, p = n.s.).
Our main prediction concerned male participants’ attractiveness ratings to be higher in the red experimental condition compared to the green one and to be higher than female ratings obtained in both conditions. A two-way independent ANOVA was run to prove the hypothesis. There was a non-significant main effect of condition (red vs green) on the attractiveness ratings, F(1, 179) = 1.24, p = n.s., ηp
2 = .007
(see Fig. 1 for means and standard deviations). The main effect of participants` gender did not reach significance as well, F(1, 179) = 3.323, p = n.s., ηp
2= .018. The interaction effect of
the participants` gender and the condition was not significant. This result indicates that no Romantic Red Effect was observed in the males´ attractiveness ratings of female targets compared to females´ ratings of the same-sex targets presented either on a red or on a green background. Specifically, females rated attractiveness level in both conditions slightly better (M = 3.0, SD = .49) in the red than in the green condition (M = 2.9, SD = .58) as well as better than males, who have also given higher ratings in the red (M = 2.8, SD = .49) in the red than in the green condition (M = 2.7, SD = .52).
Although female participants tended to give slightly higher attractiveness ratings of other females in the red condition compared to their male counterparts, this difference did not reach significance level (t(95)= 1.31, p = n.s.).
The 3rd Human and Social Sciences at the Common ConferenceOctober, 5. - 9. 2015, www.hassacc.com
Psychology eISSN: 2453-6075, cdISSN: 1339-522X10.18638/hassacc.2015.3.1.186 - 32 - ISBN: 978-80-554-1124-8

Figure 1. Means and standard deviations of the same- and opposite sex
attractiveness ratings in the red vs green conditions.
DISCUSSION
People not only prefer pretty faces (Aharon et al., 2001), they are also likely to subscribe positive traits to attractive people (e.g. Eagly, Ashmore, Makhijani, & Longo, 1991). Beauty plays an important role as it is associated with intelligence, humor and good social skills (Feingold, 1992). Good-looking applicants have higher chances to get hired due to better perceived job relevant qualifications (Shannon & Stark, 2003), as well as better career potential (Morrow, McElroy, Stamper, & Wilson, 1990). However, “Beauty-is-Good” stereotype is not always true, as it was shown by the studies investigating interpersonal perception in the romantic context (e.g. Maner, Miller, Rouby, & Gailliot, 2009) as well as in the organizational setting (e.g. Agthe, Spörrle & Maner, 2011). For instance, attractive same-sex individuals` perception was noted to evocate social avoidance behavior (Agthe, Spörrle, & Forsterling, 2008). Especially women are sensitive to the attractiveness level of other females (Buss, Shackelfort, Choe, Buunk & Dijkstra, 2000), probably due to the fact, that men place the premium weight on the physical attractiveness of their potential mates (Bleske & Buss, 2000). Financial prospects, job prospects, and physical strength are the factors important for women when looking for a new mate.
The color red was found to enhance attractiveness perception of the opposite-sex targets, which was proven in a variety of studies (e.g. Kayser et al., 2010; Elliot et al., 2010). Moreover, the impact of the red colour on the attractiveness ratings was not always moderated by perceived attractiveness of the opposite-sex target (Gueguen, 2011). In situations, when females were asked to rate males, target`s status perception was likely to have a bearing on these evaluations (Elliot et al., 2010). Red color effect is absent in the same-sex attractiveness ratings (e.g. Elliot & Niesta, 2008; Elliot et al., 2013). It is powerless in the attractiveness perception without mating interests (e.g. Elliot & Niesta, 2008; Elliot et al., 2013).
Previous findings were to some extend inconsistent. Such, in two experiments, conducted by Kirsch (2015), male participants rated attractiveness of the female targets higher, when they were wearing red T-shirts, compared to white ones, in line with the previous findings. Opposite results were obtained in the condition when female participants rated
attractiveness of male targets. This discrepancy could be partially explained by the methodological differences as well as different sample sizes. The present study was designed to determine the effect of red on the attractiveness perception of the same- and opposite-sex targets. No Romantic Red Effect could be observed in this study, which could be explained to some extend by differences in the design and procedure of the studies (clothes vs background, withing vs between experimental design; see Kirsch, 2015). Female participants rated attractiveness of the same-sex targets higher than males in both conditions, although this difference have not reached significance level. This finding could be explained by the fact, that although females are likely to devaluate the attractiveness of their female friends (Bleske-Rechek & Lighthall, 2010), they remain accurate in their self-judgments when compared to unfamiliar targets. No such devaluation is observed in judging personally unrelated attractive candidates. Romantic Red Effect is strongly connected with the Affiliation Motive (Elliot & Maier, 2012). Experimental setting as well as substantial number of pictures with good-looking young females might have served for the diminished personal relevance of the pictures viewed. This drawback could be addressed by using less number of pictures as well as by selecting another experimental setting.
CONCLUSION
In general, this experimental study emphasizes the value of the extending research on the functional role color plays on our interpersonal perception. Although research on the Romantic Red Effect is a topic of interest among quite many researchers (Kirsch, 2015), some aspects, important for the interpersonal perception are not analyzed yet. Further studies should consider for the subjects´ self-worth and perceived own attractiveness level, as long as they are known to influence attractiveness ratings.
REFERENCES
[1] Agthe, M., Spörrle, M., & Försterling, F. (2008). Success attributions and more: multi-dimensional extensions of the sexual attribution bias to failure attributions, social emotions, and the desire for social interaction. Personality & social psychology bulletin, 34(12), 1627-38.
[2] Agthe, M., Spörrle, M., & Maner, J. K. (2011). Does being attractive always help? Positive and negative effects of attractiveness on social decision making. Personality And Social Psychology Bulletin, 37(8), 1042-1054. doi:10.1177/0146167211410355.
[3] Aharon, I., Etcoff, N., Ariely, D., Chabris, C. F., O’Connor, E. & Breiter, H. C. (2001). Beautiful faces have reward value: fMRI behavioral evidence. Neuron, 32, 537-551.
[4] Bleske, A. L., & Buss, D. M. (2000). Can men and women be just friends? Personal Relationships, 7(2), 131-151. doi:10.1111/j.1475-6811.2000.tb00008.x.
[5] Bleske-Rechek, A., & Lighthall, M. (2010). Attractiveness and rivalry in women’s friendships with women. Human Nature, 21(1), 82-97. doi:10.1007/s12110-010-9081-5.
[6] Burtin, L., Kaluza, A., Klingenberg, M., Straube, J., & Utecht, C. (2011). Red shirt, nice flirt! How red influences the perception of self-attractiveness. Empiriepraktikumskongress Proceedings. Jena, Germany.
[7] Buss, D. M., Shackelford, T. K., Choe, J., Buunk, B. P., & Dijkstra, P. (2000). Distress about mating rivals. Personal Relationships, 7(3), 235-243. doi:10.1111/j.1475-6811.2000.tb00014.x.
[8] Dijkstra, P., & Buunk, B. P. (1998). Jealousy as a function of rival characteristics: An evolutionary perspective. Personality and Social Psychology Bulletin, 24, 1158–1166. doi:10.1016/j.paid.2008.09.016.
The 3rd Human and Social Sciences at the Common ConferenceOctober, 5. - 9. 2015, www.hassacc.com
Psychology eISSN: 2453-6075, cdISSN: 1339-522X10.18638/hassacc.2015.3.1.186 - 33 - ISBN: 978-80-554-1124-8

[9] Eagly, A. H., Ashmore, R. D., Makhijani, M. G., & Longo, L. C. (1991). What is beautiful is good, but . . . : A meta-analytic review of research on the physical attractiveness stereotype. Psychological Bulletin, 110, 109-128.
[10] Elliot, A. J. & Maier, M. A. (2012). Color-in-context theory. Advances in Experimental Social Psychology, 45, 63-125.
[11] Elliot, A. J. & Pazda, A. D. (2012). Dressed for sex: red as a female sexual signal in humans. PLoS One, 7, doi:e34607.
[12] Elliot, A. J., & Niesta, D. (2008). Romantic red: Red enhances men’s attraction to women. Journal of Personality and Social Psychology, 95,1150–1164. doi:10.1037/0022-3514.95.5.1150.
[13] Elliot, A. J., Greitemeyer, T., & Pazda, A. D. (2013). Women's use of red clothing as a sexual signal in intersexual interaction. Journal Of Experimental Social Psychology, 49(3), 599-602. doi:10.1016/j.jesp.2012.10.001
[14] Elliot, A. J., Greitemeyer, T., Gramzow, R. H., Niesta Kayser, D. N., Lichtenfeld, S., Maier, M. A., & Liu, H. (2010). Red, rank, and romance in women viewing men. Journal of Experimental Psychology: General, 139, 399–417. doi:10.1037/a0019689.
[15] Elliot, A. J., Maier, M. A., Moller, A. C., Friedman, R. & Meinhardt, J. (2007). Color and psychological functioning: the effect of red on performance attainment. Journal of Experimental Psychology: General, 136, 154-168.
[16] Elliot, A.J. & Covington, M.V. (2001). Approach and Avoidance Motivation. Educational Psychology Review, 13, 73-92.
[17] Feingold, A. (1992). Good-looking people are not what we think. Psychological Bulletin, 111, 304-341.
[18] Feinman, S., & Gill, G. W. (1978). Sex differences in physical attractiveness preferences. The Journal Of Social Psychology, 105(1), 43-52. doi:10.1080/00224545.1978.9924089.
[19] Francis, G. (2013). Publication bias in “Red, rank, and romance in women viewing men,” by Elliot et al. (2010). Journal Of Experimental Psychology: General, 142(1), 292-296. doi:10.1037/a0027923.
[20] Friedman, R. S., & Förster, J. (2010). Implicit affective cues and attentional tuning: An integrative review. Psychological Bulletin, 136(5), 875-893. doi:10.1037/a0020495.
[21] Goldstein, K. K. (1942). Some experimental observations concerning the influence of colors on the function of the organism. Occupational Therapy, 21, 147-151.
[22] Guéguen, N. (2012). Color and women attractiveness: When red clothed women are perceived to have more intense sexual intent. The Journal of social psychology, 152(3), 261-265.
[23] Kayser, D., Elliot, A. J., & Feltman, R. (2010). Red and romantic behavior in men viewing women. European Journal Of Social Psychology, 40(6), 901-908. doi:10.1002/ejsp.757.
[24] Kirsch, F. (2015). Perceived attractiveness and sexual orientation. The impact of the color red and color preferences. Wiesbaden: Springer.[Kirsch, F. (2015). Wahrgenommene Attraktivität und sexuelle Orientierung. Die Wirkung von Rot und Farbpräferenzen. Wiesbaden: Springer Fachmedizin].
[25] Leichsenring, F. (2004). The Influence of Color on Emotions In the Holtzman Inkblot Technique. European Journal Of Psychological Assessment, 20(2), 116-123. doi:10.1027/1015-5759.20.2.116
[26] Maner, J. K., Miller, S. L., Rouby, D. A., & Gailliot, M. T. (2009). Intrasexual vigilance: The implicit cognition of romantic rivalry. Journal of Personality and Social Psychology, 97, 74-87.
[27] Meier, B. P., D'Agostino, P. R., Elliot, A. J., Maier, M. A., & Wilkowski, B. M. (2012). Color in context: Psychological context moderates the influence of red on approach- and avoidance-motivated behavior. Plos ONE, 7(7), doi:10.1371/journal.pone.0040333
[28] Morrow, P. C., McElroy, J. C., Stamper, B. G., & Wilson, M. A. (1990). The effects of physical attractiveness and other demographic characteristics on promotion decisions. Journal of Management, 16, 723-736.
[29] Pazda, A. D., Elliot, A. J. & Greitemeyer, T. (2012). Sexy red: Perceived sexual receptivity mediates the red-attraction relation in men viewing woman. Journal of Experimental Social Psychology, 48, 787-790.
[30] Roberts, C., Owen, R. C., & Havlicek, J. (2010). Distinguishing between perceiver and wearer effects in clothing color-associated attributions. Evolutionary Psychology, 8(3), 350-364.
[31] Schneirla, T. C. (1959). An evolutionary and developmental theory of biphasic processes underlying approach and withdrawal. In M. R. Jones (Ed.), Nebraska symposium on motivation, 1959 (pp. 1-42). Oxford England: Univer. Nebraska Press.
[32] Schwarz, S., & Singer, M. (2013). Romantic red revisited: Red enhances men's attraction to young, but not menopausal women. Journal Of Experimental Social Psychology, 49(1), 161-164. doi:10.1016/j.jesp.2012.08.004
[33] Shannon, M. L., & Stark, C. P. (2003). The influence of physical appearance on personnel selection. Social Behavior and Personality, 6, 613-624.
[34] Shevell, S. K., & Kingdom, F. A. (2008). Color in complex scenes. Annual Review Of Psychology, 59143-166. doi:10.1146/annurev.psych.59.103006.093619.
[35] Tanaka, A. & Tokuno, Y. (2011). The effect of the color red on avoidance motivation. Social Behavior and Personality, 39, 287-288.
The 3rd Human and Social Sciences at the Common ConferenceOctober, 5. - 9. 2015, www.hassacc.com
Psychology eISSN: 2453-6075, cdISSN: 1339-522X10.18638/hassacc.2015.3.1.186 - 34 - ISBN: 978-80-554-1124-8

Health-related locus of control and health behaviour
among adults in Albania
Elsida Sinaj
Faculty of Psychology
Europian University of Tirana ALBANIA
Abstract – Health control beliefs were postulated to be associated
with health behavior. This study aims to examine health-related
locus of control and health behaviour among adults in Albania.
The final sample included 275 participants with an average age
41.6, SD = 10.4, where 189 of these participants were female and
63 were male, with status from higher education (Bachelor) to
PhD level. The following procedure was anonymous self-
reporting and confidential by completing the questionnaires. The
data is analyzed in two stages: 1. Descriptive Analysis 2.
Inferential analyses: Multivariate This study aims to examine
health-related locus of control and health behaviour among
adults in Albania. The study showed significant relations between
eating healthy and PLOC r = .050, p <. 05 between ILOC and
general visits to the doctor r = .046, p <. 05, between OLOC and
alcohol consumption r = .056, p <. 05. From the 11 health
behaviors assessed in this study it is shown that women are
predisposed to manifest more healthy behaviours. Results are
discussed in the context of theoretical and practical implication
and the cross-sectional study design is not allowed for causal
inferences, therefore any result presented is only hypothese as a
form provided and prepared to work for a more deep study on
this subject.
Keywords- adult, locus of control, health behavior
I. INTRODUCTION
Locus control is the reference point of control. The first principle in the concept of control is related to self-efficacy, where (1) Skinner claimed that this process is central to almost all aspects of human behavior and is the base of all human behavior. Individuals are able to control their behavior and the effect that they cause on health (2). This subjective sense in relation to the control of health can be conceptualized in different ways (3). Rotter distinguished two types of orientation process standard solution to the individual as the interior where the individual is prone to assess the actions as a result of his control, and outside where the individual is keen to assess the events as beyond his control for e. g situations that are caused by other people or fate. Individuals tend to see events as controllable by them(an internal locus of control) or uncontrollable by them (an external locus of control) (4). Having control over personal health, the individual also has even more control and over thought and action undertaken (5). Although once was thought that the beliefs of interior and exterior were at opposite ends of a continuum, (6), Wallson also argues that these two orientations of faith are independent from each other, because the individual can hold beliefs from internal and external locus of control at the same time, about a certain phenomenon (7). For example a newly diagnosed
person with lung cancer is more likely that he attribute his diagnosis internal factors such as smoking, poor diet food, inactivity, etc., but at the same time the individual can attribute lung cancer diagnosis at external causes as "bad genes" (inherited from each parent), punishment from god, pollution or bad luck. From this derives the assumption that a person is likely to adopt a behavior when he expects a certain result that has a great importance. Wallston has become a measure concerning health and locus of control to see if individuals consider their health as their control of such "I am directly responsible for my health", if they believe that their health is not controllable by them but is in the hands of fate p.sh '' if I'm good or not is a matter of chance "or if they consider their health as under the control of powerful others eg "I can just do what my doctor tells me to do" (8). The theory of locus of control suggests that individuals with the locus of internal control (ILOC) are likely to manifest more healthy behaviors, this being based on the fact that these individuals are able to control and manage carefully the behavior and their beliefs (9), on the other hand individuals with external locus of control (ELOC) are predisposed to believe more in luck (or in general to chance) to these individuals, the possibility of the manifestation of behaviors health-hazardous increases(10). Numerous empirical studies committed that have been based on the use of the theory of locus of control have generated data somewhat contradictory, that given the fact because studies major have committed important relationship correlational but small studies have not resulted in a very strong relation correlational (11). But the theory MHLC despite the limitations that may have, results that is a model widely used in studies of psychology and health. When using a theory it is important to consider the sample used for testing a theory, results not strong correlational may have resulted due to small sample, this and the fact that small samples do not have the strength to give generalizing data. Locus of control theory is a theory that in some way focused only on control of behavior, different researchers have seen this quite closely related theory and the theory of reasoned action of Fishbein & Ajzen (12), the starting and the fact because it reviews the theory of problematic relationships between individual attitudes and behaviors. The model assumes that most important social behaviors (including health behaviors) are controlled voluntarily, and that the purpose of a person to perform a behavior is immediate determinant and predictor only by the best of this behavior. The latter are represented by individual beliefs about what people expect from him, along with the motivation to conform to these expectations. Attitudes, in turn, are influenced by beliefs, the so-called rules, which deal with
The 3rd Human and Social Sciences at the Common ConferenceOctober, 5. - 9. 2015, www.hassacc.com
Psychology eISSN: 2453-6075, cdISSN: 1339-522X10.18638/hassacc.2015.3.1.172 - 35 - ISBN: 978-80-554-1124-8
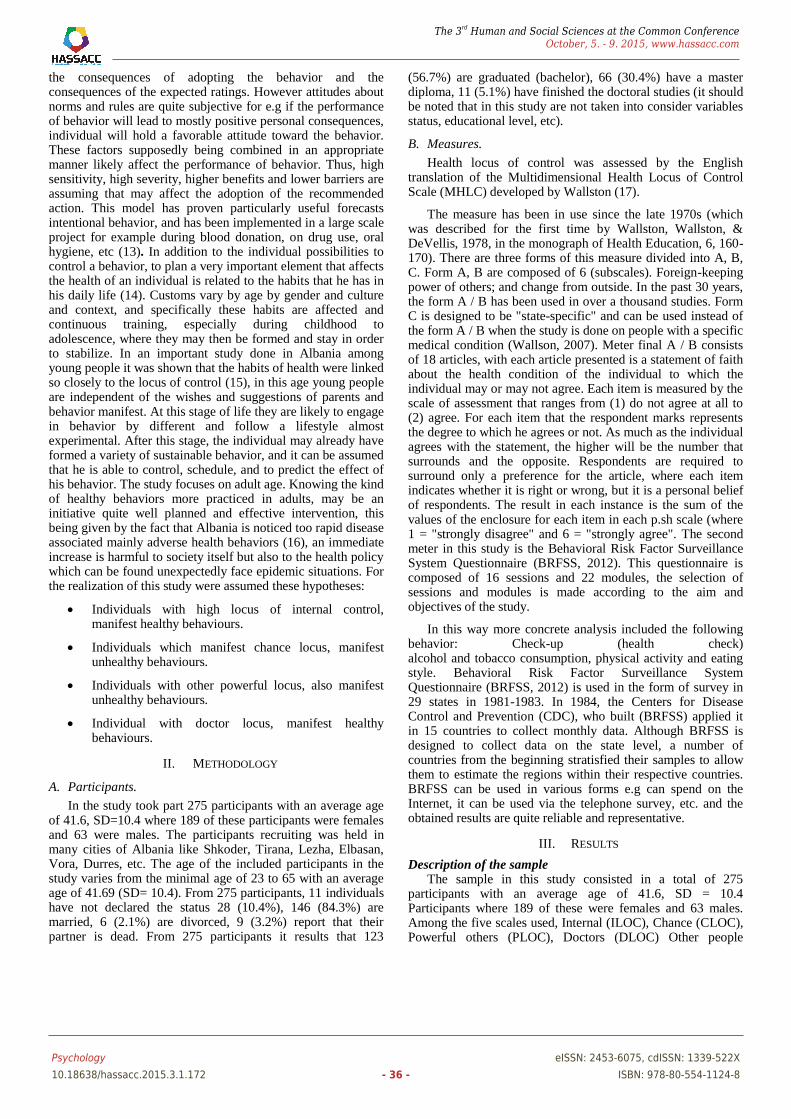
the consequences of adopting the behavior and the consequences of the expected ratings. However attitudes about norms and rules are quite subjective for e.g if the performance of behavior will lead to mostly positive personal consequences, individual will hold a favorable attitude toward the behavior. These factors supposedly being combined in an appropriate manner likely affect the performance of behavior. Thus, high sensitivity, high severity, higher benefits and lower barriers are assuming that may affect the adoption of the recommended action. This model has proven particularly useful forecasts intentional behavior, and has been implemented in a large scale project for example during blood donation, on drug use, oral hygiene, etc (13). In addition to the individual possibilities to control a behavior, to plan a very important element that affects the health of an individual is related to the habits that he has in his daily life (14). Customs vary by age by gender and culture and context, and specifically these habits are affected and continuous training, especially during childhood to adolescence, where they may then be formed and stay in order to stabilize. In an important study done in Albania among young people it was shown that the habits of health were linked so closely to the locus of control (15), in this age young people are independent of the wishes and suggestions of parents and behavior manifest. At this stage of life they are likely to engage in behavior by different and follow a lifestyle almost experimental. After this stage, the individual may already have formed a variety of sustainable behavior, and it can be assumed that he is able to control, schedule, and to predict the effect of his behavior. The study focuses on adult age. Knowing the kind of healthy behaviors more practiced in adults, may be an initiative quite well planned and effective intervention, this being given by the fact that Albania is noticed too rapid disease associated mainly adverse health behaviors (16), an immediate increase is harmful to society itself but also to the health policy which can be found unexpectedly face epidemic situations. For the realization of this study were assumed these hypotheses:
Individuals with high locus of internal control, manifest healthy behaviours.
Individuals which manifest chance locus, manifest unhealthy behaviours.
Individuals with other powerful locus, also manifest unhealthy behaviours.
Individual with doctor locus, manifest healthy behaviours.
II. METHODOLOGY
A. Participants.
In the study took part 275 participants with an average age of 41.6, SD=10.4 where 189 of these participants were females and 63 were males. The participants recruiting was held in many cities of Albania like Shkoder, Tirana, Lezha, Elbasan, Vora, Durres, etc. The age of the included participants in the study varies from the minimal age of 23 to 65 with an average age of 41.69 (SD= 10.4). From 275 participants, 11 individuals have not declared the status 28 (10.4%), 146 (84.3%) are married, 6 (2.1%) are divorced, 9 (3.2%) report that their partner is dead. From 275 participants it results that 123
(56.7%) are graduated (bachelor), 66 (30.4%) have a master diploma, 11 (5.1%) have finished the doctoral studies (it should be noted that in this study are not taken into consider variables status, educational level, etc).
B. Measures.
Health locus of control was assessed by the English translation of the Multidimensional Health Locus of Control Scale (MHLC) developed by Wallston (17).
The measure has been in use since the late 1970s (which was described for the first time by Wallston, Wallston, & DeVellis, 1978, in the monograph of Health Education, 6, 160-170). There are three forms of this measure divided into A, B, C. Form A, B are composed of 6 (subscales). Foreign-keeping power of others; and change from outside. In the past 30 years, the form A / B has been used in over a thousand studies. Form C is designed to be "state-specific" and can be used instead of the form A / B when the study is done on people with a specific medical condition (Wallson, 2007). Meter final A / B consists of 18 articles, with each article presented is a statement of faith about the health condition of the individual to which the individual may or may not agree. Each item is measured by the scale of assessment that ranges from (1) do not agree at all to (2) agree. For each item that the respondent marks represents the degree to which he agrees or not. As much as the individual agrees with the statement, the higher will be the number that surrounds and the opposite. Respondents are required to surround only a preference for the article, where each item indicates whether it is right or wrong, but it is a personal belief of respondents. The result in each instance is the sum of the values of the enclosure for each item in each p.sh scale (where 1 = "strongly disagree" and 6 = "strongly agree". The second meter in this study is the Behavioral Risk Factor Surveillance System Questionnaire (BRFSS, 2012). This questionnaire is composed of 16 sessions and 22 modules, the selection of sessions and modules is made according to the aim and objectives of the study.
In this way more concrete analysis included the following behavior: Check-up (health check) alcohol and tobacco consumption, physical activity and eating style. Behavioral Risk Factor Surveillance System Questionnaire (BRFSS, 2012) is used in the form of survey in 29 states in 1981-1983. In 1984, the Centers for Disease Control and Prevention (CDC), who built (BRFSS) applied it in 15 countries to collect monthly data. Although BRFSS is designed to collect data on the state level, a number of countries from the beginning stratisfied their samples to allow them to estimate the regions within their respective countries. BRFSS can be used in various forms e.g can spend on the Internet, it can be used via the telephone survey, etc. and the obtained results are quite reliable and representative.
III. RESULTS
Description of the sample The sample in this study consisted in a total of 275
participants with an average age of 41.6, SD = 10.4 Participants where 189 of these were females and 63 males. Among the five scales used, Internal (ILOC), Chance (CLOC), Powerful others (PLOC), Doctors (DLOC) Other people
The 3rd Human and Social Sciences at the Common ConferenceOctober, 5. - 9. 2015, www.hassacc.com
Psychology eISSN: 2453-6075, cdISSN: 1339-522X10.18638/hassacc.2015.3.1.172 - 36 - ISBN: 978-80-554-1124-8
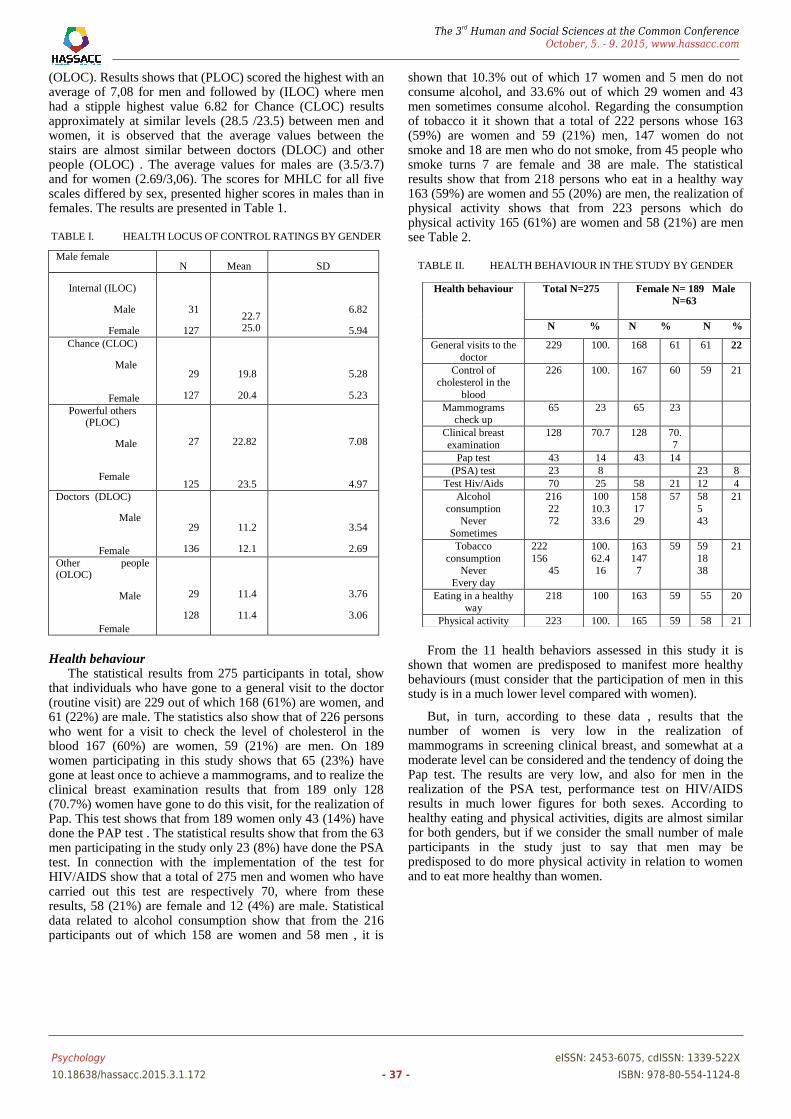
(OLOC). Results shows that (PLOC) scored the highest with an average of 7,08 for men and followed by (ILOC) where men had a stipple highest value 6.82 for Chance (CLOC) results approximately at similar levels (28.5 /23.5) between men and women, it is observed that the average values between the stairs are almost similar between doctors (DLOC) and other people (OLOC) . The average values for males are (3.5/3.7) and for women (2.69/3,06). The scores for MHLC for all five scales differed by sex, presented higher scores in males than in females. The results are presented in Table 1.
TABLE I. HEALTH LOCUS OF CONTROL RATINGS BY GENDER
Male female N Mean SD
Internal (ILOC)
Male
Female
31
127
22.7 25.0
6.82
5.94
Chance (CLOC)
Male
Female
29
127
19.8
20.4
5.28
5.23
Powerful others (PLOC)
Male
Female
27
125
22.82
23.5
7.08
4.97
Doctors (DLOC)
Male
Female
29
136
11.2
12.1
3.54
2.69
Other people (OLOC)
Male
Female
29
128
11.4
11.4
3.76
3.06
Health behaviour The statistical results from 275 participants in total, show
that individuals who have gone to a general visit to the doctor (routine visit) are 229 out of which 168 (61%) are women, and 61 (22%) are male. The statistics also show that of 226 persons who went for a visit to check the level of cholesterol in the blood 167 (60%) are women, 59 (21%) are men. On 189 women participating in this study shows that 65 (23%) have gone at least once to achieve a mammograms, and to realize the clinical breast examination results that from 189 only 128 (70.7%) women have gone to do this visit, for the realization of Pap. This test shows that from 189 women only 43 (14%) have done the PAP test . The statistical results show that from the 63 men participating in the study only 23 (8%) have done the PSA test. In connection with the implementation of the test for HIV/AIDS show that a total of 275 men and women who have carried out this test are respectively 70, where from these results, 58 (21%) are female and 12 (4%) are male. Statistical data related to alcohol consumption show that from the 216 participants out of which 158 are women and 58 men , it is
shown that 10.3% out of which 17 women and 5 men do not consume alcohol, and 33.6% out of which 29 women and 43 men sometimes consume alcohol. Regarding the consumption of tobacco it it shown that a total of 222 persons whose 163 (59%) are women and 59 (21%) men, 147 women do not smoke and 18 are men who do not smoke, from 45 people who smoke turns 7 are female and 38 are male. The statistical results show that from 218 persons who eat in a healthy way 163 (59%) are women and 55 (20%) are men, the realization of physical activity shows that from 223 persons which do physical activity 165 (61%) are women and 58 (21%) are men see Table 2.
TABLE II. HEALTH BEHAVIOUR IN THE STUDY BY GENDER
From the 11 health behaviors assessed in this study it is
shown that women are predisposed to manifest more healthy behaviours (must consider that the participation of men in this study is in a much lower level compared with women).
But, in turn, according to these data , results that the number of women is very low in the realization of mammograms in screening clinical breast, and somewhat at a moderate level can be considered and the tendency of doing the Pap test. The results are very low, and also for men in the realization of the PSA test, performance test on HIV/AIDS results in much lower figures for both sexes. According to healthy eating and physical activities, digits are almost similar for both genders, but if we consider the small number of male participants in the study just to say that men may be predisposed to do more physical activity in relation to women and to eat more healthy than women.
Health behaviour Total N=275
Female N= 189 Male
N=63
N % N % N %
General visits to the
doctor
229 100. 168 61 61 22
Control of cholesterol in the
blood
226 100. 167 60 59 21
Mammograms check up
65 23 65 23
Clinical breast
examination
128 70.7 128 70.
7
Pap test 43 14 43 14
(PSA) test 23 8 23 8
Test Hiv/Aids 70 25 58 21 12 4
Alcohol
consumption Never
Sometimes
216
22 72
100
10.3 33.6
158
17 29
57 58
5 43
21
Tobacco
consumption Never
Every day
222
156 45
100.
62.4 16
163
147 7
59 59
18 38
21
Eating in a healthy way
218 100 163 59 55 20
Physical activity 223 100. 165 59 58 21
The 3rd Human and Social Sciences at the Common ConferenceOctober, 5. - 9. 2015, www.hassacc.com
Psychology eISSN: 2453-6075, cdISSN: 1339-522X10.18638/hassacc.2015.3.1.172 - 37 - ISBN: 978-80-554-1124-8

Associations between health behaviour and the dimensions
of MHLC According to regression analysis where the data are shown
in table 3, the statistics show that a significant positive correlation between total ILOC and doctor visit r = .046, p <. 05, ILOC also correlates negatively with blood cholesterol control r = -.121, p <. 05, ILOC also correlates positively with (PSA) test, r = .023, p <.01, ILOC also correlates positively to alcohol consumption r = .072, p <. 05, ILOC also correlates positively with nutrition in a healthy way r = .037, p <. 05. Other correlations exist and are statistically significant between PLOC and General visits to the doctor, r = .035, p <.01, between PLOC is negatively correlated with the control of cholesterol in the blood, r = -.090, p <. 05, between PLOC and Test Hiv / Aids r = .064, p <. 05, between PLOC and Alcohol Consumption r = .058, p <. 05 between PLOC and Tobacco Consumption r = .054, p <. 05, between PLOC and a very important significant correlation exists between PLOC and Eating in a healthy way where r = .050, p <. 05, also PLOC Physical activity correlates with r = .020, p <. 05. significant correlation exists between CLOC and Control of cholesterol in the blood r = .039, p <. 05, between Alcohol Consumption and CLOC r = .037, p <. 05, between CLOC and Eating in a healthy way r = .039, p <. 05. An important correlation exists between DLOC and Control of cholesterol in the blood r = .018, p <. 05, between OLOC and General visits to the doctor r = .005, p <.01, between OLOC and (PSA) test r = .017, p <.01, between OLOC and Test Hiv / Aids r = .022, p <. 05, between Alcohol Consumption OLOC and r = .056, p <. 05 see table 3.
TABLE III. ASSOCIATIONS BETWEEN 5 DIMENSIONS OF THE
MHLC AND DIFFERENT FORMS OF HEALTH BEHAVIOR
ILOC PLOC CLOC DLOC OLOC
General visits to
the doctor
.046 .035 .005
Control of cholesterol in the
blood
-.121 -.090 .039 .018
Mammograms
check up
Clinical breast
examination
Pap test
(PSA) test .023 .017
Test Hiv/Aids .064 .022
Alcohol
consumption
.072 .058 .037 056
Tobacco consumption
.054
Eating in a
healthy way
.037 .050 .039 .039
Physical activity .020
IV. DISCUSSION
According to data derived in this study, it can be seen a kind of connection between MHLC, but that can only be regarded as an integral part of the decision, but not necessarily human behavior is complete under this component. This study brought some interesting data for new Albanian context. Studies have set different hypotheses about the importance of this construct (MHLC), Calnan in a study quite broad done
through two huge surveys in England concluded that the health behavior isnot related so close with beliefs and health controls, but its tight bond and is among the most important health risk behaviors such as smoking and consumption of the drugs (19, 20). On the other hand other studies argue that the effects of health checks beliefs are much stronger in the direction of an individual compared to other psychological factors, individuals (21). Studies conducted on middle ages have shown correlations very important from achieved and the conclusion that the MHLC used extensively especially when it comes to software design educational health in order to prevent diseases associated closely with behaviors health health education development programs to prevent lifestyle-related diseases (22, 23, 24). Many studies ILOC assumes that it is very closely linked to health behaviors such as smoking or the consumption of alcohol, but on the other hand in this study it was found that there was an association of the top between ILOC and between control check-ups overall health including and (PSA) test, the consumption of alcohol and eating in a healthy way. This is consistent with the theory postulated by Steptoe and Wardle, that ILOC has effects on health maintenance stronger behaviour (eg healthy nutrition) (25, 26, 15). In conclusion it can be said that this study showed significant relations between eating healthy and PLOC, a result in accordance with other similar studies (27, 28, 29). In conclusion it can be said that the locus of control can be an important component in predicting health behaviors among adults in Albania, but where component in the Albanian context is very influenced by subjective norms. The importance of subjective norms in the Albanian context is quite crucial that strongly decision-making affects the behavior and actions on personal health. This study has its own limitations starting from the fact that used questionnaires which are not standardized for Albania, the sample can be considered small in achieving generated results for all Albania. Although self-report questionnaire may have had subjects who hesitated in stating opinions, given that in the context of English, still many issues remain taboo, for e.g many subjects may have hesitated to answer the question about test HIV/AIDS, may have hesitated in reporting of mammograms, PSA test etc. Albania still has many issues which are difficult to study because the fear of prejudice and the consequences that a subject may have to participate in a study. Finally, the cross-sectional study design is not allowed for causal inferences, therefore any result presented is only hypothese as a form provided and prepared to work for a more deep study on this subject.
REFERENCES
[1] Skinner, B.F. Science and human behavior. New York: Macmillan, 1953.
[2] Wallston KA: Hocus-pocus, the focus isn’t strictly on locus: Rotter’s social learning theory modified for health. Cogn Ther Res 1992, 16:183-199. Publisher Full Text
[3] Wallston KA: Assessment of control in health-care settings. In Stress, Personal Control and Health. Edited by Steptoe A, Apples A. New York: John Wiley & Sons; 1989:85-105.
[4] Wallston KA: Assessment of control in health-care settings. In Stress, Personal Control and Health. Edited by Steptoe A, Apples A. New York: John Wiley & Sons; 1989:85-105.
[5] Rotter, julianB. (1966), “Generalized expectancies for internal versus external control of reinforcement,” Psychological Monographs, Vol.80, (1 Whole No.609)
The 3rd Human and Social Sciences at the Common ConferenceOctober, 5. - 9. 2015, www.hassacc.com
Psychology eISSN: 2453-6075, cdISSN: 1339-522X10.18638/hassacc.2015.3.1.172 - 38 - ISBN: 978-80-554-1124-8

[6] Wallston KA, Strudler Wallston B: Who is responsible for your health? The Construct of Health Locus of Control. In Social psychology of health and illness. Edited by Sanders GS. Hillsdale, N.J. [u.a.]: Erlbaum; 1982:65-98.
[7] Wallston, B. S. Health-related information seeking as a 6. HEALTH LOCUS OF CONTROL SCALES : 243 function of health related locus of control and health value. Iournol of Research in Personality, 1976, 10, 215-222.
[8] Wallston, K. A., Kaplan, G. D., & Maides, S. A. Development and validation of the health locus of control [HLC] scale. Journal of Consulting and Clinical Psychology, 1976, 44, 580-585.
[9] Norman P, Bennett PSC: Health locus of control. In Predicting health behaviour. Research and practice with social cognition models. Edited by Conner M, Norman P. Buckingham: Open Univ. Press; 1996:62-94.
[10] Bennett P, Norman P, Murphy S, Moore L, Tudor-Smith C: Beliefs about alcohol, health locus of control, value for health and reported consumption in a representative population sample. Health Educ Res 1998, 13:25-32. Publisher Full Text
[11] Roddenberry C Angela, Locus of control and self-efficacy: potential mediators of stress, illness and utilization of health services college students, B.S. University of Florida, 2000 M.S. University of Central Florida, 2005 http://etd.fcla.edu/CF/CFE0001831/Roddenberry_Angela_C_200712_PhD.pdf
[12] Ajzen, I. & Fishbein, M. (1980). Understanding attitudes and predicting social behavior. Englewood Cliffs, NJ: Prentice Hall.
[13] Floyd, D L, Prentice-Dunn, S and Rogers, R W, (2000). A meta-analysis of research on protection motivation theory. Journal of Applied Social Psychology, 30, pp. 407–429. Abstract-PsycINFO | $Order Document
[14] Hunt SM, Martin CJ: Health-related behavioural change-a test of a new model. Psychol Health 1988, 2(3):209 230. Publisher Full Text
[15] Melonashi, E; Sinaj E; Shkembi F; Canaj O. The impact of psychosocial factors on health behavior: The case of the European University of Tirana. Paper presented in Albanian Studies Days, Tirana, Albania: 2014
[16] Instituti i Statistikes i Republikes se Shqiperise [INSTAT], 2010 National statistics. http://www.instat.gov.al/graphics/
[17] http://www.vanderbilt.edu/nursing/kwallston/mhlcforma.htm
[18] Behavioral Risk Factor Surveillance System Questionnaire, http://www.cdc.gov/brfss/questionnaires/pdf-ques/2012_brfss.pdf, January 6, 2012, accessed: Nov 2015
[19] Calnan M: Control over health and patterns of health-related behaviour. Soc Sci Med 1989, 29:131-136. PubMed Abstract | Publisher Full Text
[20] Br J Addict. 1989 Sep;84(9):1059-65. Health locus of control and health beliefs in relation to adolescent smoking. Eiser JR, Eiser C, Gammage P, Morgan M.
[21] J Health Psychol. 2005 Sep;10(5):623-31.The validity of the multidimensional health locus of control scales.Wallston KA.
[22] Kuwahara A , Nishino Y, Ohkubo T, Tsuji I, Hisamichi S, Reliability and validity of the Multidimensional Health Locus of Control Scale in Japan: relationship with demographic factors and health-related behavior.May;203(1):37-45 Hosokawa T.Tohoku J Exp Med. 2004.
[23] Raja SN, Williams S, McGee R. Multidimensional health locus of control beliefs and psychological health for a sample of mothers. Soc Sci Med. 1994 Jul;39(2):213-20.
[24] Calnan M, “Control over health and patterns of health-relatedbehaviour”.SocSci Med. 1989;29(2):131-6.
[25] Steptoe, A., Sanderman, R., & Wardle, J. (1995). Stability and changes in health behaviours in young adults over a one year period. Psychology and Health, 10, 155-169.
[26] Steptoe A, Wardle J. Health behaviour, risk awareness and emotional well-being in students from Eastern Europe and Western Europe. Soc Sci Med. 2001 Dec;53(12):1621-30.
[27] Bennett P, Moore L, Smith A, Murphy S, Smith C: Health locus of control and value for health as predictors of dietary behaviour. Psychol Health 1994, 10:41-54. Publisher Full Text
[28] Bennett, Paul Norman1 , Simon Murphy2 , Laurence Moore and Christopher Tudor-Smith3 HEALTH EDUCATION RESEARCH Theory & Practice Vol.13 no.l 1998 Pages 25-32
The 3rd Human and Social Sciences at the Common ConferenceOctober, 5. - 9. 2015, www.hassacc.com
Psychology eISSN: 2453-6075, cdISSN: 1339-522X10.18638/hassacc.2015.3.1.172 - 39 - ISBN: 978-80-554-1124-8

Non-financial Reporting in Bulgaria – Status and
Challenges
A. Filipova-Slancheva
University of National and World Economy
Financial and Accounting Faculty
Sofia, Bulgaria
Abstract – Economic crisis has initiated major changes in
accounting standards in order to increase trust, transparency
and responsible business practices. Hence global and EU
regulatory framework is amended and developed. In order to
harmonize the legal framework in Bulgaria, certain provisions
are introduced, among which is non-financial reporting and
disclosure of payments to governments by large undertakings
and public-interest entities in extractive and primary forest
logging industries.
This study examined publication of non-financial reporting in
Bulgaria and application of Directive 2014/95/EU and
Accounting Directive 2013/34/EU. Certain provisions from the
Directive are transposed into the draft of the new Law on
Accounting in Bulgaria.
In the study large Bulgarian extractive and logging companies,
members of The Bulgarian Chamber of Mining and Geology plus
extractive and logging companies listed on the Bulgarian Stock
Exchange are investigated, their current non-financial reporting,
challenges they might encounter.
Results show that major logging and extractive companies in
Bulgaria are publicly disclosing only limited non-financial
information, but the number of disclosing companies is growing.
Some of the International best practices are also applied.
General conclusion wasthat integrated reporting in promoting
organizational change towards more sustainable outcomes is the
solution.
Keywords-non-financial information disclosure, Bulgaria,
government payments, extractive and logging industry
I. INTRODUCTION
Bulgaria geographically is situated in South Eastern Europe, Balkan Peninsula. Country is an EU member state since 01/01/2007. In 2014 Nominal GDP reached EUR 42.0 bn with 1.7% Real GDP growth YoY .
Extractive industry is of a paramount importance for Bulgaria, in terms of production, export, number of employed persons. Additionally, extractive sector has expanded considerably; productivity is at average EU levels, investments are growing with major European and world companies presented. Country is reach in resources, predominantly coal, lignite, copper, lead and zinc, kaolin, bentonite, gold.
Bulgaria has a leading position in European mining - third place in gold production and fourth place in lead production as of 2013[3].
Bulgarian Chamber of Mining and Geologyis a national non-governmental organization representing business from the mining sector and related activities.The Chamber initiated voluntary disclosure of sustainable mining standard in 2012. Main objective of the standard is sustainable development and prosperity of the mining industry in Bulgaria. Among other objectives are: improvement of energy and resource efficiency; minimization of environmental impacts; socio-economic benefits
In respect of logging industry, Bulgaria is reach in natural resources, but official data of the production, volumes, and turnover is not publically available. It is estimated that forestry and forest industry contributes to 2% of GDP as there is no breakdown per sectors. Scarce data is extracted from the Bulgarian Association of Wood, where list of 59 woodworking companies is enclosed with members of the Association and number of employees per company. In the provided list of member companies, criteria for primary forest logging companies – listed and non-listed are not covered.
II. NON-FINANCIAL REPORTING IN EU
Non-financial reporting in EU as opposed to financial
reporting, from legal obligation perspective could be accepted
as modest, not strictly defined, explicitly binding and unified. The accountancy framework within EU member states has
been adopted more than thirty five years ago. In 1978 the Council adopted the Fourth company law directive on the annual accounts of companies
1, where in 1983 the second
important accountancy directive was adopted – Seventh company law directive on consolidated accounts.
Crucial regulatory act for EU is the adoption in 2002 of Regulation 1606/2002
2on application of international
accounting standards.This accounting law set the basis for endorsement and application of the International Accounting Standards (IAS)/ International Financial Reporting Standards (IFRS) in the EU.
1 Fourth Council Directive 78/660/EEC of 25 July 1978 on the annual accounts of certain types of companies, OJ L222, 14.8.1978, p. 11 2 Regulation EC No 1606/2002 of the European Parliament and of the Council
of 19 July 2002 on the application of international accounting standards, OJ L243, 11.9.2002, p. 1
The 3rd Human and Social Sciences at the Common ConferenceOctober, 5. - 9. 2015, www.hassacc.com
Economics, Business and Financing eISSN: 2453-6075, cdISSN: 1339-522X10.18638/hassacc.2015.3.1.163 - 40 - ISBN: 978-80-554-1124-8

In terms of non-financial reporting, overview of the regulatory actions:
In 1992 European Commission published its fifth action programme on the environment "Towards sustainability", thus initiating sustainability reporting
In 2003 non-financial reporting also became a subject-matter of EU legislation – amending Fourth
Company Law Directive and Seventh Company Law Directive
Directive 2013/34/EU on the annual financial statements, consolidated financial statements and related reports of certain types of undertakingsThe new Directive repeals two Directives
3 - 78/660/EEC for
individual financial statements and 83/349/EEC for consolidated financial statements.
Directive 2013/34/EU on the annual financial statements, consolidated financial statements and related reports of certain types of undertakingsintroduces obligation for large non-listed and listed extractive and logging companies to report their payments to governments (the so called country by country reporting-CBCR). Reporting would also be carried out on a project basis, linked to specific projects. The new reporting obligation is applicable to all listed and large non-listed extractive and logging companies. Large companies are targeted as differentiated by number of employees, total balance sheet and net turnover. Certain provisions from the Directive are transposed into the draft of the new Law on Accounting in Bulgaria. Large company is defined as one which exceeds two of the three following criteria: Turnover €40 million; Total assets €20 million and Employees 250. In the report all material payments to governments broken down by country and by project, when these payments have been attributed to a specific project are included. Types of payments to be reported include production entitlements, royalties, dividends, licence fees, rental fees, entry fees and other considerations for licences and/or concessionsamongothers.
Milestone year for non-financial reporting in the EU is 2014, when EU Council adopted and published Directive 2014/95/EU on the disclosure of non-financial and diversity information (i.e. Corporate Social Responsibility (“CSR”) matters). New Directive 2014/95/EU amends Directive 2013/34/EU.
The new rules set forth in the Directive shed light on the importance of disclosures on sustainability factors, in particular:
social and environmental matters;
respect for human rights;
anti-bribery and corruption
The Directive leaves significant flexibility for companies to disclose relevant information in the way that they consider most useful, or in a separate report. Companies may use
3 Fourth and Seventh Accounting Directives on Annual and Consolidated
Accounts, 78/660/EEC and 83/349/EEC, respectively. Both Directives are amended and become the Accounting Directive of 26 June 2013
international, European or national guidelines which they consider appropriate (for instance, the UN Global Compact, the OECD Guidelines for Multinational Enterprises, ISO 26000
4).
It could be summarized that provisions for non-financial reporting within EU are significantly less strict, comprehensive than financial reporting. Considering the importance of sustainable development and Corporate Social Responsibility (CSR) for future development of the European economy and society, the existing regulatory framework on non-financial reporting is not legally binding to a satisfactory extent.
III. NON-FINANCIAL REPORTING IN BULGARIA
A. Legal framework
Corporatesocialresponsibility (CSR) as a growingglobaltrend, has not omitted Bulgarian companies. CSR is accepted asvoluntarycommitment of companies andorganizations to contribute to socialandenvironmentalgoals.Bulgarian companies are becoming ever more committed and involved in socially and environmentally-responsible activities. In this respect as summarized by [13]non-financialreportingimprovesthe reputation of thecompanyamong stakeholders.Transperency and disclosure of non-financial information increases competitiveness and reduces various risks.Non-financial information is disclosed on the one hand by legal obligations(Public Offering of Securities Act) applicable to all listed companies, while on the other hand voluntary - Bulgarian National Corporate Governance Code[1], Internal Codes on association or company level, International Intiatives (UN Global Compact, etc.). Periodic non-financial information is disclosed in stand-alone CSR reports, bulletins or corporate news[1].
Certain provisions from the Directive 2013/34/EU on the annual financial statements consolidated financial statements and related reports of certain types of undertakingsand Directive2014/95/EU on disclosure of non-financial and diversity information by certain large undertakings and groups are transposed into the draft of the new Law on Accounting in Bulgaria. New obligations for public-interest entities and large extractive and primary forest logging companies to report their payments to government (the so called country by country reporting-CBCR) are introduced. On the other hand, for large undertakings in the management report non-financial statement is becoming mandatory.
IV. RESEARCH METHOD
In first part of the study, literature related to non-financial reporting in EU and Bulgaria is examined – policies, action programs, regulations, directives, articles, along with annual reports of the companies members of Bulgarian Chamber of Mining and Geology and Bulgarian Association of Wood. Additionally sectorial publications, annual reports of companies from extractive and logging industry listed on the Bulgarian Stock Exchange, Bulgarian National Corporate Governance Code
4http://ec.europa.eu/finance/company-reporting/non-
financial_reporting/index_en.htm
The 3rd Human and Social Sciences at the Common ConferenceOctober, 5. - 9. 2015, www.hassacc.com
Economics, Business and Financing eISSN: 2453-6075, cdISSN: 1339-522X10.18638/hassacc.2015.3.1.163 - 41 - ISBN: 978-80-554-1124-8

As per REGULATION (EC) No 1893/2006 on establishing the statistical classification of economic activities NACE Revision 2 and amending Council Regulation (EEC) No 3037/90 as well as certain EC Regulations on specific statistical domains only companies which fall in Section B, Division 5-8 (exploration, prospection, discovery, development, and extraction of minerals, oil, natural gas deposits or other materials + clear cutting, selective logging and thinning on land containing primary forest areas) are subject to the new draft of Law on Accounting.Support services to the extractive and logging industries are not included Hence primary data for companies in the respective sector is collected from publicly available sources (website of the respective Association, members websites, Commercial register in case annual reports are not published on company website).For all large non-listed companies specified criteria applied (exceeds two of the three criteria: Turnover €40 million; Total assets €20 million and Employees 250). Data is collected in August 2015.
V. RESULTS
Having reviewed all large non-listed (exceeds two of the three criteria: Turnover €40 million; Total assets €20 million and Employees 250) and listed on the Bulgarian Stock Exchange[4] extractive and logging companies, could be summarized:
118 members of Bulgarian Chamber of Mining and Geology are investigated
47 members are meeting the set criteria in Section B, Division 5-8 REG. (EC) No 1893/2006
6 is the total number of large companies not-listed (AsarelMedet AD, Elatzite Med AD, Kaolin AD, Mini Maritsa Iztok EAD, Overgas Inc. AD, Dundee Precious Metals)
2 listed companies (Oil and Gas Exploration and Production” Plc and GIPS JSC)[4]
59 members of the Bulgarian Association of Wood
No large non-listed logging company
No listed logging company (the only listed member of the Association are three companies – Fazerles, Alfa Wood Bulgaria and Lesoplast/Welde Bulgaria, which are wood-processing companies, producers of fazers, plywood and hardboard)
TABLE I. BULGARIAN CHAMBER OF MINING AND GEOLOGY –
MEMBERS MEETING THE CRITERIA PER INDUSTRY
Industry Number of
Companies
Large companies
Ore Mining 8 3
Extraction of Industrial
Materials
5 1
Extraction of Oil and Natural Gas
2 2
Coal Mining 9 1
Extraction of Inert
and Construction
5 0
Materials
Extraction of
Marbles and
Granites
10 0
Source: Own research and calculations, data as of 31/08/2015
TABLE II. DISCLOSURE OF NON-FINANCIAL INFORMATION
Industry Non-financial information
CSR, COP (UN Global Compact)
Payments to government
disclosure
Ore Mining 3 out of 8 Yes (UN GC,
SustainabilityReport)
No
Extraction
of Industrial
Materials
1 out of 5 Yes No
Extraction
of Oil and
Natural Gas
2 out of 2 Yes (UN GC, ) No
Coal Mining 1 out of 9 yes No Extraction
of Inert and
Construction Materials
0 out of 5 0 No
Extraction
of Marbles
and Granites
0 out of 10 0 No
Source: Own research and calculations, data as of 31/08/2015
Results show that major logging and extractive companies in Bulgaria are publicly disclosing only limited non-financial information. Let alone some form of report on government payments.
This is partly not valid for some entities, which are part of International Groups, as proved by [2,5] who accept that subsidiaries of foreign multinationals are more active in non-financial disclosure than local companies. It is worth mentioning that without clear guidelines on the form and minimum information to be disclosed, the new requirement will be partially fulfilled.
VI. DISCUSSION AND CONCLUSION
The aim of this research was to investigate the non-financial reporting in Bulgaria, from legal perspective and with practical implication and the current status. In respect of new Directives and their transposition in the local legal requirements new draft of Law on Accountancy is analyzed. There are certain provisions for public-interest entities and large extractive and primary forest logging companies to report their payments to government. Hence companies from these industries are selected, their non-financial information reporting. In order to conduct the research and having in mind the lack of statistical data, most of the information is obtained by publications in the respective Associations - Bulgarian Chamber of Mining and Geology and Bulgarian Association of Wood
It can be summarized that the number of Bulgarian companies, which disclose non-financial information, apart from legal requirements, is growing. Some researches[6,11,12, and 14]accept that the size of the company, its perfomance, and industry in which it operates, mostly influence the disclosure of environmental issues. This is proving to be valid also for Bulgarian extractive companies, which also disclose negative
The 3rd Human and Social Sciences at the Common ConferenceOctober, 5. - 9. 2015, www.hassacc.com
Economics, Business and Financing eISSN: 2453-6075, cdISSN: 1339-522X10.18638/hassacc.2015.3.1.163 - 42 - ISBN: 978-80-554-1124-8

results and cases, along with periodical non-financial information for various stakeholders. No large non-listed or listed extractive and logging company is disclosing government payments.
Provisions for non-financial reporting within EU are significantly less strict, comprehensive than financial reporting; verification by independent auditor is limited to the existence of non-financial report. Considering the importance of sustainable development and Corporate Social Responsibility (CSR) for future development of the European economy and society, the existing regulatory framework on non-financial reporting is not legally binding to a satisfactory extent.
The author joins the group of researches, who accept the importance of integrated reporting in promoting organizational change towards more sustainable outcomes [10]. Integrated reporting means not just “publication of one report that comprises both financial and non-financial information” [8]; with transparently and consistently representing how an organization creates and sustains value [7].
Having in mind the importance of extractive and logging sector for Bulgarian economy, environment, society and importance of sustainable development, sustainable reporting (non-financial reporting) is crucial. New regulatory requirements are the first step, but more solid, binding, clear requirements are needed for all non- financial aspects (environmental, social among others) in order to increase transparency and trust and sustainable development.
REFERENCES
[1] Association Corporate Social Responsibility-Bulgaria (2008). Daniela Peeva – Chairman of the Association of Bulgarian Investor Relation Directors. Retrieved from csrbg.com/wp-content/.../daniela_peeva_abird.ppsx
[2] B. Tsakarestou , “Greece: The experiment of market expansion. In: Habisch A, Jonker J, Wegner M, and Schmidpeter R (Eds), Corporate social responsibility across Europe, Berlin, Heidelberg, Springer, 2004, pp. 261–273
[3] Bulgarian Chamber of Mining and Geology (n.d.). Content.Bulletins.Retreieved from http://www.bmgk-bg.org/content/fm/14/919/buletin_5_Mining_Industry.pdf, http://www.bmgk-bg.org/en/members
[4] Bulgarian Stock Exchange-Sofia (n.d.). Issuers and Membership.Financial Reports of Issuers. Retrieved from http://www.bse-sofia.bg/?page=FinancialReportsOfIssuers&year=2014&period=Q5&language=en
[5] D. Hackston, M. J. Milne, Some determinants of social and environmental disclosures in New Zealand companies. Accounting, Auditing and Accountability Journal, 9, 1996, pp. 77-108
[6] F. Macarulla, M. Talalwe, "VoluntaryCorporateSocialResponsibilityDisclosure: A CaseStudy of Saudi Arabia", Jordan Journal of BusinessAdministration, Volume 8, No. 4, 2012, pp. 815-830
[7] IIRC, The International /IRS Framework, The International Integrated ReportingCouncil, London, 2013
[8] J. C. Jensen, N. Berg, “Determinants of traditional sustainability reporting versusintegrated reporting. An institutionalist approach”, Business Strategy and the Environment, Vol. 21 No. 5, 2012, pp. 299-316
[9] L. Tang, H. Li, Corporate social responsibility communication of Chinese and global corporations in China, Public Relation Review, 35, 2009, pp. 199-212
[10] R. Eccles, M. Krzus, “Integrated reporting for a sustainable strategy”, Financial Executive, March, 2010, pp. 29-32
[11] S. Brammer and S. Pavelin , “Factors influencing the quality of corporate environmental disclosure. Bus. Strat.Env., 17, 2008, pp. 120–136
[12] S.M.DaSilvaMonteiro, B.Aibar-Guzmán, “Determinants of environmentaldisclosureintheannualreports of largecompaniesoperatinginPortugal”, CorporateSocialResponsibilityandEnvironmental Management, 17(4), 2009, pp. 185-204
[13] The University of Maribor Jean Monnet Center of Excellence. Working Papers.Working Paper Nr. 11. Retrieved from http://www.jm-excellence.si/wp-content/uploads/2013/10/Janja-Hojnik-Disclosure-of-Environmental-Information-in-Companies-Annual-Reports.pdf
[14] V. Magness, “Strategicposture, financialperformanceandenvironmentaldisclosure: Anempiricaltest of legitimacytheory”, Accounting, Auditing&AccountabilityJournal 19(4), 2006, pp. 540-563
The 3rd Human and Social Sciences at the Common ConferenceOctober, 5. - 9. 2015, www.hassacc.com
Economics, Business and Financing eISSN: 2453-6075, cdISSN: 1339-522X10.18638/hassacc.2015.3.1.163 - 43 - ISBN: 978-80-554-1124-8

The Use of Economic Modeling for Interprovincial
Comparisons of House Prices A Comparison Between Gauteng, Western Cape And South Africa
Liebenberg, B.J.
BSc Hons Candidate in Real Estate
Department of Construction Economics
University of Pretoria
South Africa
Erasmus, E.
BSc Hons Candidate in Real Estate
Department of Construction Economics
University of Pretoria
South Africa
Erasmus, J.
BSc Hons Candidate in Real Estate
Department of Construction Economics
University of Pretoria
South Africa
Boshoff, Douw G.B. PhD
Senior Lecturer
Department of Construction Economics
University of Pretoria
South Africa
Abstract—Economic modelling has been applied to various
extents in explaining property behavior in the past. Research in
space and capital markets, urban economics, input-output
analysis, etc. explains the links between real estate and
economics. When considering interprovincial comparison, the
application of such models becomes more difficult. This paper is
an introduction to the use of such models to compare the
performance of different provinces to one another, and further to
benchmark that to the country as a whole. The paper investigates
the two most economically active provinces in South Africa,
Gauteng and the Western Cape, as a case study.
Keywords— House Prices, Input-Output Analysis,
Interprovincial Economic Modelling, Real Estate Market Analysis,
Property Market Modelling
I. INTRODUCTION
Multiple factors influence the residential property market. Gauteng’s population have grown 15% from 2007-2011. According to First National Bank (Swanepoel, 2012) the level of housing demand was at its lowest in 2008, having now recovered, and is leveling out as the economy is recovering from the recession. Macro-economic factors in South Africa, for example the GDP, unemployment rate, and price indicators, have a significant influence on the housing market, where the micro-economic factors of a location will influence the residential property market.
There is relative little available research regarding the housing property market, especially in a South African context. This study will make use of various theoretical models together with external factors, to try and compare different provinces residential market.
In this study, Gauteng Province, the Western Province and the rest of South Africa will be compared to determine the residential housing market condition in South Africa.
II. LITERATURE REVIEW
A. Fischer-DiPasquale-Wheaton model
The Fischer-DiPasquale-Wheaton model (FDW) is a dynamic real estate model, displayed as figure 1, which was created on the fundamentals of demand and supply (DiPasquale and Wheaton, 1996 p.6). Thus the model establishes the market for real estate (Du Toit, 2003 p.3), in other words, the amount of available space demanded at a certain time and price.
Figure 1. Diagrammatic FDW model
Source: Archour-Fischer (1999)
Table I gives a summary of the functions used above.
TABLE I. FDW-MODEL FUNCTIONS
Quadrant 1: Demand for space R = f1(S)
S = E(b – a . R)
Quadrant 2: Determination of
value
P = f2(R)
P = R/i
Quadrant 3: Construction C = f3(P)
Rent Asset
valuation
P = R/i
Price (R)
2
1
Market for space
D(R, Econ.) = S
Stock (sq ft)
Construction
sector
P = f(C)
3
4
Stock
adjustment
S = C/d
Construction
(sq ft)
The 3rd Human and Social Sciences at the Common ConferenceOctober, 5. - 9. 2015, www.hassacc.com
Economics, Business and Financing eISSN: 2453-6075, cdISSN: 1339-522X10.18638/hassacc.2015.3.1.185 - 44 - ISBN: 978-80-554-1124-8

function C = (P – β)/α
Quadrant 4: Stock adjustment
function
S = f4(C)
S = C/d
Where:
R = rent per unit
S = supply
E = the number of office workers
a and b = demand parameters
P = price or value per unit
i = the capitalisation rate
C = construction
α and β = construction parameters
d = a depreciation rate Source: Archour-Fischer (1999: 38-39)
The model consist of four quadrants (see figure 1): the northeastern quadrant (Quadrant 1) contains the demands for units by tenants; the northwestern quadrant (Quadrant 2) is where price and rent are linked; the southwestern quadrant (Quadrant 3) is the supply curve of the construction industry; and lastly, the southeast quadrant (Quadrant 4) indicates the true depreciation and not the tax depreciation (Colwell 2002 p. 26).
The FDW model shows combined real estate equilibrium in the long run, with a connection to the financial capital market, Quadrant 2, and the capitalisation rate, this is one of the significant features of the model (Colwell, 2002: 26). But the short-term adjustment is not easily identified with the FDW model.
The capitalisation rate (ratio of rent to price) is a more stable rate than nominal interest rates; it includes a risk premium and has many external factors influencing the rate. Capital gains tax, inflation, market risk and the increase in the economic life for tax are some of the factors influencing the capitalisation rate, and help to explain the movements in the real estate market.
The axes of Quadrant 3 indicate the change in price in the stock of units and represent the gross investment that takes place over time (from conception to completion) (Colwell, 2002: 27). Quadrant 3, the construction sector must take the depreciation, through maintenance, as well as the new building units into consideration. This results in a gross investment (Colwell, 2002: 27). The movement of the curve represents the construction supply at a given cost.
The southeast quadrant (Quadrant 4) axes, represents the change in physical capital stock and stock. According to Colwell (2002), the quality of depreciation from conception to completion and the total sum of depreciation is proportional to the total amount of stock (the supply of stock).
Ultimately, Quadrant 1 or the northeast quadrant shows the rent and quality of stock, in other words, the demand for stock by tenants (Colwell, 2002: 27). External factors play a huge role in determining the demand, for example, tenant income, inflation and interest rate, economic activity of a country and amount of tenants.
The intermediate stages of the market are not clearly shown in the FDW model, and the behaviour of the statistical variables during transition phases is also not clearly notable
(Colwell, 2002: 27). These shortcomings must be noted when one considers the FDW model.
The FDW model suggests economic growth by considering: whether or not the population increases; unemployment rate; household income and spending habits (DiPasquale and Wheaton, 1996: 11-13). Any of the previously named could be considerations to determine the demand curve (Quadrant 1). The curve will move independently, and only later have an effect on Quadrant 1.
According to Du Toit and Cloete (2003), the laws of supply and demand, increased demand against fixed supply will therefore force rental upward, where this will cause higher rentals, translating into greater asset prices (Quadrant 2) that, in turn, encourages new construction (Quadrant 3). Thus, in the long run, an increase of available stock due to new construction (Quadrant 4) and the market, tends toward a new equilibrium state (Du Toit, 2003: 3).
Higher vacancy and lower levels of construction characterise a recession, while during an economic recovery, vacancy is lower and construction activity increases (DiPasquale and Wheaton, 1996: 13). Although in the property industry it is not always true as Pyhrr et al. (1989), indicates that a period of overbuilding in the real estate cycle, which typically follows an economic expansion, is initially accompanied by higher than normal vacancy rates.
The FDW model provides a structure that demonstrates the interaction between real estate and real estate assets (Du Toit, 2003: 3). Economic events could result in movement in the model, but it will happen simultaneously. These economic events could be the creation of more or less jobs and for example if the employment rate slows down the interest rate will rise (Du Toit, 2003: 3) and thus the other sectors will follow accordingly. The model, as a result of a holistic approach, creates a new equilibrium within the real estate market.
B. Real Estate Econometric Forecast Model
The Real Estate Econometric Forecast Model (REEFM) is a pooled, recursive system that forecasts conditions in both the space and capital markets, and makes use of statistical principles to explain the property market as well as to derive market returns. Boshoff (2013) has noted that the Model is of an econometric, rather than diagrammatic nature. Although Viezer (1998) developed the REEFM model, Weimer (1966) was possibly the first to distinguish between use decisions and investment decisions with respect to real estate.
Hendershott and Ling (1984) were the first to actually attempt to integrate the real estate space and capital markets. According to Viezer (1999: 504), the simulation model of Hendershott and Ling that solved for replacements cost, rents and prices evaluated investment value responses to tax code alterations in a dynamic programming algorithm that used a traditional discounted cash flow equation with assumed parameters. Later Corcoran (1987), who graphed both the space market and capital market separately, but interdependently, while clearly distinguishing between the short- and long-run supply of space. According to Viezer (1999: 504) similar models by Fisher (1992), DiPasquale and
The 3rd Human and Social Sciences at the Common ConferenceOctober, 5. - 9. 2015, www.hassacc.com
Economics, Business and Financing eISSN: 2453-6075, cdISSN: 1339-522X10.18638/hassacc.2015.3.1.185 - 45 - ISBN: 978-80-554-1124-8

Wheaton (1992) and Fisher, Hudson-Wilson and Wurtzebach (1993) will be collectively referred to as the “diagrammatic model”.
It should be highlighted that it is a not the purpose of this paper to investigate the validity of the research by Viezer (1998), but to test the applicability of the REEFM model in the Gauteng and Western Cape residential property markets.
The Real Estate Econometric Forecast Model (REEFM) treats each property type as a separate market cause of importance in relation to each individual property type. The REEFM models only require six econometric equations. These six equations predict occupancy, real rents, capitalisation rates,
market value per square foot, net change in stock and real construction costs. Secondly, it predicts seven identity equations per property type, that is: a net operating income proxy, market value per unit, stock of space, vacancy rate, implicit appreciation market return, implicit income market return and implicit total market return (Viezer 1998: 134-5).
As mentioned previously, the study will only present the South African Real Estate Market, primarily focusing on Gauteng and Western Cape Properties. Boshoff (2013) tested the applicability of the REEFM Model in the South African context and came to the conclusion that all but one equation had statistical significance. The conceptual framework of REEFM is illustrated in Figure 2
.
Figure 2. REEFM Conceptual Framework
Source: Viezer (1998)
C. Input output Matrix
1) Input output matrix background: The Input-Output Matrix has been designed by Wassily Leontief about 70 years ago. This model represents the demand and supply of a certain area (Wixted, et al., 2006, p. 7). The input-output model compiles all the materials that are supplied to an area and products that are manufactured by a certain area. These areas are normally a region, state, or country, as long as all the economic activities can be separated into production sectors (the inputs and outputs of all the products) that influence that area, such as agriculture, fishery or mining (Miller & Blair, 2009, p. 3). This information is then put into Table 1, and then further calculated.
This basic table then represents how a region or country trade with their resources, and it catches all the inputs and outputs of the region. The flow of the materials is fed into a matrix, which could also include the destination and origin of each product (Wixted et al. 2006: 7-8), it also represents the
impacts this has on the region. (D`Hernoncourt, et al., 2011, p. 6).
2) Basic Input-Output Table: all the information gathered can be represented on a table. This table can be divided into five parts. The rows represent the suppliers, and the columns the consumers, Miller and Blaire, 2009: 3).
Producers and consumers: represents the interaction between Domestic suppliers and Consumers, the value used can be the purchase price.
Value added: represents the extra costs (Non industrial inputs) that are needed to produce the product, e.g. the cost of labourers, indirect business taxes, and imports.
Final demand: allocation of which type of entity purc
hased the output. Total output: Total of all the products that have been produced.
The 3rd Human and Social Sciences at the Common ConferenceOctober, 5. - 9. 2015, www.hassacc.com
Economics, Business and Financing eISSN: 2453-6075, cdISSN: 1339-522X10.18638/hassacc.2015.3.1.185 - 46 - ISBN: 978-80-554-1124-8

Figure 3. Input-Output Table
Source: Miller & Blair (2009:3)
This table will show the economic impact that each factor has on the region’s economy, and how the flow of a specific material will influence some of the other product (Miller & Blair, 2009).
When describing our total output by X, our consumers demand by Y and Z represents the transactions that happened within the industry, which can be related in the following equation (Sporroi, et al., 2007).
(
)
A technical coefficient matrix (A) is then calculated by dividing Z (inter-industry transactions) by X (Total industry output):
Any changes in A Shows that there has been a change in the final demand of the consumers. Thus, calculating the
amount input sector ɪ had compared to the input of sector ȷ, the
final output was of their products.
When the coefficient has been calculated, the next step will be to calculate the output multiplayer by looking at the Leontief inverse matrix.
There are two inverse matrices that need to be calculated before deriving at the output multiplier. The first inverse multiplier illustrates the amount of output that each industry will need, in terms of the product being manufactured direct
and indirect requirements so that one unit of the product can be manufactured (D’Hernoncourt, 2011: 10).
L = (I – A)-1
where:
L: Leontief inverse matrix
I: Identity Matrix
A: “Direct requirements matrix (each cell of the domestic intermediate demand quadrant divided by its column total i.e. square matrix of technical coefficients)’’
The second inverse matrix shows why some outputs are needed to make one unit of a specific product by looking at the flow of money in and out of households in your region are and what effect this financial flow have on the industry (D’Hernoncourt, 2011: 11).
[
]
where:
(Aɪɪ)ɪȷ : Direct requirements matrix, or the amount of industry ɪ required per unit of industry ȷ.
(Aɪʜ)ɪ : Amount of industry ɪ required per unit of total household income from all sources.
(Aʜɪ)ȷ : Income paid to households per unit of output of industry ɪ (compensation of employees divided by the total output of the industry).
(Aʜʜ) : Household expenditure per unit of exogenous household income. (This cell is set to zero).
Production side (input)
(Index ȷ)
1
2
4 3
The 3rd Human and Social Sciences at the Common ConferenceOctober, 5. - 9. 2015, www.hassacc.com
Economics, Business and Financing eISSN: 2453-6075, cdISSN: 1339-522X10.18638/hassacc.2015.3.1.185 - 47 - ISBN: 978-80-554-1124-8

The Output multiplier can now be determined. An output multiplier is defined as the total outputs from each domestic industry required so that an additional unit of output can be produced (D’Hernoncourt, 2011: 14).
∑
An increase of income for employees are represented by the income multiplier, which also shows the difference of compensation for employees in each industry, where the difference is worked on intervals of R1 difference between each industry (D’Hernoncourt, 2011: 14).
∑
where:
IfE - Income from employment
v – ratio of IfE/ Total output for each industry
Income effects represents the impact that the income of employees have throughout the economy when the demand moves one unit up for industry j’s output. (D’Hernoncourt, 2011: 14).
The direct and indirect impact of why the demand moved upwards could be calculated by using type 1 and 2 multipliers (D’Hernoncourt, 2011: 14)..
∑
By using the Leontief inverse matrix and combining it with the employment data, it can be used to form a formula so that we can calculate the employment multiplier and the employment effects (D’Hernoncourt, 2011: 14).
The total increase of employment in the economy is affected by the final demand of an industry, is illustrated through the employment multipliers (D`Hernoncourt, et al., 2011, p. 14).
∑
where:
W indicates Full time job per Rand of total output for each industry
Employment effects calculate the impact that employment growth have throughout the economy from a change in final demand for industry J`s output of one unit (D`Hernoncourt, et al., 2011, p. 14).
∑
D. Economic situation in South Africa, Gauteng and the
Western Cape
The global economic crisis in 2008 has affected many countries including South Africa, and as a result, this has affected economic growth in South Africa over the last four years, prompting a deceleration in rate of economic growth (Stats SA, 2014).
According to Stats SA 2014, South Africa experienced an average growth rate of approximately 5% in real terms between 2004 and 2007, although the period of 2008 to 2012 only
recorded average growth just above 2%, which is to a large extend the effect of the global economic crisis.
The three provinces with the most growth was Gauteng, Kwazulu-Natal and Western Cape collectively contribute a significant portion to the country’s value added, reported at over 60% (Stats SA, 2014).
The most recent budget speech by the minister of Finance, Pravin Gordhan, suggested that the South African economy was healthy and growing, but the three month long strikes in the platinum sector has since cost mining companies R14,4 billion in sales, and the workers R6.4 billion in wages. This has had a huge negative impact on the South African economy (Mail and Guardian, 2014).
Currently the South African GDP is 384,3 billion US Dollars, and has an annual growth rate of 3,8%, where South Africa also makes up 0,62 % of the word economy (Trading Economics, 2014)
Considering all of the above-mentioned information South Africa is in a stable economic position, but many challenges are still present, for example, the unemployment rate is currently at 25,5 % (Stats SA-Economic Growth 2014) and the level of education is one of the lowest in the world, with urgent rural infrastructure development needs, as well as the high level of crime and corruption.
All these factors contribute to the attitude of ordinary South Africans, as well as to their potential to improve the South African economic climate and actively take part in making South Africa an economic force to be reckoned with.
E. External factors influencing the residential market
The value of residential property depends on many characteristics, which are related to both the physical aspects of the property and its location. An old saying is that there are three important determents, these are “location, location, location”, and this illustrates the importance of location in the Real Estate industry. Location includes employment possibilities as well as other leisure advantages. The other attribute that influence the value of the property is the characteristic of the neighbourhood in which it is in, which include parks, vistas, schools, community services etc. Other attributes related to surroundings, such as environmental factors, safety, existing infrastructure (sewerage, roads, public transport), also have an impact on the residential value of a property (Pollakowski, 1982). Therefore, it can be stated that residential property value depends on the property’s location, since location incorporates attributes, which result in benefits and satisfaction of the residents.
The location of a residential property in a city directly affects its market price. The single most important factor is the location, because of the immobility of real property. Things that make location attractive include: proximity of shopping malls, schools, transportation systems, major roads etc. These are key factors that buyer must consider before he/she purchase the property. In addition, location has an influence on the choice and on the offer price of each residential property. This meaning that the selling price of a property that is in close proximity to the amenities mentioned above will be much
The 3rd Human and Social Sciences at the Common ConferenceOctober, 5. - 9. 2015, www.hassacc.com
Economics, Business and Financing eISSN: 2453-6075, cdISSN: 1339-522X10.18638/hassacc.2015.3.1.185 - 48 - ISBN: 978-80-554-1124-8
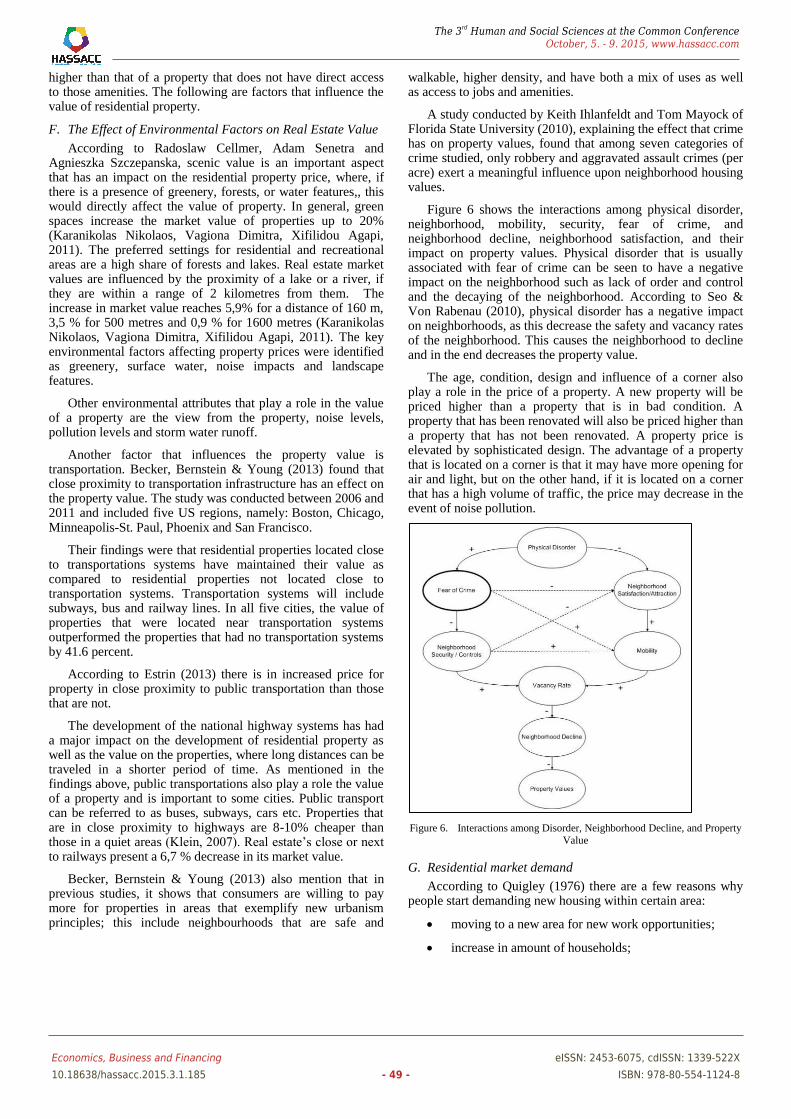
higher than that of a property that does not have direct access to those amenities. The following are factors that influence the value of residential property.
F. The Effect of Environmental Factors on Real Estate Value
According to Radoslaw Cellmer, Adam Senetra and Agnieszka Szczepanska, scenic value is an important aspect that has an impact on the residential property price, where, if there is a presence of greenery, forests, or water features,, this would directly affect the value of property. In general, green spaces increase the market value of properties up to 20% (Karanikolas Nikolaos, Vagiona Dimitra, Xifilidou Agapi, 2011). The preferred settings for residential and recreational areas are a high share of forests and lakes. Real estate market values are influenced by the proximity of a lake or a river, if they are within a range of 2 kilometres from them. The increase in market value reaches 5,9% for a distance of 160 m, 3,5 % for 500 metres and 0,9 % for 1600 metres (Karanikolas Nikolaos, Vagiona Dimitra, Xifilidou Agapi, 2011). The key environmental factors affecting property prices were identified as greenery, surface water, noise impacts and landscape features.
Other environmental attributes that play a role in the value of a property are the view from the property, noise levels, pollution levels and storm water runoff.
Another factor that influences the property value is transportation. Becker, Bernstein & Young (2013) found that close proximity to transportation infrastructure has an effect on the property value. The study was conducted between 2006 and 2011 and included five US regions, namely: Boston, Chicago, Minneapolis-St. Paul, Phoenix and San Francisco.
Their findings were that residential properties located close to transportations systems have maintained their value as compared to residential properties not located close to transportation systems. Transportation systems will include subways, bus and railway lines. In all five cities, the value of properties that were located near transportation systems outperformed the properties that had no transportation systems by 41.6 percent.
According to Estrin (2013) there is in increased price for property in close proximity to public transportation than those that are not.
The development of the national highway systems has had a major impact on the development of residential property as well as the value on the properties, where long distances can be traveled in a shorter period of time. As mentioned in the findings above, public transportations also play a role the value of a property and is important to some cities. Public transport can be referred to as buses, subways, cars etc. Properties that are in close proximity to highways are 8-10% cheaper than those in a quiet areas (Klein, 2007). Real estate’s close or next to railways present a 6,7 % decrease in its market value.
Becker, Bernstein & Young (2013) also mention that in previous studies, it shows that consumers are willing to pay more for properties in areas that exemplify new urbanism principles; this include neighbourhoods that are safe and
walkable, higher density, and have both a mix of uses as well as access to jobs and amenities.
A study conducted by Keith Ihlanfeldt and Tom Mayock of Florida State University (2010), explaining the effect that crime has on property values, found that among seven categories of crime studied, only robbery and aggravated assault crimes (per acre) exert a meaningful influence upon neighborhood housing values.
Figure 6 shows the interactions among physical disorder, neighborhood, mobility, security, fear of crime, and neighborhood decline, neighborhood satisfaction, and their impact on property values. Physical disorder that is usually associated with fear of crime can be seen to have a negative impact on the neighborhood such as lack of order and control and the decaying of the neighborhood. According to Seo & Von Rabenau (2010), physical disorder has a negative impact on neighborhoods, as this decrease the safety and vacancy rates of the neighborhood. This causes the neighborhood to decline and in the end decreases the property value.
The age, condition, design and influence of a corner also play a role in the price of a property. A new property will be priced higher than a property that is in bad condition. A property that has been renovated will also be priced higher than a property that has not been renovated. A property price is elevated by sophisticated design. The advantage of a property that is located on a corner is that it may have more opening for air and light, but on the other hand, if it is located on a corner that has a high volume of traffic, the price may decrease in the event of noise pollution.
Figure 6. Interactions among Disorder, Neighborhood Decline, and Property
Value
G. Residential market demand
According to Quigley (1976) there are a few reasons why people start demanding new housing within certain area:
moving to a new area for new work opportunities;
increase in amount of households;
The 3rd Human and Social Sciences at the Common ConferenceOctober, 5. - 9. 2015, www.hassacc.com
Economics, Business and Financing eISSN: 2453-6075, cdISSN: 1339-522X10.18638/hassacc.2015.3.1.185 - 49 - ISBN: 978-80-554-1124-8

change in preference for type of housing; and
amount of expenditure on housing has changed
According to Martin (1989), new households form due to a number of factors, including high divorce rates, an increase in population, and people moving out of their parents’ houses.
1) Work opportunities: Households move to new areas to increase their work opportunities, when people require a new house, they gather information on the spatial location and the relative house prices in the area. Different locations will mean different expenditures for traveling to amenities, work, etc. These factors will determine an “accessibility cost” that will reflect what time and costs will be spent to travel between destinations. The accessibility cost will determine whether the site is feasible or not for the household (Quigley, 1976). For a single household, the travel patterns will differ than for that of a household with more than one occupant.
Households with more than one occupant have a bit more difficult of a calculation to make, where they are required to consider all the occupants in the household and where each of them needs to be each day, calculate the total cost and time consumed on traveling and weigh the different accessibility costs against each other. This is called a cost-minimising calculation (Quigley, 1976).
With this calculation, each household’s demand for the minimum expenditure on transportation will be different, due to different circumstances and different working areas. Quigley (1976) has found that households spend an average of 40-45% of their income on fuel to and from work. With the increase in fuel prices, households cannot afford to stay so far from their workplace anymore, this percentage will have dramatically increased over the years if the households have not moved closer to their work. In a study done by Karsten (2007) he has found that most of the households that do live far from their work frequently mentioned a sense of urgency to shorten their travel distances.
In 2010, the Gautrain and bus system was implemented in Gauteng, moving between Pretoria and Johannesburg. The Guatrain has a big influence on the demand for residential properties that are in proximity to it (Commercial Property News, 2013). As mentioned previously, fuel prices increase, which pushes households closer to their work, or they must find a more cost-efficient method of transportation to work, which the Gautrain offers the community.
2) Households increase: For the population to change there are two main methods: naturally (birth, death), or through immigration and emigration (Martin, 1989). According to the latest census, it has been found that South Africa has a population of 51.8 million people, with the biggest percentage of all the provinces of 23.7 percent. This accumulates to 12.3 million people living in the 18 178km² area of Gauteng. From 2007, there has been a growth of 15% in Gauteng (Statistics SA, 2011).
Households refer to single, or multiple people living in the same dwelling. Numbers of households can increase due to an established household separating (divorce, or children moving out). As the number of household increase, naturally the
demand for housing increases. The primary age group that forms new households is 15-34 (Martin, 1989). In Gauteng, the amount of households have increased from 2 791 270 in 2001, to 3 909 022 in 2011, resulting in 71.41% growth (Statistics SA, 2011).
3) Preferred housing: Each person has different desires, people in households are required to consider each other’s desires and to find an environment that will suit them. Different types of housing are available, such as freehold, flat, townhouse, duplex, etc. It all depends on the household’s choice of residence.
A relatively recent trend is sustainable housing. Sustainable housing refers to the interaction between the development and the physical environment, and the ability of the development to continue providing a decent and sustainable living environment (Tomlinson, Abrahams, & Gildenhuys, 2003). Sustainable housing is measured by looking at how the physical structure flows with the natural environment, how much resource it uses, and the type of lifestyle the structure can provide to the users (Tomlinson, Abrahams, & Gildenhuys, 2003). Sustainable houses can ameliorate the total monthly expenditure on the structure and create a more pleasant atmosphere in which to live, as it is integrated with the natural features.
Economic and special factors have a big influence on household’s decision on where to live. They also consider the amount they can spend on housing and their family size and the age of all the household members (Karsten, 2007). Young households who do not have families choose to stay close to their working environment, and the prospect of moving due to a change in their own income or, change in neighbourhood characteristics are not cumbersome for them. Young household have the freedom to move with changes and have more control over their own preferences (Karsten, 2007), thus pushing up the demand, as young households are frequently searching for new residences.
Households who have kids tend to move as little as possible, are more willing to stay at a certain residence in which they are settled, close to work, with their social connections. Households with kids are willing to accept the increase in housing expenditure and associated environmental changes (Karsten, 2007). For these types of households, the location and characteristics of the neighbourhood is very important to achieving a certain lifestyle for their family, and especially for their children.
Residential neighbourhoods in cities are becoming increasingly dense, with less space for households with children, but residential housing is in close proximity to schools, work, amenities, and in some instances, public transport (Karsten, 2007). Households with kids will not have the space that they would prefer to have, but as they are closer to their homes, less time will be spent on traveling and they can spend more time with their families, they can visit parks and social facilities to escape from a cramped living space.
Elderly households ordinarily only consist of two people (husband and wife) or a single person, where children have since moved out and have formed their own households. This gives the elderly the opportunity to move to a smaller house
The 3rd Human and Social Sciences at the Common ConferenceOctober, 5. - 9. 2015, www.hassacc.com
Economics, Business and Financing eISSN: 2453-6075, cdISSN: 1339-522X10.18638/hassacc.2015.3.1.185 - 50 - ISBN: 978-80-554-1124-8

where mobility in the house will be easier (Feinstein & McFadden, D, 1989). Elderly people especially struggle when there are stairs in their houses (Feinstein & McFadden, D, 1989), which can be a danger to them as they tend to be frail, and could fall and hurt themselves severely. Elderly people who are a single household could get hurt and no one would be near to help. Elderly households have different needs and desires than younger households. Most elderly people are retired, so do not feel the need to live close to job opportunities, but they do want to be close to amenities, and benefit from a quiet environment in which to live.
As mentioned previously, the distance to work can have a large influence on the amount of money a household needs to spend on fuel to get to work, and on amenities. But when a household’s preference is to pay more for fuel and live in their desired area, then travel time and fuel becomes a less important factor that determines that specific household’s demand (Karsten, 2007).
In the study of Karsten (2007) it was found that several respondents have mentioned that they do not only live in the city to be closer to work and amenities, they have a wide variety of cultural and recreational facilities.
Households tend to seek security, good quality housing and fast police response (Karsten, 2007). Certainly, it goes without saying that a household would like to live in an area with high crime by choice. Karsten’s (2007) study refers to a response of passing through one of the roughest streets in Rotterdam, where one is shocked to see the drug addiction, the poor maintenance, and the drab atmosphere, when you ask yourself if one would want to live in such a city?
Examining all manner of household, no household want the same, where there are certain paths that each household would like to follow; to be safe and be comfortable in the environment that they live in. Ultimately, demand for housing is heavily influenced by the personal preference of each household and as more households prefer the same type of characteristic, the demand will rise.
4) Expenditure on housing: Each household sets out the amount they are willing to spend on housing each month, this will narrow their choices down so that they can make an informed decision on where in the residential market they fit in. To determine what type of housing the household can afford, they need to look at income, stability of income, whether or not they qualify for housing finance, and their willingness to pay.
The amount of income a household receives would be a big factor in deciding where to live, and in which type of housing. In Gauteng, the average annual income in 2011 was R156 234, or to roughly R13 000 per month (Statistics SA, 2011). Households spend 20-30% of their salary on housing each month (Tomlinson, Abrahams, & Gildenhuys, 2003). For households with a small income, sustainability will be hard to achieve, as they have other needs that have higher priority than housing. For these households, minimum housing or informal housing is preferable, so as to ensure the availability of disposable income (Tomlinson, Abrahams, & Gildenhuys, 2003). According to Melzer (2006) households who earn between R1500-3500 can’t afford to obtain a loan. Melzer
(2006) has stated that it isn’t the bond that has become unaffordable to the households, but the properties themselves.
With the above in mind, we can examine affordability. Each household must decide how much of their income they are willing to spend on housing. The higher the income of the household, the smaller the percentage will become that they will spend on housing, and the lower the income, the higher the percentage will be (Tomlinson, Abrahams, & Gildenhuys, 2003). When a household is able to obtain a bond, the size of the bond will determine how much they can spend on housing.
Housing finance always poses a big risk to households. Not all households have the courage to buy a house if they have a low income, or not a stable income. Bondholders have the risk of insufficient funds to pay the bond, where the house might be repossessed, or may want to move to obtain better opportunities, but can become tied down if the house remains unsold on being put up for sale (Rinker, 2000).
When taking out finance for a property, a bank will typically look at a person’s amount of income, the stability of his income, and his historical financial record to see if he is credit worthy (Melzer, 2006). There will also be an investigation done by the bank to see if the property meets the NHBRC’s (National Home Builders Regulation Council) building standards (Melzer, 2006), as well as whether the amount that the bank will finance for the house can be regained through selling the property when needed.
When obtaining a loan, your age also plays a role, where, according to Melzer (2006), banks are not likely to give a 20-year bond to a 45-year-old person as banks require that bond to be repaid in full before the mortgagor holder retires, and in this instance, the mortgagor will most likely be retired before his 20-year repayment period has passed.
All these factors will determine whether or not a household can obtain the funds to buy a house. As there are other options to obtain the use of a property, like renting, bonds are not the sole demand determiner. When a person complies with the standards and regulations of a bond, it will change the type of housing in which they would like to live. Unlike when renting, when buying a house, a person buys with a long-term perspective (Rinker, 2000)..
When a household decides to look for new housing, an often forgotten cost could be that of moving (Feinstein & McFadden, D, 1989), the time and effort that it consumes to pack and unpack the houses, or the cost when a moving company is used. When moving long distances, the cost will increase, due to transportation. For households who only want to move because of the changing environment in the neighbourhood, they may rethink the decision once they realise the amount of effort and capital that would go into the move.
Cost versus benefit influences demand. For any household, the higher the cost, the more and better the benefits sought, but even in cases when the cost is lower, and it is the maximum that a household can afford, their choice will be toward the most benefits that they can get for the least amount of expenditure. This shows that the more a property can offer a household in terms of their desires, the higher the demand will be for the house.
The 3rd Human and Social Sciences at the Common ConferenceOctober, 5. - 9. 2015, www.hassacc.com
Economics, Business and Financing eISSN: 2453-6075, cdISSN: 1339-522X10.18638/hassacc.2015.3.1.185 - 51 - ISBN: 978-80-554-1124-8

According to the latest census undertaken (Statistics SA, 2011: 21) it has been found that South Africa has a population of 51.8 million people, with the biggest percentage of 23.7%, or 12.3 million people living in the 18 178 km² of Gauteng.
From 2007, there has been a growth of 15% in Gauteng, making it the province with the highest growth rate, that has a direct link to the increase in demand for housing in the province (Statistics SA, 2011).
To consider the changes within the Gauteng or Western Province property market, the macro-economic situation of South Africa has to be taken into consideration, as well as South Africa’s global economic position. Various factors, such as GDP, unemployment rate, and price indicators need to be assessed to predict the future of the economic stability of South Africa.
A holistic view needs to be taken into account to predict and determine the changes in the property market.
The main factors that will play a role in the determining of residential property are location, accessibility and income. The closer the property is to commercial property, retail centres, green fields etc., the more expensive it becomes. The more accessible the property is via paved roads, the more likely it is people will result in the purchasing of the property, and thirdly, the income of the real estate property.
Once the influencing factors on the residential property in Gauteng have been identified, price determination, housing affordability measures, housing debt measures and drivers of home prices may be identified. This information will form a basis for determining the factors that play a role in the cost of a residential property in Gauteng.
FNB (Swanepoel, 2012) have done an Estate Agent survey in 2012, where they have found that the demand for properties in Gauteng was 6.51 in the first quarter, but have decreased in the second quarter to 5.78. This decrease in demand was described as a common decrease, as people are settling in for the winter months. They have taken the average percentage of the year, which is 4.7, which leads to a decrease from 2011 of 0.5. In the same study by FNB, the bank have done a case study on the time a property is on the market, where, with these results we can see what the demand for property was in the last quarter so as to compare how long the properties have been on the market.
In 2010, the Gautrain and bus system was implemented in Gauteng, and moves between Pretoria and Johannesburg. This has had a significant influence on the property prices as well as the demand towards residential properties as it is closer to public transport (SA Commercial prop news, 2013).
Demand is normally determine by two variables:
1. population growth; and
2. rate of newly formed households.
Population growth refers to the change in population numbers due to new births less deaths. Household forming is new households that form, generally due to a high divorce rate, which increase amount of households pushing the amount of
households up and pushing up the demand for housing (Martin, 1989: 2).
III. DATA COLLECTION AND DISCUSSION
A. Population
Our research focuses on the statistics of residential buildings (cost, square meter, number of buildings completed etc.) in the Gauteng, Western Cape and the rest of South Africa.
Gauteng, which has an area of 18 178 km2, is the smallest
province in South Africa, but has the largest population of 12 272 263 people, indicating that although Gauteng is not as large as the other provinces, it is still significant to the country in economic terms.
Gauteng is located in the northern part of South Africa. Gauteng consist of two of the largest cities in South Africa, namely Pretoria and Johannesburg (Statistics SA, 2011).
There are 1470.59m² for each person living in Gauteng.
The Western Cape has an area of 129 462km2 and a
population of 5 822 734 people, where Cape Town is the provincial capital (Statistics SA, 2011).
The rest of the provinces will be combined into one group so that the two subject provinces (Gauteng and the Western Cape) performance can be compared to the rest of the South Africa’s market (Statistics SA, 2011).
TABLE II. LAND SIZE AND POPULATION OF SOUTH AFRICA
(STATISTICS SA, 2011. CENSUS 2011, SOUTH AFRICA: STATISTICS
SA)
Provinces Land size km² Population
Eastern Cape 168 966 6 562 053
Free State 129 825 2 745 590
KwaZulu-Natal 94 361 10 267 300
Limpopo 125 754 5 404 868
Mpumalanga 76 495 4 039 939
Northern Cape 372 889 1 145 861
North West 104 882 3 509 953
Total (rest of SA) 1 073 172 33 675 564
The remaining seven provinces, as seen in Table 2, have a
size of 1 073 172km², and a joint population of 33 675 564.
The 3rd Human and Social Sciences at the Common ConferenceOctober, 5. - 9. 2015, www.hassacc.com
Economics, Business and Financing eISSN: 2453-6075, cdISSN: 1339-522X10.18638/hassacc.2015.3.1.185 - 52 - ISBN: 978-80-554-1124-8

There are 321 500m² for each person living in the rest of South Africa
Gauteng therefore has a much greater density than the Western Cape and the rest of South Africa, this will result in more houses build in Gauteng when compared to the other provinces.
To indicate new demand in each province, the amount of people who migrated to different provinces will be considered. Table 3 indicates the out-migration and the in-migration of the three categories. Gauteng has the largest amount of people migrating to the province, increasing the population and demand for housing;, therefore it can be ass
umed that demand in Gauteng will be higher for housing than they will be in in the Western Cape and the rest of South Africa.
The economic activity for South Africa over the past ten years, up to the end of 2013, is displayed in Figure 7. It is clear that there was a steady growth in the economic activity in the Real Estate hub, where the year-to-year growth is displayed on top of the bar. Between the period 2004 and 2008 the economy flourished, with the growth from 8.13% up to 14.4% per year. After the exponential growth in the economy, South Africa experienced a recession period during 2009 that slowed down the economic activity to 7.28 percent. The economic activity then increased slightly to 9.17% in 2010, and remained below 8.0% ever since. One must keep in mind that although the economic activity showed a steady but stable increase, it is still considered to be a weak indicator of the actual economic growth in South Africa.
It should be noted that it is very difficult to dictate the precise reason of the changes in the graphs given that there can be various reasons for these movements, such as availability of existing stock for consumers to buy, building costs, demographics, social factors (level of household income, employment trends, etc.), the availability of infrastructure and municipal services (roads, water, electricity), and the process of building plans approval at municipalities and the process and extent of reporting completed buildings to municipalities. Information on all these factors is not readily available, which make it impossible to have knowledge of the reasons for specific movements in building statistics at regional level, unless you are physically operating within these areas.
B. Gross Domestic Product (GDP)
In South Africa, the nominal gross domestic product (GDP) from 2004 appears to be good even with its slow growth, there was only a 1.89% increase in the GDP in 2013.
Figure 7. Economic growth in South Africa from 2004 to 2013
Source: Statistics SA (2011)
The real GDP (at constant 2005 prices) shows that there is a slight increase of 1.89% in 2013, increasing the average up to 3.16% from 2004. As seen in Figure 8, in 2009 the real GDP had a decline of 1.53%, and the economy recovered well in 2010 and 2011, with a growth of 3.14 and 3.6, respectively. From 2012 to 2013 the real GDPs had a steadily growth of 2.47 and 1.89, respectively. The South African market looks to be peaking currently, with a downward trend likely in the future.
Figure 8. GDP Growth in South Africa from 2004 to 2013
Source: Statistics SA (2011)
C. Residential building plans passed
The total residential building plans passed for South Africa from 2004 up to the2013 totals to 518 780. Gauteng contributes 219 008, resulting in a percentage of 42.22%, and
TABLE III. MIGRATION PATTERNS FOR A 10 YEAR PERIOD OF 2001 TO 2011
Category Out-migration In-migration Total
Gauteng 402 271 1 440 142 1 037 871
Western Cape 128 967 432 790 303 823
Rest of South Africa 1 668 343 1 335 519 332 824
Source: Statistics SA (2011)Economic Activity
The 3rd Human and Social Sciences at the Common ConferenceOctober, 5. - 9. 2015, www.hassacc.com
Economics, Business and Financing eISSN: 2453-6075, cdISSN: 1339-522X10.18638/hassacc.2015.3.1.185 - 53 - ISBN: 978-80-554-1124-8

the Western Cape contributing 111 414, resulting in a percentage of 21.48%, leaving the rest of South Africa with a total of 188 358 building plans passed, resulting in a contribution of 36.31%, as shown in Figure 9.
In 2004, Gauteng started with 7418 building plans approved less than the Western Cape. In 2005 Gauteng had a boom in the building plans approved, which continued up to 2007. The Western Cape did not perform as well, starting with its highest amount of plans approved in 2004 with 15 926, and gradually decreasing till a low point of 7 993 in 2009 and 7 906 in 2012. From 2012, the amount of building plans approved have started to increase in Western Cape, increasing to 9725 in 2013m showing positive growth as indicated in figure 10. The rest of South Africa had a slow but constant decrease in building plans passed from 2004 to 2013, reaching a low point of 11 401 building plans approved for 2013.
After the boom of building plans approved in Gauteng, the amount of plans approved dropped significantly, from 35 195 in 2007 to 12 904 in 2010, where Gauteng slowly picked up towards 2012 and a slight decrease in 2013.
Figure 9. Building plans approved in Gauteng, Western Cape and the rest of
South Africa from 2004 to 2013
Source: Statistics SA (2011)
Figure 10. Building plans approved in Gauteng, Western Cape and the rest of
South Africa from 2004 to 2013
Source: Statistics SA (2011)
D. Buildings completed
Gauteng and the Western Cape had a similar start in 2004, with a 16,128 and 13,725 buildings completed, respectively,
where the rest of South Africa had a much higher amount of buildings built. From 2005 the total amount of buildings completed in the Western Cape and the rest of South Africa decreased dramatically, especially in the rest of South Africa, decreasing from 26,211 in 2004 to 12,780 in 2006. Gauteng, on the other hand, saw an increase in their amount of buildings completed from 2005, with 16,215 to a high of 22,624 in 2006.
In 2012, the average residential buildings completed decreased in Gauteng and the rest of South Africa, but the Western Cape differed in 2013, where it had 10,192 buildings completed to the 11,514 completed in Gauteng, as shown in Figure 11.
Figure 11. Building plans completed in Gauteng, Western Cape and the rest
of South Africa from 2004 to 2013
Source: Statistics SA (2011)
Comparison of building plans approved and building completed
When comparing the different provinces’ building plans approved and buildings completed, it is evident that not all building plans that have been approved are built. There are several reasons for this, as stated in economic activity.
In Gauteng, 30.5% of all the building plans approved have not yet been built. Figure 12 & 13 illustrates that there was a large demand for houses, but only a small amount of all the plans passed were build, where in 2007, 35,195 building plans were approved, but only 20,248 were built, showing that the recession had a large impact on the amount of houses built compared with what people where aiming to build. Building plans approved and buildings completed have been relatively constant with from 2008 to 2013.
42%
22%
36% Gauteng
Western Cape
Rest of SouthAfrica
The 3rd Human and Social Sciences at the Common ConferenceOctober, 5. - 9. 2015, www.hassacc.com
Economics, Business and Financing eISSN: 2453-6075, cdISSN: 1339-522X10.18638/hassacc.2015.3.1.185 - 54 - ISBN: 978-80-554-1124-8

Figure 12. Comparison of the amount of building completed and not built in
Gauteng
Source: Statistics SA (2011)
Figure 13. Comparison of building plans approved and building completed in
Gauteng
Source: Statistics SA (2011)
In the Western Cape, only 5.46% of all the building plans approved have not yet been built. Figure 14 illustrates the amount of building plans passed and buildings completed. Plans passed and buildings build have simultaneously decreased from 2004 to 2012. The amount of plans and buildings completed has had a relative growth in 2013. According to the data gathered, figure 15 indicates that at some stage, the amount of buildings built almost exceeds the amount of building plans passed.
Figure 14. Comparison of the amount of building completed and not built in
the Western Cape Source: Statistics SA (2011)
Figure 15. Comparison of building plans approved and building completed in
Western Cape
Source: Statistics SA (2011)
For the rest of South Africa, only 26.08% of all building plans approved have not yet been built, thus being relatively constant with Gauteng, as seen in figure 16 & 17.
The plans approved in 2004 have started well, with 29,441. In 2006, the amount of buildings completed has severely decreased against the amount of plans that had been approved, which could also be due to the recession. From 2009, the amount of plans approved and buildings built have slowly decreased to 2013.
Figure 16. Comparison of the amount of building completed and not built in
the rest of South Africa
Source: Statistics SA (2011)
30.50%
69.50%
Buildings not built Buildings completed
5.46%
94.54%
Buildings not built Buildings completed
26.08%
73.92%
Buildings not built Buildings completed
The 3rd Human and Social Sciences at the Common ConferenceOctober, 5. - 9. 2015, www.hassacc.com
Economics, Business and Financing eISSN: 2453-6075, cdISSN: 1339-522X10.18638/hassacc.2015.3.1.185 - 55 - ISBN: 978-80-554-1124-8

Figure 17. Comparison of building plans approved and building completed in the rest of South Africa
Source: Statistics SA (2011)
E. Cost per square meter to build.
The cost per square meter in the rest of South Africa was found not to be as high as that in Gauteng, as the demand and competition in Gauteng exceeds that of the other provinces, as seen in Figure 18. The rest of South Africa has had a gradual increase over the years in the cost per square meter. The Western Cape has had a slightly slower growth than that of the rest of South Africa from 2006 onwards.
Gauteng had an average cost per square meter of R2097/m2
in 2004 and steadily increased to R5624/m2 in 2013 showing
an increase of R3527/m2 over the past 10 years. Whereas, the
Western Cape had an average cost of R1733/m2 in 2004, which
increased to R4201/m2 in 2013, showing an increase of
R2468/m2 over 10 years. The conclusion is that the difference
in cost per square meter is directly affected by the competition and the demand.
Figure 18. Comparison of cost per square meter in Gauteng, Western Cape
and the rest of South Africa
Source: Statistics SA (2011)
F. Square meter per unit
The square meter per unit is roughly the same for Gauteng and the Western Cape as shown in Figure 19. The size of units build in the Western Cape from 2008-2010 have gradually decreased, indicating that the Western Cape was hit the hardest by the recession. Gauteng has been relatively constant, without a big increase or decreases over time. The rest of South Africa has caught up with Gauteng, where they started at an average size of 74 m
2 in 2004, increasing to an average size of 147.36
m2 per unit, which sets the rest of South Africa’s average unit
size to 6.23 m² bigger than that of Gauteng.
Again, figure 19 shows that the Western Cape has followed its own trend, apart from the rest of South Africa.
Figure 19. Comparison of the square meter per unit in Gauteng, Western Cape
and the rest of South Africa
Source: Statistics SA (2011)
G. Cost per unit
Figure 20 illustrates that the average cost per unit to build in Gauteng are a lot higher than that of the Western Cape. The figure also illustrates that Gauteng and the Western Cape started at a relatively similar point in 2004 and Gauteng have gradually started to increase above the Western Cape. From 2010 it is evident that the cost per unit in Gauteng as well as the rest of South Africa has increased dramatically, compared to the cost per unit in the Western Cape.
Figure 20. Comparison of the cost per unit in Gauteng, Western Cape and the rest of South Africa
Source: Statistics SA (2011)
H. Average nominal house price.
Figure 21 shows the average nominal house prices, the house prices are based on the total purchase price of houses. In 2004 the average house price in Gauteng was R 610 987 and R 646 382 in the Western Cape. There is a steady growth in the market over the years. The difference in the average nominal house price from 2004 to the 2013 was R 593 895. The latest average in the nominal house price in Gauteng is R 12 04882 and R 129 1341 in the Western Cape. This can be as people build more expensive houses along the coast, as it is a luxury.
It is evident that the Rest of South Africa are growing at the same pace as Gauteng and the Western Cape, although the average house prices in the rest of South Africa are relatively lower as indicated in figure 21.
The 3rd Human and Social Sciences at the Common ConferenceOctober, 5. - 9. 2015, www.hassacc.com
Economics, Business and Financing eISSN: 2453-6075, cdISSN: 1339-522X10.18638/hassacc.2015.3.1.185 - 56 - ISBN: 978-80-554-1124-8

Figure 21. Comparison of average nominal house prices in Gauteng, Western
Cape and the rest of South Africa
Source: Du Toit (2014)
I. FDW Model
1) Quadrant 1 - Demand: Only the rental has been examined in Quadrant 1, and this was adjusted, as there was no data available for different provinces.
The assumption has been made that the higher the initial investment for a residential building, the higher the rent will be, so that the investors will have the same repayment period for a property, no matter the province. Gauteng has the highest cost per unit, which in return will have the highest rentals, whereas the Western Cape had good rentals in 2004, but they have dropped in the period of 2007-2013, with the rest of South Africa having shown good signs of growth, as indicated in Figure 22.
South Africa will be used as a constant to work out the factor to adjust the rentals for the different provinces. To acquire the adjusted rental of each province, the factor was multiplied with the whole of South Africa’s rentals.
Quadrant 1 represents the South African market very well as it shows the strong growth in Gauteng, and it indicates the way in which the rental trend evens or drops during the 2009 recession.
Figure 22. Quadrant 1- Rental in Gauteng, Western Cape and the rest of South Africa
Source: South African Reserve Bank (2014)
2) Quadrant 2 – Value: Quadrant 2 represents the cost per unit divided by the capitalisation rate to acquire the value per unit.
Figure 23 indicates the average growth of the residential house prices, where it is evident that residential property values have been badly influenced by the 2009 recession, and a negative growth in residential house prices in 2011 and 2012.The South Africa residential property market have had similar growth trends with regards to the property values, except for the rest of South Africa, which experienced strong growth from 2004-2006, whereas Gauteng and the Western Cape showed a decrease in 2005 and 2006.
After negative growth in the values between the period 2011-2012, the Western Cape has not recovered the same as has Gauteng and the rest of South Africa, which could be a result of the Western Cape being known as a place in which to purchase a second home. During the recession, a lot of these houses were sold, which may have led to an oversupply of residential units in the Western Cape for the 2013 period.
Quadrant 2 is a good representation of the actual residential property market, and it was found that the second quadrant could be used to represent the growth in residential property value over time.
Figure 23. Quadrant 2 - Value per unit in Gauteng, Western Cape and the rest
of South Africa. (Statistics SA, 2011. Census 2011, South Africa: Statistics
SA) Source: Statistics SA (2011)
3) Quadrant 3 - Construction Function: Figure 24, 25 & 26 below indicates the correlation between the amount of construction that took place in the specific provinces, and the profit gained from those residential developments.
Figure 24 and Figure 26 point out that the R-square values are 0.705 and 0.9315, indicating that there is a strong correlation between the amount of construction and profit, indicating that the developments that took place are profit driven whereas figure 25 indicates that there is no correlation between the amount of construction and profit, and that this might indicate a need for residential housing, where the main purpose of housing developments is not profit driven.
It was found that there is a strong connection between the FDW Model Quadrant 3 and our findings.
The 3rd Human and Social Sciences at the Common ConferenceOctober, 5. - 9. 2015, www.hassacc.com
Economics, Business and Financing eISSN: 2453-6075, cdISSN: 1339-522X10.18638/hassacc.2015.3.1.185 - 57 - ISBN: 978-80-554-1124-8

Figure 24. Quadrant 3 - Construction function in Gauteng. (Statistics SA,
2011. Census 2011, South Africa: Statistics SA) Source: Statistics
SA (2011)
Figure 25. Quadrant 3 - Construction function in the Western Cape. (Statistics
SA, 2011. Census 2011, South Africa: Statistics SA) Source: Statistics
SA (2011)
4) Quadrant 4 - Supply Function: Quadrant 4 illustrates the total supply of residential units in South Africa, no information could be found on the amount of residential stock to be found in each province.
Figure 27 illustrates a strong correlation between the amount of supply indicated by the FDW model and the supply recorded by the Reserve bank, as it has an R-square value of 0.9471.
Figure 26. Quadrant 3- Construction function in the rest of South Africa.
(Statistics SA, 2011. Census 2011, South Africa: Statistics SA) Source: Statistics SA (2011)
The fourth quadrant of the FDW model therefore represents a strong correlation of the true market supply.
Figure 27. Quadrant 4- The Supply function in South Africa. (South African
Reserve Bank: 2014) Source: Statistics SA (2011)
J. Conclusion
South African was not the only country badly influenced by the world recession in 2008/2009. From 2009, South Africa has shown signs of positive growth, but between the period of 2011-2013 it is evident that the South African economy have show that there was very little growth. This recession impacted the residential property market in every province. From 2008, the amount of building plans passed and completed decreased, resulting in very little growth in the residential units constructed per year.
However the cost per square meter and the value of residential properties have had a relative constant growth from 2004-2013, in 2009 during the recession it is clear that the value of residential units did not have strong growth, but there has only been a minor decrease in the value for this period. This could be due to the decreasing amount of annual supply of residential units and a decrease in demand due to the bad economy.
Each of the provinces has shown similar effects to the Macro-economic factors, and it is evident that Micro-economic factors have influenced some of the provinces at certain stages. The square meters per unit for Gauteng started to decrease form 2010 due to building space becoming increasingly scarce, with people starting to look for smaller homes, whereas, in the Western Cape, the square meters per unit increased from 2010. This is one of the cases where micro-factors play a role in the residential market.
In the study, it was found that the FDW model provided a good representation of each of the four quadrants when it comes to the total residential market. The results from Quadrant 1 and 2 provided good representations of the market that could also be supported by the cost per square meter, and units per year for each province. In Quadrant 3 the Western Cape’s units per year compared to profit show a lesser correlation than in Gauteng, and the rest of South Africa, which could be due to other factors besides the primary objective, which is profit. Quadrant 4 illustrated a good correlation to the actual supply value of residential units as recorded by the South African Reserve Bank.
The 3rd Human and Social Sciences at the Common ConferenceOctober, 5. - 9. 2015, www.hassacc.com
Economics, Business and Financing eISSN: 2453-6075, cdISSN: 1339-522X10.18638/hassacc.2015.3.1.185 - 58 - ISBN: 978-80-554-1124-8

IV. CONCLUSION
To answer the questions that were asked in Chapter One, a holistic view of the South African condition was required. Firstly the various types of economic models were identified and explained. The three models identified were the Fischer-DiPasquale-Wheaton model (FDW model), Real Estate Econometric Forecast Model (REEFM) and the Input-Output model.
Secondly, while all three models can be applied to different economic situations and different property types, for example, the Fischer-DiPasquale-Wheaton model (FDW) is a real estate model that theorises the interrelationship between markets for space (demand), asset valuation, construction sector and stock adjustment (supply) (DiPasquale and Wheaton, 1996: 6); the REEFM model is a pooled recursive system that forecasts conditions in both the space and capital markets, and makes use of statistical principles to explain the property market, as well as to derive market returns and the Input-Output represents the demand and supply of a certain area Wixted et al. 2006: 7). The input-output model compiles all the materials that are supplied to an area, and products that are manufactured by a certain area. As a result, for the purpose of comparing the South Africa residential market to a model, the Fischer-DiPasquale-Wheaton model was chosen.
Thirdly, all external factors, such as macro and micro-economics, location, transport, demand and supply were discussed and analysed. It was found that the buying power of the citizen, neighbourhood conditions, transport and affordability were the main attributes to the growth of the residential property market.
In the study we compared Gauteng, the Western Cape and the rest of South Africa to each other to determine the effectiveness of each region’s residential property market.
Fourthly, in the study it was found that the FDW model gave a decent representation of each of the four quadrants when it came to the total residential market. The results from Quadrant 1 and 2 provided good representations of the market that could also be supported by the cost per square meter, and units per year for each province. In Quadrant 3, the Western Cape’s units per year compared to profit show a lesser correlation than in Gauteng and the rest of South Africa, this could be due to other factors, besides the primary objective, which is profit. Quadrant 4 illustrated a good correlation to the actual supply value of residential units as recorded by the South African Reserve Bank.
Lastly, this indicates that it is possible to compare various provinces to each other but one has to understand the external factors that could influence each province example being at the coast or inland as well as the corresponding positive and negative attributes. The South African economy will always have an influence on the property market, with the interest rates never being constant, the attractiveness of South Africa for international investors, labour unrests and strikes, as well as the general growth of the country.
In conclusion, it can be seen that one should consider all factors and cannot analyse or compare property markets in
isolation, where a holistic view needs to be adopted to make meaningful conclusions.
REFERENCES
[1] Achour-Fischer D. 1999. An Integrated Property Market Model: A Pedagogical Tool, Journal of Real Estate Practice and Education, Vol. 2, no. 1, pp. 33-43.
[2] African Economic Outlook, 2014. South Africa. [Online] Available at: http://www.africaneconomicoutlook.org/en/ countries/southern-africa/south-africa/ [Accessed 26 February 2014].
[3] Becker, S., Bernstein, S., & Young, L. 2013. The New Real Estate Mantra: Location Near Public Transportation.
[4] Boshoff, D.G.B. 2013. Empirical Analysis of Space and Capital Markets in South Africa - a review of the REEFM- and FDW models, South African Journal of Economics and Management Sciences, Vol. 16, no. 4 pp 383-394.
[5] Case, K.E, & Fair, R.C. 1996. Principals of Macroeconomics. New Jersey: Prentice-Hall.
[6] Colwell P.F. 2002. Tweaking the DiPasquale–Wheaton Mode”, Journal of Housing Economics, Vol. 11, pp. 24-39.
[7] Corcoran, P. J. 1987. Explaining the Commercial Real Estate Market, Journal of Portfolio Management, Vol. 13, pp. 15–21.
[8] Cellmer, R. Senetra, A. Szczepanska, A. 2012. The Effect of Environmental Factors on Real Estate Value. FIG Working Week 2012: Knowing to manage the territory, protect the environment, evaluate the cultural heritage, Italy. [Online] Available at: https://www.fig.net/pub/ fig2012/papers/ts06h/ TS06H_cellmer_senetra_et_al_5748.pdf [Accessed 24 April 2014]
[9] C&H Group: Albertlu. 2012. Micro factors affecting property prices: Singapore property for rent/ sale. [Online] Available at: http://www.candh.com.sg/regulations/ singapore-property-for-rent-sale-micro-factors-affecting-property-prices/ [Accessed 3 May 2014]
[10] DiPasquale, D. & Wheaton, W.C. 1996. Urban Economics and Real Estate Markets. Prentice-Hall Incorporated: New Jersey.
[11] DiPasquale, D. & Wheaton, W. C. 1992. The Markets for Real Estate Assets and Space: A Conceptual Framework, Journal of the American Real Estate and Urban Economics Association, , Vol. 20, pp. 181–97.
[12] D’Hernoncourt, J., Cordier, M. & Hadley, D., 2011. Input-Output Multipliers-Specification Sheet and Supporting Material, Universite Libre de Bruxelles-Ceese, Brussels: Spicosa Project Report.
[13] Du Toit, J. 2008. ABSA Housing review. Johannesburg: ABSA. [Online] Available at: http://www.absa.co.za/deployedfiles/ Absacoza/PDFs/Economic%20Research/Property%20Research/Quarterly%20Housing%20Review/2013/Housing%20Review%202013%20Q3.pdf [Accessed 5 August 2014]
[14] Du Toit, J. 2010. ABSA Housing review. Johannesburg: ABSA. [Online] Available at: http://www.absa.co.za/deployedfiles/ Absacoza/PDFs/Economic%20Research/Property%20Research/Quarterly%20Housing%20Review/2010/Housing%20Review%202010%20Q4.pdf [Accessed 5 August 2014]
[15] Du Toit, J. 2014. Quarter 1. ABSA Housing review. Johannesburg: ABSA. [Online] Available at: http://www.absa.co.za/deployedfiles/Absacoza/PDFs/Economic%20Research/Property%20Research/Quarterly%20Housing%20Review/2014/Housing%20Review%202014%20Q2.pdf.pdf [Accessed 5 August 2014]
[16] Estrin, M. 2013. Public transportation affects home values. [Online] Available at: http://www.bankrate.com/finance/ real-estate/public-transportation-affects-home-values.aspx [Accessed 3 May 2014]
[17] Fisher, J. D. 1992. Integrating Research on Markets for Space and Capital, Journal of the American Real Estate and Urban Economics Association, Vol. 20, pp. 161–80.
[18] Fisher, J. D., Hudson-Wilson S. & Wurtzebach, C. H. 1993. Equilibrium in Commercial Real Estate Markets: Linking Space and Capital Markets, Journal of Portfolio Management, , Vol. 19, pp. 101–07.
[19] Fernandez-Villaverde, J., 2014. Macroeconomics: An Introduction. [Online] Available at: http://economics.sas.upenn.edu/~jesusfv/macro_jfv.pdf [Accessed 26 February 2014].
The 3rd Human and Social Sciences at the Common ConferenceOctober, 5. - 9. 2015, www.hassacc.com
Economics, Business and Financing eISSN: 2453-6075, cdISSN: 1339-522X10.18638/hassacc.2015.3.1.185 - 59 - ISBN: 978-80-554-1124-8

[20] Feinstein, J. & McFadden, D. 1989. The Dynamics of Housing Demand by the Elderly: Wealth, Cash Flow, and Demographic Effects. In: A. David, (ed.). The Economics of Aging. Chicago: University of Chicago Press, pp. 55-92.
[21] Hendershott, P. H. & D. C. Ling, 1984. Prospective Changes in Tax Law and the Value of Depreciable Real Estate, Journal of the American Real Estate and Urban Economics Association, Vol. 12, pp. 297–317.
[22] Karsten, L., 2007. Housing as a Way of Life: Towards an understanding of middle-class families’ preference for an urban residential location, Housing Studies, Vol. 22, no. 1, pp. 83-98.
[23] Klein, D. R. 2007. How to win land development issues. Maryland: Community & Environmental Defense Services publications.
[24] Laura Fernandez-Duran, L. Llorca, A. Ruiz, N. Valero, S. Botti, V. 2011. The impact of location on housing prices: Applying the Artificial Neural Network Model as an analytical tool. pp. 1-4. [Online] Available at: http://www.researchgate.net/ publication/230819406_The_impact_of_location_on_housing_prices_applying_the_Artificial_Neural_Network_Model_as_an_analytical_tool [Accessed 24 April 2014]
[25] Mail and Guardian. 2014. Platinum Talks seek to en longest South African Mine Strike. [Online] Available at: http://mg.co.za/article/2014-04-23-platinum-talks-seek-to-end-longest-south-african-mine-strike [Accessed 23 April 2014]
[26] Melzer, I., 2006. Charting the housing finance access frontier. South Africa: Finmark Trust.
[27] Martin, W. B., 1989. Demographic trend and the demand for residential rentals. The Journal of Real Estate Development, Vol. 1, no. 1, p. 51.
[28] Miller, R. E. & Blair, P. D., 2009. Input-Output Analysis. 2nd edition. Cambridge: Cambridge University Press.
[29] Miller, N. Peng, L. Sklarz, M. 2009. House prices and Economic Growth. Journal of Real Estate finances and Economics, Vol. 42, pp. 522-541.
[30] Pyhrr S.A., Cooper J.R., Wofford L.E., Kapplin S.D. & Lapides P.D. 1989. Real Estate Investment: Strategy, Analysis, Decisions. 2nd edition. Wiley: New York
[31] Pollakowski, H. O. 1982. Urban Housing Markets and Residential Location, Vol. 43. Free Press
[32] Olayinka C. Oloke, Funsho R. Simon, Ayotunde F. Adesulu. 2013. An Examination of the Factors Affecting Residential Property Values in Magodo Neighbourhood, Lagos State. International Journal of Economy, Management and Social Sciences, 2(8) August, pp. 639-643.
[33] Quigley, J., 1976. Housing Demand in the Short Run. In: NBER, ed. Explorations in Economic Research. s.l. National Bureau of Economic Research, pp. 76-102.
[34] Rinker, M., 2000. Affordable housing. Gainesville: Shimberg center for affordable housing.
[35] Seo, W., & von Rabenau, B. (2010). Spatial impacts of microneighborhood physical disorder on property resale values in Columbus, Ohio. Journal of Urban Planning and Development.
[36] Sporroi, C., Morsuk, M., Peters, I. & Reichert, P., 2007. The Economic Impacts of River Rehabilitation: A Regional Input-Output Analysis, Ecological Economics, Vol. 62, p. 341-351.
[37] Swanepoel, T. 15 August 2012. FNB property review 2nd quarter. Gauteng: FNB. [Online] Available at: http://www.google.com/ url?sa=t&rct=j&q=&esrc=s&source=web&cd=2&ved=0CCwQFjAB&url=http%3A%2F%2Fwww.ghostdigest.co.za%2Fresou [Accessed 25 February 2014].
[38] SA Commercial Property News, 2013. Pure vision properties. [Online] Available at: http://www.pvprop.co.za/blog/new-gautrain-routes-increase-property-demands/ [Accessed 25 February 2014].
[39] Statistics SA. 2014. Statistics SA 2011 Census [Online] Available at: http://beta2.statssa.gov.za/ [Accessed 5 August 2014]
[40] Statistics SA, 2014. Economic Growth. [Online] Available at: http://beta2.statssa.gov.za/?page id=735 &id=1 [Accessed 23 October 2014]
[41] South African Reserve Bank. 2014. [Online] Available at: https://www.resbank.co.za/Pages/default.aspx. [Accessed 4 August 2014]
[42] Trading Economics. 2014. South Africa GDP. [Online] Available at: http://www.tradingeconomics.com/south-africa/gdp [Accessed 23 April 2014]
[43] Tomlinson, R., Abrahams, G. & Gildenhuys, B., 2003. The Changing Nature of South African Housing Demand. South Africa: Mega-Tech.
[44] Viezer, T.W. 1998. Statistical strategies for real estate portfolio diversification. Doctoral Dissertation, Ohio State University, Columbus, OH.
[45] Viezer, T.W. 1999. Econometric integration of real estate’s space and capital markets. Journal of RealEstate Research, Vol. 18, no. 3, pp. 503-509-19.
[46] Weimer, A. M. 1996. Real Estate Decisions Are Different, Harvard Business Review, Vol. 44, pp. 105–12.
[47] Wixted, B., Yamano, N. & Webb, C., 2006. Input-Output Analysis in an Increasingly Globalised World: Applications of OECD’s Harmonized International Tables, OECD Science, Technology and Industry Working Papers, 2006/07, OECD Publishing.
The 3rd Human and Social Sciences at the Common ConferenceOctober, 5. - 9. 2015, www.hassacc.com
Economics, Business and Financing eISSN: 2453-6075, cdISSN: 1339-522X10.18638/hassacc.2015.3.1.185 - 60 - ISBN: 978-80-554-1124-8

The Conditions of Appropriate Measurement of the
Cost of Capital
Aneta Michalak
Faculty of Organization and Management
Silesian University of Technology
Zabrze, Poland
Abstract— Each economic activity is accompanied by capital. It is
necessary in the moment of establishment of a company,
conducting the operational and investment activity and even
during liquidation. Capital may take various forms and come
from different sources. However, it is never free of charge.
Therefore, calculating the cost of capital is a very important
process in the activity of each company. The result of the
calculation plays a vital role in the economic account of each
economic activity. For this reason, the appropriate measurement
of the cost of capital is still a relevant and up-to-date issue. The
objective of research undertaken in this paper is to analyze the
conditions of the calculation process for the cost of capital along
with the indication of some general standards and problems
occurring in this process.
Keywords- cost of capital, WACC, capital structure
I. INTRODUCTION
Capital is an indispensable element of every economic activity. It is engaged within the company as early as in the moment of founding it, it accompanies all the phases of its activity until its liquidation. Capital may take various forms and come from various sources. However, it is never free of charge. Therefore, the calculation of the cost of capital is an extremely important process in the activity of any company. The result of this calculation in the form of weighted average cost of capital plays a key role in the economic account of every economic activity, it is the parameter affecting the company value, evaluation of investment undertakings and many other important economic phenomena occurring inside the company. This is why the correct measurement of the cost of capital is an important and current topic. The objective of the research undertaken in this paper is to analyze the conditions of the process of calculating the cost of capital with the indication of the particular general standards that are applicable in the procedure of measuring the cost of capital and emphasizing the problems appearing in this process. In specific, the measurement of the weighted average cost of capital was brought to attention as well as the correct recognition of its components, the use of proper weights of the individual types of capitals involved in the procedure of measuring the cost of capital, taking into consideration the correct capital structure and the problem of tax shield. The paper is of theoretical character. Among the basic methods used in the research process, the analysis of literature is adopted. The results of the analysis were then compared and
generalized. The research process was enriched by adding the synthesis which was used to draw the final conclusions.
II. GENERAL ASSUMPTIONS OF CALCULATING THE COST OF
CAPITAL
The cost of capital is a broadly and multi-dimensionally defined category. There is a number of various approaches to the methodology of its calculation. All of them come down to the general rule that both the providers of debt capital (creditors), as well as providers of equity (shareholders, stakeholders), expect compensation which will correspond to the opportunity cost, related to investing capital in the given company instead of a different undertaking with a similar risk. Therefore, the estimation of the cost of capital relies on the separate calculation of the opportunity cost for the individual sources of debt capital and equity as well as on the calculation, on their basis, of the weighted average cost of capital [1]. The calculation of the cost of capital is tied to several problems and is the subject of many controversies in the scientific circles. The most important difficulties, which are mentioned in numerous papers and are emphasized in the economic practice are, among others: the problem of averaging the costs of individual sources of capital and the determination of the share of the particular sources in the capital structure as well as the problem of the risk of receiving payments by the capital-providers (the capital-providers, aware of the possibility of not receiving payments, demand additional risk premium [2], which affects the cost of capital). In relation to the occurring problems one may formulate certain recommendations regarding the rules that should be used in the process of calculating the cost of capital. Among the most important ones there are:
taking into consideration the weighted average, correctly included, costs of all sources of capital,
the use of correct weights for the individual types of capital,
taking into consideration the proper capital structure,
taking into consideration the tax shield.
III. WEIGHTED AVERAGE COST OF CAPITAL
The basic calculation rule of the cost of capital is the inclusion of properly recognized costs of all capital sources. The cost of capital in a company is generally expressed as WACC – Weighted Average Cost of Capital. In order to
The 3rd Human and Social Sciences at the Common ConferenceOctober, 5. - 9. 2015, www.hassacc.com
Economics, Business and Financing eISSN: 2453-6075, cdISSN: 1339-522X10.18638/hassacc.2015.3.1.178 - 61 - ISBN: 978-80-554-1124-8

determine it, one should indicate the cost of capital coming from the individual sources engaged in the company, e.g. the cost of shareholder‟s equity, cost of bank loans, cost of capital obtained from bonds sale etc. Each of the capital types undergoes a different evaluation depending on the way of determining the benefits for the capital provider, tax solutions etc.
Next the cost of capital is „weighted‟ by the share of the
particular sources in the capital structure. In a general form, the weighted average cost of capital may be written as the following formula [3][4]:
i
n
i
ikwWACC
1
(1)
where:
wi – i-number of the sources of capital,
Ki – cost of capital coming from the source of i-number,
n – number of capital sources.
This formula is also presented in a more general form that includes the cost of equity, obtained from the common and preferred stock issuance as well as the cost of debt capital [5]:
WACC = wdkd(1-T) + wpkp+ weke (2)
where:
wd – debt capital,
wp – capital from preferred stock issuance,
wd – capital from common stock issuance,
kd – cost of debt capital,
kp – cost of capital from preferred stock,
ke – cost of equity from common stock.
In practice, the formula above may be even more extended as debt capital mostly consists of a greater number of debt instruments. It should be emphasized that the liabilities free of interest, such as trade payables, should be excluded from WACC calculation because they do not constitute the interest-bearing debt. Indeed, some free of interest liabilities are connected with the particular cost of capital but it is expressed in the price of the goods and services purchased and manifests in the operational costs and cash flow. A separation of the costs concealed in this way, tied to trade payables, from the operational costs is a complex and time-consuming task and does not contribute to the improvement of the cost of capital valuation [6].
IV. THE ISSUE OF DETERMINING THE PROPER WEIGHTS FOR
THE COMPONENTS OF THE CAPITAL STRUCTURE
Another issue that needs to be solved in the process of calculating the cost of capital is to determine the proper weights of individual components of capital. In the subject literature one may observe two threads relating to the way of recognizing capital for the needs of the defining the capital structure and the calculation of its cost. It is the concept of the book value of capital which opposes the concept of the market value.
The book value of capital comes from the balance sheet and, depending on the approach, it may correspond to the value of all liabilities or the sum of equity and the interest-bearing parts of debt capital. On the other hand, the market value of capital is calculated with the use of the methodology of evaluating the securities on the capital market [7]. It can be determined with relative ease in a situation when the securities issued by the company are subject to market trade. In such case the market value of equity is determined on the market by the product of the share price and the number of shares issued. A similar solution can be used in case of bonds that are subject to market trade. In case of enterprises where the securities are not subject to market trade, the capital value is often determined based on the book value. In terms of long-term bonds or short-term debt securities the methodology of market evaluation based on the determination of the current value of future cash flow related to a given instrument can be used. The market value of the short-term debt capital is usually equal to its book value [8].
Nevertheless, it has to be emphasized that while the value of the debt according to the book data does not have to be fundamentally different from the actual market value, the actual value of equity can differ significantly from the book value [9]. If the company is not listed on the stock market and there is no possibility of learning the market value of shares, then apart from using the market value of equity, one may use the solution requiring subtracting the market value of debt capital from the company value, calculated using the selected method.
There are many arguments for the use of both the first as well as the other approach. In favor of using the market values in order to determine the capital structure and to calculate its cost is the fact that, ultimately, the company value is verified on the capital market as well as the fact that the capital can be acquired by the company in the way of selling securities at market, not nominal, prices. Furthermore, the market values reflect the actual economic claims of each of the capital providers, which in many cases are not reflected in the book values [10]. The arguments also arise that postulate using the book value of capital. They emphasize that the market value is hard to determine and the book values can always be accessed in the company balance sheet. Moreover, other arguments appear that the market value is subjected to high fluctuations under the influence of changes of the situation on the capital market, while the book value is more stable and can be a better reference point. Both methods have their supporters and opponents. One should take into consideration the fact that using either method depends mostly on the purpose of the analysis performed [11]. Determining the weights by the use of market value is suggested when the calculation of the cost of capital is supposed to assess the effectiveness of future investments. This is because the market value reflects the expectations of the creditors and owners towards the company and its development.
V. DETERMINATION OF THE CAPITAL STRUCTURE
The next issue that has to be solved is the problem of taking into consideration the current or target capital structure. The current capital structure of the company does not have to be the
The 3rd Human and Social Sciences at the Common ConferenceOctober, 5. - 9. 2015, www.hassacc.com
Economics, Business and Financing eISSN: 2453-6075, cdISSN: 1339-522X10.18638/hassacc.2015.3.1.178 - 62 - ISBN: 978-80-554-1124-8

same as the structure that will appear in the future. The arguments in favor of using the target capital structure are related to the use of the cost of capital in financial predictions. The cost of capital is a parameter there, appearing in the future periods e.g. as a discount rate. Additionally, in some situation the use of the target capital structure instead of the current one makes it possible to avoid the so-called „vicious circle‟ appearing in the process of calculating WACC based on the market values. It is related to the fact that in order to determine WACC, the weights based on market values of given capitals are necessary, but those weights cannot be learned without prior knowledge regarding the market value of those capitals. Meanwhile, determining the market value of equity requires discounting the expected free cash flow using WACC. The „vicious circle‟ means that it is impossible to determine the value of WACC without the knowledge about the market value of equity and, at the same time, it is impossible to learn the market value of equity without the knowledge of WACC. In this situation we have a cyclic reference. This problem can be resolved in three ways:
an iterative validation of the weights,
determining the target capital structure, not changing along with the change of the company value,
assuming the average capital structure of the comparable companies.
In the method of iterative validation of the weights used to calculate the WACC, the starting point is the preliminary estimation of the market value of equity and the determination of its share in the capital structure (w0). As the initial value of equity one can take its book value. As the next step the WACC is calculated. Then, using the calculated WACC, the estimated cash flows are discounted in order to obtain the value of the enterprise. From this value the values of debt and preference capital need to be subtracted. In this way the estimated value of equity and its estimated weight (w1) is calculated. The weight calculated in such way is used to calculate the new value of the weight (w2), which is equal to the sum of the values of the initial weight (w0) and the half of the difference between the estimated weight (w1) and the initial weight (w0), according to the formula [12]
:
w2=w0+0.5*(w1-w0) (3)
Then when using new weights, the WACC, the value of the enterprise and the value of debt capital need to be calculated again. The calculations are repeated until the moment in which the change of the estimated value of equity is lower than the assumed value, e.g. 1 PLN. In the moment when the iteration is interrupted, the WACC, value of the enterprise and the value of equity are determined.
The second way of solving the problem of the „vicious circle‟ is based on the determination of the target capital structure that does not change with the change of the company value. The downside of this method is a large subjectivity of the situation‟s assessment.
The third way of avoiding the „vicious circle‟ is tied to the determination of the weights of individual capitals based on the
average capital structure of comparable enterprises. The downside of this solution is the possibility of a high discrepancy between the capital structure in the examined company and comparable companies. Often the enterprises from the same branch of industry adopt different financial strategies. In the subject literature one can also encounter the suggestions for combining the various methods leading to the determination of the capital structure. For example, the estimation of the s capital structure based on the market value is recommended as well as comparing it to the structure of other enterprises in the same branch of industry [13]
.
VI. THE TAX SHIELD PHENOMENON
The next recommendation concerning the cost of capital is to include the corporate tax rate. It results from the conditions of Common Consolidated Corporate Tax Base – CCCTB [14]
in the European Union, according to which the interest rates on loans and credits capitalized or calculated and paid are assumed to be the tax deductible expenses in the moment of their capitalization or payment, made in compliance with the agreement conditions concluded between the parties. Additionally, the tax base for the corporate tax may be decreased in the result of bearing other costs than the interests, connected with obtaining the capital in a form of loans and credits. Here the expenses connected with processing fee, bank charges, documentation preparation, determining mortgage etc. are meant. This type of costs is included in the tax deductible expenses in the moment of their settlement (they are not divided in time in the way as the interest payments are). The inclusion of both, interest and additional costs provided a picture of a complete tax shield and allows calculating the effective interest rate on debt capital.
For the subjects that in the period of servicing debt capital do not pay tax (because they bear loss, for instance), the cost of debt is not decreased (there is no gross income being the tax base and in consequence, the amount of interest cannot be deducted), so the tax shield does not occur. In a situation when the company‟s loss takes place in one year only, and in the subsequent years the company achieves a positive financial result, this income is decreased by the amount of the loss previously borne, within the next five years. Additionally, the amount of decrease in any of the years cannot exceed the 50% of the loss amount [15]. In such situation the share of interest may be ascribed to the loss and then amend the cost of debt.
In case of the cost of equity the tax deductible expense, that could affect the company‟s tax base directly, does not occur. However, some issues are raised in this context that in the calculations of the cost of equity there should be dividend and capital gains tax rate included, obtained by the equity providers. The statements are formed against these arguments that the dividend and capital gains tax rate charges the capital providers, so it has influence on their return rate and not directly on the company‟s cost of capital. Therefore, it is not advised to include it in the calculation of the cost of capital [16].
VII. CONCLUSIONS
The problem of the calculation of the cost of capital is extremely complex. In the hereby paper the problems are
The 3rd Human and Social Sciences at the Common ConferenceOctober, 5. - 9. 2015, www.hassacc.com
Economics, Business and Financing eISSN: 2453-6075, cdISSN: 1339-522X10.18638/hassacc.2015.3.1.178 - 63 - ISBN: 978-80-554-1124-8

presented, connected with the use of a general formula of the weighted average cost of capital. The analysis of these problems proves that the result of the calculation of the cost of capital is affected by the arbitral decisions of financial managers who conduct the calculation. The application of an easy, general formula, as it may seem, of the weighted average cost of capital, bears the necessity of making a number of decisions concerning the correct recognition of the costs of all capital sources, using the proper weights, including the adequate capital structure or correct inclusion of the tax shield. Each decision, made in relation to these elements, affects the calculation result obtained.
REFERENCES
[1] K. Byrka-Kita, “Koszty kapitału – obszary zastosowania a warunki poprawnego pomiaru,” in Rozwój i funkcjonowanie przedsiębiorstw, Zeszyty Naukowe, no 446, Szczecin: Wyd. Naukowe Uniwersytetu Szczecińskiego, 2007, p. 117.
[2] I. Jonek-Kowalska, “Risk, profitability and value of the leading steel producers on the world capital markets,” Metalurgija, vol. 54, iss. 1, pp. 273-27, 2015.
[3] J.C. Groth and R.C. Anderson, “The cost of capital: perspectives for managers,” Management Decisions, no. 6, pp. 474-482, 1997
[4] T. Jajuga and T. Słoński, Finanse spółek. Długoterminowe decyzje finansowe, Wroclaw: Wydawnictwo Akademii Ekonomicznej im. O. Langego we Wrocławiu, 1997, p. 149
[5] E.F. Brigham and L.C. Gapenski, Zarządzanie finansami, t. 1, Warsaw: PWE, 2000, p. 238.
[6] T. Copeland, T. Koller and J. Murrin, Wycena, mierzenie i kształtowanie wartości firm, Warsaw: WIG Press, 1997, p. 230.
[7] I. Jonek-Kowalska and A. Gorczyńska, “Międzynarodowe rynki kapitałowe jako źródło finansowania podmiotów gospodarczych w dobie gospodarki globalnej,” Zarządzanie i Edukacja, no. 76/77, pp. 113-128, 2011.
[8] A. Duliniec, Struktura i koszt kapitału w przedsiębiorstwie, Warsaw: Wyd. PWN, 2001, p. 19.
[9] A. Wierzbicki, “Porównanie metody wyceny przedsiębiorstwa wykorzystującej średni wazony koszt kapitału z metodą skorygowanej wartości bieżącej,” in Zarządzanie Finansami firm – teoria i praktyka, Prace Naukowe no 974 Akademii Ekonomicznej we Wrocławiu, Wroclaw : Wyd. AE we Wrocławiu, 2003, p. 307.
[10] R.J. Grabowski and S.P. Pratt, Cost of capital: applications and examples, New Jersey: John Wiley and Sons, 2008, p. 6.
[11] E.A. Helfert, Techniki analizy finansowej, Warsaw: Polskie Wydawnictwo Ekonomiczne, 2004, p. 400.
[12] A. Michalak, “Krytyczne refleksje nad problemem zastosowania modelu CAPM w wycenie kosztu kapitału własnego,” Studia i Prace Kolegium Zarządzania i Finansów, Zeszyt Naukowy no. 115, Warsaw: Szkoła Główna Handlowa, pp. 113-125, 2012.
[13] A. Michalak, “Strategie finansowania przedsiębiorstw w branżach kapitałochłonnych na przykładzie polskich i światowych przedsiębiorstw górniczych,” Zarządzanie i Finanse – Journal of Management and Finance, Vol. 11, No. 1, Part 4, pp. 331-346, March 2013.
[14] Council Directive on a Common Consolidated Corporate Tax Based, Brussels, (COM), 121/4, 2011/0058 (CNS), 2011.
[15] J. Iwin-Garzyńska, Szkice o kapitale i podatkach w istocie nauki finansów przedsiebiorstw, Warsaw: Difin, 2010, p. 118.
[16] A. Michalak, “Problems of capital categorization in economic sciences and economic practice,” in Aktuálne problemy podnikovej sfery 2013, S. Majtan Ed., Bratislava: Vyd. EKONOM, pp. 380-384, 2013.
The 3rd Human and Social Sciences at the Common ConferenceOctober, 5. - 9. 2015, www.hassacc.com
Economics, Business and Financing eISSN: 2453-6075, cdISSN: 1339-522X10.18638/hassacc.2015.3.1.178 - 64 - ISBN: 978-80-554-1124-8

The 2008 Economic Recession Impact on the Residential Real Estate Market
Elizabeth Musvoto
MSc (Real Estate)
Department of Construction Economics, University of
Pretoria, South Africa
*Douw G. B. Boshoff PhD
Senior Lecturer
Department of Construction Economics,
University of Pretoria, South Africa
+2712 420 3781, +2783 287 2639,
*Corresponding author
Abstract—This paper discusses the effects of the changes brought
about by the move from an asset price boom into a period of
weak growth. The study investigates the impact of the economic
recession in the South African residential real estate sector.
Variables that measure the effects of the economic recession were
identified as the number of building plans passed, the value of
mortgage applications, township establishment applications
approved, and construction work delays. These variables were
regressed against various economic indicators. The study
provides insight as to how the monetary policies in a country can
reduce the effects that the changes in the economic cycle have on
the residential property market, and the relationship between the
economic cycles, the real estate cycles and the activities in the
residential construction industry.
Keywords: Economic recession, residential real estate, housing
economics
I. INTRODUCTION
Real estate has historically been viewed as a safe investment by homeowners and other investors. However, over the past years, real estate markets have been characterised by phases of boom and bust cycles. Real estate markets, like any other commodity markets, are sensitive to movements in economic conditions. Mueller (2002: 115) asserts that many economists consider real estate cycles to be a mirror image of the economy. This implies that real estate prices, like any other commodity prices, are driven by general economic forces. A number of studies have shown that there is a positive and strong correlation between house prices and economic variables. Case and Shiller (1990) and Abraham and Hendershott (1996), found that house price movements are influenced by changes to macroeconomic factors such as construction costs, income growth, interest rates and unemployment. These factors control the demand and supply dynamics in the property market. This paper investigates the effects of the economic recession on the residential real estate market in South Africa.
II. CHARACTERISTICS OF THE ECONOMIC
RECESSION AND ITS EFFECTS ON THE RESIDENTIAL
PROPERTY PERFORMANCE
Economic factors have a major influence on the property market dynamics. Their impact can be found at the local, regional, national and international levels. Recent exploratory research investigating linkages between property and the economy discovered recurrent rental, construction and
investment cycles in the occupation, investment and development markets. Such cycles, irregular in timing and duration, are largely driven by economic performance (Nanthakumaran et al., 1997). Indeed, the close association between property and economic cycles, together with the inherent imperfections inhibiting the markets’ smooth and quick adjustment, result in swings in property cycles.
In South Africa, the Consumer Price Index (CPI) is a measure of consumer inflation. The CPI is calculated by Statistics South Africa every month, based on the prices of a "basket" of consumer goods and services (Statistics South Africa, 2015). The composition of the basket and the weighting of the different items are based on regular surveys of consumer buying preferences. The CPIX, which is defined as the CPI for metropolitan and other urban areas, excluding the interest cost on mortgage bonds, was the initial target measure for inflation-targeting purposes, and a primary measure that determines national interest rates (South African Reserve Bank, 2015). This variant of CPI was chosen because the headline or overall CPI is influenced directly by changes in the bank’s monetary policy. Moreover, the exclusion of only the interest rate payments on mortgages was to ensure a wide coverage of consumer items and to limit the effects of interest rates on inflation targets (South African Reserve Bank, 2015). From 2009, the CPI was published according to the Classification of Individual Consumption by Purpose (commonly known by its acronym COICOP). COICOP is the international standard for classification of household expenditure and consequently for the CPI (Statistics South Africa). The new CPI measure for all urban areas includes owners’ equivalent rent, not negatively related to interest rate changes.
A trend of worsening inflation affects the residential real estate market negatively. According to Mayes (1979:13), housing, like most other products, has demand largely dependent upon the number of purchasers, their financial ability to purchase, its price and the price of competing products. This suggests that in times of high inflation, the demand for housing is lower, due to the reduced financial ability of consumers and the possibility that consumers can look for alternative accommodation than to purchase houses. Tsatsaronis and Zhu (2004) point to the fact that in most cases, a house purchase requires external financing in the form of mortgages. Therefore, in times of high inflation mortgages are unaffordable due to high interest rates and reduced buying power, thereby reducing the number of possible buyers of
The 3rd Human and Social Sciences at the Common ConferenceOctober, 5. - 9. 2015, www.hassacc.com
Economics, Business and Financing eISSN: 2453-6075, cdISSN: 1339-522X10.18638/hassacc.2015.3.1.184 - 65 - ISBN: 978-80-554-1124-8

houses, consequently reducing the price of houses. Due to the inability of lenders to repay in times of inflation, it can also be deduced from this that worsening inflation also impacts negatively on the profitability of lenders and their ability to extend credit, thereby reducing the number of possible buyers and increasing the need for alternative accommodation. This causes a fall in the demand for houses, and consequently results in a depression in the price of houses.
A rise in unemployment has a negative impact on the residential real estate market. Unemployment affects the disposable income of individuals, because they will have no source of income, or very little disposable income. Consequently, this affects the ability of individuals to afford mortgages. Tsatsaronis and Zhu (2004) also assert that housing investment decisions depend, critically, on the availability, cost and flexibility of debt financing. Credit is only available to those with the ability to repay. This means that unemployed individuals are unable to afford credit. This does not only reduce demand for houses, but also depresses the price of houses.
During an economic downturn, the cost of borrowing money increases. This stems from the risk associated with borrowing, as the chances of returning the borrowed money are lower than usual. Prior to the 2008 international financial crisis, in the United States, low interest rates and large inflows of foreign funds created easy credit conditions, fuelling a housing construction boom and encouraging debt financed consumption (Case and Quigley, 2008). As house prices declined, the values of homes were worth less than the mortgage loan. This situation eroded the financial strength of the banking institutions, because defaults and losses on loans increased tremendously (Zingales, 2008). It can be noted that after such negligence in lending terms on the part of financial institutions, increasing the cost of borrowing money could address the situation.
An upward trend in interest rates affects the residential real estate market negatively. If interest rates become less attractive, the inflow of funds slows down, and consequently, financial institutions begin to lend a little less than expected. This leads to decrease in house prices, where the demand for housing would have dropped. According to Case & Quigley (2008), a national recession itself dampens demand in a state, but the combination of high interest rates and the recession causes the housing market to contract sharply. This has the effect of pushing house prices down. Tsatsaronis and Zhu (2004) also assert that inflation is a driver of house prices, because it has an impact on the cost of mortgage financing. This implies that higher inflation has a negative impact on house prices. Consequently, periods of high inflation should be expected to see a low demand for houses.
A decline in consumption affects the residential real estate market negatively. The demand for housing largely depends on the number of possible purchasers and their financial ability to purchase (Mayes, 1979:13). When households' asset values increase, households can be expected to spend more than they otherwise would have, either by withdrawing equity from assets or by saving less in other forms (Case & Quigley, 2008). Similarly, when households' asset values fall, this may lead to a
contraction in consumer spending. In this situation negative equity creates real problems, and borrowing becomes unattractive, as the majority of people with fewer resources cannot afford to pay off their mortgages. As mentioned before, housing constitutes a substantial proportion of household wealth, and therefore, the level of mortgage debt and interest rates associated with it determines the availability of disposable income. Thus, a reduction in disposable income leads to a decline in the demand of housing, which in turn affects the residential market negatively.
III. MEASURES OF THE IMPACT OF THE ECONOMIC
RECESSION ON THE RESIDENTIAL REAL ESTATE
MARKET
Tsatsaronis and Zhu (2004) identified these variables as the applications for township establishment, number of applications approved per period, trends in property sales and leasing data per period, mortgage applications per period, total value of mortgages per period, applications for building plans, and the construction work stoppages and delays reported.
A. Applications for building plans
Building plans passed are a clear indicator of future development prospects (Prinsloo and Prinsloo, 2004). The number of building plans passed is affected by the current and future demand for property. A continued contraction in the value of residential building plans passed is reflective of tough conditions in the residential property market, mainly due to interest rate increases, high house prices, stricter lending rules or decrease in disposable income. An increase in the value of building plans passed indicates a rise in the activities in the property market. This can be a result of a cut in interest rates, increased disposable income, and friendly lending rules by the financial institutions or the general attitude towards investment into the residential property market. The contraction in the value of mortgages passed is directly related to the value of houses completed, although the construction of new houses lags in the planning phase, and the increase in building plans approved can only be reflected in the next season. The graph below shows the relationship between the building application passed and the houses completed.
The 3rd Human and Social Sciences at the Common ConferenceOctober, 5. - 9. 2015, www.hassacc.com
Economics, Business and Financing eISSN: 2453-6075, cdISSN: 1339-522X10.18638/hassacc.2015.3.1.184 - 66 - ISBN: 978-80-554-1124-8

Figure 1. Comparison between buildings completed and house plans passed
Source: (Statistics South Africa)
B. The applications for Township establishment per period
Township establishment applications are a good indicator of development activities in the residential real estate market. The developer’s intentions follow what one would expect from the housing prices. A better economic outlook and a promising increase in housing demand and price will lead to an increase in the number of applications submitted. On the contrary, when the economic outlook is gloomy, the township establishment applications to be submitted are expected to be lower as developers are not expected to put viable schemes under pressure (Mayes, 1979:5). Planning applications react even more strongly than housing starts, but this is to be expected, since the investment involved is not necessarily so substantial.
C. The number of Township establishment applications
approved per period
The number of township establishment applications approved is directly related to the number of applications submitted. In an unfavourable economic climate, the applications approved can fall, as the number of applications submitted is low, whereas if the applications submitted are high, the number of applications approved will be high. However, the fall of applications granted can be expected under conditions of expansion, as applicants will tend to put forward less viable schemes under pressure (Mayes, 1979:55). This leads to a situation whereby the number of applications submitted is higher than the applications approved. This implies that the relationship between the applications submitted and applications approved can be reversed by town planning controls.
D. Total value of mortgages per period (monthly figures)
According to the Lecat et al. (2005), house prices affect both the supply and demand for mortgages. If house prices rise
faster than available resources, the size of the mortgage requirement mechanically increases. In South Africa, Prinsloo and Prinsloo (2004:148) noted that commercial banks increase or decrease their variable mortgage rate in response to what the South African Reserve Bank does to the interest rates. Fluctuations in the prices of property, frequently used as collateral for mortgages, affect the availability of the mortgages: higher collateral values reduce the risk in the event of defaults between lenders and borrowers, and encourage banks to lend more. Expectations of an increase in the value of collateral may cause banks to underestimate their risk exposure and, possibly, to display disaster myopic behaviour, which becomes increasingly pronounced the longer the bubble inflates (Cameron et al., 2006). In a highly competitive, innovative and liquid market, mortgage money is usually available to households that would not ordinarily have met underwriting standards. The result of that is usually an increase in default rates. In times of economic downturn, lenders increase denial rates for loans because they are no longer profitable to them. The demand for mortgage loans decreases and the supply of credit evaporates completely. Hoffman (2001) empirically suggests that there is a positive long run correlation between real credit to the private sector and house prices in most countries - impulse response analysis clearly shows a dynamic interaction between these two variables.
E. Construction work delays reported
The supply and demand of property is expected to be in a certain level of equilibrium. The building plans passed are an indicator of the general attitude towards investment into the residential market (Clark, 2006). The buildings plans passed are expected to be determined by the demand for housing. The general picture of the housing market is that there is some match in the number of houses during the beginning of construction (according to the building plans passed) and during the completion stage. When there is a sudden change in the economic outlook, for example, an economic downturn, the number of houses recorded during the initial construction phase does not pass to the completion stage. The factors that might cause delays in completing constructions at any stage might be as diverse as weather conditions, or the economic outlook.
IV. METHODOLOGY
A quantitative study was conducted, where secondary data was collected from different institutions. Quantitative study methodology can be broadly categorised as research that identifies characteristics of an observed phenomenon or exploring possible correlations among two or more phenomenon (Leedy and Ormrod, 2005).
The study was conducted by means of gathering secondary data on the variables that measure the impact of the economic downturn on the residential real estate market and the economic indicators identified in the literature review. In this study, data for each identified variable that measures the impact of the economic recession on the residential real estate market was collected for periods covering the economic growths and the economic recessions in South Africa. These periods covered 16 years, from 1995. In these 16 years, the periods of economic recession were noted and recorded between 2001 and 2002 and between 2008 and 2009,
0
500000
1000000
1500000
2000000
2500000
3000000
20
06/0
1
20
06/0
5
20
06/0
9
20
07/0
1
20
07/0
5
20
07/0
9
20
08/0
1
20
08/0
5
20
08/0
9
20
09/0
1
20
09/0
5
20
09/0
9
20
10/0
1
20
10/0
5
20
10/0
9hses < 80 sqm comp hses >= 80 sqm comp
flats&townhses comp hses < 80 sqm pssed
hses >= 80 sqm pssed flats&townhses pssed
The 3rd Human and Social Sciences at the Common ConferenceOctober, 5. - 9. 2015, www.hassacc.com
Economics, Business and Financing eISSN: 2453-6075, cdISSN: 1339-522X10.18638/hassacc.2015.3.1.184 - 67 - ISBN: 978-80-554-1124-8

respectively. The remaining 12 years covered periods of economic growth. Data for the economic variables was collected for the 12 years, covering periods of economic growth in South Africa (1
st quarter of 1995 to 2
nd quarter of
2001 and 1st quarter of 2003 to 3
rd quarter of 2008) and the
economic recession (3rd
quarter of 2001 to 4th quarter of 2002
and 4th
quarter of 2008 to 4th
quarter of 2009). 2010 was marked as a period of economic recovery in South Africa.
The methodological framework consists of two main principle elements, namely: selection of the variables that measure the impact of the economic recession on the residential real estate market and the economic variables; and the analysis of the variation of the economic variables and the variables that measure the impact of the economic downturn on the residential real estate market. The variables that were identified in the literature review and answered the study objectives where used in this study.
A. Choosing the variables: Variables that measure the impact
of the economic recession on the residential real estate
market
Variables that measure the effects of the economic recession on the residential real estate market were identified in the literature review as building plans passed per period, buildings completed per period, number of township establishment applications approved per period, mortgage applications per period, total value of mortgages and construction work delays.
The data was requested at national level from Statistics South Africa, the South African Reserve Bank, different selected property development and construction companies, and at metropolitan level, from the City of Tshwane Metropolitan Municipality.
B. Choosing the variables: Economic Indicators
The economic indicators were identified in the literature review as GDP, CPI, Interest rates, Unemployment rate, Consumption rate, PPI and Disposable Income. The data was requested at national level from the South African Reserve Bank.
V. ANALYSIS AND DISCUSSION
The primary objective of the quantitative study was to establish whether the 2001/2002 and 2008/9 economic recession had an effect on the residential real estate market in South Africa, by identifying variables that can measure the effects thereof. The variables that measure the effects of the economic downturn on the residential real estate market were used as variables selected as predictors and explanatory variables of the activities in the residential property market. The economic variables were used as indicators of the state of the economy. Thus the variables that measure the effects of the economic recession on the residential real estate market were correlated to the economic variables, and their contribution measured for the given time periods.
The variables that measure the effects of the economic recession on the residential real estate market were compared to the economic variables. This was done in order to establish the relationship between the variables that measure the effects
of the economic recession on the residential real estate market and the changes in the economic variables. For example, how does the value of mortgages react to a rise in interest rates? The changes recorded determined whether the economic recession impacted on the residential real estate market i.e. the activities relating to construction and the property market.
TABLE 1: CORRELATIONS OF THE VALUE OF BUILDING PLANS
PASSED AGAINST DISPOSABLE INCOME OF HOUSEHOLDS
TABLE 1a: ECONOMIC GROWTH: 1ST QUARTER OF 1995 TO 2ND
QUARTER OF 2001
Household’s
Disposable
Income
Value of building
plans passed: Res
<80m2
Pearson Correlation .780**
Sig. (2-tailed) .000
N 26
Value of building
plans passed: Res
equal to or more
than 80m2
Pearson Correlation .550**
Sig. (2-tailed) .004
N 26
Value of buildings
plans passed: Flats
& town houses
Pearson Correlation -.526**
Sig. (2-tailed) .006
N 26
TABLE 1b: ECONOMIC GROWTH: 1ST QUARTER OF 2003 TO 3RD
QUARTER OF 2008
Household’s
Disposable
Income
Value of building
plans passed: Res
<80m2
Pearson Correlation .827**
Sig. (2-tailed) .000
N 23
Value of building
plans passed: Res
equal to or more
than 80m2
Pearson Correlation .053
Sig. (2-tailed) .811
N 23
Value of buildings
plans passed: Flats
& t/houses
Pearson Correlation .787**
Sig. (2-tailed) .000
N 23
Table 1a shows that the value of building plans passed for ―houses less than 80 m
2‖ and ―houses greater or equal to 80
m2‖ shows a strong positive correlation of 0.780 and 0.550
respectively, indicating a direct relationship where the value of building plans passed increases with increasing household disposable income. The value of building plans passed for ―flats and townhouses‖ shows a strong negative correlation of -0.526 to household disposable income, indicating an inverse relationship, where the value of building plans passed decreases with an increase in household disposable income.
Table 1b above shows that the value of building plans passed for ―houses less than 80 m
2‖ and ―flats and townhouses‖
shows a strong positive correlation of 0.827 and 0.787 respectively, to household disposable income. This shows that the value of building plans passed increased with an increase in household disposable income, thereby having a direct
The 3rd Human and Social Sciences at the Common ConferenceOctober, 5. - 9. 2015, www.hassacc.com
Economics, Business and Financing eISSN: 2453-6075, cdISSN: 1339-522X10.18638/hassacc.2015.3.1.184 - 68 - ISBN: 978-80-554-1124-8

relationship. The value of building plans passed for ―houses greater or equal to 80 m
2‖ shows weak positive correlation of
0.053 to household disposable income. If disposable income increases, consumers can spend more on other goods, such as investing in property, thus increasing the demand for residential property.
Table 1c: ECONOMIC RECESSION: 3RD QUARTER OF 2001 TO
4TH QUARTER OF 2002
Household’s
Disposable
Income
Value of building
plans passed: Res
<80m2
Pearson Correlation .886*
Sig. (2-tailed) .019
N 6
Value of building
plans passed: Res
equal to or more
than 80m2
Pearson Correlation .896*
Sig. (2-tailed) .016
N 6
Value of buildings
plans passed: Flats
& t/houses
Pearson Correlation .656
Sig. (2-tailed) .157
N 6
TABLE 1d: ECONOMIC RECESSION: 4TH QUARTER OF 2008 TO
4TH QUARTER OF 2009
Household’s
Disposable
Income
Value of building
plans passed: Res
<80m2
Pearson Correlation .116
Sig. (2-tailed) .853
N 5
Value of building
plans passed: Res
equal to or more
than 80m2
Pearson Correlation .892*
Sig. (2-tailed) .042
N 5
Value of buildings
plans passed: Flats
& t/houses
Pearson Correlation -.928*
Sig. (2-tailed) .023
N 5
From Table 1c, the value of building plans passed for all
three categories of houses namely ―houses less than 80 m2‖,
―houses greater or equal to 80 m2‖ and ―flats and townhouses‖
shows a strong positive correlation of 0.886, 0.896 and 0.656 respectively, to household disposable income. This shows that during the economic recession, the value of building plans passed had a direct relationship with household disposable income.
From Table 1d above, the value of building plans passed for ―houses less than 80 m
2‖ shows a weak positive correlation
of 0.116 to household disposable income, indicating that there was a slight, almost negligible relationship between the two variables. The value of building plans passed for ―houses greater or equal to 80 m
2‖ shows a strong positive correlation
of 0.892 to household disposable income indicating a direct relationship between the variables. The value of building plans passed for ―flats and townhouses‖ shows a strong negative correlation of -0.928 to household disposable income, indicating an inverse relationship between the variables.
As consumers faced uncertainties in the employment sector, they resorted to saving rather than spending on durable goods, such as purchasing housing as the household disposable income shrank. The value of building plans passed for flats and townhouses had an inverse relationship with household disposable income, which could be attributed to consumer preference on renting flats or townhouses, thereby leading to their higher demand compared to other housing categories.
TABLE 2: CORRELATION OF THE VALUE OF BUILDING PLANS
PASSED AGAINST GDP
TABLE 2a: ECONOMIC GROWTH: 1ST QUARTER OF 1995 TO 2ND
QUARTER OF 2001
GDP at
market
prices
Value of building
plans passed: Res
<80m2
Pearson
Correlation .772
**
Sig. (2-tailed) .000
N 26
Value of building
plans passed: Res
equal to or more than
80m2
Pearson
Correlation .550
**
Sig. (2-tailed) .004
N 26
Value of buildings
plans passed: Flats &
t/houses
Pearson
Correlation -.521
**
Sig. (2-tailed) .006
N 26
TABLE 2b: ECONOMIC GROWTH: 1ST QUARTER OF 2003 TO 3RD
QUARTER OF 2008
GDP at
market
prices
Value of building
plans passed: Res
<80m2
Pearson
Correlation .845
**
Sig. (2-tailed) .000
N 23
Value of building
plans passed: Res
equal to or more than
80m2
Pearson
Correlation .013
Sig. (2-tailed) .953
N 23
Value of buildings
plans passed: Flats &
t/houses
Pearson
Correlation .787
**
Sig. (2-tailed) .000
N 23
Table 2a above indicates that the value of building plans passed for ―houses less than 80 m
2‖ and ―houses greater or
equal to 80 m2‖
shows a strong positive correlation to GDP of 0.772 and 0.550 respectively, indicating a direct relationship, where the value of building plans passed increases with an increase in GDP. The value of building plans passed for ―flats and townhouses‖ shows strong negative correlation of -0.521 to GDP, indicating an inverse relationship, where the value of building plans passed increases when GDP decrease.
The 3rd Human and Social Sciences at the Common ConferenceOctober, 5. - 9. 2015, www.hassacc.com
Economics, Business and Financing eISSN: 2453-6075, cdISSN: 1339-522X10.18638/hassacc.2015.3.1.184 - 69 - ISBN: 978-80-554-1124-8

Table 2b indicates that the value of building plans passed for ―houses less than 80 m
2‖ and ―flats and townhouses‖ shows
a strong positive correlation to GDP of 0.845 and 0.787 respectively, indicating a direct relationship with between the variables. The value of building plans passed for ―houses greater or equal to 80 m
2‖ shows a weak positive correlation of
0.013 to GDP, indicating a slight direct relationship between the variables.
The increase in the demand for and supply of houses is attributed to the change in GDP. GDP measures the overall economic activity in the country; therefore a change in real GDP is an indication of real economic growth, which leads to high business confidence. It can therefore be concluded that an increase in economic growth usually results in creation of employment, thereby increasing the disposable income of consumers, which can result in an increase in the demand for property. The inverse relationship between the values of building plans passed for flats and townhouses and GDP can be attributed to the choice of consumers in choosing to invest in the other two categories of housing.
Table 2c: ECONOMIC RECESSION: 3RD QUARTER OF 2001 TO
4TH QUARTER OF 2002
GDP at
market prices
Value of building
plans passed: Res
<80m2
Pearson
Correlation .848
*
Sig. (2-tailed) .033
N 6
Value of building
plans passed: Res
equal to or more than
80m2
Pearson
Correlation .955
**
Sig. (2-tailed) .003
N 6
Value of buildings
plans passed: Flats &
t/houses
Pearson
Correlation .835
*
Sig. (2-tailed) .039
N 6
Table 2d: ECONOMIC RECESSION: 4TH QUARTER OF 2002 TO
4TH QUARTER OF 2008
GDP at
market prices
Value of building
plans passed: Res
<80m2
Pearson
Correlation .380
Sig. (2-tailed) .528
N 5
Value of building
plans passed: Res
equal to or more than
80m2
Pearson
Correlation .394
Sig. (2-tailed) .512
N 5
Value of buildings
plans passed: Flats &
t/houses
Pearson
Correlation -.601
Sig. (2-tailed) .283
N 5
Table 2c above indicates that the value of building plans
passed for ―houses less than 80m2‖, ―houses greater or equal to
80m2‖ and ―flats and townhouses‖ shows a strong positive
correlation to GDP of 0.848, 0.955 and 0.835 respectively, indicating a direct relationship between GDP and the value of building plans passed for the three housing categories.
From Table 2d, the value of building plans passed for ―houses less than 80m
2‖ and ―houses greater or equal to 80m
2‖
shows a weak positive correlation to GDP of 0.380 and 0.194 respectively, indicating a slight direct relationship with the variables. The value of building plans passed for ―flats and townhouses‖ shows a strong negative correlation of -0.601 to GDP, indicating an inverse relationship between the variables.
During the economic recession, the decline in GDP dictated the demand for residential properties in all 3 housing categories. It shows that investing in residential property was avoided in an economically unfriendly environment, which could be attributed to the nervousness between the consumers and the banks.
TABLE 3: CORRELATION TABLES OF THE VALUE OF
BUILDINGS COMPLETED AGAINST HOUSEHOLD
DISPOSABLE INCOME TABLE 3a: ECONOMIC GROWTH: 1ST QUARTER OF 1995 TO 2ND
QUARTER OF 2001
Household’s
Disposable
Income
Value of buildings
completed: Res <80m2
Pearson
Correlation .630
**
Sig. (2-tailed) .001
N 26
Value of buildings
completed: Res equal
to or more than 80m2
Pearson
Correlation .208
Sig. (2-tailed) .308
N 26
Value of buildings
completed: Flats &
t/houses
Pearson
Correlation -.549
**
Sig. (2-tailed) .004
N 26
TABLE 3b: ECONOMIC GROWTH: 1ST QUARTER OF 2003 TO 3RD
QUARTER OF 2008
Household’s
Disposable
Income
Value of buildings
completed: Res <80m2
Pearson
Correlation .853
**
Sig. (2-tailed) .000
N 23
Value of buildings
completed: Res equal
to or more than 80m2
Pearson
Correlation .916
**
Sig. (2-tailed) .000
N 23
Value of buildings
completed: Flats &
t/houses
Pearson
Correlation .893
**
Sig. (2-tailed) .000
N 23
In Table 3a above, the value of buildings completed for
―houses less than 80m2‖ shows a strong positive correlation of
The 3rd Human and Social Sciences at the Common ConferenceOctober, 5. - 9. 2015, www.hassacc.com
Economics, Business and Financing eISSN: 2453-6075, cdISSN: 1339-522X10.18638/hassacc.2015.3.1.184 - 70 - ISBN: 978-80-554-1124-8

0.630 to household disposable income, indicating a direct relationship between the two variables. The value of buildings completed for ―houses greater or equal to 80m
2‖ shows a weak
positive correlation of 0.208 to household disposable income, indicating a slight direct relationship between the two variables. The value of buildings completed for ―flats and townhouses‖ shows a strong negative correlation of -0.549 to household disposable income indicating an inverse relationship between the variables.
From Table 3b, the value of buildings completed for ―houses less than 80m
2‖, ―houses greater or equal to 80m
2‖ and
―flats and townhouses‖ shows a strong positive correlation of 0.853, 0.916 and 0.893 respectively, to household disposable income, indicating a direct relationship between household disposable income and the value of building completed for all the three housing categories.
The trend indicated above shows that the value of buildings completed during the economic boom increased, because the economic climate did not impede the demand for housing. Where high volumes of houses were completed, it shows that cash-flow problems were not experienced that could have hindered the completion of the buildings. In cases of flats and townhouses, which are mostly constructed by developers, and where there was an inverse relationship to household disposable income, other factors such as low demand for that kind of property were in effect.
TABLE 3c: ECONOMIC RECESSION: 3RD QUARTER OF 2001 TO 4TH QUARTER OF 2002
Household’s
Disposable
Income
Value of buildings
completed: Res
<80m2
Pearson
Correlation .589
Sig. (2-tailed) .219
N 6
Value of buildings
completed: Res equal
to or more than 80m2
Pearson
Correlation .755
Sig. (2-tailed) .082
N 6
Value of buildings
completed: Flats &
t/houses
Pearson
Correlation .574
Sig. (2-tailed) .234
N 6
TABLE 3d: ECONOMIC RECESSION: 4TH QUARTER OF 2008 TO 4TH
QUARTER OF 2009
Household’s
Disposable
Income
Value of buildings
completed: Res
<80m2
Pearson
Correlation .814
Sig. (2-tailed) .093
N 5
Value of buildings
completed: Res equal
to or more than 80m2
Pearson
Correlation .302
Sig. (2-tailed) .622
N 5
Value of buildings
completed: Flats &
t/houses
Pearson
Correlation -.182
Sig. (2-tailed) .770
N 5
In Table 3c above, the value of buildings completed for ―houses less than 80m
2‖, ―houses greater or equal to 80m
2‖ and
―flats and townhouses‖, shows a strong positive correlation of 0.589, 0.755 and 0.574, with household disposable income, indicating a direct relationship between household disposable income and the three housing categories.
The value of buildings completed for ―houses less than 80m
2‖ and ―houses greater or equal to 80m
2‖ shows a weak
positive correlation of 0.116 and 0.302 respectively, with household disposable income indicating a slight direct relationship between the variables (see Table 3d). The value of buildings completed for ―flats and townhouses‖ shows a weak negative correlation -0.182 with household disposable income, indicating an inverse relationship between the variables.
The 2001 to 2002 economic recession saw a direct relationship between household disposable income and the houses completed in the three housing categories, indicating that there was a delay in the completing houses due to cash flow problems initiated by a decline in disposable income. The 2008 to 2009 disposable income did not play a major role in the value of buildings completed since the relationship was weak. This can be attributed to other factors, such as the choices consumers made despite economic hardships.
TABLE 4: CORRELATIONS OF THE VALUE OF BUILDINGS
COMPLETED AGAINST GDP
TABLE 4a: ECONOMIC GROWTH: 1ST QUARTER OF 1995 TO 2ND QUARTER OF 2001
GDP at
market prices
Value of buildings
completed: Res
<80m2
Pearson
Correlation .624
**
Sig. (2-tailed) .001
N 26
Value of buildings
completed: Res equal
to or more than 80m2
Pearson
Correlation .262
Sig. (2-tailed) .196
N 26
Value of buildings
completed: Flats &
t/houses
Pearson
Correlation -.562
**
Sig. (2-tailed) .003
N 26
TABLE 4b: ECONOMIC GROWTH: 1st QUARTER OF 2003 TO 3rd
QUARTER OF 2008
GDP at
market prices
Value of buildings
completed: Res
<80m2
Pearson
Correlation .868
**
Sig. (2-tailed) .000
N 23
Value of buildings
completed: Res equal
to or more than 80m2
Pearson
Correlation .924
**
Sig. (2-tailed) .000
The 3rd Human and Social Sciences at the Common ConferenceOctober, 5. - 9. 2015, www.hassacc.com
Economics, Business and Financing eISSN: 2453-6075, cdISSN: 1339-522X10.18638/hassacc.2015.3.1.184 - 71 - ISBN: 978-80-554-1124-8

N 23
Value of buildings
completed: Flats &
t/houses
Pearson
Correlation .882
**
Sig. (2-tailed) .000
N 23
Table 4a above shows that the value of buildings completed
for ―houses less than 80m2‖ shows a strong positive correlation
of 0.624 with GDP indicating a direct relationship between the variables. The value of buildings completed for ―houses greater or equal to 80m
2‖ shows a weak positive correlation of 0.262
with GDP indicating a slight direct relationship between the variables. The value of buildings completed for ―flats and townhouses‖ shows a strong negative correlation with GDP of -0.562, indicating an inverse relationship between the variables.
From Table 4b above, the value of buildings completed for ―houses less than 80m
2‖, ―houses greater or equal to 80m
2‖ and
―flats and townhouses‖ shows a strong positive correlation with GDP of 0.868, 0.924 and 0.882 respectively, indicating a direct relationship GDP has with the value of buildings completed in each housing category.
During the period of economic growth, the value of buildings completed (where construction started before the 1
st
quarter of 1995 or the 1st quarter of 2003 and during these
periods) continued to rise as GDP increased, indicating that when the economic climate is stable and favorable, construction activities will continue without interruption.
TABLE 4c: ECONOMIC RECESSION: 3RD QUARTER OF 2001 TO 4TH
QUARTER OF 2002
GDP at
market prices
Value of buildings
completed: Res
<80m2
Pearson
Correlation .707
Sig. (2-tailed) .116
N 6
Value of buildings
completed: Res equal
to or more than 80m2
Pearson
Correlation .932
**
Sig. (2-tailed) .007
N 6
Value of buildings
completed: Flats &
t/houses
Pearson
Correlation .724
Sig. (2-tailed) .104
N 6
TABLE 4d: ECONOMIC RECESSION: 4TH QUARTER OF 2008 TO 4TH
QUARTER OF 2009
GDP at
market prices
Value of buildings
completed: Res
<80m2
Pearson
Correlation .752
Sig. (2-tailed) .142
N 5
Value of buildings
completed: Res equal
to or more than 80m2
Pearson
Correlation .055
Sig. (2-tailed) .930
N 5
Value of buildings
completed: Flats &
t/houses
Pearson
Correlation -.548
Sig. (2-tailed) .339
N 5
From Table 4c above, the value of buildings completed for ―houses less than 80m
2‖, ―houses greater or equal to 80m
2‖ and
―flats and townhouses‖ shows a strong positive correlation with GDP of 0.707, 0.932 and 0.724 respectively, indicating a direct relationship between GDP and the value of buildings completed for all the three categories of housing.
From Table 4d, the value of buildings completed for ―houses less than 80m
2‖ shows a strong positive correlation
with GDP of 0.752 indicating a direct relationship between the variables. The value of buildings completed for ―houses greater or equal to 80m
2‖ shows a weak positive correlation of 0.055
with GDP indicating a slight direct relationship with the variables. The value of buildings completed for ―flats and townhouse‖ shows a strong negative correlation of -0.548 with GDP, indicating an inverse relationship between the variables.
During the first period of the economic recession (3rd
quarter of 2001 to 4
th quarter of 2002), changes in GDP
affected the completion of buildings under construction maybe due to cash-flow problems. All the categories of houses were affected mainly because of the strength of the economy during that time led to a low demand in housing. The 2008 to 2009 economic recession saw only two categories of housing being responsive to changes in GDP, while flats and townhouses following their own pattern were not affected by the high construction costs associated with the recession.
TABLE 5: CORRELATION TABLES FOR TOWNSHIP ESTABLISHMENT APPLICATIONS AND PPI
TABLE 5a: ECONOMIC GROWTH: 1ST QUARTER OF 1995 TO 2ND
QUARTER OF 2001
PPI (%)
Township
Establishment
applications
approved
Pearson
Correlation .520
**
Sig. (2-tailed) .006
N 26
TABLE 5b: ECONOMIC GROWTH: 1ST QUARTER OF 2003 TO 3RD
QUARTER OF 2008
PPI (%)
Township
Establishment
applications
approved
Pearson
Correlation -.378
Sig. (2-tailed) .075
N 23
From Table 5a, the township establishment applications
approved by the City of Tshwane shows a strong positive correlation of 0.520 with PPI indicating a direct relationship between the variables. From Table 5b, the township establishment applications approved by the City of Tshwane shows a weak negative correlation of -0.378 with PPI, indicating an inverse relationship between the variables.
The 3rd Human and Social Sciences at the Common ConferenceOctober, 5. - 9. 2015, www.hassacc.com
Economics, Business and Financing eISSN: 2453-6075, cdISSN: 1339-522X10.18638/hassacc.2015.3.1.184 - 72 - ISBN: 978-80-554-1124-8

Producer Price Index is weighted index of prices measured at producer level, and shows trends within the wholesale markets, manufacturing industries and commodity markets. It helps investors to predict the Consumer Price Index. During the economic growth, PPI influenced the investment potential in residential property since the future economic outlook would be characterised by low CPI, thereby boosting the demand for housing at the planning phase.
From Table 5c, township establishment applications approved by the City of Tshwane shows a strong positive correlation of 0.632 with PPI, indicating a direct relationship between the variables.
TABLE 5c: ECONOMIC RECESSION: 3RD QUARTER OF 2001 TO 4TH
QUARTER OF 2002
PPI (%)
Township
Establishment
applications
approved
Pearson
Correlation .632
Sig. (2-tailed) .178
N 6
TABLE 5d: ECONOMIC RECESSION: 4TH QUARTER OF 2008 TO 4TH
QUARTER OF 2009
PPI (%)
Township
Establishment
applications
approved
Pearson
Correlation -.281
Sig. (2-tailed) .647
N 5
Table 5d shows that township establishment applications
approved by the City of Tshwane shows a weak negative correlation of -0.281 with PPI indicating an inverse relationship between the variables. Since PPI determines CPI, the economic climate showed that CPI was going to increase, thereby shrinking the disposable income of consumers, leading to a decline in future prospects of investing in residential property.
TABLE 6: CORRELATIONS OF TOWNSHIP ESTABLISHMENT
APPLICATIONS APPROVED AGAINST CPI
TABLE 6a: ECONOMIC GROWTH: 1ST QUARTER OF 1995 TO 2ND QUARTER OF 2001
CPI
Township
Establishment
applications
approved
Pearson
Correlation .301
Sig. (2-tailed) .136
N 26
TABLE 6b: ECONOMIC GROWTH: 1ST QUARTER OF 2003 TO 3RD
QUARTER OF 2008
CPI
Township
Establishment
applications
approved
Pearson
Correlation -.251
Sig. (2-tailed) .248
N 23
TABLE 6c: ECONOMIC RECESSION: 3RD QUARTER OF 2001 TO 4TH QUARTER OF 2002
CPI
Township
Establishment
applications
approved
Pearson
Correlation .606
Sig. (2-tailed) .202
N 6
TABLE 6d: ECONOMIC RECESSION: 4TH QUARTER OF 2008 TO 4TH
QUARTER OF 2009
CPI
Township
Establishment
applications
approved
Pearson
Correlation .701
Sig. (2-tailed) .103
N 5
From Table 6c and 6d above, township establishment
applications approved by the City of Tshwane shows a strong positive correlation of 0.606 and 0.701 respectively to CPI indicating a direct relationship between the variables. When CPI increases, commodities become more expensive; consumers use more money and have less to spend on other goods such as purchasing houses. The demand of residential property decreases leading to a decrease in intention to build (applications submitted to the city council).
TABLE 7: CORRELATIONS OF TOWNSHIP ESTABLISHMENT
APPLICATIONS APPROVED AGAINST PRIME
INTEREST RATES TABLE 7a: ECONOMIC GROWTH: 1ST QUARTER OF 1995 TO 2ND
QUARTER OF 2001
Prime interest
rate
Township
Establishment
applications
approved
Pearson
Correlation -.650
Sig. (2-tailed) .162
N 6
TABLE 7b: ECONOMIC GROWTH: 1ST QUARTER OF 2003 TO 3RD
QUARTER OF 2008
Prime interest
rate
Township
Establishment
applications
approved
Pearson
Correlation -.790
**
Sig. (2-tailed) .000
N 23
From Table 7a above, township establishment applications
approved by the City of Tshwane shows a strong negative correlation of -0.650 to prime interest rates, indicating an inverse relationship between the variables. From Table 7b above, township establishment applications approved by the City of Tshwane shows a strong negative correlation of -0.790 to prime interest rates indicating an inverse relationship between the variables.
When prime interest rates are low, the cost of borrowing is low and the repayment of loans becomes cheaper, thereby boosting the investment confidence. If investment confidence
The 3rd Human and Social Sciences at the Common ConferenceOctober, 5. - 9. 2015, www.hassacc.com
Economics, Business and Financing eISSN: 2453-6075, cdISSN: 1339-522X10.18638/hassacc.2015.3.1.184 - 73 - ISBN: 978-80-554-1124-8

is high due to economic certainty, then there will be more investment opportunities, which will influence consumer spending, thereby influencing consumer demand for residential properties.
TABLE 7c: ECONOMIC RECESSION: 3rd quarter of 2001 to 4th quarter of
2002
Prime interest
rate
Township
Establishment
applications
approved
Pearson
Correlation -.650
Sig. (2-tailed) .162
N 6
TABLE 7d: ECONOMIC RECESSION: 4TH QUARTER OF 2008 TO 4TH
QUARTER OF 2009
Prime interest
rate
Township
Establishment
applications
approved
Pearson
Correlation -.195
Sig. (2-tailed) .753
N 5
From Table 7c, township establishment applications
approved by the City of Tshwane shows a strong negative correlation of -0.650 to prime interest rates indicating an inverse relationship between the variables, while Table 7d shows that the township establishment applications approved by the City of Tshwane shows a weak negative correlation of -0.195 to prime interest rates, indicating an inverse relationship between the variables.
An increase in prime interest rates increases the cost of borrowing, as loan repayments become more expensive. Therefore, high interest rates results in high mortgage repayments, reducing affordability, and resulting in the demand for property.
TABLE 8: THE CORRELATIONS OF MORTGAGE LOAN
ADVANCES AND RE-ADVANCES FOR RESIDENTIAL AND FLATS AGAINST DISPOSABLE INCOME
TABLE 8a: ECONOMIC GROWTH: 1ST QUARTER OF 1995 TO 2ND QUARTER OF 2001
Household’s
Disposable
Income
Mortgage loan
advances and re-
advances for
residential and flats
Pearson
Correlation .713
**
Sig. (2-tailed) .000
N 26
TABLE 8b: ECONOMIC GROWTH: FIRST QUARTER OF 2003 TO 3RD
QUARTER OF 2008
Household’s
Disposable
Income
Mortgage loan
advances and re-
Pearson
Correlation .797
**
advances for
residential and flats Sig. (2-tailed) .000
N 23
From Table 8a and 8b, the mortgage loan advances and re-
advances for residential buildings and flats show a strong positive correlation of 0.713 and 0.797 respectively, with household disposable income indicating a direct relationship between the variables. If there is economic certainty, interest rates are low and unemployment is low, household disposable income will be high. Increase in household disposable income dictates the attitude of households towards spending and the affordability in the repayment of debt. If household can afford to repay debt, then the demand for residential property increases, along with the demand for mortgage financing.
TABLE 8c: ECONOMIC RECESSION: 3RD QUARTER OF 2001 TO 4TH
QUARTER OF 2002
Household’s
Disposable
Income
Mortgage loan
advances and re-
advances for
residential and flats
Pearson
Correlation .443
Sig. (2-tailed) .379
N 6
TABLE 8d: ECONOMIC RECESSION: 4TH QUARTER OF 2008 TO 4TH
QUARTER OF 2009
Household’s
Disposable
Income
Mortgage loan
advances and re-
advances for
residential and flats
Pearson
Correlation .713
Sig. (2-tailed) .177
N 5
From Table 8c above, mortgage loan advances and re-
advances for residential buildings and flats shows a weak positive correlation of 0.443 to household disposable income, indicating a slight direct relationship between the variables. From Table 8d above, mortgage loan advances and re-advances for residential buildings and flats shows a strong positive correlation of 0.713 to household disposable income, indicating a direct relationship between the variables.
Disposable income determines the capacity of a household to repay debt. This capacity will decrease if the price of fuel increases, which consequently increases the price of goods, or it can increase as a result of high interest rates, leading to an increase in bond repayments. Disposable income becomes a measure of a household’s affordability, indicating their attitude towards spending, thereby dictating the demand for residential properties.
The 3rd Human and Social Sciences at the Common ConferenceOctober, 5. - 9. 2015, www.hassacc.com
Economics, Business and Financing eISSN: 2453-6075, cdISSN: 1339-522X10.18638/hassacc.2015.3.1.184 - 74 - ISBN: 978-80-554-1124-8

TABLE 9: THE CORRELATIONS OF MORTGAGE LOAN ADVANCES AND READVANCES FOR RESIDENTIAL
AND FLATS AGAINST GDP AT MARKET PRICES
TABLE 9a: ECONOMIC GROWTH: 1ST QUARTER OF 1995 TO 2ND
QUARTER OF 2001
GDP at market
prices
Mortgage loan
advances and re-
advances for
residential and flats
Pearson
Correlation .728
**
Sig. (2-tailed) .000
N 26
TABLE 9b: ECONOMIC GROWTH: 1ST QUARTER OF 2003 TO 3RD
QUARTER OF 2008
GDP at market
prices
Mortgage loan
advances and re-
advances for
residential and flats
Pearson
Correlation .760
**
Sig. (2-tailed) .000
N 23
If GDP is high, it means that consumption is high, exports
are high, government spending is high, and investments are high. General economic certainty results in investment confidence, which results in a high demand in residential property. If there is economic growth, then disposable income is high, interest rates are low, and bond repayment is affordable.
TABLE 9c: ECONOMIC RECESSION: 3RD QUARTER OF 2001 TO 4TH
QUARTER OF 2002
GDP at market
prices
Mortgage loan
advances and re-
advances for
residential and flats
Pearson
Correlation .600
Sig. (2-tailed) .208
N 6
TABLE 9d: ECONOMIC RECESSION: 4TH QUARTER OF 2008 TO 4TH
QUARTER OF 2009
GDP at market
prices
Mortgage loan
advances and re-
advances for
residential and flats
Pearson
Correlation .635
Sig. (2-tailed) .250
N 5
From Table 9c and 9d, mortgage loan advances and re-
advances for residential buildings shows a strong positive correlation to GDP of 0.600 and 0.635 respectively, indicating a direct relationship between the variables. During the economic recession, mortgage loan advances and re-advances decreased with a decrease in GDP. When GDP is low, a combination of economic uncertainty, interest rate movements, trends in household finances, consumer risk profile and investor confidence levels will impact residential property market buying trends, levels of activity and the demand for and affordability and accessibility of mortgage finance.
TABLE 10: CORRELATIONS OF THE CONSTRUCTION WORK DELAYS AGAINST PRIME INTEREST RATES
TABLE 10a: ECONOMIC GROWTH: 1ST QUARTER OF 1995 TO 2ND
QUARTER OF 2001
Prime interest
rate
Construction work
Expected to be
completed
Pearson
Correlation -.508
**
Sig. (2-tailed) .008
N 26
Construction work
completed
Pearson
Correlation -.336
Sig. (2-tailed) .093
N 26
TABLE 10b: ECONOMIC GROWTH: 1ST QUARTER OF 2003 TO 3RD
QUARTER OF 2008
Prime interest
rate
Construction work
Expected to be
completed
Pearson
Correlation -.126
Sig. (2-tailed) .567
N 23
Construction work
completed
Pearson
Correlation -.135
Sig. (2-tailed) .539
N 23
Changes in prime interest rates have an effect on the
activities in the construction industry. A decrease in prime interest rates has a positive effect on the prices of commodities, hence the disposable income, thereby not affecting the cash flow on construction activities that may have already commenced.
TABLE 10c: ECONOMIC RECESSION: 3RD QUARTER OF 2001 TO 4TH
QUARTER OF 2002
Prime interest
rate
Construction work
Expected to be
completed
Pearson
Correlation -.685
Sig. (2-tailed) .133
N 6
Construction work
completed
Pearson
Correlation -.105
Sig. (2-tailed) .100
N 6
TABLE 10d: ECONOMIC RECESSION: 4TH QUARTER OF 2008 TO 4TH
QUARTER OF 2009
Prime interest
rate
Construction work
Expected to be
completed
Pearson
Correlation -.583
Sig. (2-tailed) .302
N 5
Construction work
completed
Pearson
Correlation -.577
The 3rd Human and Social Sciences at the Common ConferenceOctober, 5. - 9. 2015, www.hassacc.com
Economics, Business and Financing eISSN: 2453-6075, cdISSN: 1339-522X10.18638/hassacc.2015.3.1.184 - 75 - ISBN: 978-80-554-1124-8

Sig. (2-tailed) .308
N 5
From Table 10c, Construction work expected to be
completed and construction work completed shows a negative correlation to prime interest rate of -0.685 and -0.105 respectively, indicating an inverse relationship between the variables. From Table 10d, construction work expected to be completed and construction work completed shows a strong positive correlation of 0.583 and 0.577 to prime interest rates indicating a direct relationship between the variables. High interest rates led to the increase in the price of commodities, shrinking of the consumers’ disposable income, and the unaffordability of settling debts thereby leading to a decline and delays of construction activities in the property industry.
TABLE 11: CORRELATIONS OF CONSTRUCTION WORK DELAYS
AGAINST CPI
TABLE 11a: ECONOMIC GROWTH: 1ST QUARTER OF 1995 TO 2ND
QUARTER OF 2001
CPI
Construction work
Expected to be
completed
Pearson
Correlation .133
Sig. (2-tailed) .516
N 26
Construction work
completed
Pearson
Correlation .138
Sig. (2-tailed) .503
N 26
TABLE 11b: ECONOMIC GROWTH: 1ST QUARTER OF 2003 TO 3RD
QUARTER OF 2008
CPI
Construction work
Expected to be
completed
Pearson
Correlation -.027
Sig. (2-tailed) .901
N 23
Construction work
completed
Pearson
Correlation -.226
Sig. (2-tailed) .299
N 23
From Table 11a, construction work expected to be
completed and construction work completed shows a weak positive correlation to CPI of -0.133 and -0.503 respectively, indicating a direct relationship between the variables. From Table 11b, construction work expected to be completed and construction work completed shows a negative correlation of -0.027 and -0.226 respectively, with CPI indicating an inverse relationship between the variables.
TABLE 11c: ECONOMIC RECESSION: 3RD QUARTER OF 2001 TO 4TH
QUARTER OF 2002
CPI
Construction work
Expected to be
completed
Pearson
Correlation -.468
Sig. (2-tailed) .349
N 6
Construction work
completed
Pearson
Correlation -.278
Sig. (2-tailed) .594
N 6
TABLE 11d: ECONOMIC RECESSION: 4TH QUARTER OF 2008 TO 4TH
QUARTER OF 2009
CPI
Construction work
Expected to be
completed
Pearson
Correlation .745
Sig. (2-tailed) .148
N 5
Construction work
completed
Pearson
Correlation -.228
Sig. (2-tailed) .712
N 5
From Table 11c, construction work expected to be
completed and construction work completed shows a weak negative correlation to CPI of -0.468 and -0.278 respectively, indicating an inverse relationship between the variables. From Table 11d, construction work expected to be completed shows a strong positive correlation of 0.745 to CPI indicating a direct relationship between the variables, while construction work completed shows a weak negative correlation of -0.228 to CPI indicating an inverse relationship between the variables.
TABLE 12a: ECONOMIC GROWTH: 1ST QUARTER OF 1995 TO 2ND QUARTER OF 2001
CPI
Consumption
expenditure:
Durable goods
Pearson
Correlation .037
**
Sig. (2-tailed) .000
N 23
Consumption
expenditure: Semi -
durable goods
Pearson
Correlation -.423
**
Sig. (2-tailed) .000
N 23
Consumption
Expenditure: Non-
durable goods
Pearson
Correlation .651
**
Sig. (2-tailed) .000
N 23
TABLE 12b: ECONOMIC GROWTH: 1ST QUARTER OF 2003 TO 3RD
QUARTER OF 2008
CPI
Consumption
expenditure:
Durable goods
Pearson
Correlation .052
**
Sig. (2-tailed) .000
N 23
Consumption
expenditure: Semi -
durable goods
Pearson
Correlation -.610
**
Sig. (2-tailed) .000
N 23
Consumption
Expenditure: Non-
durable goods
Pearson
Correlation .451
**
Sig. (2-tailed) .000
N 23
The 3rd Human and Social Sciences at the Common ConferenceOctober, 5. - 9. 2015, www.hassacc.com
Economics, Business and Financing eISSN: 2453-6075, cdISSN: 1339-522X10.18638/hassacc.2015.3.1.184 - 76 - ISBN: 978-80-554-1124-8

TABLE 12c: ECONOMIC RECESSION: 3RD QUARTER OF 2001 TO 4TH QUARTER OF 2002
CPI
Consumption
expenditure:
Durable goods
Pearson
Correlation -.125
**
Sig. (2-tailed) .000
N 23
Consumption
expenditure: Semi -
durable goods
Pearson
Correlation -.503
**
Sig. (2-tailed) .000
N 23
Consumption
Expenditure: Non-
durable goods
Pearson
Correlation .345
**
Sig. (2-tailed) .000
N 23
TABLE 12d: ECONOMIC RECESSION: 4TH QUARTER OF 2008 TO 4TH
QUARTER OF 2009
CPI
Consumption
expenditure:
Durable goods
Pearson
Correlation .247
**
Sig. (2-tailed) .000
N 23
Consumption
expenditure: Semi -
durable goods
Pearson
Correlation -.450
**
Sig. (2-tailed) .000
N 23
Consumption
Expenditure: Non-
durable goods
Pearson
Correlation .501
**
Sig. (2-tailed) .000
N 23
The household consumption expenditure can give an
insight into the spending patterns of households during the economic boom or the economic recession. When there is an increase in the price of goods, it is expected that the consumption expenditure by consumers decreases. Consumption on durable goods such as cars and furniture is slightly affected by changes in CPI, as indicated by a weak positive correlation of 0.037. This implies that the increase in prices have a weak direct relationship with consumer spending on durable goods, as these goods are not bought often, and are bought when there is a need, thereby not considering the prices. Durable goods purchases are more likely to be financed by borrowing, and therefore, more interest sensitive that are mere increase in the price of a basket of goods.
Semi durable goods such as clothes have a strong negative correlation of -0.503 to CPI, indicating that as prices increase, consumers choose not to spend much on semi durable goods. Consumption on non- durable goods shows a strong positive correlation of 0.651 to CPI, indicating a direct relationship with CPI. This implies that changes in the prices of goods do not affect consumer spending on goods considered to be necessities. Consumers are obliged to buy food and other basic commodities, despite the prices.
VI. CONCLUSIONS
In conclusion, the analysis demonstrates that the economic fundamentals have a major role to play in the demand for residential properties. Changes in the economic outlook influence the spending habits of consumers through the availability of disposable income. This further dictates the level of activities in the residential property market as indicated by the demand for housing. It can be concluded that the economic recession did not affect the building activities in all three categories of houses, since the level of activity for flats and townhouses continued to rise despite the drop in crucial economic indicators.
REFERENCES
[1] Abraham, J.M. & Hendershott, P.H. 1996. Bubbles in metropolitan housing markets. Journal of Housing Research, vol.7, no. 2, pp. 191-207.
[2] ABSA house price index. 2007-2009. ABSA Home Loans.
[3] Available at: http://www.absa.co.za (Accessed: May 2011)
[4] Brooks, C. & Tsolacos, T.S. 1998. The impact of economic and financial factors on UK property performance. Journal of Property Research, vol. 16, no. 2, pp. 139-152.
[5] Boshoff. D.G.B. 2010. The impact of affordability on house price dynamics in South Africa. Acta Structilia, vol. 17, no.2, pp. 126-148.
[6] Cameron, G., Muellbauer, J. & Murphy, A. 2006. Was There a British House Price
[7] Bubble? Evidence from a Regional Panel. CEPR Discussion Paper 5619.
[8] Case, K.E. & Quigley, J.M. 2008. How Housing Booms Unwind: Income Effects, Wealth Effects, and Feedbacks through Financial Markets. International Journal of Housing Policy, vol. 8, no. 2, p. 161– 180.
[9] Case, K.E. and Shiller, R. 1988. The behaviour of homebuyers in boom and post boom markets. Cowles foundation for research in economics at Yale University. Discussion paper No. 890, November 1988.
[10] Chan, K.C., Hendershott, P. & Sanders, A.B. 1990. Risk and Return on Real Estate: Evidence from Equity REITs. AREUEA Journal, no. 18, pp. 431-452.
[11] Clark, A. E. & Daniel, T. 2006. Forecasting South African house prices. Investment Analyst Journal, no. 64, pp. 27-33.
[12] Egert, B. & Mihaljek, D. 2007. Determinants of house prices in central and Eastern Europe. CESifo Working Paper Series, Paper 2152, November.
[13] Fama, E.F. & Gibbons, M.R. 1984. A comparison of inflation forecasts. Journal of Monetary Economics. vol. 13, no. 3, May 1984, pp. 327-348.
[14] Hoffman, B. 2001. The determinants of private sector credit in industrialized countries: do property prices matter? BIS Working Papers, vol. 108, 2001.
[15] International Labour Organisation, 2009. Global employment trends. Available at:
[16] http:// www.ilo.org/publns (Accessed: November 2010)
[17] Key, T., MacGregor, B., Nanthakumaran, N. & Zarkesh, F. 1994. Understanding the Property cycles: economic cycles and property cycles. Final report undertaken by Investment property databank and the University of Aberdeen on behalf of The Royal Institute of Chartered Surveyors. The Royal Institute of Chartered Surveyors, University of Aberdeen.
[18] Lecat, R. & Mesonnier, J. 2005. Unabridged translations: What role do financial factors play in house price dynamics? Banque De France Bulletin, Digest-No. 134, pp. 21-37.
[19] Leedy, P.D. & Ormrod, J.E. 2005. Practical Research: Planning and Design. 8th Edition. New Jersey: Pearson Merrill Prentice Hall.
[20] Ling, D. & Archer, W. 2005. Real Estate Principles: A Value Approach. New York: McGraw-Hill.
The 3rd Human and Social Sciences at the Common ConferenceOctober, 5. - 9. 2015, www.hassacc.com
Economics, Business and Financing eISSN: 2453-6075, cdISSN: 1339-522X10.18638/hassacc.2015.3.1.184 - 77 - ISBN: 978-80-554-1124-8

[21] Nachmias, D. & Nachmias, C.F. 1996. Research Methodology in the social sciences. New York: St. Martin Press.
[22] Marais, H. 2009. The impact of the global recession on South Africa. Available at:
[23] http://www.amandlapublishers.co.za (Accessed on 04/09/2009)
[24] Mayes, D.G. 1979. The property boom: the effects of building society behaviour on house prices. Oxford: Martin Robertson
[25] McQuinn, K. & O’Reilley, G. 2006. Assessing the Role of Income and Interest Rates in Determining Irish House Prices. CBFSAI Financial Stability Report, pp. 123-131.
[26] Mueller, G.R. 2002 . What will the next real estate cycle look like? Journal of Real Estate Portfolio Management, vol. 8, no. 2, p. 115.
[27] Prinsloo, D.A. & Prinsloo, L.J. 2004. Property Economics in South Africa. 2nd Edition. Sandton: South African Property Education Trust.
[28] Statistics South Africa. 2010. Online Interactive Data Consumer Price Index (Base 2000= 100). Available at: http://www.statssa.gov.za/timeseriesdata/excel_format.asp. (Accessed on: March 2010- December 2011)
[29] Statistics South Africa. 2015. Consumer Price Index. Statistical release P0141. August 2015. Pretoria: Stats SA.
[30] South African Reserve Bank. 2015. Consumer Price Index (CPI) Available at: http://www2.resbank.co.za/internet/Glossary.nsf/0/ cf8ddca8a8853c8542256b43002fbf78?OpenDocument (Accessed: September 2015).
[31] Tsatsaronis, K. & Zhu, H. 2004. What drives housing price dynamics: Cross country evidence. BIS Quarterly review, March pp. 65 - 78.
[32] Zingales, L. 2008. Testimony on the causes and effects of the Lehman Brothers Bankruptcy before the committee on the oversight and government reform. United States House of Representatives.
The 3rd Human and Social Sciences at the Common ConferenceOctober, 5. - 9. 2015, www.hassacc.com
Economics, Business and Financing eISSN: 2453-6075, cdISSN: 1339-522X10.18638/hassacc.2015.3.1.184 - 78 - ISBN: 978-80-554-1124-8

Forecasting correctness of incurring credit with the
aid of E.I. Altman’s, J. Gajdka’s and D. Stos’s
discriminant analysis models on the example of 200
studied companies from Opole and Pomorskie
provinces
Rafał Parvi
Faculty of Economics
Wroclaw School of Banking
Wroclaw, Poland
Abstract – The credit risk related to issuing credit for a company
is mostly the result of too high amount of the incurred credit,
wrong prediction of future periods and repayment of the
incurred liability. In order to minimize risk, as part of
information about a credited company, there should be technical
and economical information enabling to conduct "collective
evaluation of the company's activity" with the use of E.I.
Altman's, J. Gajdka’s and D. Stos's models. Both models were
used in the group of the studied companies of Opole and
Pomorskie provinces. The research showed that incurred credit
contributed to improvement of the financial liquidity in both
groups. However, credits of greater worth led to the lessened
increase of net profit and contributed to the small decrease of
companies showing net loss. On the other hand, the group of
companies, in which credits of lower worth were incurred, could
decrease the number of companies suffering from net loss.
Keywords: company, financial liquidity, credit, discriminant
analysis, net profit
I. INTRODUCTION
Using the J. Gajdka’s and D. Stos’s model in practice, it should be noted that the model proves to be perfect for Polish conditions because it reflects the realities of the Polish market, and demonstrates correctness of incurred credit of studied companies. The E.I. Altman's model was also used in research because the research results had to be compared in terms of a difference from the Polish market because this ratio was created for the American market and its needs.
200 micro, small and medium-sized companies were studied in the research, including 100 companies from the Opole province and 100 companies from the Pomorskie province. Such a big group of the studied companies was used to indicate correctness of the company's decision on incurring credit. The goal was to indicate that the company, which did not have the financial liquidity, or was operating on the border of its maintenance, could improve or regain the financial liquidity after incurring credit [5, 6, 7, 10]. However, the amount of properly incurred credit and the period of its duration were additionally taken into account because they had
significant influence on the company's financial liquidity. Used models also enabled to indicate that the incurred credit influenced development of the subject's running a business positively, and even contributed to improve its financial condition. Nevertheless, it had to be incurred in a proper amount and for a proper period.
II. J. GAJDKA’S, D. STOS’S AND E.I. ALTMAN'S
DISCRIMINANT MODELS.
The J. Gajdka’s and D. Stos's model reflects the best research results because it was developed in Poland, where Polish companies underwent discriminant analysis. The J. Gajdka’s, D. Stos's and E.I. Altman's models are comparable, but were developed for different economic realities. When both models were compared, differences between them were indicated [8, 11].
The E.I. Altman's model has been used for dozens of years. It may distort a picture and a result of the research because it was used as early as in the 1970s. The credit risk related to issuing credit for investments is mostly the result of the credited company's wrong prediction of its realization [2, 4], and as it can also be noticed in the conducted research, the wrong credit amount, either too low, or too high, and the time period, for which it was incurred. The E.I. Altman's model enables to forecast the course of economic events happening in the company within subsequent two years of its operation. The "Z" value, calculated on the basis of 5 economic and financial ratios, is the basis of this model [3, 10]:
TABLE I. E.I. ALTMAN’S GUIDELINES FOR THE COMPANY’S
CLASSIFICATION
The "Z" ratio's value
The chance of the company's bankruptcy
Z <= 1.8 Very high
1.8 < Z < 3 Indefinite, but significant
Z => 3 Low
Source: E. I. ALTMAN
The 3rd Human and Social Sciences at the Common ConferenceOctober, 5. - 9. 2015, www.hassacc.com
Economics, Business and Financing eISSN: 2453-6075, cdISSN: 1339-522X10.18638/hassacc.2015.3.1.156 - 79 - ISBN: 978-80-554-1124-8

Z = 1.2 x1 + 1.4 x2 + 3.3 x3 + 0.6 x4 + 0,999 x5
where:
X1 - working capital / assets in total
X2 – net income / assets in total
X3 – EBIT / assets in total
X4 – net market value of the company/liabilities in total
X5 – trade (net sale) / assets in total
These ratios are statistical assessment of performance of not only the manufacturing company, but also other kinds of the company. If the result of "Z" value's calculations is below three, it means that credit ratings of the company's need to be examined and assessed thoroughly because the indefinite or low chance of the company's bankruptcy, or its ability to overcome such situation, should be expected.
In calculations of the E.I. Altman's "Z" ratio, attention should be paid on the X5 ratio's value, which is trade (net sale) to assets in total, if the denominator shows low value in relation to the numerator. It may mean that the company is underfunded. That is why values not exceeding three that is X5<= 3 are considered to be the proper level of this ratio because, otherwise, the general assessment may be distorted.
By the use of the "Z" ratio, we can predict c. 80-90% of accurate forecasts of the companies' bankruptcy, or occurring problems with companies' maintenance of the financial liquidity. It concerns both one- and two-year periods.
E.I. Altman, in his original model, took a sample consisting of 66 companies operating in the same period and sector of economy. Half of these companies was insolvent. At the beginning, he estimated values of 22 financial ratios. Later, the number of these ratios, after conducting statistical tests and verification of their meanings (values), was lessened to 5. These 5 ratios reflect economic and financial situation and predicted credit rating best.
The cut-off point in the E.I. Altman's model amounts to 2.675. It is the discriminatory line separating the set of companies into two groups that is companies with high (below 2.675) and low likelihood of insolvency (above the cut-off point). According to E.I. Altman's research, the error of wrong companies' qualification to the set was then the smallest – as many as 94% of companies, which bankrupted in the previous year, reached the "Z" function's value below 2.675. In the same period, the studied value of 97% of solvent companies was above the cut-off point. Correctness of the classification a year prior to bankruptcy amounted to 95%, and, by analogy, results of the whole sample amounted to 82% two years prior to insolvency.
In Poland, D. Zarzecki undertook verification of discriminant analysis's models in 2003. The result of the analysis of these models conducted by D. Zarzecki shows that the J. Gajdek’s and D. Stos’s model brings the best research results [8, 11]:
Z= 0,7732059 – 0,0856425 x X1 + 0,0007747 x X2 +
0,9220985 x X3 +
+ 0,6535995 x X4 – 0,594687 x X5
where:
X1 – revenues from the sale/assets in total,
X2 – (short-term liabilities/cost of production
sold) x 360,
X3 – net profit/assets in total,
X4 – gross profit from the sale/net revenues,
X5 – liabilities in total/assets in total.
In this model, the cut-off point is 0.45, which means that a
studied company is not endangered with bankruptcy, if the above value is reached. This cut-off point is different from the one given by E.I. Altman, but it is related to the used ratios, which are different in particular models.
A comparison of these two research methods by E.I. Alrman, J. Gajdka and D. Stos leads to clear conclusions and gives an opportunity to consider both studied methods – the one developed and functioning in the world, and the one used in Polish companies and adjusted to the Polish market’s conditions. The other method is a little bit more correlated with Polish companies. However, ratios show that both methods are close to each other, and comply in indicating these companies, which can be included either to the group of companies endangered with bankruptcy, or the one, in which there are successful companies able to compete on the market with incurring credit.
Strengths of the discriminant analysis are:
the system's easy functioning,
the assessment's objectivity, in which measurable financial information is the basis,
effectiveness measured with the forecasts' regularities scale,
providing early warnings about credit risk.
Weaknesses are:
effectiveness dependent on the quality of financial data set necessary to estimate values of particular ratios,
only selected, not complex, quantitative information is taken into account in the model's construction,
quantitative information is static.
During the study of companies with the use of both models, the method enabling to compare them in a way presenting their financial capabilities unambiguously was constructed. Depicted values of the "Z" ratios were present in conjunction with several variables presenting what differences occur at the chosen amount of contracted credit and its period [1, 8].
Used models are very useful in assessment of the companies' crediting and are often used in practice [3]. Nonetheless, conducted analyses are not attempts to estimate specific worth of credit and the period for which the company should go in debt, but the credit's maximum worth and period.
The 3rd Human and Social Sciences at the Common ConferenceOctober, 5. - 9. 2015, www.hassacc.com
Economics, Business and Financing eISSN: 2453-6075, cdISSN: 1339-522X10.18638/hassacc.2015.3.1.156 - 80 - ISBN: 978-80-554-1124-8

It may lead to issuing credit to a company, which may not be able to repay it in future.
III. THE USE OF E.I. ALTMAN’S, J. GAJDKAS’S AND
D. STOS’S DISCRIMINANT ANALYSIS MODELS IN
ORDER TO INDICATE CORRECTNESS OF A DECISION
ON INCURRING CREDIT ON THE EXAMPLE OF 200
STUDIED COMPANIES FROM OPOLE AND
POMORSKIE PROVINCES.
In the Opole province, companies were studied with a comparison of the net profit in following years: a year prior to issuing credit, in the year of issuing credit and two years after issuing credit. The net income (division into following groups: from PLN 0 to PLN 100,000, from PLN 100,100 to PLN 200,000, from PLN 200,100 to PLN 500,000, and from PLN 501,000 to 1,000,000) and net loss were taken into account. The goal of such an analysis was to study range and opportunities of the obtained credit’s amount in relation to the net profit and owned capital. The net profit, or net loss, indicated whether credit contributed to maintenance and improvement of the companies’ financial liquidity, or it led to their bankruptcy.
In 2010-2015, in the Opole province, companies of lower net profit (from PLN 0 to PLN 100,000 and from PLN 100,100 to PLN 200,000) were the most numerous – there were 80 such companies. In the Pomorskie province, ranges between PLN 0 and PLN 100,000, and between PLN 100,100 and PLN 200,000 were dominant – there were 47 such companies. It should be noted that the studied companies tended to maintain net profit.
TABLE II. PROFIT OR LOSS OF STUDIED COMPANIES OF THE
OPOLE PROVINCE EXAMINED (100 EXAMINED COMPANIES).
Year Profit
0-100,000
Profit
100,100 –
200,000
Profit
200,100 –
500,000
Profit
500,100 –
1,000,000
Net
loss
2010 28 33 15 4 20
2011 33 35 11 3 18
2012 35 37 10 3 15
2013 38 42 10 3 7
2014 37 41 12 5 5
2015 35 43 11 6 5
Source: own development based on 100 studied companies of the Opole province.
TABLE III. PROFIT OR LOSS OF STUDIED COMPANIES OF THE
POMORSKIE PROVINCE EXAMINED (100 EXAMINED COMPANIES).
Year Profit
0-100,000
Profit
100,100 –
200,000
Profit
200,100 –
500,000
Profit
500,100 –
1,000,000
Loss
2010 19 26 22 5 28
2011 17 26 24 6 27
2012 17 27 20 6 30
2013 17 30 21 6 26
2014 20 27 21 7 25
2015 24 30 20 6 20
Source: own development based on 100 studied companies of the Pomorskie province.
Moreover, incurring credit even led to decrease of the number of companies, in which the loss occurred – from 20 to 5 in the Opole province, and from 28 to 20 in the Pomorskie province. It proves that the decision on incurring credit, which contributed to improvement of the financial liquidity, was correct. These data were summarized in tables 2 and 3.
In tables 4 and 5, the average net profit, average long-term and current assets, average worth of issued credit, and average loss of the companies that do not have the financial liquidity were presented.
In the table 4, it should be noted that the average value of issued credit amounts to PLN 251,425. It is the working capital facility, revolving in subsequent years, and issued in 2011. The value of credit constitutes c. 1/3 of average values of current assets that is c. 33%. It is the evidence that credit, which is c. 30% of current assets, causes maintenance of the financial liquidity, and does not cause financial destabilization.
TABLE IV. AVERAGE NET PROFIT IN RELATION TO VALUE OF LONG-TERM AND CURRENT ASSETS OF STUDIED COMPANIES OF THE
OPOLE PROVINCE IN PLN THOUSANDS.
Year Average Net
profit
Average value
of Long-term
assets
Average value
of Current
assets
Average value of
assets in total
Average value of
the issued credit
Average Loss
Before issuing credit
2010 199,875
(80 companies)
450,456 658,475 1,108,931 X 225,154
(20 companies)
The year of issuing credit
2011 205,895
(82 companies)
552,326 798,459 1,350,785 251,425 289,478
(18 companies)
After issuing credit
2012 245,425
(85 companies)
582,954 821,258 1,404,212 X 198,487
(15 companies)
2013 263,125 623,745 836,547 1,460,292 X 125,158
The 3rd Human and Social Sciences at the Common ConferenceOctober, 5. - 9. 2015, www.hassacc.com
Economics, Business and Financing eISSN: 2453-6075, cdISSN: 1339-522X10.18638/hassacc.2015.3.1.156 - 81 - ISBN: 978-80-554-1124-8

(93 companies) (7 companies)
2014 266,254
(95 companies)
639,532 840,128 1,479,660 X 134,578
(5 companies)
2015 295,365
(95 companies)
644,588 855,655 1,500,243 X 134,578
(5 companies)
Source: own development based on 100 studied companies of the Opole province.
TABLE V. AVERAGE NET PROFIT IN RELATION TO VALUE OF LONG-TERM AND CURRENT ASSETS OF STUDIED COMPANIES OF THE
POMORSKIE PROVINCE IN PLN THOUSANDS.
Year Average Net
profit
Average value
of Long-term
assets
Average value
of Current
assets
Average value of
assets in total
Average value of
the issued credit
Average Loss
Before issuing credit
2010 223,114
(72 companies)
501,694 574,112 1,075,806 X 284,697
(28 companies)
The year of issuing credit
2011 243,632
(73 companies)
509,332 589,362 1,098,694 428,951 294,563
(27 companies)
After issuing credit
2012 257,896
(70 companies)
497,851 641,369 1,139,220 X 324,521
(30 companies)
2013 260,845
(74 companies)
515,687 658,562 1,174,249 X 336,459
(26 companies)
2014 263,451
(75 companies)
520,678 664,654 1,185,332 X 340,569
(25 companies)
2015 269,663
(80 companies)
526,772 676,512 1,203,284 X 342,754
(20 companies)
Source: own development based on 100 studied companies of the Pomorskie province.
While analysing the table 5, it should be noted that the average value of issued credit amounts to PLN 428,951. It is the working capital facility, revolving in subsequent years, and issued in 2011 as well. However, in case of companies of the Pomorskie province, its worth in relation to current assets is c. 7/10, so it is 68% of the credit's worth in relation to current assets. In this case, it can be seen clearly that companies maintain the financial liquidity harder with such debts. Moreover, the group of companies suffering loss reduced only from 28 to 27 in the year of incurring credit. As late as in 2012-2015, the group decreased to 20 companies. But in the Opole province, the number of companies suffering loss decreased four times – from 20 to 5 with 30% relation of incurred credit to current assets, while in the Pomorskie province, the number of such companies decreased from 28 to 20 with c. 68% relation of incurred credit to current assets.
In conclusion, too heavy burden with debt and relying on foreign capital (over 68% of the current assets' value) leads to
disturbance of the company's financial liquidity because the company is not able to pay such debt and use obtained funds properly and sensibly. Only these companies where foreign capital is 30% of current assets will use them sensibly and in accordance with their financial opportunities.
The credit risk taken by a bank due to granting funds was minimal in case of companies with less credit. It is demonstrated by another calculations and use of E.I. Altman’s,J. Gajdka’s and D. Stos's methods. Nevertheless, granting funds constituting c. 50% of the company's current assets was too dangerous both for the bank and the company.
Analysing course of economical events since the moment preceding issuing credit [9] and subsequent years of the activity's duration, five selected ratios corresponding to particular models were used. The cut-off points for two chosen discriminant analysis models were obtained.
TABLE VI. THE USE OF E.I. ALTMAN’S, J. GAJDKA’S AND D. STOS’S DISCRIMINANT ANALYSIS MODELS ON THE EXAMPLE OF 100
STUDIED COMPANIES FROM THE OPOLE PROVINCE.
E.I. Altman's model 2010 2011 2012 2013 2014 2015
The number of companies showing profit 80 82 85 93 95 95
The 3rd Human and Social Sciences at the Common ConferenceOctober, 5. - 9. 2015, www.hassacc.com
Economics, Business and Financing eISSN: 2453-6075, cdISSN: 1339-522X10.18638/hassacc.2015.3.1.156 - 82 - ISBN: 978-80-554-1124-8

The average "Z" ratio for companies 3.12 3.45 3.32 4.11 4.15 4.17
Absence of risk, values close to and above 3.0 low absence absence absence absence absence
The number of companies showing loss 20 18 15 7 5 5
The average "Z" ratio for companies 1.98 2.36 1.95 1.72 1.80 1.83
Absence of risk, values close to and above 3.0 high medium high high high high
The J. Gajdka and D. Stos's model 2010 2011 2012 2013 2014 2015
The number of companies showing profit 80 82 85 93 95 95
The average "Z" ratio for companies 0.79 0.93 0.88 1.02 1.05 1.06
Absence of risk, values close to and above 0.45 absence absence absence absence absence absence
The number of companies showing loss 20 18 15 7 5 5
The average "Z" ratio for companies 0.31 0.39 0.37 0.34 0.33 0.35
Absence of risk, values close to and above 0.45 high medium high high high high
Source: Own development on the basis of data of 100 selected companies from the Opole province.
TABLE VII. THE USE OF E.I. ALTMAN’S, J. GAJDKA’S AND D. STOS’S DISCRIMINANT ANALYSIS MODELS ON THE EXAMPLE OF 100
STUDIED COMPANIES FROM THE POMORSKIE PROVINCE.
E.I. Altman's model 2010 2011 2012 2013 2014 2015
The number of companies showing profit 72 73 70 74 75 80
The average "Z" ratio for companies 2.85 2.99 3.01 3.05 3.09 3.10
Absence of risk, values close to and above 3.0 absence absence absence absence absence absence
The number of companies showing loss 28 27 30 26 25 20
The average "Z" ratio for companies 0.88 0.89 0.97 1.03 1.07 1.09
Absence of risk, values close to and above 3.0 high high high high high high
The J. Gajdka’s and D. Stos's model 2010 2011 2012 2013 2014 2015
The number of companies showing profit 72 73 70 74 75 80
The average "Z" ratio for companies 0.55 0.57 0.60 0.63 0.68 0.72
Absence of risk, values close to and above 0.45 absence absence absence absence absence absence
The number of companies showing loss 28 27 30 26 25 20
The average "Z" ratio for companies 0.35 0.36 0.38 0.40 0.42 0.40
Absence of risk, values close to and above 0.45 high high high medium medium medium
Source: Own development on the basis of data of 100 selected companies from the Pomorskie province.
On the example of the studied companies of the Opole province, the Altaman's model shows significant improvement of the ratio in 2011 (3.45), when companies incurred credit, in relation to 2010 (3.12). Improvement of the selected companies' financial condition proves the above. In subsequent years, this value is the same, and in 2015, increases to 4.17.
The J. Gajdka’s and D. Stos's model also indicates values above the cut-off point from 0.79 to 1.06 in 2010-2015. Only in companies suffering from loss the cut-off's ratio tends to deteriorate with the use of both methods, which proves that even properly selected credit does not improve the companies' financial liquidity. The values described above present research included in the table 6.
In turn, in the table 7, E.I. Altman’s, J. Gajdka’s and D. Stos's models were also used during research of companies of the Pomorskie province. The above research shows that companies, which maintained the financial liquidity with incurring credit, improved their financial condition, but their cut-off point's ratio are different from ones noted in the Opole province.
In the E.I. Altman's model, improvement can be seen in 2010-2015 – ratio's value increased from 2.85 to 3.10. Whereas in the J. Gajdka’s and D. Stos's model, the ratio's values increased from 0.55 to 0.72. It means that credit's worth constituting 68% of the current assests' worth is too heavy burden, and prevents from significant improvement of the financial liquidity. Moreover, it does not show the ratio similar to the one obtained in research in the Opole province.
The 3rd Human and Social Sciences at the Common ConferenceOctober, 5. - 9. 2015, www.hassacc.com
Economics, Business and Financing eISSN: 2453-6075, cdISSN: 1339-522X10.18638/hassacc.2015.3.1.156 - 83 - ISBN: 978-80-554-1124-8

Figure 1. The use of E.I. Altman's model in the analysis of 200 companies of
Opole and Pomorskie provinces showing profit and loss in 2010-2015 (own development on the basis of data of selected companies from Opole and
Pomorskie provinces).
Furthermore, the cut-off points' values of the companies showing net loss in the Pomorskie province do not show significant improvement of the financial liquidity, but they slightly vary in 2010-2015. In the E.I. Altman's method, they vary from 0.88 to 1.09, and in the J. Gajdka;s and D. Stos’s method – from 0.35 to 0.40.
It evidences that greater worth of credit could not ensure companies satisfactory improvement of the financial liquidity, but worsened their situation.
Figure 2. The use of the J. Gajdka’s and D. Stos's model in the analysis of
200 companies of Opole and Pomorskie provinces showing profit and loss in 2010-2015 (own development on the basis of data of selected companies from
Opole and Pomorskie provinces).
Analysing net profit of the companies, it can be noted that issued credit influenced their development positively. There, its huge influence on the companies' net income can be seen. Thanks to opportunity to incur credit, companies could develop
dynamically and as they planned in their assumptions with credit constituting 30% of the current assets' worth. Only credit constituting 68% of the current assets' worth did not cause major changes in many companies and did not lead to improvement of the financial liquidity of the greater number of companies showing net loss.
The sensibly selected credit resulted in the greater increase of net profit and contributed to the increase of net income and profit, without which the company could not develop and reach significant results.
IV. CONCLUSIONS
It should be emphasised that contracted credit in studied companies contributed to improvement of the financial liquidity. However, it was mostly in case of companies, whose credits were c. 30% of the current assets' worth. Furthermore, in case of companies of the Pomorskie province, whose credits were 68% of the current assets' worth, the financial liquidity was not improved as much as in case of lower credits incurred by the studied companies of the Opole province. Nevertheless, credits enabled companies to settle current liabilities, which is proven by lessened number of companies suffering from net loss because such a phenomenon occurred in the group of 100 studied companies in 2010-2015. Therefore, companies maintained good financial condition after issuing credit. It should be stated clearly that the decision on incurring credit was, indeed, correct. But it should be borne in mind that the amount of incurred credit must not exceed specific worth preventing from repaying incurred credit and settling liabilities, which could lead to the company's inability to debt service. That is why c. 30% of the company's current assets' value, resulting from research of the companies, is the optimal amount.
The period, for which credit was incurred, is highly significant, but the studied companies contracted the working capital facility for one year with the possibility to renew it in subsequent years, which did not affect research and cause its distortion.
The companies that had unevenly balanced liquidity or needed additional financial resources for the functioning on the market, and that took up a credit above the value exceeding 68% of the external funds in relation to their current assets, did not maintain the liquidity, and only 8 companies improved it in relation to 20 companies that were at risk of bankruptcy, which was reported in the Pomorskie Voivodeship. While the number of companies in Opole Voivodeship, which improved their liquidity, is 15, that is several times more than in Pomorskie Voivodeship, but the improvement occurred thanks to a taken credit, however the debt amounted only to 30% of the external funds in relation to their current assets. Therefore, there must be a firm answer that the credits that are incurred in the form of cash and account for more than 68% of the external funds in respect of current assets will not have a good impact on the financial condition of the studied companies, since such a capital obligation and interest liability constitutes a major burden for the company, which must within next months, after a credit was incurred, pay it back to the bank.
0
0,5
1
1,5
2
2,5
3
3,5
4
4,5
2010 2011 2012 2013 2014 2015
Opole province - companies showing profit
Pomorskie province - companies showing profit
Opole province - companies showing loss
Pomorskie province - companies showing loss
0
0,2
0,4
0,6
0,8
1
1,2
2010 2011 2012 2013 2014 2015
Opole province - companies showing profit
Pomorskie province - companies showing profit
Opole province - companies showing loss
Pomorskie province - companies showing loss
The 3rd Human and Social Sciences at the Common ConferenceOctober, 5. - 9. 2015, www.hassacc.com
Economics, Business and Financing eISSN: 2453-6075, cdISSN: 1339-522X10.18638/hassacc.2015.3.1.156 - 84 - ISBN: 978-80-554-1124-8

REFERENCES
[1] Antonowicz P., „Własności wskaźnika rentowności sprzedaży brutto oraz produktywności majątku w prognozowaniu i ocenie zagrożenia upadłością przedsiębiorstw”, w: "Czas na pieniądz. Zarządzanie Finansami. Mierzenie wyników przedsiębiorstw i ocena efektywności inwestycji", Zeszyty Naukowe Uniwersytetu Szczecińskiego nr 760, Finanse, Rynki Finansowe, Ubezpieczenia nr 59, 2013, pp. 11-20.
[2] Czekaj J., „Rynki, instrumenty i instytucje finansowe”. Praca zbiorowa pod redakcją J. Czekaj, Warszawa, PWN, 2008, pp. 10-17.
[3] Czerwiński S., Spiak J. Nietupski T., “Calculation parametres de la regulation dans l’entreprises agricole”. Nimes, CIOSTA, 1980, pp. 44 - 55.
[4] Dowgiałło Z., „Upadłość małych i średnich przedsiębiorstw w świetle badań”, Szczecin, „Firma i rynek” Zachodniopomorska Szkoła Biznesu Szczecin 2002 nr 2/3, pp. 122 - 124.
[5] Gabrusiewicz W., „Analiza finansowa przedsiębiorstwa, teoria i zastosowanie”, PWE, Warszawa, 2014, pp. 245-261
[6] Jaworski, W. L., „Bankowość”. Praca zbiorowa pod redakcją W.L. Jaworskiego i Z. Zawadzkiej, Warszawa, Poltext 2001, pp. 638-641.
[7] Nowak E., „Analiza sprawozdań finansowych”, PWE, Warszawa, 2014, pp. 185-194.
[8] Parvi R., (2015) „Forecasting correctnesss of incurring credit with the aid of E.I. Altman’s, J. Gajdka’sand D. Stos’s discriminant analysis models on the example of 200 studied companies from Opole and Podkarpackie provinces”, Czech Technical University in Prague, pp. 141-149.
[9] Pomykalska B., Pomykalski P., „Analiza finansowa przedsiębiorstwa”, Warszawa, PWN, 2007, pp. 178-189.
[10] Rutkowski A., „Zarządzanie finansami”, PWE, Warszawa, 2007, pp. 420-429.
[11] Zarzecki D., „Analiza dyskryminacyjna jako metoda oceny zagrożenia bankructwem”. W: Zarządzanie finansami. Mierzenie wyników i wycena przedsiębiorstw. Szczecin, Uniwersytet Szczeciński 2003, pp. 173-181.
The 3rd Human and Social Sciences at the Common ConferenceOctober, 5. - 9. 2015, www.hassacc.com
Economics, Business and Financing eISSN: 2453-6075, cdISSN: 1339-522X10.18638/hassacc.2015.3.1.156 - 85 - ISBN: 978-80-554-1124-8

Human resource marketing approach and its possible
deduction from the generic sales marketing concept
Minder Susanna, Doctoral Student
University of Latvia
Riga, Latvia
Abstract— Human resource marketing is gaining more and more
importance for companies which are working in a constraint
labor-market. In the recent years different authors make an
effort to systematize human resource marketing analog to the
generic sales marketing concept. But this adaptability raises
questions which are not sufficiently answered in the literature
yet. For instance: Can employees be seen as customers? If so,
how can they be managed or reprimanded? This paper aims to
show these inconsistencies by giving an overview of some existing
approaches to human resource marketing. All these approaches
generalize generic sales marketing theories and research beyond
the exchange of goods, services and money to any valuable
resource, hereby human resources. This is especially pertinent as
the differences between employees and customers as well as jobs
and goods are not sufficiently stated in the literature. This leaves
way for further studies to explain and solve the questions arising
in the derivation of human resource marketing from the generic
sales marketing approach. The study examines the existing
literature from the 1960s to today and draws attention to
inconsistencies emerging from the linkage to the generic sales
marketing concept. By raising these problem indicators in the
area of contemporary human resource marketing approaches,
the research adds value to the literature, where human resource
marketing is not defined by one single autonomous doctrine, but
is mostly linked to the generic sales marketing concept.
Keywords- Human resource management, Human resource
marketing, Generic sales marketing
I. INTRODUCTION
The problem of how to acquire qualified labor force on the labor market is gaining more and more importance, especially in countries like Germany, where demand and supply differ on the labor market. The German labor market is one of the few labor markets in the Euro Zone which is still growing. Besides the German workforce is becoming inclemently younger as a lot of employees leave their companies due to age reasons and leave a gap in the labor force. To preclude this trend organizations place emphasis on human resource marketing methods.
There is a rapidly growing literature on human resource marketing. However, whilst there are various explanations of human resource marketing in the literature, there are arising inconsistencies. The major reason for this is that the majority of authors adapt human resource marketing analog to the generic sales marketing concept. They generalize generic sales marketing theories and research beyond the exchange of goods, services and money to any valuable resource like time, energy, feelings, places, ideas, symbols or information and to the
exchange with customers, employees, suppliers, the public, and even competitors.
However, in the opinion of the author this brings some confusion as there seem to be some hurdles that hinder a one-to-one transfer of the generic sales marketing concept to the realm of human resource.
The paper attempts to identify these problems concerning the transferability of the generic sales marketing approach to the human resource area. For instance there are problems with the portraying of the employment relationship: Can employees “consume” jobs? If that is the case how can they be managed? Can employees therefore really be treated equal as customers? This is especially pertinent as the differences between employees and customers are not sufficiently stated in the literature. It is suggested, therefore, that a clear understanding of the limitations of the transferability of the generic sales marketing to the realm of human resources calls attention and is studied further.
In order to achieve this purpose the author begins with a brief overview of different explanations and approaches to the concept of human resource marketing in the literature from the 1960s to today. As human resource marketing expanded over the years, scholars sought to synthesize its fundamental premises into “general theories”. Prominent among early contributions are the theories of Schubert [1] (Schubert, M., 1962) and Strutz [2](Strutz, H., 1992). Of more recent origin are the improved marketing mix and promotion process [3] (Gardner, T., 2010) and the recruitment process according to Melin [4](Melin, E., 2005).
The author then shows some inconsistencies in the derivation of the concepts to the realm of human resources. Finally the outcome of the paper are questions which are not answered yet but leave way to further studies.
The research method used for the study is a literature review, combined with the generation of research hypotheses as conclusion.
II. RESEARCH RESULTS AND DISCUSSION
The term „Human Resource Marketing“ (HR marketing) was brought into the economical discussion by Schubert in 1962 [1] (Schubert, M., 1962). Publications regarding this topic flourished but then decreased dramatically in the middle of the 70's. Since the end of the 80's the discussion intensified again [6], [7], [8] (Bleis, T., 1992; Dietmann,E., 1993; Süß, M., 1996). [2] Strutz (Strutz, H., 1992, pp.2) stated that the
The 3rd Human and Social Sciences at the Common ConferenceOctober, 5. - 9. 2015, www.hassacc.com
Management and Marketing eISSN: 2453-6075, cdISSN: 1339-522X10.18638/hassacc.2015.3.1.154 - 86 - ISBN: 978-80-554-1124-8

strategic importance of human resource marketing is – in the light of the increasing demand of employees on the labor market – beyond controversy.
Thereby the development of human resource marketing must be seen in context of generic sales marketing [2] (Strutz, H, 1992). In Germany the idea of human resource marketing has its roots at the beginning of the 1970's [9] (Rastetter, D., 1996), as - due to the beginning lack of employees on the labor market - a transmission of the generic sales marketing and its concepts and instruments into the human resource area took place [9] (Rastetter, D., 1996).
The basic idea of this expansion of the marketing idea is that not only within the classical marketing range (the distribution of products and services by economical enterprises) tradeoffs exist - for which appropriate methods should be used. In that line of thought [10] Hempelmann (1995, p. 745) stated that marketing can be reasonable and essential with regard to other transaction initiators (e.g. Nonprofit enterprises), objects (e.g. opinions) and transaction partners (e.g. coworker).
This view of marketing asserts that the employment relationship is a form of transaction. This is clear in Berry’s [11] (1984) statement that “the exchange that takes place between employees and employer is no less real than the exchange that takes place between consumers and companies. Whereas customers exchange economic resources for goods and services, employees exchange human resources for jobs that provide, among other things, economic resources. Just as consumers can choose Honda automobiles over Ford automobiles, so employees can choose to work for an airline rather than a bank, or for one bank instead of another.”
Such an expansion of marketing as asserted by Berry is called human resource marketing in the literature: Objects are jobs, transaction partners are existing employees (resp. employers) and future employees. An exchange of work offer and work demand is caused by analog generic sales marketing strategies and instruments. According to Simon [12] (Simon, H. et al., 1995) this definition in the area of human resource management includes the entire human resource strategy and defines human resource marketing as a comprehensive thinking and action plan.
Wiegran [13] (1993, p.9) states in dependence on Ruhleder [14] (Ruhleder, R., 1978) that “HR Marketing is a company´s mindset that orientates itself on the conception and contribution of potential and existing employees and puts the employee more and more in the focus of its endeavor.”
Regarding the term “human resource marketing” the author proposes different explanations that can be found in literature. The understanding of HR marketing is by no means uniform. Different authors [6], [7] (Bleis, T., 1992, Dietmann, E., 1993; [4] Melin, E., 2005, [4] Gardner, T. et al. 2010, [15] Staffelbach, B., 1995, [16] Bartscher, T. & Fritsch, S., 1992) make an effort to systematize the different approaches.
Other possible systematizations are according to Fröhlich [17] (2004, p.17f) depending on the chronology, starting in the 1960´s and continuing until today. A differentiation can be made into two phases. The first phase starts in the 60´s when
human resource marketing flourished and then ends in the middle of the 70's. Since the end of the 80's when the discussion about human resource marketing intensified again, the second phase started and lasts until today. What all different systematizations have in common is an implicit classification on the basis of different criteria which can be arranged in a reference framework [16], [18], [19] (Bartscher, T. & Fritsch, S., 1992; Seiwert, L., 1985; Thom, N., 1994).
The author draws attention to the fact that there seem to be inconsistencies in the recent foci of human resource marketing as a sub-approach of sales marketing. Recently scholars argument that positions should be traded like goods and employees like consumers. However, this shortening entails unexpected risks in the opinion of the author. The author draws attention to the fact that by positing the notion that organizations have to orientate themselves and therefore “sell” themselves and their associated forms and conditions of employment to actual or potential employees, leaves way to further interpretations in the research community: First to the obligations of employers in the employment relationship and second, to the link between the way in which employees are treated by employers and how employees subsequently behave in the workplace [5] (Colvin, 2003). As example Cappelli [20] (1999) and Michaels, Handfield-Jones & Axelrod [21] (2001) state that today the labor force change between different companies is seen as an expression of market-oriented relations between employee and employer as well as a quality indicator [22], [23] (Bloom & Van Reenen, 2007, Maertz, C. & Campion, A., 2004) for human resource marketing of single companies.
In the opinion of the author, there are clear limitations to human resource marketing as a way of portraying the employment relationship. To claim that employees “buy” and “consume” jobs and that, if they find them not adequate any more, they can “buy” other jobs elsewhere is a misrepresentation of the employment relationship [23] (Maertz, C. & Campion, A., 2004). The author advances the view that in the first place, it is employers who are the buyers and consumers in the relationship, offering monetary and non-monetary rewards in return for the right to use employees’ labor for a contracted period of time. Consumption of the employee’s labor during that time is at the discretion of the employer only, not the employee. Secondly the view that employees are “customers” of the employer means that the fundamental structural problem of management is pushed away as a mere technical problem of marketing. Furthermore, if employees were indeed “consumers” of jobs and “customers” of employers, they would in the opinion of the author, presumably have the same rights as other, more conventionally defined consumers. Thus their job - once “bought” - would become their inalienable private property which they would be able to retain or dispose of at will. According to Foster [24] (Foster, C. et al. 2010) employees seen as customers could not be deprived of their right to continue consuming their job (e.g. be laid off), could not be reprimanded for consuming it in an inappropriate way (e.g. be disciplined) [25] (Cappelli & Neumark, 2004) and could not be instructed on how to consume it (e.g. be managed). In the opinion of the author the employee, like the customer, would always be right.
The 3rd Human and Social Sciences at the Common ConferenceOctober, 5. - 9. 2015, www.hassacc.com
Management and Marketing eISSN: 2453-6075, cdISSN: 1339-522X10.18638/hassacc.2015.3.1.154 - 87 - ISBN: 978-80-554-1124-8

But of course the author experiences that employees do not possess this kind of market power. Therefore when the interests of employees and employers diverge it is not always in the interests of employees to prevail [26] (Hausknecht et al., 2009). Hence Berry’s [11] (1984) view of human resource marketing as offering “internal products that satisfy the needs and wants of ... internal customers while addressing the objectives of the organization” fails to address the problem of what happens when employees’ needs and organizational objectives diverge. Here human resource marketing reveals the weakness of its essentially unitaristic assumptions.
Besides - according to human resource marketing - if the “employees as customers” do not like the employment product on offer from their actual employer, they can go elsewhere and find a better offer [27], [28] (Siebert, W., and Wood., S. et al., 2006). Thus, labor is conceived as being not only formally free but substantively.
In the author´s opinion, all the forces which serve to constrain different individuals or social groups to particular labor markets, jobs and/ or career paths would simply disappear and therefore the author believes that human resource marketing itself would be made obsolete.
III. CONCLUSIONS
The purpose of the paper is to show inconsistencies in the derivation of human resource marketing from generic sales marketing concepts. As seen above the concept of human resource marketing has been exposed to criticism for different reasons in the past. Regarding the term “human resource marketing” different explanations can be found in literature. The understanding of human resource marketing is by no means uniform but systematized within different approaches. Nevertheless it was established as independent and important field in research and practice.
In the author´s opinion it is difficult to explain human resource marketing analog to the generic sales marketing concept. There are quite a lot of different hurdles that hinder a one-to-one transfer of the generic sales marketing concept to the realm of human resource marketing. Due to the specialties of generic sales marketing shown above and the problems arising out of these specialties, the author sees questions which are not sufficiently answered yet. But until today no other elementary definition and explanation can be found in the literature. Scholars stick to the basic framework of generic sales marketing to explain the market functions of labor supply and labor demand. As mentioned questions of how problems of this transfer can be coped with are not answered at all or only on the fringes of existing literature. This leaves way to further studies respectively the development of more accurately fitting definitions and explanations in the realm of human resource marketing.
1) If the approaches of the generic sales marketing is
transferred to the realm of human resource
marketing without any adaptation human resource
marketing itself will dissolve. (Potential)
employees with the same market power as normal
customers make human resource marketing itself
obsolete. Here the inconsistency of the existing
approaches leaves way to further studies which
need to explain human resource marketing within
another or expanded theoretical context than the
generic sales one.
2) Employees can not be treated as customers. They
do not possess the same market power. Other
guidelines and principles exist in the cooperation of
organizations with their employees as in the
cooperation of organizations with consumers. The
problem of how this cooperation can be explained
analog to the generic sales marketing concepts
leave way to further studies. Besides employment
relationships explained by the generic sales
marketing approach rise problems in explaining
management structures. The questions if - and if
yes - how employees should be managed,
disciplined etc. are not sufficiently answered yet.
These conclusions which are of interest for further studies summarize the author´s findings of the paper. Human resource marketing scholars need to be prepared to contribute to the posed questions and inconsistencies shown by the author. The author will continue his research by developing a theoretical model which will explain the employment relationship by newly defined principles and guidelines. In the case of the model and the derived hypotheses a qualitative research method will be accomplished by the author to prove/ dismiss the model respectively the hypotheses. Experts in the area of human resource marketing will be interviewed to check the theoretical hypotheses and further conclusions will be drawn by the author.
REFERENCES
[1] Schubart, M., 1962, Das Tabu der Gehälter, Econ: Düsseldorf / Reich,
F., 1995, Personalmarketing im Straßengütertransportgewerbe, Gabler: Wiesbaden.
[2] Strutz, H., 1992, Personalmarketing: Alter Wein in neuen Schläuchen?,
in: Strutz, Hans (ed.): Strategien des Personalmarketing, Gabler: Wiesbaden.
[3] Gardner T, Stansbury J, Hart D., 2010, “The ethics of lateral hiring”, in:
Business Ethics Quarterly, vol. 20, pp. 341 – 369. [4] Melin, E., 2005, “Likeness and differences between external and
internal employer brand images”, Lulea University of Technology,
Department of Business Administration and Social Sciences, Lulea
University Press: Lulea.
[5] Colvin, A. J., 2003, “The dual transformation of workplace dispute
resolution”, in: Journal of Industrial Relations, vol. 42, no. 4¸ pp. 712 – 735.
[6] Bleis, T., 1992, Personalmarketing. Darstellung und Bewertung eines
kontroversen Konzepts, Hampp: München. [7] Dietmann,E., 1993, Personalmarketing. Ein Ansatz
zielgruppenorientierter Personalpolitik, Gabler: Wiesbaden.
[8] Süß, M., 1996, Externes Personalmarketing für Unternehmen mit geringer Branchenattraktivität, Hampp: München.
[9] Rastetter, D., 1996, Personalmarketing, Bewerberauswahl und
Arbeitsplatzsuche, Ferdinand Enke: Stuttgart. [10] Hempelmann, B., 1995, “Generic Marketing“, in: Tietz, Bruno (eds.):
Handwörterbuch des Marketing, Schäffer Poeschel: Stuttgart.
[11] Berry, L., 1984, “The Employee as Customer”, in: Lovelock, C. (eds.), Services Marketing: Texts, Cases and Readings, Englewood Cliffs:
Prentice-Hall.
[12] Simon, H. et al., 1995, Effektives Personalmarketing. Strategien – Instrumente – Fallstudien, Gabler: Wiesbaden.
The 3rd Human and Social Sciences at the Common ConferenceOctober, 5. - 9. 2015, www.hassacc.com
Management and Marketing eISSN: 2453-6075, cdISSN: 1339-522X10.18638/hassacc.2015.3.1.154 - 88 - ISBN: 978-80-554-1124-8

[13] Wiegran, G., 1993, Transaktionskostentheorie und Personalmarketing,
Sinocon: München.
[14] Ruhleder, R., 1978, Personal-Marketing, in: Dummer, W. (eds.):
Personal-Enzyklopädie, vol. 3, Verlag Moderne Industrie: München,
pp. 145 - 148. [15] Staffelbach, B., 1995, Strategisches Personalmarketing (Überblick), in:
Scholz, C. & Djarrahzadeh, M. (eds.): Strategisches
Personalmanagement. Konzepte und Realisationen, Schäffer Poeschel: Stuttgart, pp. 143 – 158.
[16] Bartscher, T. & Fritsch, S., 1992, Personalmarketing, in: Gaugler, E.,
Handwörterbuch für Personalwesen, 2nd ed., Schäfer-Poeschl: Stuttgart, pp. 1747-1758.
[17] Fröhlich, W., 2004, Nachhaltiges Personalmarketing: Entwicklung
einer Rahmenkonzeption mit praxistauglichem Benchmarking-Modell, in: Fröhlich, W. (eds)., 2004, Nachhaltiges Personalmarketing -
Strategische Ansätze und Erfolgskonzepte aus der Praxis, Ritterbach:
Frechen. [18] Seiwert, L., 1985, Vom operativen zum strategischen
Personalmarketing, in: Personalwirtschaft, vol. 9, pp.348 - 353.
[19] Thom, N., 1994, Personalmarketing - auch in rezessiven Zeiten?, in: io Management Zeitschrift, vol. 4, pp. 72 – 74.
[20] Cappelli, 1999, “The new deal at work”, Harvard Business Review
Press: Boston/ USA. [21] Michaels E., Handfield-Jones, H. & Axelrod, B., 2001, “The war for
talent”, Harvard Business Review Press: Boston/ USA.
[22] Bloom, N., & Van Reenen, J., 2007, “Measuring and explaining
management practices across firms and countries”, in: Quarterly
Journal of Economics, vol. 122, no.4, pp. 1351 – 1408.
[23] Maertz, C. P. & Campion, M. A., 2004, “Profiles in quitting:
Integrating process and content turnover theory”, in: Academy of Management Journal, vol. 47, pp. 566 – 582.
[24] Foster, C., Punjaisri, K. & Cheng, R., 2010, “Exploring the relationship
between corporate, internal and employer branding”, in: Journal of Product & Brand Management, vol. 19, no. 6, pp. 401 – 409.
[25] Cappelli, P. & Neumark, D., 2004. “External churning and internal
flexibility: Evidence on the functional flexibility and core-periphery hypotheses”, in: Journal of Industrial Relations, vol. 43, no. 1, pp. 148
– 182.
[26] Hausknecht, J. P., Trevor, C. O. & Howard, M. J., 2010, “Unit-level voluntary turnover rates and customer service quality: Implications of
group cohesiveness, newcomer concentration, and size”, in: Journal of
Management, vol. 37, pp. 352 – 388. [27] Siebert, W. S. & Zubanov, N., 2009, “Searching for the optimal level of
employee turnover: A study of a large U.K. retail organization”, in:
Academy of Management Journal, vol. 52, no. 2, pp. 294 – 313. [28] Wood, S., Holman, D., & Stride, C., 2006, “Human resource
management and performance in UK call centres”, in: British Journal
of Industrial Relations, vol. 44, pp. 99 – 124.
The 3rd Human and Social Sciences at the Common ConferenceOctober, 5. - 9. 2015, www.hassacc.com
Management and Marketing eISSN: 2453-6075, cdISSN: 1339-522X10.18638/hassacc.2015.3.1.154 - 89 - ISBN: 978-80-554-1124-8

The local disaster management system: the crisis
cluster in the face of natural disasters
Zbigniew Piepiora
Wrocław University of Environmental and Life Sciences
Wrocław, Poland
Oliver Belarga
Osaka University
Osaka, Japan
Abstract — The article is the part of the research project entitled
‘Comparing Local Disaster Management Systems across Levels
of Development’. The aim of the paper is to verify the idea of the
cooperation within the confines of the crisis cluster and its
meaning in counteracting the effects of the natural disasters. The
example of Jelenia Góra in Poland (the Lower Silesian province)
is examined. The case of the Jelenia Góra district provides an
example of the stable form of crisis cluster. The cooperation
remains with the permanent coordination which is provided by
the County Crisis Management Center located in the Jelenia
Góra County Office and the Department of Crisis Management
in the Jelenia Góra District Office. The cooperation in
counteracting the effects of the natural disasters can provide the
higher security level and sustainable development.
Keywords - disaster, natural disaster, disaster management,
emergency management, crisis management, crisis cluster, Jelenia
Góra, district, county
I. INTRODUCTION
Floods, storms and extreme temperatures are examples of natural disasters. These phenomena can be defined, according to the Polish Natural Disaster Act, as an events connected with impacting of nature’s forces. Besides mentioned examples, catastrophes are also: blizzards, tornadoes, atmospheric discharges, seismic activity, intensive rainfalls, landslides, fires, ice’s phenomena on rivers, lakes, and water reservoirs and the sea, infestations of insects and diseases of plants, animals and people [17, art. 3].
The natural disaster can be started by natural factors: hydrometheorological (e.g. the storm), biological (e.g. the disease), geological (e.g. the seismic activity)[16]. It is often the sudden event with tragic effects which causes damages, suffering of people and also changes connected with the affected area.
The aim of the paper is to verify the idea of the cooperation within the confines of the crisis cluster and its meaning in counteracting the effects of the natural disasters. The Jelenia Góra district in Poland (the Lower Silesian province) is examined to recognize the type of cluster.
In the article, there is used the methodology from Zbigniew Piepora’s book entitled ‘Economic aspects of local natural disasters' policy’. This book entails the method of the research. First, the disasters occurring in the area of the country are recognized. The topographic map vs. the administrative map analysis in the context of occurring disasters is conducted on the local level of county/district (the LAU1 (NUTS4) local
level of administration). The municipalities/communes (the LAU2 (NUTS5) local level of administration) according to the specific form of disasters also are selected. In the different types of municipalities the cooperating institutions are recognized. After the field work, the crisis clusters are recognized [7, 14].
It is worth to notice that the article is the part of the research project entitled ‘Comparing Local Disaster Management Systems across Levels of Development’. The first stage of project was executed from June of 2014 to July of 2015, and headed by PhD Zbigniew Piepiora with co-investigators: Oliver Belarga PhD, Osaka University, Japan; Mark Anthony Alindogan RN, MPH, Save the Children International; Raju Sarkar M.Sc., Karlsruhe Institute of Technology[9, p. 391-395].
II. THE PAPER’S KEY WORDS: DISASTER,
DISASTER MANAGEMENT AND CRISIS CLUSTER
The key words for this project are: ‘disaster’, ‘disaster management’ and ‘crisis cluster’.
Disaster can be defined as ‘the situation or event, which overwhelms local capacity, necessitating a request to national or international level for external assistance. An unforeseen and often sudden event that causes great damage, destruction and human suffering. Though often caused by nature, disasters can have human origins. Wars and civil disturbances that destroy homelands and displace people are included among the causes of disasters. Other causes can be: building collapse, blizzard, drought, epidemic, earthquake, explosion, fire, flood, hazardous material or transportation incident (such as a chemical spill), hurricane, nuclear incident, tornado, or volcano. A disaster to be entered, for an example, into the EM-DAT database, at least one of the following criteria must be fulfilled: ten (10) or more people reported killed, hundred (100) or more people reported affected, declaration of a state of emergency, call for international assistance’[6; 3, p. 41-314; 1, p. 2-21].
Disaster management is also called ‘the emergency management’ or ‘crisis management’. It can be defined as ‘the organization and management of resources and responsibilities for addressing all aspects of emergencies, in particular preparedness, response and initial recovery steps’[16, p. 13-14; 4, p. 239-246].
Crisis cluster denotes ‘the conception of creating the cooperative and specialized groups of public utilities which act
The 3rd Human and Social Sciences at the Common ConferenceOctober, 5. - 9. 2015, www.hassacc.com
Management and Marketing eISSN: 2453-6075, cdISSN: 1339-522X10.18638/hassacc.2015.3.1.175 - 90 - ISBN: 978-80-554-1124-8
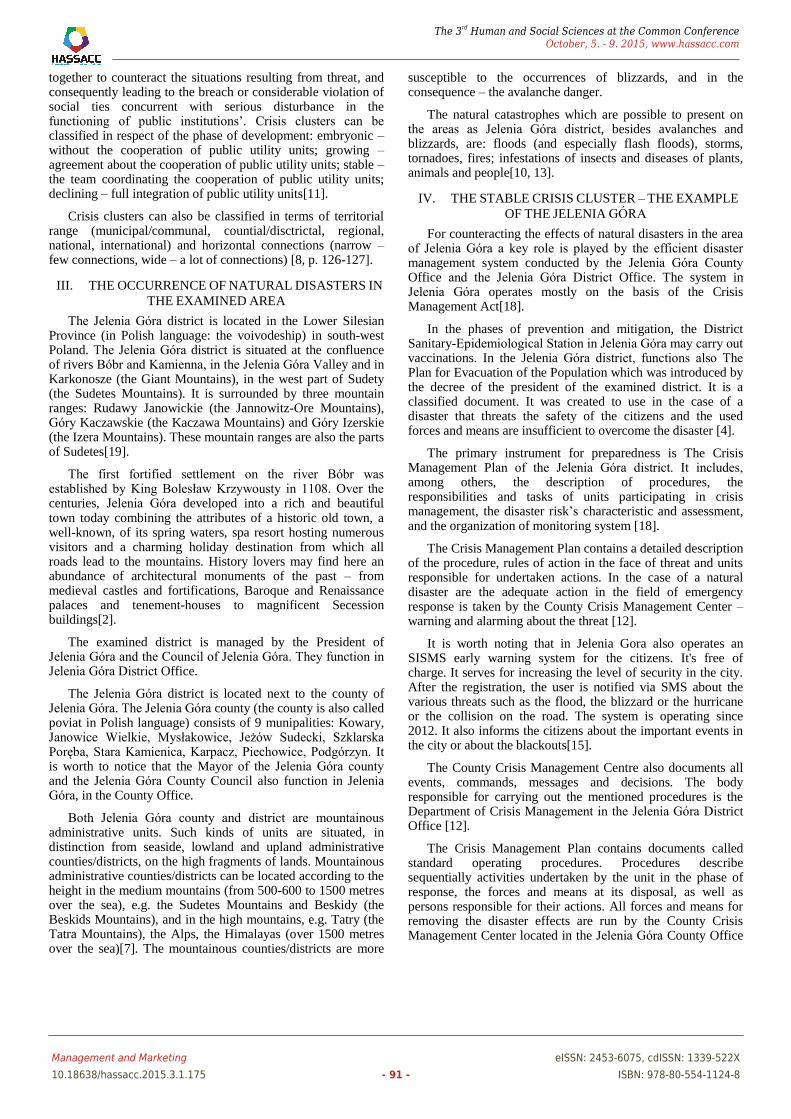
together to counteract the situations resulting from threat, and consequently leading to the breach or considerable violation of social ties concurrent with serious disturbance in the functioning of public institutions’. Crisis clusters can be classified in respect of the phase of development: embryonic – without the cooperation of public utility units; growing – agreement about the cooperation of public utility units; stable – the team coordinating the cooperation of public utility units; declining – full integration of public utility units[11].
Crisis clusters can also be classified in terms of territorial range (municipal/communal, countial/disctrictal, regional, national, international) and horizontal connections (narrow – few connections, wide – a lot of connections) [8, p. 126-127].
III. THE OCCURRENCE OF NATURAL DISASTERS IN
THE EXAMINED AREA
The Jelenia Góra district is located in the Lower Silesian Province (in Polish language: the voivodeship) in south-west Poland. The Jelenia Góra district is situated at the confluence of rivers Bóbr and Kamienna, in the Jelenia Góra Valley and in Karkonosze (the Giant Mountains), in the west part of Sudety (the Sudetes Mountains). It is surrounded by three mountain ranges: Rudawy Janowickie (the Jannowitz-Ore Mountains), Góry Kaczawskie (the Kaczawa Mountains) and Góry Izerskie (the Izera Mountains). These mountain ranges are also the parts of Sudetes[19].
The first fortified settlement on the river Bóbr was established by King Bolesław Krzywousty in 1108. Over the centuries, Jelenia Góra developed into a rich and beautiful town today combining the attributes of a historic old town, a well-known, of its spring waters, spa resort hosting numerous visitors and a charming holiday destination from which all roads lead to the mountains. History lovers may find here an abundance of architectural monuments of the past – from medieval castles and fortifications, Baroque and Renaissance palaces and tenement-houses to magnificent Secession buildings[2].
The examined district is managed by the President of Jelenia Góra and the Council of Jelenia Góra. They function in Jelenia Góra District Office.
The Jelenia Góra district is located next to the county of Jelenia Góra. The Jelenia Góra county (the county is also called poviat in Polish language) consists of 9 munipalities: Kowary, Janowice Wielkie, Mysłakowice, Jeżów Sudecki, Szklarska Poręba, Stara Kamienica, Karpacz, Piechowice, Podgórzyn. It is worth to notice that the Mayor of the Jelenia Góra county and the Jelenia Góra County Council also function in Jelenia Góra, in the County Office.
Both Jelenia Góra county and district are mountainous administrative units. Such kinds of units are situated, in distinction from seaside, lowland and upland administrative counties/districts, on the high fragments of lands. Mountainous administrative counties/districts can be located according to the height in the medium mountains (from 500-600 to 1500 metres over the sea), e.g. the Sudetes Mountains and Beskidy (the Beskids Mountains), and in the high mountains, e.g. Tatry (the Tatra Mountains), the Alps, the Himalayas (over 1500 metres over the sea)[7]. The mountainous counties/districts are more
susceptible to the occurrences of blizzards, and in the consequence – the avalanche danger.
The natural catastrophes which are possible to present on the areas as Jelenia Góra district, besides avalanches and blizzards, are: floods (and especially flash floods), storms, tornadoes, fires; infestations of insects and diseases of plants, animals and people[10, 13].
IV. THE STABLE CRISIS CLUSTER – THE EXAMPLE
OF THE JELENIA GÓRA
For counteracting the effects of natural disasters in the area of Jelenia Góra a key role is played by the efficient disaster management system conducted by the Jelenia Góra County Office and the Jelenia Góra District Office. The system in Jelenia Góra operates mostly on the basis of the Crisis Management Act[18].
In the phases of prevention and mitigation, the District Sanitary-Epidemiological Station in Jelenia Góra may carry out vaccinations. In the Jelenia Góra district, functions also The Plan for Evacuation of the Population which was introduced by the decree of the president of the examined district. It is a classified document. It was created to use in the case of a disaster that threats the safety of the citizens and the used forces and means are insufficient to overcome the disaster [4].
The primary instrument for preparedness is The Crisis Management Plan of the Jelenia Góra district. It includes, among others, the description of procedures, the responsibilities and tasks of units participating in crisis management, the disaster risk’s characteristic and assessment, and the organization of monitoring system [18].
The Crisis Management Plan contains a detailed description of the procedure, rules of action in the face of threat and units responsible for undertaken actions. In the case of a natural disaster are the adequate action in the field of emergency response is taken by the County Crisis Management Center – warning and alarming about the threat [12].
It is worth noting that in Jelenia Gora also operates an SISMS early warning system for the citizens. It's free of charge. It serves for increasing the level of security in the city. After the registration, the user is notified via SMS about the various threats such as the flood, the blizzard or the hurricane or the collision on the road. The system is operating since 2012. It also informs the citizens about the important events in the city or about the blackouts[15].
The County Crisis Management Centre also documents all events, commands, messages and decisions. The body responsible for carrying out the mentioned procedures is the Department of Crisis Management in the Jelenia Góra District Office [12].
The Crisis Management Plan contains documents called standard operating procedures. Procedures describe sequentially activities undertaken by the unit in the phase of response, the forces and means at its disposal, as well as persons responsible for their actions. All forces and means for removing the disaster effects are run by the County Crisis Management Center located in the Jelenia Góra County Office
The 3rd Human and Social Sciences at the Common ConferenceOctober, 5. - 9. 2015, www.hassacc.com
Management and Marketing eISSN: 2453-6075, cdISSN: 1339-522X10.18638/hassacc.2015.3.1.175 - 91 - ISBN: 978-80-554-1124-8

by the technical means of communication. In the case that the forces and means are insufficient to fight the disaster, the mayor of the Jelenia Góra district may submit an application to the mayor of the Jelenia Góra county, or to mayors of other counties in the Lower Silesian province, with a request to provide the assistance. The mayor of the Jelenia Góra district may also submit an application to the Governor of the Lower Silesia with a request to ask the competent authorities of the Ministry of Defense to support the activities by the military forces and means [12].
In the phase of response, a major role is played by the District Police Headquarters in Jelenia Góra. It carries out with the activities in the field of alarming and warning systems, and the clean-up, rescue and restore operations. The first group includes managing the forces and means at the disaster area, to process and transmit information necessary for the effective management of action, command and co-operation. The police also by their communication and broadcast equipment informs the population about the danger, and also monitors the threatened areas. In some cases, it is possible to provide the police means and communication systems to the other services for the information flow and to direct (only by the police) the activities of these services. The District Police Headquarters in Jelenia Góra is able to direct for action: 41 officers, 9 personal-terrain vehicles, 2 trucks, 1 pontoon and a generator [4].
Another unit engaged in the phase of response is the District Guard in Jelenia Gora. It is a formation subordinate to the president of the Jelenia Góra district, but for the carried out activities is responsible the commander of the district guard. For some of the tasks, the officer on duty is also responsible. He accepts the applications, coordinates the actions undertaken by the patrols and maintains communication with them. He cooperates with the County Crisis Management Team, the District Fire Service Headquarters and the District Police Headquarters in Jelenia Góra. The District Guard in Jelenia Gora disposes, if necessary, the police cars, the radio equipment for communications, as well as other equipment, depending on activities. Staffing officers of the district guard are chosen according to the needs arising from the situation and findings. In the face of a potential or real threat of disaster, the duty officer after consultation with the commander carries out with the necessary balance of forces and means to counteract the disaster. The district guard assists the other services involved in the fight with the disaster in providing the assistance to the victims, evacuating the residents, protecting the property in the affected areas and policing in places of the temporary stay of the population [12].
In the phase of response, the Head of the Department of Crisis Management in the Jelenia Góra District Office produces the documentation. He also estimates the losses [12].
In the phases of response and recovery, a key role plays the District Fire Service Headquarters (DFS HQ) in Jelenia Góra. It conducts and coordinates rescue operations. Accepts applications. Accepts, processes and distributes information. For all the actions taken, the responsible authority is the Commander of the DFS HQ in Jelenia Gora. If it necessary, the District Management Position of the DFS HQ may deploy the firefighters to coordinate the actions for municipal/communal
crisis management teams that cooperate with the County Crisis Management Center in Jelenia Góra [12].
The phases of response and recovery are connected with lowering of standards of living – blackouts and the risk of contamination of drinking water, food, the emergence of pests. In Jelenia Gora, functions Tauron Ekoenergia sp. z o.o. that provides the energy and the sanitary-epidemiological station. The District Sanitary-Epidemiological Station in Jelenia Góra performs tasks to ensure the health, safety and life. The Water and Sewage Enterprise ‘Wodnik’ (‘Aquarius’) draws water for the Jelenia Gora district from the intakes located within the administrative borders and situated in the neighboring municipalities. The contamination of the intakes is associated with the serious handicaps of functioning of the district and supplying of drinking water on tanks from other sources. The District Sanitary-Epidemiological Station in Jelenia Góra also estimates the additional needs in the terms of water supplying, conducting laboratory tests, and securing the sufficient quantities of disinfectant. It also sets the procedure in the case of a plague of pests (e.g. rats, mosquitoes). These types of animals often carry diseases, so sanitary-epidemiological station is monitoring the epidemiological situation [4].
In the case of disasters such as avalanches the Mountainous Search and Rescue is involved, in the case of droughts, floods and flash floods, in the all phases of the disaster management, the Regional Water Management Board (RWMB) – the branch in Podgórzyn is also involved in counteracting the effects of the disasters. The RWMB is an administrator of the rivers, polders and retention [20].
According to the authors, a complex system of disaster management in the Jelenia Gora district can be considered good. It can be draw as the crisis cluster.
V. THE DISCUSSION
As it is presented at the figure 1, the case of Jelenia Góra is an example of the stable, districtal/countial local crisis cluster. The examined cluster has wide horizontal connections.
‘The heart’ of the cluster is the Department of Crisis Management in the Jelenia Góra District Office which cooperates with the County Crisis Management Center. The cooperation of public utility units common for the Jelenia Góra district and the Jelenia Góra county takes place on the local level.
In the stable phase of the crisis cluster, the requirements of the Crisis Management Act are fulfilled for the Jelenia Góra district and country.
The 3rd Human and Social Sciences at the Common ConferenceOctober, 5. - 9. 2015, www.hassacc.com
Management and Marketing eISSN: 2453-6075, cdISSN: 1339-522X10.18638/hassacc.2015.3.1.175 - 92 - ISBN: 978-80-554-1124-8

Figure 1. The Jelenia Góra crisis cluster. Source: Own study.
VI. SUMMARY
According to the authors, the case of the Jelenia Góra district provides an example of the stable form of the local districtal/countial crisis cluster. The cooperation remains with the permanent coordination which is provided by the County Crisis Management Center located in the Jelenia Góra County Office and the Department of Crisis Management in the Jelenia Góra District Office.
The cooperation of public utility units is common for the Jelenia Góra district and the Jelenia Góra County. It takes place on the local level. The horizontal connections are wide.
In the stable phase of the crisis cluster, the requirements of the Crisis Management Act are fulfilled. The crisis cluster of the Jelenia Góra district can naturally come to the declining phase are, after upgrade come into the new life cycle. The cooperation in counteracting the effects of the natural disasters can provide the higher security level and sustainable development.
REFERENCES
[1] Abbott P. L., Natural disasters, San Diego State University, San Diego 2009.
[2] About Jelenia Góra, http://en.jeleniagora.pl/content/about-jelenia-g%C3%B3ra, 27.07.2015.
[3] Alexander D., Natural disasters, Wydawnictwo Springer Science & Business, Berlin 1993.
[4] Michał Brzywcz, Wybrane aspekty występowania powodzi na obszarze miasta na prawach powiatu Jelenia Góra, Praca magisterska pod kierunkiem dr. Zbigniewa Piepiory, Uniwersytet Przyrodniczy we Wrocławiu, Wrocław 2015.
[5] Casale R., Margottini C. (red.), Natural Disasters and Sustainable Development, Wyd. Springer, Berlin 2004.
[6] Emergency Events Database: The Office of Foreign Disaster Assistance / Centre of Research on the Epidemiology of Disasters (EM-DAT: OFDA/CRED), Université catholique de Louvain Bruksela, http://www.emdat.be, 4.09.2010.
[7] Piepiora Z., Ekonomiczne aspekty lokalnej polityki przeciwdziałania skutkom katastrof naturalnych (Economic aspects of local natural disasters’ policy), ed. Zbigniew Piepiora, Kowary 2012.
[8] Piepiora Z., Klaster kryzysowy jako element przestrzeni przeciwdziałania katastrofom naturalnym, w: Miszczak K, Przybyła Z. (red.), Nowe paradygmaty gospodarki przestrzennej, Biuletyn – zeszyt nr 236, Wyd. PAN KPZK, Warszawa 2008.
[9] Piepiora Z., Relacja z Ogólnopolskiej Konferencji pt. „Aspekty polityki gospodarczej, społecznej i przestrzennej (w wymiarze krajowym, regionalnym, lokalnym)” – Międzyzdroje, 22-24 września 2014 roku, w: (red.) B. Kryk, Gospodarka regionalna i międzynarodowa. Studia i Prace Wydziału Nauk Ekonomicznych i Zarządzania nr 37 tom 2, Wyd. Uniwersytet Szczeciński, Szczecin 2014, s. 391-395.
[10] Piepiora Z., Wybrane aspekty przeciwdziałania skutkom katastrof naturalnych na obszarze powiatu jeleniogórskiego, w: Współczesne problemy polityki ekonomicznej, red. S. Korenik, Z. Przybyła, UE we Wrocławiu / Jaremen Press, Jelenia Góra, 2008, ISBN 978-83-923545-6-7, s. 227-234.
[11] Piepiora Z., Kachniarz M., Piepiora P., The idea of the criss cluster in the municipality in the face of the natural disasters, w: L. Čechurová, M. Jiřincová (red.), Trendy v podnikání 2014. Recenzovaný sborník příspěvků mezinárodní vědecké konference (Business Trends 2014. Reviewed conference proceedings), Vydala Západočeská univerzita v Plzni, 2014, ISBN 978-80-261-0444-5.
[12] Plan zarządzania kryzysowego miasta Jelenia Góra, Urząd Miasta w Jeleniej Górze.
[13] Procedury informowania, ostrzegania i alarmowania o zagrożeniach w powiecie jeleniogórskim, Starostwo Powiatowe w Jeleniej Górze, Wydział Zarządzania Kryzysowego i Spraw Obronnych, Jelenia Góra sierpień 2004.
[14] Schmidt-Thomé P. (ed.), The Spatial Effects and Managementof Natural and Technological Hazards in Europe, ESPON 1.3.1. Executive Summary, Wyd. Geologian Tutkimuskeskus, Luxemburg 2006.
[15] System ostrzegania SISMS, http://www.jeleniagora.pl/content/system-ostrzegania-sisms, 27.07.2015
[16] Terminology on Disaster Risk Reduction, UNISDR 2009.
[17] Ustawa z dnia 18 kwietnia 2002 r. o stanie klęski żywiołowej, Dz. U. 2002 nr 62 poz. 558 z późn. zmian.
[18] Ustawa z dnia 26 kwietnia 2007 r. o zarządzaniu kryzysowym, Dz.U. 2007 Nr 89 poz. 590 z późn. zmian.
[19] Welcome, http://en.jeleniagora.pl/content/welcome, 27.07.2015.
[20] Zmiany w RZGW - nowe Zarządy Zlewni w Podgórzynie i Legnicy, http://wroclaw.rzgw.gov.pl/pl/shownews/40/3820/Zmiany_w_RZGW_-_nowe_Zarzady_Zlewni_w_Podgorzynie_i_Legnicy, 27.07.2015.
The 3rd Human and Social Sciences at the Common ConferenceOctober, 5. - 9. 2015, www.hassacc.com
Management and Marketing eISSN: 2453-6075, cdISSN: 1339-522X10.18638/hassacc.2015.3.1.175 - 93 - ISBN: 978-80-554-1124-8

Ideal of cognition in Dao philosophy and education
Maria Butucea
Technical University of Civil Engineering,
Lacul Tei Bdv., No.122-124, Bucharest, Romania
Minnan University, Fujian, China
Abstract — The ideal of knowledge means how to use all our
abilities in order to understand Nature as it is. The ideal of
knowledge can show father the ideal of sage, philosophy and
scientist or any cognitive subject. Daoism it the oldest Chinese
philosophy, which provide some kind of ideal of cognition
available, even in a present days in education.
Keywords- Ideal of cognition, Dao philosophy, education
I. INTRODUCTION
If Daoism is a philosophy or a religion, it doesn’t matter anymore from some time now. Scholars put this question in order to separate theory of knowledge by ethical advices. But Wing-Tsit Chan [7] claims that Daoism as religion is a degeneration of Daoism as philosophy. He’s point of view was that Dao as philosophy (daojia) and Dao as religion (daojiao) are entirely different traditions. (Chan, 1967)
Our interest is not to separate philosophy and religion knowledge from ethic. To separate philosophy from religion is only a western point of view and it doesn’t work for Chinese thinking. Daoshi (Daoist masters) offered insights we might call philosophical aphorism. (Bokenkamp, 1997) But they also practiced meditation and physical exercises, studied nature for diet and remedy, practiced rituals. (Robinet, 1997) The question if Daoism is a philosophy or a religion is not one we can ask without imposing a set of understandings, presuppositions, and qualifications that do not apply to Daoism. But this is not a reason to discount the importance of Dao thought. (Chan, 1991) Quite to the contrary, it may be one of the most significant ideas that classical Daoism can contribute to the study of philosophical background of different culture and education in the present age and understand if there are different ideal of cognition. So, it is hard to separate ethical concepts from epistemological ones.
Even so and accepting the connections of them we can work out and find more. What we claim here is that we can study the cultural background using the concept of ideal of knowledge integrate in education at hidden level of Chinese mind.
Nowadays is well known the role of cultural background for a integrative education and globalization. (Nisbett 2003/2004). Richard Nisbett in “The Geography of Though. How Asian and Westerns Think Differently and...Why?” has cited authors like Stich, Riegel and Basseches who had introduce the concept of de reflective equilibrium. [18] [21] Our claim in this paper is to realize this kind reflective equilibrium following the diversity of way of thinking and after that to make the future integrative education.
II. EPISTEMOLOGY AND FUNDAMENTAL CONCEPTS IN
DAOISM
Chinese philosophy has been dominated by questions of change: why is there change rather than stability? What is the relationship between change and human action? (Henricks, 1989; LaFargue, 1992) European philosophy has long been dominated by questions of epistemology: What do we know? How do we know it? How can we justify our claims to knowledge? (Aristotel, 1961; Penrose, 1994) Are there patterns of change that we can detect and use to our advantage? Westerner cognitive ideal is to separate as much as possible subject and object (classical science), repeatability of event without changing too much, experiment and outside observation and finally the goal is to manipulate nature in our advantage and more comfort. Nowadays all this are taught everywhere as ideal to practice a true science, including in Chinese schools.
What about ancient and meanwhile contemporary Chinese mind? It seems, despite globalization, still remains differences. There is still something we don’t understand how they are working and why. What about to have a look at philosophical background, to be more specific, regarding on cognitive and action ideal or both?
The concept of Dao means “road” is the ultimate reality and is often translated as “the way.” It might be used also the term of method. Is it a method for what? It is for understanding the world as it is or for moral purpose? It is a kind of ideal? It is well known that scholars agreed that moral is the main topic of Chinese philosophy, (Fried, 2012; Granet, 2006), but if Daoism asks some requirement for the sages’ behavior that must be at first something to be known or understand by them. It must be the structure of the Universe and after that the method, the way of understanding it and act accordingly. (Hansen, 1992) So, according to Daoism, Dao is the process of reality itself, the way that things come together, while still transforming. Reality is a process. All this reflects the deep seated Chinese belief that not the stability, but the change is the most basic character of things. Dao, therefore, does not “do” anything, but, similar to gravity, it provides the context out of which potentiality actualizes from formless to form, from non-experienced to the experienced. The patterns of this change are symbolized by Yin and Yang as relations of correlative forces. Dao is the alteration of these qualitative forces. Yet, reality is not ordering into one unified whole. It is the 10,000 things (wanwu). There is the Dao, but not “the World” or “the Cosmos” in a Western sense. (Lin, 1977)
The 3rd Human and Social Sciences at the Common ConferenceOctober, 5. - 9. 2015, www.hassacc.com
Educational sciences eISSN: 2453-6075, cdISSN: 1339-522X10.18638/hassacc.2015.3.1.187 - 94 - ISBN: 978-80-554-1124-8

The book Dao De Jing, written by Lao Zi, teaches that humans cannot fathom the Dao, because any name we give to it cannot capture it. It is beyond what we can conceive (ch.1). [5], [14]Those who wu wei may become one with Dao, and thus “obtain the Dao”. ”Wu wei”, traditional rendering of it as “non-action” or “no action” is incorrect. Wu wei means something like “act naturally”, “effortless action,” or “non-willful action”. The ideal person, the sage (sheng ren), the true person (zhen ren) in the Dao De Jing, always wu wei. Let review some ideas of this book, necessary to make a scheme for theory of knowledge, how we can learn and father more the linking to education.
A central theme of the Dao De Jing is that
correlatives are the expressions of the movement of Dao. Correlatives in Chinese philosophy are not opposites, mutually excluding each other.
They represent the web and flow of the forces of reality: yin/yang, male/female; excess/defect; leading/following; active/passive. As one approaches the fullness of Yin or Yang, the other begins to horizon and emerges.
Internal alchemy or reflexive mind. Sages concentrate their internal energies (qi).They clean their vision (ch. 10). They manifest plainness and become like not carved wood (pu). (ch. 19) Sages know the value of emptiness, nonmaterial things as illustrated by how emptiness is used in a bowl, door, window, valley or canyon (ch. 11). [5],[14]
Us conscious and unconscious mind, rational and irrational mind, deduction and intuition as well, heart-mind (xin). They preserve the female (Yin), meaning that they know how to be receptive and are not unbalanced favoring assertion and action, the masculine (Yang) (ch. 28). They shoulder Yin and embrace Yang, blend internal energies (qi) and thereby attain harmony (he) (ch. 42). Those who are following the Dao use their heart-mind (xin) to “solve” or “figure out” life’s apparent knots and entanglements (ch. 55). [5],[14]
Respect the nature (like water). Never do anything by force, but only following the flows of processes. Indeed, the Dao De Jing cautions that those who would try to do something with the world will fail; they will actually ruin it (ch. 29). [5],[14]
Sages do not engage in disputes and arguing, or try to prove their point (chs. 22, 81). They are like water (ch. 8), finding their own place, overcoming the hard and strong by suppleness (ch. 36). [5],[14]
Sages act with no expectation of reward (chs. 2; 51) and live in harmony. They put themselves last and yet come first (ch. 7). They never make a display of themselves, (chs. 72, 22). They create peace (ch. 32). Creatures do not harm them (chs. 50; 55). Soldiers do not kill them (ch. 50). [5],[14]
So, the ideal of knowledge means how to use all our abilities in order to understand Nature as it is. Never force,
never impose anything and without separation between subject and object. Actually the subject is part of object, part of nature.
The ideal of knowledge can show father the ideal of sage, philosopher scientist and for any cognitive subject. For Dao ideal, any observation is a separation; any possible experiment is an intrusion in the flow of events of nature. Even the art of arguments, so gladly use by Greeks in order to find the truth, are not accepted. Subject of knowledge must be in harmony with object and with other people. Our ideal makes us hungry about truth, for Daoist anything new is like a déjà-vu.
III. CHINESE LANGUAGE AND CHINESE COGNITIVE
CONCEPTS
Ii is important to talk about language because Chinese language is a mind organizer. (Butucea, 2009) Is Chinese language more appropriate to express and capture the flow of events? Chinese is quite different in structure and grammar then westerner languages. In this language words have a dynamic meaning. Words express more action than stable things. The Truth (Zhen) is not a correspondence with an event, but the dynamic concept about how things are changing in time and space. The concept of “Nature” is Ziran (something developing without any cause!) In Chinese any noun can become a verb. By example, Dao become sometimes daoing (the action to seek the truth, being on the road!) And there are many other words which can make the mind able to observe connections and relations in the World’s net. (Girardot, 1983)
So far, they can observe better the relationships then isolation, they can accept community as a unity, they are less egoistic and much modest and they accept to work hard and have rest like Yin and Yang. It is seams that Chinese Language has a Dao structure, or ideal and makes understandable knowledge always in term of process and relation.
IV. IDEAL OF COGNITION USED IN A THEORY OF EDUCATION
One of the most fundamental teachings is that human discriminations, such as true or false in knowledge as also in morality (good, bad) and aesthetic (beauty, ugly) generate the troubles and moral problems (ch. 3a) [5],[14]. Some teachings of Dao De Jing have educational implication. So, ethic remains just an extinction of epistemology. Knowledge of natural lows is previous to human and social lows. It is better to practice wu-wei in all endeavors, act naturally and not willfully try to oppose to it, tamper with how reality is moving. The flow of events is the true knowledge, but not the stability. The main core of a possible implicit theory of education is in the following sentences:
Learning about relation and have dynamic point of view is the correct educational attitude.
Sages always think that everything is hard, so they work diligently in order to have achievements.
Mind as rational mind cannot design alone the real world and description is always lacking the true of the reality because that is changing forever. We need an integrative view regarding the whole.
Mankind must work with modesty in the vast creation of the Universe. To be quite is a virtue of sage, not a
The 3rd Human and Social Sciences at the Common ConferenceOctober, 5. - 9. 2015, www.hassacc.com
Educational sciences eISSN: 2453-6075, cdISSN: 1339-522X10.18638/hassacc.2015.3.1.187 - 95 - ISBN: 978-80-554-1124-8

sign of stupidity. Actually, only stupid people are pretending to possess the true and always speak lauder.
To access the true of Nature (Zi Ran,) we must use quite mind (meditation, deep reflection as better way than calculation) or balancing work and relaxation as Yin and Yang. Here is also a concept of learning that they call “absobtion”, that is very difficult to us to understand it. Might be cognition without separation between subject and object of knowledge, or might be a kind of deep refection focused on nature no matter human’s product, abstraction or physical one, or keep in mind all of those together. I should mention here that it not the main purpose of this article to discuss this concept, but only notice it.
And most important teaching of Daoism is do not force anything. Act accordingly the flow of natural processes, social events or psychological and physical needs. This is the meaning of controversial concept ”wu wei”, so much discussed in the literature on this topic. Might be also view as ecological attitude that we can discover nowadays (Barry, 2010).
Compartivists authors [8] [10] [11] [13] [19], [21],[16] emphasized that Confucius and his followers wanted to change the world and be proactive in setting things straight. They wanted to tamper, orchestrate, plan, educate, develop, and propose solutions. Dao ideal of cognition and action take their hands off of life, and Confucians ideal want their fingerprints on everything. So, Chinese philosophy has own philosophical confrontation. Imagine this comparison like this: If the Daoist goal is to become like a piece of natural wood, authentic sincere, according to himself, creative, the goal of the Confucians is to become a carved sculpture. The Dao ideal use the piece of wood just as it is found, but the Confucians polish it, shape it, and decorate it. Confucians think they can engineer reality, understand it, name it, control it. Dao philosopher following the ideal of cognition and action thinks that such endeavors are the source of our frustration and fragmentation and falsity (chs. 57; 72) [5],[14],[19],[20].
In the past Daoism became a complete philosophy of life, reaching into religion, social action, and individual health and physical well-being. Nowadays Daoism is not dead not at all. The natural abilities of mind are the some from century, said the cognitivists, we only add new theory, new languages which are only mind’s tools. (Miclea, 2003) Might be Dao theory of knowledge or Chinese languages new tools or instruments for better understanding the Universe, how to teach and learn something about?
V. DAO BACKGROUND AS IDEAL IN CHINESE SCHOOL
Living and teaching in China from some time now, reading and translating some ancient text, we found, using also observation and interacting for long time with students and teachers, that they have a deep philosophical background as popular metaphysic. I will try to present briefly here some contemporary example which can be interpreted as Dao ideal roots for their style of life, teaching and learning in contemporary schools:
To be focus on connection more than on things. All examples in textbooks, experiments are focus in connection of things and evolution. When they are teaching about relationships they are focused on examples like family, community, brotherhood and so on.
Modesty of student and teacher. Chinese students are quite in the classrooms and avoid to express them self. To be modest is considered a Buddhist, Confucians advice, but it is repeated again and again in Dao De Jing and in everyday life by parents and teachers. “Those who know don’t speak, and those who don’t know speak lauder”. Therefore, the student waits very quietly to be asked by teacher and after that give the answer, doesn’t matter the topic. The arrogance, self-expression is blamed by mats and by authorities.
Chinese students, children, teachers are very diligent and practice again and again their tasks. Make effort is the key point of their success. Lao Zi elucidated those concepts clearly in the 41st Verse of the Dao De Jing: “When the best student hears of the Dao/he strives with great effort to know it“.[5],[14] Practice means not only memorization but is also applications, studies in different situation. They work hard, following diligently every step, in details and never complain. They never say “I am the best”, like westerner when have success, they only say “I try to do this”. Diligent practice is the path to success.
Making a balance between work and rest is respect Yin Yang processing. Language require semantic memory, so they more able to recognize in context shapes, names and the meaning of a connection. Yin and Yang expresses the balance in every school activity they have done. They practice sport and martial art (see in Modern Curriculum) and also meditation and music for relaxation.
VI. INTEGRATIVE VISION
To be focus in connection, not only in separation is very important as attitude in the process of knowledge in many subjects, so we can assume in our theory of teaching and learning as well. We also can assume that cognitive ideal. We can improve the self-image of students by sayings: Be yourself! Express yourself! like American way, but also we can assume that not all student can verbalize in the classroom, not all of them work in team or assume the same principals of life style.
We should try to understand individuality before integrate in universal educational theory and design requirements. The hedonist vision in school is not totally motivating state of mind for knowledge, therefore you assume that working hard and take responsibility can led our students to achievements. It might be many other possible points that we can learn from Chinese style of thinking and from their philosophical background.
The 3rd Human and Social Sciences at the Common ConferenceOctober, 5. - 9. 2015, www.hassacc.com
Educational sciences eISSN: 2453-6075, cdISSN: 1339-522X10.18638/hassacc.2015.3.1.187 - 96 - ISBN: 978-80-554-1124-8

VII. CONCLUSIONS
In short, after all we found and presented above, Chinese mind had a cognitive ideal background of Dao; even they pretend and claim they have Confucian conception of life or that are teaching, learning and behaving in a modern contemporary style like western. Even they accept and learn English and western style of life or whatever from western culture they still had a secret. They deeply assumed a Dao ideal. To make sense to themselves the western points of view, they transform all western teaching and sciences in their own way of understanding the word, accordingly to their ancestral tacit philosophy.
The reverse of the coin is also available: let’s start to better understand their tacit hidden philosophy and exchange ideas about knowledge and education. Daoism even mixed, “absorbed” in Confucianism or Buddhism is still alive. Maybe this unconscious process at the hidden level of Chinese mind is less studied by scholars and we must make some efforts using more appropriate tools than observation and deduction in order to discover it.
REFERENCES
[1] Aristotel, Analitica secundă, Organon III, Editura ştiinţifică, Bucureşti. 1961.
[2] A. Barry, A Dao of Technology? Published online: 10 April 2010 # Springer Science+Business Media B.V.
[3] St. R. Bokenkamp, Early Daoist Scriptures. Berkeley: University of California Press. 1997.
[4] M. Butucea,.„How language could work as a "logical organizer" of Chinese thinking style” în „Buletinul Institutului Politehnic din Iaşi” Ed. Universitatea Tehnică Gh. Asachi, Iaşi - Romania, Socio-Umane 2009. pp. 37.
[5] M. Butucea, Aforisme filosofice - Dao De jing. Traducere. Ed. ProUniversitaria, Bucharest. Romania. 2014.
[6] A. Chan. Two Visions of the Way: A Translation and Study of the Heshanggong and Wang Bi Commentaries on the Laozi. Albany: State University of New York Press. 1991.
[7] Chan, W. T. (1967). The story of Chinese philosophy in C. A. Moore (ed.), The Chinese Mind: Essentials of Chinese Philosophy and Culture. East-West Center Press. Honolulu.
[8] D. Fried, What’s in a Dao? Ontology and Semiotics in Laozi and Zhuangzi. Published online: 27 October 2012 # Springer Science+Business Media Dordrecht.
[9] N. J. Girardot, Myth and Meaning in Early Taoism: The Theme of Chaos (hun-tun).Berkeley: University of California Press. 1983.
[10] M. Granet. Gândirea Chineză. Editura Herald. Bucureşti. 2006.
[11] C. Hansen. A Daoist Theory of Chinese Thought. New York: Oxford University Press. 1992.
[12] R. Henricks, Lao-Tzu: Te-Tao Ching. New York: Ballantine. 1989.
[13] M. LaFargue. The Tao of the Tao-te-ching. Albany: State University of New York Press. 1992.
[14] P., J. Lin. A Translation of Lao-tzu’s Tao-te-ching and Wang Pi’s Commentary. Ann Arbor: University of Michigan. 1977.
[15] Lao Zi. Cartea despre Dao şi putere, cu ilustraţii din Zhuang Zi, introd., trad. Din chineza vech şi note de Dinu Luca, Ed. Humanitas, Bucureşti. 1993.
[16] H. Maspero, Taoism and Chinese Religion. Amherst: University of Massachusetts Press. 1981
[17] M. Miclea, P. Curşeu, Modele Neurocognitive, Editura ASCR, Cluj-Napoca. 2003.
[18] R. Nesbitt, The Geography of Though How Asian and Westerns Think Differently and...Why?” Free Press Sydney. 2003/2004.
[19] I. Robinet, Taoism: Growth of a Religion. Stanford: Stanford University Press. 1997.
[20] Penrose, R. Mintea noastră cea de toate zilele. Editura Tehnică. Bucureşti. 1996.
[21] YU Zhenhua. The Expansion of Epistemology: The Metaphysical vs. the Practical Approach. Published online: 20 January 2012 # Springer Science+BusinessMedia B.V.
The 3rd Human and Social Sciences at the Common ConferenceOctober, 5. - 9. 2015, www.hassacc.com
Educational sciences eISSN: 2453-6075, cdISSN: 1339-522X10.18638/hassacc.2015.3.1.187 - 97 - ISBN: 978-80-554-1124-8

Methodological innovation for learning mediation
Esther Luna González
University of Barcelona
Methods of Research and Diagnosis in Education Department
Barcelona, Spain
Abstract – This paper shows a teaching innovation project aimed
at students who have completed courses in mediation in Degrees
of Pedagogy and Social Education at the University of Barcelona;
This project aims to improve the teaching and learning of the
students through their participation in the development of
audiovisual material for their training. Of all students of
mediation, 17 students have participated as a pilot group; we
present the process followed and the results obtained.
Keywords- Conflict resolution; mediation; innovation;
university; teaching Project
I. INTRODUCTION
The training of mediators and mediation for conflict resolution is a real need and necessary in today's society. For over 20 years Catalonia opted for mediation. Currently, the Law 15/2009, of 22 July, mediation in the field of private law in Catalonia and the Royal Decree-Law 5/2012, of 5 March, Mediation in civiles affairs and commercial highlights the importance of mediation, constituting a professional profile for the students of the Faculty of Education.
For this reason, teachers mediation of the Department of Research Methods and Diagnosis in Education has constituted a team of work. Furthermore, as an added value to the project presented, the teaching team also consists of professionals active in mediation; This aspect gives the project a more practical nature, real and close the area to work.
The purpose of this teaching team is that the students themselves of the various courses of mediation can participate actively in a process of preparing of material with the video as a methodological strategy.
This participation has a dual purpose; first, the students involved in the preparation of a video training in mediation is a motivating element [1] and considered methodological strategy in their learning process, allowing the achievement of meaningful learning; and, moreover, the final product can be used by students next year as material for training. Thus, approaches the reality of mediation in the classroom and beyond the characteristics of mediation as an alternative dispute resolution technique (such as to be a confidential process) which prevent a practical-applied .
So video content are four mediations conducting for students, each of them relating to a field of mediation (criminal, school, family and community). The role of teachers is advisory, monitoring and boost; the main role of the activity is in the student.
II. THE DIDACTICAL USE OF VIDEO
In the 80s, in the field of anthropological and cultural research arises the use of videos for academic purposes [2] [3]. In earlier times its use was limited due to its high cost, complexity of use and lack of familiarity with recording equipment [4]. Rapid advances in video technology, have become a source of unlimited possibilities [3] and accessible to non-professional users [4]. However, despite its increasing use in research and its ability to capture the complexities of teaching, classroom use is still raising questions of when, how and why to use [5] [6].
Wise use in class could substantially increase the amount and quality of time spent teaching [7]. It could also enrich the teaching of many scientific disciplines [8]. Linking auditory and visual information, the video provides a multisensory experience to the student [9]. So, as we have said elsewhere [10], the data retained by the student would be 20% of what they listen, 30% of what they see and 50% of what they see and listen. Based on similar analyzes [11] argues that the simultaneous processing of auditory and visual information of the video, could help in learning.
The video could improve learning complex skills to expose students to events that can not be easily proven otherwise [12]. The video, which allows students to observe real objects and scenes, sequences see and hear moving stories [13]. From the perspective of students, the video may be a more effective way than the text, to improve motivation in learning processes [14]. Economically [15] this is profitable to save costs to be reused.
(This section has been translated of the article [16]).
III. AIMS
This innovative project aims to:
Improve the learning of students participating in mediation matters through involvement in the development of audiovisual material.
This general objective is broken down into the following specific:
Knowing the initial state of the students in the mediation.
Knowing the meaningful learning produced by methodological innovation in students (pilot group) in relation to students who follow the training process established in the syllabus.
The 3rd Human and Social Sciences at the Common ConferenceOctober, 5. - 9. 2015, www.hassacc.com
Educational sciences eISSN: 2453-6075, cdISSN: 1339-522X10.18638/hassacc.2015.3.1.167 - 98 - ISBN: 978-80-554-1124-8

Identify the key elements of the process followed by the pilot group that has led to the improvement of learning.
IV. DEVELOPMENT
There have been five mediations (5 groups). Each group have been formed by 3 or 4 students and have embraced the following areas: community, business, school and juvenile justice. The role of teachers (5 have been participants) has been accompanying advice, supervision and dynamic; because is the student who has the main role.
The methodology followed by the students to carry out the project was the seminar format (there have been two seminars, one in the morning (six students) and afternoon (8 students) in both Seminars have attended the five teachers participating in the project).
The classes of mediation are two days a week for two hours each class and the involvement of students in the project began some weeks later to start the course. The idea is that the students could acquire the basic knowledges the first weeks. After these weeks, one day was a more theoretical class and the other was more practical. The students who participated in the project did not have to attend to practical classe if they wished, because that day they had Seminar (Project).
Each group had to prepare a conflict situation and manage it through mediation. The students could to meet with the teachers independent of the Seminar days.
V. WORK PLAN
The project consists of three phases or moments that refer to themselves phases of the evaluation process in terms of training:
- Initial phase. At the beginning of each of the three subjects are explained to students the educational project which is intended to carry out and it was the students themselves who decided to be part of it. If there had been more interested students than expected (24 students in total), had asked for a letter of motivation and individual interviews had been conducted. This phase also applied a test in order to know their initial state about mediation knowledge.
This phase allowed us to form the pilot group and have a first approach to the initial state of knowledges about mediation that students had.
- Process phase. Once formed the pilot group, the students, in continuous supervision with teachers chose the field of mediation, wrote the case, produced the script of mediation, did the filming and finally, to joint sessions with teachers, they learned with the elaboration of the guide for the analysis of the cases.
These tasks gave us evidences of learning process that allowed us to visualize qualitatively meaningful differences between student pilot and the pilot not.
- Final phase. This phase refers to the final evaluation of the project as it allowed us to close the teaching-learning process started. We applied again to all students the test to ascertain whether there were meaningful differences between the initial
knowledge and level of achievement between the two groups of students (pilot and pilot) and identify what these differences were.
Meanwhile, there were two reflection sessions with each of the groups (pilot and pilot) to assess the usefulness and significance which led them to their learning process. In these sessions we observed that participation in the development of video led to an improvement in their learning in the mediation.
The tasks that the students always conducted with the support, monitoring and assessment of educational seminars and tutories, were the following:
Preparation of cases.
Script development of mediation
Staging of mediation and filming it.
Analysis of mediation.
Preparation of analysis guide for each mediation.
The development of the analysis guide was a tool for reflection and analysis, both for the students involved in the video and for students who then use it as a learning tool in mediation. This reflection had a direct impact to meaningful learning content in students [17].
The contents worked on each of the mediations were those of each of the subjects of the course where the students belonged, emphasizing:
The technical development of the mediation process.
Escalating conflicts.
The communication models.
It was intended to reinforce the work of these aspects to two main issues. First, because they are transversal issues for each of the students involved in the project. And secondly, because it responds to the need for resources and educational materials on mediation.
VI. SAMPLE
The project presented was applied to 17 students who participate in both courses mediation of Degree Pedagogy and Social Education.
VII. TECHNIQUES FOR GATHERING INFORMATION
The results of the students participating in this process were compared with results obtained by others students. Therefore the following techniques were applied to gather information:
Proof of contents. This test looks at the contents of the subject in order to know the initial state of knowledge and their level of achievement at the end.
Products of students. The activities that students (pilot and no pilot) has done throughout the process, considering them as evidences of their own learning process.
Sessions of students. At the end of the course, the teacher conducted an assessment session thoughtful
The 3rd Human and Social Sciences at the Common ConferenceOctober, 5. - 9. 2015, www.hassacc.com
Educational sciences eISSN: 2453-6075, cdISSN: 1339-522X10.18638/hassacc.2015.3.1.167 - 99 - ISBN: 978-80-554-1124-8

nature with the students participating in the course, and another with the students of the pilot group.
The timing of the project was from October to February. Being the participation of students from November to January.
VIII. EVALUATION
There were two types of assessments:
a) Evaluation of students which is conducting a portfolio of reflective demonstrated that meaningful learning has meant participation in the project, the aim is to foster an evaluation trainer that has its origin in the students and is based on self learning [18]. This evaluation was a tool in itself analysis for the evaluation of the project.
We should add that at the start of the courses was explained to the students the educational project being carried out in order to motivate to the participation. In the case of more than three students interested per classroom, is necessary a personal interview and a letter of motivation to choose the students. It was not necessary.
b) Evaluation of the project; to assess the improvement of learning of students participating in mediation matters have established evaluation indicators putting them in connection with the evaluation object corresponding phase of the work plan on running and collection techniques and sources of information that have been applied to obtain the information:
Project aim Knowing the initial state of the students
about mediation.
Test content to students (both groups, pilot
and not pilot
Object of
evaluation
Knowledge mediation
Phase work
plan
Initial
Indicators Description of the initial state of
knowledge, skills and attitudes of students
in relation to the course content.
Strategies and
sources of
data
collection
Test content to students (both groups, pilot
and not pilot.
Project aim Knowing the meaningful learning which
has produced methodological innovation in
students in the pilot group in relation to
students who follow the training process
established in the syllabus.
Object of
evaluation
Differences in the learnings.
Phase work
plan
Process and final
Indicators Reaction of students to the methodology:
- Level of motivation
- Evaluation of the activities throughout the
process
- Assessment of the contents learned
- Assessment of the significance of the
process
- Level of interest in the methodology
Changes observed in students:
- Development of mediation skills
- Achievement of learning
- Reflection and critical analysis
- Level of autonomy and initiative to
undertake mediation
Strategies and
sources of
data
collection
Test of contents and products of students
(both groups) and joint sessions between
students (both groups separately) and
teachers.
Project aim Identify the key elements of the process
followed by the pilot group that has led to
the improvement of learning.
Object of
evaluation
Elements that can promote/hinder a
meaningful improvement in learning.
Phase work
plan
Process and final
Indicators - Elements that have favored the
improvement of learning in students.
- Difficulties presented throughout the
process.
- Effects on training as professionals
mediators.
Strategies and
sources of
data
collection
Products of students (both groups) and joint
sessions between students (both groups
separately) and teachers.
IX. CONCLUSIONS AND PROSPECTS
As university teachers responsible for the education of students in the Faculty of Education, we must respond to social demands in order to form professional mediation with quality. This is why it is necessary to emphasize the acquisition of meaningful learning. This project has involved not only the achievement of improved learning, but also the achievement of the following specific competences:
a. Being able to analyze conflicts from a comprehensive perspective that allows broad
The 3rd Human and Social Sciences at the Common ConferenceOctober, 5. - 9. 2015, www.hassacc.com
Educational sciences eISSN: 2453-6075, cdISSN: 1339-522X10.18638/hassacc.2015.3.1.167 - 100 - ISBN: 978-80-554-1124-8

visions neutral and respectful with the feelings of each party.
b. Being able to establish communication paths between the parties in order to unlock situations of isolation far from their interests.
c. Being able to provide new perspectives on the conflict situation in order to complement the various parts of speech, and generate possibilities approach in finding a solution.
d. Being able to design arrangements that may lead to the acceptance and satisfaction of the parties in conflict.
e. Being able to propose specific programs and intervene in various areas of conflict management.
Therefore, this project has resulted in an impact to the extent that students participating in the project has been able to develop these skills, which has allowed him to complete training as mediators.
Moreover, the results obtained from the analysis of data from different techniques to gather information, refer to:
Significantly improves the learning of students in the pilot group compared to other students in terms of meaningful learning, greater mastery of content (mediation and conflict), more motivation and interest mediation, acquisition of specific skills and greater capacity for analysis.
Establishment of the key elements that has made the improvement of learning referring to: a teaching-learning meaningful and based on real experience, monitor the process of training students, the format of the sessions (seminar), and reflective practice sessions generated.
This has been possible because:
New technologies incorporated in the teaching-learning are an element of motivation in students.
The student is the key player in the teaching-learning process, which helps to improve learning [19].
It promotes reflection, being an indispensable tool through which students acquire knowledge and skills [20].
Transferability of the results: The results achieved with the project may well be
transferable to other courses or to other degrees.
This is possible because what is proposed is a change in methodology in the process; a participatory methodology in which the protagonist of the process of teaching and learning are the students, thereby promoting the autonomy, initiative and responsibility. Instead, teachers have a supervisory role, catalyst and advisor; Video being didactic strategy to optimize learning. Therefore, in this regard, that teachers predisposed to a more active methodology can replicate the process in its course.
X. ISSUES AND/OR CONSIDERATIONS FOR DISCUSSION
Experiences are presented as an example where, from practice, students have the opportunity to build knowledge applied to their future profession, they match problems, real or alleged, reflecting, seeking consensus on the theory and reference resolution of the case. We believe that a good professional training must start training people active in their learning, and thus overcome passive learning, promoting the role of student and facilitating processes that allow him to think, analyze, and prepare themselves to cooperate their own learning. In this sense the teaching is conducive to this process; in the case of the project presented, the methodology used was the group tutories and seminars, the teacher accompanying the students with the development of audiovisuals and the analysis of the case. It is a work that has required dedication and effort issues that are not always possible in the current scenario, and an attention to students quite individualized.
Therefore, we can say that one of the key factors for improving student learning is a methodological change? We understand that for methodological change means a more participatory methodology in which the protagonist of the process of teaching and learning is the students, thereby promoting the autonomy, initiative and responsibility. And where teachers have a supervisory role, catalyst and advisor.
Therefore, in this regard, that teachers predisposed to a more active methodology can replicate the process in its course and get similar results?
REFERENCES
[1] Bravo, JL. “El vídeo como medio educativo.” Madrid: ICE Universitat Politècnica, 1992.
[2] Gobo, G. “Doing ethnography”. London, United Kingdom: Sage Publications, 2008.
[3] Pink, S. “Doing visual ethnography” (2nd ed.). London, United Kingdom: Sage Publications, 2007.
[4] Shrum, W., Duque, R., y Brown, T. “Digital video as research practice: Methodology for the millennium”. Journal of Research Practice (JRP), 1, 1-19, 2005.
[5] Hollingsworth, H. “Learning about teaching and teaching about learning: Using video data for research and professional development.” Paper presented at the Australian Council of Educational Research Conference, Melbourne, Australia, 2005.
[6] Johnson, B., Sullivan, A. M., y Williams, D. “A one-eyed look at classroom life: Using new technologies to enrich classroom-based research.” Issues in Educational Research, 19, 34-47, 2009.
[7] El-Sayed R-ESH, El-Sayed S-EHAER, “Video-based lectures: An emerging paradigm for teaching human anatomy and physiology to student nurses”, Alex J Med, Retrieved of: http://dx.doi.org/10.1016/j.ajme.2012.11.002, 2013.
[8] Goldman, C., Corley, R. y Piaskoski, M. “Proceed with caution: the application of antitrust to innovation-intensive markets.” J Inform Law Tech, 1, 1-52, 2004.
[9] Hampton, C. “Teaching practical skills. In: Mishra A.K., Bartram J., editors. Perspectives on distance education: skills development through distance education, commonwealth of learning.” Canada: Vancouver. Retrieved of: http://www.col.org/SiteCollectionDocuments/Skills_Chapter09.pdf. p. 83-91, 2002.
[10] De Juan, J. “Introducci n a la Ense anza Universitaria”. Madrid: Dykinson, 1996.
[11] Kozma, R.B. “Learning with media.” Rev Educ Res, 61, 179-211, 1991.
The 3rd Human and Social Sciences at the Common ConferenceOctober, 5. - 9. 2015, www.hassacc.com
Educational sciences eISSN: 2453-6075, cdISSN: 1339-522X10.18638/hassacc.2015.3.1.167 - 101 - ISBN: 978-80-554-1124-8

[12] Zhang, D., Zhou, L., Briggs R.O., Nunamaker, Jr. J.F. “Instructional video in e- learning: assessing the impact of interactive video on learning effectiveness.” Inf Manag, 43, 15-27, 2006.
[13] Overbaugh, R.C. “The efficacy of interactive video for teaching Basic techniques of classroom management of pre-service teachers.” Comput Human Behav, 11, 11-527, 1995.
[14] Choi HJ, Johnson SD. “The effect of problem-based video instruction on learner satisfaction, comprehension and retention in college courses.” Brit J Educ Tech, 38, 885-95, 2007.
[15] Jung, I. “Innovative and good practices of open and distance learning in Asia and the Pacific. APEID, UNESCO.” Bangkok Occasional Paper Series, Paper No. 3 Recuperado de: http://unesdoc.unesco.org/images/0015/001529/152961e.pdf, 2005.
[16] De Juan, J., Pérez-Ca averas, R.M., Girela, J.L., Vizcaya, M.F., Segovia, Y., Romero, A., Martínez-Ruiz, N., G mez-Torres, M.J., Torrus, D., Castillejo, A., Soto, J.L., Herrero, J., Martínez, A. “Importancia del uso de vídeos didácticos en la docencia presencial de
las asignaturas de biología.” Departamento de Enfermería y Biotecnología. Universidad de Alicante. Retrieved of: http://web.ua.es/es/ice/jornadas-redes/documentos/2013-comunicaciones-orales/334916.pdf
[17] Exley, RJ. “A Critique of the Civic Engagement Model,” in Speck, and B. Hoppe, S. (eds.). Service-Learning: History, Theory, and Issues, Westport, Connecticut: Praeger Publishers, 2004, pp.85-97.
[18] Cabrera, F. “Evaluaci n y ciudadanía. Atendiendo a la diversidad: Evaluaci n participativa autogestionada,” in Pantoja, A.; Zwierewicz, M. y Moraes, R. (coords.). Diversidad y adversidad en Educaci n, Jaen: Joxman, 2011, pp. 247-275.
[19] Trilla, J. and Novella, A. “Participaci n, democracia y formaci n para la ciudadanía. Los consejos de infancia”. Revista de Educaci n, 2011, 356: 23-43.
[20] Holland, B. “A Comprehensive Model for Assessing Service-Learning and Community-University Partnerships.” New Directions for Higher Education, 2001, 114: 51-60.
The 3rd Human and Social Sciences at the Common ConferenceOctober, 5. - 9. 2015, www.hassacc.com
Educational sciences eISSN: 2453-6075, cdISSN: 1339-522X10.18638/hassacc.2015.3.1.167 - 102 - ISBN: 978-80-554-1124-8

The intercultural curriculum: an educational need
Olga Gonzàlez Mediel
Department of Teaching Musical and Corporal Expression
University of Barcelona
Barcelona, Spain
Esther Luna González
Department of Methods of Research and Diagnosis in
Education
University of Barcelona
Barcelona, Spain
Abstract- This article aims to show, from the analysis of the
reactions of a group of students in a primary school (second
year), in front of several proposed activities of knowledge and
appreciation of other cultures, such as children have no prejudice
towards openness curricular other ways of being and doing, and
no foreign students present in the classroom.
The experience on which to base these statements became one of
the conclusions of that research work, through cooperative action
research, was implemented in a public center of Barcelona and
posed the transformation towards a model curriculum education
exchange.
Keywords- intercultural education; cultural diversity;
curriculum transformation; action research; anti-racist education;
primary education
I. INTRODUCTION
This research is part of the line of work on citizenship education than Research Group of Intercultural Education (GREDI) of the University of Barcelona has been working since 1997. It is part of a notion of citizenship education that involves the training of citizens committed to a set of values to guide their behavior and actions that make the collective process of building a society where cultural diversity is alive and creative and enriching experience where you fight against social exclusion may fragments our system of relationships and where participation and social responsibility as a foundation for a fair and sustainable human development is encouraged [1].
As described previously [1] [2] [3] [4] [5], these behaviors and actions that should characterize the citizen today, implies a training model to promote active, intercultural, critical and responsible citizenship proposed by the GREDI.
Figure 1. Model of Citizenship Education
This model advances the notion of citizenship as a legal status that recognizes the person a set of rights and duties towards a notion which includes the development of a citizenship culture. Our study emphasizes the practical exercise of citizenship, understood as process, because the achievement of a peaceful and creative coexistence between peoples, claiming not only "citizenship" (the citizenship as a status) but also and in a special way "feel citizen" (the citizenship as a process). This civic conscience "is born" but "becomes" is a process of social construction that is occurred to the extent that people live and interact with others, develop values and norms of collective behavior.
Therefore, the model highlights two basic dimensions: the citizenship as a status and citizenship as a process.
The citizenship as a process involves the active exercise of citizenship. From this perspective, citizenship is understood as a social construction, so it is not linked exclusively to the legal acquisition of status, although necessary, but with the development of a sense of belonging to a community, leading to participation in public affairs and acquisition of citizenship competencies necessary for active exercise in public space.
The three elements mentioned (sense of belonging, participation and citizenship skills) interact dynamically, so that a strong difficulty or barrier one can prevent the development of others. In turn, the exercise of citizenship depends on the social context in which people are located (family, school, social, political, etc.) [2].
Of the highlights, this study lies in the development of citizenship skills and the formation of an active, intercultural, critical and responsible citizenship. We also find ourselves in the line of authors like [6] [7] [8] [9] and the positions of the European Community [10] among others, who consider the feeling of belonging a community and exercise or practice of citizenship, two essential dimensions.
Society and schools are today, very different places from a cultural standpoint. This diversity can have positive effects and negative effects, highlighting the rejection of difference (mostly due to ignorance), and establishing an identification of "difference" with "deficiency" [11]. The education sector has developed numerous actions to overcome this wrong approach (an example of this interest are the 26 research gathered by Educational Research and Documentation Centre) [12].
The education system aim to essential that all students achieve a solid cultural competence, ie, develop attitudes and skills to live in a multicultural and multilingual society such as
The 3rd Human and Social Sciences at the Common ConferenceOctober, 5. - 9. 2015, www.hassacc.com
Educational sciences eISSN: 2453-6075, cdISSN: 1339-522X10.18638/hassacc.2015.3.1.162 - 103 - ISBN: 978-80-554-1124-8

ours. However, there are few schools that have in the curriculum intercultural, where the dialogue and exchange on the other is an identifying feature of coexistence in school. Sometimes the influence of context and the mass media trains children with a rejection of the other culture, towards difference. It is the responsibility of everyone, and therefore, school, educate in the difference.
Therefore, the experience exposed, becomes the curriculum in an intercultural one to prove that children are not racist per se.
II. PURPOSE
Start a transformation of the Curriculum Education Primary for moving towards an effective model Intercultural Education.
This transformation affected different issues of the educational community (which became specific objectives):
Teachers
Methodological strategies
School
Curriculum
Families
Students in general
Student "newcomer"
III. SAMPLE
The research was applied to three classrooms of second year: 75 students; 24 of them were born in other countries with a total of 11 nationalities.
The justifications for this choice was that, on the one hand, ethno-cultural groups represented (11) were quite diverse and large number of students. Moreover, according to the characteristics of children of these ages we knew from evolutionary psychology [13], about 8 years old, is an age where students not yet developed prejudices and accepts the changes normally.
4 teachers were implied in the research as researchers.
IV. METHODOLOGY
It conducts an action research because two people of two institutions, one facing the scientific production and the other works in a school, have decided to join to solve problems that belong to the practice of school teachers. [14].
In schools, action research refers to a wide variety of evaluative, investigative, and analytical research methods designed to diagnose problems or weaknesses—whether organizational, academic, or instructional—and help educators develop practical solutions to address them quickly and efficiently. Action research may also be applied to programs or educational techniques that are not necessarily experiencing any problems, but that educators simply want to learn more about and improve. The general goal is to create a simple, practical, repeatable process of iterative learning, evaluation,
and improvement that leads to increasingly better results for schools, teachers, or programs.
Action research may also be called a cycle of action or cycle of inquiry, since it typically follows a predefined process that is repeated over time. A simple illustrative example:
- Identify a problem to be studied
- Collect data on the problem
- Organize, analyze, and interpret the data
- Develop a plan to address the problem
- Implement the plan
- Evaluate the results of the actions taken
- Identify a new problem
- Repeat the process
Unlike more formal research studies, such as those
conducted by universities and published in peer-reviewed scholarly journals, action research is typically conducted by the educators working in the district or school being studied—the participants—rather than by independent, impartial observers from outside organizations. Less formal, prescriptive, or theory-driven research methods are typically used when conducting action research, since the goal is to address practical problems in a specific school or classroom, rather than produce independently validated and reproducible findings that others, outside of the context being studied, can use to guide their future actions or inform the design of their academic programs. That said, while action research is typically focused on solving a specific problem or answer a specific question, action research can also make meaningful contributions to the larger body of knowledge and understanding in the field of education, particularly within a relatively closed system such as school, district, or network of connected organizations [15].
The term “action research” was coined in the 1940s by Kurt Lewin, a German-American social psychologist who is widely considered to be the founder of his field. The basic principles of action research that were described by Lewin are still in use to this day.
Educators typically conduct action research as an extension of a particular school-improvement plan, project, or goal—i.e., action research is nearly always a school-reform strategy. The object of action research could be almost anything related to educational performance or improvement, from the effectiveness of certain teaching strategies and lesson designs to the influence that family background has on student performance to the results achieved by a particular academic support strategy or learning program—to list just a small sampling.
Action research links research processes and innovation processes and development and training in the profession, which responds to the intention that staff involve in a process reflective and transforming their own educational practice [16].
The research process was designed and planned according to the four phases of action research:
1. Initial Reflection: State of the Art
The 3rd Human and Social Sciences at the Common ConferenceOctober, 5. - 9. 2015, www.hassacc.com
Educational sciences eISSN: 2453-6075, cdISSN: 1339-522X10.18638/hassacc.2015.3.1.162 - 104 - ISBN: 978-80-554-1124-8

2. Planning: Analysis of context, planification and designing intervention
3. Action: Curriculum Transformation (cyclic)
4. Final comments: Evaluation of the effect of the change.
[17] collect the basic elements that serve to frame and justify the choice of action research as a research methodology:
The research problems are defined by both researchers and teachers.
The university faculty and teachers collaborate to find solutions to the problems of the school.
The results of the research are used to solve problems.
Teachers develop skills, abilities and knowledge of research and researchers reeduquen this type of research.
Teachers and researchers are co-authors of research reports.
V. STRATEGIES FOR COLLECTING INFORMATION
The interview, observation, field diary and analysis of the productions have been four main strategies information collection. The interview has been applied to teachers who have carried out activities; the participant observation has been done by the own researcher; the field diary have demostrated the experience as reflections written by the teachers involved in the activities and, the productions, are exercises / activities murals, etc., all product classes made by the students.
VI. RESULTS
The results are outlined in this paper regarding the impact of the intercultural curriculum in students, particularly in the area of music:
- The students did owner of some of the activities are
worked: in the playground, spontaneously, several
children include the learned dance in their repertoire
fun; and students from other countries bring different
music.
"Several students from different countries have
contributed voluntarily and quite spontaneous music
CDs from their places of origin." (P3, 3: 1)
"Spontaneously, X takes the teacher's arm and dragging
also Y starts singing the Ciranda Brazil have learned
that week. All three are dancing, they have learned the
song." (P2, 2: 1)
- From the outset was achieved the participation of
everyone in the proposed activities.
"The level of participation is very high, children are
interested in everything that you said. In addition,
there are many children who have much knowledge of
the location of different countries because it is their
reality from an early age, they live naturally and
completely positive and exciting." (Q13, 13: 4)
- Creating a classroom atmosphere enriching and
motivator.
"The students were interested and collaborators.
Demonstrated attentive and interested. The climate of the
classroom was enough attention and curiosity." (P 4, 4).
"The experience has been quite positive and the children
have really enjoyed the activity." (5 P, 5: 6)
"It has been very rewarding, very exciting. We have been
very well together." (P14, 14: 6)
"Overall it was well received by all students. No negative
attitude or reject any of the students." (P13, 13: 3)
- The students receive as a everyday this kind of
information because it is their cultural reality of life since
little.
- They explain things Catalan and speak in public, when it
is a non common behavior.
“It is very difficult to speak, but has made little effort to
speak Catalan (which it never does)." (P82, 82: 7)
- Help each other in activities and express themselves
verbally.
"X, without any shame, he constantly correcting the
pronunciation of his classmates and teacher, but
everyone receives it well and try to rectify." (P50, 50: 4)
"I was very happy, plus it could provide information to
colleagues and teachers and showed super proud." (P55,
55: 4)
- The positive effect of the role of students results in a high
selfesteem.
"This kid came last year just talking Chinese, is now
highly integrated and progresses quickly. I was very
happy to see that we talked about things in their country.
We have read the letter with the help of another child
who comes from Nepal and understand Chinese." (P29,
29: 3)
- The three groups have received with joy the activities,
being interested in all the explanations both their
classmates, teachers, how different people (relatives
and experts) participating in the sessions.
"The proposal was enthused." (P67, 67: 3)
"Everyone participated delighted, charmed and happy,
trying to use everything I had learned (to say hello and
The 3rd Human and Social Sciences at the Common ConferenceOctober, 5. - 9. 2015, www.hassacc.com
Educational sciences eISSN: 2453-6075, cdISSN: 1339-522X10.18638/hassacc.2015.3.1.162 - 105 - ISBN: 978-80-554-1124-8

thank you in Nepali) in the general session. The result
has been very successful from all points of view." (P84,
84: 8)
"X says there is no time for more slides and kids say they
want to see more. All class smiles.” (P85, 85: 3)
- One of the indicators of the success of the sessions has
been the collaboration of students bringing
information and objects.
"Arrives in the morning at 9 and a bag carries a flag of
Uruguay and a pumpkin to mate with a pipe. X also has
a pumpkin for a trip that did their parents in Uruguay."
(P59, 59: 1)
- Numerous emotional reactions of satisfaction are
detected.
"The teacher asks for help in X (Chinese student) to
pronounce better and he reads aloud. The action is
applauded spontaneously by the colleagues." (P34, 34: 2)
"Everyone applauds his performance and the child is
exalting joy, as it starts dancing when the last group out
to accompany the song." (P50, 50: 6)
There is no doubt that these sessions were received gladly
by the students, probably because it is a new methodology, far away of the standard methodologies, it gives voice to students, etc. and they want to continue doing it.
The experience of the local students demonstrates the lack of prejudice of children of primary school. There is no doubt that local students have received with great interest and satisfaction the approach of other cultures, without exception.
In summary, we can say that the experience has been valued very positively by all participants (the opinions of students deducted from proceedings before the proposal and the participating teachers picked from your own voice ).
The effects have been highly positives in all aspects analyzed
at the end of the process, highlighting the climate created in
the classroom, participation of all students, working dynamics
achieved, the benefits of new students (increase of esteem,
participation, collaboration ...), motivation and degree of
emotion expressed by all students achieving curricular goals
with intercultural methodology, preparation and use new
resources and the participation of family members and experts.
VII. CONCLUSIONS
The results show that primary school children are not racist, but, on the contrary, admire and admired eachother when they know some of their cultural traits or characteristics classmates
born in other countries. This evidence reinforces the need for action in this regard to get an education not racist, simply opening the curriculum is enough, because since from monoculturalism becomes very easy to fall into the trap of ethnocentrism and to be considered the unique and better. So we believe in the intecrultural education from the analysis of practical experience, according to the guidelines that the Department of Education also proposed.
REFERENCES
[1] Bartolomé, M. y Cabrera, F. “Construcción de una ciudadanía intercultural y responsable. Guía para el profesorado de Secundaria.” Madrid: Narcea, 2007.
[2] Bartolomé, M. “Educar para una Ciudadanía Intercultural. En M. Bartolomé (Ed.). Identidad y Ciudadanía: Un Reto a la Educación Intercultural.” Madrid: Narcea, pp. 131-161, 2002.
[3] Bartolomé, M. y Cabrera, F. “Sociedad multicultural y ciudadanía: hacia una sociedad y ciudadanía multiculturales.” Revista de Educación, número extraordinario ciudadanía y educación, 33-57, 2003.
[4] Bartolomé, M. y Marín, M.A. “Las identidades cívicas y culturales: ejes clave para la construcción de una ciudadanía intercultural.” En S. Sacavino (Coord.). Identidad (es) y Ciudadanía Intercultural desafíos para la educación. [CD] Brasil: Consejo de Cultura, 2005.
[5] Cabrera, F. “Hacia una nueva concepción de la ciudadanía en una sociedad multicultural.” En M. Bartolomé (Ed.). Identidad y Ciudadanía: Un Reto a la Educación Intercultural. Madrid: Narcea, pp.79-104, 2002.
[6] Osler, A. European Citizenship and Study Abroad: student teachers’ experiences and identities. Cambridge Journal of Education, 28 (1), 77-96, 1998.
[7] Osler, A. (Ed.) “Citizenship and Democracy in Schools: diversity, identity equality.” Staffordshire, UK: Trentham Books, 2000.
[8] Spencer, S. y Klug, F. “Multicultural Teaching.” New York: Trentham Books, 1998.
[9] Bárcena, F. “El oficio de la ciudadanía. Introducción a la educación política.” Barcelona: Paidós, 1997.
[10] Consejo de Europa. “Declaration and programme on education for democratic citizenship, based on de right and responsabilities of citizen.” C.M. (99) 76. Estrasburgo: Council of Europe., 1999.
[11] Bartolomé, M. “Panorámica general de la investigación sobre educación intercultural en Europa.” Revista de Investigación Educativa (RIE), 15 (1), 7-28, 1997.
[12] Grañeras, M.; Lamelas, R .; Segalerva, A.; Vázquez, E .; Gordo, JL; Molinuevo, L. “Catorce years of research on the Inequalities of education in Spain.” Madrid, CIDE. Collection CIDE No. 135, 1998.
[13] Kohlberg, L. “Psicología del desarrollo moral.” Bilbao: Desclée de Brower, 1992.
[14] Bartolomé, M., Cabrera, F. y Sandín, M.P. “Educación ciudadana en el curriculo.” En Bartolomé, M. y Cabrera, F. (Eds.). Construcción de una ciudadanía intercultural y responsable. Guía para el profesorado de Secundaria (pp. 53-76). Madrid: Narcea, pp. 53-76, 2007.
[15] McNiff, J. “Action Research: Principles and practice.” New York: Routledge, 2013.
[16] Whitehead, J. & Mcniff, J. “Action Research Living Theory.” London: Sage, 2006.
[17] Bartolomé, M. & Sandín, M.P. “Metodologia qualitativa en Educació.” Barcelona: Universitat de Barcelona, 2001.
The 3rd Human and Social Sciences at the Common ConferenceOctober, 5. - 9. 2015, www.hassacc.com
Educational sciences eISSN: 2453-6075, cdISSN: 1339-522X10.18638/hassacc.2015.3.1.162 - 106 - ISBN: 978-80-554-1124-8
Crash course for new online faculty orientation
Anssi Mattila
Online Education Team
Educational and Regional Development Unit
Laurea University of Applied Sciences
Kerava, Finland
Abstract— In this paper, a generic outline for the content of a set
of orientation courses aimed at new online instructors will be
presented. The new online faculty, who acts as students on these
professional development online courses, need to learn for
example how to use the online learning tools efficiently, how to
set the tone of discussion online and what is expected from them
as online instructors. Upon completing the orientation program
described in this paper, the new online faculty will for example
know how to interact online, how to use the given eLearning
platform with all its special features, how to prepare and deliver
a successful online course and how to support online learners
with all their learning efforts.
Keywords - orientation, online education, eLearning
I. INTRODUCTION
Electronic learning platforms are used more and more to enhance learning and to facilitate learning activities. Using technology to facilitate learning has its advantages as does using internet as a medium of teaching. The new online faculty needs to be trained. It may not be compulsory to give them grades for the orientation course(s) but using grades does give the new faculty the opportunity to observe online learning through the lenses of a learner.
The new online faculty orientation should be organized fully online. The orientation is not just about making the protocols and administrative procedures familiar to the new faculty, but is about peer learning and interacting with the fellow "students". The faculty should be treated as students during the orientation weeks to give them the sense of what it is to be a student online. That is expected to make them better educators online.
The length of the orientation depends on what are the goals and learning objectives of the orientation. Implementing the program presented here would take some months. It is important that the online instructors are not let to teach online prior to completing all the different orientation program activities. You may, however, choose which ones of the different sections presented here your organization wants to online instructors to take and perhaps even tailor the program depending on the prior proven online teaching experience of the new online faculty.
An online course has at least 80 per cent of the course content available online [1]. Today, the use of technology in the higher education transcends the physical distance, offers a faster transfer of knowledge and quicker feedback [2]. An electronic online learning platforms (e.g. Blackboard, Moodle, Izio, Jenzabar, eCollege, WebCT) have been used to facilitate online learning but the inclusion of collaboration tools (e.g.
Skype, Twitter, Flickr, Google Docs, Facebook, Google Earth) enhancing online learning is likely to promote entirely new ways of interaction such as role-based sharing and playfulness. The new ways of interaction also include for example multiple collaborators contributing to effective interaction more synchronously and collaborators can modify the work of others together.
Technology can act as a lever for learning [3]. Students of the digital era have become more open-minded and willing to co-create and transfer ideas. Thus, the online learning environment must be not only supportive but challenging as well. According to Allen et al. (2008), the online course enrollment is growing substantially faster than the overall higher education enrollment [1] but is still very national, if not even local. At its best, the online education could be very global and groups of students relatively diverse.
II. STRUCTURING THE PROFESSIONAL DEVELOPMENT
COURSES FOR ONLINE EDUCATORS
A. Generic objectives
Firstly, the new online faculty (who now are students on an online professional development course), need to learn how to move around on whatever eLearning platform your home institution is using. The new online faculty will learn how to write notes, reply to notes, and attach things to notes. They are expected to do their assignments in the practice class as they would be done on a real online course aimed at college students. The online educators could especially explore what makes internet an exciting learning environment and what kind of tools can be used to build the course. [4]. Interaction throughout the course is needed and the needs of a student should never be left unattended. The instructor must be competent user of the eLearning platform in order to advice the students how to get the best out of all the features it has to offer.
Secondly, the new online faculty learns about the tone and embracing diversity online. The online instructors should be asked to develop their own online voice. Your affiliation may have certain rules how to write an autobiography. That should be introduced to the new online faculty here, too. [4]. Setting the tone at the start of a course will determine the overall course of the online course. Like West et al. (2004) have argued: “Knowing the tone you want to set will allow you to shape the climate of your class for success” [5].
Thirdly, the new online faculty must be introduced to the expectations of your home institution. Also, the organizational values should be introduced here. If your online instructors do
The 3rd Human and Social Sciences at the Common ConferenceOctober, 5. - 9. 2015, www.hassacc.com
Educational sciences eISSN: 2453-6075, cdISSN: 1339-522X10.18638/hassacc.2015.3.1.173 - 107 - ISBN: 978-80-554-1124-8

not build their own course syllabi, this is the time to let them explore the existing one(s). They could also be asked to develop short online lecturettes to be used on their courses. They will learn how to encourage interaction in the online courses and develop their own personal philosophy to assess the student performance online. [4]. Both the learner and the instructor responsibilities should be clear from day one. The online courses are not self-paced as we all know. The instructors online have multiple responsibilities such as administrative duties besides the daily teaching tasks. Also, the instructor is expected to set up the course prior to the start date (of semester).
B. Generic Outcomes
The generic outcomes of a new online faculty orientation include for example learning to interact in the online environment, addressing the student questions posed online and acquainting the instructors with the instructional pedagogy online. The new faculty is expected to learn about the support systems available and extend their knowledge on what makes a good online facilitator. The online instructors pull together all they have learned and are able to construct a sample online course. Also, a sample syllabus for an online course will be developed and its differences to a syllabus used in a seated class environment will be examined. [4].
C. Content for orientation course I: getting ready to teach
online
This first course in the overall online instructor orientation program covers well the responsibilities of the new online faculty members within the given educational institution. This course lets the instructors in on the best practices for course preparation and delivery and provides perspective to the operational environment of the given educational institution. The learning methods could include for example blogs, threaded discussions, readings, reflective essays, and practical exercises such as information search from the (online) library, developing course outlines and/or syllabus and/or assigning grades. [6].
For week one the topics could include history and policies of your university. The outline for week two could comprise of introducing the principles of good practice in instruction and how to create a good course syllabus. Week three could concentrate on making the active learning techniques familiar and how to set the student expectations online. Also, if adult learners are to be taught, the special features of teaching adult learners could be introduced here. Using grading rubrics, solving grade disputes and writing test items could be the topics for week four, which completes the first orientation course. [6].
D. Content for orientation course II: teaching online
Together with course I, the new online faculty should be asked to actually create a course shell for an online course by using whatever eLearning platform your university is using. Although they would not be creating the course shells and/or content in the future, this is still a great way to introduce the online learning technology and facilities to them. It is important that the new online faculty goes through each section of an online course and that this course covers the features of
your course management system and their instructional use incl. best practices. [7].
Meaningful discussions are the key to keeping up a dialogue online and facilitation frequent online participation [8]. Responses showing critical thinking, timely participation in the online discussion and keeping up the dialogue are all dimensions of meaningful online discussion. Threaded discussions are all about questioning and answering. Sometimes it is necessary to repeat the question or redirect the question to another student. The instructor may also promote discussion among the student by asking thought-provoking questions. [9]. The online instructor must be proactive and present. In addition to the instructional material available on the course website, the instructor could choose to use some additional material and external sources of information supporting the students learning online. It goes without saying that collaborative tools must be in use.
As presented in the Embry-Riddle Aeronautical University's online course syllabus created by Dr. Rita Herron 7], the Learning Outcomes for this sort of course on instructional use of eLearning platform with Lab, could include [quoted from 7]
Module 1: Announcements, Faculty Profile & Email: Upon completion of this module, the learner will be able to:
Compose an announcement appropriate for your Blackboard course site.
Post the announcement in the Lab course.
Compose a faculty profile that provides a well-rounded self-introduction.
Upload the faculty profile to the Lab course.
Compose an appropriate email message.
Send an email from the Lab course to your instructor.
Module 2: Discussion Board & Online Tests/Surveys: Upon completion of this module, the learner will be able to:
Create a discussion board forum.
Add threads and posts to a discussion board forum the Lab course.
Grade discussion board discussions.
Create a test/survey.
View a test/survey from a student’s perspective.
Module 3: Assignment Tool, SafeAssign Assignments &
Collaboration:
Upon completion of this module, the learner will be
able to:
Design an assignment for posting in Blackboard.
Create an assignment in the Lab course.
The 3rd Human and Social Sciences at the Common ConferenceOctober, 5. - 9. 2015, www.hassacc.com
Educational sciences eISSN: 2453-6075, cdISSN: 1339-522X10.18638/hassacc.2015.3.1.173 - 108 - ISBN: 978-80-554-1124-8

Grade an assignment submitted via the assignment manager.
Identify example of the different types of plagiarism.
List remedies for unintentional and intentional plagiarism.
Access and interpret Originality Reports.
Identify the key elements in creating a “plagiarism-proof” assignment.
Use SafeAssign to promote student creativity.
Learn collaborating tools.
Create and manage groups in the Lab course.
Module 4: Course Content & Grade Center:
Upon completion of this module, the learner will be
able to:
Plan the structure for a course site.
Create a content area in the Lab course.
Review how to add items, course links, and external links to a content area.
Review and understand the course grading plans.
Enter grades in the Grade Center.
Enter comments and feedback in the Grade Center.
Extra Module: Course Management:
Upon completion of this module, the learner will be
able to:
Archive a course at the end of a term.
Run a Report of User Activity
The recommended learning methods for this course II are using practical exercises such as how to create an announcement in the online course, how to send a group email to the students, how to set up the student teams, how to update your faculty profile, and so forth. There are very little readings, if any, involved. The lab course is more about hands-on type of activities.
E. Content for orientation course III: working with the
students online
So now your new online faculty is familiar with the basics of teaching online as well as the technological aspects and human factors related to giving and receiving education online. This final course of the overall orientation of the new online faculty covers "best practices in online learning, student-centered approaches to teaching, and instructional applications of web-based tools for collaboration." [10].
As presented in the Embry-Riddle Aeronautical University's online course syllabus [10], the Learning Outcomes for this sort of course on supporting online learners, could include [quoted from 10]
Module 1: Introductions, Expectations, and Principles of
Engagement
Upon completion of this module, the learner will be
able to:
Assemble a learning team of three to five classmates.
Help create the learning expectations for the course.
Demonstrate understanding of syllabi as learning contracts.
Discuss the characteristics of online learners.
Describe how to apply these techniques to your own online courses.
Module 2: Facilitation Skills and Discussion Board
Management
Upon completion of this module, the learner will be
able to:
Evaluate Gagne's "Nine Events of Instruction."
Discuss learning styles as applied to online learners.
Discuss the principles of the Socratic method.
Distinguish between types of questions and the uses of each.
Select a question and answer format for different online scenarios.
Be familiar with a variety of active learning techniques.
Be able to apply these techniques to your own courses.
Module 3 - Collaboration and Technology
Upon completion of this module, the learner will be
able to:
Discuss principles for fostering a learning community.
Assess ways to use technology to enhance your teaching.
Evaluate several current technologies (including blogs, wikis, podcasting, and social bookmarking) and the strengths and weaknesses of each.
Practice the skill set required for online collaboration.
Module 4 – Assessments, Best Practices, and Final Reflections
Upon completion of this module, the learner will be
able to:
Examine general principles of assessment and evaluation.
Apply these techniques to an online course.
Evaluate a variety of information about adult and online learners.
Demonstrate the ability to integrate these concepts into your own teaching.
The used activities could include for example readings and viewing videos, online discussions, group projects and reflective essays. The topics could include for example learning contracts and learner expectations, learning styles and communities, online communications skills and discussion
The 3rd Human and Social Sciences at the Common ConferenceOctober, 5. - 9. 2015, www.hassacc.com
Educational sciences eISSN: 2453-6075, cdISSN: 1339-522X10.18638/hassacc.2015.3.1.173 - 109 - ISBN: 978-80-554-1124-8

board organization, giving and receiving feedback online, blogs, wikis, social bookmarking, podcasting, instant messaging and online small group activities. [10].
III. CONCLUSIONS
This paper outlined a crash course for new online faculty orientation. Such an orientation can be organized within couple of weeks or it can be constructed to take couple of months. The new faculty needs to also understand "where they're coming from"; what are the policies, and the history of their new affiliation. This will help them to become better online instructors. Based on the trip around the eLearning platform and the online course shell, the new faculty will be able to better and more extensively attend to the online learners' needs. The approach described in this paper, enables also the peer learning amongst the new faculty members and can act as an ice-breaking opportunity as well.
REFERENCES
[1] E. Allen, J. Seaman, Staying the Course. Babson Park: The Sloan Consortium, pp. 1, 2008.
[2] C. Lomas, M. Burke, C. Page, “Collaboration Tools”, Educause Learning Initiative, No. 2, 2008, pp. 2-11.
[3] R. Paloff, K. Pratt, The virtual student: A profile and guide to working with online learners. San Francisco: Jossey-Bass. 2003.
[4] Course syllabus for New Faculty Orientation. Fall 2008. University of the Incarnate Word.
[5] R. West, L. Turner, Introducing communication theory: Analysis and application, 2nd ed. Boston: McGraw-Hill. 2004.
[6] Course syllabus for Teaching at Embry Riddle Worldwide (FACD 701). Fall 2010. Embry-Riddle Aeronautical University.
[7] Coures syllabus for Instructional Use of Blackboard with Lab (FACD 700/700L). Fall 2010. Embry-Riddle Aeronautical University.
[8] R. Frazee, “Using Relevance to Facilitate Online Participation in a Hybrid Course”, Educause Quarterly, No. 4, pp. 67-69, 2003.
[9] W. Cashin, Answering and Asking Questions, Idea paper no. 31 of Center for Faculty Evaluation & Development. Kansas: Kansas City University. 1995. Unpublished.
[10] Coures syllabus for Supporting Online Learners (FACD 702). Fall 2010. Embry-Riddle Aeronautical University.
The 3rd Human and Social Sciences at the Common ConferenceOctober, 5. - 9. 2015, www.hassacc.com
Educational sciences eISSN: 2453-6075, cdISSN: 1339-522X10.18638/hassacc.2015.3.1.173 - 110 - ISBN: 978-80-554-1124-8

Relationship between enrolment criteria and first-year
students’ study-success
Dušan Munđar
Faculty of Organization and Informatics
University of Zagreb
Varaždin, Croatia
Damira Keček
University North
University Centre Varaždin
Varaždin, Croatia
Darko Matotek
Faculty of Economics
University of Osijek
Osijek, Croatia
Abstract— The paper discusses the usability of enrolment points
achieved based on the results of State Matura exams and points
achieved based on high school grades as predictors of study
success measured by number of ECTS credits achieved one year
after enrolment for students at two faculties. The results of the
multivariate analysis indicate that points achieved based on high
school grades are a statistically significant predictor for both
faculties and points achieved based on the results of State Matura
exams for one of the two faculties. Prediction quality of the
multivariate model for the analyzed aspect of study success,
measured by multiple R-squared, is low to medium.
Keywords- ECTS credits, high school grades, multiple
regression, State Matura exams
I. INTRODUCTION
The state graduation exam (State Matura exams) in Croatia is a standardized set of external final exams that determines the level of achieved student’s knowledge and competences at the end of the 4-year secondary education. There are mandatory and elective State Matura exams. Mandatory exams are the Croatian language, mathematics and a foreign language and they can be taken at two levels: higher (A) and basic (B). All other State Matura exams can be taken at one level. Students of grammar schools are obliged to take State Matura in order to finish their secondary education in Croatia. Students of vocational and art schools are also eligible for State Matura exams, provided they have completed a 4-year program and that their secondary education ends with the creation and defense of the final paper [1].
Exams are the same for all candidates. They are taken at the same time and in the same tests conditions. Even though the State Matura is considered as a valid, reliable, objective and fair evaluation method of school achievements, there are some thoughts about the unfairness of such exams, because not all candidates have equal opportunities to have a good result considering that they come from different school programs [2].
The requirement for entry into higher education is to pass the State Matura. Each higher education institution has certain requirements for enrolment into its study programs. Majority of higher education institutions use the results of State Matura and the average success during secondary education instead of the entrance exam. Some of them are also checking specific skills and talents in the selection process.
The adoption of the Bologna Declaration by Education Ministers from 29 European countries in 1999 marked a turning point in the development of higher education in Europe. Its main goal was to establish a greater compatibility and comparability of higher education systems, to enhance the attractiveness and competitiveness of Europe's higher education systems and greater employability of higher education European graduates [3].
One of the main aims of the methodological transformation of the higher education system, according to the Bologna Process, is the transformation in the measurement of the students’ work to pass subjects in ECTS (European Credit Transfer System) [4].
ECTS is a learner-centered system for credit accumulation and transfer directed toward the student and students’ workload which is needed to achieve the objectives of the study program specified in the learning outcomes. The aim of introducing this system is to facilitate planning, implementation, evaluation and recognition of qualifications and units of learning, as well as student mobility [5]. 60 ECTS credits is the amount of student workload in a formal learning context in one year of full time study and is associated with learning outcomes. In most cases, student workload ranges from 1500 to 1800 hours for an academic year, whereby one ECTS credit represents 25 to 30 hours of student’s workload.
Introduction section provided basic information on State Matura and ECTS credits as research domain. The next section introduces the research question and presents some related work done on the research of study success. The final section outlines data, methodology and results of the analysis. The main findings are then summarised in the Conclusion.
II. RELATED WORK
After the investigation of papers published in available proceedings of conferences and journals, few of them that are related to investigation of study success at university level are selected mostly focusing in Croatian context. The papers have different definitions of success, predictors of success and methods used to analyze success. None of the papers discusses the usability of requirements for enrolment in study programs: points achieved based on results of State Matura exams and points achieved based on high school grades, as predictors of one of the aspects of success: the number of ECTS credits achieved after one year of study. The main research question of
The 3rd Human and Social Sciences at the Common ConferenceOctober, 5. - 9. 2015, www.hassacc.com
Educational sciences eISSN: 2453-6075, cdISSN: 1339-522X10.18638/hassacc.2015.3.1.179 - 111 - ISBN: 978-80-554-1124-8

this paper is to investigate the mentioned usability in Croatian context.
One of the papers [6] in this field of research aims to investigate whether the introduction of national Matura has resulted in enrolment of higher quality students, who achieved higher average grade, better pass rate and completion within the stipulated duration of studies, than the students enrolled prior to introduction of national Matura. That research was conducted using the available data on the 2009/2010 generation of full-time students of undergraduate university studies, as the last generation of students who were enrolled in the first year of study without State Matura, and the 2010/2011 generation, as the first generation of undergraduate university studies that was required to pass the Matura exam and was enrolled in the first year of study based on the results of the Matriculation exam. The main findings were that there was no increase in average grade among students that have passed the Matura exams in relation to students enrolled a year earlier. But the students of the 2010 generation are achieving better exam pass rates than the students of the 2009 generation.
Different methods are used for prediction of academic achievements. For example, in research [7] classification trees and neural networks are used to make a model for predictions of passing the course Mathematics 1. Course of Mathematics 1 is taught at the Polytechnic of Varaždin in all technical studies in the winter semester of the first year of study. Data for creating models for predicting the passing of the Course were collected through a survey research conducted in academic year 2010/2011 with students of that course. After elimination of incompletely filled-out questionnaires, representative sample consisted of 131 students. Based on the 12 input variables and one output variable, a model of classification and prediction of passing the course was made. Classification trees gave a higher classification accuracy of neural networks and it seems as better solution for creating models for passing the course.
Research question of another paper about the discussed topic was whether the same admissions data can be used to predict first-semester success [8]. The predictors for enrolment and persistence may not be the same for different-size colleges or universities considering that, compared to their larger-sized and better-endowed counterparts, small private colleges may lack adequate laboratory or sports facilities, they have fewer course offerings, meagre marketing budgets, and fewer feeder high school networks that could affect college choice. Authors of that research concluded that the predictors of first-semester success for the small, private college studied here are high school GPA (grade point average), an offer of two scholarships, being a second choice school, and indecision on major at admission.
In [9] authors investigate relationship between scores in State Matura exams in Mathematics, Croatian language, high school grades and success in some mathematical courses in the undergraduate study of Information and Business Systems at the University of Zagreb, Faculty of Organization and Informatics. The main method used for prediction of success in mathematical courses in the paper is logistic regression. Authors identified significant prediction power of high school grade point average on pass rates in Mathematics 1 and 2.
There is a positive correlation between the results of State Matura exam in Mathematics and pass rates in Mathematics 1 and 2. Results of Croatian language State Matura exam are the least important for passing Mathematics 1 and 2.
In paper [10] authors examined effects of 30 variables upon the dependent variable Student success. They stated two hypotheses. H1: Previous education, regular active class attendance, lectures and motivation for the studies show discriminant validity in the prediction of academic performance (studying success) and H2: Student’s gender does not show discriminant validity in the prediction of academic performance. Authors claimed that H1 was confirmed and H2 should be considered undecided, since gender contributes to discrimination between more successful students and less successful ones to a certain extent. Research method used in the paper was discriminant analysis. Data were collected using questionnaire among students at Faculty of Organization and Informatics, University of Zagreb.
There is a wide range of methods that can be used in learning analytics, especially for analysis of factors of study success at university level. Paper [11] describes how discriminant analysis, neural networks, random forests and decision trees can be used to predict students' academic success.
III. DATA AND METHODOLOGY
The research included a total of 512 full-time students at the study program Information and Business Systems (IBS) at the Faculty of Organization and Informatics, University of Zagreb enrolled in the first year study for the first time. Out of this number, 254 students were enrolled in academic year 2011/2012 and 258 students were enrolled in academic year 2012/2013.
The total number of full-time students enrolled in the first year study for the first time in undergraduate study at Faculty of Economics (EFOS), University of Osijek was 505, of those 299 students in academic year 2012/2013 and 206 students in academic year 2013/2014.
Examined variables in this analysis are points achieved based on high school grades (School), points obtained at the State Matura exams (Matura) and ECTS credits (ECTS) achieved in period of one year after enrolment. Points from high school are based on high school grades and the highest possible points a student could have is 350 points for IBS program, and 200 points for EFOS. State Matura points are collected from all exams that student took and passed in Croatian language, Mathematics and Informatics and student could achieve maximum of 650 points at IBS, and 800 for EFOS. A year after enrolment student can achieve 60 ECTS credits or more, based on the number of enrolled courses. The requirements for the undergraduate study program IBS at the Faculty of Organization and Informatics are higher level of Mathematics, higher or basic level of Croatian language and Informatics is non obligatory. Requirements for enrolment on the study of Economics are basic level of Mathematics, basic level of Croatian language, basic level of foreign language and Politics and Economics. This research tries to bring some insight into success based on number of ECTS credits as one of
The 3rd Human and Social Sciences at the Common ConferenceOctober, 5. - 9. 2015, www.hassacc.com
Educational sciences eISSN: 2453-6075, cdISSN: 1339-522X10.18638/hassacc.2015.3.1.179 - 112 - ISBN: 978-80-554-1124-8

the success measures and enrolment requirements defined by two faculties, for the years with available data.
Prediction of the first year study success is done using multiple linear regression. Multiple linear regression is generally used for modeling relationship between two or more explanatory variables and a response variable by fitting a linear equation to observed data. The mentioned method is used to model relationship between response variable number of ECTS credits and explanatory variables points achieved based on high school grades and points achieved based on the results of State Matura exams.
Computation is done in R Studio, a user interface for R programming language and MS Excel 2010.
A. Analysis for Information and Business Systems
Table I contains the descriptive statistics calculated for the above defined variables for the students enrolled in the study at the Faculty of Organization and Informatics. The average points achieved at high school as well as average points from State Matura in academic year 2012/2013 were slightly higher than in academic year 2011/2012. According to the median, half of the students in academic year 2011/2012 had 258.30 points from high school or less, while the remaining 50% of students had 258.30 points or more. In academic year 2012/2013 median of points from high school was 270.20 points. Median of points at the State Matura exams determined in academic year 2012/2013 was higher than in academic year 2011/2012. Observing academic year 2011/2012, the first
quartile shows that a quarter of the students had 232.60 points from high school or less, while the third quartile shows that a quarter of the students had 290.30 points or more. Quartiles of the points from Matura exams were slightly lower than quartiles of the points from high school. Situation is similar for the academic year 2012/2013. The average number of ECTS credits in academic year 2012/2013 was higher than the average number of ECTS credits in academic year 2011/2012. Described by median, the difference was 5.50 ECTS credits. In academic year 2011/2012 half of the students achieved between 6.00 and 55.75 ECTS credits, while in academic year 2012/2013 half of the students achieved between 7.25 and 56 ECTS credits. Therefore, the interquartile determined for students in academic year 2011/2012 was by 1 ECTS credit higher than the value calculated for interquartile in academic year 2012/2013. The present descriptive statistical indicators for ECTS credits are also visible in Fig. 1.
To determine if there is a statistically significant difference of means in achieved ECTS credits between two groups of students, students enrolled in academic years 2011/2012 and students enrolled in 2012/2013, Welch Two Sample t-test is applied. The following results are obtained: t value of -0.91, on df=509.99 and p-value=0.36. 95 percent confidence interval of the means difference is [-5.99, 2.20].
According to the results of Welch Two Sample t-test, the difference between achieved ECTS of two groups of students is not statistically significant.
TABLE I. DESCRIPTIVE STATISTICS OF STUDENTS’ POINTS ACHIEVED IN HIGH SCHOOL AND AT THE FACULTY (IBS)
IBS Academic Year
2011/2012 2012/2013
1st
Q. Median Mean 3st
Q. 1st Q. Median Mean 3
st Q.
School 232.60 258.30 262.10 290.30 237.10 270.20 270.40 300.80
Matura 204.00 233.40 247.90 289.20 222.40 273.10 274.50 331.20
ECTS 6.00 37.00 32.97 55.75 7.25 42.50 34.87 56.00
Figure 1. ECTS credits achieved in acad. year (IBS)
Table II presents Pearson’s correlation coefficients among variables: points achieved based on high school grades, points obtained at the State Matura exams and ECTS credits. Coefficients indicate medium correlation among all observed variables.
Graphical representation of those results is given in Fig. 2. It presents Scatterplot matrix in which observed variables are written in a main diagonal of the matrix. In the lower triangle
of this matrix variables are plotted with column variable as the X- axis, and row variable as Y-axis. Correlation coefficients are shown in the upper triangle of Scatterplot matrix.
TABLE II. CORRELATION AMONG OBSERVED VARIABLES (IBS)
IBS School Matura ECTS
School 1 0.36 0.47
Matura 0.36 1 0.47
ECTS 0.47 0.47 1
Figure 2. Scatterplot matrix of observed variables (IBS)
The 3rd Human and Social Sciences at the Common ConferenceOctober, 5. - 9. 2015, www.hassacc.com
Educational sciences eISSN: 2453-6075, cdISSN: 1339-522X10.18638/hassacc.2015.3.1.179 - 113 - ISBN: 978-80-554-1124-8

Prediction of the first year study success is done using multiple regression. Multiple regression is used since Scatterplots indicate linear relationships of variable ECTS with variable Matura points and variable School points. Multiple regression equation
MATURASCHOOL= 210 ECTS (1)
Basic indicators of multiple regression achieved by least
squared error estimation are given in Table III.
TABLE II. BASIC INDICATORS OF MULTIPLE REGRESSION (IBS)
Variables Coeff. Std. Err t value Pr(>|t|)
Intercept -45.03 5.80 -7.76 4.58e-14
School 0.20 0.02 8.83 <2e-16
Matura 0.09 0.01 8.99 <2e-16
Both high school grades and Matura exams are statistically
significant predictors of success. Each additional point achieved based on high school grades, keeping Matura exams points constant, predicts 0.2 more ECTS credits achieved. Each additional point achieved based on Matura exams results, holding high school points constant, predicts 0.09 more ECTS credits achieved. R-squared is the percentage of the response variable variation that is explained by a linear model. Multiple R-squared for the model is 0.3261 and adjusted R-squared is 0.3235, but there are other variables that have to be considered for more successful prediction of success.
B. Analysis for Economics program
It is obvious from Table IV that the average points achieved at high school for students who enrolled in Faculty of Economics (EFOS) in academic year 2012/2013 and in academic year 2013/2014 are almost identical, while the average points from State Matura in both academic years are equal. Median of points from high school was 428.30 points in
academic year 2012/2013 and 429.30 points in academic year 2013/2014. In academic year 2013/2014 median of points from Matura exams was only by 1 point bigger than in academic year 2012/2013. In academic year 2012/2013 a quarter of the students had 138.80 points from high school or less, while a quarter of the students had 171.60 points or more. In academic year 2013/2014 those numbers are slightly higher. First quartile of the points from Matura exams in academic year 2012/2013 is barely higher (by 2.10 points) than first quartile of the points from Matura exams in academic year 2013/2014, while third quartile of the points from Matura exams in academic year 2012/2013 is slightly lower (by 10.50 points) than third quartile of the points from Matura exams in academic year 2013/2014.
The average number of ECTS credits in academic year 2012/2013 and in academic year 2011/2012 is almost equal, while the median in academic year 2012/2013 is by 2 ECTS credits lower than in academic year 2013/2014. First quartile shows that a quarter of the students had 46.00 ECTS credits or less in academic year 2102/2013 and 47.25 ECTS credits or less in academic year 2103/2014. In both academic years, a quarter of the students had maximum ECTS credits.
Welch Two Sample t-test for determination of a statistically significant difference of means in achieved ECTS credits between two groups of students, students enrolled in academic years 2012/2013 and students enrolled in 2013/2014 gave the following results: t value of -0.37, on df=454.85 and p-value=0.71. 95 percent confidence interval of the means difference is [-3.40, 2.31]. The difference between achieved ECTS of two groups of students is, according to the Welch Two Sample t-test, not statistically significant.
In Fig. 3 descriptive statistical indicators for ECTS credits are presented.
TABLE III. DESCRIPTIVE STATISTICS OF STUDENTS’ POINTS ACHIEVED IN HIGH SCHOOL AND AT THE FACULTY (EFOS)
EFOS
Academic Year
2012/2013 2013/2014
1st Q. Median Mean 3st Q. 1st Q. Median Mean 3st Q.
School 138.80 156.40 155.90 171.60 142.80 153.60 155.10 168.80
Matura 399.90 428.30 435.30 464.70 397.80 429.30 435.30 475.20
ECTS 46.00 55.00 49.24 60.00 47.25 57.00 49.78 60.00
Figure 3. ECTS credits achieved in acad. year (EFOS)
Pearson’s correlation coefficients in Chyba! Nenašiel sa žiaden zdroj odkazov. indicate that points achieved in high school are medium to low correlated to ECTS credits. Low correlation is determined between points achieved in high school and points from Matura exams and between points from Matura exams and ECTS credits.
TABLE IV. CORRELATION AMONG OBSERVED VARIABLES (EFOS)
EFOS School Matura ECTS
School 1 0.02 0.32
Matura 0.02 1 0.02
ECTS 0.32 0.02 1
Graphical representation of those results is given in
Scatterplot matrix in Fig. 4.
The 3rd Human and Social Sciences at the Common ConferenceOctober, 5. - 9. 2015, www.hassacc.com
Educational sciences eISSN: 2453-6075, cdISSN: 1339-522X10.18638/hassacc.2015.3.1.179 - 114 - ISBN: 978-80-554-1124-8

Prediction of the first year study success is, as before, done using multiple regression with the multiple regression equation (1).
Basic indicators of multiple regression are given in Table VI.
Figure 4. Scatterplot matrix of observed variables
TABLE V. BASIC INDICATORS OF MULTIPLE REGRESSION (EFOS)
Variables Coeff. Std. Err t value Pr(>|t|)
Intercept 9.301 7.541 1.233 0.218
School 0.246 0.033 7.469 3.62e-13
Matura 0.004 0.013 0.330 0.742
Variable points achieved based on high school grades are statistically significant predictor of success. Each additional point achieved based on high school grades, holding Matura exam points constant, predicts 0.246 more ECTS credits achieved. Matura exams result is not statistically significant variable. Because multiple R-squared for the model is only 0.100, model is not very successful but indicates that Matura exams points can't be used for such predictions. There are other variables that have to be identified for prediction.
IV. CONCLUSION AND FURTHER RESEARCH
The main research goal of this paper is examination of one aspect of success in the first year of study for students at two faculties: Faculty of Organization and Informatics (FOI) and Faculty of Economics (EFOS). The aspect of success was defined as number of ECTS credits achieved in period of the first year after enrolment. For the purpose, it is investigated whether variables points achieved based on high school grades and points achieved based on State Matura exams can be used as predictors of the aspect of success in two case studies: FOI and EFOS. Only those three variables for the two faculties are considered due to data availability. In our cases, the conclusion is that high school grades are a better predictor for the aspect
than the State Matura exams. In previous research, for example [8] and [9], authors also identified significant prediction power of high school grades for study success in some particular courses or in whole first-year study program. Habits of continuous work seem to be more important for study success than one time results on Matura exams. Presented models did not have high predictive power so other variables are proposed for investigation for prediction purposes, e.g. motivation of students, their socioeconomic status, schools students are coming from etc. complementary to this research and other study success researches.
REFERENCES
[1] Ministry of Science, Education and Sports - MZOS. (2015, September 11th). State Matura. Available at: http://public.mzos.hr/Default.aspx?sec=2246
[2] P. Bezinović, “Državna matura kao zapreka pristupu visokom obrazovanju,”. Revija za socijalnu politiku, vol. 16, pp. 175-208, 2009.
[3] B. Wächter, “The Bologna Process: developments and prospects,” European Journal of Education, vol. 39, pp. 265-273, 2004.
[4] M. J. Garcia-Garcia, C. Gonzalez, and R. Argüelles, “Methodological changes in technical teaching in order to the European higher education area comparison between countries: Italy and Spain,” Procedia Social and Behavioral Sciences, vol. 1, pp. 2701–2706, 2009.
[5] European Union. (2015, September 11th). ECTS Users’ Guide. Publications Office of the European Union. Available at: http://ec.europa.eu/education/library/publications/2015/ects-users-guide_en.pdf
[6] S. Oberman-Peterka, N. Bosanac, and D. Matotek, “Analysis of Efficacy of Studying of the First Generation of Students with National Matriculation,” In Interdisciplinary Management Research X, pp. 755-764, Opatija, Croatia, 2014.
[7] D. Keček, M. Milković, and K. Hajdek, “Data mining methods for predicting course passing rates,” In Proceedings of the 16th International Conference on Printing, Design and Graphic Communications, pp 392-401, Senj, Croatia, 2012.
[8] R. G. Ledesma and N. Obukhova, “Predictors of First-Semester Success in a Small Private College,” Atlantic Economic Journal, vol. 43, pp. 161-162, 2015.
[9] D. Munđar and Z. Erjavec, “Pass rates in mathematical courses: relationship with the state matura exams scores and high school grades,” In Proceedings of The fifth international scientific colloquium mathematics and children, pp. 153-162, Osijek, Croatia, 2015.
[10] B. Divjak and D. Oreški, “Prediction of Academic Performance Using Discriminant Analysis,” In Proceedings of the ITI 2009 31st Int. Conf. on Information Technology Interfaces, pp. 225-230, Cavtat, Croatia, 2009.
[11] J. F. Superby, J. P. Vandamme, and N. Meskens, “Determination of factors influencing the achievement of the first-year university students using data mining methods,” In Proceedings of the Workshop on Educational Data Mining at the 8th International Conference on Intelligent Tutoring Systems (ITS 2006), pp. 37-44, Jhongli, Taiwan, 2006.
The 3rd Human and Social Sciences at the Common ConferenceOctober, 5. - 9. 2015, www.hassacc.com
Educational sciences eISSN: 2453-6075, cdISSN: 1339-522X10.18638/hassacc.2015.3.1.179 - 115 - ISBN: 978-80-554-1124-8

Fuel Poverty Challenges in Serbia: Evidence from the
Suburban Settlement of Kaluđerica
Tanja Bajić
Institute of Architecture and Urban & Spatial Planning of
Serbia, IAUS
Belgrade, Serbia
Jasna Petrić
Institute of Architecture and Urban & Spatial Planning of
Serbia, IAUS
Belgrade, Serbia
Abstract— Nowadays, fuel poverty is a globally recognized social
and energy problem which is significantly influenced by low
household incomes and high energy prices, as well as the built
form elements. Although official data indicate that the average
household in Serbia is a fuel poor household, namely that it
spends more than 10% of its monthly income on energy services,
this issue is not sufficiently addressed in national policies and
academic research. This paper indicates the vulnerability to fuel
poverty of people living in illegally built suburban areas in
Serbia. The results of the survey conducted in the settlement of
Kaluđerica on the outskirts of Belgrade show a low level of
energy efficiency and high car fuel consumption as key factors
affecting the pronounced burden of fuel spending within family
budgets. Due to inefficient heating systems and inadequate
energy performances of buildings, many households are forced to
use risky methods of energy saving that can have harmful effects
on their health, and also erode their quality of life.
Keywords - fuel poverty, suburban settlement, Kaluđerica,
Serbia
I. INTRODUCTION
Fuel poverty is recognized as a serious social and energy problem that is gaining importance with rising electricity prices and awareness of the negative effects of climate change.
The concept of fuel poverty has been discussed in various studies over the last three decades. According to its first definition by Isherwood and Hancock from 1979, it refers to the phenomenon in which households spend more than twice the median (i.e. 12%) on fuel, light and power [1]. Twelve years later, in her book entitled ―Fuel Poverty‖, Brenda Boardman gave a new interpretation and quantification of the concept, according to which fuel poor households are those that ―are unable to obtain an adequate level of energy services, particularly warmth, for 10 percent of their income‖ [2]. This definition and the indicator of 10% as a percentage threshold of income that ―needs to be spent‖ for obtaining an adequate level of wintertime warmth (21°C in the living room and 18°C in the other occupied rooms) was adopted as the official definition of fuel poverty in the UK Fuel Poverty Strategy 2001 [3], to be later also accepted as a conceptual model in other countries. The possibility of obtaining heating was a key element of the first considerations of the phenomenon, primarily because of concerns about the negative effects of cold homes on health, and especially because of the problem of excess winter deaths (EWD) that is more pronounced in the United Kingdom than in other northern countries with similar climates. Amongst the
consequences of fuel poverty, the most frequent include: restricted use of heating, cold and damp homes, debts on utility bills and a reduction in household expenditure on other essential items. In addition, fuel poverty is associated with a wide range of physical and mental illnesses, such as depression, asthma and heart diseases, etc. [4]
Although the factors contributing to the incidence of fuel poverty are complex, the most pronounced causes include: 1) low household incomes; 2) high electricity prices; and 3) poor energy performance of housing stock. The energy used in homes is directly dependent on social stratification, namely on economic possibilities, as well as on the individual preferences and habits of tenants [5], while the factors of built form, like location and energy-relevant characteristics of residential buildings, have an important role. Although wealthier households consume more energy on average, their homes are more often newer and more energy efficient, while poor people's homes have greater energy losses because of their low quality and inefficient heating systems. Pronounced fuel poverty is especially linked to rural areas due to the absence of district heating systems, poor energy performances of residential buildings and a significant share of low-income elderly households, as well as the problem of high fuel costs for cars.
The operational definitions of fuel poverty that explain the structure of fuel poverty and enable its measurement and monitoring differ from context to context, thus making it difficult to compare the severity of this problem between different countries. The percentage share of the population that cannot afford adequate heating and the percentage share of the population in energy arrears are most frequently used as indicators for this phenomenon, but other indicators for the energy performance of residential buildings are also used. There are also differences in defining expenditure on energy, so that the concept of fuel poverty in the British context primarily refers to domestic energy consumption, while, for example in France, the notion of ―energy precarity‖ is increasingly applied to both the home and transport in relation to energy use.
There is a significant increase in concern about the problem of fuel poverty with East European countries joining the European Union. According to statistical data on the incomes and living conditions of EU households (EU SILC 2011), 9.9% of households are unable to keep their home adequately warm in a great number of countries of Western, Central and
The 3rd Human and Social Sciences at the Common ConferenceOctober, 5. - 9. 2015, www.hassacc.com
Social Science eISSN: 2453-6075, cdISSN: 1339-522X10.18638/hassacc.2015.3.1.176 - 116 - ISBN: 978-80-554-1124-8

Northern Europe, while in other parts of Europe this percentage ranges from 10 to 19, apart from Portugal and Latvia (20-29.9%) and Bulgaria and Lithuania (over 30%) [6]. The same source shows that there is almost an equal share of households in arrears on utility bills, a problem which is most pronounced in Greece, Romania, Bulgaria, Slovenia, Croatia and Latvia (20-29.9%) [7].
The post-socialist countries of South-eastern Europe are particularly vulnerable to fuel poverty. They are characterized by a low level of energy efficiency, as well as high share of expenditure on energy in the housing sector. In this region, the economic and political changes in the early 1990s contributed to an abrupt increase in energy prices and a reduction in household incomes, as well as to a number of problems in the production and supply of energy due to technical damage and the inadequate maintenance of already outdated infrastructure and technology. At the same time, the massive privatization of social apartments has raised a complex issue of the management, maintenance and possibility of improving the energy efficiency of this inherited energy-inefficient housing stock.
Cross-regional comparison shows that the efficiency of the Serbian energy system is one of the lowest, and energy intensity is amongst the highest (the ratio of energy consumed to real GDP), which is a result of energy intensive industries, energy-inefficient technologies used in households, industry and energy sectors, and poorly-insulated buildings [8]. Data from the 2013 Survey on Income and Living Conditions conducted according to the EU SILC methodology show that in Serbia 18.3% of the respondents live in households unable to keep their home adequately warm, and as many as approximately 37% of households have arrears on their utility bills, which is more than the EU average [9]. Extensive illegal residential construction widespread all over the country, especially on the periphery of large cities – Belgrade and Novi Sad [10], is a specific phenomenon directly linked to the problem of fuel poverty. Such illegal construction is characterized by locations in suburban and peripheral areas of cities, the absence of district heating systems, single-family detached houses as a dominating typology, and lower construction standards. It is estimated that in Serbia there are from 600,000 to 1 million of such houses (out of a total of 2.95 million units) [11]. This paper will consider the challenges of fuel poverty in Serbia using the example of Kaluđerica, a suburban settlement of Belgrade, which is considered the largest completely built illegal settlement in the Balkans, and most probably in Europe [12].
II. FUEL POVERTY IN SERBIA
Although widespread in Serbia, the fuel poverty problem is not yet an important topic in national policies and academic research. Like in other countries in the region, this issue is mainly addressed through tariff subsidies and social policy mechanisms, and not sufficiently through energy efficiency improvements. In Serbia, energy efficiency is primarily considered as a means for increasing energy security, and it is focused on the domain of energy generation [e.g. 13] and industry, rather than on households vulnerable to fuel poverty [8]. The lack of political and research attention has also
resulted in the lack of an appropriate definition of the concept of fuel poverty which would enable the measurement and monitoring of the problem and the development of an approach to solving it within the local framework. A possible starting point for considering this phenomenon in Serbia is to take into account the generally accepted fuel poverty indicator expressed as a percentage share of the monthly household income used for home energy needs. According to the broader definition of this concept used here, energy consumption is the use of fuel both in the home and for transport.
According to the 2013 Household Budget Survey (HBS), households in Serbia spend a monthly average of 11.3% of their total disposable income on household energy expenditure
1[14]. This indicates that an average Serbian
household is a fuel poor household according to the Western European definition of fuel poverty with the indicator of 10%. When we add the current transport expenditure
2 to the
household expenditure on energy, this share makes up approximately 16.7%. The HBS results show that the degree of vulnerability of the population to fuel poverty is different between urban and other areas, as well as across different regions in Serbia. The share of the total household income spent on home energy bills and transport in urban areas makes up approximately 16%, while in other areas it is almost 18%. This difference clearly indicates the greater vulnerability to fuel poverty of rural and suburban populations that is caused by the location factor, and it primarily refers to transportation costs. According to the household income levels and total household expenditure on energy, the Belgrade region leads, particularly with regard to expenditure on electricity, central heating and public transport. The highest share of the total disposable income spent on houshold energy is recorded in Vojvodina (approximately 13%), where the highest expenditure is on natural gas and coal. On the other hand, the percentage share of the total energy and transport expenditure in households is highest in the Šumadija and Western Serbia Region and makes up as much as 19%. Fuel consumption for cars is also the highest in these areas [14].
The key fuel poverty factors in Serbia are the following: 1) high prices of fuel and district heating in relation to household income; 2) undeveloped and inefficient heating systems and a lack of alternative energy sources, making it impossible for households to save energy; and 3) a low level of energy efficiency of housing stock.
Although the price of electricity in Serbia is among the lowest in Europe [15], heating with electricity, after the heating with liquid fuel, is the least economical, except for the use of electric thermal storage heaters that use electricity supplied at a cheaper night-time rate. The use of cheaper firewood is still the least expensive type of heating, while the gas prices in Serbia are still too high and are permanently rising.
1 The household energy expenditure means the total expenditure on
electricity, natural gas, bottled gas, liquid fuels, firewood, coal, central heating and hot water and other heating-related costs.
2 The current transport expenditure includes the expenditure on fuels and
lubricants, as well as on urban and intercity passenger transportation, including taxis.
The 3rd Human and Social Sciences at the Common ConferenceOctober, 5. - 9. 2015, www.hassacc.com
Social Science eISSN: 2453-6075, cdISSN: 1339-522X10.18638/hassacc.2015.3.1.176 - 117 - ISBN: 978-80-554-1124-8

The 2011 Census data show that 22% of apartments in Serbia have central heating, 20.6% of them have apartment-contained central heating, while a total of 57.2% of apartments have no installations for central heating or apartment-contained central heating [16]. According to the HBS data, over 56% of households in Serbia use only solid fuels (wood and coal) for heating, while the share of solid fuels at the level of the poorest households makes up 86.5% [14].
For the first time ever, the Law on Planning and Construction from 2009 introduced the concept of energy efficiency into the national regulations in the energy and construction field, as well as obligatory energy certification of buildings. One of the first steps in the process of implementing the Law and accompanying regulations in the field of energy efficiency of buildings was the energy efficiency classification of buildings in Serbia which was carried out in the period from 2011 to 2013 according to the methodology developed within the European project TABULA
3. The purpose of forming the
typology of buildings, published in the Atlas of Family Housing and the Atlas of Multifamily Housing [17, 18], was to assess the quality of residential buildings in Serbia regarding their energy performance. The results of this research indicate an inadequate energy efficiency status of the existing housing stock in Serbia, out of which 87% is mainly single-family detached houses. On average, approximately 83% of the listed single-family houses do not have thermal insulation, while in most of the houses that have thermal insulation, the average thickness of the thermal insulation layer (approximately 5cm) does not meet the energy efficiency standards. The inadequate thermal characteristics of windows were also recorded (70% of them are older than 30 years), as well as a high percentage of unfinished facades (a huge 38% in the period 1991-2011). In the category of multi-family houses, the large heat losses are caused by non-insulated or inadequately insulated building envelopes and worn-out windows, mainly made of wood (72%). Approximately a quarter of multi-storey buildings were built during the intense period of housing construction (1971-1980) that was characterized by the use of precast concrete, the thermal protection of which does not meet the current requirements and standards.
The households in Serbia faced with fuel poverty have developed different coping strategies that often have unwanted effects on their health and quality of life. According to the UNDP research carried out in 2004 [11], there are different risky saving methods and risk-free saving methods. Risky saving methods include using cheap and low-quality fuels, reducing the use of certain appliances, reducing the number of heated rooms and using fuels, such as unseasoned wood, that produce indoor pollution. Risk-free saving methods include turning off lights; switching more electricity consumption to the night, when tariffs are lower; insulating doors, windows and exterior walls; and purchasing appliances with low energy consumption. This research shows that the risky saving methods are mostly used by poor households that are not connected to the district heating systems. On the other hand, the wealthier households in Serbia in principle have no energy-saving habits because they link this practice to poverty, but
3 IEE project: TABULA – Typology Approach for Building Stock Energy
Assessment, www.building-typology.eu
when they do save energy, they use the less risky saving methods.
III. VULNERABILITY TO FUEL POVERTY IN SUBURBAN
AREAS: A CASE STUDY OF KALUĐERICA
The illegal construction in suburban areas of the cities in Serbia, with typical examples being Belgrade and Novi Sad [10], began at the end of the 1960s primarily as a consequence of poor housing conditions and inadequate housing policies that did not provide the opportunity to all citizens to use a socially owned apartment, but neither did it provide the possibility to legally build a house with one’s own money [19]. This practice was in full swing particularly in the 1990s simultaneously with the abandonment of the social housing system and with a massive inflow of refugees from the war affected areas of the former Yugoslavia. Building houses without getting the required permits, without designs and with their own hands, for many families was an easier way to provide a roof over their heads.
In addition to them being located in the urban peripheries and having different infrastructure deficiencies, the general characteristics of illegally built settlements, the so called ―wild settlements‖, include them being made up of single-family housing (detached houses), lower building standards and a low level of energy efficiency, as well as the absence of a district heating system. The common phenomenon is that the households live in uncompleted residential buildings for a long period of time. The housing conditions, combined with the marked presence of lower income social categories, indicate a high degree of vulnerability to fuel poverty for those living in these areas. The fact that the permits required for investment and energy efficient improvements cannot be issued to illegally built structures is recognized as a specific challenge for the future energy policy in Serbia [20].
The purpose of conducting empirical research into the problem of fuel poverty in the suburban area of Belgrade was to obtain indicators for the structure of household expenditure on energy, as well as for the level of and potential factors relating to their vulnerability to fuel poverty. The settlement of Kaluđerica in the periphery of Belgrade was selected for this research as a specific example of an illegally built settlement (Fig. 1). Its urban and demographic development started in 1967, and today, in terms of the population size (approximately 27,000 inhabitants according to the 2011 Census), it has reached the size of a smaller urban settlement. This settlement belongs to the Belgrade suburban municipality of Grocka and is about 10 km from the city centre. Today, there are 8,831 households and 10,866 apartments with an average size of 75m
2, which is approximately 9m
2 more than the average
apartment size in the Belgrade region [16]. The results of a survey on the residential preferences of the population living in this suburban settlement conducted in 2014 showed that the main motives to settle in Kaluđerica were ownership of the property, and its size, quality and value. The survey also showed that the respondents, to a great extent, expressed their dissatisfaction with the overall housing amenities and their quality of life (due to a number of infrastructure problems, lack of facilities, poor environmental quality, etc.) [21].
The 3rd Human and Social Sciences at the Common ConferenceOctober, 5. - 9. 2015, www.hassacc.com
Social Science eISSN: 2453-6075, cdISSN: 1339-522X10.18638/hassacc.2015.3.1.176 - 118 - ISBN: 978-80-554-1124-8

Figure 1. View on the settlement of Kaluđerica (photo: Tanja Bajić)
A. Methodology
A survey on fuel poverty in Kaluđerica was conducted in February 2015 on a representative sample of 50 households, which make up approximately 0.6% of the total number of households in the settlement according to the 2011 Census. The sample was formed by the random sampling method, taking into account only the criterion for balanced distribution of households in the settlement according to the previously designated spatial zones. The research was for the most part carried out by means of a personal in-home survey using the survey questionnaire, while a smaller share of respondents were surveyed by email. The survey was anonymous, and the answers to the survey questions were given only by one member – a representative of the household, who was a male in almost 90% of the cases and who explained his interest in participating in the survey by his better knowledge of problems relative to the female members of his household.
The questionnaire consisted of four parts. The first part of the questionnaire referred to the general data on the household, the second part referred to the household expenditure on energy, the third part referred to the energy characteristics of the family house, and the fourth part referred to the indicators for the assessment of thermal comfort. The problem of fuel poverty was considered in terms of the measurements that were carried out on the basis of the following indicators: the ratio of total household income to the household expenditures on energy (average monthly household expenditures on heating, electricity and transport); electricity bill arrears; basic energy-relevant characteristics of family houses, as well as indicators for the assessment of thermal comfort, which were all defined according to the national methodology used within the TABULA project [17].
B. General Data on Housholds
The average size of the households surveyed was 4.4 persons per household, while the size of several households surveyed was 8 persons. The four-person households are the most represented (30%), followed by five- and six-person households (18%); the participation of two- and three-person households is uniform (12% each), while the percentage of the single-person households is negligible. Households made up of one or more generations of parents with at least one child under 19 years of age were the dominating household type (58%), followed by households with children over 20 years of age (22%), while households with two or more persons with no children were represented with 18%.
The share of households with one person who earns a regular monthly income was the highest (30%), followed by 2 persons (28%), 3 persons (24%), 4 persons (10%), and 5 persons (6%) who earn regular monthly income, while one household had no regular income.
C. Expenditure on Energy
According to the survey data, as many as 66% of the households in Kaluđerica spend over 20% of their total monthly household income on household energy and transportation costs. For the same needs, 20% of the households spend 15-20% of their total monthly household income, 10% of them spend 10-15% of their total monthly household income and only 4% of the households spend less than 10% of their disposable income (Fig. 2).
4%
10%
20%
66%
<10% 10-15% 15-20% >20%
Figure 2. Share of households, grouped by average expenditure on energy
services (as % of the total monthly income)
In approximately two thirds of the households surveyed, the use of solid fuels (wood and coal) is a dominant source of household heating, where firewood is the most represented fuel, used by 66% of the households. Electricity is the second heating source represented (14%), while the third dominant heating source is modern biomass pellet stoves (12%), which have become an increasingly popular option (Fig. 3). Over half of the households have individual central heating or apartment-contained central heating, while more than one third of homes are still heated with solid fuel stoves. For a smaller number of households, electric thermal storage heaters are the primary type of heating (mainly used in combination with a wood-burning stove) and are most frequently used for heating the bedrooms. Approximately 40% of the households have air conditioning units that are mainly used for cooling the rooms in summer, while every fourth household also uses them for additional heating of rooms in winter.
The average monthly expenditure on electricity in the households surveyed is 5,800 RSD (cca 48 EUR) per household, which is certainly more than 12% of the average monthly net earnings in Serbia.
14%
66%
8%
12%
electricity firewood
coal biomass
52% 36%
12%
central heating
solid fuel stove
electric thermal storage heater
Figure 3. Household heating by primary energy sources and heating systems
The 3rd Human and Social Sciences at the Common ConferenceOctober, 5. - 9. 2015, www.hassacc.com
Social Science eISSN: 2453-6075, cdISSN: 1339-522X10.18638/hassacc.2015.3.1.176 - 119 - ISBN: 978-80-554-1124-8

Significant expenditure on individual and public city transport is also recorded. 70% of the households use their own cars as a means of transportation and spend on average approximately 10,000 RSD (cca 83 EUR) on fuel. However, this can vary significantly and range from 1,000 RSD (cca 8 EUR) up to 50,000 RSD (cca 414 EUR). Approximately three quarters of the households spend regularly on public city transport, while there is a lower share of those that use taxis or interurban transport. According to the respondents, only 12% of the households have electricity bill arrears.
D. Energy Characteristics of Buildings
The analysis of the general energy characteristics of housing stock embraced by this research indicates a low level of energy efficiency, mainly due to the lack of financial resources of the residents for completing the construction of their houses. Using the random sampling method, households living in new houses built after 2000 (44%) were mainly selected; while houses built in the 1970s, 1980s and 1990s are uniformly represented.
Approximately two thirds of the houses are detached and square-shaped, while the remaining third of them are semi-detached and detached houses of elongated or non-compact shape. The share of openings on the facade of all the houses is less than 50%. The majority of the houses have sloping roofs and attics that are in 28% of the cases used for dwelling, while temporary roof structures are recorded in 12% of the houses.
The exterior walls of the residential buildings are most often made of 20cm thick hollow (clay) blocks, while a lower percentage of them are made of bricks, a combination of blocks and bricks, or concrete blocks. The building envelope thermal insulation is complete in 56% of the houses, while houses with partially applied thermal insulation or with no thermal insulation make up 22% (Fig. 4). 5cm thick polystyrene was used as thermal insulation in most of the finished facades, while mineral wool or thinner polystyrene were used to a lesser extent. Roof heat insulation was applied in 26% of the houses, while only 40% of the houses have floor thermal insulation. Given that a significant percentage of the houses analysed were built over the last fifteen years, new double-glazed windows are the dominating type.
The windows are less than 10 years old in 52% of the cases, the windows 11-20 years old (20%) and 21-30 (18%) years old are relatively uniformly represented, while in 10% of the cases the windows are more than 30 years old. PVC and wood are the most common types of windows; there are fewer cases of aluminium windows, while the old wooden single glazed double-wing windows are found in the houses built in the 1970s.
56% 22%
22% yes
no
partially
Figure 4. Thermal insulation of facades
2%
26%
20% 22%
30%
<25%
25-49%
50-74%
75-99%
100%
Figure 5. Share of housholds by heated area of dwelling (in %)
E. Thermal Comfort
The family houses in Kaluđerica have two or three storeys on average, but are mostly uncompleted so that the households live in only a part of the total floor area of the house, which they heat completely or partially. In the sample analysed, the average net usable area of apartments or houses (if one household uses the entire house for living) is 135m
2. In 58% of
the cases, this area is less than 100m2, in 30% of the cases it is
between 100 and 200m2, and only in 10% of the cases is it
greater than 200m2.
Less than a third of the households surveyed heat the entire usable area in the heating season. The share of households that heat 1/4-1/2, 1/2-3/4 and over 3/4 of the apartment or house is relatively uniform, while the percentage of those that heat less than 1/4 of their living space is negligible (Fig. 5). According to the subjective estimates of the respondents, approximately 50% of them were satisfied with air temperatures in their homes during the winter months, 44% of the respondents were only partially satisfied, while 6% of the respondents were not satisfied.
IV. CONCLUSIONS
The problem of fuel poverty has not yet been sufficiently addressed in Serbia, although it affects its entire population and not only the most vulnerable social categories. This is confirmed by the data that an average household in Serbia spends more than 10% of its total monthly income on household energy costs, and almost 17% of the total monthly income on home energy bills and transport. This paper indicates the issue of fuel poverty in the context of illegally built suburban areas in Serbia using the example of the Kaluđerica settlement on the outskirts of Belgrade. Empirical research conducted using a survey questionnaire confirmed the assumption of a very pronounced vulnerability to fuel poverty among the residents of this settlement and the influence of the factor of the built form on this phenomenon.
This analysis of household expenditure on energy took into account not only the home energy expenditure, which relates to electricity and heating in the case of this settlement, but also the household transport expenditure, namely the expenses for car fuel and commuting. It was necessary to apply this wider definition of fuel poverty in the subject context in order to determine the influence of the location factor on the material deprivation of households regarding the use of energy resources. The research showed that, in addition to high energy prices in relation to disposable income, high expenses for car fuel and having an inefficient heating system (as a product of the location factor), as well as the energy inefficiency of
The 3rd Human and Social Sciences at the Common ConferenceOctober, 5. - 9. 2015, www.hassacc.com
Social Science eISSN: 2453-6075, cdISSN: 1339-522X10.18638/hassacc.2015.3.1.176 - 120 - ISBN: 978-80-554-1124-8

residential buildings also contribute to fuel poverty in this suburban settlement. According to the data obtained, 86% of the households surveyed spend more than 15% of their monthly income on home energy bills, while for 66% of the households, this amounts to over 20% of their income, which is offered as an upper threshold for the given indicator. Many respondents in this category claimed that for them, this figure exceeded 30%. For the sake of comparison, the same indicator in the region with the highest fuel poverty level recorded in Serbia is less than 20%.
The survey results showed that, although the residents of Kaluđerica mostly commute by public transportation, there is a significant share of households that regularly use cars (as high as 70%), thus spending four times more of their income than the average at the level of the city. Furthermore, commuting costs are a dominant factor in the structure of the expenditures analysed in many households. Given that Kaluđerica is not connected to the district heating system, the commonly used heating systems are: individual heating systems or apartment-contained central heating, and the traditional solid fuel stoves, while wood and coal are used as a primary fuel in approximately two thirds of cases. Slightly more than a half of the houses embraced by the survey had a complete building envelope thermal insulation, but its thickness most frequently did not meet the current energy efficiency regulations. Nevertheless, comparing this data with the results of a survey conducted at the end of the 1980s, when only 26% of houses in the ―elite‖ part of Kaluđerica had finished facades [12], it may be noticed that both the availability of thermal insulation and the awareness of energy efficiency have increased. On the other hand, investments in additional energy-saving measures are still not sufficient. The extent of the influence of elementary improvements in energy efficiency on thermal comfort is shown by the data that more than a half of the respondents not satisfied with the winter temperatures in their homes lived in houses with unfinished facades. The indicators for thermal comfort also indicate that reducing the heated space is a common practice of the residents of this settlement, thus approximately 30% of the households surveyed heat less than 50% of their living area during the heating season. When we add the data on the frequent use of inefficient wood-burning stoves, as well as the use of cheap heating fuels, the problem of using risky methods of energy saving, with all of their negative effects on health and quality of life, is evident in this settlement.
This paper highlights the specifics and some of the key factors of the fuel poverty problem in Serbia which are related to the unplanned and uncontrolled development of suburban areas. Addressing this issue in further research and practice will certainly require the examination of potential ways to improve the overall energy efficiency in these areas, both in terms of housing stock and heating systems.
ACKNOWLEDGMENT
This paper is a result of the projects: ―Spatial, Environmental, Energy and Social Aspects of Developing Settlements and Climate Change – Mutual Impacts‖, No. TR 36035 and ―The Role and Implementation of the National Spatial Plan and Regional Development Documents in
Renewal of Strategic Research, Thinking and Governance in Serbia‖, No. III47014, which are financed by the Serbian Ministry of Education, Science and Technological Development.
REFERENCES
[1] C. Liddell, C. Morris, S. J. P. McKenzie and G. Rae, ―Measuring and monitoring fuel poverty in the UK: National and regional perspectives‖, Energy Policy, vol. 49, pp. 27–32, 2012.
[2] B. Boardman, Fuel Poverty: From Cold Homes to Affordable Warmth. London: Belhaven Press, 1991, p. 207
[3] DEFRA, The UK Fuel Poverty Strategy 2001, Available at: http://webarchive.nationalarchives.gov.uk/20121217150421/http://decc.gov.uk/assets/decc/what%20we%20do/supporting%20consumers/addressing%20fuel%20poverty/strategy/file16495.pdf
[4] EU Fuel Poverty Network (2011) Working to raise awareness of fuel poverty across the EU. Available at: www.fuelpoverty.eu
[5] L. Lutzenhizer and B. Hackett, ―Social Stratification and Environmental Degradation: Understanding Houshold CO2 Production‖, Social Problems, vol. 40, no. 1, pp. 50–73, 1993.
[6] C.R. Wand (2013) % of households unable to keep their home adequately warm. Available at: http://fuelpoverty.eu.
[7] C.R. Wand (2013) % of households in arrears on utility bills. Available at: http://fuelpoverty.eu.
[8] H. Stadtmüller (2014) ―Understanding the link between energy efficiency and energy poverty in Serbia‖. Available at: http://rs.boell.org/sites/default/files/uploads/2014/09/stadtmueller_2014_understandingthe_link_between_energy_efficiency_and_energy_poverty_in_serbia.pdf
[9] Statistical Office of the Republic of Serbia, Income and Living Conditions in the Republic of Serbia – 2013. Final Report. Belgrade: Statistical Office of the Republic of Serbia, 2015.
[10] J. Petrić, J. Basarić, and T. Bajić, ―Urban society and resilience of Belgrade and Novi Sad in the network of settlements in Serbia – recent changes and perspectives‖. Proceedings of the International Conference on ―Changing Cities‖: Spatial, morphological, formal & socio-economic dimensions, Skiathos island, Greece, June 18 - 21, 2013. Thessaloniki: Grafima Publ., 2013, pp. 1720-1729.
[11] UNDP, Stuck in the past: Energy, environment and poverty in Serbia and Montenegro. Belgrade: UNDP, 2004.
[12] B. Saveljić, Beogradska favela, Beograd: Istraživačko-izdavački centar SSO Srbije, 1989.
[13] T. Pavlović et al., „Possibility of electricity generation using PV solar plants in Serbia―, Renewable and Sustainable Energy Reviews, vol. 20, pp. 201-218, 2013.
[14] Republički zavod za statistiku, Anketa o potrošnji domaćinstava, 2013. Beograd: Republički zavod za statistiku, 2014.
[15] EUROSTAT (2013) Energy price statistics. Available at: http://ec.europa.eu/eurostat/statistics-explained/index.php/Energy_price_statistics
[16] Republički zavod za statistiku, Popis stanovništva, domaćinstava i stanova. Beograd: Republički zavod za statistiku, 2011.
[17] M. Jovanović Popović et al., Atlas porodičnih kuća Srbije. Beograd: Arhitektonski fakultet Univerziteta u Beogradu, 2012.
[18] M. Jovanović Popović et al., Atlas višeporodičnih zgrada Srbije. Beograd: Arhitektonski fakultet Univerziteta u Beogradu, 2013.
[19] K. Petovar, Urbana sociologija. Naši gradovi između države i građanina. Beograd: Geografski fakultet, 2003.
[20] Izveštaj sa Okruglog stola ―Biomasa-održiva energija‖, 7.11.2014, Zlatibor (Bela zemlja). Available at: http://www.bfpe.org/wp-content/uploads/2014/11/GIZ-biomasa_II-okrugli-sto_izvestaj.pdf
[21] J. Petrić, T. Bajić, J. Basarić, ―Nekontrolisano širenje grada pod uticajem faktora rezidencijalnog izbora – primer naselja Kaluđerica u Beogradu‖. Monografija sa naučno-stručnog skupa ―Lokalna samouprava u planiranju i uređenje prostora i naselja‖, Zlatibor, 3-5. april, 2014. Beograd: Asocijacija prostornih planera Srbije, 2014, str. 421-428.
The 3rd Human and Social Sciences at the Common ConferenceOctober, 5. - 9. 2015, www.hassacc.com
Social Science eISSN: 2453-6075, cdISSN: 1339-522X10.18638/hassacc.2015.3.1.176 - 121 - ISBN: 978-80-554-1124-8

EDUCATION AND PHRASEOLOGY
Margarita Dedej
European University
Tirana, Albania
Abstract— The purpose of this study is to highlight the features of
adjectival phraseological units and their use by certain social
groups by identifying the relationship of man and their
conceptions of life reflected in language. By using some idioms,
the author analyzes the semantic relation between words in
examples detached from the daily discourse or various
dictionaries, to shed light on the relations that man creates with
the nature surrounding him, and his perception of the world, the
environment, a phenomenon or the human feelings. These
observations are aslo compared with the English language. In the
following examples, the author observed how they make use of
adjectival phraseological units in different areas and in different
groups or communities. By simple reasoning many of these
concepts to life and the environment surrounding the manner of
perception of a community or a particular social group, the link
between the meaning and the word frontal figurative meaning is
embedded in the language and culture over time. The adjectival
phraseological units, to which the meaning of the integral limbs
analyzing phraseological units in particular, are independent of
the general meaning of the whole unit. Thus, colors and labels are
used to reflect viewpoints about certain social economic situations
or to set of actions and people. In many cases, Albanian limbs
frequently used with a figurative meaning of the adjectival
phraseology, enables the construction of phraseology
opportunities offered by the language, known as analogical
formations. These units can be used to replace an adjective
within a sentence and an endless opportunity for creating new
words or new meanings with multiple stylistic overtones.
Keywords- language, phraseological units, social group,
figurative sense, adjective
I. INTRODUCTION
In the field of pedagogy,do this work in order to understand the adjectival phraseological units are an important part of the language and as such , express emotions or mental state.
Impact of adjectival phraseological units in language comes from numerous options and features that allow the outstanding use of phraseological units in different texts as a means of enriching the language inexhaustible.
Starting from these data that are the fruit of experience in teaching I noticed that adjectival phraseological units play an important role in understanding as well as their use in discourse.
Bringing examples could observe how phraseological units are an integral part of the language and as such occupy a special place and in different texts as a means of enriching the language inexhaustible.
Interaction between two objects is the relationship that exists between the real world and physiology, and sensory
organs mark meanings associated with the operation that senses. Overall connection between bodies and their semantic referent is determined by cultural differences.
Phraseological units are motivated by different conceptual metaphors and a way to discover knowledge metaphorically through close study of mental images that people create for phraseological units.
II. SOME EXAMPLES OF THE USE OF IDIOMS ACCORDING TO
THE SITUATION
Phraseological units, just like words have a meaning, but often this is not the direct meaning of the constituent members (their meaning extracted by means of integral limbs), e.g., ―had two ribs yarn‖ (very poor) the meaning carried in entirely words and phraseological unit ―skinny‖ (very weak), the meaning of words is drawn from the constituent parts. In some idioms, the semantic relations between words and offline examples from fiction will be analyzed to shed light on the relations that man creates with the nature surrounding him, and his perception of the world, the environment, a phenomenon or the human feelings. These observations are aslo compared with the English language. Phraseological units have generally adjectival predicative adjective meaning, and as such, its members could merge their meanings and be functionally equivalent to the word. In the following examples, how find the phraseological adjectival use units in different areas and in different groups or communities will be noticed:
1. ―White as biluri‖ (Shkodra) (porcelain)—The phraseological unit is used to identify the purity;
2. ―White as lime‖ (like whitewash and milk of lime)—Its comparative form of the phraseological unit displays a direct sense and relates to the object based on the similarity of the color;
3. ―White as milk‖ (dairy products)—Which means more white, its comparative form again gives the concept of white;
4. ―See things in black and white‖ (black and white (one-sided))—This juxtaposition is made based on the contrast to show the attitude of a man undecided or biased, while the directly phraseological meaning of this unit suggests any anomalies senses of sight;
5. ―Has white spirit‖ (the white hearts, generous and loving)—It seems that the British people used it, but such a conceptual formulation relates and identifies one of the most important virtues of Albanians, part of the century-old tradition inherited from generation to generation—generosity;
The 3rd Human and Social Sciences at the Common ConferenceOctober, 5. - 9. 2015, www.hassacc.com
Social Science eISSN: 2453-6075, cdISSN: 1339-522X10.18638/hassacc.2015.3.1.181 - 122 - ISBN: 978-80-554-1124-8

6. ―A handful of white‖—The phraseological unit conceals a sense that nothing is likely related to the color of money, but by way of fair and honest with those which were obtained before removing the white of the eye (very brave and resourceful);
7. ―Dressed in white‖ (white of the eye)—The phraseological unit did not leave the meaning of frontal, because their sight is the most expensive and the only man through which come to see and connect with the world around us;
8. ―The white pages‖ (honest)—Only a connoisseur of Eagle manages to realize that it is not followed. The phraseological unit to show the color of the site is connected with a character virtue, such as honesty;
9. ―White hair‖ (grizzly)—Hair has fallen snow (on top) (the gray, decrepit);
10. ―White haired‖—The phraseological unit is equivalent to the word, and as such it is used to identify a person of advanced age, with gray hair and has gained enough experience in life.
In English there are some uses of the adjective 'white' in special cases worth adjectival phraseological units in which we do not find relevant in Albanian. Why? By simple reasoning of many of these concepts to life, the environment associated with the perception of a community or a particular social group. For example, ―white crow‖ (raven white), ―white elephant‖ (fruitless), ―white lie‖ (small lie/insignificant), ―white coal‖ (coal white, hydropower), ―white hot passion‖ (fiery passion), and ―white blooded‖ (anemic).
The study showed that in English, there are some valuable adjective phraseological units which be formed by the adjective "white", which have no equivalent in the Albanian language.
1. ―Black as tar‖— Phraseological unit is realized on the basis of similarity and color, tar (a by-product of the oil that is used for paving roads and is black;
2. ―Black as a raven‖ (very black)—The basis of this comparative phraseological unit becomes not only based on color, so this comparison coloring is coming through the hidden meaning that there is no direct semantic connection, because the raven is a bird that is haunting or a admonisher of evil.
3. ―Black as porridge‖ (in Shkodra)—The phraseological unit is used in Shkodra and the comparison seems not straightforward, because porridge done with flour and therefore there is no black, so the connection will be seeked elsewhere. Porridge is a kind of traditional cooking in tough economic times, so this comparison is related to the dark days of economic misery;
4. ―Black as night‖—This is closely compared with no moonlight and no stars, with a very dark night and is a phrase that is echoed in English in the form of ―black night‖ or ―white night‖;
5. ―Black as soot‖ (like coal)—The phraseological unit is constructed by the similarity of the color black. Soot (or coal) has the color of black;
6. ―With black heart‖ (black soul)—The ―black heart‖ phraseological unit conveys its meaning through connection with the soul of a bad man;
7. ―Makes black and white‖ (liar)—A man who devised the opposite of what is true, while the changes or differences are substantial.
In the above examples, sometimes phraseological meaning is related to the original meaning, and it realizes the transformation of figurative meaning of phraseological limbs inside the unit. Phraseological units found in the figurative sense were given the direct meaning. The link between the word meaning and the frontal figurative meaning is embedded in language and culture at the time. Plenty of phraseological units are based on conceptual metaphors that affect the conceptual level and not the lexical. In the adjectival phraseological units, the meaning of the integral limbs of the context of the phraseological units in particular, are independent of the general meaning of the whole unit. So in the above examples, colors were used to reflect views about certain social economic situations or set of actions and people. In certain cases, to understand adjectival idioms interfere mechanisms, such as metaphor and metonymy, contribute to giving a proper understanding of the whole unit. Through their possible meaning abstract concepts make them simpler, more concrete. Phraseological units vary according to the forms of their use in discourse and can be used in terms of their direct or figurative sense. Phraseological units have as their equivalent phrase free. Free phrase is solidified by the constant use of a particular form of phraseological unit for a long time and with a new meaning of limbs. During the historical development of language, the new meaning acquired by the two parts is different from that it previously had (before moving on phraseological unit) e.g. put hand on heart becomes hand on heart, etc.
In some cases, compound words, free from their frequent use of phraseological units, pass through metaphor. This change is not immediate, because the author needs a long time to acquire new features (new figurative sense).
Adjectival phraseological units form an important group to enrich the literary language, but also the conversational discourse in everyday life. Plenty of free compound words after lexicalization pass to phraseological units through the use of metaphor.
―She said everything just in her face, but Bojka’face was seven acres and didn’t pay attention to those words‖ (the meaning of the expression in this context is cheeky). (Thomai, 1981:194)
In the above example, the meaning of adjectival phraseological unit is given by merging the meanings of integral limbs (verb + nominal group). The verb is used in its direct meaning and nominal limb is used in its figurative meaning.
The 3rd Human and Social Sciences at the Common ConferenceOctober, 5. - 9. 2015, www.hassacc.com
Social Science eISSN: 2453-6075, cdISSN: 1339-522X10.18638/hassacc.2015.3.1.181 - 123 - ISBN: 978-80-554-1124-8

In many cases, in Albanian language, the frequent use of the figurative meaning of adjectival phraseology enables the construction of phraseology according to the opportunities offered by the language, which are known as analogical formations, for example:
(a) sharp tongue ―The bride had a sharp tongue and the old woman did not want to speak to her.‖ (Thomai, 1981:189) (sharp tongue).
Adjectival phraseological units that have as a source the free phrase consist of limbs that have lost their semantic independence. If limbs are separated from the phraseological phrase, they have different meaning. In some cases, loss of limb independence in phraseological units is complete.
(b) On the edge of the burst (very disappointed), soul burst, burst heart, etc.. ―I can not see her at the edge of the burst , it hurts a lot‖ (Thomai, 1981:45).
Loss of independence of the limbs may also be partial in adjectival phraseological units, such as ―gleeful heart‖, ―beaten by life‖. Some of the limbs in adjectival phraseological units during language development may have a different meaning from that phraseological unit. In many cases, meaning of limbs in particular can not be assumed, so they enter the discourse as a finished unit. In some cases the limbs are solitified and unified with other members to draw meaning of phraseological unit. Since adjectival phraseological units have the meaning of contributive adjective and not that of the attributive, they indicate qualities of humans or items. Free compound words often serve as the semantic meaning of the subject entity that makes its direct meaning. For example:
―The bride had sharp tongue and the old woman did not want to speak to her‖ (Thomai, 1981:189) (sharp tongue)
III. ETHNOLOGY USE OF PHRASEOLOGICAL UNITS OF
WOMANHOOD
Phraseological units enter into the discourse and reflect the peculiarities of the social groups of which are used. In certain circumstances, adjectival phraseological units are developed and changed accordingly by women, embedded their way of thinking or living. For example:
1. ―Be crate padlock‖ (closely related)—As daughter and mother are related spiritually, as well as mentally (since they are both female), so very close. They are mother and daughter, crate padlock. (Thomai, 1999, p. 6)
2. ―Rotting in the belly‖ (bad, black soul)—Such expression among a group of women has not only the sense of a woman with a bad heart, but using its utmost reaches a stage and seeks to identify a barren woman and a bad heart;
3. ―Became belly noodles‖ (hungry)—The unit was used in comparative form, because noodles are assortments prepared by women and are used to identify a man who is hungry. Sometimes, even women use such an expression,like ―flake thin‖—very hungry identifying the thickness of the pie;
4. ―The summer season has mouth‖ (soft-spoken)—The phraseological unit identifies opinion for a new bride, beautiful and soft-spoken, and it finds room in other units, such as ―sweet mouth‖, and ―nightingale in the cage‖—the ladies, good girl, girl who stays at home and does house works. This unit reveals the opinion for a hardworking and honest girl. For example, ―She is a perfect lady, she is a nightingale in the cage‖ (Stefanllari, 1998:27);
5. ―killed snake‖ (tired)—Whining is a kind of thick snake and usually found near the village houses and feeds with mice or birds. Here used in the context of tired, clumsy, and helpless, it refers to a woman who is not agile and who is an idler. For example, ―It is like killing snake, from misery‖ (Thomai, 1981:32).
6. ―Be two-ply rib‖ (be emaciated, weak)—Women’s thoughts come as configurations of traditional mentality that a poor bride may not heir healthy community and that women should choose carefully. Phraseological unit, ―as foot bird‖ identifies and names a slender girl or fed with flies - not burnt bread – versatile. The ladies, in this unit, have unfolding petrification to the specific thoughts of a girl, a homemaker.
7. ―The cat has eaten the dough‖ (bored)—The phraseological unit has strands and use of womanhood for the simple reason that womanhood cook dough and bread in the oven. As we see from the examples found in the Phraseological Dictionary of the Albanian Language and in everyday discourse, the words used by women, are delicate and they are part of the activity and engagement of women as a cooker (in witchcraft, the use of the words ―dough‖, ―bread‖, ―noodles‖, etc.) on the growth and care of children (mother-child relationship ), the tailor, the washer, etc.;
8. ―Jackals milling‖ (talkative)—The phraseological unit of womanhood certainly is used mainly in the countryside especially when waiting in line to grinding at the mill. The unit is a component naming of wild forest animals (jackals) that identifies an agile and mischievous man;
9. ―Becomes sunny‖ (good) (Shkurtaj, 2009:30)—The versatile unit has as semantic hotbed of universal energy source, the sun, and identifies with a good man who does good even great;
10. ―The devil entered into the belly‖ (covetous)—The phraseological unit reflects the mentality of a man who changed his bad behavior and to convey a particular coloration to this evil identified with the devil;
11. ―Be made to connect the cradle‖ (weak, diminished, and shrunken)—It is probably related with the way of raising children and their relationship in diapers, to identify the growth and care of mothers to their babies. The opinion relates to the body and stature of immature infants, weak and small;
12. ―Has a weak heart‖ (soft, sensitive)—The phraseological unit is used to express an opinion usually for women,
The 3rd Human and Social Sciences at the Common ConferenceOctober, 5. - 9. 2015, www.hassacc.com
Social Science eISSN: 2453-6075, cdISSN: 1339-522X10.18638/hassacc.2015.3.1.181 - 124 - ISBN: 978-80-554-1124-8

because they have softer nature, more sensitive, and can not withstand strong spiritual aftershocks;
13. ―Has golden hands‖—A working unit of womanhood is usually used to evaluate a working girl, who is capable of everything, these thoughts are also reflected in other units of related meaning, e.g. has gold hands, she breaks up at your hand - fragile, delicate, thought for a unit conveys a spiritual thing related to its fragility and delicacy;
14. ―Chamois‖ (agile girl or woman)—The phraseological unit is used by women to give their opinion about a girl too agile and quick, and sometimes without sociable;
15. ―Has sweet blood‖ (loving , sociable)—The phraseological unit conveys the thoughts of a girl who is separated from others, because there is a quality of her, she is loving and sweet;
16. ―To kidnap the head‖ (very pretty)—The phraseological unit reflects the opinion of women for a boy or girl very beautiful and almost a mythical beauty.
To display the view for a more talkative nature, the following expressions are used:
1. ―The tongue is sorrel‖—Sorrel is a kind of wild cabbage which is cooked and has long leaves;
2. ―Spade tongue‖—Here is taken the resembles with the width of the bucket, the metal which resembles the shape of tongue);
3. ―Embroidered with white thread‖ (clear, visible)—This unit shows women’s decisions to act or occurrence that is nailed and is visible, then it is useless to hide what it seems. If to make a careful sewing, women adjust the color of the thread with the color of the cloth, this unit makes visible a mistake or a defect that is easily recognized.
4. ―Be cuckoo‖ (lonely)—The phraseological unit is used by the womenfolk to express their opinions on a man who has just left and on having lost her relatives. Owl in the popular mindset is a bird that lives alone, so the comparison of a man left alone becomes.
5. ―The chicken hearts‖ (cowardly)—The phraseological unit is used to reflect a feature or a particular quality of a woman even though she is compared with a bird.
Partly, expressions are used by women related to their daily lives and their jobs: cooking, cleaning, sewing, raising children, caring for pets, etc.. Phraseological units worth adjectival show that certain social groups have specific ways of thinking and expression, highlighting the exceptional value of the language by using the tools or other items to make comparisons based on the quality or the circumstances of a bird or an animal.
IV. ETHNOLOGY USE OF PHRASEOLOGICAL UNITS BY MEN
In the popular mentality, has always used words and phrases that only by men or only address those facilities assigned to them, making it possible that some of the terms are only used by men. It is not only part of the assessment, but also
a conception of some jobs that only men can make (such as war, heavy drinking, and agricultural affairs). For example:
1. ―Brandy fell‖ (drunk)—The phraseological unit provides the quality of a man who is a drunk lush (for information, women in albanian mentality can not be drunk). Other units are also used, such as ―as became roundish‖, ―became intoxicated‖, and ―became tongue of bell‖. In these units we have not only the opinion about drunk man but also for his incorrect way of action;
2. ―Belt became drum‖ (stupid and incompetent)—The phraseological unit conveys the thought that the man in question is incompetent and stupid, who does not understand;
3. ―The free wet shaves‖ (slicker and rogue)—In this opinion, the phraseological unit is conveyed to a man who is rogue and slicker, to display this view is also used the expression sends you to the sea and you are not wet;
4. ―Gets death eye‖ (brave and courageous)—The phraseological unit is used to point out the quality of a courageous man expressing its opposite, so he has no fear of death, but confronts it with bravery.
5. ―Rocky head‖ is used to give an opinion on a man who does not want to listen or understand what you say , etc. unconvinced. Comparison with the rock comes to show the strength of the rock and the human head
6. ―Has not mate‖ (neat, brave, and hardworking)—The phraseological unit is used to give the good qualities of a man that does not compare to anyone else;
7. ―Has blood sponge‖ (very resourceful, brave, and relentless)—This unit is used to assess the readiness of a good man and ready to sacrifice. He is the only one of its kind;
8. ―The grafted on the trunk‖ (good, polite, and understandable)—Although it is used as a model for a process that is performed only by plants and trees, the expression is rather selected to the context in which is used.
Phraseological units which reflect the way of thinking and different experiences of people, can be used to replace an adjective within a sentence. In the examples below we can see that adjectival phraseological units are an endless possibility to create new word connections or new meanings with multi stylistic connotations. The knife had gone through the bone,
making pig 's, blood boarded the head of , the seething anger in the heart etc.
Phraseological units which reflect ways of thinking and different experiences of people who experience and reflect the position of the speakers can be used to replace an adjective within a sentence. In the following examples, adjectival phraseological units that are an endless opportunity for creating new words or new meanings with multiple stylistic overtones will be noticed: ―as a small white cloud‖ (mobile and temporary), ―the wool had fallen head‖ (ringworm), ―as spider spun‖ (thin), and ―as the sun of May‖ (clear) (Stefanllari, & Dheri, 1975:12).
The 3rd Human and Social Sciences at the Common ConferenceOctober, 5. - 9. 2015, www.hassacc.com
Social Science eISSN: 2453-6075, cdISSN: 1339-522X10.18638/hassacc.2015.3.1.181 - 125 - ISBN: 978-80-554-1124-8

In most cases, a phraseological unit reflect on known or unknown basis, the quality of a thing with which is matched or taken into consideration, especially in the historical aspect that is reflected in the following units: ―be not gullible‖, ―like those dogs that eat the bad guys from behind‖, ―wipe from the earth‖, ―the blood gets eyebrow‖, ―like a big oak leaf‖(the bravest of very good friends), ―no pupil shakes‖, etc.
Phraseological units are elements of language acquisition and as such, they can be used to store expressive and figurative values in Albanian, especially in the use of metaphors, similes (comparison expand), or simple comparison with comparative connecter or not, etc.
V. CONCLUSION
In essence, adjectival phraseological units are generally with the meaning of predicative adjectives and as such are functionally equivalent to the word and finds use in different areas and in different groups or communities. Sometimes they are used to reflect the quality of things or people and used as basic elements of color names. They are used to reflect the views and opinions about certain social economic situations of to set of actions and people.
Phraseological units vary according to the forms of their use in discourse by identifying the different ethnical groups to
use expressions. These expressions can be used with their direct meaning or their figurative meaning, identifying the feminine delicacy and fragility in the construction of phraseological units. In the popular mentality, words and phrases that are used only by men or addressed to them or to those facilities always been used by them, making it possible that some of the terms used only by men. It is not only part of the assessment, but also a conception of some jobs that only men can make (such as war, heavy drinking, and agricultural affairs).
REFERENCES
[1] Institute of Linguistics and Literature. (1995). The grammar of the Albanian language. Tirana: Publication of the Academy of Sciences .
[2] Institute of Linguistics and Literature. (2002). The grammar of the Albanian language II. Tirana: Publication of the Academy of Sciences .
[3] Shkurtaj, Gj. ( 2009). From dialectology the ethnography of speaking. Tirana: The Publishing House ―Morava‖.
[4] Stefanllari, I., & Dheri, V. (1975). Phraseological idiomatic English dictionary—English. Tirana: University of Tirana.
[5] Thomai, J. (1999). Glossary phraseological Albanian language. Tirana: The Publishing House ―Science‖.
[6] Thomai, J. (1981). Issues Albanian language phraseology. Tirana: RPS Academy of Sciences of Albania, Institute of Linguistics and Literature.
[7] Stefanllari, I. (1998). Phraseological English dictionary—Albanian. Tirana: Encyclopedic Publications.
The 3rd Human and Social Sciences at the Common ConferenceOctober, 5. - 9. 2015, www.hassacc.com
Social Science eISSN: 2453-6075, cdISSN: 1339-522X10.18638/hassacc.2015.3.1.181 - 126 - ISBN: 978-80-554-1124-8
Care drain strategies in transnational families
Maria Petronela Munteanu
Faculty of Philosophy and Social-Political Sciences
University of Alexandru Ioan Cuza of Iasi
Iasi, Romania
Abstract – The transnationalism has become in recent years a
well-studied sub-theme of migration, initiated and carried
forward by anthropologists, sociologists, economists and political
scientists. The concept of transnationalism, refers to migrant
networks, transnational communities, or social space that
transnational origin and resident companies are connected. The
study about transnational and global boundaries connections,
posed a challenge for a centric view in the world, resulting new
areas of research, studies about migration and transnational
social fields. In this article I will focus on issues such as: (1)
defining the control and regulation of immigration policies and
migration management; and (2) strategies for international
communication on formal and informal economies remittances
that migrants use to take part in the family life they left behind.
In other words, I focus on the effects of conditioning the transfer
and communication dimensions of care in long distance and
transnational family life.
Key Words: transnationalism, care drain, strategies, family
I. INTRODUCTION
Transnational families are constituted by relational links that target welfare and mutual support and providing a source of identity. Like any other families, transnational families face inequalities among different family members. In transnational families the differences from accessing mobility, accessing resources of different types of capital, or lifestyles, appear in noteworthy ways. Starting from this hypothesis, the specific objectives of this article are: to explore the relationship between migration and the transnational functional family, and to understand better the interaction between transnationalism arrangements and family life. More particularly, in this article we intend to answer the following research questions:
Q1: What types of relationships are produced by care work mediated by technology in transnational family?
Q2: What is the relationship between economic globalization and transnational migration?
Q3: What are the most common methods used by migrants to keep in touch with home or family who remain in the origin country?
II. THE TRANSNATIONALIZATION OF MIGRATION
Policymakers give a increased attention to the relationship between migration and development, not only regarding the transfer of migrants remittances but also regarding the importance of development rather than official aid. Basically, migrants can create spread in the economy, contributing to economic development through remittances, through the return of capital, skills, and social networks when they return home.
However, migrants also represent a loss of educational services, remittances can be reduced and most migrants are not returning, rather create a "culture" of migration. The verdict of policy makers for the origin countries may represent a benefit but also can have negative aspects. A study conducted by IOM concluded, inter alia, that data on the impact of remittances on growth of living standards of society remains vague, but at the same time it has clear potential benefits of diaspora. Migrants can be seen both as a product of globalization and its expression in so far as they treat the world / planet as a common space. (R. Munck, 2008)
We could also say that, according to researcher Munck, migration can be seen as a test for the labor movement today. The movement of the working class and the labor process was national, if not even nationalist. Workers unite both collective exercise but can be combined in terms of ethnicity, national origin and of gender. (R.Munck, 2010)
Global Migration affects a growing number of countries of origin and destination with both positive and negative effects on countries and individuals involved. Policies build the whole process of migration, starting with the departure motivation, policies related to pre-departure training, selecting the destination, and the terms of admission to policies on labor protection, and social and political inclusion.
As a result migration creates a myriad of policy challenges, both in terms of relations between states and also by the nature of politics within states by creating new constituencies and political debate but the new generation. There is no doubt that policies affect migration and migration policies in turn affect the policies.
In the research "Gendering the Politics of Migration" - the author summarizes the history and evolution of scientific research development issues in the context of migration policy. The author notes that overall there was a lack of theorizing involved in international migration policies and that existing studies focus mainly on macro level and are written from the perspective of the central state.
The author has identified three major themes, namely: control (nation-state role in setting the rules inputs and outputs), national security and the issue of incorporation including the impact of migration and citizenship. These three topics were approached from the point of view of the host country for migrants, although there are few examples of research that addresses migration policies.
These three topics were approached from the point of view of the host country for migrants, although there are few examples of research that addresses migration policies. As a
The 3rd Human and Social Sciences at the Common ConferenceOctober, 5. - 9. 2015, www.hassacc.com
Social Science eISSN: 2453-6075, cdISSN: 1339-522X10.18638/hassacc.2015.3.1.166 - 127 - ISBN: 978-80-554-1124-8

result, numerous field studies in policy focused more on the consequences of migration in the destination country than on the determinants or causes in the country of origin. (Nicola Piper, 2006)
Policies that build migration are intertwined in the sense that policies can not be separated from politics. The fact that there was always this idea resulting from gender neutral policies that women are subordinate to men, thus ignoring the specific experience of women and their needs, has been the subject of numerous studies in a variety of contexts.
International migration has become an established feature of global social and economic life. As a result, mobility across borders, attracted general attention on important international policy in recent years.
Current statistics show that more and more Romanians are migrating for a decent life. The strong increase in migration has led to theorizing of two powerful phenomena such as the trans-nationalizing production and trans-nationalizing labor migration. Sassen speaks in his thesis about the internationalization of growth production and capital mobility that have created new conditions of labor mobility. Globalization of technologies, economic policies and strategies of investors have contributed since the 1960s to the formation of a new transnational space for the circulation of capital. (William I. Robinson, 2009).
In recent years Romania was primarily a source country for migration flows. Migration can serve to refocus and questioning normative understandings of gender roles and ideologies, changing traditional roles, the division of labor, and other significant categories of gender and generational construction.
Transnational relations triggered a series of legal problems in the immigrant countries. If migration helps families, despite the distance, to have a better future for children or elderly people, this contributes too, in a positive outcome for the people of underdeveloped countries. But on the other hand, if migration endanger the development of children, or the elderly then migration involves social costs to society. (Erica Richard, 2009)
Families living simultaneously in different nations, which includes both migrant and ethnic minority families can be a source of sensitivity and uncertainty for the nation state. The governments may perceive loyalty to other countries as a threat to their national economy. On the other hand, from the perspective of individuals and their families, nation states and restrictions imposed can be a problem. (D. Bryceson, U. Vuorela, 2012)
III. TRANSNATIONAL FAMILY
Transnational families are sometimes defined as separate families but referring, despite physical distance, to those family units with close ties among its members. Understanding this phenomenon, we refer to the appearance of other terms such as transnational maternity, transnational paternity, and trans-grandparents. Family members from different geographical locations within the system, are connected in a transnational family. Transnational family stretches along the state border,
along a set of norms and values that originate in different social protection systems. In different systems of social protection, rights and obligations relating to family welfare are conceptualized and practiced in different ways. This means that occurs the emergence of new concepts of family life based on social relationships. (Erica Richard, 2009)
Simultaneously, transnational families are built between different nation-states, thus they are imagined and reflective communities. These cross-borders processes involve also the creation of transnational methodologies to understand the construction of common memories, feelings of belonging, networks, mutual obligations and conflict management strategies and the dynamics of power. Easy idealized as porous formations and cosmopolitan, transnational families have become a heuristic emphasis in studying both the conservative and homogenizing processes for complaint and pluralization processes and the emergence of various forms of cultural hibriditare. Therefore they are also realities of identity, characterized by a continuous exchange of judges is renegotiating image mobilized members and the family unit value. (Susana Trovao, 2014).
Although this is not a new phenomenon, the researchers of transnationalism argue that modern relations of production and transport and communication technologies, makes it easier for migrants staying in contact with their family, the country of origin and the country they migrated from. These links are a result of the flows of people, goods, money and ideas that affect the way in which migrants carry their lives in their new country and how people remaining in the home operates. (V. Mazzucato, D. Schans, 2008)
IV. QUALITATIVE RESEARCH ABOUT TRANSNATIONAL
FAMILIES STRATEGIES
This article highlights the transnational nature of life by covering changes in this phenomenon. Life has experience inter-subjective transnational families, across national borders. Consequently, the needs of the transnational family members are often entangled in national intra-complex processes. Transnational families must cope with multiple residences national identities and beliefs. Like any other family, transnational family should mediate potential conflicts between its members, including differences in access to mobility, resources, various types of capital and lifestyles.
As qualitative research methodology on transnational life, I used the guide interview and observation. According to recent statistics, the demand for labor migration in the West is represented by female workers in exchange for labor male. According to researchers in the field, this exchange led to appearance of "the care-drain", the formation of transnational families; global care chain is created by importing care and love from underdeveloped countries to the more developed economically ones. The research subjects of this thesis are represented by women. What I want to emphasize in this chapter refers to practices and strategies that women call to make transnationalism functional.
Regarding changes that appear due to the departure of foreign women, it is clear that we find changes both within the family and in personal and professional life of women
The 3rd Human and Social Sciences at the Common ConferenceOctober, 5. - 9. 2015, www.hassacc.com
Social Science eISSN: 2453-6075, cdISSN: 1339-522X10.18638/hassacc.2015.3.1.166 - 128 - ISBN: 978-80-554-1124-8

migrants. Migration, the absence of the family and society brings with it many changes. This article highlights changes to the parental and marital obligations after the departure.
The physical distance makes it difficult to fulfill parental obligations, and those of the marital home, but that does not mean that there shall be in any way. Migrant women are always in a constant attempt to fulfill these tasks, even remotely. Women interviewed on these tasks, reported that they try to adopt all sorts of strategies for their performance.
Most of the mothers tried to place the decision to migrate in a context of continuous care, noting that their ability to support their children excludes the ability to be physically present with them. The logic of this exchange, gifts and remittances become a strategy of “away maternity”. Due to the relative ease with which cross international borders, gifts and remittances have become transnational currency love. "I always tried to give him everything he needed, I made sacrifices and I sent everything just so I feel less guilty I'm not near him, as I should". (Maria). Migrants must replace parental affection, certain goods whose interest lies in calming the feelings of loss and guilt.
Maintaining intimate relationships of families depend on a variety of transnational care practices involving movement of objects and people values. Care distance moves through formal and less formal channels of marketing, communication technologies such as international remittance companies and facilitators of transport. In the present study, we can identify clear distinctions in how migrants make use of these marketing channels to nurture their relationships with children or other family members.
If life in Romania becomes impossible for Rodica and Ana, the circumstances of their departure were not less excruciating. Mothers, like Ana and Rodica remember us the days before their departure with tense conversations that have tried to explain to their children the decisions of departure. "When my cousin found me a job abroad, I stayed a few days and I thought about how to tell my daughter. She understood right away, it was great when I left, she was 15 years old. My daughter knew that if I go to England, things will get better in our family, we have more opportunities to provide, to fulfill the needs. When I said I was going to England, my little one began to cry, my daughter said that she would miss me and she wants me to take care of myself. I felt that she became angry and worried, but I knew this was the only way to have a better life. "(Rodica)
They were faced with a conflict of parental obligations - providing physical needs of their children while they were absent. These mothers took the decision to leave but assuming continued growth and childcare stating that ensures their physical absence, however, financial condition and welfare of their families.
Care for the family is one of the main ways in which transnational families maintain privacy over long distances. Care drain requires resources, and every resources may be dependent of a particular configuration of resources. Researchers Baldassare, Baldock and Wilding, proposed a multidimensional conceptualization of transnational care which includes five dimensions: personal support, practical support
(such as the granting of advice), emotional support which aims to improve the mental well-being, financial support and accommodation. (M. Kilkey, L. Merla, 2011.)
These dimensions can be seen as expressions of emotional support simultaneously. Looking at these cases we can make a difference in the care of granting practices. Numerous studies have identified that transnational families adopt different methods to maintain intimacy with those left at home and takes responsibility for granting care. Remittances, regular visits and face to face communication are critical in understanding how that transanational families manage to remain united. In addition, methods of communication such as letters, phone calls, messages, and most recent methods emails are ways in which migrants can manage to maintain contact with their families. (Tingyu Kang, 2012)
Comparing migration from our day with migration from the past we can say that in the past the main way to keep in touch with family was sending correspondence and packages. Phone calls were very rare because of the high cost of owning a phone or recharging the pre payd cards. "We took care of every cent, every offer that appeared to talk to my family. Today is easy with this technology, but for me was very hard when I left for the first time. It was hard to not hear for weeks, sometimes even months with my family. "Caring for family, liaising with the family is of great importance to the safety and security of the family. Unfortunately for Rodica, this physical distance and emotional absence, distanced her from her husband, and lost many events from childrens lives.
The transnational family is separated primarily by geographical distance, but the last few years, yet they manage to maintain a closer relationship with the family, through various methods of communication, as does Ana. Increasingly within transnational families we can bring into question the concept of co-presence virtual or connected, to theorize this feeling / need to be together through the Internet. The introduction of social technologies in the lives of transnational families make the migration process easier to be accepted than before, giving them individuals, not just the opportunity to manipulate and maintain family ties but also the opportunity to negotiate their roles over time. "It is easier now that we have cellphones and internet, we always talk, see and hear at the same time, sometimes we do things together, we talk on Viber, and sometimes I also help her with her homeworks.". (Ana 35).
The distinctive feature of media technology tools, is to break the distance and time limitations that prevented communication in the family. This quality could change how migrants and their relatives abroad, interpret geographical separation. Yet granting transnational care can not always reproduce in how to achieve in the past or how family members want because of geographic distance. An example might be those rituals and daily activities, like those before bedtime rituals or habits of personal hygiene, etc. "Clearly, I'm glad I can talk to my daughter, but due to time zone, we can not talk until later, it is hard but we manage. "(Ana)
By definition transnational families are less related to the predominant discourse of isolated nuclear family unit is more permeable to and social environment influences. Ability to liaise with the extended family and the wider community home
The 3rd Human and Social Sciences at the Common ConferenceOctober, 5. - 9. 2015, www.hassacc.com
Social Science eISSN: 2453-6075, cdISSN: 1339-522X10.18638/hassacc.2015.3.1.166 - 129 - ISBN: 978-80-554-1124-8

became the central continue over time. Facilitated Internet connection also serves as a bridge between the individual community in which migrant belonged and therefore represents a source of capital.
The impact and influence of technology on migration is indisputable because it facilitates the flow of people across the planet and the development and maintenance of family ties with diaspora communities. Computer, phones and Internet access have become daily resources among migrants, with the aim to develop, maintain and recreate the network of formal and informal transnational in both the digital world and in the physical, as occurs strengthening and shaping sense of identity individual and collective.
The using of these technologies can facilitate adaptation to a new environment, can make the parting proccess easier but can also hinder the situation by installing strong emotions audio or video contact with family or country of origin.
V. CONCLUSIONS
The impact of communications technology is particularly visible in the context of transnational families. Transnational families are so defined because it’s members live sometimes or often separated from each other, but they are also together to create something that can be seen as a sense of collective welfare and unity, such as "welfare family" even beyond national borders' (Bryceson and Vuorela, 2002). The fact that their structural norm implies sustained geographical distance means that transnational families are denied the joy and intimacy of physical proximity (Parrenas, 2005). In this context, one of the most important tools that can maintain a sense of familiarity is through the use of communications technologies.
Although the extent and direction vary from individual to individual, the desire to communicate from a distance was still common to all the families in this study. In this sense, families in this research are "transnational families", using ICT to create, sustain and reproduce social fields across geographic boundaries, cultural and political. The introduction of ICT has created more opportunities to keep in touch with relatives, and to create a stronger sense of shared social field. It is undeniable that feeling of connection to the everyday lives of those left behind, has been improved.
This paper tries to outline how the emotions and feelings have been discussed in the context of research on transnational
families existing and presents strategies for care in the context of transnational families and illustrates some of the tensions of globalization, the discourse of democratic equality and opportunity through the production of ICT.
ACKNOLDEGEMENT
This paper is a result of a research made possible by the financial support of the Sectoral Operational Programme for Human Resources Development 2007-2013, co-financed by the European Social Fund, under the project POSDRU/159/1.5/S/132400 - “Young successful researchers – professional development in an international and interdisciplinary environment”.
REFERENCES
[1] Ronaldo Munck, Globalisation, Governance and Migration: an introduction, Third World Quarterly, Vol. 29, No. 7, p. 1227-1246, 2008.
[2] Ronaldo Munck, Globalization, Migration and Work: Issues and Perspectives, LABOUR. Capital and Society, p. 777, 2010.
[3] Nicola Piper, Gendering the Politics of Migration, International Migration Review, Vol. 40, No. 1, Gender and Migration Revisited, p. 133-164, 2006.
[4] William I. Robinson, Saskia Sassen and the Sociology of Globalization: A Critical Appraisal, vol.3, No1, 2009.
[5] Erica Richard, The family as a nation-state project in a global context: Implications for >>citizenship<< and social welfare, The future of the welfare state: paths of social policy innovation between constraints and opportunities, 2009.
[6] Deborah Bryceson, Ulla Vuorela, The transnational family, new European frontiers and global network, - Oxford- New York- ed. Berg, 2012.
[7] Susana Trovao, Comparing Transnational and Local Influences on Immigrant Transnational Families of African and Asian Origin in Portugal, Journal of Family Issues, 2014.
[8] Valentine Mazzucato, Djamila Schans, Transnational Families, Children and the Migration- Development Nexus, Social Scince Reserch Council, 2008.
[9] Majella Kilkey, Laura Merla, Transnational Families Care-giving Arrangements: towards a situated transnationalism, 2011.
[10] Tingyu Kang, Gendered media, changing intimacy: internet-mediated transnational communication in the family sphere, Media, Culture & Society, Sage, p. 147, 2012.
[11] Parreñas, R. , (2005), Long distance intimacy: class, gender and Intergenerational relations between mothers and children in Filipino transnaţional Families, Global Networks
The 3rd Human and Social Sciences at the Common ConferenceOctober, 5. - 9. 2015, www.hassacc.com
Social Science eISSN: 2453-6075, cdISSN: 1339-522X10.18638/hassacc.2015.3.1.166 - 130 - ISBN: 978-80-554-1124-8

MEDIATION FOR WHAT? REFLECTIONS ON EDUCATIONAL FIELD
Helena Neves Almeida, Phd.
Professor
Faculty of Psychology and Education Sciences
University of Coimbra (Portugal)
Abstract – This article aims to highlight some central ideas in the
design conceptions of mediation nowadays, underlying the
necessary reflection on the specificity of School Mediation.
Keywords: mediation; conflict/dispute resolution; social
regulation; school mediation
I. INTRODUCTION
In a first approach, mediation seems to be a paradox in today's society: the scientific and technological findings provide solutions to most problems, the multiplication of laws in all areas seems to address all disputes, without forgetting the communication networks which promote connections and diverse solutions. While the modern world was being built, establishing contacts and connections of all kinds, federations, monetary unions, conventions, there was also the emergence of catalysts. As Paule Paillet mentions [1] “when the citizen protection entities, when the regulation of their relations with the law with the norm and the institution are disturbed or perverted, it is necessary to find a way of connection. Political, associative, union, legal or social, it will always aim to establish the necessary connections. Therefore, mediation represents finding an imperfection in our world and an opening to hope”.
II. MEDIATION TO REGULATE OR TRANSFORME
CONFLICTS. A CONCEPTUAL APPROACH
The deepening of the democratic system, the economic globalization and the development of information and communication technologies have provided a new impulse to the social and economic relations, highlighting the increase in the relations between citizens and between them and the services and companies. But, although it is true that the democratization of access to credit and other services, whose consumption is anticipated to payment, the diversification of the rights associated to a better knowledge and greater will and ability to exercise them by its owners, have provided the increased demand for a justice that should be fast and efficient, also in the social field mediation has been claiming to be an alternative way of solving conflicts. The growing institutionalization of social relations, whose visibility relies on the increasing access to public and private services particularly in the areas of education, social work and health, which are associated with a change in the family structure and function and a decrease in the influence of church and community, as instances for the regulation of conflicts, contribute to the fact that family, school, social and community mediation constitute
a reference paradigm of the professional practices that occur in these areas.
The practice of mediation has expanded by several fields of intervention and takes different roles in everyday life. Nowadays, we witness the proliferation of the diversity of mediators and mediation practices, as a creative response to conflicts that result from inter-personal relationships or from social change. The mediation process is advocated when the conflict takes a leading role in the relationships between people, between them and the organizations and between the organizations in a given territory, and every time that the search for alternatives requires the intervention of a third party that values the communication between the parties and the decision-making ability of the litigants, in order to establish a mutual agreement, without the intervention of the judge or a negotiator. The conflict, the balance and the change are referential poles/centers of the expansion of the mediating practices; mediation is used in conflict situations, so as to control or prevent conflict, establish or re-establish social bonds, and thus to regulate social relations and, or to promote changes on a personal, inter-individual and social level.
The panorama of mediation practices in different socio-economic and political contexts, allows us to refer, in general, two conceptions of mediation: one connected to the American culture that sees it as an alternative means of conflict/dispute resolution, and another more universal, European, inheritor of the Declaration of Human and Citizen Rights of 1789. Bonafé-Schmitt [2] believes that “the forms and the development of mediation in the different countries are directly influenced by the social regulatory systems”. A comparative analysis developed by the author and his collaborators on the existing restorative mediation in France and in the United States, reveals different models of social integration underlying the mediation models: The American is a differential or a community model, and the French one is an universal and republican model. These model differences explain why in the United States there is a focus on “community mediation”, based on the cult of negotiation, and in France, on “the neighborhood mediation, social or intercultural” in which “the other” is a different being but equal, which is focused on the constant regulation of social relations. It creatively establishes new ties, renewing cut bonds by managing their break.
Pioneers in the field of alternative modes of dispute resolution (ADR), the US gave a recognized contribution to the expansion of mediation in European Union countries. However, the synthesis of the mediation contours in several
The 3rd Human and Social Sciences at the Common ConferenceOctober, 5. - 9. 2015, www.hassacc.com
Social Science eISSN: 2453-6075, cdISSN: 1339-522X10.18638/hassacc.2015.3.1.180 - 131 - ISBN: 978-80-554-1124-8
continents, conducted by Marta Carrasco [3], highlights the special features that the process has been taking, directly linked to the diversity of the contexts and its legal framework. In Europe, and as an example, in England there are two mediation types (the public sector and the voluntary sector), in Italy there is a particular emphasis on family school and criminal mediation, in France mediation is essentially developed in the family domain (criminal and civil), in the Scandinavian countries (Denmark, Finland, Sweden and Norway) the most referenced is the mediation of consumption. The study favors a targeted approach to conflict/dispute resolution, within an essentially healing perspective, neglecting its preventive and restorative dimension, also promotional of social ties, from a more sociological reading.
The main purpose of mediation lies in the establishment or restoration of the communication between the parties, helping the dialogue between them. Even when the agreement is not possible, and each party takes a radical position, the failure of mediation is relative, as it has been established or initiated a partial communication process that introduces changes. As mentioned by François Six “there is no perfect mediation; all mediation is a moment of catalysis [...]; the most successful mediation, is the one that produces a true communication between the parties, a communication that will really achieve results in the lives of each of the two people or each of the two groups” [4]. Mediation should produce, not a communication simulation, but a real exchange; even when it is not achieved, it should result in each party the awareness that his/her truth is not the only one, and that the other also has a part of it.
In fact, one of the benefits of mediation is to communicate [5] to each party that the isolation/exclusion is harmful to the construction of a solution/way out and the opening towards the other, only values his position. In mediation, the production of communication comprises three stages: listening, time and conclusion. Listening allows to understand the situation, the arguments, and the meanings assigned by each party to the matter in hand; Time allows to manage the disputes and favors taking a stand in freedom, without rushes and consciously by the parties involved; the conclusion is the product of the work done so far, in an effort of respect for the identity of the agents involved. “All mediation is different and requires a specific time, different from mediation to mediation, with its own pace. It is up to the mediator to make the mediation to be successful over time; the extension or reduction of the breaks between mediation meetings results from a continuous adaptation; all this to conduct the mediation to an end” [5] Mediation allows changing the arguments of each litigant, making it more rational and far from the personal experience. And this distancing involves a new way of looking at reality, of overcoming constraints and finding alternative ways regarding the conflict.
But this is not it. Mediation enhances the construction of social bonds, and is even a new approach in the process of supporting social inclusion, when operationalized in the social and cultural fields. For example, professionals working with groups of Gypsies, Luso-African and African immigrants in Portugal, are faced with people marked by multiple cultural differences towards the host society, such as differences in ethnic identity, culture, patterns of behavior and social
organization. As mentioned by Santos Silva [6][7] “Given the unequal structure of the distribution of resources, opportunities and powers, these differences tend to be reconfigured as inequalities, tend to induce or to justify, asymmetries, deprivation and marginalization that the members of these groups are subject to. What hinders or even prevents the achievement of their personal rights, the development of feelings of self-esteem and respect, their social, family, labor, professional and civic integration and their relationship with the institutions, the norms and routines of the comprehensive/global society”. Mediation and the culture associated with it, characterized by the respect towards the other, focusing on dialogue, the enhancement of citizenship, the importance given to the individuals and to the development of their skills in the process of change, the hope for a solution that exceeds the binomial “win-lose”, and which is transversal to the whole relational process, constitute an added value in the “re-sewing” process of social ties under rupture. The mediator as a catalyst is devoid of coercive, decision-making and legislative power. He does not take the place of the protagonists, does not take participate in their disputes, does not promote their merger through the action. Instead, the mediator gathers the conflicting parties, asks them to engage in the course of their lives, their projects, and that they undertake a new path by adopting a new dynamic between them.
III. SCHOOL MEDIATION: FIELD AND ONGOING
PROCESS FOR THE SOCIAL SCIENCES AND
HUMANITIES
As emphasized by Bonafé-Schmitt [8], “Mediation is not just a conflict management technique, it is also a learning process of new forms of sociability”. It is learning in the relationship and through the relationship, both of understanding proximity and analytical distance between litigants with different powers (peer relationships, relationships between individuals and organizations, relationships between organizations, and with the community). This sociability learning is reflected in the context of the individual and the society. Thus, Briant and Palaut [9] mention that mediation does society. The school is not just a place to acquire knowledge, it is also a place for socialization, a place for learning ways of sociability.
In the educational context, the interveners in the learning process (teachers, students, support staff, and other experts) are diverse from the perspective of education and socio-cultural characteristics. The social, institutional and community surrounding contexts are also different (schools and services in more urban or more rural areas, periphery, coast and interior areas, social housing). Within the same territory, geographical and institutional, unequal resources can be articulated and enhanced, establishing and mobilizing partnerships, networking, whose efficiency and effectiveness is expectedly high. However, the facts do not always happen according to the expected. Mediation, as a process, is achieved in a complex way in everyday life, and is maximized as the actors create bonds and overcome the obstacles arising from such complexity. The objectives aimed, obtain its specificity when they are contextualized. The social and pedagogical dimension of mediation emerges as central, in its training and creation of personal and socio-institutional commitments, anchored in the
The 3rd Human and Social Sciences at the Common ConferenceOctober, 5. - 9. 2015, www.hassacc.com
Social Science eISSN: 2453-6075, cdISSN: 1339-522X10.18638/hassacc.2015.3.1.180 - 132 - ISBN: 978-80-554-1124-8
monitoring of projects with preventive objectives and appropriate to the population involved; but the school mediation also focuses on solving problems or disputes in a more inter-individual, healing and restorative perspective.
Mediation deals with theoretical and practical knowledge, but also with representations. The diversity of the interveners threats the assumption of a team work within a voluntary process by the same in the context of action (for example, teachers, support staff, administrative staff, parents), of the mediators and the litigants (actual or potential). A teamwork that goes beyond the frontiers of the scientific or operational specificity and is materialized in a transdisciplinary knowledge for the benefit of common objectives, within and outside the institutional walls. Each actor, and every action is part of a puzzle of strategic knowledge with various guises, whose unity and meaning is discovered after their connection. It is not enough to identify the actors and the nature of the actual or potential conflict, which leads to the mediation, or to only master their methodological procedures. It is necessary to learn and understand the socio-cultural characteristics of the region in which the intervention occurs, to understand the expression of the consequences of the situation in individual, collective and institutional terms, to identify the obstacles, and prepare a project in which mediation is just one of the approaches.
One of the first difficulties to face in the school context consists in the creation of a dynamic of mediation (ac)knowledge, its advantages and limitations. Therefore, it is necessary to invest in the construction of a common identity among the members of the educational community, which in addition to the possible difference in the social origins, basic training and age, might not have common working habits in the school. The sharing of uncertainties, fears, as well as of the positive experiences in regular meetings, since the beginning of the process, the identification and analysis of situations, the involvement in common tasks, the definition of functional rules, may constitute strategies appropriate to the process of definition of the identity of mediators and mediation. Mediation is not a patchwork of individual contributions. The meaning of mediation must be part of a wider educational project. Thus, it is also important the design of mediation projects, within a shared and responsible manner, which consider or might give visibility to the different logics of organizational functioning (economic, organizational, political, social, educational), without the appropriation of target audiences, within a spirit of interpersonal, inter-institutional and inter-professional cooperation, thus contributing to the improvement of the school environment.
Another obstacle to overcome is the management of the powers of the various actors of the educational community. To the mediator it is recognized moral authority, some proponent power, even if it is a micro and shared power [10], but when it wavers to the appeal of the decision-making exercise rather
than to the other, it ceases to be. In mediation what is truly important, is what those with whom the mediator interacts think and how they act, it is not their perception of the world, it is not their will. It is for the mediator to create opportunities for the discovery of the new, of alternatives that had not been considered, because they were invisible under the emotional and opaque arguments of the litigants. How to achieve this in contexts of tension, contradictions and conflicts, without the intervention of the personal equation of the mediator? It takes two requirements: training and practice.
Mediation is under construction. The path, though long, is already being traveled on the knowledge and action plan. We must invest in training, production of knowledge adequate to the realities and emergency settings of the new. It is mandatory to focus on new ways of dealing with the constraints, new ways of acting due to the difference, within a search for alternatives, which, as Urie Bronfenbrenner [11] mentions, correspond to the rejection of the “deficit” model, a fact also emphasized by Schnitman [12], in favor of a research policy and practice committed to transforming experiences that encourage human development and promote citizenship. In this context, mediation becomes a new way of looking at the world and intervene in it.
REFERENCES
[1] Paillet, P. (1982). “Des médiations par milliers” in Informations Sociales, 4, p.9.
[2] Bonafé-Schmitt, J.P. & al. (1999). Les médiations, la médiation, collection Trajets, Toulouse : Éditions Érès, p.18
[3] Carrasco, M. ( 2005). Mediación y Consumidores. Madrid : Instituto Nacional del Consumo.
[4] Six, J.F (1991). Le temps des médiateurs, Paris : Éditions du Seuil, p.185.
[5] Six, J.F. (1995). Dynamique de la médiation, Paris : Desclée de Brower, p.144.
[6] Santos Silva, Augusto (1998). A Formação e a acção de mediadores sociais, Síntese de mesa redonda, organizada pelo Ministério da Educação em 27 de Março de 1998, p.4.
[7] Oliveira, A. e Galego, C. (2005). A mediação sócio-cultural: um puzzle em construção. Observatório da Emigração. Lisboa: ACIME, p. 33
[8] Bonafé-Schmitt, J.P. & al. (2000). La médiation scolaire par les élèves. Paris : ESF Éditeur, p. 194
[9] Briant, V. & Palau, Y. (1999). La médiation. Définition, pratiques et perspectives, collection Sciences Sociales, 128, Paris : Éditions Nathan/HER
[10] Almeida, H. (2001). Conceptions et pratiques de la médiation sociale. Les modéles de médiation dans le quotidien professionnel des assistants sociaux, Coimbra : Fundação Bissaya-Barreto, Instituto Superior Bissaya-Barreto.
[11] Bronfenbrenner, U. (1996). A ecologia do desenvolvimento humano: experimentos naturais e planejados, Porto Alegre: Artes Médicas.
[12] Schnitman, D.F. (1999). Novos Paradigmas na Resolução de Conflitos, in Schnitman, D. e Littlejohn, Stephen (org.). Novos Paradigmas em Mediação. S.Paulo: Editora Artes Médicas Sul. 17-27.
The 3rd Human and Social Sciences at the Common ConferenceOctober, 5. - 9. 2015, www.hassacc.com
Social Science eISSN: 2453-6075, cdISSN: 1339-522X10.18638/hassacc.2015.3.1.180 - 133 - ISBN: 978-80-554-1124-8

Variability of Suburban Preference in a Post-socialist
Belgrade
Jasna Petrić
Institute of Architecture and Urban & Spatial Planning of
Serbia, IAUS
Belgrade, Serbia
Tanja Bajić
Institute of Architecture and Urban & Spatial Planning of
Serbia, IAUS
Belgrade, Serbia
Abstract—The debate over urban sprawl and its impacts is
overarching and closely linked to voluntary or induced
resettlement of population from the inner city or from other
urban or rural settlements to the urban periphery. Residential
preference drive of urban sprawl could diverse in post-socialist
countries from a typical suburbanization process in the West.
According to different age and income structure, people may look
for the same amenities in their preferred type of neighborhood,
yet the diversity of motives and the ability to fulfill the key
aspirations explain a drive towards inner or peripheral city
development. In this paper, a suburban case-study neighborhood
in Belgrade metropolitan area was analyzed in terms of
variability and continuity of residential preferences.
Questionnaire survey has been conducted for obtaining the
results on motives that drive people to settle in a suburban
neighborhood, their satisfaction with life in it, and variability of
suburban preference.
Keywords- neighborhood, suburban, residential preferences,
post-socialist city
I. INTRODUCTION
Urban sustainability, which presumes reurbanization and the pursuit of more compact settlement structures, may well be justified and supported by the current urban policy, yet if such policy is out of tune with public opinion, it will never be effective. Therefore, a much clearer understanding of factors which influence people‟s preferences to both urban and suburban areas is needed, so that we are better placed to use these factors to encourage suburban residents to consider urban living as well as to prevent further expansion of urban sprawl.
The setting for the research on residential preferences in this paper is placed in post-socialist Belgrade, i.e. Belgrade Metropolitan Area, with a focus on one of the largest illegally developed suburban settlements – Kaluđerica. The questionnaire survey was conducted in order to analyze underlying dimensions of residential preference in this suburban neighborhood and their variability.
II. RESIDENTIAL PREFERENCES DEVELOPMENT AND
FAMILY LIFE-CYCLE APPROACH TO IT
The general impression on residential areas and their overall spatial (physical) patterns are the outcomes of complex interaction between demographic changes, physical mobility, facility provision and people‟s preferences. Physical, mental and emotional health of individuals is directly influenced by the quality of living environment. Therefore, residential areas
can either be harsh and impersonal enhancing the feel of discomfort with their residents, or they can encourage people to feel at ease and foster a sense of community for its residents.
Theoretical notions on urban or suburban residents‟ preferences commence with the exploration of residential preferences components or dimensions of residential preference. When dissatisfaction with suburban living is in focus, the following dimensions of residential preferences are found to be significant: attachment, social and environmental context and physical planning [1]. In addition, when analyzing neighborhood of suburban type in terms of residential preference variability, i.e. person‟s willingness to remain in the present neighborhood or to leave it for another one of similar or different type, the residential mobility is analyzed as the fourth dimension of residential preference [2]. Through empirical research, attachment to the residential neighborhood reflects how emotion (community sentiment) and rational assessment of the relative advantages and disadvantages of living in a particular neighborhood (community evaluation) vary according to the socio-economic characteristics of residents as well as according to different types of living environments. Social and environmental context form the dimension of residential preferences which is observed through neighborhood contacts, feeling of safety, housing type, infrastructure and other facility provision, etc. Physical planning dimension involves issues of urban design, accessibility, the separation or integration of land uses, commuting distances, and public space. Residential mobility intentions serve as a factor of current residential preference variability, and they are analyzed in relation to the neighborhood type, residents‟ socio-economic characteristics, environmental characteristics, environmental context and neighborhood attachment.
In a variety of contexts, the research on residential preference development mainly focuses on interrelationship between residential areas and socio-psychological factors, stage in a family life-cycle, duration of living in the neighborhood, etc. On the other hand, variables, which influence the level of satisfaction with residential neighborhood, relate to qualitative characteristics, e.g. ambience (nature, mix, and intensity of land uses and the form of the physical environment, engagement (safety and security, neighborhood friendliness), and choicefulness (opportunities for residents to choose alternative locations, life-styles and living arrangements) [3].
The 3rd Human and Social Sciences at the Common ConferenceOctober, 5. - 9. 2015, www.hassacc.com
Social Science eISSN: 2453-6075, cdISSN: 1339-522X10.18638/hassacc.2015.3.1.165 - 134 - ISBN: 978-80-554-1124-8

Motives for population resettlement, especially between urban center and periphery, are closely linked to the attributes which residents ascribe to the “ideal” place of living and (in)ability to achieve such qualities in the present residential place. General background for these “small” migrations are economic situation and socio-political system, although the ultimate impulse to move houses happens often by chance [4]. Spatial mobility is also conditioned by resettlement habits of the residents. To illustrate this, average American moves houses almost 12 times in his lifetime whereas the average European makes only 2 – 4 such changes [5, 6].
People‟s propensity towards urban living (either as their wish to remain city residents or to reconsider moving back to it from suburbs) is often analyzed through the typical family life-cycle. Life-cycle stages presume change of people‟s affluence, job changes, moving from renting to owning a house or flat, and from being single to starting a family. However, changes in households are probably the most important reason why families move [7]. A starting point in making hypothesis about changes of residential preferences throughout a family life-cycle is with couples who decide to live together. They often become tenants in a multi-family building. For many of these couples, a critical moment arrives when their first child is born. Urban environment, which till that moment seemed attractive and vibrant, may then become potentially confining (lack of housing space) or not safe enough for a child upbringing. On the other hand, a provision of quality education and health facilities within the place of residence plays an important role in residential choice of couples with children, and that favors residential preferences toward urban environments. Next stage in a family life-cycle is represented by so-called “empty nesters”, i.e. couples whose children have grown up and left the parent‟s house. Accessibility to various services starts to play an important role in their residential preferences structure and it may appear that in this stage “empty nesters” would want to move to a smaller place of residence. This hypothetical trajectory of behavior does not have to be universally supported hence it is not always the case that couples whose children have grown up prefer urban to suburban or even rural living. Smaller household may require less in terms of housing space, but this again does not have to be a universal rule. Similarly to single young households, senior people‟s households may be again attracted to urban living, mainly because of better accessibility to a variety of services adapted to this group‟s needs. Therefore, the hypothesized changes of residential preferences throughout family life-cycle require testing in various contexts because certain dimensions of residential preferences are with changeable primacy for various population groups as well as preferences depend on differences in cultural and sociopolitical heritage [8].
TABLE I. RESIDENTIAL PREFERENCE MOTIVES AND ATTRIBUTES
Motive Attributes
1. Housing
Size and Quality of the House or Flat
Property Values/ Re-sale Values and Maintenance Costs
Property in Ownership
2. Environment/
Neighborhood
Environmental Quality
Safety/Security
Social Milieu
Social and Technical Infrastructure
3. Accessibility
Public Transport Organization
Proximity to the Place of Work
Proximity to Education, Health, Culture and Social
Services
Proximity to Shops
Green/ Open Spaces
Intensified Contacts with Family and Friends
4. Life-Cycle
Stage
Household Size and Age of Household Members
Change in Marital Status
Newborn in the Family
Employment Change / Retirement
III. INFLUENCE OF (SUB)URBAN PREFERENCES ON URBAN
SPRAWL
The debate over urban sprawl and its impacts is a long standing one. In the early 1990s, qualitative definitions of sprawl were conceived, linking it to the following urban forms: 1) leapfrog or scattered development, 2) commercial strip development, 3) expanses of low-density development, and 4) expanses of single-use development [9].
Following the EU planning propositions for a sustainable urban development, urban form should aim at more compact and less land consumptive urban pattern that places greater emphasis on higher densities, mixed uses, quality shared space and facilities, and public transport. Some common denominators of urban sprawl are: lower residential densities in new (planned, discontinuous or dispersed) areas at the urban periphery; high automobile dependence; and the lack of public space and public services. Though urban living has been supported through policies and greatly promoted, in reality people often look for alternatives that offer them certain amenities and values they cannot find or cannot afford within compact cities. This paves the way to continuous process of urban sprawl being a global phenomenon.
Over the last half a century, there has been much more research of urban sprawl in the USA than in other parts of the world. However, North American, Australian or West European types of sprawl are not always correspondent to the experience of urban sprawl elsewhere. The western type of sprawl is characterized by zoned areas with a single dominant
The 3rd Human and Social Sciences at the Common ConferenceOctober, 5. - 9. 2015, www.hassacc.com
Social Science eISSN: 2453-6075, cdISSN: 1339-522X10.18638/hassacc.2015.3.1.165 - 135 - ISBN: 978-80-554-1124-8

use and low land-use intensity, relative uniformity of housing, weaker connections and lower accessibility (lacks in different types of transport), and reduced walkability.
Urban sprawl of European cities happen through physical expansion of urban areas into the surrounding rural or natural (forest) lands. In terms of spatial and temporal analysis of urban sprawl, there are certain differences between post-socialist and other countries of Europe [10]. In contrast to the Western countries, suburbanization in the post-socialist countries has been less pronounced as their cities managed to remain spatially quite compact and densely populated [11].
Under socialism, the main factors of urban sprawl were underurbanization and prioritized industry development that conditioned enhanced in-migration from rural areas and towns to bigger urban centres. Most researchers on the post-socialist era (after the 1990s) have argued that at the beginning of the transition period, the characteristics of suburbanization were also different than in Western countries. Socioeconomic status, or the lack of financial sources would drive people of post-socialist cities to find cheaper housing at the urban periphery. Also, some returned to the suburban homes due to unemployment issues in the city, since they lost job and life commodities in the inner city [12]. These factors are contrasted by the ones which drive suburbanization in Western countries - aspiration of the better-off population to attain “higher” quality of living and realization of dream about owning an individual house in suburbs.
Residential preferences play an important role in the process of urban sprawl. With that in view, their influence can be dual since they can either stimulate further suburbanization, when larger share of population wishes to settle in the urban periphery, or they can promote reurbanization, i.e. population flux towards inner parts of the city. This thesis is further elaborated on the example of the Serbian capital Belgrade and its suburban neighborhood.
A. Belgrade Metropolitan Area in Changes Prior to and
During a Post-Socialist Transition
Serbia as a part of former Yugoslavia is the example of post-socialist European country with a prolonged transition period. Within the Serbian urban system, Belgrade, i.e. Belgrade Metropolitan Area (BMA) has always had a special position. Presently, BMA encompasses 3226 km
2, or 3.6% of
the territory of the Republic of Serbia, which is inhabited by 1.6 million people (2011 Census), or 23% of the population of the Republic. BMA consists of 17 municipalities, out of which 10 are urban and 7 suburban.
The city growth and all changes in the spatial-functional structure of the urban area of Belgrade were rapidly induced after the Second World War due to emphasized industrialization. For then Yugoslav capital, this presumed the construction of a number of massive chemical, metallurgical, and machine-building factories. This was accompanied by an explosive population growth in Belgrade in the decades after the 1940s [13]. The state took the role of primary urban developer. This was possible because most urban land and large production means were put in public ownership. In
contrast, almost 90% of agricultural resources remained privately owned [13].
Certain issues were effectively addressed by the state in the first post-war planning period of Belgrade, i.e. within about a decade or so. Those issues were: rebuilding of the war-damaged urban fabric, restoration of the vital civil services, housing provision, economic growth, etc. Great population in-migration initiated urgent building of mass housing in Belgrade. Egalitarian ambitions of socialist society were expressed through “public ownership” of flats, which were developed by the state companies for their workers. Namely, public organizations and state organs were financing housing development for their employees, and the major intensity of construction of the so-called “state flats” on available urban land was achieved throughout 1960s and 1970s in order to accommodate waves of immigrating population (employees and their families). Even though this type of housing development was considerable, it wasn‟t able to fully cover the housing demand of all employees, not to mention immigrants who were yet looking for the employment in Belgrade. The housing demand was neither met in the terms of quantity of “state flats” nor in the terms of quality of their residential function, facility services, proximity to work, etc. Therefore, the way was opened to peri-urban concentration of people whose housing needs weren‟t provided by the mechanisms of the then prevailing system. Such situation nourished illegal construction in the urban outskirts (on agricultural land). Illegal construction in Belgrade urban periphery emerged as an issue in the 1970s, and it would continuously grow throughout the 1980s with a culmination peak in the 1990s.
At the beginning of the transition of former communist/socialist countries, Yugoslavia was in much better position than any other East European country because it was already much more open to changes and performed “experimentation with quasi capitalist reforms” [13]. However, 1990s brought totally opposite prospects for Belgrade as the capital city of the country because of the break of civil wars in former Yugoslavia. Urban sprawl by illegal construction grew immensely. On the one hand, a major factor to that was a radical shift to the market as a “self-regulating” mechanism which should solve housing issues. Therefore, public sector withdrew from housing production as well as from housing maintenance. The second important factor to aggravated problems in post-socialist Belgrade was the inflow of a great number of refugees and internally displaced people from former Yugoslav republics and Kosovo and Metohija throughout the 1990s. The estimated figure of refugees/internally displaced people who came in this way to Belgrade alone was around 100000 [13]. Consequently, unauthorized housing construction escalated in a form of relatively modest huts on the periphery of Belgrade, where it was more affordable for people to acquire land for building new home and where they already had some connections with relatives who previously came to the city. It is important to stress that in the same period of time Belgrade also lost some of its most perspective (young and educated) population due to brain-drain to foreign countries. This has caused deterioration of the natural population growth, hence BMA lost over 20000 people in the last intercensus period (2002 – 2011) because of
The 3rd Human and Social Sciences at the Common ConferenceOctober, 5. - 9. 2015, www.hassacc.com
Social Science eISSN: 2453-6075, cdISSN: 1339-522X10.18638/hassacc.2015.3.1.165 - 136 - ISBN: 978-80-554-1124-8

negative natural growth. On the other hand, in the same time it received over 38000 people on the account of in-migration [14]. This demonstrates its strong magnetisms and domination in the national urban system as a concentration hub for people, jobs and income (BMA share in the achieved GDP of Serbia was 40% in the year 2011) [15].
IV. QUESTIONNAIRE SURVEY ON RESIDENTIAL
PREFERENCES IN THE SUBURBAN NEIGHBORHOOD OF
BELGRADE
As representative of suburban neighborhood type, Kaluđerica was chosen to be the case-study for analyses of its residents preferences. Development of the infamous wild suburban neighborhood of Kaluđerica started back in 1967. The impetus for its growth was the lack of available flats in Belgrade. Namely, people coming from all over the country put a high demand over flats in the city. At the same time, development of “state flats“ wasn't able to meet this requirement within the urban boundaries of Belgrade. Therefore, rural settlement of Kaluđerica became attractive because of its proximity to Belgrade (10 km away from the city hub), favorable position - road connection, and most of all because the Master Plan of Belgrade that was endorsed in the early 1970s drew the line right in front of Kaluđerica allowing individual housing development there and not in the urban part of Belgrade [16, 17].
Within the literature sources, as well as in broader professional circles, Kaluđerica is often mentioned as the prime example of illegal housing development. It is reckoned to be the largest completely developed “wild settlement” in Serbia, and potentially largest of that kind in the Balkans and in Europe [16]. Presently, Kaluđerica has approximately 27000 residents who are registered by 2011 Census, and 8831 households.
In some previous research during the 1980s, the general causes of illegal construction of Kaluđerica were substantiated, as well as subjects of this construction and their motives. Almost 30 years after that study was made, new survey in Kaluđerica was conducted. This time, the focus was on the analysis of residential preference (placing the relative advantage to certain type of living) as a factor of choosing Kaluđerica for the place of residence, i.e. on the motives and aspiration of people to live in a suburb. Also, without arguing whether the development of Kaluđerica was a product of voluntary or “induced” residential choice, this neighborhood can serve as an important case-study for the analysis of suburban preference‟s variability.
Residential preference survey in Kaluđerica was anonimus and it was conducted in the period February – March 2014 on a sample of 1% of the total number of households (according to 2011 Census). Each participating household was represented by one respondent only who was expressing his/her personal perception on the attachment to Kaluđerica, social and environmental context, physical planning issues and residential mobility propensity.
A. General Profile of Respondents
From the total number of 90 respondents to the questionnaire more than half belong to the age group 20-39
years old (Fig.1) whereas the share of man and woman is almost equal. Majority of respondents are with high school as the highest level of achieved formal education, and they are predominantly working as full or part-time employees. The average household size of respondents (4 people/hhld.) is much above the Serbian average. It is not seldom that in Kaluđerica 2-3 generations live “under one roof” so their households number up to 9 members. In most households there is at least one person who is less than 19 years old. Kaluđerica is neighborhood with large share of people who live there for more than 20 years (Fig. 2). Their houses are mainly individual with 2-3 elevations.
Figure 1. Respondents age
Figure 2. Duration of living in Kaluđerica
B. Motives to Settle in Kaluđerica
According to the questionnaire survey, the main motive to settle in Kaluđerica was property in ownership. This is followed by size and quality of the house and property values/ re-sale values and affordable maintenance costs. Among other factors of choosing Kaluđerica for residential neighborhood, organized public transport system is also influential (Fig. 3).
C. Satisfaction With Life Commodities in Kaluđerica
This research substantiated that resident‟s attachment to Kaluđerica was divided. Most respondents said they were attached to this neighborhood at the time of this survey but they might move away in the future. However, almost 25% of respondents wanted to live in Kaluđerica only. Finally, the least share of respondents said they didn‟t feel at home in Kaluđerica (Fig. 4).
4
51
30
14
15-19 20-39 40-64 65 years+
%
59
26
8
6
1
Over 20 years
11-20 years
6-10 years
1-5 years
Less than 1 year
%
The 3rd Human and Social Sciences at the Common ConferenceOctober, 5. - 9. 2015, www.hassacc.com
Social Science eISSN: 2453-6075, cdISSN: 1339-522X10.18638/hassacc.2015.3.1.165 - 137 - ISBN: 978-80-554-1124-8

Figure 3. Motives to choose Kaluđerica for the place od residence
Figure 4. Attachment to Kaluđerica
When analyzing the overall satisfaction of people in Kaluđerica with its facilities and amenities, satisfaction with the public transport system organization is the most pronounced. Then, people are satisfied with good neighborhood, and the location of Kaluđerica. On the other hand, a negative stance (dissatisfaction) with environmental quality and the level of hygiene in Kaluđerica is overwhelming in the responses (Fig. 5).
Figure 5. Satisfaction with life commodities in Kaluđerica
D. Variability of Suburban Preference in Kaluđerica
If there is to be omitted 37% of respondents who didn‟t want to leave Kaluđerica at all, those that expressed variability of suburban preference showed willingness to exercise the residential choice in the following parts of Belgrade urban area (Fig. 6).
1) Municipality Zvezdara (Lion area) This area is attractive because respondents used to live
there in the past; it is close to the city center yet it doesn‟t have drawbacks of the city center; its advantage is proximity to schools, hospitals, green market and other retail services; and it is well connected in terms of transport facilities.
2) Stari grad (Dorćol) This area shows attractivness because its the hub of the old
town of Belgrade and it enjoys favorable location, presence of various services and facilities; people can go everywhere by foot instead of using a car or public transport system; etc.
3) Municipality Vračar Vračar is attractive because it offers greater choice in public
transport system; people are less car dependent and can rely on pedestrian choice; it is a place of cultural activities and is close to universities.
4) Municipality Voždovac (Banjica) This area is attractive for people of Kaluđerica because it
has a good quality of air; its public transport system is well organized; and because of emotional attachment of people who originated from this area.
5) Other destinations in the City of Belgrade Among other attractive destinations in Belgrade,
respondents opted for moving to: Zemun (because of family ties); Košutnjak (because of greenery); Mirijevo (because of its proximity to Kaluđerica and because of family ties); Dedinje (because it is affluent area of the city, and because of work location); Beli Potok (open/ green areas); and Konjarnik (because of its location in the city; greater choice of public transport; and retail facilities).
Figure 6. Alternative preference destinations in Belgrade
5
6
6
6
6
7
8
9
13
14
20
Proximity to education,…
Proximity to retail facilities
Intensified contacts with…
Change of marital status
Household size and the age of…
Reduced traffic and noise
Lower costs of living
Organized public transport…
Property values/ re-sale…
Size and quality of the house…
Property in ownership
%
23
24
29
18
6
I want to live in Kaluđerica only.
I plan to remain resident in Kaluđerica for a
number of years.
I feel like I‟m presently attached to
Kaluđerica but may move out in the future.
Given the opportunity, I would like to move
to another area.
I don‟t feel at home in Kaluđerica.
%
Environmental quality and the…
Feeling of friendliness
Various facilities and amenities…
Quietness and safety of living
Favorable location of Kaluđerica
Good neighborhood
Public transport system…
9%
39%
41%
43%
60%
68%
74%
76%
38%
37%
39%
22%
18%
16%
15%
23%
22%
18%
18%
14%
10%
Yes No Neutral
2
4
4
4
6
6
12
12
17
33
Konjarnik
Beli Potok
Dedinje
Košutnjak
Zemun
Mirijevo
Municipality Voždovac/Banjica
Municipality Vračar
Stari grad/ Dorćol
Municipality Zvezdara/ Lion
%
The 3rd Human and Social Sciences at the Common ConferenceOctober, 5. - 9. 2015, www.hassacc.com
Social Science eISSN: 2453-6075, cdISSN: 1339-522X10.18638/hassacc.2015.3.1.165 - 138 - ISBN: 978-80-554-1124-8

V. CONCLUSION
The residential preference study in a suburban neighbourhood of post-socialist Belgrade showed that the key aspirations to growth of urban periphery are driven by different motives to some other cities in the Western world.
The main difference is in the people‟s evaluation of the public transport system organization. It is sticking that even though Kaluđerica is suburban neighbourhood, people there do not dominantly rely on private car transportation. They place high importance on public transport organization with which they have been sattisfied to a high level.
Unlike Western countries‟ sprawl, where suburbanization is stimulated by the affluent population‟s wish to move out of the city, people of Belgrade suburban neighborhood Kaluđerica were primarily driven by the ability to afford house in private ownership in this area instead of somewhere else within or nearby the city.
Some residential preference dimensions or their attributes are shown to be equally important for people in Kaluđerica as for people in any urban or suburban neighborhood, e.g. emotional attachment (link with a place of origin); social and environmental context (infrastructure and other facilities provision); physical planning issues (accessibility on foot or by public transport system); and environmental quality.
Main dissatisfaction with suburban life in Kaluđerica is expressed towards lacks in the level of hygiene and environmental quality. Some parts of the inner urban area of Belgrade are perceived to be much cleaner and healthier for living by the residents of this particular neighborhood.
With all this in view, stances of people in Kaluđerica are not anti-urban. Given the opportunity, more than 60% of respondents would consider to move to the urban part of Belgrade. However, exercise of that choice relies on the economical circumstances, and while they are not significantly improved, residential mobility is not likely to happen.
ACKNOWLEDGMENT
This paper is result of the projects: “Transitioning Towards Urban Resilience and Sustainability (TURaS)”, Contract No. 282834, which is financed within FP7 of the EC on topic ENV.2011.2.1.5-1; “The Role and Implementation of the National Spatial Plan and Regional Development Documents in Renewal of Strategic Research, Thinking and Governance in Serbia”, No. III47014, and “Sustainable Spatial Development of Danube Region in Serbia”, No. TR 36036, latter two projects being financed by the Serbian Ministry of Education, Science and Technological Development.
REFERENCES
[1] E. Talen, “Traditional Urbanism Meets Residential Affluence. An Analysis of the Variability of Suburban Preference,” Journal of the American Planning Association, 67 (2), pp. 199–216, Spring 2001.
[2] J. Petric, Residential Preferences Meeting Sustainable Urban Goals. An Analysis of the Variability of Urban and Suburban Preferences. PhD Thesis, 2003, University of Strathclyde, Department of Architecture and Building Science, UK, unpublished.
[3] S. Brower, Good Neighbourhoods: A Study of In-Town & Suburban Residential Environments. Westport, Connecticut London, PRAEGER, 1996.
[4] J. Cvijić, Anthropogeographical and Ethnographic Annals/ Antropogeografski i etnografski spisi. 3rd edition, Belgrade: SANU, 2000.
[5] K.A. Hansen. (2013, 10,1). Geographical Mobility. Available at: https://cps.ipums.org/cps/resources/cpr/5_ps.pdf.
[6] H. Bonin, W. Eichhorst, C. Florman, M. Okkels Hansen, L. Skiöld, J. Stuhler, K. Tatsiramos, H. Thomasen, K.F. Zimmermann, “Geographic Mobility in the European Union: Optimising its Economic and Social Benefits,” IZA Research Report No. 19, Swedish National Labour Market Board (AMS), NIRAS Consultants, 2008.
[7] A.J. van der Vlist, C. Gorter, P. Nijkamp, P. Rietveld, “Residential mobility and local housing-market differences,” Environment and Planning A, 22, pp.1147–1164, 2002.
[8] J. Petrić, “Residential Preferences Towards Urban and Suburban Areas and their Relationship with Demographic Characteristics/ Rezidencijalne preferencije ka gradskim i prigradskim područjima i povezanost sa njihovim demografskim karakteristikama,” Arhitektura i urbanizam, 38, pp.3–8, 2013.
[9] S. Hamidi, R. Ewing, I. Preuss, A. Dodds, “Measuring Sprawl and Its Impacts: An Update,” Journal of Planning Education and Research, Vol. 35(1), pp. 35–50, 2015.
[10] A. D. Slaev, I. Nikiforov, “Factors of Urban Sprawl in Bulgaria,” SPATIUM, 29, pp. 22–29, 2013.
[11] A. Bertaud, “The spatial structures of central and eastern European cities,” in The Urban Mosaic of Post-socialist Europe: Space, Institutions and Policy, S. Tsenkova and Z, Nedović-Budić, Eds. Heidelberg: Springer, 2006, pp. 91–110.
[12] Z. Krisjane, M. Berzins, “Post-socialist Urban Trends: New Patterns and Motivations for Migration in the Suburban Areas od Rīga, Latvia,” Urban Studies, 49(2), pp. 289–306, 2012.
[13] S. Hirt, “City profile Belgrade, Serbia,” Cities, 26, pp. 293–303, 2009.
[14] J. Petrić, T. Nikolić, “Development of Belgrade‟s Urban Form: Compactness, Urban Sprawl and „Resilience‟/ Razvoj urban matrice Beograda: kompaktnost, nekontrolisano širenje i „fleksibilnost“,“ in Renewal of the Strategic Spatial Thinking, Research and Governance in Serbia – Book 2/Obnova strateškog prostornog mišljenja, istraživanja i upravljanja u Srbiji – knjiga 2, J. Petrić, M. Vujošević, M. Hadžić, B. Bajat, Eds. Belgrade: Institute of Architecture and Urban & Spatial Planning of Serbia, 2014, pp.171–194.
[15] J. Todorić, Residential Preferences Analysis in the Context of Reurbanisation in Belgrade/ Analiza stambenih preferencija u kontekstu reurbanizacije Beograda, Special Issues № 86, Belgrade: Geographic institute “Jovan Cvijić“, Serbian Academy of Science and Arts, 2013.
[16] B. Saveljić, Belgrade‟s Favela/ Beogradska favela, Beograd: Istraživačko-izdavački centar SSO Srbije, 1989.
[17] B. Žerjav. (2014, 2 28). Incorporating Informal Construction: Urban Planning in Belgrade and Proposals for Changes. Master Thesis. Available at: thesis.eur.nl/pub/12211/(1)33609.pdf.
The 3rd Human and Social Sciences at the Common ConferenceOctober, 5. - 9. 2015, www.hassacc.com
Social Science eISSN: 2453-6075, cdISSN: 1339-522X10.18638/hassacc.2015.3.1.165 - 139 - ISBN: 978-80-554-1124-8

Analyses of Labor Market Development in Bulgaria Role of active policies for social and economic development
Venelin Terziev
Vasil Levski National Military University - Bulgaria
Veliko Tarnovo, Bulgaria
Ekaterina Arabska
Innovations and Sustainability Academy
Plovdiv, Bulgaria
Abstract— The transformations in the labor market, social
security, social assistance and human resources development as
well as the relations between different public systems are issues of
special consideration in recent years because of the dynamic
changes in economic and social environment in conditions of all-
embracing globalization processes influencing as never before
European countries and regions. The characteristics of labor
market development in different countries provide valuable
implications about future development and policy building.
Through the peculiar example of the Republic of Bulgaria the
study presented in the paper outlines the importance of the active
policies for building a functioning labor market. The factors of
unemployment and economic growth in the country are further
examined leading to conclusions about the need of flexibility and
adequate and timely policies of labor market and economic
development.
Keywords- unemployment, social policy, labor market
I. INTRODUCTION
The problems of the modern labor market are subject to increasing interest in the field of research, policy discussions and management practice. The topical interest of the studied subject for the impact of various policies, programs and measures on the national labor market is conditioned by the fact that in recent years the implementation of specific programs and measures plays an increasing role in Bulgaria and is used as a main tool for the impact the labor market, both at regional and national level. The economic activity, the employment of the population with productive labor, is the most important factor for economic growth. As a factor for economic growth at this stage, employment is important for Bulgaria in terms of its quality structures, sectoral and branch redistribution, mobility and price. Regarding its rate and structure, the employment is a result of the economic development and the radical changes occurred in the structure of ownership and production. In large part, however, it is a result of the ongoing economic, social and political reforms [1].
The decline in the economic activity of the population and even more in the employment in the 90s of the XX century, the high rate of long-term unemployment and the mass poverty led to the contraction of the domestic market, reducing the chances for production development and increasing employment. All this reduced the social security (even if only in terms of insurance funds) and retarded the society development, making the transition to a market economy long and happening at high social and economic costs [2]. The restructuring of the
workforce and the changes in the employment of the population in Bulgaria are radical, large-scale and diverse.
The first group of changes in employment, creating a good basis and opportunities during the transition period in Bulgaria and after that in the years of the integration to the EU are [2]: (1) change in the model of employment - from administrative to market distribution of employees and their mobility; from full employment on social basis to unemployment and uncertainty in terms of paid work; from passive to active behavior and competition in the labor market; (2) elimination of administrative restrictions on the movement of the workforce inside and outside the country; creation of conditions, albeit still limited, for greater mobility of the workforce; (3) new and radical change in the existing national labor and social legislation in the context of the development of market economy and democratic processes and in accordance with international conventions, European directives, etc.; (4) creation and development of the labor market and its institutions and policies with the development of a network of employment services throughout the country, their equipment and the qualification of the persons employed in them; (5) creation and development of a policy for regulating the labor market, an active policy for stimulating unemployed to return to work and employers to hire certain groups of unemployed; (6) restructuring of branch and sectoral employment, rapid increase in the number of employees in services and reduction of those in industry; (7) increase in the employment in the private sector, in the number of entrepreneurs and self-employed. The second group of changes in employment are changes posing problems and barriers to the achievement of economic growth and social cohesion, such as: reduced participation of the population in paid work, employment and economic development; growing economic burden on workers (social contributions, taxes, restrictions on wage growth, etc.); the drastic decline in the employment of young people, ethnic groups, women, rural population stands out on the background of the general drop in employment. As a result, there is a rise in the number of poor and impoverished, excluded from the world of work. There is a high proportion of the employable population dependent on and in need of social assistance.
Despite the significant contraction in employment in the 90s of the XX century (about 40% compared with 1989), the hidden unemployment and the inefficient use of the employed remained high. Improving the efficiency, the competitiveness of the majority of the national production requires reducing the share of the costs of production, including labor costs. This
The 3rd Human and Social Sciences at the Common ConferenceOctober, 5. - 9. 2015, www.hassacc.com
Social Science eISSN: 2453-6075, cdISSN: 1339-522X10.18638/hassacc.2015.3.1.151 - 140 - ISBN: 978-80-554-1124-8

virtually requires dismissal of some employees [3]. The process of deindustrialization and economic restructuring naturally resulted in the sharp reduction of employment in industry. The decrease in production was more significant. The employment and the production were crushed in some sectors for which it is considered that the country has a good potential and traditions and in sectors in which a lot has been invested in recent decades. The first ones include light and food industries and the second ones - electronics, computing, electrical industry, instrumentation, specialized equipment, etc. In this way the national economy has not only lost foreign markets and opportunities for more accelerated growth and employment, including highly skilled labor, but also opportunities to change the technical and technological level of production in the near future, to keep in the country and to use professionally trained and qualified specialists in an effective way. In the public and especially in the private sector, there is a high share of employees, receiving wages around the minimum amount. Part of the private sector employees are still not insured for social risks. This leads to an increase in the number and the proportion of the so-called “working poor” and also increases insecurity and social differentiation. One part of these people choose official unemployment to employment (the social benefits are relatively high or sufficient in size so that they are preferred to the receipt of income from work) or continue their stay in unemployment as preferred to the alternative of low pay and insecurity.
In the 90s the unemployment was high, mass and long and lead to profound social and economic changes in society. Actually the labor supply was much greater because of the many graduates of educational establishments or early drop-outs, desperate and disillusioned unemployed who gave up their official registration, seeking employment pensioners and students and others. Thereto was also added the huge number of exempted from the army in connection with the ongoing reform in it. During this period the unemployment rate in many communities was over 30%, and in some - over 40% and even 50%. Most of the regions where these communities live are with mixed and Roma population. Only about 1/4 of the unemployed receive social benefits or the majority of the unemployed have no income. Relatively few of them can hope for social assistance or involvement in subsidized employment programs [2]. The majority of the unemployed have lower education without professional training and/or without work experience. The majority of them are Roma, young people and women. About 60% of the unemployed are with low education and without profession, which means that, in case of favorable economic growth, increase in the foreign investments, increased labor demand, it is very unlikely that they would find paid employment. And this is confirmed in practice as in the following the transition few years with a high growth, a high labor demand, even a shortage nationwide, have been registered in the country. The unemployment, although significantly decreased, remained relatively high, especially for the unemployed from the so called risky groups (long-term unemployed with low education, no profession, disabled, etc.). For many of them paid jobs remain inaccessible and entering into such an employment is accidental, non-continuous, uncertain. This in turn results in social insecurity and in the
"best" cases - employment in the informal economy, migration and others.
The employment policy has long been focused mainly on the unemployed, on financing the highly restricted activity of vocational guidance and training, promoting and encouraging unemployed to take up work and employers to hire certain groups of unemployed. Very little funds are still used for active policy, teaching, professional training and retraining of the unemployed, for job creation for long-term unemployed in the real economy, for increasing the mobility of the workforce and other activities that would actually reduce the unemployment and the occurred social tension. Employment and unemployment are closely related and dependent on the cycles and characteristics of the economic development and its management. On the other hand, as a product of the functioning of the labor market, they need to be considered in the context of the general economic theory of the market economy, by distinguishing the capabilities and the effectiveness of the public policy for intervention and regulation [4]. The strategic objective of the employment policy is to achieve full and productive employment of the people capable and willing to work. The targets and the specific tasks for the realization of this goal are related to the development of the economy and the population, the achievement of a perfect match between the demand and supply of labor, the creation of job opportunities for all willing to work and for enterprises - to increase their competitiveness and efficiency. The consideration of the features of the economic development and the possible impacts on the labor market gradually become an inseparable part of the process of policy making in the labor market. In the early periods of the development of the labor market, the policies regarding it are primarily aimed at tackling the effects of the economic reforms on employment, but now the policy of the labor market has a clearly active character and is aimed at influencing the processes or the behavior formation among the target groups according to planned purposes. The functioning labor market in a country is an adequate mechanism of the market environment and the pursued policy is increasingly based on the existing relations and interactions between the periods of development of the economy and the labor market [2, 4]. In the years of transition, within the development of the labor market, the policy has been focused on more active actions aiming at supporting the restructuring of the workforce and the increasing of its mobility. The predictability of the economic processes and of the effects on employment is not high and still remains within the short-term events and does not have a long-term character. The development of models to predict the needs of the workforce is imperative for the establishment of a closer link between the policy on the labor market and the periodicity in the dynamics of the economy [5].
In the period of the transition and up to now the policy on the labor market in Bulgaria has reflected the needs of the economy to varying degrees. In 1990-2000 this policy was built together with the development of the labor market and therefore its nature was primarily preventive. Since 2000 the policy on the labor market included more active programs and activities so that it could reflect more adequately the changes in the macroeconomic environment and the periods in the
The 3rd Human and Social Sciences at the Common ConferenceOctober, 5. - 9. 2015, www.hassacc.com
Social Science eISSN: 2453-6075, cdISSN: 1339-522X10.18638/hassacc.2015.3.1.151 - 141 - ISBN: 978-80-554-1124-8
economic development. As a whole, however, the active policy had a minor and temporary role in supporting employment and could not replace the investment activity for the creation of jobs. The economic development has been crucial for the demand and supply on the labor market and its balance in the different periods of the development. The anti-crisis policy in Bulgaria in the period from 2008 to now has mainly been focused on financial stability and consolidation and has severely limited the support for employment. A specific short-term policy was pursued for the protection of the labor market through programs for reduced working hours and for business support but this had a temporary effect and was not supported by other effective measures for employment creation and for sustainable turn in the unemployment growth. The most important feature of the period of the European integration is further development of labor market and establishment of the needed state and regional governmental structures and legislative base in accordance to the European policies and strategies. The development of the public employment services (National employment agency and particularly its directorates called labor offices) could be accepted as the main positive outcome of the ongoing transformations in that time because of the impact on labor market development and rates of employment and unemployment they had and the improvements in the conducted active social policies which are still strongly supported by the EU funding.
II. BUILDING A FUNCTIONING LABOR MARKET
The institutions and the legislation related to the labor market were created in Bulgaria at the beginning of the transition and this gave the opportunity to have them developed in accordance with the existing ones in the European Union countries. Essentially there are two contradictory trends in the developed and functioning state Employment Agency- decentralization of most of the functions and at the same time centralization, administration regarding the provision of resources for the various institutional levels on the labor market, development of strategies and measures of active employment policy and others. The role of the main mediator in the labor market is assigned to labor offices. Over the past years their functions have evolved, their priorities have enriched and changed. In the early years they mainly carried out functions of registration of unemployed, announcing vacancies to them and paying cash benefits and benefits to the unemployed. Until recently these activities of the so-called "passive policy" occupied over 90-95% of the work of labor offices. And still today, although much less, there are labor offices for which these functions are the main or sole ones. The unemployed got registered in labor offices mainly because of the opportunity to receive benefits or unemployment benefits. In support of this claim come the data for the relatively mass refusal of the unemployed to retain their monthly registration at labor offices after the expiry of the term for receipt of these cash payments. This means that the unemployed do not trust, do not expect that by using public employment services, they would return to work.
In the public employment services there has been a gradual development of the activities of the so-called "active" employment policy [2]: recruitment mediation, including information on vacancies and work conditions, vocational
guidance, motivation and professional qualification with the purpose of getting jobless people employed in the available jobs on the market; stimulation of self-employment, entrepreneurship of the unemployed; implementation of programs and other measures of the state policy for regulation of the labor market; performance of specialized control over the observance of laws and other normative documents in the field of unemployment insurance, payment of cash benefits and compensations, use of the provided incentives for hiring unemployed for the purpose intended, entrepreneurship and others.
During the first transitional period, passive policy measures prevailed ion the labor market. The share of the costs of this policy varied from 93.7% (1991) to 68% (1999) [6]. The majority of the measures were in the form of unemployment benefits paid only to the people dismissed. At first, their size was generously determined and depended on the remuneration received by then, and the period of receipt of the benefits was the same for all. Very soon another, more restrictive system was introduced. The policies got more oriented towards the labor supply and less towards the labor demand. Passive policy measures were dominating: payment of benefits and social benefits for certain groups of unemployed, encouraging early retirement and withdrawal from the labor market of part of the working age population. The number of the people who continued their education increased; there was also considerable external migration, which reduced the supply of labor. There was a lack of purposeful state policy for employment restructuring. Significant development was given to the social policy and the passive policy for the labor market, with adverse long-term consequences for the economic activity of certain groups of the population. The deindustrialization resulted in the implementation of employment programs with sectoral focus – for qualification and employment of the massively dismissed workers from the restructuring or the closure of inefficient industries (ore mining and coal mining, steel industry, etc.).
Since the late 90s, and especially since the beginning of the new millennium, there has been a change in the strategy on the labor supply - from passive to active measures; from social benefits to employment; from individual measures and programs to national action plans in favor of employment. The employment policy got included in the macroeconomic and regional policy. An understanding emerged that employment policy is rather an economic than a social problem and that the solution to the problems of high unemployment and poverty is in the economic and not in the social policy, social benefits and temporary subsidized employment. The employment policies started to become more regional. There appeared more programs that reflected the socioeconomic priorities of the regions.
The transformation of the Bulgarian economy into a market one revealed numerous peculiarities and paradoxes in the formation of the labor market, which are not usually characteristic of the countries with a traditional organization of the market economy [4, 7]. The absence of major economic growth in the first years of the reforms contributed to the establishment of a view of the uniqueness of the Bulgarian transition phase in the sense that the successfully selected
The 3rd Human and Social Sciences at the Common ConferenceOctober, 5. - 9. 2015, www.hassacc.com
Social Science eISSN: 2453-6075, cdISSN: 1339-522X10.18638/hassacc.2015.3.1.151 - 142 - ISBN: 978-80-554-1124-8

macroeconomic strategy resulted in the avoidance of serious problems in the labor market. This "success" however was accompanied by hypertrophic appearance of intermediate forms in the status of the employees who were not completely unemployed, but were also not working. "Unemployment in the workplace", including the one connected with the preservation of excessive, economically unjustified employment, paradoxically coupled with a shortage of staff. The actual unemployment resulting from a periodic change of jobs met the inflexible employment system, the weak points of the labor market, the insufficient understanding of the role of some market mechanisms such as the employment services (primarily with their functions in informing about available vacancies and workers seeking employment). Structural unemployment, usually determined by the recession in some industry branches and the growth (including the increase in the number of jobs) in new sectors is generally eliminated by systems for retraining of employees. But in the transition conditions in Bulgaria, the compensating creation of new jobs was clearly insufficient, and the new jobs often required no training but professional habits and skills of a lower level than the ones in the previous job. In response to cyclical unemployment (unemployment of insufficient demand) measures are often used for recovery of aggregate demand (or for retention of its decline), promotion of job creation (tax concessions, removing the obstacles to the creation of small businesses, provision of know-how, etc.), promotion of part-time employment. But in the Bulgarian transitional conditions, cyclical unemployment rather took the form of systematic unemployment as a result of the continuous and prolonged economic recession, sectoral imbalances and other causes that put into question the traditional means of counteracting to unemployment.
Similar paradoxes of the labor relations in an economy in transition often suggest that the measures of state influence on the labor market make no sense in such a situation. Therefore, their application should be postponed until the moment when the labor market and the economic system as a whole finally acquire classic market features. But the problem is that not only the listed, but also many other paradoxes of the transitional period entirely dictate the situation on the labor market. The increasing discrimination in hiring and dismissal, for example, can hardly be attributed to the regularities of the transition. Even the distortions related to the causes of unemployment cannot be used to deny the fact that each year tens of hundreds of people change their jobs remaining in a state of frictional unemployment for a certain period of time. Structural changes, although acquiring the form of almost universal but uneven decline, coexist with different points of growth both in new sectors (e.g. financial and commercial sector) and within the industries that are experiencing recession (some companies hire new workers and others dismiss workers). The weak points of the institutions on the labor market, regulating the wage dynamics (e.g. employment contracts and agreements) can not also be used as a starting point for conclusions about their temporary inappropriateness. The transformation of the labor relations from such that are typical of the planning economy to ones typical of the market economy were significantly delayed, compared with the advent of other attributes of the market (formation of different forms of ownership, financial and other
markets) [2]. A delay of this kind may become an essential factor leading to the delay in the completion of the transformation period. It could be stated that this period would not end if the labor relations, the creation of effective institutions in the labor market remained inadequate to the other economic transformations [4]. The processes of the integration to the European Union provided the needed insights and instruments for further elaboration and improvement of active policies on the labor market and employment. The experience collected throughout the years lead to a number of effective national programs and measures set out in the national employment law and supplemented by the EU funding programs. The consecutive policy during the last two decades of attempts of change in the country will certainly have “delayed impacts” in the future which could be observed even in the very recent years. Economic development in 2014 and the growth of the GDP, the highest in the last three years, led to the stabilization of the labor market and allowed to register positive dynamics in employment reaching a coefficient of unemployment of 11.2% in 2014 (for comparison for the EU-2008 it is 10.2%) although still great regional discrepancies in the country and the very distinct values for the different groups of the unemployed [2]. However, the problems are still prominent and alarming which imposes the need of the approaches and instruments in the conducted policies [5].
III. FACTORS OF UNEMPLOYMENT AND ECONOMIC GROWTH
IN BULGARIA
Considering the circumstances described in the previous sections, it could be stated that the increase in unemployment as a result of an accidental, single drop of the real GDP is due to the formation of cyclical unemployment, which was limited - about 1% [3, 8, 9]. The changes in the actual and the cyclical unemployment are closely related to the process of market transition and its recessive impulses, the experienced deep financial and economic crisis and the recently set under control variation in the growth rate. However, they run fairly smoothly and monotonically. The unemployment dynamics was characterized by an explosive, dramatic increase in the first two or three years of the period (for example, by 9.6% in 1991 and by 3.8% in 1999) and by a sharp drop by 3.6% in 1994. In the other years of the period there was a shift to more moderate changes [6]. So after 1993-1994 the unemployment rate fluctuated mainly in a more narrow range, changing by 1.1 to 1.9% per year, regardless of the declines, the moments of boom or sometimes the large variations in the growth rate. This was accompanied by a reverse dependence to the growth rate, which showed only occasional distortions.
Any recorded rate of actual unemployment includes a certain rate of natural unemployment. During the first years of the transition in Bulgaria, it increased, which further raised the actual unemployment rate and distorted the assessment of the cyclical unemployment rate. The natural unemployment growth is predetermined by cardinal economic changes, specific personal motives and objective conditions which determine a relative share of friction that is higher than the most prevalent (about 1%) and especially regarding the structural component [2]. The relative weight of the friction component increases due to the intense internal migration, the gradual expansion of the private sector share and the
The 3rd Human and Social Sciences at the Common ConferenceOctober, 5. - 9. 2015, www.hassacc.com
Social Science eISSN: 2453-6075, cdISSN: 1339-522X10.18638/hassacc.2015.3.1.151 - 143 - ISBN: 978-80-554-1124-8
differences in the amount of wages, the higher requirements to the professional skills of workers, the demand for workers with other specializations, the need for updating the vocational training or the retraining of specialists. There is a growth in the proportion of the structural unemployment, determined by the simultaneous introduction of radical branch, product and technological reform and restructuring of the Bulgarian production. The low unemployment benefits provided have a discouraging effect on employment. The composition of employees (classified according to different criteria) is gradually changing, with an increase in the participation of certain groups of employees, of whom are typical more frequent fluctuations, change in the workplace and hence a higher level of unemployment. Furthermore, at the outset of the transition a significant part of the previously employed (almost completely, but inefficiently used workforce) left the sphere of production and did not get back into it. In some cases these people got transferred to the group outside the active workforce, in others they made attempts to develop their own small business or remained long-term unemployed. Among the reasons for this movement were the difficulties encountered in finding other suitable employment, especially for people over a certain age limit, the emerged and partly preserved up to now mismatch between the demand and the supply of labor for some specialties and professions, the increasing share of the hidden economy and the employment in it, the reduction of real wages and the availability of savings from previous periods, etc. As a result, the number of the discharged exceeded the one of the registered unemployed.
In the calculation of the employment indicators one may not fully cover or may not clearly distinguish until recently growing number of partially, occasionally employed. Pressured by the lack or shortage of money, in spite of the uncertainty, many people accept proposals for a short-time job or mostly services for temporary or part-time activities, including irregular, campaigning commitment without contractual obligations. Even the reported (based on the so-called “civil contracts” concluded – not accepted as a part of official labor relations agreed on in “labor contracts”) parameters of temporary and part-time employment were still alarming. Thus, for 2004 and 2005 the full-time employed were around 91% of the total employees, as 85% were the employed under a permanent contract. On the other hand, as a component of unemployment it is reported that in 2005, for example, over one-sixth or almost 16% were the unemployed, who had lost their jobs due to the termination of temporary or seasonal employment [6]. Although in the recent years the labor legislation in the country has improved, the legal labor relations have been regulated and put under tighter control, the existing problems in this field and the number of the employed unregistered persons have been reduced, but this problem has not yet been completely overcome. Statistics show that over 85 thousand people (5.2% of the employees in the private sector and 0.4% of the employees in the public sector) are employed without a contract, but their actual range is probably higher [2, 4]. The market orientation induced processes leading to a profound disruption of the labor market. The decline in production in the mid-90s caused а reduction in the number of employees, as this trend also had technological prerequisites. It significantly affected the people with higher education. Thus,
while almost 39% of the total number of the registered unemployed in 2005, for example, were with no profession, with primary or lower education, about half of all unemployed had a specialty and almost 23% of them were university graduates and were long-term unemployed [6]. The dismissals of trained staff and the narrowed opportunities for developing the production areas so that they can fully absorb this labor potential increased the relative "price" of the growth, affecting its current and future rate. The backward inclusion of people with higher qualifications in labor activities was hampered by the irreversible changes in the company and sectoral structure of the GDP, by the advanced technical and technological characteristics of the production, by the new and higher requirements for professional knowledge and skills of the specialists which were set by companies.
In the structure of the Bulgarian economy in the studied periods and after that even till now, the services sector has crucial importance and share - its share in creating GDP amounted to more than 60% at the end of this period [2]. Its accelerated development can serve to explain the observed increase in the number of the persons employed in trade, catering and hospitality, construction, utilities and utilities services. These industries are prospering and labor-absorbing, but they provide opportunities for engagement mostly of people without special training, with lower qualifications, for a not too high remuneration or under not especially attractive work conditions. So this has retained the gap between the supply and the demand of labor, there were many vacancies (over 2400 in 2005). Only 15% of these vacancies, however, were suitable for university graduates. The violated conformity between the proposed jobs and the qualification level gave additional contribution to the extension of the duration of unemployment – around 60% of the unemployed in the country searched for work for a period exceeding one year [2]. Industry – the sector most affected by the process of privatization and reorganization of the corporate activity - was gradually overcoming its falling behind and predisposed to increased employment. There has been an increase in the number of the employed in the manufacture of food products, textiles and clothing, processed leather, wood and wood products and others. However, the proportion of the employment in the industries remains marginal, over 80% of the employees are concentrated in trade [6]. The trend towards fewer employed under a permanent employment contract is observed in the public sector, while in the private sector (which quickly responds to the reactivating domestic market) the number of the employees increased by 5% at the end of the period under investigation. Because of the predominant development of areas characterized by higher labor intensity, even the productivity growth of about 7-8% annually, reported in the last several years, is insufficient. This growth failed to induce a significant change and approximation in the ratio between the growth rate and the unemployment rate. The specific degree of correlation between the GDP dynamics and the unemployment (and the employment) is determined largely by the relevant corporate structure. The established in the country and already amounting to 79.4% share of the private sector in basic prices covers more than 99% of micro and small enterprises [6]. There was a dominance of companies with extremely tight capacity to generate employment and growth,
The 3rd Human and Social Sciences at the Common ConferenceOctober, 5. - 9. 2015, www.hassacc.com
Social Science eISSN: 2453-6075, cdISSN: 1339-522X10.18638/hassacc.2015.3.1.151 - 144 - ISBN: 978-80-554-1124-8

also for their own growth, characterized by a more frequent change of employees, reduction of their number or firmly established family commitment. While in both sectors (public and private) one could observe a tendency of increase in the number and the proportion of medium-sized and larger companies, they do not carry out reciprocal parity process of increasing employment. The opportunities for higher employment through own business and self-performed activities are not utilized, as the data show that only 3.8% of the employed in 2005 were employers and only 8.6% were self-employed [6].
The differences in the unemployment rates according to sex, age, education and professional background give reason to assume that for some groups of employees, the risk of becoming long-term unemployed is relatively higher. This risk is of a sustainable nature. The effects of the duration can also be fully attributed to such fragile components of unemployment. For example, young people without experience can be confronted with the effects of selection. Older workers and low-skilled women who are unemployed may become victims of circumstances, similar to the loss of qualification (supply effect) or may face discriminatory practices by employers (demand effect). On the Bulgarian labor market there could be considered as crucial not only the influence of the inflows in unemployment at the expense of macroeconomic and other external measures, but this influence which would reduce the average duration of unemployment. In order to achieve a reduction in the total number of unemployed, there is a need of long and uninterrupted period of growth in the number of jobs. The increase in the number of vacancies need not be necessarily accompanied by a decline in long-term unemployment (and, consequently, of total unemployment). Even in times of economic growth, the increase in the proportion of the long-term unemployed can be significant, but the ratio of the outflow of this group can be reduced. The reason lies in the fact that the economic growth can reduce short-term unemployment, but has little impact on long-term unemployment and on other "fragile" components of unemployment (unskilled workers, young people without work experience, etc.). One major reason is the presence of "effects of duration" [2], not directly related to the economic opportunities of employment.
The discussed circumstances once again confirm that the increase in the labor demand caused by the economic recovery will have a positive impact mainly on those who have been unemployed for a relatively short period of time. As a rule, this group of employees who have a high capacity for employment does not need intensive support from the state. The reliable and comprehensive information about the available vacancies in the economy is often sufficient to reduce the period of job search. But the long-term unemployed and those for whom the risk to fall into this group is high will hardly be able to “reap the fruits” of the economic growth and to find a new job on their own.
IV. CONCLUSION
The shortening of the period in which the effects of the modern crisis are transferred to the labor market, respectively
to the labor demand, reflects not only the degree of elasticity of the labor demand in relation to primary markets, but also the flexibility of the implemented policies. This fact brings in the focus of attention the flexibility of the labor markets and the opportunities (through its improvement) to enhance the mobility and the adaptability of the workforce to the rapidly changing labor demand. The adequacy and the timeliness of the pursued policy are crucial for the effective support of the changes in the parameters of the labor market and for the economic development. The tracking of the delay of the effects and the changes in its duration should not be overlooked so that preventive measures for a timely response can be developed. Regulatory regimes have a certain influence on the development of the basic parameters of the labor market, but in general their impact, and that of specific policies in the labor market for the activation of the labor resources, for providing employment and a better labor adaptation of the workforce have effects with limited opportunities regarding the balancing of the demand and supply of labor. Employment policy is included in the macroeconomic and regional policy, i.e. employment policy is more economic than a social problem and the solution to the problems of high unemployment and poverty is economic, not social policy, social benefits and temporary, subsidized employment. The management of the labor market is closely linked to macroeconomic management. The adequacy and timeliness of the policy are crucial for the effective support of the changes in the parameters of labor market and economic development. The reporting of the time delay effects and changes in its duration should not be ignored in order to develop preventive measures for timely response. The shortening of the period in which the effects of an ongoing crisis are transferred onto the labor market, respectively the labor demand, reflects not only the degree of elasticity of labor demand relative to the primary market, but the flexibility of the implemented policies. This has focused attention on the flexibility of labor markets and opportunities through policy on the labor market to enhance the mobility and adaptability of the workforce to rapidly changing environment.
REFERENCES
[1] K. Vladimirova, Labor, employment and unemployment. Sofia, 2000.
[2] V. Terziev, Impact of active social policies and programs in the period of active economic transformations in Bulgaria. “East West” Association for Advances Studies and Higher Education GmbH. 2015.
[3] D. Kanev, Labor economics, 1993.
[4] V. Terziev, Impact of labor market policies on employment provision. Dema Press, Ruse, 2013.
[5] V.Terziev, E. Arabska, Assessment of active social policies’ impacts on labor market in the Republic of Bulgaria. Social and economic and law basics of economics development. Collective monograph, Ufa Aeterna, 2014, pp.3-57.
[6] National Statistical Institute (NSI) web-site: http://www.nsi.bg/.
[7] D. Shopov, L. Dulevski, L. Stefanov, M. Paunov, H.nMaleshkov, Investigation on the labor market and the industrial relations in Bugaria after 1990. Sofia, University Publishing House “Economy”, 1996.
[8] L. Dulevski, Fundamentals of labor economics. Sofia, 1998.
[9] K. Vladimirova, Employment, unemployment and economic development. Sofia, 1992.
The 3rd Human and Social Sciences at the Common ConferenceOctober, 5. - 9. 2015, www.hassacc.com
Social Science eISSN: 2453-6075, cdISSN: 1339-522X10.18638/hassacc.2015.3.1.151 - 145 - ISBN: 978-80-554-1124-8

Opportunities of Quality and Efficiency Improvement
in Public Employment Services Application of a new process model in Bulgarian labour offices
Venelin Terziev
University of Rousse - Bulgaria
Rousse, Bulgaria
Ekaterina Arabska
Innovations and Sustainability Academy
Plovdiv, Bulgaria
Abstract- In recent decades in each EU member state there is an
increasingly strong view that public employment services should
play a more active role on labor markets. In response to
fundamental changes in economic and social sphere a new set of
functions is assumed tothem which impose the search and the
application of new approaches. Problems concerning
employment and unemployment should be considered as complex
and multilayered. The adequacy of responses by institutions on
the labor market is directly related to technologies used at work
and applied models to rationalize decision-making and to
improve the quality of services provided. A solution is the
application of a process model of work in the labor offices taking
into account the necessary resources (in terms of time required to
perform certain actions) and determining the required capacity.
The model presented in the paper is a flexible tool for better
management and efficient use of human resources.
Keywords- employment, labor market, process model
I. INTRODUCTION
The dynamic changes of the social environment that determine the changes in attitudes and actions on labor markets and public service providers, challenge the policy making in the field of employment. Particular importance is assigned to the ability of the public employment services for vigorous action aimed at ensuring the maximum impact of policy on the labor market. Public employment services (PES) are expected to handle both current and future challenges. Rapid response to changing conditions and the combination of short-term interventions with sustainable solutions require flexibility, organizational response capability and creativity. The evolution from bureaucratic oriented organizations to more flexible, open, market-oriented networks and structures requires intellectual and cultural change as the business model and management and individual ways of working [1].
In direct relation with the implementation of the Europe 2020 Strategy for smart, sustainable and inclusive growth is the introduction of a common strategy for public employment services in the EU aiming at sustainable results consistent with the challenges of social environment provoked by the labor markets [2]. This does not mean that the operational consequences for each of the public employment services will be the same. It should not be overlooked that in different countries there are specific conditions that influence those consequences. And to respond flexibly and precisely to the
numerous internal or external changes, public employment services are subject to conversion and renewal.
Improving processes and the quality of the administrative services in the Employment Agency of the Republic of Bulgaria is seen as a prerequisite for effective implementation of employment policies [3, 4]. The study presents opportunities for improving the quality of services offered and the capacity and efficiency of working the Directorates "Labour Office" (LOD) by introducing a process model.
II. MATERIAL AND METHODS
The objectives of this study are the following basic processes in the Bulgarian Employment Agency: Information and consultation; Registration; Placement; Training and qualification; Programs and employment measures.
Based on the described processes, the subject of our further research is carrying out a detailed metric measurement of activities in the Employment Agency with the objective of standardizing and defining the necessary resources for the efficient provision of services in the Employment Agency.
For purposes of the survey fieldwork are implemented in three directorates „Labour Office”: Rodopi, Kazanlak and Pirdop [3].
The study was conducted in the following three interrelated steps:
Stage One: metric measurement of existing activities and operations within the basic processes in the directorates „Labour offices”.The measurement is done by directly monitoring the implementation of the activities of the employees in the three LOD in their work with clients and counterparties of the labor office and in the performance of duties carried out without the involvement of external parties. In determining the current capacity “pictures” of the execution time activities is used. For activities for which there is no observed execution time expert assessment is used.
Stage Two: creation of a model for designing the capacity aiming at effective implementation of the new model of work by:standardization of the execution time of various actions of the new operating model; determining the frequency of implementation of the various activities for a set period of time for each of the three LOD.
The 3rd Human and Social Sciences at the Common ConferenceOctober, 5. - 9. 2015, www.hassacc.com
Social Science eISSN: 2453-6075, cdISSN: 1339-522X10.18638/hassacc.2015.3.1.152 - 146 - ISBN: 978-80-554-1124-8

Stage Three: design of an algorithm for defining and determining the cost for the basic activities to justify the necessary resources to achieve the objectives.
When performing work the following sources of information were used: existing internal documents such as standardized monthly, quarterly and annual reports, information about new registered unemployed, annual analyses of the placement activities of LOD, analyses of the activity of providing psychological services, employment report analyses, activity in vocational guidance information and consultation, analyses report for the organization of vocational training and motivation of unemployed and employees, management reports, newsletters, etc.; conducted structured interviews with officials of the LOD.
III. RESULTS
The research is conducted in accordance with pre-defined scope of work. At every stage of the implementation several key documents are developed that are presented and discussed with the leadership of the National Employment Agency.
As a result of the measurement of timing in the three pilot LOD a picture of the execution time of the operations is created. Time measurement is made on the basis of monitoring the implementation of all activities of the main processes (Table 1) in the LOD. Activities that are critical to the realization of the new model are monitored and measured several times to create a more accurate time value. The observed time for these activities is established on the basis of a weighted average of the observed time of all performed measurements.
TABLE I. MAIN PROCESSES IN LABOUR OFFICES
Process Goals
Information
and
consultation
Ensure equal access to information and services and provide different access channels.
Fast and quality customer service by providing a clear, easy to understand, complete and accurate information and explanations.
Uniform flow distribution of persons seeking for a job and directing them to obtain services to staff competence.
Fostering independent work habits and search of useful information through various information sources.
Directing the attention of customers to use alternative sources of information (web-site, e-mail, kiosks, town halls, libraries, etc.).
Registration
Registration of the individual for the subsequent use of services by LOD.
Fast and quality service by providing a clear, easily understood, complete and accurate information, explanations and forms necessary for the registration of persons.
Collecting complete and accurate information about the persons seeking for jobs and storage with a view on its repeated use and updating.
Faster inclusion of seeking jobs on the labor market, by offering suitable vacancies on the day of registration.
Reduce unevenness of the flow through even distribution of the various contingents for subsequent visits to labor brokers.
Placement –
working with
Provide information on available vacancies in order to quickly realize on the labor market.
Display the characteristics of the seeking jobs in
job seekers order to improve and facilitate the selection and recruitment vacancies.
Increase the number of hired throughout unemployed persons by encouraging them to participate actively in the labor market.
Supporting employment of the unemployed, by assessing the shortage of skills, counseling and referral to training for acquiring professional qualification, technical or social skills, and skills for independent job search.
Supporting young people under 29 years of age for employment and / or inclusion in the training.
Development of an individual plan for finding work for the unemployed in an optimally short term.
Placement -
working with
employers
Expanding the scope of employers using the services of directorates "Labour" by:
Implementation of active, personalized service to each employer and the grounds that providing employment for job seekers;
Preliminary analysis of business performance and segmentation, depending on their economic activity and capacity for announcement of vacancies in the LOD.
Increasing vacancies in order to more opportunities for job seekers through:
Active contacts with employers announcing vacancies;
Proactive contacts with employers and proposing appropriate profiles of job seekers, even without the vacant job.
Achieving full specification of vacancies for subsequent fast and qualitative selection and recruitment of job seekers.
Implementation
of programs /
projects for
employment
and training
Provide employment to unemployed persons in an disadvantaged position on the labor market.
Increasing the employability of unemployed people by involving them in programs for employment and training.
Increasing the number of the hired among unemployed persons through their inclusion in existing employment programs and training.
Helping the unemployed to start their own business.
Encouraging employers to participate in existing programs / projects for employment.
Acquisition of permanent work habits by job seekers, reducing their dependence on the social assistance system and their return to the labor market.
Implementation
of measures for
employment
and training
Methodological and technological unification of LOD’s activity related to the implementation of active employment measures:
Inclusion of employers in training measures and employment;
Increasing the employability of the unemployed through participation in active measures for training and employment;
Providing employment to unemployed persons disadvantaged on the labor market;
Encouraging entrepreneurship among the unemployed;
Promoting mobility of unemployed persons with a view to finding a job in another place.
Promoting unemployed, subject to monthly social assistance, who start work
Improving the organization of activities.
Improving the quality and efficiency of services for the unemployed and employers.
For the calculation of frequency of different activities two main sources were used - the monthly averages for each LOD from the previous year and expert assessments. One of the reasons for the presence of an expert evaluation is currently a
The 3rd Human and Social Sciences at the Common ConferenceOctober, 5. - 9. 2015, www.hassacc.com
Social Science eISSN: 2453-6075, cdISSN: 1339-522X10.18638/hassacc.2015.3.1.152 - 147 - ISBN: 978-80-554-1124-8

lack of such information in the system of the Employment Agency. Despite the differences in the pilot LOD, expert assessments are set equally to all three bureaus.
Expert evaluations are described for the processes examined as follows:
Information and consultation: registered persons will want information or advice on average once a month; 30% of people will need information; 70% of people will need specific advice; 10% of the contingent can seek for a job by their own.
Registration: the registrar have to wait an average of 3 min. 35 sec. for the persons to finish completing their registration documents; 50% of people will be interested in a particular vacancy offered by the registrar;
Placement - working with job seekers: 10% of registered will need training for independent job search; all first-time registered persons discuss training opportunities in LOD; 50% of people need some training.
Placement - selection and recruitment: for 1 free vacancy on the primary market an average of 5 job seekers are interviewed; 50% of people will need advice on the preparation of documents according to the requirements of employers; in average five interviews between employers and job seekers are held in LOD per month.
Placement - working with employers: 20 meetings with employers per month outside LOD.
Implementation of programs: 2 persons for a vacancy announced are interviewed on average; about 1.5 job seekers remain for inclusion in the program; programs have two different vacancies per employer on average.
Implementation of measures: meeting with employers are 50% more than the capacity.
The study embraces all the major activities of the process model in the Employment Agency to set a standardized execution time and frequency of occurrence for a certain period (one month). Standardized execution time is calculated as follows: for the activities that exist in the current operating model and are effectively implemented the standardized time is identical to the observed execution time of the operation; for the activities that exist in the current model of work, but are not effectively implemented the standardized time is determined on the basis of the expert assessments of the effective implementation of the actions; for the activities that are new to the Employment Agency, standardized time is determined on the basis of the expert assessments.
As a result of the investigation two main documents were developed: model to determine the current and future capacity; updated balance of time for each of the pilot LOD [3, p.152-159]. The model contains all the major activities of the current process model of LOD with specified observed execution time and frequency of occurrence for a certain period (one month).
The model provides a clear assessment of the capacity needed for the implementation of the activities in different processes. What share of current capacity is utilized in the implementation of each major process could be also estimated. It provides opportunity to determine in much detail within each major process what activities require the most manpower (in terms of time to do the corresponding activities and mandays) (Table 2).
TABLE II. ESTIMATED CAPACITIES
Process Capacity (mandays per month)
Current model Future model
Information and consultation
98:45:00 98:45:00
Registration 46:54:06 37:27:38
Placement – working with job seekers
23:04:30 35:41:23
Placement – selection and recruitment
167:56:30 200:19:52
Placement – working with employers
8:30:00 9:25:15
Planning and organization
53:18:26 42:19:15
Implementation of measures
18:08:38 19:18:38
The new process model of work requires the use of certain assumptions developed and confirmed by the expert evaluations. In order to achieve comparability between the current capacity of each LOD and the necessary capacity to implement the new model of work under equal conditions, assumptions made are set equally for all three pilot LOD.
Here are the main assumptions used in developing the model for the different processes:
Registration: new files are open only to persons registering for the first time in the LOD; only 40% of the persons register for the first time in the LOD; the practice of issuing an official document (for confirmation of status) continues.
Placement - working with job seekers: 50% of the persons who are offered vacancies from LOD will find at least one appropriate vacancy for them; the full cycle of recruitment is performed only for persons registering for the first time in the LOD; the contingent is divided into three equal parts – for primary market, measures and programs.
Placement - selection and recruitment: for each interviewed jobseekers a profile corresponding to the actual vacancies is created; monthly meetings to confirm the status are maintained.
Placement - working with employers: once a week information for new employers in the region is collected; 10 plans for key clients should be prepared and revised per month on average; once a week availability of vacancies from other sources is analyzed; monthly average of 10 "hot" candidates will be presented before 10 employers announced vacancies in sources other than the LOD.
The 3rd Human and Social Sciences at the Common ConferenceOctober, 5. - 9. 2015, www.hassacc.com
Social Science eISSN: 2453-6075, cdISSN: 1339-522X10.18638/hassacc.2015.3.1.152 - 148 - ISBN: 978-80-554-1124-8

Training and qualification: the shortage of skills and competences on the labor market for the next period is annually summarized and presented; once a year to prepare proposals for the development of necessary competences; once a month summarizing the identified training needs and prepare monthly training plan; once a month to plan and organize the delivery of training to the prepared monthly plan; part of the training is implemented by internal resources of the Employment Agency (e.g. motivational training);after the training plan of the person involved is completed, concrete commitments to implement are placed.
Implementation of programs: those who are invited for an interview for a vacancy in particular employment program have to sign to confirm the status before a labor mediator.
Implementation of measures: those who are invited for an interview for possible appointment by employment measures have to sign to confirm their status.
On the basis of the model an updated balance of time for each pilot LOD is created. The purpose of this document is to highlight the differences between the current and the new process model of work in terms of the required for the implementation work capacity. This helps to address very clearly capacity shortages in specific processes (activities) and to determine the possible reserves that can be used more efficiently.
As a result of the creation of the updated balance of time needed for the operations, the main conclusions that can be drawn are the following:
when using the new process model of work there are significant reserves and opportunities for capacity reduction in the process of registration. These reserves can be realized through reallocation of responsibilities and tasks in the LOD;
using the new process model of work processes that require the greatest degree of additional capacity are „Placement- selection and recruitment”, „Placement- working with jobseekers”, „Training and qualification”;
for the realization of future process model as a whole additional capacity is needed taking into account the underlined assumptions;
higher „capacities” requirements for the implementation of the new process model of work cannot be fully compensated by the identified capacities reserves;
different practices in the pilot LOD show differences in the use of current capacity. This means that re-location of capacity in three LOD by redistribution of responsibilities and tasks is different in different offices.
The above-described model to determine the current and future capacity is used to create an alternative scenario. It
includes the time proposed by the experts to perform the operations. As a result, the following two main documents are developed: determination of the current and future capacity of LOD Kazanlak and updated balance of time for LOD Kazanlak. As these two documents are created through the above model, all assumptions are valid here too. The only difference in the created alternative scenario is that it is based on expert assessments of the time needed to complete the activities. This allows to identify differences in the current and required capacity at LOD- Kazanlak arising from different set time. Differences can be observed both at the individual process and the level of individual activities in the process.
Based on the alternative scenarios for LOD- Kazanlak the following conclusions could be made:
the „expert” time to implement the activities is higher than that observed in metric measurements time. As a result, the calculations in the alternative scenarios show higher values for the current capacity and for the capacity needed in the future;
the main findings about the observed reserves under the process of registration and the processes that need additional capacity to implement the new model of work: „Placement- selection and recruitment”, „Placement- work with job seekers”, „Training and qualification” are the same;
despite the resulting higher values for current and future capacity in the alternative scenario, the difference between current and future capacity remains the same in both scenarios. This means that the future process model requires additional capacity in general, taking into account the underlying assumptions.
The main objective of the developed algorithm is to create a tool of allocating costs to the basic services of the agency. This makes it easy to justify the resources required at different starting points as available capacity, existing and expected period of service, available resources, and to determine the value of each service.
By created the algorithm the following processes could be defined and justified:
to justify the necessary human, material, financial and information resources to provide services and implement objectives of the Agency;
to identify factors for performance, economy and efficiency of activity of the Agency as clients served per time unit, cost per unit of service, number officers per 1000 registered unemployed persons, number of officers per 100 hired persons, etc., which to serve as a set of norms for the implementation of activities in the Agency;
to monitor and control costs per services rendered by the Agency and undertake adjustments in case of change in market balance between supply and demand of labor.
In creating the algorithm the following logical framework is used:
The 3rd Human and Social Sciences at the Common ConferenceOctober, 5. - 9. 2015, www.hassacc.com
Social Science eISSN: 2453-6075, cdISSN: 1339-522X10.18638/hassacc.2015.3.1.152 - 149 - ISBN: 978-80-554-1124-8

the initial starting point are the results that the Employment Agency must achieve within the strategic plan or a budget year (Action Plan on Employment). These results represent the concretization of the agency's mission and its objectives, which are generally formulated as: reducing unemployment and increasing employability of the workforce to the requirements of the labor market; achieving financial sustainability in the provision of services by ensuring sufficient resources and proper timing and distribution by regions; achieving a correct and proper balance between the benefits of services and their costs; customer satisfaction of services rendered;
the strategic objectives are defined with specific quantitative and qualitative indicators which must be guaranteed at the output of the system such as achieving a certain amount of services rendered, number of clients served, implementation of specific programs and measures for employment, etc.; achieving a certain amount of service through fixed amounts of expenditure in legislation and defined optimal costs in the Agency (incl. its territorial divisions);revenues from fee-paid services.
IV. DISCUSSION
The created model for determining the required capacity is a flexible tool for better management of activities in different LOD by providing the necessary human resources and their use in the most efficient manner. The model is created in electronic form (Excel-tables), which allows to develop various scenarios based on different starting conditions and assumptions in different LOD.
Initial conditions are bound to the policies and objectives of the Employment Agency. To allow the maximum fine use of the model, the input data should comply with the National Employment Plan for the respective year. As a result of implemented policies, priorities and inflated expectations (more funds acquired through programs, active work with employers, etc.) the frequency of occurrence of the various activities should be revised. This could lead to setting the greater frequency of occurrence of certain activities and hence - a requirements for larger capacities.
The assumptions are related to changes in the way of work in the LOD and the implementation of the new process model. Much of the planned implementation activities require additional time and effort. In order to achieve better performance of the LOD, the new process model should be provided with the necessary capacity.
The proposed algorithm to determine the necessary resources, their costs and their allocation to the relevant processes is in the widespread Excel format, making it easy to implement and simulate scenarios. This supports a reasonable budget preparation and flexible adaptation of resources to the LOD to the requirements of the labor market during the relevant budget year. The algorithm fully reflects the way the services are rendered in a LOD. As services are realized through workflows in the organization, the algorithm is based entirely on the described model for determining the current and
future capacity. Information on the detailed operation of the algorithm is available in each table. Each table in the algorithm is a separate element of the necessary resources, their costa and it includes all the necessary expenses for the operation of a LOD. The necessary resources for the activities of a LOD are based on the pre-set quantity and quality of services offered. In the algorithm there is a clear definition of the input data, as well as their source of information. The number of assumptions is used as in the model itself.
The key resources and costs necessary to implement the activities are divided into direct, related to the performance of services, and indirect- serving activities on providing services. The advantage of the developed algorithm, unlike the usual way to prepare a budget, is that these two types of costs can be monitored and managed separately. Thus alternative scenarios can be „simulated” based on different inputs in order to find the optimal solution.
At the highest level the created algorithm has the following main components (Table 3):
Human resources and costs- this includes direct expenditures of time and labor services-wage labor costs for administrative services and the cost of staff training;
Material resources and costs -this includes direct material costs for services and indirect material costs for services;
Capital expenditure;
Cost of financing programs, measures for employment, training and qualification of job seekers, projects and business benefits.
The structure of the created algorithm allows direct transfer of costs per indicators in the traditional format of the budget and each expense can be justified by type, size, at what point of time it is needed, and especially for the service which it refers to.
TABLE III. SCHEMATIC PRESENTATION OF THE MODEL
Input Process Output Result
Physical
resources Quantity
Quality
Time schedule Value
Financial
resources Quantity
Time schedule
Efficiency
Expenditires
per unit of
service Coefficients
Quantity
Quality
of service
of the way it is
rendered Cost
Clients satisfaction
Mission implementation
Financial
sustainability Expenditures /
Benefits
Clients satisfaction
The advantages of the new process model are presented on Table 4.
TABLE IV. ADVANTAGES OF THE NEW PROCESS MODEL
General
processes Advantages
Registration Primary segmentation / prioritization of the contingent - integration with the process
The 3rd Human and Social Sciences at the Common ConferenceOctober, 5. - 9. 2015, www.hassacc.com
Social Science eISSN: 2453-6075, cdISSN: 1339-522X10.18638/hassacc.2015.3.1.152 - 150 - ISBN: 978-80-554-1124-8

„Placement”;
Immediately supply of available vacancies at registration and each subsequent visit;
Optimizing introduced-net information by reducing the number of data sets and repetitive details.
Training and
qualification Focus on shortage of skills in the labor market;
Dynamic planning and organizing the trainings;
Diversification of forms and training opportunities;
Greater freedom and regional diversity of the training;
Monitoring the implementation of the commitments of the person in connection with newly acquired skills and qualifications.
Programs and
measures Participation of experts from labor offices in the
development of new programs;
Preliminary testing programs;
Timely financial, informational and methodological provision of programs;
Optimizing existing portfolio of measures and programs to focus on those with the greatest social impact;
Dynamic management and change of the existing portfolio of measures and programs to reflect changes in the contingent.
Placement Better knowledge and specifying the needs and requirements of employers;
Offered vacancies available whenever a visit of a job seekers;
Secondary segmentation of the contingent;
Better knowledge and specification of owned and missing qualities of each job seeker;
Segmentation and active work with employers;
Actively seeking alternative sources of job vacancies;
More efficient selection of job seekers respecting not only formal, but also the specific requirements of employers.
Administrative
processes Reduce the document turnover in the system;
Establish a culture of responsibility and decision-making;
Clearly specified the powers of the directors of the LOD;
Stimulating a certain discretion;
Creating optimal management processes to improve decision making.
There are a number of risks that may impede the proper definition of the capacity and the use of the created model in the Employment Agency. Among them the attention deserve the following:
inefficient utilization of the model due to misunderstanding of its basic parameters;
estimated capacity concerns only activities engaged in the main processes of LOD. Some of them, however - participation in the development of new programs and measures, participation in cooperation councils, etc., are not included and should be taken into account when calculating the total human resources needed for a LOD;
because of its specificity, activities associated with the implementation of resource processes of a LOD are not possible to be included in the scope of the created model. Despite the initiative of decentralization
beyond the model remain the processes for managing information resources, supply management and all management activities of planning, communication, control and others.
Knowledge of risk situations is the basis of solutions for risk management in the implementation of the model and effective actions for their prevention, and if this is not the case –their bringing to reasonable limits.
V. CONCLUSIONS
The overall strategy for the future approved by the European public services is in response to the challenges of the dynamic changes in the social environment and consistent with the requirements of the strategic framework for the development of the Europe 2020. It is aimed at the realization of an effective system for management of human resources. Examining PES as a result of the actions of all the factors of a system as a whole could provide significant implications about their economic and social efficiency. Defining the main processes and the implemented activities is the initial point in modeling which in the current study is supported by capacity measurements and assessments. Optimization, quality and efficiency improvement can be accomplished with the use of complex and systematic approaches that take into account available resources and capacity needed in the construction and improvement new tools to streamline management decisions, effective management and control.
The study presents a model to determine the required capacity as a flexible tool for better management of activities in different labor offices by providing the necessary human resources and their use in the most efficient manner. The model allows consideration of the initial conditions which are bound to the policies and objectives of the Employment Agency and gives opportunity to develop different scenarios based on different starting conditions and assumptions in different labor offices. The application of the process model of work in terms of the main activities (in particular training and qualification, implementation of programs and implementation of measures) provides opportunities for optimal use of available resources and improve the capacity of work, and hence the efficiency of the social policies by providing tools for analyses, evaluation of alternative scenarios, rationalization of management decisions and standardization.
REFERENCES
[1] V. Terziev, S. Dimitrova, Social programming in the context of stimulating social activity and regulation of social development through active policies. “East West” Association for Advances Studies and Higher Education GmbH, Vienna, 2015.
[2] European network of Public employment services. http://ec.europa.eu/social/main.jsp?catId=1100&langId=en
[3] V. Terziev,Challenges before social programming in the context of encouragement social activity and regulation of social development through active policies (Predizvikatelstva pred sotsialnoto programirane v konteksta na nasŭrchavaneto na sotsialnata aktivnost i reguliraneto na sotsialnoto razvitie chrez aktivni politiki), Primaks- Ruse, 2015.
[4] V. Terziev, Impact of active social policies and programs in the period of active economic transformations in Bulgaria. „East West” Association for Advances Studies and Higher Education GmbH, Vienna, 2015.
The 3rd Human and Social Sciences at the Common ConferenceOctober, 5. - 9. 2015, www.hassacc.com
Social Science eISSN: 2453-6075, cdISSN: 1339-522X10.18638/hassacc.2015.3.1.152 - 151 - ISBN: 978-80-554-1124-8

Legislative background and civil activities of NGOs
in different countries Based on materials of sociological research on the Internet
Aleksander Voronov, Edita Albova, Natalia Zhukova
Learning Lab Training Management of Rector
Saint-Petersburg State University
Saint-Petersburg, Russia
Elena Kapustina, Elena Voronova
Faculty of Sociology
Saint-Petersburg State University
Saint-Petersburg, Russia
Abstract – Civic engagement is defined as a process of working to
make a difference in the civic life of our communities and
developing the combination of knowledge, skills, values and
presence of legislative basis to implement that difference. It refers
to promoting voluntary movements and non-governmental actors
in different countries. It provides various activities of NGOs.
Comparative analysis is based on a document analysis in the
Internet. Countries for the research are taken from the World
Giving Index range.
Keywords- charity, NGO, volunteers, sociology, online-
published documents, legislative basis
I. INTRODUCTION
Civil society is seen as a social sphere separated from both the state and the market. The development of civil society is characterised by the increasing activities of non-state, not-for-profit, voluntary organizations formed by people in order to address various social issues. In our work we concentrate on the promotion of the non-political actors and, in particular, we track the impact of voluntary movements and non-governmental actors in various countries on the civil activities and civic life and the way such actors are represented and act in the communities.
One of the criteria of the civil society development is the number of non-governmental organizations in the countries. It primarily refers to the sphere of voluntary associations or non-profit organizations. Interestingly, there is no stated title of a non-governmental organization in the world which leads to frequent usage of such acronyms as NGO as NPO and NCO.
There is a difference between “moral” and “civic”. The term “morality” is related to the value judgments about how a person ought to act towards the others. The term “civic” reflects different social relations starting from the family, neighborhoods and local communities to state, national, and cross national levels [1].
The research is grounded in the theory of social action developed by M. Weber (1990) and the theory of institutional altruism of P. Sorokin (1997).
II. METHODS
Nowadays the Internet is an integral component of social relations and individual communicative practices all over the
world. Because of the active using of the information and communication technologies there are a lot of electronic resources in the Internet available to anyone. Thus, using the information via the network resources is an important issue.
The research was conducted by the using the method of analysis of the documents. The documents included the information from the World Wide Web written in English, Russian, Spanish and Italian languages. Several criteria concepts were introduced in the query search engines «Google», «Yandex», «Yahoo» and others. For the analysis the electronic content of the pages from the first 30-50 links were selected.The several parameters of external analysis were defined: the document format, country and the year of the Internet resource creation, the author, the aim of its creation, reliability and authenticity. The main criteria of the content analysis: the development of volunteer movement; the development of philanthropy (or charity); the development of mutual aid and social networks; self-organization of the client groups, protecting the interests of clients and client groups by volunteers. The study examined the countries included in the World Giving Index 2014, published by the British charity fund CAF [2]. CAF did the ranking for the fifth time on the basis of a worldwide survey of Gallup (Gallup's WorldView poll). In the 2014 ranking 135 countries have participated. Country's place in the rating is determined by the average of the three indices: Helping a stranger, Donating money, Volunteering. We have worked with the countries belonging to different groups of the ranking. This paper presents an analysis of 6 countries: England, Spain, Portugal, Italy, Russia, Turkey. The main parameters of these countries in the context of this analysis are shown in the summary tables (Table I, II).
TABLE I. INDEXES OF CHARITY AND NGOS ACTIVITY IN DIFFERENT
COUNTRIES (RANKING)
Country
Characteristics
Worl
d
Givin
g
Index
Helping
a
stranger
Donati
ng
money
Volu
ntee
ring
Numbe
r of
non-
profit
organiz
ations
England 7 24 4 33 48 000
Spain 62 51 56 83 260 000
The 3rd Human and Social Sciences at the Common ConferenceOctober, 5. - 9. 2015, www.hassacc.com
Social Science eISSN: 2453-6075, cdISSN: 1339-522X10.18638/hassacc.2015.3.1.182 - 152 - ISBN: 978-80-554-1124-8

Portugal 78 76 62 83 17 012
Italy 79 72 52 114 301 191
Russia 126 122 131 70 669 900
Turkey 128 106 112 132 245 170
TABLE II. INDEXES OF CHARITY AND NGOS ACTIVITY IN DIFFERENT
COUNTRIES (SCORE)
Countr
y
Characteristics
Worl
d
Givi
ng
Inde
x
Helpin
g a
strange
r
Dona
ting
mone
y
Vol
unt
eeri
ng
Numb
er of
non-
profit
organi
zation
s
England 55 61▼ 74 29 48 000
Spain 32 53▲ 27▼ 15 260 000
Portugal 28 46 24 15 17 012
Italy 28
▼ 47▼ 28▼ 9▼ 301 191
Russia 19 34 6 18 669 900
Turkey 18 38▲ 12 5 245 170
Countries‟ scores indicate a rise or fall in a score of 3 percentage points or more since the 2012 survey: ▲Scores have increased by at least three percentage points ▼Scores have decreased by at least three percentage points. Scores in plain text have seen a change of less than three percentage points either way, or were not surveyed in 2012.
III. CIVIL SOCIETY AND NGOS
A number of researchers consider non-profit organizations to be a part of the emerging civil society in the country. Others believe that a certain number of non-profit non-governmental organizations indicates the development of civil society. By civil society they understand "a social order that favors the development of the human personality and amateur public associations». [10]
However, scientists agreed that NCOs play a significant role in the contemporary society contributing to organization of various forms of self-help and mutual aid to citizens, including them in cooperation with various associations and foundations.
What is more, non-governmental and non-commercial organizations are one of the channels to attract government attention to the issues of society. That is why NCOs and NGOs are considered to be an engine of civic activity.
There are many indicators that could evaluate the importance of the NGOs and NCOs in civil society and civil activity. The comparative analysis of the countries will be presented here to underline the involvement and importance of NGOs and NCOs in civil activity. The countries will be analysed according to the four following criteria: development of volunteer movement, the development of philanthropy, the development of mutual aid and social networks and self-
organization of the client groups, protecting the interests of clients and client groups by volunteers.
A. Development of volunteer movement
Having analyzed the various sources of information, we could rank the countries according to the first criteria mentioned above - the development of volunteer movement considering the number and types of NGOs engaged in social assistance as follows:
The most widely represented volunteer movement and NPOs being in a constant development could be outlined in such countries as Russia and England. Referring February 17, 2015, the Ministry of Justice (MOJ) registered 225 724 non-profit organizations - including 113 thousand socially oriented NGOs. [3]
One of the trends of the development of the "third" sector at the moment is the support from SO NPOs (socially oriented NPOs) in the form of subsidies from the state. A portal for the Ministry of Economic Development of the Russian Federation was created as a single information system to support socially oriented non-profit organizations. There are more than 50 normative documents (laws), which have been passed since 1995.
In England, on the contrary, there is the Law on Public Service (Law on social benefits) which is a part of the deliberate policy of the British Government aimed at facilitating access to public contracts for social and non-profit enterprises. [4]
There are 48,000 third sector organizations in England. A notable feature of recent developments in the third sector in the UK is a growing reliance on public funding by third sector organizations. Around 36% of organizations in the third sector received some public money, and that 14% (23,000 organizations) regarded statutory funding as their most important source of income. Whereas the proportion of third sector income received from such sources, in the aggregate, is around 50%, the proportion of organizations which receive this income is approximately 36%.
The leadership of the sector is crucial to the creation of a „strategic unity‟ and a collective voice; but leadership itself is contested and has to struggle for legitimacy and leverage.
Determining the most influential NGO in England, many scientists stress the importance of the Historic Building and Monuments Commission for England, or “English Heritage” that has an extensive network of branches throughout the country. The main force of the organization in the conservation of cultural heritage are volunteers. A distinctive feature of volunteering in the UK - openness. Every citizen of the country can become a volunteer starting from 16 years old.
However, there are important variations depending on legal form, size, beneficiary, purpose, role, and geographical location. Many of these factors are interrelated. Over 70% of organizations employing at least 10 staff-members receive public funding in some form. The position is less clear with regard to volunteering.
The 3rd Human and Social Sciences at the Common ConferenceOctober, 5. - 9. 2015, www.hassacc.com
Social Science eISSN: 2453-6075, cdISSN: 1339-522X10.18638/hassacc.2015.3.1.182 - 153 - ISBN: 978-80-554-1124-8

The management and governance of the major part of voluntary sector organizations mirrors those in the public and private sector, with a Board of Trustees who act as the directors and/or governors of the organization. Trustees usually have responsibilities laid down in both a legally binding Trust deed and in law, but will be normally be unremunerated, apart from the reimbursement of out-of-pocket expenses.
In the same time in Italy the work of volunteers is based on three important principles: solidarity, voluntary and gratuitous. Their activities are governed by the law of 1991, which clearly states that volunteer mission is aimed at supporting the ethical and social values, is absolutely free. Under this law voluntary organizations are prohibited from engaging in business or any other commercial income-generating activities, in addition to that which is aimed at financing of individual volunteer initiatives and training programs. According to statistics there are about 5 million volunteers in Italy. [5]
In Italy there is a process of reforming NGOs. New laws are breaking “Berlin wall” between government and civic organizations. There are some advantages for NGOs, for example, lower rate of taxes. The problem is the lack of resources to keep official circumlocution. In 2011 about 301.191 NGOs were registered in Italy and currently, in 2015, there are more than 4 million of volunteers.
Concerning Turkey, institutional charity waqf is presented. Large and influential waqf is based on the largest Turkish industrial conglomerate, a federation "Waqf - the third sector", which includes more than a hundred of charities, non-governmental organizations and associations [13]. In 1984, with the entry into force of the law №3294 on social support and mutual solidarity a national fund of social mutual aid and solidarity was founded by the General Secretariat to coordinate assistance to the needy and the poor.
In Southern countries of Europe such as Portugal and Spain, the volunteer work is performed mostly by two main organizations - CNPV and “Círculo de Economía”.
CNPV coordinates the activities of all the volunteers of the country by implementing large social projects. [6]
Estimated by the number of organizations comprising it, the Third sector social action is a significant sector. In 2010 the number of active organizations was estimated at around 29,000. Civic initiative implements a valuable promotion of the sector likewise gives an indication of the importance of the Third Sector Social Action entitles in Spain. The activities of the Third Sector Social Action entities a target four groups of persons: primarily individuals with disabilities and, to a smaller extent, minors, seniors and the population in general. The half the organizations in the sector conducts their activities in a provincial, regional or local settings. The volume of expenditure for 2010 represented 1, 62% of the total Gross Domestic Product of Spain for that year.
Currently there are around 260,000 non-profit organizations in Spain, 35,000 of which are defined as social action, community development and international development and aid organizations. In reality only around 100 of them in fact fundraise in a way that would be recognized in the UK, USA, or other mature fundraising markets. The majority of them are
small local self-help organizations, sports clubs or entities completely funded by local, regional and central government. Collaboration and cooperation among the non-governmental organizations and the state takes place through five groups: Strategic Action Plan for the Social Action of the Third Sector; Social inclusion and Employment; Legislation and Financing; Volunteers; and Gender and Equality.
The largest non-profit organization of Spain, Círculo de Economía, is considered as a place for a dialogue and a discussion of various social groups: businessmen, economists, professionals and experts from the administration. Círculo de Economía has 4 main areas of activities: the economy, climate change and energy, infrastructure and the environment and the quality of democracy and social transformation.
B. Development of philantropy (or charity)
Following the second criterion - the development of philanthropy (or charity) in social sphere we could point out that the most developed charity are in England and Russia. On the one hand, British charity is on the increase. Implementation of social programs and community initiatives emanating from society is experiencing tremendous growth. Charity in England is common, perhaps, more than in any other country. The number of charitable organizations in the UK is growing.
On the other hand, charity in Russia is represented by NGOs, business, volunteers and private benefactors [12]. Moreover, NGOs initiatives in Russia are supported by legislature. Coordinating Council for Cooperation with civil society institutions was established under the Chairman of the Federation Council. In 2006, the research team has analyzed ZIRCON Data bases OP RF and highlight those areas in which the activity of NGOs appear most often which are education and science (32% of NGOs, who have declared their activities in 2006) and culture and sport (27% of Russian NGOs).
In Turkey, for example, charities come through charitable foundations, but they do not focus on institutional change and the impact of the adoption of major government decisions. Majority of funds are the organizations that operate at the local level in order to provide assistance to the local population, and therefore can only help a small number of people. [13]
In 1991, the Italian law on volunteering fixed the relationships with government organizations. In Italy social volunteering has appeared officially. One of the largest organizations that develop voluntary initiatives in the country is the Italian Foundation volunteer, initiated by the Rome Savings Bank. Furthermore, there is a Standing Committee of Chairmen of voluntary organizations and foundations, representing the interests of Italian volunteers to the government, parliament, the church and various social institutions.
Considering Spain, it could be highlighted that representatives of high society usually arrange a charity market in the days before Christmas. Additionally, at the Christmas time there are many charity events. [7]
Society for the Blind ONCE lottery is a popular in Spain share/action, the so-called game “Big coupon”. Part of the
The 3rd Human and Social Sciences at the Common ConferenceOctober, 5. - 9. 2015, www.hassacc.com
Social Science eISSN: 2453-6075, cdISSN: 1339-522X10.18638/hassacc.2015.3.1.182 - 154 - ISBN: 978-80-554-1124-8

proceeds from the lottery ONCE goes to charity in order to help deprived people of view.
Regarding Portugal, a humanitarian alliance of cancer patients (UniãoHumanitária dos Doentes com Cancro - UHDC) in 2013 expanded the scope of its activities and now provides free social assistance to all needy residents of Lisbon, not only for cancer patients. Help is available in the Núcleo de ApoioaoDoenteOncológico UHDC, as well as in the capital and its suburbs.
C. Development of mutual aid and social networks
Positioning Figures and Tables: Place figures and tables at the top and bottom of columns. Avoid placing them in the middle of columns. Large figures and tables may span across both columns. Figure captions should be below the figures; table heads should appear above the tables. Insert figures and tables after they are cited in the text. Use the abbreviation “Fig. 1”, even at the beginning of a sentence.
Examining the third criterion - the development of mutual aid and social networks, it could be underlined that, for example, in England there are widely distributed mutual benefit societies - voluntary associations aimed to provide sick assistance to families in the event of death of the breadwinner, etc. As well as the state, the organization has to deal with the costs of its members without receiving any income. Furthermore, mutual benefit societies were the main mechanism of “social protection” in Britain generated self-organizing civil society. In 1910, mutual societies consisted of 6.6 million members, while the trade unions - 2.5 million and the same - in cooperative organizations.
According to the Center for Civil Society Studies, in Russia the non-profit sector has been an expanding segment of the informal communities, aimed at creating a network of self-help groups to solve pressing social problems (e.g., cleaning 2013 World). Consolidation in this socially-oriented network is based on the participants' desire to create a public goodness. Association of individuals in groups, organizations and communities indicates a fairly high level of awareness of social reality and active life position, "the specificity of the country lies in the fact that the informal practices of public activity developed significantly better than the formal" [15]. In the study of informal communities that we refer to, Internet researchers identify in their professional practices these informal communities as really existing and well-functioning and short-lived community [9]. Among the most successful they named: Environmental Movement "Musora.Bolshe.Net»; service “House. The Yard. Road” to accommodate complaints about the state of communications, adjacent territories; Virtual bell; 2013 World cleaning; Site St. Petersburg's Parents; Paternal Committee: interregional public movement; Tugeza. As a rule, according to B. Dondokova, the factor of motivation for creation such communities is any emergency of social nature, requires the consolidation of a significant number of individuals. Emotional experience of collective solidarity is a major affective component of exchange transactions and is a powerful impetus for the emergence of informal communities of practice using mutual aid as the main mechanism of action. Thus, the project “Virtual bell” originated in a situation of large-scale fires in 2010. “Virtual Rynda” - a community that
uses the Internet as a means for coordinating mutual assistance, the purpose of which is to reveal the potential of the Russian community network for cooperation between Internet users and various organizations, including nonprofit organizations, government agencies and businesses "Another equally significant project “Neighbours” - a non-political association of urban experts, consisting of real masters of their craft, to the members - public figures, lawyers, journalists, psychologists, experts in public relations. The leading characteristic of mutual assistance in the community is a professional cooperation in the framework of the informal social interaction and joint solution of urgent social problems. A separate group constitute parent sites that carry not only educational and informational, advisory (consulting various experts on the development and education of children), the communicative function, but the function of mutual support site members in solving a variety of problems. The volunteerism in Russian sociology is considered from positions of social work, the social help and charity. Research of volunteerism are based on well-known historical scientific traditions which come from ideas of altruism, religious values ,socialist ideas and liberal values of freedom of activity of the individual. [14]
In Italy currently the structure of the Local Social Services (LSS) dominates structure at the community level, which is as close to the population, so there are real opportunities to work with the individual, his or her family, a group of families to promote forms of mutual aid and solidarity. In Italy these changes have occurred more clearly in the period of social reforms, 70s, and 80s job prospects in the Commune. [11]
Another trend could be tracked in Spain. This is the fourth year in Barcelona in the heart of the city is equipped with a three-story headquarters of the “Catalan integral cooperative”, with a garden on the roof. Boasting 1200 members of the community not only distributes goods from warehouses (including “working hours”, as in “time bank”, and its own currency - the “eco”), but also pays attention to other applied problems: mutual housing, basic medical consultations, educational activities and courses, and even the organization of care for young children. In one of the halls of local parents working nurseries are opened daily for joint care of their babies. In addition to the 30 euro entrance fee, no additional cost is required, just a desire for mutual support. Moreover, there are many self-help groups in the social network “Facebook”. Those technologies exist in Russia and in Turkey, and it is seen as civil initiatives.
Concerning Portugal, pensions over the past 5 years have decreased by 20% there. The number of people living in Portugal on the brink of poverty is around 30% of population, and it would be greater if the Portuguese were not so friendly to other family and friends; it was mutual decision between residents‟ family and friends network to save the population caught in the difficult economic situation of the Portuguese. Young Portuguese live most of their lives with their parents supporting each other, creating a separate family or moving into a new apartment is simply impossible. The plight of young people in Portugal is paradoxically strongly correlated with the elderly people because of the crises. As a rule, public demonstrations are made because of youth and seniors. In
The 3rd Human and Social Sciences at the Common ConferenceOctober, 5. - 9. 2015, www.hassacc.com
Social Science eISSN: 2453-6075, cdISSN: 1339-522X10.18638/hassacc.2015.3.1.182 - 155 - ISBN: 978-80-554-1124-8

Portugal, there is the almost equal number of men and women who can rely on a close person or organization.
In such countries as India, Turkey, China, Portugal, Italy, Russia we could observe a historical specificity of mutual aid development which lies in religious communities and clans.
Evaluation of the civil activity: self-organization of the client groups, protecting the interests of clients and client groups by volunteers.
Last, but not least is the fourth criterion - self-organization of the client groups, protecting the interests of clients and client groups by volunteers, which is also revealed in this article. Starting with England, it could be noted that many social services across the country are dependent on human rights volunteers. Across the UK advocacy services are attracted to the work of volunteers, if it were not for their help and support, many services have just closed.
Regarding Russia, civil society organizations involved in human rights activities (protection of cultural, political, personal, environmental and socio-economic rights) have a staff of lawyers and usually invite volunteers to carry out different types of activities that are not only legal, but also supporting - records management, data archiving, development sites, information support networks. Here are a few examples of organizations involved in the protection of individual rights of different groups of customers:
Fund "Mother's Right human rights violations in the army, the military death: legal and psychological assistance to relatives of the victims.
Saint-Petersburg Department of interregional public charitable human rights organization "Committee for Civil Rights» - rights of prisoners.
Center “Memorial” for migrants and stateless persons illegally staying foreign nationals. Attract volunteers, for example, to work with children of migrants.
Moreover, it is important to stress that there is a number of volunteer projects available in Istanbul (Turkey), and may include teaching in primary schools, helping in orphanages, working with people with disabilities, environmental or cultural environment or even volunteering in construction projects in rural areas of Turkey. [8]
As for Italy, nowadays there are 5 million volunteers, which means 800 volunteers per 10 000 population. In the volunteer movement involved the order of 80% of women and only 50% of men. Volunteering is more developed in the central and eastern parts of the country where the highest civil activity of the population is presented.
Concerning the same issue in Spain, we shall point out that environmental group “Huertos Compartidos”, recently established community garden, which connects owners of vacant land to those who want to plant vegetables and share the harvest. In addition, the Spanish branch of Reprieve - an international human rights organization that works to achieve the abolition of the death penalty, as well as to provide legal support to those who face the death penalty.
IV. CONCLUSION
Having analyzed such countries as Russia, England, Italy, Spain, Portugal and Turkey according to the four criteria mentioned above by working with Internet online-published documents, it could be concluded that the involvement of NGOs in volunteer movement and other types of civil activities has the influential impact on development of civil societies in the countries. All of the studied European countries strive to develop such participation of NGOs in civil activities.
Summarising our research experience, we have managed to track successful ways of the NGOs participation development in civil activities and civil society what could bring us to the idea that such way of communication and mutual help could foster the development of civil societies and of countries and would affect not only the social field but also economic, political and cultural spheres. Strong involvement of different kinds of non-governmental organizations (like NPOs, NCOs, NGOs, GONGO etc.) shows also that the elusive boundaries between the spheres of government, commercial activity, private life and civil society are frequently blurred.
The analysis of online-published information sources is determined by the specificity of the information space of the Internet which has a network structure. The selected sources are normally connected by quotation links with other sources, which also reflects the examined question and can be applied to the analysis.
REFERENCES
[1] Ph.D. Program in Political Science of the City University of New YorkStable, Comparative Politics,Vol. 36, No. 3, pp. 291-312, April 2004.
[2] Charitie Aid Foundation, World Giving Index 2014. Online document title. Available at: https://www.cafonline.org/about-us/publications/2014-publications/world-giving-index-2014, accessed: May 20th, 2015.
[3] Information and practical journal “Protected by the state”, “Volonterstvo v Velikobritanii”. Online document title. Available at: http://ohrangos.ru/n1international.html, accessed: May 15th, 2015
[4] Legislation.gov.UK, Public Services (Social Value) Act 2012. Online document title. Available at: http://www.legislation.gov.uk/ukpga/2012/3/enacted, accessed: May 15th, 2015.
[5] N. Mirakyan, “Ne nado privilegii,” RG.RU. Online document title. Available at: http://m.rg.ru/2012/11/12/italy.html, accessed: May 15th, 2015.
[6] O. Gerasimova, “Vklad NKO v strategicheskoe planirovanie v Ispanii I Rossii”, Cogita!ru. Online document title. Available at: http://www.cogita.ru/nko/2-i-konkurs-esse-deyatelnost-nko-v-rossii-i-v-evrope/olga-gerasimova.-vklad-nko-v-strategicheskoe-planirovanie-v-ispanii-i-rossii, accessed: May 15th, 2015.
[7] Information portal about Spain and the Unified Service Center, “Amancio Ortega pojertvoval 20 mln evro na blagotvoritrl‟nost‟.” Online document title. Available at: http://www.espanarusa.com/ru/news/article/372892, accessed: May 15th, 2015.
[8] G. Bowen, Civic Engagement in Higher Education: Resources and References, CA: Center for Service Learning Western Carolina University Cullowhee, 2010.
[9] Dondokova B., “Neformal'naya vzaimopomoshch' kak factor sotsial'noy solidarnosti v sovremennom rossiyskom obshchestve”, Sovremennyye problem nauki i obrazovaniya, No. 2, pp. 36-48, 2013.
[10] E. Gelner, “Conditions of Liberty: Civil Society and its Rivals”, Allen Lane: Penguin, 1994.
The 3rd Human and Social Sciences at the Common ConferenceOctober, 5. - 9. 2015, www.hassacc.com
Social Science eISSN: 2453-6075, cdISSN: 1339-522X10.18638/hassacc.2015.3.1.182 - 156 - ISBN: 978-80-554-1124-8

[11] A. Sicora, “La violenzacontroglioperatorideiservizisociali e sanitari, Carocci, Roma, 2013.
[12] A. Voronov, E. Voronova, “Blagotvoritel‟nost‟ I dobrovol‟chestvo v sovremennoi Rossii”, CA: Saint-Petersburg University, Saint-Petersburg, 2011.
[13] E. Voronova, H. Kara, “Deyatelnost sovremennykh blagotvoritelnykh fondov Rossii i Turtsii v protsesse stanovleniya grazhdanskikh obshchestv”, Vestnik S.-Peterb.un-ta, Ser.12.., No. 3, pp. 153-162, 2014.
[14] E. Voronova, “Dobrovolchestvo kak forma blagotvoritel'nosti v sovremennoy Rossii”, Vestnik Sankt-Peterburgskogo universiteta., Ser. 12., No. 1, pp. 330-342, 2011.
[15] I. Mersiyanova, “O formirovanii obshchestvennykh institutov” (06.04.2011). Online document title. Available at: http://ria.ru/strategy2020_analytics/20110406/361755277.html, accessed: June 2nd, 2015.
The 3rd Human and Social Sciences at the Common ConferenceOctober, 5. - 9. 2015, www.hassacc.com
Social Science eISSN: 2453-6075, cdISSN: 1339-522X10.18638/hassacc.2015.3.1.182 - 157 - ISBN: 978-80-554-1124-8

IMPACT OF FOREIGN INVESTMENT IN THE
REHABILITATION OF THE COUNTYR
ECONOMY, THE CASE OF KOSOVO
Salihu Vjollca
European University of Tirana
Departament of law
Prishtina, Kosove
Abstract – In this topic will be discussed the role of foreign
investment for economic rehabilitation of war-torn countries and
their impact on the opening of enterprises for the employment of
Kosovars
Next will be treated the situation of countries which tend to join
the European Union, with the aim of developing the country and
building the values of democracy.
Running of the Western Balkan countries towards democracy
and economic development is difficult without foreign
investment. The case of Kosovo will be discussed in particular,
where the conflict in the former Yugoslavia delayed aid and
investments that negatively affect regional development and its
integration processes. Also private investment and remittances of
Kosovar Diaspora and Migration will be analyzed. The negative
impact of high-level corruption in Kosovo as stumbling, inhibitor
of foreign investments. Conclusions and ideas for the attraction
of foreign investments.
Keywords- foreign investments, process integration, regional
cooperation, assistance, state of law , the Western Balkans ,
corruption
I. INTRODUCTION
Investments represent a complex and responsible business step, followed by uncertainty and risks. Investments somehow project the future of certain companies or national economies
[1].
Therefore, investment means commitment of a given amount of money now, expecting the return of a greater amount in the future
[2].
Investments in another country, based on certain terms and conditions , can make another state, itself or through investors ( business entities ) thereof
[3].
[1] Salihu Vjollca- Foreign direct investment in Kosovo , their role and
impact on economic development, International Conference , 27-29 . 03.2015
, Dubrovnik, Croatia ;
[2] Mustafa Isa " Financial management " Riinvest Prishtina , Prishtina ,
2008, pp.153;
Foreign investments have an important role in business development of the country , noting that States, which have the most rapid pace of development of the business climate, are also the countries with the highest levels of direct investment growth and gross domestic product[
5].
II. INVESTMENTS IN COUNTRIES AIMING INTEGRATION IN
THE EUROPEAN UNION
Current analysis up towards the country's economic development and attracting foreign direct investment, are made mainly about the role of human resources and their impact on attracting investment. If a country manages to develop education and quality of professional training, provides sustainable economic growth of the country. According to the analysis, which are made for foreign investment, it appears that countries with developed human resources have attracted much larger investments in relation to countries that have less developed human resources ( Aslam Khan M, 2007).
But it is important to analyze the situation of the countries emerging from war, economic crisis and the choice of ways to attract foreign investment.The collapse of communism and the subsequent developments have put a spotlight that potential Balkan economies such as Bulgaria, Albania, Serbia and Montenegro, Romania and the former Yugoslav Republic of Macedonia are the countries that have received very low levels of investment and poorer same political system, to attract foreign investment, and therefore the leadership in most of these countries is delayed so much that it is necessary to provide reforms.
However, now there are signs of improvement and that in due time, but these countries have to engage as much as possible with the world economy through membership in the EU although most of these countries have made the transition more difficult [
6].
Kosovo is a new country with a fragile economy, out of the bloody war. This war, in the years 1990 - 1999 forwarded by prostration and the definitive destruction of the Socialist
[3]Smaka Riza , The business rights , Illyria Royal University, Prishtina,
2007, pp.262 ; [4] Vjosa & Lulaj Enkeleda Hajdari , Foreign direct investment and
tourism industry in the municipality of Ulcinj and the countries of the region .
04/05/2013 International Conference, Ulcinj , Montenegro;
The 3rd Human and Social Sciences at the Common ConferenceOctober, 5. - 9. 2015, www.hassacc.com
Law eISSN: 2453-6075, cdISSN: 1339-522X10.18638/hassacc.2015.3.1.189 - 158 - ISBN: 978-80-554-1124-8

Federal Republic of Yugoslavia (SFRY), part of which was Kosovo. Also Kosovo is a poor country with many problems and difficulties. Immediately after the War and the entry of KFOR forces, Kosovo entered the direct transition phase [
7].
Therefore, Kosovo as a new country, is facing a very wrecked and inherited economy and is going through a very difficult post transition phase, with attempts to transition from the type command economy to free market economy. The liberalization of capital is a conductive opportunity to the transformation of the property as a fundamental step towards a functional economy and incentives for direct foreign investments for which the need is extremely current, considering the fact and the situation in which was the country after the war, and next we will present advantages, which are favorable to invest in Kosovo [
8].
But here we can say that Kosovo despite the difficulties has a new and dynamic economy. Its base is transformed from a centralized economy, orchestrated in an open market economy, which experienced its deep transformation after the 1999 liberation of Kosovo from Serbia. One of the challenges faced over the last decade is the process of privatization.
International Economic Cooperation of the country or a region is a result of the level of the economy and structure development of a country or region. Therefore, international economic cooperation of Kosovo depends on these two main factors that determine the framework, the general dynamics and the main directions of development of this cooperation. In an effort to create a more suitable environment for investors, the Kosovo Privatization Agency, continues with an accelerated program of privatization of enterprises and assets through a process of transparent and competitive tendering, according to best international practices. Therefore, in order to create a climate of stable legislative and economic development after its independence, Kosovo has made progress in many areas of its development as : increasing political stability, increase the level of safety, stable economy with continuous growth, supplement legislation etc. It has become an important part of regional cooperation initiatives, through which it is achieved the creation of a regional common market, the elimination of customs tariffs, the elimination of trade barriers and the opening of new perspectives.
Kosovo institutions have worked and continue to work rapidly to meet the standards which are necessary for membership in the European Union. It is created a stable macroeconomic environment, a sound financial system and reforms are made in fiscal policy in the application of tax to
[5] The Balkans: Foreign Direct Investment and EU Accession,
ARIStIdIS BItZENIS , University of Macedonia, Greece pp.16,
[6]. Salihu Vjollca Kosovo's economy opportunity or challenge for foreign
investors, 04/05/2013 International Conference, Ulcinj, Montenegro;
[7] Kosovo is no part of Eastern Europe, between Serbia and Macedonia;
It has an area of: 10,908 km2; no relief - fertile soil, in general, a land surrounded by mountains; its climate is influenced by continental air masses
resulting in relatively cold winter and snow and dry summers; maximum
rainfall between October and December; no natural resources, nickel, lead, zinc, magnesium, lignite, kaolin, chrome, bauxite; Kosovo's population
counts: 2,180,686
lower rates in the region. Among the important objectives that our country has set for itself is the increasing competitiveness of the economy in the regional market.
Kosovo’s legal system is reconstructed to comply with EU legislation. So the transfer of profits and repatriation of invested capital is free and unlimited. Therefore in order to create a stable economic climate for economic development with the aim of attracting foreign investments, which represent one of the essential factors to the development of the country, all laws and regulations in Kosovo are available online in English making Kosovo 's legal system among the most transparent in the region. With Article 3 of the Regulation on Foreign Investment , under which is guaranteed national treatment, legal certainty, the right of free conversion and payment, keeping the books and the transfer of profit, wealth etc [
9].
III. DIRECT FOREIGN INVESTMENTS IN KOSOVO BY
COUNTRIES AND SECTORS
European Union countries continue to be the main source of FDI -s in Kosovo. Unlike 2011, where the bulk of FDI was the United Kingdom ( 20.3 % of total FDI ) as we see from the chart below, in 2012 Turkey represents the country of origin mostly FDI in Kosovo (28.3 % of total FDI ). FDI has been from Switzerland where we see growth in 2012 from this place, with 18.9 % participation [
10].
Figure 1. Structure of FDI by key countries, in percentage
Source: BQK, 2013. Turkey, Germany, Switzerland, Great Britain, USA, Slovenia, Bulgaria, Albania
[9 ] See Regulation Nr.2001/3,
http://www.unmikonline.org/regulations/unmikgazette/03albanian/A2001regs/
RA2001_03.pdf
[10] See CBK Central Bank Report 2013, http://www.bqk-
kos.org/repository/docs/2014/BQK-RV-Shqip-2013.pdf
The 3rd Human and Social Sciences at the Common ConferenceOctober, 5. - 9. 2015, www.hassacc.com
Law eISSN: 2453-6075, cdISSN: 1339-522X10.18638/hassacc.2015.3.1.189 - 159 - ISBN: 978-80-554-1124-8

Countries
Export
(000) €
Participation
in total
%
Import
(000) €
Participation
in total
%
Italy 71.351 25.8 213.469 8.5
Albania 40.180 14.6 110.528 4.4
Macedonia 26.376 9.6 287.739 11.5
Switzerland 15.133 5.5 22.664 0.9
Germany 14.995 5.4 304.195 12.1
Serbia 14.968 5.4 278.388 11.1
Turkey 11.380 4.1 199.881 8.0
Kina 3.266 1.2 159.651 6.4
Total 276.100 71.6 2.507.609 62.9
Figure 2. Foreign Direct investment by the main economic sectors, in percentage
IV. REMITTANCES
Categories with the largest contribution to the narrowing of the current account deficit are remittances. Remittances continue to be a key component within the transfers to the private sector ( 67.7 percent of all total private sector transfers). Income from remittances in 2012 totaled 605.6 million euro’s compared to 2011 represents an increase of 3.6 percent. As a percentage of GDP, remittances in 2011 were at the same level with the previous year having a share of 12.5 percent.
Remittances continue to be the main source of Germany and Switzerland with 34 or 23 percent of total remittances received in Kosovo, while other countries are represented by lower interest rates. Italy and Austria account for 7 or 6 percent of total shipments, followed by Belgium with 3 percent, the US by 4 percent and Sweden with 3 percent. About 20 % of remittances transferred through the banking system, while 36 percent are transferred through money transfer agencies. The rest of remittances transferred through other channels include informal channels [
11].
Figure 3. Receipts of remittances in euros
Source: BQK(2013)
[11 ]See, CBK Central Bank Report 2013, http://www.bqk-
kos.org/repository/docs/2014/BQK-RV-Shqip-2013.pdf
V. CORRUPTION
Phenomenon (factor), which impacts very negatively on the economic development of the country, namely in absorption of foreign investment is corruption. This phenomenon hinders and hampers development in all areas of the country where it is applicable. High perception of corruption not only reduces the trust of citizens and businesses to the government and public institutions, creates a negative reputation of the country, but is also an obstacle to attracting foreign direct investment as well as economic development.
Alleviation of the bureaucracy in terms of doing business should go for improvements in the fight against corruption in order to achieve the goal of increasing foreign investment. This phenomenon is a source of uncertainty for foreign businesses serious and so further increase the risk of investing in the country.
According to the Council of Europe , " Corruption means requesting, offering , giving or accepting , directly or indirectly a bribe or any advantage or prospect thereof that distorts the proper perform- duty or behavior required by the recipient of the bribe".
Development of small and medium enterprises SMEs, condition for reducing unemployment. The importance of development of small and medium enterprises SMEs, lays in the fact that they are an essential component of a country's economic development and these are the source of considerable help to stimulate employment and economic dynamism and competitiveness.
So, small and medium enterprises are businesses which make up almost in most countries 91 per cent of economic development and is considered as one of the basic sectors in the creation of a sustainable economic budget . Here we can say that each country is vital to encourage and support the development of the sector of small and medium enterprises, creating as many administrative facilities doing business in the country.
Small and medium enterprises, occupy an important place in the economy of a country. Contribution of those in growth, employment creation and social development is to be assessed. As public opinion researchers and all recognize the great importance they have. ( Staworth and Gray, 1991). Even sometimes they are considered as " locomotives of growth ". Generally about 62 % of the total number of employees ( Madsing-1997 ) are employed at small and medium enterprises. While developing countries NVN - to employ about 20 % of the adult population [
12].
As criterion of separation of enterprises in those small and medium enterprises mainly deal volume production, the size of total revenue, number of employees etc. The advantages of small and medium enterprises are because they are flexible, but they also have their drawbacks as they cannot provide important financial tools [
13].
[12] Tongue, 2001, part 1.p..5
[13
] Svetislav Polovina – Gjuro Sh. Mediq /Basis of eonomy, Zagreb
2002, pp. 134
The 3rd Human and Social Sciences at the Common ConferenceOctober, 5. - 9. 2015, www.hassacc.com
Law eISSN: 2453-6075, cdISSN: 1339-522X10.18638/hassacc.2015.3.1.189 - 160 - ISBN: 978-80-554-1124-8

According to some studies on the level of the European Union (EU ), small and medium enterprises play an important economic role. So at the same time they are considered as a major source of entrepreneurial ingenuity, innovation as well as employment opportunities. Or as the commissioner enterprises and industry Günter Verheuge would say : "Micro, small and medium enterprises ( SMEs) are the engine of European economy . They are an essential element of jobs, create entrepreneurial spirit and bring innovation in the EU and thus they are important for boosting competitiveness and employment " [
14]. Development of small and medium
enterprises SMEs, serves as the biggest engine for opening new places of work in the developing economies and those in transition, bringing new people into the workforce, boost tax payers as well as products and services into the local, regional and global markets.
But the impact and the number of SMEs in countries with economies in transition and in the case of countries that are judged to make a slow process of economic transition, are the lower in percentages and the employment is less dynamic.
Entrepreneurs should be motivated to develop legitimate companies and SMEs should provide the desired effects. This can be achieved only through the good business climate, because even in best business climate, most new businesses bankrupt.
Therefore, an unfavorable environment with high taxes, corruption and oppressive bureaucracy of hindering even more opportunities for a successful business. To be lasting and successful new businesses, according to the legislation of direct support they should be offered a relief to market access, finance, education, land, technology and other support services, which will be help for new enterprises to cope more easily with the same competitive market and be developed.
VI. CONCLUSIONS
We can conclude that foreign direct investments constitute an important axis in the country's development path.
The transition from one system to another and facing multiple disadvantages on the one hand and modern orders imperative to development , need to be more competitive , in turn, constitutes a necessity of attracting foreign direct investment genuine , during which they found place .
Fighting corruption through codes of ethics, laws on denunciation, simpler administration and with less bureaucracy.
Legislative stability of the country, one A key factor for attracting foreign investment , which guarantees investments and investors.
[14] Günter Verheugen, Member of the Europe commission responsible
enterprise and industry
REFERENCES
[1] Salihu Vjollca - Foreign direct investment in Kosovo, their role and impact on economic development, International Conference, 27-29 .03.2015, Dubrovnik, Croatia ;
[2] Mustafa Isa " Financial management " Riinvest Prishtina , Prishtina , 2008, pp.153 ;
[3] Smaka Riza , The business rights , Illyria Royal University, Prishtina, 2007, pp.262;
[4] Vjosa & Lulaj Enkeleda Hajdari , own foreign direct investment and tourism industry in the municipality of Ulcinj and the countries of the region . 04/05/2013 International Conference , Ulcinj , Montenegro;
[5] The Balkans: Foreign Direct Investment and EU Accession, ARIStIdIS BItZENIS , University of Macedonia, Greece pp.16,;
[6] Salihu Vjollca, Kosovo's economy opportunity or challenge for foreign investors . 04/05/2013 International Conference , Ulcinj, Montenegro;
[8] Berisha Skender, International Economics, University of Prishtina , Prishtina, 2002, pp. 244;
[9] Regulation Nr.2001/3; http://www.unmikonline.org/regulations/unmikgazette/03albanian/A2001regs/RA2001_03.pdf;
[10] CBK Central Bank Report 2013, http://www.bqk-kos.org/repository/docs/2014/BQK-RV-Shqip-2013.pdf;
[12] Tongue, 2001, part 1.pp.5;
[13] Svetislav Polovina – Gjuro Sh. Mediq /Basis of eonomy, Zagreb 2002, pp. 134;
[14] Günter Verheugen, Member of the Europe commission responsible enterprise and industry
The 3rd Human and Social Sciences at the Common ConferenceOctober, 5. - 9. 2015, www.hassacc.com
Law eISSN: 2453-6075, cdISSN: 1339-522X10.18638/hassacc.2015.3.1.189 - 161 - ISBN: 978-80-554-1124-8

Strategy Development in Latvian Trade Unions:
Leaders’ Assessment
Antra Line
Riga Teacher Training and Educational Management Academy
Imantas 7.linija -1, Riga, Latvia, LV-1083
Abstract – The paper analyses the theoretical and practical
aspects of strategy development in trade unions. The aim of the
paper is to reveal the strategy development aspects in the trade
unions of Latvia, their topicality and problems, evaluating the
information about the process in which the strategy is developed
in these organizations. The tasks of the paper: to analyse the
scientific literature about the stages of strategy development in
trade unions discussing the importance of their values, mission,
vision and goals; to conduct the analysis of the results of the
empirical research to arrive at conclusions about the strategy
development practice in Latvian trade unions. The theoretical
and methodological basis of the research was designed using the
scientific literature published in the United States of America, as
well as Canada, Australia and the European Union state and the
findings of the interviews with trade union leaders. The
qualitative research method has been applied to the empirical
research: semi-structured interviews. The paper concludes that
the practice of strategy development in Latvian trade unions
needs to be improved.
Key words: trade unions, strategy, strategy development,
strategic management, goals, values
I. INTRODUCTION
Effective operation of trade unions is significant in the development of any democratic country. It is exactly the effectiveness of trade unions that often helps to maintain a rather high democracy level in the country. The problem regarding the trend of reduction in the number of trade union members in the Baltic countries, the Check Republic, Poland and other parts of Europe has already been in the scope of theoreticians and practitioners for several years [13]. The effectiveness of trade unions is affected by changes in the external environment that create new challenges; therefore, for Latvian trade unions to survive and improve in the modern changing environment they should develop new management methods.
Topicality of the research problem: In literature sources about managing trade unions it is possible to find researchers’ opinion about the fact that in recent years several trade unions have started to integrate the strategic planning principles and techniques elaborated in management practice in their operations. Applying these approaches, trade unions have discovered that the approaches allow them to adapt to the changing environment. Since 1990, the number of international trade unions that design strategic plans and operate according to them has increased. However, still in the trade unions of the USA, Great Britain and Australia strategic plans are not
frequently used at both national and industry level [22]. In the present situation, as the statements [5] of European Trade Union Confederation indicate, trade unions need strategic planning in order to maintain and develop these organizations and to facilitate corporate social responsibility.
Research subject: strategy development in Latvian trade unions.
Aim of the research is to analyse the opinion of Latvian trade union leaders about strategy development in these organizations.
Tasks of the research: to analyse scientific literature about the stages of strategy development in trade unions discussing the importance of their values, mission, vision and goals, to conduct the analysis of the results of the empirical research to arrive at conclusions about the strategy development practice in Latvian trade unions.
II. METHODOLOGY AND METHODS
Methods applied in the research: theoretical research method: analysis of scientific literature and empirical research method: surveying Latvian trade union leaders applying structured interviews. The interviews were audio recorded, then they were transcribed – qualitative transformation of the results in a printed form; based on the transcript information, a qualitative content analysis was performed.
Research methodology: the scientific literature published in the United States of America, as well as in Canada, Australia and the European Union states and the results of the interviews with the leaders of Latvian trade unions. Interviews were held with 12 experts (60% of the Free Trade Union Confederation of Latvia member organisations) who are Latvian top level branch trade union leaders and whose trade unions represent different economic sectors. The average age of the experts is 55, 4 years, and the average leader work experience is 12, 7 years.
Analysis of the research results. One of the first scientists that characterised a trade union as an organization were British researchers J.Child, R.Loveridge and M.Warner in the sixties of the previous century. To date, comprehensive scientific research has not been conducted in this field, incl. the fact that strategy development aspects have been little considered. This issue has been analysed by T.Hannigan, D.Weil, W. Holley, K. Jenning, R. Wolter and K. Stratton Devine. The research has been mainly done in the trade unions of the USA, Canada and Australia. At the end of the nineties of the previous century, the
The 3rd Human and Social Sciences at the Common ConferenceOctober, 5. - 9. 2015, www.hassacc.com
Political science eISSN: 2453-6075, cdISSN: 1339-522X10.18638/hassacc.2015.3.1.164 - 162 - ISBN: 978-80-554-1124-8

scientist M. Gardner admitted that the strategy of trade unions is a plan or a method for attaining goals [7].K. Stratton Devine admitted that in trade unions a critical attention should be paid to planning and that trade unions should be aware of the theoretical viewpoints of strategic planning because it helps to react effectively to the changes in the external environment [21]. Strategic management can be considered a mix of management decisions and operations that determines the long-term operation of the organization and comprises the analysis of the internal and the external environment of the organization, strategic planning, defining, evaluation and control [20]. According to Johnson, Scholes, Whittington [12], strategic management is ensuring of the interaction of three complex basic elements: strategic position, strategic alternatives and strategy implementation. However, strategic management can also be looked upon as art, because experience and intuition also have significance in strategic decision making [11]. Several scientists, like V. Vroom, P. Yetton, B. Wooldridge and S. Floyd, have paid attention to the fact that member participation leads to a higher involvement level and understanding of the decisions [20]. As the structure and essence of trade unions envisages the possibility of a high level of member participation in strategy development, when strategy development teams are created, it is possible to improve the members’ level of understanding about the strategic position of the organization and to raise the members’ motivation to involve in the strategy implementation [14]. Research testifies about the usefulness of teamwork as both an approach and a tool in the management of trade unions [16]. Researchers of trade unions consider that teamwork approach facilitates a clearer, more understandable communication with the members.
To analyse the strategy development theories in more detail, the author of the paper has summarised the opinions of the most recognized theoreticians about this aspect of trade union management.
TABLE I. COMPARISON OF THE STRATEGY DEVELOPMENT THEORIES IN
TRADE UNIONS
Strategy
development
aspects
Authors
W. Holley, K.
Jenning and R.
Wolter
D.Weil T.Hanigan
Mission
development
Envisaged Not envisaged Envisaged
Vision
development
Not envisaged Not envisaged Envisaged
Defining of
values
Not envisaged Not envisaged Not envisaged
Setting goals Envisaged Envisaged Envisaged
Analysis of the
external
environment
It is recommended
to analyse the
employers’
practice;
employment trends in the
industry; political
and legal environment;
image of the trade
union.
It is
recommended to
analyse the
economic
environment, technology and
political
environment, public opinion
about the trade
union.
It is
recommended
to analyse the
economic and
social environment,
technologies,
the political environment,
employers’
practice and other trade
unions.
Source: author’s complete [8;10;21].
The table illustrates that theoreticians W. Holley, K. Jenning and R. Wolter draft the strategic direction only with the help of the mission, but the vision and values are not defined [10]. The approach of T. Hanigan provides the presence of a mission and a vision and depicts strategic planning as a process of the development of the continuous and single plans [8]. Whereas, D. Weil has envisaged only defining goals and the analysis of the external environment [21]. Likewise, it can be observed that the above mentioned authors have not paid attention to the aspects of value definition in trade unions, whereas the author of the paper would like to emphasise the importance of values. Values are moral principles or the major conviction. The values of an enterprise can act as its driving force providing flexibility by encouraging creativity [9] as well as managing the ethical dimension [6]. It is exactly the values on which the standards of behaviour, attitude and decision making set in the organization are based [15, 9]. The author of the paper considers that the core values defined by other non-governmental organizations can also applied to the strategy development of trade unions [3], values which include, for example, public mindedness, comprehensive viewpoint, responsibility, accountability, truthfulness.
According to the opinion of the researchers of trade unions W. Holley, K. Jenning and R. Wolter, strategy development in trade unions comprises the following steps: defining the mission; analysis of the external environment, which envisages the analysis of the political and legal environment, the labour market, the specific industry and the employer, as well as the assessment of the image of the trade union; defining long-term and short-term goals; strategy development, which ensures attainment of the long-term goals of the trade union and the growth of the trade union as an organization [10].
Goals are defined as the desirable outcomes of the organization’s operation. They divide the defined mission in separate, specific, particular, objectives that should be met in a particular period. In this context the leader’s interests, knowledge and experience are also important as the basic conditions for reality perception in order to define problems and identify alternatives for further action [18]. According to the opinion of theoreticians Caune, Dzedonis [4] goals should correspond several requirements – they should be: specific and measurable; they should specifically state the accountability and terms of execution; achievable, ambitious, but realistic in order to motivate employees to attain them; flexible – it is possible that due to the impact of the organizational environment a need to correct or change them will appear. Considering the goals of trade unions, T. Hanigan emphasises that they are the basis for tasks, they should be measurable, realistic to be achieved, flexible, understandable and motivating. Setting the goals, the previous outcomes of the operation of trade unions and the experience of using resources should be taken into consideration.
According to the approach of Baret [2]; Allison and, Kaye [4], organizations should determine not only the vision in its regular understanding, but also the external vision which reflects what the public benefits will be in case the goals of the organizations are attained. According to the opinion of the author of the paper, Latvian trade unions should use this aspect,
The 3rd Human and Social Sciences at the Common ConferenceOctober, 5. - 9. 2015, www.hassacc.com
Political science eISSN: 2453-6075, cdISSN: 1339-522X10.18638/hassacc.2015.3.1.164 - 163 - ISBN: 978-80-554-1124-8

because in this country the fact that a large part of society still remembers the trade unions of soviet times and therefore are sceptical and also feel dislike to contemporary trade unions is very essential.
III. DATA DESCRIPTION
Empirical analysis. Experts’ opinion about whether unions need a certain
operational strategy. Nine experts have admitted that the strategic basis (priority
organizational operational directions) should be determined. They should not be specific, but general. One of the interviewed leaders reveals that in the union that he manages specific and measurable goals are defined. Whereas, three union leaders admit that there is no need for defining the operational strategy. Such an opinion is justified by saying that, “Operational outcomes do not depend on the strategy but on the management’s attitude to unions”; “Strategic goals change under the influence of time and situation, therefore there is no need to define them”.
Information about the way in which the interviewed trade unions design the priority directions of operations. Four out of nine leaders make decisions themselves about the priority directions of the organization. The leaders have chosen such a practice because “… members consider that the leader knows better what goals have to be set and completely trust the leader in this matter”; “The leader defines strategic goals on the basis of the ones of the European partnership union because considers these goals suitable and trusts this organization”.
Experts’ opinion about the usefulness of designing a strategy development team.
The strategy development groups are not formed because the leaders do not have experience in establishing such groups. Two experts consider that it is impossible to design strategy development teams in their unions because of the following reasons: “… people are much overloaded, often they cannot find time for the union activities, therefore we do not do that not to unnecessarily burden our people”; “The strategy development team cannot be formed because the education level and competencies of chairpersons are too low for them to work in such a team successfully”. Only one of the twelve unions has a strategy development team. International strategic management experts are also invited to work in it.
Experts’ opinions whether trade unions need to define values, mission and vision.
Only in two trade unions values, mission and vision are defined. One of these trade unions regularly revisits these aspects when preparing for the congress and they have defined a vision where their members want to see the trade union in 2020. Four key words have been used to determine the strategic direction: motivation; quality, legal protection and effectiveness. Whereas, ten trade unions have not defined the values, mission and vision. Such a practice is explained by saying that, “Values, mission and vision should be defined by the national level trade union, we are more down to earth”; “The trade union operates as an ambulance, therefore it is not important”; “It is expressed through our operations, but we do not write it down on the paper”; “We have not had time to define, we have only discussed it a little”. However, almost all
trade union leaders admit that it would be important to explain to society that its benefits will be if trade unions attain their goals, thus admitting the importance of the external vision. Leaders of two trade unions admit that it is not necessary to define values in the trade unions they manage “… because it is more important to defend people …”, at the same time agreeing with all the other respondents who consider that the base value of trade unions is their members, for example, “… our value is the employees of the industry; we want the employees to receive a decent salary so that they could support their family and educate their children”; “Members are the base value. The more members there are, the stronger the trade union”; “Our members are a value.”
The information provided by the leaders about the goals set by trade unions.
Most of the respondents mention ensuring the increase of the number of members or the social dialogue at the enterprise level as the most essential goal. It is admitted that “Goals are very specific, measurable. It is not difficult to measure how many members have left, how many have joined, how many collective agreements have been signed and improved.”, “The basic goal is to unite the maximum number of members in the trade union.”, “The number of members can be counted, but, in total, it can be stated how effectively we are working.”, “… there are also such goals that are not measurable …, because I cannot count how many consultations I give on employment rights or other legal issues, therefore in the report I write that numerous consultations have been provided.”
Assessment of the external environment of trade unions, according to the leaders.
In general, leaders evaluate the external environment as unfavourable and admit that the operation of trade unions is affected most strongly by the neoliberal political environment; the microeconomic situation of the country; the poor understanding of the journalists about the specifics of the trade union operations, bias and negativity in the assessments, as well as the critical public opinion about these organizations. Based on these considerations, leaders admit that because of the impact of these factors, it is getting more and more complicated to manage a trade union. Despite this viewpoint, a systematic analysis of the external environment is conducted only in one of the interviewed trade unions.
IV. CONCLUSIONS
1. The results of the interviews reveal that a specific operational strategy has been defined in one of the 12 interviewed trade unions of Latvia. In the other trade unions, only generally defined priority directions for operation are determined. It indicates to an insufficient understanding of trade union leaders about the importance of a particular strategic vision in trade unions.
2. The practice of strategic decision making reveals that when determining the priority directions of the organization’s operation, the semi-consultative model dominates in the trade unions of Latvia.
3. To date, the leaders of trade unions have not understood the benefits created by teamwork opportunities and focused on the creation of strategy development teams;
The 3rd Human and Social Sciences at the Common ConferenceOctober, 5. - 9. 2015, www.hassacc.com
Political science eISSN: 2453-6075, cdISSN: 1339-522X10.18638/hassacc.2015.3.1.164 - 164 - ISBN: 978-80-554-1124-8

thus, it can be concluded that the practice of involving members in strategy development needs to be improved.
4. All respondents consider that the base value of trade unions is their members, but it has not been recorded in written form – only two trade unions have defined their values, mission and vision. The leaders of trade unions admit that it would be important to explain to society, what its benefits will be if the trade union attains its goals, thus admitting the importance of external vision in these organizations.
5. Specific and measurable goals are defined in one out of 12 trade unions of Latvia, which indicates to an insufficient understand of the trade union leaders about the theoretical aspects and importance of strategic goals in trade unions.
6. Despite the conclusion that due to the impact of the external environment it is getting more complicated to manage a trade union, a systematic analysis of the external environment is conducted in only one of the interviewed trade unions.
7. In total, the results of the interviews indicate that strategy development in Latvian trade unions is precluded by the lack of human resources and leaders’ knowledge about the theoretical viewpoints of the strategy design. When these drawbacks are eliminated, the improvement of the strategy development practice in Latvian trade unions can be started.
REFERENCES
[1] Allison, M., Kaye, J. Strategic planning for nonprofit organizations: A practical guide and workbook. USA: John Wiley&Sons, Incorporated,2005, pp. 87-105
[2] Barret R. Building a Values-Driven Organization. Routledge, New York, 2013, pp. 227
[3] Boas, K. ( 2014, September, 03) Nonprofit: Defining core values. Available online at http://www.thesustainablengo.org/general-management-skills/nonprofit-defining-core-values
[4] Caune, J., Dzedons, A. Stratēģiskā vadīšana. Rīga: Lidojošā zivs, 2009, pp. 386
[5] Corporate Social Responsibility - Union Thinking on the EU Strategy 2011-2014 for Corporate Social Responsibility, Available online at http://www.etuc.org/sites/www.etuc.org/files/CES-Brochure_RSE-Uk.pdf.
[6] Fritzsche D. J., Oz E. Personal values’ influence on the ethical dimension of decision making// Journal of Business Ethics, 75, 335-343, 2007
[7] Gahan, P. Union strategy: a conceptual framework. Sydney: University of New South Wales, 1998, pp.35
[8] Hannigan, T. Managing tomorrow’s high - performance unions. London: Quorum Books, 1998, 301
[9] Hoag, B., Coope, C. L. Managing Value-Based Organizations: It's Not What You Think. Northampton Massachusetts: Edward Elgar Publishing, 2006, pp. 305
[10] Holley, W. H., Jenning, K. M., Wolter, R. S. The Labor Relation Process. (10 th ed.). South Western: Cengage Learning, 2011, pp.720
[11] Jeff, C.Strategic management. London: Sage Publicions, 2008, pp. 223
[12] Johnson G., Scholes K, Whittington R., Exploring Corporate Strategy: Text and Cases. Financial Times/ Prentice Hall, 2005, pp.1072
[13] Kohl, H., Where Do Trade Unions Stand Today in Eastern Europe? Stock-taking After EU Enlargement. Frederich-Ebert-Stiftung, International Trade Union Cooperation, Global Trade Union Program, Briefing Paper, 2008
[14] Lawlor, T., Rigby, M., Smith, R. European Trade Unions: Change and Response. London: Routledge, 2005, pp. 235
[15] Morden, T. Principles of strategic management. Burlington: Asgate Publishing Company, 2007, pp. 640
[16] Murakami, T. Trade Union Strategy and Teamwork: The British and German Car Industry. Labor Studies Journal, 24(4), 35-52, 2000
[17] Ortiz, L., Lorente - Galera, F. Two failed attempts and one success: The introduction of teamwork at SEAT–Volkswagen. In John J. Lawler, Greg Hundley (Eds). The Global Diffusion of Human Resource Practices: Institutional and Cultural Limits (Advances in International Management, Volume 21) Emerald Group Publishing Limited, 59 – 87, 2008
[18] Pfeffer J., Salancik G. R.The External Control of Organizations. A Resource Dependence Perspective. - Stanford: Stanford University Press, 2003, pp.300.
[19] Roberto, M. Strategic Decision-Making Processes: Beyond the Efficiency-Consensus Trade-Off. Group & Organization Management, 2004, pp. 29: 625.
[20] Sekhar, S. G. Business policy and strategic management. New Delhi: Intenational Publishing House, 2010 pp.571
[21] Stratton Devine, K., Reshef, Y. Union Planning: A Framework and Research Agenda. In: Relations Industrielles/Industrial Relations, 51(3), 506-523, 1996.
[22] Weil, D. A. Strategic Planning for Labor Unions. New York: Lexington Books, 1994, pp. 319
[23] Weil, D. A. Strategic Choice Framework for Union Decision Making. The Journal of Labor and Society, Vol. 8, No. 3, pp. 327-334, 2005
The 3rd Human and Social Sciences at the Common ConferenceOctober, 5. - 9. 2015, www.hassacc.com
Political science eISSN: 2453-6075, cdISSN: 1339-522X10.18638/hassacc.2015.3.1.164 - 165 - ISBN: 978-80-554-1124-8

Exploring the political economics of microfinance A case study of Uganda (East-Africa), 2000-2005
Oliver Schmidt
School of Business and Management Studies
Mountains of the Moon University (MMU)
Fort Portal, Uganda
Abstract— In the late 1990s and early 2000s, Uganda was widely
recognised among development agencies and microfinance
practitioners for its market-building approach to microfinance
policy. However, the same government all but abandoned that
approach in the middle of the decade.
This paper studies the two fundamentally different microfinance
policy regimes that GoU has been pursuing before and after
2005. It explores the reversal of policy direction, drawing on
political economics. It finds that the shift of policy direction
served the objectives of Uganda’s politicians to maintain political
power, as it offered them an avenue to create loyalty through
patronage. MF special interest groups – particularly development
agencies – had chosen a strategy based on information and
financial contributions that failed to incite politicians and to
maintain univocal support from technocrats and MF
practitioners.
No paper is known to the author that has sought to analyse the
political economics of the microfinance sector; although it is
inevitably an important topic of conversation among
practitioners. This paper, based on a qualitative exploration,
offers such an analysis and invites researchers to study this angle
of the microfinance sector further.
Keywords— Political Economics, microfinance, policy, East-
Africa, special interest groups, market-building, interventionist
policy
I. INTRODUCTION
Microfinance (MF) has been high on international the development agenda. Microcredit is found to address information assymmetries between lenders and borrowers and hence expand the market frontier of banking [45]; MF describes the provision of various financial services to low-income unbanked households, in particular savings, since rigorous studies have found little impact of microcredit but significant impact of access to savings on developmental characteristics [46]. However, reviewing evidence for Sub-Sahara-Africa specifically, [50] question positive impact of both micro-credit and savings.
In East Africa, development agencies have supported technically and financially governments and central banks in drawing policies and regulations for Microfinance Institutions (MFIs) since the 1990s. Between 1999 and 2005, Uganda gained international recognition for an MF policy that was centred on integrating the microfinance market into the financial sector. In particular, it incited non-government
organisation-MFIs to transform into central-bank-supervised and deposit-taking MFIs. Around 2006, Uganda’s neighbours Kenya and Tanzania enacted comparable legislative frameworks. Regarding savings and credit cooperatives, Tanzania and Kenya had created tiered regulations in 2003 and 2008 respectively, while the same is still being discussed in Uganda [1] [2].
1
Some authors have considered the 'political economy' that shapes incentives and power-relations between micro-lenders and borrowers, and the relation between microfinance and the capitalist economic system [47] [48]. However, the author only knows of two other papers which explore effects of the political system and its processes on public microfinance policy: [51] describes the attempt to enact a deposit-taking MFI-bill in India; [52] discusses the relationship between Grameen Bank and the Government of Bangladesh. This state of academic as well as practitioners' documentation is in marked contrast to development practitioners' emphasize that they seek to engage policy makers for ‘building favorable policy and regulatory frameworks’ [4].
In 2005, Uganda’s government chose to reverse the direction of its MF policy. Yet, it had thus far been thought of as ‘state-of-the art’ by development agencies; having been shaped by some widely acknowledged members of the MF practitioner community. That shift of direction has neither been studied comprehensively by development agencies nor by scholars. The objective of this paper is twofold:
The first objective is to present the case of Uganda’s MF policy and its making in the 2000s and the shift of direction in the middle of that period. It consolidates for the first time the contemporary microfinance policy processes in Uganda, which in this period - and because of the outcomes of these policy processes -
1 It In Tanzania, the threshold for savings and credit cooperatives to be
regulated by the central bank is a deposit portfolio of Tanzanian Shillings 800
million (approx. Euro 387,000) [1]. In Kenya, financial coops that offer daily liable deposits must be licensed by the Savings and Credit Cooperate Societies
Regulatory Authority and comply with its prudential regulation (among others
minimum capital of Kshs 10 million [approx. Euro 82,000]; capital adequacy requirements, and compulsory deposit insurance). Other financial coops can
only offer deposits liable at 60 days notice. The Regulatory Authority is a
semi-autonomous institution, closely linked to the central bank as well as to the Ministry of Cooperative Development and Marketing [2]. In Uganda, the
discussion about financial coop regulations leans towards the Kenyan
framework, which would be placed under the purview of Ministry of Finance [3].
The 3rd Human and Social Sciences at the Common ConferenceOctober, 5. - 9. 2015, www.hassacc.com
Political science eISSN: 2453-6075, cdISSN: 1339-522X10.18638/hassacc.2015.3.1.177 - 166 - ISBN: 978-80-554-1124-8

was considered as a 'model' by the international development community.
The second objective is to suggest an exploratory political economics-framework which draws on political economics, characterised by [44] as 'new political economy'. It hopes to motivate more comprehensive and more quantitative research into policy processes that, on the one hand, aim to shape the financial infrastructure available to the world's low-income-households, and that, on the other hand, hold lessons for practices of development cooperation and ultimately development as well as political economics.
The remainder of the paper is organised as follows. Section II outlines the theoretical framework. Section III presents the case of Uganda’s MF policy since 1999, and its shift of direction in 2005. Section IV interprets Uganda’s MF policymaking through the political-economy-framework. It highlights how politicians, technocrats and MF special interest groups weighed their resources for influencing policy. While the latter relied on generation and provision of information, the former relied on financial and loyalty prospects. Section V concludes with an overview of limitations of this study and potential for future research directions.
II. THE PERSPECTIVE OF POLITICAL ECONOMICS
A. Introduction
Political economics studies 'important issues that arise in the policy sphere' [44]. Policy making can be analysed with a two-stage principal-agent-framework. The electorate is the principal that chooses politicians as its agents; politicians are principals who work through technocrats as their agents [5][6] [7]. Principal-agent-relationships are shaped by political and social institutions. These form the regime or ‘the rules of the game’ ([8], p.3).
B. Policy-makers and policy-making
Politicians are usually modeled as agents who pursue political power. Political economy models vary with regard to the motives for political power as well as the means to pursue it. In any case it is realistic to assume, smart to presume, and justified to support the view that politicians pursue their own objectives and that these objectives differ from those of the citizen [5] [9].
Special interest groups are defined broadly as any subset of voters who share concerned characteristics, or beliefs and interests [10]. Special interest groups have a wide array of means to influence policy-making from the first draft until implementation [7] [11]. Policy-making entails generating, enacting and implementing of policies [9].
Policies are generated by politicians, technocrats or special interest groups. Each of them may (co-)author a platform, or a draft policy, or a bill. However, politicians and technocrats do not do so as individuals, but as agents of a broader interest. ‘In modern democracies, a politician is a spokesman for some broad-based opinion, and what he or she hopes to become is the holder of an office’ ([12], p. 64). When it comes to enacting and implementation of policy, political office holders rely on
the technocrats employed by those offices.2
Analogous to politicians, technocrats pursue their own objectives. The landmark model of Niskanen ([13] quoted by [9]) suggests it to be maximization of budgets at the technocrat’s disposal.
3
C. Policy-making strategies
Politicians, technocrats and special interest groups choose different strategies to steer through those policy proposals that are closest to their objectives, and to fend off those policy proposals that conflict with their objectives. These strategies may be classified by the resources drawn on, including information, finance, and loyalty.
Information-based policy-making strategies seek to generate and provide knowledge about the contents and expected effects of the policy. If policy-makers are well informed, they may be comfortable to act upon that information. However, the tasks of gathering and vetting information are costly. Therefore, policy-makers must decide which portion of their budget to allocate to the information tasks. Special Interest groups bear the cost of information to signal its credibility to politicians and technocrats [10].
Politicians and technocrats seek information from special interest groups who have tacit knowledge of the respective policy issue. ‘While such lobbying typically reduces the uncertainty facing a policymaker, it cannot eliminate it entirely. Importantly, in most cases, the sharing of information is beneficial to both the policymaker and the interest group. Even when two groups with disparate preferences lobby a policymaker, each group gains relatively to the outcome that would result from an uniformed policy choice’ ([10], p. 138).
4
Under the two-stage principal-agent framework, the same conclusion would apply to the interaction between politicians and technocrats with regard to tacit knowledge of administrative procedures.
From the above concludes that no policy-maker has the financial or technical capacity to reduce information uncertainty to zero. That means that information is always incomplete. Politicians, technocrats and special interest groups, then, must choose which level of incompleteness of information is acceptable to them. Different academic fields suggest different approaches to that choice. Rational choice theory suggests risk management based on probability-based models. Behavioural theory suggests, based on models of human cognition that most people rely on heuristics and framing of selective information. ‘Story-telling’ composes thus
2 The route of enacting a political platform or policy proposal into law
usually includes a number of milestones. Those include a policy paper by an agency, for example the central bank; a cabinet paper, that is a pronouncement
by politicians (the members of cabinet); tabling a bill to parliament, usually a
privilege by members of the legislative and of the executive; and parliamentary consultation which usually does not only involve members of
parliament but also openly or covertly special interest groups. 3 Technocrats are involved in achieving each milestone. The ultimate
‘gate-keepers’ are politicians who hold the according offices. They are the
only ones to take binding decisions on cabinet papers, or tabling of bills, or
acts of parliament, or authority to technocrats to take action on or under a policy enacted.
4 [10] model in mathematical detail how politicians or technocrats (which
they subsume under ‘policymakers’) and special interest groups interact over information and information uncertainty.
The 3rd Human and Social Sciences at the Common ConferenceOctober, 5. - 9. 2015, www.hassacc.com
Political science eISSN: 2453-6075, cdISSN: 1339-522X10.18638/hassacc.2015.3.1.177 - 167 - ISBN: 978-80-554-1124-8

selected, incomplete information into a seemingly comprehensive narrative [14] [15]. Due to limitation of space, this paper discusses information-based strategies under the axiomatic assumption that uncertainty of information is negligible towards the outcomes of policy-making. The exploration of policy-making strategies based on incomplete information has to be left to a future paper.
Finance-based policy-making strategies involve offering financial incentives in exchange for support to a given policy proposal. Politicians may request financial contributions for their election campaigns. It has been shown that special interest groups signal their preferences by paying voluntarily before a policy issue arises [10]. Politicians could also impose access costs on special interest groups who wish to present their issues. Technocrats may expect political office holders to allocate increased budgets to them in return for smooth processing of a given policy. They may administratively delay policies that imply reductions of their budgets [16]. Technocrats are usually legally prohibited from accepting direct financial contributions from special interest groups. However, they can accept indirect expansion of their budgets, for example financing of departmental retreats and business trips. Special interest groups often include allocation of funding into the policy proposals they advocate for. Thus, enacting and implementing of their policy proposals is regularly linked to financial flows to the special interest groups.
Loyalty-based policy-making strategies rely on people who have the right to vote on the policy or whose role is to take its formulation forward. It also relies on people who have the capacity to mobilise opposition or criticism against proposed policies but refrain from doing so. Thus, the political power of a politician depends on loyalty by people [17]. However, it is important to note that loyalty to a policy and loyalty to a politician are different from each other. They may or may not be aligned. Political loyalty may be offered based on issues, performance, and identity [18]. Politicians generate loyalty through patronage, social capital or the use of aggression.
Patronage is the exchange of offices or finance in exchange for support; it could also take the form of exchanging support for one policy for support for another policy.
5 E. g. [20]
suggest that rewarding loyalty through patronage is more important for consolidating power than financial incentives.
Social capital emerges from a shared interest or from a shared identity. Shared interests or identity can create a network within which information and other transaction costs are reduced [21]. By emphasising shared interests and identity, for example of rural or young populations or of people with the same ethnicity [18], politicians seek to invoke a bond with those sections of the electorate. It can be ‘capitalised’ as loyal voting behaviour, whereby the politician is elected regardless of the policies he pursues.
Finally, loyalty can also be generated by intimidating opponents or rigging ballots. Other aggressive methods to generate loyalty include assassination, riots and guerrilla activity [18]. Use of aggression characterises semiauthoritarian or authoritarian regimes.
5 This is called ‘logrolling’ in public-choice-literature [19].
III. MAKING MICROFINANCE POLICY IN UGANDA
A. Uganda’s political regime since 1986
Uganda, alongside Kenya, Rwanda and 21 other African countries has been characterised as a hybrid regime of semiauthoritarian nature while Tanzania has been categorized as semidemocratic [22]. ‘Hybrid regimes (both their semi-democratic and semiauthoritarian variants) are neither liberal democracies nor autocratic regimes; rather, they are situated along a spectrum, in between these two types’ ([22], p. 9).
The hybrid political system of Uganda was establishe in 1986 under the leadership of Yoweri Museveni. Mr. Museveni had led the ‘National Resistance Movement (NRM)’ through guerrilla activity against Uganda’s authoritarian regimes of the 1970s and 1980s [23]. Mr. Museveni has been president of Uganda since 1986; the NRM has ruled with an absolute majority since. Accordingly, Uganda’s politicians have mostly emerged from the NRM – and even the majority of those in the opposition are former protégés of the NRM. With 50 percent of the population aged fifteen years and below, generational change takes place among the lower ranks of politicians.
B. Uganda’s economic policies between 1986 and 1999
With regard to its macro-economic management, the NRM-led government had leaned towards interventionism in its early years. Since the first half of the 1990s it shifted its focus towards market-building [24]. This shift was inspired by World Bank and IMF and led to the emergence of a strong technocracy in the central bank (Bank of Uganda – BoU) [25] [26]. In 1992, it brought about the creation of the ministry of finance, planning and economic development (MoFPED) which was the result of a merger of the ministries of finance and of planning; the latter had been established in the 1960s [25].
Unlike its macro-economic policy, the micro-economic policies of the NRM-led government remained mixed, with both interventionist and market-building approaches. This is borne out by Uganda’s financial sector policies. Thus between 1988 and 1994, the government pursued direct credit provision through the country’s largest and government-owned bank [27]. But the 1990s saw a phase of liberal licensing which led to an increase in the number of regulated financial institutions [28].
6 However, over the same period the government pursued
three schemes for directed credit, two of which were administered through ministerial and local government offices [3] [27].
At the end of the 1990s, Uganda’s regulated segment of the financial sector fell into a crisis that culminated in the closure of four commercial banks and demise of the largest and government-owned bank. In the aftermath of those events, the central bank consolidated its position as the sole supervisor of financial institutions; technocrats of ministry of finance lost their stake in that budget [25] [26]. At about the same time, the
6 [28] record an increase from seven to 23 financial institutions regulated
by the central bank. These are recognized in three categories; commercial
banks, credit institutions and deposit-taking MFIs which all provide retail
credit and/or savings and/or payment services; according to the scope of their license. Their licenses also require different amounts minimum capital.
The 3rd Human and Social Sciences at the Common ConferenceOctober, 5. - 9. 2015, www.hassacc.com
Political science eISSN: 2453-6075, cdISSN: 1339-522X10.18638/hassacc.2015.3.1.177 - 168 - ISBN: 978-80-554-1124-8

government’s credit schemes failed due to poor administration and high default rates [27].
C. A market-building MF policy regime from 1999 to 2005
Uganda’s market-building MF policy was based on a 1999 policy paper by the BoU [3]. It followed a comprehensive campaign of NGO-activists and development technocrats and led to the microfinance deposit-taking institutions-act in 2003 [11]. Most of these NGOs used compulsory savings as part of their lending model although some of them mobilized voluntary savings. However, they were legally prohibited from accepting deposits; that is savings from the public to be intermediated into loans. Savings and credit cooperatives, on the other hand, are allowed to intermediate savings from their members (but not the public) into loans for their members.
Development technocrats were involved in both shaping the growth of MFI operations and in influencing the development of related policy of the central bank and ministry of finance. Table 1 presents the building blocks and institutions that embedded Uganda’s market-building MF policy.
TABLE I. BUILDING BLOCKS OF UGANDA’S MARKET-BUILDING MF
POLICY
Item Type Year Role
Core Docu-
ments
Policy Paper
1999a ‘supported the view of microfinance as a line of business
and foresaw the initiation and
creation of a four tiered financial structure’ ([3], p. 40)
Cabinet
Paper
1999 basically adopted the policy paper
which had been authored by BoU
MF Regulation
Bill
2000 based on its policy paper, BoU produced this draft bill which was
widely debated at AMFIU, in the
MF Forum and in parliament
Cabinet
Statement
2001 ‘it [Government of Uganda] had
pulled out of direct delivery of
financial services and would concentrate on improving the
operational environment (policy
regime) for private sector institutions to do the business’
([3], p. 41)
MF Depo-sit-taking
Institutions
(MDI) Bill
2003 emerged from the discussions between 2000 and 2003, when it
was enacted by parliament
MDI-
regulations
2004 The MDI-act authorised BoU to
implement the regulation of
MDIs, for which they stipulated
regulations about licensing, reporting and performance
requirements of the MDIs. MDI-
licenses have been given on the basis of these regulations5
Orga-
nisa-tions
BoU Foun-
ded in 1966
authored the MF policy paper and
the MF Regulation Bill; licenses and supervises MDIs
MoFPED Foun-
ded in
1992
authored the MF cabinet paper
and the cabinet statement that
supported a market-building direction; steered bill through
parliament towards its being
passed as MDI-Act; oversaw administrative unit that
coordinated MF Outreach Plan
Association
of MFIs in
Uganda
(AMFIU)
Foun-
ded in
1996
with active support of
development technocrats, this
member-based organisation
became a major platform of the
campaign for a change of the regulatory framework in Uganda
MF
Support
Centre Limited
(MSCL)
Foun-
ded in
2003
replaced earlier schemes through
which government had directed
credit; mandated to advance wholesale loans to MFIs by
business performance principles,
though at subsidized lending rates
Frame
works
MF Forum Foun-
ded in
1998
a consultancy mechanism for
debating and refining policy in
which development technocrats were prominently involved
MF
Outreach
Plan
Foun-
ded in
2002
‘a strategic plan for expanding the
outreach of Micro-finance into
the rural areas [...] multi-
donor/government plan [...] based
on [...] increased efficiency,
commercial viability and market development for capacity
building services’ ([28], p.13)
a. There is an inconsistency in AMFIU’s publications about the year of the BoU and cabinet policy
papers. [31], which was edited based on discussion with a number of development practitioners who
were present at the time in question, records it for the year 2000. [3] records it for the year 1999.
Sources: [3] [11] [28] [29] [30] [40].
D. An interventionist MF policy regime since 2005
In the run-up to the 2006-parliamentary and presidential elections, NRM endorsed a platform of ‘Bonna Bagagawale’ (Prosperity for all). The minister of state in charge of microfinance (2005 to 2009), Caleb Akandwanaho
7 was a
leading protagonist of that platform and had his technocrats draw an MF policy of an interventionist spirit [32]. Based on this framework, the government intended to channel all MF funds into the formation of ‘one savings and credit cooperative per sub-county’. Table 2 gives the building blocks and institutions that embed the interventionist policy. By June 2011, the Ugandan government supported 735 financial coops nation-wide financially and technically [33].
TABLE II. BUILDING BLOCKS OF UGANDA’S INTERVENTIONIST MF
POLICY
Item Type Year Role
Core
Do-cu-
ments
Manifesto
of the NRM in
the
presidential and par-
liamentary elections
2006 A multi-faceted development agenda
for ‘Bonna Bagagawale’(Prosperity for All), it endorses an interventionist
economic policy; perceives
microfinance as a ‘social service’ that should be available to every citizen;
describes government’s role in microfinance provision as ‘creating
and building a nationwide network of
rural financial infrastructure’
MF policy 2005 ‘translated’ objectives of ‘Bonna Bagagawale’ into guidelines for
government policy; focus on
financial coops and the objective of forming ‘one financial coop per sub-
county’
Orga- MoFPED Foun- authored the MF policy paper that
7 Retired General Caleb Akandwanaho, popularly known as Salim Saleh,
is a younger brother of Uganda’s President Yoweri K. Museveni. He was
among the military leaders of the guerrilla activity that Mr. Museveni led in the 1970s and 1980s.
The 3rd Human and Social Sciences at the Common ConferenceOctober, 5. - 9. 2015, www.hassacc.com
Political science eISSN: 2453-6075, cdISSN: 1339-522X10.18638/hassacc.2015.3.1.177 - 169 - ISBN: 978-80-554-1124-8

nisa-
tions
ded in
1992
supported an interventionist
direction; drafted an MF regulation
bill that would bring SACCOs under
its purview; oversees administrative
unit that coordinates RFSP
Uganda Credit and
Savings
Coope-rative
Union
Foun-ded in
1972
formally a member-based organisation, government through
financial and personnel intervention
shaped it to be the main implementing agency of RFSP;
spearheads the formation of ‘one
financial coop per sub-county’; supports young coops with physical
assets, staff salary subsidies and
trainings
MF
Support
Centre (MSCL)
Foun-
ded in
2003
The government shifted the criteria
of MSCL lending from business
performance towards political-administrative (financial coops,
including young and inexperienced
ones); also included Farmers’ Marketing Cooperatives into the
MSCL target group; set up an
agricultural credit facility with an annual interest rate of 9 per cent,
which requires SACCOs to retail
agricultural credit at not more than 13 per cent annually
Fra-
me-works
The Rural
Financial Services
Program
(RFSP)
Foun-
ded in 2007
replaced the MF Outreach Plan; the
coordinating unit for the interventionist policy, administering
government funds to the cooperative
union and its member-SACCOs
Sources: [3] [32] [34] [35] [36]
IV. EXPLAINING UGANDA’S MICROFINANCE
POLICY MAKING
A. Objectives of Uganda’s MF policy makers
1) Politicians In terms of winning elections, Uganda’s ruling party and its
politicians have been overwhelmingly successful. They won all national election since 1986 at a substantial margin. Their MF policy has added to that record in two main ways.
First, during the presidential and parliamentary election campaign of 2001, the market-building MF policy distanced the government from the failures of its directed credit schemes as well as from the failure of financial institutions. Furthermore, the process of implementing a market-building MF policy required the active involvement of development agencies, through AMFIU (see table 1) and through the MF Forum. This was appreciated by the development agencies who described it as ‘best practice’ [30].
Second, the presidential and parliamentary election campaigns of 2006 and 2011 were won by mobilising rural and first-time voters who constitute the majority of Ugandans. The interventionist MF policy appealed to these voters because it raised their expectations for a quick and tangible access to finance in the form of financial coop-loans. Moreover, young voters could hardly remember the failed directed credit schemes of the 1990s and were eager for the opportunities promised by ‘Bonna Bagagawale’.
2) Technocrats
The market-building MF policy served the interest of technocrats both at BoU and at MoFPED. BoU technocrats defended their consolidated role through pro-actively taking up the MF topic. At the same time, they were cautious to avoid the responsibility of supervising a large number of MFIs and financial coops. Indeed, the technocrats were aware that they would not be able to effectively supervise all of them. In the 1990s, they had experienced rapid growth in the number of financial institutions outpacing the central bank’s supervision capacity. This had been a factor in the banking crisis at the end of that decade [26].
Meanwhile, technocrats in the ministry of finance expected their profile and budgets to rise with the growing number of development agencies. In 2005, ministry technocrats might not have been convinced of the new direction. On the one hand, they had professionally embraced the Rutherford and Robinson paradigms (see IV.B.1). On the other hand, the interventionist policy increased the influence of politicians over spending decisions, as opposed to MF budgets being largely controlled by technocrats. This became particularly visible in the MF Support Centre Ltd (see table 2), where a politician became chairperson of the board of directors and assumed managerial roles.
However, ministry technocrats knew that the central bank had expanded its staffing when its supervision function was strengthened with international funding. central bank technocrats through their cautious approach towards licensing MFIs
8 had signaled that they were not interested in taking
responsibility for the vast number of non-regulated MFIs. Therefore, ministry technocrats could assume that the change of MF policy would hand more staffing to them. This reasoning is borne out by the financial coop-regulation bill that they have since drafted and promoted.
9
However, that bill removes financial coops from the oversight of the Ministry for Tourism, Trade and Industries. This ministry is responsible for the registration and, nominally, supervision of all cooperatives. Supported by cooperative activists, the technocrats of the Ministry for Tourism, Trade and Industries have since agitated for policies that delay the tabling of the ministry of finance coop-regulation bills in cabinet.
Central bank-technocrats had hitherto been among the most critical of the new policy, and their resistance altered some of the elements included in the earlier proposal. These had concerned the role of government-owned Postbank, a central
8 Between 2004 and 2014, the central bank issued six licenses to MFIs;
three to ‘spin-offs’* of international NGOs (FINCA, Uganda Finance Trust**, and Entrepreneurship Finance Centre), one to an NGO-turned-company*
founded by a Ugandan and an US-American entrepreneur (Uganda
Microfinance Limited**), one to the ‘spin-off’* of a government project which had initially been funded by USAID (PRIDE MF), and one to the ‘spin-
off’* of a Ugandan NGO (UGAFODE).
* The deposit-taking MFI-act requires the legal status of a company limited by shares; therefore NGOs had to transform to that legal status. All
licensed MFIs maintained, except for minor adjustments, the names of the
NGOs they had been. ** Uganda MF Limited was taken over by Kenya Commercial Bank in
2008. Finance Trust changed its regulatory status into a commercial bank in
2013. 9 See footnote 1.
The 3rd Human and Social Sciences at the Common ConferenceOctober, 5. - 9. 2015, www.hassacc.com
Political science eISSN: 2453-6075, cdISSN: 1339-522X10.18638/hassacc.2015.3.1.177 - 170 - ISBN: 978-80-554-1124-8

bank-regulated financial institution. The major focus of the new policy was on coops, though, and those remain outside the realm of the central bank.
3) MF Special Interest Groups Special interest groups that advocate for MF policy in
Uganda comprise of NGO- and cooperative activists, bankers and development technocrats. Most of them supported the market-building MF policy and were critical of the interventionist approach for a number of reasons.
First, NGO-activists who work MFIs that are subsidiaries of international NGOs (four of which later transformed into licensed MFIs) were among the supporters of the market-building MF policy, because it provided them with career opportunities. For example, as the NGOs grew and transformed into licensed MFIs, salaries increased and staff were also offered many training opportunities, often abroad. Moreover, the growth of licensed MFIs opens many opportunities to their staff such as the chance to become branch or regional managers or even department heads [37]. Second, another interest group who supported the market building MF policy were bankers who joined transforming MFIs or who organised MF ‘product lines’ in regulated financial institutions. Accordingly, they supported the market-building MF policy, because it created opportunities for their business and their careers [37].
However, not all NGO-activists remained supportive of the market-building MF policy. It was becoming clear towards the middle of the decade that many NGOs would not be able to transform their MFIs, as the market space was occupied and transformation funding was reducing [3]. In NGO-MFIs that were struggling to transform or to operate self sufficiently, NGO-activists experienced increasing job insecurity and stagnating opportunities. These NGO-activists realised that the interventionist MF policy might offer them better career opportunities, for instance by joining the cooperative union that distributed government funds to financial coops, or by joining those coops. Indeed, one NGO even abandoned its legal form and registered as a financial coop.
Technocrats employed by development agencies that were subsidiaries of ‘donor countries’ were another group with interests in supporting market-oriented MF policy. At least nine bi- and multilateral development agencies supported financially and technically Uganda’s MF sector during the period of market-building. They were also active participants of the MF Forum and (some of them) have been the main funders of AMFIU. Most of them stopped that support after the shift to the interventionist MF policy.
Cooperative activists, on the other hand, have divided interests and loyalties. Those working in large and operationally self-sufficient financial coops were supporters of the market-building policy, because they did not wish politicians and government technocrats to interfere in their organisations. Members or staff of smaller coops regularly supported the interventionist policy, because it created opportunities for them. In fact, many of these small financial coops had been formed for the purpose of accessing government funding. The divide among cooperative activists is also visible at national level, were one cooperative association
is strongly opposed to the interventionist MF policy, while another is its lead implementer (table 2) [11].
B. Strategies adopted by Uganda’s MF policy-makers
1) Information-based strategies NGO-activists and development technocrats were at the
forefront of the evolution of microfinance as a knowledge field; notable are the ‘Robinson-paradigm’ and the ‘Rutherford paradigm’ The former proposed the view that MFIs should be financial service providers exclusively, rather than social service providers, or a mix of the two [38]. The latter drew on the act that until the 1990s, microfinance basically involved micro-credit only, and stressed the demand of poor people for savings [39]. This implies, amongst other things, regulation of the industry. The Robinson and Rutherford paradigms informed MF policy-making in Uganda between 1999 and 2005 [11] [40].
However, when Uganda’s parliamentarians passed the deposit-taking MFI-bill in 2003, they also passed a resolution calling for additional government interventions towards the mostly rural financial coops that were considered unlikely to transform into deposit-taking MFIs [31]. This showed that the information provided by development agencies met with skepticism of many Ugandan politicians. In other words, Ugandan politicians accorded the market building MF policy low credibility, despite the efforts of development technocrats, NGO-activists and bankers to provide supportive information.
For most Ugandan politicians, the information they had or believed to have about the merits of interventionism enjoyed higher credibility. They felt that rural outreach of microfinance in Uganda expanded very slowly,
10 and they embraced the
promise of ‘Bonna Bagagawale’ to accelerate it. Consequently, in 2005 they embraced the change of MF policy toward interventionism. It is noteworthy that the financial support of development agencies and international NGOs appears to have added little credibility of the information they provided. This observation points to the scope of finance- and loyalty-based strategies.
2) Finance-based strategies Donor countries contributed substantially to organisations
and frameworks of the market-building MF policy.11
However, most of this finance was not distributed through government agencies. It was provided to MFIs to finance expansion of their operations and their transformation into regulated financial institutions; much of it in form of technical assistance.
Also, the budgets injected into the MF sector were small compared to the financial means provided to priority interest
10 In 2006, regulated financial institutionss reached about 20 percent of
Uganda’s population; non-regulated MFIs and financial coops reached about
six percent. Between 2003 and 2007, licensed and non-licensed MFIs hardly expanded their outreach [41].
11 Between 1999 and 2003, US$ 60 million were allocated to the MF
sector [3] [30]. That equals on annual average less than two percent of foreign aid.
The 3rd Human and Social Sciences at the Common ConferenceOctober, 5. - 9. 2015, www.hassacc.com
Political science eISSN: 2453-6075, cdISSN: 1339-522X10.18638/hassacc.2015.3.1.177 - 171 - ISBN: 978-80-554-1124-8

areas of the leading donor countries. Those are security and military spending.
12
If development agencies had translated their disagreement about the reversal of MF policy direction into reduced security and military spending, it would probably have outweighed the political gains expected from that reversal. However, the NRM-government had experience with ‘trade-offs’ of security/military policy against other fields of policy [42]. They had reason to assume that the change of MF policy direction would not upset military priorities. Indeed, it did not.
13
3) Loyalty-based strategies Under the conditions of a semi-authoritarian regime,
rewarding loyalty and retaining loyalists is likely to be the most important consideration of political power [22]. Uganda’s three presidential elections since 2001 have been contested by an ‘illoyalist’; a former army officer who is also a former leading member of the ruling party [22].
Furthermore, in 2005 Uganda held the first election under a new ‘multi-party-regime’.
14 In previous elections under the
current constitution, the ruling 'movement' was the only organisational platform allowed for campaigning. All other candidates were formally independent individuals [22]. The multi-party-regime had been advocated for by international development agencies in a rather pushy way. Moreover, they were calling for reforms that would separate organisational structures of party and local government, which thus far had been de facto identical [22] [23].
That meant that the objectives of the development agencies and the interests of the ruling politicians were in strong conflict. Maintaining political power meant to steer through that conflict, and at the same time assure loyalties, either through patronage or through means of aggression. Against this backdrop, the reversal of MF policy direction sent a message both to the government’s own followers and to the international development agencies. The message was that the NRM was standing up to defend its own interests, as opposed to being ‘pushed around’. Moreover, it created alternative avenues for patronage, as funding was channeled into young, small coops which had often been created for that very purpose.
V. RECOMMENDATIONS AND CONCLUSIONS
Few approaches to development have received comparable public and academic interest as microfinance. Exemplarily for the views held by many bi- and multilateral development agencies at the time, the Nobel Prize Committee stated in 2006 that '[l]asting peace can not be achieved unless large population groups find ways in which to break out of poverty. Micro-
12 ‘Between 1990 and 2005, aid [inflows to Uganda] averaged US$ 738
million per year’ ([42], p. 47). Of this amount, annual defence spending represented about 18 percent.
13 Since 2005, aid inflows for microfinance have been shrinking, while
aid allocated to military and security has been increasing [42]. 14 Uganda had held multi-party-elections in 1962, marking independence
from colonial rule, and in 1980, marking the end of the regime of Idi Amin
Dada. However, the 1980-elections were highly disputed, ‘plunging Uganda into an anarchic civil war’ ([23], p. 238).
credit is one such means [49]'.15
A recent academic review of microfinance impact in Sub-Sahara-Africa alone found, among 383 thematically relevant reports, 69 that studied impact with some degree of rigour [50]. However, as microfinance has been scrutinized with thorough empirical methods, little of its impact, as stipulated by the Nobel Prize Committee, has been confirmed. Instead, the strongest developmental impact of microfinance lies, for the time being, in 'industry-building' [46].
Curiously, little academic attention, and neither practitioners' documentation, has been dedicated to the mechanisms of building the microfinance industries in low-income-countries in Africa, America, Asia and Europe. [48] explains microfinance industry-building from a global systemic perspective, based on quantitative data. According to him, it is an expression of 'neo-liberalism'. [47] explains it from a local household perspective, based on qualitative data. He describes incentives of MFI-staff that correspond to over-indebtedness and social pressure of micro-borrowers; which he interprets as the 'political economy' on which microfinance industries are built.
However, neither of them considers the political systems and processes that shape public policies that govern (or abstain from governing) relations between MFIs and their various stakeholders (customers, funders, staff, tax authorities, consumer protection agencies, etc). This paper is the first that consolidates the data available to describe political systems and processes that shaped microfinance policy in Uganda; a country that had been widely acclaimed a 'model' for the period of 'market-building policy' documented in this paper.
It shows that Uganda’s politicians have cultivated reservations about the market-building MF policy regime. Since 1986, they had been informed that MF was a social service that makes loans available at highly subsidised interest rates. Furthermore, they perceive licensed MFIs only a limited number of their constituents (= voters).
16 Accordingly, they
perceive the shift (return) to an interventionist MF policy regime of 2005 well warranted. This is supported by the different interpretations of the performance of the current interventionist MF policy regime. Their protagonists see it positively, e. g. because of a phase of rapid SACCO growth between 2005 and 2008, resulting in over 800,000 savers reached in 2010 [41]. And even if they see weaknesses, there is currently no political or technocratic forum to discuss them.
The analysis of Uganda’s MF policy regime in the 2000s offers insights for the provision of policy advice by development agencies and for the study of MF developments. However, the exploratory nature of this application of political-economics requires testing through further research. It points to the need for better quantitative data, and better documentation of qualitative data. The hypothesis that information is relatively low priority as compared to finance- and loyalty-based strategies needs to be explored further. Given the limitations of
15 The quote is taken from the press release that announced the award of
the 2006 Nobel Peace Prize to Mohammed Yunus and the Grameen Bank.
16 By 2010, three MDIs were growing robustly, and reached out to about
430,000 savers. The fourth MDI had over 110,000 savers in 2008, when it was taken over by a commercial bank [41].
The 3rd Human and Social Sciences at the Common ConferenceOctober, 5. - 9. 2015, www.hassacc.com
Political science eISSN: 2453-6075, cdISSN: 1339-522X10.18638/hassacc.2015.3.1.177 - 172 - ISBN: 978-80-554-1124-8

the current dataset, the effects of different objectives and strategies on policy-makers and policy outcomes cannot be established authoritatively. This indicates direction for further research, for example comprehensive interviews with those involved. Such studies would also allow exploring the role of information uncertainty, and how policy-makers deal with it. Last but not least, a systematic comparative approach would show why the MF policies in other East African countries were sequenced differently, for example regulating financial cooperatives before transforming NGOs. It could also be valuable to set up a comparative study including countries from more regions; as data e. g. for South Asia might be more comprehensively available.
The case of Uganda emphasises the relevance of gaining deeper understanding of the political economics of its making public policy - on MF or other policy fields that interact highly with development agencies - without over-generalizing perceived global trends as [48] does. This paper proposes a starting point in terms of theoretical framework and in terms of empirical material.
REFERENCES
[1] Millinga, A. 2007. ‘Microfinance Policies and Regulatory System in Tanzania – Practitioner Perspective’, Presentation at the 3rd Africa Microfinance Conference, August 2007, Kampala, www.fsdu.or.ug (web site), date accessed 3 March 2012.
[2] Wolff, P., Distler, M., Drochner, M., Meise, J., and Schmidt, D. 2011. ‘Regulation of SACCOs in Kenya – Case Study of the Country Working Group Uganda’, German Development Institute (GDI), (Bonn: unpublished).
[3] AMFIU, 2008. Uganda Microfinance Industry Assessment. Kampala: AMFIU.
[4] CGAP, 2012. Our Work – Government and Policy Available at http://www.cgap.org/p/site/c/govt/, accessed on 3 March 2012.
[5] Besley, T. 2006. Principled Agents? The Political Economy of Good Government, The Lindahl Lectures, Oxford and New York: Oxford University Press.
[6] Furubotn, E. G. and Richter, R., 1997. Institutions and Economic Theory: An Introduction to and Assessment of the New Institutional Economics.Ann Arbor: University of Michigan Press.
[7] Fritsch, M., Wein, T. And Ewers, H.-J., 1999. Marktversagen und Wirtschaftspolitik, 3rd edn, Muenchen: Franz Vahlen.
[8] North, D., 1990. Institutions, Institutional Change and Economic Performance. Cambridge, UK: Cambridge University Press.
[9] Kirsch, G., 2004. Neue Politische Oekonomie, 5th edn. Stuttgart: Lucius and Lucius.
[10] Grossman, G. M. and Helpman, E., 2001. Special Interest Politics. Cambridge, MA: MIT Press.
[11] Schmidt, O., 2011. Association – Concept, Management, Context. Saarbruecken: VDM.
[12] Minogue, K., 1995. Politics – A Very Short Introduction. Oxford and New York: Oxford University Press.
[13] Niskanen, W. A., 1975. Bureaucrats and Politicians, Journal of Law and Economics, 18.
[14] Kahneman, D., 2011. Thinking, Fast and Slow. New York: Farrar, Straus and Giroux.
[15] Akerlof, G. and Shiller R., 2009. Animal Sprits – How Human Psychology drives the Economy and Why it matters for global Capitalism. Princeton, NJ: Princeton University Press.
[16] Wintrobe, R. , 1997. Modern bureaucratic theory. In Mueller, D. C. (ed) Perspectives on Public Choice – A Handbook. Cambridge, UK: Cambridge University Press, pp. 429-454.
[17] Hirschmann, A. O., 1970. Exit, Voice and Loyalty, Responses to Decline in Firms, Organizations, and States. Cambridge, MA: Harvard University Press.
[18] Collier, P., 2009. Wars, Guns and Votes – Democracy in Dangerous Places. London: Vintage.
[19] Stratmann, T., 1997. Logrolling. In Mueller, D. C. (ed.) Perspectives on Public Choice – A Handbook. Cambridge, UK: Cambridge University Press, pp. 322-341.
[20] Langguth, G., 2009. Kohl, Schroeder, Merkel – Machtmenschen. Muenchen: DTV.
[21] Dasgupta, P., 2000. Economic Progress and the Idea of Social Capital. In Dasgupta, P. and Serageldin, I. (eds.), Social Capital – a Multifaceted Perspective. Washington D. C.: World Bank.
[22] Tripp, A. M., 2010. Museveni’s Uganda – Paradoxes of Power in a Hybrid Regime. London and Colorado: Lynne-Rienner Publishers.
[23] Meredith, M., 2006. The State of Africa – A History of Fifty Years of Independence. London: Free Press.
[24] Whitworth, A, and Williamson, T., 2010. Overview of Ugandan Economic Reform since 1986. In Kuteesa, F., Tumusiime-Mutebile, E., Whitworth, A. and Williamson, T. (eds.), Uganda’s Economic Reforms – Insider Accounts. Oxford and New York: Oxford University Press, pp. 1-34.
[25] Tumusiime-Mutebile, E., 2010. Institutional and Political Dimensions of Economic Reform. In Kuteesa, F., Tumusiime-Mutebile, E., Whitworth, A. and Williamson, T. (eds.), Uganda’s Economic Reforms – Insider Accounts. Oxford and New York: Oxford University Press, pp. 35-51.
[26] Byaruhanga, C, Henstridge, M. and Kasekende L., 2010. Exchange Rate, Fiscal, and Monetary Policy, In Kuteesa, F., Tumusiime-Mutebile, E., Whitworth, A. and Williamson, T. (eds.), Uganda’s Economic Reforms – Insider Accounts. Oxford and New York: Oxford University Press, pp. 52-88.
[27] Muhumuza, W., 2007. Credit and Reduction of Poverty in Uganda. Kampala: Fountain Publishers.
[28] Kamuhanda, R. and Tanburn, J., 2005. Making Service Markets Work for the Poor – the Experience of Uganda. Kampala: ILO and DFID.
[29] BoU, 2004. The Micro Finance Deposit-taking Institutions (Licensing) Regulations, in: Statutory Instruments Supplement No. 34 to The Uganda Gazette, No. 53, Vol. XCVII dated 15 October 2004. Entebbe: UPPC.
[30] Godwin-Groen R. Bruett, T. and Latortue, A., 2004. Uganda Microfinance Sector Effectiveness Review, Available at www.fsdu.or.ug/pdfs/Uganda_Microfinance_Sector_Review.pdf, [accessed on 22nd October 2011].
[31] AMFIU, 2005. Regulating and Strengthening tier 4 Microfinance Institutions in Uganda – Background Studies, Kampala: AMFIU.
[32] MoFPED, 2005. Microfinance Policy and Regulatory Framework in Uganda 2005-2015, Available at www.finance.go.ug/docs/Introduction_to_Microfinance_bklet.pdf, [accessed on 20th October 2011].
[33] Agabalinda, C., 2012. SACCOs - a reality check, in: BoU/PMA (eds.): Agricultural Finance Yearbook 2012, Kampala, p. 128-135.
[34] Akandwanaho, C., 2007. Strategy for Rural Financial Services, Presentation at the public expenditure review workshop, 8 May 2007. Kampala: MoFPED.
[35] RFSP (2009). Rural Financial Services Programme. In AMFIU (ed.): The Uganda Microfinance Directory 2009/10, Kampala.
[36] Schmidt, O., 2008. Finanz- und Bankenmaerkte in NiedrigEinkommenslaendern: Erfahrungen aus Uganda, Ostafrika. Wirtschaftswissenschaftliches Studium, Vol. 37, Issue 2 (2/2008), pp. 95-99.
[37] Muzigiti, G. and Schmidt, O., 2010. Careers in the Banking and Microfinance Industry in Uganda. In Karugaba, D. and Schmidt, O. (eds.), Career Perspectives in Accounting, (Micro) Finance and other Sectors, Yearbook of MMU School of Business and Management Studies, Vol. 1, Fort Portal.
[38] Robinson, M., 2001. The Microfinance Revolution – Sustainable Finance for the Poor. Washington D. C.: World Bank.
The 3rd Human and Social Sciences at the Common ConferenceOctober, 5. - 9. 2015, www.hassacc.com
Political science eISSN: 2453-6075, cdISSN: 1339-522X10.18638/hassacc.2015.3.1.177 - 173 - ISBN: 978-80-554-1124-8

[39] Rutherford, R., 1999. The Poor and their Money – An Essay about Financial Services for Poor People, Institute for Development Policy and Management. Manchester: University of Manchester.
[40] AMFIU, 2006. Ten years of AMFIU (1996-2000). Kampala: AMFIU.
[41] Schmidt, O., 2012. Microfinance in Uganda: 2012 and beyond, Presentation at Makerere University Business School’s 1st Annual Microfinance Workshop, 28 and 29 February 2012. Kampala: MUBS. Available at http://mmumf.wordpress.com (web site) [accessed on 31st May 2012].
[42] Mwenda, A., 2010. Uganda’s Politics of Foreign Aid and Violent Conflict: The Political Uses of the LRA Rebellion. In: Allen, T. and Vlassenroot K. (eds.) The Lord’s Resistance Army: Myth and Reality. London: Zed Books.
[43] The Monitor, 30th March 2015, p. 33.
[44] Besley, T. (2004), The New Political Economy, in: Proceedings of the British Academy, Vol. 131, 2004, Oxford University Press.
[45] Morduch, J. and Armedariz, B. (2010), Economics of Microfinance, 2nd edition, MIT Press.
[46] Roodman, D. (2012), Due Diligence - An impertinent Inquiry into Microfinance, Washington D. C: Brookings Institution Press.
[47] Mader, P. (2015), The Political Economy of Microfinance - Financializing Poverty, London et al: Palgrave MacMillan
[48] Bateman, M. (2010), Why Doesn’t Microfinance Work? The Destructive Rise of Local Neoliberalism. London: Zed Books.
[49] Nobel Prize Committee (2006), The Nobel Peace Prize for 2006, under: www.nobelprize.org/nobel_prizes/peace/laureates/2006/press.html, date accessed 30th Sept. 2015.
[50] Rooyen, C. van, Steward, R., De Wet, T. (2012): The Impact of Microfinance in Sub-Saharan Africa: A Systematic Review of the Evidence, in: World Development, Vol. 40, No. 11, pp. 2249–2262.
[51] Ghate, P. (2007), Regulation: The Microfinance Bill - An Opportunity being lost?, chapter 9, in: Ghate, P. (Ed.): Microfinance in India - A State of the Sector Report, 2007, New Dehli, p. 149-175.
[52] Dowla, A. (2013), Bankers to the Poor, Bother to the State — Political Risks in Microfinance, paper presented at the Third European Research Conference on Microfinance Research, Kristiansand, Norway, June 10-12 2013.
The 3rd Human and Social Sciences at the Common ConferenceOctober, 5. - 9. 2015, www.hassacc.com
Political science eISSN: 2453-6075, cdISSN: 1339-522X10.18638/hassacc.2015.3.1.177 - 174 - ISBN: 978-80-554-1124-8

The simulation of the bottom-up/top-down dialectics Through the use of descriptive tools and models
Lorenzo Cioni
Computer Science Department/University of Pisa
Scuola Normale Superiore
Pisa, Italy
Abstract— In this paper we concisely present the use of two
simulation tools for the focused analysis of one the central topics
of sociological research: the interactions between individual
behaviors and social rules. Such tools can be used to analyze such
interactions and their potentially conflicting outcomes. The
paper, after a brief discussion of some central issues, presents
two models and some comments on their meaning and usefulness.
Keywords- collective and individual behaviors, social planning,
proactive behaviors, simulation tools
I. INTRODUCTION
In this paper we present some hints for resolving the following problem: how it is possible for one or more social planners, on one hand, to devise social behaviors that are socially acceptable and accepted and, on the other hand, to encourage (indirectly or implicitly) some “good” individual behaviors and, at the same time, discourage some other “bad” individual behaviors. This double flow from a society and its composing individuals and from such individuals to the society to which they belong should be driven without the use of coercive tools but essentially through the use of side payments or through compensations if not simply through education.
The paper is based on [1] and [2] and is focused on the dialectics between a society and its composing members ([3]). This dialectics is exemplified by a top-down flow and a bottom-up flow. The former flow describes the social planning actions from the few social planners to the many members of the society for which such planners are devising norms and rules ([1], [2], [4], [5]). The latter flow describes the reactive and proactive behaviors of the individuals through which they can attain self-organizations and conflicting (with the planned ones) behaviors ([1], [2], [4], [5]).
II. THE BUILDING BLOCKS
Introduction
The proposed approach is centered on the classical dualism between a society and its members. In this paper we present the use of two descriptive simulation tools that can be used for the analysis of such a dualism whereas in [1] we presented the general framework.
In [1] we discuss in some detail also the roles that can be played by groups and coalitions (as, respectively, non disjoint or disjoint subsets of individuals). In this paper we deal only
marginally with these issues and refer, for instance, also to [6] and [7] for a deeper treatment.
A society
A society is usually seen as an entity characterized by an enduring structure and governed by norms and rules ([3], [14]) to which its members can or cannot conform. A society is made of individuals, as a forest is made of trees. At the level of the society, however, we lose sight of the individuals and their behaviors that are merged in collective behaviors, possibly with the mediation of statistical indicators such as expected values, modal values and standard deviation values. In a certain sense we can say that a society masks or hides the individuals.
The individuals
The individuals are the stakeholders of our framework. In this paper we assume they are distinct from the social planners so to simplify the treatment and avoid ever possible conflict of interests. We refer to [1] for a more thorough treatment of these issues.
The individuals are not passive members of a society but show both reactive and proactive behaviors ([1], [2], [4], [5]). Roughly speaking the behaviors are said to be of a proactive type ([1]) if they are not casual since they are driven by every individual’s free will, they are searched for so that they determine the plans of actions of an individual, they are intentional since they have aims and objectives, they are deliberate since they derive from a more or less conscious and accurate deliberation phase.
On the other hand they can be said to be of a reactive type if they occur randomly, they are not searched for, they are not intentional and they are not deliberate.
Proactive behaviors tend to produce behaviors from the bottom that spread among the individuals either as an alternative to unaccepted planned norms and rules or as a compensation for lacking norms and rules.
On the other hand reactive behaviors arise as a way to contrast unacceptable social norms proposed and, in some way, imposed by the social planners. They represent a possibly violent way to express a conscientious objection and therefore are bursts of unplanned actions. These features make their description and analysis difficult if not impossible to perform. In the present paper we assume that the models involve only proactive behaviors. For further detail we refer to [1].
The 3rd Human and Social Sciences at the Common ConferenceOctober, 5. - 9. 2015, www.hassacc.com
Other social sciences eISSN: 2453-6075, cdISSN: 1339-522X10.18638/hassacc.2015.3.1.159 - 175 - ISBN: 978-80-554-1124-8

Groups and coalitions
The dialectics between a society ad its composing individuals can be either unmediated ([3], [4], [5]) or mediated ([1], [2]). The mediation occurs through the formation of alliances and agreements among the individuals that may enforce proactive or reactive behaviors but can even favor the acceptance and the spread of norms and rules devised by the social planners. A major role in this dynamics is represented by the formation of coalitions and groups. Coalitions can be seen as competing (but also cooperating) segregated groups of individuals ([4]) whereas groups can be seen as transversal and diffuse groups of individuals ([1]).
The levels
We can therefore move at three levels: at a macrolevel ([4], [5]), at a microlevel ([1], [2], [4], [5]) and at the mesolevel ([8]). At the macrolevel we see the society but hide the individuals so that we consider only aggregate behaviors.
At the microlevel we see the individuals and their individual behaviors as well their interactions but hide the society. At this level we can consider ([1]) both bilateral (i.e. between pairs of individuals) and multilateral (i.e. among more than two individuals) interactions as well as both symmetric and asymmetric interactions depending on the fact that the individuals have the same or different strategies and payoffs ([15]). Such elements enter as features of the individuals in the models at the microlevel. A deeper treatment of these features has been performed in [1].
At the mesolevel we see coalitions ([15]) and groups so that we can examine their forming and dissolving and their reciprocal interactions and their mediation role between the society, on one side, and the individuals, on the other side.
III. THE APPROACHES AND THE TOOLS
The approaches
The treatment at the three aforesaid levels can be carried out according to various approaches ([1], [15], [16]) and precisely according to either a descriptive approach or a normative approach or a prescriptive approach.
If we use a descriptive approach ([1], [15], [16]) we move within descriptive decision theory so that the motto in this case is “what is”: we ask how the individuals do behave in certain choice or decision situations. In this case we have to raise questions about what we need to know in order to be able to predict their behaviors in such situations. If we decide to adopt a normative approach ([1], [15], [16]) we move within normative decision theory. The motto in this case is “what ought to be” so that we ask how the individuals ought to behave in certain choice or decision situations. If we decide to adopt a prescriptive approach ([1], [15], [16]) we pose strong constraints on the normative approach so that the motto in this case becomes “what must be”. The choice of one of the foregoing approaches depends on the identity and the aims of who is designing each model as it will be suggested in the models that we present in this paper.
The tools
Since this paper is devoted to the description of the bottom-up/top-down dialectics through the use of descriptive tools its focus is on two types of tools: a tool to be used at the aggregate level (or the macrolevel) and a tool to be used at the disaggregated levels (either the mesolevel or the microlevel).
The former tool allows us to implement models at the macrolevel under the paradigm of System Dynamics ([17], [19], [20]). According to this paradigm we can describe the interesting behaviors with differential equations of the first order graphically described with a metaphor of stocks and flows with conservative and informative connections. In order to implement our models according to this paradigm we used a program called Vensim ([9]).
The latter tool allows us to implement models at the mesolevel and at the microlevel under the paradigm of the agent systems ([21], [22], [23]). According to this paradigm we can describe the interesting behaviors through simple rules that drive the low level behaviors of the agents and their interactions. In order to implement our models according to this paradigm we used a program called NetLogo ([10], [18]).
IV. A MODEL AT THE MACROLEVEL
As an example of the proposed approach we present the model of Fig. 1. This model describes the interactions at the macrolevel and is based on the closed world hypothesis (no arrival and no departure of individuals) and represents the bilateral interactions among the individuals of three types. Those of type A are said to belong to a “neutral” type (for instance the citizens who perform normal waste collection), those of type B belong to a “positive” type whose behavior the social planners want to favor (for instance the citizens who perform waste recycling) whereas those of type C belong to a “negative” type (for instance the citizens who perform illegal waste dumps) whose behavior the social planners want to contrast ([11], [12]. [13]). The model of Fig. 1 describes the dynamics through a pictorial representation of differential equations like the following:
dTypeA/dt=disaffectionBA+disaffectionCA-conversionAb-conversionAC
The model describes the attractiveness of the individuals of Type B and Type C over those of Type A together with the disaffection times for the individuals of both Type B and Type C. The disaffection times are a measure of how long an individual behaves accordingly either to the “positive” or to the “negative” behavior before returning to be of the “neutral” type. In the model we also present the attractiveness of the individuals of Type C over those of Type B together with a “corrective” path from Type C to Type B. This “corrective” path represents the action of the education over the individuals of Type C with the aim of convincing them to switch their behavior from Type C to Type B. In the model the education is assumed to be effective only if it is above a given threshold otherwise it is ineffective. We note that in the model the exogenous variables (and so those without incoming arcs) represent the possible policies that the social planners can adopt in this context.
The 3rd Human and Social Sciences at the Common ConferenceOctober, 5. - 9. 2015, www.hassacc.com
Other social sciences eISSN: 2453-6075, cdISSN: 1339-522X10.18638/hassacc.2015.3.1.159 - 176 - ISBN: 978-80-554-1124-8

Figure 1. A model at the macrolevel under the closed world hypothesis
In this way we, as the social planners, can describe the bilateral interactions between individuals of three disjoint types but can also evaluate how we should act on the exogenous variables through to be devised policies (so to act from a normative or prescriptive perspective) in order to have Type B behavior as the dominant behavior possibly followed by Type A and Type C (if the disaffection times cannot be made infinite and the associated attractiveness cannot be reduced to zero).
In Fig. 2 we show the rather unrealistic case where we have attractivenessConB=0 and education=0. In this case we have that Type C is slightly more attractive than Type B over Type A and that the disaffection times of the types B and C have almost the same value. In the graphs we present also the constant value of the variable Total to underline that we are in a closed world.
Figure 2. An unrealistic case
In many cases it is not possible to avoid the attractiveness of the individuals of Type C over those of Type B. In Fig. 3 we show the effect of attractivenessConB=0.1 in absence of any form of education. In this case Type C becomes rapidly the undesired (from the social planners) dominant behavior.
Figure 3. Tpe C acctractiveness on Type B, no education
Figure 4. The use of education as a partially persuasive tool
In Fig. 4 we show how, with the use of educative policies above a given threshold, the social planers can expect to obtain that the Type B behavior becomes the dominant behavior followed, in this case, by Type C and Type A. This shows that, in order to get the desired Type B, Type A Type, C ordering, either the level of the education must be raised so to increase its incisiveness or the disaffection times must be modified so to increase the one of Type B and reduce the one of Type C or both things.
V. MODELS AT THE MICRO/MESOLEVEL (HINTS)
At both the mesolevel and the microlevel we must be able to describe the behaviors of the individuals or of the groups and coalitions. In order to attain this in [1] we used NetLogo ([10], [18]). On that occasion we presented, as an example of a model at the microlevel, the dynamics between conformists and nonconformists ([24]) and, as examples of models at the mesolevel, the effect of the presence of leaders (1), the emergence of leaders (2) and the emergence of groups (3).
In the models of type (1) we showed how the presence of leaders of two types together with a certain number of neutral agents causes the aggregation of the neutral agents in two disjoint subgroups, each subgroup corresponding to one of the types of the leaders and depending on the number of leaders of each type and on their attractiveness.
The 3rd Human and Social Sciences at the Common ConferenceOctober, 5. - 9. 2015, www.hassacc.com
Other social sciences eISSN: 2453-6075, cdISSN: 1339-522X10.18638/hassacc.2015.3.1.159 - 177 - ISBN: 978-80-554-1124-8

In the models of type (2) we examined how leaders can emerge from a set of sad agents (since they have no leader) of different colors where no leader was initially present. The emergence is governed by either an election mechanism or a promotion mechanism based on exchanges with a threshold. Agents who meet can include a leader or not. If an agent of a certain type meets a leader of the same type it joins its group and becomes happy (so to be associated to that leader forever) otherwise they exchange their endowments among agents of the same type. If, owing to these exchanges, one of the agents’ wealth exceeds its threshold it becomes a leader with that color and becomes able to associate to itself other sad agents of the same color (that therefore become happy).
In the models of type (3) we have an initial step that is identical to those of the models of type (2) but for the fact that we hide the individuals as they join a leader that gains a weight that depends on the numerosity of its group. Then we have a second step where the emerged leaders of different colors interact until we have only one leader of each color or one group for each color. In [1] we also introduced a somewhat complex model that can be used at the mesolevel to analyze the forming of both static coalitions and dynamic coalitions in an either static or dynamic environment represented by the patches from which the coalitions derive the goods that they exchange and that produce the worth for each coalition. The proposed model allows us to implement the following endless cycle:
(1) initialization phase,
(2) interactions phase (among the equivalent players),
(3) sharing of the worth (within each coalition),
(4) reporting of the worth to the individuals,
(5) [coalitions dynamics phase],
(6) go to (2).
At step (2) the equivalent players are the entities that represent each coalition or group seen as a monolithic entity whereas step (5) is only for dynamic coalitions.
VI. MACROLEVEL AND MICROLEVEL
In [1], in order to illustrate the dynamics between the macrolevel and the microlevel, we presented three models that describe three paradigmatic situations. In the first situation we dealt with we presented the interactions, at the macrolevel, between two types of populations (such as conformists and anti conformists ([24]) or cooperators and non-cooperators or doves and hawks or doves and law abiders or hawks and law abiders, [11], [12]) with the possible presence of a propensity at imitative behaviors. At the microlevel, we introduced the unexpected presence of a third population composed by the so called imitators and examined how this presence may alter the macro-behavioral expectations of the social planners. We recall how an imitator is an individual that tends to have the same behavior of the individual he is interacting with within bilateral interactions. This imitation, in many cases, does not occur deterministically so we introduced, at the microlevel, a probability of deviation that allows us to model both errors of
interpretation and misunderstandings from the imitator himself. In the second situation we dealt with we presented the extension of the previous model to three types of individuals that interact among themselves at both the macrolevel and at the microlevel with the possible intervention of imitative behaviors. In this paper we present only the third situation since it represents the counterpart, at the microlevel, of the model that we presented in Fig. 1 (at the macrolevel).
The evolution of this model is governed by the following exogenous variables:
- the effectivenessAB variable that defines the effectiveness
of the bilateral interactions between the Type A and the Type B;
- the effectivenessAC variable that defines the effectiveness
of the bilateral interactions between the Type A and the Type C;
- the initial_typeA variable that defines the initial numerousness of the Type A;
- the initial_typeB variable that defines the initial numerousness of the Type B;
- the initial_typeC variable that defines the initial numerousness of the Type C ;
- the disaffect? variable that assumes values in the set {yes, no} and that defines either the presence or the absence of the
disaffection mechanisms;
- the disaffection_time_typeB variable that defines the
average time of disaffection for the agents of the Type B;
- the disaffection_time_typeC variable that defines the
average time of disaffection for the agents of the Type C;
- the number_of_steps variable that defines the average mobility of the agents;
- the attractivenessConB variable that defines the effect of
attraction of the agents of Type C on those of Type B;
- the education variable that defines the educative pressure on the agents of Type C so to have them become of Type B and that depends on the value of a threshold endogenous local (to each individual) variable. In this case we do not define any threshold exogenous and global variable since such a variable should have a statistical meaning and has no role at the level of the individuals.
Figure 5. Part of the NetLogo interface of thethree types model
The 3rd Human and Social Sciences at the Common ConferenceOctober, 5. - 9. 2015, www.hassacc.com
Other social sciences eISSN: 2453-6075, cdISSN: 1339-522X10.18638/hassacc.2015.3.1.159 - 178 - ISBN: 978-80-554-1124-8

As to the simulations, we can start with the so called standard situation in which the aforesaid parameters assume the following values:
effectivenessAB = 0.57
effectivenessAC = 0.37
initial_typeA = 1000
initial_typeB = 22
initial_typeC = 23
disaffection_time_typeB = 82
disaffection_time_typeC = 90
attractivenessConB = 0
education = 0
In this case we get the behaviors of Fig. 6 where the behavior of Type C is due to the lower value of effectivenessAC. If we put, other things being equal, effectivenessAC=0.69 we get the behaviors of Fig. 7 where we get the opposite behaviors for Type B and Type C.
Figure 6. The behavior in the standard situation
Figure 7. The behaviors with the first variation
The behaviors of Fig. 7 are very similar to the behaviors of Fig. 3. If, other things being equal, we put
effectivenessAB = effectivenessAC = 0.50
disaffection_time_typeB = disaffection_ time_typeC = 100
we get the stable coexisting behaviors of Fig. 8 (akin to those of Fig. 2) with a possibly unacceptable percentage of Type C behavior.
Figure 8. The behaviors with the second variation
We can introduce now the bilateral direct interactions between the individuals of Type B with those of Type C so that we start again with the standard situation in which we modify the parameter attractivenessConB so it assumes the following value:
attractivenessConB = 0.20
In this way we get the behaviors of Fig. 9 (akin to those of Fig. 3) where we have that Type C becomes rapidly the dominating behavior. If we want to contrast this we can resort to education. In order to get this we can define a modification of the standard situation so to modify the values of the parameters as follows:
effectivenessAB = effectivenessAC = 0.50
initial_typeA = 1000
initial_typeB = 22
initial_typeC = 23
disaffection_time_typeB = disaffection_time_typeC = 100
attractivenessConB = 0.49
education = 0.90
In this way we get the behaviors of Fig. 10 (akin to those of Fig. 4) where we have that Type A decreases less sharply than in the previous cases until it stabilizes at a low level, in this case equal almost to zero; Type B increases to a maximum and then it stabilizes at an almost constant value; Type C remains at an almost constant low value and, lastly, Type B >> Type C. From the foregoing graphs we derive a good agreement with the behaviors we got from the corresponding graphs of the model at the macrolevel and so a good agreement from the descriptive and the normative points of view since these models can be used each one from each perspective or approach, normative the former and descriptive the latter.
The 3rd Human and Social Sciences at the Common ConferenceOctober, 5. - 9. 2015, www.hassacc.com
Other social sciences eISSN: 2453-6075, cdISSN: 1339-522X10.18638/hassacc.2015.3.1.159 - 179 - ISBN: 978-80-554-1124-8

Figure 9. The presence of attractivenessConB > 0
Figure 10. The presence also of education > 0
From this we can derive a good agreement between the two (both normative and descriptive) approaches and also that, if the social planners are able to implement the proper educative policies (an hard issue by itself), they can expect to contrast the undesired behavior of the Type C individuals so to obtain a society where a majority of individuals is of the preferred Type B with a small, physiological, minority of Type A individuals and an even smaller minority of Type C individuals.
VII. CONCLUSIONS
The paper has presented the use of two tools for the analysis of the possibly mediated interactions between individual and collective behaviors according to three possible approaches. Such interactions have been shown with a model that describes three interacting types of individuals at two levels. The study needs surely further both theoretical and empirical investigations that include the development of other models to describe other interactions modes but seems promising.
ACKNOWLEDGMENT
The author wishes to thank Professor Giorgio Gallo of the Computer Department of the University of Pisa for his being a constant incentive at doing at any step always better that at the previous steps.
REFERENCES
[1] L. Cioni, Top-down and bottom-up interactions between individual and collective behaviors, PhD dissertation in Mathematical Engineering and Simulation, University of Genoa, 2013.
[2] L. Cioni, “Interacting paradigms for modeling social interactions”, “Advances in Business Management”, Towards Systemic Approach, 3rd Business systems Laboratory International Symposium, Perugia - January 21-23, 2015, abstract published oh the Book of Abstracts, pages 39-40, E-ISBN: 9788890824227.
[3] C. Bicchieri, The Grammar of Society. The Nature and Dynamics of Social Norms, Cambridge University Press, 2006.
[4] T. C. Schelling, Micromotives and Macrobehaviors, W. W. Norton, 1978.
[5] T. C. Schelling, Ethics, Law, and the Exercise of Self-Command, University of Michigan, The Tanner Lectures on Human Values, 1982.
[6] M. Olson. The Logic of Collective Action. Public Goods and the Theory of Groups, Cambridge, Mass, Harvard University Press, 1971.
[7] J. A. M. Vennix. Group Model Building. Facilitating Team Learning Using System Dynamics. John Wiley and Sons, 1996.
[8] W. J. Mc Connell and E. F. Moran, editors, Meeting in the Middle: The Challenge of Meso-Level Integration, LUCC Report Series No. 5, 2000, An International Workshop, October 17-20, 2000, Ispra, Italy.
[9] Vensim PLE User’s Guide. Ventana Systems Inc., 5th edition, 2007.
[10] NetLogo 5.0.1 User Manual. NetLogo, 2012. Available as https://ccl.northwestern.edu/netlogo/docs/NetLogo%20User%20Manual.pdf.
[11] G. Nigel and R. Conte, editors, Artificial Societies. The Computer Simulation of Social Life, Taylor & Francis e-Library, 2005.
[12] G. Nigel and K. G. Troitzsch, Simulation for the Social Scientist, Open University Press, 1999.
[13] H. Ulrich and G.J.B. Probst, editors, Self-Organization and Management of Social Systems, Springer-Verlag, 1984.
[14] P. Sites. Control: the basis of social order. Dunellen Publishing Co.,1973.
[15] R. B. Myerson. Game Theory. Analysis of conflict. Harvard University Press, 1991.
[16] A. Rapoport. Decision Theory and Decision Behaviour. Normative and Descriptive Approaches. Kluver Academic Publishers, 1989.
[17] B. Richmond. An Introduction to Systems Thinking. High performance systems, Inc., 2001.
[18] J. M. Vidal. Multiagent Systems with NetLogo Examples. Jos´e M. Vidal, 2007.
[19] E. F. Wolsetnholme. System Enquiry. A System Dynamics Approach. John Wiley & Sons, 1990.
[20] Hans G. Daellenbach. Systems and decision making. A management science approach. John Wiley & Sons, 1994.
[21] N. Vlassis. A Concise Introduction to Multiagent Systems and Distributed Artificial Intelligence. Morgan and Claypool, 2007.
[22] G. Weiss, editor. MultiAgent Systems. A Modern Approach to Distributed Artificial Intelligence. MIT Press, 2001.
[23] M. Wooldridge. An Introduction to MultiAgent Systems. John Wiley and Sons, 2002.
[24] A. Sen, Collective Choice and Social Welfare, Holden-Day, 1970.
The 3rd Human and Social Sciences at the Common ConferenceOctober, 5. - 9. 2015, www.hassacc.com
Other social sciences eISSN: 2453-6075, cdISSN: 1339-522X10.18638/hassacc.2015.3.1.159 - 180 - ISBN: 978-80-554-1124-8

Pottery finds from survey of Apice territory: first
results
Assunta Campi
Department of Architecture and Industrial Design
Seconda Università di Napoli, Aversa, Italy
Abstract - This article provides information about the pottery
found during the first archaeological surveys conducted in a part
of the eastern territory of Benevento, in the specific case the area
falling in the town district of Apice. This territory is affected by
the passage of the Via Appia. Through the study of the territory,
in its preliminary stages, we have been identified 6 archaeological
unknown sites. The pottery found permits to outline the various
stages of life that affected this region over the centuries; the study
of potsherds provides important data on the setting of this area
(affected by the passage of the Calore river) from Prehistory to
the Modern Age. Important data regarding the population in
Late Antiquity: it is attested at least until the sixth century AD
the continuity of life of some rural settlements (villas, farms) that
were important stages of frequentation between the Republican
Age and the Imperial Age. The presence of many settlements
arisen in the middle valley of the Calore river since prehistoric
times up to modern times demonstrates the importance that had
the river in the development of the population and in the
settlement evolution.
Keywords- archaeology, history, ancient pottery, Late Antiquity,
cultural landscape
Figure 1. Apice, “Ponte Rotto” locality. Sites discovered in surveys.
I. INTRODUCTION
The study of ceramic materials presented in this article is the result of systematic surveys carried out on the territory falling in the town district of Apice in the province of Benevento. In the specific case the surveys were carried out in "Ponte Rotto" locality. The area of the surface surveys, where were found and identified numerous potsherds, is the land strip along the Calore river which also preserves the remains of the
“Ponte Appiano” (also known as “Ponte Rotto”) built in 123 A.D. under the Emperor Hadrian.
The surveys of this territory were conducted with the use of typical methods of research of ancient and medieval topography; it was found that these methods (direct study of the territory, maps and aerial photos analysis, toponyms study, study of archaeological materials, etc...) used in territorial sector may help to increase knowledge, in terms of history and archaeology, of that territory by about 90%.
This study is also part of the researches of post-classical archeology that for about thirty years are conducted in the archaeological contexts of Campania inland [1]. These studies have made significant data concerning forms of the population and the changes in the settlement system of the Roman period.
The information of the surface surveys carried out in neighboring territories [2] are very important to understand the settlement dynamics of Calore middle valley. For the understanding of the settlement history of the territory of Apice have been fundamental archaeological researches conducted in the near fortified hilltop village of Montegiove (Miscano valley), structured between Late Antiquity and the Early Middle Ages [3].
The archaeological research in Montegiove is complemented by topographic and systematic surveys, whose purpose is an accurate reconstruction of the settlement dynamics between the Late Antiquity and the Middle Ages; the contribution of the topographical and archaeological knowledge was applied in Irpinia (province of Avellino) where, in the activities of ten stratigraphic excavations took place in the castles of Montella [4], Rocca San Felice [5], Torelladei Lombardi [6], Sant'Angelodei Lombardi [7], Monteforte Irpino [8] and Ariano Irpino [9] as well as in religious buildings like the church of Frigento [10], were complemented by activities of archaeological survey in territorial neighboring compartments.
All materials found were quantified, classified (through special forms called “RA”), drawn, compared, interpreted and dated; the data obtained from this study thus permit to speculate dating the sites identified during the surveys.
All sites until now identified have been placed on IGM maps identified by geographic coordinates (longitude and latitude). The reference map used is made up of the official maps of the Italian State edited by Military Geographic Institute of Florence; for the territory covered by the study were taken into account the sheet 173 Benevento scale 1:
The 3rd Human and Social Sciences at the Common ConferenceOctober, 5. - 9. 2015, www.hassacc.com
History and Archaeology eISSN: 2453-6075, cdISSN: 1339-522X10.18638/hassacc.2015.3.1.171 - 181 - ISBN: 978-80-554-1124-8

100,000 made in 1957; the sheet 174 Ariano Irpino scale 1,100,000 made in 1962; tablets 173 II-NE Apice built in 1957 and 174 III-NO Bonito made in 1955 and the regional technical maps in scale 1.5000. This study will lead to the creation of an archaeological map with all the evidence of the area being studied.
II. SITES
In this article we present the data from the study of ceramic materials found in the sites identified in the "Ponte Rotto" locality located in the floodplain and on the hills overlooking the Calore river. These sites, called "Site 3" - "Site 4" - "Site 5" - "Site 6", have returned pottery dating from the prehistoric and the early modern period (Fig.1).
The material identified (they are especially walls) was selected on the basis of the morphological aspects identifiable to a careful examination of the artifacts to obtain data concerning the type, function, and therefore the exact date of the same.
Below is presented the tabs of classification of the identified sites and the classification, for historical reference period, of the materials documented and subject to detailed graphic and photographic documentation.
Site 3. Apice, Ponte Rotto (IGM 1:25.000, 173 II-NE Apice e 174 III-NO Bonito)
Late-repubblican Age; Imperial Age; Late Antiquity Age; Modern Age
Villa
The site 3 (41 ° 05 '09.06' 'N, 14 ° 55' 50 69 '' E) is located 136.33 meters from the ruins of the “Ponte Appiano”; at the time of surveys this area showed excellent visibility due to the recent plowing for the planting of cereals. In a land strip of about 114x116 meters survey’s activities revealed a dispersion of archaeological material very fragmented. A lot of potsherds were found: this fragments belong to the classes of black glazed pottery, African Terra Sigillata, coarse ware and painted ware. Fragments of metal objects were found. The presence of these wares types and fragmented tiles and bricks could suggest the existence of a roman villa probably founded in the Late-republican Age and that continued to be used in the Imperial Age and in Late Antiquity. In figure 2 a and b are the artefacts found at the site 3. In figure 4 is are the artefacts found at the site 3.
LATE ANTIQUITY AGE
Red slip ware 1. Pot lobed handle with orange clay (5YR 6/8 reddish
yellow) with quartz and limestone inclusions. The artifact, realized with potter’s wheel, has a maximum height of 3,2 centimeters. Traces of red slip are on external surface.
MODERN AGE
Cooking glazed ware 1. Cooking pot with ovoid body and flat base; it is
characterized by a red-orange kneading (5YR 7/8 reddish yellow) which has a lot of inclusions. The pot is realized with potter’s wheel; it has a diameter of 8 centimeters and it has a
maximum height of 3,2 centimeters. This cooking pot has a glazed coating on internal surface (Fig. 2a).
White glazed ware 1. Big dish with horizontal rim which is characterized by a
purified clay (2.5YR 6/3light reddish brown); the kneading has limestone inclusions. The dish is realized with potter’s wheel; it has a diameter of 14 centimeters and it has a maximum height of 3,2 centimeters. A white glazed coating (2.5R 8/1white) covers both surfaces (Fig. 2b).
Site 4. Apice, Ponte Rotto (IGM 1:25.000, 173 II-NE Apice e 174 III-NO Bonito)
Archaic Age; Imperial Age; Late Antiquity Age; Modern Age
Villa
Site 4 (41 ° 05 '14. 94' 'N, 14 ° 56' 11 74 '' E) is located at approximately 284.73 meters from Roman infrastructure (“Ponte Appiano”) and along the route of the road SP28. The area was characterized, at the time of the surveys, by land uncultivated. The survey reveals a high concentration of potterysherds identified in a land strip of 150x30 meters. Fragments of tiles and bricks were also found. Pottery finds are mainly dated to the Imperial Age and the Late Antiquity (coarse ware, cooking ware, African terra sigillata). Prehistoric and Archaic ceramics were also discovered. The agricultural exploitation that interested this area in the Modern Age is demonstrated by the presence of glazed ware. Figure 2 c, d, e, f, g, shows the artifacts found at the site 3. In figure 5 there are the artifacts found at the site 4.
LATE ANTIQUITY AGE
Red slip ware 1. Little horizontal rim on straight and slightly convex body
which belongs to a medium size bowl; it’s characterized by a pink purified clay (7.5YR 6/4 light brown). The artifact, realized with potter’s wheel, has a diameter of 10 centimeters and it has a maximum height of 1,3 centimeters. This bowl has red slip’s traces on external surface. The artifact is similar in morphology to different bowls dating to fifth-sixth century A.D. and found in archaeological contexts near Naples [11], ancient Capua [12] and Benevento [13] (Fig. 2g).
Coarse ware 1. Straight rim with rounded edge lapped by a small curb
probably belong to a jug with orange clay (10R 6/8 pale red); the kneading has a lot of inclusions. The pot is realized with potter’s wheel; it has a not definable diameter and it has a maximum height of 2,9 centimeters. The pot is similar in morphology to a late sixth-early seventh century A.D. pitcher discovered in the archaeological of Carminiello ai Mannesi, Naples [11] (Fig. 2g).
2. Rounded rim probably belonging to a bowl which has a grey clay (5YR 5/1 gray) with quartz inclusions. The pot, realized with potter’s wheel, has a diameter of 8 centimeters and it has a maximum height of 0,8 centimeters. The bowl may be a local imitation of African terra sigillata Hayes 50b and Hayes 64 bowl types [14] dating to fifth century A.D. these imitations are common in Late Antiquity rural sites of southern
The 3rd Human and Social Sciences at the Common ConferenceOctober, 5. - 9. 2015, www.hassacc.com
History and Archaeology eISSN: 2453-6075, cdISSN: 1339-522X10.18638/hassacc.2015.3.1.171 - 182 - ISBN: 978-80-554-1124-8

Italy: similar imitations were found in the nearby Miscano valley [15]. Everted rim with rounded edge probably belongs to a bowl ; purified pink kneading (5YR 7/4pink) with limestone inclusions. The bowl is realized with potter’s wheel; it has a diameter of 16 centimeters and it has a maximum height of 2 centimeters (Fig. 2f).
Cooking ware 1. Little pot handle realized with an orange clay (5YR 6/8
reddish yellow); the kneading ha a lot of inclusions (limestone, quartz, sand grains).
Figure 2. Potsherds from site 3 and site 4.
African terra sigillata 1.Little cylindrical handle which is characterized by a
groove which crosses the entire surface; this handle belongs to a little pot which is characterized by pink clay (10R 7/6 pale red) with quartz inclusions. The artifact, realized with potter’s wheel, has a maximum height of 1,7 centimeters and it has a thickness of 1 centimeter. The fragment has a damaged slip that covers only the external surface; the slip has an orange-red tonality (2.5YR 7/6 light red) (Fig. 2c).
MODERN AGE
Glazed ware 1. Large horizontal rim on slightly convex body which
belongs to a dish with pink clay (5YR 7/3 pink) and purified kneading. The dish, realized with potter’s wheel, has a diameter of 22 centimeters and it has a maximum height of 2,4 centimeters. This fragment is characterized by a thin layer of white glaze (5YR 8/1 white) that covers the entire internal surface and part of external surface. It also has a polychrome decoration on the internal surface; this decoration represents a stylized flower characterized by green, brown, blue and yellow leaves and petals. The artifact is similar to a dish found in the neighboring territory of Buonalbergo [16] (Fig. 2e).
Site 5. Apice, Ponte Rotto (IGM 1:25.000, 173 II-NE Apice e 174 III-NO Bonito.)
Imperial Age; Late Antiquity Age
Farm/ little rural settlement
The site 5 (41 ° 05 '15. 13' 'N, 14 ° 56' 20 13 '' E) is located approximately 317.86 meters from the structures of the bridge on the via Appia; at the time of the surveys the ground was plowed and the visibility was excellent. In a land strip of 180,39x50,99 meters the survey led to the discovery of an
archaeological findings area characterized by a lot of potsherds; in this archaeological site there were pots belonging to coarse ware, cooking wares and painted wares. In this area, where there was probably a farm or a little rural settlement, we have been found a lot of very fragmentary bricks and tiles. In figure 3 a, b and c are the artefacts found at the site 3. In figure 6 there are the artefacts found at the site 5.
IMPERIAL AGE
Coarse ware 1. Slightly everted rim with a small part of the body; the
potsherd is characterized by a groove located under the rim. The artifact, probably a bowl, has a red purified kneading (2.5YR 5/1 reddish gray) with quartz and limestone inclusions. The bowl, realized with potter’s wheel, has a maximum height of 1,9 centimeters and it has a thickness of 1 centimeter (Fig. 3c).
LATE ANTIQUITY AGE
Cooking ware 1. Casserole with large horizontal rim with rounded edge;
this pot has a kneading with a lot of inclusions (quartz, limestone). Most of these inclusions were deliberately added to ceramic kneading by ancient potters to withstand the high temperatures. The clay is orange (7.5YR 6/3 light brown). The casserole is realized with potter’s wheel and it has a maximum height of 1,9 centimeters and a thickness of 3,4 centimeters. The shape of this pot is very common among Italian coarse ware dated to sixth-seventh century [17] (Fig. 3a).
2. Pot’s lid with rounded rim; the artifact has a red kneading (2.5YR 6/6 light red) with a lot of inclusions. This lid is realized with potter’s wheel and it has a maximum height of 1,2 centimeters and a thickness of 0,7 centimeters (Fig. 3b).
Site 6. Apice, Ponte Rotto (IGM 1:25.000, 173 II-NE Apice e 174 III-NO Bonito.)
Prehistoric Age, Imperial Age, Late Antiquity Age, Modern Age
Farm/ little rural settlement
The site 6 (41 ° 05 '20. 89' 'N, 14 ° 56' 15 74 98 '' E) is located approximately 415.31 meters from the ruins of the “Ponte Appiano” and it’s characterized by uncultivated land. In a land strip of 221,58x186,86 meters the survey led to the discovery of an archaeological findings area characterized by a lot of potsherds. Pottery finds of this site belong to the classes of coarse ware, coking ware, glazed ware with blue decorations and prehistoric flint’s shards relates to toolmaking and to stone processing. the area is characterized by the presence of fragments of brick and building materials (stone blocks). Figure 3 d, e and f shows the artifacts found at the site 3. In figure 7 there are the artifacts found at the site 6.
IMPERIAL AGE
Coarse ware 1. Casserole with flat bases and ovoid body; this artifact
had a light red clay (2.5YR 6/2pale red) and limestone inclusions. The pot was realized with potter’s wheel; it has a
The 3rd Human and Social Sciences at the Common ConferenceOctober, 5. - 9. 2015, www.hassacc.com
History and Archaeology eISSN: 2453-6075, cdISSN: 1339-522X10.18638/hassacc.2015.3.1.171 - 183 - ISBN: 978-80-554-1124-8

diameter of 12 centimeters and it has a maximum height of 3,6 centimeters (Fig. 3d).
LATE ANTIQUITY AGE
Red slip ware 1. Jar with flat bases and light red purified kneading
(2.5YR 6/6 reddish yellow). The artifact was realized with potter’s wheel; the pot has a diameter of 22 centimeters and it has a maximum height of 3,3 centimeters. It also has red slip on external surface (Fig. 3f).
MODERN AGE
Glazed ware with blue decorations 1. Rounded rim probably belongs to a medium size bowl
with light red clay (2.5YR 7/4 light reddish brown); the kneading has quartz inclusions. the pot has a diameter of 24 centimeters and it has a maximum height of 2 centimeters. The pot, realized with potter’s wheel, has a white glazed coating (5YR 8/1 white) which covers both surfaces (5YR 8/1 white). A geometric decoration, realized with blue pigment, characterized the whole internal surface (Fig. 3e).
Figure 3. Potsherds from site 5 and site 6.
III. CONCLUSION
The ceramics found in the sites identified in the "Ponte Rotto" locality while conducting reconnaissance relate to a wide historical period from prehistory to the modern age. These artifacts are not only a source of primary interest for the understanding of the material culture of a given era and civilization that produced them but also enable to outline the forms and methods of settlement of this territory and understanding of the transformations that affected the landscape especially in Roman times when we witness the formation of town developments (especially devoted to agricultural use of the area) connected to each other through
small diverticula associated with viability constituted by via Appia.
Many data from the study of ceramics dating from between the Imperial Age and the Late Antiquity: coarse and cooking wares are very common, are more sporadic fragments related to containers (amphorae). As regards the coarse ware we have been identified different types of large bowls and bowls as well as to jugs for pouring of liquids; cooking wares turns out to be represented by jars, pots and lids.
The presence of African terra sigillata is an important indicator not only the arrival, in the Southern Italy inland contexts, of the imported goods from ultramarine areas, but also the importance of primary and secondary viability until Late Antiquity. The study of ceramic material in fact provides basic information on the trade relationship between regional and extra-regional contexts and this will, in the final stage of the study of the territorial area, to draw important data on traffic and contacts between the various territorial sectors.
The pottery classes identified in the surveys of "Ponte Rotto" locality dated between the Imperial Age and Late Antiquity are typical of suburban and residential contexts and / or productive related, namely villas and / or farms. The data obtained from the study of ceramics attests the continuity of life in these settlements until the sixth century A.D.
In conclusion from the study of the territory and archaeological materials, although preliminary, it was possible to begin to speculate about the populating of the land strip running along Calore river. At present the research area is to be occupied in Prehistoric times as evidenced by the discovery of coarse ceramics (walls) and worked flints.
The population of the area became more massive in the late Republican period, when we witness the formation of a spread settlement dedicated land use places near the Calore river. Population and exploitation that affected intensively the territory in Late Antiquity, a period when the via Appia was still the road axis most important to the area.
In the sixth century, perhaps in the early seventh century A.D., the archaeological record confirms the abandonment of settlements in the valley and the hills overlooking the river with the subsequent formation of the hilltop village, defended naturally, of Apice, which still dominates the modern town.
Although there was the abandonment of the valley, the viability is in operation in the early Middle Ages as the traces of a restoration of the “Ponte Appiano” probably dating back to Lombard period. The route of this road axis probably was modified as evidenced by the existence of a small bridge not far from the “Ponte Appiano” on the Calore river.
This infrastructure dates from the Middle Ages, a time when we are witnessing the initial recovery, then definitive in the Modern age (as evidenced by the pottery fragments analyzed) of the valley floor and making cultivation of land which were abandoned, for reasons of insecurity and unhealthiness, in Late Antiquity.
The 3rd Human and Social Sciences at the Common ConferenceOctober, 5. - 9. 2015, www.hassacc.com
History and Archaeology eISSN: 2453-6075, cdISSN: 1339-522X10.18638/hassacc.2015.3.1.171 - 184 - ISBN: 978-80-554-1124-8

Figure 4. Potsherds from site 3.
Figure 5. Potsherds from site 4.
The 3rd Human and Social Sciences at the Common ConferenceOctober, 5. - 9. 2015, www.hassacc.com
History and Archaeology eISSN: 2453-6075, cdISSN: 1339-522X10.18638/hassacc.2015.3.1.171 - 185 - ISBN: 978-80-554-1124-8

Figure 6. Potsherds from site 5.
Figure 7. Potsherds from site 6.
REFERENCES
[1] M. Rotili, “Archeologia medievale”, I, in Storia illustrata di Avellino e dell’Irpinia, I, L’Irpinia antica, G. Collucci Pescatori , Pratola Serra 1996, pp. 257-272;
M. Rotili, “Archeologia medievale”, II, in Storia illustrata di Avellino e dell’Irpinia, I, L’Irpinia antica, G. Collucci Pescatori , Pratola Serra 1996, pp. 273-288;
M. Rotili, “Scavi di chiese e castelli in Irpinia” in Scavi medievali in Italia, Atti della prima conferenza italiana di archeologia medievale (Cassino 14-16 dicembre 1995), S. Patitucci Uggeri, 1998 Roma-Freiburg-Wien, pp. 293-310;
The 3rd Human and Social Sciences at the Common ConferenceOctober, 5. - 9. 2015, www.hassacc.com
History and Archaeology eISSN: 2453-6075, cdISSN: 1339-522X10.18638/hassacc.2015.3.1.171 - 186 - ISBN: 978-80-554-1124-8

M. Rotili, “Le ricerche nel castello e nell’area murata del Monte (1980-92, 2005-07). Diagnosi e strategia in Montella: ricerche archeologiche nel donjon e nell’area murata 2011” , Napoli, pp. 11-67.
[2] N. Busino,” La media valle del Miscano tra tardoantichità e Medioevo. Carta archeologica di San Giorgio la Molara, Buonalbergo, Montefalcone di Valfortore, Casalbore. Dal pianoro della Guarana al torrente la Ginestra. Ricerche archeologiche a Montegiove, 1st ed., Arte Tipografica Editrice, 2007;
S. Pomicino, “Dinamiche insediative nell’Alta Valle del Fredane, in Per la conoscenza dei Beni Culturali. II. Ricerche del Dottorato in Metodologie conoscitive per la conservazione e la valorizzazione dei beni culturali 2004-2009, 2009”, Santa Maria Capua Vetere-Volla, pp. 135-147;
S. Pomicino, “Dinamiche insediative nell’Alta Valle del Fredane. Dati preliminari dalle località Roggiani, Bosco dei Monaci e Goleto, in Per la conoscenza dei Beni Culturali. III. Ricerche del Dottorato in Metodologie conoscitive per la conservazione e la valorizzazione dei beni culturali 2005-2010, 2010”, Santa Maria Capua Vetere-Volla, pp. 121-136;
P. Pratillo, “Il territorio di Montella (Avellino) tra Tarda Antichità e Medioevo”, in “Archeologia del paesaggio medievale. Studi in memoria di Riccardo Francovich”, Quaderni di Archeologia medievale, IX, S. PATITUCCI UGGERI 2007, Palermo, pp. 173-184;
P. Pratillo, “Accentramento insediativo fra tarda antichità e alto medioevo”, in” La Campania tra tarda antichità e alto medioevo: ricerche di archeologia del territorio”, Atti del Giornata di studio, (Cimitile 10 giugno 2008), C. Ebanista- M. Rotili, 2009, Cimitile, pp. 75-101.
[3] M. Rotili, C. Calabria, and N. Busino, “Le ricerche archeologiche a Montegiove (1999-2000), in La media valle del Miscano fra Tarda Antichità e Medioevo. Carta archeologica di San Giorgio La Molara, Buonalbergo, Montefalcone di Valfortore, Casalbore dal pianoro della Guarana al Torrente La Ginestra. Ricerche a Montegiove (1999-2000)”, N. Busino 2007, Napoli, pp. 203-292.
[4] M. Rotili, “Archeologia del donjon di Montella”, Memorie dell’Accademia di Archeologia, Lettere e Belle Arti in Napoli, XIII, 1999, Napoli;
M. Rotili,” Montella: ricerche archeologiche nel donjon e nell’area murata”, 2011, Napoli.
[5] M. Rotili, “Rocca San Felice: ricerche archeologiche 1990-1992”, Rendiconti dell’Accademia di Archeologia, Lettere e Belle Arti, LXIII, 1991-1992, pp. 231-384.
[6] M. Rotili, Archeologia postclassica a Torella dei Lombardi. Ricerche archeologiche nel castello (1993-97), 1997, Napoli.
[7] M. Rotili, Sant’Angelo dei Lombardi. Ricerche nel castello (1987-96). I. Settore sud-est e ambiente 12, 2002, Napoli.
[8] M. Rotili, “Archeologia medievale”, I, in Storia illustrata di Avellino e dell’Irpinia, I, L’Irpinia antica, G. Collucci Pescatori , Pratola Serra 1996, pp. 257-272;
[9] M. Rotili, “Ricerche archeologiche nel castello di Ariano Irpino. primo bilancio”, 1988, Ariano Irpino.
M. Rotili and N. Busino, “Castello di Ariano Irpino. Ricerche archeologiche 1988-94, 2008”, in Archeologia castellana nell’Italia meridionale. Bilanci e aggiornamenti, Atti della IV Conferenza Italiana di Archeologia Medievale (Roma, CNR 27-28 Novembre 2008), Quaderni di Archeologia medievale, XI, S. Patitucci Uggeri, 2010, Palermo, pp. 139-166;
M. Rotili, N. Busino and P. Pratillo, I”l castello di Ariano Irpino: dinamiche costruttive e aspetti della cultura materiale (secoli XI-XVI). Altri dati sulla ceramica in Irpinia”, in Rendiconti dell’Accademia di Archeologia, Lettere e Belle Arti, LXXIV, 2006-07 pp. 131-177.
[10] M. Rotili, “Un inedito edificio della Longobardia minore: la chiesa madre di Frigento, in Longobardia e longobardi nell’Italia meridionale. Le istituzioni ecclesiastiche”, Atti del 2° Convegno internazionale di studi (Benevento, 29-31 maggio 1992), G. Andenna and G. Picasso, 1996, Milano, pp. 275-320;
M. Rotili and C.Ebanista, “Archeologica postclassica in Irpinia: lo scavo della chiesa di S. Pietro a Frigento”, Rendiconti dell’Accademia di Archeologia, Lettere e Belle Arti, LXIV, 1993-94, pp. 587-594.
[11] P. Arthur, “Ceramica comune tardo-antica ed alto-medievale”, in “Il complesso archeologico di Carminiello ai Mannesi”, Napoli (Scavi 1983-1984), 1994, Galatina, pp. 181-220.
[12] P. Arthur, “Scavo in proprietà Carrillo S.M.C.V.: contributo per una conoscenza di Capua tardo-antica”, in Archeologia Medievale, XIV, 1987, pp. 517-534.
[13] A. Scarpati, “La ceramica comune ingubbiata, in Testimonianze di epoca altomedievale a Benevento. Lo scavo del Museo del Sannio”, A. Lupia, 1998, Napoli, pp. 126-134.
[14] J. W. Hayes,” Late roman pottery”, 1972, London.
[15] N. Busino,” La media valle del Miscano tra tardoantichità e Medioevo. Carta archeologica di San Giorgio la Molara, Buonalbergo, Montefalcone di Valfortore, Casalbore. Dal pianoro della Guarana al torrente la Ginestra. Ricerche archeologiche a Montegiove”, 1st ed., Arte Tipografica Editrice, 2007.
[16] N. Busino,” La media valle del Miscano tra tardoantichità e Medioevo. Carta archeologica di San Giorgio la Molara, Buonalbergo, Montefalcone di Valfortore, Casalbore. Dal pianoro della Guarana al torrente la Ginestra. Ricerche archeologiche a Montegiove”, 1st ed., Arte Tipografica Editrice, 2007.
[17] G. Olcense, “Ceramiche comuni a Roma e in area romana. Produzione, circolazione e tecnologia (tarda età repiblicana-prima età imperiale)”, 2003, Mantova;
P. Arthur, “Ceramica comune tardo-antica ed alto-medievale”, in “Il complesso archeologico di Carminiello ai Mannesi”, Napoli (Scavi 1983-1984), 1994, Galatina, pp. 181-220.
The 3rd Human and Social Sciences at the Common ConferenceOctober, 5. - 9. 2015, www.hassacc.com
History and Archaeology eISSN: 2453-6075, cdISSN: 1339-522X10.18638/hassacc.2015.3.1.171 - 187 - ISBN: 978-80-554-1124-8

Biblical-historical aspects about the Decree of the
Persian king Cyrus, for the reconstruction of the
Temple in Jerusalem and its consequences (537BC)
Ioan-Gheorghe Rotaru
Ph.D. Associate Professor of 'Timotheus' Brethren Theological Institute of Bucharest, Romania.
President of Education Society for Romanian People (SPIPR), Bucharest, Romania.
Abstract – Biblical-historical aspects about the Decree of the
Persian king Cyrus, for the reconstruction of the Temple in
Jerusalem and its consequences (537BC). The Jews arrived in
Babylon, because they were taken as war prisoners, after the
campaign of the King Nebuchadnezzar in Judea, occasion on
which Jerusalem was conquered and demolished, along with the
famous temple of Solomon. For the Jews, the fall of Jerusalem
into the hands of the emperor of Babylon was prophesied before
by the prophet Jeremiah, but the king did not take heed to the
prophet's insistence to surrender to the Babylonian emperor,
situation that would have saved lives of people from death, as
well as the destruction of material goods. After 70 years of
captivity, Emperor Cyrus the Persian will give a decree, together
with the necessary financial support, for the reconstruction of the
temple in Jerusalem, with the permission to return home for the
Jews who wanted this. The study refers only to the biblical-
historical context of the Jews reaching into captivity, to the
decree given by the emperor and to the return at home of a group
of about 50.000 Jews, without entering the temple building
details, which will be the subject of another study.
Keywords- Decree, reconstruction of the Temple, exiles, return
I. THE BIBLICAL-HISTORICAL CONTEXT OF THE
JEWS REACHING INTO THE BABYLONIAN CAPTIVITY
The fall of Jerusalem in the hands of the emperor of Babylon was prophesied before by the prophet Jeremiah, who wrote to the emperor of the Kingdom of Judah, Jehoiakim, about this situation, but the emperor, dissatisfied of the content, burned the book, trying to catch the prophet Jeremiah and the scribe Baruch: "And thou shalt say to Jehoiakim king of Judah, Thus saith the LORD; Thou hast burned this roll, saying, Why hast thou written therein, saying, The king of Babylon shall certainly come and destroy this land, and shall cause to cease from thence man and beast?" [1]
"It was God's purpose that Jehoiakim should heed the counsels of Jeremiah and thus win favor in the eyes of Nebuchadnezzar and save himself much sorrow. The youthful king had sworn allegiance to the Babylonian ruler, and had he remained true to his promise he would have commanded the respect of the heathen, and this would have led to precious opportunities for the conversion of souls. Scorning the unusual privileges granted him, Judah's king willfully followed a way of his own choosing. He violated his word of honor to the Babylonian ruler, and rebelled. This brought him and his kingdom into a very strait place. Against him were sent "bands
of the Chaldees, and bands of the Syrians, and bands of the Moabites, and bands of the children of Ammon," and he was powerless to prevent the land from being overrun by these marauders. 2 Kings 24:2. Within a few years he closed his disastrous reign in ignominy, rejected of Heaven, unloved by his people, and despised by the rulers of Babylon whose confidence he had betrayed--and all as the result of his fatal mistake in turning from the purpose of God as revealed through His appointed messenger. Jehoiachin [also known as Jeconiah, and Coniah], the son of Jehoiakim, occupied the throne only three months and ten days, when he surrendered to the Chaldean armies which, because of the rebellion of Judah's ruler, were once more besieging the fated city. On this occasion Nebuchadnezzar "carried away Jehoiachin to Babylon, and the king's mother, and the king's wives, and his officers, and the mighty of the land," several thousand in number, together with "craftsmen and smiths a thousand. "With these the king of Babylon took "all the treasures of the house of the Lord, and the treasures of the king's house." 2 Kings 24:15,16,13 [2].
"At that time the servants of Nebuchadnezzar king of Babylon came up against Jerusalem, and the city was besieged. And Nebuchadnezzar king of Babylon came against the city, and his servants did besiege it. And Jehoiachin the king of Judah went out to the king of Babylon, he, and his mother, and his servants, and his princes, and his officers: and the king of Babylon took him in the eighth year of his reign. And he carried out thence all the treasures of the house of the LORD, and the treasures of the king's house, and cut in pieces all the vessels of gold which Solomon king of Israel had made in the temple of the LORD, as the LORD had said. And he carried away all Jerusalem, and all the princes, and all the mighty men of valour, even ten thousand captives, and all the craftsmen and smiths: none remained, save the poorest sort of the people of the land. And he carried away Jehoiachin to Babylon, and the king's mother, and the king's wives, and his officers, and the mighty of the land, those carried he into captivity from Jerusalem to Babylon. And all the men of might, even seven thousand, and craftsmen and smiths a thousand, all that were strong and apt for war, even them the king of Babylon brought captive to Babylon." [3]
In the kingdom of Judah, emperor Nebuchadnezzar named Matania as king, to whom he changed his name to Zedekiah, naming his as his vassal: "And the king of Babylon made Mattaniah his father's brother king in his stead, and changed his name to Zedekiah." [4] Emperor Zedekiah, instead of being
The 3rd Human and Social Sciences at the Common ConferenceOctober, 5. - 9. 2015, www.hassacc.com
Philosophy, Ethics and Religion eISSN: 2453-6075, cdISSN: 1339-522X10.18638/hassacc.2015.3.1.155 - 188 - ISBN: 978-80-554-1124-8

subjected and loyal to the emperor Nebuchadnezzar, he rebelled against the emperor of Babylon: "For through the anger of the LORD it came to pass in Jerusalem and Judah, until he had cast them out from his presence, that Zedekiah rebelled against the king of Babylon." [5]
The prophet Jeremiah told the next emperor of the Kingdom of Judah, Zedekiah, about the invasion of the Babylonians and about the need to obey them, for him and the people to survive and to protect the citadel of Jerusalem from being demolished and burned: "Then said Jeremiah unto Zedekiah, Thus saith the LORD, the God of hosts, the God of Israel; If thou wilt assuredly go forth unto the king of Babylon's princes, then thy soul shall live, and this city shall not be burned with fire; and thou shalt live, and thine house: But if thou wilt not go forth to the king of Babylon's princes, then shall this city be given into the hand of the Chaldeans, and they shall burn it with fire, and thou shalt not escape out of their hand." [6]
"Zedekiah at the beginning of his reign was trusted fully by the king of Babylon and had as a tried counselor the prophet Jeremiah. By pursuing an honorable course toward the Babylonians and by paying heed to the messages from the Lord through Jeremiah, he could have kept the respect of many in high authority and have had opportunity to communicate to them a knowledge of the true God. Thus the captive exiles already in Babylon would have been placed on vantage ground and granted many liberties; the name of God would have been honored far and wide; and those that remained in the land of Judah would have been spared the terrible calamities that finally came upon them. Through Jeremiah, Zedekiah and all Judah, including those taken to Babylon, were counseled to submit quietly to the temporary rule of their conquerors. It was especially important that those in captivity should seek the peace of the land into which they had been carried." [7]
"Through Daniel and others of the Hebrew captives, the Babylonian monarch had been made acquainted with the power and supreme authority of the true God; and when Zedekiah once more solemnly promised to remain loyal, Nebuchadnezzar required him to swear to this promise in the name of the Lord God of Israel. Had Zedekiah respected this renewal of his covenant oath, his loyalty would have had a profound influence on the minds of many who were watching the conduct of those who claimed to reverence the name and to cherish the honor of the God of the Hebrews. But Judah's king lost sight of his high privilege of bringing honor to the name of the living God. Of Zedekiah it is recorded: "He did that which was evil in the sight of the Lord his God, and humbled not himself before Jeremiah the prophet speaking from the mouth of the Lord. And he also rebelled against King Nebuchadnezzar, who had made him swear by God: but he stiffened his neck, and hardened his heart from turning unto the Lord God of Israel." 2 Chronicles 36:12, 13. [8]
Nebuchadnezzar, the emperor of Babylon conquered Jerusalem in 605 BC, which he demolished and burned, he demolished also the famous Temple of the King Solomon and he took the sacred vessels which were in the service of the Temple, together with many servants, that he took to Babylon. This fact is written also by the prophet Jeremiah as follows: "In the ninth year of Zedekiah king of Judah, in the tenth month, came Nebuchadrezzar king of Babylon and all his army against Jerusalem, and they besieged it. And in the eleventh year of
Zedekiah, in the fourth month, the ninth day of the month, the city was broken up. And all the princes of the king of Babylon came in, and sat in the middle gate, even Nergalsharezer, Samgarnebo, Sarsechim, Rabsaris, Nergalsharezer, Rabmag, with all the residue of the princes of the king of Babylon. And it came to pass, that when Zedekiah the king of Judah saw them, and all the men of war, then they fled, and went forth out of the city by night, by the way of the king's garden, by the gate betwixt the two walls: and he went out the way of the plain. But the Chaldeans' army pursued after them, and overtook Zedekiah in the plains of Jericho: and when they had taken him, they brought him up to Nebuchadnezzar king of Babylon to Riblah in the land of Hamath, where he gave judgment upon him. Then the king of Babylon slew the sons of Zedekiah in Riblah before his eyes: also the king of Babylon slew all the nobles of Judah. Moreover he put out Zedekiah's eyes, and bound him with chains, to carry him to Babylon. And the Chaldeans burned the king's house, and the houses of the people, with fire, and brake down the walls of Jerusalem. Then Nebuzaradan the captain of the guard carried away captive into Babylon the remnant of the people that remained in the city, and those that fell away, that fell to him, with the rest of the people that remained." [9]
"The weakness of Zedekiah was a sin for which he paid a fearful penalty. The enemy swept down like a resistless avalanche and devastated the city. The Hebrew armies were beaten back in confusion. The nation was conquered. Zedekiah was taken prisoner, and his sons were slain before his eyes. The king was led away from Jerusalem a captive, his eyes were put out, and after arriving in Babylon he perished miserably. The beautiful temple that for more than four centuries had crowned the summit of Mount Zion was not spared by the Chaldeans. "They burnt the house of God, and brake down the wall of Jerusalem, and burnt all the palaces thereof with fire, and destroyed all the goodly vessels thereof." 2 Chronicles 36:19. At the time of the final overthrow of Jerusalem by Nebuchadnezzar, many had escaped the horrors of the long siege, only to perish by the sword. Of those who still remained, some, notably the chief of the priests and officers and the princes of the realm were taken to Babylon and there executed as traitors. Others were carried captive, to live in servitude to Nebuchadnezzar and to his sons" [10].
II. THE DECREE OF THE RECONSTRUCTION OF
JERUSALEM AND THE RETURN OF THE JEWS FROM
CAPTIVITY
The decree of reconstruction of Jerusalem and implicitly of the Temple in Jerusalem was so important that it had been prophesied long before being issued. Thus the decree of reconstruction was reminded by the prophet Isaiah 161 years before the decree was given, and the name of the emperor who was to decree the reconstruction of Jerusalem and of the Temple was predicted more than 100 years before his birth. Thus we read in the book of the prophet Isaiah : "That confirmeth the word of his servant, and performeth the counsel of his messengers; that saith to Jerusalem, Thou shalt be inhabited; and to the cities of Judah, Ye shall be built, and I will raise up the decayed places thereof: That saith to the deep, Be dry, and I will dry up thy rivers: That saith of Cyrus, He is my shepherd, and shall perform all my pleasure: even saying to Jerusalem, Thou shalt be built; and to the temple, Thy foundation shall be laid." [11]
The 3rd Human and Social Sciences at the Common ConferenceOctober, 5. - 9. 2015, www.hassacc.com
Philosophy, Ethics and Religion eISSN: 2453-6075, cdISSN: 1339-522X10.18638/hassacc.2015.3.1.155 - 189 - ISBN: 978-80-554-1124-8

"Thus saith the LORD to his anointed, to Cyrus, whose right hand I have holden, to subdue nations before him; and I will loose the loins of kings, to open before him the two leaved gates; and the gates shall not be shut; I will go before thee, and make the crooked places straight: I will break in pieces the gates of brass, and cut in sunder the bars of iron: And I will give thee the treasures of darkness, and hidden riches of secret places, that thou mayest know that I, the LORD, which call thee by thy name, am the God of Israel. For Jacob my servant's sake and Israel mine elect, I have even called thee by thy name: I have surnamed thee, though thou hast not known me. I am the LORD, and there is none else, there is no God beside me: I girded thee, though thou hast not known me: I have raised him up in righteousness, and I will direct all his ways: he shall build my city, and he shall let go my captives, not for price nor reward, saith the LORD of hosts." [12]
Interesting is the fact that in these scriptural passages, emperor Cyrus, is named from the perspectives of the divinity, “My shepherd “ and “His anointed “, being called by the name even before he was born.
"The advent of the army of Cyrus before the walls of Babylon was to the Jews a sign that their deliverance from captivity was drawing nigh. More than a century before the birth of Cyrus, Inspiration had mentioned him by name, and had caused a record to be made of the actual work he should do in taking the city of Babylon unawares, and in preparing the way for the release of the children of the captivity. Through Isaiah the word had been spoken: "Thus saith the Lord to His anointed, to Cyrus, whose right hand I have holden, to subdue nations before him; . . . to open before him the two-leaved gates; and the gates shall not be shut; I will go before thee, and make the crooked places straight: I will break in pieces the gates of brass, and cut in sunder the bars of iron: and I will give thee the treasures of darkness, and hidden riches of secret places, that thou mayest know that I, the Lord, which call thee by thy name, am the God of Israel." Isaiah 45:1-3[13].
The prophet Jeremiah had written in his book: "For thus saith the LORD, That after seventy years be accomplished at Babylon I will visit you, and perform my good word toward you, in causing you to return to this place. And I will be found of you, saith the LORD: and I will turn away your captivity, and I will gather you from all the nations, and from all the places whither I have driven you, saith the LORD; and I will bring you again into the place whence I caused you to be carried away captive." [14]
"Often had Daniel and his companions gone over these and similar prophecies outlining God's purpose for His people. And now, as the rapid course of events betokened the mighty hand of God at work among the nations, Daniel gave special thought to the promises made to Israel." [15]
The decree of the emperor Cyrus marked the beginning of a new period in the history of the Jewish people. Thus the decree of reconstruction of the temple in Jerusalem was given at Ecbatana, the summer residence of the emperor, in the first year of the reign of the emperor Cyrus (Ezra 1, 1). If it is calculated the period from the fall of the Babylonian Empire, after the Jewish method of calculating time, respectively “autumn-autumn”, this decree would have taken place in the summer of 537 BC. The decree was issued in two forms. The first form of the decree was to be proclaimed publicly [16]. The hagiographic chroniclers describe the decree giving in the
following words: “Now in the first year of Cyrus king of Persia, that the word of the LORD spoken by the mouth of Jeremiah might be accomplished, the LORD stirred up the spirit of Cyrus king of Persia, that he made a proclamation throughout all his kingdom, and put it also in writing, saying, Thus saith Cyrus king of Persia, All the kingdoms of the earth hath the LORD God of heaven given me; and he hath charged me to build him an house in Jerusalem, which is in Judah. Who is there among you of all his people? The LORD his God be with him, and let him go up.” [17]
“Now in the first year of Cyrus king of Persia, that the word of the LORD by the mouth of Jeremiah might be fulfilled, the LORD stirred up the spirit of Cyrus king of Persia, that he made a proclamation throughout all his kingdom, and put it also in writing, saying, Thus saith Cyrus king of Persia, The LORD God of heaven hath given me all the kingdoms of the earth; and he hath charged me to build him an house at Jerusalem, which is in Judah. Who is there among you of all his people? his God be with him, and let him go up to Jerusalem, which is in Judah, and build the house of the LORD God of Israel, (he is the God,) which is in Jerusalem. And whosoever remaineth in any place where he sojourneth, let the men of his place help him with silver, and with gold, and with goods, and with beasts, besides the freewill offering for the house of God that is in Jerusalem.” [18]
A second form of the decree was rather a document specifying instructions for official use only. The public Decree provided for certain measures regarding (1) the reconstruction of the temple in Jerusalem, (2) the return of the Jewish captives in Judea on a voluntary basis and (3) the financial aid to the Jews who were repatriating, aid granted by their compatriots who chose to remain there, along with their friends among the peoples. On the other hand, the official decree contained certain instructions and precise specifications regarding the new temple that was to be constructed, (2) it had certain provisions regarding the cover of the expenses of construction of the temple, from imperial funds and (3) gave the command to return to the Jews the sacred vessels, which were taken from the old temple, Solomon's temple, and brought to Babylon [19] : “And also let the golden and silver vessels of the house of God, which Nebuchadnezzar took forth out of the temple which is at Jerusalem, and brought unto Babylon, be restored, and brought again unto the temple which is at Jerusalem, every one to his place, and place them in the house of God.” [20]
It is believed that there was a particular reason for which the content of the official decree was not included in the public one. On the one hand, some provisions were not significant to the public, and on the other hand, the announcement that the emperor was willing to cover the construction costs, could discourage the Jews and their friends to bring financial gifts to support the needs of construction [21].
For achieving these things, the emperor Cyrus appointed a Jew of noble rank, of royal rank, called Sheshbazzar or Zerubbabel, to be governor of the province Judea, which, administratively, was part of the satrapy called “Across the river”, a large region that comprised all the countries between the Euphrates River and Egypt. To this new governor, Sheshbazzar or Zerubbabel, have been entrusted all the sacred vessels of the ancient temple in Jerusalem, which were found in Babylon, together with a team of collaborators, led by Jeshua (or Joshua), a descendant of the last great officiant priest of the
The 3rd Human and Social Sciences at the Common ConferenceOctober, 5. - 9. 2015, www.hassacc.com
Philosophy, Ethics and Religion eISSN: 2453-6075, cdISSN: 1339-522X10.18638/hassacc.2015.3.1.155 - 190 - ISBN: 978-80-554-1124-8

Temple of Solomon, together with other 9 or 10 leading men, according to the biblical information: “Which came with Zerubbabel: Jeshua, Nehemiah, Seraiah, Reelaiah, Mordecai, Bilshan, Mispar, Bigvai, Rehum, Baanah;” [22] “Who came with Zerubbabel, Jeshua, Nehemiah, Azariah, Raamiah, Nahamani, Mordecai, Bilshan, Mispereth, Bigvai, Nehum, Baanah.” [23] Thus the new governor appointed for Judea, Sheshbazzar or Zerubbabel, made all the necessary preparations for the return to the old homeland, Judea. The decree of return of the Jews and of reconstruction of the temple gathered over 42.000 exiles included in the official lists that were willing to sell their properties and return to Judea. Even in the conditions of the captivity in Babylon, most of the Jews were able to preserve their genealogical documents, this way being able to prove their rights and titles in Judea. The detailed list of the non-ecclesiastical repatriated Jews, as we find it described in the Book of Ezra, was classified into 17 groups of families being constituted from almost 100 persons to almost 3.000 men each and 15 groups were entered in the list according to the settlement on citadels, of which the smallest numbered 42 men and the largest 1.254. Besides these there was also a group called “the children of Senaah”, with a total of 3.630 men, which could had been made up of poor people [24], alongside other 652 men who had lost all their documents by which they could prove their rights in the Jewish community. [25] We find the official list of the Jews who were repatriated in the Book of Ezra, as follows : “Now these are the children of the province that went up out of the captivity, of those which had been carried away, whom Nebuchadnezzar the king of Babylon had carried away unto Babylon, and came again unto Jerusalem and Judah, every one unto his city; Which came with Zerubbabel: Jeshua, Nehemiah, Seraiah, Reelaiah, Mordecai, Bilshan, Mispar, Bigvai, Rehum, Baanah. The number of the men of the people of Israel:The children of Parosh, two thousand an hundred seventy and two. The children of Shephatiah, three hundred seventy and two. The children of Arah, seven hundred seventy and five. The children of Pahathmoab, of the children of Jeshua and Joab, two thousand eight hundred and twelve. The children of Elam, a thousand two hundred fifty and four. The children of Zattu, nine hundred forty and five. The children of Zaccai, seven hundred and threescore. The children of Bani, six hundred forty and two. The children of Bebai, six hundred twenty and three. The children of Azgad, a thousand two hundred twenty and two.The children of Adonikam, six hundred sixty and six. The children of Bigvai, two thousand fifty and six. The children of Adin, four hundred fifty and four. The children of Ater of Hezekiah, ninety and eight. The children of Bezai, three hundred twenty and three. The children of Jorah, an hundred and twelve. The children of Hashum, two hundred twenty and three. The children of Gibbar, ninety and five. The children of Bethlehem, an hundred twenty and three. The men of Netophah, fifty and six. The men of Anathoth, an hundred twenty and eight.The children of Azmaveth, forty and two. The children of Kirjatharim, Chephirah, and Beeroth, seven hundred and forty and three. The children of Ramah and Gaba, six hundred twenty and one. The men of Michmas, an hundred twenty and two. The men of Bethel and Ai, two hundred twenty and three. The children of Nebo, fifty and two.The children of Magbish, an hundred fifty and six. The children of the other Elam, a thousand two hundred fifty and four.The children of Harim, three hundred and twenty. The children of Lod, Hadid, and Ono, seven hundred twenty and five.The
children of Jericho, three hundred forty and five.The children of Senaah, three thousand and six hundred and thirty.The priests: the children of Jedaiah, of the house of Jeshua, nine hundred seventy and three.The children of Immer, a thousand fifty and two.The children of Pashur, a thousand two hundred forty and seven. The children of Harim, a thousand and seventeen. The Levites: the children of Jeshua and Kadmiel, of the children of Hodaviah, seventy and four.The singers: the children of Asaph, an hundred twenty and eight.The children of the porters: the children of Shallum, the children of Ater, the children of Talmon, the children of Akkub, the children of Hatita, the children of Shobai, in all an hundred thirty and nine. The Nethinims: the children of Ziha, the children of Hasupha, the children of Tabbaoth, The children of Keros, the children of Siaha, the children of Padon,The children of Lebanah, the children of Hagabah, the children of Akkub, The children of Hagab, the children of Shalmai, the children of Hanan,The children of Giddel, the children of Gahar, the children of Reaiah, The children of Rezin, the children of Nekoda, the children of Gazzam, The children of Uzza, the children of Paseah, the children of Besai, The children of Asnah, the children of Mehunim, the children of Nephusim, The children of Bakbuk, the children of Hakupha, the children of Harhur, The children of Bazluth, the children of Mehida, the children of Harsha, The children of Barkos, the children of Sisera, the children of Thamah, The children of Neziah, the children of Hatipha. The children of Solomon's servants: the children of Sotai, the children of Sophereth, the children of Peruda, The children of Jaalah, the children of Darkon, the children of Giddel, The children of Shephatiah, the children of Hattil, the children of Pochereth of Zebaim, the children of Ami.” [26]
Governor Zerubbabel or Sheshbazzar was joined, from the Jewish exiles, for return, by more than 4.000 priests, that were part of 4 families, who were also joined by an unknown number of priests from 3 families but that could not prove their rights to the priesthood: “And of the children of the priests: the children of Habaiah, the children of Koz, the children of Barzillai; which took a wife of the daughters of Barzillai the Gileadite, and was called after their name: These sought their register among those that were reckoned by genealogy, but they were not found: therefore were they, as polluted, put from the priesthood.” [27]
It should be noted that in contrast to the large number of priests (4.389), willing to return to Judea, only a relatively small number of 733 Levites were willing to return. The reason for this unwillingness to return can be found in the fact that the prophet Ezekiel predicted that the Levites were to be degraded to fulfill more menial works, in the next service to the temple, fulfilling only a manual work because of their apostasy in the pre-exilic period [28]: “Thus saith the Lord GOD; No stranger, uncircumcised in heart, nor uncircumcised in flesh, shall enter into my sanctuary, of any stranger that is among the children of Israel. And the Levites that are gone away far from me, when Israel went astray, which went astray away from me after their idols; they shall even bear their iniquity. Yet they shall be ministers in my sanctuary, having charge at the gates of the house, and ministering to the house: they shall slay the burnt offering and the sacrifice for the people, and they shall stand before them to minister unto them. Because they ministered unto them before their idols, and caused the house of Israel to fall into iniquity; therefore have I lifted up mine hand against them, saith the Lord GOD, and they shall bear their iniquity.
The 3rd Human and Social Sciences at the Common ConferenceOctober, 5. - 9. 2015, www.hassacc.com
Philosophy, Ethics and Religion eISSN: 2453-6075, cdISSN: 1339-522X10.18638/hassacc.2015.3.1.155 - 191 - ISBN: 978-80-554-1124-8

And they shall not come near unto me, to do the office of a priest unto me, nor to come near to any of my holy things, in the most holy place: but they shall bear their shame, and their abominations which they have committed. But I will make them keepers of the charge of the house, for all the service thereof, and for all that shall be done therein. But the priests the Levites, the sons of Zadok, that kept the charge of my sanctuary when the children of Israel went astray from me, they shall come near to me to minister unto me, and they shall stand before me to offer unto me the fat and the blood, saith the Lord GOD: They shall enter into my sanctuary, and they shall come near to my table, to minister unto me, and they shall keep my charge.” [29] All the Jews above, prepared for repatriation, were accompanied by over 7.500 ministers and singers: “The whole congregation together was forty and two thousand three hundred and threescore, Beside their servants and their maids, of whom there were seven thousand three hundred thirty and seven: and there were among them two hundred singing men and singing women.” [30]
III. THE TRAVEL AND ARRIVAL HOME OF THE
ONES REPATRIATED
If the decree of the emperor Cyrus was given in the summer or autumn of 537 BC, the journey of the governor Zerubbabel with the group of exiles for repatriation probably began in the spring of the following year, 536 BC, since this was the usual season for traveling. The Mesopotamian armies left their homeland usually in spring for military campaigns in the foreign territories. The great caravan of those who accompanied Zerubbabel, nearly 50.000 people, with approx. 8.000 beasts of burden carrying their riches, needed some time to be able to reach Jerusalem, and they probably arrived in their homeland during the summer. Interesting is the fact that with all the numerous armies, they followed the course of the Euphrates River until they reached the parallel 36 or have passed through the former country of Assyria up to Arbela and followed approximately the course of the current Syrian-Turkish border. From there they must have passed through the northern desert of Syria, distance of almost 160 km unto the river Orontes, the Aleppo oasis being situated in the middle of this droughty land. After they arrived at Orontes, they could have used either the path from the inside, or the one which was following the coast of Phoenicia and Palestine. If they have used the first one, it means that they went on the course of Orontes River up to its spring, then to the south through the mountainous land between the range of the mountains Lebanon and Anti-Lebanon (comprising Mount Hermon and Mount Amana), finally crossing Galilee and Samaria before reaching the destination [31].
The first thing the group of exiles did after they arrived in peace to Jerusalem was to first take a service of thanksgiving to God, on which occasion the leaders of the congregation brought precious gifts : “And some of the chief of the fathers, when they came to the house of the LORD which is at Jerusalem, offered freely for the house of God to set it up in his place: They gave after their ability unto the treasure of the work threescore and one thousand drams of gold, and five thousand pound of silver, and one hundred priests' garments.” [32] After the thanksgiving service, the repatriated exiles spread in the country, in order to reoccupy the lands of their ancestors. At the beginning of the New Year they gathered again to Jerusalem to sanctify the altar for burnt offerings recently built, to reintroduce the service of the daily sacrifices
and to celebrate the holidays of the seventh month: “And when the seventh month was come, and the children of Israel were in the cities, the people gathered themselves together as one man to Jerusalem. Then stood up Jeshua the son of Jozadak, and his brethren the priests, and Zerubbabel the son of Shealtiel, and his brethren, and builded the altar of the God of Israel, to offer burnt offerings thereon, as it is written in the law of Moses the man of God. And they set the altar upon his bases; for fear was upon them because of the people of those countries: and they offered burnt offerings thereon unto the LORD, even burnt offerings morning and evening. They kept also the feast of tabernacles, as it is written, and offered the daily burnt offerings by number, according to the custom, as the duty of every day required; And afterward offered the continual burnt offering, both of the new moons, and of all the set feasts of the LORD that were consecrated, and of every one that willingly offered a freewill offering unto the LORD. From the first day of the seventh month began they to offer burnt offerings unto the LORD. But the foundation of the temple of the LORD was not yet laid. ” [33]
On that occasion of their presence in Jerusalem, there have also been made plans for rebuilding the temple and were concluded certain contracts with the inhabitants of Zidon and Tyre for the wood necessary for the construction of the temple: “They gave money also unto the masons, and to the carpenters; and meat, and drink, and oil, unto them of Zidon, and to them of Tyre, to bring cedar trees from Lebanon to the sea of Joppa, according to the grant that they had of Cyrus king of Persia.” [34] The actual work of rebuilding the temple began only the following year. For placing the cornerstone of the temple was chosen to be the same month in which Solomon began to build the first temple (Ezra 3,8; 1 Kings 6,1). This was an occasion of great joy for the faithful Jews, who had waited that day for many years, but the plans of the new temple together with its auxiliary buildings were not equalizing neither in size nor in splendor the temple destroyed by Nebuchadnezzar, reason why some of the older Jews, who had seen Solomon's temple in their youth, cried: “Now in the second year of their coming unto the house of God at Jerusalem, in the second month, began Zerubbabel the son of Shealtiel, and Jeshua the son of Jozadak, and the remnant of their brethren the priests and the Levites, and all they that were come out of the captivity unto Jerusalem; and appointed the Levites, from twenty years old and upward, to set forward the work of the house of the LORD. Then stood Jeshua with his sons and his brethren, Kadmiel and his sons, the sons of Judah, together, to set forward the workmen in the house of God: the sons of Henadad, with their sons and their brethren the Levites. And when the builders laid the foundation of the temple of the LORD, they set the priests in their apparel with trumpets, and the Levites the sons of Asaph with cymbals, to praise the LORD, after the ordinance of David king of Israel. And they sang together by course in praising and giving thanks unto the LORD; because he is good, for his mercy endureth for ever toward Israel. And all the people shouted with a great shout, when they praised the LORD, because the foundation of the house of the LORD was laid. But many of the priests and Levites and chief of the fathers, who were ancient men, that had seen the first house, when the foundation of this house was laid before their eyes, wept with a loud voice; and many shouted aloud for joy: So that the people could not discern the noise of the shout of joy from the noise of the weeping of the people: for the people
The 3rd Human and Social Sciences at the Common ConferenceOctober, 5. - 9. 2015, www.hassacc.com
Philosophy, Ethics and Religion eISSN: 2453-6075, cdISSN: 1339-522X10.18638/hassacc.2015.3.1.155 - 192 - ISBN: 978-80-554-1124-8
shouted with a loud shout, and the noise was heard afar off. ” [35]
IV. CONCLUSIONS
The Jews arrived in Babylon, because they were taken as war prisoners, after the campaign of the King Nebuchadnezzar in Judea, occasion on which Jerusalem was conquered and demolished, along with the famous temple of Solomon. Nebuchadnezzar, the emperor of Babylon conquered Jerusalem in 605 BC, which he demolished and burned, he demolished also the famous Temple of the King Solomon and he took the sacred vessels which were in the service of the Temple, together with many servants, that he took to Babylon. The decree of reconstruction of Jerusalem and implicitly of the Temple in Jerusalem was so important that it had been prophesied long before being issued. Thus the decree of reconstruction was reminded by the prophet Isaiah 161 years before the decree was given, and the name of the emperor who was to decree the reconstruction of Jerusalem and of the Temple was predicted more than 100 years before his birth. The decree of the emperor Cyrus marked the beginning of a new period in the history of the Jewish people. Thus the decree of reconstruction of the temple in Jerusalem was given at Ecbatana, the summer residence of the emperor, in the first year of the reign of the emperor Cyrus (Ezra 1, 1). If it is calculated the period from the fall of the Babylonian Empire, after the Jewish method of calculating time, respectively “autumn-autumn”, this decree would have taken place in the summer of 537 BC.
After the 70 years of Babylonian captivity the Jews, returning home, each of them taking again into possession their ancestral properties, gathered in Jerusalem to prepare the holy celebrations and to make plans in order to rebuild the temple in Jerusalem. The project of the temple and its annexes no longer corresponded to the famous temple built during the reign of King Solomon and destroyed by the emperor Nebuchadnezzar, for which at the settlement of the foundations, there was a great uproar, some were very glad for the possibility of building again the temple, and others, the older ones, were crying, thinking of the glory of the first temple, that they had known. As soon as the construction works began, there also appeared all sorts of troubles with their neighbors, the Samaritans. Everything that happened during the course of the construction works, until their completion, will be presented in another study.
REFERENCES
[1] The Holy Bible, King James Version, Cambridge, Cambridge University Press, Jeremiah 36, 29, p. 932.
[2] E.G White, Profeți și regi (Prophets and Kings), ed. a 5-a, Casa de Editură Viață și Sănătate, București, 2011, pp. 302-303.
[3] The Holy Bible…, 2 Kings 24,10-16, p. 517.
[4] The Holy Bible…, 2 Kings 24,17, p. 517.
[5] The Holy Bible…, 2 Kings 24,20, p. 517.
[6] The Holy Bible…, Jeremiah 38, 17-18, p. 935.
[7] E.G White, Profeți și regi (Prophets and Kings)..., p. 304.
[8] E.G White, Profeți și regi (Prophets and Kings)..., pp. 308-309.
[9] The Holy Bible…, Jeremiah 39, 1-9, pp. 935-936.
[10] E.G White, Profeți și regi (Prophets and Kings)..., pp. 316-317.
[11] The Holy Bible…, Isaiah 44, 26-28, p. 861.
[12] The Holy Bible…, Isaiah 45, 1-5.13, p. 861.
[13] E.G White, Profeți și regi (Prophets and Kings)..., p. 381.
[14] The Holy Bible…, Jeremiah 29, 10.14, p. 919.
[15] E.G White, Profeți și regi (Prophets and Kings)..., p. 382.
[16] Uniunea de Conferințe a Bisericilor Adventiste din Romania, http://www.resursebiblice.ro/2012/refacerea-poporului-iudeu/,25.08.2015.
[17] The Holy Bible…,2 Chronicles 36, 22-23, p. 607.
[18] The Holy Bible…, Ezra 1, 1-4, p. 608.
[19] Uniunea de Conferințe a Bisericilor Adventiste din Romania, http://www.resursebiblice.ro/2012/refacerea-poporului-iudeu/,25.08.2015.
[20] The Holy Bible…, Ezra 6,5, p. 614.
[21] Uniunea de Conferințe a Bisericilor Adventiste din Romania, http://www.resursebiblice.ro/2012/refacerea-poporului-iudeu/,25.08.2015.
[22] The Holy Bible…, Ezra 2,2, p. 608.
[23] The Holy Bible…, Nehemiah 7,7, p. 629.
[24] The Holy Bible…, Ezra 2,35, p.609.
[25] Uniunea de Conferințe a Bisericilor Adventiste din Romania, http://www.resursebiblice.ro/2012/refacerea-poporului-iudeu/,25.08.2015.
[26] The Holy Bible…, Ezra 2, 1-57, pp. 608-610.
[27] The Holy Bible…, Ezra 2, 61-62, p. 610.
[28] Uniunea de Conferințe a Bisericilor Adventiste din Romania, http://www.resursebiblice.ro/2012/refacerea-poporului-iudeu/,25.08.2015.
[29] The Holy Bible…, Ezekiel 44, 9-16, p.1025.
[30] The Holy Bible…, Ezra 2, 64-65, p. 610.
[31] Uniunea de Conferințe a Bisericilor Adventiste din Romania, http://www.resursebiblice.ro/2012/refacerea-poporului-iudeu/,25.08.2015.
[32] The Holy Bible…, Ezra 2, 68-69, p.610.
[33] The Holy Bible…, Ezra 3, 1-6, pp. 610-611.
[34] The Holy Bible…, Ezra 3, 7, p. 611.
[35] The Holy Bible…, Ezra 3, 8-13, p. 611
The 3rd Human and Social Sciences at the Common ConferenceOctober, 5. - 9. 2015, www.hassacc.com
Philosophy, Ethics and Religion eISSN: 2453-6075, cdISSN: 1339-522X10.18638/hassacc.2015.3.1.155 - 193 - ISBN: 978-80-554-1124-8
Historical-biblical aspects about the development and
completion of the reconstruction works of the Temple
in Jerusalem, following the Decrees given by the
emperors Cyrus (538/537BC) and Darius
(520/519BC)
Ioan-Gheorghe Rotaru
Ph.D. Associate Professor of 'Timotheus' Brethren Theological Institute of Bucharest, Romania.
President of Education Society for Romanian People (SPIPR), Bucharest, Romania.
Abstract – The Jews, after completing the 70 years of captivity in
Babylon, following an imperial decree given by the emperor
Cyrus, some of them have returned to their homeland, while
others remained in the Empire. The group of those who have
returned home, under the direction of the governor Zerubbabel
or Sheshbazzar, each took again into possession the ancestral
properties, after that, meeting in Jerusalem, they started to make
plans in order to rebuild the temple in Jerusalem. As soon as the
construction works began, there also began all sorts of trouble
with their neighbors, the Samaritans, who also wished to
participate to the construction of the temple, but the Jews have
refused them. The people animated by the leaders and prophets
start building again, placing the cornerstones, but during the
conduct of the construction actions, Jerusalem is visited by the
Persian governor, Tatnai, who was inspecting that area. The
governor does not stop them from the works but he sends a
report to the emperor and asks for the copy of the decree of
Cyrus to be searched, regarding the situation in Jerusalem, copy
which is finally found in the capital Ecbatana, after learning the
content to which the emperor Darius, in response to the
governor, gives another decree, which stipulated the permission
for continuing the works and the imperial financial support.
Thus, the reconstruction works of the temple in Jerusalem, works
started during the reign of the emperor Cyrus will be completed
during the reign of the emperor Darius.
Keywords- Decree, reconstruction of the temple, exiles,
prophets, consecration of the temple
I. INTRODUCTION
The Jews, after completing the 70 years of captivity in Babylon, following an imperial decree given by the emperor Cyrus, some of them have returned to their homeland, while others remained in the Empire. The group of those who have returned home, under the direction of the governor Zerubbabel or Sheshbazzar, each took again into possession the ancestral properties, after that, meeting in Jerusalem, they started to make plans in order to rebuild the temple in Jerusalem. It is true that the plans of the new temple did not correspond to the famous temple built by the Jewish king Solomon, that is why some were nostalgic for the old temple destroyed by the king Nebuchadnezzar, and others were eager to build the new
designed temple. As soon as the construction works began, there also began all sorts of trouble with their neighbors, the Samaritans, who also wished to participate to the construction of the temple, but the Jews have refused them. The consequences of this decision, not to accept the Samaritans as well, to the construction of the temple, led to an active and permanent hostility of the Samaritans, who tried to intimidate and hinder them to build the temple, even succeeding to bribe the counselors with silver to balk the work of building the temple, hindering the payments for the reconstruction works from the thesaurus of the royal funds, as stipulated by the imperial decree. This situation continued in terms of tension, until the false Smerdis interrupts the construction works, and in these circumstances the Jews have abandoned the reconstruction plan, occupying, in particular, each of his house and his works. In these circumstances arise the prophets Haggai and Zechariah, who rebuke the people for neglecting the works of the Lord and preoccupying only for their interests. The people animated by the leaders and prophets start building again, placing the cornerstones, but during the conduct of the construction actions, Jerusalem is visited by the Persian governor, Tatnai, who was inspecting that area. Seeing the site in work, he asks the leaders of the Jews about the building permit, given by the emperor. The leaders and elders of the Jews tell the governor Tatnai about the circumstances of the decree of Cyrus, regarding the temple and the repatriation of the Jews, but no longer having the imperial authorization to be able to present it. The governor does not stop them from the works but he sends a report to the emperor and asks for the copy of the decree of Cyrus to be searched, regarding the situation in Jerusalem, copy which is finally found in the capital Ecbatana, after learning the content to which the emperor Darius, in response to the governor, gives another decree, which stipulated the permission for continuing the works and the imperial financial support. Thus, the reconstruction works of the temple in Jerusalem, works started during the reign of the emperor Cyrus will be completed during the reign of the emperor Darius.
The 3rd Human and Social Sciences at the Common ConferenceOctober, 5. - 9. 2015, www.hassacc.com
Philosophy, Ethics and Religion eISSN: 2453-6075, cdISSN: 1339-522X10.18638/hassacc.2015.3.1.158 - 194 - ISBN: 978-80-554-1124-8

II. ASPECTS OF THE DEVELOPMENT OF THE
RECONSTRUCTION WORKS OF THE TEMPLE IN JERUSALEM
As soon as the construction works began, there have also started all sorts of trouble with their neighbors, the Samaritans. These were the result of a mixture of several nations who had been brought in the former kingdom of Israel, in different periods, by different Assyrian emperors from several lands conquered by the Assyrian Empire. The Samaritans served their heathen gods, as well as Jehovah, the God worshiped by the people of Israel, whose worship was added by them to their pagan worship when they were brought to Palestine [1] : “And the king of Assyria brought men from Babylon, and from Cuthah, and from Ava, and from Hamath, and from Sepharvaim, and placed them in the cities of Samaria instead of the children of Israel: and they possessed Samaria, and dwelt in the cities thereof. And so it was at the beginning of their dwelling there, that they feared not the LORD: therefore the LORD sent lions among them, which slew some of them. Wherefore they spake to the king of Assyria, saying, The nations which thou hast removed, and placed in the cities of Samaria, know not the manner of the God of the land: therefore he hath sent lions among them, and, behold, they slay them, because they know not the manner of the God of the land. Then the king of Assyria commanded, saying, Carry thither one of the priests whom ye brought from thence; and let them go and dwell there, and let him teach them the manner of the God of the land. Then one of the priests whom they had carried away from Samaria came and dwelt in Bethel, and taught them how they should fear the LORD. Howbeit every nation made gods of their own, and put them in the houses of the high places which the Samaritans had made, every nation in their cities wherein they dwelt. And the men of Babylon made Succothbenoth, and the men of Cuth made Nergal, and the men of Hamath made Ashima, And the Avites made Nibhaz and Tartak, and the Sepharvites burnt their children in fire to Adrammelech and Anammelech, the gods of Sepharvaim. So they feared the LORD, and made unto themselves of the lowest of them priests of the high places, which sacrificed for them in the houses of the high places. They feared the LORD, and served their own gods, after the manner of the nations whom they carried away from thence.” [2]
When the Jews returned from the Babylonian captivity, they have searched and recovered their ancestral properties, of which, it is possible, that some were occupied right by the Samaritans, during the Jewish captivity, and this explains the attitude of hostility from the Samaritans who tried to hinder them and to create them all sorts of inconveniences, so as not to be able to rebuild their temple and implicitly the religious worship. After the return of the Jews, the Samaritans were not only removed from those territories, where the Jews repatriated, but it was refused their collaboration or participation in any way at the reconstruction of the temple, as well as any rights at the religious service in Jerusalem. The repatriated Jews had learned, on their skin, the harsh lesson of the fact that the close connection with those who worship idols ultimately leads to idolatry and idolatry was precisely the one that had caused them the affliction of the defeat from 586 BC and their deportation to Babylon. So when the zealot Jews showed in this way that they had learned the lesson in the years of captivity in Babylon and they have made known this fact, firmly, to their neighbors from the north, that they will have nothing to do with them, there was a rupture between them that never healed again [3]: “Now when the adversaries of Judah and Benjamin heard that the children of the captivity builded the temple unto the LORD God of Israel; Then they came to
Zerubbabel, and to the chief of the fathers, and said unto them, Let us build with you: for we seek your God, as ye do; and we do sacrifice unto him since the days of Esarhaddon king of Assur, which brought us up hither. But Zerubbabel, and Jeshua, and the rest of the chief of the fathers of Israel, said unto them, Ye have nothing to do with us to build an house unto our God; but we ourselves together will build unto the LORD God of Israel, as king Cyrus the king of Persia hath commanded us. ” [4]
“Only a remnant had chosen to return from Babylon; and now, as they undertake a work seemingly beyond their strength, their nearest neighbors come with an offer of help. The Samaritans refer to their worship of the true God, and express a desire to share the privileges and blessings connected with the temple service. "We seek your God, as ye do," they declare. "Let us build with you." But had the Jewish leaders accepted this offer of assistance, they would have opened a door for the entrance of idolatry. They discerned the insincerity of the Samaritans. They realized that help gained through an alliance with these men would be as nothing in comparison with the blessing they might expect to receive by following the plain commands of Jehovah.” [5]
The consequences of this decision, not to accept the Samaritans as well, to the construction of the temple, led to an active and permanent hostility from the Samaritans, who tried to intimidate them and hinder them to build the temple: “Then the people of the land weakened the hands of the people of Judah, and troubled them in building.” [6] The Samaritans have also succeeded to bribe the counselors with silver to balk the work of building the temple, managing in this way to hinder the payments for the reconstruction works from the thesaurus of the royal funds: “And hired counselors against them, to frustrate their purpose, all the days of Cyrus king of Persia, even until the reign of Darius king of Persia.” [7] “Untiring in their opposition, the Samaritans "weakened the hands of the people of Judah, and troubled them in building, and hired counselors against them, to frustrate their purpose, all the days of Cyrus king of Persia, even until the reign of Darius." Ezra 4: 4,5. By false reports they aroused suspicion in minds easily led to suspect. But for many years the powers of evil were held in check, and the people in Judea had liberty to continue their work.” [8]
It is possible that after the death of Daniel, not to have existed at the imperial court, any Jewish sustainer who may have promoted the activity of reconstruction of the temple and that could defend their interests in moments of crisis. But subsequently, from the very harsh tone which the emperor Darius put in connection with the renewal of the decree of emperor Cyrus and with the provisions of its financial support, if it had not been put into practice, is highlighted the fact that the emperor discovered that the decree of the emperor Cyrus had been sabotaged [9]: “Moreover I make a decree what ye shall do to the elders of these Jews for the building of this house of God: that of the king's goods, even of the tribute beyond the river, forthwith expenses be given unto these men, that they be not hindered. And that which they have need of, both young bullocks, and rams, and lambs, for the burnt offerings of the God of heaven, wheat, salt, wine, and oil, according to the appointment of the priests which are at Jerusalem, let it be given them day by day without fail: That they may offer sacrifices of sweet savours unto the God of heaven, and pray for the life of the king, and of his sons. Also I have made a decree, that whosoever shall alter this word, let timber be pulled down from his house, and being set up, let
The 3rd Human and Social Sciences at the Common ConferenceOctober, 5. - 9. 2015, www.hassacc.com
Philosophy, Ethics and Religion eISSN: 2453-6075, cdISSN: 1339-522X10.18638/hassacc.2015.3.1.158 - 195 - ISBN: 978-80-554-1124-8

him be hanged thereon; and let his house be made a dunghill for this. And the God that hath caused his name to dwell there destroy all kings and people, that shall put to their hand to alter and to destroy this house of God which is at Jerusalem. I Darius have made a decree; let it be done with speed.” [10]
From another perspective, the Jews had neither demonstrated a sufficient faith in facing with self-control the difficulties they went through during the reconstruction of the temple. Instead of staying united in the reconstruction work and this way to oppose the enemy through a united and determined front, each of them tried to defend individually, as they best could, thus leaving the reconstruction work of the temple in Jerusalem and each of them taking care of their own houses, that they have fortified. In this way they gave up the noble cause of rebuilding the temple for which they were entitled by the decree of the emperor Cyrus, each of them dealing with their own works. Here was also a matter of faith and respect for the God to whom they wanted to build the temple. A believer always places his God first and then his works, and the Jews, in the given situation, placed God on secondary plan. This lack of faith in the work of rebuilding the temple of God attracted upon them a series of divine punishments, as for instance: inflation, drought and poor harvests, according to the information given by the prophet Haggai [11]: “Ye have sown much, and bring in little; ye eat, but ye have not enough; ye drink, but ye are not filled with drink; ye clothe you, but there is none warm; and he that earneth wages earneth wages to put it into a bag with holes. And I called for a drought upon the land, and upon the mountains, and upon the corn, and upon the new wine, and upon the oil, and upon that which the ground bringeth forth, and upon men, and upon cattle, and upon all the labour of the hands.” [12]
“For over a year the temple was neglected and well-nigh forsaken. The people dwelt in their homes and strove to attain temporal prosperity, but their situation was deplorable. Work as they might they did not prosper. The very elements of nature seemed to conspire against them. Because they had let the temple lie waste, the Lord sent upon their substance a wasting drought. God had bestowed upon them the fruits of field and garden, the corn and the wine and the oil, as a token of His favor; but because they had used these bountiful gifts so selfishly, the blessings were removed. Such were the conditions existing during the early part of the reign of Darius Hystaspes. Spiritually as well as temporally, the Israelites were in a pitiable state. So long had they murmured and doubted; so long had they chosen to make personal interests first, while viewing with apathy the Lord's temple in ruins, that many had lost sight of God's purpose in restoring them to Judea; and these were saying, "The time is not come, the time that the Lord's house should be built." Haggai 1, 2.” [13]
“To those who had become discouraged, Haggai addressed the searching inquiry, "Is it time for you, O ye, to dwell in your ceiled houses, and this house lie waste? Now therefore thus saith the Lord of hosts; Consider your ways." Why have you done so little? Why do you feel concern for your own buildings and unconcern for the Lord's building? Where is the zeal you once felt for the restoration of the Lord's house? What have you gained by serving self? The desire to escape poverty has led you to neglect the temple, but this neglect has brought upon you that which you feared. "Ye have sown much, and bring in little; ye eat, but ye have not enough; ye drink, but ye are not filled with drink; ye clothe you, but there is none warm; and he
that earneth wages earneth wages to put it into a bag with holes."” [14]
Something, it seems to have been worked on the temple in Jerusalem, after its foundations were laid during the reign of the emperors Cyrus and Cambyses, information we learn from what the Jews said who declared, during the reign of the emperor Darius, that: “Then came the same Sheshbazzar, and laid the foundation of the house of God which is in Jerusalem: and since that time even until now hath it been in building, and yet it is not finished.” [15] So when the emperor Cambyses II (529-522 BC, son of the emperor Cyrus) crossed Palestine, on the way to Egypt, in 525 BC, it may be that some representatives of the Jews to have met him somewhere, in one of the maritime citadels, to assure him of their unfailing loyalty. There is no evidence in this regard, but the Jewish documents from Elephantine [16] from Egypt show that the king Cambyses II showed more tolerant towards the Jews than towards the Egyptians, which is understandable also from his disposition to destroy the Egyptian temple from Elephantine, but he left untouched the neighboring Jewish temple, on the same island. [17]
Because of this, we are entitled to conclude that the king Cambyses II had taken no hostile action towards the Jews in their homeland. Any frustration regarding the reconstruction plan, that the Jews knew in their work should have come from the clerks of lower rank, as well as from their neighbors in Palestine, who believed that the hostile activity against the Jews will remain unpunished, since the emperor was away, engaged in various military campaigns and other imperial affairs. Knowing the course of the political things of the time, these enemies of the Jews were aware of the pronounced lack of popularity towards the king Cambyses II manifested throughout the empire and they endeavored to use to their advantage these feelings directed against the king. The lack of popularity of the king Cambyses II was so accentuated, that when the Mede Gaumata, on 11 March 522, BC proclaimed himself emperor, pretending he was Bardiya or Smerdis, the brother of Cambyses II [18], he was immediately accepted by the inhabitants of a large part of the empire. In this direction we are headed by the Babylonian documents bearing dates prior to the death of the king Cambyses II, from the reign of Bardiya, as it is called the false Smerdis in Babylonia. Until his death, September 29 of the same year 522 BC, the false Bardiya, a follower of the ancient pre-Zoroastrian religion, made serious attempts of destruction of the new religion. He ordered the destruction of the temples (supposed Zoroastrian), as he was accused by the emperor Darius in his long inscription from Behistan.[19] In these conditions of political instability, it is not hard to understand how elements hostile to the Jews were able to easily obtain from the impostor Smerdis a decree prohibiting the continuation of the construction of the temple in Jerusalem and that, probably, would allow the destruction even of what had already been build. Such a decree would have been in agreement with Smerdis' policy of destroying the temples, probably in order to destroy all the religions that, according to his conception, were a threat to the religion promoted by him. His action of hostility directed against the Jews might have been based on the fact that they had received certain privileges from the previous Persian emperors (Cyrus, Cambyses II), whose achievements he wanted to destroy. Certainly the enemies of the Jews were delighted by such a decree and used it as a legal basis to sustain their attack against what had already been built, and this can be inferred from the fact that it was necessary to be placed a new foundation, according to the information in (Hagai 2, 18.19) when, after two years, it was
The 3rd Human and Social Sciences at the Common ConferenceOctober, 5. - 9. 2015, www.hassacc.com
Philosophy, Ethics and Religion eISSN: 2453-6075, cdISSN: 1339-522X10.18638/hassacc.2015.3.1.158 - 196 - ISBN: 978-80-554-1124-8

resumed the reconstruction of the temple. On the occasion of the attack against Jerusalem, it seems that the official archives were destroyed, because the rulers of the Jews were not able to present any official document in support of the construction works, when Tatnai, the governor of the satrapy “Across the river”, inspected the area, a few years later, having to be made references to the imperial archives of Babylonia to corroborate their verbal assertions (Ezra 5, 13 at 6, 2). [20]
The six months of the reign of Gaumata, the false Smerdis, as well as the following months, in which Darius had to fight for the throne against various pretenders, until there were restored in the empire stable political conditions, must have been troubled times and of unrest for the Jews. The state of affairs described by the prophets Haggai and Zechariah gives us the possibility to understand some of the disasters that preceded the service of those men, who started working in the second year of the king Darius (520/519 BC). The emergence on the political scene of the Persian Empire of the king Darius, must have been a period of great relief for the Jews the fact that when they saw that the king Darius, a follower of Zoroaster, managed to control the political and military situation, sitting firmly on the throne of the Achaemenid Empire, believing that the king will be their friend, as were the kings Cyrus and Cambyses. After the order was established again in the empire, the prophets Haggai and Zechariah were chosen by God to initiate and animate a new campaign of resuming the reconstruction work, interrupted from the temple. The first chapter of the Book of Haggai begins with a prophetic spiritual message for the Jewish leaders, Zerubbabel and Joshua, those that were ruling the people from a civil and spiritual point of view, message transmitted on the first day of the sixth month (Elul) of the second year of the emperor Darius. Prophet Haggai was calling for the resumption of the construction work of the temple, but at the same time was reproving the people for his lack of faith and zeal, showing them that the misfortunes that came upon them were the result of their indifference towards the reconstruction work of the temple (Hagai 1, 2-11). After this message from the prophet, a few weeks later (in the 24th day of the same month, Elul) [21], the rulers of the Jews together with the people have decided to obey the prophetic exhortation and to start work on the reconstruction of the temple [22]:“Then Zerubbabel the son of Shealtiel, and Joshua the son of Josedech, the high priest, with all the remnant of the people, obeyed the voice of the LORD their God, and the words of Haggai the prophet, as the LORD their God had sent him, and the people did fear before the LORD. Then spake Haggai the LORD'S messenger in the LORD'S message unto the people, saying, I am with you, saith the LORD. And the LORD stirred up the spirit of Zerubbabel the son of Shealtiel, governor of Judah, and the spirit of Joshua the son of Josedech, the high priest, and the spirit of all the remnant of the people; and they came and did work in the house of the LORD of hosts, their God, in the four and twentieth day of the sixth month, in the second year of Darius the king.” [23]
“The message of counsel and reproof given through Haggai was taken to heart by the leaders and people of Israel. They felt that God was in earnest with them. They dared not disregard the repeated instruction sent them--that their prosperity, both temporal and spiritual, was dependent on faithful obedience to God's commands. Aroused by the warnings of the prophet, Zerubbabel and Joshua, "with all the remnant of the people, obeyed the voice of the Lord their God, and the words of Haggai the prophet." Verses 12. As soon as Israel decided to obey, the words of reproof were followed by a message of
encouragement. "Then spake Haggai . . . unto the people, saying, I am with you, saith the Lord. And the Lord stirred up the spirit of Zerubbabel" and of Joshua, and "of all the remnant of the people; and they came and did work in the house of the Lord of hosts, their God." Verses 13, 14.” [24]
III. INSPECTION OF THE WORKS FROM JERUSALEM
BY TATNAI, THE IMPERIAL GOVERNOR
However, until 18 December of the year 520 BC there were made various preliminary works on the construction site, so that it could be placed a new foundation for the temple. The day of placing the foundations of the temple was always linked to special celebrations, and the prophet Haggai used that occasion to make two speeches of encouragement for the people. During this period, Tatnai, the Persian royal governor on this side of the river unexpectedly made an inspection, together with his entire staff of clerks, in Jerusalem (Ezra 5, 3). The governor Tatnai proved to be an impartial and conscientious civil servant, according to the best Persian traditions. Seeing the works of construction on the construction site of the temple, the high official asked to see the royal building permit. To the requirements of the Persian high official Tatnai responded the elders of the Jews, while Zerubbabel, acting as governor seems to have remained in the shadow, very possible for the fact he did not know the attitude of the new civil servant. The elders and the rulers of the Jews have told the governor Tatnai how the first temple was destroyed by the king Nebuchadnezzar, how the Jews were taken away and taken to a long captivity in Babylon and how they were allowed to return home under the emperor Cyrus, also stating that this returned them also the thesaurus of the temple, taken to Babylon by Nebuchadnezzar and had given a royal decree by which it was authorized the reconstruction of the temple in Jerusalem, with clear provisions of financial support from the royal treasury. The high official Tatnai was impressed by the presentation of the situation made by the elders of the Jews and he gave credit to those told by them, because he allowed them for the moment to continue their construction works. Due to the fact that they had not been able to present a written imperial authorization in support of their statements, possibly that the authorization had been destroyed or stolen by the Samaritans, the high official sent emperor Darius Hystaspes a detailed report about this case. Thus the high official attached to his report also a list with the names of the Jewish leaders, asking to be made a research of the archives of Babylon, regarding the search of the decree given by the emperor Cyrus, referred to by the Jewish leaders, and then to be issued a royal decision regarding the attitude he had to take towards the situation described (Ezra 5, 3-17). [25] The book of the prophet Ezra records this event as follows: “At the same time came to them Tatnai, governor on this side the river, and Shetharboznai, and their companions, and said thus unto them, Who hath commanded you to build this house, and to make up this wall? Then said we unto them after this manner, What are the names of the men that make this building? But the eye of their God was upon the elders of the Jews, that they could not cause them to cease, till the matter came to Darius: and then they returned answer by letter concerning this matter. The copy of the letter that Tatnai, governor on this side the river, and Shetharboznai, and his companions the Apharsachites, which were on this side the river, sent unto Darius the king: They sent a letter unto him, wherein was written thus; Unto Darius the king, all peace. Be it known unto the king, that we went into the province of Judea, to the house of the great God, which is builded with great stones, and timber is laid in the walls, and this work goeth fast on, and prospereth in their hands. Then
The 3rd Human and Social Sciences at the Common ConferenceOctober, 5. - 9. 2015, www.hassacc.com
Philosophy, Ethics and Religion eISSN: 2453-6075, cdISSN: 1339-522X10.18638/hassacc.2015.3.1.158 - 197 - ISBN: 978-80-554-1124-8

asked we those elders, and said unto them thus, Who commanded you to build this house, and to make up these walls? We asked their names also, to certify thee, that we might write the names of the men that were the chief of them. And thus they returned us answer, saying, We are the servants of the God of heaven and earth, and build the house that was builded these many years ago, which a great king of Israel builded and set up. But after that our fathers had provoked the God of heaven unto wrath, he gave them into the hand of Nebuchadnezzar the king of Babylon, the Chaldean, who destroyed this house, and carried the people away into Babylon. But in the first year of Cyrus the king of Babylon the same king Cyrus made a decree to build this house of God. And the vessels also of gold and silver of the house of God, which Nebuchadnezzar took out of the temple that was in Jerusalem, and brought them into the temple of Babylon, those did Cyrus the king take out of the temple of Babylon, and they were delivered unto one, whose name was Sheshbazzar, whom he had made governor; And said unto him, Take these vessels, go, carry them into the temple that is in Jerusalem, and let the house of God be builded in his place. Then came the same Sheshbazzar, and laid the foundation of the house of God which is in Jerusalem: and since that time even until now hath it been in building, and yet it is not finished. Now therefore, if it seem good to the king, let there be search made in the king's treasure house, which is there at Babylon, whether it be so, that a decree was made of Cyrus the king to build this house of God at Jerusalem, and let the king send his pleasure to us concerning this matter.” [26]
IV. CIRCUMSTANCES OF ISSUING ANOTHER
DECREE FOR THE RECONSTRUCTION OF THE TEMPLE
GIVEN BY THE EMPEROR DARIUS
After receiving the report of the governor Tatnai [27], the archives of the state in Babylon were investigated, archives that have not revealed any document on the case reported, but the clerks responsible with the research continued their investigation at Ecbatana [28], finally being found a scroll, on which was written the official copy of the decree of the emperor Cyrus, copy which was brought to the emperor. After the discovery of the copy of the imperial decree, the emperor Darius gave another decree, which stipulated the following: “Now therefore, Tatnai, governor beyond the river, Shetharboznai, and your companions the Apharsachites, which are beyond the river, be ye far from thence: Let the work of this house of God alone; let the governor of the Jews and the elders of the Jews build this house of God in his place. Moreover I make a decree what ye shall do to the elders of these Jews for the building of this house of God: that of the king's goods, even of the tribute beyond the river, forthwith expenses be given unto these men, that they be not hindered. And that which they have need of, both young bullocks, and rams, and lambs, for the burnt offerings of the God of heaven, wheat, salt, wine, and oil, according to the appointment of the priests which are at Jerusalem, let it be given them day by day without fail: That they may offer sacrifices of sweet savours unto the God of heaven, and pray for the life of the king, and of his sons. Also I have made a decree, that whosoever shall alter this word, let timber be pulled down from his house, and being set up, let him be hanged thereon; and let his house be made a dunghill for this. And the God that hath caused his name to dwell there destroy all kings and people that shall put to their hand to alter and to destroy this house of God which is at Jerusalem. I Darius have made a decree; let it be done with speed.” [29]
The decree given by the emperor Cyrus, regarding the reconstruction of the temple in Jerusalem, had clear provisions regarding the payment of the expenses of construction from the royal funds. But when it was discovered the fact that it was paid little or nothing of what was planned, it is very possible that the emperor Darius got angry, because in this way was being demonstrated that the royal decrees were thoughtless and their provisions were not fulfilled. It is possible that this was the cause for which the answer to the governor Tatnai was written on an unusually harsh tone, containing threats of terrible punishments, in the situation where this new imperial decree was not to be applied. This new decree of Darius, of the year 520/519 BC, which was confirming the first decree of the emperor Cyrus [30], comprised three legal provisions. Thus, the Royal decree stipulated first of all, for the governor Tatnai not to hinder with anything the work of the Jews to rebuild the temple, secondly it stipulated for the sums promised by the emperor Cyrus to be paid from the revenues of the province “Across the river”; and thirdly, for the Jews, within their religious services, to pray for the good of the king and of his sons (Ezra 6,1-12). [31]
V. CONCLUSIONS
After the completion of the 70 years of Babylonian captivity, a significant number of Jews returning home, each took again into possession the ancestral properties, then they gathered in Jerusalem to prepare the sacred feasts and they placed again the religious worship in Jerusalem, after which they started to make plans in order to rebuild the temple in Jerusalem. The project of the temple and its annexes no longer corresponded to the famous temple built during the time of the king Solomon and destroyed by the emperor Nebuchadnezzar, for which at the settlement of the foundations of the temple, it was a different reaction, some were very glad for the possibility of building the temple again, and others, the elderly, were crying, thinking of the glory of the first temple, that they knew, and what they saw now was not corresponding anymore to what they knew it was at the first temple. [32]
After receiving this decree of the king Darius, with the material support of the Mede-Persian Empire and with the spiritual support of the Jewish leaders and of their prophets Haggai and Zechariah, it seems that the people worked with a lot of zeal and joy. The whole project of rebuilding the temple in Jerusalem was completed by the 3rd day of the month Adar, in the 6th year of Darius, when there were held the ceremonies of consecration of the temple (Ezra 6, 13-15). According to the calculation system this would have taken place on 12 March 515 BC. The real time of construction of the temple, from the placement of the second foundation in December 520 BC, was of 4 years and 3 months [33], shorter with 2 years and 3 months than that necessary to Solomon to complete the construction of the temple and its complex of buildings. This was possible due to the situation that a part of the huge infrastructures that Solomon had built to ensure a spacious platform on the uneven land of the northwestern hillock of Jerusalem were still good to use, as well as the fact that a large part of the construction material, purchased during the reign of the emperors Cyrus and Cambyses, was available and could be used. After describing the ceremonies related to the consecration of the new built temple and the celebration of the Feast of the Unleavened Bread, in the following month (Ezra 6, 16-22), the biblical reports no longer tell anything about the relationship of the Jews with the Persian Empire, until the time of the emperor Xerxes. It is believed however, without fear of making mistakes in the assertions that the Jews prospered
The 3rd Human and Social Sciences at the Common ConferenceOctober, 5. - 9. 2015, www.hassacc.com
Philosophy, Ethics and Religion eISSN: 2453-6075, cdISSN: 1339-522X10.18638/hassacc.2015.3.1.158 - 198 - ISBN: 978-80-554-1124-8

during the reign of the emperor Darius, whose leadership has been beneficial for all the peoples in the regions of the empire. [34]
REFERENCES
[1] Refacerea poporului iudeu (Restoration of the Jewish people), Uniunea de Conferințe a Bisericilor Adventiste din Romania, (The Union of Conferences of the Adventist Churches in Romania); http://www.resursebiblice.ro/2012/refacerea-poporului-iudeu/,25.08.2015.
[2] The Holy Bible, King James Version, Cambridge, Cambridge University Press, 2 Kings, 17, 24-33, p.505.
[3] Refacerea poporului iudeu (Restoration of the Jewish people), Uniunea de Conferințe a Bisericilor Adventiste din Romania, (The Union of Conferences of the Adventist Churches in Romania); http://www.resursebiblice.ro/2012/refacerea-poporului-iudeu/,25.08.2015.
[4] The Holy Bible…, Ezra 4, 1-3, pp. 611-612.
[5] E.G White, Profeți și regi (Prophets and Kings), ed. a 5-a, Casa de Editură Viață și Sănătate, București, 2011, pp.391-392.
[6] The Holy Bible…, Ezra 4,4, p.612.
[7] The Holy Bible…, Ezra 4,5, p.612.
[8] E.G White, Profeți și regi (Prophets and Kings)..., p.394.
[9] Refacerea poporului iudeu (Restoration of the Jewish people), Uniunea de Conferințe a Bisericilor Adventiste din Romania, (The Union of Conferences of the Adventist Churches in Romania); http://www.resursebiblice.ro/2012/refacerea-poporului-iudeu/,25.08.2015.
[10] The Holy Bible…, Ezra 6, 8,12, pp. 614-615.
[11] Refacerea poporului iudeu (Restoration of the Jewish people), Uniunea de Conferințe a Bisericilor Adventiste din Romania, (The Union of Conferences of the Adventist Churches in Romania); http://www.resursebiblice.ro/2012/refacerea-poporului-iudeu/,25.08.2015.
[12] The Holy Bible…, Haggai 1, 6.11, pp.1092-1093.
[13] E.G White, Profeți și regi (Prophets and Kings)..., p.395.
[14] E.G White, Profeți și regi (Prophets and Kings)..., p.396.
[15] The Holy Bible…, Ezra 5, 16, p. 614.
[16] About the community in Elephantine were found several documents. In 1895, some indigenous diggers have found some papyruses on this island, and in 1904, the Antiquities Service of Egypt made excavations and uncovered several papyruses, written in Aramaic by the Jewish colony in the period between 500 and 400 BC. One of the documents is a letter written to the Persian governor in Jerusalem in 407, asking permission to rebuild their temple on the island. Sanballat's name (Nehemiah 4:1), the high official of Samaria, is confirmed in the letter of the Jews in Elephantine to the governor of Judea. After expressing their desire to rebuild their temple, in the conclusion they say: " Also, we put the whole question in a letter on our behalf to Delaiah and Shelemiah, the sons of Sanballat, the governor of Samaria”. The name of Tobiah is also confirmed by archeology. In Jordan, at Araq el-Emir, in the eastern part of Aman, there are the ruins of Tobiah’s castle, and near the castle is the tomb of Tobiah family where it is engraved deep into stone, in an ancient Aramaic writing, the name Tobiah. Albright, by the way of writing, claims it is older than the year 400 BC. Thus, the old writing confirms the words of the high official Nehemiah. These two governors have sought to hinder the reconstruction of the walls of Jerusalem, work started and finished by Nehemiah. http://cristianet.fr/index.php?option=com_content&task=view&id=245&Itemid=106, accc.29.08.2015, 18,37.
[17] Refacerea poporului iudeu (Restoration of the Jewish people), Uniunea de Conferințe a Bisericilor Adventiste din Romania, (The Union of Conferences of the Adventist Churches in Romania);
http://www.resursebiblice.ro/2012/refacerea-poporului-iudeu/,25.08.2015.
[18] Emperor Cambyses II died during the march back from Egypt, homeward. The younger brother of Cambyses II, Smerdis, was killed following an attempt to obtain the throne, and in the absence of the king, the magician Gaumata posed as Smerdis and tried to get on the throne.
[19] The inscription from Behistun (or Behistoun or Bisistun) is a monumental inscription which describes the conquests of Darius I in three languages: Old Persian, Elamite and Akkadian. The text is engraved in a seafront from the mount Behistun, in Kermanshah province of the current Iran. The inscription was deciphered by Henry Rawlinson. Adkins, Lesley, Empires of the Plain: Henry Rawlinson and the Lost Languages of Babylon, St. Martin's Press, New York, 2003; Thompson, R. Campbell. "The Rock of Behistun". Wonders of the Past. Edited by Sir J. A. Hammerton. Vol. II. New York: Wise and Co., 1937, pp. 760–767; A. T. Olmstead, "Darius and His Behistun Inscription", The American Journal of Semitic Languages and Literatures, vol. 55, 1938, no. 4, pp. 392–416; https://ro.wikipedia.org/wiki/Inscripția_de_la_Behistun,acc.29.08.2015,19,01;http://cristianet.fr/index.php?option=com_content&task=view&id=245&Itemid=106, acc.29.08.2015,18,58.
[20] Refacerea poporului iudeu (Restoration of the Jewish people), Uniunea de Conferințe a Bisericilor Adventiste din Romania, (The Union of Conferences of the Adventist Churches in Romania); http://www.resursebiblice.ro/2012/refacerea-poporului-iudeu/,25.08.2015.
[21] It is generally considered that these two dates from the Book of the prophet Haggai are August 29 and September 21 of the year 520 BC, after the method of calculating the year spring-spring.
[22] Refacerea poporului iudeu (Restoration of the Jewish people), Uniunea de Conferințe a Bisericilor Adventiste din Romania, (The Union of Conferences of the Adventist Churches in Romania); http://www.resursebiblice.ro/2012/refacerea-poporului-iudeu/,25.08.2015.
[23] The Holy Bible…, Haggai, 1, 12-15, p.1093.
[24] E.G White, Profeți și regi (Prophets and Kings)..., pp. 396-397.
[25] Refacerea poporului iudeu (Restoration of the Jewish people), Uniunea de Conferințe a Bisericilor Adventiste din Romania, (The Union of Conferences of the Adventist Churches in Romania); http://www.resursebiblice.ro/2012/refacerea-poporului-iudeu/,25.08.2015.
[26] The Holy Bible…, Ezra, 5, 3-17, pp. 613-614.
[27] O.T.Olmstead describes Zerubbabel as being governor of the third rank, his immediate superior being Tatnai, the high official on this side of the river, and his superior was Hystanes, the satrap of Babylon. http://cristianet.fr/index.php?option=com_content&task=view&id=245&Itemid=106, acc. 29.08.2015.
[28] In the Book of Ezra it is called Ahmeta. Ecbatana was imperial residence town.
[29] The Holy Bible…, Ezra, 6, 6-12, pp.614-615.
[30] Popa, Dumitru S., Daniel, vol. I, București, 1991, pp. 270.284.
[31] Refacerea poporului iudeu (Restoration of the Jewish people), Uniunea de Conferințe a Bisericilor Adventiste din Romania, (The Union of Conferences of the Adventist Churches in Romania); http://www.resursebiblice.ro/2012/refacerea-poporului-iudeu/,25.08.2015.
[32] Ibidem.
[33] According to other specialists the time of construction would have been of four years, four months and ten days. http://biblia.crestini.com/explicatia-cartii/1/Neemia, acc.29.08.2015.
[34] Refacerea poporului iudeu (Restoration of the Jewish people), Uniunea de Conferințe a Bisericilor Adventiste din Romania, (The Union of Conferences of the Adventist Churches in Romania); http://www.resursebiblice.ro/2012/refacerea-poporului-iudeu/,25.08.2015.
The 3rd Human and Social Sciences at the Common ConferenceOctober, 5. - 9. 2015, www.hassacc.com
Philosophy, Ethics and Religion eISSN: 2453-6075, cdISSN: 1339-522X10.18638/hassacc.2015.3.1.158 - 199 - ISBN: 978-80-554-1124-8

Evolution of life, death, rebirth: the theory of
Absolutivity
Mahesh Man Shrestha
Irrigation engineer
Kathmandu, Nepal
Abstract – Absolute entity (cosmic consciousness) holding around
the Virtual (seen) and Real (unseen) universe makes entire
Cosmos in existence. It always existed, neither being created nor
destroyed. A fraction of an Absolute entity falls into the Real
universe for further expansion of the Virtual universe through
the Big-Bang. Thus gradually mahat, aham, chitta tattva and
microvitum are formed, and with the sentient, mutative and
static forces of Real universe it changes into five fundamental
factors such as ethereal, aerial, luminous, liquid and solid. All
these factors remain in requisite proportion, and mutually
cohesive with the Pranah (vital energy) which is necessary for the
manifestation of life. Proper integration of the psychic and
physical body triggers life and their dissociation causes death.
Later, complex life created gradually from single celled amoeba,
plant, animal, monkey, chimpanzee to complex human beings
into existence. Soul (immaterial) finds its new form of body
(material) depending upon one’s past experience and takes birth
and rebirth in the Virtual universe. Thus, the Theory of
Absolutivity explains all the clues of universe, matter formations,
life creation to ending into death, rebirth to life, and knowing
God.
Key Words: Absolute entity, Real and Virtual universe, Pranah,
Omega point, Soul
I. INTRODUCTION
Everybody likes to know causes of the common phenomena of life, death and rebirth of a living being in the world. What makes a life to come after birth and end in death? Whether rebirth occurs? How does it happen? Who does this? These are among main queries which are ever precipitating in the mind of a serious observer in the world. This article tries to present an account of philosophy supported by scientific views to answering the queries.
The Theory of Absolutivity states that everything comes out of cosmic consciousness and later merged into cosmic consciousness ultimately. The behavior of the changes based on the person's consciousness and perception by their unit mind. Consciousness is the product of a unit mind of a person. Cosmic consciousness is the product of cosmic mind of the Absolute entity. Meditation is the process of merging the consciousness of a person into cosmic consciousness (Absolute entity). All the modern scientific theories and laws proposed by various scientists are valid only to a certain level of spaces and conditions. Modern scientific development and concerning activities are limited only to the Virtual universe (seen universe) having four dimensions. Scientists believe that some natural forces might be accidently responsible to cause the Big-Bang triggering the creation of the whole physical (virtual)
universe. However, to understand the subject, some key points and figures have been adopted from “The Secrecy of the Universe: The Theory of Absolutivity, Human and Social Sciences presented by the author at the common conference (HASSACC), Slovakia. Nov 17-24, 2014” [8].
In this regards, author tries to propose a complete solution to evolution of life, death and rebirth through the “Theory of Absolutivity” with the complementary supportive explanations of parallel universe, Upanishad, Sarkar‟s Sristi-chakra, Quantum Science, Law of information and uncertainty, DNA, String Theory and Buddha‟s concept to Big-Bang Model [8].
All living beings are composed of cells – from a single-celled amoeba to the hundred trillion (10
14) celled human
beings– serving the basic function of applying energy within open and closed systems [2].
Almost all major cultures of the world, at one time or another, there had been a strong belief in rebirth. This can be traced back to the very earliest period of civilization where all major religions, be a theism or atheism, believe in the phenomenal rebirth. Rebirth is the philosophical concept that the soul or spirit can begin a new life in a new body after its biological death. Particular groups within the Abrahamic religions of Judaism, Christianity, and Islam do refer to reincarnation. Recently, Europeans and North Americans are paying attention to reincarnation concern. Professor Ian Stevenson of the University of Virginia, USA has published findings on more than twenty cases of rebirth [17]. We are now at a point where even the most skeptical of us will have to admit that there is a lot of circumstantial evidence in favor of the reality of rebirth. This article tries to establish the fact with the help of the Theory of Absolutivity, the concept of life, death and rebirth as the phenomena of consciousness.
II. OBJECTIVES
To understand Consciousness (Absolute entity) and consciousness transforming into the matter and the living beings.
To reveal the mechanism of death and rebirth of living beings.
To verify the Theory of Absolutivity.
III. EVOLUTION OF LIFE
Evolution of matter and life takes place from Consciousness (Absolute entity) through Real (unseen) and
The 3rd Human and Social Sciences at the Common ConferenceOctober, 5. - 9. 2015, www.hassacc.com
Philosophy, Ethics and Religion eISSN: 2453-6075, cdISSN: 1339-522X10.18638/hassacc.2015.3.1.153 - 200 - ISBN: 978-80-554-1124-8

Virtual (seen) universes and later it merges ultimately into Absolute entity in course of time and space.
A. Absolute entity:
Absolute entity has eternal existence. It is neither created nor destroyed. Absolute entity is absolutely positively charged entity without negativity. No time bounding to this entity. Its nature is that of pure cessation, and it is this that the Samkhyists call Purusha, the Vedantins call Bramh, the idealistic Buddhists call “Pure idea” and the Nihilists “Pure-essenceless” [7]. Absolute entity is that formless subjectivity, pure potential, infinite, universal consciousness which alone exists even after the cosmic dissolution [13]. Absolute entity is thus neither existent nor non-existent and is both statical and dynamical. It is situated in such a way that the Real and Virtual universe cannot reach or touch it. The situation of this entity is supposed to be the middle of a cylindrical cosmos (Figure 1), and all around the cylindrical structure there exists only the Real and Virtual universes in which the Virtual universe are in expanding and contracting phases. “World line” in a cosmos (Figure 1) is an infinitely thin loop of one dimensional string which represents its history by a line in space-time. Similarly “World-sheet” represents its history in two dimensional surfaces in space-time [14]. Absolute entity is the key factor which creates all Real, Virtual universe, living and non-living beings in its awakening stage [8]. This has been further explained in detail below.
B. Real and Virtual universe:
The Real universe existed even before the Big-Bang. It is also known as unseen universe having cosmic mind. It is composed of three subtler elements known as sentient (positive), static (negative) and mutative (neutral) forces which remain in a form of balanced equilateral triangle of forces (Figure 2 and 3). The dimension of Real universe are remains in very small curved space something like a million, million, million, million, and millionth of an inch [14]. Hawking in his book “The Theory of Everything” suggested that the other dimensions are curved up into a space of so small that we just don‟t notice it. Virtual universe having four dimensions is actually the projection of Real universe. Combination of Real and Virtual universe makes an Actual universe in a Cosmos (Figure 3) [8]. Each and every matter of Virtual universe has its invisible wave flux of immaterial part (antimatter) which remains in the Real universe could be only perceived.
Satyendra Bose proposed to Einstein that if matter cooled to very low temperatures to Absolute Kelvin or minus 273 degree centigrade then the entropy of that matter should decrease and matter should come down to a zero-energy state. This remained only in the realms of hypothetical speculation until it was proved much later on. This zero-energy state is now known in physics as the Bose-Einstein condensate. This state of matter is also called a super atom as the entire mass behaves as if it were a single atom. It loses all its characteristics of shape, charge and polarization. It probably reverts to a shapeless and attributeless phenomenon in the devolution of matter, reverting back to just the potential to manifest as anything and everything [12].
There may well be other regions of the universe in which all the dimensions are curled up small, or in which more than
four dimensions (26, 50 or more) are nearly flat [14]. These could be said as a transcendental or spiritual dimension. These are so subtler that they exist in immaterial form like quality or wave form and entire cosmos are filled with these elements. They are in a curve shaped having length equivalent to nearly Plank‟s constant i.e. invisible form like a one dimensional curved string of Hawking‟s String Theory [14]. This is also in conformity with the entropic principle and the existence of Real universe in the Theory of Absolutivity.
Figure 1. Cylindrical structure of Cosmos
Figure 2. Absolute entity, multisided, triangular Real universe with Omega point
A. Absolute entity changes into matter and living beings:
Let us try to understand how the spiritual factor or consciousness (Absolute entity) changes into physical factor (matter, lives and energy) in space-time within a cosmos are described in detail as follows:
There created, in the beginning, multi-sided different shapes in celestial bodies due to nature driven haphazard directional flow of three forces (sentient, mutative and static) in Real universe (Figure 2). A fractional portion of Absolute entity known as Omega point falls into the Real universe at its awakening stage. Later, all of a sudden, a triangle of forces of sentient, mutative and static started swirling around Omega point, the portion of Absolute entity (Figure 2). This Omega point disturbed the balance of the triangular forces of Real universe and created a resultant positive (sentient) force which
The 3rd Human and Social Sciences at the Common ConferenceOctober, 5. - 9. 2015, www.hassacc.com
Philosophy, Ethics and Religion eISSN: 2453-6075, cdISSN: 1339-522X10.18638/hassacc.2015.3.1.153 - 201 - ISBN: 978-80-554-1124-8

caused the Big-Bang and further expanded Virtual universe (Figure 3) [8].
The two factors, Absolute entity and Real universe, though duel in theory, are singular in spirit. Their collective body is just like that of fire. One cannot think of fire without its special thermal value and, in the same way, one cannot think of Absolute entity without Real universe in the collective body. Now the Real universe starts changing into Virtual universe at different stages in time and space due to its resultant force. Therefore, Real universe expressing her in the form of the resultant force inculcates a feeling of “existence” or “I-ness” feeling which is known as “Mahattattva” (Figure 8). At this stage, the creation of existence feeling occurs in the entity which does not have thinking or doing ability. Sentient force of Real universe is gradually transformed into the mutative principles owing to its internal clash. This mutation causes the feeling of second subjectivity and so the cosmic “I-ness” gets metamorphosed into the cosmic doer “I”. This cosmic doer “I” is known as “Ahamtattva” (Ego; or second mental subjectivity). At this stage an entity will have a knower-ship. Ahamtattva exists only in subjective strata. As the static principle starts its domination Ahamtattwa gets objectivity. At this stage an entity will have doership quality also and thus cosmic mind comes into existence. This Cosmic Mind is an objective reality with the doership; its immediate mental subjectivity being the Ahamtattva and supreme mental subjectivity the Mahattattva. Thus Macrocosmic universe is created and the cosmic mind is formed. Nothing is beyond the scope of the cosmic mind i.e. everything comes within its mental scope. So the Absolute entity needs no nervous system or organs for controlling their operations. The Cosmic mind is most powerful and capable to work in all ten directions at a time and it is complete in all the sense. The capability of Unit mind (individual people) is so limited that it can work in only one direction at a time and that too at limited area with its limited power. So far as properties are concerned, the Unit mind has no difference from the Cosmic mind. Both have intellectual and supra-physical value [7]. Chitta under the influence of static force of Real universe gets cruder and at a later stage is transformed into the Microvitum which is a kind of subtler living entity in the form of idea or thought. This Microvitum could be the genetic mutative force which has been discovered in the modern quantum physics as a “mysterious” “transcendental realm” beyond normal space-time [11]. This appears to be the source of driving force behind evolution of our life system in universe. Millions of Microvitum makes a carbon atom [11]. Microvitum is the silver lining between the spiritual and psychic stage and cannot affect the spiritual structure but can affect both the physical and psychic structures. It is a living subtler organism responsible for converting the idea into matter or energy and life indirectly as well. It is more idea than matter. Static forces of Real universe further metamorphosized the microvitum into ethereal element first. In this case “sound” remains as fluxes (fractions of wave). Aerial element comes into existence and in this “sound” and “touch” remains as fluxes. Then Luminous is created whose fluxes are “sound”, “touch” and “shape”. And then liquid is created and its fluxes are “sound”, “touch”, “shapes” and “tests”. Finally, solid element is created and “sound”, “touch”, “shapes”, “tastes” and “smell” remain as
fluxes. Solid is the crudest manifestation of Absolute entity (Figure 8) [10]. Cosmic mind of the Absolute entity displays its will with the five manifested fundamental physical factors such as ethereal, aerial, luminous, liquid and solid [10].
Figure 3. Actual, Real and Virtual universe in Cosmos
Within a fraction of second after the Big-Bang, all the known four forces of Virtual universe such as strongest subatomic (gluon), weak subatomic (radiation), electromagnetic and gravitational forces were created. In the earlier moments after the Big-Bang, the weaker gravitational force, as time passed, started dominating among forces, and as a result the created bigger lumps of celestial bodies commenced attracting scattered small particles into their orbits. Thus, gradually, the masses and volumes of celestial bodies increased and formed different clusters, gluons, protons, electrons, neutrons, hydrogen atoms, stars, galaxies, planets etc to ultimately a Virtual universe (seen universe) (Figure 4) with four dimensions was emerged. Virtual universe always functions in two dimensional plane with additional another two dimensions around the Absolute entity in space and time (Figure 3 and Figure 4) [8].
All current Earthly life physically is composed of cells serving the basic function of applying energy within open and closed systems. Thus, although on a cosmic level, Entropy “rules” the universe from an initial temperature of 10
32 degree
centigrade at 10-43
seconds after the Big Bang (of some 13,700 million years ago) to a current temperature of 3 degrees centigrade – life on Earth resides within the open system of our little Solar system [8].
A Super Nova explosion created all elements having more than two protons within the core of their atoms. During the first 1,000 million years of the existence of the Earth, the off-gassing of elements into the second atmosphere of the Earth resulted in the colliding, sticking, and reacting of gasses. Free atoms and simple molecules emerged in the sphere by virtue of
The 3rd Human and Social Sciences at the Common ConferenceOctober, 5. - 9. 2015, www.hassacc.com
Philosophy, Ethics and Religion eISSN: 2453-6075, cdISSN: 1339-522X10.18638/hassacc.2015.3.1.153 - 202 - ISBN: 978-80-554-1124-8

subtle fusion of Sun energy, radiated radioactivity through active substances within Earth, lightning electromagnetic discharges, sound waves of thundering and chemical bonds breakdown generated ammonia and methane gases. These simple molecules slosh around within the primordial soup creating amino acids and nucleotide bases – in short, organic matter from inorganic substance. Amino acids, from the simplest structure of glycine to the most complex of tryptophan– along with the nucleic acids – form the two dozen or so moderately complex molecules that comprised the basic ingredients of all life on Earth [2, 8].
It is fact that all the minute particles of Virtual universe functions as Cosmos do. In other word, all matters and particles, irrespective of dimension, behaves like a universe. Only the difference is in its scope and sizes. This has been confirmed by the elementary particle Higgs-Boson (Figure 5) discovered in an experiment at CERN (European Organization for Nuclear Research) through the Large-Hadron Collider situated near the border of Geneva and Paris. The configuration of the Cosmos as explained by the Theory of Absolutivity also looks like a Higgs-Boson particle (Figure 6).
Figure 4. Expanding Virtual universe
Source: The birth of the Universe, The Kingfisher Young People’s Book of Space
In the Cosmos each and every matter having size infinitely small tending to zero or tending to infinitely big behaves like a universe or cosmos [7, 8].
Figure 5. Higgs-boson particle
Figure 6. Configuration of Cosmos
Source: home.web.cern.ch/topics/higgs-boson
The 3rd Human and Social Sciences at the Common ConferenceOctober, 5. - 9. 2015, www.hassacc.com
Philosophy, Ethics and Religion eISSN: 2453-6075, cdISSN: 1339-522X10.18638/hassacc.2015.3.1.153 - 203 - ISBN: 978-80-554-1124-8

According to theory of strong entropic principle, there are either many different universes or many different regions of a single universe, each with its own initial configuration and, perhaps, with its own set of laws of science. In most of these universes the conditions might not be favorable for the development of complicated organisms unlike our universe with intelligent beings along with [8]. This is also true for the cosmological structure as shown in figure 6 having some universes are on contracting phase and some are in the expanding phase with its own set of laws. Thus the Theory of Absolutivity is also seen in conformity with the entropic principle.
B. Life Formation:
Scientists claim that mind and consciousness are only a pack of neurons made up of chain of lifeless molecules and atoms electrically excitable cells that process and transmit information through electrical and chemical signals. Scientific reductionism sees only in matter, not in informational pattern. Therefore, it cannot quite put its finger on those elusive patterns that carry the massage of the life and pure consciousness [15]. The four lettered DNA in a cell is informational; it is the specific sequence of chemical letters that determines the variation in living organism. [15]. Matter alone is not enough to explain the realities of life and consciousness. There is something leftover, as it were, at each higher level in the hierarchical vision of universe. Theologists view this leftover region as the emergent freedom of life, mind and soul [15].
Physical body are composed of five fundamental elements as unit namely, ethereal, aerial, luminous, liquid and solid [7]. The external pressure of the static principle on the aforesaid five factors is known as “Bala”. As a result of Bala, two opposing forces develop; one centrifugal and the other centripetal in character. The centre-seeking or centripetal force tries to maintain the structural solidarity of the object while the centrifugal one tries to split up the object into thousands. The collective name of these exterial and interial forces is “prana” or energy. In prana there exists an internal clash in which either of the aforesaid active forces may win. If the centripetal forces win i.e., if the resultant force created happens to be centre-seeking in character, a nucleus is formed within the solid factor. Under such a circumstance a solid structure is created and the maintenance of its physical solidarity depends upon the Bala or external pressure (Figure 7). “Pranah” or “vital energy” is the master device to control five fundamental elements of a solid composed body. All these factors should remain in requisite proportion, and the mutual cohesion amongst these factors depends upon the resultant centre-seeking or the pranah. In condition of imbalance resultant centre-seeking force and congenial environment, all the five elements in a composite body may split into their own original forms resulting disappearing solidness in an entity (Figure 9) [11]. In the absence of a proper environment static force continues exerting external pressure on the unit composite structure. Static force exerts more pressure; there will be a tremendous reaction within the physical body affecting both the centrifugal and centripetal forces and resulting in structural dissociation. This is called “Jadasphota” or supernova stage (Figure 9).
Figure 7. Solidarity maintained stage of a unit composite structure
Due to Jadasphota, gradually or instantantly, the component factors of the physical structure get dissociated into the five fundamental factors. This phenomenon of retracing back in Sanchara (Centripetal force) is known as “Negative Sanchara” (Figure 8). In the process of Negative Sanchara the component factors cannot dissociate into factors subtler than the ethereal as that would mean the Ahamtattva withdrawing its eternally active thought projection. And this withdrawal by the cosmic “I” would mean suspension of the cosmic mind or cessation of Macrocosmic activity or the end of the creation as creation itself is only a thought-projection of the Macrocosm. Mahattattva and Ahamttattva are in dormant stage within the scope of chitta and matter. Also, in the case of unit structure, the initial mind created is not anything subtler than chitta. Intellectual unit mind controls the physical activities of the blind pranah of the unit structure. The mind of undeveloped creatures and plants the major portion is nothing but chitta in which Mahattattva and Ahamttattva are in dormant stage. Ego does not appear in the primary stage of mental creation hence blind forces of pranah cannot activate the physical structure. After the expression of ego, in a later stage of psychic evolution, ego (Ahamttattva) and pure „I‟ feeling (Mahttattva) are created, and with the help of unit mind (intellectual), the blind pranah is properly controlled. Thus pranah and mind, working in a collaborative way, maintain the structural solidarity in this divine march of Negative Sanchara and Negative Prati-Sanchara [7, 10].
Jadasphota occurs only in dead or dying celestial bodies. In a living celestial body, the existing congenial environment will cause the transformation of prana into pranah. This eliminates the chance of Jadasphota [10].
When soul find their identity based on their past experience retracing back to eather stage or uniceller living structure is known as Negative Sanchara or Negative Prati-Sanchara. In this way the journey of evolution continues eternally according to the divine urge of the Absolute entity [11]. After trillion years or more, the Virtual universe will again start contracting to form a condition before the Big-Bang and again it will expand as before. Thus the Virtual universe starts oscillating forever (Figure 6).
The 3rd Human and Social Sciences at the Common ConferenceOctober, 5. - 9. 2015, www.hassacc.com
Philosophy, Ethics and Religion eISSN: 2453-6075, cdISSN: 1339-522X10.18638/hassacc.2015.3.1.153 - 204 - ISBN: 978-80-554-1124-8

Figure 8. Cycle of formation of matter and living being in Sristi-Chakra
IV. MECHANISM OF DEATH
A. Death explained in science
Dying starts when a body doesn't get optimum quantity of oxygen to make the body survive. Different cells die at different speeds, so the length of the dying process depends on which cells are deprived of oxygen. The brain requires a tremendous amount of oxygen but keeps very little in reserve, so any cutoff of oxygen to the brain will result in cell death within three to seven minutes; that is why a stroke can kill so quickly. When blood is cut off from heart, a heart attack occurs and can also take a life fairly swiftly. But since our bodies aren't designed to last forever, sometimes the body's systems just simply wear out [9].
Any pain that a dying person feels can usually be managed by a doctor in some way. The dying person is often disoriented, and feels quite uncomfortable in the body orientation. As the cells inside a person lose their connections, the person may start convulsing or having muscle spasms. We can't know exactly how the person is feeling at this point, though those who have had near-death experiences (NDE) seem to agree that the process is not painful. NDEs appear to have some common characteristics, including a feeling of peace and well-being, a sense of separation from the physical body and a sensation of walking through darkness to enter light [9].
Figure 9. Jadasphot or Supernova Stage of unit composite structure
When the heartbeat and breath stop, a person is clinically dead. There is no circulation, and no new reserves of oxygen are reaching cells. However, a clinical death also denotes a point where the process is reversible, by means of Cardiopulmonary Resuscitation (CPR), a transfusion or a ventilator. The point of no return is biological death, which begins about four to six minutes after clinical death. After the heartbeat stops, it only takes that long for brain cells to begin dying from lack of oxygen. Resuscitation is impossible at this point [9].
B. Death in spiritualism
Any object, psychic (mental) or physical, always emanates waves. The solidarity of our composite structures remains
The 3rd Human and Social Sciences at the Common ConferenceOctober, 5. - 9. 2015, www.hassacc.com
Philosophy, Ethics and Religion eISSN: 2453-6075, cdISSN: 1339-522X10.18638/hassacc.2015.3.1.153 - 205 - ISBN: 978-80-554-1124-8

unchanged in spite of wear and tear as long as the nucleus remains under the influence of the resultant centripetal force. Pranah or vital energy is the master device to control these five fundamental elements of a solid composed body. The cooperative activities of the ten vayus (namely five centre-seeking such as prana, apana, samana, udana and vyana and five centrifugal such as naga, urma, krikala, devadatta and dhananjaya) known as “Pranah” are necessary to make remain a body intact and alive [11]. In condition of imbalance resultant interial force and congenial environment, all the five elements in a composite body may split into their own original forms resulting disappearing solidness in an entity [11].
Prana vayu acts between the navel point and the vocal cord and performs inhalation and exhalation functions in the body. Apana resides from payu (anus) to the navel-point and controls the movement of urine and stool. Samana resides in the navel sphere and maintains function adjustment between prana and apana vayus. Udana resides in throat and controls functions of vocal cord and voice in the body. Vyana regulates the blood circulation and the physical function of the afferent and efferent nerves of body. Naga (serpent) vayu empowers body‟s activities of jumping or extending and also throwing an object. Kurma (tortoise) vayu helps functioning body contraction. Krikala vayu helps in yawning. Similarly, devadatta vayu is responsible for thirst, hunger, inducing sleep and drowsiness in the body [11].
Proper adjustments among psychic waves, physical waves and the Pranah are essential to maintain the unit composite structure. Association by proper adjustment and parallelism of the psychic and physical body waves causes life and dissociation under adverse conditions results in death. Such dissociation can also take place if the waves of the physical structure get cruder due to old age or any other physical deficiencies and diseases of physiological and pathogenic origins etc. Physicians may help restore proper physical wave-length and thus a body restores health once again. Similarly, practicing yoga, performing pranayam and self meditating help regulate different vayus imparting health resilience in the physical body.
A physical deficiency of the body due to diseases results in the weakening of the prana and apana vayus resulting unbalancing samana vayu in the body creating a vehement fight in the navel area and in the vocal cord. When samana loses its vitality, prana, apana and samana consolidate into one and strike udana vayu resulting a person gets sick and feels uneasiness. The moment udana loses its separate identity; vyana also comes in contact with the collective force of all the internal vayus. Thus getting all centre-seeking vayus associated into one, move throughout the physical body with great force and strike at every delicate point of body for an outlet. This is the situation at the point of death. The combined vayus pass out of the body, and with their passing away from the physical structure all the external vayus, except dhananjaya leave the physical structure. As said earlier dhananjaya vayu induces sleep, this vayu causes a deep sleep to dead. That is why dhananjaya remains in the body even after all nine vayus abandon the body. At last, this vayu gets liberated when the dead body is burnt or gets totally decayed [11].
V. REBIRTH
Rebirth may be defined as the re-embodiment of an immaterial part of a person after a short or a long interval after death, in a new body, whence, it proceeds to lead a new life in the body more or less unconscious of its past existences, but containing within itself the “essence” of the results of its past lives, which experience goes to make up its new character or personality [3].
Buddhism teaches us that the process of death and rebirth will continue until “nirvana or liberation” is attained. To Buddhism, death is not the end of life; it is merely the end of the physical body [6]. Most religions believe that the core of the person, the real person, is the soul, a non-material and eternal entity that survives even after-life [5].
Objections to claims of rebirth include the facts that the vast majority of people do not remember previous lives and there is no mechanism known to modern science that would enable a personality to survive death and travel to another body, barring the idea of biocentrism [18]. In the No-Rebirth scenario death is something like the event horizon of a black hole. Crossing the event horizon of a black hole is a one-way journey and after crossing it nothing can comeback, not even light.
For the last fifty years men like Oliver Lodge, Broad, and Rhine explored some new frontiers of the human mind. Their findings were proved authentic and supported rebirth. And many such experiments to contact bodiless spirits have been successful in establishing that souls change their bodies, which are born again and again. Without the help of any technical aids communication could be established with a person who is thousands of miles away, which means that astral communication or communication without the help of any physical instruments is possible [18]. Remembrance of past life is known as “extra-cerebral memory”. It recalls an existence beyond our brain and the physical body. Extra-cerebral memory usually remains especially in child for a short period, 4 to 5 years. If it remains for long, the child will be unable to adjust the “two personalities” of different wavelengths and may become mad or fall sick and die to take another suitable form of life to adjust its mental waves. Or soon the child will forget the past memory for congenial environment for future development [5].
A human being is composed of the body and an immaterial part. The body which is material part is well understood because it fell within the Classical Science realm of Res Extensa (matter) and was extensively studied by scientists. The immaterial part has not been studied by scientists because it fell within the classical Science realm of Res Cogttans (mind). Even in Medical Science early doctors believed that all elements of the human being were only due to disorders of the material body. The subject of psychiatry in western medicine is more recent origin. Psychiatrist Ian Stevenson from the University of Virginia investigated many reports of young children claimed to remember their past lives. Stevenson claimed there were a handful of cases suggesting the evidence of xenoglossy [17].
The 3rd Human and Social Sciences at the Common ConferenceOctober, 5. - 9. 2015, www.hassacc.com
Philosophy, Ethics and Religion eISSN: 2453-6075, cdISSN: 1339-522X10.18638/hassacc.2015.3.1.153 - 206 - ISBN: 978-80-554-1124-8

In the Rebirth scenario death is not an event horizon because only the body, the material part, disintegrates and goes into a state of no return. The immaterial part (soul) enters into a scientifically unknown state and reappears, after a period, in a scientifically known state in the body of an unborn infant. British neurologist John Eccles concluded that human consciousness was extra-cerebral and that the non-physical mind entered the physical brain during embryological development [1]. This is how life comes into physical creation.
Scientists speculate that antimatters (immaterial) still exist somewhere else in space lead to an existence of anti-universe. Uncertainty principle state that empty space is filled with pairs of material (particle) and immaterial (antiparticles) [14]. This supports the existence of Real universe (immaterial universe) somewhere in cosmos supporting the philosophy of an existence of soul (immaterial part) entering in a person as a portion of Real universe remains parallel with physical body hexagonally. Thus soul is embedded within our physical body itself in the form of Parallel universe symbolically as shown in Figure 10 and Figure 11. Thus the portion of Real universe with its sentient, mutative and static forces forming an equilateral triangle and the three forces of Physical universe such as matter energy and information as another equilateral triangle are over lapped and forms a physical body of Virtual universe. All the forces of both the entities are equal in strength and balanced so it has been symbolically represented by equilateral triangles as shown in Figure 10 and 11. Such soul exists in the living beings and all kind of physical objects in the form of immaterial part. The difference is only at its level of consciousness. Soul remains in a Parallel universe unless merged into the Absolute entity after the devoid of all the past experience or deed of a physical body. Soul finds its new form of body depending upon one‟s past experience (deed) and takes birth in the Virtual universe, meaning a regeneration of matter and life into Virtual universe again in the form of a new physical body (Figure 8). This is just like the way an electron disappears from an atomic orbital and reappears in another without passing through the space in between, the difference being that in the disappearance and reappearance of an electron there is no time gap in between [3]. Modern science, especially quantum mechanics, has compelled us to accept unintelligible mechanism of natural phenomenon-like the jump of the electron-and we do not hesitate to accept them. Likewise with the data and observations available we are compelled to accept rebirth and the hypothesis of the Theory of Absolutivity as a reality.
A standard procedure used at present for the acceptance of any scientific theory described by Geremy Hayward as a four step scientific process are a) study the relevant phenomenon, b) formulate the new theory, c) use the theory to predict observations that we should able to make if the theory is correct, and d) look for these predicted observations. Richard Feynman, Noble laureate for Physics combines those steps a) and b) and describes it as a three step process. If the observations made in the last step agree, the theory becomes acceptable. If more and more observations show agreement the theory receive stronger scientific acceptance [3].
Hence the phenomenon of rebirth is already known and therefore the steps a) and b) are already there. In examining the
scientific acceptability of rebirth, therefore, one has only to go through the last two steps of the above scientific process. If this is done successfully rebirth is proved in the way as any other theory of modern science is proved.
Professor Robert Lanza from Wake Forest University School of Medicine in North Carolina explained that the life and consciousness are the keys to understanding the true nature of the universe suggesting a person's consciousness determines the shape and size of objects in the universe and that all the matter and the cosmos are constructed from the consciousness [17] which is also in conformity with the Theory of Absolutivity as explained earlier. Similarly, theoretical physicists believe that there is infinite number of universes with different variations of people, and situations, taking place simultaneously. This demonstrating the matter and energy can display characteristics of both waves and particles, and the behavior of the particle changes based on a person's perception and consciousness. This multi-verse has been represented by expanding and contracting universes (Figure 6) supporting the hypothesis of the Theory of Absolutivity.
Figure 10. Formation of Parallel Universe
Figure 11. Parallel Universe
Thus the observations on spontaneous recall of past lives, past life therapy, child prodigies, transforming consciousness
The 3rd Human and Social Sciences at the Common ConferenceOctober, 5. - 9. 2015, www.hassacc.com
Philosophy, Ethics and Religion eISSN: 2453-6075, cdISSN: 1339-522X10.18638/hassacc.2015.3.1.153 - 207 - ISBN: 978-80-554-1124-8

(immaterial part) into a matter (material part), life and energy match the predictions made in the third stage of the scientific process completing the four step test for scientific acceptability. On the basis of these tests it is concluded that the scientific acceptability of the phenomenon of rebirth and the hypothesis of Theory of Absolutivity is in conformity on these accounts.
VI. CONCLUSION
Absolute entity (Universal consciousness) holding around the Virtual and Real universe makes entire Cosmos in existence. The matter and energy can display characteristics of both waves and particles, and the behavior of the particle changes based on a person's perception and consciousness. A person‟s consciousness determines the shape and size of objects in the universe. Physical structures are composed of five fundamental factors such as ethereal, aerial, luminous, liquid and solid as unit within composite body. The manifestation of Pranah or life depends on two essential conditions. First, the resultant of Prana must be an interial force (centripetal force) and secondly, there must be a congenial environment. Association by proper adjustment and parallelism between the psychic (Parallel universe) and physical body (Virtual universe) waves cause life and its dissociation under adverse conditions results in death.
Living beings are taking births in different forms repeatedly, and each birth, in time duration; go dead in this Virtual world till one is free from all karma(past deed) accompanied with Soul. Human beings could be liberated from the accumulated karma forever by virtue of following institution or performing regular meditation. It is the duty of Cosmic mutative force to provide the Soul a proper physical parallelism for due expression. This is done by making the dissociated mind penetrate into a subtle physical structure. The Theory of Absolutivity has tried to establish the above facts scientifically supported by the works of many modern scientists and philosophers in this direction.
REFERENCES
[1] Anonymous. (2012, March 5) Universal Consciousness-You are an Infinite Eternal Being.
[2] Cosmicfingerprints. www.brainauten.com/Apologistc/VQ_Booklet. pdf
[3] Granville Dharmawardena, (1996 Nov, 28th). Scientific Acceptability of Rebirth, (Online), Available: http://www.buddhanet.net
[4] G.M. Shrestha, Tantra ka Kehi Rahashya. (in Nepali) Janakpurdham, Nepal. Gopal Man Shrestha Publication, 1995, 81 pp.
[5] K. & S, Rawat, Punarjanma (Rebirth: A Scientific Reasearch) (in Nepali). Ratna Pustak Bhandar, Kathmandu. 2012. 163 pp.
[6] L. Cheodon, Cosmology Concept in Buddist Philosophy. Paper presented at Tribhuvan University, Kathmandu, Nepal. 21 March 2012.
[7] M.M. Shrestha, The Development Dimension, A Converging Point of Eastern & Western Philosophy and Sciences. Lalitpur, Nepal. Usha Publication, 2009. 234 pp.
[8] M.M. Shrestha, The Secrecy of the Universe: TheTheory of Absolutivity, Human and Social Sciences at the common conference (HASSACC), Slovakia. Nov 17-24, 2014.
[9] Molly Edmonds (2015, February 2nd). How Dying Works.
[10] P.R. Sarkar, Idea and Ideology. Culcutta, India. Ananda Marga Publications, 1984. 102 pp.
[11] P.R. Sarkar, Microvitum in a nutshell. Culcutta, India. Ananda Marga Publications, 1991, 158 pp.
[12] Ranade, D. (2008, Dec. 30) Bose-Einstein condensate and state of Samadhi,.
[13] R.S. Balsekar, (2008, Feb. 20) Consciousness Pervades the Real and Unreal. The Times of India, http://spirituality.Indiatimes.com.
[14] S.W. Hawking, The Theory of Everything, The Origin and Fate of the Universe, India, Jaico Publishing House, 2007, 132 pp.
[15] T.K. Dutta, (2002, September, 9) Consciousness be Reduced to Matter? The Times of India.
[16] V.F. Gunaratna, Dharma Data, (1980) Rebirth, Rebirth Explained. Kandy.
[17] W. Victoria, (2014, February 5) Quantum physics proves that there is an afterlife, claims scientist.
[18] Wikimedia Foundation, Inc., (2012, June 25) Scientific Enquiry into Rebirth is Quite Possible, Discourses.
The 3rd Human and Social Sciences at the Common ConferenceOctober, 5. - 9. 2015, www.hassacc.com
Philosophy, Ethics and Religion eISSN: 2453-6075, cdISSN: 1339-522X10.18638/hassacc.2015.3.1.153 - 208 - ISBN: 978-80-554-1124-8

Business Ethics and Social Media Framing Moral Cosmopolitanism in Facebook’s Statement of Rights and Responsibilities
Spyridon Stelios
School of Applied Mathematical and Physical Sciences
National Technical University of Athens
Athens, Greece
Abstract—Moral cosmopolitanism refers to the duty to respect
and promote universally basic human rights and justice. Almost
all cosmopolitan conceptions of morality hold that human beings
as a whole are morally important. A content analysis on the
moral cosmopolitanism frame is being applied on 10 sections of
Protecting Other People's Rights of the Facebook’s Statement of
Rights and Responsibilities. Results indicate a strong presence of
the frame. This redefines the way in which a social network is
operating within the field of business ethics, laying the
foundation for further research.
Keywords- Moral Cosmopolitanism, Social Media, Business
Ethics, FramingAnalysis
I. INTRODUCTION
Much has recently been said about social networks. What is certain, in principle, is that on social networks, people are just as much readers as they are content producers. It is within the context of electronic free assembly and association that individuals gain new opportunities for participation and an opportunity to communicate with each other in different ways. But apart from direct communication capability shared by members, there are other parameters that maintain or aspire to maintain group cohesion. In this study it is argued that one of these parameters is the moral status of the group
This paper investigates whether and in what way an ethical frame, namely moral cosmopolitanism is implied or even promoted in Facebook’s Statement of Rights and Responsibilities. Of course moral cosmopolitanism in this case applies in the microcosm of network users. Once identified a second question concerns the reasons why a media company and especially a social network would promote moral cosmopolitanism. The first question is of particular interest as there has been no previous research study. The second question is based on a hypothesis. Obviously its confirmation cannot be established here. Nevertheless, it is an assumption that deserves to be explored further, as its verification would mean that favoring an ethical behavior of users relates to media corporate policy.
Furthermore, much has been said for the overlap between business and media ethics. So, on a second level of analysis, it will be investigated whether the presence of ethical cosmopolitanism in a social network’s Terms of Use is a differentiating factor between practices concerning business ethics and media ethics.
II. THE ETHICS OF SOCIAL MEDIA
Social media is an umbrella term used to describe social interaction through a suite of technology based tools , many of which are internet based. This includes networking sites, such as facebook ([1]). Internet social media demonstrate special characteristics, one of whom is that all content published is almost immediately available to a potentially worldwide audience. This unique feature determines or at least could determine a specific moral substance of a network’s offered servises.
A. Business Ethics or Media Ethics?
Internet has revolutionized the nature and speed of communication allowing for huge quantities of data and information to be rapidly transmitted, anywhere and anytime. This feature enables companies acting as networking sites, to forge ever-closer relationships with customers and users. That is why there is undoubtedly an increased interest shown by managers and chief executive officers, as well as by governments, in ethical issues that (might) implicate companies in this sector. Why is it that these issues seem to be high on the public agenda? One reason is that there is an increased public expectation especially towards social networking sites. The public spotlight is constantly upon them pushing questions of ―right‖ conduct more to the fore.
Within the framework of business ethics, [2] (p. 101) notes that ―companies are viewing their brands as a set of values and beliefs, even a distinct corporate personality, that has the potential to attract customers and inspire their commitment and loyalty. Business success can hinge on the perception of a brand’s attributes and appeal compared with those of competing brands, thus highlighting the need for brands to be nurtured, managed, sustained and protected.‖ Of course one of the theoretical questions for social media ethics is whether it actually constitutes a distinct field or it is just a kind of business ethics. A prima facie a distinction in this case seems clearer because users tend to forget or overlook the economic and thus speculative side of online networks.
The theory of business ethics is structured by two research approaches, the empirical and the normative one. Researchers with philosophical training have introduced purely normative, non-empirical methods to study business ethics, just as they did earlier to other fields of professional ethics. On the other hand, business school researchers with training in empirical methods have applied their techniques (often adapted from marketing and elsewhere) to study important issues in corporate ethics
The 3rd Human and Social Sciences at the Common ConferenceOctober, 5. - 9. 2015, www.hassacc.com
Philosophy, Ethics and Religion eISSN: 2453-6075, cdISSN: 1339-522X10.18638/hassacc.2015.3.1.183 - 209 - ISBN: 978-80-554-1124-8

([3], p. 253). Social media ethics tend to incorporate a scheme of both empirical and normative approaches that produces a powerful stream of research.
Probably the most important component in ethical behavior of media is regulation. What kind of regulation should be imposed by government or firms themselves? One answer is that regulation has to be value-led. Reference [4] ( p. 188) notes that the developing of a value-led regulation cannot be forced; it can only come from within. Firms have to pursue a more active engagement with commonly shared values, aiming eventually at a value-led self-regulation. In the financial services industry, [4] has named 5 core values that everyone wants to see operating effectively. These are: i) fairness, ii) straightforwardness and absence of deception, iii) responsibility, learning and accountability, iv) consideration for others, and v) trust and reliability. Could it be that because of their unique nature, social media are engaging to a universally common value that ultimately distinguishes them as ethical entities from other corporate organizations? To answer this question, we need to present the concept and nature of this universally common value.
B. Moral Cosmopolitanism
Fundamentally, moral cosmopolitanism is a moral commitment to help human beings. Philosophically, it refers to the duty to respect and promote universally basic human rights and justice and to aid fellow human beings (e.g. foreigners) who are suffering. Almost all cosmopolitan conceptions of morality hold that human beings as a whole are morally important. Thus, all must be properly taken into account in practical deliberations about any actions that could significantly affect their fundamental rights.
One can distinguish between strict and moderate forms of cosmopolitanism. Within this sphere, strict cosmopolitans operate with the claim that the duty to provide aid neither gets weighed against any extra duty to help locals or compatriots nor increases in strength when locals or compatriots are in question. Based on this, theorists are guided by either utilitarian assumptions (e.g. [5]) or from Kantian assumptions (e.g. [6]). On the other hand the so-called moderate cosmopolitans (e.g. [7]) acknowledge the cosmopolitan scope of a duty to provide aid, but insist that we also have special duties to compatriots ([8]).
Due to the conspicuous injustice of current international economic, environmental and social conditions, several arguments in favor of moral cosmopolitanism have been formulated. Theorists commonly base their arguments on one or another universal form of morality (one example is political, cultural and economic cosmopolitanism). Reference [9] (p. 50) has argued that a single cosmopolitan culture is emerging worldwide spreading across all indigenous cultures, and carrying to each of them what are, in some at least geographical sense, global human rights. So the United Nations' Universal Declaration of Human Rights may be read as assuming a kind of moral cosmopolitanism. The rationale behind it assumes, or at least aspires to, a universal approach to articulating international human rights.
In a meta-ethical level, cosmopolitanism represents the position that some system of ethics applies universally. That is, for all similarly situated individuals, regardless of any distinguishing feature such as nationality, sex, culture, race, religion, sexual orientation, etc. This is in contrast with moral relativism according to which moral justification or truth is relative, because people typically belong to many different groups defined by various criteria: culture, religion, political territory, ethnicity, race, gender, etc. Of course, there appears to be no objective map of the world that displays its division into social groups to which the truth or justification of moral judgments are relative. For that reason it is important to find a plausible way of identifying the specific group of persons ([10]).
III. STATEMENT OF RIGHTS AND RESPONSIBILITIES
This study applies a content analysis in Facebook’s Statement of Rights and Responsibilities and particularly Paragraph 5 entitled Protecting Other People's Rights. Its 10 points are presented below:
1. We respect other people's rights, and expect you to do the same.
2. You will not post content or take any action on Facebook that infringes or violates someone else's rights or otherwise violates the law.
3. We can remove any content or information you post on Facebook if we believe that it violates this Statement or our policies.
4. We provide you with tools to help you protect your intellectual property rights. To learn more, visit our How to Report Claims of Intellectual Property Infringement page.
5. If we remove your content for infringing someone else's copyright, and you believe we removed it by mistake, we will provide you with an opportunity to appeal.
6. If you repeatedly infringe other people's intellectual property rights, we will disable your account when appropriate.
7. You will not use our copyrights or Trademarks or any confusingly similar marks, except as expressly permitted by our Brand Usage Guidelines or with our prior written permission.
8. If you collect information from users, you will: obtain their consent, make it clear you (and not Facebook) are the one collecting their information, and post a privacy policy explaining what information you collect and how you will use it.
9. You will not post anyone's identification documents or sensitive financial information on Facebook.
10. You will not tag users or send email invitations to non-users without their consent. Facebook offers social reporting tools to enable users to provide feedback about tagging.
IV. METHODOLOGICAL BACKGROUND AND DESIGN
As already mentioned, methodologically, the study is a content analysis. Content analysis refers to contextualized
The 3rd Human and Social Sciences at the Common ConferenceOctober, 5. - 9. 2015, www.hassacc.com
Philosophy, Ethics and Religion eISSN: 2453-6075, cdISSN: 1339-522X10.18638/hassacc.2015.3.1.183 - 210 - ISBN: 978-80-554-1124-8

interpretations of communication content in order to produce valid and reliable inferences. This type of analysis was selected because of its nature as ―a research technique for making replicable and valid inferences from data to their context‖ ([11], p. 21). In addition, according to [12], content analysis can be used to compare levels of communication, to identify the intentions and other characteristics of the communicators and to reveal the focus of attention at any given period. Combined with framing theory, content analysis can systematize and quantify frames found in communication content, and thus, provide valid inferences.
A content analysis on the moral cosmopolitanism frame is being applied on 10 sections of Paragraph 5 entitled Protecting Other People's Rights of the Facebook’s Statement of Rights and Responsibilities. The concept of framing has been investigated by a variety of researchers from several disciplines in social sciences. Frames are understood either as a characteristic of a text or as cognitive structures used by recipients. Essentially, they are sense-making devices that could be related to words, images, phrases, and presentation styles that a speaker uses when relaying information to another. Reference [13] (p. 10) describes them as ―principles of organization which govern events—at least social ones—and our subjective involvement in them‖. Reference [14] (p. 11) states that ―the concept of framing refers to subtle alterations in the statement or presentation of judgment and choice problems.‖ So, framing may be studied as a strategy of constructing and processing a kind of discourse. Reference [15] (p. 52) notes that, ―to frame is to select some aspects of a perceived reality and make them more salient in a communicating text, in such a way as to promote a particular problem definition, causal interpretation, moral evaluation, and/or treatment recommendation for the item described‖. By incorporating both text characteristics and mental processes, framing is structured and signified by the notion of salience, i.e. the means making a piece of information more noticeable and memorable to the receiver.
Overall, frames are abstractions that succeed in structuring message meaning and framing theory suggests that the way something is presented by the media to the audience, influences the choices of the latter on how to process that information. In that sense, media is focusing attention on certain occurrences and then places them within a field of meaning. In addition, they may assume the role of engaging and strengthening universalism values through the way people incorporate them in their language and in their lives. Obviously, the concept of framing may be expanded to social media as well, although that domain constitutes a newly formed research field where framing analysis has not been adequately performed. This is also one of the main challenges for undertaking this research project.
So, the presence of a moral cosmopolitanism frame is been investigated in each section of paragraph 5. To identify the specific frame in the text, every section should answer the following question: Does the text structure a meaning of a universally applied system of ethics or universal common values?
V. FINDINGS
Section 1 asks from users to respect the other people’s rights. This presupposes a common system of rights shared among users. Section 2 takes a more active stance toward the user by prohibiting her to take action(s) that violate another user’s rights. So, implicitly there is an agreement or understanding that all users obey the laws of a common ethical system. Both sections refer the word ―rights‖ in their text. Section 3 presents a warning about the actions Facebook intends to undertake if someone violates the Statement of Rights and Responsibilities. So here a clear warning is been exhibited against anyone who violates any ethical principle constituting this specific system of common values. Section 4 reinforces the protection of individual rights. This by itself creates a safety valve of participation for all members that ultimately strengthens the moral bond within the group regardless of its orientation. Then, after the preceding warning, the Statement in section 5 is trying to disclaim its responsibilities in case of misbehavior. Here Facebook acquires the role of a user, implying how any user/member of this common value system should behave in similar cases. Section 6 refers to the need to protect copyright by threatening users who infringe other people's intellectual property with expulsion from the network. In section 7 the use of intellectual material associated with this social network is prohibited, unless it is permitted by the network’s Brand Usage Guidelines. In this case there is no reference in moral cosmopolitanism frame. There is one clear and explicit statement aiming to prevent unauthorized copyright actions not among users but between users and Facebook. In section 8 Facebook sets rules of conduct for users who (might) exchange information and data, denying any own responsibility. Here all users are treated as a single group where nobody can behave outside a specific action framework. Section 9 refers to one basic human right that refers to the protection of personal data such as financial information. The statement here demonstrates an ethical commitment and clearly reflects a moral obligation without however stating the consequences its violation will entail. Finally, tagging someone, i.e. creating a link to their profile is the subject of the final section, section 10. Here again we are dealing with the protection of network members’ rights especially with regard to privacy. Interestingly, this reference about the obligation not to send email invitations to non-users adds in non-users to this set of users bound by common rights and obligations.
Beyond the level of propositional meaning there are also specific words indicating the existence of the frame. These words are: ―rights‖, ―law‖, and ―consent‖. The word ―rights‖ is mentioned in six sections and the words ―law‖ and ―consent‖ are mentioned in two different sections respectively. Overall, the moral cosmopolitanism frame is present in 9 out of 10 sections of Protecting Other People's Rights paragraph. What we can make of these findings is that cosmopolitanism is evident in the Terms of Use of that specific social network. It seems, prima facie, to accompany or even promote a sense of global equality for its members, thus creating the necessary background of applying the rules.
The 3rd Human and Social Sciences at the Common ConferenceOctober, 5. - 9. 2015, www.hassacc.com
Philosophy, Ethics and Religion eISSN: 2453-6075, cdISSN: 1339-522X10.18638/hassacc.2015.3.1.183 - 211 - ISBN: 978-80-554-1124-8
VI. CONCLUSION
It is certain that this short study does not allow the formulation of adequate answers for all questions raised. Of course some preliminary conclusions can be drawn forming the basis for future investigations. Specifically, as far as the first question is concerned, implications of a moral cosmopolitanism frame were identified in the text of 9 sections of the Statement. Next, an answer on the possibility of Facebook making a choice to incorporate conceptual schemes of moral cosmopolitanism requires a more extensive survey. But the fact that these schemes exist cannot be ignored. Finally, as far as the third question is concerned, results indicate that the answer to whether the presence of a moral cosmopolitanism frame is a differentiating factor between practices concerning business ethics and media ethics is not just a yes or no. More specifically, unlike other media (e.g. television) the terms of use are set out more clearly and can be applied directly and decisively on behalf of the social media company. Hence morality plays a more active role in user's interaction with the media and user’s interaction with another user. This encouragement of moral cosmopolitanism seems also good for business since it creates a feeling of global equality for its members. It is a policy satisfying ethical requirements as well as business objectives, forming an ideal amalgamation of business and media moral practices.
In conclusion, it should be noted that empirical approaches to social media research indicate that strengthening common values among users, enhances usability. In this respect moral cosmopolitanism may be regarded as a model of value-led self-regulation. Contrary to moral relativism, cosmopolitanism seeks no plausible way of identifying specific groups within social networks users, assuming no distinguished feature, and thus maintaining the universality of its application.
REFERENCES
[1] Institute of Business Ethics: Business Ethics Briefing (2011, December). The ethical challenges of social media. Available at: https://www.ibe.org.uk/userassets/briefings/ibe_briefing_22_the_ethical_challenges_of_social_media.pdf
[2] O. Harpur, ―Building a sustainable reputation,‖ in Business Ethics, The Economist Books, C. Moon and C. Bonny Eds. London: Profile Books Ltd, 2001, pp. 101-115.
[3] T. Donaldson and T. W. Dunfee, ―Toward a Unified Conception of Business Ethics: Integrative Social Contracts Theory,‖ The Academy of Management Review, Vol. 19, No. 2, pp. 252-284, Apr., 1994.
[4] D. Jackman, Values-led regulation,‖ in Business Ethics, The Economist Books, C. Moon and C. Bonny Eds. London: Profile Books Ltd, 2001, pp. 186-194.
[5] P. Singer, Practical Ethics. Cambridge: Cambridge University Press, 1993.
[6] O. O'Neill, Bounds of Justice. Cambridge: Cambridge University Press, 2000.
[7] S. Scheffler, Boundaries and Allegiances: Problems of Justice and Responsibility in Liberal Thought. Oxford: Oxford University Press, 2001.
[8] P. Kleingeld and E. Brown, "Cosmopolitanism," in The Stanford Encyclopedia of Philosophy, E.N. Zalta Ed. Fall 2014 Edition. Available at: http://plato.stanford.edu/archives/fall2014/entries/cosmopolitanism/
[9] R. J. Vincent, Human Rights and International Relations. Cambridge: Cambridge University Press, 1986.
[10] C. Gowans, ―Moral Relativism,‖ in The Stanford Encyclopedia of Philosophy, E.N. Zalta Ed. Spring 2012 Edition. Available at: http://plato.stanford.edu/archives/spr2012/entries/moral-relativism/
[11] K. Krippendorf, Content Analysis: An Introduction to its Methodology. London: Sage, 1980.
[12] B. Berelson, Content Analysis in Communication Research. Glencoe, IL: The Free Press, 1952.
[13] E. Goffman, Frame Analysis. New York: Harper, 1974.
[14] S. Iyengar, Is anyone responsible? How television frames political issues. Chicago, IL: University of Chicago Press, 1991.
[15] R. M. Entman, ―Framing: Toward Clarification of a Fractured Paradigm,‖ Journal of Communication, Volume 43, Issue 4, pages 51–58, December 1993.
The 3rd Human and Social Sciences at the Common ConferenceOctober, 5. - 9. 2015, www.hassacc.com
Philosophy, Ethics and Religion eISSN: 2453-6075, cdISSN: 1339-522X10.18638/hassacc.2015.3.1.183 - 212 - ISBN: 978-80-554-1124-8

Greenways – an alternative mobility structure and an
urban development strategy
Rute Sousa Matos and Rita Calhau
University of Évora
Art and Art History Investigation Centre (CHAIA)
University of Évora
Évora, Portugal
Alexandre Lisboa
Oeiras City Hall
Green Spaces Department
Oeiras, Portugal
Abstract— Greenways are fundamental in establishing a
continuous landscape structure. This landscape structure
involves natural and cultural factors that determine flows and
processes both at an ecological level, both social and aesthetic
ones.
Within the extensive range of functions that green corridors play,
one should highlight the implementation of an alternative
mobility structure enhancer of natural and artificial flows in the
landscape. We intend to establish a strategic plan implemented
through a sustainable structure, enabling to effect the flows and
processes referred to in a context of natural and cultural
continuity, enhancing the landscape values which is going
through, giving a balanced soil occupancy considering the
potential of each area faced with fast current urban growth.
Our main objective is then the application of the concept of
"greenway" in the municipal ecological structure, by proposing a
network of corridors and the subsequent definition of different
types and proposals, according to their respective potential. This
aims to protect the values and natural resources, as well as
forestry, agricultural and cultural areas as well as the respective
integration of key systems for environmental protection and the
enhancement of rural and urban areas. It is intended that they
act as continuous landscape structures ensuring the
multifunctionality of ecosystems and of landscape.
The case study presented is the municipality of Oeiras, District of
Lisbon. Portugal.
Keywords- Greenways; continuous landscape structure;
landscape multifunctionality
I. INTRODUCTION
Oeiras is already a municipality that stands out environmentally in the context of the metropolitan area of Lisbon. There have been concerns of reconciling social and economic development through the creation and maintenance of open spaces. This is particularly important in urban areas where urban expansion must find ways to include what nature offers us.
Thus, the municipality has set the goal of Oeiras grow in a sustainable and balanced way and proposed to move to a new development paradigm: the concept of “green city”.
The open spaces, the issues of energy, of air, noise and sustainable mobility are part of the strategy to achieve the objective that was set by the municipality. Within the sustainable mobility, simultaneously ecological values safeguard, are greenways, our paper subject.
This paper is the result of a study that has sought strategies for the implementation of a network of greenways in the municipality of Oeiras, in the metropolitan area of Lisbon, in Portugal.
The proposed work is based on a network of greenways coordinated with the municipal ecological structure, and takes various forms depending on the biophysical, social and cultural characteristics essential to it. The purpose of this joint structure, ecology/mobility, is to protect the values and natural resources, and forest, agricultural and cultural areas, as well as to integrate the systems essential to environmental protection and enhancement of rural and urban areas.
The first part of our study addresses the concepts of alternative mobility and of greenways, and then tackles the analysis, interpretation and characterization of landscape. The analysis and framework of the Oeiras council backdrop covers: it’s historical and geographical context, the characterization of its landscape, its coordination with Agenda 21, and the implementation of the council’s Municipal Master Plan (PDM), which is the legislative basis for setting out the main rules on the council’s land use planning.
Following this characterization, we diagnosed in situ both the layout of existing alternative mobility and of the municipality’s ecological structure, comparing both and seeking to find potential links and common features.
Based on this diagnosis, we have defined different types of existing greenways, including those of an ecological and social nature that are vital for proper land use planning, which is central to sustainable development.
The second part of our study presents a few proposals for the different types of greenways found.
The information and data provided in this paper concerns only the greenways, particularly in respect of the objectives and strategies adopted, the definition of their various types, and the proposals found for each of them.
The 3rd Human and Social Sciences at the Common ConferenceOctober, 5. - 9. 2015, www.hassacc.com
Other humanities eISSN: 2453-6075, cdISSN: 1339-522X10.18638/hassacc.2015.3.1.160 - 213 - ISBN: 978-80-554-1124-8
II. MATERIAL AND METHODS
The issue discussed here, including the concept of greenways, the objectives and strategies adopted, in which we now include a strait relation with landscape, led to a discussion by various authors (since twentieth century), thus producing critical studies and works on its relevance. The authors that interest us are the ones that considered the relation between green corridors and landscape as an area of vital experience, both in terms of an ecological and social dimension which should be inherent in the city planning.
This article is then developed based on the literature review on theoretical studies produced on the issue that we aim to develop. We will also study Oeiras green corridors and landscape and the work that has been developed to include them in the urban planning, in terms of its social, economical, ecological, cultural, ethical and aesthetical dimension.
III. DISCUSSION
A. Greenways
The greenway movement is the end result of a planning strategy begun in the early 19th century, not idealized by one single author but rather by a number of individuals and the result of personal efforts that for almost a half a century gradually consolidated and expanded an idea [1]. Although the concept of greenway has existed for more than three decades and its relevance for the green urban structure is well known, no clear reference can be found in Portuguese legislation. Reference is only made to a continuum naturale as a continuing system of natural events in the basic environment law, omitting its social and cultural relevance [2]. The national sustainable development strategy [3], however, more specifically the 5th objective – better international connectivity of the country and balanced enhancement of the land – refers to the support to investment to be made in individual cities, to strengthen the sustainability of their operation, including the support to the creation of greenways and “green” public spaces in the cities, as the fundamental investment for the improvement of their environmental quality. One could say that there is already some ecological concern about the greenways.
In the 1990s, [4] a compiled a broad range of definitions of greenway, which has counteracted the tendency to exclusively assign ecological functions to the greenway. Little refers to these greenways as connectors of fragments of natural ecosystems in urban sites, and mentions also their potential for recreational and leisure uses, and as an alternative mobility system.
Today, and in line with the strategic plan of greenways [5], the Municipal Council of Oeiras defines a greenway as an
a Although Little had started his career as advertising executive in New
York City, he becomes a full-time environmental activist, a writer, journalist and politic analyst; in 1978 he was the president of the American land forum
with the main goal to develop an earth conservation politic. In the “state
university. “ncsu libraries.”. On April 2013 in http://www.lib.ncsu.Edu/specialcollections/greenways/little_mc214.html/.
alternative mobility structure capable of generating natural and artificial flows within the territory. It is characterized by being a system or a single network with spaces contextualized according to their type and arranged hierarchically, based on a principal or secondary green structure of a territory, that is, on natural sites or built sites. [6]
As part of the review of the Master Plans, priority should be given to the development of several proposals contributing to the expansion of the ecological structure, coordinating, as much as possible, the different existing sites. In the review of the 1994 Master Plan, a preliminary study was prepared on the potential layout of a network of greenways for the municipality of Oeiras. In this study, the greenways have two different sets of functions that need to be taken into account in this project: ecological functions, linked to living beings and the environment, and social functions, linked to culture, recreation and leisure.
1) Overall objectives and strategies adopted Based on the analysis and characterization studies carried
out, the following were defined as the main objectives of the strategic plans for greenways:
a) Implement a sustainable structure covering the entire
municipality, to achieve a number of functional and ecological
flows in a continuum naturale context.
b) Coordinate the municipality’s green structure with
an alternative mobility network. Other benefits of the
greenway connectivity include alternative forms of transport,
recreation, and the need or preference for a relationship of
proximity with nature[7].
c) Enhance the natural and intrinsic value of
landscapes crossed by these greenways; the integration of
cycling or cultural routes with the ecological structure adds
value to both structures and promotes their acceptance [8].
However, there is also the intrinsic value of the typical
landscape features to consider; in this particular case, the
many watersheds and enclosed valleys that offer unique views.
d) Ensure the balanced occupation of the area bearing
in mind the purpose of the spaces and the current rapid urban
growth: the implementation of the greenway concept has
gained in popularity abroad in response to climate, cultural
and political changes and to proliferation factors [9].
Economic decentralization and urban expansion have raised
much interest in planning models and alternative methods, as
their physical links offer distinct advantages as regards the
circulation and transport of materials, species and nutrients,
besides being a network of social development that draws
people with different values and perspectives about land use
and planning. This is perhaps the most striking characteristic
of greenways setting them apart from other spatial planning
concepts [10].
The strategies adopted to date are divided into four distinct phases:
Propose an overall municipal structure.
The 3rd Human and Social Sciences at the Common ConferenceOctober, 5. - 9. 2015, www.hassacc.com
Other humanities eISSN: 2453-6075, cdISSN: 1339-522X10.18638/hassacc.2015.3.1.160 - 214 - ISBN: 978-80-554-1124-8
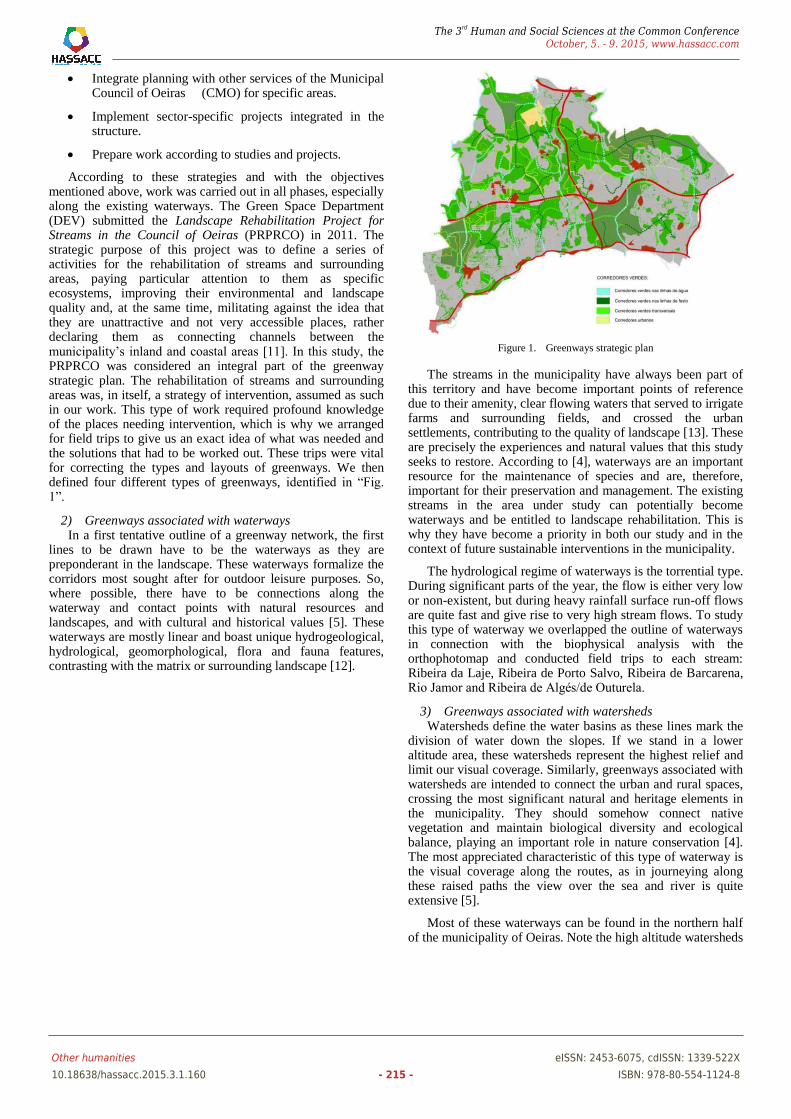
Integrate planning with other services of the Municipal Council of Oeiras (CMO) for specific areas.
Implement sector-specific projects integrated in the structure.
Prepare work according to studies and projects.
According to these strategies and with the objectives mentioned above, work was carried out in all phases, especially along the existing waterways. The Green Space Department (DEV) submitted the Landscape Rehabilitation Project for Streams in the Council of Oeiras (PRPRCO) in 2011. The strategic purpose of this project was to define a series of activities for the rehabilitation of streams and surrounding areas, paying particular attention to them as specific ecosystems, improving their environmental and landscape quality and, at the same time, militating against the idea that they are unattractive and not very accessible places, rather declaring them as connecting channels between the municipality’s inland and coastal areas [11]. In this study, the PRPRCO was considered an integral part of the greenway strategic plan. The rehabilitation of streams and surrounding areas was, in itself, a strategy of intervention, assumed as such in our work. This type of work required profound knowledge of the places needing intervention, which is why we arranged for field trips to give us an exact idea of what was needed and the solutions that had to be worked out. These trips were vital for correcting the types and layouts of greenways. We then defined four different types of greenways, identified in “Fig. 1”.
2) Greenways associated with waterways In a first tentative outline of a greenway network, the first
lines to be drawn have to be the waterways as they are preponderant in the landscape. These waterways formalize the corridors most sought after for outdoor leisure purposes. So, where possible, there have to be connections along the waterway and contact points with natural resources and landscapes, and with cultural and historical values [5]. These waterways are mostly linear and boast unique hydrogeological, hydrological, geomorphological, flora and fauna features, contrasting with the matrix or surrounding landscape [12].
Figure 1. Greenways strategic plan
The streams in the municipality have always been part of this territory and have become important points of reference due to their amenity, clear flowing waters that served to irrigate farms and surrounding fields, and crossed the urban settlements, contributing to the quality of landscape [13]. These are precisely the experiences and natural values that this study seeks to restore. According to [4], waterways are an important resource for the maintenance of species and are, therefore, important for their preservation and management. The existing streams in the area under study can potentially become waterways and be entitled to landscape rehabilitation. This is why they have become a priority in both our study and in the context of future sustainable interventions in the municipality.
The hydrological regime of waterways is the torrential type. During significant parts of the year, the flow is either very low or non-existent, but during heavy rainfall surface run-off flows are quite fast and give rise to very high stream flows. To study this type of waterway we overlapped the outline of waterways in connection with the biophysical analysis with the orthophotomap and conducted field trips to each stream: Ribeira da Laje, Ribeira de Porto Salvo, Ribeira de Barcarena, Rio Jamor and Ribeira de Algés/de Outurela.
3) Greenways associated with watersheds Watersheds define the water basins as these lines mark the
division of water down the slopes. If we stand in a lower altitude area, these watersheds represent the highest relief and limit our visual coverage. Similarly, greenways associated with watersheds are intended to connect the urban and rural spaces, crossing the most significant natural and heritage elements in the municipality. They should somehow connect native vegetation and maintain biological diversity and ecological balance, playing an important role in nature conservation [4]. The most appreciated characteristic of this type of waterway is the visual coverage along the routes, as in journeying along these raised paths the view over the sea and river is quite extensive [5].
Most of these waterways can be found in the northern half of the municipality of Oeiras. Note the high altitude watersheds
The 3rd Human and Social Sciences at the Common ConferenceOctober, 5. - 9. 2015, www.hassacc.com
Other humanities eISSN: 2453-6075, cdISSN: 1339-522X10.18638/hassacc.2015.3.1.160 - 215 - ISBN: 978-80-554-1124-8

– standing at 100 and 200 meters high – located on the northwest and northeast boundaries.
4) Uninhabited connecting greenways According to the strategic plan for greenways, connecting
corridors are used to connect all corridors [5]. We chose to base our approach on two different types of connecting greenways which cement the idea of the municipality’s network of greenways: connecting greenways in uninhabited areas and connecting greenways in populated area. As regards the former, emphasis will be given to connections between watersheds and waterways and/or between two waterways. In respect of the latter, their purpose is to interconnect the urban centers and/or a greenway and an urban center. We dealt with in particular with corridors in uninhabited areas and took into account all corridors formed by open spaces in unbuilt areas. They are clearly for recreational use as, wherever possible, they allow a direct connection with open recreational and leisure sites and with natural sites. In addition to scaling up the development of leisure, sports and recreational activities, this type of corridor enables the significant improvement of climate conditions by regularizing temperature, radiation, atmospheric pressure, wind and humidity, and also improves air quality by purifying and controlling air pollution, preventing and reducing the risk of flooding and soil erosion, and increasing the typical biodiversity of green urban areas.
To arrive at this typology, we cross-referenced data on the greenway network route for the proposal to review the Master Plan in force with the tree register and the classes of the National Agricultural Reserve areas (RAN) and of the National Ecological Reserve (REN) contemplated in the Master Plan in force.
IV. POPULATED CONNECTING GREENWAYS
As mentioned in the previous typology, if uninhabited connecting greenways refer to watersheds and waterways and or/ between two waterways, populated connecting greenways focus on the coordination of urban centers. They reflect the improvement made in the structure of urban areas, the increase of direct benefits, for e.g., the increase in value of existing buildings close to the rehabilitated green areas, and the increase of indirect benefits, for e.g., the production of oxygen and the reduction in energy consumption as a result of improved climate comfort. These are the corridors most likely to promote mild mobility, for e.g., cycling, in urban centers as an alternative to commuting, and the ones that contribute the most to the increase of vegetation in the urban landscape. Their scope is, however, more limited, consisting mostly of proposals for tree alignments, most of which coincide with the communication routes in urban centers.
To arrive at this typology, we cross-referenced data on the greenway network route for the proposal to review the Master Plan in force with the tree register and the classes of buildings contemplated in the Master Plan in force.
A. Proposals-Type
1) Greenways associated with waterways Interventions in waterways must include cleaning and
environmental rehabilitation of river banks, and urban regeneration for the benefit and sustainable fruition of natural,
social and economic systems. Built structures in the watercourse and in areas part of the floodplains “Fig. 2”, many of them illegal, are significant contributors to the increased likelihood of annual flooding, so their demolition should be considered in the long term.
Once the existing streams in the municipality are rehabilitated, they will interconnect the architectural, cultural and natural heritage bordering them “Fig. 3”. This has its advantages in the regeneration of the riparian area, creating opportunities for social and economic development compatible with the sensitivity of the natural system in question.
The rehabilitation of waterways is a good means to promote forms of sustainable mobility, as they form five north-south axes and will enable the connection of urban centers with existing commerce, services and public transportation. The latter include the existing large scale railway line along the south coast of the municipality, connecting the Lisbon, Oeiras and Cascais municipalities and increasing their tourist attraction.
Intervention works should be based on:
The redefinition of the natural look of riverside beds, by bringing down all stone or concrete walls delimiting them and without any sort of aesthetic or cultural value;
The redefinition of the floodplain area, in the long term;
The definition of walkways and bikeways forbidden to road traffic, with a permeable surface suited to be near waterways;
The creation of relaxation and support areas along the walkways, such as shaded areas, picnic parks and bicycle rental and parking;
The creation of parking spaces at the far ends of these walkways to enhance their use;
The promotion of tourism related to existing heritage elements;
The redefinition of existing community gardens;
The maximum usability of buildings in the surrounding areas for the management and support to cycle routes;
The better fit of equipment within the landscape;
Signage and information guide on the routes.
2) Greenways associated with watersheds Intervention works in greenways in the watershed can take
full advantage of their nature conservation potential, by increasing the native vegetation patches and the biological diversity and ecological balance “Fig. 4”.
Once rehabilitated, high altitude areas in the municipality will be much in demand as they offer wonderful views and good weather conditions “Fig. 5”.
The 3rd Human and Social Sciences at the Common ConferenceOctober, 5. - 9. 2015, www.hassacc.com
Other humanities eISSN: 2453-6075, cdISSN: 1339-522X10.18638/hassacc.2015.3.1.160 - 216 - ISBN: 978-80-554-1124-8

Figure 2. Section of the existing streams.
Figure 3. Section of the proposal.
Figure 4. Section of the existing watersheds
Figure 5. Section of the proposal.
Intervention works in this type of corridor should be based on:
The increase of the ecological structure used by the public, contributing also to avoid the urban sprawl;
The protection of natural heritage with a view to a balanced and sustainable development;
The promotion of better contacts between the population and nature;
The improvement of landscape quality;
The definition of walking and cycling trails, closed to road traffic, using a permeable surface suited to walking and the flow of surface water, and the creation of designated spaces for relaxation and support to walking trails, for e.g., shades areas, picnic park, and bicycle rental and parking;
The creation of alternative uses with the potential of enhancing the use of areas, such as belvederes;
The creation of more educational and environmental protection activities to increase participation and the exercise of citizenship; for example, the creation of environmental education activities for school children, e.g., plantations and education on the importance of vegetation and preservation of natural sites in urban areas.
V. UNINHABITED CONNECTING GREENWAYS
As connecting routes in uninhabited urban areas “Fig. 6” provide access to the surrounding open areas, they offer rather pleasant outdoor off-road trails allowing hikers to learn about the existing rural or farming landscape “Figs. 7 and 8”.
The advantages of these intervention works are as follows:
Increase the development of leisure, sports and recreational activities;
Improve weather quality by regularizing temperature, radiation, atmospheric pressure, wind and humidity;
Improve air quality by purifying and controlling air pollution;
Prevent and reduce the risk of flooding and soil erosion;
Increase biodiversity in urban green spaces.
VI. POPULATED CONNECTING GREENWAYS
Intervention works in this type of greenways “Fig. 9” contribute essentially to increase vegetation in the urban landscape through the rehabilitation of pedestrian walkways “Fig. 10” and proposing new tree alignments along the idle of roads and alongside walkways “Fig. 11”.
The advantages of these intervention works are as follows:
Improve the structure of urban areas;
Increase direct benefits, for e.g., increase the value of existing buildings located close to the rehabilitated green spaces;
Increase indirect benefits, for e.g., the production of oxygen and the reduction in energy consumption as a result of improved climate comfort.
Figure 6. Section of the existing greenways in green spaces.
Figure 7. Section of the proposal
The 3rd Human and Social Sciences at the Common ConferenceOctober, 5. - 9. 2015, www.hassacc.com
Other humanities eISSN: 2453-6075, cdISSN: 1339-522X10.18638/hassacc.2015.3.1.160 - 217 - ISBN: 978-80-554-1124-8

Figure 8. Proposal plan of linkage axes in green spaces.
Figure 9. Section of linkage axes in built areas
Figure 10. Section of the proposal
Figure 11. Proposal plan of linkage axes in built areas.
VII. CONCLUSIONS
The existence of a network of greenways is very important on account of the advantages and unique ecological, social, economic and aesthetic improvements. Today, the impact of greenways all across the world is quite positive on the social well-being of populations they affect directly and indirectly.
In respect of the environment, greenways contribute to the improvement of climate quality by regularizing temperature, radiation, atmospheric pressure, wind and humidity; to the improvement of air quality by purifying and controlling air pollution; to the improvement of acoustic environment and road safety by using vegetation to absorb noise and avoid dazzle caused by oncoming traffic; to the prevention and reduction of the risk of flooding and soil erosion, and to the increase of biodiversity.
Socially-wise, they increase the development of leisure, sports, recreational and educational activities; they allow
cultural outdoor activities, shows, workshops; they are part of the urban design composition, contributing to the organization and definition of spaces and to the scenic beauty of landscapes, in contrast with the artificial inert elements.
In respect of the economic sector, greenways reflect the improvement in the overall organization of the territory; the improvement of the urban area structures; the increase of direct benefits (vegetation used for production, increase in the value of built heritage close to the green areas, creation of jobs for maintaining these green areas), and the increase of indirect benefits (production of oxygen and reduction of energy consumption by improving climate comfort).
In the specific case of Oeiras, the review of the Master Plan is a clear opportunity for assessing the current spatial planning strategies, to develop and safeguard all future activities, even at a broader scale, including the implementation of a greenway connecting the Monsanto Forest Park and Sintra Mountain across Carnaxide Mountain (Monsanto Forest Park, Sintra Mountain and Carnaxide Mountain are important open and ecological areas that are fundamental to include in a regional scale Green Structure. They don’t belong to Oeiras municipality but, as well as Oeiras, they are included in the metropolitan area of Lisbon). This connection further strengthens the purpose of this project, as it is an opportunity for spatial planning and urban development at regional level.
REFERENCES
[1] F. Ramalhete, et al, Geota. Corredores verdes - conceitos base e algumas propostas para a área metropolitana de Lisboa. Lisboa: Grupo de Estudos de Ordenamento do Território e Ambiente.2007.
[2] Lei n.º 13/2002, de 19 de fevereiro de 2002, diário da república. I série a - n.º 42: 1324-1340.
[3] Resolução de conselho de ministros, n.º 109/2007, de 20 de agosto de 2007, diário da república. Série i - n. º 159: 5405-547
[4] C. E. Little, Greenways for America. Baltimore and London: The John Hopkins University Press. 1990.
[5] Câmara Municipal de Oeiras. Plano estratégico dos corredores verdes. Plano de desenvolvimento estratégico. Oeiras: Câmara Municipal de Oeiras. 2005.
[6] Câmara Municipal de Oeiras. Relatório de atividades/resultados/estratégia. Documentos anexos plano estratégico. Oeiras: Câmara Municipal de Oeiras. 2006.
[7] Kaplan et al. referred in J. Ahearn. “Greenways in the USA- theory, trends and prospect”. Cambridge: Cambridge University Press. 2004
[8] M. R. Magalhães, Estrutura ecológica da paisagem, conceitos e delimitação - escalas regional e municipal. Lisboa: Isapress. 2007.
[9] J. Ahern, and J. Fabos, “A global greenway vision: the role of GIS”. [GisPlanet Conference Proceedings GIS PlaNET p.98. 1998].
[10] J. Ahearn, Greenways in the USA- theory, trends and prospect. Cambridge: Cambridge University Press. 2004
[11] Câmara Municipal de Oeiras et al, Plano de requalificação paisagística das ribeiras do concelho de Oeiras. Plano de desenvolvimento estratégico. Oeiras: Câmara Municipal de Oeiras. 2011.
[12] M. G. Saraiva, O rio como paisagem - gestão de corredores fluviais no quadro do ordenamento do território. Lisboa: Fundação Calouste Gulbenkian. 1999.
The 3rd Human and Social Sciences at the Common ConferenceOctober, 5. - 9. 2015, www.hassacc.com
Other humanities eISSN: 2453-6075, cdISSN: 1339-522X10.18638/hassacc.2015.3.1.160 - 218 - ISBN: 978-80-554-1124-8

Published by:
EDIS - Publishing Institution of the University of Zilina Univerzitna 1 01026 Zilina Slovak Republic
Editors: Ing. Michal Mokrys; Ing. Stefan Badura, Ph.D.
ISBN: 978-80-554-1124-8
cdISSN: 1339-522X
eISSN: 2453-6075
DOI: 10.18638/hassacc.2015.3.1
Pages: 218
Printed in: 150 copies
Publication year: 2015
All published papers undergone single blind peer review.
All published papers are in English language only. Each paper had assigned 2 reviewers and each paper went through two-tier approval process.
Papers are published as delivered by authors without content modification. All accepted papers have been formally checked by the conference Technical Committee and regularly reviewed in single blind peer reviewing process by the conference Scientific Committee (Reviewers Committee).
The publication contents are the sole responsibility of the publication author and it does not reflect the Publishing Society, Zilina, Slovakia.
Open Access Online archive is available at: http://www.hassacc.com/archive (proceedings will be available online one month after the publication release).
In case of any questions, notes or complaints, please contact us at: info(at)hassacc.com.com.
Paper Citation Example: In (Eds.) S. Brown, S. Larsen, K. Marrongelle, and M. Oehrtman, Proceedings of the 3rd International Virtual Conference in
Human And Social Sciences at the Common Conference (HASSACC-2015), Vol. 3, pg #-#. Zilina, Slovakia.
Warning
Copyright © The authors mentioned in the table of contents, Publishing Society, Zilina, Slovakia, All rights reserved.
The 3rd Human and Social Sciences at the Common ConferenceOctober, 5. - 9. 2015, www.hassacc.com
eISSN: 2453-6075, cdISSN: 1339-522X- 219 - ISBN: 978-80-554-1124-8

HASSACC 2015
Proceedings in
Human and Social Sciences at the Common Conference 2015
The 3rd Human And Social Sciences at the Common Conference
5. - 9. October 2015
Slovak Republic
ISBN 978-80-554-1124-8
cdISSN 1339-522X
eISSN 2453-6075