
2015 Annual Report
158
2015 Two Thousand Fifteen Annual Report First Northwest Bancorp
-
Upload
khangminh22 -
Category
Documents
-
view
0 -
download
0
Transcript of 2015 Annual Report

2015
Two Thousand Fifteen
Annual Report
First Northwest Bancorp

Message to Our ShareholdersCompletion and transition were our objectives in fiscal 2015. We are proud to have completed the conversion from a mutual form of ownership to a public company in January. We appreciate the community and shareholder support which has helped us strengthen our community bank and will position us for the future. In conjunction with the conversion we were able to fund the First Federal Community Foundation with a combination of cash and stock valued at $9.7 million. We celebrated the first anniversary of our Silverdale branch in Kitsap County, where our phenomenal staff has produced deposit growth above levels achieved in any previous First Federal de novo branch.
Financial Performance
The company experienced a net loss of $5.1 million for the fiscal year ended June 30, 2015. The loss was primarily the result of the costs associated with funding the First Federal Community Foundation. Excluding those one-time foundation costs we would have reported net income of $3.3 million* compared to $2.7 million for the fiscal year ended June 30, 2014, an increase of 21.9%.
Total assets increased $141.5 million, or 17.8%, from $795.3 million at June 30, 2014 to $936.8 million at June 30, 2015. The primary source of increased assets was the conversion which raised $117.6 million in net proceeds. The proceeds of the conversion were invested in cash and investment securities. The balance of cash and investment securities increased from $251.2 million at June 30, 2014 to $405.6 million at June 30, 2015. It is our intent to systematically and prudently reposition these increased assets into higher yielding loans.
Our initial branch expansion in Silverdale was a success, increasing deposit balances at our new location by $24.3 million during the first twelve months. Total deposits for the company increased by $46.8 million from $600.4 million at June 30, 2014 to $647.2 million at June 30, 2015.
The mutual to stock conversion also strengthened our balance sheet, increasing equity 135.4% to $190.7 million at June 30, 2015 from $81.0 million at June 30, 2014. Our capital ratios continue to substantially exceed the regulatory requirements for a well-capitalized financial institution.
The Future
Our strategic plans focus on positioning the company for the future. These plans include geographic diversification, investing in technology and prudent risk management, all of which are intended to increase shareholder value. These commitments by the Board, management and staff reflect our continuing dedication to the communities we serve, delivering the best banking experience anywhere with a home town touch.
Sincerely,
Stephen Oliver Laurence J. HuethChairman, Board of Directors President and Chief Executive Officer
*This is a non-GAAP measure calculated by taking the net loss of $5.1 million calculated on a GAAP basis and adding back the charitable contribution, net of tax, of $8.3 million to arrive at net income of $3.3 million. Differences may occur due to rounding.
Stephen OliverChairman, Board of Directors
Larry HuethPresident and Chief Executive Officer

Community Lending Program
Our Pledge to Provide“You believed in us and we believe in you.”
Through our 2015 mutual to stock conversion process, you supported us by voting to approve our stock conversion which generated additional capital. We are proud to now pledge those resources in Commercial, Consumer and Construction lending through a new special lending program.
First Federal will provide funding to qualified businesses and individuals within our footprint. Our goal is to provide the financial tools necessary to assist in increased productivity, growth and revenue for our local businesses.
First Federal also provides personal lending products to fit consumer needs. We strive to provide competitive interest rates.
Our CommitmentWe are committed to strengthening our communities. Since 1923 we have provided the finest in banking services and solutions. We are one of the largest employers on the Olympic Peninsula, supporting economic growth and development to our communities. We reinvest in the growth and success of our local businesses and people.
Total Assetsas of June 30Dollars in millions
$748.9
$771.9$784.5
$795.3
$936.8
2011 2012 2013 2014 2015
Total Equityas of June 30Dollars in millions
$77.2 $77.3$78.6
$81.0
$190.7
2011 2012 2013 2014 2015
Total Loansas of June 30Dollars in millions
$424.2
$400.7
$449.4
$496.2$487.9
2011 2012 2013 2014 2015
Net Income (Loss)year ended June 30Dollars in thousands
$3,895
($1,960)
$2,318$2,668
($5,090)
2011 2012 2013 2014 2015
Our parked car was totaled by a hit and run driver. First Federal came through for us during this stressful time. Obtaining an auto loan through First Federal was the quickest and most efficient loan process ever.
~Cheryl Baumann
“First Federal supported our vision for our new medical clinic by providing financing when timing for finding financing was difficult. Our clinic now serves over 14,000 patients and is a leader in healthcare delivery in Clallam County. We have a great community partnership with First Federal.”
~ Jamestown Family Health Clinic - Diane Gange, CFO
“First Federal is focused on understanding our business and delivering exceptional results. Great people - great bank!” ~ JWJ Group - John Johnson

Innovative TechnologyInteractive Teller Machines (ITM): Technology is moving forward and so are we with options to manage your finances your way. For some customers, virtual banking may be the wave of the future, but for others the branch network will continue to be important. Our goal is to combine personal/business banking and innovative, efficient technology. Mon - Fri 7:00am - 7:00pm Sat 9:00am - 1:00pmApple Pay: The First Federal Visa card and Apple Pay will change the way you pay. With a single touch you can securely and privately pay at hundreds of thousands of stores and participating apps.
Product SolutionsPersonal and Business Banking: Our focus is on serving, and our banking products are designed to meet yourreal day-to-day financial needs.Commercial/Mortgage/Consumer Lending: You have many lending options at First Federal, and we’ll explore them with you—then put together the combination of terms and rate that fits you best.Investment Services: At First Federal Investment Services, we know that the savings and investment decisions that you make today will impact your financial future.
Complimentary ServicesFirst Federal Visa® Debit Card with UChoose Rewards® and MoneyPass® network. Enjoy the rewards program to earn points for your every day shopping and the MoneyPass ATM Surcharge Free Network for the freedom to get cash without the ATM Fee.Online Banking with Bill Pay, Finance Works, PopMoney and Funds Transfer. Keep track of your finances with an overview of all your accounts within Online Banking. You can also pay bills and track your spending. Need to make a transfer? It’s easy with immediate transfers from your internal accounts, and you can also make external transfers using PopMoney and Funds Transfer. Mobile Banking with Mobile Deposit. The First Federal Mobile Banking App is a great way to manage your accounts, make transfers and even deposit your check just by taking a picture.
Awards/Recognition/AccomplishmentsFirst Northwest Bancorp FNWBJanuary 2015, First Federal Savings and Loan Association of Port Angeles completed its mutual to stock conversion.
ABA NASDAQ Community Bank IndexFirst Northwest Bancorp announced on July 3, 2015 that it has been added to the prestigious ABA NASDAQ Community Bank Index, the nation’s most broadly represented stock index for community banks. The index includes approximately 3,763 community banks with more than $199 billion in market capitalization.
Bauer Financial 5-Star RatingFirst Federal was rated 5-Stars in 2015 by Bauer Financial. A 5-Star rating is considered “superior,” the highest rating possible.
Best Place to BankFirst Federal was again voted “Best Place to Bank” in Clallam and Jefferson Counties, ”Best Customer Service” in Clallam and Jefferson Counties and “Best Financial Advisor” in Clallam and Jefferson Counties by the 2015 Peninsula Daily News’ Best of the Peninsula.
Community FoundationThe First Federal Community Foundation was established and funded as part of the conversion. In August 2015 the Foundation awarded $441,000 in inaugural gifts to organizations in Clallam, Jefferson and Kitsap Counties.
“We are so pleased with the formation of the First Federal Community Foundation and look forward to providing additional support in the communities First Federal serves”
~Karen McCormick, Executive Director & Board Member, First Federal Community Foundation
Providing a two way video option with local representatives who manage:• Withdrawals & Check Cashing• Deposits & Transfers• Loan Payments• Inquiries and more!
UNITED STATESSECURITIES AND EXCHANGE COMMISSION
Washington, D.C. 20549
FORM 10-K
ANNUAL REPORT PURSUANT TO SECTION 13 OR 15(d) OF THE SECURITIES EXCHANGE ACT OF 1934For the fiscal year ended June 30, 2015 or
TRANSITION REPORT PURSUANT TO SECTION 13 OR 15(d) OF THE SECURITIES EXCHANGE ACT OF 1934For the transition period from _____ to _____
Commission File Number: 001-36741
FIRST NORTHWEST BANCORP(Exact name of registrant as specified in its charter)
Washington 46-1259100(State or other jurisdiction of incorporation or organization) (I.R.S. Employer I.D. Number)
105 West 8th Street, Port Angeles, Washington 98362(Address of principal executive offices) (Zip Code)
Registrant's telephone number, including area code: (360) 457-0461
Common Stock, par value $0.01 per share The Nasdaq Stock Market LLC (Title of Class) (Name of each exchange on which registered)
Securities registered pursuant to Section 12(g) of the Act: None
Indicate by check mark if the registrant is a well-known seasoned issuer, as defined in Rule 405 of the Securities Act. Yes No
Indicate by check mark if the registrant is not required to file reports pursuant to Section 13 or 15(d) of the Act. Yes No
Indicate by check mark whether the registrant (1) has filed all reports required to be filed by Section 13 or 15(d) of the Securities Exchange Act of 1934 during the preceding 12 months (or for such shorter period that the registrant was required to file such reports), and (2) has been subject to such filing requirements for the past 90 days.Yes No
Indicate by check mark whether the registrant has submitted electronically and posted on its corporate Web site, if any, every Interactive Data File required to be submitted and posted pursuant to Rule 405 of Regulation S-T (§232.405 of this chapter) during the preceding 12 months (or for such shorter period that the registrant was required to submit and post such files).Yes No
Indicate by check mark whether the registrant is a large accelerated filer, an accelerated filer, a non-accelerated filer, or a smaller reporting company. See the definitions of “large accelerated filer,” “accelerated filer” and “smaller reporting company” in Rule 12b-2 of the Exchange Act.
Large accelerated filer Accelerated filerNon-accelerated filer Smaller reporting company
Indicate by check mark whether the registrant is a shell company (as defined in Rule 12b-2 of the Exchange Act). Yes No
As of September 25, 2015, there were issued and outstanding 13,100,360 shares of the registrant’s common stock, which are traded on the NASDAQ Global Market under the symbol “FNWB.” The registrant was not a reporting company as of the end of its last completed second fiscal quarter. The aggregate market value of the voting stock held by non-affiliates of the registrant, computed by reference to the closing price of such stock as of January 29, 2015, was $129.8 million. (The exclusion from such amount of the market value of the shares owned by any person shall not be deemed an admission by the registrant that such person is an affiliate of the registrant.)
DOCUMENTS INCORPORATED BY REFERENCE
Portions of the registrant's Proxy Statement for the 2015 Annual Meeting of Shareholders are incorporated by reference into Part III.

2
FIRST NORTHWEST BANCORP
2015 ANNUAL REPORT ON FORM 10-K
TABLE OF CONTENTS
Forward-Looking StatementsAvailable Information
PART IItem 1. Business
GeneralMarket AreaLending ActivitiesAsset QualityInvestment ActivitiesDeposit Activities and Other Sources of FundsSubsidiary and Other ActivitiesCompetitionEmployeesHow We Are RegulatedTaxation
Item 1A. Risk FactorsItem 1B. Unresolved Staff CommentsItem 2. PropertiesItem 3. Legal ProceedingsItem 4. Mine Safety Disclosures
PART IIItem 5. Market for Registrant's Common Equity, Related Stockholder Matters and Issuer
Purchases of Equity SecuritiesItem 6. Selected Financial DataItem 7. Management's Discussion and Analysis of Financial Condition and Results of Operations
GeneralOur Business and Operating StrategyCritical Accounting PoliciesNew Accounting Pronouncements 68Comparison of Financial Condition at June 30, 2015 and June 30, 2014Comparison of Results of Operations for the Years Ended June 30, 2015 and June 30, 2014Comparison of Financial Condition at June 30, 2014 and June 30, 2013Comparison of Results of Operations for the Years Ended June 30, 2014 and June 30, 2013Average Balances, Interest and Average Yields/CostRate/Volume AnalysisAsset and Liability Management and Market RiskLiquidity ManagementOff-Balance Sheet Activities and CommitmentsContractual ObligationsCommitments and Off-Balance Sheet Arrangements
(Table of Contents continued on following page)
45
667821313540404142495159606161
616364646567
6871757680818183838484
3
Capital ResourcesEffect of Inflation and Changing PricesRecent Accounting Pronouncements
Item 7A. Quantitative and Qualitative Disclosures About Market Risk Item 8. Financial Statements and Supplementary DataItem 9. Changes in and Disagreements with Accountants on Accounting and Financial DisclosureItem 9A. Controls and ProceduresItem 9B. Other Information
PART III.Item 10. Directors, Executive Officers and Corporate GovernanceItem 11. Executive CompensationItem 12. Security Ownership of Certain Beneficial Owners and Management and Related
Stockholder MattersItem 13. Certain Relationships and Related Transactions and Director IndependenceItem 14. Principal Accounting Fees and Services
PART IV.Item 15. Exhibits and Financial Statement SchedulesSignatures 148
As used in this report, the terms, “we,” “our,” and “us,” and “Company” refer to First Northwest Bancorp and its consolidated subsidiary, unless the context indicates otherwise. When we refer to “First Federal” or the “Bank” in this report, we are referring to First Federal Savings and Loan Association of Port Angeles, the wholly owned subsidiary of First Northwest Bancorp.
8485868686145145145
146146
146146147
147

4
Forward-Looking Statements
Certain matters in this Form 10-K, including information included or incorporated by reference, constitute forward-looking statements within the meaning of the Private Securities Litigation Reform Act of 1995. Forward-looking statements are not statements of historical fact, are based on certain assumptions and are generally identified by the use of words such as “believes,” “expects,” “anticipates,” “estimates” or similar expressions. Forward-looking statements include, but are not limited to:
• statements of our goals, intentions and expectations;
• statements regarding our business plans, prospects, growth and operating strategies;
• statements regarding the quality of our loan and investment portfolios; and
• estimates of our risks and future costs and benefits.
These forward-looking statements are subject to significant risks and uncertainties. Actual results may differ materially from those contemplated by the forward-looking statements due to, among others, the following factors:
• changes in general economic conditions, either nationally or in our market area, that are worse than expected;
• the credit risks of our lending activities, including changes in the level and trend of loan delinquencies and write-offs and changes in our allowance for loan losses and provision for loan losses that may be impacted by deterioration in the housing and commercial real estate markets;
• fluctuations in the demand for loans, the number of unsold homes, land and other properties and fluctuations in real estate values in our market area;
• a decrease in the secondary market demand for loans that we originate for sale;
• management's assumptions in determining the adequacy of the allowance for loan losses;
• our ability to control operating costs and expenses, especially new costs associated with our operation as a public company;
• whether our management team can implement our operational strategy including but not limited to our loan growth;
• our ability to successfully integrate any newly acquired assets, liabilities, customers, systems, and management personnel into our operations and our ability to realize related revenue synergies and cost savings within expected time frames and any goodwill charges related thereto;
• our success in opening new branches;
• increases in premiums for deposit insurance;
• the use of estimates in determining fair value of certain of our assets, which estimates may prove to be incorrect and result in significant declines in valuation;
• changes in the levels of general interest rates, and the relative differences between short and long-term interest rates, deposit interest rates, our net interest margin and funding sources;
• increased competitive pressures among financial services companies;
• our ability to attract and retain deposits;
• changes in consumer spending, borrowing and savings habits;
• our ability to successfully manage our growth in compliance with regulatory requirements;
• results of examinations of us by the Washington State Department of Financial Institutions, Department of Banks, the Federal Deposit Insurance Corporation, Federal Reserve Bank of San Francisco, or other regulatory authorities, including the possibility that any such regulatory authority may, among other things, require us to increase our reserve for loan losses, write-down assets, change our regulatory capital position or affect our ability to borrow funds or maintain or increase deposits, which could adversely affect our liquidity and earnings;

5
• legislative or regulatory changes that adversely affect our business, including the effects of the Dodd-Frank Act and Basel III, changes in regulatory policies and principles, or the interpretation of regulatory capital or other rules;
• adverse changes in the securities markets;
• changes in accounting policies and practices, as may be adopted by the financial institutions regulatory agencies, the Public Company Accounting Oversight Board or the Financial Accounting Standards Board;
• costs and effects of litigation, including settlements and judgments;
• inability of key third-party vendors to perform their obligations to us; and
• other economic, competitive, governmental, regulatory and technical factors affecting our operations, pricing, products and services and other risks described elsewhere in our filings with the Securities and Exchange Commission, including this Form 10-K.
These developments could have an adverse impact on our financial position and our results of operations.
Any of the forward looking statements that we make in this report and in other public statements we make may turn out to be wrong because of inaccurate assumptions we might make, because of the factors illustrated above or because of other factors that we cannot foresee. Any forward-looking statements are based upon management’s beliefs and assumptions at the time they are made. We undertake no obligation to publicly update or revise any forward-looking statements included or incorporated by reference in this document or to update the reasons why actual results could differ from those contained in such statements, whether as a result of new information, future events or otherwise. In light of these risks, uncertainties and assumptions, the forward-looking statements discussed in this report might not occur, and you should not put undue reliance on any forward-looking statements.
Available Information
The Company provides a link on its investor information page at www.ourfirstfed.com to the Securities and Exchange Commission’s (“SEC”) website (www.sec.gov) for purposes of providing copies of its annual report to shareholders, Annual Report on Form 10-K, Quarterly Reports on Form 10-Q, Current Reports on Form 8-K and press releases. Other than an investor’s own internet access charges, these filings are available free of charge and also can be obtained by calling the SEC at 1-800-SEC-0330. The information contained on the Company’s website is not included as part of, or incorporated by reference into, this Annual Report on Form 10-K.

6
PART I
Item 1. Business
General
First Northwest Bancorp (or the “Company”), a Washington corporation, was formed on August 14, 2012 for the purpose of becoming the bank holding company for First Federal Savings and Loan Association of Port Angeles ("First Federal” or the “Bank”) in connection with First Federal’s mutual to stock conversion. The mutual to stock conversion was completed on January 29, 2015, through the sale and issuance of 13,100,360 shares of common stock by First Northwest Bancorp, including 933,360 shares contributed to our foundation, the First Federal Community Foundation ("Foundation"), established in connection with the mutual to stock conversion. The primary focus of the Foundation is to promote and support charitable services, affordable housing initiatives, local community development projects, and local economic development initiatives in the Bank's primary market areas. The Foundation was also funded with a $400,000 charitable contribution made by the Bank.
At June 30, 2015, we had total assets of $936.8 million, total deposits of $647.2 million and total stockholders' equity of $190.7 million. First Northwest Bancorp’s business activities generally are limited to passive investment activities and oversight of its investment in First Federal. Accordingly, the information set forth in this report, including consolidated financial statements and related data, relates primarily to First Federal.
As a bank holding company, First Northwest Bancorp is subject to regulation by the Board of Governors of the Federal Reserve System (“Federal Reserve”). First Federal changed its charter from a federal mutual savings and loan association to a Washington State chartered mutual savings bank effective November 30, 2011, and is examined and regulated by the Washington State Department of Financial Institutions, Division of Banks (“DFI”) and by the Federal Deposit Insurance Corporation (“FDIC”). First Federal is required to have certain reserves set by the Federal Reserve and is a member of the Federal Home Loan Bank of Des Moines (“FHLB” or “FHLB of Des Moines”), which is one of the 11 regional banks in the Federal Home Loan Bank System (“FHLB System”).
First Federal is a community-based savings bank primarily serving the North Olympic Peninsula region of Washington through its nine full-service banking offices. Eight branches are located within Clallam and Jefferson counties and one in Kitsap County. In addition, we have a loan production office in Bellingham, Washington that will become a full-service branch once construction of the building is completed, which is expected to be during the second fiscal quarter ending December 31, 2015. We relocated our branch in Kitsap County in July 2014 and plan to continue to grow our franchise by adding up to four de novo full service branch offices, including the new branch in Bellingham, in contiguous counties in the Puget Sound region over the next three years.
We offer a wide range of products and services focused on the lending and depository needs of the communities we serve. Historically, lending activities have been primarily directed toward the origination of first lien one- to four-family mortgage loans, and, to a lesser extent, commercial and multi-family real estate loans, construction and land loans (including lot loans), commercial business loans, and consumer loans, consisting primarily of home equity loans and lines of credit. During the past decade, recognizing our need to adapt to changing market conditions, we have revised our operating strategy to diversify our loan portfolio, expand our deposit product offerings and enhance our infrastructure. We have increased the origination of commercial real estate and multi-family real estate loans and decreased reliance on originating and retaining longer-term, fixed-rate, residential mortgage loans. Since 2010, we have generally sold most newly originated and refinanced, conforming single-family owner-occupied mortgage loans into the secondary market, although in 2012, we began selectively retaining 30-year fixed-rate mortgages in the portfolio in an effort to enhance our net interest income. We have historically offered traditional consumer and business deposit products, including transaction accounts, savings and money market accounts and certificates of deposit for individuals, businesses and nonprofit organizations. Deposits are our primary source of funds for our lending and investing activities. Although we intend to expand primarily through internal growth, we will also consider prudent acquisitions of other financial institutions and bank branches in the Puget Sound region.
The executive office of the Company is located at 105 West 8th Street, Port Angeles, Washington 98362, and its telephone number is (360) 457-0461.
7
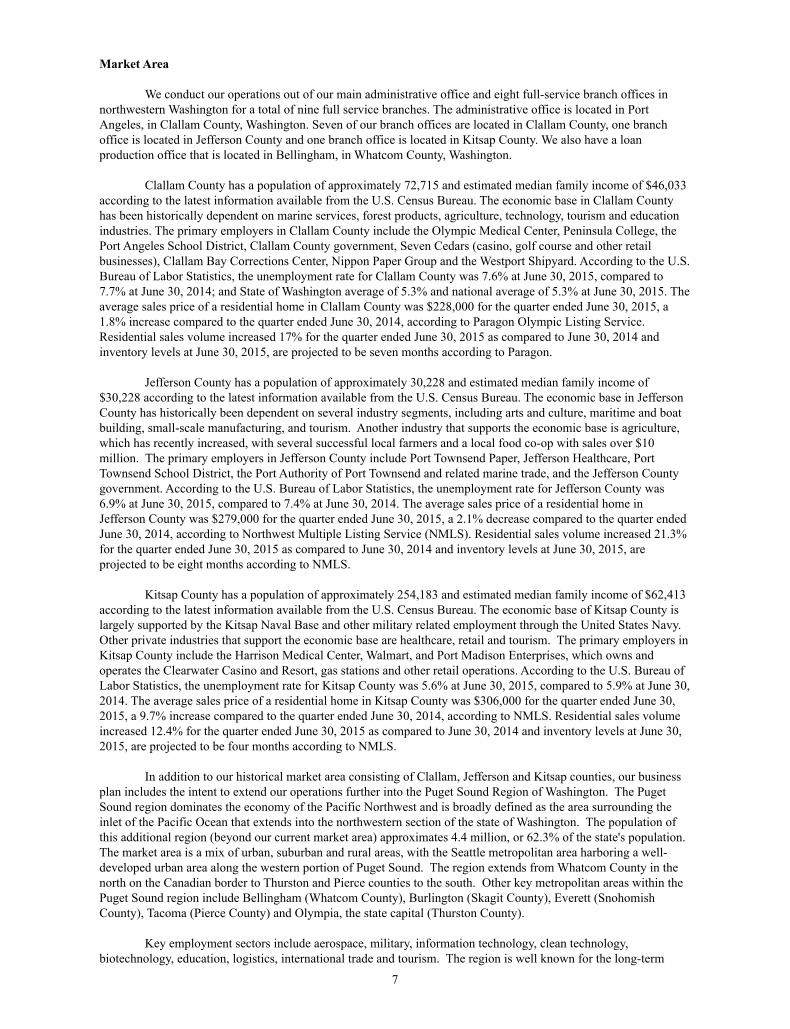
Market Area
We conduct our operations out of our main administrative office and eight full-service branch offices in northwestern Washington for a total of nine full service branches. The administrative office is located in Port Angeles, in Clallam County, Washington. Seven of our branch offices are located in Clallam County, one branch office is located in Jefferson County and one branch office is located in Kitsap County. We also have a loan production office that is located in Bellingham, in Whatcom County, Washington.
Clallam County has a population of approximately 72,715 and estimated median family income of $46,033 according to the latest information available from the U.S. Census Bureau. The economic base in Clallam County has been historically dependent on marine services, forest products, agriculture, technology, tourism and education industries. The primary employers in Clallam County include the Olympic Medical Center, Peninsula College, the Port Angeles School District, Clallam County government, Seven Cedars (casino, golf course and other retail businesses), Clallam Bay Corrections Center, Nippon Paper Group and the Westport Shipyard. According to the U.S. Bureau of Labor Statistics, the unemployment rate for Clallam County was 7.6% at June 30, 2015, compared to 7.7% at June 30, 2014; and State of Washington average of 5.3% and national average of 5.3% at June 30, 2015. The average sales price of a residential home in Clallam County was $228,000 for the quarter ended June 30, 2015, a 1.8% increase compared to the quarter ended June 30, 2014, according to Paragon Olympic Listing Service. Residential sales volume increased 17% for the quarter ended June 30, 2015 as compared to June 30, 2014 and inventory levels at June 30, 2015, are projected to be seven months according to Paragon.
Jefferson County has a population of approximately 30,228 and estimated median family income of $30,228 according to the latest information available from the U.S. Census Bureau. The economic base in Jefferson County has historically been dependent on several industry segments, including arts and culture, maritime and boat building, small-scale manufacturing, and tourism. Another industry that supports the economic base is agriculture, which has recently increased, with several successful local farmers and a local food co-op with sales over $10 million. The primary employers in Jefferson County include Port Townsend Paper, Jefferson Healthcare, Port Townsend School District, the Port Authority of Port Townsend and related marine trade, and the Jefferson County government. According to the U.S. Bureau of Labor Statistics, the unemployment rate for Jefferson County was 6.9% at June 30, 2015, compared to 7.4% at June 30, 2014. The average sales price of a residential home in Jefferson County was $279,000 for the quarter ended June 30, 2015, a 2.1% decrease compared to the quarter ended June 30, 2014, according to Northwest Multiple Listing Service (NMLS). Residential sales volume increased 21.3% for the quarter ended June 30, 2015 as compared to June 30, 2014 and inventory levels at June 30, 2015, are projected to be eight months according to NMLS.
Kitsap County has a population of approximately 254,183 and estimated median family income of $62,413 according to the latest information available from the U.S. Census Bureau. The economic base of Kitsap County is largely supported by the Kitsap Naval Base and other military related employment through the United States Navy. Other private industries that support the economic base are healthcare, retail and tourism. The primary employers in Kitsap County include the Harrison Medical Center, Walmart, and Port Madison Enterprises, which owns and operates the Clearwater Casino and Resort, gas stations and other retail operations. According to the U.S. Bureau of Labor Statistics, the unemployment rate for Kitsap County was 5.6% at June 30, 2015, compared to 5.9% at June 30, 2014. The average sales price of a residential home in Kitsap County was $306,000 for the quarter ended June 30, 2015, a 9.7% increase compared to the quarter ended June 30, 2014, according to NMLS. Residential sales volume increased 12.4% for the quarter ended June 30, 2015 as compared to June 30, 2014 and inventory levels at June 30, 2015, are projected to be four months according to NMLS.
In addition to our historical market area consisting of Clallam, Jefferson and Kitsap counties, our business plan includes the intent to extend our operations further into the Puget Sound Region of Washington. The Puget Sound region dominates the economy of the Pacific Northwest and is broadly defined as the area surrounding the inlet of the Pacific Ocean that extends into the northwestern section of the state of Washington. The population of this additional region (beyond our current market area) approximates 4.4 million, or 62.3% of the state's population. The market area is a mix of urban, suburban and rural areas, with the Seattle metropolitan area harboring a well-developed urban area along the western portion of Puget Sound. The region extends from Whatcom County in the north on the Canadian border to Thurston and Pierce counties to the south. Other key metropolitan areas within the Puget Sound region include Bellingham (Whatcom County), Burlington (Skagit County), Everett (Snohomish County), Tacoma (Pierce County) and Olympia, the state capital (Thurston County).
Key employment sectors include aerospace, military, information technology, clean technology, biotechnology, education, logistics, international trade and tourism. The region is well known for the long-term

8
presence of The Boeing Corporation and Microsoft, two major industry leaders. The military presence includes a number of large installations serving the U.S. Air Force, Army and Navy. Given the employment profile, the region's workforce is generally highly educated. Washington's geographic proximity to the Pacific Rim along with a deep water port has made it a center for international trade as well, which contributes significantly to the regional economy (one in three jobs in Washington is tied to foreign exports). The Washington ports make Washington the fourth largest exporting state in the nation, and the top five trading partners with Washington include China, Mexico, Canada, Japan and Korea. Tourism has also developed into a major industry for the area, due to the scenic beauty, temperate climate, and easy accessibility. Maritime industry employment, supported by the trade and fishing industries, is also an important employment sector.
The regional economy has had a historical dependence on the aerospace industry which has had periods of strong growth, as well as reductions in activity. Over the past few years, growth rates have been steady and long-term growth trends are favorable as the market area continues to maintain a highly educated and motivated workforce, and the Puget Sound region remains a desirable place to live. In the most recent periods, similar to national trends, most of the Puget Sound region has largely recovered from the prior issues related to home value declines, foreclosure rates, and other real estate related problems that were a result of the national recession of 2007-2009.
For a discussion regarding the competition in our primary market area, see “Competition.”
Lending Activities
General. First Federal’s principal lending activities are concentrated in first lien one- to four-family mortgage loans and commercial and multi-family real estate loans. First Federal also makes construction and land loans (including lot loans), commercial business loans, and consumer loans, consisting primarily of home-equity loans and lines of credit. A substantial portion of our loan portfolio is secured by real estate, either as primary or secondary collateral.

9
Loan Portfolio Analysis
The following table represents information concerning the composition of our loan portfolio, including loans held for sale, by the type of loan at the dates indicated:
June 30,2015 2014 2013 2012 2011
Amount Percent Amount Percent Amount Percent Amount Percent Amount Percent(Dollars in thousands)
Real estate:One- to four-family $ 256,806 52.0% $ 242,523 48.1% $ 248,172 54.2% $ 215,661 52.6% $ 239,318 55.6%Multi-family 33,086 6.7 45,100 8.9 27,928 6.1 17,175 4.2 17,088 3.9Commercial real estate 125,623 25.4 128,028 25.4 93,056 20.3 79,965 19.5 74,810 17.3Construction and land 19,127 3.8 20,497 4.1 15,493 3.4 22,689 5.6 23,595 5.5
Total real estate loans 434,642 87.9 436,148 86.5 384,649 84.0 335,490 81.9 354,811 82.3
Consumer:Home equity 36,387 7.4 40,064 7.9 42,497 9.3 51,155 12.4 54,960 12.8Other consumer 8,198 1.7 10,697 2.1 13,029 2.8 11,083 2.7 13,092 3.1
Total consumer loans 44,585 9.1 50,761 10.0 55,526 12.1 62,238 15.1 68,052 15.9
Commercial business loans 14,764 3.0 17,532 3.5 17,746 3.9 12,259 3.0 7,946 1.8
Total loans 493,991 100.0% 504,441 100.0% 457,921 100.0% 409,987 100.0% 430,809 100.0%
Less:Deferred fees and discounts 840 862 622 563 597(Premium) discount on purchased
loans, net (1,957) (1,290) (428) 957 1,022Loans held for sale 110 613 400 418 275Allowance for loan losses 7,111 8,072 7,974 7,390 4,728
Total loans, net $ 487,887 $ 496,184 $ 449,353 $ 400,659 $ 424,187
9
Loa
n Po
rtfo
lio A
naly
sis
The
follo
win
g ta
ble
repr
esen
ts in
form
atio
n co
ncer
ning
the
com
posi
tion
of o
ur lo
an p
ortfo
lio, i
nclu
ding
loan
s hel
d fo
r sal
e, b
y th
e ty
pe o
f loa
n at
the
date
s ind
icat
ed:
June
30,
2015
2014
2013
2012
2011
Am
ount
Perc
ent
Am
ount
Perc
ent
Am
ount
Perc
ent
Am
ount
Perc
ent
Am
ount
Perc
ent
(Dol
lars
in th
ousa
nds)
Rea
l est
ate:
One
- to
four
-fam
ily$
256,
806
52.0
%$
242,
523
48.1
%$
248,
172
54.2
%$
215,
661
52.6
%$
239,
318
55.6
%M
ulti-
fam
ily33
,086
6.7
45,1
008.
927
,928
6.1
17,1
754.
217
,088
3.9
Com
mer
cial
real
est
ate
125,
623
25.4
128,
028
25.4
93,0
5620
.379
,965
19.5
74,8
1017
.3C
onst
ruct
ion
and
land
19,1
273.
820
,497
4.1
15,4
933.
422
,689
5.6
23,5
955.
5To
tal r
eal e
stat
e lo
ans
434,
642
87.9
436,
148
86.5
384,
649
84.0
335,
490
81.9
354,
811
82.3
Con
sum
er:
Hom
e eq
uity
36,3
877.
440
,064
7.9
42,4
979.
351
,155
12.4
54,9
6012
.8O
ther
con
sum
er8,
198
1.7
10,6
972.
113
,029
2.8
11,0
832.
713
,092
3.1
Tota
l con
sum
er lo
ans
44,5
859.
150
,761
10.0
55,5
2612
.162
,238
15.1
68,0
5215
.9
Com
mer
cial
bus
ines
s loa
ns14
,764
3.0
17,5
323.
517
,746
3.9
12,2
593.
07,
946
1.8
Tota
l loa
ns49
3,99
110
0.0%
504,
441
100.
0%45
7,92
110
0.0%
409,
987
100.
0%43
0,80
910
0.0%
Les
s: Def
erre
d fe
es a
nd d
isco
unts
840
862
622
563
597
(Pre
miu
m) d
isco
unt o
n pu
rcha
sed
loan
s, ne
t(1
,957
)(1
,290
)(4
28)
957
1,02
2Lo
ans h
eld
for s
ale
110
613
400
418
275
Allo
wan
ce fo
r loa
n lo
sses
7,11
18,
072
7,97
47,
390
4,72
8To
tal l
oans
, net
$48
7,88
7$
496,
184
$44
9,35
3$
400,
659
$42
4,18
7
Fixe
d-R
ate
and
Adj
usta
ble-
Rat
e L
oans
The
follo
win
g ta
ble
show
s the
com
posi
tion
of o
ur lo
an p
ortfo
lio, i
nclu
ding
loan
s hel
d fo
r sal
e, in
dol
lar a
mou
nts a
nd in
per
cent
ages
by
fixed
rate
s and
adj
usta
ble
rate
s at t
he
date
s ind
icat
ed:
June
30,
2015
2014
2013
2012
2011
Am
ount
Perc
ent
Am
ount
Perc
ent
Am
ount
Perc
ent
Am
ount
Perc
ent
Am
ount
Perc
ent
Fixe
d-ra
te lo
ans:
(Dol
lars
in th
ousa
nds)
Rea
l est
ate:
One
- to
four
-fam
ily$
182,
409
36.8
%$
173,
414
34.4
%$
188,
270
41.1
%$
160,
985
39.3
%$
178,
692
41.5
%M
ulti-
fam
ily7,
979
1.6
2,28
10.
52,
291
0.5
3,63
00.
97,
448
1.7
Com
mer
cial
real
est
ate
36,8
807.
546
,199
9.1
43,2
269.
446
,823
11.4
49,7
2611
.5C
onst
ruct
ion
and
land
14,1
322.
912
,575
2.5
14,1
533.
117
,444
4.3
19,7
804.
6To
tal r
eal e
stat
e lo
ans
241,
400
48.8
234,
469
46.5
247,
940
54.1
228,
882
55.9
255,
646
59.3
Con
sum
er:
Hom
e eq
uity
8,74
11.
810
,085
2.0
10,3
672.
312
,412
3.0
12,3
222.
9O
ther
con
sum
er6,
986
1.4
9,24
71.
811
,345
2.4
9,19
82.
211
,129
2.6
Tota
l con
sum
er lo
ans
15,7
273.
219
,332
3.8
21,7
124.
721
,610
5.2
23,4
515.
5C
omm
erci
al b
usin
ess l
oans
5,90
01.
28,
547
1.7
13,1
122.
95,
873
1.4
3,13
00.
7To
tal f
ixed
-rat
e lo
ans
263,
027
53.2
262,
348
52.0
282,
764
61.7
256,
365
62.5
282,
227
65.5
Adj
usta
ble-
rate
loan
s:R
eal e
stat
e:O
ne- t
o fo
ur-f
amily
74,3
9715
.169
,109
13.7
59,9
0213
.154
,676
13.3
60,6
2614
.1M
ulti-
fam
ily25
,107
5.1
42,8
198.
525
,637
5.6
13,5
453.
39,
640
2.2
Com
mer
cial
real
est
ate
88,7
4318
.081
,829
16.2
49,8
3010
.933
,142
8.1
25,0
845.
8C
onst
ruct
ion
and
land
4,99
51.
07,
922
1.6
1,34
00.
35,
245
1.3
3,81
50.
9To
tal r
eal e
stat
e lo
ans
193,
242
39.2
201,
679
40.0
136,
709
29.9
106,
608
26.0
99,1
6523
.0C
onsu
mer
:H
ome
equi
ty27
,646
5.6
29,9
795.
932
,130
7.0
38,7
439.
442
,638
9.9
Oth
er c
onsu
mer
1,21
20.
21,
450
0.3
1,68
40.
41,
885
0.5
1,96
30.
5To
tal c
onsu
mer
loan
s28
,858
5.8
31,4
296.
233
,814
7.4
40,6
289.
944
,601
10.4
Com
mer
cial
bus
ines
s loa
ns8,
864
1.8
8,98
51.
84,
634
1.0
6,38
61.
64,
816
1.1
Tota
l adj
usta
ble-
rate
loan
s23
0,96
446
.824
2,09
348
.017
5,15
738
.315
3,62
237
.514
8,58
234
.5
Tota
l loa
ns49
3,99
110
0.0%
504,
441
100.
0%45
7,92
110
0.0%
409,
987
100.
0%43
0,80
910
0.0%
Les
s: Def
erre
d fe
es a
nd d
isco
unts
840
862
622
563
597
(Pre
miu
m) d
isco
unt o
n pu
rcha
sed
loan
s, ne
t(1
,957
)(1
,290
)(4
28)
957
1,02
2Lo
ans h
eld
for s
ale
110
613
400
418
275
Allo
wan
ce fo
r loa
n lo
sses
7,11
18,
072
7,97
47,
390
4,72
8To
tal l
oans
, net
$48
7,88
7$
496,
184
$44
9,35
3$
400,
659
$42
4,18
7
10
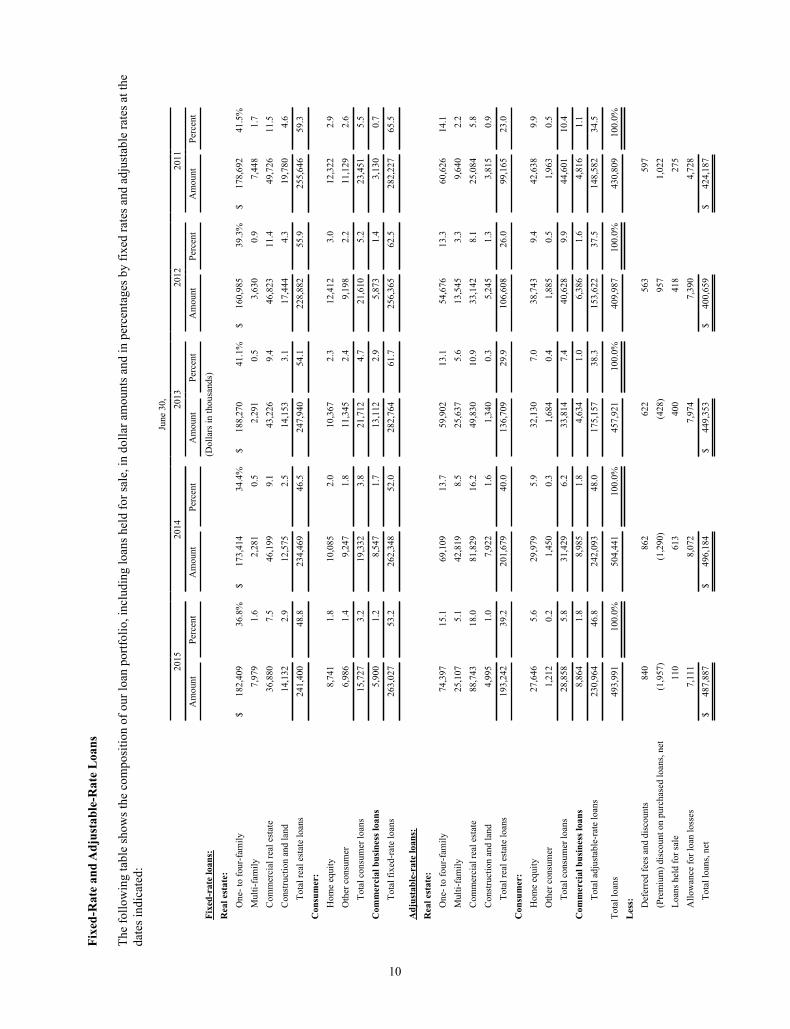
Fixed-Rate and Adjustable-Rate Loans
The following table shows the composition of our loan portfolio, including loans held for sale, in dollar amounts and in percentages by fixed rates and adjustable rates at the dates indicated:
June 30,2015 2014 2013 2012 2011
Amount Percent Amount Percent Amount Percent Amount Percent Amount Percent
Fixed-rate loans: (Dollars in thousands)Real estate:
One- to four-family $ 182,409 36.8% $ 173,414 34.4% $ 188,270 41.1% $ 160,985 39.3% $ 178,692 41.5%Multi-family 7,979 1.6 2,281 0.5 2,291 0.5 3,630 0.9 7,448 1.7Commercial real estate 36,880 7.5 46,199 9.1 43,226 9.4 46,823 11.4 49,726 11.5Construction and land 14,132 2.9 12,575 2.5 14,153 3.1 17,444 4.3 19,780 4.6
Total real estate loans 241,400 48.8 234,469 46.5 247,940 54.1 228,882 55.9 255,646 59.3Consumer:
Home equity 8,741 1.8 10,085 2.0 10,367 2.3 12,412 3.0 12,322 2.9Other consumer 6,986 1.4 9,247 1.8 11,345 2.4 9,198 2.2 11,129 2.6
Total consumer loans 15,727 3.2 19,332 3.8 21,712 4.7 21,610 5.2 23,451 5.5Commercial business loans 5,900 1.2 8,547 1.7 13,112 2.9 5,873 1.4 3,130 0.7
Total fixed-rate loans 263,027 53.2 262,348 52.0 282,764 61.7 256,365 62.5 282,227 65.5
Adjustable-rate loans:Real estate:
One- to four-family 74,397 15.1 69,109 13.7 59,902 13.1 54,676 13.3 60,626 14.1Multi-family 25,107 5.1 42,819 8.5 25,637 5.6 13,545 3.3 9,640 2.2Commercial real estate 88,743 18.0 81,829 16.2 49,830 10.9 33,142 8.1 25,084 5.8Construction and land 4,995 1.0 7,922 1.6 1,340 0.3 5,245 1.3 3,815 0.9
Total real estate loans 193,242 39.2 201,679 40.0 136,709 29.9 106,608 26.0 99,165 23.0Consumer:
Home equity 27,646 5.6 29,979 5.9 32,130 7.0 38,743 9.4 42,638 9.9Other consumer 1,212 0.2 1,450 0.3 1,684 0.4 1,885 0.5 1,963 0.5
Total consumer loans 28,858 5.8 31,429 6.2 33,814 7.4 40,628 9.9 44,601 10.4Commercial business loans 8,864 1.8 8,985 1.8 4,634 1.0 6,386 1.6 4,816 1.1
Total adjustable-rate loans 230,964 46.8 242,093 48.0 175,157 38.3 153,622 37.5 148,582 34.5
Total loans 493,991 100.0% 504,441 100.0% 457,921 100.0% 409,987 100.0% 430,809 100.0%Less:
Deferred fees and discounts 840 862 622 563 597(Premium) discount on purchased loans, net (1,957) (1,290) (428) 957 1,022Loans held for sale 110 613 400 418 275Allowance for loan losses 7,111 8,072 7,974 7,390 4,728
Total loans, net $ 487,887 $ 496,184 $ 449,353 $ 400,659 $ 424,187

11
Loa
n M
atur
ity
The
follo
win
g ta
ble
illus
trate
s the
con
tract
ual m
atur
ity o
f our
loan
por
tfolio
at J
une
30, 2
015.
Mor
tgag
es th
at h
ave
adju
stab
le o
r ren
egot
iabl
e in
tere
st
rate
s are
show
n as
mat
urin
g in
the
perio
d du
ring
whi
ch th
e co
ntra
ct is
due
. Th
e to
tal a
mou
nt o
f loa
ns d
ue a
fter J
une
30, 2
016
that
hav
e fix
ed in
tere
st ra
tes i
s $2
56.9
mill
ion,
whi
le th
e to
tal a
mou
nt o
f loa
ns d
ue a
fter s
uch
date
that
hav
e ad
just
able
inte
rest
rate
s is $
225.
3 m
illio
n. T
he ta
ble
does
not
refle
ct th
e ef
fect
s of
unpr
edic
tabl
e pr
inci
pal p
repa
ymen
ts.
Rea
l Est
ate
One
- to
Four
-C
omm
erci
al R
eal
Con
stru
ctio
nC
omm
erci
alFa
mily
Mul
ti-fa
mily
Esta
tean
d La
ndH
ome
Equi
tyO
ther
Con
sum
erB
usin
ess
Tota
l (1
)W
eigh
ted
Wei
ghte
dW
eigh
ted
Wei
ghte
dW
eigh
ted
Wei
ghte
dW
eigh
ted
Wei
ghte
dA
vera
geA
vera
geA
vera
geA
vera
geA
vera
geA
vera
geA
vera
geA
vera
geA
mou
ntR
ate
Am
ount
Rat
eA
mou
ntR
ate
Am
ount
Rat
eA
mou
ntR
ate
Am
ount
Rat
eA
mou
ntR
ate
Am
ount
Rat
e
(Dol
lars
in th
ousa
nds)
2016
(2)
$41
44.
14%
$50
33.
00%
$6,
658
5.38
%$
624
5.12
%$
746.
93%
$1,
303
9.83
%$
2,18
85.
04%
$11
,764
5.65
%20
1710
36.
306,
259
4.07
1,89
86.
535,
090
4.62
313
5.21
496
6.33
996
4.70
15,1
554.
7220
1814
95.
165
5.76
2,85
25.
6040
85.
2366
86.
571,
389
5.68
1,31
64.
596,
787
5.49
2019
357
4.95
176
4.45
778
5.06
386
7.00
780
5.14
1,10
45.
651,
183
4.33
4,76
45.
1620
20 to
202
22,
094
5.59
512
4.56
20,5
255.
3373
66.
349,
217
5.02
2,41
06.
1782
36.
1136
,317
5.35
2023
to 2
026
10,7
293.
948,
848
4.11
90,8
364.
412,
972
6.57
3,68
64.
9070
17.
718,
258
3.91
126,
030
4.40
2027
to 2
030
56,5
973.
4997
5.64
823
4.97
5,96
66.
9421
,484
4.71
113
8.92
——
85,0
804.
0620
31 a
nd b
eyon
d18
6,36
34.
3616
,686
4.57
1,25
33.
152,
945
4.02
165
5.50
682
8.97
——
208,
094
4.38
Tota
l$2
56,8
064.
16%
$33
,086
4.33
%$1
25,6
234.
66%
$19
,127
5.70
%$
36,3
874.
86%
$8,
198
6.99
%$
14,7
644.
34%
$493
,991
4.46
%
____
___
(1)
Excl
udes
def
erre
d fe
es a
nd d
isco
unts
of $
840,
000.
(2)
Incl
udes
dem
and
loan
s, lo
ans h
avin
g no
stat
ed m
atur
ity, o
verd
raft
loan
s and
loan
s hel
d fo
r sal
e.
11
Loan Maturity
The following table illustrates the contractual maturity of our loan portfolio at June 30, 2015. Mortgages that have adjustable or renegotiable interest rates are shown as maturing in the period during which the contract is due. The total amount of loans due after June 30, 2016 that have fixed interest rates is $256.9 million, while the total amount of loans due after such date that have adjustable interest rates is $225.3 million. The table does not reflect the effects of unpredictable principal prepayments.
Real EstateOne- to Four- Commercial Real Construction Commercial
Family Multi-family Estate and Land Home Equity Other Consumer Business Total (1)Weighted Weighted Weighted Weighted Weighted Weighted Weighted WeightedAverage Average Average Average Average Average Average Average
Amount Rate Amount Rate Amount Rate Amount Rate Amount Rate Amount Rate Amount Rate Amount Rate
(Dollars in thousands)2016 (2) $ 414 4.14% $ 503 3.00% $ 6,658 5.38% $ 624 5.12% $ 74 6.93% $ 1,303 9.83% $ 2,188 5.04% $ 11,764 5.65%2017 103 6.30 6,259 4.07 1,898 6.53 5,090 4.62 313 5.21 496 6.33 996 4.70 15,155 4.722018 149 5.16 5 5.76 2,852 5.60 408 5.23 668 6.57 1,389 5.68 1,316 4.59 6,787 5.492019 357 4.95 176 4.45 778 5.06 386 7.00 780 5.14 1,104 5.65 1,183 4.33 4,764 5.162020 to 2022 2,094 5.59 512 4.56 20,525 5.33 736 6.34 9,217 5.02 2,410 6.17 823 6.11 36,317 5.352023 to 2026 10,729 3.94 8,848 4.11 90,836 4.41 2,972 6.57 3,686 4.90 701 7.71 8,258 3.91 126,030 4.402027 to 2030 56,597 3.49 97 5.64 823 4.97 5,966 6.94 21,484 4.71 113 8.92 — — 85,080 4.062031 and beyond 186,363 4.36 16,686 4.57 1,253 3.15 2,945 4.02 165 5.50 682 8.97 — — 208,094 4.38
Total $256,806 4.16% $ 33,086 4.33% $125,623 4.66% $ 19,127 5.70% $ 36,387 4.86% $ 8,198 6.99% $ 14,764 4.34% $493,991 4.46%
_______ (1) Excludes deferred fees and discounts of $840,000. (2) Includes demand loans, loans having no stated maturity, overdraft loans and loans held for sale.

12
Geo
grap
hic
Dis
trib
utio
n of
our
Loa
ns
Th
e fo
llow
ing
tabl
e sh
ows a
t Jun
e 30
, 201
5 th
e ge
ogra
phic
dis
tribu
tion
of o
ur lo
an p
ortfo
lio in
dol
lar a
mou
nts a
nd p
erce
ntag
es.
Nor
th O
lym
pic
Peni
nsul
a (1
)O
ther
Wes
tern
Was
hing
ton
Oth
er W
ashi
ngto
nTo
tal i
n W
ashi
ngto
n St
ate
All
Oth
er S
tate
sT
otal
Am
ount
% o
f Tot
al
in C
ateg
ory
Am
ount
% o
f Tot
al
in C
ateg
ory
Am
ount
% o
f Tot
alin
Cat
egor
yA
mou
nt%
of T
otal
in
Cat
egor
yA
mou
nt%
of T
otal
in
Cat
egor
yA
mou
nt%
of T
otal
in
Cat
egor
y
Rea
l est
ate
loan
s:(D
olla
rs in
thou
sand
s)
One
- to
four
-fam
ily$
168,
436
65.5
%$
48,6
8519
.0%
$3,
509
1.4%
$22
0,63
085
.9%
$36
,176
14.1
%$
256,
806
52.0
%
Mul
ti-fa
mily
3,76
911
.419
,054
57.6
10,2
6331
.033
,086
100.
0—
—33
,086
6.7
Com
mer
cial
real
est
ate
48,3
0138
.471
,825
57.2
5,49
74.
412
5,62
310
0.0
——
125,
623
25.4
Con
stru
ctio
n an
d la
nd12
,836
67.1
5,95
531
.133
61.
819
,127
100.
0—
—19
,127
3.9
Tot
al r
eal e
stat
e lo
ans
233,
342
53.7
145,
519
33.5
19,6
054.
539
8,46
691
.736
,176
8.3
434,
642
88.0
Con
sum
er lo
ans:
Hom
e eq
uity
32,9
7890
.62,
766
7.6
643
1.8
36,3
8710
0.0
——
36,3
877.
4
Oth
er c
onsu
mer
6,47
078
.977
49.
442
95.
27,
673
93.6
525
6.4
8,19
81.
7
Tot
al c
onsu
mer
loan
s39
,448
88.5
3,54
07.
91,
072
2.4
44,0
6098
.852
51.
244
,585
9.1
Com
mer
cial
bus
ines
s loa
ns8,
403
56.9
6,36
343
.1—
—14
,766
100.
0(2
)—
14,7
642.
9
Tot
al lo
ans
$28
1,19
356
.9%
$15
5,42
231
.5%
$20
,677
4.2%
$45
7,29
292
.6%
$36
,699
7.4%
$49
3,99
110
0.0%
____
____
____
(1) I
nclu
des C
lalla
m a
nd Je
ffers
on c
ount
ies.
12
Geographic Distribution of our Loans
The following table shows at June 30, 2015 the geographic distribution of our loan portfolio in dollar amounts and percentages.
North OlympicPeninsula (1)
Other WesternWashington Other Washington
Total in Washington State All Other States Total
Amount% of Total in Category Amount
% of Total in Category Amount
% of Totalin Category Amount
% of Total in Category Amount
% of Total in Category Amount
% of Total in Category
Real estate loans: (Dollars in thousands)
One- to four-family $ 168,436 65.5% $ 48,685 19.0% $ 3,509 1.4% $ 220,630 85.9% $ 36,176 14.1% $ 256,806 52.0%
Multi-family 3,769 11.4 19,054 57.6 10,263 31.0 33,086 100.0 — — 33,086 6.7
Commercial real estate 48,301 38.4 71,825 57.2 5,497 4.4 125,623 100.0 — — 125,623 25.4
Construction and land 12,836 67.1 5,955 31.1 336 1.8 19,127 100.0 — — 19,127 3.9
Total real estate loans 233,342 53.7 145,519 33.5 19,605 4.5 398,466 91.7 36,176 8.3 434,642 88.0
Consumer loans:
Home equity 32,978 90.6 2,766 7.6 643 1.8 36,387 100.0 — — 36,387 7.4
Other consumer 6,470 78.9 774 9.4 429 5.2 7,673 93.6 525 6.4 8,198 1.7
Total consumer loans 39,448 88.5 3,540 7.9 1,072 2.4 44,060 98.8 525 1.2 44,585 9.1
Commercial business loans 8,403 56.9 6,363 43.1 — — 14,766 100.0 (2) — 14,764 2.9
Total loans $ 281,193 56.9% $ 155,422 31.5% $ 20,677 4.2% $ 457,292 92.6% $ 36,699 7.4% $ 493,991 100.0%
____________(1) Includes Clallam and Jefferson counties.
13
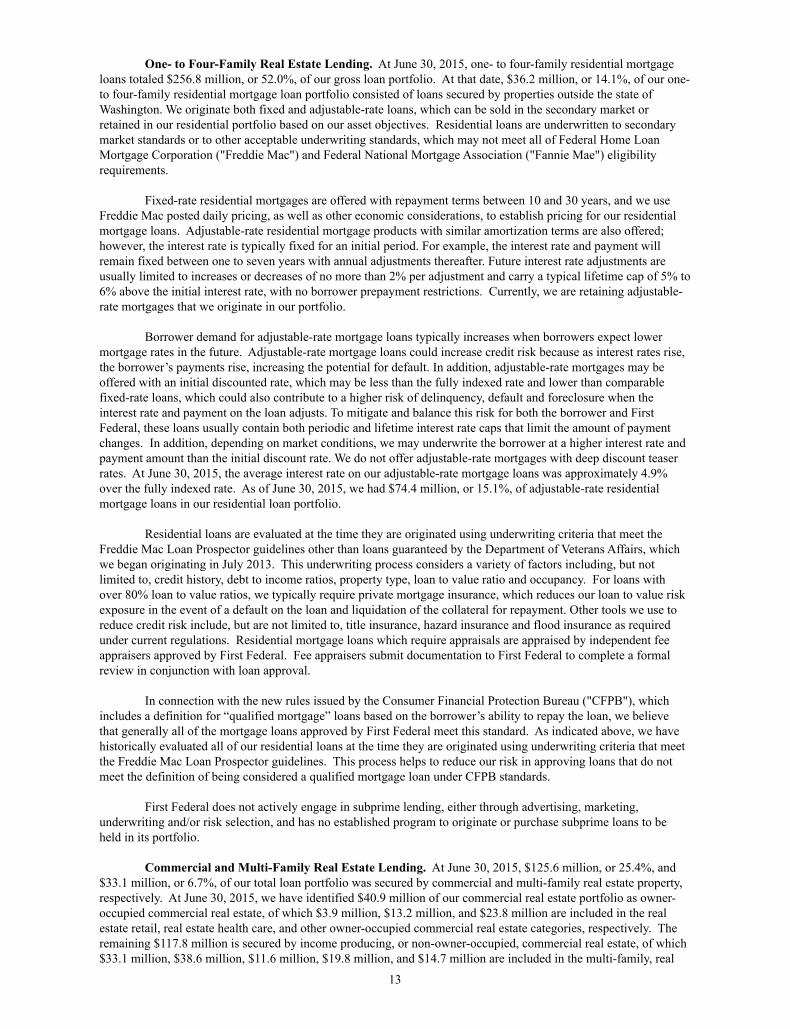
One- to Four-Family Real Estate Lending. At June 30, 2015, one- to four-family residential mortgage loans totaled $256.8 million, or 52.0%, of our gross loan portfolio. At that date, $36.2 million, or 14.1%, of our one- to four-family residential mortgage loan portfolio consisted of loans secured by properties outside the state of Washington. We originate both fixed and adjustable-rate loans, which can be sold in the secondary market or retained in our residential portfolio based on our asset objectives. Residential loans are underwritten to secondary market standards or to other acceptable underwriting standards, which may not meet all of Federal Home Loan Mortgage Corporation ("Freddie Mac") and Federal National Mortgage Association ("Fannie Mae") eligibility requirements.
Fixed-rate residential mortgages are offered with repayment terms between 10 and 30 years, and we use Freddie Mac posted daily pricing, as well as other economic considerations, to establish pricing for our residential mortgage loans. Adjustable-rate residential mortgage products with similar amortization terms are also offered; however, the interest rate is typically fixed for an initial period. For example, the interest rate and payment will remain fixed between one to seven years with annual adjustments thereafter. Future interest rate adjustments are usually limited to increases or decreases of no more than 2% per adjustment and carry a typical lifetime cap of 5% to 6% above the initial interest rate, with no borrower prepayment restrictions. Currently, we are retaining adjustable-rate mortgages that we originate in our portfolio.
Borrower demand for adjustable-rate mortgage loans typically increases when borrowers expect lower mortgage rates in the future. Adjustable-rate mortgage loans could increase credit risk because as interest rates rise, the borrower’s payments rise, increasing the potential for default. In addition, adjustable-rate mortgages may be offered with an initial discounted rate, which may be less than the fully indexed rate and lower than comparable fixed-rate loans, which could also contribute to a higher risk of delinquency, default and foreclosure when the interest rate and payment on the loan adjusts. To mitigate and balance this risk for both the borrower and First Federal, these loans usually contain both periodic and lifetime interest rate caps that limit the amount of payment changes. In addition, depending on market conditions, we may underwrite the borrower at a higher interest rate and payment amount than the initial discount rate. We do not offer adjustable-rate mortgages with deep discount teaser rates. At June 30, 2015, the average interest rate on our adjustable-rate mortgage loans was approximately 4.9% over the fully indexed rate. As of June 30, 2015, we had $74.4 million, or 15.1%, of adjustable-rate residential mortgage loans in our residential loan portfolio.
Residential loans are evaluated at the time they are originated using underwriting criteria that meet the Freddie Mac Loan Prospector guidelines other than loans guaranteed by the Department of Veterans Affairs, which we began originating in July 2013. This underwriting process considers a variety of factors including, but not limited to, credit history, debt to income ratios, property type, loan to value ratio and occupancy. For loans with over 80% loan to value ratios, we typically require private mortgage insurance, which reduces our loan to value risk exposure in the event of a default on the loan and liquidation of the collateral for repayment. Other tools we use to reduce credit risk include, but are not limited to, title insurance, hazard insurance and flood insurance as required under current regulations. Residential mortgage loans which require appraisals are appraised by independent fee appraisers approved by First Federal. Fee appraisers submit documentation to First Federal to complete a formal review in conjunction with loan approval.
In connection with the new rules issued by the Consumer Financial Protection Bureau ("CFPB"), which includes a definition for “qualified mortgage” loans based on the borrower’s ability to repay the loan, we believe that generally all of the mortgage loans approved by First Federal meet this standard. As indicated above, we have historically evaluated all of our residential loans at the time they are originated using underwriting criteria that meet the Freddie Mac Loan Prospector guidelines. This process helps to reduce our risk in approving loans that do not meet the definition of being considered a qualified mortgage loan under CFPB standards.
First Federal does not actively engage in subprime lending, either through advertising, marketing, underwriting and/or risk selection, and has no established program to originate or purchase subprime loans to be held in its portfolio.
Commercial and Multi-Family Real Estate Lending. At June 30, 2015, $125.6 million, or 25.4%, and $33.1 million, or 6.7%, of our total loan portfolio was secured by commercial and multi-family real estate property, respectively. At June 30, 2015, we have identified $40.9 million of our commercial real estate portfolio as owner-occupied commercial real estate, of which $3.9 million, $13.2 million, and $23.8 million are included in the real estate retail, real estate health care, and other owner-occupied commercial real estate categories, respectively. The remaining $117.8 million is secured by income producing, or non-owner-occupied, commercial real estate, of which $33.1 million, $38.6 million, $11.6 million, $19.8 million, and $14.7 million are included in the multi-family, real

14
estate retail, real estate health care, real estate hospitality, and other non-owner-occupied commercial real estate, respectively. Our commercial real estate loans include, but are not limited to, loans secured by retail strip centers, hotels and motels, medical and professional office buildings, office/warehouse, self-storage facilities, combination gas stations and convenience stores, and assisted living facilities located within our market areas. Substantially all of our commercial real estate and multi-family loans are primarily secured by properties located in Washington State.
These loans are generally priced at a higher rate of interest than one- to four-family residential loans, as these loans have higher loan balances, are more difficult to evaluate and monitor, and involve a greater degree of risk than one- to four-family residential loans. Repayment on loans secured by commercial or multi-family properties is dependent on successful management or utilization of the land and improvements by the property owner to create gross revenues and sufficient net operating income to meet the debt service requirements and provide a return to the owner. Changes in economic and real estate market conditions can affect net operating income, capitalization rates, and ultimately the valuation and marketability of the collateral. As a result, we analyze market data including, but not limited to, vacancy rates, absorption percentages, leasing rates and competing projects under development. Interest rate, occupancy and capitalization rate stress testing are required as part of our underwriting analysis. If the borrower is a corporation, we generally require and obtain personal guarantees from the corporate principals, which include underwriting of their personal financial statements, tax returns, cash flows and individual credit reports, which provides us with additional support and a secondary source for repayment of the debt.
We offer both fixed- and adjustable-rate loans on commercial and multi-family real estate, which may include balloon loans. As of June 30, 2015, we had $88.7 million in adjustable-rate commercial real estate loans and $25.1 million in adjustable-rate multi-family loans. Commercial and multi-family real estate loans with adjustable rates generally adjust after an initial period of three years. These loans generally have maturity dates between three and 10 years. Amortization terms are generally limited to terms up to 25 years on commercial real estate loans and up to 30 years on multi-family loans. Adjustable-rate multi-family residential and commercial real estate loans are generally priced to market indices with appropriate margins, which may include the U.S. Constant Maturity Treasury Rate, LIBOR, The Wall Street Journal prime rate, or other acceptable index. Substantially all adjustable-rate commercial and multi-family real estate loans are subject to a floor rate, and the weighted average floor rate on these loans was 4.44% at June 30, 2015. Of all of the adjustable-rate commercial loans, 87% are subject to a ceiling rate, and the weighted average ceiling rate on those loans was 8.49% at June 30, 2015.
The maximum loan to value ratio for commercial and multi-family real estate loans is typically limited to 80% of the appraiser opinion of market value or determined by the income to debt service ratio, which is 1.20x for non-owner-occupied properties and 1.10x for owner-occupied properties. In addition, aggregate debt service ratios, including the guarantor’s cash flow and the borrower’s other projects, are required by policy to have a minimum income to debt service ratio of 1.20x. We require independent appraisals or evaluations on all loans secured by commercial real estate from an approved appraisers list.
We require most of our commercial and multi-family real estate loan borrowers to submit annual financial statements and/or rent rolls on the subject property. These properties may also be subject to annual inspections with pictures to support that appropriate maintenance is being performed by the owner/borrower. All commercial real estate loans over $750,000 are reviewed at least annually along with each commercial real estate borrower and, as applicable, each guarantor. The loan and its borrowers and/or guarantors are subject to an annual risk certification verifying that the loan is properly risk rated based upon covenant compliance and other terms as provided for in the loan agreements. While this process does not prevent loans from becoming delinquent, it provides us with the opportunity to better identify problem loans in a timely manner and to work with the borrower prior to the loan becoming delinquent.

15
The following table provides information on multi-family and commercial real estate loans by type at the dates indicated:
June 30,2015 2014 2013
Amount Percent Amount Percent Amount Percent(Dollars in thousands)
Multi-family $ 33,086 20.9% $ 45,100 26.0% $ 27,928 23.1%Real estate retail 42,526 26.8 59,378 34.3 43,596 36.0Real estate health care 24,804 15.6 13,995 8.1 15,316 12.7Real estate hospitality 20,185 12.7 21,289 12.3 3,320 2.7Other non-owner-occupied commercial real estate 14,675 9.2 16,924 9.8 12,705 10.5Other owner-occupied commercial real estate 23,433 14.8 16,442 9.5 18,119 15.0
Total $158,709 100.0% $173,128 100.0% $120,984 100.0%
If we foreclose on a multi-family or commercial real estate loan, the marketing and liquidation period to convert the real estate asset to cash can be a lengthy process with substantial holding costs. In addition, vacancies, deferred maintenance, repairs and market stigma can result in prospective buyers expecting sale price concessions to offset their real or perceived economic losses for the time it takes them to return the property to profitability. Depending on the individual circumstances, initial charge-offs and subsequent losses on commercial real estate loans can be unpredictable and substantial.
The average outstanding loan size in our commercial real estate portfolio was $679,000 as of June 30, 2015. We generally target individual commercial real estate loans between $250,000 and $10.0 million to small and mid-size owners and investors in our market areas as well as other parts of Washington. We will also make commercial real estate loans in other states if we have a pre-existing relationship with the borrower.
Our three largest commercial and multi-family borrowing relationships at June 30, 2015 consisted of an $11.6 million relationship secured primarily by a hotel located in King County; an $11.6 million relationship secured by an assisted living facility in King County; and an $8.7 million relationship secured primarily by a retail shopping center located in Island County, whereby the original commitment was made in October 2012 for $15.0 million of which $5.8 million was participated with two other lenders. At June 30, 2015, we had 38 additional commercial loan relationships above $3.0 million, ranging from $3.3 million to $7.2 million, aggregating $88.6 million. At June 30, 2015, these loans were all performing in accordance with their repayment terms.
Construction and Land Lending. At June 30, 2015, our construction and land loans were $19.1 million, or 3.8% of the total loan portfolio. First Federal offers an “all-in-one” residential adjustable-rate custom construction loan product, which upon completion of the construction phase may be placed in our loan portfolio. We also originate construction loans for certain commercial real estate projects. These projects include, but are not limited to, multi-family, retail, office/warehouse and office buildings. Underwriting criteria on these loans include, but are not limited to, minimum debt service coverage requirements of 1.20x or better, loan to value limitations, pre-leasing requirements, construction cost over-run contingency reserves, interest and absorption period reserves, occupancy, capitalization rates and interest rate stress testing, as well as other underwriting criteria.
Construction loan applications require the borrower to provide architectural and working plans, a material specifications list, detailed cost breakdown and a construction contract. Construction loan advances are based on progress payments for “work in place” based on detailed line item construction budgets. Independent construction inspectors are used to evaluate the construction draw request relative to the progress and “work in place.” Our construction administrator reviews all construction projects, inspection reports and construction loan advance requests to ensure they are appropriate and in compliance with all loan conditions. Other risk management tools include title insurance, date down endorsements and periodic lien inspections prior to the payment of construction loan advances. In some cases, general contractors may be required to provide sub-contractor lien releases for any work performed prior to the filing of our deed of trust or prior to each construction loan advance.
Land acquisition, development and construction loans are available on a limited basis to local contractors and developers for the purpose of holding and/or developing residential building sites and homes when market conditions warrant such activity. Land acquisition loans are secured by a first lien on the property and are generally limited to 65% of the acquisition price or the appraised value, whichever is less. Development land loans are
16
generally limited to 75% of the discounted appraised value based on the projected lot sale absorption rate and associated carry and liquidation costs of the developed lots and homes. Underwriting criteria for acquisition and development loans include, but are not limited to, evidence of preliminary plat approval, compliance with state and Federal environmental protection and disclosure laws, engineering plans, detailed cost breakdowns and marketing plans. These loans have been limited to projects within the Puget Sound region. Other risk management tools include, but are not limited to, title insurance, feasibility and market absorption reports, environmental questionnaires, and other supplementary information as may be required to determine if the project and proposed lots represent acceptable collateral for timely repayment of the loan. The success of land acquisition, development and construction lending is largely dependent upon future sales for repayment of the loan. Economic and market conditions can be unpredictable and can have a significant adverse impact on the value and marketability of the collateral for land acquisition, development and construction loans.
We also originate individual lot loans, which are secured by a first lien on the property, for borrowers who are planning to build on the lot within the next five years. Generally, these loans have a maximum loan to value ratio of 75% for improved lands (legal access, water and power) and 50% to 65% for unimproved land. The interest rate on these loans is fixed with a 20-year amortization and a five-year term. At June 30, 2015, individual lot loans totaled $11.9 million or 2.4% of the total loan portfolio.
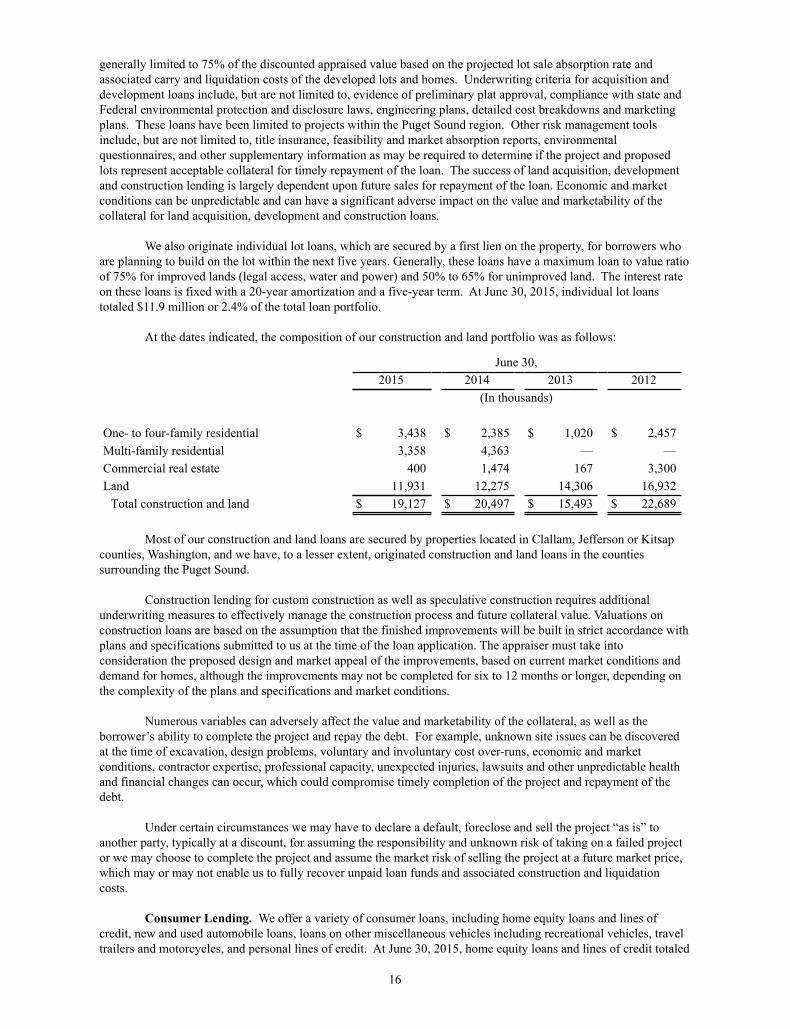
At the dates indicated, the composition of our construction and land portfolio was as follows:
June 30,2015 2014 2013 2012
(In thousands)
One- to four-family residential $ 3,438 $ 2,385 $ 1,020 $ 2,457Multi-family residential 3,358 4,363 — —Commercial real estate 400 1,474 167 3,300Land 11,931 12,275 14,306 16,932
Total construction and land $ 19,127 $ 20,497 $ 15,493 $ 22,689
Most of our construction and land loans are secured by properties located in Clallam, Jefferson or Kitsap counties, Washington, and we have, to a lesser extent, originated construction and land loans in the counties surrounding the Puget Sound.
Construction lending for custom construction as well as speculative construction requires additional underwriting measures to effectively manage the construction process and future collateral value. Valuations on construction loans are based on the assumption that the finished improvements will be built in strict accordance with plans and specifications submitted to us at the time of the loan application. The appraiser must take into consideration the proposed design and market appeal of the improvements, based on current market conditions and demand for homes, although the improvements may not be completed for six to 12 months or longer, depending on the complexity of the plans and specifications and market conditions.
Numerous variables can adversely affect the value and marketability of the collateral, as well as the borrower’s ability to complete the project and repay the debt. For example, unknown site issues can be discovered at the time of excavation, design problems, voluntary and involuntary cost over-runs, economic and market conditions, contractor expertise, professional capacity, unexpected injuries, lawsuits and other unpredictable health and financial changes can occur, which could compromise timely completion of the project and repayment of the debt.
Under certain circumstances we may have to declare a default, foreclose and sell the project “as is” to another party, typically at a discount, for assuming the responsibility and unknown risk of taking on a failed project or we may choose to complete the project and assume the market risk of selling the project at a future market price, which may or may not enable us to fully recover unpaid loan funds and associated construction and liquidation costs.
Consumer Lending. We offer a variety of consumer loans, including home equity loans and lines of credit, new and used automobile loans, loans on other miscellaneous vehicles including recreational vehicles, travel trailers and motorcycles, and personal lines of credit. At June 30, 2015, home equity loans and lines of credit totaled

17
$36.4 million, or 7.4% of the loan portfolio. Our interest rates on home equity loans are risk priced adjusted based on credit score, loan to value and overall credit quality of the applicant. Home equity loans are made for, among other purposes, the improvement of residential properties, weatherization, and other consumer needs. Some of these loans are secured by first liens; however, the majority of these loans are secured by a second deed of trust on the residential property. Fixed-rate, fully-amortizing home equity loans are available up to a maximum loan amount of $250,000 with repayment periods ranging from seven to 15 years. We also offer a home equity line of credit product, which was revised in 2013 to address concerns about a borrower's ability to repay or refinance the remaining principal balance at maturity. Previously, home equity lines of credit were originated as interest only for the term of the loan, usually 15 to 20 years, with the remaining principal balance due, in the form of a balloon payment, at the end of the term, up to a maximum of $250,000. Our new home equity product has a five year, interest-only term with the remaining balance at the end of the term, which may be up to a maximum of $250,000, fully amortized over a period of 15 years. Home equity lines of credit are tied to the prime rate during the interest-only period. Home equity loans and lines of credit have greater risk than one- to four-family residential mortgage loans because they are secured by mortgages subordinated to the existing first mortgage on the property, which we may or may not hold, and do not have private mortgage insurance coverage.
We also offer a weatherization loan program guaranteed by either the City of Port Angeles or the Clallam County Public Utility District. The purpose of these loans is to promote energy conservation by weatherizing homes and providing a low interest rate program for consumers to achieve lower energy costs and tax rebates. These are one-year adjustable-rate loans indexed to LIBOR.
We offer several options for vehicle purchase or refinance with a maximum term of up to 84 months depending on the age and condition of the vehicle. Loan rates for auto lending, as well as all other consumer loans, are priced based on the specific loan type and the risk involved. Direct and indirect lending sources are used to originate auto loans, which includes online as well as in person applications at our branch locations.
We make indirect auto loans through an auto dealer loan program with two local franchised car dealerships for new and used cars. We have provided our underwriting criteria and pricing to the dealers but require further underwriting review and final approval prior to funding. At June 30, 2015, we had $575,000 of loans originated through the local dealer program. In addition to the local program, at June 30, 2015, we also had $508,000 of auto loans to borrowers located outside the state of Washington and $920,000 of auto loans to borrowers located inside the state of Washington that were originated through an internet-based origination service whose contract was terminated in February 2015.
Consumer loans represent additional and unique underwriting risks because of the mobility and rapidly depreciating nature of consumer assets such as automobiles, RVs, boats and trailers in contrast to real estate based collateral. If a borrower defaults, repossession and liquidation of the collateral may not provide sufficient sales proceeds to satisfy the outstanding loan balance. Many factors account for potential loan losses on consumer loans, a number of which are largely outside the control of the lenders and include deferred maintenance, damages, depreciation and borrowers who relocate to other states. While subsequent legal actions and judgments against defaulted borrowers may be appropriate, such collection efforts and costs may not always be warranted and are evaluated after determining the cost of such collection efforts and the probability of any future loan recovery. In addition, consumer loan collections are dependent on the borrower’s continuing financial stability and are more likely to be adversely affected by job loss, illness or personal bankruptcy. Furthermore, the application of various federal and state laws, including federal and state bankruptcy and insolvency laws, may limit the amount that can be recovered on these loans.
Commercial Business Lending. As of June 30, 2015, commercial business loans totaled $14.8 million, or 3.0% of our loan portfolio. These loans are primarily originated as loans to business borrowers, which include lines of credit, term loans and letters of credit. These loans are typically secured by business assets and are used for general business purposes, including seasonal and permanent working capital, equipment financing, capital, and general investments. Loan terms vary from one to seven years. The interest rates on such loans are generally floating rates indexed to LIBOR, The Wall Street Journal prime rate or other acceptable indices depending on prevailing economic and market conditions. A typical requirement for us to extend business credit is for the borrower to have a business deposit relationship with us which, in most cases, includes multiple accounts and related services from which we realize low cost deposits plus service and ancillary fee income.
Commercial business loans typically have shorter maturity terms and higher interest spreads than real estate loans, but generally involve more credit risk because of the type and nature of the collateral. We are focusing our efforts on small-to-medium sized, privately-held companies with local or regional businesses that operate in our

18
market area. Our commercial business lending policy includes credit file documentation and analysis of the borrower’s background, capacity to repay the loans and the adequacy of the borrower’s capital, as well as an evaluation of other conditions affecting the borrower. Analysis of the borrower’s past, present and future cash flows, as well as the collateral pledged as security is also an important aspect of our credit analysis. We generally obtain personal guarantees on our commercial business loans.
Primary repayment of our commercial loans is often dependent on cash flows of the borrower, which may be unpredictable due to normal business cycles, industry changes, and economic and political conditions. Furthermore, collateral securing these loans may fluctuate in value based on market conditions or other factors. Our commercial business loans are originated primarily based on the identified cash flow of the borrowing entity and secondarily on the underlying collateral and revenue provided by the borrower and guarantors. Most often, this collateral consists of real estate, accounts receivable, inventory or equipment. Secondary sources of repayment and/or recovery for most of these loans are based on the liquidation of the pledged collateral, and may include enforcement of personal guaranties. Secondary underwriting and collection efforts may include accounts receivable, or other third party payments, whereby availability of funds for repayment of these loans may be substantially dependent on the ability of the borrower or a third party to collect amounts due from its customers. In addition, collateral secured by business assets may become functionally or economically obsolete, which can become problematic from a valuation, collection and liquidation perspective.
Loan Solicitation and Processing. Our loan originations are obtained from a variety of sources, including existing or walk-in customers, business development by our relationship managers (“RMs”), and referrals from our directors, business owners, investors, entrepreneurs, builders, realtors, existing customers and other professional third parties, including brokers. Loan originations are further supported by lending services offered through our internet website, direct mail, advertising, cross-selling, employees’ community service and in the case of auto loans, through dealers or web-based established third-party internet solicitors. All of our consumer loan products, including residential mortgage loans, secured and unsecured consumer loans are processed through our centralized processing and underwriting center. Commercial business loans, including commercial and multi-family real estate loans, are processed by the RMs, assistants and credit underwriters with formalized credit presentations submitted to our senior loan committee for approval. The senior loan committee consists of the president/chief executive officer, chief financial officer, chief credit officer, chief banking officer, director of lending, and commercial credit administrator. Exceptions to our loan policies are fully disclosed to the approving authority, either individual or senior loan committee prior to commitment. Exceptions are reported to the board of directors monthly. During the years ended June 30, 2015 and 2014, there were twenty-seven exceptions and seven exceptions, respectively.
Lending Authority. Our board of directors has delegated loan approval authority as follows: Overdrafts may be approved by select named positions up to $10,000. The chief credit officer along with an underwriter or the mortgage and consumer credit administrator can approve mortgage loans up to $500,000. Mortgage loans in amounts over $500,000 up to $2.9 million require the approval of the senior loan committee. At June 30, 2015, any loan or relationship in excess of $3.0 million required the approval of the board loan asset/quality committee. As of August 31, 2015, the lending limit requiring board loan approval was increased to $5.0 million with a corresponding lending authority change of up to $4.9 million from $2.9 million for the senior loan committee.
Commercial loan approvals require two or more signatures from Credit Administration, Production Administration, and Executive Administration personnel. Either the chief credit officer or the commercial credit administrator, who are authorized individually to approve commercial loan relationships up to $300,000 and $200,000, respectively, must approve all loans. The chief banking officer or director of lending are authorized individually to approve commercial loans relationships up to $200,000, and the chief executive officer or chief financial officer are authorized individually to approve commercial loans up to $100,000. Approval is required from two of the three levels, regardless of the loan relationship amount, and their approval authorities can be aggregated not to exceed $500,000. The approval of any commercial loan relationship in excess of $500,000 and up to $2.9 million requires the approval of the two officers stated above with further approval required from the Bank's senior loan committee. Commercial loan relationships of $3.0 million or more require approval by the senior loan committee and then the majority of the board loan committee. In certain circumstances, the chief credit officer, individually, or the commercial credit administrator and the chief banking officer together, may approve Automated Clearing House and Remote Deposit Capture transactions up to any amount. In addition, where there is an existing relationship with a commercial borrower with loans outstanding in excess of $3.0 million, the board loan committee has the authority to authorize the senior loan committee to approve additional commercial loans to this borrower in excess of $3.0 million, with the total amount of such loans not to exceed $300,000.

19
The board loan/asset quality committee and full board continue to provide direction through policy approval and oversight for key credit risk management, such as lending to percentage of capital, loans to one borrower limits, and underwriting criteria. The board loan committee reviews all loan approvals by the senior loan committee each quarter. The board of directors will also review the approvals of the board loan/asset quality committee. The board loan/asset quality committee will also review all policy exceptions, concentrations of credit and compliance with all lending policies. The board loan/asset quality committee meets at least quarterly to discuss asset quality, loan production, and policy compliance, as well as to review industry trends.
Washington law provides that Washington chartered savings banks, such as First Federal, are subject to the same loans to one borrower restrictions as Washington chartered commercial banks, which restricts total loans and extensions of credit by a bank to 20% of its unimpaired capital and surplus. As a result, under Washington law, First Federal would be limited to loans to one borrower of $27.4 million at June 30, 2015. First Federal, however, has elected to restrict its loans to one borrower to no more than 15% of its unimpaired capital plus surplus, which was $18.5 million at June 30, 2015, or $13.0 million, whichever is less, unless specifically approved by the board loan/asset quality committee as an exception to policy. Under this policy, at June 30, 2015, First Federal’s limit on loans to one borrower was $13.0 million. Subsequent to June 30, 2015, First Federal increased its loans to one borrower limit from $13.0 million to $15.0 million. At June 30, 2015, there were 41 loans, or $120.5 million, with relationships over $3.0 million. No relationship over $3.0 million was past-due, on nonaccrual status, or was accounted for as a troubled debt restructuring ("TDR") as of June 30, 2015. The following table provides a summary of our five largest relationships at June 30, 2015.
Total CommitmentNumber of Loans in
Relationship Primary Collateral Type(In thousands)
$11,617 3 Commercial Real Estate11,568 1 Commercial Real Estate8,704 2 Commercial Real Estate7,408 2 Multi-family Real Estate7,158 4 Commercial Real Estate
Loan Originations, Servicing, Purchases and Sales. We originate mortgage, consumer, multi-family and commercial real estate, and commercial business loans for our portfolio utilizing fixed- and adjustable-rate loan products. We also purchase whole and participation loans on a servicing retained or released basis, including loans that may be located outside our primary market areas. Our ability to originate sufficient loan volume to meet our asset and liability management objectives is limited within our historical market as a result of consumer demand, population demographics and economic conditions. During the past few years, we, like many other financial institutions, have experienced significant prepayments on loans due to prevailing economic conditions and low interest rates. In periods of economic uncertainty, the ability of financial institutions, including us, to originate real estate loans is substantially reduced, which results in a decrease in interest income. During the years ended June 30, 2015, 2014 and 2013, our total originations were $104.5 million, $113.5 million and $175.0 million, respectively.
The North Olympic Peninsula region, which represents our largest concentration of depositors and borrowers, has experienced limited population growth, and the region's unemployment rate is higher than both the state and national unemployment rates. As a result, we have recently begun to opportunistically originate and purchase loans outside of these areas in the counties surrounding the Puget Sound, and we may purchase loans with different credit and underwriting criteria than those we originate organically.
During the years ended June 30, 2015, 2014 and 2013 we purchased $26.1 million, $39.9 million and $43.0 million of loans, respectively. Loan pools purchased in the past three years consisted primarily of single family residential properties located in Washington, California, Kentucky and Ohio. We have also purchased commercial real estate secured by properties located in California, multi-family real estate secured by properties located in Washington and participated in a commercial real estate loan secured by a property in eastern Washington. Purchased loans, loan pools, and participations are underwritten by our credit administration department, evaluated for credit risk, and approved by the appropriate loan committee(s) prior to purchase, according to our lending authority guidelines.
At June 30, 2015, we had approximately $76.0 million of one- to four-family mortgage loans, $23.0 million of multi-family loans, $63.8 million of commercial real estate loans, and $5.5 million of construction and land loans secured by properties located outside of the North Olympic Peninsula region and Kitsap and Whatcom counties.

20
Included in the one- to four-family residential loans are $12.7 million and $17.5 million of one- to four-family mortgages in the states of California and Ohio, respectively. Also included in these amounts are multi-family and commercial real estate loans of $12.7 million and $58.3 million, respectively, located primarily in King, Pierce and Snohomish counties around the Puget Sound region of Washington. For more information see Item 1.A. Risk Factors -“Slower growth in our primary market area has led us to originate and purchase loans outside of our market area which could affect the level of our nonperforming loans.”
We actively sell residential first mortgage loans in the secondary market, and we currently service all loans sold but have, in the past, also sold loans with the servicing released. The majority of all residential mortgages we originate are fixed-rate mortgages, which primarily are sold to the secondary market at the time of origination to improve our interest rate risk. In 2012, we began selectively adding 30 year fixed-rate mortgages to our loan portfolio in an effort to enhance our net interest income. During the years ended June 30, 2015, 2014 and 2013, we sold $22.5 million, $28.8 million and $46.8 million of residential mortgage loans, respectively. Our secondary market relationship is primarily with Freddie Mac. These sales allow for a servicing fee on loans when the servicing is retained by us. Most one- to four-family loans sold by us are sold with servicing retained. Loans in general are sold on a non-recourse basis, whenever possible, subject to a provision for repurchase upon breach of representation, warranty or covenant. Sales of real estate loans through secondary market conduits can be beneficial to us since these sales generate income at the time of sale, produce future servicing income, provide funds for additional lending, and assist us in managing our interest rate risk.
During fiscal 2008, we sold loans with “life of the loan” recourse provisions to Freddie Mac, requiring us to repurchase the loan if it defaults. The remaining balance of loans serviced for others with life of the loan recourse provisions was $7.4 million at June 30, 2015. Two loans were repurchased during the year ended June 30, 2015 for $335,000, one loan was repurchased during the year ended June 30, 2014 for $239,000 and one loan was repurchased during the year ended June 30, 2013 for $150,000. Additionally, beginning in May 2013, the Freddie Mac has required loans guaranteed by the United States Department of Agriculture to be sold with 'life of the loan" recourse provisions. We earned mortgage servicing income of $561,000, $606,000, and $659,000 for the years ended June 30, 2015, 2014 and 2013, respectively. At June 30, 2015, we were servicing $213.9 million of residential mortgage loans for Freddie Mac and other secondary market purchasers. These mortgage servicing rights had a fair value at June 30, 2015, of $1.8 million. See Note 6 of the Notes to Consolidated Financial Statements included in Item 8, "Financial Statements and Supplementary Data," of this Form 10-K.
Gains, losses and transfer fees on sales of one- to four-family loans and participations are recognized at the time of the sale. Our net gain on sales of residential loans was $548,000, $762,000 and $1.6 million for the years ended June 30, 2015, 2014 and 2013, respectively.

21
The following table shows our loan origination, sale and repayment activities for the periods indicated (includes loans held for sale):
Year Ended June 30,2015 2014 2013
(In thousands)Originations by type:Fixed-rate:One- to four-family $ 56,191 $ 36,626 $ 84,723Multi-family — 132 397Commercial real estate — 3,745 16,037Construction and land 8,204 1,103 398Home equity 798 1,489 269Other consumer 1,609 2,127 5,658Commercial business 1,148 1,271 12,023
Total fixed-rate 67,950 46,493 119,505Adjustable-rate:One- to four-family 3,276 3,263 4,242Multi-family — — 8,041Commercial real estate 20,151 49,180 26,693Construction and land 8,461 5,328 10,104Home equity 1,931 1,221 1,839Other consumer 9 3 1Commercial business 2,675 8,053 4,600
Total adjustable-rate 36,503 67,048 55,520Total loans originated 104,453 113,541 175,025
Purchases by type:One- to four-family 26,078 18,477 37,405Multi-family 21 20,463 58Commercial real estate — 993 5,544
Total loans purchased 26,099 39,933 43,007Sales and Repayments:One- to four-family loans sold 22,540 28,769 46,798
Commercial real estate loans sold — 5,865 —Total loans sold 22,540 34,634 46,798
Total principal repayments, charge-offs and transfers toreal estate owned and repossessed assets 118,462 72,320 123,300
Total reductions 141,002 106,954 170,098Net loan activity $ (10,450) $ 46,520 $ 47,934
Loan Origination and Other Fees. Loan origination fees generally represent a percentage of the principal amount of the loan that is paid by the borrower. Accounting standards require that certain fees received, net of certain origination costs, be deferred and amortized over the contractual life of the loan. Net deferred fees or costs associated with loans that are prepaid or sold are recognized as income at the time of prepayment. We had $840,000, $862,000 and $622,000 of net deferred loan fees and costs at June 30, 2015, 2014 and 2013. In addition, we receive fees for loan commitments, late payments and miscellaneous services.
Asset Quality
Management of asset quality is accomplished by internal controls, monitoring and reporting of key risk indicators, and both internal and independent third party loan reviews. The primary objective of our loan review process is to measure borrower performance and assess risk for the purpose of identifying loan weakness in order to minimize loan loss exposure. From the time of loan origination through final repayment, all loans are assigned a risk rating based on pre-determined criteria and levels of risk. The risk rating is monitored annually for most loans, and may change during the life of the loan as appropriate.
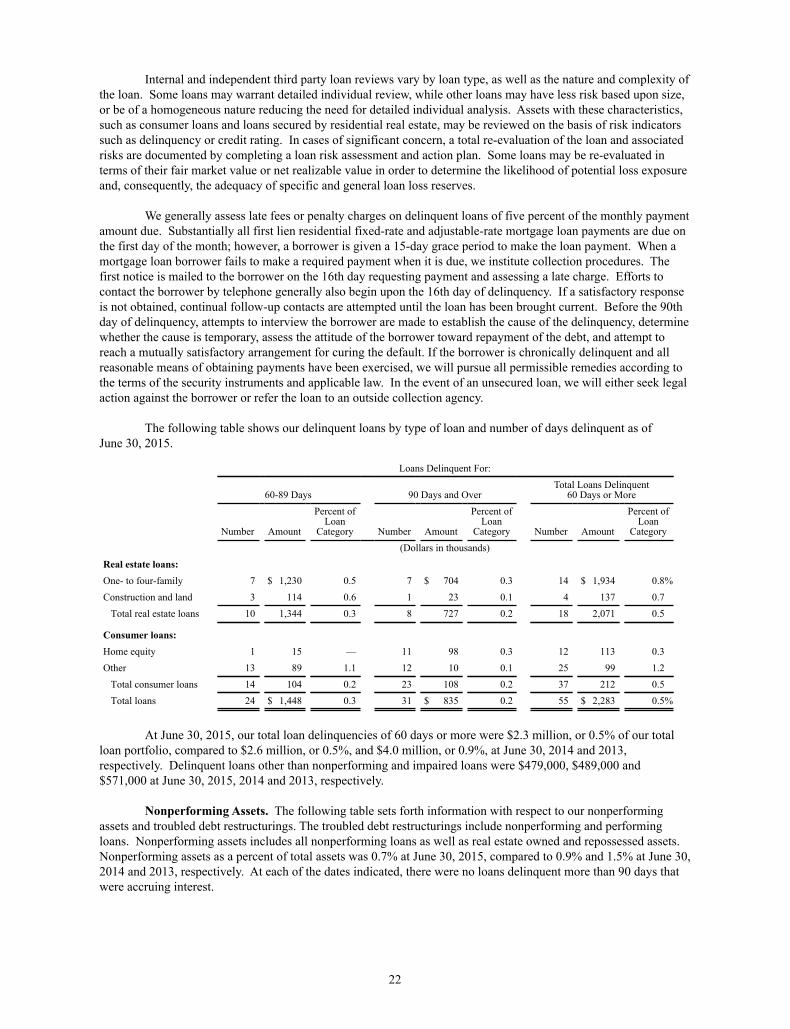
22
Internal and independent third party loan reviews vary by loan type, as well as the nature and complexity of the loan. Some loans may warrant detailed individual review, while other loans may have less risk based upon size, or be of a homogeneous nature reducing the need for detailed individual analysis. Assets with these characteristics, such as consumer loans and loans secured by residential real estate, may be reviewed on the basis of risk indicators such as delinquency or credit rating. In cases of significant concern, a total re-evaluation of the loan and associated risks are documented by completing a loan risk assessment and action plan. Some loans may be re-evaluated in terms of their fair market value or net realizable value in order to determine the likelihood of potential loss exposure and, consequently, the adequacy of specific and general loan loss reserves.
We generally assess late fees or penalty charges on delinquent loans of five percent of the monthly payment amount due. Substantially all first lien residential fixed-rate and adjustable-rate mortgage loan payments are due on the first day of the month; however, a borrower is given a 15-day grace period to make the loan payment. When a mortgage loan borrower fails to make a required payment when it is due, we institute collection procedures. The first notice is mailed to the borrower on the 16th day requesting payment and assessing a late charge. Efforts to contact the borrower by telephone generally also begin upon the 16th day of delinquency. If a satisfactory response is not obtained, continual follow-up contacts are attempted until the loan has been brought current. Before the 90th day of delinquency, attempts to interview the borrower are made to establish the cause of the delinquency, determine whether the cause is temporary, assess the attitude of the borrower toward repayment of the debt, and attempt to reach a mutually satisfactory arrangement for curing the default. If the borrower is chronically delinquent and all reasonable means of obtaining payments have been exercised, we will pursue all permissible remedies according to the terms of the security instruments and applicable law. In the event of an unsecured loan, we will either seek legal action against the borrower or refer the loan to an outside collection agency.
The following table shows our delinquent loans by type of loan and number of days delinquent as of June 30, 2015.
Loans Delinquent For:
60-89 Days 90 Days and OverTotal Loans Delinquent
60 Days or More
Number Amount
Percent ofLoan
Category Number Amount
Percent ofLoan
Category Number Amount
Percent ofLoan
Category(Dollars in thousands)
Real estate loans:One- to four-family 7 $ 1,230 0.5 7 $ 704 0.3 14 $ 1,934 0.8%Construction and land 3 114 0.6 1 23 0.1 4 137 0.7
Total real estate loans 10 1,344 0.3 8 727 0.2 18 2,071 0.5
Consumer loans:Home equity 1 15 — 11 98 0.3 12 113 0.3Other 13 89 1.1 12 10 0.1 25 99 1.2
Total consumer loans 14 104 0.2 23 108 0.2 37 212 0.5Total loans 24 $ 1,448 0.3 31 $ 835 0.2 55 $ 2,283 0.5%
At June 30, 2015, our total loan delinquencies of 60 days or more were $2.3 million, or 0.5% of our total loan portfolio, compared to $2.6 million, or 0.5%, and $4.0 million, or 0.9%, at June 30, 2014 and 2013, respectively. Delinquent loans other than nonperforming and impaired loans were $479,000, $489,000 and $571,000 at June 30, 2015, 2014 and 2013, respectively.
Nonperforming Assets. The following table sets forth information with respect to our nonperforming assets and troubled debt restructurings. The troubled debt restructurings include nonperforming and performing loans. Nonperforming assets includes all nonperforming loans as well as real estate owned and repossessed assets. Nonperforming assets as a percent of total assets was 0.7% at June 30, 2015, compared to 0.9% and 1.5% at June 30, 2014 and 2013, respectively. At each of the dates indicated, there were no loans delinquent more than 90 days that were accruing interest.

23
June 30,2015 2014 2013 2012 2011
(Dollars in thousands)
Nonaccruing loans:Real estate loans:One- to four-family $ 4,232 $ 3,543 $ 5,643 $ 5,410 $ 5,041Commercial real estate 147 1,913 2,823 3,626 5,008Construction and land 159 127 236 132 769
Total real estate loans 4,538 5,583 8,702 9,168 10,818Consumer loans:Home equity 181 340 1,062 882 883Other 164 41 100 102 290
Total consumer loans 345 381 1,162 984 1,173Total nonaccruing loans 4,883 5,964 9,864 10,152 11,991
Real estate owned:One- to four-family 493 524 1,920 2,546 3,630Commercial real estate 1,368 — 195 41 632Construction and land — 220 119 233 134
Total real estate loans 1,861 744 2,234 2,820 4,396Home equity — — — — —
Total real estate owned 1,861 744 2,234 2,820 4,396
Repossessed automobiles andrecreational vehicles 53 66 31 45 79
Total nonperforming assets $ 6,797 $ 6,774 $ 12,129 $ 13,017 $ 16,466
TDR loans:One- to four-family $ 4,923 $ 5,939 $ 6,318 $ 4,946 $ 4,798Multi-family 629 728 280 287 —Commercial real estate 1,363 4,456 4,701 2,894 3,140Construction and land — — — — —
Total real estate loans 6,915 11,123 11,299 8,127 7,938Home equity 428 615 740 742 594Other consumer — — 2 30 61Commercial business 403 426 308 — —
Total restructured loans $ 7,746 $ 12,164 $ 12,349 $ 8,899 $ 8,593
Nonaccrual and 90 days or more past dueloans as a percentage of total loans 1% 1.2% 2.2% 2.5% 2.8%
Nonperforming TDR loans included intotal nonaccruing loans and totalrestructured loans above $ 5,676 $ 3,536 $ 5,263 $ 4,107 $ 5,279
For the years ended June 30, 2015 and 2014, gross interest income which would have been recorded had the nonaccruing loans been current in accordance with their original terms amounted to $184,000, and $196,000, respectively. The amount that was included in interest income on impaired loans was $473,000, $774,000 and $516,000, respectively, for the years ended June 30, 2015, 2014 and 2013.
Other Loans of Concern. In addition to the nonperforming assets set forth in the table above, as of June 30, 2015, there were 88 accruing loans totaling $11.2 million with respect to which known information about the possible credit problems of the borrowers have caused management to have concerns as to the ability of the borrowers to comply with present loan repayment terms and which may result in the future inclusion of such items in the nonperforming asset categories. These loans have been considered in management's determination of our allowance for loan losses.

24
Real Estate Owned and Repossessed Property. Real estate we acquire as a result of foreclosure, deed in lieu, or non-merger deed in lieu of foreclosure is classified as real estate owned until it is sold. When the property is acquired, it is recorded at the lower of its cost, which is the unpaid principal balance of the related loan, or the fair market value of the property less selling costs. Other repossessed collateral, including automobiles, are also recorded at the lower of cost or fair market value. As of June 30, 2015, First Federal had four properties in real estate owned with an aggregate book value of $1.9 million. Of the four properties owned, the largest was a $1.4 million commercial real estate property, which was subsequently sold, and the remaining $493,000 consisted of three single family residential properties. Our real estate owned properties are all located in Washington. The properties included in real estate owned are listed with a real estate broker for sale, included in the multiple listing service, and are actively being marketed.
Restructured Loans. According to Generally Accepted Accounting Principles ("GAAP"), we are required to account for certain loan modifications or restructurings as a TDR. In general, the modification or restructuring of a debt is considered a TDR if we, for economic or legal reasons related to a borrower’s financial difficulties, grant a concession to the borrower under more favorable terms and conditions than we would grant to an ordinary bank customer under a normal course of business standard.
General loan restructures and modifications not considered as TDR loans may include lowering interest rates, extending the maturity date, deferring or re-amortizing monthly payments or other concessions. These general loan restructures and modifications are made on a case-by-case basis provided that such concessions are not below market rates nor considered material and outside of the terms and conditions granted to other borrowers under normal course of business standards.
Adversely classified loans which are subsequently modified and placed in nonaccrual status must remain in nonaccrual status for a period of not less than six months with consecutive satisfactory payment performance and be further supported by current financial information and analysis which demonstrates the borrowers have the financial capacity to meet future debt service before being returned to accrual status.
As of June 30, 2015, we had 58 loans with an aggregate principal balance of $7.7 million which we have identified as TDR loans, of which $2.1 million were performing in accordance with their revised payment terms and on accrual status. TDR loans are placed on accrual status after a sustained period of payment performance after modification, usually six months or longer. Included in the allowance for loan losses at June 30, 2015, is a reserve of $272,000 related to these loans in conformance with GAAP. As of June 30, 2015, there were $5.7 million of TDR loans on nonaccrual, all of which were restructured or modified prior to June 30, 2014, whose accrual status continues to be evaluated by management and that remain on non-accrual due to a lack of sustained payment performance after modification. Nonaccruing TDR loans are classified as substandard and the appropriate loss history and qualitative factors determine the allowance. Accruing TDR loans may be classified special mention or pass depending upon verified repayment sources, collateral values and repayment history. The amount of the allowance is determined based on the current risk rating and the amount that is needed determines the amount that is needed to fund the reserve.
Classified Assets. Federal regulations provide for the classification of lower quality loans and other assets as substandard, doubtful or loss. An asset is considered substandard when material conditions are identified which raise issues about the financial capacity, collateral or other conditions which may compromise the borrower’s promise and ability to satisfactorily perform under the terms of the loan. Substandard assets considered impaired include those characterized by the distinct possibility that we will sustain some loss if the deficiencies are not corrected. Assets classified as doubtful have all the weaknesses inherent in those classified as impaired with the added characteristic that the weaknesses present make near term collection or liquidation highly questionable and improbable. Assets classified as loss are those considered uncollectible and of such little value that their continuance as assets with the establishment of a specific loss reserve is not warranted.
In accordance with Accounting Standards Codification ("ASC") 310 and ASC 450, when we classify problem assets as substandard, doubtful, and loss, we conduct individual loan and collateral analysis to establish a specific loan loss allowance in an amount we deem prudent, based on the unique circumstances of each loan. Our Credit Administration, and senior management review the analysis and approve the specific loan loss allowance for these loans.
General reserve loan loss allowances represent loss allowances which have been established to recognize the inherent risk associated with lending activities, but which, unlike specific allowances on impaired loans, have not been specifically allocated to particular problem assets. When an insured institution identifies a problem asset as

25
an unavoidable and imminent loss, it is required to partially or fully charge-off such assets in the period in which they are deemed uncollectible. Assets that do not currently expose us to sufficient risk to warrant classification as substandard or doubtful but possess identified weaknesses are classified by us as either watch or special mention assets. Our determination as to the classification of our assets and the amount of our valuation allowances is subject to review by the DFI and the FDIC, who can order specific charge-offs or the establishment of additional loan loss allowances.
We review, at least quarterly, the problem assets in our portfolio to determine whether any assets require reclassification. On the basis of our review, as of June 30, 2015, we had classified loans of $9.9 million and $6.3 million of special mention loans. The amount classified represented 5.2% of equity capital and 1.1% of assets at that date.
The following table shows the aggregate amounts of our classified assets at the dates indicated.
June 30,2015 2014 2013
(In thousands)Loans:Substandard loans $ 9,851 $ 13,943 $ 21,515Doubtful loans — — 156
Total classified assets $ 9,851 $ 13,943 $ 21,671
Included in our classified loans at June 30, 2015 were $1.3 million of loans made to not-for-profit organizations. We continue to work with these nonprofit entities to improve their finances and encourage ongoing debt repayment.

26
The
follo
win
g ta
ble
show
s at J
une
30, 2
015,
the
geog
raph
ic d
istri
butio
n of
our
cla
ssifi
ed a
sset
s in
dolla
r am
ount
s and
per
cent
ages
.
Nor
th O
lym
pic
Peni
nsul
aO
ther
Wes
tern
Was
hing
ton
Oth
er W
ashi
ngto
nTo
tal i
nW
ashi
ngto
n St
ate
All
Oth
er S
tate
sT
otal
Am
ount
% o
f Tot
al in
Cat
egor
yA
mou
nt%
of T
otal
inC
ateg
ory
Am
ount
% o
f Tot
al in
Cat
egor
yA
mou
nt%
of T
otal
inC
ateg
ory
Am
ount
% o
f Tot
al in
Cat
egor
yA
mou
nt%
of T
otal
inC
ateg
ory
(Dol
lars
in th
ousa
nds)
Rea
l est
ate
loan
s:
One
- to
four
-fam
ily$
5,00
53.
0%$
167
0.3%
$17
24.
9%$
5,34
42.
4%$
609
1.7%
$5,
953
2.3%
Mul
ti-fa
mily
629
16.7
——
——
629
1.9
——
629
1.9
Com
mer
cial
real
est
ate
1,45
73.
0—
——
—1,
457
1.2
——
1,45
71.
2
Con
stru
ctio
n an
d la
nd23
71.
8—
——
—23
71.
2—
—23
71.
2
Tot
al r
eal e
stat
e lo
ans
7,32
83.
116
70.
117
20.
97,
667
1.9
609
1.7
8,27
61.
9
Con
sum
er lo
ans:
Hom
e eq
uity
779
2.4
130.
539
6.1
831
2.3
——
831
2.3
Oth
er c
onsu
mer
226
3.5
222.
838
8.9
286
3.7
——
286
3.5
Tot
al c
onsu
mer
loan
s1,
005
2.5
351.
077
7.2
1,11
72.
5—
—1,
117
2.5
Com
mer
cial
bus
ines
s loa
ns45
85.
5—
——
—45
83.
1—
—45
83.
1
Tot
al lo
ans
$8,
791
3.1%
$20
20.
1%$
249
1.2%
$9,
242
2.0%
$60
91.
7%$
9,85
12.
0%
26
The following table shows at June 30, 2015, the geographic distribution of our classified assets in dollar amounts and percentages.
North OlympicPeninsula
Other WesternWashington Other Washington
Total inWashington State All Other States Total
Amount% of Total in
Category Amount% of Total in
Category Amount% of Total in
Category Amount% of Total in
Category Amount% of Total in
Category Amount% of Total in
Category
(Dollars in thousands)
Real estate loans:
One- to four-family $ 5,005 3.0% $ 167 0.3% $ 172 4.9% $ 5,344 2.4% $ 609 1.7% $ 5,953 2.3%
Multi-family 629 16.7 — — — — 629 1.9 — — 629 1.9
Commercial real estate 1,457 3.0 — — — — 1,457 1.2 — — 1,457 1.2
Construction and land 237 1.8 — — — — 237 1.2 — — 237 1.2
Total real estate loans 7,328 3.1 167 0.1 172 0.9 7,667 1.9 609 1.7 8,276 1.9
Consumer loans:
Home equity 779 2.4 13 0.5 39 6.1 831 2.3 — — 831 2.3
Other consumer 226 3.5 22 2.8 38 8.9 286 3.7 — — 286 3.5
Total consumer loans 1,005 2.5 35 1.0 77 7.2 1,117 2.5 — — 1,117 2.5
Commercial business loans 458 5.5 — — — — 458 3.1 — — 458 3.1
Total loans $ 8,791 3.1% $ 202 0.1% $ 249 1.2% $ 9,242 2.0% $ 609 1.7% $ 9,851 2.0%
27
Allowance for Loan Losses. Management recognizes that loan losses may occur over the life of a loan and the allowance for loan losses must be maintained at a level necessary to absorb specific losses on impaired loans and probable losses inherent for the total loan portfolio. Monthly, our chief credit officer prepares a report of the allowance for loan losses and establishes the provision for credit losses based on the risk composition of our loan portfolio, delinquency levels, loss experience, economic conditions, regulatory examination results, seasoning of the loan portfolios, and other factors related to the collectability of the loan portfolio. This allowance for loan losses report is reviewed monthly by our Asset Quality Committee consisting of the chief credit officer, chief banking officer, chief financial officer and chief executive officer. The qualitative factors, which have an impact on the allowance for loan losses, are approved by Management on a quarterly basis. Quarterly, the allowance for loan losses with the adjusted qualitative factors is reviewed by the board of director's board loan asset quality committee and presented for approval to the full board of directors. The allowance is increased by the provision for loan losses, which is charged against current period operating results, and decreased by the amount of actual loan charge-offs, net of recoveries.
We believe the quantitative and qualitative analysis necessary to calculate accounting estimates for loan loss reserves is a critical process; however, we also recognize that economic, market, industry and political changes can adversely affect loan quality. Unpredictable personal events or other undisclosed information by individual borrowers can occur at any time, which can result in immediate significant changes in, as well as management’s assumptions about, probable losses inherent in the loan portfolio. The impact of such events can quickly deplete the allowance and potentially require increased provisions to replenish the allowance, which could negatively affect current and future earnings.
Our methodology for analyzing the allowance for loan losses consists of two components: general and specific allowances. The formula for the general loan loss reserve allowance is determined by applying an estimated quantified loss percentage, as well as qualitative factors, to various groups of loans. The loss percentages are generally based on various historical measures such as the amount and type of classified loans, past due ratios, loss experience, and economic conditions, which could affect the collectability of the respective loan types. Qualitative factors and adjustments to the loan loss reserve calculations are largely subjective but also include objective variables such as unemployment rates, falling or rising real estate values, real estate and retail sales, demographics and other known material economic indicators. A specific allowance is established when management believes the borrower’s financial and/or collateral condition has materially deteriorated to a point of impairment and loss is highly probable.
The allowance for loan losses was $7.1 million at June 30, 2015, compared to $8.1 million and $8.0 million at June 30, 2014 and 2013, respectively. The fluctuation was a result of the changes in asset quality reflected in our delinquent, nonperforming, and classified loans, together with our recognition of qualitative factors which reflect the challenges that exist in our primary market areas within which we do business. Our actual loss history has improved as further time has elapsed since the significant charge-offs taken in 2011 and 2012 and we recover from the recent recession. First Federal uses a three year loss history as part of its allowance for loan losses methodology. We continually monitor local, regional, and national economic trends.
We define a loan as being impaired when, based on current information and events, it is probable we will be unable to collect amounts due under the contractual terms of the loan agreement. Large groups of smaller balance homogeneous loans such as residential mortgage loans and consumer loans are grouped together for impairment analysis and reserve calculation. All other loans are evaluated for impairment on an individual basis. In the process of identifying loans as impaired, management takes into consideration factors which include payment history, collateral value, financial condition of the borrower, and the probability of collecting scheduled payments in the future. Minor payment delays and insignificant payment shortfalls typically do not result in a loan being classified as impaired. The significance of payment delays and shortfalls is considered by management on a case-by-case basis, after taking into consideration the totality of circumstances surrounding the loans and borrowers, including payment history and amounts of any payment shortfall, length and reason for delay, and likelihood of return to stable performance.
In determining the allowance for loan losses, management utilizes the valuation shown in the most recent appraisal obtained, unless additional information is known, which can result in additional adjustments to the valuation of collateral pledged.
Appraisals or evaluations may be updated subsequent to the time of origination, whenever management identifies a loan as impaired or potentially being impaired. Events which may trigger an updated appraisal or evaluation include, but are not limited to, borrower delinquency, material technical defaults, annual review of

28
borrower’s financial condition, property tax and/or assessment delinquency, deferred maintenance or other information known or discovered by us.
Impaired collateral dependent loans require a current appraisal and analysis to determine the net value of the collateral for loan loss reserve purposes. Our policy is to update these appraisals every 12 months as long as the loan and collateral remains impaired, except for smaller balance, homogeneous loans, which are applied a reserve according to their risk weighting and loan class. Certain types of collateral, depending on market conditions, may require more frequent appraisals, updates or evaluations. When the results of the impairment analysis indicate a potential loss, the loan is classified as substandard and a specific reserve amount is established or adjusted to reflect any further deterioration in the value of the collateral that may occur prior to liquidation or reinstatement. The impairment analysis takes into consideration the primary, secondary, and tertiary sources of repayment, whether impairment is likely to be temporary in nature or liquidation is anticipated.
The allowance for loan losses was $7.1 million, or 1.4% of total loans outstanding, as of June 30, 2015, compared to $8.1 million and $8.0 million, or 1.6% and 1.7%, respectively, of total loans outstanding as of June 30, 2014 and June 30, 2013, respectively. The level of the loan loss reserve allowance as of June 30, 2015, is based on our current qualitative and quantitative methodology, which includes best efforts identification of loans which may have loss potential in the foreseeable future; however, actual losses may vary from the estimates. Management will continue to review the adequacy of the allowance for loan losses and make adjustments to the allowance for loan losses based on loan growth, economic conditions, charge-offs and portfolio composition. For the years ended June 30, 2015, 2014 and 2013, the provision for loan losses was $0, $1.3 million and $1.4 million, respectively.
As of June 30, 2015, we had impaired loans of $10.8 million, compared to $14.7 million and $17.3 million at June 30, 2014 and 2013, respectively.
Management believes that our allowance for loan losses as of June 30, 2015, was adequate to absorb the known and inherent risks of loss in the loan portfolio at that date. While management believes the estimates and assumptions used in its determination of the adequacy of the allowance are reasonable, there can be no assurance that such estimates and assumptions will not be proven incorrect in the future, or that the actual amount of future provisions will not exceed the amount of past provisions or that any increased provision that may be required will not adversely impact our financial condition and results of operations. In addition, the determination of the amount of our allowance for loan losses is subject to review by bank regulators, as part of the routine examination process, which may result in the establishment of additional reserves based upon their judgment of information available to them at the time of their examination.

The
follo
win
g ta
ble
sum
mar
izes
the
dist
ribut
ion
of o
ur a
llow
ance
for l
oan
loss
es a
t the
dat
es in
dica
ted.
June
30,
2015
2014
2013
2012
2011
Am
ount
Perc
ent
of lo
ans
in e
ach
cate
gory
to to
tal
Am
ount
Perc
ent
of lo
ans
in e
ach
cate
gory
to to
tal
Am
ount
Perc
ent
of lo
ans
in e
ach
cate
gory
to to
tal
Am
ount
Perc
ent
of lo
ans
in e
ach
cate
gory
to to
tal
Am
ount
Perc
ent
of lo
ans
in e
ach
cate
gory
to to
tal
(Dol
lars
in th
ousa
nds)
Allo
cate
d at
end
of p
erio
d to
:O
ne- t
o fo
ur- f
amily
$3,
143
52.0
%$
3,40
848
.1%
$3,
667
54.2
%$
3,46
452
.6%
$2,
025
55.5
%M
ulti-
fam
ily25
16.
747
58.
923
06.
178
4.2
734.
0C
omm
erci
al re
al e
stat
e99
825
.41,
491
25.4
1,32
120
.387
619
.596
217
.4C
onst
ruct
ion
and
land
336
3.8
397
4.1
297
3.4
230
5.5
502
5.5
Hom
e eq
uity
1,05
27.
41,
289
7.9
1,56
29.
31,
773
12.5
666
12.8
Oth
er c
onsu
mer
321
1.7
389
2.1
453
2.8
395
2.7
166
3.0
Com
mer
cial
bus
ines
s25
13.
038
83.
522
33.
957
43.
029
41.
8U
nallo
cate
d75
9—
235
—22
1—
——
40—
Tota
l$
7,11
110
0.0%
$8,
072
100.
0%$
7,97
410
0.0%
$7,
390
100.
0%$
4,72
810
0.0%
29
The following table summarizes the distribution of our allowance for loan losses at the dates indicated.
June 30,2015 2014 2013 2012 2011
Amount
Percentof loansin each
categoryto total Amount
Percentof loansin each
categoryto total Amount
Percentof loansin each
categoryto total Amount
Percentof loansin each
categoryto total Amount
Percentof loansin each
categoryto total
(Dollars in thousands)Allocated at end of period to:One- to four- family $ 3,143 52.0% $ 3,408 48.1% $ 3,667 54.2% $ 3,464 52.6% $ 2,025 55.5%Multi-family 251 6.7 475 8.9 230 6.1 78 4.2 73 4.0Commercial real estate 998 25.4 1,491 25.4 1,321 20.3 876 19.5 962 17.4Construction and land 336 3.8 397 4.1 297 3.4 230 5.5 502 5.5Home equity 1,052 7.4 1,289 7.9 1,562 9.3 1,773 12.5 666 12.8Other consumer 321 1.7 389 2.1 453 2.8 395 2.7 166 3.0Commercial business 251 3.0 388 3.5 223 3.9 574 3.0 294 1.8Unallocated 759 — 235 — 221 — — — 40 —
Total $ 7,111 100.0% $ 8,072 100.0% $ 7,974 100.0% $ 7,390 100.0% $ 4,728 100.0%
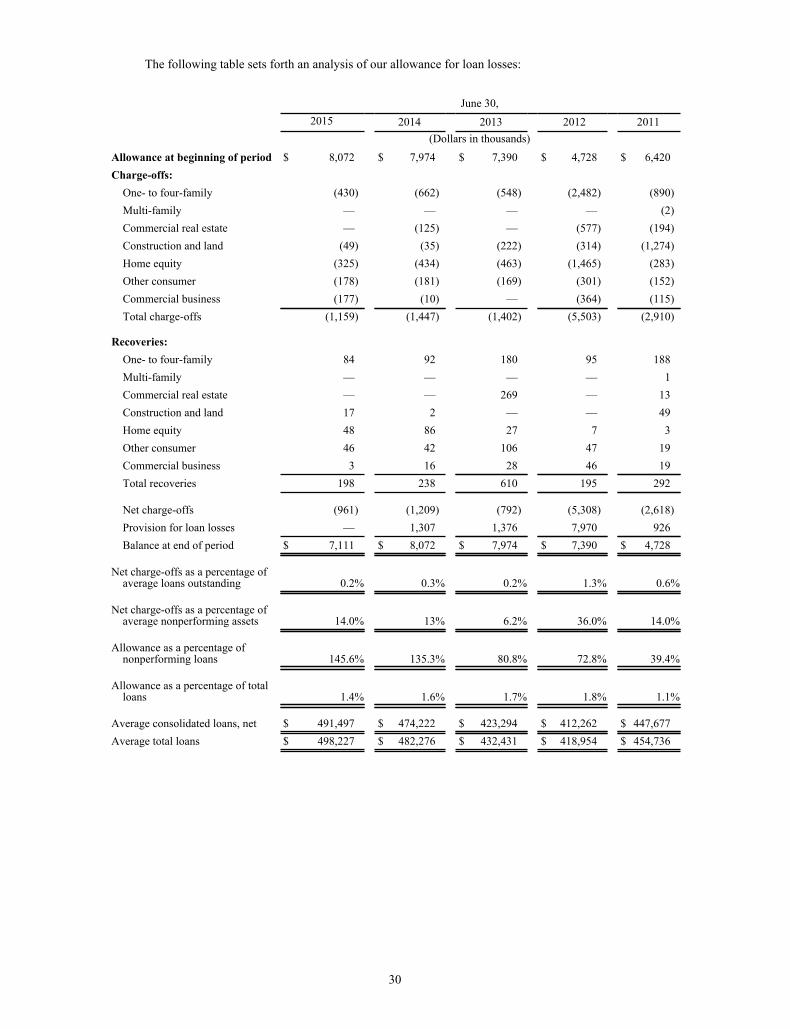
30
The following table sets forth an analysis of our allowance for loan losses:
June 30,2015 2014 2013 2012 2011
(Dollars in thousands)
Allowance at beginning of period $ 8,072 $ 7,974 $ 7,390 $ 4,728 $ 6,420Charge-offs:
One- to four-family (430) (662) (548) (2,482) (890)Multi-family — — — — (2)Commercial real estate — (125) — (577) (194)Construction and land (49) (35) (222) (314) (1,274)Home equity (325) (434) (463) (1,465) (283)Other consumer (178) (181) (169) (301) (152)Commercial business (177) (10) — (364) (115)Total charge-offs (1,159) (1,447) (1,402) (5,503) (2,910)
Recoveries:One- to four-family 84 92 180 95 188Multi-family — — — — 1Commercial real estate — — 269 — 13Construction and land 17 2 — — 49Home equity 48 86 27 7 3Other consumer 46 42 106 47 19Commercial business 3 16 28 46 19Total recoveries 198 238 610 195 292
Net charge-offs (961) (1,209) (792) (5,308) (2,618)Provision for loan losses — 1,307 1,376 7,970 926Balance at end of period $ 7,111 $ 8,072 $ 7,974 $ 7,390 $ 4,728
Net charge-offs as a percentage ofaverage loans outstanding 0.2% 0.3% 0.2% 1.3% 0.6%
Net charge-offs as a percentage ofaverage nonperforming assets 14.0% 13% 6.2% 36.0% 14.0%
Allowance as a percentage ofnonperforming loans 145.6% 135.3% 80.8% 72.8% 39.4%
Allowance as a percentage of totalloans 1.4% 1.6% 1.7% 1.8% 1.1%
Average consolidated loans, net $ 491,497 $ 474,222 $ 423,294 $ 412,262 $ 447,677Average total loans $ 498,227 $ 482,276 $ 432,431 $ 418,954 $ 454,736

31
Investment Activities
General. Under Washington law, savings banks are permitted to invest in various types of liquid assets, including U.S. Treasury obligations, securities of various federal agencies, certain certificates of deposit of insured banks and savings institutions, banker’s acceptances, repurchase agreements, federal funds, commercial paper, investment grade corporate debt, and obligations of states and their political subdivisions.
Our chief financial officer has the basic responsibility for the management of our investment portfolio, in consultation with our chief executive officer, and the direction and guidance of the board of directors. Various factors are considered when making investment decisions, including the marketability, maturity and tax consequences of the proposed investment. The maturity structure of investments will be affected by various market conditions, including the current and anticipated slope of the yield curve, the level of interest rates, the trend of deposit inflows, and the anticipated demand for funds from deposit withdrawals and loan originations and purchases.
The general objective of our investment portfolio is to provide sufficient liquidity to fund lending when loan demand is high, to assist in maintaining earnings when loan demand is low, and to maximize earnings while satisfactorily managing risk, including credit risk, reinvestment risk, liquidity risk and interest rate risk.
Securities. At June 30, 2015, total investment securities increased $128.4 million, or 55.3%, to $360.6 million at June 30, 2015, from $232.2 million at June 30, 2014, primarily as a result of cash received from the Company's initial stock offering and increases in customer deposits that were deployed into earning assets during the year ended June 30, 2015. U.S. government agency issued mortgage-backed securities ("MBS agency") comprised the largest portion, at 61.7%, of our investment portfolio at June 30, 2015, followed by U.S. Small Business Administration securities ("SBA") at 9.8%, municipal bonds at 9.0%, corporate issued asset-backed securities ("ABS corporate") securities at 8.2%, agency bonds at 6.6%, U.S. government agency issued asset-backed securities ("ABS agency") at 2.6%, and corporate issued mortgage-backed securities ("MBS corporate") at 2.2%. MBS agency securities also comprised the largest change in the investment portfolio, increasing $53.7 million during the year, followed by increases in ABS corporate securities of $29.6 million, agency bonds of $23.8 million, municipal bonds of $9.1 million, MBS corporate of $8.0 million, and SBA securities of $5.2 million, partially offset by a decrease in ABS agency securities of $938,000. The duration of the total investment securities portfolio remained the same at 4.7 years at June 30, 2015 and 2014.
The issuers of MBS agency securities held in our portfolio, which include Fannie Mae, Freddie Mac, and Ginnie Mae, and certain issuers of agency bonds held in our portfolio, which include the U.S. Treasury, FHLB, and Fannie Mae, as well as the U.S. Small Business Administration, guarantee the timely principal and interest payments in the event of default. ABS agency bonds held in our portfolio also include securities issued by Sallie Mae Student Loan Trust and CIT Education Loan Trust, which are backed by student loans in a subordinate tranche where payment is not guaranteed by the issuer. The underlying student loans are reinsured by the U.S. Department of Education, which mitigates a significant portion of their risk of loss. Municipal bonds consist of a mix of taxable and non-taxable, revenue and general obligation bonds issued by various local and state government entities that use their revenue-generating and taxing authority as a source of repayment of their debt. The state of the issuers of our municipal bonds, in which we hold more than 10% of our municipal bond portfolio at June 30, 2015, include Washington state at 31.3%, New York at 17.2%, Florida at 15.8%, Texas at 11.7%, and Alabama at 10.9%. We believe our municipal bonds are considered investment grade, and we monitor their credit quality on an ongoing basis.
ABS and MBS corporate securities have no guarantees in the event of default and therefore warrant continued monitoring for credit quality. Our MBS corporate securities consist of fixed and variable rate mortgages issued by various corporations, and our ABS corporate securities consist of a mix of variable rate collateralized loan obligations in managed funds which we believe have sufficient subordination to mitigate the risk of loss on these investments. Monitoring of these securities may include, but is not limited to, reviewing credit quality standards such as delinquency, subordination, and credit ratings. We believe all our corporate securities are considered investment grade.
As a member of the FHLB, we had an average balance of $9.5 million in stock of the FHLB for the year ended June 30, 2015. We received $12,000 and $10,000 in dividends from the FHLB during the years ended June 30, 2015 and 2014, and none during the year ended June 30, 2013.
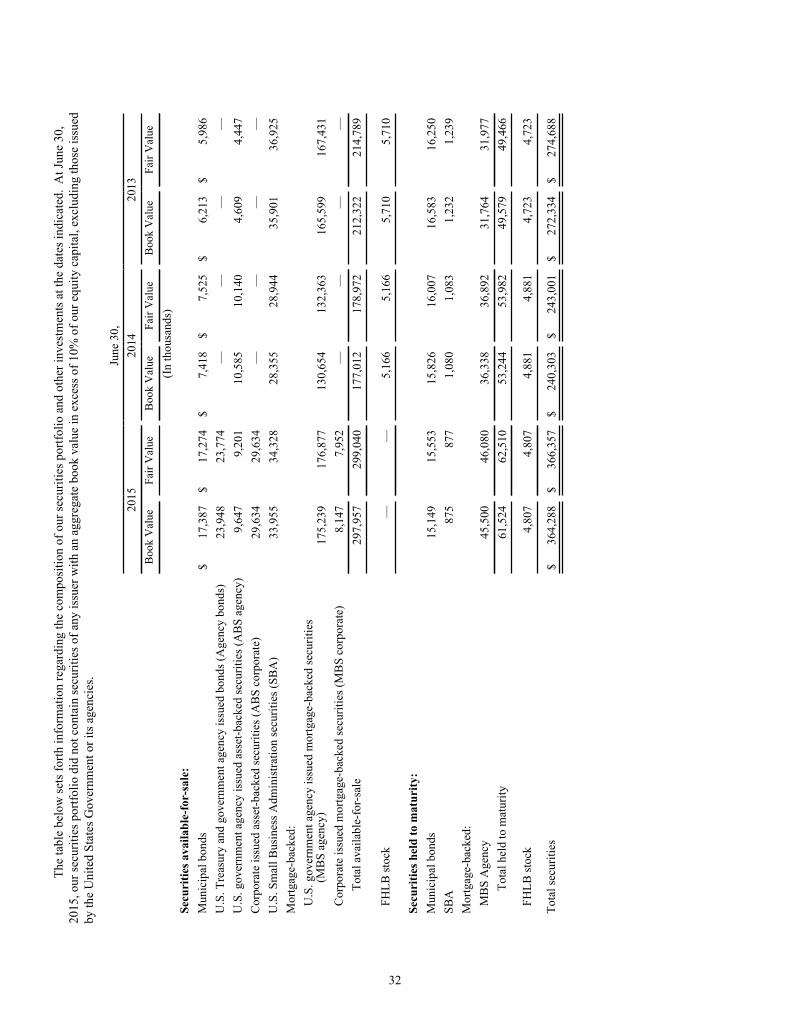
32
The
tabl
e be
low
sets
forth
info
rmat
ion
rega
rdin
g th
e co
mpo
sitio
n of
our
secu
ritie
s por
tfolio
and
oth
er in
vest
men
ts a
t the
dat
es in
dica
ted.
At J
une
30,
2015
, our
secu
ritie
s por
tfolio
did
not
con
tain
secu
ritie
s of a
ny is
suer
with
an
aggr
egat
e bo
ok v
alue
in e
xces
s of 1
0% o
f our
equ
ity c
apita
l, ex
clud
ing
thos
e is
sued
by
the
Uni
ted
Stat
es G
over
nmen
t or i
ts a
genc
ies.
June
30,
2015
2014
2013
Boo
k V
alue
Fair
Val
ueB
ook
Val
ueFa
ir V
alue
Boo
k V
alue
Fair
Val
ue(I
n th
ousa
nds)
Secu
ritie
s ava
ilabl
e-fo
r-sa
le:
Mun
icip
al b
onds
$17
,387
$17
,274
$7,
418
$7,
525
$6,
213
$5,
986
U.S
. Tre
asur
y an
d go
vern
men
t age
ncy
issu
ed b
onds
(Age
ncy
bond
s)23
,948
23,7
74—
——
—U
.S. g
over
nmen
t age
ncy
issu
ed a
sset
-bac
ked
secu
ritie
s (A
BS
agen
cy)
9,64
79,
201
10,5
8510
,140
4,60
94,
447
Cor
pora
te is
sued
ass
et-b
acke
d se
curit
ies (
AB
S co
rpor
ate)
29,6
3429
,634
——
——
U.S
. Sm
all B
usin
ess A
dmin
istra
tion
secu
ritie
s (SB
A)
33,9
5534
,328
28,3
5528
,944
35,9
0136
,925
Mor
tgag
e-ba
cked
:U
.S. g
over
nmen
t age
ncy
issu
ed m
ortg
age-
back
ed se
curit
ies
(M
BS
agen
cy)
175,
239
176,
877
130,
654
132,
363
165,
599
167,
431
Cor
pora
te is
sued
mor
tgag
e-ba
cked
secu
ritie
s (M
BS
corp
orat
e)8,
147
7,95
2—
——
—To
tal a
vaila
ble-
for-
sale
297,
957
299,
040
177,
012
178,
972
212,
322
214,
789
FHLB
stoc
k—
—5,
166
5,16
65,
710
5,71
0
Secu
ritie
s hel
d to
mat
urity
:M
unic
ipal
bon
ds15
,149
15,5
5315
,826
16,0
0716
,583
16,2
50SB
A87
587
71,
080
1,08
31,
232
1,23
9M
ortg
age-
back
ed:
MB
S A
genc
y45
,500
46,0
8036
,338
36,8
9231
,764
31,9
77To
tal h
eld
to m
atur
ity61
,524
62,5
1053
,244
53,9
8249
,579
49,4
66
FHLB
stoc
k4,
807
4,80
74,
881
4,88
14,
723
4,72
3
Tota
l sec
uriti
es$
364,
288
$36
6,35
7$
240,
303
$24
3,00
1$
272,
334
$27
4,68
8
32
The table below sets forth information regarding the composition of our securities portfolio and other investments at the dates indicated. At June 30, 2015, our securities portfolio did not contain securities of any issuer with an aggregate book value in excess of 10% of our equity capital, excluding those issued by the United States Government or its agencies.
June 30,2015 2014 2013
Book Value Fair Value Book Value Fair Value Book Value Fair Value(In thousands)
Securities available-for-sale:Municipal bonds $ 17,387 $ 17,274 $ 7,418 $ 7,525 $ 6,213 $ 5,986U.S. Treasury and government agency issued bonds (Agency bonds) 23,948 23,774 — — — —U.S. government agency issued asset-backed securities (ABS agency) 9,647 9,201 10,585 10,140 4,609 4,447Corporate issued asset-backed securities (ABS corporate) 29,634 29,634 — — — —U.S. Small Business Administration securities (SBA) 33,955 34,328 28,355 28,944 35,901 36,925Mortgage-backed:
U.S. government agency issued mortgage-backed securities (MBS agency) 175,239 176,877 130,654 132,363 165,599 167,431
Corporate issued mortgage-backed securities (MBS corporate) 8,147 7,952 — — — —Total available-for-sale 297,957 299,040 177,012 178,972 212,322 214,789
FHLB stock — — 5,166 5,166 5,710 5,710
Securities held to maturity:Municipal bonds 15,149 15,553 15,826 16,007 16,583 16,250SBA 875 877 1,080 1,083 1,232 1,239Mortgage-backed:
MBS Agency 45,500 46,080 36,338 36,892 31,764 31,977Total held to maturity 61,524 62,510 53,244 53,982 49,579 49,466
FHLB stock 4,807 4,807 4,881 4,881 4,723 4,723
Total securities $ 364,288 $ 366,357 $ 240,303 $ 243,001 $ 272,334 $ 274,688

33
Mat
urity
of S
ecur
ities
. Th
e co
mpo
sitio
n an
d co
ntra
ctua
l mat
uriti
es o
f our
inve
stm
ent p
ortfo
lio a
t Jun
e 30
, 201
5 an
d Ju
ne 3
0, 2
014,
exc
ludi
ng F
HLB
st
ock,
are
indi
cate
d in
the
follo
win
g ta
ble.
The
yie
lds o
n m
unic
ipal
bon
ds h
ave
not b
een
com
pute
d on
a ta
x eq
uiva
lent
bas
is.
June
30,
201
51
year
or l
ess
Ove
r 1 y
ear t
o 5
year
sO
ver 5
to 1
0 ye
ars
Ove
r 10
year
sTo
tal S
ecur
ities
Am
ortiz
edC
ost
Wei
ghte
dA
vera
geY
ield
Am
ortiz
edC
ost
Wei
ghte
dA
vera
geY
ield
Am
ortiz
edC
ost
Wei
ghte
dA
vera
geY
ield
Am
ortiz
edC
ost
Wei
ghte
dA
vera
geY
ield
Am
ortiz
edC
ost
Wei
ghte
dA
vera
geY
ield
Fair
Val
ue(D
olla
rs in
thou
sand
s)Se
curi
ties a
vaila
ble-
for-
sale
:M
unic
ipal
bon
ds$
——
%$
——
%$
1,95
03.
13%
$15
,437
2.66
%$
17,3
872.
71%
$17
,274
Age
ncy
bond
s1,
008
0.15
10,9
661.
4911
,974
2.23
——
23,9
481.
8123
,774
AB
S A
genc
y—
——
——
—9,
647
1.73
9,64
71.
739,
201
AB
S C
orpo
rate
——
——
4,92
72.
4924
,707
2.98
29,6
342.
9029
,634
SBA
——
——
9,98
52.
0323
,970
1.76
33,9
551.
8434
,328
Mor
tgag
e-ba
cked
:M
BS
Age
ncy
——
——
5,91
22.
5816
9,32
72.
0917
5,23
92.
1117
6,87
7M
BS
Cor
pora
te—
——
——
—8,
147
2.88
8,14
72.
887,
952
Tot
al a
vaila
ble-
for-
sale
1,00
80.
1510
,966
1.49
34,7
482.
3225
1,23
52.
1929
7,95
72.
1829
9,04
0
Secu
ritie
s hel
d to
mat
urity
:M
unic
ipal
bon
ds26
03.
7816
53.
919,
586
2.24
5,13
82.
7515
,149
2.46
15,5
53SB
A—
——
—33
40.
7254
10.
7187
50.
7187
7M
ortg
age-
back
ed:
MB
S A
genc
y32
4.17
11.
486,
207
2.06
39,2
603.
0045
,500
2.87
46,0
80T
otal
hel
d to
mat
urity
292
3.83
166
3.90
16,1
272.
1444
,939
2.94
61,5
242.
7462
,510
Tot
al se
curi
ties
$1,
300
0.98
%$
11,1
321.
53%
$50
,875
2.26
%$
296,
174
2.31
%$
359,
481
2.27
%$
361,
550
33
Maturity of Securities. The composition and contractual maturities of our investment portfolio at June 30, 2015 and June 30, 2014, excluding FHLB stock, are indicated in the following table. The yields on municipal bonds have not been computed on a tax equivalent basis.
June 30, 20151 year or less Over 1 year to 5 years Over 5 to 10 years Over 10 years Total Securities
AmortizedCost
WeightedAverage
YieldAmortized
Cost
WeightedAverage
YieldAmortized
Cost
WeightedAverage
YieldAmortized
Cost
WeightedAverage
YieldAmortized
Cost
WeightedAverage
YieldFair
Value(Dollars in thousands)
Securities available-for-sale:Municipal bonds $ — —% $ — —% $ 1,950 3.13% $ 15,437 2.66% $ 17,387 2.71% $ 17,274Agency bonds 1,008 0.15 10,966 1.49 11,974 2.23 — — 23,948 1.81 23,774ABS Agency — — — — — — 9,647 1.73 9,647 1.73 9,201ABS Corporate — — — — 4,927 2.49 24,707 2.98 29,634 2.90 29,634SBA — — — — 9,985 2.03 23,970 1.76 33,955 1.84 34,328Mortgage-backed:
MBS Agency — — — — 5,912 2.58 169,327 2.09 175,239 2.11 176,877MBS Corporate — — — — — — 8,147 2.88 8,147 2.88 7,952
Total available-for-sale 1,008 0.15 10,966 1.49 34,748 2.32 251,235 2.19 297,957 2.18 299,040
Securities held to maturity:Municipal bonds 260 3.78 165 3.91 9,586 2.24 5,138 2.75 15,149 2.46 15,553SBA — — — — 334 0.72 541 0.71 875 0.71 877Mortgage-backed:
MBS Agency 32 4.17 1 1.48 6,207 2.06 39,260 3.00 45,500 2.87 46,080Total held to maturity 292 3.83 166 3.90 16,127 2.14 44,939 2.94 61,524 2.74 62,510
Total securities $ 1,300 0.98% $ 11,132 1.53% $ 50,875 2.26% $ 296,174 2.31% $ 359,481 2.27% $ 361,550

34
June
30,
201
41
year
or l
ess
Ove
r 1 y
ear t
o 5
year
sO
ver 5
to 1
0 ye
ars
Ove
r 10
year
sTo
tal S
ecur
ities
Am
ortiz
edC
ost
Wei
ghte
dA
vera
geY
ield
Am
ortiz
edC
ost
Wei
ghte
dA
vera
geY
ield
Am
ortiz
edC
ost
Wei
ghte
dA
vera
geY
ield
Am
ortiz
edC
ost
Wei
ghte
dA
vera
geY
ield
Am
ortiz
edC
ost
Wei
ghte
dA
vera
geY
ield
Fair
Val
ue(D
olla
rs in
thou
sand
s)Se
curi
ties a
vaila
ble-
for-
sale
:M
unic
ipal
bon
ds$
——
%$
——
%$
102
2.75
%$
7,31
63.
27%
$7,
418
3.27
%$
7,52
5A
BS
Age
ncy
——
——
——
10,5
851.
7810
,585
1.78
10,1
40SB
A—
——
—1,
947
2.30
26,4
081.
5328
,355
1.58
28,9
44M
ortg
age-
back
ed:
MB
S A
genc
y—
——
—5,
030
2.62
125,
624
2.00
130,
654
2.02
132,
363
Tota
l ava
ilabl
e-fo
r-sa
le—
——
—7,
079
2.53
169,
933
1.97
177,
012
1.99
178,
972
Secu
ritie
s hel
d to
mat
urity
:M
unic
ipal
bon
ds25
03.
7356
23.
82—
—15
,014
2.42
15,8
262.
4916
,007
SBA
——
——
370
0.75
710
0.76
1,08
00.
761,
083
Mor
tgag
e-ba
cked
:M
BS
Age
ncy
——
157
4.70
8,67
11.
5627
,510
2.87
36,3
382.
5736
,892
Tot
al h
eld
to m
atur
ity25
03.
7371
94.
019,
041
1.53
43,2
342.
6853
,244
2.51
53,9
82
Tot
al se
curi
ties
$25
03.
73%
$71
94.
01%
$16
,120
1.97
%$
213,
167
2.11
%$
230,
256
2.11
%$
232,
954
34
June 30, 20141 year or less Over 1 year to 5 years Over 5 to 10 years Over 10 years Total Securities
AmortizedCost
WeightedAverage
YieldAmortized
Cost
WeightedAverage
YieldAmortized
Cost
WeightedAverage
YieldAmortized
Cost
WeightedAverage
YieldAmortized
Cost
WeightedAverage
YieldFair
Value(Dollars in thousands)
Securities available-for-sale:Municipal bonds $ — —% $ — —% $ 102 2.75% $ 7,316 3.27% $ 7,418 3.27% $ 7,525ABS Agency — — — — — — 10,585 1.78 10,585 1.78 10,140SBA — — — — 1,947 2.30 26,408 1.53 28,355 1.58 28,944Mortgage-backed:
MBS Agency — — — — 5,030 2.62 125,624 2.00 130,654 2.02 132,363Total available-for-sale — — — — 7,079 2.53 169,933 1.97 177,012 1.99 178,972
Securities held to maturity:Municipal bonds 250 3.73 562 3.82 — — 15,014 2.42 15,826 2.49 16,007SBA — — — — 370 0.75 710 0.76 1,080 0.76 1,083Mortgage-backed:
MBS Agency — — 157 4.70 8,671 1.56 27,510 2.87 36,338 2.57 36,892Total held to maturity 250 3.73 719 4.01 9,041 1.53 43,234 2.68 53,244 2.51 53,982
Total securities $ 250 3.73% $ 719 4.01% $ 16,120 1.97% $ 213,167 2.11% $ 230,256 2.11% $ 232,954

35
The Company may hold certain investment securities in an unrealized loss position that are not considered other than temporarily impaired or OTTI. At June 30, 2015, there were 54 investment securities with $2.1 million of unrealized losses and a fair value of approximately $157.7 million. At June 30, 2014, there were 23 investment securities with $1.0 million of unrealized losses and a fair value of approximately $72.9 million.
Deposit Activities and Other Sources of Funds
General. Deposits, borrowings and loan repayments are the major sources of our funds for lending and other investment purposes. Scheduled loan repayments are a relatively stable source of funds, while deposit inflows and outflows and loan prepayments are influenced significantly by general interest rates and market conditions. Borrowings from the FHLB are used to supplement the availability of funds from other sources and also as a source of term funds to assist in the management of interest rate risk.
Our deposit composition reflects a mixture with certificates of deposit accounting for 22.9% of the total deposits at June 30, 2015, and interest and noninterest-bearing checking, savings and money market accounts comprising the balance of total deposits. We rely on marketing activities, convenience, customer service and the availability of a broad range of deposit products and services to attract and retain customer deposits. We did not have any brokered deposits at June 30, 2015.
Deposits. Deposits are attracted from within our market area through the offering of a broad selection of deposit instruments, including checking accounts, money market deposit accounts, savings accounts and certificates of deposit with a variety of rates. Deposit account terms vary according to the minimum balance required, the time periods the funds must remain on deposit and the interest rate, among other factors. In determining the terms of our deposit accounts, we consider the development of long-term profitable customer relationships, current market interest rates, current maturity structure and deposit mix, our customer preferences and the profitability of acquiring customer deposits compared to alternative sources.
Deposit Activity. The following table sets forth our total deposit activities for the periods indicated.
Year Ended June 30,2015 2014 2013
(Dollars in thousands)Beginning balance $ 600,399 $ 595,044 $ 583,238Net deposits 45,096 3,818 9,838Interest credited 1,669 1,537 1,968Ending balance $ 647,164 $ 600,399 $ 595,044
Net increase $ 46,765 $ 5,355 $ 11,806
Percent increase 7.8% 0.9% 2.0%
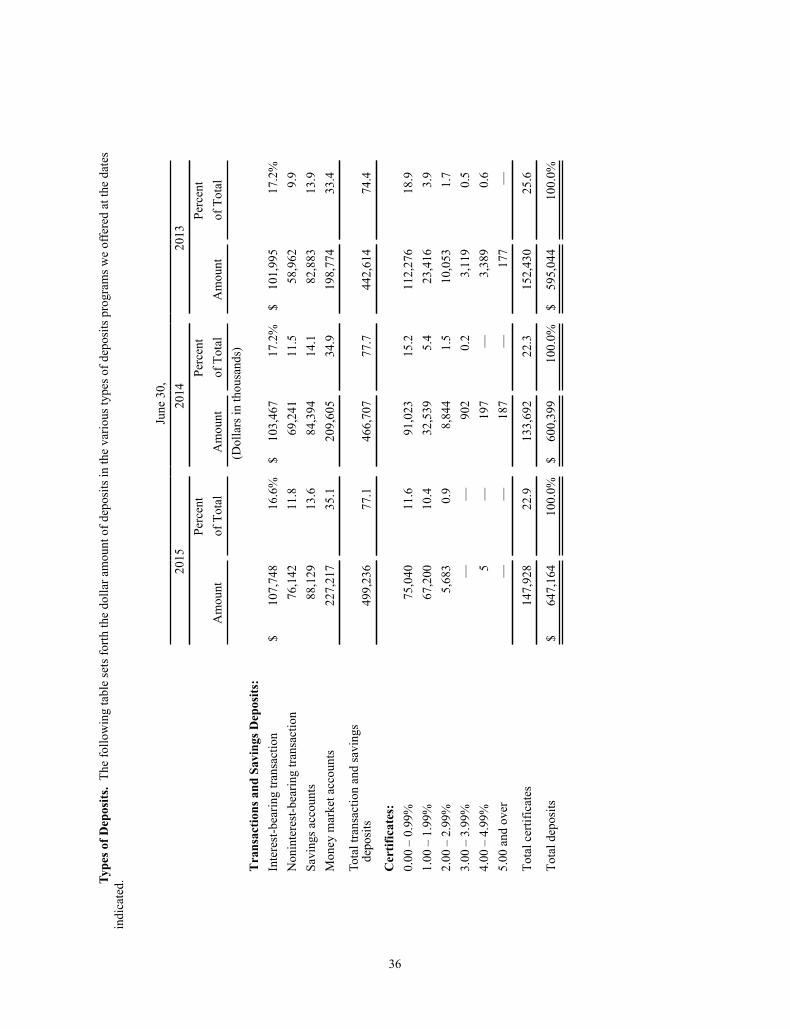
36
Type
s of D
epos
its.
The
follo
win
g ta
ble
sets
forth
the
dolla
r am
ount
of d
epos
its in
the
vario
us ty
pes o
f dep
osits
pro
gram
s we
offe
red
at th
e da
tes
indi
cate
d.
June
30,
2015
2014
2013
Perc
ent
Perc
ent
Perc
ent
Am
ount
of T
otal
Am
ount
of T
otal
Am
ount
of T
otal
(Dol
lars
in th
ousa
nds)
Tra
nsac
tions
and
Sav
ings
Dep
osits
:In
tere
st-b
earin
g tra
nsac
tion
$10
7,74
816
.6%
$10
3,46
717
.2%
$10
1,99
517
.2%
Non
inte
rest
-bea
ring
trans
actio
n76
,142
11.8
69,2
4111
.558
,962
9.9
Savi
ngs a
ccou
nts
88,1
2913
.684
,394
14.1
82,8
8313
.9M
oney
mar
ket a
ccou
nts
227,
217
35.1
209,
605
34.9
198,
774
33.4
Tota
l tra
nsac
tion
and
savi
ngs
de
posi
ts
499,
236
77.1
466,
707
77.7
442,
614
74.4
Cer
tific
ates
:0.
00 –
0.9
9%75
,040
11.6
91,0
2315
.211
2,27
618
.91.
00 –
1.9
9%67
,200
10.4
32,5
395.
423
,416
3.9
2.00
– 2
.99%
5,68
30.
98,
844
1.5
10,0
531.
73.
00 –
3.9
9%—
—90
20.
23,
119
0.5
4.00
– 4
.99%
5—
197
—3,
389
0.6
5.00
and
ove
r—
—18
7—
177
—
Tota
l cer
tific
ates
147,
928
22.9
133,
692
22.3
152,
430
25.6
Tota
l dep
osits
$64
7,16
410
0.0%
$60
0,39
910
0.0%
$59
5,04
410
0.0%
36
Types of Deposits. The following table sets forth the dollar amount of deposits in the various types of deposits programs we offered at the dates indicated.
June 30,2015 2014 2013
Percent Percent PercentAmount of Total Amount of Total Amount of Total
(Dollars in thousands)Transactions and Savings Deposits:Interest-bearing transaction $ 107,748 16.6% $ 103,467 17.2% $ 101,995 17.2%Noninterest-bearing transaction 76,142 11.8 69,241 11.5 58,962 9.9Savings accounts 88,129 13.6 84,394 14.1 82,883 13.9Money market accounts 227,217 35.1 209,605 34.9 198,774 33.4
Total transaction and savings deposits 499,236 77.1 466,707 77.7 442,614 74.4
Certificates:0.00 – 0.99% 75,040 11.6 91,023 15.2 112,276 18.91.00 – 1.99% 67,200 10.4 32,539 5.4 23,416 3.92.00 – 2.99% 5,683 0.9 8,844 1.5 10,053 1.73.00 – 3.99% — — 902 0.2 3,119 0.54.00 – 4.99% 5 — 197 — 3,389 0.65.00 and over — — 187 — 177 —
Total certificates 147,928 22.9 133,692 22.3 152,430 25.6
Total deposits $ 647,164 100.0% $ 600,399 100.0% $ 595,044 100.0%

37
Dep
osit
Flow
. Th
e fo
llow
ing
tabl
e se
ts fo
rth th
e ba
lanc
es o
f sav
ings
dep
osits
in th
e va
rious
type
s of s
avin
gs a
ccou
nts o
ffere
d by
Firs
t Fed
eral
at t
he
date
s ind
icat
ed.
June
30,
2015
2014
2013
2012
2011
Am
ount
Perc
ent
of Tota
lIn
crea
se/
(Dec
reas
e)A
mou
nt
Perc
ent
of Tota
lIn
crea
se/
(Dec
reas
e)A
mou
nt
Perc
ent
of Tota
lIn
crea
se/
(Dec
reas
e)A
mou
nt
Perc
ent
of Tota
lIn
crea
se/
(Dec
reas
e)A
mou
nt
Perc
ent
of Tota
lIn
crea
se/
(Dec
reas
e)(D
olla
rs in
thou
sand
s)Sa
ving
s acc
ount
s$
88,1
2913
.7%
$3,
735
$84
,394
14.0
%$
1,51
1$
82,8
8313
.9%
$4,
876
$78
,007
13.4
%$
4,07
5$
73,9
3213
.1%
$(1
,882
)Tr
ansa
ctio
n ac
coun
ts18
3,89
028
.411
,182
172,
708
28.8
11,7
5116
0,95
727
.118
,340
142,
617
24.5
15,5
1612
7,10
122
.614
,154
Mon
ey-m
arke
tac
coun
ts22
7,21
735
.117
,612
209,
605
34.9
10,8
3119
8,77
433
.45,
927
192,
847
33.1
23,0
8216
9,76
530
.26,
141
Fixe
d-ra
te c
ertif
icat
esw
hich
mat
ure
in th
eye
ar e
ndin
g :
With
in 1
yea
r71
,474
11.0
2,48
668
,988
11.5
(25,
395)
94,3
8315
.9(1
5,49
2)10
9,87
518
.8(2
2,60
3)13
2,47
823
.685
7
Afte
r 1 y
ear b
utw
ithin
2 y
ears
33,3
365.
22,
228
31,1
085.
25,
425
25,6
834.
3(7
,769
)33
,452
5.7
(1,0
59)
34,5
116.
1(5
,719
)
Afte
r 2 y
ears
but
with
in 5
yea
rs42
,912
6.6
9,44
533
,467
5.6
1,19
832
,269
5.4
6,03
326
,236
4.5
2,10
224
,134
4.3
(7,3
54)
Cer
tific
ates
mat
urin
g th
erea
fter
206
—77
129
—34
95—
(109
)20
4—
(273
)47
70.
1(2
2)To
tal
$647
,164
100.
0%$
46,7
65$6
00,3
9910
0.0%
$5,
355
$595
,044
100.
0%$
11,8
06$5
83,2
3810
0.0%
$20
,840
$562
,398
100.
0%$
6,17
5
37
Deposit Flow. The following table sets forth the balances of savings deposits in the various types of savings accounts offered by First Federal at the dates indicated.
June 30,2015 2014 2013 2012 2011
Amount
Percentof
TotalIncrease/
(Decrease) Amount
Percentof
TotalIncrease/
(Decrease) Amount
Percentof
TotalIncrease/
(Decrease) Amount
Percentof
TotalIncrease/
(Decrease) Amount
Percentof
TotalIncrease/
(Decrease)(Dollars in thousands)
Savings accounts $ 88,129 13.7% $ 3,735 $ 84,394 14.0% $ 1,511 $ 82,883 13.9% $ 4,876 $ 78,007 13.4% $ 4,075 $ 73,932 13.1% $ (1,882)Transaction accounts 183,890 28.4 11,182 172,708 28.8 11,751 160,957 27.1 18,340 142,617 24.5 15,516 127,101 22.6 14,154
Money-marketaccounts 227,217 35.1 17,612 209,605 34.9 10,831 198,774 33.4 5,927 192,847 33.1 23,082 169,765 30.2 6,141
Fixed-rate certificateswhich mature in theyear ending :Within 1 year 71,474 11.0 2,486 68,988 11.5 (25,395) 94,383 15.9 (15,492) 109,875 18.8 (22,603) 132,478 23.6 857
After 1 year butwithin 2 years 33,336 5.2 2,228 31,108 5.2 5,425 25,683 4.3 (7,769) 33,452 5.7 (1,059) 34,511 6.1 (5,719)
After 2 years butwithin 5 years 42,912 6.6 9,445 33,467 5.6 1,198 32,269 5.4 6,033 26,236 4.5 2,102 24,134 4.3 (7,354)
Certificatesmaturing thereafter 206 — 77 129 — 34 95 — (109) 204 — (273) 477 0.1 (22)
Total $647,164 100.0% $ 46,765 $600,399 100.0% $ 5,355 $595,044 100.0% $ 11,806 $583,238 100.0% $ 20,840 $562,398 100.0% $ 6,175

38
Deposit Maturities. The following table sets forth the rate and maturity information of our time deposit certificates at June 30, 2015.
0.00-0.99%
1.00-1.99%
2.00-2.99%
3.00-3.99%
4.00-4.99%
5.00%or higher Total
Percent ofTotal
Certificate accountsmaturing in quarter ending: (Dollars in thousands)
September 30, 2015 $ 20,736 $ 681 $ 1,317 $ — $ 5 $ — $ 22,739 15.3%
December 31, 2015 12,985 71 957 — — — 14,013 9.5
March 31, 2016 16,307 217 1,732 — — — 18,256 12.3
June 30, 2016 7,674 7,778 1,014 — — — 16,466 11.1
September 30, 2016 4,907 7,775 653 — — — 13,335 9.0
December 31, 2016 4,730 2,037 10 — — — 6,777 4.6
March 31, 2017 3,386 1,737 — — — — 5,123 3.5
June 30, 2017 1,814 6,287 — — — — 8,101 5.5
September 30, 2017 1,128 1,679 — — — — 2,807 1.9
December 31, 2017 521 5,901 — — — — 6,422 4.3
March 31, 2018 428 5,467 — — — — 5,895 4.0
June 30, 2018 424 3,677 — — — — 4,101 2.8
Thereafter — 23,893 — — — — 23,893 16.2
Total $ 75,040 $ 67,200 $ 5,683 $ — $ 5 $ — $ 147,928 100.0%
Percent of total 50.8% 45.4% 3.8% —% —% —% 100.0%
Jumbo Certificates. The following table indicates the amount of our jumbo certificates of deposit by time remaining until maturity as of June 30, 2015. Jumbo certificates of deposit are certificates in amounts of $100,000 or more.
Maturity
3 Monthsor Less
Over 3 to 6
Months
Over 6 to 12 Months
Over 12Months Total
(In thousands)Certificates of deposit less than $100,000 $ 12,089 $ 6,756 $ 17,537 $ 27,836 $ 64,218Certificates of deposit of $100,000 or more 10,650 7,257 17,185 48,618 83,710
Total certificates $ 22,739 $ 14,013 $ 34,722 $ 76,454 $ 147,928
The Federal Reserve requires First Federal to maintain reserves on transaction accounts or non-personal time deposits. These reserves may be in the form of cash or noninterest-bearing deposits with the Federal Reserve Bank of San Francisco. Negotiable order of withdrawal (NOW) accounts and other types of accounts that permit payments or transfers to third parties fall within the definition of transaction accounts and are subject to the reserve requirements, as are any non-personal time deposits at a savings bank. As of June 30, 2015, our deposit with the Federal Reserve Bank of San Francisco and vault cash exceeded our reserve requirements.
Borrowings. Although customer deposits are the primary source of funds for our lending and investment activities, we have used advances from the FHLB, including short-term Cash Management Advance Promissory Notes ("CMA borrowings") and longer term advances to supplement our supply of lendable funds, to meet short-

39
term deposit withdrawal requirements and also to provide longer-term funding to better match the duration of selected loan and investment maturities.
Depending upon the retail banking activity and the availability of excess post-conversion capital that may be provided to us, we will consider and may undertake additional leverage strategies within applicable regulatory requirements or restrictions. These borrowings would be expected to primarily consist of FHLB advances.
As a member of the FHLB, we are required to own capital stock in the FHLB and are authorized to apply for advances on the security of that stock and certain of our mortgage loans and other assets (principally securities which are obligations of, or guaranteed by, the U.S. Government) provided certain creditworthiness standards have been met. Advances are individually made under various terms pursuant to several different credit programs, each with its own interest rate and range of maturities. Depending on the program, limitations on the amount of advances are based on the financial condition of the member institution and the adequacy of collateral pledged to secure the credit. We maintain a committed credit facility with the FHLB and currently have pledged loan and security collateral to support a borrowing capacity of $205.7 million at June 30, 2015. We had outstanding advances from the FHLB of $89.9 million leaving a remaining borrowing capacity of $115.8 million. In April 2013, we restructured substantially all of our FHLB advances by extending maturities and taking advantage of the lower interest rate environment. This is reflected in the lower weighted average interest rate on FHLB advances for the years ended June 30, 2015 and 2014, compared to the year ended June 30, 2013.
Included in borrowings at June 30, 2015, is a fixed-rate promissory note in the amount of $109,000 held by Craft3 Development IV, LLC, a subsidiary of First Federal (the “Craft 3 Promissory Note”). Simple interest of 4.5% per annum is calculated on the outstanding principal balance and is due monthly. The entire unpaid principal balance plus remaining interest due is payable on September 1, 2015.
The following tables set forth information regarding our borrowings at the end of and during the periods indicated. The tables include both long- and short-term borrowings.
June 30,2015 2014 2013
(Dollars in thousands)Maximum balance:
FHLB advances $ 89,924 $ 99,924 $ 99,924CMA borrowings 1,000 31,000 1,500Craft3 Promissory Note 109 109 109
Average balances:FHLB advances $ 89,924 $ 96,591 $ 99,924CMA borrowings 83 7,967 125Craft3 Promissory Note 109 109 109
Weighted average interest rate:FHLB advances 3.24% 3.26% 3.99%CMA borrowings 0.29 0.29 0.46Craft3 Promissory Note 4.50 4.50 4.50
Balance outstanding at end of period:FHLB advances $ 89,924 $ 89,924 $ 99,924CMA borrowings — 15,100 —Craft3 Promissory Note 109 109 109
Total borrowings $ 90,033 $ 105,133 $ 100,033

40
June 30,2015 2014 2013
(Dollars in thousands)Weighted average interest rate at end of
period:FHLB advances 3.24% 3.24% 3.28%CMA borrowings 0.29 0.30 —Craft3 Promissory Note 4.50 4.50 4.50
Subsidiary and Other Activities
First Federal has one subsidiary, North Olympic Peninsula Services, Inc. (“NOPS”), which is wholly-owned and has been inactive for approximately ten years. We made an initial capital investment on May 19, 1982 in NOPS of $25,000 and an additional capital investment on May 7, 1985 of $475,000. As of June 30, 2015we had not made any subsequent investment in NOPS.
NOPS was established for the purpose of conducting various activities including, but not limited to: (i) the acquisition, development, improvement and management of real or personal property; (ii) the origination, sale, purchase, and servicing of secured and unsecured loans; (iii) providing services to financial institutions and other corporate entities, including serving as an insurance agent or broker; acting as a partner, member, associate, or manager of any partnership, limited partnership, joint venture, trust or other enterprise.
In addition, NOPS owns a building located at 139 West First Street, Port Angeles, Washington, that is adjacent to First Federal’s Downtown Port Angeles branch located at 141 West First Street, Port Angeles, Washington. At June 30, 2015, the building was valued at $205,000. The one-story building, including a small basement area, is approximately 4,668 square feet and all of the space is currently rented to First Federal for use as office space and storage. The current lease between NOPS and First Federal has a three year term and a rental rate of $5.14 per square foot. First Federal has no plans to utilize NOPS in the future in any capacity and has authorized management to dissolve this subsidiary.
In 2008, First Federal partnered with Craft3, Inc., a Washington nonprofit corporation, to form two limited liability companies for the purpose of participating in the new markets tax credit program (“NMTC”). First Federal made an initial capital investment of 99.99% in Craft3 Development, IV, LLC (“Craft3 Development”) for $4.9 million in the form of $2.4 million of debt and $2.5 million of equity. Craft3 Development then made a 100% equity investment of $4.9 million into another company, Craft3 Investment IV, LLC (“Craft3 Investment”). Craft3 Investment distributed those funds in the form of a loan to the Downtown Ambulatory Health Center, LLC for construction of a medical facility in Port Angeles, Washington. First Federal participated in the NMTC program until its expiration in June 2015 and realized tax credits totaling $1.9 million over the seven year period, the full amount of allowable tax credits.
It is expected that Craft3 Development and Craft3 Investment will be dissolved in the next twelve months, and the loan to the Downtown Ambulatory Health Center, LLC will be refinanced with First Federal or another lender. If the loan to the Downtown Ambulatory Health Center LLC cannot be traditionally refinanced, it will be treated as a troubled debt and evaluated by First Federal’s credit department for further collection and possible workout. At the time of the dissolution of Craft3 Development and Craft3 Investment, it is expected that First Federal will receive a $4.6 million reimbursement for its debt and equity contributions. The $293,000 difference between the amount of First Federal's investment ($4.9 million) and the amount of the expected reimbursement ($4.6 million) was amortized over the new markets tax period of seven years.
Competition
We face competition in originating loans. Competition in originating real estate loans comes primarily from other savings institutions, commercial banks, credit unions, life insurance companies and mortgage bankers.

41
Other savings institutions, commercial banks, credit unions and finance companies provide vigorous competition in consumer lending, including our indirect lending. Commercial business competition is primarily from commercial banks, some of which have a nationwide presence. We compete by delivering high-quality, personal service to our customers that result in a high level of customer satisfaction.
We attract our deposits through our branch office system. Competition for those deposits is principally from other savings institutions, commercial banks and credit unions located in the same community, as well as mutual funds and other alternative investments. We compete for these deposits by offering excellent service and a variety of deposit accounts at competitive rates. Based on the most recent branch data provided by the FDIC, as of June 30, 2015, First Federal’s share of bank, savings bank and savings and loan association deposits in Clallam and Jefferson counties was 35.8% and 18.8%, respectively.
Our market area has a high concentration of financial institutions, many of which are branches of large money center and regional banks. These include large national lenders that have greater resources and may offer services that we do not provide.
Employees
At June 30, 2015, we had 157 full-time equivalent employees. Our employees are not represented by any collective bargaining group. We consider our employee relations to be good.
Executive Officers
The following is a description of the principal occupation and employment of the executive officers of the Company and the Bank during at least the past five years (ages are presented as of June 30, 2015):
Laurence J. Hueth, age 52, is President and Chief Executive Officer of the Company and First Federal, positions he has held since March 2013 after serving in an interim capacity following management changes in December 2012. He has served on the First Federal Board of Directors since 2010. Mr. Hueth joined First Federal in 2008 and was promoted to Senior Vice President, Chief Financial Officer in March 2009. He assumed responsibility for operational and risk areas, serving as Chief Operating Officer from 2011 to 2012. Mr. Hueth has over 30 years of progressive responsibility in finance and risk management areas within the banking industry. Prior to joining First Federal, Mr. Hueth was employed for 15 years at PFF Bank & Trust located in Pomona, California where he held positions in finance, treasury and risk management, including serving as Vice President, Operational Risk Manager and Bank Treasurer from 2005 until November 2008. Mr. Hueth is active with numerous charitable and civic organizations in Clallam and Jefferson counties.
Regina M. Wood, age 44, is Executive Vice President and Chief Financial Officer of the Company and First Federal positions she has held since March 2013. Prior to that, she served as interim Chief Financial Officer and Vice President of First Federal from December 2012 through March 2013 and Vice President, Controller of First Federal from August 2006 to December 2012. Ms. Wood was the Controller of the Central Washington Grain Growers, Inc. from 2002 to 2006 and Assistant Controller from 1999 to 2002. Ms. Wood is a certified public accountant licensed in the state of Washington.
Jeffrey S. Davis, age 49, is Executive Vice President and Chief Operating Officer of First Federal, a position he has held since February 25, 2015, after serving as Senior Vice President and Bank Operations Officer of First Federal since his employment on September 1, 2014. Prior to joining First Federal, Mr. Davis had been employed since 2007 by First Merchants Corporation, Muncie, Indiana, and served in various capacities, most recently serving as Senior Vice President - Director of Retail Administration & Product Management since 2010. Prior to that, he served as First Vice President - Transaction Services of First Merchants Corporation from 2007 until 2010.
Christopher A. Donohue, age 59, is Executive Vice President and Chief Credit Officer of First Federal, a position he has held since April 2013. Prior to joining First Federal, Mr. Donohue worked at the Bank of Nevada from August 2012 as a Vice President-Senior Assets Officer. He worked from September 2010 to September 2011 with the Bank of George as a Senior Vice President and Credit Administrator. Prior to working with the Bank of George, Mr. Donohue worked for five years with SouthwestUSA Bank, attaining the position in 2007 of Executive Vice President and Chief Credit Officer, until its FDIC receivership in 2010. These banks are or were located in Las Vegas, Nevada.

42
Kelly A. Liske, age 38, is Executive Vice President and Chief Banking Officer of First Federal, a position she has held since July 2013. Ms. Liske served as a Commercial Relationship Manager and Vice President for First Federal from July 2011 to July 2013. Prior to that she served as the Branch Manager, Assistant Vice President for First Federal’s Port Townsend Branch from 2006 until 2011.
HOW WE ARE REGULATED
The following is a brief description of certain laws and regulations applicable to First Northwest Bancorp and First Federal. The descriptions of laws and regulations included herein do not purport to be complete and are qualified in their entirety by reference to the actual laws and regulations. Legislation is introduced from time to time in the United States Congress or the Washington State Legislature that may affect the operations of First Northwest Bancorp and First Federal. In addition, the regulations governing us may be amended from time to time. Any such legislation or regulatory changes in the future could adversely affect our operations and financial condition by the FDIC, DFI, Federal Reserve and the CFPB.
The Dodd-Frank Wall Street Reform and Consumer Protection Act (the “Dodd-Frank Act”), which was enacted in July 2010, imposed new restrictions and an expanded framework of regulatory oversight for financial institutions, including depository institutions and their holding companies. Among other changes, the Dodd-Frank Act established the CFPB as an independent bureau of the Federal Reserve Board. The CFPB assumed responsibility for the implementation of the federal financial consumer protection and fair lending laws and regulations and has authority to impose new requirements. First Federal is subject to consumer protection regulations issued by the CFPB, but as a smaller financial institution, we are generally subject to supervision and enforcement by the FDIC and the DFI with respect to our compliance with consumer financial protection laws and CFPB regulations.
Many aspects of the Dodd-Frank Act are subject to rulemaking by the federal banking agencies, which has not been completed and will not take effect for some time, and will take effect over several years, making it difficult to anticipate the overall financial impact of the Dodd-Frank Act on First Northwest Bancorp, First Federal and the financial services industry more generally.
Regulation of First Federal
General. First Federal, as a state-chartered savings bank, is subject to applicable provisions of Washington law and to regulations and examinations of the DFI. As an insured institution, it also is subject to examination and regulation by the FDIC, which insures the deposits of First Federal to the maximum permitted by law. During these state or federal regulatory examinations, the examiners may require First Federal to provide for higher general or specific loan loss reserves, which can impact our capital and earnings. This regulation of First Federal is intended for the protection of depositors and the deposit insurance fund of the FDIC and not for the purpose of protecting shareholders of First Federal or First Northwest Bancorp. First Federal is required to maintain minimum levels of regulatory capital and is subject to some limitations on the payment of dividends to First Northwest Bancorp. See "– Capital Requirements" and "– Dividends."
Federal and State Enforcement Authority and Actions. As part of its supervisory authority over Washington-chartered savings banks, the DFI may initiate enforcement proceedings to obtain a cease-and-desist order against an institution believed to have engaged in unsafe and unsound practices or to have violated a law, regulation, or other regulatory limit, including a written agreement. The FDIC also has the authority to initiate enforcement actions against insured institutions for similar reasons and may terminate the deposit insurance if it determines that an institution has engaged in unsafe or unsound practices or is in an unsafe or unsound condition. Both these agencies may utilize less formal supervisory tools to address their concerns about the condition, operations or compliance status of a savings bank.
Regulation by the Washington Department of Financial Institutions. State law and regulations govern First Federal's ability to take deposits and pay interest, to make loans on or invest in residential and other real estate, to make consumer loans, to invest in securities, to offer various banking services to its customers, and to establish branch offices. As a state savings bank, First Federal must pay semi-annual assessments, examination costs and certain other charges to the DFI.
Washington law generally provides the same powers for Washington savings banks as federally and other-state chartered savings institutions and banks with branches in Washington, subject to the approval of the DFI. Washington law allows Washington savings banks to charge the maximum interest rates on loans and other extensions of credit to Washington residents which are allowable for a national bank in another state if higher than
43
Washington limits. In addition, the DFI may approve applications by Washington savings banks to engage in an otherwise unauthorized activity if the DFI determines that the activity is closely related to banking and First Federal is otherwise qualified under the statute. This additional authority, however, is subject to review and approval by the FDIC if the activity is not permissible for national banks.
Insurance of Accounts and Regulation by the FDIC. The deposit insurance fund of the FDIC insures deposit accounts in First Federal up to $250,000 per separately insured depositor. As insurer, the FDIC imposes deposit insurance premiums and is authorized to conduct examinations of, and to require reporting by, FDIC-insured institutions. Our deposit insurance premiums for the year ended June 30, 2015, were $544,000.
Under the FDIC’s risk-based assessment system, insured institutions are assigned to one of four risk categories based on supervisory evaluations, regulatory capital levels and certain other risk factors. Rates are based on each institution’s risk category and certain specified risk adjustments, whereby stronger institutions pay lower rates while riskier institutions pay higher rates. Assessments are based on an institution’s average consolidated total assets minus average tangible equity with an assessment rate schedule ranging from 2.5 to 45 basis points. The FDIC has authority to increase insurance assessments, and any significant increases would have an adverse effect on the operating expenses and results of operations of First Federal. Management cannot predict what assessment rates will be in the future.
Insurance of deposits may be terminated by the FDIC upon a finding that an institution has engaged in unsafe or unsound practices, is in an unsafe or unsound condition to continue operations or has violated any applicable law, regulation, rule, order or condition imposed by the FDIC. We do not currently know of any practice, condition or violation that may lead to termination of our deposit insurance.
Prompt Corrective Action. Federal statutes establish a supervisory framework based on five capital categories: well capitalized, adequately capitalized, undercapitalized, significantly undercapitalized and critically undercapitalized. An institution’s category depends upon where its capital levels are in relation to relevant capital measures, which include a risk-based capital measure, a leverage ratio capital measure and certain other factors. The federal banking agencies have adopted regulations that implement this statutory framework. Under these regulations, an institution is treated as well capitalized if its ratio of total capital to risk-weighted assets is 10% or more, its ratio of core capital to risk-weighted assets is 6% or more, its ratio of core capital to adjusted total assets (leverage ratio) is 5% or more, and it is not subject to any federal supervisory order or directive to meet a specific capital level. In order to be adequately capitalized, an institution must have a total risk-based capital ratio of not less than 8%, a core capital to risk-weighted assets ratio of not less than 4%, and a leverage ratio of not less than 4%. An institution that is not well capitalized is subject to certain restrictions on brokered deposits, including restrictions on the rates it can offer on its deposits generally. Any institution which is neither well capitalized nor adequately capitalized is considered undercapitalized.
Undercapitalized institutions are subject to certain prompt corrective action requirements, regulatory controls and restrictions which become more extensive as an institution becomes more severely undercapitalized. Failure by First Federal to comply with applicable capital requirements would, if unremedied, result in restrictions on its activities and lead to enforcement actions, including, but not limited to, the issuance of a capital directive to ensure the maintenance of required capital levels and, ultimately, the appointment of the FDIC as receiver or conservator. Banking regulators will take prompt corrective action with respect to depository institutions that do not meet minimum capital requirements. Additionally, approval of any regulatory application filed for their review may be dependent on compliance with capital requirements. At June 30, 2015, First Federal was categorized as “well capitalized” under the new regulatory capital requirements described below to be considered "well capitalized." For additional information, see Note 11 of the Notes to Consolidated Financial Statements included in Item 8, "Financial Statements and Supplementary Data," of this Form 10-K.
Capital Requirements. In early July 2013, the Federal Reserve Board and the FDIC approved revisions to their capital adequacy guidelines and prompt corrective action rules that implement the revised standards of the Basel Committee on Banking Supervision, commonly called Basel III, and address relevant provisions of the Dodd-Frank Act. “Basel III” refers to two consultative documents released by the Basel Committee on Banking Supervision in December 2009, the rules text released in December 2010, and loss absorbency rules issued in January 2011, which include significant changes to bank capital, leverage and liquidity requirements.
The rules include new risk-based capital and leverage ratios, which became effective January 1, 2015, and revised the definition of what constitutes “capital” for purposes of calculating those ratios. The new minimum capital level requirements applicable to First Northwest Bancorp and First Federal are: (i) a new common equity Tier
44
1 capital ratio of 4.5%; (ii) a Tier 1 capital ratio of 6% (increased from 4%); (iii) a total capital ratio of 8% (unchanged from current rules); and (iv) a Tier 1 leverage ratio of 4% for all financial institutions. In addition, the rules assign a higher risk weight (150%) to exposures that are more than 90 days past due or are on nonaccrual status and to certain commercial real estate facilities that finance the acquisition, development or construction of real property.
The rules also establish a “capital conservation buffer” of 2.5% above the new regulatory minimum capital requirements, which must consist entirely of common equity Tier 1 capital and would result in the following minimum ratios: (i) a common equity Tier 1 capital ratio of 7.0%, (ii) a Tier 1 capital ratio of 8.5%, and (iii) a total capital ratio of 10.5%. The new capital conservation buffer requirement will be phased in beginning in January 2016 at 0.625% of risk-weighted assets and would increase by that amount each year until fully implemented in January 2019. A financial institution would be subject to limitations on paying dividends, engaging in share repurchases, and paying discretionary bonuses if its capital level falls below the buffer amount. These limitations would establish a maximum percentage of eligible retained income that could be utilized for such actions.
As of June 30, 2015, First Federal’s Tier 1 capital (leverage) ratio was 14.53% and its total risk-based capital ratio was 25.01%. For additional information, see Note 11 of the Notes to Consolidated Financial Statements contained in Item 8, "Financial Statements and Supplementary Data," of this Form 10-K.
For all of these capital requirements, there are a number of changes in what constitutes regulatory capital, some of which are subject to a two-year transition period. These changes include the phasing-out of certain instruments as qualifying capital. First Federal does not have any of these instruments as a result of First Federal’s total assets being below the $15 billion threshold. Under the new requirements for total capital, Tier 2 capital is no longer limited to the amount of Tier 1 capital included in total capital. Mortgage servicing rights, certain deferred tax assets and investments in unconsolidated subsidiaries over designated percentages of common stock will be deducted from capital, subject to a two-year transition period. In addition, Tier 1 capital will include accumulated other comprehensive income, which includes all unrealized gains and losses on available for sale debt and equity securities, subject to a two-year transition period; however, during the first quarter of 2015 First Federal took advantage of the one-time option to permanently opt-out of the inclusion of accumulated other comprehensive income in its capital calculations to reduce the impact of market volatility on its regulatory capital levels.
The new requirements also include changes in the risk-weightings of assets to better reflect credit risk and other risk exposures. These include a 150% risk weight (up from 100%) for certain high volatility commercial real estate acquisition, development and construction loans and for non-residential mortgage loans that are 90 days past due or otherwise in nonaccrual status; a 20% (up from 0%) credit conversion factor for the unused portion of a commitment with an original maturity of one year or less that is not unconditionally cancelable; a 250% risk weight (up from 100%) for mortgage servicing and deferred tax assets that are not deducted from capital; and increased risk-weightings (0% to 600%) for equity exposures. The FDIC also has authority to establish individual minimum capital requirements in appropriate cases upon a determination that an institution’s capital level is or may become inadequate in light of particular risks or circumstances.
Standards for Safety and Soundness. The federal banking regulatory agencies have prescribed, by regulation, guidelines for all insured depository institutions relating to internal controls, information systems and internal audit systems; loan documentation; credit underwriting; interest rate risk exposure; asset growth; asset quality; earnings; and compensation, fees and benefits. The guidelines set forth the safety and soundness standards that the federal banking agencies use to identify and address problems at insured depository institutions before capital becomes impaired. Each insured depository institution must implement a comprehensive written information security program that includes administrative, technical, and physical safeguards appropriate to the institution’s size and complexity and the nature and scope of its activities. The information security program must be designed to ensure the security and confidentiality of customer information, protect against any unanticipated threats or hazards to the security or integrity of such information, protect against unauthorized access to or use of such information that could result in substantial harm or inconvenience to any customer, and ensure the proper disposal of customer and consumer information. Each insured depository institution must also develop and implement a risk-based response program to address incidents of unauthorized access to customer information in customer information systems. If the FDIC determines that an institution fails to meet any of these guidelines, it may require an institution to submit to the FDIC an acceptable plan to achieve compliance.
Federal Home Loan Bank System. First Federal is a member of the FHLB of Des Moines following the voluntary merger of the FHLB of Seattle with and into the FHLB of Des Moines effective May 31, 2015. As a member, First Federal is required to purchase and maintain stock in the FHLB of Des Moines. At June 30, 2015,

45
First Federal had $4.8 million in FHLB of Des Moines stock, which was in compliance with this requirement. Each FHLB serves as a reserve or central bank for its members within its assigned region, and it is funded primarily from proceeds derived from the sale of consolidated obligations of the Federal Home Loan Bank System. Each FHLB makes loans or advances to members in accordance with policies and procedures, established by its Board of Directors, subject to the oversight of the Federal Housing Finance Board. All advances from the FHLB of Des Moines are required to be fully secured by sufficient collateral as determined by the FHLB of Des Moines, and all long-term advances are required to provide funds for residential home financing. At June 30, 2015, First Federal had $89.9 million of outstanding advances from the FHLB of Des Moines. See Item 1, "Business – Deposit Activities and Other Sources of Funds – Borrowings."
The FHLBs continue to contribute to low- and moderately-priced housing programs through direct loans or interest subsidies on advances targeted for community investment and low- and moderate-income housing projects. These contributions have affected adversely the level of FHLB dividends paid and could continue to do so in the future. These contributions could also have an adverse effect on the value of FHLB stock in the future. A reduction in value of First Federal's FHLB of Des Moines stock may result in a corresponding reduction in its capital.
Activities and Investments of Insured State-Chartered Financial Institutions. Federal law generally limits the activities and equity investments of FDIC insured, state-chartered banks to those that are permissible for national banks. An insured state bank is not prohibited from, among other things, (1) acquiring or retaining a majority interest in a subsidiary, (2) investing as a limited partner in a partnership, the sole purpose of which is direct or indirect investment in the acquisition, rehabilitation or new construction of a qualified housing project, provided that such limited partnership investments may not exceed 2% of the bank’s total assets, (3) acquiring up to 10% of the voting stock of a company that solely provides or reinsures directors’ and officers’ liability insurance coverage or bankers’ blanket bond group insurance coverage for insured depository institutions, and (4) acquiring or retaining the voting shares of a depository institution if certain requirements are met.
Washington State has enacted a law regarding financial institution parity. Primarily, the law affords Washington-chartered commercial banks the same powers as Washington-chartered savings banks. In order for a bank to exercise these powers, it must provide 30 days' notice to the Director of the Washington Division of Financial Institutions and the Director must authorize the requested activity. In addition, the law provides that Washington-chartered commercial banks may exercise any of the powers that the Federal Reserve has determined to be closely related to the business of banking and the powers of national banks, subject to the approval of the Director in certain situations. Finally, the law provides additional flexibility for Washington-chartered commercial and savings banks with respect to interest rates on loans and other extensions of credit. Specifically, they may charge the maximum interest rate allowable for loans and other extensions of credit by federally-chartered financial institutions to Washington residents.
Dividends. Dividends from First Federal constitute the major source of funds for dividends in future periods that may be paid by First Northwest Bancorp to shareholders. The amount of dividends payable by First Federal to First Northwest Bancorp depends upon First Federal’s earnings and capital position; is limited by federal and state laws, regulations and policies; and is subject to prior regulatory approval. According to Washington law, First Federal may not declare or pay a cash dividend on its capital stock if it would cause its net worth to be reduced below (1) the amount required for liquidation accounts or (2) the net worth requirements, if any, imposed by the Director of the DFI. Dividends on First Federal’s capital stock may not be paid in an aggregate amount greater than the aggregate retained earnings of First Federal without the approval of the Director of the DFI.
The amount of dividends actually paid during any one period will be strongly affected by First Federal’s policy of maintaining a strong capital position. Federal law further provides that no insured depository institution may pay a cash dividend if it would cause the institution to be “undercapitalized” as defined in the prompt corrective action regulations. Moreover, the federal bank regulatory agencies also have the general authority to limit the dividends paid by insured banks if such payments are deemed to constitute an unsafe and unsound practice.
Affiliate Transactions. Federal laws strictly limit the ability of banks to engage in certain transactions with their affiliates, including their bank holding companies. Transactions deemed to be a “covered transaction” under Section 23A of the Federal Reserve Act and between a subsidiary bank and its parent company or the nonbank subsidiaries of the bank holding company are limited to 10% of the bank subsidiary’s capital and surplus and, with respect to the parent company and all such nonbank subsidiaries, to an aggregate of 20% of the bank subsidiary’s capital and surplus. Further, covered transactions that are loans and extensions of credit generally are required to be secured by eligible collateral in specified amounts. Federal law also requires that covered transactions and certain

46
other transactions listed in Section 23B of the Federal Reserve Act between a bank and its affiliates be on terms as favorable to the bank as transactions with non-affiliates.
Community Reinvestment Act. First Federal is subject to the provisions of the Community Reinvestment Act of 1977 (CRA), which requires the appropriate federal bank regulatory agency to assess a bank’s performance under the CRA in meeting the credit needs of the community serviced by the bank, including low-and moderate income neighborhoods. The regulatory agency’s assessment of a bank’s record is made available to the public. Further, a bank’s CRA performance rating must be considered in connection with a bank’s application, among other things, to establish a new branch office that will accept deposits; to relocate an existing office; or to merge or consolidate with, or acquire the assets or assume the liabilities of, a federally regulated financial institution. First Federal received a “satisfactory” rating during its most recent CRA examination.
Privacy Standards. The Gramm-Leach-Bliley Financial Services Modernization Act of 1999 (GLBA) modernized the financial services industry by establishing a comprehensive framework to permit affiliations among commercial banks, insurance companies, securities firms and other financial service providers. First Federal is subject to FDIC regulations implementing the privacy protection provisions of the GLBA. These regulations require First Federal to disclose its privacy policy, including informing consumers of its information sharing practices and informing consumers of its rights to opt out of certain practices.
Environmental Issues Associated with Real Estate Lending. The Comprehensive Environmental Response, Compensation and Liability Act ("CERCLA") is a federal statute that generally imposes strict liability on all prior and present "owners and operators" of sites containing hazardous waste. However, Congress asked to protect secured creditors by providing that the term "owner and operator" excludes a person whose ownership is limited to protecting its security interest in the site. Since the enactment of the CERCLA, this "secured creditor exemption" has been the subject of judicial interpretations which have left open the possibility that lenders could be liable for cleanup costs on contaminated property that they hold as collateral for a loan. To the extent that legal uncertainty exists in this area, all creditors, including First Federal, that have made loans secured by properties with potential hazardous waste contamination (such as petroleum contamination) could be subject to liability for cleanup costs, which costs often substantially exceed the value of the collateral property.
Federal Reserve System. The Federal Reserve Board requires that all depository institutions maintain reserves on transaction accounts or non-personal time deposits. These reserves may be in the form of cash or noninterest-bearing deposits with the regional Federal Reserve Bank. Negotiable order of withdrawal (NOW) accounts and other types of accounts that permit payments or transfers to third parties fall within the definition of transaction accounts and are subject to the reserve requirements, as are any non-personal time deposits at a savings bank. As of June 30, 2015, First Federal's deposit with the Federal Reserve Bank and vault cash exceeded its reserve requirements.
Other Consumer Protection Laws and Regulations. The Dodd-Frank Act established the CFPB and empowered it to exercise broad regulatory, supervisory and enforcement authority with respect to both new and existing consumer financial protection laws. First Federal is subject to consumer protection regulations issued by the CFPB, but as financial institutions with assets of less than $10 billion, First Federal is generally subject to supervision and enforcement by the FDIC and the DFI with respect to compliance with consumer financial protection laws and CFPB regulations.
First Federal is subject to a broad array of federal and state consumer protection laws and regulations that govern almost every aspect of its business relationships with consumers. While the list set forth below is not exhaustive, these include the Truth-in-Lending Act, the Truth in Savings Act, the Electronic Fund Transfer Act, the Expedited Funds Availability Act, the Equal Credit Opportunity Act, the Fair Housing Act, the Real Estate Settlement Procedures Act, the Home Mortgage Disclosure Act, the Fair Credit Reporting Act, the Fair Debt Collection Practices Act, the Right to Financial Privacy Act, the Home Ownership and Equity Protection Act, the Consumer Leasing Act, the Fair Credit Billing Act, the Homeowners Protection Act, the Check Clearing for the 21st Century Act, laws governing flood insurance, laws governing consumer protections in connection with the sale of insurance, federal and state laws prohibiting unfair and deceptive business practices, and various regulations that implement some or all of the foregoing. These laws and regulations mandate certain disclosure requirements and regulate the manner in which financial institutions must deal with customers when taking deposits, making loans, collecting loans, and providing other services. Failure to comply with these laws and regulations can subject First Federal to various penalties including, but not limited to, enforcement actions, injunctions, fines, civil liability, criminal penalties, punitive damages, and the loss of certain contractual rights.

47
Regulation and Supervision of First Northwest Bancorp
General. First Northwest Bancorp is a bank holding company registered with the Federal Reserve and the sole shareholder of First Federal. Bank holding companies are subject to comprehensive regulation by the Federal Reserve under the Bank Holding Company Act of 1956, as amended (“BHCA”), and the regulations promulgated thereunder. This regulation and oversight is generally intended to ensure that First Northwest Bancorp limits its activities to those allowed by law and that it operates in a safe and sound manner without endangering the financial health of First Federal.
As a bank holding company, First Northwest Bancorp is required to file quarterly and annual reports with the Federal Reserve and any additional information required by the Federal Reserve and is subject to regular examinations by the Federal Reserve. The Federal Reserve also has extensive enforcement authority over bank holding companies, including the ability to assess civil money penalties, to issue cease and desist or removal orders and to require that a holding company divest subsidiaries (including its bank subsidiaries). In general, enforcement actions may be initiated for violations of law and regulations and unsafe or unsound practices.
The Bank Holding Company Act. Under the BHCA, First Northwest Bancorp is supervised by the Federal Reserve. The Federal Reserve has a policy that a bank holding company is required to serve as a source of financial and managerial strength to its subsidiary banks and may not conduct its operations in an unsafe or unsound manner. In addition, the Federal Reserve provides that bank holding companies should serve as a source of strength to its subsidiary banks by being prepared to use available resources to provide adequate capital funds to its subsidiary banks during periods of financial stress or adversity, and should maintain the financial flexibility and capital raising capacity to obtain additional resources for assisting its subsidiary banks. A bank holding company's failure to meet its obligation to serve as a source of strength to its subsidiary banks will generally be considered by the Federal Reserve to be an unsafe and unsound banking practice or a violation of the Federal Reserve's regulations, or both.
Under the BHCA, the Federal Reserve may approve the ownership of shares by a bank holding company in any company the activities of which the Federal Reserve has determined to be so closely related to the business of banking or managing or controlling banks as to be a proper incident thereto. These activities generally include, among others, operating a savings institution, mortgage company, finance company, credit card company or factoring company; performing certain data processing operations; providing certain investment and financial advice; underwriting and acting as an insurance agent for certain types of credit-related insurance; leasing property on a full-payout, non-operating basis; selling money orders, travelers' checks and U.S. Savings Bonds; real estate and personal property appraising; providing tax planning and preparation services; and, subject to certain limitations, providing securities brokerage services for customers.
Acquisitions. The BHCA prohibits a bank holding company, with certain exceptions, from acquiring ownership or control of more than 5% of the voting shares of any company that is not a bank or bank holding company and from engaging in activities other than those of banking, managing or controlling banks, or providing services for its subsidiaries. A bank holding company that meets certain supervisory and financial standards and elects to be designed as a financial holding company may also engage in certain securities, insurance and merchant banking activities and other activities determined to be financial in nature or incidental to financial activities. The BHCA prohibits a bank holding company, with certain exceptions, from acquiring ownership or control of more than 5% of the voting shares of any company that is not a bank or bank holding company and from engaging in activities other than those of banking, managing or controlling banks, or providing services for its subsidiaries.
Regulatory Capital Requirements. The Federal Reserve has adopted capital guidelines pursuant to which it assesses the adequacy of capital in examining and supervising a bank holding company and in analyzing applications under the BHCA. These guidelines apply on a consolidated basis to bank holding companies with $1.0 billion or more in assets, or with fewer assets but certain risky activities, and on a bank-only basis to other companies. These bank holding company capital adequacy guidelines are similar to those imposed on First Federal by the FDIC. For a bank holding company with less than $1.0 billion in total consolidated assets, the capital guidelines typically apply on a bank only basis and the Federal Reserve expects the holding company's subsidiary banks to be well capitalized under the prompt corrective action regulations. In July 2013, the Federal Reserve and the FDIC approved revisions to their capital adequacy guidelines and prompt corrective action rules to implement the Basel III regulatory capital reforms and changes required by the Dodd-Frank Act. For additional information, see the section above entitled “- Regulation of First Federal - Capital Regulation” and Note 11 of the Notes to Consolidated Financial Statements included in Item 8., "Financial Statements and Supplementary Data," of this Form 10-K.
48
Interstate Banking. The Federal Reserve must approve an application of a bank holding company to acquire control of, or acquire all or substantially all of the assets of, a bank located in a state other than the holding company's home state, without regard to whether the transaction is prohibited by the laws of any state. The Federal Reserve may not approve the acquisition of a bank that has not been in existence for the minimum time period, not exceeding five years, specified by the law of the host state. Nor may the Federal Reserve approve an application if the applicant controls or would control more than 10% of the insured deposits in the United States or 30% or more of the deposits in the target bank's home state or in any state in which the target bank maintains a branch. Federal law does not affect the authority of states to limit the percentage of total insured deposits in the state that may be held or controlled by a bank holding company to the extent such limitation does not discriminate against out-of-state banks or bank holding companies. Individual states may also waive the 30% state-wide concentration limit contained in the federal law.
The federal banking agencies are authorized to approve interstate merger transactions without regard to whether the transaction is prohibited by the law of any state, unless the home state of one of the banks adopted a law prior to June 1, 1997, which applies equally to all out-of-state banks and expressly prohibits merger transactions involving out-of-state banks. Interstate acquisitions of branches will be permitted only if the law of the state in which the branch is located permits such acquisitions. Interstate mergers and branch acquisitions will also be subject to the nationwide and statewide insured deposit concentration amounts described above.
Restrictions on Dividends. First Northwest Bancorp's ability to declare and pay dividends is subject to the Federal Reserve limits and Washington law, and it may depend on its ability to receive dividends from First Federal.
A policy of the Federal Reserve limits the payment of a cash dividend by a bank holding company if the holding company's net income for the past year is not sufficient to cover both the cash dividend and a rate of earnings retention that is consistent with capital needs, asset quality and overall financial condition. A bank holding company that does not meet any applicable capital standard would not be able to pay any cash dividends under this policy. A bank holding company not subject to consolidated capital requirements is expected not to pay dividends unless its debt-to-equity ratio is less than 1:1, and it meets certain additional criteria. The Federal Reserve also has indicated that it would be inappropriate for a company experiencing serious financial problems to borrow funds to pay dividends.
Except for a company that meets the well-capitalized standard for bank holding companies, is well managed, and is not subject to any unresolved supervisory issues, a bank holding company is required to give the Federal Reserve prior written notice of any purchase or redemption of its outstanding equity securities if the gross consideration for the purchase or redemption, when combined with the net consideration paid for all such purchases or redemptions during the preceding 12 months, is equal to 10.0% or more of the company's consolidated net worth. The Federal Reserve may disapprove such a purchase or redemption if it determines that the proposal would constitute an unsafe or unsound practice or would violate any law, regulation or regulatory order, condition, or written agreement. A bank holding company is considered well-capitalized if on a consolidated basis it has a total risk-based capital ratio of at least 10.0% and a Tier 1 risk-based capital ratio of 6.0% or more, and is not subject to an agreement, order, or directive to maintain a specific level for any capital measure.
In addition, during the 12 months following the conversion and stock offering, or until January 29, 2016, First Northwest Bancorp may not make any distributions of capital without the written approval of the Federal Reserve and the written non-objection of the DFI. In addition, any material deviations from, or changes to, the business plan are subject to the prior written approval of the Regional Director of the FDIC-San Francisco.
Under Washington corporate law, First Northwest Bancorp generally may not pay dividends if after that payment it would not be able to pay its liabilities as they become due in the usual course of business, or its total assets would be less than the sum of its total liabilities.
Stock Repurchases. Any repurchases of our common stock during the three year period following the conversion is subject to the prior approval of the DFI and other bank regulatory agencies, as applicable. A bank holding company, except for certain “well-capitalized” and highly rated bank holding companies, is required to give the Federal Reserve prior written notice of any purchase or redemption of its outstanding equity securities if the gross consideration for the purchase or redemption, when combined with the net consideration paid for all such purchases or redemptions during the preceding twelve months, is equal to 10% or more of its consolidated net worth. The Federal Reserve may disapprove such a purchase or redemption if it determines that the proposal would

49
constitute an unsafe or unsound practice or would violate any law, regulation, Federal Reserve order or any condition imposed by, or written agreement with, the Federal Reserve.
The Dodd-Frank Act. On July 21, 2010, the Dodd-Frank Act was signed into law. The Dodd-Frank-Act imposes new restrictions and an expanded framework of regulatory oversight for financial institutions, including depository institutions and implements new capital regulations that First Northwest Bancorp will become subject to and that are discussed above under “- Regulation of First Federal - Capital Regulations.” In addition, among other changes, the Dodd-Frank Act requires public companies, like First Northwest Bancorp, to (i) provide their shareholders with a non-binding vote (a) at least once every three years on the compensation paid to executive officers and (b) at least once every six years on whether they should have a “say on pay” vote every one, two or three years; (ii) have a separate, non-binding shareholder vote regarding golden parachutes for named executive officers when a shareholder vote takes place on mergers, acquisitions, dispositions or other transactions that would trigger the parachute payments; (iii) provide disclosure in annual proxy materials concerning the relationship between the executive compensation paid and the financial performance of the issuer; and (iv) amend Item 402 of Regulation S-K to require companies to disclose the ratio of the Chief Executive Officer's annual total compensation to the median annual total compensation of all other employees. For certain of these changes, the implementing regulations have not been promulgated, so the full impact of the Dodd-Frank Act on public companies cannot be determined at this time.
Federal Securities Law. The stock of First Northwest Bancorp is registered with the SEC under the Securities Exchange Act of 1934, as amended. As a result, First Northwest Bancorp is subject to the information, proxy solicitation, insider trading restrictions and other requirements under the Securities Exchange Act of 1934.
First Northwest Bancorp stock held by persons who are affiliates of First Northwest Bancorp may not be resold without registration unless sold in accordance with certain resale restrictions. Affiliates are generally considered to be officers, directors and principal shareholders. If First Northwest Bancorp meets specified current public information requirements, each affiliate of First Northwest Bancorp will be able to sell in the public market, without registration, a limited number of shares in any three-month period.
The SEC has adopted regulations and policies under the Sarbanes-Oxley Act of 2002 that apply to First Northwest Bancorp as a registered company under the Securities Exchange Act of 1934. The stated goals of these Sarbanes-Oxley requirements are to increase corporate responsibility, provide for enhanced penalties for accounting and auditing improprieties at publicly traded companies and to protect investors by improving the accuracy and reliability of corporate disclosures pursuant to the securities laws. The SEC and Sarbanes-Oxley-related regulations and policies include very specific additional disclosure requirements and new corporate governance rules. The Sarbanes-Oxley Act represents significant federal involvement in matters traditionally left to state regulatory systems, such as the regulation of the accounting profession, and to state corporate law, such as the relationship between a board of directors and management and between a board of directors and its committees.
TAXATION
Federal Taxation
General. First Northwest Bancorp and First Federal are subject to federal income taxation in the same general manner as other corporations, with some exceptions discussed below. The following discussion of federal taxation is intended only to summarize certain pertinent federal income tax matters and is not a comprehensive description of the tax rules applicable to First Northwest Bancorp or First Federal. First Federal is no longer subject to U.S. federal income tax examinations by tax authorities for years ended before June 30, 2012. See Note 9 of the Notes to Consolidated Financial Statements included in Item 8, "Financial Statements and Supplementary Data," of this Form 10-K.
First Northwest Bancorp anticipates that it will file a consolidated federal income tax return with First Federal commencing with the first taxable year after completion of the conversion. Accordingly, it is anticipated that any cash distributions made by First Northwest Bancorp to its shareholders would be considered to be taxable dividends and not as a return of capital to shareholders for federal and state tax purposes.
Method of Accounting. For federal income tax purposes, First Federal currently reports its income and expenses on the accrual method of accounting and uses a fiscal year ending on June 30 for filing its federal income tax return.

50
Minimum Tax. The Internal Revenue Code imposes an alternative minimum tax at a rate of 20% on a base of regular taxable income plus certain tax preferences, called alternative minimum taxable income. The alternative minimum tax is payable to the extent such alternative minimum taxable income is in excess of an exemption amount. Net operating losses can offset no more than 90% of alternative minimum taxable income. Certain payments of alternative minimum tax may be used as credits against regular tax liabilities in future years. First Federal has been subject to the alternative minimum tax, and at June 30, 2015 has credits for carryover of approximately $14,475.
Corporate Deduction. First Northwest Bancorp may eliminate from its income dividends received from First Federal as a wholly owned subsidiary of First Northwest Bancorp if it elects to file a consolidated return with First Federal. The corporate dividends-received deduction is 100%, or 80%, in the case of dividends received from corporations with which a corporate recipient does not file a consolidated tax return, depending on the level of stock ownership of the payor of the dividend. Corporations which own less than 20% of the stock of a corporation distributing a dividend may deduct 70% of dividends received or accrued on their behalf.
Charitable Contribution Carryovers. The Company may carryforward charitable contributions to the succeeding five taxable years. The utilization of the charitable contribution carryforward may not exceed 10% of taxable income as defined by the federal taxation laws. At June 30, 2015, the Company had a charitable contribution carryforward for federal income tax purposes of $9.3 million. This carryforward was generated from the Company’s creation of the First Federal Community Foundation to which it contributed 933,360 shares of its common stock and $400,000 in cash in connection with the mutual to stock conversion. Management does not fully expect to utilize the benefit over the five year carryforward period and has recorded a reserve on the portion of the related deferred tax asset estimated to expire unused.
Washington Taxation
First Federal is subject to a business and occupation tax imposed under Washington law at the rate of 1.5% of gross receipts. Interest received on loans secured by mortgages or deeds of trust on residential properties and certain investment securities are exempt from this tax.

51
Item 1A. Risk Factors.
Our increased emphasis on commercial real estate lending subjects us to various risks that could adversely impact our results of operations and financial condition.
Since June 30, 2011, we have increased the amount of our commercial real estate and multi-family loans from $91.9 million, or 21.2%, of our total loan portfolio to $158.7 million, or 32.1% of our total loan portfolio, at June 30, 2015. We intend to continue to increase, subject to market demand, our origination and purchase of commercial real estate loans.
Our increased focus on this type of lending has increased our risk profile relative to traditional one- to four-family lenders. Commercial real estate loans are intended to enhance the average yield of our earning assets; however, they do involve a different level of risk of delinquency or collection than generally associated with one- to four-family loans for a number of reasons. The repayment of commercial real estate loans typically is dependent on the successful operation and income stream of the borrowers’ business, or the ability to lease the property at sufficient rates, and the value of the real estate securing the loan as collateral, which can be significantly affected by economic conditions. These loans also involve larger balances to a single borrower or groups of related borrowers. Some of our commercial borrowers have more than one loan outstanding with us. Consequently, an adverse development with respect to one loan or one credit relationship can expose us to a significantly greater risk of loss compared to an adverse development with respect to a single one- to four-family residential mortgage loan. Since commercial real estate loans generally have large balances, deterioration in the quality of commercial loans may result in the need to significantly increase our provision for loan losses and charge-offs will likely be larger on a per loan basis compared to consumer loans. As a result, deterioration of this portfolio could materially adversely affect our future earnings. Collateral evaluation and financial statement analysis in these types of loans also requires a more detailed analysis at the time of loan underwriting and on an ongoing basis. Finally, if we foreclose on a commercial real estate loan, our holding period for the collateral is typically longer than for a one- to four-family residence because the secondary market for most types of commercial real estate is not readily liquid, which results in less opportunity to mitigate credit risk by selling part or all of our interest in these assets. At June 30, 2015, we had $147,000 of nonperforming commercial real estate loans and no nonperforming multi-family loans in our portfolio.
The unseasoned nature of our commercial loan portfolio may result in errors in judging its collectability, which may lead to additional provisions for loan losses or charge-offs, which would hurt our profits.
Our commercial loan portfolio, which includes loans secured by commercial and multi-family real estate as well as business assets, has increased from $99.8 million, or 23.2% of total loans, at June 30, 2011, to $173.5 million, or 35.1% of total loans, at June 30, 2015. Included in our commercial loan portfolio at June 30, 2015, were $18.2 million of purchased loans and loan participations. A large portion of our commercial loan portfolio is unseasoned, meaning they were originated recently. Our limited experience with these borrowers does not provide us with a significant payment history pattern. Further, First Federal has not experienced a downturn in economic conditions with these borrowers. As a result, it is difficult to predict the future performance of this part of our loan portfolio. These borrowers may develop delinquency or charge-off levels above our historical experience, which could adversely affect our future performance.
We have a concentration of large loans outstanding to a limited number of borrowers that increases our risk of loss.
First Federal has extended significant amounts of credit to a limited number of borrowers, largely in connection with high-end residential real estate and commercial and multi-family real estate loans. At June 30, 2015, the aggregate amount of loans, including unused commitments, to First Federal's five largest borrowers (including related entities) amounted to approximately $45.5 million, or 9.2% of total loans. The largest 20 borrowers at June 30, 2015 totaled $117.2 million, or 23.7% of total loans. At such date, none of the loans to First Federal's 20 largest borrowers were nonperforming loans.
A high concentration of credit to a limited number of borrowers increases the risk in First Federal's loan portfolio. In the event that one or more of these borrowers is not able to service the contractual repayment, the potential loss to First Federal is more likely to have a material adverse impact on our business, financial condition and results of operations.

52
Slower growth in our primary market area has led us to originate and purchase loans outside of our market area which could affect the level of our nonperforming loans.
We currently have full service offices on the North Olympic Peninsula and in Kitsap County and a lending office in Whatcom County. The North Olympic Peninsula region, which represents our largest concentration of depositors and borrowers, has experienced limited population growth, and the region's unemployment rate is higher than both the state and national unemployment rates. As a result, we have recently begun to opportunistically originate and purchase loans outside of these areas in the counties surrounding the Puget Sound, and we may purchase loans with different credit and underwriting criteria than those we originate organically. At June 30, 2015, we had approximately $76.0 million of one- to four-family mortgage loans, $23.0 million of multi-family loans and $63.8 million of commercial real estate loans secured by properties located outside of the North Olympic Peninsula region and Whatcom and Kitsap counties. Included in the one- to four-family residential loans are $12.7 million and $17.5 million of one- to four-family mortgages in the states of California and Ohio, respectively. We also have multi-family and commercial real estate loans of $19.1 million and $71.8 million, respectively, located primarily in Kitsap, King, Pierce and Snohomish counties around the Puget Sound region of Washington. We have not experienced significant loan delinquencies with these out of market area loans; however, declines in economic conditions or real estate values in these markets could significantly adversely affect the level of our nonperforming loans and our results of operations.
We are dependent on key personnel and the loss of one or more of those key persons may materially and adversely affect our prospects.
We rely heavily on the efforts and abilities of our executive officers, and certain other key management personnel, which make up our management team. The ability to attract, retain and season this management team presents risks to executing our business plan. In the past we have had significant turnover in our management team. The senior management team has been working together for two years. Our president and chief executive officer, Laurence J. Hueth, the former chief financial officer of First Federal, was appointed to his position in January 2013. Mr. Hueth joined First Federal in December 2008. Regina M. Wood, the former controller of First Federal, was appointed chief financial officer in March 2013. Ms. Wood joined First Federal in August 2006. In addition, our chief credit officer, Christopher A. Donohue, joined First Federal in April 2013. From 2005 through 2013, Mr. Donohue worked in various lending and asset resolution positions for several banks located in Nevada. In August 2013, Kelly A. Liske, was appointed our chief banking officer. Ms. Liske joined First Federal in 2006 as branch manager in Port Townsend and was later promoted to commercial relationship manager before becoming chief banking officer. In addition, Jeffrey S. Davis, our executive vice president and chief operating officer, joined First Federal on September 1, 2014, as senior vice president and bank operations officer and was appointed as executive vice president and chief operating officer on February 25, 2015. In March 2015, Mr. Davis was also put in charge of Human Resources following the resignation of Elaine T. Gentilo, Senior Vice President/Chief People Officer of First Federal.
Our current management team was instrumental in completing the conversion and developing and implementing our current operational strategy. While we believe our current management team has the knowledge and experience to continue to effectively implement this operational strategy, we recognize that these individuals will need time to develop a cohesive and unified senior management team, which could delay the implementation of our operational strategy. The loss of the services of any of our current management team could have a material adverse impact on our operations because we would most likely have to search outside of First Federal for qualified replacements. This search may be prolonged as our current market area is considered remote. This characteristic may make it more difficult for us to find qualified replacements willing to relocate to a smaller community like ours.
Changes in our current management team and their responsibilities may be disruptive to our business and operations and could have a material adverse effect on our business, financial condition and results of operations. While we believe that our relationship with our management team is good, we cannot guarantee that all members of our management team will remain with our organization or successfully transition into their new roles.
Adverse economic conditions in the market areas we serve could adversely impact our earnings and could increase the credit risk associated with our loan portfolio.
Our customer base has been historically concentrated in the North Olympic Peninsula region of Washington, in particular Clallam, Jefferson and Kitsap counties. We recently expanded our lending area to include other counties surrounding the Puget Sound and to a lesser extent other parts of Washington. In the most recent economic downturn, this region, as well as much of the rest of the state of Washington, experienced substantial

53
home price declines, increased foreclosures and above average unemployment rates. Continued weakness or further deterioration of economic conditions in the market areas we serve could result in the following consequences, any of which could have a materially adverse impact on our business, financial condition and results of operations:
• loan delinquencies, problem assets and foreclosures may increase; • demand for our products and services may decline, possibly resulting in a decrease in our total loans or
assets; • collateral for loans made may decline further in value, exposing us to increased risk of loss on existing
loans and reducing customers’ borrowing power; • the net worth and liquidity of loan guarantors may decline, impairing their ability to honor commitments to
us; and• the amount of our deposits may decrease and the composition of our deposits may be adversely affected.
There are local factors that may have further adverse impact on the economies in our primary market areas. For example, a study that was released in early 2012 found that areas of the Port Angeles harbor contained high concentrated levels of pollution. Clean up requirements and associated costs could materially affect local businesses and the regional economy. In addition, the health care industry is a significant source of employment within the region. Rising costs as well as changing insurance reimbursement levels have adversely affected the health care industry in recent years. If these rising costs and adverse insurance reimbursement changes continue, many health care organizations may be forced to reduce their operations, which could result in a reduction of the number of jobs, which would adversely affect unemployment rates within the North Olympic Peninsula region of Washington.
Changing water rights in the state of Washington could adversely affect the value of undeveloped lots and subsequent use for residential and commercial activity within our market area and potentially other rural areas of the state of Washington.
Washington Department of Ecology requirements and proposals that limit the use of water in rivers and streams, as well as the underground water in related aquifers, have increased costs for and restricted use of water in certain parts of our market area. New water use regulations currently affect both the Dungeness Valley in the east end of Clallam County and the Quilcene and Chimacum areas in Jefferson County, limiting daily use of water from new wells and increasing the cost of water usage, including the requirement of permit fees to drill new wells. These changes have had an adverse impact on the value of undeveloped lots and their subsequent use for residential or commercial activities within our market area and similar areas throughout Washington. At June 30, 2015, we had loans on 51 residential lots aggregating $3.3 million that we believe could be adversely affected, which may reduce the values of these properties.
Our branching strategy will cause our expenses to increase and may negatively affect our earnings.
We are planning up to four new branch openings during the next three years. The success of our expansion strategy into new markets, however, is contingent upon numerous factors, such as our ability to select suitable locations, assess each market's competitive environment, secure managerial resources, hire and retain qualified personnel and implement effective marketing strategies. The opening of new offices may not increase the volume of our loans and deposits as quickly or to the degree that we hope, and opening new offices will increase our operating expenses. On average, de novo branches do not become profitable until three to four years after opening. We currently expect to lease rather than own the additional branches. Further, the projected time line and the estimated dollar amounts involved in opening de novo branches could differ significantly from actual results. In addition, we may not successfully manage the costs and implementation risks associated with our branching strategy. Accordingly, any new branch may negatively impact our earnings for some period of time until the branch reaches certain economies of scale. Finally, there is a risk that our new branches will not be successful even after they have been established.
Our business may be adversely affected by credit risk associated with residential property.
At June 30, 2015, $293.2 million, or 59.4% of our total loan portfolio, consisted of one- to four-family mortgage loans and home equity loans secured by residential properties. Lending on residential property is generally sensitive to regional and local economic conditions that significantly impact the ability of borrowers to meet their loan payment obligations, making loss levels difficult to predict. Declines in residential real estate values securing these types of loans may increase the level of borrower defaults and losses above the recent charge-off experience on these loans. Net charge-offs of one- to four-family residential and home equity loans secured by residential properties during fiscal years 2015, 2014 and 2013 totaled $623,000, $918,000 and $804,000,

54
respectively, or 64.8%, 75.9% and 101.5% of total net charge-offs during these periods, respectively. Further, a significant amount of our home equity lines of credit consist of second mortgage loans. For those home equity lines secured by a second mortgage, it is unlikely that we will be successful in recovering all or a portion of our loan balances in the event of default unless we are prepared to repay the first mortgage loan and such repayment and the costs associated with a foreclosure are justified by the value of the property. For these reasons we may experience higher rates of delinquencies, default and losses on loans secured by junior liens.
Our non-owner-occupied residential real estate loans may expose us to increased credit risk.
At June 30, 2015, $27.0 million, or 5.5% of our total loan portfolio, was secured by non-owner-occupied residential properties consisting of one- to four-family and home equity loans. Loans secured by non-owner-occupied properties generally expose a lender to greater risk of nonpayment and loss than loans secured by owner-occupied properties because repayment of such loans depends primarily on the tenant’s continuing ability to pay rent to the property owner, who is our borrower, or, if the property owner is unable to find a tenant, the property owner’s ability to repay the loan without the benefit of a rental income stream. In addition, the physical condition of non-owner-occupied properties is often below that of owner-occupied properties due to lax property maintenance standards, which has a negative impact on the value of the collateral properties. Furthermore, some of our non-owner-occupied residential loan borrowers have more than one loan outstanding with us, which may expose us to a greater risk of loss compared to an adverse development with respect to an owner-occupied residential mortgage loan.
Repayment of our commercial business loans is often dependent on the cash flows of the borrower, which may be unpredictable, and the collateral securing these loans may fluctuate in value.
At June 30, 2015, we had $14.8 million, or 3.0% of total loans, in commercial business loans. Commercial business lending involves risks that are different from those associated with residential and commercial real estate lending. Real estate lending is generally considered to be collateral based lending with loan amounts based on predetermined loan to collateral values, with liquidation of the underlying real estate collateral being viewed as the primary source of repayment in the event of borrower default. Our commercial business loans are primarily made based on the cash flow of the borrower and secondarily on the underlying collateral provided by the borrower. The borrowers' cash flow may be unpredictable, and collateral securing these loans may fluctuate in value. Although commercial business loans are often collateralized by equipment, inventory, accounts receivable, or other business assets, the liquidation of collateral in the event of default is often an insufficient source of repayment because accounts receivable may be uncollectible and inventories may be obsolete or of limited use, among other things.
A portion of our loan portfolio is serviced by third parties, which may limit our ability to foreclose on such loans.
At June 30, 2015, $32.5 million of our one- to four-family and $2.3 million of our commercial real estate loan portfolios were serviced by third parties. When a loan goes into default, it is the responsibility of the third-party servicer to enforce the borrower’s obligation to repay the outstanding indebtedness. We are reliant on the servicer to bring the loan current, enter into a satisfactory loan modification or foreclose on the property on behalf of First Federal. We must comply with any loan modification entered into by the servicer even if we would not otherwise agree to the modified terms, which may result in a reduction in our interest income due to the loan modification. Delays in foreclosing on property, whether caused by restrictions under state or federal law or the failure of a third party servicer to timely pursue foreclosure action, can increase our potential loss on such property, due to factors such as lack of maintenance, unpaid property taxes and adverse changes in market conditions. These delays may adversely affect our ability to limit our credit losses.
Our lending limit may restrict our growth.
Washington law provides that Washington chartered savings banks, such as First Federal, are subject to the same loans to one borrower restrictions as Washington chartered commercial banks, which restricts total loans and extensions of credit by a bank to 20% of its unimpaired capital and surplus. As a result, under Washington law, First Federal would be limited to loans to one borrower of $27.4 million at June 30, 2015. First Federal, however, has elected to restrict its loans to one borrower to no more than 15% of its unimpaired capital plus surplus, which was $18.5 million at June 30, 2015, or $13.0 million, whichever is less, unless specifically approved by the board loan/asset quality committee as an exception to policy. Under this policy, at June 30, 2015, First Federal’s limit on loans to one borrower was $13.0 million. Subsequent to June 30, 2015, First Federal increased its loans to one borrower limit from $13.0 million to $15.0 million. This amount is significantly less than that of many of our competitors and

55
may discourage potential commercial borrowers who have credit needs in excess of our loan to one borrower lending limit from doing business with us. Our loan to one borrower restriction also impacts the efficiency of our commercial lending operation because it lowers our average loan size, which means we have to generate a higher number of transactions to achieve the same portfolio volume. We can accommodate larger loans by selling participations in those loans to other financial institutions, but this strategy is not most efficient or always available. We may not be able to attract or maintain clients seeking larger loans or may not be able to sell participations in these loans on terms we consider favorable.
Our allowance for loan losses may prove to be insufficient to absorb losses in our loan portfolio.
We make various assumptions and judgments about the collectability of our loan portfolio, including the creditworthiness of our borrowers and the value of the real estate and other assets serving as collateral for the repayment of many of our loans. In determining the amount of the allowance for loan losses, we review our loans and our loss and delinquency experience, and we evaluate economic conditions. If our assumptions are incorrect, our allowance for loan losses may not be sufficient to cover probable incurred losses in our loan portfolio, resulting in additions to our allowance for loan losses through the provision for losses on loans which is charged against income.
Additionally, pursuant to our growth strategy, as we increase the amount of our commercial real estate and expand the types of collateral that will securitize these loans, the unseasoned nature of these loans will increase the risk that our allowance may be insufficient to absorb losses without significant additional provisions. Material additions to our allowance could materially decrease our net income. In addition, bank regulatory agencies periodically review our allowance for loan losses and may require an increase in the provision for possible loan losses or the recognition of further loan charge-offs, based on judgments different than those of management. In addition, if charge-offs in future periods exceed the allowance for loan losses we will need additional provisions to replenish the allowance for loan losses. Any additional provisions will result in a decrease in net income and possibly capital, and may have a material adverse effect on our financial condition and results of operations.
If our nonperforming assets increase, our earnings will be adversely affected.
At June 30, 2015, our nonperforming assets, which consist of nonaccruing loans and real estate owned, were $6.8 million, or 0.7% of total assets. Our nonperforming assets adversely affect our net income in various ways:
• we record interest income on a cash basis only for nonaccrual loans and any nonperforming investment securities and we do not record interest income for real estate owned;
• we must provide for probable loan losses through a current period charge to the provision for loan losses;• noninterest expense increases when we write down the value of properties in our real estate owned portfolio
to reflect changing market values or recognize other-than-temporary impairment on nonperforming investment securities;
• there are legal fees associated with the resolution of problem assets, as well as carrying costs, such as taxes, insurance, and maintenance fees related to our real estate owned; and
• the resolution of nonperforming assets requires the active involvement of management, which can distract them from more profitable activity.
If additional borrowers become delinquent and do not pay their loans and we are unable to successfully manage our nonperforming assets, our losses and troubled assets could increase significantly, which could have a material adverse effect on our financial condition and results of operations.
Our securities portfolio may be negatively impacted by fluctuations in market value and interest rates.
Our securities portfolio may be impacted by fluctuations in market value, potentially reducing accumulated other comprehensive income and/or earnings, both of which could adversely affect the value of our equity. Fluctuations in market value may be caused by changes in market interest rates, lower market prices for securities, and limited investor demand. Our securities portfolio is evaluated for other-than-temporary impairment, and if this evaluation shows impairment to the actual or projected cash flows associated with one or more securities, a potential loss to earnings and/or a decline in other comprehensive income may occur. There can be no assurance that declines in market value will not result in other-than-temporary impairments of these assets, which would lead to accounting charges that could have a material adverse effect on our net income and capital levels.

56
If our real estate owned is not properly valued or declines further in value, our earnings could be reduced.
We obtain updated valuations in the form of appraisals and tax assessed values when a loan has been foreclosed and the property taken in as real estate owned and at certain other times during the asset’s holding period. Our net book value of the loan at the time of foreclosure and thereafter is compared to the updated market value of the foreclosed property less estimated selling costs (fair value). A charge-off is recorded for any excess in the asset’s net book value over its fair value. If our valuation process is incorrect, or if property values decline, the fair value of our real estate owned may not be sufficient to recover our carrying value in such assets, resulting in the need for additional charge-offs. In addition, bank regulators periodically review our real estate owned and may require us to recognize further charge-offs. Significant charge-offs to our real estate owned could have a material adverse effect on our financial condition and results of operations.
We are subject to interest rate risk.
Our earnings and cash flows are largely dependent upon our net interest income. Interest rates are highly sensitive to many factors that are beyond our control, including general economic conditions and policies of various governmental and regulatory agencies, particularly the Federal Reserve. Changes in monetary policy, including changes in interest rates, could influence not only the interest we receive on loans and investments and the amount of interest we pay on deposits and borrowings, but these changes could also affect (i) our ability to originate loans and obtain deposits, (ii) the fair value of our financial assets and liabilities and (iii) the average duration of our mortgage-backed securities portfolio and other interest-earning assets. If the interest rates paid on deposits and other borrowings increase at a faster rate than the interest rates received on loans and other investments, our net interest income, and therefore earnings, could be adversely affected. Earnings could also be adversely affected if the interest rates received on loans and other investments fall more quickly than the interest rates paid on deposits and other borrowings.
Although management believes it has implemented effective asset and liability management strategies to reduce the potential effects of changes in interest rates on our results of operations, any substantial, unexpected or prolonged change in market interest rates could have a material adverse effect on our financial condition and results of operations. Also, our interest rate risk modeling techniques and assumptions likely may not fully predict or capture the impact of actual interest rate changes on our balance sheet. See Item 7., “Management’s Discussion and Analysis of Financial Condition and Results of Operations – Asset and Liability Management and Market Risk,” of this Form 10-K.
Decreased volumes and lower gains on sales of mortgage loans sold could adversely impact our noninterest income.
We originate and sell one- to four-family mortgage loans. Our mortgage banking income is a significant portion of our noninterest income. We generate gains on the sale of one- to four-family mortgage loans pursuant to programs currently offered by Freddie Mac and other secondary market purchasers. Any future changes in their purchase programs, our eligibility to participate in such programs, the criteria for loans to be accepted or laws that significantly affect the activity of such entities could, in turn, materially adversely affect our results of operations. Further, in a rising or higher interest rate environment, our originations of mortgage loans may decrease, resulting in fewer loans that are available to be sold to investors. This would result in a decrease in mortgage banking revenues and a corresponding decrease in noninterest income. In addition, our results of operations are affected by the amount of noninterest expense associated with mortgage banking activities, such as salaries and employee benefits, occupancy, equipment and data processing expense and other operating costs. During periods of reduced loan demand, our results of operations may be adversely affected to the extent that we are unable to reduce expenses commensurate with the decline in loan originations.
If we are unable to effectively integrate new personnel hired to carry out our business plan our business may be adversely affected.
We have recently hired a number of experienced bankers, and we expect to hire additional personnel in order to successfully implement our business plan. The difficulties in hiring and training new personnel include integrating personnel with different business backgrounds and combining different corporate cultures, while retaining other key employees. The process of integrating personnel could cause an interruption of, or loss of momentum in, our operations and the loss of customers and key personnel. In addition, we may not realize expected revenue increases and other projected benefits from the increased emphasis in these areas. Any delays or difficulties
57
encountered in connection with integrating and growing this portion of our operations could have an adverse effect on our business and results of operations or otherwise adversely affect our ability to achieve anticipated results.
Our consideration of whole bank or branch acquisitions may expose us to financial, execution and operational risks that could adversely affect us.
We plan to evaluate supplementing organic growth by acquiring other financial institutions or their businesses that we believe will help us fulfill our strategic objectives and enhance our earnings. There are risks associated with this strategy, however, including the following:
• We may be exposed to potential asset quality issues or unknown or contingent liabilities of the financial institutions, businesses, assets and liabilities we acquire. If these issues or liabilities exceed our estimates, our results of operations and financial condition may be materially negatively affected;
• Our growth initiatives may require us to recruit experienced personnel to assist in such initiatives, which will increase our compensation costs. The failure to identify, hire and retain such personnel would place significant limitations on our ability to execute our growth strategy;
• Our strategic efforts may divert resources or management’s attention from ongoing business operations and may subject us to additional regulatory scrutiny;
• The acquisition of other entities generally requires integration of systems, procedures and personnel of the acquired entity into our company to make the transaction economically successful. This integration process is complicated and time consuming and can also be disruptive to the customers of the acquired business. If the integration process is not conducted successfully and with minimal effect on the acquired business and its customers, we may not realize the anticipated economic benefits of particular acquisitions within the expected time frame, and we may lose customers or employees of the acquired business. We may also experience greater than anticipated customer losses even if the integration process is successful;
• To finance a future acquisition, we may borrow funds, thereby increasing our leverage and diminishing our liquidity, or raise additional capital, which could dilute the interests of our existing shareholders; and
• We expect our income will increase following our acquisitions; however, we also expect our general and administrative expenses to increase.
We operate in a highly competitive industry.
We face substantial competition in all areas of our operations from a variety of different competitors, many of which are larger and may have more financial resources. These competitors primarily include national, regional and internet banks within the various markets in which we operate. We also face competition from many other types of financial institutions, including savings and loans, credit unions, mortgage banking finance companies, brokerage firms, insurance companies and other financial intermediaries. The financial services industry could become even more competitive as a result of legislative, regulatory and technological changes and continued consolidation. Also, technology has lowered barriers to entry and made it possible for nonbanks to offer products and services traditionally provided by banks, such as automatic transfer and automatic payment systems. Competitors in these nonbank sectors may have fewer regulatory constraints and may have lower cost structures. Additionally, due to their size, many competitors may be able to achieve economies of scale and, as a result, may offer a broader range of products and services as well as better pricing for those products and services than we can.
Failure to perform in any of these areas could significantly weaken our competitive position, which could adversely affect our growth and profitability and result in a material adverse effect on our financial condition and results of operations.
We participate in a multiple employer defined benefit pension plan for the benefit of our employees. If we were to withdraw from this plan, or if the plan sponsor requires us to make additional contributions, we could incur a substantial expense which would negatively impact our earnings.
We participate in the Pentegra Defined Benefit Plan for Financial Institutions, a multiple employer pension plan for the benefit of our employees. Effective February 1, 2006, we did not allow additional employees to participate in this plan. On January 31, 2010, we froze the future accrual of benefits under this plan with respect to participating employees. In connection with our decision to freeze our benefit accruals under the plan, and since then, we continue to evaluate costs associated with withdrawing from the plan. Based upon the value of the plan’s assets, if we had chosen to withdraw from the plan as of June 30, 2015, we would have incurred an additional expense of up to approximately $8.6 million.

58
The actual expense that would be incurred in connection with a withdrawal from the plan is primarily dependent upon the timing of the withdrawal, the total value of the plan’s assets at the time of withdrawal, general market interest rates at that time, expenses imposed on withdrawal, and other conditions imposed by Pentegra as set forth in the plan. If we choose to withdraw from the plan in the future, we could incur a substantial expense in connection with the withdrawal.
Even if we do not withdraw from the plan, Pentegra, as sponsor of the plan, may request that we make additional contributions to the plan in excess of the contributions that we are regularly required to make, or obtain a letter of credit in favor of the plan, if our financial condition declines to the point that it triggers certain criteria contained in the plan. If we fail to make the contribution or obtain the requested letter of credit, then we may be forced to withdraw from the plan and establish a separate, single employer defined benefit plan that we anticipate would be underfunded to a similar extent as under the multiple employer plan.
Non-compliance with the USA PATRIOT Act, Bank Secrecy Act, or other laws and regulations could result in fines or sanctions and limit our ability to get regulatory approval of acquisitions and new branches.
The USA PATRIOT and Bank Secrecy Acts require financial institutions to develop programs to prevent financial institutions from being used for money laundering and terrorist activities. If such activities are detected, financial institutions are obligated to file suspicious activity reports with the U.S. Treasury’s Office of Financial Crimes Enforcement Network. These rules require financial institutions to establish procedures for identifying and verifying the identity of customers seeking to open new financial accounts. Failure to comply with these regulations could result in fines or sanctions and limit our ability to get regulatory approval of acquisitions and new branch locations. Recently, several banking institutions have received large fines for non-compliance with these laws and regulations. While we have developed policies and procedures designed to assist in compliance with these laws and regulations, no assurance can be given that these policies and procedures will be effective in preventing violations of these laws and regulations.
We operate in a highly regulated environment and may be adversely affected by changes in laws and regulations.
We are subject to extensive examination, supervision and comprehensive regulation by the FDIC as insurer of our deposits, and by the DFI. As a bank holding company, First Northwest Bancorp is subject to examination and supervision by the Federal Reserve. Such regulation and supervision will govern the activities in which we may engage, primarily for the protection of depositors and the Deposit Insurance Fund. These regulatory authorities have extensive discretion in connection with their supervisory and enforcement activities, including the ability to impose restrictions on an institution’s operations, require additional capital, reclassify assets, determine the adequacy of an institution’s allowance for loan losses and determine the level of deposit insurance premiums assessed. Any change in such regulation and oversight, whether in the form of regulatory policy, regulations, or legislation, could have a material impact on us and our operations. Because our business is highly regulated, the laws, rules and applicable regulations are subject to regular modification and change. Laws, rules and regulations may be adopted in the future that could make compliance more difficult or expensive or otherwise adversely affect our business, financial condition or prospects.
We are subject to certain risks in connection with our use of technology.
We rely heavily on in-house and third-party service providers for communications, information, operating and financial control systems technology, including our internet banking services and data processing systems. Any failure or interruption of these services or systems or breaches in security of these systems could result in failures or interruptions in our customer relationship management, general ledger, deposit, loan servicing and/or loan origination systems. The occurrence of any failures or interruptions may require us to identify alternative sources of such services, and we cannot assure you that we could negotiate terms that are as favorable to us, or could obtain services with similar functionality as found in our existing systems without the need to expend substantial resources, or even be able to find comparable services at all that would meet our business needs.
While we have taken steps to adequately secure our computer systems, software, and networks, and assure our vendors have adequate security over technology-based systems we outsource from them, those security measures may not be sufficient to mitigate the risk of a cyber attack, and therefore we may be vulnerable to breaches, unauthorized access, misuse, computer viruses, or other malicious code. A security breach could lead to the disclosure of confidential bank or customer information contained within our or our vendor's computer systems

59
and networks and/or cause a significant disruption of service, which could subject us to litigation, financial losses, and reputational damage.
Our business may be adversely affected by an increasing prevalence of fraud and other financial crimes.
Our loans to businesses and individuals and our deposit relationships and related transactions are subject to exposure to the risk of loss due to fraud and other financial crimes. Nationally, reported incidents of fraud and other financial crimes have increased, and while we have policies and procedures designed to prevent such losses, there can be no assurance that we will not incur such losses.
Item 1B. Unresolved Staff Comments
None.
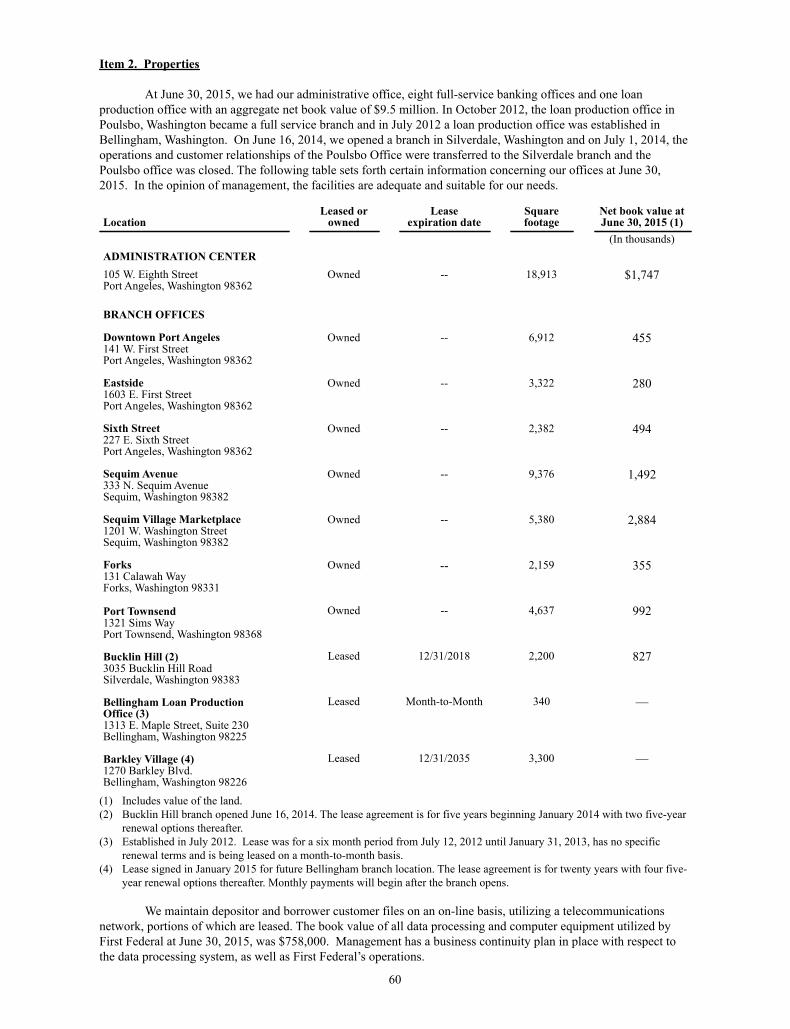
60
Item 2. Properties
At June 30, 2015, we had our administrative office, eight full-service banking offices and one loan production office with an aggregate net book value of $9.5 million. In October 2012, the loan production office in Poulsbo, Washington became a full service branch and in July 2012 a loan production office was established in Bellingham, Washington. On June 16, 2014, we opened a branch in Silverdale, Washington and on July 1, 2014, the operations and customer relationships of the Poulsbo Office were transferred to the Silverdale branch and the Poulsbo office was closed. The following table sets forth certain information concerning our offices at June 30, 2015. In the opinion of management, the facilities are adequate and suitable for our needs.
LocationLeased or
ownedLease
expiration dateSquarefootage
Net book value atJune 30, 2015 (1)
(In thousands)ADMINISTRATION CENTER105 W. Eighth Street Port Angeles, Washington 98362
Owned -- 18,913 $1,747
BRANCH OFFICES
Downtown Port Angeles 141 W. First Street Port Angeles, Washington 98362
Owned -- 6,912 455
Eastside 1603 E. First Street Port Angeles, Washington 98362
Owned -- 3,322 280
Sixth Street 227 E. Sixth Street Port Angeles, Washington 98362
Owned -- 2,382 494
Sequim Avenue 333 N. Sequim Avenue Sequim, Washington 98382
Owned -- 9,376 1,492
Sequim Village Marketplace 1201 W. Washington Street Sequim, Washington 98382
Owned -- 5,380 2,884
Forks131 Calawah WayForks, Washington 98331
Owned -- 2,159 355
Port Townsend 1321 Sims WayPort Townsend, Washington 98368
Owned -- 4,637 992
Bucklin Hill (2)3035 Bucklin Hill RoadSilverdale, Washington 98383
Leased 12/31/2018 2,200 827
Bellingham Loan Production Office (3)1313 E. Maple Street, Suite 230Bellingham, Washington 98225
Leased Month-to-Month 340 —
Barkley Village (4)1270 Barkley Blvd.Bellingham, Washington 98226
Leased 12/31/2035 3,300 —
(1) Includes value of the land.(2) Bucklin Hill branch opened June 16, 2014. The lease agreement is for five years beginning January 2014 with two five-year
renewal options thereafter.(3) Established in July 2012. Lease was for a six month period from July 12, 2012 until January 31, 2013, has no specific
renewal terms and is being leased on a month-to-month basis. (4) Lease signed in January 2015 for future Bellingham branch location. The lease agreement is for twenty years with four five-
year renewal options thereafter. Monthly payments will begin after the branch opens.
We maintain depositor and borrower customer files on an on-line basis, utilizing a telecommunications network, portions of which are leased. The book value of all data processing and computer equipment utilized by First Federal at June 30, 2015, was $758,000. Management has a business continuity plan in place with respect to the data processing system, as well as First Federal’s operations.

61
Item 3. Legal Proceedings
The Company or First Federal from time to time is involved in various claims and legal actions arising in the ordinary course of business. There are currently no matters that, in the opinion of management, would have material adverse effect on our consolidated financial position, results of operation, or liquidity.
Item 4. Mine Safety Disclosures
Not applicable
PART II
Item 5. Market for Registrant’s Common Equity, Related Stockholder Matters and Issuer Purchases of Equity Securities
Market, Holder and Dividend Information. Our common stock is listed on The Nasdaq Stock Market LLC’s Global Market, under the symbol “FNWB.” The common stock was issued at a price of $10.00 per share on January 29, 2015, and the Company's common stock commenced trading on The Nasdaq Global Market on January 30, 2015. As of the close of business on September 15, 2015, there were 13,100,360 shares of common stock issued and outstanding and we had approximately 853 shareholders of record, excluding persons or entities who hold stock in nominee or “street name” accounts with brokers.
The following table sets forth the high and low sales prices of the Company's common stock, provided by the Nasdaq Stock Market, for each quarter during the year ended June 30, 2015, in which the common stock was outstanding. The Company has not paid any dividends to shareholders since its formation.
Year Ended June 30, 2015 High LowThird Quarter $ 12.65 $ 11.75Fourth Quarter 12.54 11.85
Under Washington law, the Company is prohibited from paying a dividend if, as a result of its payment, the Company would be unable to pay its debts as they become due in the normal course of business, or if the Company's total liabilities would exceed its total assets. The principal source of funds for the Company is dividend payments from the Bank. According to Washington law, First Federal may not declare or pay a cash dividend on its capital stock if it would cause its net worth to be reduced below (1) the amount required for liquidation accounts or (2) the net worth requirements, if any, imposed by the Director of the DFI. Dividends on First Federal's capital stock may not be paid in an aggregate amount greater than the aggregate retained earnings of First Federal, without the approval of the Director of the DFI. See Item 1, “Business-How We Are Regulated,” for more information regarding the restrictions on the Company’s and the Bank’s abilities to pay dividends.
Use of Proceeds. First Northwest Bancorp filed a Registration Statement on Form S-1 with the Securities
and Exchange Commission in connection with the conversion of the Bank and the related offering of common stock by First Northwest Bancorp. The Registration Statement (File No. 333-185101) was declared effective by the Securities and Exchange Commission on November 12, 2014. First Northwest Bancorp registered 13,100,360 shares of common stock, par value $0.01 per share, pursuant to the Registration Statement for an aggregate price of $131,003,600. The stock offering commenced on November 19, 2014. Sandler O’Neill + Partners, L.P. acted as marketing agent for the offering. The issuance of 13,100,360 shares was completed on January 29, 2015 with the sale of 12,167,000 shares of common stock and First Northwest Bancorp contributing 933,360 shares of common stock to the First Federal Community Foundation (“Foundation”), the charitable foundation established by First Federal in connection with the offering.
The expenses paid or incurred in connection with the stock offering were $4.1 million, including expenses paid to the marketing agent of $1.4 million, and other expenses of?$2.7 million. The net proceeds resulting from the offering after deducting all expenses related to the offering were approximately $117.6 million. First Northwest Bancorp contributed approximately $58.4 million of the net proceeds of the offering to First Federal and $400,000 to the Foundation. In addition, as of June 30, 2015, approximately $11.8 million of the net proceeds were used to fund the loan to the employee stock ownership plan. First Northwest Bancorp intends to purchase an additional 95,230

62
shares for the employee stock ownership plan from the net proceeds retained with the balance invested in securities and cash and cash equivalents. There has been no material change in the planned use of proceeds from our offering as described in our final prospectus filed with the SEC on November 25, 2014 pursuant to Rule 424(b) under the Securities Exchange Act of 1934, as amended.
Stock Repurchases. The Company is subject to certain regulatory restrictions on its ability to repurchase its common stock. The Company had no stock repurchases of its outstanding common stock during the fourth quarter of the year ended June 30, 2015.
Equity Compensation Plan Information. The equity compensation plan information presented under subparagraph (d) in Part III, Item 12 of this report is incorporated herein by reference.
Performance Graph. Our shares of common stock began trading on the Nasdaq Stock Market LLC's Global Market on January 30, 2015. Accordingly, no comparative stock performance information is available for periods ending prior to this date. The following performance graph compares the Company's cumulative total shareholder return on the Company’s Common Stock since the inception of trading on January 30, 2015 with the cumulative total return on the NASDAQ Composite Index and a peer group of the SNL All Thrift Index for all periods indicated. Total return assumes the reinvestment of all dividends and that the value of Common Stock and each index was $100 on January 30, 2015. Historical stock price performance is not necessarily indicative of future stock price performance.
Period EndedIndex 1/30/2015 2/28/2015 3/31/2015 4/30/2015 5/31/2015 6/30/2015First Northwest Bancorp $ 100.00 $ 102.79 $ 102.46 $ 99.43 $ 100.99 $ 102.38NASDAQ Composite 100.00 107.25 106.00 106.91 109.86 108.15SNL Thrift Index 100.00 105.01 107.66 107.34 109.75 115.02

63
Item 6. Selected Financial Data
The following table sets forth certain information concerning our consolidated financial position and results of operations at and for the dates indicated and have been derived from our audited consolidated financial statements. The information below is qualified in its entirety by the detailed information included elsewhere herein and should be read along with Item 7., “Management's Discussion and Analysis of Financial Condition and Results of Operations” and Item 8., “Financial Statements and Supplementary Data” included in this Form 10-K.
June 30,2015 2014 2013 2012 2011
Selected Financial Condition Data: (In thousands)Total assets $ 936,802 $ 795,292 $ 784,510 $ 771,864 $ 748,851Cash and cash equivalents 45,030 18,960 22,948 42,475 35,751Loans receivable, net(1) 487,887 496,184 449,353 400,659 424,187Investment securities available-for-sale 299,040 178,972 214,789 218,163 198,917Investment securities held to maturity 61,524 53,244 49,579 57,385 37,081Real estate owned and repossessed assets 1,914 810 2,265 2,864 4,475Deposits 647,164 600,399 595,044 583,238 562,398Borrowings 90,033 105,133 100,033 100,033 100,033Total equity 190,681 80,995 78,623 77,300 77,220
Year Ended June 30,2015 2014 2013 2012 2011
Selected Operations Data: (In thousands)
Total interest income $ 27,487 $ 26,559 $ 25,795 $ 26,942 $ 29,416Total interest expense 4,592 4,729 6,000 7,140 8,258 Net interest income 22,895 21,830 19,795 19,802 21,158Provision for loan losses — 1,307 1,376 7970 926Net interest income after provision for loan losses 22,895 20,523 18,419 11,832 20,232Net gain on sale of loans 548 762 1,563 1,503 1,472Net gain on sale of investment securities — 112 70 293 40Impairment losses on investment securities, net — — — (419) (829)Other noninterest income 4,159 4,116 3,934 4,022 3,940 Total noninterest income 4,707 4,990 5,567 5,399 4,623Total noninterest expense 33,046 22,105 21,246 20,991 19,765Income (loss) before provision (benefit) for income taxes (5,444) 3,408 2,740 (3,760) 5,090Provision (benefit) for income taxes (354) 740 422 (1,800) 1,195 Net income (loss) $ (5,090) $ 2,668 $ 2,318 $ (1,960) $ 3,895
_____________(1) Net of allowances for loan losses, loans in process, purchase discounts and deferred loan fees.

64
At or For the Year Ended June 30,2015 2014 2013 2012 2011
(Dollars in thousands)Selected Financial Ratios and Other Data:Performance ratios:Return (loss) on assets (0.58)% 0.34 % 0.30 % (0.26)% 0.52 %Return (loss) on equity (3.92) 3.33 2.94 (2.52) 5.17Average interest rate spread 2.60 2.78 2.54 2.67 2.88Net interest margin(1) 2.75 2.89 2.67 2.79 3.02Efficiency ratio(2) 119.7 82.4 83.8 83.3 76.7Average interest-earning assets to average interest-bearing liabilities 127.0 118.3 116.5 112.2 111.5
Asset quality ratios: Nonperforming assets to total assets at end of period(3) 0.7 % 0.9 % 1.5 % 1.7 % 2.2 % Nonperforming loans to total gross loans(4) 1.0 1.2 2.2 2.5 2.8 Allowance for loan losses to nonperforming loans(4) 145.6 135.3 80.8 72.8 39.4 Allowance for loan losses to gross loans receivable 1.4 1.6 1.7 1.8 1.1 Net charge-offs to average outstanding loans 0.2 0.3 0.2 1.3 0.6
Capital ratios: Equity to total assets at end of period 20.4 % 10.2 % 10.0 % 10.0 % 10.3 % Average equity to average assets 14.9 10.1 10.1 10.2 10.0
Other data: Number of full service offices (5) 9 10 9 8 8 Full-time equivalent employees 157 169 161 152 149
__________(1) Net interest income divided by average interest-earning assets.(2) Total noninterest expense as a percentage of net interest income and total other noninterest income.(3) Nonperforming assets consists of nonperforming loans (which include nonaccruing loans and accruing loans more than
90 days past due), foreclosed real estate and repossessed assets.(4) Nonperforming loans consists of nonaccruing loans and accruing loans more than 90 days past due.(5) Effective July 1, 2015, our branch in Poulsbo was closed and all accounts were moved to the new location in Silverdale.
Item 7: Management’s Discussion and Analysis of Financial Condition and Results of Operations
GeneralFirst Northwest Bancorp (or the "Company") is a bank holding company which primarily engages in the
business activity of its subsidiary, First Federal Savings and Loan Association of Port Angeles ("First Federal" or the "Bank"). First Federal is a community-oriented financial institution primarily serving the North Olympic Peninsula region of Washington through our nine full-service banking offices. We offer a wide range of products and services focused on the lending and depository needs of the communities we serve. Historically, lending activities have been primarily directed toward the origination of first lien one- to four-family mortgage loans, and, to a lesser extent, commercial and multi-family real estate loans, construction and land loans (including lot loans), commercial business loans, and consumer loans, consisting primarily of home equity loans and lines of credit. During the past decade, recognizing our need to adapt to changing market conditions, we have revised our operating strategy to diversify our loan portfolio, expand our deposit product offerings and enhance our infrastructure. We have increased the origination of commercial real estate and multi-family real estate loans, and decreased reliance on originating and retaining longer-term, fixed-rate, residential mortgage loans. Since 2010, we have generally sold most newly originated and refinanced, conforming single-family owner-occupied mortgage loans into the secondary market, although in 2012, we began selectively retaining 30-year fixed-rate mortgages in the portfolio in an effort to enhance our net interest income. We have historically offered traditional consumer and business deposit products, including transaction accounts, savings and money market accounts and certificates of deposit for individuals, businesses and nonprofit organizations. Deposits are our primary source of funds for our lending and investing activities.

65
As part of our planned expansion into new markets, we have secured a lease agreement for a full-service branch located in Bellingham, Washington, which has been approved by the Federal Deposit Insurance Corporation ("FDIC") and Department of Financial Institutions of Washington ("DFI"). The lease term will be for approximately 20 years with rent payments beginning at $7,500 per month at the time of branch opening, which is estimated to be during the quarter-ending December 31, 2015. The proposed new branch will offer similar deposit, lending, and investment products and services and will utilize technology in the form of interactive teller machines similar to the Silverdale, Washington full-service branch location we opened in June 2014.
On January 29, 2015, the Bank completed its mutual-to-stock conversion and became a wholly owned subsidiary of the Company. The Company raised approximately $117.6 million in net proceeds from the sale of 12,167,000 common shares in its initial public offering. From the proceeds the Company made a capital contribution of approximately $58.4 million to the Bank. The Company's stock trades on the NASDAQ under the ticker symbol "FNWB."
Common shares available in the initial stock offering were oversubscribed by eligible depositors in the first priority. As a result, the Employee Stock Ownership Plan ("ESOP"), being in the second priority eligible to purchase stock in the initial stock offering, is filling its order of 8% of the common stock, or 1,048,029 shares, in the open market. As of June 30, 2015, the ESOP had purchased 952,799, or 90.9%, of the total shares to be purchased at an average net price per share of $12.38.
First Federal is significantly affected by prevailing economic conditions as well as government policies and regulations concerning, among other things, monetary and fiscal affairs, housing and financial institutions. Deposit flows are influenced by a number of factors, including interest rates paid on competing time deposits, available alternative investments, account maturities, and the overall level of personal income and savings. Lending activities are influenced by the demand for funds, the number and quality of lenders, and regional economic cycles.
Our primary source of pre-tax income is net interest income. Net interest income is the difference between interest income, which is the income that we earn on our loans and investments, and interest expense, which is the interest that we pay on our deposits and borrowings. Changes in levels of interest rates affect our net interest income. A secondary source of income is noninterest income, which includes revenue we receive from providing products and services, including service charges on deposit accounts, mortgage banking income, earnings from bank-owned life insurance, and gains and losses from sales of securities.
An offset to net interest income is the provision for loan losses, which represents the periodic charge to operations which is required to adequately provide for probable losses inherent in our loan portfolio. As a loan's risk rating improves, property values increase, or recoveries of amounts previously charged off are received, a recapture of previously recognized provision for loan losses may be added to net interest income.
The noninterest expenses we incur in operating our business consist of salaries and employee benefits and expenses, occupancy and equipment expenses, federal deposit insurance premiums and regulatory assessments, data processing expenses, expenses related to real estate and personal property owned and other miscellaneous expenses.
Salaries and employee benefits consist primarily of salaries and wages paid to our employees, payroll taxes, expenses for health insurance, retirement plans and other employee benefits, including employee compensation expenses stemming from recognition of expense related to the ESOP and the adoption of new equity benefit plans. We cannot determine the actual amount of these new stock-related compensation and benefit expenses at this time because applicable accounting practices require that they be based on the fair market value of the shares of common stock at specific points in the future.
Our contribution of $400,000 in cash and $9.3 million in common stock to the First Federal Community Foundation ("Foundation") established in connection with our conversion resulted in a pre-tax, noninterest expense charge of $9.7 million and primarily caused our $5.1 million net loss during the year ended June 30, 2015. The contribution to the Foundation, on a net-tax basis, was $8.3 million.
Our Business and Operating Strategy
Throughout most of our over 90-year history, we have operated as a traditional savings and loan association, attracting deposits and investing those funds primarily in residential mortgage loans and investment securities. During the past decade, recognizing our need to adapt to changing market conditions, we revised our operating strategy to diversify our loan portfolio, expand our deposit product offerings and enhance our infrastructure. Certain highlights of our operations in recent years are as follows:

66
• Repositioning the loan portfolio. We have significantly increased the origination of commercial real estate and multi-family real estate loans, and decreased reliance on originating and retaining longer-term, fixed-rate, owner-occupied residential mortgage loans. This has been done to reduce our exposure to interest rate risk, increase the yield on our loan portfolio and shorten the maturity of the loan portfolio. In addition, given current market conditions, we are not presently emphasizing land and land development loans or construction loans.Reorganized and strengthened the senior management team. During the past five years, we have experienced significant management turnover. This has resulted in a change in our senior management team, through promotions as well as external hires. During 2013 we promoted Laurence J. Hueth from executive vice president, chief financial officer, and chief operating officer to president and chief executive officer, Regina M. Wood was promoted from vice president and controller to executive vice president and chief financial officer and Kelly A. Liske was promoted from vice president and commercial relationship manager to executive vice president and chief banking officer. Mr. Hueth, Ms. Wood, and Ms. Liske have collectively been with First Federal for 18 years and collectively possess over 50 years industry experience. Christopher A. Donohue was hired as executive vice president and chief credit officer with over 30 years industry experience outside of the state of Washington. Jeffrey S. Davis was hired during fiscal 2015 and currently holds the position of Executive Vice President and Chief Operations Officer with over 25 years industry experience. The senior management team consists of nine individuals, and these individuals are primarily responsible for the design and implementation of our business plan.Selling residential mortgage loans into the secondary market. Since 2009, we have generally sold most newly originated and refinanced, conforming single-family owner-occupied mortgage loans into the secondary market on a servicing retained or servicing released basis. This strategy has helped to reduce our exposure to interest rate risk and increase our noninterest income. After reducing the retention of one- to four-family residential loans, in 2012 we began selectively adding non-conforming 30-year fixed-rate mortgages to the portfolio in an effort to meet increasing consumer demand as well as to enhance our net interest income.
• Adding new deposit capabilities. Historically, we have offered traditional consumer and business deposit products. Over the past several years, we have added remote deposit capture, consumer and business on-line banking and consumer mobile banking capabilities. At our new Kitsap County branch location, we implemented interactive tellers machines, allowing our customers to conduct business with a teller through the video monitor. The board and management remain committed to maintaining competitive deposit products and services.
• Enhancing our infrastructure. Over the past several years, we have focused on upgrading our infrastructure, both in terms of equipment and personnel, in order to support our changing lending and deposit capabilities and position ourselves for growth.
Our objective is to develop First Federal into an independent high performing bank focused on meeting the needs of individuals, small businesses and community organizations in the Puget Sound region through exceptional service and competitive products. After the conversion and offering, we intend to implement these strategies to achieve our objective:
• Increasing our portfolio of higher yielding commercial loans. Through increased loan originations and purchases, we intend to increase our loan to deposit ratio and the percentage of our loan portfolio consisting of higher-yielding commercial real estate and commercial business loans. These loan categories offer higher risk-adjusted returns, shorter maturities and more sensitivity to interest rate fluctuations than traditional fixed-rate, one- to four-family residential loans. Our commercial real estate, commercial business and multi-family real estate loans have increased from $99.8 million, or 23.2% of total loans, at June 30, 2011, to $173.5 million, or 35.1% of total loans, at June 30, 2015. The increase resulted in part from developing relationships with new loan referral sources, including our board of directors and loan brokers, pursuing loan purchase and participation opportunities, competing successfully in new and existing markets, and benefiting from the improvement of the economy in northwestern Washington.
• Maintaining our focus on asset quality. We believe that strong asset quality is a key to our long-term financial success. We are focused on monitoring existing performing loans, resolving nonperforming loans and selling foreclosed assets. Nonperforming assets have decreased from $16.5 million at June 30, 2011, to $6.8 million at June 30, 2015. The level of our nonperforming assets has been reduced through write-downs, collections, modifications and sales of real estate owned and repossessed assets. We have taken proactive steps to resolve our nonperforming loans, including negotiating repayment plans, forbearances, loan modifications and loan extensions with our borrowers when appropriate. We have also accepted short payoffs on delinquent loans, particularly when such payoffs result in a smaller loss to us than foreclosure. We also retain the services of independent firms to periodically review segments of our loan portfolio and

67
provide comments regarding our loan policies and procedures. Given current market conditions, we are not presently emphasizing land and land development loans or construction loans. Our exposure to these categories of loans has declined to $19.1 million at June 30, 2015 compared to $23.6 million at June 30, 2011.
• Attracting core deposits and other deposit products. Our strategy is to emphasize relationship banking with our customers to obtain a greater share of their deposits, with specific emphasis on their core transaction accounts. We believe this emphasis will help to increase our level of core deposits and locally-based retail certificates of deposit. In addition to our retail branches, we maintain state-of-the-art technology-based products, such as on-line personal financial management, business online banking, business remote deposit products, mobile remote deposit services through smartphones and tablets, account-to-account transfer services between First Federal and other banks, and person to person funds transfer through smartphones and tablets that enable us to compete effectively with banks of all sizes. We recently enhanced our integrated mobile banking platform by introducing applications for both smartphones and tablets and we have begun implementing a new branching structure that includes extended banking hours through the use of interactive teller machines.
• Expanding our market presence and capturing business opportunities resulting from changes in the competitive environment. By delivering high quality, customer-focused products and services, we believe we can attract additional borrowers and depositors and thus increase our market share and revenue generation in our primary market area. As the local economy continues to recover and loan demand strengthens, we also believe that opportunities will exist in the Puget Sound region to expand our franchise. We are planning up to four new branch openings in the contiguous counties in the Puget Sound region during the next three years. We also expect that community bank consolidation will continue to take place and we may consider acquiring individual branches or other banks. We do not, however, currently have any understandings or agreements regarding any specific acquisitions and will be disciplined when evaluating and deciding on future acquisitions, recognizing that there may also be opportunity for increasing our market share as a result of customer dissatisfaction from other transactions or changes in strategy of market competitors. Our primary focus for expansion will be in the Northwest Washington markets we know and understand, although we may consider opportunities that arise in other parts of Western Washington.
• Hiring experienced employees with a customer sales and service focus. Our goal is to compete by relying on the strength of our customer service and relationship building. We believe that our ability to continue to attract and retain banking professionals who have a significant knowledge of existing and new market areas, possess strong business banking sales and service skills, and maintain a focus on community relationships will enhance our success. We intend to hire additional lenders and business development officers who are established in their communities to enhance our market position and add profitable growth opportunities.
Critical Accounting Policies
We have certain accounting policies that are important to the assessment of our financial condition, since they require management to make difficult, complex or subjective judgments, some of which may relate to matters that are inherently uncertain. Estimates associated with these policies are susceptible to material changes as a result of changes in facts and circumstances. Facts and circumstances which could affect these judgments include, but are not limited to, changes in interest rates, changes in the performance of the economy and changes in the financial condition of borrowers. Our accounting policies are discussed in detail in Note 1 of the Notes to Consolidated Financial Statements included in "Item 8. Financial Statements and Supplementary Data."
The following represent our critical accounting policies:
Allowance for Loan Losses. The allowance for loan losses is the amount estimated by management as necessary to cover losses inherent in the loan portfolio as of balance sheet date. The allowance is established through the provision for loan losses, which is charged to income. Determining the amount of the allowance for loan losses necessarily involves a high degree of judgment. Among the material estimates required to establish the allowance are: the likelihood of default; the loss exposure at default; the amount and timing of future cash flows on impaired loans; the value of collateral; and the determination of loss factors to be applied to the various elements of the portfolio. All of these estimates are susceptible to significant change. Management reviews, and the board of directors approves, at least quarterly, the level of the allowance and the provision for loan losses based on past loss experience, current economic conditions and other factors related to the collectability of the loan portfolio. Although we believe that we use the best information available to establish the allowance for loan losses, future adjustments to the allowance may be necessary if economic or other conditions differ substantially from the assumptions used in making the evaluation. In addition, the FDIC and the DFI, as an integral part

68
of their examination process, periodically review our allowance for loan losses and may require us to recognize adjustments to the allowance based on their judgment about information available at the time of their examination. A large loss could deplete the allowance and require increased provisions for loan losses to replenish the allowance, which would adversely affect earnings. See Note 3 of the Notes to Consolidated Financial Statements contained in "Item 8. Financial Statements and Supplementary Data."
Mortgage Servicing Rights. We record mortgage servicing rights on loans originated and subsequently sold into the secondary market. We stratify our capitalized mortgage servicing rights based on the type, term and interest rates of the underlying loans. Mortgage servicing rights are initially recognized at fair value. The value is determined through a discounted cash flow analysis, which uses interest rates, prepayment speeds and delinquency rate assumptions as inputs. All of these assumptions require a significant degree of management judgment. If our assumptions prove to be incorrect, the value of our mortgage servicing rights could be negatively affected. See Notes 1 and 6 to the Notes to Consolidated Financial Statements included in "Item 8. Financial Statements and Supplementary Data."
Income Taxes. Management makes estimates and judgments to calculate certain tax liabilities and to determine the recoverability of certain deferred tax assets, which arise from temporary differences between the tax and financial statement recognition of revenues and expenses. We also estimate a valuation allowance for deferred tax assets if, based on the available evidence, it is more likely than not that some portion or all of the recorded deferred tax assets will not be realized in future periods. These estimates and judgments are inherently subjective. In evaluating the recoverability of deferred tax assets, management considers all available positive and negative evidence, including past operating results, recent cumulative losses - both capital and operating - and the forecast of future taxable income, both capital gains and operating. In determining future taxable income, management makes assumptions for the amount of taxable income, the reversal of temporary differences and the implementation of feasible and prudent tax planning strategies. These assumptions require judgments about future taxable income and are consistent with the plans and estimates to manage our business. Any reduction in estimated future taxable income may require us to record a valuation allowance against deferred tax assets. An increase in the valuation allowance would result in additional income tax expense in the period and could have a significant impact on future earnings.
Real Estate Owned and Repossessed Assets. Real estate owned and repossessed assets include real estate and personal property acquired through foreclosure or repossession, and may include in-substance foreclosed properties. In-substance foreclosed properties are those properties for which the institution has taken physical possession, regardless of whether formal foreclosure proceedings have taken place. At the time of foreclosure, foreclosed real estate is recorded at the fair value less estimated costs to sell, which becomes the property’s new cost basis. Any write-downs based on the asset’s fair value at date of acquisition are charged to the allowance for loan losses. After foreclosure, valuations are periodically performed by management and property held for sale is carried at the lower of the new cost basis or fair value less estimated costs to sell. Impairment losses on property to be held and used are measured as the amount by which the carrying amount of a property exceeds its fair value.
Fair Value. Fair values of financial instruments are estimated using relevant market information and other assumptions. Fair value estimates involve uncertainties and matters of significant judgment regarding interest rates, credit risk, prepayments, and other factors, especially in the absence of broad markets for particular items. Changes in assumptions or in market conditions could significantly affect these estimates.
New Accounting Pronouncements
For a discussion of new accounting pronouncements and their impact on the Company, see Note 1 of the Notes to Consolidated Financial Statements included in "Item 8. Financial Statements and Supplementary Data."
Comparison of Financial Condition at June 30, 2015 and June 30, 2014
Assets. Total assets increased $141.5 million, or 17.8%, to $936.8 million at June 30, 2015, from $795.3 million at June 30, 2014, primarily due to an increase of $128.4 million, or 55.3%, in total investment securities to $360.6 million at June 30, 2015, as a result of deploying $117.6 million received from the Company's initial stock offering and an increase of $26.1 million in total cash and due from banks during the year. Net loans, excluding loans held for sale, decreased $8.3 million, or 1.7%, to $487.9 million at June 30, 2015, from $496.2 million at June 30, 2014.
Gross loans, excluding loans held for sale, decreased $9.9 million, or 2.0%, to $493.9 million at June 30, 2015, from $503.8 million at June 30, 2014. The decline in the portfolio was primarily the result of a reduction in

69
commercial, construction and land, and consumer loans. Commercial loans, including commercial real estate, multi-family, and commercial business loans, decreased $17.2 million, or 9.0%, to $173.5 million at June 30, 2015 from $190.7 million at June 30, 2014. Total consumer loans decreased $6.2 million, or 12.2%, to $44.6 million at June 30, 2015 from $50.8 million at June 30, 2014. These declines were primarily the result of a combination of prepayments and regular amortization outpacing the amount of new originations during the year. We continue to reduce our reliance on purchased commercial and multi-family real estate loans and focus on organic growth in these portfolios of loans; however, we may from time to time evaluate loan purchases to supplement our loan growth and increase our yield on interest earning assets. Partially offsetting these declines during the year ended June 30, 2015 was an increase in one- to four-family residential loans of $14.8 million, or 6.1%, primarily the result of purchase loan activity.
During the year ended June 30, 2015, the Company originated $104.5 million of loans, of which $76.2 million, or 72.9%, were originated in the North Olympic Peninsula, $26.1 million, or 25.0%, in the Puget Sound region of Washington, and $2.2 million, or 2.1%, in other areas in Washington. In addition to loans originated during the year ended June 30, 2015, the Company purchased two pools of one- to four-family residential loans totaling $25.6 million located in the Puget Sound region of Washington.
Our allowance for loan losses declined $961,000, or 11.9%, from $8.1 million at June 30, 2014 to $7.1 million at June 30, 2015, and the allowance for loan losses as a percentage of total loans declined 20 basis points from 1.6% at June 30, 2014, to 1.4% at June 30, 2015. The allowance remained relatively stable as the result of improving asset quality and decreases in nonperforming and classified loans during the year ended June 30, 2015.
Loans receivable, including loans held for sale, consisted of the following at the dates indicated:
June 30, 2015 June 30, 2014(In thousands)
Real Estate:One- to four-family $ 256,806 $ 242,523Multi-family 33,086 45,100Commercial real estate 125,623 128,028Construction and land 19,127 20,497
Total real estate loans 434,642 436,148
Consumer:Home equity 36,387 40,064Other consumer 8,198 10,697
Total consumer loans 44,585 50,761
Commercial business loans 14,764 17,532
Total loans 493,991 504,441Less:
Net deferred loan fees 840 862Premium on purchased loans, net (1,957) (1,290)Loans held for sale 110 613Allowance for loan losses 7,111 8,072
Total loans receivable, net $ 487,887 $ 496,184
Nonperforming loans decreased $1.1 million, or 18.3%, to $4.9 million at June 30, 2015, from $6.0 million at June 30, 2014. During the year ended June 30, 2015, nonperforming commercial real estate loans decreased $1.8 million, and nonperforming home equity loans decreased $159,000, partially offset by increases of $689,000 in one- to four-family residential loans, $32,000 in construction and land loans, and $123,000 in other consumer loans. Nonperforming loans to total loans declined to 1.0% at June 30, 2015 from 1.2% at June 30, 2014. Real estate owned and repossessed assets increased $1.1 million to $1.9 million at June 30, 2015, from $810,000 at June 30, 2014. The decrease in nonperforming commercial real estate loans and increase in real estate owned and repossessed assets was primarily the result of the transfer of a $1.4 million commercial real estate loan to real estate owned during the year ended June 30, 2015. Our allowance for loan losses was $7.1 million and $8.1 million, or 1.4% and

70
1.6% of gross loans receivable, at June 30, 2015 and June 30, 2014, respectively. The allowance for loan losses as a percentage of nonperforming loans increased 7.6% from 135.3% at June 30, 2014 to 145.6% at June 30, 2015.
At June 30, 2015, there were $7.7 million in restructured loans, of which $2.1 million were performing in accordance with their modified payment terms and returned to accrual status. Classified loans decreased by $4.0 million, or 28.8%, to $9.9 million at June 30, 2015, from $13.9 million at June 30, 2014.
The following table represents nonperforming assets and troubled debt restructurings ("TDRs") at the dates indicated.
June 30, 2015 June 30, 2014(In thousands)
Nonaccruing loans:Real estate loans:One- to four-family $ 4,232 $ 3,543Commercial real estate 147 1,913Construction and land 159 127
Total real estate loans 4,538 5,583
Commercial business loans: — —
Consumer loans:Home equity 181 340Other 164 41
Total consumer loans 345 381
Total nonaccruing loans 4,883 5,964
Real estate owned:One- to four-family 493 524Commercial real estate 1,368 —Construction and land — 220
Total real estate owned 1,861 744
Repossessed automobiles and recreational vehicles 53 66
Total nonperforming assets $ 6,797 $ 6,774
TDR loans:One- to four-family $ 4,923 $ 5,939Multi-family 629 728Commercial real estate 1,363 4,456
Total real estate loans 6,915 11,123
Home equity 428 615Commercial business 403 426
Total restructured loans $ 7,746 $ 12,164
Nonaccrual and 90 days or more past due loans as apercentage of total loans 1.0% 1.2%
Nonperforming TDRs included in total nonaccruingloans and total restructured loans above $ 5,676 $ 3,536

71
At June 30, 2015, total investment securities increased $128.4 million, or 55.3%, to $360.6 million at June 30, 2015, from $232.2 million at June 30, 2014, primarily as a result of cash received from the Company's initial stock offering and increases in customer deposits that were deployed into earning assets during the year ended June 30, 2015. Mortgage-backed securities represent the largest portion of our investment securities portfolio and totaled $230.3 million at June 30, 2015, an increase of $61.6 million, or 36.5%, from $168.7 million at June 30, 2014. Other investment securities, including municipal bonds, were $130.2 million at June 30, 2015, an increase of $66.7 million, or 105.0% from $63.5 million at June 30, 2014. From the net proceeds received from our initial stock offering and additional available cash on hand during the year, we purchased $138.0 million of investment securities consisting of a combination of fixed rate securities of $107.9 million, or 78.2%, and adjustable rate securities of $30.1 million, or 21.8%. Of the fixed rate securities, $10.2 million consisted of laddered maturity U.S. Treasury notes which will mature in approximate $500,000 increments starting in September 2015 and each of the six months thereafter through February 2025. Other fixed rate securities consist of $5.0 million Agency bond securities, $70.7 million of U.S. government agency issued mortgage-backed securities ("Agency MBS"), $10.0 million of Small Business Association ("SBA") securities, $7.6 million of municipal securities, and one corporate issued mortgage-backed security ("Corporate MBS") of $4.4 million. Adjustable rate securities consisted of $14.8 million corporate asset-backed securities ("Corporate ABS"), $4.7 million of Corporate MBS, and $10.6 million Agency MBS. Investment securities and mortgage-backed securities purchased fall within the policy types and dollar limits as set by First Federal's investment policy. Corporate MBS and Corporate ABS require additional monitoring by the Bank for credit quality and risk-weighting on at least a quarterly basis to detect underlying credit issues that may require attention as these investments do not have guarantees of payment in the event of default. The duration of the total investment securities portfolio remained the same at 4.7 years at June 30, 2015 and 2014.
Liabilities. Total liabilities increased $31.8 million, or 4.5%, to $746.1 million at June 30, 2015, from $714.3 million at June 30, 2014. This increase was primarily the result of deposit account balances increasing $46.8 million, or 7.8%, to $647.2 million at June 30, 2015, from $600.4 million at June 30, 2014. Transaction, savings, and money market account deposits increased $32.5 million, or 7.0%, to $499.2 million at June 30, 2015 from $466.7 million at June 30, 2014, while certificates of deposit increased $14.2 million, or 10.6%, during this period. Increases in deposits were primarily the result of targeted promotional efforts on money market and certificates of deposits in new and existing market areas.
Borrowings, consisting primarily of long term advances from the Federal Home Loan Bank, decreased $15.1 million, or 14.4%, from $105.1 million at June 30, 2014 to $90.0 million at June 30, 2015, as Federal Home Loan Bank cash management advances were repaid. Total borrowings at June 30, 2015 consisted primarily of long term advances from the FHLB.
Equity. Total equity increased $109.7 million, or 135.4%, to $190.7 million at June 30, 2015, from $81.0 million at June 30, 2014. The increase was primarily the result of an increase to capital from the initial stock offering of $126.9 million, partially offset by a $5.1 million net loss and $11.8 million of unearned ESOP shares purchased in the open market during the year ended June 30, 2015.
Comparison of Results of Operations for the Years Ended June 30, 2015 and June 30, 2014
General. The Company had a net loss for the year ended June 30, 2015 of $5.1 million, or $0.42 per share, compared to net income of $2.7 million for the year ended June 30, 2014, a decrease of $7.8 million, or 288.9%. The net loss during the year ended June 30, 2015, was primarily due to the Company contributing $400,000 in cash and $9.3 million in common stock to the Foundation, resulting in a pre-tax noninterest expense charge of $9.7 million.
Net Interest Income. Net interest income increased $1.1 million to $22.9 million for the year ended June 30, 2015, from $21.8 million for the year ended June 30, 2014. The increase was primarily the result of an increase in interest income as cash received from the initial public stock offering and increased customer deposits was deployed into the investment portfolio.
Net interest margin decreased 14 basis points to 2.75% for the year ended June 30, 2015, from 2.89% for the fiscal year 2014, primarily due to an increase in the average balance of investment and mortgage-backed securities and cash and cash equivalents yielding lower rates compared to the loan portfolio, coupled with a decrease in average loan yields during the year ended June 30, 2015. Of the $1.1 million increase in net interest income during the year ended June 30, 2015 compared to fiscal year 2014, $1.8 million was the result of an increase in volume partially offset by a $746,000 decline from change in rates. The cost of average interest-bearing liabilities decreased four basis points to 0.70% for the year ended June 30, 2015, compared to 0.74% for the prior fiscal year,

72
due primarily to the decreased cost of FHLB borrowings and a decline in the average balance of certificates of deposit.
Interest Income. Total interest income increased $928,000, or 3.5%, to $27.5 million for the year ended June 30, 2015 from $26.6 million for the comparable period in 2014. Interest income increased primarily due to increases in the average balance and in the yield on investment and mortgage-backed securities as additional cash flows were deployed into the investment securities and mortgage-backed securities portfolios. During the year ended June 30, 2015, average loan yields decreased 23 basis points compared to the year ended June 30, 2014, as higher yielding loans continued to pay off and were replaced with loans at lower interest rates. This resulted in interest income on loans receivable decreasing $320,000, to $22.0 million for the year ended June 30, 2015 from $22.4 million for the year ended June 30, 2014, despite an increase in the average balance of loans receivable of $17.3 million during fiscal year 2015.
Interest income on investment securities increased $701,000 to $1.9 million for the year ended June 30, 2015 compared to $1.1 million for the year ended June 30, 2014. The average balance of investment securities increased $27.1 million to $88.8 million for the year ended June 30, 2015 compared to $61.6 million for the year ended June 30, 2014. The yield on investment securities for the year ended June 30, 2015 increased twenty-two basis points.
Interest income on mortgage backed securities increased $473,000 primarily due to an increase of 25 basis points in average yields to 1.91% for the year ended June 30, 2015 from 1.66% for the year ended June 30, 2014 and an increase in the average balance of $1.0 million compared to the prior year.
The following table compares average earning asset balances, associated yields, and resulting changes in interest income for the periods shown:
Year Ended June 30,2015 2014
Average Balance
Outstanding Yield
Average Balance
Outstanding Yield
Increase/ (Decrease) in
Interest Income(Dollars in thousands)
Loans receivable, net $ 491,497 4.49 % $ 474,222 4.72 % $ (320)Investment securities 88,764 2.08 61,620 1.86 701Mortgage-backed securities 181,727 1.91 180,743 1.66 473FHLB stock 9,463 0.13 10,268 0.10 2Cash and due from banks 61,154 0.18 27,596 0.15 72
Total interest-earning assets $ 832,605 3.30 $ 754,449 3.52 $ 928
Interest Expense. Total interest expense decreased $137,000, or 2.9%, to $4.6 million for the year ended June 30, 2015, compared to $4.7 million for the year ended June 30, 2014, primarily due to a $269,000, or 8.4%, decline in borrowing costs. Deposit costs increased $132,000, or 8.6%, primarily due to an increase in the average balance of money market accounts of $14.5 million coupled with an increase in the average rate paid of three basis points, which resulted in an $82,000 increase in interest paid on money market accounts during the year ended June 30, 2015.
The average balance of interest-bearing deposits increased $31.8 million, or 6.0%, to $565.0 million for the year ended June 30, 2015 from $533.2 million for the year ended June 30, 2014. This increase was attributable to increases in the average balances of savings accounts of $19.0 million, money market accounts of $14.5 million and transaction accounts of $2.8 million, partially offset by a decrease in the average balance of certificates of deposit of $4.5 million. With rates at historically low levels there has been little incentive for depositors to extend maturities and reduce the liquidity associated with savings and money market products by renewing maturing certificates of deposit. The average cost of all deposit products increased to 0.30% for the year ended June 30, 2015 from 0.29% for the year ended June 30, 2014. Borrowing costs declined $269,000 to $2.9 million for the year ended June 30, 2015 from $3.2 million for the last fiscal year primarily due to the maturity of $10.0 million long-term FHLB advances.
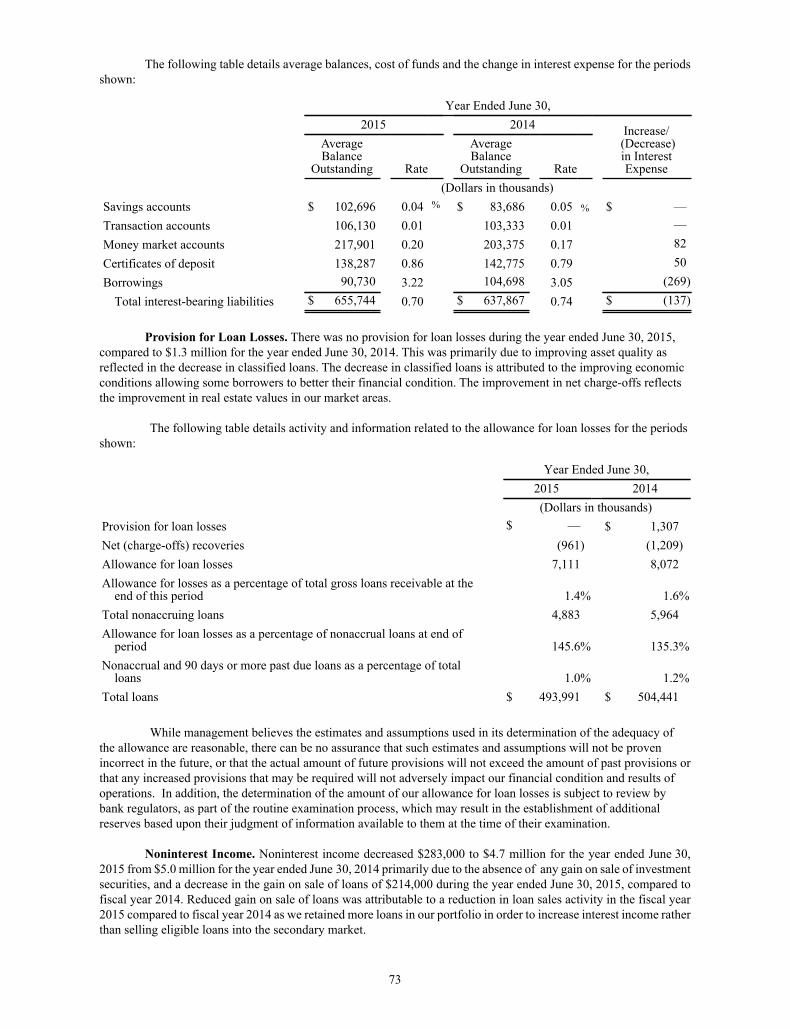
73
The following table details average balances, cost of funds and the change in interest expense for the periods shown:
Year Ended June 30,2015 2014 Increase/
(Decrease)in InterestExpense
Average Balance
Outstanding Rate
Average Balance
Outstanding Rate(Dollars in thousands)
Savings accounts $ 102,696 0.04 % $ 83,686 0.05 % $ —Transaction accounts 106,130 0.01 103,333 0.01 —Money market accounts 217,901 0.20 203,375 0.17 82Certificates of deposit 138,287 0.86 142,775 0.79 50Borrowings 90,730 3.22 104,698 3.05 (269)
Total interest-bearing liabilities $ 655,744 0.70 $ 637,867 0.74 $ (137)
Provision for Loan Losses. There was no provision for loan losses during the year ended June 30, 2015, compared to $1.3 million for the year ended June 30, 2014. This was primarily due to improving asset quality as reflected in the decrease in classified loans. The decrease in classified loans is attributed to the improving economic conditions allowing some borrowers to better their financial condition. The improvement in net charge-offs reflects the improvement in real estate values in our market areas.
The following table details activity and information related to the allowance for loan losses for the periods shown:
Year Ended June 30,2015 2014(Dollars in thousands)
Provision for loan losses $ — $ 1,307Net (charge-offs) recoveries (961) (1,209)Allowance for loan losses 7,111 8,072Allowance for losses as a percentage of total gross loans receivable at the
end of this period 1.4% 1.6%Total nonaccruing loans 4,883 5,964Allowance for loan losses as a percentage of nonaccrual loans at end of
period 145.6% 135.3%Nonaccrual and 90 days or more past due loans as a percentage of total
loans 1.0% 1.2%Total loans $ 493,991 $ 504,441
While management believes the estimates and assumptions used in its determination of the adequacy of the allowance are reasonable, there can be no assurance that such estimates and assumptions will not be proven incorrect in the future, or that the actual amount of future provisions will not exceed the amount of past provisions or that any increased provisions that may be required will not adversely impact our financial condition and results of operations. In addition, the determination of the amount of our allowance for loan losses is subject to review by bank regulators, as part of the routine examination process, which may result in the establishment of additional reserves based upon their judgment of information available to them at the time of their examination.
Noninterest Income. Noninterest income decreased $283,000 to $4.7 million for the year ended June 30, 2015 from $5.0 million for the year ended June 30, 2014 primarily due to the absence of any gain on sale of investment securities, and a decrease in the gain on sale of loans of $214,000 during the year ended June 30, 2015, compared to fiscal year 2014. Reduced gain on sale of loans was attributable to a reduction in loan sales activity in the fiscal year 2015 compared to fiscal year 2014 as we retained more loans in our portfolio in order to increase interest income rather than selling eligible loans into the secondary market.

74
The following table provides a detailed analysis of the changes in the components of noninterest income for the periods shown:
Year Ended June 30, Increase (Decrease)2015 2014 Amount Percent
(Dollars in thousands)Loan and deposit service fees $ 3,404 $ 3,447 $ (43) (1.2)%Mortgage servicing fees, net of amortization 305 284 21 7.4Net gain on sale of loans 548 762 (214) (28.1)Net gain on sale of investment securities — 112 (112) (100.0)Increase in cash surrender value of bank-owned life
insurance 102 94 8 8.5Other income 348 291 57 19.6
Total noninterest income $ 4,707 $ 4,990 $ (283) (5.7)%
Noninterest Expense. Noninterest expense increased $10.9 million, or 49.5%, to $33.0 million for the year ended June 30, 2015, compared to $22.1 million for the year ended June 30, 2014. This increase in noninterest expense was primarily due to the funding of the Foundation, which resulted in an increase in noninterest expense of $9.7 million. Compensation and benefits increased $1.1 million, and data processing and occupancy and equipment expense increased $321,000 and $5,000, respectively, partially offset by a $233,000 decline in real estate owned and repossessed assets expense, net. Compensation and benefits during the year ended June 30, 2015 increased compared to the comparable period in 2014 as a result of certain market rate and merit increase adjustments for employees and management and increased employee benefits expenses, including expenses related to the ESOP.
The following table provides an analysis of the changes in the components of noninterest expense for the periods shown:
Year Ended June 30,Increase
(Decrease)2015 2014 Amount Percent
(Dollars in thousands)Compensation and benefits $ 12,703 $ 11,614 $ 1,089 9.4%Real estate owned and repossessed assets expenses,
net 165 398 (233) (58.5)Data processing 2,521 2,200 321 14.6Occupancy and equipment 3,058 3,053 5 0.2Supplies, postage, and telephone 663 695 (32) (4.6)Regulatory assessments and state taxes 334 381 (47) (12.3)Advertising 433 425 8 1.9Charitable contributions 9,870 183 9,687 5,293.4Professional fees 1,063 945 118 12.5FDIC insurance premium 544 551 (7) (1.3)Other 1,692 1,660 32 1.9
Total $ 33,046 $ 22,105 $ 10,941 49.5%
Provision for Income Tax. An income tax benefit of $354,000 was recorded for the year ended June 30, 2015 compared to an income tax expense of $740,000 for the year ended June 30, 2014. This was generally due to a decrease in income before taxes of $8.9 million. Under current Federal income tax regulations, charitable contribution deductions are limited to 10% of taxable income. Accordingly, the $9.7 million contribution will create a carry-forward for income tax purposes with a deferred tax asset and related valuation allowance for financial statement purposes.

75
Comparison of Financial Condition at June 30, 2014 and June 30, 2013
Assets. Total assets increased $10.8 million, or 1.4%, to $795.3 million at June 30, 2014, from $784.5 million at June 30, 2013. Loans receivable, net, increased $46.8 million, or 10.4%, to $496.2 million at June 30, 2014, from $449.4 million at June 30, 2013. Securities decreased $32.2 million, or 12.2%, to $232.2 million at June 30, 2014, from $264.4 million at June 30, 2013, and cash and cash equivalents decreased by $3.9 million, or 17.0%, to $19.0 million at June 30, 2014 from $22.9 million at June 30, 2013.
Gross loans, excluding loans held for sale, increased $46.3 million, or 10.1%, to $503.8 million at June 30, 2014, from $457.5 million at June 30, 2013. The portfolio growth was primarily a result of a $51.5 million, or 13.4%, increase in real estate secured loans to $436.1 million at June 30, 2014, from $384.6 million at June 30, 2013. The portfolio of commercial real estate loans increased during the year ended June 30, 2014, by $34.9 million, or 37.5%, to $128.0 million at June 30, 2014, from $93.1 million at June 30, 2013. At June 30, 2014, $76.1 million, or 59.5% of such loans, were secured by properties outside the North Olympic Peninsula region. Multi-family loans increased by $17.2 million, or 61.5%, to $45.1 million at June 30, 2014, as compared to $27.9 million at June 30, 2013. At June 30, 2014, $40.6 million, or 90.0% of such loans, were secured by properties outside the North Olympic Peninsula region. Commercial business loans decreased slightly by $214,000, or 1.2%, to $17.5 million at June 30, 2014, from $17.7 million at June 30, 2013, while construction and land loans increased $5.0 million, or 32.3%, to $20.5 million at June 30, 2014, from $15.5 million at June 30, 2013, reflecting the stabilizing of one- to four-family real estate values in the North Olympic Peninsula region. These increases were partially offset by a decrease in one- to four-family residential loans of $5.7 million, or 2.3%, to $242.5 million at June 30, 2014, from $248.2 million at June 30, 2014.
During the year ended June 30, 2014, we originated $113.5 million and purchased $39.9 million of loans. Of loans originated, $56.4 million, or 49.6%, were originated on the North Olympic Peninsula compared to $35.0 million, or 30.8%, in the Puget Sound region and $22.0 million, or 19.4%, in other areas. Purchased loans included $18.5 million of one- to four-family jumbo loans secured by properties located in California, $20.5 million of multi-family real estate loans secured by properties primarily located in the Puget Sound region of Washington and a $993,000 commercial real estate participation secured by property located in Eastern Washington.
Our allowance for loan losses was $8.1 million, or 1.6% of gross loans receivable at June 30, 2014, compared to $8.0 million, or 1.7% of gross loans receivable at June 30, 2013. The increase in the allowance was primarily the result of portfolio growth, partially offset by improving asset quality as evidenced by decreases in nonperforming and classified loans during the year ended June 30, 2014. Classified loans decreased by $7.8 million, or 35.9%, to $13.9 million at June 30, 2014, from $21.7 million at June 30, 2013.
Nonperforming loans decreased $3.9 million, or 39.5%, to $6.0 million at June 30, 2014, from $9.9 million at June 30, 2013, as asset quality improved in all loan categories. Nonperforming loans to total loans decreased to 1.2% at June 30, 2014, from 2.2% at June 30, 2013. Real estate owned and repossessed assets decreased $1.5 million to $810,000 at June 30, 2014, from $2.3 million at June 30, 2013 as a result of decreased foreclosure activity and sales of foreclosed assets during the period. At June 30, 2014, we had $12.2 million in TDRs, of which $8.6 million were performing in accordance with their revised terms and returned to accrual status. See “Item 1. Business – Asset Quality” for additional information.
At June 30, 2014, the securities portfolio represented 29.2% of total assets, compared to 33.7% at June 30, 2013, as proceeds from repayment and sales of securities were redeployed into loans. Mortgage-backed securities represented the largest portion of our investment portfolio and were $168.7 million at June 30, 2014, a decrease of $30.5 million, or 15.3%, from $199.2 million at June 30, 2013. Other investment securities, including municipal bonds, were $63.5 million at June 30, 2014, a decrease of $1.7 million, or 2.6%, from $65.2 million at June 30, 2013.
Liabilities. Total liabilities increased $8.4 million, or 1.2%, to $714.3 million at June 30, 2014, from $705.9 million at June 30, 2013, primarily due to deposit account balances increasing $5.4 million, or 0.9%, to $600.4 million at June 30, 2014, from $595.0 million at June 30, 2013, and borrowings increasing $5.1 million, or 5.1%, from $100.0 million at June 30, 2013, to $105.1 million at June 30, 2014.
We believe our deposit growth was attributable to our customers seeking the safety afforded by insured deposits along with our success in attracting deposits from community organizations. Transaction, savings and money market accounts increased $24.1 million, or 5.4%, to $466.7 million at June 30, 2014, from $442.6 million at June 30, 2013, while certificates of deposit declined $18.7 million, or 12.3%, during this period. The change in the
76
mix of deposits reflects the continued impact of the historically low interest rate environment as depositors preferred the liquidity of savings and money market products as compared to time deposits.
Total borrowings were comprised primarily of advances from FHLB. The increase in borrowings during fiscal year 2014 was attributable to the utilization of short-term FHLB advances to support our daily short-term cash needs, such as fluctuations in customer deposits, lending activities, loan prepayments and operating expenses.
Equity. Total equity increased $2.4 million, or 3.1%, to $81.0 million at June 30, 2014, from $78.6 million at June 30, 2013. The increase was primarily a result of $2.7 million in net income partially offset by a decline in other comprehensive income associated with mark to market adjustments on the investment portfolio.
Comparison of Results of Operations for the Years Ended June 30, 2014 and June 30, 2013
General. Net income for the year ended June 30, 2014, was $2.7 million, compared to a net income of $2.3 million for the year ended June 30, 2013. The increase in net income resulted from a $2.0 million increase in net interest income and a $69,000 decrease in the provision for loan losses, partially offset by a $577,000 decline in noninterest income, an $859,000 increase in noninterest expense and an increase of $318,000 in income tax expense.
Net Interest Income. Net interest income increased $2.0 million to $21.8 million for the year ended June 30, 2014, from $19.8 million for the year ended June 30, 2013. The increase was primarily a result of a reduction in interest expense.
Our net interest margin increased 22 basis points to 2.89% for the year ended June 30, 2014, from 2.67% for the same period in 2013, primarily due to the $50.9 million, or 12.0%, increase in average net loans receivable and the reduction in our average cost of funds. The average yield on interest-earning assets increased four basis points, as increases in the yield on our investment portfolio more than offset a 46 basis point decrease in yield on our loan portfolio. The redistribution of earning assets from investments to loans also improved our earning asset yield. The cost of average interest-bearing liabilities decreased 20 basis points to 0.74% for the year ended June 30, 2014, compared to 0.94% for the prior fiscal year, due to a reduction in rates paid on FHLB advances and customer deposits. Our funding costs have limited opportunity for further downward rate adjustments.
Interest Income. Total interest income increased $764,000, or 3.0%, to $26.6 million for the year ended June 30, 2014, from $25.8 million for the comparable period in 2013. Interest income on loans increased $432,000, or 2.0%, during the year ended June 30, 2014, reflecting an increase of $50.9 million in the average balance of net loans receivable outstanding for the year ended June 30, 2014, compared to the comparable period in 2013. During the year ended June 30, 2014, average loan yields decreased 46 basis points as higher yielding loans continued to pay off and were replaced with loans at lower interest rates.
Interest income on investment securities increased $248,000 to $1.1 million for the year ended June 30, 2014, compared to $901,000 for the year ended June 30, 2013. The average balance of our investment securities increased $1.0 million to $61.6 million for the year ended June 30, 2014, compared to $60.6 million for the year ended June 30, 2013. The yield on investment securities for the year ended June 30, 2014 increased 37 basis points due to slowing prepayment activity, which reduced premium amortization, and higher reinvestment rates available in 2014.
Interest income on mortgage-backed securities increased by $91,000, primarily due to slowing amortization of premiums along with the reinvestment of repayments and proceeds from sales of such securities into higher yielding mortgage-backed securities.
The following table compares average earning asset balances, associated yields, and resulting changes in interest income for the year ended June 30, 2014 and 2013:

77
Year Ended June 30,2014 2013
Average Balance
Outstanding Yield
Average Balance
Outstanding Yield
Increase/ (Decrease) in
Interest Income(Dollars in thousands)
Loans receivable, net $ 474,222 4.72 % $ 423,294 5.18 % $ 432Investment securities 61,620 1.86 60,581 1.49 248Mortgage-backed securities 180,743 1.66 211,731 1.37 91FHLB stock 10,268 0.10 10,642 — 10Cash and due from banks 27,596 0.15 36,037 0.16 (17) Total interest-earning assets $ 754,449 3.52 $ 742,285 3.48 $ 764
Interest Expense. Total interest expense decreased $1.3 million, or 21.2%, to $4.7 million for the year ended June 30, 2014, compared to $6.0 million for the year ended June 30, 2013, primarily due to a restructuring of $89.9 million in FHLB advances in April 2013. The restructuring lengthened maturities by 47 months and decreased the average rate paid by 73 basis points to 3.26% for the year ended June 30, 2014, from 3.99% for the year ended June 30, 2013. Deposit costs decreased $431,000, or 21.9%, primarily due to a maturity of $18.6 million in higher cost certificates of deposit and increases in the average balances for lower cost interest-bearing transaction accounts of $4.2 million, savings accounts of $3.8 million, and money market accounts of $6.6 million. With rates at historically low levels there has been little incentive for depositors to renew certificates or extend maturities. The average cost of all deposit products decreased for the year ended June 30, 2014, with certificates of deposit declining by 17 basis points to 0.79% from 0.96% for the year ended June 30, 2013, while the cost of money market deposits decreased by one basis point to 0.17% for the year ended June 30, 2014, from 0.18% for the year ended June 30, 2013. The average balance of interest-bearing deposits decreased $4.0 million, or 0.8%, to $533.2 million for the year ended June 30, 2014 from $537.2 million for the year ended June 30, 2013. Borrowing costs declined $840,000 to $3.2 million for the year ended June 30, 2014 from $4.0 million for the same period last year due to a 98 basis point reduction in the average rate paid on borrowings.
The following table details average balances, cost of funds, and the change in interest expense for the years ended June 30, 2014 and 2013:
Year Ended June 30,2014 2013 Increase/
(Decrease) in InterestExpense
Average Balance
Outstanding Rate
Average Balance
Outstanding Rate(Dollars in thousands)
Savings accounts $ 83,686 0.05 % $ 79,872 0.07 % $ (21)Transaction accounts 103,333 0.01 99,170 0.01 —Money market accounts 203,375 0.17 196,809 0.18 1Certificates of deposit 142,775 0.79 161,359 0.96 (411)Borrowings 104,698 3.05 100,113 4.03 (840) Total interest-bearing liabilities $ 637,867 0.74 $ 637,323 0.94 $ (1,271)
Provision for Loan Losses. The provision for loan losses decreased $69,000, or 5.0%, to $1.3 million for the year ended June 30, 2014, compared to $1.4 million for the year ended June 30, 2013. This was primarily due to improving asset quality as reflected in the decrease in nonaccrual and 90 days or more past due loans as a percent of total loans, from 2.2% of the loan portfolio at June 30, 2013 to 1.2% of the loan portfolio at June 30, 2014. The improvements in delinquencies and nonaccrual loans are attributed to improving economic conditions allowing some borrowers to improve their financial condition. This reduction in the provision for loan losses was partially offset by additional reserves needed to cover a higher average loans receivable balance and $1.2 million of net charge-offs during fiscal 2014.

78
The following table details activity and information related to the allowance for loan losses for the years ended June 30, 2014 and 2013:
At or For the YearEnded June 30,
2014 2013(Dollars in thousands)
Provision for loan losses $ 1,307 $ 1,376Net (charge-offs) recoveries (1,209) (792)Allowance for loan losses 8,072 7,974Allowance for losses as a percentage of total gross loans receivable at the
end of this period 1.6% 1.7%Total nonaccruing loans 5,964 9,864Nonaccrual and 90 days or more past due loans as a percentage of total
loans 1.2% 2.2%Allowance for loan losses as a percentage of nonperforming loans at end of
period 135.3% 80.8%Total loans $ 504,441 $ 457,921
Noninterest Income. Noninterest income decreased $577,000, or 10.4%, to $5.0 million for the year ended June 30, 2014, from $5.6 million for the year ended June 30, 2013. The decrease in noninterest income during the 2014 fiscal year was due primarily to the impact of interest rates. Rising rates at the end of 2013 caused a reduction in loan refinance activity, affecting our ability to generate gains on sales of loans, and the general level of interest rates also reduced the returns on bank-owned life insurance. The following table provides an analysis of the changes in the components of noninterest income for the years ended June 30, 2014 and 2013:
Year Ended June 30, Increase (Decrease)
2014 2013 Amount Percent(Dollars in thousands)
Loan and deposit service fees $ 3,447 $ 3,353 $ 94 2.8 %Mortgage servicing fees, net of amortization 284 5 279 5,580.0Net gain on sales of loans 762 1,563 (801) (51.2)Net gain on sale of investment securities 112 70 42 60.0Increase in cash surrender value of bank-owned life
insurance 94 316 (222) (70.3)Other income 291 260 31 11.9 Total noninterest income $ 4,990 $ 5,567 $ (577) (10.4) %
Loan and deposit service fees increased $94,000, or 2.8%, to $3.4 million for the year ended June 30, 2014 due to increases in transactional deposit accounts between these periods. Net gain on sale of investment securities was $112,000 for the year ended June 30, 2014 as selected securities with lower yields were sold to fund higher yielding investments. Decreases in the gain on sale of loans and the increase in mortgage servicing fees net of amortization during the year ended June 30, 2014, compared to the 2013 fiscal year, were attributable to reduced origination activity and the retention of a limited amount of 30-year fixed rate single family residential loans to the portfolio, reducing the opportunity to generate loan sale revenue. In addition, the increase in cash surrender value of our bank-owned life insurance declined $222,000 to $94,000 for the year ended June 30, 2014, from $316,000 for the same period last year as a result of the declining yields of the underlying investments as funds were reinvested at lower interest rates.
Noninterest Expense. Noninterest expense increased $859,000, or 4.0%, to $22.1 million for the year ended June 30, 2014, compared to $21.2 million for the year ended June 30, 2013. This increase was primarily due to an increase in compensation and benefits expense of $1.1 million, or 10.6%, to $11.7 million for the year ended June 30, 2014, compared to $10.6 million for the comparable period in 2013. Additional staffing has been added in connection with our branch expansion into Kitsap County and loan production office expansion into Whatcom

79
County. We have also increased our staffing in the credit administration and production areas to increase our loan production and to improve our approval time for loans. As a result, full-time equivalent employees increased to 169 at June 30, 2014, from 161 at June 30, 2013. Compensation was further increased as deferral of compensation expense related to the origination of loans declined during fiscal 2013 and, to a lesser extent, increased contributions were made to our defined benefit retirement plan. Our efficiency ratio was 82.4% for the year ended June 30, 2014, compared to 83.8% for the year ended June 30, 2013. The following table provides an analysis of the changes in the components of noninterest expense:
At or For the YearEnded June 30,
Increase (Decrease)
2014 2013 Amount Percent(Dollars in thousands)
Compensation and benefits $ 11,683 $ 10,560 $ 1,123 10.6 %Real estate owned and repossessed assets expenses,
net 398 244 154 63.1Data processing 2,200 1,956 244 12.5Occupancy and equipment 3,053 2,881 172 6.0Supplies, postage, and telephone 695 802 (107) (13.3)Regulatory assessments and state taxes 381 384 (3) (0.8)Advertising 608 522 86 16.5Professional fees 945 1,477 (532) (36.0)FDIC insurance premiums 551 680 (129) (19.0)Other 1,591 1,740 (149) (8.6)
Total $ 22,105 $ 21,246 $ 859 4.0 %
We also had an increase in expense for data processing of $244,000 for the year ended June 30, 2014 due to costs associated with our branch expansion and the related cost increases attributed to increased transaction activity associated with deposit accounts, including mobile and internet banking. Occupancy and equipment expense increased $172,000 during the period, primarily due to branch expansion and other improvements. These increases were offset by a $532,000 reduction in professional fees that resulted from the recognition of fees related to the postponement of the conversion during the year ended June 30, 2013. Expenses associated with real estate owned and repossessed assets for the year ended June 30, 2014 reflect normal operating expenses related to repossession, disposition and foreclosure activity.
Provision (Benefit) for Income Tax. An income tax expense of $740,000 was recorded for net income for the year ended June 30, 2014, compared to an income tax expense of $422,000 for the year ended June 30, 2013. This was due to an increase in income before taxes of $668,000 as well as a change in the mix of taxable and non-taxable income as more taxable net interest income was realized and non-taxable earnings related to the increase in the cash surrender value of bank-owned life insurance decreased.

80
Aver
age
Bal
ance
s, In
tere
st a
nd A
vera
ge Y
ield
s/C
ost
The
follo
win
g ta
ble
sets
forth
, for
the
perio
ds in
dica
ted,
info
rmat
ion
rega
rdin
g av
erag
e ba
lanc
es o
f ass
ets a
nd li
abili
ties a
s wel
l as t
he to
tal d
olla
r am
ount
s of
inte
rest
inco
me
from
ave
rage
as
sets
and
inte
rest
exp
ense
on
aver
age
liabi
litie
s, re
sulta
nt y
ield
s, in
tere
st ra
te sp
read
, net
inte
rest
m
argi
n (o
ther
wis
e kn
own
as n
et y
ield
on
asse
ts),
and
the
ratio
of a
vera
ge
asse
ts to
ave
rage
inte
rest
-bea
ring
liabi
litie
s. A
lso
pres
ente
d is
the
wei
ghte
d av
erag
e yi
eld
on in
tere
st-e
arni
ng a
sset
s, ra
tes p
aid
on in
tere
st-b
earin
g lia
bilit
ies a
nd th
e re
sulta
nt sp
read
at J
une
30, 2
015.
Inco
me
and
all
aver
age
bala
nces
are
mon
thly
ave
rage
bal
ance
s, w
hich
man
agem
ent d
eem
s to
be n
ot m
ater
ially
diff
eren
t tha
n da
ily a
vera
ges.
Non
accr
uing
loan
s hav
e be
en
incl
uded
in th
e ta
ble
as lo
ans c
arry
ing
a ze
ro y
ield
.
At J
une
30, 2
015
Yea
r End
ed Ju
ne 3
0,20
1520
1420
13
Yie
ld/
Rat
e
Ave
rage
Bal
ance
Out
stan
ding
Inte
rest
Earn
ed/
Paid
Yie
ld/
Rat
e
Ave
rage
Bal
ance
Out
stan
ding
Inte
rest
Earn
ed/
Paid
Yie
ld/
Rat
e
Ave
rage
Bal
ance
Out
stan
ding
Inte
rest
Earn
ed/
Paid
Yie
ld/
Rat
e
Inte
rest
-ear
ning
ass
ets:
(Dol
lars
in th
ousa
nds)
Loan
s rec
eiva
ble,
net
(1)
4.32
%$
491,
497
$22,
046
4.49
%$
474,
222
$22,
366
4.72
%$
423,
294
$21,
934
5.18
%In
vest
men
t sec
uriti
es2.
2488
,764
1,85
02.
0861
,620
1,14
91.
8660
,581
901
1.49
Mor
tgag
e-ba
cked
secu
ritie
s2.
2918
1,72
73,
466
1.91
180,
743
2,99
31.
6621
1,73
12,
902
1.37
FHLB
div
iden
ds0.
249,
463
120.
1310
,268
100.
1010
,642
——
Cas
h an
d ca
sh e
quiv
alen
ts0.
3361
,154
113
0.18
27,5
9641
0.15
36,0
3758
0.16
Tota
l int
eres
t-ear
ning
ass
ets (2
)3.
3183
2,60
527
,487
3.30
754,
449
26,5
593.
5274
2,28
525
,795
3.48
Inte
rest
-bea
ring
liab
ilitie
s:Sa
ving
s acc
ount
s0.
04$
102,
696
$38
0.04
$83
,686
380.
05$
79,8
7259
0.07
Tran
sact
ion
acco
unts
0.01
106,
130
100.
0110
3,33
310
0.01
99,1
7010
0.01
Mon
ey m
arke
t acc
ount
s0.
1721
7,90
143
60.
2020
3,37
535
40.
1719
6,80
935
30.
18C
ertif
icat
es o
f dep
osit
0.94
138,
287
1,18
50.
8614
2,77
51,
135
0.79
161,
359
1,54
60.
96To
tal d
epos
its0.
2856
5,01
41,
669
0.30
533,
169
1,53
70.
2953
7,21
01,
968
0.37
Bor
row
ings
3.33
90,7
302,
923
3.22
104,
698
3,19
23.
0510
0,11
34,
032
4.03
Tota
l int
eres
t-bea
ring
liabi
litie
s0.
6565
5,74
44,
592
0.70
637,
867
4,72
90.
7463
7,32
36,
000
0.94
Net
inte
rest
inco
me
$22,
895
$21,
830
$19,
795
Net
inte
rest
rate
spre
ad2.
662.
602.
782.
54N
et e
arni
ng a
sset
s$
176,
861
$11
6,58
2$
104,
962
Net
inte
rest
mar
gin
(3)
2.75
2.89
2.67
Ave
rage
inte
rest
-ear
ning
ass
ets t
o av
erag
e in
tere
st-
bear
ing
liabi
litie
s12
7.0%
118.
3%11
6.5%
(1)
The
aver
age
loan
s rec
eiva
ble,
net
bal
ance
s inc
lude
non
accr
uing
loan
s.(2
) In
clud
es in
tere
st-b
earin
g de
posi
ts (c
ash)
at o
ther
fina
ncia
l ins
titut
ions
.(3
) N
et in
tere
st in
com
e di
vide
d by
ave
rage
inte
rest
-ear
ning
ass
ets.
80
Average Balances, Interest and Average Yields/Cost
The following table sets forth, for the periods indicated, information regarding average balances of assets and liabilities as well as the total dollar amounts of interest income from average assets and interest expense on average liabilities, resultant yields, interest rate spread, net interest margin (otherwise known as net yield on assets), and the ratio of average assets to average interest-bearing liabilities. Also presented is the weighted average yield on interest-earning assets, rates paid on interest-bearing liabilities and the resultant spread at June 30, 2015. Income and all average balances are monthly average balances, which management deems to be not materially different than daily averages. Nonaccruing loans have been included in the table as loans carrying a zero yield.
At June30, 2015
Year Ended June 30,2015 2014 2013
Yield/Rate
AverageBalance
Outstanding
InterestEarned/
PaidYield/Rate
AverageBalance
Outstanding
InterestEarned/
PaidYield/Rate
AverageBalance
Outstanding
InterestEarned/
PaidYield/Rate
Interest-earning assets: (Dollars in thousands)Loans receivable, net (1) 4.32% $ 491,497 $22,046 4.49% $ 474,222 $22,366 4.72% $ 423,294 $21,934 5.18%Investment securities 2.24 88,764 1,850 2.08 61,620 1,149 1.86 60,581 901 1.49Mortgage-backed securities 2.29 181,727 3,466 1.91 180,743 2,993 1.66 211,731 2,902 1.37FHLB dividends 0.24 9,463 12 0.13 10,268 10 0.10 10,642 — —Cash and cash equivalents 0.33 61,154 113 0.18 27,596 41 0.15 36,037 58 0.16
Total interest-earning assets (2) 3.31 832,605 27,487 3.30 754,449 26,559 3.52 742,285 25,795 3.48
Interest-bearing liabilities:Savings accounts 0.04 $ 102,696 $ 38 0.04 $ 83,686 38 0.05 $ 79,872 59 0.07Transaction accounts 0.01 106,130 10 0.01 103,333 10 0.01 99,170 10 0.01Money market accounts 0.17 217,901 436 0.20 203,375 354 0.17 196,809 353 0.18Certificates of deposit 0.94 138,287 1,185 0.86 142,775 1,135 0.79 161,359 1,546 0.96
Total deposits 0.28 565,014 1,669 0.30 533,169 1,537 0.29 537,210 1,968 0.37Borrowings 3.33 90,730 2,923 3.22 104,698 3,192 3.05 100,113 4,032 4.03
Total interest-bearing liabilities 0.65 655,744 4,592 0.70 637,867 4,729 0.74 637,323 6,000 0.94
Net interest income $22,895 $21,830 $19,795Net interest rate spread 2.66 2.60 2.78 2.54Net earning assets $ 176,861 $ 116,582 $ 104,962Net interest margin (3) 2.75 2.89 2.67Average interest-earning assets to average interest-
bearing liabilities 127.0% 118.3% 116.5%
(1) The average loans receivable, net balances include nonaccruing loans.(2) Includes interest-bearing deposits (cash) at other financial institutions.(3) Net interest income divided by average interest-earning assets.

81
Rate/Volume Analysis
The following table presents the dollar amount of changes in interest income and interest expense for major components of interest-earning assets and interest-bearing liabilities. It distinguishes between the changes related to outstanding balances and due to the changes in interest rates. For each category of interest-earning assets and interest-bearing liabilities, information is provided on changes attributable to (i) changes in volume (i.e., changes in volume multiplied by old rate) and (ii) changes in rate (i.e., changes in rate multiplied by old volume). For purposes of this table, changes attributable to both rate and volume, which cannot be segregated, have been allocated proportionately to the change due to volume and the change due to rate.
Year Ended Year EndedJune 30, 2015 vs. 2014 June 30, 2014 vs. 2013
Increase (Decrease)Due to
TotalIncrease
Increase (Decrease)Due to
TotalIncrease
Volume Rate (Decrease) Volume Rate (Decrease)(In thousands)
Interest earning assets:Loans receivable $ 815 $ (1,135) $ (320) $ 2,639 $ (2,207) $ 432Investment and mortgage-backed securities 521 653 1,174 (410) 749 339FHLB stock (1) 3 2 — 10 10Other(1) 50 22 72 (14) (3) (17)
Total interest-earning assets $ 1,385 $ (457) $ 928 $ 2,215 $ (1,451) $ 764
Interest-bearing liabilities:Savings accounts $ 10 $ (10) $ — $ 3 $ (24) $ (21)Interest-bearing transaction accounts — — — 7 (7) —Money market accounts 25 57 82 12 (11) 1Certificates of deposit (35) 85 50 (178) (233) (411)Borrowings (426) 157 (269) 185 (1,025) (840)
Total interest-bearing liabilities $ (426) $ 289 $ (137) $ 29 $ (1,300) $ (1,271)
Net change in interest income $ 1,811 $ (746) $ 1,065 $ 2,186 $ (151) $ 2,035
(1) Includes interest-bearing deposits (cash) at other financial institutions.
Asset and Liability Management and Market Risk
Risk Management Overview. Managing risk is an essential part of successfully managing a financial institution. Our Enterprise Risk Management committee reports key risk indicators to the board of directors through the Audit Committee. The most prominent risk exposures management monitors are: strategic, credit, interest rate, liquidity, operational, compliance, reputational and legal risk. We utilize the services of outside firms to assist us in our asset and liability management and our analysis of market risk.
Interest Rate Risk Management. We manage the interest rate sensitivity of interest-bearing liabilities and interest-earning assets in an effort to minimize the adverse effects of changes in the interest rate environment. Except for certain adjustable-rate home equity lines of credit and commercial real estate loans that are tied to the prime rate, the twelve month constant maturity treasury, or the London Interbank Offered Rate ("LIBOR"), deposit accounts typically reprice more quickly in response to changes in market interest rates than mortgage loans because of their shorter maturities. As a result, sharp increases in interest rates may adversely affect earnings. Typically, decreases in interest rates beneficially affect our earnings in the short term, but with the Federal Reserve Board maintaining the federal funds rate near zero for a prolonged period, decreases in interest rates adversely affect earnings due to prepayments and refinancing associated with loans and investment securities, which are then reinvested in lower yielding assets, reducing interest income. In contrast, First Federal has little or no long-term ability to reduce funding costs associated with deposits and borrowings. To increase earnings in the short-term,

82
management has recently begun adding a limited amount of fixed-rate conforming residential mortgage loans to the loan portfolio.
We currently do not participate in hedging programs, interest rate swaps or other activities involving the use of derivative financial instruments to manage interest rate risk.
Interest Rate Sensitivity Analysis. Management uses an interest rate sensitivity analysis to review our level of interest rate risk. This analysis measures interest rate risk by computing changes in the present value of our cash flows from assets, liabilities and off-balance sheet items in the event of a range of assumed changes in market interest rates. The present value of equity is equal to the market value of assets minus the market value of liabilities, with adjustments made for off-balance sheet items. This analysis assesses the risk of loss in market risk sensitive instruments in the event of a sudden and sustained 100 to 300 basis point increase or a 100 basis point decrease in market interest rates with no effect given to any future steps that management might take to counter the impact of that interest rate movement. The following table presents the change in the present value of First Federal’s equity at June 30, 2015, that would occur in the event of an immediate change in interest rates based on management’s assumptions.
June 30, 2015Economic Value of Equity
Basis PointChange in
InterestRates $ Amount $ Change % Change
EVERatio
%(Dollars in thousands)
+ 300 $ 161,061 $ (21,882) (12.0)% 19.6%+ 200 169,154 (13,789) (7.5) 19.9+ 100 176,905 (6,038) (3.3) 20.2
0 182,943 — — 20.3- 100 170,643 (12,300) (6.7) 18.5
Using the same assumptions as above, the sensitivity of our projected net interest income for the year ended June 30, 2015, is as follows:
June 30, 2015Projected Net Interest Income
Basis PointChange in
InterestRates $ Amount $ Change % Change
(Dollars in thousands)
+ 300 $ 21,263 $ (2,923) (12.1)%+ 200 22,402 (1,784) (7.4)+ 100 23,347 (839) (3.5)
0 24,186 — —- 100 23,388 (798) (3.3)
Assumptions made by management relate to interest rates, loan prepayment rates, deposit decay rates, and the market values of certain assets under differing interest rate scenarios, among others. As with any method of measuring interest rate risk, certain shortcomings are inherent in the method of analysis presented in the foregoing tables. For example, although certain assets and liabilities may have similar maturities or periods to repricing, they may react in different degrees to changes in market interest rates. Also, the interest rates on certain types of assets and liabilities may fluctuate in advance of changes in market interest rates, while interest rates on other types may lag behind changes in market rates. Additionally, certain assets have features, such as rate caps or floors, which restrict changes in interest rates on a short-term basis and over the life of the asset. Further, in the event of a change

83
in interest rates, expected rates of prepayments on loans and early withdrawals from certificates could deviate significantly from those assumed in calculating the table.
Liquidity Management
Liquidity is the ability to meet current and future financial obligations of a short-term and long-term nature. Our primary sources of funds consist of deposit inflows, loan repayments, maturities and sales of securities and borrowings from the FHLB. While maturities and scheduled amortization of loans and securities are usually predictable sources of funds, deposit flows, calls of investment securities and borrowed funds, and prepayments on loans and investment securities are greatly influenced by general interest rates, economic conditions and competition, which can cause those sources of funds to fluctuate.
Management regularly adjusts our investments in liquid assets based upon an assessment of the expected loan demand, expected deposit flows, the yields available on interest-earning deposits and securities, and the objectives of our interest-rate risk and investment policies.
Our most liquid assets are cash and cash equivalents followed by available for sale securities. The levels of these assets depend on our operating, financing, lending and investing activities during any given period. At June 30, 2015, cash and cash equivalents totaled $45.0 million. Securities classified as available-for-sale, whose aggregate market value exceeds cost, provide additional sources of liquidity and had a market value of $299.0 million at June 30, 2015. We have pledged collateral to support borrowings from the FHLB of $90.0 million. We have also established a borrowing arrangement with the Federal Reserve Bank of San Francisco; however, no collateral has been pledged as of June 30, 2015.
At June 30, 2015, we had $4.2 million in loan commitments outstanding, and an additional $39.2 million in undisbursed loans and standby letters of credit.
Certificates of deposit due within one year of June 30, 2015 totaled $71.5 million, or 48.3% of certificates of deposit. The large percentage of certificates of deposit that mature within one year reflects customers' hesitancy to invest their funds for longer periods at historically low interest rates. Management believes, based on past experience, that a significant portion of our certificates of deposit will be renewed or rolled into money market accounts. If these maturing deposits are not renewed, however, we will be required to seek other sources of funds, including other certificates of deposit and borrowings. We have the ability to attract and retain deposits by adjusting the interest rates offered. Depending on market conditions, we may be required to pay higher rates on such deposits or other borrowings than we currently pay on certificates of deposit. In addition, we believe that our branch network, which is presently comprised of nine full-service retail banking offices located throughout our primary market area, and the general cash flows from our existing lending and investment activities, will afford us sufficient long-term liquidity. For additional information, see the Consolidated Statements of Cash Flows in Item 8 of this Form 10-K.
Off-Balance Sheet Activities
In the normal course of operations, First Federal engages in a variety of financial transactions that are not recorded in the financial statements. These transactions involve varying degrees of off-balance sheet credit, interest rate and liquidity risks. These transactions are used primarily to manage customers’ requests for funding and take the form of loan commitments and lines of credit. For the year ended June 30, 2015 and the year ended June 30, 2014, we engaged in no off-balance sheet transactions likely to have a material effect on the financial condition, results of operations or cash flows.

84
Contractual Obligations
At June 30, 2015, our scheduled maturities of contractual obligations were as follows:
Within1 Year
After 1 Year Through3 Years
After 3 Years Through5 Years
Beyond5 Years
TotalBalance
(In thousands)
Certificates of deposit $ 71,474 $ 52,561 $ 23,687 $ 206 $ 147,928FHLB advances — 6,924 53,000 30,000 89,924Operating leases 128 286 206 1,395 2,015Borrower taxes and insurance 932 — — — 932Deferred compensation 83 162 — 75 320
Total contractual obligations $ 72,617 $ 59,933 $ 76,893 $ 31,676 $ 241,119
Commitments and Off-Balance Sheet Arrangements
The following table summarizes our commitments and contingent liabilities with off-balance sheet risks as of June 30, 2015:
Amount of Commitment Expiration - Per Period
TotalAmounts
Committed
Due inOneYear
(In thousands)Commitments to originate loans:
Fixed-rate $ 403 $ 403Adjustable-rate 3,780 3,780Unfunded commitments under lines of credit
or existing loans 38,956 38,956Standby letters of credit 201 201
Total $ 43,340 $ 43,340
Capital Resources
First Federal is subject to minimum capital requirements imposed by the FDIC. Capital adequacy requirements are quantitative measures established by regulation that require First Federal to maintain minimum amounts and ratios of capital.
Effective January 1, 2015 (with some changes transitioned into full effectiveness over two to four years), First Federal became subject to new capital adequacy requirements adopted by the FDIC which created a new required ratio for common equity Tier 1 (“CET1”) capital, increased the minimum Tier 1 risk-based capital ratio, changed the risk-weightings of certain assets for purposes of the risk-based capital ratios, created an additional capital conservation buffer over required risk-based capital ratios, and changed what qualifies as capital for purposes of meeting these various capital requirements. Failure to meet minimum capital requirements can initiate certain mandatory and possibly additional discretionary actions by bank regulators that, if undertaken, could have a direct material effect on the Company’s financial statements.
In addition to the capital requirements, there are a number of changes in what constitutes regulatory capital, subject to transition periods. These changes include the phasing-out of certain instruments as qualifying capital, of which First Federal has none. Mortgage servicing rights and deferred tax assets over designated percentages of CET1 are deducted from capital, subject to a four-year transition period ending December 31, 2017. CET1 consists of Tier 1 capital less all capital components that are not considered common equity. In addition, Tier 1 capital includes accumulated other comprehensive income, which includes all unrealized gains and losses on available for
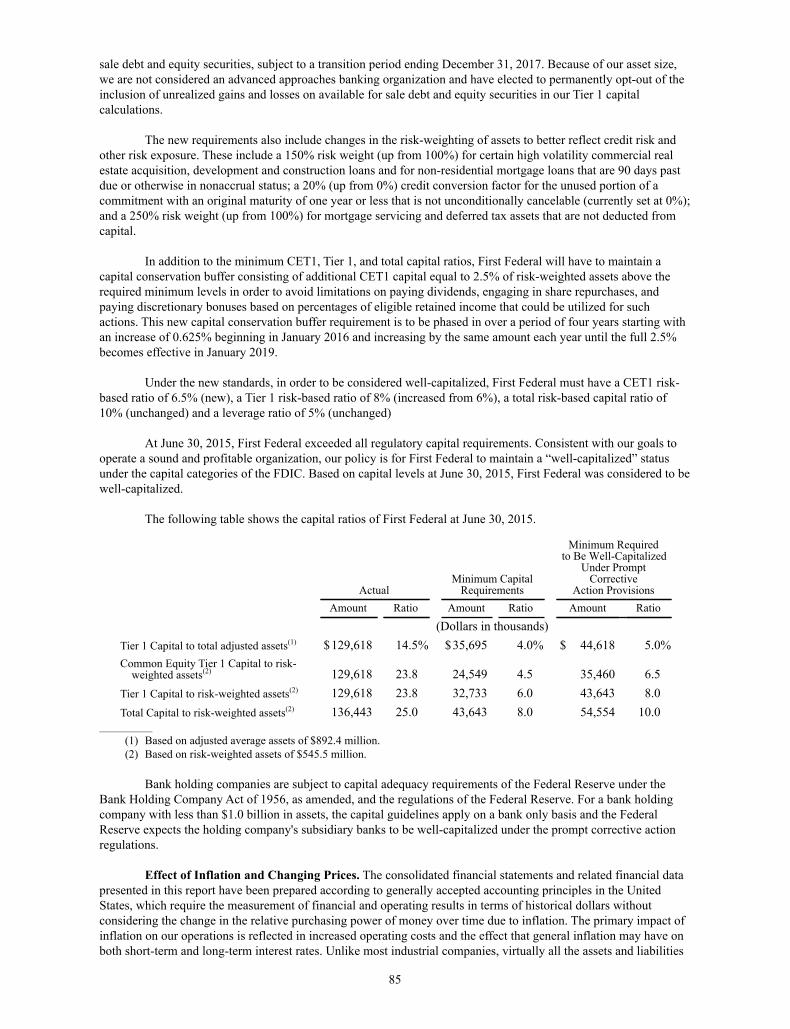
85
sale debt and equity securities, subject to a transition period ending December 31, 2017. Because of our asset size, we are not considered an advanced approaches banking organization and have elected to permanently opt-out of the inclusion of unrealized gains and losses on available for sale debt and equity securities in our Tier 1 capital calculations.
The new requirements also include changes in the risk-weighting of assets to better reflect credit risk and other risk exposure. These include a 150% risk weight (up from 100%) for certain high volatility commercial real estate acquisition, development and construction loans and for non-residential mortgage loans that are 90 days past due or otherwise in nonaccrual status; a 20% (up from 0%) credit conversion factor for the unused portion of a commitment with an original maturity of one year or less that is not unconditionally cancelable (currently set at 0%); and a 250% risk weight (up from 100%) for mortgage servicing and deferred tax assets that are not deducted from capital.
In addition to the minimum CET1, Tier 1, and total capital ratios, First Federal will have to maintain a capital conservation buffer consisting of additional CET1 capital equal to 2.5% of risk-weighted assets above the required minimum levels in order to avoid limitations on paying dividends, engaging in share repurchases, and paying discretionary bonuses based on percentages of eligible retained income that could be utilized for such actions. This new capital conservation buffer requirement is to be phased in over a period of four years starting with an increase of 0.625% beginning in January 2016 and increasing by the same amount each year until the full 2.5% becomes effective in January 2019.
Under the new standards, in order to be considered well-capitalized, First Federal must have a CET1 risk-based ratio of 6.5% (new), a Tier 1 risk-based ratio of 8% (increased from 6%), a total risk-based capital ratio of 10% (unchanged) and a leverage ratio of 5% (unchanged)
At June 30, 2015, First Federal exceeded all regulatory capital requirements. Consistent with our goals to operate a sound and profitable organization, our policy is for First Federal to maintain a “well-capitalized” status under the capital categories of the FDIC. Based on capital levels at June 30, 2015, First Federal was considered to be well-capitalized.
The following table shows the capital ratios of First Federal at June 30, 2015.
ActualMinimum Capital
Requirements
Minimum Requiredto Be Well-Capitalized
Under PromptCorrective
Action ProvisionsAmount Ratio Amount Ratio Amount Ratio
(Dollars in thousands)Tier 1 Capital to total adjusted assets(1) $129,618 14.5% $35,695 4.0% $ 44,618 5.0%Common Equity Tier 1 Capital to risk-
weighted assets(2) 129,618 23.8 24,549 4.5 35,460 6.5Tier 1 Capital to risk-weighted assets(2) 129,618 23.8 32,733 6.0 43,643 8.0Total Capital to risk-weighted assets(2) 136,443 25.0 43,643 8.0 54,554 10.0
______________
(1) Based on adjusted average assets of $892.4 million. (2) Based on risk-weighted assets of $545.5 million.
Bank holding companies are subject to capital adequacy requirements of the Federal Reserve under the Bank Holding Company Act of 1956, as amended, and the regulations of the Federal Reserve. For a bank holding company with less than $1.0 billion in assets, the capital guidelines apply on a bank only basis and the Federal Reserve expects the holding company's subsidiary banks to be well-capitalized under the prompt corrective action regulations.
Effect of Inflation and Changing Prices. The consolidated financial statements and related financial data presented in this report have been prepared according to generally accepted accounting principles in the United States, which require the measurement of financial and operating results in terms of historical dollars without considering the change in the relative purchasing power of money over time due to inflation. The primary impact of inflation on our operations is reflected in increased operating costs and the effect that general inflation may have on both short-term and long-term interest rates. Unlike most industrial companies, virtually all the assets and liabilities

86
of a financial institution are monetary in nature. As a result, interest rates generally have a more significant impact on a financial institution's performance than do general levels of inflation. Although inflation expectations do affect interest rates, interest rates do not necessarily move in the same direction or to the same extent as the prices of goods and services.
Recent Accounting Pronouncements
See Note 1 of the Notes to Consolidated Financial Statements contained in Item 8 of this Form 10-K.
Item 7A. Quantitative and Qualitative Disclosures about Market Risk
Our market risk arises principally from interest rate risk inherent in our lending, investing, deposit and borrowing activities. Management actively monitors and manages its interest rate risk exposure. In addition to other risks that we manage in the normal course of business, such as credit quality and liquidity, management considers interest rate risk to be a significant market risk that could potentially have a material effect on our financial condition and result of operations. The information contained under Item 7. "Management 's Discussion and Analysis of Financial Condition and Results of Operations - Asset and Liability Management and Market Risk" of this Form 10-K is incorporated herein by reference.
Item 8. Financial Statements and Supplementary Data
Item 1. Financial Statements
Index to Consolidated Financial Statements Page
Report of Independent Registered Public Accounting Firm Consolidated Balance Sheets, June 30, 2015 and 2014 Consolidated Statements of Operations For the Years Ended June 30, 2015, 2014 and 2013Consolidated Statements of Comprehensive (Loss) Income For the Years Ended June 30, 2015, 2014 and 2013Consolidated Statements of Changes in Stockholders’ Equity For the Years Ended June 30, 2015, 2014 and 2013 Consolidated Statements of Cash Flows For the Years Ended June 30, 2015, 2014 and 2013 Notes to Consolidated Financial Statements
8788
89
90
91
9294

REPORTOFINDEPENDENTREGISTEREDPUBLICACCOUNTINGFIRM
TheBoardofDirectorsFirstNorthwestBancorpandSubsidiaryPortAngeles,WashingtonWehaveauditedtheaccompanyingconsolidatedbalancesheetsofFirstNorthwestBancorpandSubsidiary(the“Company”)asofJune30,2015and2014,andtherelatedconsolidatedstatementsofoperations,comprehensive(loss)income,stockholders’equity,andcashflowsforeachoftheyearsinthethree‐yearperiodendedJune30,2015.TheseconsolidatedfinancialstatementsaretheresponsibilityoftheCompany’smanagement.Ourresponsibilityistoexpressanopinionontheseconsolidatedfinancialstatementsbasedonouraudits.WeconductedourauditsinaccordancewiththestandardsofthePublicCompanyAccountingOversightBoard(UnitedStates).Thosestandardsrequirethatweplanandperformtheaudittoobtainreasonableassuranceaboutwhethertheconsolidatedfinancialstatementsarefreeofmaterialmisstatement.TheCompanyisnotrequiredtohave,norwereweengagedtoperform,anauditofitsinternalcontroloverfinancialreporting.Ourauditincludedconsiderationofinternalcontroloverfinancialreportingasabasisfordesigningauditproceduresthatareappropriateinthecircumstances,butnotforthepurposeofexpressinganopinionontheeffectivenessoftheCompany’sinternalcontroloverfinancialreporting.Accordingly,weexpressnosuchopinion.Anauditalsoincludesexamining,onatestbasis,evidencesupportingtheamountsanddisclosuresintheconsolidatedfinancialstatements,assessingtheaccountingprinciplesusedandsignificantestimatesmadebymanagement,aswellasevaluatingtheoverallconsolidatedfinancialstatementpresentation.Webelievethatourauditsprovideareasonablebasisforouropinion.Inouropinion,theconsolidatedfinancialstatementsreferredtoabovepresentfairly,inallmaterialrespects,theconsolidatedfinancialpositionofFirstNorthwestBancorpandSubsidiaryasofJune30,2015and2014,andtheresultsoftheiroperationsandtheircashflowsforeachoftheyearsinthethree‐yearperiodendedJune30,2015,inconformitywithaccountingprinciplesgenerallyacceptedintheUnitedStatesofAmerica.
Everett,WashingtonSeptember24,2015

See accompanying notes to the consolidated financial statements.
88
FIRST NORTHWEST BANCORP AND SUBSIDIARYCONSOLIDATED BALANCE SHEETS
(In thousands, except share data)
June 30,ASSETS 2015 2014
Cash and due from banks $ 10,590 $ 14,228Interest-bearing deposits in banks 34,440 4,732Investment securities available for sale, at fair value 299,040 178,972Investment securities held to maturity, at amortized cost 61,524 53,244Loans held for sale 110 613Loans receivable (net of allowance for loan losses of $7,111 and $8,072) 487,887 496,184Federal Home Loan Bank (FHLB) stock, at cost 4,807 10,047Accrued interest receivable 2,546 2,272Premises and equipment, net 12,580 12,287Mortgage servicing rights, net 1,187 1,266Bank-owned life insurance, net 18,168 18,066Real estate owned and repossessed assets 1,914 810Prepaid expenses and other assets 2,009 2,571
Total assets $ 936,802 $ 795,292
LIABILITIES AND STOCKHOLDERS' EQUITY
Deposits $ 647,164 $ 600,399Borrowings 90,033 105,133Deferred tax liability, net — 1,110Accrued interest payable 265 262Accrued expenses and other liabilities 7,727 6,355Advances from borrowers for taxes and insurance 932 1,038
Total liabilities 746,121 714,297
Commitments and Contingencies (Note 13)
Stockholders' EquityPreferred stock, $0.01 par value, authorized 5,000,000 shares,
no shares issued or outstanding — —Common stock, $0.01 par value, authorized 75,000,000 shares;
issued and outstanding 13,100,360 at June 30, 2015, andnone at June 30, 2014 131 —
Additional paid-in capital 126,809 —Retained earnings 74,573 79,663Accumulated other comprehensive income, net of tax 750 1,332Unearned employee stock ownership plan (ESOP) shares (11,582) —
Total stockholders' equity 190,681 80,995
Total liabilities and stockholders' equity $ 936,802 $ 795,292

See accompanying notes to the consolidated financial statements.
89
FIRST NORTHWEST BANCORP AND SUBSIDIARYCONSOLIDATED STATEMENTS OF OPERATIONS
(In thousands, except per share data)
Year Ended June 30,2015 2014 2013
INTEREST INCOMEInterest and fees on loans receivable $ 22,046 $ 22,366 $ 21,934Interest on mortgage-backed and related securities 3,466 2,993 2,902Interest on investment securities 1,850 1,149 901Interest-bearing deposits and other 113 41 58FHLB dividends 12 10 —
Total interest income 27,487 26,559 25,795
INTEREST EXPENSEDeposits 1,669 1,537 1,968Borrowings 2,923 3,192 4,032
Total interest expense 4,592 4,729 6,000
Net interest income 22,895 21,830 19,795
PROVISION FOR LOAN LOSSES — 1,307 1,376
Net interest income after provision for loan losses 22,895 20,523 18,419
NONINTEREST INCOMELoan and deposit service fees 3,404 3,447 3,353Mortgage servicing fees, net 305 284 5Net gain on sale of loans 548 762 1,563Net gain on sale of investment securities — 112 70Increase in cash surrender value of bank-owned life insurance 102 94 316Other income 348 291 260
Total noninterest income 4,707 4,990 5,567
NONINTEREST EXPENSECompensation and benefits 12,703 11,614 10,560Real estate owned and repossessed assets, net 165 398 244Data processing 2,521 2,200 1,956Occupancy and equipment 3,058 3,053 2,881Supplies, postage, and telephone 663 695 802Regulatory assessments and state taxes 334 381 384Advertising 433 425 522Charitable contributions 9,870 183 —Professional fees 1,063 945 1,477FDIC insurance premium 544 551 680Other 1,692 1,660 1,740
Total noninterest expense 33,046 22,105 21,246
(LOSS) INCOME BEFORE (BENEFIT) PROVISION FORINCOME TAXES (5,444) 3,408 2,740
(BENEFIT) PROVISION FOR INCOME TAXES (354) 740 422
NET (LOSS) INCOME $ (5,090) $ 2,668 $ 2,318
Basic and diluted (loss) per share $ (0.42) na (1) na (1)
(1) Not applicable as no shares were issued and outstanding during this period.
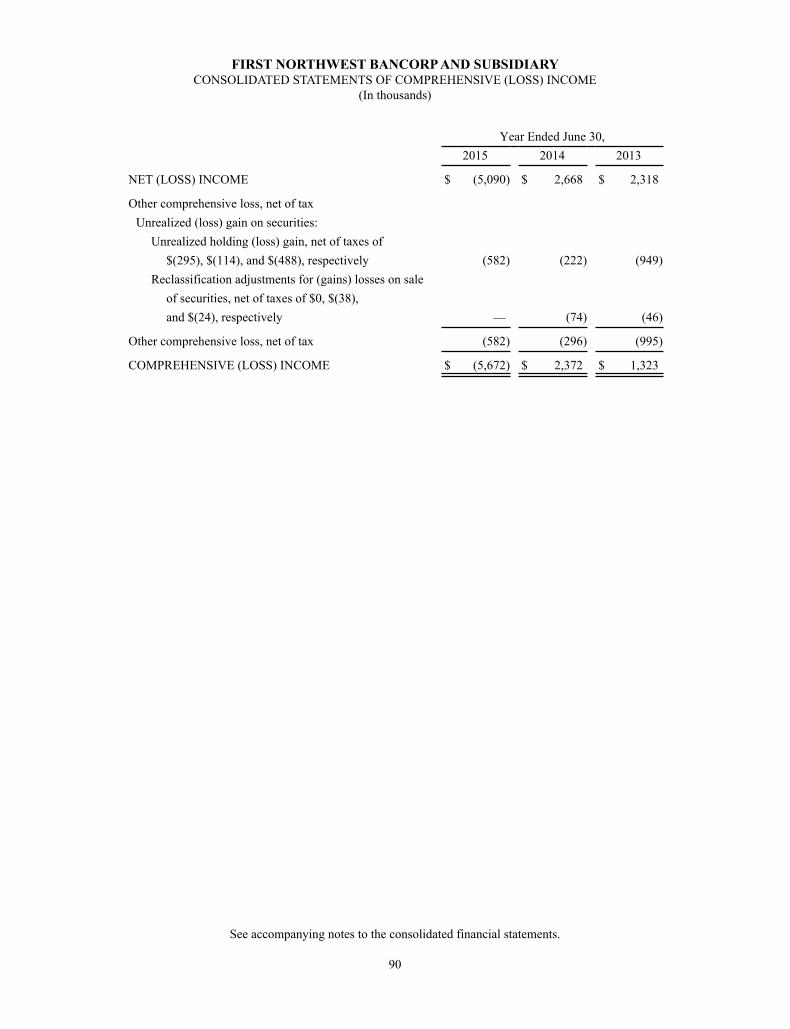
See accompanying notes to the consolidated financial statements.
90
FIRST NORTHWEST BANCORP AND SUBSIDIARYCONSOLIDATED STATEMENTS OF COMPREHENSIVE (LOSS) INCOME
(In thousands)
Year Ended June 30,2015 2014 2013
NET (LOSS) INCOME $ (5,090) $ 2,668 $ 2,318
Other comprehensive loss, net of taxUnrealized (loss) gain on securities:
Unrealized holding (loss) gain, net of taxes of$(295), $(114), and $(488), respectively (582) (222) (949)
Reclassification adjustments for (gains) losses on saleof securities, net of taxes of $0, $(38),and $(24), respectively — (74) (46)
Other comprehensive loss, net of tax (582) (296) (995)
COMPREHENSIVE (LOSS) INCOME $ (5,672) $ 2,372 $ 1,323

See accompanying notes to the consolidated financial statements.
91
FIRST NORTHWEST BANCORP AND SUBSIDIARYCONSOLIDATED STATEMENTS OF CHANGES IN STOCKHOLDERS' EQUITY
(In thousands, except share data)
Common Stock AdditionalPaid-inCapital
RetainedEarnings
UnearnedESOPShares
AccumulatedOther
Comprehensive(Loss) Income,
Net of Tax
TotalStockholders'
EquityShares Amount
BALANCE, June 30, 2012 — $ — $ — $ 74,677 $ — $ 2,623 $ 77,300
Net income 2,318 2,318Other comprehensive loss, net
of tax (995) (995)
BALANCE, June 30, 2013 — $ — $ — $ 76,995 $ — $ 1,628 $ 78,623
Net income 2,668 2,668Other comprehensive loss, net
of tax (296) (296)
BALANCE, June 30, 2014 — $ — $ — $ 79,663 $ — $ 1,332 $ 80,995
Net loss (5,090) (5,090)Other comprehensive loss, net
of tax (582) (582)Proceeds from stock offering,
net of expenses 13,100,360 131 126,810 126,941Purchase of ESOP shares (11,799) (11,799)Allocation of ESOP shares (1) 217 216
BALANCE, June 30, 2015 13,100,360 $ 131 $ 126,809 $ 74,573 $ (11,582) $ 750 $ 190,681
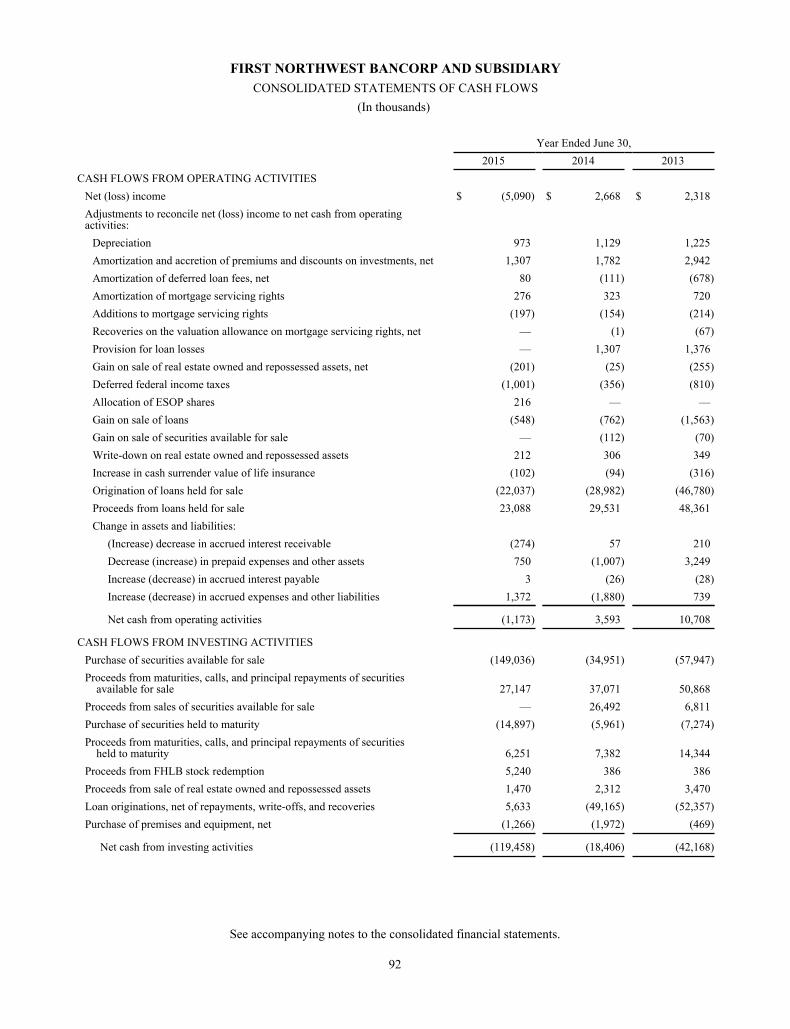
See accompanying notes to the consolidated financial statements.
92
FIRST NORTHWEST BANCORP AND SUBSIDIARYCONSOLIDATED STATEMENTS OF CASH FLOWS
(In thousands)
Year Ended June 30,2015 2014 2013
CASH FLOWS FROM OPERATING ACTIVITIESNet (loss) income $ (5,090) $ 2,668 $ 2,318Adjustments to reconcile net (loss) income to net cash from operatingactivities:
Depreciation 973 1,129 1,225Amortization and accretion of premiums and discounts on investments, net 1,307 1,782 2,942Amortization of deferred loan fees, net 80 (111) (678)Amortization of mortgage servicing rights 276 323 720Additions to mortgage servicing rights (197) (154) (214)Recoveries on the valuation allowance on mortgage servicing rights, net — (1) (67)Provision for loan losses — 1,307 1,376Gain on sale of real estate owned and repossessed assets, net (201) (25) (255)Deferred federal income taxes (1,001) (356) (810)Allocation of ESOP shares 216 — —Gain on sale of loans (548) (762) (1,563)Gain on sale of securities available for sale — (112) (70)Write-down on real estate owned and repossessed assets 212 306 349Increase in cash surrender value of life insurance (102) (94) (316)Origination of loans held for sale (22,037) (28,982) (46,780)Proceeds from loans held for sale 23,088 29,531 48,361Change in assets and liabilities:
(Increase) decrease in accrued interest receivable (274) 57 210Decrease (increase) in prepaid expenses and other assets 750 (1,007) 3,249Increase (decrease) in accrued interest payable 3 (26) (28)Increase (decrease) in accrued expenses and other liabilities 1,372 (1,880) 739
Net cash from operating activities (1,173) 3,593 10,708
CASH FLOWS FROM INVESTING ACTIVITIESPurchase of securities available for sale (149,036) (34,951) (57,947)Proceeds from maturities, calls, and principal repayments of securities
available for sale 27,147 37,071 50,868Proceeds from sales of securities available for sale — 26,492 6,811Purchase of securities held to maturity (14,897) (5,961) (7,274)Proceeds from maturities, calls, and principal repayments of securities
held to maturity 6,251 7,382 14,344Proceeds from FHLB stock redemption 5,240 386 386Proceeds from sale of real estate owned and repossessed assets 1,470 2,312 3,470Loan originations, net of repayments, write-offs, and recoveries 5,633 (49,165) (52,357)Purchase of premises and equipment, net (1,266) (1,972) (469)
Net cash from investing activities (119,458) (18,406) (42,168)
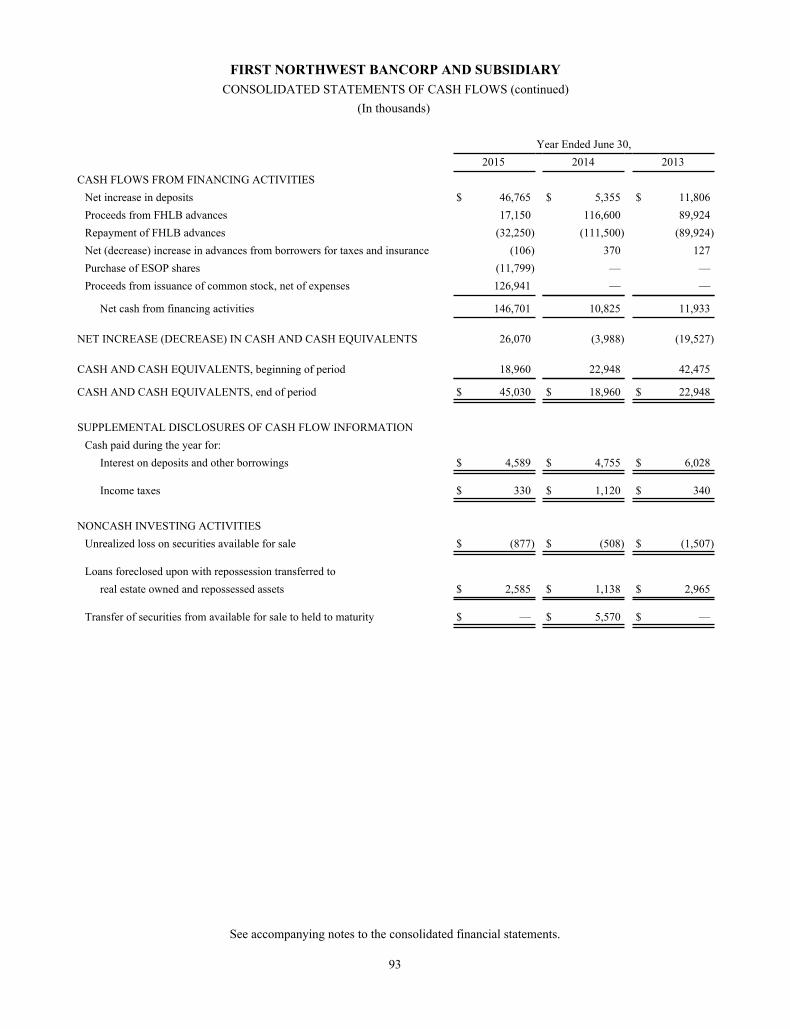
See accompanying notes to the consolidated financial statements.
93
FIRST NORTHWEST BANCORP AND SUBSIDIARYCONSOLIDATED STATEMENTS OF CASH FLOWS (continued)
(In thousands)
Year Ended June 30,2015 2014 2013
CASH FLOWS FROM FINANCING ACTIVITIESNet increase in deposits $ 46,765 $ 5,355 $ 11,806Proceeds from FHLB advances 17,150 116,600 89,924Repayment of FHLB advances (32,250) (111,500) (89,924)Net (decrease) increase in advances from borrowers for taxes and insurance (106) 370 127Purchase of ESOP shares (11,799) — —Proceeds from issuance of common stock, net of expenses 126,941 — —
Net cash from financing activities 146,701 10,825 11,933
NET INCREASE (DECREASE) IN CASH AND CASH EQUIVALENTS 26,070 (3,988) (19,527)
CASH AND CASH EQUIVALENTS, beginning of period 18,960 22,948 42,475
CASH AND CASH EQUIVALENTS, end of period $ 45,030 $ 18,960 $ 22,948
SUPPLEMENTAL DISCLOSURES OF CASH FLOW INFORMATIONCash paid during the year for:
Interest on deposits and other borrowings $ 4,589 $ 4,755 $ 6,028
Income taxes $ 330 $ 1,120 $ 340
NONCASH INVESTING ACTIVITIESUnrealized loss on securities available for sale $ (877) $ (508) $ (1,507)
Loans foreclosed upon with repossession transferred toreal estate owned and repossessed assets $ 2,585 $ 1,138 $ 2,965
Transfer of securities from available for sale to held to maturity $ — $ 5,570 $ —
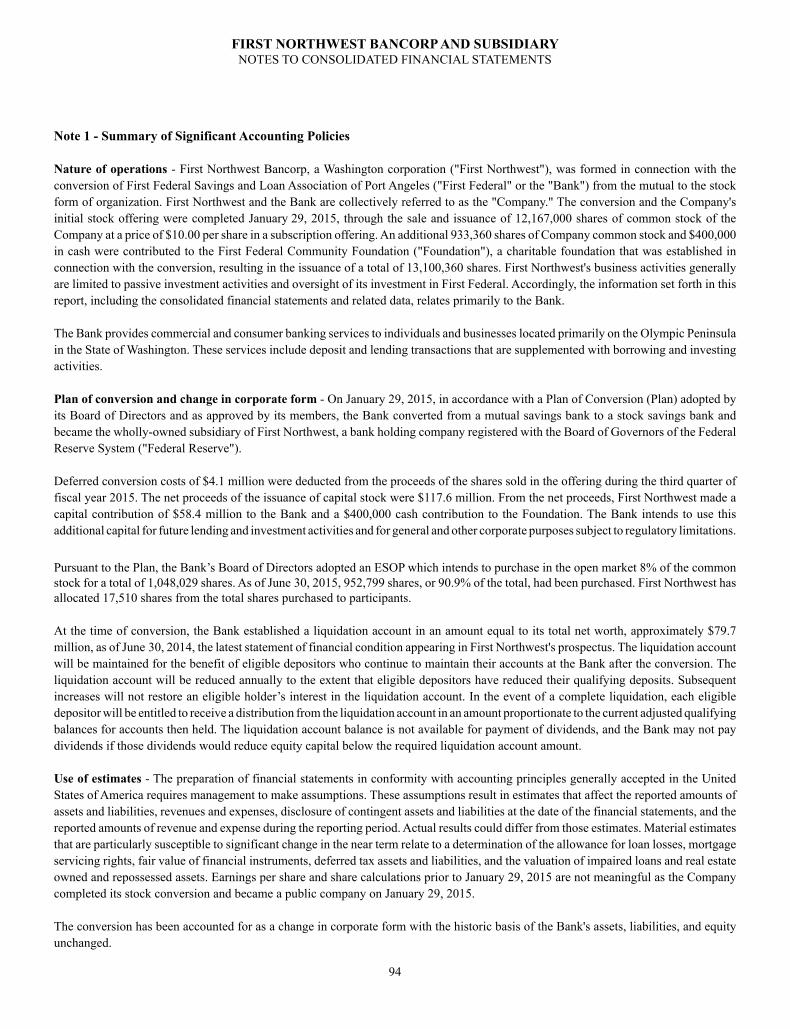
FIRST NORTHWEST BANCORP AND SUBSIDIARYNOTES TO CONSOLIDATED FINANCIAL STATEMENTS
94
Note 1 - Summary of Significant Accounting Policies
Nature of operations - First Northwest Bancorp, a Washington corporation ("First Northwest"), was formed in connection with the conversion of First Federal Savings and Loan Association of Port Angeles ("First Federal" or the "Bank") from the mutual to the stock form of organization. First Northwest and the Bank are collectively referred to as the "Company." The conversion and the Company's initial stock offering were completed January 29, 2015, through the sale and issuance of 12,167,000 shares of common stock of the Company at a price of $10.00 per share in a subscription offering. An additional 933,360 shares of Company common stock and $400,000 in cash were contributed to the First Federal Community Foundation ("Foundation"), a charitable foundation that was established in connection with the conversion, resulting in the issuance of a total of 13,100,360 shares. First Northwest's business activities generally are limited to passive investment activities and oversight of its investment in First Federal. Accordingly, the information set forth in this report, including the consolidated financial statements and related data, relates primarily to the Bank.
The Bank provides commercial and consumer banking services to individuals and businesses located primarily on the Olympic Peninsula in the State of Washington. These services include deposit and lending transactions that are supplemented with borrowing and investing activities.
Plan of conversion and change in corporate form - On January 29, 2015, in accordance with a Plan of Conversion (Plan) adopted by its Board of Directors and as approved by its members, the Bank converted from a mutual savings bank to a stock savings bank and became the wholly-owned subsidiary of First Northwest, a bank holding company registered with the Board of Governors of the Federal Reserve System ("Federal Reserve").
Deferred conversion costs of $4.1 million were deducted from the proceeds of the shares sold in the offering during the third quarter of fiscal year 2015. The net proceeds of the issuance of capital stock were $117.6 million. From the net proceeds, First Northwest made a capital contribution of $58.4 million to the Bank and a $400,000 cash contribution to the Foundation. The Bank intends to use this additional capital for future lending and investment activities and for general and other corporate purposes subject to regulatory limitations.
Pursuant to the Plan, the Bank’s Board of Directors adopted an ESOP which intends to purchase in the open market 8% of the common stock for a total of 1,048,029 shares. As of June 30, 2015, 952,799 shares, or 90.9% of the total, had been purchased. First Northwest has allocated 17,510 shares from the total shares purchased to participants.
At the time of conversion, the Bank established a liquidation account in an amount equal to its total net worth, approximately $79.7 million, as of June 30, 2014, the latest statement of financial condition appearing in First Northwest's prospectus. The liquidation account will be maintained for the benefit of eligible depositors who continue to maintain their accounts at the Bank after the conversion. The liquidation account will be reduced annually to the extent that eligible depositors have reduced their qualifying deposits. Subsequent increases will not restore an eligible holder’s interest in the liquidation account. In the event of a complete liquidation, each eligible depositor will be entitled to receive a distribution from the liquidation account in an amount proportionate to the current adjusted qualifying balances for accounts then held. The liquidation account balance is not available for payment of dividends, and the Bank may not pay dividends if those dividends would reduce equity capital below the required liquidation account amount.
Use of estimates - The preparation of financial statements in conformity with accounting principles generally accepted in the United States of America requires management to make assumptions. These assumptions result in estimates that affect the reported amounts of assets and liabilities, revenues and expenses, disclosure of contingent assets and liabilities at the date of the financial statements, and the reported amounts of revenue and expense during the reporting period. Actual results could differ from those estimates. Material estimates that are particularly susceptible to significant change in the near term relate to a determination of the allowance for loan losses, mortgage servicing rights, fair value of financial instruments, deferred tax assets and liabilities, and the valuation of impaired loans and real estate owned and repossessed assets. Earnings per share and share calculations prior to January 29, 2015 are not meaningful as the Company completed its stock conversion and became a public company on January 29, 2015.
The conversion has been accounted for as a change in corporate form with the historic basis of the Bank's assets, liabilities, and equity unchanged.
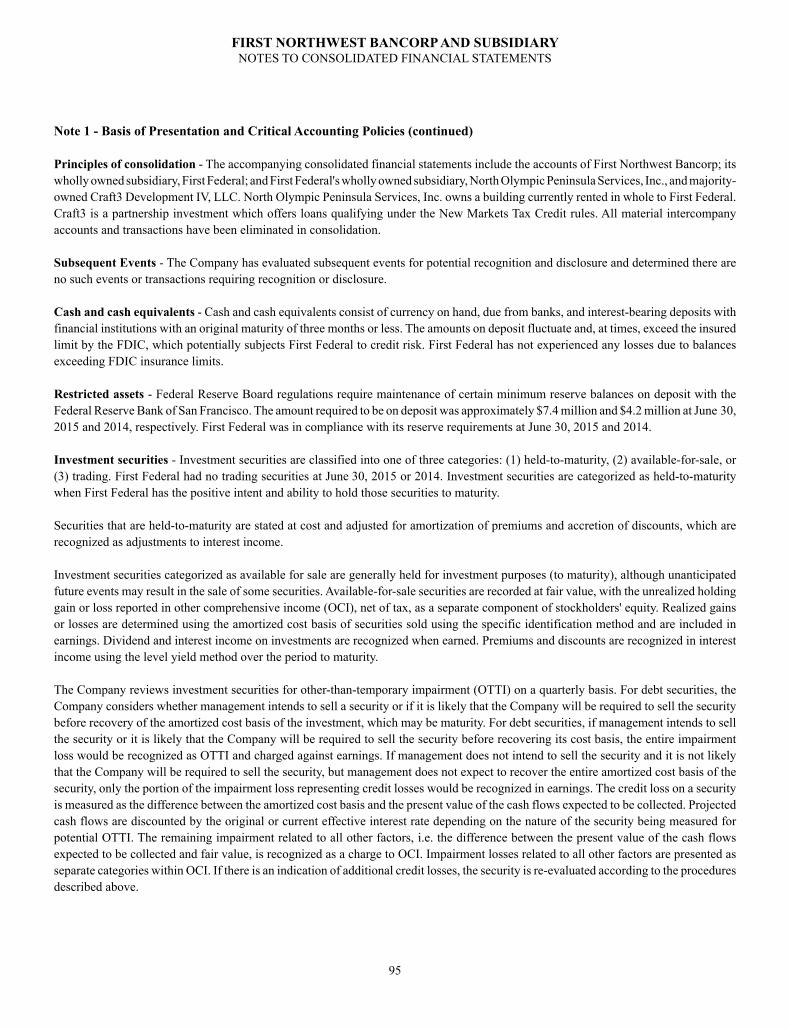
FIRST NORTHWEST BANCORP AND SUBSIDIARYNOTES TO CONSOLIDATED FINANCIAL STATEMENTS
95
Note 1 - Basis of Presentation and Critical Accounting Policies (continued)
Principles of consolidation - The accompanying consolidated financial statements include the accounts of First Northwest Bancorp; its wholly owned subsidiary, First Federal; and First Federal's wholly owned subsidiary, North Olympic Peninsula Services, Inc., and majority-owned Craft3 Development IV, LLC. North Olympic Peninsula Services, Inc. owns a building currently rented in whole to First Federal. Craft3 is a partnership investment which offers loans qualifying under the New Markets Tax Credit rules. All material intercompany accounts and transactions have been eliminated in consolidation.
Subsequent Events - The Company has evaluated subsequent events for potential recognition and disclosure and determined there are no such events or transactions requiring recognition or disclosure.
Cash and cash equivalents - Cash and cash equivalents consist of currency on hand, due from banks, and interest-bearing deposits with financial institutions with an original maturity of three months or less. The amounts on deposit fluctuate and, at times, exceed the insured limit by the FDIC, which potentially subjects First Federal to credit risk. First Federal has not experienced any losses due to balances exceeding FDIC insurance limits.
Restricted assets - Federal Reserve Board regulations require maintenance of certain minimum reserve balances on deposit with the Federal Reserve Bank of San Francisco. The amount required to be on deposit was approximately $7.4 million and $4.2 million at June 30, 2015 and 2014, respectively. First Federal was in compliance with its reserve requirements at June 30, 2015 and 2014.
Investment securities - Investment securities are classified into one of three categories: (1) held-to-maturity, (2) available-for-sale, or (3) trading. First Federal had no trading securities at June 30, 2015 or 2014. Investment securities are categorized as held-to-maturity when First Federal has the positive intent and ability to hold those securities to maturity.
Securities that are held-to-maturity are stated at cost and adjusted for amortization of premiums and accretion of discounts, which are recognized as adjustments to interest income.
Investment securities categorized as available for sale are generally held for investment purposes (to maturity), although unanticipated future events may result in the sale of some securities. Available-for-sale securities are recorded at fair value, with the unrealized holding gain or loss reported in other comprehensive income (OCI), net of tax, as a separate component of stockholders' equity. Realized gains or losses are determined using the amortized cost basis of securities sold using the specific identification method and are included in earnings. Dividend and interest income on investments are recognized when earned. Premiums and discounts are recognized in interest income using the level yield method over the period to maturity.
The Company reviews investment securities for other-than-temporary impairment (OTTI) on a quarterly basis. For debt securities, the Company considers whether management intends to sell a security or if it is likely that the Company will be required to sell the security before recovery of the amortized cost basis of the investment, which may be maturity. For debt securities, if management intends to sell the security or it is likely that the Company will be required to sell the security before recovering its cost basis, the entire impairment loss would be recognized as OTTI and charged against earnings. If management does not intend to sell the security and it is not likely that the Company will be required to sell the security, but management does not expect to recover the entire amortized cost basis of the security, only the portion of the impairment loss representing credit losses would be recognized in earnings. The credit loss on a security is measured as the difference between the amortized cost basis and the present value of the cash flows expected to be collected. Projected cash flows are discounted by the original or current effective interest rate depending on the nature of the security being measured for potential OTTI. The remaining impairment related to all other factors, i.e. the difference between the present value of the cash flows expected to be collected and fair value, is recognized as a charge to OCI. Impairment losses related to all other factors are presented as separate categories within OCI. If there is an indication of additional credit losses, the security is re-evaluated according to the procedures described above.

FIRST NORTHWEST BANCORP AND SUBSIDIARYNOTES TO CONSOLIDATED FINANCIAL STATEMENTS
96
Note 1 - Summary of Significant Accounting Policies (continued)
Federal Home Loan Bank stock - First Federal’s investment in Federal Home Loan Bank of Des Moines (FHLB) stock is carried at cost, which approximates fair value. As a member of the FHLB system, First Federal is required to maintain a minimum investment in FHLB stock based on specific percentages of its outstanding mortgages, total assets, or FHLB advances. At June 30, 2015 and 2014, First Federal’s minimum investment requirement was approximately $4.8 million and $4.9 million, respectively. First Federal was in compliance with the FHLB minimum investment requirement at June 30, 2015 and 2014. First Federal may request redemption at par value of any stock in excess of the amount First Federal is required to hold. Stock redemptions are granted at the discretion of the FHLB.
Management evaluates FHLB stock for impairment based on its assessment of the ultimate recoverability of cost rather than by recognizing temporary declines in value. The determination of whether a decline affects the ultimate recoverability of cost is influenced by criteria such as (1) the significance of any decline in net assets of the FHLB compared with the capital stock amount for the FHLB and the length of time this situation has persisted, (2) commitments by the FHLB to make payments required by law or regulation and the level of such payments in relation to the operating performance of the FHLB, (3) the impact of legislative and regulatory changes on institutions and, accordingly, the customer base of the FHLB, and (4) the liquidity position of the FHLB. Based on its evaluation, First Federal did not recognize an OTTI loss on its FHLB stock at June 30, 2015 and 2014.
Loans held for sale - Mortgage loans originated and intended for sale in the secondary market are carried at the lower of aggregate cost or fair value. Fair value is determined based upon market prices from third-party purchasers and brokers. Net unrealized losses, if any, are recognized through a valuation allowance by charges to earnings. Gains or losses on the sale of loans are recognized at the time of sale and determined by the difference between net sale proceeds and the net book value of the loan less the estimated fair value of any retained mortgage servicing rights.
Loans receivable - Loans are stated at the amount of unpaid principal, net of charge-offs, unearned income, allowance for loan loss (ALLL) and any deferred fees or costs. Interest on loans is calculated using the simple interest method based on the month end balance of the principal amount outstanding and is credited to income as earned. The estimated life is adjusted for prepayments.
Each loan segment and class inherently contains differing credit risk profiles depending on the unique aspects of that segment or class of loans. For example, borrowers tend to consider their primary residence and access to transportation for employment-related purposes as basic requirements; accordingly, many consumers prioritize making payments on real estate first-mortgage loans and vehicle loans. Conversely, second-mortgage real estate loans or unsecured loans may not be supported by sufficient collateral; thus, in the event of financial hardship, borrowers may tend to place less importance on maintaining these loans as current and the Bank may not have adequate collateral to provide a secondary source of repayment in the event of default. Notwithstanding the various risk profiles unique to each class of loan, management believes that the credit risk for all loans is similarly dependent on essentially the same factors, including the financial strength of the borrower, the cash flow available to service maturing debt obligations, the condition and value of underlying collateral, the financial strength of any guarantors, and other factors.
Loans are classified as impaired when, based on current information and events, it is probable that First Federal will be unable to collect the scheduled payments of principal and interest when due, in accordance with the terms of the original loan agreement. The carrying value of impaired loans is based on the present value of expected future cash flows discounted at each loan’s effective interest rate or, for collateral dependent loans, at fair value of the collateral, less selling costs. If the measurement of each impaired loan’s value is less than the recorded investment in the loan, First Federal recognizes this impairment and adjusts the carrying value of the loan to fair value through the allowance for loan losses. This can be accomplished by charging off the impaired portion of the loan or establishing a specific component to be provided for in the allowance for loan losses.
The accrual of interest on mortgage and commercial loans is discontinued at the time the loan is 90 days delinquent, unless the credit is well secured and in process of collection. In all cases, loans are placed on nonaccrual or charged off at an earlier date if collection of principal or interest is considered doubtful.

FIRST NORTHWEST BANCORP AND SUBSIDIARYNOTES TO CONSOLIDATED FINANCIAL STATEMENTS
97
Note 1 - Summary of Significant Accounting Policies (continued)
All interest accrued but not collected for loans that are placed on nonaccrual or charged off is reversed against interest income. The interest on these loans is accounted for on the cash basis or cost recovery method until qualifying for return to accrual. Loans are returned to accrual status when all the principal and interest amounts contractually due are brought current and future payments are reasonably assured. For those loans placed on non-accrual status due to payment delinquency, return to accrual status will generally not occur until the borrower demonstrates repayment ability over a period of not less than six months.
Loan fees - Loan origination fees and certain direct origination costs are deferred and amortized as an adjustment to the yield of the loan over the contractual life using the effective interest method. In the event a loan is sold, the remaining deferred loan origination fees and/or costs are recognized as a component of gains or losses on the sale of loans.
Allowance for loan losses - First Federal maintains a general allowance for loan losses based on evaluating known and inherent risks in the loan portfolio, including management’s continuing analysis of the factors underlying the quality of the loan portfolio. These factors include changes in the size and composition of the loan portfolio, actual loan loss experience, and current and anticipated economic conditions. The reserve is an estimate based upon factors and trends identified by management at the time the financial statements are prepared.
The ultimate recovery of loans is susceptible to future market factors beyond First Federal’s control, which may result in losses or recoveries differing significantly from those provided in the consolidated financial statements. In addition, various regulatory agencies, as an integral part of their examination processes, periodically review First Federal’s allowance for loan losses. Such agencies may require First Federal to recognize additional provisions for loan losses based on their judgment using information available to them at the time of their examination.
Allowances for losses on specific problem loans are charged to income when it is determined that the value of these loans and properties, in the judgment of management, is impaired. First Federal accounts for impaired loans in accordance with Accounting Standards Codification (ASC) 310-10-35, Receivables—Overall—Subsequent Measurement. A loan is considered impaired when, based on current information and events, it is probable that First Federal will be unable to collect all amounts due according to the contractual terms of the loan agreement.
When a loan has been identified as being impaired, the amount of the impairment is measured by using discounted cash flows, except when it is determined that the sole source of repayment for the loan is the operation or liquidation of the underlying collateral. In such cases, impairment is measured at current fair value generally based on a current appraisal of the collateral, reduced by estimated selling costs. When the measurement of the impaired loan is less than the recorded investment in the loan (including collected interest that has been applied to principal, net deferred loan fees or costs, and unamortized premiums or discounts), loan impairment is recognized by establishing or adjusting an allocation of the allowance for loan losses. Uncollected accrued interest is reversed against interest income. If ultimate collection of principal is in doubt, all cash receipts on impaired loans are applied to reduce the principal balance. The impairment amount for small balance homogeneous loans is calculated using the adjusted historical loss rate for the class and risk category related to each loan, unless the loan is subject to a troubled debt restructuring ("TDR").
A TDR is a loan for which First Federal, for reasons related to the borrower’s financial difficulties, grants a concession to the borrower that First Federal would not otherwise consider. The loan terms that have been modified or restructured due to the borrower’s financial difficulty include, but are not limited to, a reduction in the stated interest rate; an extension of the maturity; an interest rate below market; a reduction in the face amount of the debt; a reduction in the accrued interest; or extension, deferral, renewal, or rewrite of the original loan terms.
The restructured loans may be classified “special mention” or “substandard” depending on the severity of the modification. Loans that were paid current at the time of modification may be upgraded in their classification after a sustained period of repayment performance, usually six months or longer, and there is reasonable assurance that repayment will continue. Loans that are past due at the time of modification are classified “substandard” and placed on nonaccrual status.

FIRST NORTHWEST BANCORP AND SUBSIDIARYNOTES TO CONSOLIDATED FINANCIAL STATEMENTS
98
Note 1 - Summary of Significant Accounting Policies (continued)
TDR loans may be upgraded in their classification and placed on accrual status once there is a sustained period of repayment performance, usually six months or longer, and there is a reasonable assurance that repayment will continue. First Federal allows reclassification of a troubled debt restructuring back into the general loan pool (as a non-troubled debt restructuring) if the borrower is able to refinance the loan at then-current market rates and meet all of the underwriting criteria of First Federal required of other borrowers. The refinance must be based on the borrower’s ability to repay the debt and no special concessions of rate and/or term are granted to the borrower.
Reserve for unfunded commitments - Management maintains a reserve for unfunded commitments to absorb probable losses associated with off-balance sheet commitments to lend funds such as unused lines of credit and the undisbursed portion of construction loans. Management determines the adequacy of the reserve based on reviews of individual exposures, current economic conditions, and other relevant factors. The reserve is based on estimates and ultimate losses may vary from the current estimates. The reserve is evaluated on a regular basis and necessary adjustments are reported in earnings during the period in which they become known. The reserve for unfunded commitments is included in "Accrued expenses and other liabilities" on the consolidated balance sheets.
Real estate owned and repossessed assets - Real estate owned and repossessed assets include real estate and personal property acquired through foreclosure or repossession, and may include in-substance foreclosed properties. In-substance foreclosed properties are those properties for which the Bank has taken physical possession, regardless of whether formal foreclosure proceedings have taken place.
At the time of foreclosure, foreclosed real estate is recorded at the fair value less estimated costs to sell, which becomes the property’s new cost basis. Any write-downs based on the asset’s fair value at date of acquisition are charged to the allowance for loan losses. After foreclosure, valuations are periodically performed by management and property held for sale is carried at the lower of the new cost basis or fair value less estimated costs to sell. Impairment losses on property to be held and used are measured as the amount by which the carrying amount of a property exceeds its fair value. Subsequent gains, losses, and expenses recognized on the sale of these properties are included in noninterest expense. The amounts ultimately recovered on foreclosed assets may differ substantially from the carrying value of the assets due to future market factors beyond management's control.
Mortgage servicing rights - Originated servicing rights are recorded when mortgage loans are originated and subsequently sold with the servicing rights retained. Servicing assets are initially recognized at fair value on the consolidated balance sheets and amortized into non-interest income in proportion to, and over the period of, the estimated future net servicing income of the underlying financial asset. To determine the fair value of servicing rights, management uses a valuation model that calculates the present value of future cash flows. Assumptions used in the valuation model include market discount rates and anticipated prepayment speeds. In addition, estimates of the cost of servicing per loan, an inflation rate, ancillary income per loan, and default rates are used. The initial fair value relating to the servicing rights is capitalized and amortized into noninterest income in proportion to, and over the period of, estimated future net servicing income.
Management assesses impairment of the mortgage servicing rights based on recalculations of the present value of remaining future cash flows using updated market discount rates and prepayment speeds. Subsequent loan prepayments and changes in prepayment assumptions in excess of those forecasted can adversely impact the carrying value of the servicing rights. Impairment is assessed on a stratified basis with any impairment recognized through a valuation allowance for each impaired stratum. The servicing rights are stratified based on the predominant risk characteristics of the underlying loans: fixed-rate loans and adjustable-rate loans. The effect of changes in market interest rates on estimated rates of loan prepayments is the predominant risk characteristic for mortgage servicing rights. The valuation model incorporates assumptions that market participants would use in estimating future net servicing income, such as the cost to service, the discount rate, the custodial earnings rate, an inflation rate, ancillary income, prepayment speeds, and default rates and losses.
Mortgage servicing income represents fees earned for servicing loans. Fees for servicing mortgage loans are generally based upon a percentage of the principal balance of the loans serviced, as well as related ancillary income such as late charges. Servicing income is recognized as earned, unless collection is doubtful. The caption in the consolidated statement of operations “Mortgage servicing fees, net” includes mortgage servicing income, amortization of mortgage servicing rights, the effects of mortgage servicing run-off, and impairment.

FIRST NORTHWEST BANCORP AND SUBSIDIARYNOTES TO CONSOLIDATED FINANCIAL STATEMENTS
99
Note 1 - Summary of Significant Accounting Policies (continued)
Income taxes - First Federal accounts for income taxes in accordance with the provisions of ASC 740-10, Income Taxes, which requires the use of the asset and liability method of accounting for income taxes. Deferred tax assets and liabilities are recognized for their future tax consequences, attributable to differences between the financial statement carrying amounts of existing assets and liabilities and their respective tax bases. Deferred tax assets and liabilities are measured using the enacted tax rates expected to apply to taxable income in the years in which those temporary differences are expected to be recovered or settled.
Premises and equipment - Premises and equipment are stated at cost less accumulated depreciation. Depreciation is recognized and computed on the straight-line method over the estimated useful lives as follows:
Buildings 37.5 - 50 yearsFurniture, fixtures, and equipment 3 - 10 yearsSoftware 3 yearsAutomobiles 5 years
Transfers of financial assets - Transfers of an entire financial asset, a group of financial assets, or a participating interest in an entire financial asset are accounted for as sales when control over the assets has been relinquished. Control over transferred assets is deemed to be surrendered when: (1) the assets have been isolated from First Federal, (2) the transferee obtains the right (free of conditions that constrain it from taking advantage of that right) to pledge or exchange the transferred assets, and (3) First Federal does not maintain effective control over the transferred assets through an agreement to repurchase them before their maturity. The mortgage loans that are sold with recourse provisions are accounted for as sales until such time as the loan defaults.
Periodically, First Federal sells mortgage loans with “life of the loan” recourse provisions, requiring First Federal to repurchase the loan at any time if it defaults. The remaining balance of such loans at June 30, 2015 and 2014, was approximately $7.4 million and $8.6 million, respectively. Of these loans, two loans were repurchased for a total of $335,000 during the year ended June 30, 2015. One loan was also repurchased in the amount of $239,000 during the year ended June 30, 2014. There is an associated allowance of $94,000 and $116,000 at June 30, 2015 and 2014, respectively, included in “accrued expenses and other liabilities” on the consolidated balance sheets related to these loans.
Bank-owned life insurance - The carrying amount of life insurance approximates fair value. Fair value of life insurance is estimated using the cash surrender value, less applicable surrender charges. The change in cash surrender value is included in noninterest income.
Off-balance-sheet credit-related financial instruments - In the ordinary course of business, First Federal has entered into commitments to extend credit, including commitments under lines of credit, commercial letters of credit, and standby letters of credit. Such financial instruments are recorded when they are funded.
Advertising costs - First Federal expenses advertising costs as they are incurred.
Comprehensive (loss) income - Accounting principles generally require that recognized revenue, expenses, and gains and losses be included in net (loss) income. Although certain changes in assets and liabilities, such as unrealized gains and losses on available-for-sale securities, are reported as a separate component of the equity section of the consolidated balance sheets, such items, along with net (loss) income, are components of comprehensive (loss) income.
Fair value measurements - Fair values of financial instruments are estimated using relevant market information and other assumptions (Note 14). Fair value estimates involve uncertainties and matters of significant judgment regarding interest rates, credit risk, prepayments, and other factors, especially in the absence of broad markets for particular items. Changes in assumptions or in market conditions could significantly affect these estimates.

FIRST NORTHWEST BANCORP AND SUBSIDIARYNOTES TO CONSOLIDATED FINANCIAL STATEMENTS
100
Note 1 - Summary of Significant Accounting Policies (continued)
Segment information - First Federal is engaged in the business of attracting deposits and providing lending services. Substantially all income is derived from a diverse base of commercial, mortgage, and consumer lending activities and investments. The Company’s activities are considered to be a single industry segment for financial reporting purposes.
Employee Stock Ownership Plan - The cost of shares issued to the ESOP but not yet allocated to participants is shown as a reduction of stockholders' equity. Compensation expense is based on the market price of shares as they are committed to be released to participants' accounts. Dividends on allocated ESOP shares reduce retained earnings while dividends on unearned ESOP shares reduce debt and accrued interest.
Earnings (loss) per Share - Basic earnings (loss) per share ("EPS") is computed by dividing net income or (loss), reduced by earnings allocated to participating shares of restricted stock, by the weighted-average number of common shares outstanding during the period. As ESOP shares are committed to be released they become outstanding for EPS calculation purposes. ESOP shares not committed to be released are not considered outstanding for basic or diluted EPS calculations. The basic EPS calculation excludes the dilutive effect of all common stock equivalents. Diluted earnings per share reflects the weighted-average potential dilution that could occur if all potentially dilutive securities or other commitments to issue common stock were exercised or converted into common stock using the treasury stock method.
According to the provisions of ASC 260, Earnings per Share, nonvested share-based payment awards that contain nonforfeitable rights to dividends or dividend equivalents are participating securities and are included in the computation of EPS pursuant to the two-class method. The two-class method is an earnings allocation formula that determines earnings per share for each class of common stock and participating security according to dividends declared or accumulated and participation rights in undistributed earnings. At this time the Company has no share-based payment awards.
Recently issued accounting pronouncements - In January 2015, the Financial Accounting Standards Board (FASB) issued Accounting Standards Update (ASU) No. 2015-01, Income Statement--Extraordinary and Unusual Items (Subtopic 225-20). The ASU eliminates the need to separately classify, present, and disclose extraordinary events. The disclosure of events or transactions that are unusual or infrequent in nature will be included in other guidance. The amendments in this ASU are effective for annual periods, and interim periods within those annual periods, beginning after December 15, 2015. The adoption of ASU No. 2015-1 is not expected to have a material impact on the Company's consolidated financial statements.
In February 2015, FASB issued ASU No. 2015-02, Consolidation (Topic 810): Amendments to the Consolidation Analysis, which is intended to improve targeted areas of consolidation guidance for legal entities such as limited partnerships, limited liability corporations, and securitization structures (collateralized debt obligations, collateralized loan obligations, and mortgage-backed security transactions). The ASU focuses on the consolidation evaluation for reporting organizations (public and private companies and not-for-profit organizations) that are required to evaluate whether they should consolidate certain legal entities. In addition to reducing the number of consolidation models from four to two, the new standard simplifies the FASB Accounting Standards Codification™ and improves current GAAP by placing more emphasis on risk of loss when determining a controlling financial interest. A reporting organization may no longer have to consolidate a legal entity in certain circumstances based solely on its fee arrangement, when certain criteria are met, reducing the frequency of the application of related-party guidance when determining a controlling financial interest in a variable interest entity (VIE), changing consolidation conclusions for public and private companies in several industries that typically make use of limited partnerships or VIEs. The ASU will be effective for periods beginning after December 15, 2015, for public companies. Early adoption is permitted, including adoption in an interim period. The adoption of ASU 2015-02 is not expected to have a material impact on the Company’s consolidated financial statements.
In April 2015, FASB issued ASU No. 2015-03, Interest - Imputation of Interest (Subtopic 835-30): Simplifying the Presentation of Debt Issuance Cost, which requires debt issuance costs related to a recognized debt liability to be presented in the balance sheet as a direct deduction from the debt liability rather than as an asset. For public business entities, the guidance in the ASU is effective for fiscal years and interim periods within those fiscal years, beginning after December 15, 2015. Early adoption is allowed for all entities for financial

FIRST NORTHWEST BANCORP AND SUBSIDIARYNOTES TO CONSOLIDATED FINANCIAL STATEMENTS
101
Note 1 - Summary of Significant Accounting Policies (continued)
statements that have not been previously issued. Entities would apply the new guidance retrospectively to all prior periods. The adoption of ASU 2015-03 is not expected to have a material impact on the Company's consolidated financial statements.
In April 2015, FASB issued ASU No. 2015-05, Customer's Accounting for Fees Paid in a Cloud Computing Arrangement. The amendments in this ASU provide guidance to customers in cloud computing arrangements about whether a cloud computing arrangement includes a software license. If a cloud computing arrangement includes a software license, the customer should account for the software license element of the arrangement consistent with the acquisition of other software licenses. If a cloud computing arrangement does not include a software license, the customer should account for the arrangement as a service contract. The amendments are effective for annual periods, including interim periods within those annual periods, beginning after December 15, 2015. Early adoption is permitted. This ASU is not expected to have a material effect on the Company's consolidated financial statements.
In June 2015, FASB issued ASU No. 2015-10, Technical Corrections and Improvements. On November 10, 2010 FASB added a standing project that will facilitate the FASB Accounting Standards Codification (‘Codification”) updates for technical corrections, clarifications, and improvements. These amendments are referred to as Technical Corrections and Improvements. Maintenance updates include non-substantive corrections to the Codification, such as editorial corrections, various link-related changes, and changes to source fragment information. This update contains amendments that will affect a wide variety of Topics in the Codification. The amendments in this ASU will apply to all reporting entities within the scope of the affected accounting guidance and generally fall into one of four categories: amendments related to differences between original guidance and the Codification, guidance clarification and reference corrections, simplification, and minor improvements. In summary, the amendments in this ASU represent changes to clarify the Codification, correct unintended application of guidance, or make minor improvements to the Codification that are not expected to have a significant effect on current accounting practice. Transition guidance varies based on the amendments in this ASU. The amendments in this ASU that require transition guidance are effective for fiscal years and interim reporting periods after December 15, 2015. Early adoption is permitted including adoption in an interim period. All other amendments are effective upon the issuance of this ASU. ASU 2015-10 did not have a material impact on the Company's consolidated financial statements.
In August 2015, FASB issued ASU No. 2015-14, Revenue from Contracts with Customers (Topic 606), which defers the effective date of ASU No. 2014-09 one year. ASU No. 2014-09 created Topic 606 and supersedes Topic 605, Revenue Recognition. The core principle of Topic 606 is that an entity recognizes revenue to depict the transfer of promised goods or services to customers in an amount that reflects the consideration to which the entity expects to be entitled in exchange for those goods or services. In general, the new guidance requires companies to use more judgment and make more estimates than under current guidance, including identifying performance obligations in the contract, estimating the amount of variable consideration to include in the transaction price and allocating the transaction price to each separate performance obligation. ASU No. 2015-14 is effective for public entities for interim and annual periods beginning after December 15, 2017; early adoption is permitted for interim and annual periods beginning after December 15, 2016. For financial reporting purposes, the standard allows for either full retrospective adoption, meaning the standard is applied to all of the periods presented, or modified retrospective adoption, meaning the standard is applied only to the most current period presented in the financial statements with the cumulative effect of initially applying the standard recognized at the date of initial application. The Company is currently evaluating the impact of this ASU.
In August 2015, FASB issued ASU No. 2015-15, Interest - Imputation of Interest (Subtopic 835-30). This ASU added SEC requirements for the presentation and subsequent measurement of debt issuance costs associated with line-of-credit arrangements. This is an update to ASU No. 2015-03 issued in April 2015, which is mentioned above. For public business entities, the guidance in the ASU is effective for fiscal years and interim periods within those fiscal years, beginning after December 15, 2015. Early adoption is allowed for all entities for financial statements that have not been previously issued. Entities would apply the new guidance retrospectively to all prior periods. The adoption of ASU 2015-15 is not expected to have a material impact on the Company's consolidated financial statements.
Reclassifications - Certain reclassifications have been made to the 2014 and 2013 consolidated financial statements to conform to the 2015 presentation with no effect on net income or equity.

FIRST NORTHWEST BANCORP AND SUBSIDIARYNOTES TO CONSOLIDATED FINANCIAL STATEMENTS
102
Note 2 - Securities
The amortized cost, gross unrealized gains and losses, and estimated fair value of securities classified as available-for-sale and held-to-maturity at June 30, 2015, are summarized as follows:
June 30, 2015
AmortizedCost
GrossUnrealized
Gains
GrossUnrealized
Losses
EstimatedFair
Value(In thousands)
Available for SaleInvestment Securities
Municipal bonds $ 17,387 $ 122 $ (235) $ 17,274U.S. Treasury and government agency issued bonds (Agency bonds) 23,948 10 (184) 23,774U.S. government agency issued asset-backed securities (ABS agency) 9,647 — (446) 9,201Corporate issued asset-backed securities (ABS corporate) 29,634 — — 29,634U.S. Small Business Administration securities (SBA) 33,955 519 (146) 34,328
Total $ 114,571 $ 651 $ (1,011) $ 114,211
Mortgage-Backed SecuritiesU.S. government agency issued mortgage-backed securities (MBS agency) $ 175,239 $ 2,241 $ (603) $ 176,877Corporate issued mortgage-backed securities (MBS corporate) 8,147 — (195) 7,952
Total $ 183,386 $ 2,241 $ (798) $ 184,829
Total securities available for sale $ 297,957 $ 2,892 $ (1,809) $ 299,040
Held to MaturityInvestment Securities
Municipal bonds $ 15,149 $ 424 $ (20) $ 15,553SBA 875 3 (1) 877
Total $ 16,024 $ 427 $ (21) $ 16,430
Mortgage-Backed SecuritiesMBS agency $ 45,500 $ 889 $ (309) $ 46,080
Total securities held to maturity $ 61,524 $ 1,316 $ (330) $ 62,510

FIRST NORTHWEST BANCORP AND SUBSIDIARYNOTES TO CONSOLIDATED FINANCIAL STATEMENTS
103
Note 2 - Securities (continued)
The amortized cost, gross unrealized gains and losses, and estimated fair value of securities classified as available-for-sale and held-to-maturity at June 30, 2014, are summarized as follows:
June 30, 2014
Cost
GrossUnrealized
Gains
GrossUnrealized
Losses
EstimatedFair
Value(In thousands)
Available for SaleInvestment Securities
Municipal bonds $ 7,418 $ 139 $ (32) $ 7,525ABS agency 10,585 — (445) 10,140SBA 28,355 600 (11) 28,944
Total $ 46,358 $ 739 $ (488) $ 46,609
Mortgage-Backed SecuritiesMBS agency $ 130,654 $ 2,078 $ (369) $ 132,363
Total securities available for sale $ 177,012 $ 2,817 $ (857) $ 178,972
Held to MaturityInvestment Securities
Municipal bonds $ 15,826 $ 199 $ (18) $ 16,007SBA 1,080 4 (1) 1,083
Total $ 16,906 $ 203 $ (19) $ 17,090
Mortgage-Backed SecuritiesMBS agency $ 36,338 $ 692 $ (138) $ 36,892
Total securities held to maturity $ 53,244 $ 895 $ (157) $ 53,982

FIRST NORTHWEST BANCORP AND SUBSIDIARYNOTES TO CONSOLIDATED FINANCIAL STATEMENTS
104
Note 2 - Securities (continued)
The following table shows the unrealized gross losses and fair value of the investment portfolio by length of time that individual securities in each category have been in a continuous loss position as of June 30, 2015:
Less Than Twelve Months Twelve Months or Longer TotalGross
UnrealizedLosses
FairValue
GrossUnrealized
LossesFair
Value
GrossUnrealized
LossesFair
Value(In thousands)
Available for SaleInvestment Securities
Municipal bonds $ (204) $ 9,809 $ (31) $ 3,801 $ (235) $ 13,610Agency bonds (184) 20,792 — — (184) 20,792ABS agency — — (446) 9,201 (446) 9,201SBA (140) 11,823 (6) 4,122 (146) 15,945
Total $ (528) $ 42,424 $ (483) $ 17,124 $ (1,011) $ 59,548
Mortgage-Backed SecuritiesMBS agency $ (459) $ 63,631 $ (144) $ 11,091 $ (603) $ 74,722MBS corporate (195) 4,164 — — (195) 4,164
Total $ (654) $ 67,795 $ (144) $ 11,091 $ (798) $ 78,886
Held to MaturityInvestment Securities
Municipal bonds $ — $ — $ (20) $ 1,298 $ (20) $ 1,298SBA — — (1) 244 (1) 244
Total $ — $ — $ (21) $ 1,542 $ (21) $ 1,542
Mortgage-Backed SecuritiesMBS agency $ (272) $ 14,628 $ (37) $ 3,059 $ (309) $ 17,687

FIRST NORTHWEST BANCORP AND SUBSIDIARYNOTES TO CONSOLIDATED FINANCIAL STATEMENTS
105
Note 2 - Securities (continued)
The following table shows the unrealized gross losses and fair value of the investment portfolio by length of time that individual securities in each category have been in a continuous loss position as of June 30, 2014:
Less Than Twelve Months Twelve Months or Longer TotalGross
UnrealizedLosses
FairValue
GrossUnrealized
LossesFair
Value
GrossUnrealized
LossesFair
Value(In thousands)
Available for SaleInvestment Securities
Municipal bonds $ — $ — $ (32) $ 3,827 $ (32) $ 3,827ABS agency (288) 6,088 (157) 4,053 (445) 10,141SBA — — (11) 5,068 (11) 5,068
Total $ (288) $ 6,088 $ (200) $ 12,948 $ (488) $ 19,036
Mortgage-Backed SecuritiesMBS agency $ (24) $ 14,233 $ (345) $ 24,379 $ (369) $ 38,612
Held to MaturityInvestment Securities
Municipal bonds $ — $ — $ (18) $ 1,311 $ (18) $ 1,311SBA — — (1) 260 (1) 260
Total $ — $ — $ (19) $ 1,571 $ (19) $ 1,571
Mortgage-Backed SecuritiesMBS agency $ (13) $ 5,728 $ (125) $ 7,921 $ (138) $ 13,649
The Company may hold certain investment securities in an unrealized loss position that are not considered OTTI. At June 30, 2015, there were 54 investment securities with $2.1 million of unrealized losses and a fair value of approximately $157.7 million. At June 30, 2014, there were 23 investment securities with $1.0 million of unrealized losses and a fair value of approximately $72.9 million.
The unrealized losses on investments in debt securities relate principally to the general change in interest rates and illiquidity, and not credit quality, that has occurred since the securities’ purchase dates, and such unrecognized losses or gains will continue to vary with general interest rate level fluctuations in the future. As management does not intend to sell the securities, and it is not likely they will be required to sell the securities before their anticipated recovery, no declines are deemed to be other than temporary.
The unrealized losses on investment and mortgage-backed securities were caused by interest rate changes. Certain investments in a loss position are guaranteed by government entities or government sponsored entities. It is expected that securities in a loss position would not be settled at a price less than the amortized cost of the investment. Because the decline in fair value is attributable to changes in interest rates and not credit quality, and the Company does not intend to sell the securities and believes it is not likely it will be required to sell these investments until a market price recovery or maturity, these investments are not considered other than temporarily impaired.
There were no OTTI losses during the years ended June 30, 2015 or 2014.
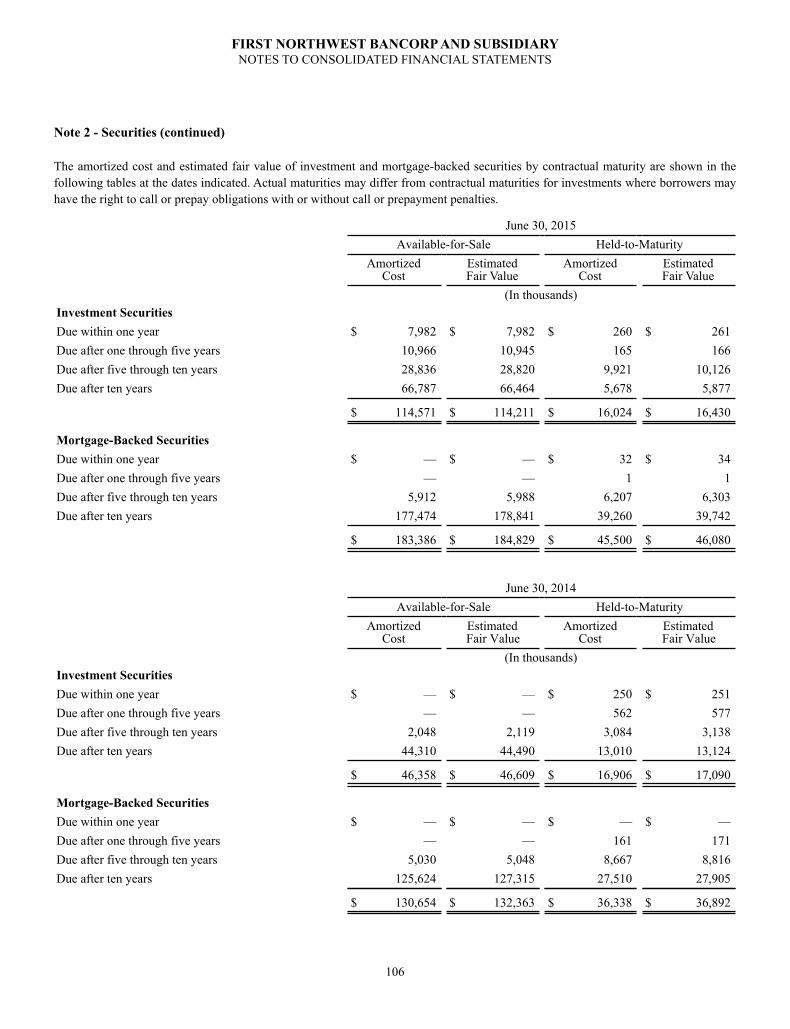
FIRST NORTHWEST BANCORP AND SUBSIDIARYNOTES TO CONSOLIDATED FINANCIAL STATEMENTS
106
Note 2 - Securities (continued)
The amortized cost and estimated fair value of investment and mortgage-backed securities by contractual maturity are shown in the following tables at the dates indicated. Actual maturities may differ from contractual maturities for investments where borrowers may have the right to call or prepay obligations with or without call or prepayment penalties.
June 30, 2015Available-for-Sale Held-to-Maturity
AmortizedCost
EstimatedFair Value
AmortizedCost
EstimatedFair Value
(In thousands)Investment SecuritiesDue within one year $ 7,982 $ 7,982 $ 260 $ 261Due after one through five years 10,966 10,945 165 166Due after five through ten years 28,836 28,820 9,921 10,126Due after ten years 66,787 66,464 5,678 5,877
$ 114,571 $ 114,211 $ 16,024 $ 16,430
Mortgage-Backed SecuritiesDue within one year $ — $ — $ 32 $ 34Due after one through five years — — 1 1Due after five through ten years 5,912 5,988 6,207 6,303Due after ten years 177,474 178,841 39,260 39,742
$ 183,386 $ 184,829 $ 45,500 $ 46,080
June 30, 2014Available-for-Sale Held-to-Maturity
AmortizedCost
EstimatedFair Value
AmortizedCost
EstimatedFair Value
(In thousands)Investment SecuritiesDue within one year $ — $ — $ 250 $ 251Due after one through five years — — 562 577Due after five through ten years 2,048 2,119 3,084 3,138Due after ten years 44,310 44,490 13,010 13,124
$ 46,358 $ 46,609 $ 16,906 $ 17,090
Mortgage-Backed SecuritiesDue within one year $ — $ — $ — $ —Due after one through five years — — 161 171Due after five through ten years 5,030 5,048 8,667 8,816Due after ten years 125,624 127,315 27,510 27,905
$ 130,654 $ 132,363 $ 36,338 $ 36,892
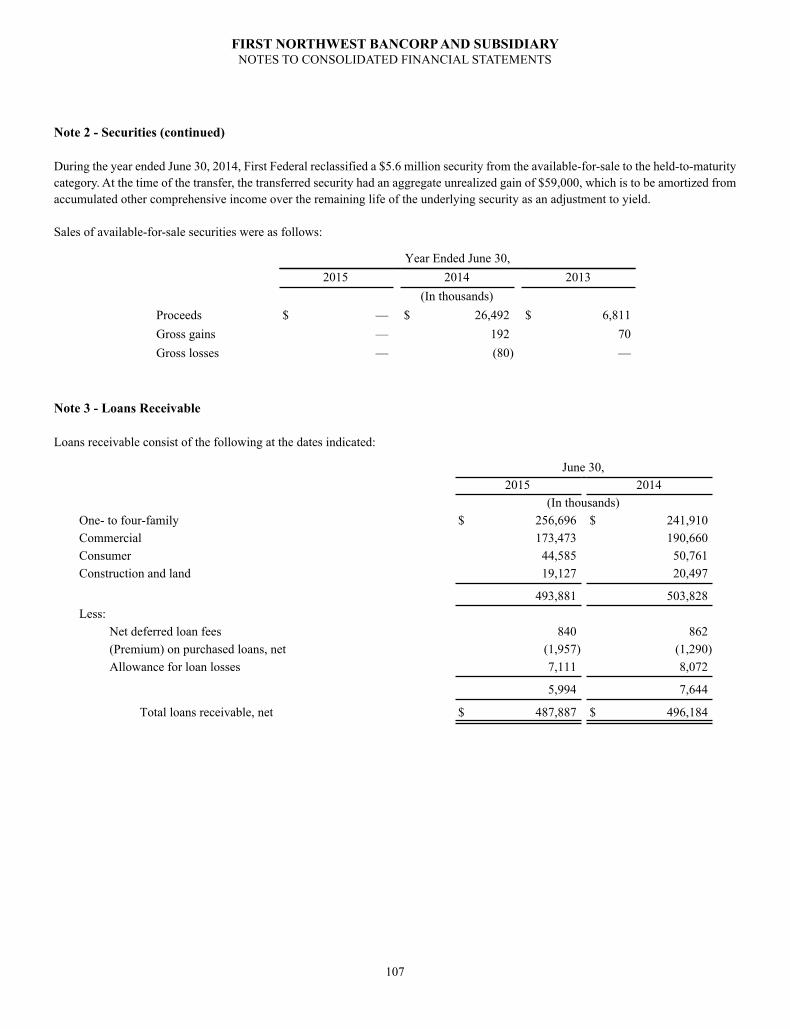
FIRST NORTHWEST BANCORP AND SUBSIDIARYNOTES TO CONSOLIDATED FINANCIAL STATEMENTS
107
Note 2 - Securities (continued)
During the year ended June 30, 2014, First Federal reclassified a $5.6 million security from the available-for-sale to the held-to-maturity category. At the time of the transfer, the transferred security had an aggregate unrealized gain of $59,000, which is to be amortized from accumulated other comprehensive income over the remaining life of the underlying security as an adjustment to yield.
Sales of available-for-sale securities were as follows:
Year Ended June 30,2015 2014 2013
(In thousands)Proceeds $ — $ 26,492 $ 6,811Gross gains — 192 70Gross losses — (80) —
Note 3 - Loans Receivable
Loans receivable consist of the following at the dates indicated:
June 30,2015 2014
(In thousands)One- to four-family $ 256,696 $ 241,910Commercial 173,473 190,660Consumer 44,585 50,761Construction and land 19,127 20,497
493,881 503,828Less:
Net deferred loan fees 840 862(Premium) on purchased loans, net (1,957) (1,290)Allowance for loan losses 7,111 8,072
5,994 7,644
Total loans receivable, net $ 487,887 $ 496,184
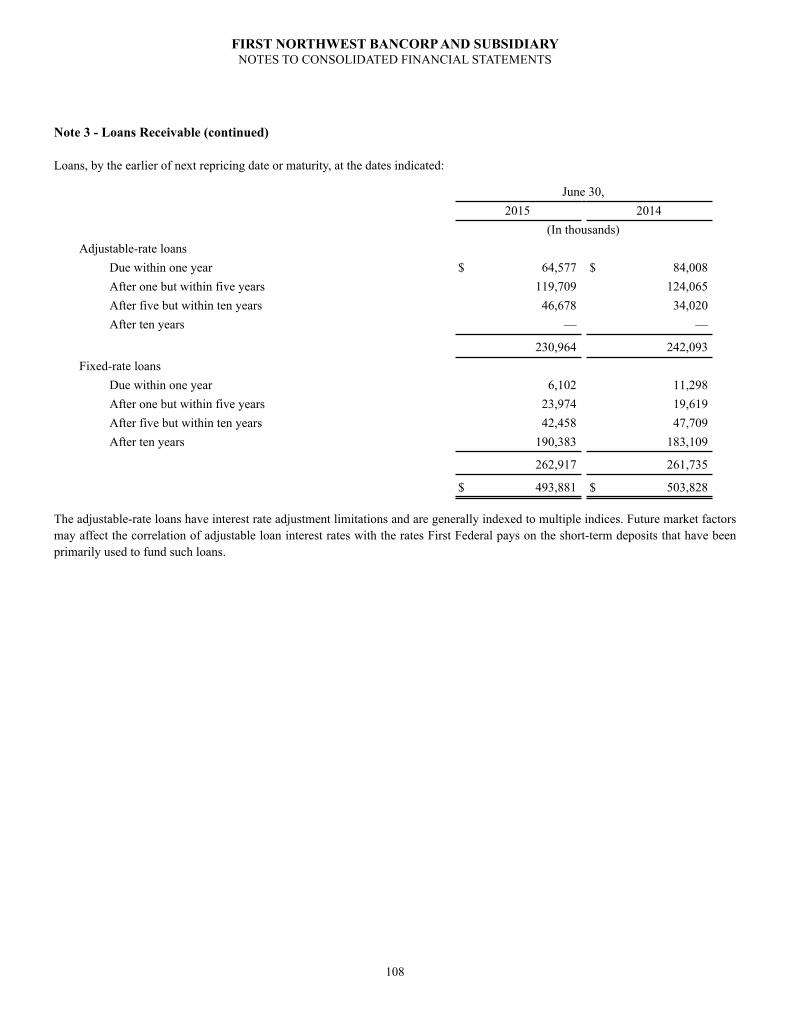
FIRST NORTHWEST BANCORP AND SUBSIDIARYNOTES TO CONSOLIDATED FINANCIAL STATEMENTS
108
Note 3 - Loans Receivable (continued)
Loans, by the earlier of next repricing date or maturity, at the dates indicated:
June 30,2015 2014
(In thousands)Adjustable-rate loans
Due within one year $ 64,577 $ 84,008After one but within five years 119,709 124,065After five but within ten years 46,678 34,020After ten years — —
230,964 242,093Fixed-rate loans
Due within one year 6,102 11,298After one but within five years 23,974 19,619After five but within ten years 42,458 47,709After ten years 190,383 183,109
262,917 261,735
$ 493,881 $ 503,828
The adjustable-rate loans have interest rate adjustment limitations and are generally indexed to multiple indices. Future market factors may affect the correlation of adjustable loan interest rates with the rates First Federal pays on the short-term deposits that have been primarily used to fund such loans.

FIRST NORTHWEST BANCORP AND SUBSIDIARYNOTES TO CONSOLIDATED FINANCIAL STATEMENTS
109
Note 3 - Loans Receivable (continued)
The following tables summarize changes in the ALLL and the loan portfolio by segment and impairment method for the periods shown:
At or For the Year Ended June 30, 2015One- to
Four-Family Commercial ConsumerConstruction
and Land Unallocated TotalALLL: (In thousands)Beginning balance $ 3,408 $ 2,354 $ 1,678 $ 397 $ 235 $ 8,072
Provision for loan losses 81 (680) 104 (29) 524 —Charge-offs (430) (177) (503) (49) — (1,159)Recoveries 84 3 94 17 — 198
Ending balance $ 3,143 $ 1,500 $ 1,373 $ 336 $ 759 $ 7,111
Allowance by portfolio segment:Total ALLL $ 3,143 $ 1,500 $ 1,373 $ 336 $ 759 $ 7,111
General reserve 2,982 1,381 1,242 318 759 6,682Specific reserve 161 119 131 18 — 429
Loan balance:Total loans $ 256,696 $ 173,473 $ 44,585 $ 19,127 $ — $ 493,881
General reserves (1) 249,290 171,077 43,786 18,968 — 483,121Specific reserves (2) 7,406 2,396 799 159 — 10,760
(1) Loans collectively evaluated for impairment included in general reserves.(2) Loans individually evaluated for impairment included in specific reserves.

FIRST NORTHWEST BANCORP AND SUBSIDIARYNOTES TO CONSOLIDATED FINANCIAL STATEMENTS
110
Note 3 - Loans Receivable (continued)
The following tables summarize changes in the ALLL and loan portfolio by segment and impairment method for the periods shown:
At or For the Year Ended June 30, 2014One- to
Four-Family Commercial ConsumerConstruction
and Land Unallocated TotalALLL: (In thousands)Beginning balance $ 3,667 $ 1,774 $ 2,015 $ 297 $ 221 $ 7,974
Provision for loan losses 311 699 150 133 14 1,307Charge-offs (662) (135) (615) (35) — (1,447)Recoveries 92 16 128 2 — 238
Ending balance $ 3,408 $ 2,354 $ 1,678 $ 397 $ 235 $ 8,072
Allowance by portfolio segment:Total ALLL $ 3,408 $ 2,354 $ 1,678 $ 397 $ 235 $ 8,072
General reserve 3,238 2,077 1,558 381 235 7,489Specific reserve 170 277 120 16 — 583
Loans:Total loans $ 241,910 $ 190,660 $ 50,761 $ 20,497 $ — $ 503,828
General reserves (1) 234,300 184,895 49,843 20,057 — 489,095Specific reserves (2) 7,610 5,765 918 440 — 14,733
(1) Loans collectively evaluated for impairment included in general reserves.(2) Loans individually evaluated for impairment included in specific reserves.
At or For the Year Ended June 30, 2013One- to
Four-Family Commercial ConsumerConstruction
and Land Unallocated TotalALLL: (In thousands)Beginning balance $ 3,464 $ 1,528 $ 2,168 $ 230 $ — $ 7,390
Provision for loan losses 571 (50) 345 289 221 1,376Charge-offs (548) — (632) (222) — (1,402)Recoveries 180 296 134 — — 610
Ending balance $ 3,667 $ 1,774 $ 2,015 $ 297 $ 221 $ 7,974
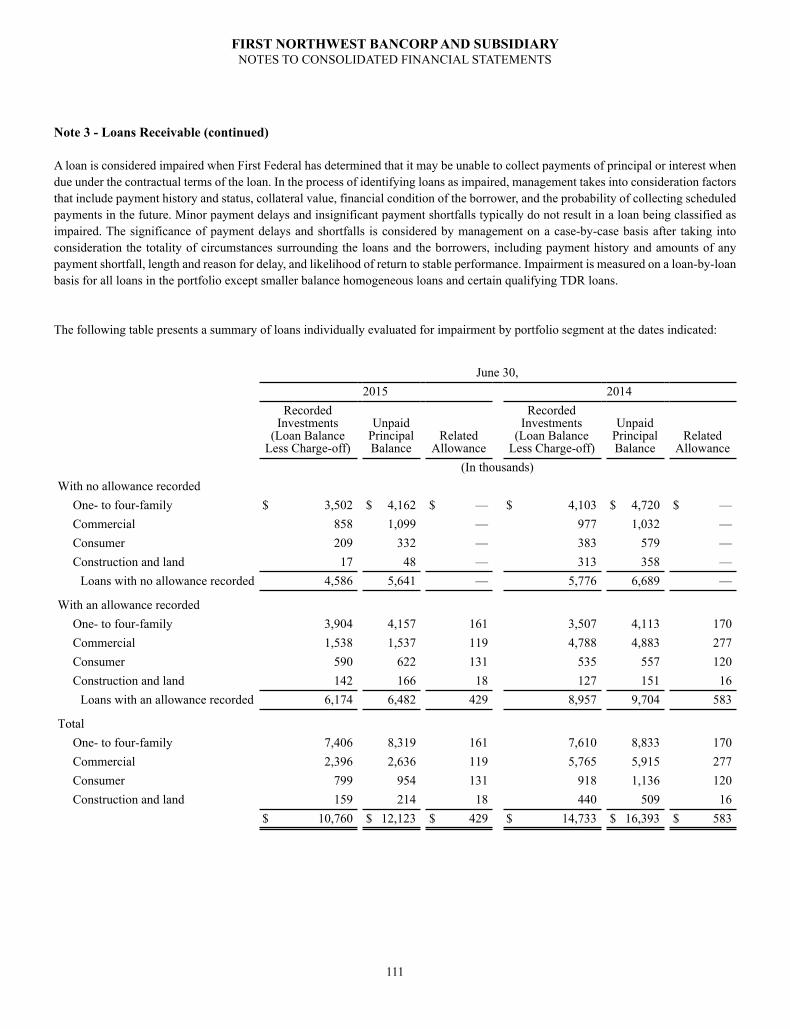
FIRST NORTHWEST BANCORP AND SUBSIDIARYNOTES TO CONSOLIDATED FINANCIAL STATEMENTS
111
Note 3 - Loans Receivable (continued)
A loan is considered impaired when First Federal has determined that it may be unable to collect payments of principal or interest when due under the contractual terms of the loan. In the process of identifying loans as impaired, management takes into consideration factors that include payment history and status, collateral value, financial condition of the borrower, and the probability of collecting scheduled payments in the future. Minor payment delays and insignificant payment shortfalls typically do not result in a loan being classified as impaired. The significance of payment delays and shortfalls is considered by management on a case-by-case basis after taking into consideration the totality of circumstances surrounding the loans and the borrowers, including payment history and amounts of any payment shortfall, length and reason for delay, and likelihood of return to stable performance. Impairment is measured on a loan-by-loan basis for all loans in the portfolio except smaller balance homogeneous loans and certain qualifying TDR loans.
The following table presents a summary of loans individually evaluated for impairment by portfolio segment at the dates indicated:
June 30,2015 2014
RecordedInvestments
(Loan BalanceLess Charge-off)
UnpaidPrincipalBalance
RelatedAllowance
RecordedInvestments
(Loan BalanceLess Charge-off)
UnpaidPrincipal Balance
RelatedAllowance
(In thousands)With no allowance recorded
One- to four-family $ 3,502 $ 4,162 $ — $ 4,103 $ 4,720 $ —Commercial 858 1,099 — 977 1,032 —Consumer 209 332 — 383 579 —Construction and land 17 48 — 313 358 —
Loans with no allowance recorded 4,586 5,641 — 5,776 6,689 —
With an allowance recordedOne- to four-family 3,904 4,157 161 3,507 4,113 170Commercial 1,538 1,537 119 4,788 4,883 277Consumer 590 622 131 535 557 120Construction and land 142 166 18 127 151 16
Loans with an allowance recorded 6,174 6,482 429 8,957 9,704 583
TotalOne- to four-family 7,406 8,319 161 7,610 8,833 170Commercial 2,396 2,636 119 5,765 5,915 277Consumer 799 954 131 918 1,136 120Construction and land 159 214 18 440 509 16
$ 10,760 $ 12,123 $ 429 $ 14,733 $ 16,393 $ 583
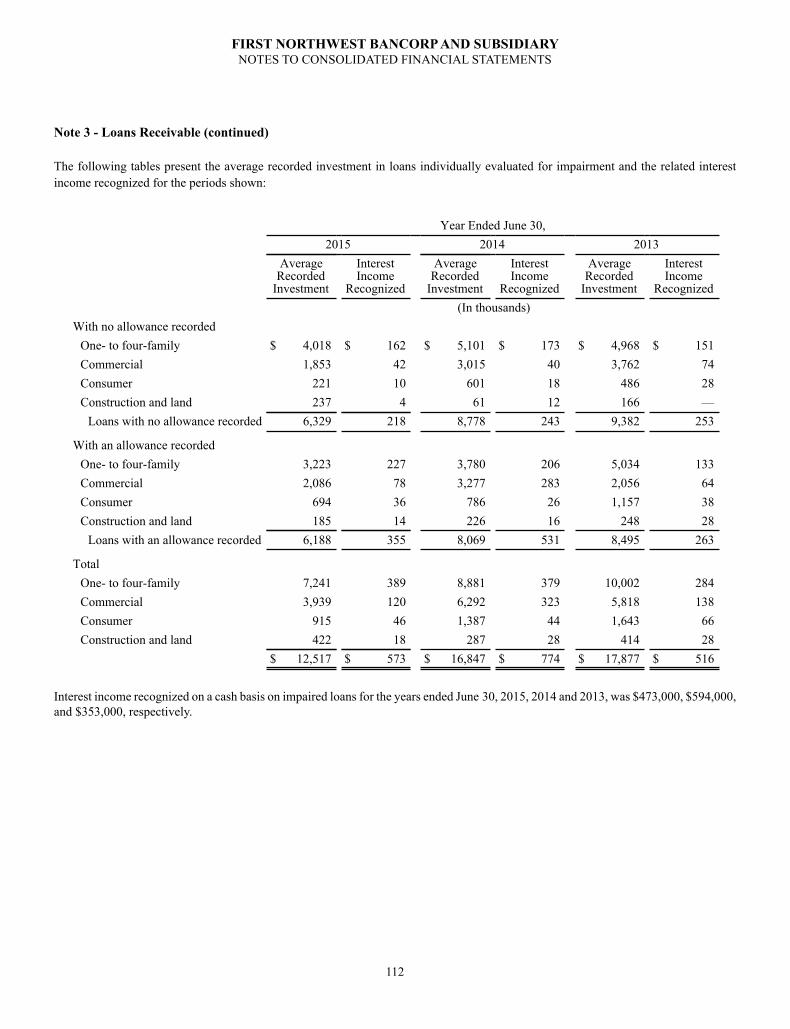
FIRST NORTHWEST BANCORP AND SUBSIDIARYNOTES TO CONSOLIDATED FINANCIAL STATEMENTS
112
Note 3 - Loans Receivable (continued)
The following tables present the average recorded investment in loans individually evaluated for impairment and the related interest income recognized for the periods shown:
Year Ended June 30,2015 2014 2013
AverageRecorded
Investment
InterestIncome
Recognized
AverageRecorded
Investment
InterestIncome
Recognized
AverageRecorded
Investment
InterestIncome
Recognized (In thousands)
With no allowance recordedOne- to four-family $ 4,018 $ 162 $ 5,101 $ 173 $ 4,968 $ 151Commercial 1,853 42 3,015 40 3,762 74Consumer 221 10 601 18 486 28Construction and land 237 4 61 12 166 —
Loans with no allowance recorded 6,329 218 8,778 243 9,382 253
With an allowance recordedOne- to four-family 3,223 227 3,780 206 5,034 133Commercial 2,086 78 3,277 283 2,056 64Consumer 694 36 786 26 1,157 38Construction and land 185 14 226 16 248 28
Loans with an allowance recorded 6,188 355 8,069 531 8,495 263
TotalOne- to four-family 7,241 389 8,881 379 10,002 284Commercial 3,939 120 6,292 323 5,818 138Consumer 915 46 1,387 44 1,643 66Construction and land 422 18 287 28 414 28
$ 12,517 $ 573 $ 16,847 $ 774 $ 17,877 $ 516
Interest income recognized on a cash basis on impaired loans for the years ended June 30, 2015, 2014 and 2013, was $473,000, $594,000, and $353,000, respectively.

FIRST NORTHWEST BANCORP AND SUBSIDIARYNOTES TO CONSOLIDATED FINANCIAL STATEMENTS
113
Note 3 - Loans Receivable (continued)
The following table presents the recorded investment in nonaccrual loans by class of loan at the dates indicated:
June 30,2015 2014
(In thousands)One- to four-family
One- to four-family Olympic Peninsula1 $ 3,839 $ 3,223One- to four-family other 393 320
CommercialCommercial real estate 147 1,913
ConsumerHome equity 181 340Auto 10 —Consumer other 154 41
Construction and landLand and development 159 127
$ 4,883 $ 5,964
1 Olympic Peninsula is limited to properties located in the Washington State counties of Clallam and Jefferson in these tables.
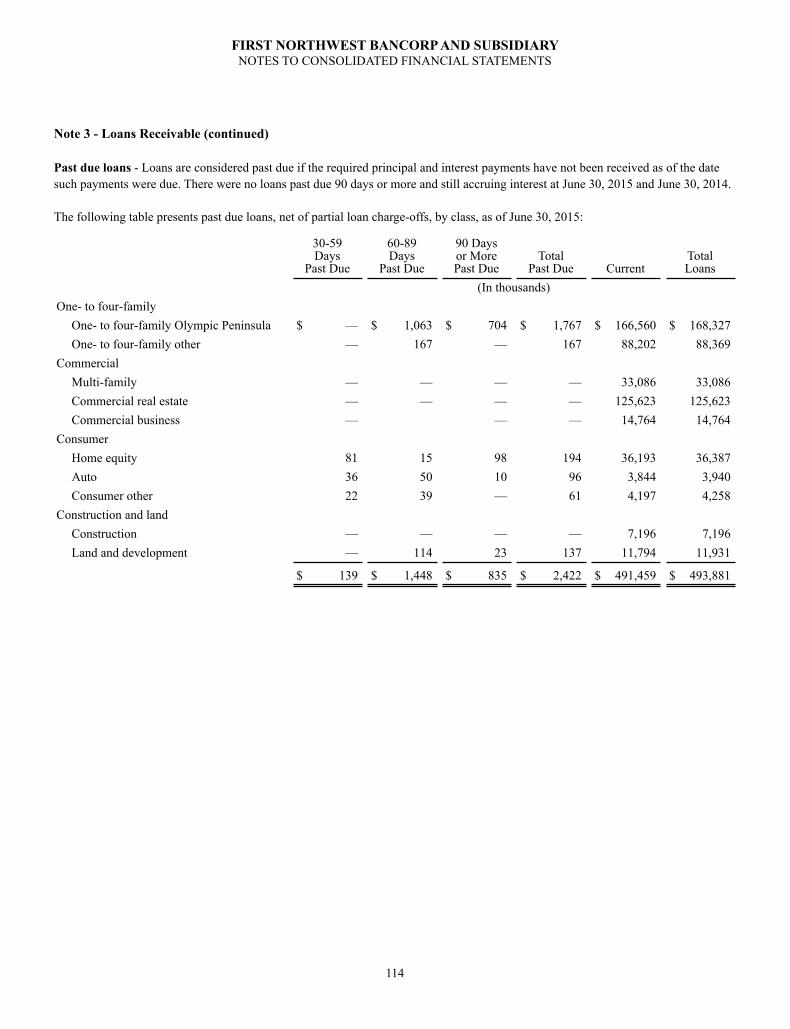
FIRST NORTHWEST BANCORP AND SUBSIDIARYNOTES TO CONSOLIDATED FINANCIAL STATEMENTS
114
Note 3 - Loans Receivable (continued)
Past due loans - Loans are considered past due if the required principal and interest payments have not been received as of the date such payments were due. There were no loans past due 90 days or more and still accruing interest at June 30, 2015 and June 30, 2014.
The following table presents past due loans, net of partial loan charge-offs, by class, as of June 30, 2015:
30-59Days
Past Due
60-89Days
Past Due
90 Daysor MorePast Due
TotalPast Due Current
TotalLoans
(In thousands)One- to four-family
One- to four-family Olympic Peninsula $ — $ 1,063 $ 704 $ 1,767 $ 166,560 $ 168,327One- to four-family other — 167 — 167 88,202 88,369
CommercialMulti-family — — — — 33,086 33,086Commercial real estate — — — — 125,623 125,623Commercial business — — — 14,764 14,764
ConsumerHome equity 81 15 98 194 36,193 36,387Auto 36 50 10 96 3,844 3,940Consumer other 22 39 — 61 4,197 4,258
Construction and landConstruction — — — — 7,196 7,196Land and development — 114 23 137 11,794 11,931
$ 139 $ 1,448 $ 835 $ 2,422 $ 491,459 $ 493,881
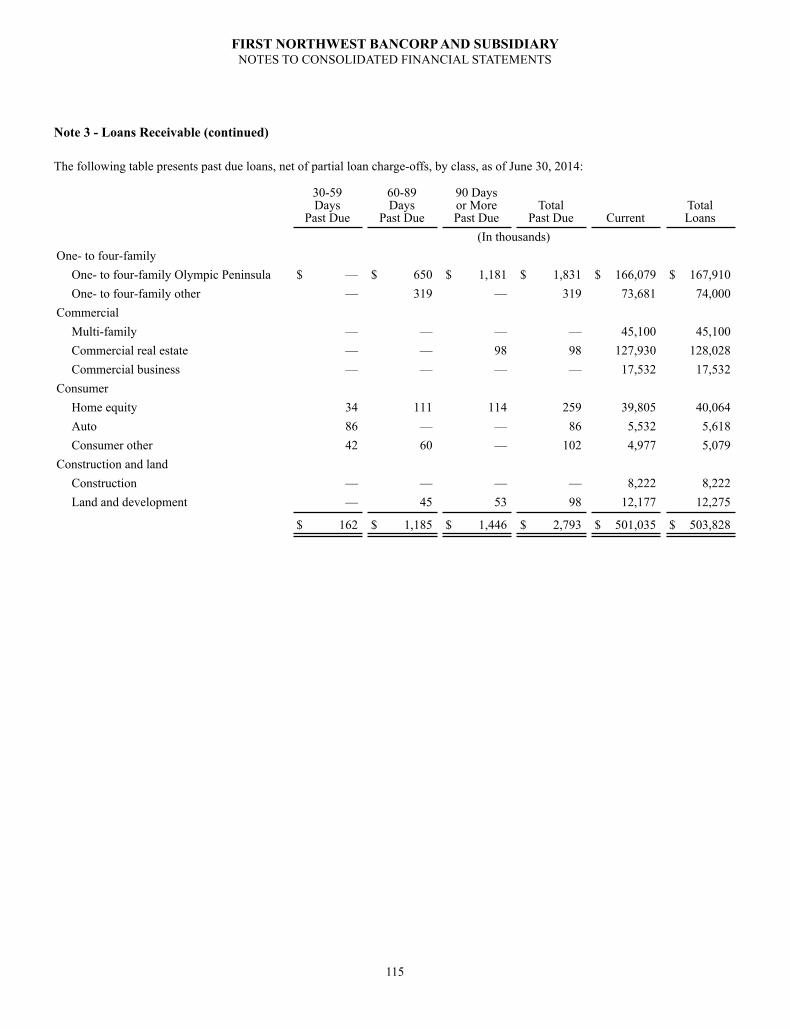
FIRST NORTHWEST BANCORP AND SUBSIDIARYNOTES TO CONSOLIDATED FINANCIAL STATEMENTS
115
Note 3 - Loans Receivable (continued)
The following table presents past due loans, net of partial loan charge-offs, by class, as of June 30, 2014:
30-59Days
Past Due
60-89Days
Past Due
90 Daysor MorePast Due
TotalPast Due Current
TotalLoans
(In thousands)One- to four-family
One- to four-family Olympic Peninsula $ — $ 650 $ 1,181 $ 1,831 $ 166,079 $ 167,910One- to four-family other — 319 — 319 73,681 74,000
CommercialMulti-family — — — — 45,100 45,100Commercial real estate — — 98 98 127,930 128,028Commercial business — — — — 17,532 17,532
ConsumerHome equity 34 111 114 259 39,805 40,064Auto 86 — — 86 5,532 5,618Consumer other 42 60 — 102 4,977 5,079
Construction and landConstruction — — — — 8,222 8,222Land and development — 45 53 98 12,177 12,275
$ 162 $ 1,185 $ 1,446 $ 2,793 $ 501,035 $ 503,828

FIRST NORTHWEST BANCORP AND SUBSIDIARYNOTES TO CONSOLIDATED FINANCIAL STATEMENTS
116
Note 3 - Loans Receivable (continued)
Credit quality indicator - Federal regulations provide for the classification of lower quality loans and other assets, such as debt and equity securities, as substandard, doubtful, or loss; risk ratings 6, 7, and 8 in our 8-point risk rating system, respectively. An asset is considered substandard if it is inadequately protected by the current net worth and pay capacity of the borrower or of any collateral pledged. Substandard assets include those characterized by the distinct possibility that First Federal will sustain some loss if the deficiencies are not corrected. Assets classified as doubtful have all the weaknesses inherent in those classified substandard with the added characteristic that the weaknesses present make collection or liquidation in full highly questionable and improbable, on the basis of currently existing facts, conditions, and values. Assets classified as loss are those considered uncollectible and of such little value that their continuance as assets without the establishment of a specific loss reserve is not warranted.
When First Federal classifies problem assets as either substandard or doubtful, it may establish a specific allowance to address the risk specifically or First Federal may allow the loss to be addressed in the general allowance. General allowances represent loss allowances that have been established to recognize the inherent risk associated with lending activities but that, unlike specific allowances, have not been specifically allocated to particular problem assets. When an insured institution classifies problem assets as a loss, it is required to charge off such assets in the period in which they are deemed uncollectible. Assets that do not currently expose First Federal to sufficient risk to warrant classification as substandard or doubtful but possess identified weaknesses are designated as either watch or special mention assets; risk ratings 4 and 5 in our risk rating system, respectively. At June 30, 2015 and June 30, 2014, First Federal had $9.9 million and $13.9 million, respectively, of loans classified as substandard and no loans classified as doubtful or loss. Loans not otherwise classified are considered pass graded loans and are rated 1-3 in our risk rating system.
Additionally, First Federal categorizes loans as performing or nonperforming based on payment activity. Loans that are more than 90 days past due and nonaccrual loans are considered nonperforming.
The following table represents the internally assigned grade as of June 30, 2015, by class of loans:
Pass WatchSpecialMention
Sub-Standard Total
(In thousands)One- to four-family
One- to four-family Olympic Peninsula $ 161,004 $ 1,524 $ 794 $ 5,005 $ 168,327One- to four-family other 86,487 934 — 948 88,369
CommercialMulti-family 22,907 9,550 — 629 33,086Commercial real estate 106,072 12,960 5,134 1,457 125,623Commercial business 8,449 5,795 62 458 14,764
ConsumerHome equity 34,969 501 86 831 36,387Auto 3,716 105 58 61 3,940Consumer other 3,906 108 19 225 4,258
Construction and landConstruction 7,196 — — — 7,196Land and development 11,230 351 113 237 11,931
$ 445,936 $ 31,828 $ 6,266 $ 9,851 $ 493,881
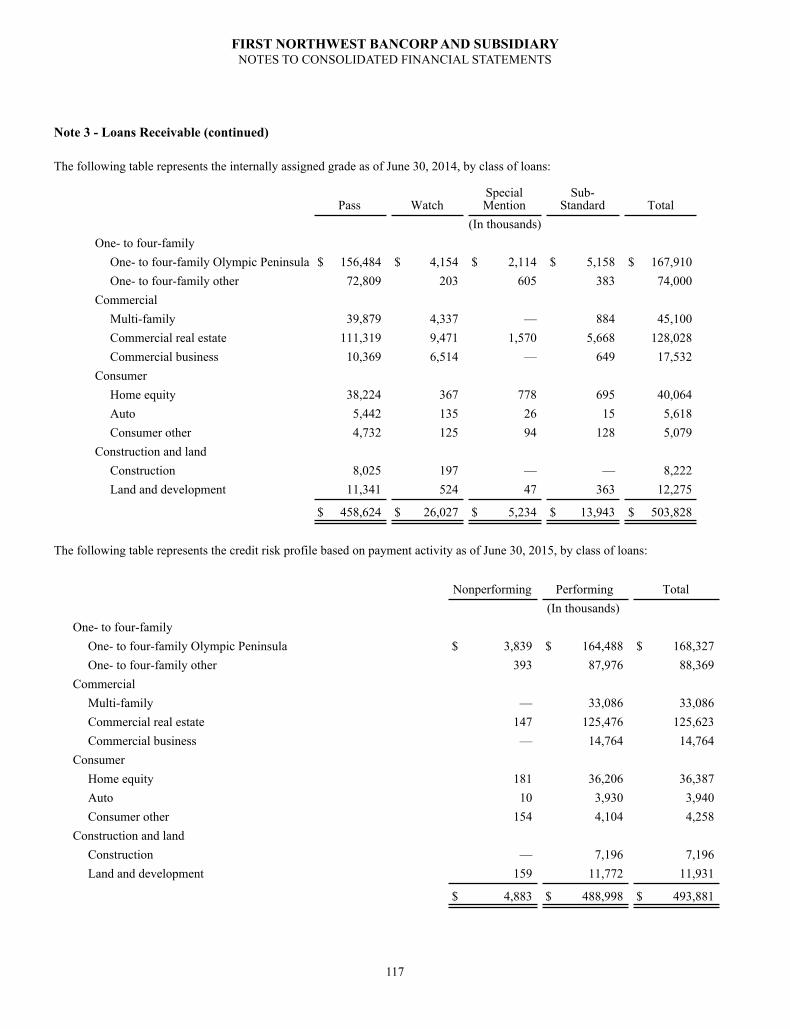
FIRST NORTHWEST BANCORP AND SUBSIDIARYNOTES TO CONSOLIDATED FINANCIAL STATEMENTS
117
Note 3 - Loans Receivable (continued)
The following table represents the internally assigned grade as of June 30, 2014, by class of loans:
Pass WatchSpecialMention
Sub-Standard Total
(In thousands)One- to four-family
One- to four-family Olympic Peninsula $ 156,484 $ 4,154 $ 2,114 $ 5,158 $ 167,910One- to four-family other 72,809 203 605 383 74,000
CommercialMulti-family 39,879 4,337 — 884 45,100Commercial real estate 111,319 9,471 1,570 5,668 128,028Commercial business 10,369 6,514 — 649 17,532
ConsumerHome equity 38,224 367 778 695 40,064Auto 5,442 135 26 15 5,618Consumer other 4,732 125 94 128 5,079
Construction and landConstruction 8,025 197 — — 8,222Land and development 11,341 524 47 363 12,275
$ 458,624 $ 26,027 $ 5,234 $ 13,943 $ 503,828
The following table represents the credit risk profile based on payment activity as of June 30, 2015, by class of loans:
Nonperforming Performing Total(In thousands)
One- to four-familyOne- to four-family Olympic Peninsula $ 3,839 $ 164,488 $ 168,327One- to four-family other 393 87,976 88,369
CommercialMulti-family — 33,086 33,086Commercial real estate 147 125,476 125,623Commercial business — 14,764 14,764
ConsumerHome equity 181 36,206 36,387Auto 10 3,930 3,940Consumer other 154 4,104 4,258
Construction and landConstruction — 7,196 7,196Land and development 159 11,772 11,931
$ 4,883 $ 488,998 $ 493,881

FIRST NORTHWEST BANCORP AND SUBSIDIARYNOTES TO CONSOLIDATED FINANCIAL STATEMENTS
118
Note 3 - Loans Receivable (continued)
The following table represents the credit risk profile based on payment activity as of June 30, 2014, by class of loans:
Nonperforming Performing Total(In thousands)
One- to four-familyOne- to four-family Olympic Peninsula $ 3,223 $ 164,687 $ 167,910One- to four-family other 320 73,680 74,000
CommercialMulti-family 45,100 45,100Commercial real estate 1,913 126,115 128,028Commercial business — 17,532 17,532
ConsumerHome equity 340 39,724 40,064Auto — 5,618 5,618Consumer other 41 5,038 5,079
Construction and landConstruction — 8,222 8,222Land and development 127 12,148 12,275
$ 5,964 $ 497,864 $ 503,828
Troubled debt restructuring - A TDR is a loan to a borrower who is experiencing financial difficulty that has been modified from its original terms and conditions in such a way that First Federal is granting the borrower a concession of some kind. First Federal has granted a variety of concessions to borrowers in the form of loan modifications. The modifications granted can generally be described in the following categories:
Rate modification - A modification in which the interest rate is changed.
Term modification - A modification in which the maturity date, timing of payments, or frequency of payments is changed.
Payment modification - A modification in which the dollar amount of the payment is changed. Interest-only modifications in which a loan is converted to interest-only payments for a period of time are included in this category.
Combination modification - Any other type of modification, including the use of multiple categories above.
Upon identifying a receivable as a troubled debt restructuring, First Federal classifies the loan as impaired for purposes of determining the allowance for loan losses. This requires the loan to be evaluated individually for impairment, generally based on the expected cash flows under the new terms discounted at the loan’s original effective interest rates. For TDR loans that subsequently default, the method of determining impairment is generally the fair value of the collateral less estimated selling costs.

FIRST NORTHWEST BANCORP AND SUBSIDIARYNOTES TO CONSOLIDATED FINANCIAL STATEMENTS
119
Note 3 - Loans Receivable (continued)
The following is a summary of information pertaining to TDR loans included in impaired loans at the dates indicated:
June 30,2015 2014
(In thousands)Total TDR loans $ 7,746 $ 12,164
Allowance for loan losses related to TDR loans $ 272 $ 363
Total nonaccrual TDR loans $ 5,676 $ 3,536
The following table presents newly restructured and renewals or modifications of existing TDR loans by class that occurred during the year ended June 30, 2015, by type of concession granted:
Numberof Contracts
RateModification
TermModification
CombinationModification
TotalModifications
(Dollars in thousands)Pre-modification outstanding recorded investment
One- to four-familyOne- to four-family Olympic Peninsula 1 $ — $ 151 $ — $ 151
CommercialCommercial business 1 $ — $ 105 $ — $ 105
ConsumerOne- to four-family second mortgages 1 $ — $ 50 $ — $ 50
3 $ — $ 306 $ — $ 306
Post-modification outstanding recorded investmentOne- to four-family
One- to four-family Olympic Peninsula 1 $ — $ 154 $ — $ 154Commercial
Commercial business 1 $ — $ 105 $ — $ 105Consumer
One- to four-family second mortgages 1 $ — $ 50 $ — $ 50
3 $ — $ 309 $ — $ 309
Renewals or modifications of existing TDR loans during the year ended June 30, 2015, consisted of three recorded investments with pre-renewal balances totaling $306,000 and post-renewal balances of $309,000.
There were no TDR loans that were modified within the 12 months prior to June 30, 2015, and for which there was a payment default during the year ended June 30, 2015.

FIRST NORTHWEST BANCORP AND SUBSIDIARYNOTES TO CONSOLIDATED FINANCIAL STATEMENTS
120
Note 3 - Loans Receivable (continued)
The following table presents newly restructured and renewals or modifications of existing TDR loans by class that occurred during the year ended June 30, 2014, by type of concession granted:
Numberof Contracts
RateModification
TermModification
CombinationModification
TotalModifications
(Dollars in thousands)Pre-modification outstanding recorded investment
One- to four-familyOne- to four-family Olympic Peninsula 14 $ 950 $ — $ 1,493 $ 2,443
CommercialMultifamily 5 — — 610 610
ConsumerHome equity 2 — 29 44 73Consumer other 1 — — 1 1
22 $ 950 $ 29 $ 2,148 $ 3,127
Post-modification outstanding recorded investmentOne- to four-family
One- to four-family Olympic Peninsula 14 $ 947 $ — $ 1,500 $ 2,447Commercial
Multifamily 1 — — 597 597Consumer
Home equity 2 — 29 44 73Consumer other 1 — — 1 1
18 $ 947 $ 29 $ 2,142 $ 3,118
During the year ended June 30, 2014, new TDR loans consisted of ten recorded investments with pre-modification balances totaling $1.9 million resulting in six post-modification investments with balances of $1.9 million. Renewals or modifications of existing TDR loans consisted of twelve recorded investments with pre-renewal balances totaling $1.2 million and post-renewal balances of $1.2 million.
The following is a summary of TDR loans that were modified within the 12 months prior to June 30, 2014, and for which there was a payment default during the year ended June 30, 2014.
Numberof Contracts
RateModification
TermModification
CombinationModification
TotalModifications
(Dollars in thousands)TDR loans that subsequently defaulted
One- to four-familyOne- to four-family Olympic Peninsula 1 $ — $ — $ 229 $ 229
1 $ — $ — $ 229 $ 229
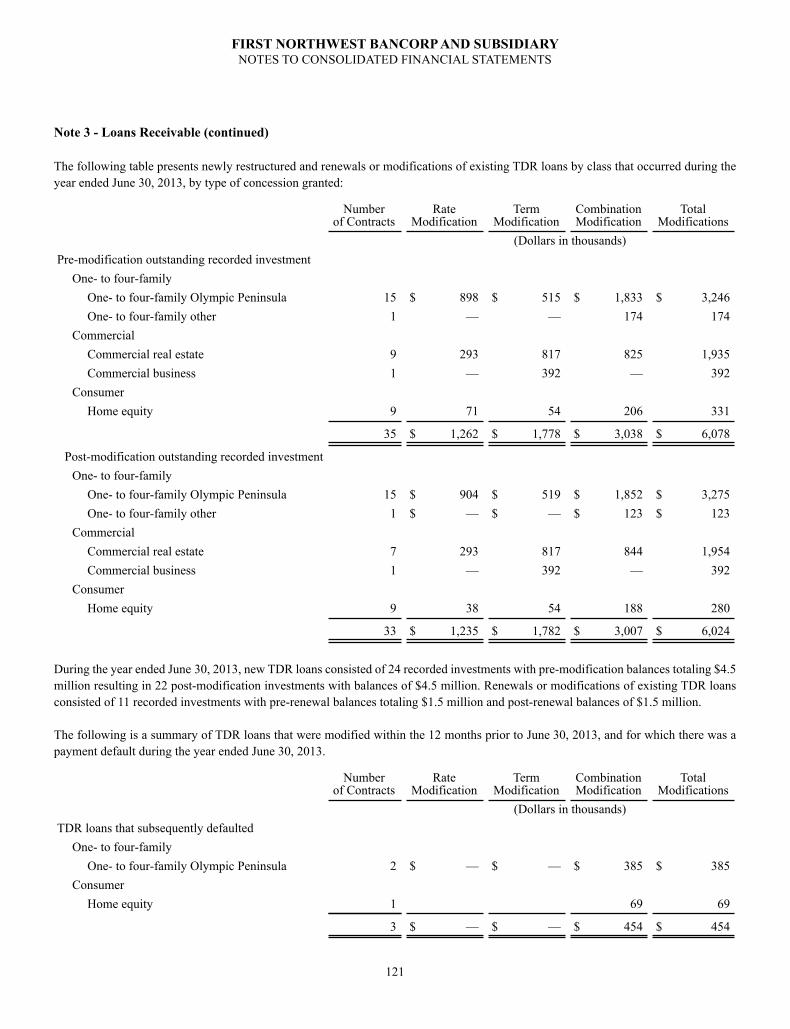
FIRST NORTHWEST BANCORP AND SUBSIDIARYNOTES TO CONSOLIDATED FINANCIAL STATEMENTS
121
Note 3 - Loans Receivable (continued)
The following table presents newly restructured and renewals or modifications of existing TDR loans by class that occurred during the year ended June 30, 2013, by type of concession granted:
Numberof Contracts
RateModification
TermModification
CombinationModification
TotalModifications
(Dollars in thousands)Pre-modification outstanding recorded investment
One- to four-familyOne- to four-family Olympic Peninsula 15 $ 898 $ 515 $ 1,833 $ 3,246One- to four-family other 1 — — 174 174
CommercialCommercial real estate 9 293 817 825 1,935Commercial business 1 — 392 — 392
ConsumerHome equity 9 71 54 206 331
35 $ 1,262 $ 1,778 $ 3,038 $ 6,078
Post-modification outstanding recorded investmentOne- to four-family
One- to four-family Olympic Peninsula 15 $ 904 $ 519 $ 1,852 $ 3,275One- to four-family other 1 $ — $ — $ 123 $ 123
CommercialCommercial real estate 7 293 817 844 1,954Commercial business 1 — 392 — 392
ConsumerHome equity 9 38 54 188 280
33 $ 1,235 $ 1,782 $ 3,007 $ 6,024
During the year ended June 30, 2013, new TDR loans consisted of 24 recorded investments with pre-modification balances totaling $4.5 million resulting in 22 post-modification investments with balances of $4.5 million. Renewals or modifications of existing TDR loans consisted of 11 recorded investments with pre-renewal balances totaling $1.5 million and post-renewal balances of $1.5 million.
The following is a summary of TDR loans that were modified within the 12 months prior to June 30, 2013, and for which there was a payment default during the year ended June 30, 2013.
Numberof Contracts
RateModification
TermModification
CombinationModification
TotalModifications
(Dollars in thousands)TDR loans that subsequently defaulted
One- to four-familyOne- to four-family Olympic Peninsula 2 $ — $ — $ 385 $ 385
ConsumerHome equity 1 69 69
3 $ — $ — $ 454 $ 454

FIRST NORTHWEST BANCORP AND SUBSIDIARYNOTES TO CONSOLIDATED FINANCIAL STATEMENTS
122
Note 3 - Loans Receivable (continued)
No additional funds are committed to be advanced in connection with impaired loans at June 30, 2015.
The following table presents TDR loans by class at the dates indicated by accrual and nonaccrual status.
June 30, 2015 June 30, 2014Accrual Nonaccrual Total Accrual Nonaccrual Total
(In thousands)One- to four-family
One- to four-family Olympic Peninsula $ 1,563 $ 2,917 $ 4,480 $ 3,941 $ 1,529 $ 5,470One- to four-family other 281 162 443 281 188 469
CommercialMulti-family — 629 629 728 — 728Commercial real estate 147 1,216 1,363 2,742 1,714 4,456Commercial business — 403 403 426 — 426
ConsumerHome equity 79 349 428 510 105 615
$ 2,070 $ 5,676 $ 7,746 $ 8,628 $ 3,536 $ 12,164
TDR loans may be upgraded in their classification and placed on accrual status once there is a sustained period of repayment performance, usually six months or longer, and there is a reasonable assurance that repayment will continue. First Federal allows reclassification of a troubled debt restructuring back into the general loan pool (as a non-troubled debt restructuring) if the borrower is able to refinance the loan at then-current market rates and meet all of the underwriting criteria of First Federal required of other borrowers. The refinance must be based on the borrower’s ability to repay the debt and no special concessions of rate and/or term are granted to the borrower.

FIRST NORTHWEST BANCORP AND SUBSIDIARYNOTES TO CONSOLIDATED FINANCIAL STATEMENTS
123
Note 4 - Real Estate Owned and Repossessed Assets
The following table presents the activity in real estate owned and repossessed assets for the periods shown:
June 30,2015 2014 2013
(In thousands)Beginning balance $ 810 $ 2,265 $ 2,864Loans transferred to foreclosed assets 2,585 1,138 2,965Sales (1,470) (2,312) (3,470)Write-downs (212) (306) (349)Net gain on sales 201 25 255
Ending balance $ 1,914 $ 810 $ 2,265
The following table presents the breakout of real estate owned and repossessed assets by type as of:
June 30,2015 2014
(In thousands)One- to four-family residential properties $ 493 $ 524Land — 220Commercial real estate 1,368 —Personal property 53 66
$ 1,914 $ 810
Note 5 - Premises and Equipment
Premises and equipment consist of the following at June 30, 2015 and 2014:
June 30,2015 2014
(In thousands)Land $ 2,560 $ 2,560Buildings 6,115 6,115Building improvements 7,220 7,201Furniture, fixtures, and equipment 6,140 6,599Software 1,349 1,347Automobiles 81 225Construction in progress 733 171
24,198 24,218Less accumulated depreciation and amortization (11,618) (11,931)
$ 12,580 $ 12,287
Depreciation expense was $973,000, $1.1 million, and $1.2 million for the years ended June 30, 2015, 2014, and 2013, respectively.

FIRST NORTHWEST BANCORP AND SUBSIDIARYNOTES TO CONSOLIDATED FINANCIAL STATEMENTS
124
Note 5 - Premises and Equipment (continued)
Operating rental payments for buildings were $126,000, $103,000, and $42,000 for the years ended June 30, 2015, 2014, and 2013, respectively.
Operating lease commitments - The Bank has lease agreements with unaffiliated parties for three locations. The lease terms for our two branches and one loan production office are not individually material. Lease expirations range from one to twenty years.
All lease agreements require the Bank to pay its pro-rata share of building operating expenses. The minimum annual lease payments under non-cancelable operating leases with initial or remaining terms of one year or more through the initial lease term are as follows:
June 30,Twelve-month period ending: (In thousands)2016 $ 1282017 1432018 1432019 1162020 90Thereafter 1,395
Total minimum payments required $ 2,015
Note 6 - Mortgage Servicing Rights
Loans serviced for FHLB, Fannie Mae, and Freddie Mac are not included in the accompanying consolidated balance sheets. The unpaid principal balances of serviced loans, primarily mortgage loans, were $213.9 million and $235.2 million at June 30, 2015 and 2014, respectively.
Mortgage servicing rights for the years ended June 30 are as follows:
2015 2014 2013(In thousands)
Balance at beginning of period $ 1,266 $ 1,434 $ 1,873Additions 197 154 214Amortization (276) (323) (720)Valuation allowance recovery — 1 67
Balance at end of period $ 1,187 $ 1,266 $ 1,434
The aggregate change in valuation allowance for mortgage servicing rights for the years ended June 30 are as follows:
2015 2014 2013(In thousands)
Balance at beginning of period $ — $ (1) $ (68)Impairments — — —Recoveries — 1 67
Balance at end of period $ — $ — $ (1)

FIRST NORTHWEST BANCORP AND SUBSIDIARYNOTES TO CONSOLIDATED FINANCIAL STATEMENTS
125
Note 6 - Mortgage Servicing Rights (continued)
The key economic assumptions used in determining the fair value of mortgage servicing rights at June 30 are as follows:
2015 2014 2013
Constant prepayment rate 13.0% 10.7% 20.9%Weighted-average life (years) 5.7 6.3 3.9Yield to maturity discount 9.9% 10.0% 9.8%
The fair values of mortgage servicing rights are approximately $1.8 million and $2.2 million at June 30, 2015 and 2014, respectively.
The following represents servicing and late fees earned in connection with mortgage servicing rights and is included in the accompanying consolidated financial statements as a component of noninterest income for the years ended June 30:
2015 2014 2013(In thousands)
Servicing fees $ 561 $ 606 $ 659Late fees 23 24 27
Note 7 - Deposits
The aggregate amount of time deposits in excess of the FDIC insured limit, currently $250,000, at June 30, 2015 and 2014, was $36.3 million and $26.4 million, respectively. Deposits and weighted-average interest rates at the dates indicated are as follows:
Weighted-Average Interest
RateJune 30,
2015
Weighted-Average Interest
RateJune 30,
2014(In thousands)
Savings 0.04% $ 88,129 0.04% $ 84,394Transaction accounts 0.01% 183,890 0.01% 172,708Insured money market accounts 0.17% 227,217 0.18% 209,605Certificates of deposit and jumbo certificates 0.94% 147,928 0.82% 133,692
$ 647,164 $ 600,399
Weighted-average interest rate 0.28% 0.25%

FIRST NORTHWEST BANCORP AND SUBSIDIARYNOTES TO CONSOLIDATED FINANCIAL STATEMENTS
126
Note 7 - Deposits (continued)
Maturities of certificates at the dates indicated are as follows:
June 30, 2015(In thousands)
Within one year or less $ 71,474After one year through two years 33,336After two years through three years 19,225After three years through four years 14,504After four years through five years 9,183After five years 206
$ 147,928
Deposits at June 30, 2015 and 2014, include $44.2 million and $38.1 million, respectively, in public fund deposits. Investment securities with a carrying value of $42.7 million and $37.4 million were pledged as collateral for these deposits at June 30, 2015 and 2014, respectively. This exceeds the minimum collateral requirements established by the Washington Public Deposit Protection Commission.
Interest on deposits by type for the periods shown was as follows:
Year Ended June 30,2015 2014 2013
(In thousands)Savings $ 38 $ 38 $ 59Transaction accounts 10 10 10Insured money market accounts 436 354 353Certificates of deposit and jumbo certificates 1,185 1,135 1,546
$ 1,669 $ 1,537 $ 1,968
Note 8 - Borrowings
FHLB BorrowingsFirst Federal is a member of the FHLB. As a member, First Federal has a committed line of credit of up to 40% of total assets, subject to the amount of FHLB stock ownership and certain collateral requirements.
First Federal has entered into borrowing arrangements with the FHLB to borrow funds primarily under long-term, fixed-rate advance agreements. First Federal also has a short-term, variable-rate revolving advance (CMA) which matures in May 2016. All borrowings are secured by collateral consisting of single-family, home equity, and multi-family loans receivable in the amounts of $198.8 million and $209.7 million; and investment securities with a carrying value of $7.3 million and $10.0 million, at June 30, 2015 and 2014, respectively, pledged as collateral.

FIRST NORTHWEST BANCORP AND SUBSIDIARYNOTES TO CONSOLIDATED FINANCIAL STATEMENTS
127
Note 8 - Borrowings (continued)
FHLB advances outstanding at June 30, 2015 and 2014, were as follows:
June 30,2015 2014
(In thousands)Long-term advances $ 89,924 $ 89,924CMA advance — 15,100
The maximum and average outstanding balances and average interest rates on CMA short-term, variable-rate advances were as follows:
June 30,2015 2014 2013
(In thousands)Maximum outstanding at any month-end $ 1,000 $ 31,000 $ 1,500Monthly average outstanding 83 7,967 125Weighted-average daily interest rates
Annual 0.29% 0.29% 0.46%Period End 0.29% 0.30% —%
Interest expense during the year 1 24 —
At June 30, 2015 and 2014, FHLB long-term, fixed-rate advances and are scheduled to mature as follows:
Weighted-AverageInterest Rate 2015
Weighted-AverageInterest Rate 2014
(In thousands)Within one year or less —% $ — —% $ —After one year through two years — — — —After two years through three years 2.71 6,924 — —After three years through four years 2.65 18,000 2.71 6,924After four years through five years 3.15 35,000 2.65 23,000After five years 3.80 30,000 3.24 60,000
$ 89,924 $ 89,924
The maximum and average outstanding balances and average interest rates on FHLB long-term, fixed-rate advances were as follows:
June 30,2015 2014 2013
(In thousands)Maximum outstanding at any month-end $ 89,924 $ 99,924 $ 99,924Monthly average outstanding 89,924 96,591 99,924Weighted-average interest rates
Annual 3.24% 3.26% 3.99%Period End 3.24% 3.24% 3.28%
Interest expense during the year 2,917 3,163 4,027

FIRST NORTHWEST BANCORP AND SUBSIDIARYNOTES TO CONSOLIDATED FINANCIAL STATEMENTS
128
Note 8 - Borrowings (continued)
Note PayableAt June 30, 2015, Craft3 Development IV, LLC, a subsidiary of First Federal, holds a fixed-rate promissory note from Craft3, Inc. in the amount of $109,000. Simple interest of 4.50% per annum is calculated on the outstanding principal balance and is due monthly. The entire unpaid principal balance plus any remaining interest due is payable prior to dissolving the partnership.
Note 9 - Federal Taxes on Income
The provision (benefit) for income taxes for the years ended June 30 is summarized as follows:
2015 2014 2013(In thousands)
Current $ 647 $ 1,096 $ 1,232Deferred (1,001) (356) (810)
$ (354) $ 740 $ 422
A reconciliation of the tax provision (benefit) based on statutory corporate tax rates, estimated to be 34%, on pre-tax income and the provision (benefit) shown in the accompanying consolidated statements of income for the years ended June 30 is summarized as follows:
2015 2014 2013(In thousands)
Income taxes computed at statutory rates $ (1,851) $ 1,159 $ 930Tax credits (195) (195) (195)Tax-exempt income (218) (357) (311)Bank-owned life insurance income (35) (32) (108)Deferred tax asset valuation allowance 1,917 — —Other, net 28 165 106
$ (354) $ 740 $ 422
As a result of the bad debt deductions taken in years prior to 1988, retained earnings include accumulated earnings of approximately $6.4 million, on which federal income taxes have not been provided. If, in the future, this portion of retained earnings is used for any purpose other than to absorb losses on loans or on property acquired through foreclosure, federal income taxes may be imposed at the then-prevailing corporate tax rates. The Company does not contemplate that such amounts will be used for any purpose that would create a federal income tax liability; therefore, no provision has been made.
Deferred tax assets and liabilities are recognized for the future tax consequences attributable to temporary differences between the financial statement carrying amounts of existing assets and liabilities and their respective tax basis. Deferred tax assets and liabilities are measured using enacted tax rates expected to apply to taxable income in the years in which those temporary differences are expected to be recovered or settled. The effect on deferred tax assets and liabilities of a change in tax rates is recognized in income in the period that includes the enactment date. These calculations are based on many complex factors including estimates of the timing of reversals of temporary differences, the interpretation of federal income tax laws, and a determination of the differences between the tax and the financial reporting basis of assets and liabilities. Actual results could differ significantly from the estimates and interpretations used in determining the current and deferred income tax assets and liabilities.

FIRST NORTHWEST BANCORP AND SUBSIDIARYNOTES TO CONSOLIDATED FINANCIAL STATEMENTS
129
Note 9 - Federal Taxes on Income (continued)
During the year ended June 30, 2015, the Company contributed $400,000 in cash and $9.3 million in common stock to the Foundation. Under current Federal income tax regulations, charitable contribution deductions are limited to 10% of taxable income. Accordingly, the $9.7 million contribution created a carryforward for income tax purposes with a deferred tax asset of $3.3 million and related valuation allowance of $1.9 million for financial statement reporting purposes. At June 30, 2015, the balance of the contribution carryforward totaled $9.3 million. The contribution carryforward will expire in 2020. A valuation allowance is provided when it is more likely than not that some portion or all of the deferred tax assets will not be realized. The Company evaluates whether its deferred tax assets will be realized and adjusts the amount of its valuation allowance, if necessary. There was a valuation allowance of $1.9 million at June 30, 2015, and no valuation allowance at June 30, 2014.
First Federal participated in the New Markets Tax Credit program for low-income communities beginning in fiscal year ended June 30, 2008, through June 2015. First Federal received tax credits of approximately $1.9 million over seven years. Tax benefits related to these credits were recognized for financial reporting purposes in different periods than the credits are recognized in First Federal’s income tax returns due to a yearly tax basis reduction resulting in a gain for income tax purposes at the end of the tax credit period. The financial reporting tax credit approximated $1.3 million over the seven-year period, representing the available tax credit of $1.9 million less the reduction of the tax gain of $655,000 calculated at First Federal’s current tax rate of 34%.
First Federal complied with the various regulatory provisions of the New Markets Tax Credit program and, therefore, will earn approximately $296,000 of credits that will be claimed on the Company's current-year tax return. Additionally, as of June 30, 2015, there were tax credit carryforwards of $205,000 that begin to expire in 2033.
The Company applies the provisions of FASB ASC 740 that require the application of a more-likely-than-not recognition criterion for the reporting of uncertain tax positions on its financial statements. The Company had no unrecognized tax assets at June 30, 2015 and June 30, 2014. During the years ended June 30, 2015 and 2014, the Company recognized no interest and penalties. The Company recognizes interest and penalties in income tax expense. The Company files income tax returns in the U.S. federal jurisdiction and is no longer subject to U.S. federal income tax examinations by tax authorities for years ending before June 30, 2012.
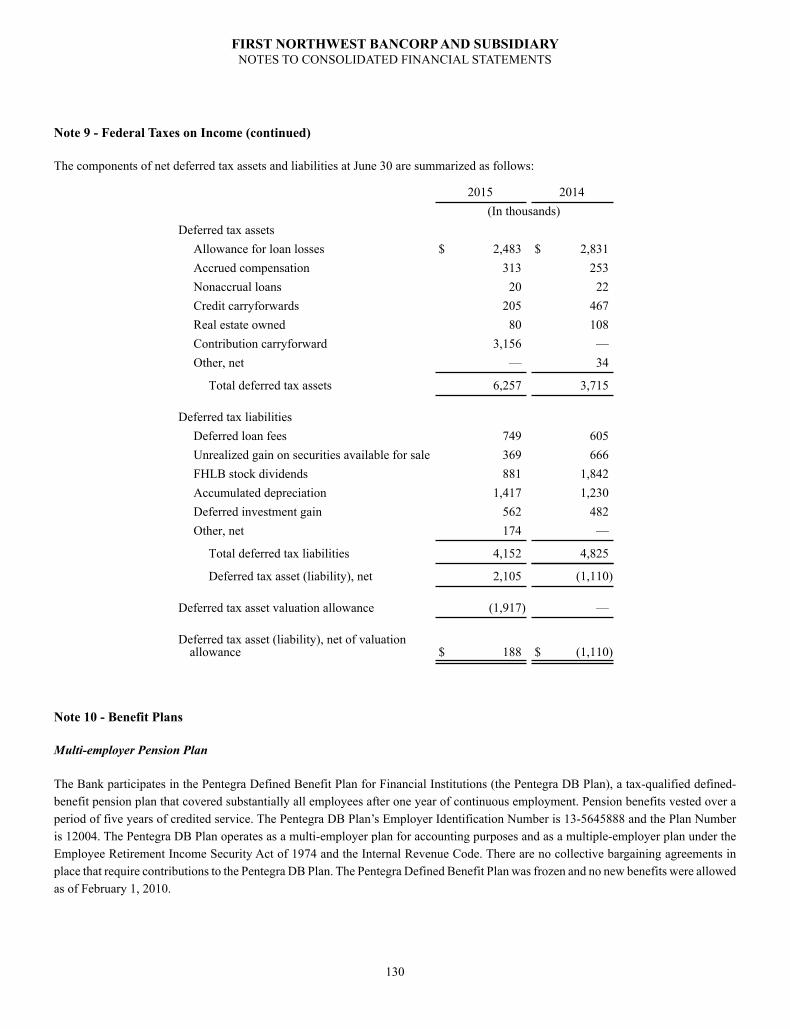
FIRST NORTHWEST BANCORP AND SUBSIDIARYNOTES TO CONSOLIDATED FINANCIAL STATEMENTS
130
Note 9 - Federal Taxes on Income (continued)
The components of net deferred tax assets and liabilities at June 30 are summarized as follows:
2015 2014(In thousands)
Deferred tax assetsAllowance for loan losses $ 2,483 $ 2,831Accrued compensation 313 253Nonaccrual loans 20 22Credit carryforwards 205 467Real estate owned 80 108Contribution carryforward 3,156 —Other, net — 34
Total deferred tax assets 6,257 3,715
Deferred tax liabilitiesDeferred loan fees 749 605Unrealized gain on securities available for sale 369 666FHLB stock dividends 881 1,842Accumulated depreciation 1,417 1,230Deferred investment gain 562 482Other, net 174 —
Total deferred tax liabilities 4,152 4,825
Deferred tax asset (liability), net 2,105 (1,110)
Deferred tax asset valuation allowance (1,917) —
Deferred tax asset (liability), net of valuationallowance $ 188 $ (1,110)
Note 10 - Benefit Plans
Multi-employer Pension Plan
The Bank participates in the Pentegra Defined Benefit Plan for Financial Institutions (the Pentegra DB Plan), a tax-qualified defined-benefit pension plan that covered substantially all employees after one year of continuous employment. Pension benefits vested over a period of five years of credited service. The Pentegra DB Plan’s Employer Identification Number is 13-5645888 and the Plan Number is 12004. The Pentegra DB Plan operates as a multi-employer plan for accounting purposes and as a multiple-employer plan under the Employee Retirement Income Security Act of 1974 and the Internal Revenue Code. There are no collective bargaining agreements in place that require contributions to the Pentegra DB Plan. The Pentegra Defined Benefit Plan was frozen and no new benefits were allowed as of February 1, 2010.

FIRST NORTHWEST BANCORP AND SUBSIDIARYNOTES TO CONSOLIDATED FINANCIAL STATEMENTS
131
Note 10 - Benefit Plans (continued)
The Pentegra DB Plan is a single plan under Internal Revenue Code Section 413(c) and, as a result, all of the assets stand behind all of the liabilities. Accordingly, under the Pentegra DB Plan, contributions made by a participating employer may be used to provide benefits to participants of other participating employers.
The table below presents the funded status (market value of plan assets divided by funding target) of the plan as of July 1:
2014 2013Source Valuation Report Valuation ReportOur plan 105.3% 93.3%
There was no change to the funded status of the plan as of June 30, 2015. First Federal’s contributions to the Pentegra DB Plan are not more than 5% of the total contributions to the Pentegra DB Plan. First Federal’s policy is to fund pension costs as accrued.
Total contributions during the years ended June 30 were:
2015 2014 2013Date Paid Amount Date Paid Amount Date Paid Amount
(In thousands)12/26/2014 $ 700 9/4/2013 $ 31 10/26/2012 $ 28
12/31/2013 763 12/10/2012 634
$ 700 $ 794 $ 662
Nonqualified Deferred Compensation Plan
First Federal also sponsors a nonqualified Deferred Compensation Plan for members of the Board of Directors and eligible officer-level employees. This plan, approved by the Board on February 1, 2012, allows eligible participants to defer and invest a portion of their earnings in a selection of investment options identified in the plan at no expense to First Federal. All deferrals are remitted to Pentegra, the Plan Administrator, and held in a trust. The aggregate balance held in trust at June 30, 2015 was $320,000.
The Company also has agreements with certain key officers that provide for potential payments upon retirement, disability, termination, change in control and death.
401(k) Plan
During the year ended June 30, 1994, First Federal began participation in a multi-employer 401(k) plan funded by employees and a Bank matching program. In December 2012, the Plan converted to a single-employer 401(k) plan. Employees may contribute up to 20% of their pre-tax compensation to the 401(k) plan. First Federal provides matching funds of 50% limited to the first 6% of salary contributed. First Federal's contributions were $163,000, $153,000, and $136,000 during the years ended June 30, 2015, 2014, and 2013, respectively.
Employee Stock Ownership Plan
In connection with the mutual to stock conversion, the Company established an ESOP for eligible employees of the Company and the Bank. Employees of the Company who have been credited with at least 1,000 hours of service during a 12-month period are eligible to participate in the ESOP.

FIRST NORTHWEST BANCORP AND SUBSIDIARYNOTES TO CONSOLIDATED FINANCIAL STATEMENTS
132
Note 10 - Benefit Plans (continued)
Pursuant to the Plan, the ESOP intends to purchase in the open market 8% of the common stock for a total of 1,048,029 shares. As of June 30, 2015, 952,799 shares, or 90.9% of the total, have been purchased in the open market at an average price of $12.38 per share with funds borrowed from First Northwest. The Bank will make contributions to the ESOP in amounts necessary to amortize the ESOP loan payable to First Northwest over a period of 20 years, bearing estimated interest at 2.44%.
Shares purchased by the ESOP with the loan proceeds are held in a suspense account and allocated to ESOP participants on a pro rata basis as principal and interest payments are made by the ESOP to the Company. The loan is secured by shares purchased with the loan proceeds and will be repaid by the ESOP with funds from the Bank's discretionary contributions to the ESOP and earnings on the ESOP assets. An annual principal and interest payment of $274,000 was made by the ESOP during the year ended June 30, 2015.
As shares are committed to be released from collateral, the Company reports compensation expense equal to the average daily market prices of the shares and the shares become outstanding for EPS computations. The compensation expense is accrued monthly throughout the year. Dividends on allocated ESOP shares will be recorded as a reduction of retained earnings; dividends on unallocated ESOP shares will be recorded as a reduction of debt and accrued interest.
Compensation expense related to the ESOP for the year ended June 30, 2015 was $216,000.
Shares held by the ESOP as of the dates indicated are as follows:
June 30, 2015(Dollars in thousands)
Allocated shares 17,510Unallocated shares 935,289
Total ESOP shares 952,799
Fair value of unallocated shares $ 11,532
Note 11 - Regulatory Capital Requirements
Under Federal regulations, pre-conversion retained earnings are restricted for the protection of pre-conversion depositors.
The Bank is subject to various regulatory capital requirements administered by federal and state agencies. Failure to meet minimum capital requirements can initiate certain mandatory and possibly additional discretionary actions by regulators that, if undertaken, could have a direct material effect on the Bank’s financial statements. Under capital adequacy guidelines and the regulatory framework for prompt corrective action, the Bank must meet specific capital guidelines that involve quantitative measures of the Bank’s assets, liabilities, and certain off-balance-sheet items as calculated under regulatory accounting practices. The Bank’s capital amounts and classification are also subject to qualitative judgments by the regulators about components, risk weightings, and other factors. Prompt corrective action provisions are not applicable to bank holding companies.
Quantitative measures established by regulation to ensure capital adequacy require the Bank to maintain minimum amounts and ratios (set forth in the table that follows) of total and Tier I capital to risk-weighted assets (as defined in the regulations) and of Tier 1 capital to average assets.

FIRST NORTHWEST BANCORP AND SUBSIDIARYNOTES TO CONSOLIDATED FINANCIAL STATEMENTS
133
Note 11 - Regulatory Capital Requirements (continued)
Effective January 1, 2015 (with some changes transitioned into full effectiveness over two to four years), the Bank is now subject to new capital requirements which create a new required ratio for common equity Tier 1 (“CET1”) capital, increases the leverage and Tier 1 capital ratios, changes the risk-weightings of certain assets for purposes of the risk-based capital ratios, creates an additional capital conservation buffer over the required capital ratios and changes what qualifies as capital for purposes of meeting these various capital requirements. The Bank is required to maintain additional levels of Tier 1 common equity over the minimum risk-based capital levels before it may pay dividends, repurchase shares or pay discretionary bonuses.
The new minimum requirements are a ratio of common equity Tier 1 capital (CET1 capital) to total risk-weighted assets the (“CET1 risk-based ratio”) of 4.5%, a Tier 1 capital ratio of 6.0%, a total capital ratio of 8.0%, and a leverage ratio of 4.0%.
In addition to the capital requirements, there are a number of changes in what constitutes regulatory capital, subject to a certain transition period. These changes include the phasing-out of certain instruments as qualifying capital. The Bank does not have any of these instruments. Mortgage servicing and deferred tax assets over designated percentages of CET1 are deducted from capital, subject to a transition period ending December 31, 2017. CET1 consists of Tier 1 capital less all capital components that are not considered common equity. In addition, Tier 1 capital includes accumulated other comprehensive income, which includes all unrealized gains and losses on available for sale debt and equity securities, subject to a transition period ending December 31, 2017. Because of the Bank’s asset size, the Bank is not considered an advanced approaches banking organization and has elected to permanently opt-out of the inclusion of unrealized gains and losses on available for sale debt and equity securities in its capital calculations.
The new requirements also include changes in the risk-weighting of assets to better reflect credit risk and other risk exposure. These include a 150% risk weight (up from 100%) for certain high volatility commercial real estate acquisition, development and construction loans and for non-residential mortgage loans that are 90 days past due or otherwise in nonaccrual status; a 20% (up from 0%) credit conversion factor for the unused portion of a commitment with an original maturity of one year or less that is not unconditionally cancellable; and a 250% risk weight (up from 100%) for mortgage servicing and deferred tax assets that are not deducted from capital.
In addition to the minimum CET1, Tier 1 and total capital ratios, the Bank will have to maintain a capital conservation buffer consisting of additional CET1 capital equal to 2.5% of risk-weighted assets above the required minimum levels in order to avoid limitations on paying dividends, engaging in share repurchases, and paying discretionary bonuses based on percentages of eligible retained income that could be utilized for such actions. This new capital conservation buffer requirement is to be phased in beginning in January 2016 at 0.625% of risk-weighted assets and increasing each year until fully implemented in January 2019.
Under the new standards, in order to be considered well-capitalized, the Bank must maintain a CET1 risk-based ratio of 6.5% (new), a Tier 1 risk-based ratio of 8% (increased from 6%), a total risk-based capital ratio of 10% (unchanged) and a leverage ratio of 5% (unchanged).
As of June 30, 2015, the most recent regulatory notifications categorized First Federal as “well capitalized” under the regulatory framework for prompt corrective action. To be categorized as “well capitalized,” the Bank must maintain minimum total risk-based, Tier I risk-based, and Tier I leverage ratios as set forth in the following table. There are no conditions or events since that notification that management believes have changed First Federal’s category.
At periodic intervals, the DFI and FDIC routinely examine First Federal as part of its legally prescribed oversight of the banking industry. A future examination by the DFI and FDIC could include a review of certain transactions or other amounts reported in First Federal’s consolidated financial statements. Based on these examinations, the regulators can direct that First Federal’s consolidated financial statements be adjusted in accordance with their findings. In view of the uncertain regulatory environment in which First Federal operates, the extent, if any, to which a forthcoming regulatory examination may ultimately result in adjustments to the accompanying consolidated financial statements cannot presently be determined.
At June 30, 2015 and 2014, regulatory capital for First Federal was calculated in accordance with the FDIC’s Call Report guidelines.

FIRST NORTHWEST BANCORP AND SUBSIDIARYNOTES TO CONSOLIDATED FINANCIAL STATEMENTS
134
Note 11 - Regulatory Capital Requirements (continued)
First Federal’s actual and required capital amounts and ratios are presented in the following table:
ActualFor Capital
Adequacy Purposes
To Be Categorized As Well Capitalized
Under Prompt CorrectiveAction Provision
Amount Ratio Amount Ratio Amount Ratio(In thousands)
As of June 30, 2015Common Equity Tier 1 Capital Ratio
(Common equity tier 1 capital to risk-weighted assets) $ 129,618 23.76% $ 24,549 4.50% $ 35,460 6.50%
Tier 1 Capital Ratio(Tier 1 capital to risk-weighted assets) $ 129,618 23.76% $ 32,733 6.00% $ 43,643 8.00%
Total Capital Ratio(Risk-based capital to risk-weighted assets) $ 136,443 25.01% $ 43,643 8.00% $ 54,554 10.00%
Tier 1 Leverage Ratio(Tier 1 capital to adjusted average assets) $ 129,618 14.53% $ 35,695 4.00% $ 44,618 5.00%
As of June 30, 2014Total capital
(to risk-weighted assets) $ 85,127 19.58% $ 34,776 8.00% $ 43,470 10.00%Core or Tier I capital
(to adjusted tangible assets) $ 79,657 9.92% $ 32,116 4.00% $ 40,145 5.00%Tier I capital
(to tangible assets) $ 79,657 9.92% $ 12,043 1.50% N/ATier I capital
(to risk-weighted assets) $ 79,657 18.32% N/A $ 26,082 6.00%
Note 12 - Related Party Transactions
Certain directors and executive officers are also customers who transact business with First Federal. All loans and commitments included in such transactions were made in compliance with applicable laws on substantially the same terms (including interest rates and collateral) as those prevailing at the time for comparable transactions with other persons and do not involve more than the normal risk of collectability or present any other unfavorable features.

FIRST NORTHWEST BANCORP AND SUBSIDIARYNOTES TO CONSOLIDATED FINANCIAL STATEMENTS
135
The following table presents the activity in loans to directors and executive officers for the periods shown:
At or For the Year Ended June 30,2015 2014 2013
(In thousands)Beginning balance $ 1,226 $ 1,231 $ 1,453Loan advances 36 187 382Loan repayments (49) (105) (382)Reclassifications1 (396) (87) (222)
Ending balance $ 817 $ 1,226 $ 1,231
1 Represents loans that were once considered related party but are no longer considered related party or loans that were not related party that subsequently became related party loans.
Deposits and certificates from related parties totaled $3.1 million and $3.9 million at June 30, 2015 and 2014, respectively.
Note 13 - Commitments and Contingencies
First Federal is a party to financial instruments with off-balance-sheet risk in the normal course of business to meet the financing needs of its customers. These financial instruments generally represent a commitment to extend credit in the form of loans. The instruments involve, to varying degrees, elements of credit and interest rate risk in excess of the amount recognized in the consolidated balance sheets.
First Federal’s exposure to credit loss, in the event of nonperformance by the other party to the financial instrument for commitments to extend credit, is represented by the contractual notional amount of those instruments. First Federal uses the same credit policies in making commitments as it does for on-balance-sheet instruments. Management does not anticipate any material loss as a result of these transactions.
Commitments to extend credit are agreements to lend to a customer as long as there is no violation of any condition established by the contract. Commitments generally have fixed expiration dates or other termination clauses and may require payment of a fee. Since many of these commitments are expected to expire without being drawn upon, the total commitment amounts do not necessarily represent future cash requirements. First Federal evaluates each customer’s creditworthiness on a case-by-case basis. First Federal did not incur any significant losses on its commitments for the years ended June 30, 2015 and 2014.
The following financial instruments were outstanding whose contract amounts represent credit risk at June 30:
2015 2014 (In thousands)
Commitments to grant loans $ 4,183 $ 191Standby letters of credit 201 260Unfunded commitments under lines of credit or existing loans 38,956 38,538

FIRST NORTHWEST BANCORP AND SUBSIDIARYNOTES TO CONSOLIDATED FINANCIAL STATEMENTS
136
Note 13 - Commitments and Contingencies (continued)
Legal contingencies - Various legal claims may arise from time to time in the normal course of business, which, in the opinion of management, have no current material effect on First Federal’s consolidated financial statements.
Significant group concentrations of credit risk - Concentration of credit risk is the risk associated with a lack of diversification, such as having substantial loan concentrations in a specific type of loan within First Federal’s loan portfolio, thereby exposing First Federal to greater risks resulting from adverse economic, political, regulatory, geographic, industrial, or credit developments. Loans-to-one-borrower are subject to the state banking regulations general limitation of 20 percent of First Federal’s equity, excluding accumulated other comprehensive income. At June 30, 2015 and 2014, First Federal’s most significant concentration of credit risk was in loans secured by real estate. These loans totaled approximately $471.5 million and $475.8 million, or 95.5% and 94.4%, of First Federal’s total loan portfolio at June 30, 2015 and 2014, respectively. Real estate construction, including land acquisition and land development, commercial real estate, multi-family, home equity, and one- to four-family residential loans are included in the total loans secured by real estate for purposes of this calculation. After a period of decline the real estate market has begun to recover, which has helped stabilize nonperforming loans and the allowance for loan losses.
At June 30, 2015 and 2014, First Federal’s most significant investment concentration of credit risk was with the U.S. Government, its agencies, and Government-Sponsored Enterprises (GSEs). First Federal’s exposure, which results from positions in securities issued by the U.S. Government, its agencies, and securities guaranteed by GSEs, was $295.4 million and $218.9 million, or 80.8% and 90.4%, of First Federal’s total investment portfolio (including FHLB stock) at June 30, 2015 and 2014, respectively.
Note 14 - Fair Value Accounting and Measurement
Fair value is the price to sell an asset or transfer a liability in an orderly transaction between market participants in the Company’s principal market. The Company has established and documented its process for determining the fair values of its assets and liabilities, where applicable. Fair value is based on quoted market prices, when available, for identical or similar assets or liabilities. In the absence of quoted market prices, management determines the fair value of the Company’s assets and liabilities using valuation models or third-party pricing services, both of which rely on market-based parameters when available, such as interest rate yield curves, option volatilities and credit spreads, or unobservable inputs. Unobservable inputs may be based on management’s judgment, assumptions, and estimates related to credit quality, liquidity, interest rates, and other relevant inputs.
Any changes to valuation methodologies are reviewed by management to ensure they are relevant and justified. Valuation methodologies are refined as more market-based data becomes available.
A three-level valuation hierarchy is used in determining fair value that is based on the transparency of the inputs used in the valuation process. The inputs used in determining fair value in each of the three levels of the hierarchy are as follows:
Level 1 - Quoted prices (unadjusted) in active markets for identical assets or liabilities.
Level 2 - Either: (i) quoted prices for similar assets or liabilities; (ii) observable inputs, such as interest rates or yield curves; or (iii) inputs derived principally from or corroborated by observable market data.
Level 3 - Unobservable inputs.

FIRST NORTHWEST BANCORP AND SUBSIDIARYNOTES TO CONSOLIDATED FINANCIAL STATEMENTS
137
Note 14 - Fair Value Accounting and Measurement (continued)
The hierarchy gives the highest ranking to Level 1 inputs and the lowest ranking to Level 3 inputs. The level in the fair value hierarchy within which the fair value measurement in its entirety falls is determined based on the lowest level input that is significant to the overall fair value measurement.
Qualitative disclosures of valuation techniques - Securities available for sale: where quoted prices are available in an active market, securities are classified as Level 1. Level 1 instruments include highly liquid government bonds, securities issued by the U.S. Treasury, and exchange-traded equity securities.
If quoted prices are not available, management determines fair value using pricing models, quoted prices of similar securities, which are considered Level 2, or discounted cash flows. In certain cases, where there is limited activity in the market for a particular instrument, assumptions must be made to determine their fair value. Such instruments are classified as Level 3.
Assets and liabilities measured at fair value on a recurring basis - Assets and liabilities are considered to be fair valued on a recurring basis if fair value is measured regularly (i.e., daily, weekly, monthly, or quarterly). The following tables show the Company’s assets and liabilities measured at fair value on a recurring basis at the dates indicated:
June 30, 2015Quoted Prices in
Active Markets for Identical Assets
or Liabilities
Significant Other
Observable Inputs
Significant Unobservable
Inputs(Level 1) (Level 2) (Level 3) Total
(In thousands)Securities available-for-sale
Municipal bonds $ — $ 17,274 $ — $ 17,274Agency bonds — 23,774 — 23,774ABS agency — 9,201 — 9,201ABS corporate — 29,634 — 29,634SBA — 34,328 — 34,328MBS agency — 176,877 — 176,877MBS corporate — 7,952 — 7,952
$ — $ 299,040 $ — $ 299,040
June 30, 2014Quoted Prices in
Active Markets for Identical Assets
or Liabilities
SignificantOther
Observable Inputs
SignificantUnobservable
Inputs(Level 1) (Level 2) (Level 3) Total
(In thousands)Securities available-for-sale
Municipal bonds $ — $ 7,525 $ — $ 7,525ABS agency — 10,140 — 10,140SBA — 28,944 — 28,944MBS agency — 132,363 — 132,363
$ — $ 178,972 $ — $ 178,972

FIRST NORTHWEST BANCORP AND SUBSIDIARYNOTES TO CONSOLIDATED FINANCIAL STATEMENTS
138
Note 14 - Fair Value Accounting and Measurement (continued)
Assets measured at fair value on a nonrecurring basis - Assets are considered to be fair valued on a nonrecurring basis if the fair value measurement of the instrument does not necessarily result in a change in the amount recorded on the consolidated balance sheets. Generally, nonrecurring valuation is the result of the application of other accounting pronouncements that require assets or liabilities to be assessed for impairment or recorded at the lower of cost or fair value.
The following tables present the Company’s assets measured at fair value on a nonrecurring basis at the dates indicated:
June 30, 2015Level 1 Level 2 Level 3 Total
(In thousands)Impaired loans $ — $ — $ 10,760 $ 10,760Real estate owned and repossessed assets — — 1,914 1,914
$ — $ — $ 12,674 $ 12,674
June 30, 2014Level 1 Level 2 Level 3 Total
(In thousands)Impaired loans $ — $ — $ 14,733 $ 14,733Real estate owned and repossessed assets — — 810 810
$ — $ — $ 15,543 $ 15,543
The following tables present the techniques used to value assets measured at fair value on a nonrecurring basis at the dates indicated:
June 30, 2015
Fair ValueValuationTechnique Unobservable Input
Range(Weighted-Average)1
(In thousands)Impaired loans $ 10,760 Market comparable Discount to appraisal 0% - 25% (2%)Real estate owned and repossessed
assets 1,914 Market comparable Discount to appraisal 0% - 8% (1%)1 Discount to appraisal disposition value.
June 30, 2014
Fair ValueValuationTechnique Unobservable Input
Range(Weighted-Average)1
(In thousands)Impaired loans $ 14,733 Market comparable Discount to appraisal 0% - 35% (6%)Real estate owned and repossessed
assets 810 Market comparable Discount to appraisal 0% - 10% (1%)1 Discount to appraisal disposition value.

FIRST NORTHWEST BANCORP AND SUBSIDIARYNOTES TO CONSOLIDATED FINANCIAL STATEMENTS
139
Note 14 - Fair Value Accounting and Measurement (continued)
The following tables present the carrying value and estimated fair value of financial instruments at the dates indicated:
June 30, 2015Level 1 Level 2 Level 3 Total
CarryingAmount
FairValue
CarryingAmount
FairValue
CarryingAmount
FairValue
CarryingAmount
FairValue
(In thousands)Financial assets
Cash and cash equivalents $ 45,030 $ 45,030 $ — $ — $ — $ — $ 45,030 $ 45,030Investment securities available forsale — — 299,040 299,040 — — 299,040 299,040Investment securities held tomaturity — — 61,524 62,510 — — 61,524 62,510Loans held for sale — — 110 110 — — 110 110Loans receivable, net — — — — 487,887 493,270 487,887 493,270FHLB stock — — 4,807 4,807 — — 4,807 4,807Accrued interest receivable — — 2,546 2,546 — — 2,546 2,546Mortgage servicing rights, net — — — — 1,187 1,837 1,187 1,837
Financial liabilitiesDemand deposits $ 499,236 $ 499,236 $ — $ — $ — $ — $ 499,236 $ 499,236Time deposits — — 147,928 148,436 — — 147,928 148,436Borrowings — — 90,033 93,426 — — 90,033 93,426Accrued interest payable — — 265 265 — — 265 265
June 30, 2014Level 1 Level 2 Level 3 Total
CarryingAmount
FairValue
CarryingAmount
FairValue
CarryingAmount
FairValue
CarryingAmount
FairValue
(In thousands)Financial assets
Cash and cash equivalents $ 18,960 $ 18,960 $ — $ — $ — $ — $ 18,960 $ 18,960Investment securities available forsale — — 178,972 178,972 — — 178,972 178,972Investment securities held tomaturity — — 53,244 53,982 — — 53,244 53,982Loans held for sale — — 613 613 — — 613 613Loans receivable, net 496,184 505,181 496,184 505,181FHLB stock — — 10,047 10,047 — — 10,047 10,047Accrued interest receivable — — 2,272 2,272 — — 2,272 2,272Mortgage servicing rights, net — — — — 1,266 2,157 1,266 2,157
Financial liabilitiesDemand deposits $ 466,707 $ 466,707 $ — $ — $ — $ — $ 466,707 $ 466,707Time deposits — — 133,692 134,162 — — 133,692 134,162Borrowings — — 105,133 107,584 — — 105,133 107,584Accrued interest payable — — 262 262 — — 262 262

FIRST NORTHWEST BANCORP AND SUBSIDIARYNOTES TO CONSOLIDATED FINANCIAL STATEMENTS
140
Note 14 - Fair Value Accounting and Measurement (continued)
Financial assets and liabilities other than investment securities are not traded in active markets. Estimated fair values require subjective judgments and are approximate. The estimates of fair value in the previous table are not necessarily representative of amounts that could be realized in actual market transactions, or of the underlying value of the Company. Fair value estimates, methods, and assumptions are set forth below for the Company's financial instruments:
Financial instruments with book value equal to fair value - The fair value of financial instruments that are short-term or reprice frequently and that have little or no risk are considered to have a fair value equal to book value. These instruments include cash and due from banks, interest bearing deposits with banks, loans held for sale, FHLB stock, accrued interest receivable, and accrued interest payable. FHLB stock is not publicly traded, however, it may be redeemed on a dollar-for-dollar basis, for any amount the Bank is not required to hold, subject to the FHLB's discretion. The fair value is therefore equal to the book value.
Securities - Fair values for investment securities are primarily measured using information from a third-party pricing service. The pricing service uses evaluated pricing models based on market data. In the event that limited or less transparent information is provided by the third-party pricing service, fair value is estimated using secondary pricing services or non-binding third-party broker quotes.
Loans receivable, net - Fair values are estimated for portfolios of loans with similar financial characteristics. Loans are segregated by type, including fixed and variable one- to four-family residential real estate, commercial, and consumer loans. There is an accurate and reliable secondary market for one- to four-family residential mortgage production, and available market benchmarks are used to establish discount factors for estimating fair value for these types of loans. Commercial and consumer loans use market benchmarks when available; however, due to the varied term structures and credit issues involved, they mainly rely on cash flow projections and repricing characteristics within the loan portfolio. These amounts are discounted further by embedded probable losses expected to be realized in the portfolio.
Valuations of impaired loans, real estate owned and repossessed assets are periodically performed by management, and the fair values of these loans are carried at the fair value of the underlying collateral less estimated costs to sell. Fair value of the underlying collateral may be determined using an appraisal performed by a qualified independent appraiser.
Mortgage servicing rights - The estimated fair value of mortgage servicing rights is based on market prices for comparable mortgage servicing contracts, when available, or alternatively, is based on a valuation model that calculates the present value of estimated future net servicing income.
Deposits - The fair value of deposits with no stated maturity, such as non-interest bearing deposits, savings and interest checking accounts, and money market accounts, is equal to the amount payable on demand as of June 30, 2015 and 2014. The fair value of certificates of deposit is based on the discounted value of contractual cash flows. The discount rate is estimated using the rates currently offered for deposits of similar remaining maturities.
Borrowings - The fair value of FHLB advances and other borrowings are calculated using a discounted cash flow method, adjusted for market interest rates and terms to maturity.
Off-balance-sheet financial instruments - Commitments to extend credit represent all off-balance-sheet financial instruments. The fair value of these commitments is not significant.

FIRST NORTHWEST BANCORP AND SUBSIDIARYNOTES TO CONSOLIDATED FINANCIAL STATEMENTS
141
Note 15 - Earnings per Share
Basic earnings per share are computed by dividing income available to common stockholders by the weighted average number of common shares outstanding for the period. Diluted earnings per share reflect the potential dilution that could occur if securities or other contracts to issue common stock were exercised or converted into common stock or resulted in the issuance of common stock that then shared in the earnings of the entity. Basic and diluted earnings per share are the same amount at June 30, 2015 as the Company does not have any additional potential dilutive common shares.
The following table presents a reconciliation of the components used to compute basic and diluted loss per share for the periods shown.
Year Ended June 30,2015 2014
Numerator:Net (loss) income $ (5,090) $ 2,668
Denominator:Denominator for basic and diluted earnings per share -
weighted average common shares outstanding 12,165,071 na(1)
Basic and diluted loss per share $ (0.42)
(1) Earnings per share and share calculations are not applicable (na) as the Company completed its stock conversion and became a public company on January 29, 2015.
As of June 30, 2015, the ESOP had purchased 952,799 shares in the open market. Unallocated ESOP shares are not included as outstanding shares for basic or diluted earnings per share calculations. As of June 30, 2015, 17,510 shares have been allocated to employees through the ESOP while 935,289 shares remain unallocated.
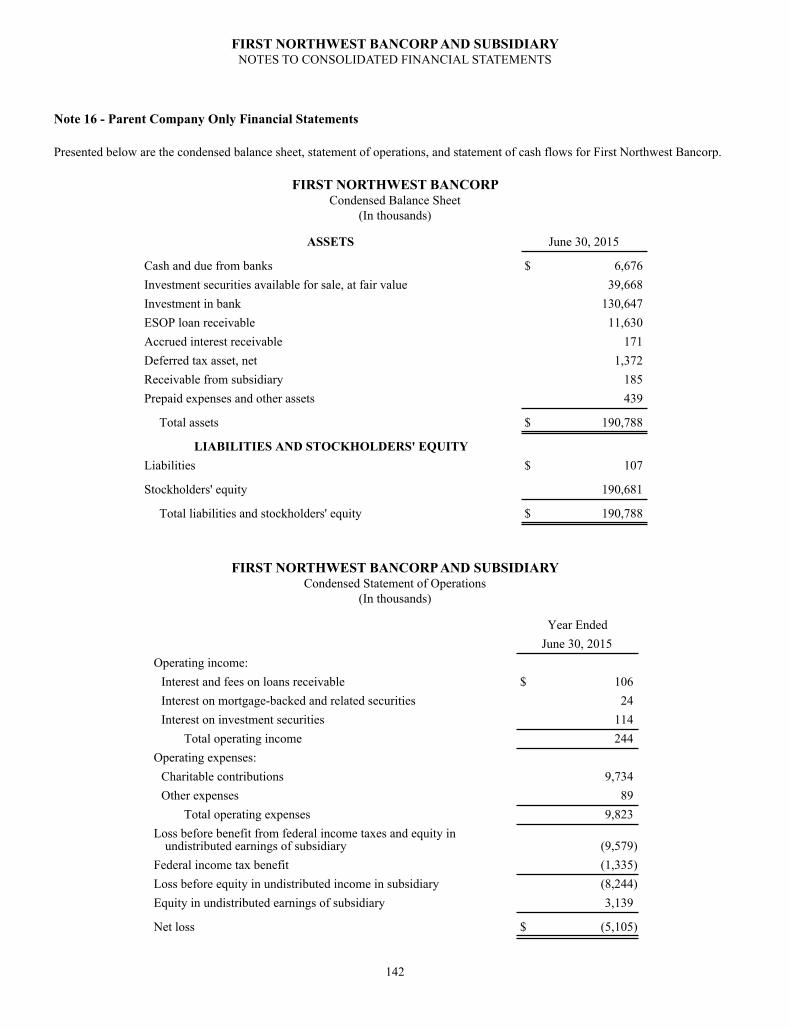
FIRST NORTHWEST BANCORP AND SUBSIDIARYNOTES TO CONSOLIDATED FINANCIAL STATEMENTS
142
Note 16 - Parent Company Only Financial Statements
Presented below are the condensed balance sheet, statement of operations, and statement of cash flows for First Northwest Bancorp.
FIRST NORTHWEST BANCORPCondensed Balance Sheet
(In thousands)
ASSETS June 30, 2015
Cash and due from banks $ 6,676Investment securities available for sale, at fair value 39,668Investment in bank 130,647ESOP loan receivable 11,630Accrued interest receivable 171Deferred tax asset, net 1,372Receivable from subsidiary 185Prepaid expenses and other assets 439
Total assets $ 190,788
LIABILITIES AND STOCKHOLDERS' EQUITYLiabilities $ 107
Stockholders' equity 190,681
Total liabilities and stockholders' equity $ 190,788
FIRST NORTHWEST BANCORP AND SUBSIDIARYCondensed Statement of Operations
(In thousands)
Year EndedJune 30, 2015
Operating income:Interest and fees on loans receivable $ 106Interest on mortgage-backed and related securities 24Interest on investment securities 114
Total operating income 244Operating expenses:
Charitable contributions 9,734Other expenses 89
Total operating expenses 9,823Loss before benefit from federal income taxes and equity in
undistributed earnings of subsidiary (9,579)Federal income tax benefit (1,335)Loss before equity in undistributed income in subsidiary (8,244)Equity in undistributed earnings of subsidiary 3,139
Net loss $ (5,105)

FIRST NORTHWEST BANCORP AND SUBSIDIARYNOTES TO CONSOLIDATED FINANCIAL STATEMENTS
143
FIRST NORTHWEST BANCORP AND SUBSIDIARYCondensed Statement of Cash Flows
(In thousands)
Year Ended June 30,2015
Cash flows from operating activities:Net loss $ (5,105)Adjustments to reconcile net loss to net cash from operating activities:
Equity in undistributed earnings of subsidiary (3,139)Amortization of premiums and accretion of discounts on
investments, net 80Change in deferred tax assets, net (1,239)Change in receivable from subsidiary (185)Change in other assets (611)Change in other liabilities 107
Net cash used by operating activities (10,092)
Cash flows from investing activities:Purchase of securities available for sale (41,106)Proceeds from maturities, calls, and principal repayments of
securities available for sale 967Investment in subsidiary (58,404)ESOP loan origination, net of repayments (11,630)
Net cash used by investing activities (110,173)
Cash flows from financing activities:Proceeds from issuance of common stock, net of expenses 126,941
Net cash provided by financing activities 126,941
Net increase in cash 6,676
Cash and cash equivalents at beginning of period —
Cash and cash equivalents at end of period $ 6,676
NONCASH INVESTING ACTIVITIESUnrealized loss on securities available for sale $ (393)

FIRST NORTHWEST BANCORP AND SUBSIDIARYNOTES TO CONSOLIDATED FINANCIAL STATEMENTS
144
Note 17 - Summarized Consolidated Quarterly Financial Data (Unaudited)
The following table presents summarized consolidated quarterly data for each of the last two years.
FirstQuarter
SecondQuarter
ThirdQuarter
FourthQuarter
(In thousands, except share data)2015Total interest income $ 6,630 $ 6,717 $ 6,891 $ 7,249Total interest expense 1,107 1,116 1,162 1,207Net interest income 5,523 5,601 5,729 6,042Provision for loan losses — — — —Net interest income after provision for loan
losses 5,523 5,601 5,729 6,042Total noninterest income 1,142 979 1,293 1,293Total noninterest expense 5,517 5,442 15,761 6,326Income (loss) before provision for (benefit
from) federal income tax expense 1,148 1,138 (8,739) 1,009Provision for (benefit from) federal income tax
expense 299 256 (1,160) 251Net income (loss) $ 849 $ 882 $ (7,579) $ 758
Basic earnings (loss) per share na (1) na (1) $ (0.62) $ 0.06Diluted earnings (loss) per share na (1) na (1) $ (0.62) $ 0.06
2014Total interest income $ 6,361 $ 6,590 $ 6,754 $ 6,854Total interest expense 1,231 1,212 1,172 1,114Net interest income 5,130 5,378 5,582 5,740Provision for loan losses 433 (1) 367 508Net interest income after provision for loan
losses 4,697 5,379 5,215 5,232Total noninterest income 1,142 1,159 1,160 1,529Total noninterest expense 4,966 5,346 5,824 5,969Income before provision for federal income tax
expense 873 1,192 551 792Provision for federal income tax expense 193 335 92 120Net income $ 680 $ 857 $ 459 $ 672
Basic earnings (loss) per share na (1) na (1) na (1) na (1)Diluted earnings (loss) per share na (1) na (1) na (1) na (1)
(1) Not applicable as no shares were issued during these periods.

145
Item 9. Changes in and Disagreements With Accountants on Accounting and Financial Disclosure
None.
Item 9A. Controls and Procedures
(a) Evaluation of Disclosure Controls and Procedures: An evaluation of the Company’s disclosure controls and procedures (as defined in Section 13a-15(e) of the Securities Exchange Act of 1934 (the “Act”)) was carried out under the supervision and with the participation of the Company’s Chief Executive Officer, Chief Financial Officer and several other members of the Company’s senior management as of the end of the period covered by this report. The Company’s Chief Executive Officer and Chief Financial Officer concluded that the Company’s disclosure controls and procedures in effect as of June 30, 2015 were effective in ensuring that the information required to be disclosed by the Company in the reports it files or submits under the Act was (i) accumulated and communicated to the Company’s management (including the Chief Executive Officer and Chief Financial Officer) in a timely manner, and (ii) recorded, processed, summarized and reported within the time periods specified in the SEC’s rules and forms.
(b) Exemption from Management’s Report on Internal Control over Financial Reporting for the Fiscal Year Ended June 30, 2015: This Annual Report on Form 10-K does not include a report of management’s assessment regarding internal control over financial reporting or an attestation report of our independent registered public accounting firm due to a transition period established by the rules of the SEC for newly public companies.
(c) Changes in Internal Controls: There have been no changes in the Company’s internal control over financial reporting during the year ended June 30, 2015 that have materially affected, or are reasonably likely to materially affect, the Company’s internal control over financial reporting.
The Company intends to continually review and evaluates the design and effectiveness of its disclosure controls and procedures and to improve its controls and procedures over time and to correct any deficiencies that it may discover in the future. The goal is to ensure that senior management has timely access to all material financial and non-financial information concerning the Company's business. While the Company believes the present design of its disclosure controls and procedures is effective to achieve its goal, future events affecting its business may cause the Company to modify its disclosure controls and procedures. The Company does not expect that its disclosure controls and procedures and internal control over financial reporting will prevent every error or instance of fraud. A control procedure, no matter how well conceived and operated, can provide only reasonable, not absolute, assurance that the objectives of the control procedure are met. Because of the inherent limitations in all control procedures, no evaluation of controls can provide absolute assurance that all control issues and instances of fraud, if any, within the Company have been detected. These inherent limitations include the realities that judgments in decision-making can be faulty, and that breakdowns in controls or procedures can occur because of simple error or mistake. Additionally, controls can be circumvented by the individual acts of some persons, by collusion of two or more people, or by management override of the control. The design of any control procedure is based in part upon certain assumptions about the likelihood of future events, and there can be no assurance that any design will succeed in achieving its stated goals under all potential future conditions; over time, controls become inadequate because of changes in conditions, or the degree of compliance with the policies or procedures may deteriorate. Because of the inherent limitations in a cost-effective control procedure, misstatements due to error or fraud may occur and not be detected.
Item 9B. Other Information
Not applicable.

146
PART III
Item 10. Directors, Executive Officers and Corporate Governance
The information contained under the section captioned “ Proposal 1 – Election of Directors” in the Company’s proxy statement, a copy of which will be filed with the SEC no later than 120 days after the Company’s year end (the “Proxy Statement”) is incorporated herein by reference.
For information regarding the executive officers of the Company and the Bank, see the information contained herein under the section captioned “Item 1. Business – Employees – Executive Officers.”
Audit Committee Financial Expert. The Audit Committee of the Company is composed of Directors Jennifer Zaccardo (Chairperson), David Blake, Lloyd Eisenman, Richard Kott, and Norman Tonina. Each member of the Audit Committee is “independent” as defined in the Nasdaq Stock Market listing standards. The Board of Directors has determined that Ms. Zaccardo meets the definition of “audit committee financial expert,” as defined by the SEC.
Code of Ethics. The Board of Directors has adopted a Code of Ethics for the Company’s officers (including its senior financial officers), directors and employees. The Code is applicable to the Company’s principal executive officer and senior financial officers. The Company’s Code of Ethics is posted on its website at www.ourfirstfed.com.
Compliance with Section 16(a) of the Exchange Act. The information contained under the section captioned “Section 16(a) Beneficial Ownership Reporting Compliance” is included in the Company’s Proxy Statement and is incorporated herein by reference.
Nomination Procedures. There have been no material changes to the procedures by which shareholders may recommend nominees to the Company's Board of Directors.
Item 11. Executive Compensation
The information contained in the section captioned “Executive Compensation” and "Directors' Compensation" in the Proxy Statement is incorporated herein by reference.
Item 12. Security Ownership of Certain Beneficial Owners and Management and Related Stockholder Matters
(a) Security Ownership of Certain Beneficial Owners.
The information contained in the section captioned “Security Ownership of Certain Beneficial Owners and Management” in the Proxy Statement is incorporated herein by reference.
(b) Security Ownership of Management.
The information contained in the section captioned “Security Ownership of Certain Beneficial Owners and Management” in the Proxy Statement is incorporated herein by reference.
(c) Changes In Control
The Company is not aware of any arrangements, including any pledge by any person of securities of the Company, the operation of which may at a subsequent date result in a change in control of the Company.
(d) Equity Compensation Plan Information
The Company has not established any equity compensation plans as of June 30, 2015.
Item 13. Certain Relationships and Related Transactions, and Director Independence
Related Transactions. The information contained in the section captioned “Meetings and Committees of the Board of Directors and Corporate Governance Matters – Corporate Governance – Transactions with Related Persons” in the Proxy Statement is incorporated herein by reference.

147
Director Independence. The information contained in the section captioned “Meetings and Committees of the Board of Directors and Corporate Governance Matters – Corporate Governance – Director Independence” in the Proxy Statement is incorporated herein by reference.
Item 14. Principal Accounting Fees and Services
The information contained under the section captioned “Proposal 5 – Ratification of Appointment of Independent Auditor” is included in the Company’s Proxy Statement and is incorporated herein by reference.
PART IV
Item 15. Exhibits and Financial Statement Schedules (a) 1. Financial Statements.
For a list of the financial statements filed as part of this report see Part II – Item 8.
2. Financial Statement Schedules.
All schedules have been omitted as the required information is either inapplicable or contained in the Consolidated Financial Statements or related Notes contained in Part II, Item 8 of this Form 10-K.
3. Exhibits:
Exhibits are available from the Company by written request.
3.1 Articles of Incorporation, as amended (1) 3.2 Bylaws (1) 4.1 Form of Stock Certificate of the Company (1) 10.1 Form of Employee Severance Compensation Plan (1) 10.2 401(k) Retirement Plan (1) 10.3 Severance Agreement with Elaine T. Gentilo (2) 10.4 Form of Employment Agreement with Laurence J. Hueth, Regina M. Wood, Christopher A. Donohue,
Kelly A. Liske and Jeffrey S. Davis (3) 10.5 First Federal Fiscal Year 2016 Cash Incentive Plan (4) 10.6 Form of Participation Agreement under the First Federal Fiscal Year 2016 Cash Incentive Plan (4) 14 Code of Ethics (5) 21 Subsidiaries of Registrant 31.1 Certification of Chief Executive Officer Pursuant to Section 302 of the Sarbanes-Oxley Act 31.2 Certification of Chief Financial Officer Pursuant to Section 302 of the Sarbanes-Oxley Act 32 Certification of Chief Executive Officer and Chief Financial Officer Pursuant to Section 906 of the
Sarbanes-Oxley Act 101 The following materials from First Northwest Bancorp's Annual Report on Form 10-K for the year ended
June 30, 2015, formatted in Extensible Business Reporting Language (XBRL): (1) Consolidated Balance Sheets; (2) Consolidated Statements of Operations; (3) Consolidated Statements of Comprehensive (Loss) Income; (4) Consolidated Statements of Changes in Stockholders' Equity; (5) Consolidated Statements of Cash Flows; and (6) Notes to Consolidated Financial Statements
___________________ (1) Filed as an exhibit to the Company’s Registration Statement on Form S-1, as amended (File No. 333-185101) and
incorporated herein by reference. (2) Filed as an exhibit to the Company's Current Report on Form 8-K filed May 14, 2015 (File No. 001-36741) and
incorporated herein by reference. (3) Filed as an exhibit to the Company's Current Report on Form 8-K filed August 3, 2015 (File No. 001-36741) and
incorporated herein by reference. (4) Filed as an exhibit to the Company's Current Report on Form 8-K filed August 27, 2015 (File No. 001-36741) and
incorporated herein by reference. (5) The Company elects to satisfy Regulation S-K §229.406(c) by posting its Code of Ethics on its website at
www.ourfirstfed.com.Copies of these exhibits are available upon written request to Investor Relations, First Northwest Bancorp, 105 West 8th Street, Port Angeles, Washington 98362.

148
SIGNATURES
Pursuant to the requirements of Section 13 or 15(d) of the Securities Exchange Act of 1934, the registrant has duly caused this report to be signed on its behalf by the undersigned, thereunto duly authorized.
FIRST NORTHWEST BANCORP September 25, 2015 By: /s/Laurence J. Hueth Laurence J. Hueth President, Chief Executive Officer and Director (Duly Authorized Representative)
Pursuant to the requirements of the Securities Exchange Act of 1934, this report has been signed below by the following persons on behalf of the registrant and in the capacities and on the dates indicated.
By: /s/Laurence J. Hueth September 25, 2015 Laurence J. Hueth President, Chief Executive Officer and Director (Principal Executive Officer) By: /s/Regina M. Wood September 25, 2015 Regina M. Wood Executive Vice President and Chief Financial Officer (Principal Financial and Accounting Officer) By: /s/Stephen E. Oliver September 25, 2015
Stephen E. Oliver Chairman of the Board and Director
By: /s/David A. Blake September 25, 2015
David A. Blake Director
By: /s/Richard G. Kott September 25, 2015
Richard G. Kott Director
By: /s/Lloyd J. Eisenman September 25, 2015
Lloyd J. Eisenman Director
By: /s/Cindy H. Finnie September 25, 2015
Cindy H. Finnie Director

149
By: /s/David T. Flodstrom September 25, 2015David T. Flodstrom Director
By: /s/Jennifer Zaccardo September 25, 2015
Jennifer Zaccardo Director
By: /s/Norman J. Tonina, Jr. September 25, 2015Norman J. Tonina, Jr.Director
By: /s/Craig Curtis September 25, 2015Craig CurtisDirector

This Page Intentionally Left Blank

This Page Intentionally Left Blank

This Page Intentionally Left Blank

Annual MeetingThe annual meeting of shareholders will be held at the Red Lion Hotel Olympic Room at 221 North Lincoln Street, Port Angeles, WA 98362 on Monday, November 16, 2015 at 10:00am, Pacific Time.
Website Addresswww.ourfirstfed.com
Special CounselBreyer & Associates PC8180 Greensboro Drive, Suite 785McLean, VA 22102
Independent RegisteredPublic Accounting FirmMoss Adams LLP2707 Colby Avenue, Suite 801Everett, WA 98201
Transfer AgentComputershareP.O. BOX 30170College Station, TX 77842-3170(866) 289-7521
Board of DirectorsStephen E. Oliver, ChairmanDavid A. Blake, Vice ChairmanCraig A. CurtisLloyd J. EisenmanCindy H. FinnieDavid T. FlodstromLaurence J. HuethRichard G. KottNorman J. Tonina, Jr.Jennifer Zaccardo
First NorthwestBancorp Offi cersLaurence J. Hueth, President and Chief Executive OfficerRegina M. Wood, Executive Vice President, Chief Financial Officer and TreasurerJoyce L. Ruiz, Senior Vice President and Chief Administrative Officer/Corporate Secretary
Market InformationFirst Northwest Bancorp is traded on the NASDAQ Global Select Market under the symbol FNWB
Financial InformationRequests for copies of our Form 10-K and Forms 10-Q filed with the Securities and Exchange Commission should be directed in writing to:
Regina M. WoodExecutive Vice PresidentChief Financial Officer and TreasurerFirst Northwest BancorpP.O. BOX 351Port Angeles, WA 98362
Corporate Profi leFirst Northwest Bancorp (the “Corporation”), a Washington corporation, was organized for the purpose of becoming the holding company for First Federal Savings and Loan Association of Port Angeles (the “Bank” or “First Federal”), upon the Bank’s conversion from a mutual to a stock savings bank (“Conversion”). The Conversion was completed in January 2015. The Corporation does not engage in any significant activity other than holding the stock of the Bank. First Federal is a community-based savings bank primarily serving Western Washington through its full-service banking offices and loan production office, which are located within Clallam, Jefferson, Kitsap and Whatcom counties, Washington. First Federal’s business consists of attracting deposits from the public and utilizing those deposits to originate loans.
First Federal Offi cersLaurence J. Hueth, President and Chief Executive OfficerRegina M. Wood, Executive Vice President, Chief Financial Officer and TreasurerJeffrey S. Davis, Executive Vice President and Chief Operations OfficerChristopher A. Donohue, Executive Vice President and Chief Credit OfficerKelly A. Liske, Executive Vice President and Chief Banking OfficerBrett Bies, Senior Vice President and Chief Information OfficerEd Brady, Senior Vice President and Chief Risk Officer/Compliance and BSA OfficerJoyce L. Ruiz, Senior Vice President and Chief Administrative Officer/Corporate Secretary

Connect with Us!First Federal is a part of social media to share our story and to learn more about the stories of our customers and communities.
Customer Contact Center360.417.3204
800.800.1577 toll-freeHours: M–F 7:00 am–7:00 pm Sat 9:00 am–1:00 pm
Locations:
Port AngelesCorporate Office /Administration Center
105 West Eighth Street Port Angeles, WA 98362Downtown
141 West First Street Port Angeles, WA 98362Eastside
1603 East First Street Port Angeles, WA 98362Sixth Street
227 East Sixth Street Port Angeles, WA 98362
SequimSequim Avenue
333 North Sequim Avenue Sequim, WA 98382Sequim Village Marketplace
1201 West Washington Street Sequim, WA 98382
Forks131 Calawah Way
Forks, WA 98331
Port Townsend1321 Sims Way
Port Townsend, WA 98368
Silverdale3035 Bucklin Hill Road
Silverdale, WA 98383
Bellingham Coming Winter 2015!1207 Barkley Boulevard
Bellingham, WA 98226
Member FDIC