2015 Annual Report
396
2015 Annual Report PLAN | INVEST | PROTECT
-
Upload
khangminh22 -
Category
Documents
-
view
0 -
download
0
Transcript of 2015 Annual Report

2015 Annual Report
PLAN | INVEST | PROTECT

Retirement
is a journey.At Voya Financial®, we help
Americans plan, invest and protect
their savings — to get ready to retire
better. We serve the financial needs
of approximately 13 million individual
and institutional customers in the
United States with a clear mission
to make a secure financial future
possible — one person, one family,
one institution at a time. We are
equally committed to conducting
business in a way that is socially,
environmentally, economically and
ethically responsible.
In the pages of this annual report,
we invite you to read more about
the progress we made in 2015
toward achieving our vision to be
America’s Retirement CompanyTM.
We executed a number of initiatives
that have helped our customers
become retirement-ready, provided
value for our shareholders and
distribution partners, and created a
great workplace for our employees.
And we have plans to continue
our momentum, reaching more
customers with valuable financial
solutions and accelerating
our performance.
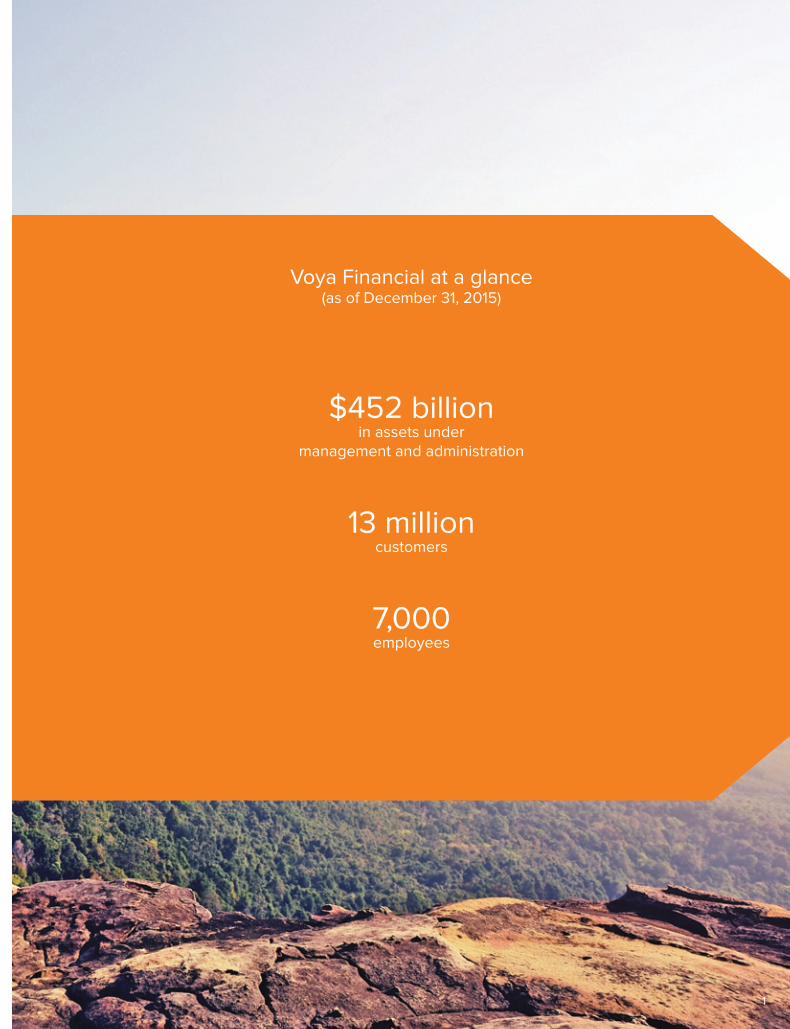
Voya Financial at a glance(as of December 31, 2015)
$452 billion
in assets under
management and administration
13 million
customers
7,000
employees
1

To My Fellow Shareholders:
In the almost three years since
Voya Financial became a
public company, we have
achieved a tremendous
amount for both our
customers and shareholders.
We met our 2016 Ongoing
Business Adjusted
Operating Return on Equity
(Adjusted ROE) target two
years ahead of schedule;
generated significant
excess capital and
returned $2.3 billion to
shareholders; achieved
ratings upgrades
from the major rating
agencies; rebranded
the company;
established a diverse
and independent
board of directors; and
significantly increased
the public float of our
shares by becoming fully
independent in 2015.2

3
We are proud of the significance and breadth of these
accomplishments, especially given the short period
of time during which they were achieved. In addition
to our financial results, we also earned accolades for
the culture that we have created and the value that we
have delivered for our customers and shareholders.
We have highlighted some of these in the pages of this
annual report.
At the same time, we have kept our eyes on the road
ahead. Our industry is fiercely competitive, and we
recognize the need to be innovative and forward-
thinking to ensure that we can continue to meet — and
anticipate — the needs of our 13 million customers. Just
as important, we are eager to attract new customers to
Voya with our value proposition of helping Americans
plan, invest and protect their savings — to get ready to
retire better.
A plan for further growth and margin improvement
At our Investor Day last June, we outlined our plans
for achieving our 2018 Adjusted ROE target of 13.5%
to 14.5%. Supporting our efforts are $350 million of
strategic investments that we are making through 2018.
These investments will substantially simplify our IT
infrastructure as well as expand our digital and analytics
capabilities. We also will focus on developing cross-
enterprise solutions that will harness the power of our
Ongoing Business as “One Voya.” These investments
will make us more efficient and enable us to better serve
and engage with our customers. Equally important, we
will be well positioned to achieve further profitable
growth and reduce costs.
At Investor Day, we also outlined more than 20
growth, margin and capital initiatives across our
Ongoing Business — Retirement, Annuities, Investment
Management, Individual Life and Employee Benefits —
that we’ll be executing to achieve our financial targets.
During 2015, we made progress on several fronts and
also recognized the need to accelerate others to ensure
that we continue to work toward achieving our plan.
While our Adjusted ROE growth from 2015 through 2018
may not be linear, we are executing with the same focus
that enabled us to achieve our prior Adjusted ROE target.
Growth InitiativesWith Voya’s strong market positions, diverse and broad
distribution, as well as many trends and opportunities that
align with our current business profile and expertise, we
see several opportunities for future growth. For example,
customers of all sizes are facing the continued fraying
of traditional safety nets, longer lifespans, a proliferation
of choice in retirement savings, and few options for
holistic advice. Through our growth initiatives, we are
developing new solutions, expanding distribution and
further enhancing our new digital resources to address
opportunities and position both the company and our
customers for success. A few examples of our growth
initiatives include:
• In Retirement, we are enhancing distribution to extend
our market reach and drive growth. As a result, in 2015,
we achieved record full-service deposits in Small-
Mid Corporate and Tax-Exempt Markets. We also
made further enhancements to MyOrangeMoney™ —
our digital tool that helps plan participants see how
their retirement savings can translate into monthly
income in retirement — as well as in other plan
sponsor-focused websites. Collectively, these actions
demonstrate our ability to grow and our commitment
to helping our customers and distribution partners.
• In Annuities, we have increased our distribution reach,
enabling us to drive greater sales of our expanded,
capital-efficient product portfolio. In 2015, we had
$1.6 billion in annuity sales through independent
broker-dealers, due in part to our focus on deepening
relationships within our top 10 broker-dealers.
Expanding our product portfolio, continuing to build
relationships with broker-dealers, and expanding in
the bank channel will enable us to drive further growth.
• In Investment Management, we are leveraging
our broad investment capabilities in fixed income,
equities and multi-asset strategies and solutions —
as well as our strong performance — to grow. For
example, we won several new mandates last year to
help insurance companies with their general-account
investment needs. This — along with expanding
relationships outside of the U.S. — is enabling us
to grow in the institutional channel. We also have
begun a realignment of our intermediary channel to
deepen our relationships with retirement-focused
financial advisors.
• We have significantly grown our Employee Benefits
business, where in-force premiums grew 14% in 2015
compared with 2014. Loss ratios and earnings also
remained strong. We have expanded the reach of
our group life and stop-loss offerings to grow in the
middle market and with private exchanges, and we
are enhancing the customer experience with new
digital capabilities.

4
Margin InitiativesMargin improvement has been a significant contributor
to the Adjusted ROE growth we have achieved thus far,
and it will continue to play a role in our plan for higher
returns in 2018. For example, we have taken actions
to manage our in-force block of business in Retirement
and, when it comes to new business, we are targeting
full-service client opportunities based on the value
proposition that we provide. Similarly, in Individual Life
and Annuities, we are adjusting crediting rates, where
possible, to maintain our expected financial targets.
Several of the strategic investments that I previously
mentioned will also help improve margins across
Voya. This includes consolidating certain IT
platforms and migrating certain activities to a cloud-
based environment.
Capital InitiativesCapital initiatives played a significant role in our prior
return on equity improvement plan, and will continue
to be important as move forward. Some of the actions
we took in 2015, such as the most recent sale of a
block of term life policies via reinsurance, and reducing
redundant reserve financing costs in Individual Life, will
help improve returns in 2016. In addition, we will continue
to expand our less capital-intensive businesses as well
as evaluate opportunities to reduce capital usage.
You have heard us frequently talk about the importance
of being good stewards of capital. Every decision that we
make about where to invest, where to spend and how
to drive or unlock value for our shareholders is framed
by this philosophy. Returning capital to shareholders
has continued to be a priority for us, as evidenced by
the $2.3 billion we’ve returned to shareholders through
share repurchases as of the end of 2015.
Our people move us forward
A strong plan with specific initiatives will get you only
so far. Our focus on Continuous Improvement and our
values-based culture help accelerate our performance
and differentiate Voya. Our people move our business
forward, and they also contribute directly to advancing
society. Our employees work together as a powerful
force by offering their time, energy and financial
resources in the communities where we live and work.
For example, since we kicked off our most recent
annual employee giving cycle in September 2015, Voya
employees have contributed $2.8 million to more than
5,000 nonprofit organizations. These donations were
matched by our Voya Foundation, resulting in gifts to
nonprofits that have exceeded $5 million. More than 60
percent of our employees participated in our month-long
employee giving campaign last year — far exceeding
the 35 percent average of similar campaigns at other
companies, according to the non-profit Committee
Encouraging Corporate Philanthropy’s 2015 survey. We
also held our second annual National Day of Service
in 2015, during which I joined more than 3,000 of my
Voya colleagues to volunteer nearly 12,000 hours of
community service across the country in just one day.
Our employees recognize our commitment to help
Americans prepare for retirement, and they are aligned
with our vision. For example, last year, 90 percent of
our employees participated in an organizational health
index survey that was conducted by an independent
third party. The survey showed a 10 percentage-point
improvement over the past 18 months and placed
Voya in the highest quintile of 700 firms tracked. This
significant increase and strong ranking bode well for
our ability to execute our strategy.
A strong position for future growth
Achieving our vision to be America’s Retirement
Company™ means enabling our customers to enjoy an
effortless experience, and ensuring that we can connect
with them how and where they want to be served.
With this innovative and forward-looking mindset, we
are confident that we can expand our Adjusted ROE,
accelerate earnings growth, increase free cash flow
and, ultimately, have a differentiated value proposition
— one that will attract and reward shareholders for the
long term.
Thank you for your support.
Sincerely,
Rodney O. Martin, Jr.
Chairman of the Board and Chief Executive Officer
Voya Financial, Inc.
March 18, 2016
5
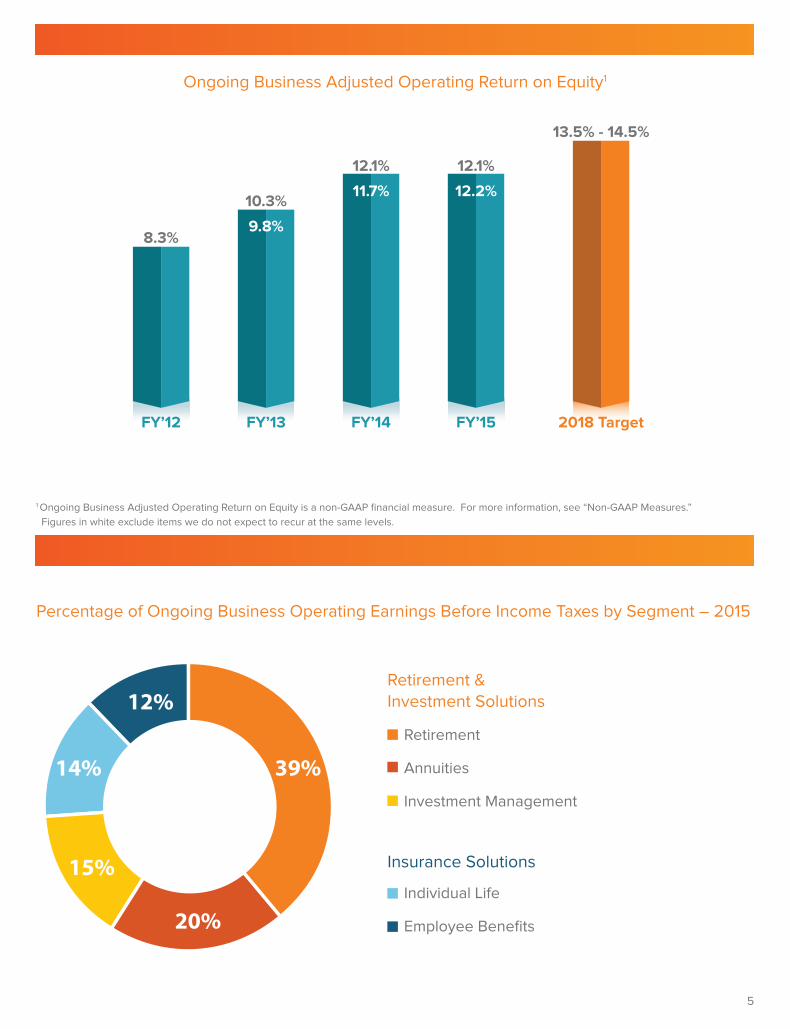
39%
12%
14%
15%
20%
Ongoing Business Adjusted Operating Return on Equity1
Percentage of Ongoing Business Operating Earnings Before Income Taxes by Segment – 2015
Retirement &
Investment Solutions
Insurance Solutions
Retirement
Annuities
Investment Management
Individual Life
Employee Benefits
1 Ongoing Business Adjusted Operating Return on Equity is a non-GAAP financial measure. For more information, see “Non-GAAP Measures.”
Figures in white exclude items we do not expect to recur at the same levels.
FY’12
8.3%
FY’13
10.3%
FY’14
12.1%
FY’15
12.1%
9.8%
11.7% 12.2%
2018 Target
13.5% - 14.5%

6
2015 Achievements
During 2015, Voya Financial achieved many impressive accomplishments — earning honors and accolades that
connect directly with the culture that we have created and the value that we have delivered for our employees,
customers, shareholders and distribution partners. In addition to the recognitions highlighted on this page, since
the beginning of 2015 Voya Financial also has:
• Made its debut on the 2015 Fortune 500 at #268;
• Ranked 34th on the second annual Fortune 500 Top Employment Brands Report sponsored by Wilsons
Human Capital Group;
• Earned 51 best-in-class awards from PLANSPONSOR magazine for its Retirement business;
• Received rating upgrades from Standard & Poor’s, Moody’s Investors Service and Fitch Ratings; and
• Received the number-one ranking for overall customer satisfaction in the life insurance category in
Insure.com’s 2016 list of the best insurance companies.
Received a perfect
score of 100% on the
Human Rights Campaign
Foundation’s 2015
Corporate Equality
Index, making this the
11th year in a row Voya
has been recognized as
a Best Place to Work for
LGBT Equality.
Winner of the first-ever
Corporate Philanthropy
Award from the Invest
in Others Charitable
Foundation for
Voya’s commitment
to encouraging
and supporting
philanthropic activities.
Finalist for the Best Board
Diversity Initiative award
at the second annual
New York Stock Exchange
Leadership Awards.
Named one of the 2016
World’s Most Ethical
Companies® by the
Ethisphere Institute,
marking the third
consecutive year Voya has
received this recognition.
Voya Investment
Management named to
Pensions & Investments
magazine’s 2015 Best
Places to Work in money
Management list.
Recognized as one of the
Top Green Companies
in the U.S. 2015 by
Newsweek magazine,
ranking at number 78 of
the 500 U.S. companies
to earn this designation
for corporate sustainability
and environmental impact.

7
Executive Committee
Board of Directors
Lynne BiggarChief Marketing and
Communications Officer,
Visa Inc.
Jeffrey T. BeckerChief Executive Officer,
Investment Management
Rodney O. Martin, Jr. Chairman and
Chief Executive Officer
Michael S. SmithChief Executive Officer,
Insurance Solutions
J. Barry GriswellFormer Chairman and
Chief Executive Officer,
Principal Financial Group
Byron H. Pollitt, Jr.Retired Executive Vice President
and Chief Financial Officer,
Visa Inc.
David ZwienerOperating Executive,
The Carlyle Group
Jane P. ChwickCo-Chief Operating Officer,
LiquidTalent
Alain M. KaraoglanChief Operating Officer;Chief Executive Officer, Retirement and Investment Solutions
Chet S. Ragavan
Chief Risk Officer
Ewout L. SteenbergenChief Financial Officer
Frederick S. Hubbell(Lead Director)
Former Chairman of Insurance
and Asset Management
Americas, ING Group
Joseph V. TripodiChief Marketing Officer,
The Subway Corporation
Ruth Ann M. GillisRetired Executive
Vice President and
Chief Administrative Officer,
Exelon Corporation
Charles P. NelsonChief Executive Officer,
Retirement
Kevin D. SilvaChief Human Resources Officer
Trish WalshChief Legal Officer
Rodney O. Martin, Jr.Chairman and
Chief Executive Officer,
Voya Financial, Inc.
Deborah C. WrightSenior Fellow,
Ford Foundation

8
Our Vision:
To be America’s Retirement Company .
Our Mission:
To make a secure financial future possible —
one person, one family, one institution at a time.
Our Guiding Principle:
Dedicated to helping Americans become financially and
emotionally ready for retirement by providing our customers
and clients with quality asset accumulation, asset protection
Our Values:
• We have customer passion.
• We do the right thing.
• We are the We.
• We have a winning spirit.
• We care.
TM
8
UNITED STATESSECURITIES AND EXCHANGE COMMISSION
WASHINGTON, D.C. 20549
FORM 10-K(Mark One)
È ANNUAL REPORT PURSUANT TO SECTION 13 OR 15(d) OF THE SECURITIESEXCHANGE ACT OF 1934
For the fiscal year ended December 31, 2015OR
‘ TRANSITION REPORT PURSUANT TO SECTION 13 OR 15(d) OF THE SECURITIESEXCHANGE ACT OF 1934
For the transition period from toCommission File Number: 001-35897
Voya Financial, Inc.(Exact name of registrant as specified in its charter)
Delaware(State or other jurisdiction of
incorporation or organization)
52-1222820(IRS Employer
Identification No.)
230 Park AvenueNew York, New York
(Address of principal executive offices)10169
(Zip Code)
(212) 309-8200(Registrant’s telephone number, including area code)
Securities registered pursuant to Section 12(b) of the Act:Title of each class Name on each exchange on which registered
Common Stock, $.01 Par Value New York Stock ExchangeSecurities registered pursuant to Section 12(g) of the Act: None
Indicate by check mark if the registrant is a well-known seasoned issuer, as defined in Rule 405 of the Securities Act. Yes È No ‘
Indicate by check mark if the registrant is not required to file reports pursuant to Section 13 or Section 15(d) of the Act. Yes ‘ No È
Indicate by check mark whether the registrant (1) has filed all reports required to be filed by Section 13 or 15(d) of the Securities ExchangeAct of 1934 during the preceding 12 months (or for such shorter period that the registrant was required to file such reports) and (2) hasbeen subject to such filing requirements for the past 90 days. Yes È No ‘
Indicate by check mark whether the registrant (1) has submitted electronically and posted on its corporate Web site, if any, everyInteractive Data File required to be submitted and posted pursuant to Rule 405 of Regulation S-T (§232.405 of this chapter) during thepreceding 12 months (or for such shorter period that the registrant was required to submit and post such files). Yes È No ‘
Indicate by check mark if disclosure of delinquent filers pursuant to Item 405 of Regulation S-K (§ 229.405 of this chapter) is not containedherein, and will not be contained, to the best of registrant’s knowledge, in definitive proxy or information statements incorporated byreference in Part III of this Form 10-K or any amendment to this Form 10-K. È
Indicate by check mark whether the registrant is a large accelerated filer, an accelerated filer, a non-accelerated filer, or a smaller reportingcompany. See the definitions of “large accelerated filer”, “accelerated filer” and “smaller reporting company” in Rule 12b-2 of theExchange Act. (Check one):
Large accelerated filer È Accelerated filer ‘
Non-accelerated filer ‘ (Do not check if a smaller reporting company) Smaller reporting company ‘
Indicate by check mark whether the registrant is a shell company (as defined in Rule 12b-2 of the Exchange Act). Yes ‘ No È
As of June 30, 2015, the aggregate market value of the common stock of the registrant held by non-affiliates of the registrant wasapproximately $10.5 billion.
As of February 11, 2016, there were 208,276,367 shares of the registrant’s common stock outstanding.
Documents incorporated by reference: Portions of Voya Financial, Inc.’s Proxy Statement for its 2016 Annual Meeting of Shareholdersare incorporated by reference in the Annual Report on Form 10-K in response to Part III, Items 10, 11, 12, 13 and 14.

Voya Financial, Inc.Form 10-K for the period ended December 31, 2015
Table of Contents
ITEMNUMBER PAGE
PART I.
Item 1. Business . . . . . . . . . . . . . . . . . . . . . . . . . . . . . . . . . . . . . . . . . . . . . . . . . . . . . . . . . . . . . . . . . . . . . . . . . . . . . . . . . 5
Item 1A. Risk Factors . . . . . . . . . . . . . . . . . . . . . . . . . . . . . . . . . . . . . . . . . . . . . . . . . . . . . . . . . . . . . . . . . . . . . . . . . . . . . . 48
Item 1B. Unresolved Staff Comments . . . . . . . . . . . . . . . . . . . . . . . . . . . . . . . . . . . . . . . . . . . . . . . . . . . . . . . . . . . . . . . . . 80
Item 2. Properties . . . . . . . . . . . . . . . . . . . . . . . . . . . . . . . . . . . . . . . . . . . . . . . . . . . . . . . . . . . . . . . . . . . . . . . . . . . . . . . . 80
Item 3. Legal Proceedings . . . . . . . . . . . . . . . . . . . . . . . . . . . . . . . . . . . . . . . . . . . . . . . . . . . . . . . . . . . . . . . . . . . . . . . . . 80
Item 4. Mine Safety Disclosures . . . . . . . . . . . . . . . . . . . . . . . . . . . . . . . . . . . . . . . . . . . . . . . . . . . . . . . . . . . . . . . . . . . . 80
PART II.
Item 5. Market for Registrant’s Common Equity, Related Stockholder Matters and Issuer Purchases of EquitySecurities . . . . . . . . . . . . . . . . . . . . . . . . . . . . . . . . . . . . . . . . . . . . . . . . . . . . . . . . . . . . . . . . . . . . . . . . . . . . . . . . 81
Item 6. Selected Financial Data . . . . . . . . . . . . . . . . . . . . . . . . . . . . . . . . . . . . . . . . . . . . . . . . . . . . . . . . . . . . . . . . . . . . . 83
Item 7. Management’s Discussion and Analysis of Financial Condition and Results of Operations . . . . . . . . . . . . . . . . 87
Item 7A. Quantitative and Qualitative Disclosures About Market Risk . . . . . . . . . . . . . . . . . . . . . . . . . . . . . . . . . . . . . . . . 184
Item 8. Financial Statements and Supplementary Data . . . . . . . . . . . . . . . . . . . . . . . . . . . . . . . . . . . . . . . . . . . . . . . . . . . 198
Item 9. Changes in and Disagreements with Accountants on Accounting and Financial Disclosure . . . . . . . . . . . . . . . . 367
Item 9A. Controls and Procedures . . . . . . . . . . . . . . . . . . . . . . . . . . . . . . . . . . . . . . . . . . . . . . . . . . . . . . . . . . . . . . . . . . . . . 367
Item 9B. Other Information . . . . . . . . . . . . . . . . . . . . . . . . . . . . . . . . . . . . . . . . . . . . . . . . . . . . . . . . . . . . . . . . . . . . . . . . . . 369
PART III.
Item 10. Directors, Executive Officers and Corporate Governance . . . . . . . . . . . . . . . . . . . . . . . . . . . . . . . . . . . . . . . . . . . 369
Item 11. Executive Compensation . . . . . . . . . . . . . . . . . . . . . . . . . . . . . . . . . . . . . . . . . . . . . . . . . . . . . . . . . . . . . . . . . . . . 369
Item 12. Security Ownership of Certain Beneficial Owners and Management and Related Stockholder Matters . . . . . . . 369
Item 13. Certain Relationships and Related Transactions, and Director Independence . . . . . . . . . . . . . . . . . . . . . . . . . . . 370
Item 14. Principal Accounting Fees and Services . . . . . . . . . . . . . . . . . . . . . . . . . . . . . . . . . . . . . . . . . . . . . . . . . . . . . . . . 370
PART IV.
Item 15. Exhibits, Financial Statement Schedules . . . . . . . . . . . . . . . . . . . . . . . . . . . . . . . . . . . . . . . . . . . . . . . . . . . . . . . . 370
Exhibit Index . . . . . . . . . . . . . . . . . . . . . . . . . . . . . . . . . . . . . . . . . . . . . . . . . . . . . . . . . . . . . . . . . . . . . . . . . . . . . . . . . . . . . . 371
Signatures . . . . . . . . . . . . . . . . . . . . . . . . . . . . . . . . . . . . . . . . . . . . . . . . . . . . . . . . . . . . . . . . . . . . . . . . . . . . . . . . . . . . . . . . 378
2

Table of Contents
For the purposes of the discussion in this Annual Report on Form 10-K, the term Voya Financial, Inc. refers to Voya Financial,Inc. and the terms “Company,” “we,” “our,” and “us” refer to Voya Financial, Inc. and its subsidiaries.
NOTE CONCERNING FORWARD-LOOKING STATEMENTS
This Annual Report on Form 10-K, including “Risk Factors,” “Management’s Discussion and Analysis of Financial Condition andResults of Operations,” and “Business,” contains forward-looking statements within the meaning of the Private SecuritiesLitigation Reform Act of 1995. Forward-looking statements include statements relating to future developments in our business orexpectations for our future financial performance and any statement not involving a historical fact. Forward-looking statements usewords such as “anticipate,” “believe,” “estimate,” “expect,” “intend,” “plan,” and other words and terms of similar meaning inconnection with a discussion of future operating or financial performance. Actual results, performance or events may differmaterially from those projected in any forward-looking statement due to, among other things, (i) general economic conditions,particularly economic conditions in our core markets, (ii) performance of financial markets, including emerging markets, (iii) thefrequency and severity of insured loss events, (iv) mortality and morbidity levels, (v) persistency and lapse levels, (vi) interestrates, (vii) currency exchange rates, (viii) general competitive factors, (ix) changes in laws and regulations, (x) changes in thepolicies of governments and/or regulatory authorities and (xi) other factors described in the section “Item 1A. Risk Factors.”
The risks included here are not exhaustive. Current reports on Form 8-K and other documents filed with the Securities andExchange Commission (“SEC”) include additional factors that could affect our businesses and financial performance.Moreover, we operate in a rapidly changing and competitive environment. New risk factors emerge from time to time, and it isnot possible for management to predict all such risk factors.
MARKET DATA
In this Annual Report on Form 10-K, we present certain market and industry data and statistics. This information is based onthird-party sources which we believe to be reliable. Market ranking information is generally based on industry surveys andtherefore the reported rankings reflect the rankings only of those companies who voluntarily participate in these surveys.Accordingly, our market ranking among all competitors may be lower than the market ranking set forth in such surveys. In somecases, we have supplemented these third-party survey rankings with our own information, such as where we believe we knowthe market ranking of particular companies who do not participate in the surveys.
In this Annual Report on Form 10-K, the term “customers” refers to retirement plan sponsors, retirement plan participants,institutional investment clients, retail investors, corporations or professional groups offering employee benefits solutions,insurance policyholders, annuity contract holders, individuals with contractual relationships with financial advisors and holdersof Individual Retirement Accounts (“IRAs”) or other individual retirement, investment or insurance products sold by us.
Market data sources used with respect to our various segments include:
Retirement. Our Retirement segment sources our market segment leadership positions within the retirement industry frommarket surveys conducted by LIMRA, an insurance and financial services industry organization, and industry-recognizedpublications such as Pensions & Investments, PlanSponsor Magazine and InvestmentNews.com. Retirement tracks marketsegment leadership positions by assets under management (“AUM”) or assets under administration (“AUA”), number of definedcontribution plans, number of defined contribution plan participant accounts, sales (takeover assets and contributions), and thenumber of producing broker-dealer representatives.
Annuities. Our Annuities segment sources our market segment leadership positions within the annuities industry primarily fromLIMRA market surveys. Annuities tracks market segment leadership positions by assets under management.
Investment Management. Our Investment Management segment sources our market segment leadership positions within theinvestment management industry from Morningstar fund data and industry-recognized publications such as Pension & Investments.Investment Management tracks market segment leadership positions by AUM; and by benchmark or peer median metrics, which,as presented, measure each investment product based on (i) rank above the median of its peer category within Morningstar (mutualfunds) or eVestment (institutional composites) for unconstrained and fully-active investment products; or (ii) outperformanceagainst its benchmark index for “index like”, rules based, risk-constrained, or client-specific investment products.
3

Individual Life. Our Individual Life segment sources our market segment leadership positions within the individual lifeinsurance industry primarily from LIMRA market surveys. Individual Life tracks market segment leadership positions bypremiums sold.
Employee Benefits. Our Employee Benefits segment sources our market segment leadership positions within the employeebenefits industry from LIMRA market surveys and MyHealthguide newsletter rankings. Stop loss market rankings are derivedfrom MyHealthguide, which does not include most managed healthcare providers in their market positions survey. TheMyHealthguide survey is a recurring publication that compiles a ranking of medical stop loss providers and their most recentlysourced annual premium data. Employee Benefits tracks market segment leadership positions by new premiums and in-forcepremiums.
4
PART I
Item 1. Business
For the purposes of this discussion, the term Voya Financial, Inc. refers to Voya Financial, Inc. and the terms “Company,”“we,” “our,” and “us” refer to Voya Financial, Inc. and its subsidiaries.
We are a premier retirement, investment and insurance company serving the financial needs of approximately 13 millionindividual and institutional customers in the United States as of December 31, 2015. Our vision is to be America’s RetirementCompany™. Our approximately 7,000 employees (as of December 31, 2015) are focused on executing our mission to make asecure financial future possible—one person, one family and one institution at a time. Through our retirement, investmentmanagement and insurance businesses, we help our customers save, grow, protect and enjoy their wealth to and throughretirement. We offer our products and services through a broad group of financial intermediaries, independent producers,affiliated advisors and dedicated sales specialists throughout the United States.
Our extensive scale and breadth of product offerings are designed to help Americans achieve their retirement savings,investment income and protection goals. Our strategy is centered on preparing customers for “Retirement Readiness” —beingemotionally and economically secure and ready for their retirement. We believe that the rapid aging of the U.S. population,weakening of traditional social safety nets, shifting of responsibility for retirement planning from institutions to individuals andgrowth in total retirement account assets will drive significant demand for our products and services going forward. We believethat we are well positioned to deliver on this Retirement Readiness need.
We believe that we help our customers achieve three essential financial goals, as they plan for, invest for and protect theirretirement years.
• Plan. Our products enable our customers to save for retirement by establishing investment accounts through theiremployers or individually.
• Invest. We provide advisory programs, individual retirement accounts (“IRAs”), fixed annuities, brokerage accounts,mutual funds and accumulation insurance products to help our customers achieve their financial objectives. Ourincome products such as target date funds, guaranteed income funds, fixed annuities, IRAs, mutual funds andaccumulation insurance products enable our customers to meet income needs through retirement and achieve wealthtransfer objectives.
• Protect. Our specialized retirement and insurance products, such as universal life (“UL”), indexed universal life(“IUL”), variable life, term life and stable value products, allow our customers to protect against unforeseen lifeevents and mitigate market risk.
We tailor our products to meet the unique needs of our individual and institutional customers. Our individual businesses areprimarily focused on the middle and mass affluent markets; however we serve customers across the full income spectrum,especially in our Institutional Retirement Plans business, Retail and Alternative Fund businesses, and Employee Benefitssegment. Similarly, our institutional businesses serve a broad range of customers, with customized offerings to the small-mid,large and mega market segments across all industries.
We operate our principal businesses through two business lines: Retirement and Investment Solutions; and Insurance Solutions.We refer to these business lines as our “ongoing business”. In addition, we also have Closed Blocks and Corporate reportingsegments. Closed Blocks consists of two segments which we have placed in run-off—Closed Block Variable Annuity(“CBVA”) and Closed Block Other. Our Corporate segment includes our corporate activities and corporate-level assets andfinancial obligations.
5

The following table presents a summary of our key individual and institutional markets, how we define those markets, and thekey products sold in such markets.
Retail Wealth Management
Market Household Income Range Investable Asset Range Typical Customer Products
Mass Market $50,000-$100,000 <$100,000 Term Life InsuranceMutual FundsIRAsAnnuities
Middle Market & Mass Affluent $100,000-$250,000 $100,000-$2,000,000 Term Life InsuranceUniversal Life InsuranceMutual FundsIRAsFinancial AdvisoryAnnuities
Affluent & Wealth Management Market $250,000-$500,000 >$2,000,000 Term Life InsuranceUniversal Life InsuranceMutual FundsSeparately Managed AccountsAlternative FundsIRAsFinancial AdvisoryAnnuities
Institutional Markets
Market Employee Size Asset Range Typical Customer Products
Small-Mid 26-3,000 $0-$150 million Full Service Retirement PlansRetirement RecordkeepingEmployee BenefitsInvestment ManagementStable Value / Pension RiskTransfer
Large 3,000-5,000 $150 million-$1 billion Full Service Retirement PlansRetirement RecordkeepingEmployee BenefitsInvestment ManagementStable Value / Pension RiskTransfer
Mega >5,000 >$1 billion Full Service Retirement PlansRetirement RecordkeepingEmployee BenefitsInvestment ManagementStable Value
6
Retirement and Investment Solutions. Our Retirement and Investment Solutions business comprises three reporting segments:Retirement, Annuities and Investment Management. Our Retirement and Annuities segments provide an extensive product rangeaddressing both the accumulation and income distribution needs of customers, through a broad distribution footprint of over 2,100affiliated representatives and thousands of non-affiliated brokers and agents as well as third-party administrators (“TPAs”) andbanks as of December 31, 2015, and our Investment Management segment is a prominent full-service asset manager that deliversclient-oriented investment solutions and advisory services, serving both individual and institutional customers.
• Retirement is a leading provider of retirement services and products in the United States, offering tax-deferred,employer-sponsored retirement savings plans and administrative services to approximately 47,000 plan sponsorscovering approximately 4.5 million plan participant accounts in corporate, education, healthcare, other non-profit andgovernment entities as of December 31, 2015. Stable Value and pension risk transfer solutions are also offered toinstitutional plan sponsors where we may or may not be providing defined contribution plans. Retirement alsoprovides IRAs and other retail financial products as well as comprehensive financial planning and advisory services toindividual customers. We serve a broad spectrum of employers ranging from small companies to the very largestcorporations and government entities. Retirement had $291.8 billion of AUM and AUA as of December 31, 2015, ofwhich $96.7 billion was full service business, $191.8 billion was recordkeeping, stable value and pension risk transferbusiness and $3.3 billion was Retail Wealth Management business.
• Annuities provides fixed and indexed annuities, tax-qualified mutual fund custodial and other investment-onlyproducts and payout annuities for pre-retirement wealth accumulation and post-retirement income management soldthrough multiple channels, and had $27.0 billion of AUM as of December 31, 2015.
• Investment Management. We are a prominent full-service asset manager with approximately $200.7 billion of AUMand $48.8 billion of AUA as of December 31, 2015, delivering client-oriented investment solutions and advisoryservices. We serve both individual and institutional customers, offering them domestic and international fixed income,equity, multi-asset and alternative investment products and solutions across a range of geographies, investment stylesand capitalization spectrums.
• As of December 31, 2015, we managed $122.5 billion in our commercial business (comprising $77.7 billion forthird-party institutions and individual investors, and $44.8 billion in separate account assets for our Retirementand Investment Solutions, Insurance Solutions and Closed Block businesses) and $78.2 billion in general accountassets for Voya Financial.
• As of December 31, 2015, 89.0%, 93.0%, and 71.0% of fixed income assets, 61.0%, 73.0%, and 63.0% of equityassets, and 95%, 95% and 42% of Multi-Asset Strategies and Solutions (“MASS”) assets outperformedbenchmark or peer median returns on a 3-year, 5-year, and 10-year basis, respectively. Our retail mutual fundportfolio assets totaled $24.9 billion as of December 31, 2015.
Insurance Solutions. We are a top-tier provider of life insurance in the United States, providing universal, variable and term lifeinsurance products. Based on the LIMRA survey as of September 30, 2015, for premiums sold, our universal and term life productsranked seventeenth and twenty-fourth, respectively. The rankings reflect our recent focus on selling more capital efficient products,such as IUL. We are also a top ten ranked provider of stop-loss coverage in the United States as reported by MyHealthguide in January2016 and provide stop-loss, group life and voluntary employee-paid and disability products to large businesses covering 5.4 millionindividuals. Our Insurance Solutions business comprises two reporting segments: Individual Life and Employee Benefits.
• Individual Life provides wealth protection and transfer opportunities through universal, variable and term products,distributed primarily through a network of independent general agents and managing directors (“AlignedDistributors”) to meet the needs of a broad range of customers from the middle-market through affluent marketsegments. As of December 31, 2015, the Individual Life distribution model is supported by approximately 100Aligned Distributors with access to over 55,000 producers who are committed to promoting Voya products.
• Employee Benefits provides stop loss, group life, voluntary employee-paid and disability products to mid-sized andlarge businesses. As of December 31, 2015, the Company has 60 employee benefits sales representatives, across 19sales offices, with average industry experience of 18 years. For the year ended December 31, 2015, approximatelytwo-thirds of Employee Benefits sales were attributable to stop loss products while the remaining one-third wasprimarily related to life and voluntary products.
7
Closed Blocks. We have separated our CBVA and Closed Block Other segments from our other operations, as part of a strategicdecision to run-off, divest, or cease actively writing certain lines of business. Accordingly, these segments have been classifiedas closed blocks and are managed separately from our ongoing business.
• CBVA. In 2009, we decided to stop actively writing new retail variable annuity products with substantial guaranteefeatures (the last policies were issued in early 2010) and placed this portfolio in run-off. Subsequently, we refined ourhedge program to seek to dynamically protect regulatory and rating agency capital of the variable annuities block foradverse equity market movements. In addition, since 2010, we have increased statutory reserves considerably, addedsignificant interest rate risk protection and have more closely aligned our policyholder behavior assumptions withexperience. Our focus in managing our CBVA segment is on protecting regulatory and rating agency capital frommarket movements via hedging and judiciously looking for opportunities to accelerate the run-off of the block, wherepossible. We believe that our hedge program, combined with an estimated $5.7 billion of assets available to supportthe guarantees in the variable annuity block (including assets which back our statutory reserves of $5.1 billion as ofDecember 31, 2015) provide adequate resources to fund a wide range of, but not all, possible market scenarios as wellas a margin for adverse policyholder behavior. For additional information, see “Part I. Item 1A. Risk Factors—RisksRelated to our CBVA Segment.”
• Closed Block Other. In 2009, we also placed guaranteed investment contracts (“GICs”) and funding agreements thatwere issued, with the proceeds invested to earn a spread, in run-off. As of December 31, 2015, remaining assets in theGICs and funding agreements portfolio had an amortized cost of $1.2 billion, down from a peak of $14.3 billion in2008. Also included in the Closed Block Other segment is residual activity on other closed or divested businessesincluding our group reinsurance and individual reinsurance businesses.
As of December 31, 2015, we had $452.4 billion in total AUM and AUA and total shareholders’ equity, excluding accumulatedother comprehensive income/loss (“AOCI”) and noncontrolling interests, of $12.0 billion. In the year ended December 31, 2015,we generated $584.5 million of Income (loss) before income taxes, $408.3 million of Net income (loss) available to VoyaFinancial, Inc.’s common shareholders and $977.5 million of Operating earnings before income taxes. Operating earningsbefore income taxes is a non-GAAP financial measure. For a reconciliation of Operating earnings before income taxes toIncome (loss) before income taxes, see “Item 7. Management’s Discussion and Analysis of Financial Condition and Results ofOperations—Results of Operations—Company Consolidated.”
ORGANIZATIONAL HISTORY AND STRUCTURE
Our History
Prior to our initial public offering in May 2013, we were a wholly owned subsidiary of ING Groep N.V. (“ING Group”), aglobal financial institution based in the Netherlands.
Through ING Group, we entered the United States life insurance market in 1975 through the acquisition of Wisconsin NationalLife Insurance Company, followed in 1976 with ING Group’s acquisition of Midwestern United Life Insurance Company andSecurity Life of Denver Insurance Company in 1977. ING Group significantly expanded its presence in the United States in thelate 1990s and 2000s with the acquisitions of Equitable Life Insurance Company of Iowa (1997), Furman Selz, an investmentadvisory company (1997), ReliaStar Life Insurance Company (including Pilgrim Capital Corporation) (2000), Aetna LifeInsurance and Annuity Company (including Aeltus Investment Management) (2000) and CitiStreet (2008). As of March 2015,ING Group has completely divested its ownership of Voya Financial, Inc. common stock, although it continues to hold warrantsto acquire a certain number of our shares.
For additional information on the separation from ING Group, see the “Business, Basis of Presentation and SignificantAccounting Policies” section in Part II, Item 7. of this Annual Report on Form 10-K.
8
Our Organizational Structure
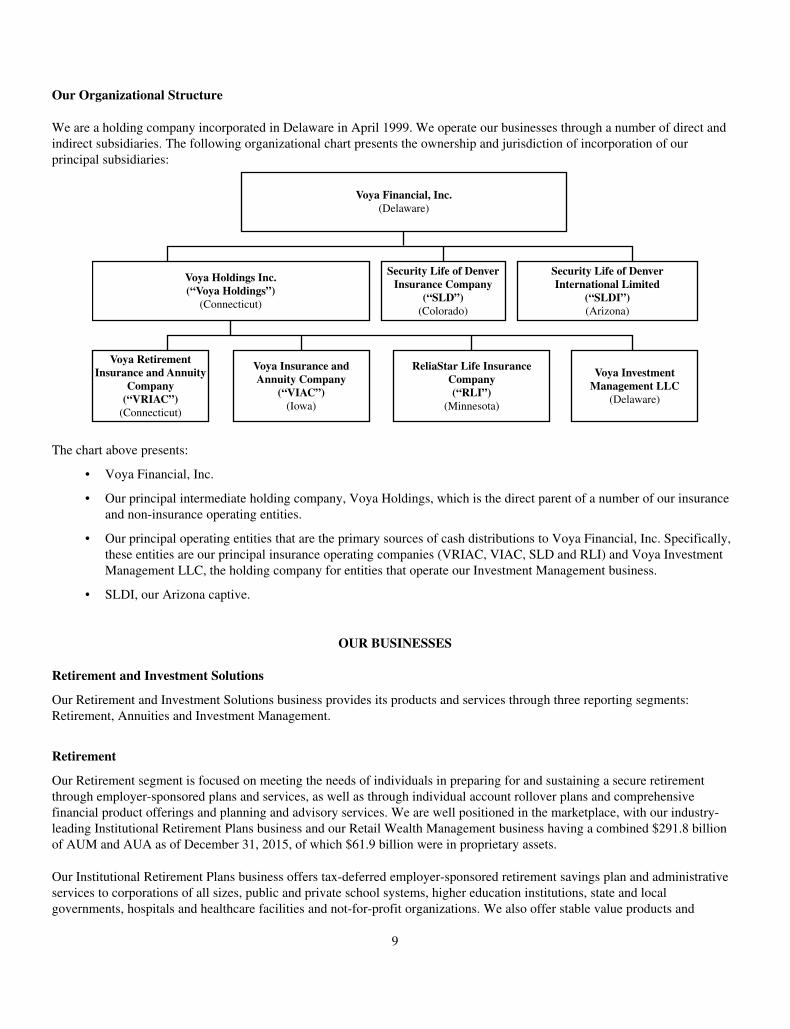
We are a holding company incorporated in Delaware in April 1999. We operate our businesses through a number of direct andindirect subsidiaries. The following organizational chart presents the ownership and jurisdiction of incorporation of ourprincipal subsidiaries:
Voya Financial, Inc.(Delaware)
Voya Holdings Inc.(“Voya Holdings”)
(Connecticut)
Voya RetirementInsurance and Annuity
Company(“VRIAC”)
(Connecticut)
Voya Insurance andAnnuity Company
(“VIAC”)(Iowa)
ReliaStar Life InsuranceCompany(“RLI”)
(Minnesota)
Voya InvestmentManagement LLC
(Delaware)
Security Life of DenverInsurance Company
(“SLD”)(Colorado)
Security Life of DenverInternational Limited
(“SLDI”)(Arizona)
The chart above presents:
• Voya Financial, Inc.
• Our principal intermediate holding company, Voya Holdings, which is the direct parent of a number of our insuranceand non-insurance operating entities.
• Our principal operating entities that are the primary sources of cash distributions to Voya Financial, Inc. Specifically,these entities are our principal insurance operating companies (VRIAC, VIAC, SLD and RLI) and Voya InvestmentManagement LLC, the holding company for entities that operate our Investment Management business.
• SLDI, our Arizona captive.
OUR BUSINESSES
Retirement and Investment Solutions
Our Retirement and Investment Solutions business provides its products and services through three reporting segments:Retirement, Annuities and Investment Management.
Retirement
Our Retirement segment is focused on meeting the needs of individuals in preparing for and sustaining a secure retirementthrough employer-sponsored plans and services, as well as through individual account rollover plans and comprehensivefinancial product offerings and planning and advisory services. We are well positioned in the marketplace, with our industry-leading Institutional Retirement Plans business and our Retail Wealth Management business having a combined $291.8 billionof AUM and AUA as of December 31, 2015, of which $61.9 billion were in proprietary assets.
Our Institutional Retirement Plans business offers tax-deferred employer-sponsored retirement savings plan and administrativeservices to corporations of all sizes, public and private school systems, higher education institutions, state and localgovernments, hospitals and healthcare facilities and not-for-profit organizations. We also offer stable value products and
9
pension risk transfer solutions to institutional plan sponsors where we may or may not be providing defined contribution productsand services. This broad-based institutional business crosses many sectors of the economy, which provides diversification thathelps insulate us from downturns in particular industries. In the defined contribution market, we provide services to approximately47,000 plan sponsors covering approximately 4.5 million plan participant accounts as of December 31, 2015.
Our Retail Wealth Management business, which focuses on the rapidly expanding retiree market as well as on pre-retirees andour defined contribution plan participants, offers retail financial products and comprehensive advice services to help individualsmanage their retirement savings and income needs. While AUM and AUA for our Retail Wealth Management business wereonly a small portion of our overall AUM and AUA, amounting to $3.3 billion as of December 31, 2015, it is a key area of futuregrowth for our Retirement segment.
Our Retirement segment earns revenue principally from asset and participant-based advisory and recordkeeping fees.Retirement generated operating earnings before income taxes of $470.6 million for the year ended December 31, 2015. OurInvestment Management segment also earns arm’s-length market-based fees from the management of the general account andmutual fund assets supporting Institutional Retirement Plans and Retail Wealth Management rollover products. Distribution ofInvestment Management products and services using the Retirement segment continues to present a growth opportunity for ourRetirement and Investment Management segments that we are actively pursuing.
We will continue to focus on growing our retirement platform by driving increases in our Institutional Retirement Plans businessthrough focused sales and retention efforts, and by further developing our Retail Wealth Management business with a particular focuson expanding relationships with our Institutional Retirement Plan participants. We will also continue to place a strong emphasis oncapital and cost management while also growing our distribution platform and achieving a diversified retirement product mix.
An important element of our Retirement strategy is to leverage the extensive customer base to which we have access throughour Institutional Retirement Plans business in order to grow our Retail Wealth Management and Investment Managementbusinesses. We are therefore focused on building long-term relationships with our plan participants, especially when initiatedthrough service touch points such as plan enrollments and rollovers, which will go beyond such participant’s participation in ourInstitutional Retirement Plans and enable us to offer such participant’s individual retirement and investment managementsolutions both during and after the term of their plan participation.
Institutional Retirement Plans
Products and Services
We are one of only a few providers that offer tax-deferred institutional retirement savings plans (utilizing U.S. tax-advantagedsavings vehicles for tax-advantaged retirement savings), services and support to the full spectrum of businesses, ranging fromsmall to mega-sized plans and across all markets. These plans may either be offered as full service or recordkeeping onlyservice products. We also offer stable value investment options and pension risk transfer solutions to institutional clients.
Full-service retirement products provide recordkeeping and plan administration services, tailored award-winning participantcommunications and education programs, innovative myOrangeMoney™ digital capabilities for sponsors and plan participants(plus mobile capabilities for participants), trustee services and institutional and retail investments. These include a wide variety ofinvestment and administrative products for defined contribution plans for tax-advantaged retirement savings, as well asnonqualified executive benefit plans and employer stock option plans. Plan sponsors may select from a variety of investmentstructures and products, such as general account, separate account, mutual funds, stable value or collective investment trusts and avariety of underlying asset types (including their own employer stock) to best meet the needs of their employees. A broad selectionof funds is available for our products in all asset categories from over 100 fund companies, including the Voya family of mutualfunds managed by our Investment Management segment. Our full-service retirement plan offerings are also supported by financialplanning and investment advisory services offered through our Retail Wealth Management business or through third parties (e.g.,Morningstar) to help prepare individuals for retirement through customer-focused personalized and objective investment advice.
Recordkeeping only service products provide administration support for plan sponsors seeking integrated recordkeepingservices for defined contribution, defined benefit and non-qualified plans. Our plan sponsor base spans the entire range ofcorporate plan sponsors as well as state and local governments. Our recordkeeping retirement plan offerings are also supportedby award-winning participant communications and education programs, innovative myOrangeMoney™ digital capabilities forsponsors and plan participants (plus mobile capabilities for participants), as well as investment advisory services offeredthrough our Retail Wealth Management business.
10
Stable value investment options are offered with a particular focus on cross-selling products utilizing proprietary investmentmanagement to our largest institutional recordkeeping plans. Our product offering includes both separate account GICs andsynthetic GICs managed by either proprietary or outside investment managers.
Pension risk transfer solutions are offered to institutional plan sponsors looking to transfer their defined benefit plan obligationsto us. We first entered this market in 2014, and we believe it offers a growth opportunity that is aligned with our expertise inservicing institutional group annuity plans and individual plan participants.
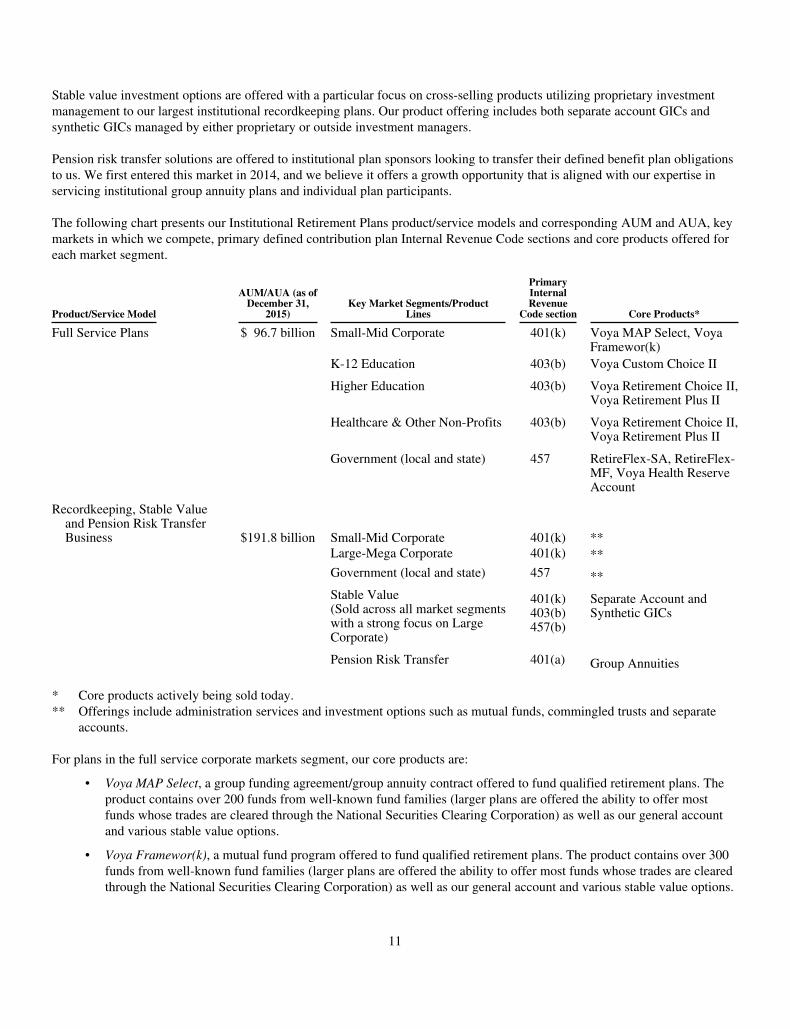
The following chart presents our Institutional Retirement Plans product/service models and corresponding AUM and AUA, keymarkets in which we compete, primary defined contribution plan Internal Revenue Code sections and core products offered foreach market segment.
Product/Service Model
AUM/AUA (as ofDecember 31,
2015)Key Market Segments/Product
Lines
PrimaryInternalRevenue
Code section Core Products*
Full Service Plans $ 96.7 billion Small-Mid Corporate 401(k) Voya MAP Select, VoyaFramewor(k)
K-12 Education 403(b) Voya Custom Choice II
Higher Education 403(b) Voya Retirement Choice II,Voya Retirement Plus II
Healthcare & Other Non-Profits 403(b) Voya Retirement Choice II,Voya Retirement Plus II
Government (local and state) 457 RetireFlex-SA, RetireFlex-MF, Voya Health ReserveAccount
Recordkeeping, Stable Valueand Pension Risk TransferBusiness $191.8 billion Small-Mid Corporate 401(k) **
Large-Mega Corporate 401(k) **Government (local and state) 457 **Stable Value(Sold across all market segmentswith a strong focus on LargeCorporate)
401(k)403(b)457(b)
Separate Account andSynthetic GICs
Pension Risk Transfer 401(a) Group Annuities
* Core products actively being sold today.** Offerings include administration services and investment options such as mutual funds, commingled trusts and separate
accounts.
For plans in the full service corporate markets segment, our core products are:
• Voya MAP Select, a group funding agreement/group annuity contract offered to fund qualified retirement plans. Theproduct contains over 200 funds from well-known fund families (larger plans are offered the ability to offer mostfunds whose trades are cleared through the National Securities Clearing Corporation) as well as our general accountand various stable value options.
• Voya Framewor(k), a mutual fund program offered to fund qualified retirement plans. The product contains over 300funds from well-known fund families (larger plans are offered the ability to offer most funds whose trades are clearedthrough the National Securities Clearing Corporation) as well as our general account and various stable value options.
11

For plans in the full service tax-exempt markets, we offer a variety of customized products, including the following:
• Voya Retirement Choice II and RetireFlex-MF, retail mutual fund products which provide flexible funding vehiclesand are designed to provide a diversified menu of mutual funds in addition to a guaranteed option (available through agroup fixed annuity contract or stable value product).
• Voya Retirement Plus II and Voya Custom Choice II, registered group annuity products featuring variable investmentoptions held in a variable annuity separate account and a fixed investment option held in the general account.
• RetireFlex-SA, an unregistered group annuity product which features variable investment options held in a variable annuityseparate account and a guaranteed option (available through a group fixed annuity contract or stable value product).
Markets and Distribution
Our Institutional Retirement Plans business can be categorized into two primary markets: Corporate and Tax Exempt. A briefdescription of each, including sub segments and strengths are as follows:
Corporate Markets:
• Small-Mid Corporate Market. In this growth market we offer full service solutions to defined contribution plans ofsmall-mid-sized corporations (i.e., typically less than 3,000 employees). Our comprehensive product offering(including flexible investment choices), highly competitive fiduciary solutions, dedicated and proactive service teamsand product and service innovations leveraged from our expertise in the Large Corporate market make us one of asmall group of providers who can service small-mid corporate plans as they continue to grow. Furthermore, we offer aunique enrollment experience through our myOrangeMoney™ digital capabilities, plus a broad suite of financialplanning, guidance and advisors products, tools and services to help plan participants better prepare for retirement.
• Large Corporate Market. In this market we offer recordkeeping services to defined contribution plans of large tomega-sized corporations. Our solutions and capabilities support the most complex retirement plans with a specialfocus on client relationship management and participant retirement readiness support through a broad suite offinancial planning, guidance and advisory products, tools and services. We are dedicated to providing engagingeducation, innovative technology-based tools and award winning print materials to help plan participants achieve asecure and dignified retirement.
Tax Exempt Markets:
• Education Market. We offer comprehensive full service offerings to both public and private K-12 educational entitiesas well as public and private higher education institutions, which we believe are attractive growth segments. In theUnited States, we rank third in the K-12 education market and fourth in higher education by assets as ofSeptember 30, 2015. Our innovative solutions to reduce administrative burden, deep technical and regulatoryexpertise, strong on-site service teams, and broad suite of retirement readiness products, tools and services forparticipants, continue to support our position as one of the top providers in this market.
• Healthcare Market. In this market we service hospitals and healthcare organizations by offering full service solutionsfor a variety of plan types. Like the education market, we have solutions to reduce administrative burdens, deeptechnical and fiduciary expertise and on-site service teams to assist healthcare plan sponsors. Additionally, we providecustomized communications, education and enrollment support plus a broad suite of retirement readiness products,tools and services in order to better prepare plan participants for retirement.
• Government Market. We provide both full service and recordkeeping only offerings to small and large governmentalentities (e.g., state and local government) with a client base that spans all 50 states. For large governmental sponsors,we offer recordkeeping services that meet even the most complex needs of each client, plus offer extensive participantcommunication and retirement education support, including a broad suite of retirement readiness products, tools andservices. We also offer a broad range of proprietary, non-proprietary and stable value investments. Our flexibility andexpertise help make us the fourth ranked provider in this market in the United States based on AUM and AUA as ofSeptember 30, 2015.
Products for Institutional Retirement Plans are distributed nationally through multiple unaffiliated channels or via affiliateddistribution including direct sales teams. We offer localized support to these groups and their clients during and after the sales
12
process, a broad selection of investment options and flexibility of choice and top-tier fiduciary solutions to help their clientsmeet or exceed plan guidelines and responsibilities.
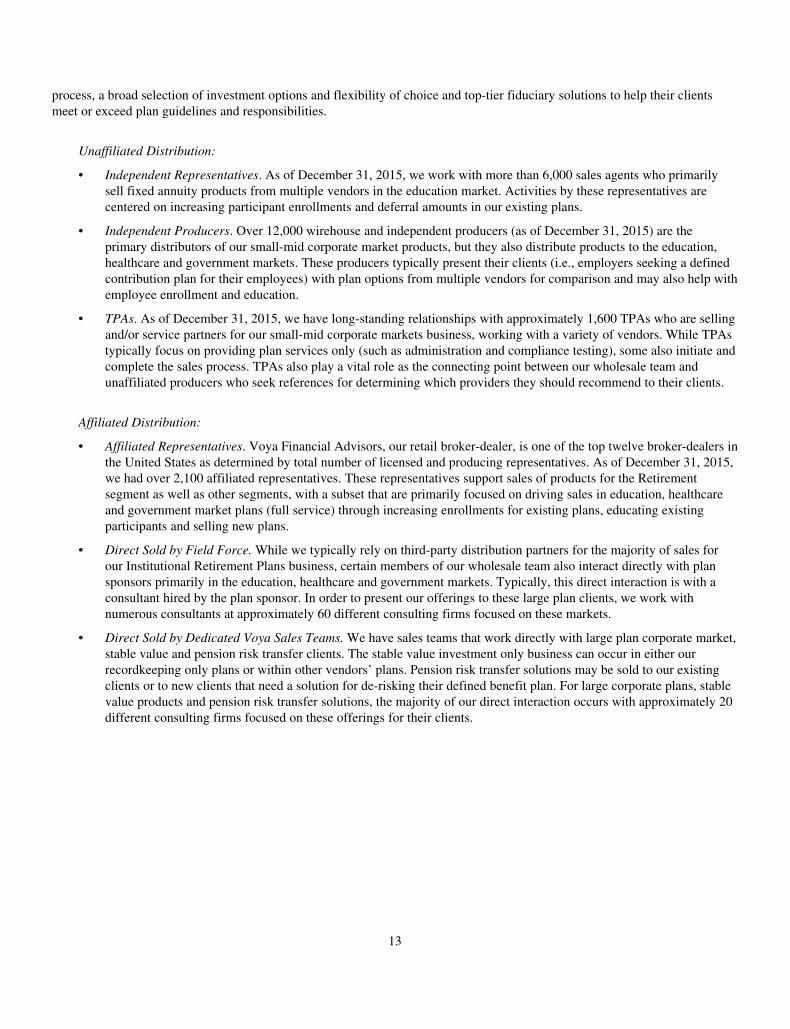
Unaffiliated Distribution:
• Independent Representatives. As of December 31, 2015, we work with more than 6,000 sales agents who primarilysell fixed annuity products from multiple vendors in the education market. Activities by these representatives arecentered on increasing participant enrollments and deferral amounts in our existing plans.
• Independent Producers. Over 12,000 wirehouse and independent producers (as of December 31, 2015) are theprimary distributors of our small-mid corporate market products, but they also distribute products to the education,healthcare and government markets. These producers typically present their clients (i.e., employers seeking a definedcontribution plan for their employees) with plan options from multiple vendors for comparison and may also help withemployee enrollment and education.
• TPAs. As of December 31, 2015, we have long-standing relationships with approximately 1,600 TPAs who are sellingand/or service partners for our small-mid corporate markets business, working with a variety of vendors. While TPAstypically focus on providing plan services only (such as administration and compliance testing), some also initiate andcomplete the sales process. TPAs also play a vital role as the connecting point between our wholesale team andunaffiliated producers who seek references for determining which providers they should recommend to their clients.
Affiliated Distribution:
• Affiliated Representatives. Voya Financial Advisors, our retail broker-dealer, is one of the top twelve broker-dealers inthe United States as determined by total number of licensed and producing representatives. As of December 31, 2015,we had over 2,100 affiliated representatives. These representatives support sales of products for the Retirementsegment as well as other segments, with a subset that are primarily focused on driving sales in education, healthcareand government market plans (full service) through increasing enrollments for existing plans, educating existingparticipants and selling new plans.
• Direct Sold by Field Force. While we typically rely on third-party distribution partners for the majority of sales forour Institutional Retirement Plans business, certain members of our wholesale team also interact directly with plansponsors primarily in the education, healthcare and government markets. Typically, this direct interaction is with aconsultant hired by the plan sponsor. In order to present our offerings to these large plan clients, we work withnumerous consultants at approximately 60 different consulting firms focused on these markets.
• Direct Sold by Dedicated Voya Sales Teams. We have sales teams that work directly with large plan corporate market,stable value and pension risk transfer clients. The stable value investment only business can occur in either ourrecordkeeping only plans or within other vendors’ plans. Pension risk transfer solutions may be sold to our existingclients or to new clients that need a solution for de-risking their defined benefit plan. For large corporate plans, stablevalue products and pension risk transfer solutions, the majority of our direct interaction occurs with approximately 20different consulting firms focused on these offerings for their clients.
13
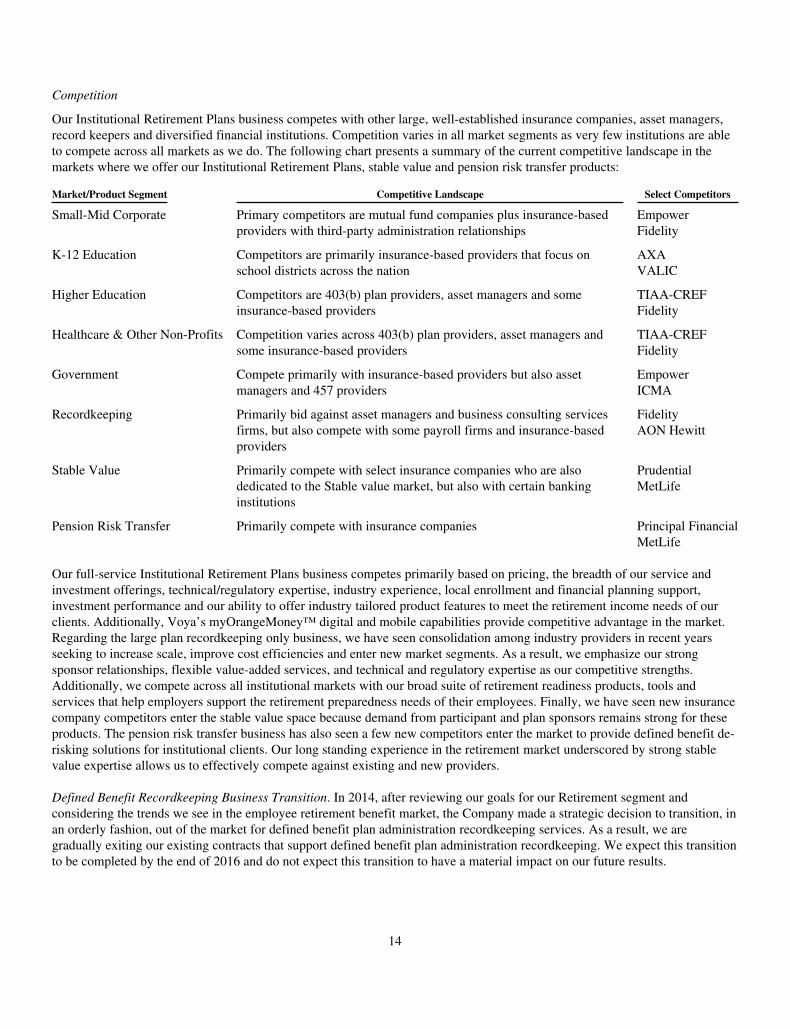
Competition
Our Institutional Retirement Plans business competes with other large, well-established insurance companies, asset managers,record keepers and diversified financial institutions. Competition varies in all market segments as very few institutions are ableto compete across all markets as we do. The following chart presents a summary of the current competitive landscape in themarkets where we offer our Institutional Retirement Plans, stable value and pension risk transfer products:
Market/Product Segment Competitive Landscape Select Competitors
Small-Mid Corporate Primary competitors are mutual fund companies plus insurance-basedproviders with third-party administration relationships
EmpowerFidelity
K-12 Education Competitors are primarily insurance-based providers that focus onschool districts across the nation
AXAVALIC
Higher Education Competitors are 403(b) plan providers, asset managers and someinsurance-based providers
TIAA-CREFFidelity
Healthcare & Other Non-Profits Competition varies across 403(b) plan providers, asset managers andsome insurance-based providers
TIAA-CREFFidelity
Government Compete primarily with insurance-based providers but also assetmanagers and 457 providers
EmpowerICMA
Recordkeeping Primarily bid against asset managers and business consulting servicesfirms, but also compete with some payroll firms and insurance-basedproviders
FidelityAON Hewitt
Stable Value Primarily compete with select insurance companies who are alsodedicated to the Stable value market, but also with certain bankinginstitutions
PrudentialMetLife
Pension Risk Transfer Primarily compete with insurance companies Principal FinancialMetLife
Our full-service Institutional Retirement Plans business competes primarily based on pricing, the breadth of our service andinvestment offerings, technical/regulatory expertise, industry experience, local enrollment and financial planning support,investment performance and our ability to offer industry tailored product features to meet the retirement income needs of ourclients. Additionally, Voya’s myOrangeMoney™ digital and mobile capabilities provide competitive advantage in the market.Regarding the large plan recordkeeping only business, we have seen consolidation among industry providers in recent yearsseeking to increase scale, improve cost efficiencies and enter new market segments. As a result, we emphasize our strongsponsor relationships, flexible value-added services, and technical and regulatory expertise as our competitive strengths.Additionally, we compete across all institutional markets with our broad suite of retirement readiness products, tools andservices that help employers support the retirement preparedness needs of their employees. Finally, we have seen new insurancecompany competitors enter the stable value space because demand from participant and plan sponsors remains strong for theseproducts. The pension risk transfer business has also seen a few new competitors enter the market to provide defined benefit de-risking solutions for institutional clients. Our long standing experience in the retirement market underscored by strong stablevalue expertise allows us to effectively compete against existing and new providers.
Defined Benefit Recordkeeping Business Transition. In 2014, after reviewing our goals for our Retirement segment andconsidering the trends we see in the employee retirement benefit market, the Company made a strategic decision to transition, inan orderly fashion, out of the market for defined benefit plan administration recordkeeping services. As a result, we aregradually exiting our existing contracts that support defined benefit plan administration recordkeeping. We expect this transitionto be completed by the end of 2016 and do not expect this transition to have a material impact on our future results.
14
Underwriting and Pricing
We price our institutional and individual retirement products based on long-term assumptions that include investment returns,mortality, persistency and operating costs. We establish target returns for each product based upon these factors and theexpected amount of regulatory and rating agency capital that we must hold to support these contracts over their projectedlifetime. We monitor and manage pricing and sales mix to achieve target returns. It may take new business several years beforeit is profitable, depending on the nature and life of the product, and returns are subject to variability as actual results may differfrom pricing assumptions. We seek to mitigate investment risk by actively managing market and credit risks associated withinvestments and through asset/liability matching portfolio management.
Retail Wealth Management
Products and Services
Our Retail Wealth Management business offers simple, easy-to-understand products, along with holistic advice and guidancedelivered through affiliated brokers and by online capabilities. Our current investment solutions include a variety of mutual fundcustodial IRA products and managed accounts and advisory programs, plus brokerage accounts.
The primary focus of our Retirement segment is to serve approximately 4.5 million defined contribution plan participantaccounts (as of December 31, 2015). We also seek to capitalize on our access to these individuals through our InstitutionalRetirement Plans business by developing long-term relationships and providing individual retail solutions. We believe that ourability to offer a seamless and integrated approach to an individual customer’s entire financial picture, while saving for or livingin retirement, presents a compelling reason for our Institutional Retirement Plans participants to use us as their principalinvestment and retirement plan provider. Through our broad range of advisory programs, our financial advisers have access to awide set of solutions for our customers for building investment portfolios, including stocks, bonds and mutual funds, as well asmanaged accounts. These experienced advisers work with customers to select a program to meet their financial needs that takesinto consideration each individual’s time horizon, goals and attitudes towards risk.
Markets and Advisory Services
Retail Wealth Management advisory services and product solutions are primarily sold through our affiliated distribution groupof over 2,100 Voya Financial Advisors representatives as well as online via Voya websites. The affiliated representatives helpprovide cohesiveness between our Institutional Retirement Plans and Retail Wealth Management businesses and they aregrouped into two primary categories: affiliated field-based representatives and home office phone-based representatives.Affiliated field-based representatives are registered sales and investment advisory representatives in our retail broker dealer thatdrive both fee-based and commissioned sales. They provide face-to-face interaction with individuals seeking financial adviceand retail investment products (e.g., rollover products) as well as retirement and financial planning solutions. Home officephone-based representatives primarily focus on our growth opportunity of assisting participants in our large recordkeepingplans. They offer the same broad suite of products and services as the affiliated field-based representatives, but are highlytrained in providing financial advice that helps customers transition through life stage and job-related changes.
In an effort to develop a path for affiliated representatives to offer holistic retirement planning solutions to participants in ourInstitutional Retirement Plans, we partner with our institutional clients to engage, educate, advise and motivate their employees totake action that will better prepare them for successful retirement outcomes.
Competition
Our Retail Wealth Management advisory services and product solutions compete for rollover and other asset consolidationopportunities against integrated financial services companies and independent broker-dealers who also offer individualretirement products, all of which currently have more market share than insurance-based providers in this space. Primarycompetitors to our Retail Wealth Management business are, in the investor channel, Fidelity, Schwab, Vanguard and MerrillEdge, and in the field channel, LPL Financial, Ameriprise, Commonwealth, Cambridge, Cetera, Morgan Stanley Smith Barneyand Bank of America Merrill Lynch.
Our Retail Wealth Management advisory services and product solutions compete based on our consultative approach, simplicityof design and a fund and investment selection process that includes proprietary and non-proprietary investment options. Theadvisory services and product solutions are primarily targeted towards existing participants, which allow us to benefit from our
15
extensive relationships with large corporate and tax-exempt plan sponsors, our small and mid-corporate market plan sponsorsand other qualified plan segments in healthcare, higher education and K-12 education.
Underwriting and Pricing
We price our institutional and individual retirement products based on long-term assumptions that include investment returns,mortality, persistency and operating costs. We establish target returns for each product based upon these factors and theexpected amount of regulatory and rating agency capital that we must hold to support these contracts over their projectedlifetime. We monitor and manage pricing and sales mix to achieve target returns. It may take new business several years beforeit is profitable, depending on the nature and life of the product, and returns are subject to variability as actual results may differfrom pricing assumptions. We seek to mitigate investment risk by actively managing market and credit risks associated withinvestments and through asset/liability matching portfolio management.
Annuities
The Annuities segment provides fixed and indexed annuities, tax-qualified mutual fund custodial and other investment-only productsand payout annuities for pre-retirement wealth accumulation and postretirement income management, sold through multiple channels.Revenues are generated from fees and from margins based on the difference between income earned on the investments supporting theliability and interest credited to customers. Our Annuities segment generated operating earnings before income taxes of $243.0 millionfor the year ended December 31, 2015.
We intend to achieve our risk-adjusted return objectives in Annuities through a disciplined approach, balancing profitabilitywith growth, with a focus on preserving margins in low interest rate environments. As a result, we expect to opportunisticallygrow our Fixed Indexed Annuities (“FIA”) business when margins are attractive and to reduce growth but maintain distributionaccess when margins are less attractive. Our mutual fund custodial products business is not sensitive to interest rate conditionsand, as such, is focused on growth. While we still offer traditional fixed annuities, we are prepared to allow the existing businessto decline in volume due to low margins and less attractive returns. We intend to meet our risk management objectives bycontinuing to hedge market risks associated with the indexed crediting strategies selected by clients on our FIA contracts. See“Item 7A. Quantitative and Qualitative Disclosures About Market Risk—Risk Management.”
Products and Services
Our Annuities segment product offerings include immediate and deferred fixed annuities designed to address customer needs fortax-advantaged savings and retirement income and their wealth-protection concerns. New sales comprise primarily FIAs andtax-qualified mutual fund custodial accounts.
FIAs. FIAs are marketed principally based on underlying interest-crediting guarantee features coupled with the potential forincreased returns based on the performance of market indices. For an FIA, the principal amount of the annuity is guaranteed tobe no less than a minimum value based on non-forfeiture regulations that vary by state. Interest on FIAs is credited based onallocations selected by a customer in one or more of the strategies we offer and upon policy parameters that we set. Thestrategies include a fixed interest rate option, as well as several options based upon performance of various external financialmarket indices. Such indices may include equity indices, such as Standard & Poor’s 500 Index (the “S&P 500”), or an interestrate benchmark, such as the change in London Interbank Offered Rates (“LIBOR”). The parameters (such as “caps,”“participation rates,” and “spreads”) are periodically declared by us for both initial and following periods. Our existing FIAscontain death benefits as required by non-forfeiture regulations. Some FIAs contain guaranteed withdrawal benefit features at anadditional cost. These living benefits guarantee a minimum annual withdrawal amount for life. The amount of the guaranteedannual withdrawal may vary by age at first withdrawal.
Annual Reset and Multi-Year Guarantee Annuities (“MYGAs”). Our in-force block includes Annual Reset and MYGA products,which provide guaranteed minimum rates of up to 4.5% and with crediting rate terms from one year to 10 years. These products arerunning off, with net outflows of $0.7 billion in 2015, compared with $1.7 billion in 2014 and $1.2 billion in 2013. The run-off ofthese Annual Reset and MYGA contracts is expected to continue to enhance the margin of our Annuities segment in future periods.
Although not currently a significant portion of new sales, we also offer other fixed annuities with a guaranteed interest rate or aperiodic annuity payment schedule suitable for clients seeking a stable return.
16
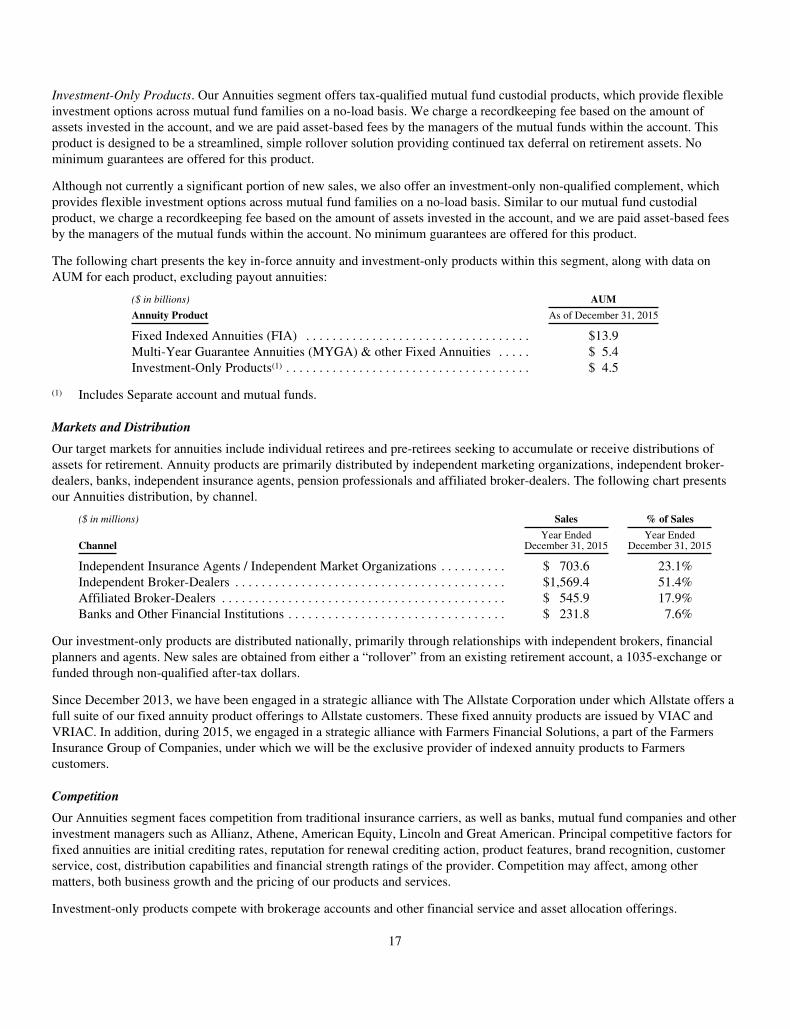
Investment-Only Products. Our Annuities segment offers tax-qualified mutual fund custodial products, which provide flexibleinvestment options across mutual fund families on a no-load basis. We charge a recordkeeping fee based on the amount ofassets invested in the account, and we are paid asset-based fees by the managers of the mutual funds within the account. Thisproduct is designed to be a streamlined, simple rollover solution providing continued tax deferral on retirement assets. Nominimum guarantees are offered for this product.
Although not currently a significant portion of new sales, we also offer an investment-only non-qualified complement, whichprovides flexible investment options across mutual fund families on a no-load basis. Similar to our mutual fund custodialproduct, we charge a recordkeeping fee based on the amount of assets invested in the account, and we are paid asset-based feesby the managers of the mutual funds within the account. No minimum guarantees are offered for this product.
The following chart presents the key in-force annuity and investment-only products within this segment, along with data onAUM for each product, excluding payout annuities:
($ in billions) AUM
Annuity Product As of December 31, 2015
Fixed Indexed Annuities (FIA) . . . . . . . . . . . . . . . . . . . . . . . . . . . . . . . . . . $13.9Multi-Year Guarantee Annuities (MYGA) & other Fixed Annuities . . . . . $ 5.4Investment-Only Products(1) . . . . . . . . . . . . . . . . . . . . . . . . . . . . . . . . . . . . . $ 4.5
(1) Includes Separate account and mutual funds.
Markets and Distribution
Our target markets for annuities include individual retirees and pre-retirees seeking to accumulate or receive distributions ofassets for retirement. Annuity products are primarily distributed by independent marketing organizations, independent broker-dealers, banks, independent insurance agents, pension professionals and affiliated broker-dealers. The following chart presentsour Annuities distribution, by channel.
($ in millions) Sales % of Sales
ChannelYear Ended
December 31, 2015Year Ended
December 31, 2015
Independent Insurance Agents / Independent Market Organizations . . . . . . . . . . $ 703.6 23.1%Independent Broker-Dealers . . . . . . . . . . . . . . . . . . . . . . . . . . . . . . . . . . . . . . . . . $1,569.4 51.4%Affiliated Broker-Dealers . . . . . . . . . . . . . . . . . . . . . . . . . . . . . . . . . . . . . . . . . . . $ 545.9 17.9%Banks and Other Financial Institutions . . . . . . . . . . . . . . . . . . . . . . . . . . . . . . . . . $ 231.8 7.6%
Our investment-only products are distributed nationally, primarily through relationships with independent brokers, financialplanners and agents. New sales are obtained from either a “rollover” from an existing retirement account, a 1035-exchange orfunded through non-qualified after-tax dollars.
Since December 2013, we have been engaged in a strategic alliance with The Allstate Corporation under which Allstate offers afull suite of our fixed annuity product offerings to Allstate customers. These fixed annuity products are issued by VIAC andVRIAC. In addition, during 2015, we engaged in a strategic alliance with Farmers Financial Solutions, a part of the FarmersInsurance Group of Companies, under which we will be the exclusive provider of indexed annuity products to Farmerscustomers.
Competition
Our Annuities segment faces competition from traditional insurance carriers, as well as banks, mutual fund companies and otherinvestment managers such as Allianz, Athene, American Equity, Lincoln and Great American. Principal competitive factors forfixed annuities are initial crediting rates, reputation for renewal crediting action, product features, brand recognition, customerservice, cost, distribution capabilities and financial strength ratings of the provider. Competition may affect, among othermatters, both business growth and the pricing of our products and services.
Investment-only products compete with brokerage accounts and other financial service and asset allocation offerings.
17

Underwriting and Pricing
We generally do not underwrite individual lives in our Annuities segment. Instead, we price our products based upon ourexpected investment returns and our expectations for mortality, longevity and persistency for the group of our contract holdersas a whole, taking into account our historical experience. We price annuities by analyzing longevity and persistency risk,volatility of expected earnings on our AUM and the expected time to retirement. Our product pricing models also take intoaccount capital requirements, hedging costs and operating expenses.
Our investment-only products are fee-based recordkeeping products for which the recordkeeping fees, combined with estimatedmutual fund revenue sharing, are priced to cover acquisition and operating costs over the life of the account. These investment-only products do not generate investment margins, do not expose us to significant mortality risk and no hedging is required.
Investment Management
We offer domestic and international fixed income, equity, multi-asset and alternatives products and solutions across marketsectors, investment styles and capitalization spectrums through our actively managed, full-service investment managementbusiness. Multiple investment platforms are backed by a fully integrated business support infrastructure that lowers expense andcreates operating efficiencies and business leverage and scalability at low marginal cost. As of December 31, 2015, ourInvestment Management segment managed $77.7 billion for third-party institutions and individual investors, $44.8 billion inseparate account assets for our Retirement Solutions and Insurance Solutions businesses and our Closed Block segments and$78.2 billion in general account assets.
We are committed to reliable and responsible investing and delivering research-driven, risk-adjusted, client-oriented investmentstrategies and solutions and advisory services across asset classes, geographies and investment styles. We serve a variety ofinstitutional clients, including public, corporate and Taft-Hartley Act defined-benefit and defined-contribution retirement plans,endowments and foundations, and insurance companies through our institutional distribution channel and through affiliates. Wealso serve individual investors by offering our mutual funds and separately managed accounts through an intermediary-focuseddistribution platform or through affiliate and third-party retirement platforms.
Investment Management’s primary source of revenue is management fees collected on the assets we manage. These fees typicallyare based upon a percentage of AUM. In certain investment management fee arrangements, we may also receive performance-based incentive fees when the return on AUM exceeds certain benchmark returns or other performance hurdles. In addition, and toa lesser extent, Investment Management collects administrative fees on outside managed assets that are administered by our mutualfund platform, and distributed primarily by our Retirement Solutions business. Investment Management also receives fees as theprimary investment manager of our general account, which is managed on an arm’s-length pricing basis. Investment Managementgenerated operating earnings before income taxes of $181.9 million for the year ended December 31, 2015.
We are driving Investment Management profitability by leveraging continued strong investment performance across all assetclasses to accelerate growth in AUM. We are also increasing scale in our primary capabilities and our share of proprietary fundsin affiliate products, principally through leveraging our access to approximately 47,000 defined contribution plan sponsors andnearly 4.5 million plan participant accounts through our Retirement business as of December 31, 2015. We are focused oncapitalizing on Retirement Solutions’ leading market position and Investment Management’s broad investment capabilities andstrong investment track records. To that end we have established dedicated retirement resources within our InvestmentManagement intermediary-focused distribution team to work with Retirement Solutions and have enhanced our MASSinvestment platform (described below) to increase focus on retirement products such as our target date and target risk portfolios,which we believe will capture an increased proportion of retirement flows going forward.
We are also growing our third-party affiliated and non-affiliated investment management business through continued strength ofinvestment performance as well as a number of key strategic initiatives, including: improved distribution productivity; increasedfocus on client “solutions” and income and outcome oriented products such as target date funds; pursuit of investment onlymandates on non-affiliate retirement platforms; replacement of sub-advised Voya Mutual Funds where Investment Managementnow offers stronger investment performance; sub-advisory mandates for Investment Management capabilities on others’platforms; leveraging partnerships with financial intermediaries and consultants; long -term expansion of our internationalinvestment capabilities; opportunistic launching of capital markets products such as Collateralized loan obligations (“CLOs”)and Closed End Mutual Funds; and prudent expansion of our private equity business.
18
Products and Services
Investment Management delivers products and services that are manufactured by traditional and specialty investment platforms.The traditional platforms are fixed income, equities and MASS. The specialty investment platforms are senior bank loans andalternatives.
Fixed Income. Investment Management’s fixed income platform manages assets for our general account, as well as for domesticand international institutional and retail investors. As of December 31, 2015, there were $116.1 billion in AUM on the fixedincome platform, of which $78.2 billion were general account assets. Through the fixed income platform clients have access tomoney market funds, investment-grade corporate debt, government bonds, residential mortgage-backed securities (“RMBS”),commercial mortgage-backed securities (“CMBS”), asset-backed securities (“ABS”), high yield bonds, private and syndicateddebt instruments, commercial mortgages and preferred securities. Each sector within the platform is managed by seasonedinvestment professionals supported by significant credit, quantitative and macro research and risk management capabilities.
Equities. The equities platform is a multi-cap and multi-style research-driven platform comprising both fundamental andquantitative equity strategies for institutional and retail investors. As of December 31, 2015, there were $56.1 billion in AUMon the equities platform covering both domestic and international markets including Real Estate. Our fundamental equitycapabilities are bottom-up, research driven and cover growth, value and core strategies in the large, mid and small cap spaces.Our quantitative equity capabilities are used to create quantitative and enhanced indexed strategies, support other fundamentalequity analysis and create extension products.
MASS. Investment Management’s MASS platform offers a variety of investment products and strategies that combine multipleasset classes with asset allocation techniques. The objective of the MASS platform is to develop customized solutions that meet thespecific, and often unique, goals of investors with products that change dynamically over time in response to changing markets andclient needs. Utilizing core capabilities in asset allocation, manager selection, asset/liability modeling, risk management andfinancial engineering, the MASS team has developed a suite of target date and target risk funds that are distributed through ourRetirement Solutions business and to institutional and retail investors. These funds can incorporate multi-manager funds. TheMASS team also provides pension risk management, strategic and tactical asset allocation, liability-driven investing solutions andinvestment strategies that hedge out specific market exposures (e.g., portable alpha) for clients.
Senior Bank Loans. Investment Management’s senior bank loan group is an experienced manager of below-investment gradefloating-rate loans, actively managing diversified portfolios of loans made by major banks around the world to non-investmentgrade corporate borrowers. Senior in the capital structure, these loans have a first lien on the borrower’s assets, typically givingthem stronger credit support than unsecured corporate bonds. The platform offers institutional, retail and structured products(e.g., CLOs), including on-shore and off-shore vehicles with assets of $19.8 billion as of December 31, 2015.
Alternatives. Investment Management’s primary alternatives platform is Pomona Capital. Pomona Capital specializes ininvesting in private equity funds in three ways: by purchasing secondary interests in existing partnerships; by investing in newpartnerships; and by co-investing alongside buyout funds in individual companies. As of December 31, 2015, Pomona Capitalmanaged assets totaling $7.3 billion across a suite of eight limited partnerships and the Pomona Investment Fund, a newregistered investment fund launched in May, 2015 that is available to accredited investors. In addition, Investment Managementoffers select alternative and hedge funds leveraging our core debt and equity investment capabilities.
19

The following chart presents asset and net flow data as of December 31, 2015, broken out by Investment Management’s fiveinvestment platforms as well as by major client segment:
AUM Net Flows
As ofDecember 31, 2015
Year EndedDecember 31, 2015
$ in billions $ in millions
Investment PlatformFixed income . . . . . . . . . . . . . . . . . . . . . . . . . . . . . . . . . . . . . $116.1 $(1,773.7)Equities . . . . . . . . . . . . . . . . . . . . . . . . . . . . . . . . . . . . . . . . . 56.1 (4,698.8)Senior Bank Loans . . . . . . . . . . . . . . . . . . . . . . . . . . . . . . . . 19.8 1,279.4Alternatives . . . . . . . . . . . . . . . . . . . . . . . . . . . . . . . . . . . . . . 8.7 587.3
Total . . . . . . . . . . . . . . . . . . . . . . . . . . . . . . . . . . . . . . . . . . . $200.7(1) $(4,605.8)
MASS(1) . . . . . . . . . . . . . . . . . . . . . . . . . . . . . . . . . . . . . . . . . 26.7 (3,093.9)
Client SegmentRetail . . . . . . . . . . . . . . . . . . . . . . . . . . . . . . . . . . . . . . . . . . . $ 66.7 $(6,096.6)Institutional . . . . . . . . . . . . . . . . . . . . . . . . . . . . . . . . . . . . . . 55.9 84.9General Account . . . . . . . . . . . . . . . . . . . . . . . . . . . . . . . . . . 78.2 N/AMutual Funds Manager Re-assignments(2) . . . . . . . . . . . . . . N/A 1,405.9
Total . . . . . . . . . . . . . . . . . . . . . . . . . . . . . . . . . . . . . . . . . . . $200.7 $(4,605.8)
Voya Financial affiliate sourced, excluding CBVA(3) . . . . . $ 30.7 $ (671.9)CBVA(3) . . . . . . . . . . . . . . . . . . . . . . . . . . . . . . . . . . . . . . . . . 23.7 (3,416.1)
(1) $21.2 billion of MASS assets are included in the fixed income, equity and senior bank loan AUM figures presented above.The balance of MASS assets, $5.5 billion, is managed by third parties and we earn only a modest fee on these assets.
(2) Represents the re-assignment of mutual fund management contracts to Voya Investment Management from externalmanagers. The AUM related to the re-assignments are included in the retail segment above.
(3) Assets sourced from Voya Financial, including CBVA, are also included in the retail and institutional markets segmentsabove.
Markets and Distribution
We serve our institutional clients through a dedicated sales and service platform consisting of direct- and consultant-focusedsales professionals. We serve individual investors through an intermediary-focused distribution platform, consisting of businessdevelopment and wholesale forces which partner with banks, broker-dealers and independent financial advisers, as well as ouraffiliate and third-party retirement platforms.
With the exception of Pomona Capital, the different products and strategies associated with our investment platforms aredistributed and serviced by these Retail and Institutional client-focused segments as follows:
• Retail client segment: Open- and closed-end funds through affiliate and third-party distribution platforms, includingwirehouses, brokerage firms, and independent and regional broker-dealers. As of December 31, 2015, total AUMfrom these channels was $66.7 billion.
• Institutional client segment: Individual and pooled accounts, targeting defined benefit, defined contribution recordkeepingand retirement plans, Taft Hartley and endowments and foundations. As of December 31, 2015, Investment Managementhad approximately 265 institutional clients, representing $55.9 billion of AUM primarily in separately managed accounts,collective investment trusts and structured vehicles.
Investment Management manages a variety of variable portfolio, mutual fund and stable value assets, sold through ourRetirement, Annuities, and Insurance Solutions businesses. As of December 31, 2015, total AUM from these channels andCBVA was $54.4 billion with the majority of the assets gathered through our Retirement segment.
20
Competition
Investment Management competes with a wide array of asset managers and institutions in the highly fragmented U.S. investmentmanagement industry. In our key market segments, Investment Management competes on the basis of, among other things, investmentperformance, investment philosophy and process, product features and structure and client service. Our principal competitors in theInvestment Management business include insurance-owned asset managers such as Principal Global Investors (Principal FinancialGroup), Prudential and Ameriprise, bank-owned asset managers such as J.P. Morgan Asset Management, as well as “pure-play” assetmanagers including PIMCO, Invesco, Wellington, Legg Mason, T. Rowe Price, Franklin Templeton and Fidelity.
Insurance Solutions
Our Insurance Solutions business comprises two reporting segments: Individual Life and Employee Benefits. Our strategy isbased on a broad and effective distribution model, fueled by a manufacturing capability that provides a stream of competitiveproduct solutions, all supported by an efficient operations and underwriting model.
Individual Life
Our Individual Life segment has a broad independent distribution footprint and manufactures a wide range of competitiveproducts, with a focus on indexed universal life. We offer fixed, indexed and variable universal life insurance products targetedto more affluent markets, and low-cost term life insurance designed to serve the middle market. We have re-priced certainproducts and will continue to monitor changes to the product portfolio to align with market conditions. As of September 30,2015, we were the seventeenth largest writer of universal life in the United States based on premiums sold or written. As ofSeptember 30, 2015, we were the twenty-fourth largest writer of term life in the United States. Our strong market positions haveallowed us to properly scale our business to achieve greater profitability. As of December 31, 2015, Individual Life’s in-forcebook comprised over 0.9 million policies and gross premiums and deposits of approximately $1.9 billion.
The Individual Life segment generates revenue on its products from premiums, investment income, expense load, mortalitycharges and other policy charges, along with some asset-based fees. Profits are driven by the spread between investment incomeearned and interest credited to policyholders, plus the difference between premiums and mortality charges collected and benefitsand expenses paid. Our Individual Life segment generated operating earnings before income taxes of $172.7 million for the yearended December 31, 2015.
We intend to achieve our earnings growth in our Individual Life segment by focusing on growing our earnings drivers. Ourearnings drivers include growing our in-force block of business by adding new businesses and entering new markets that meetour profit and capital requirements, combined with effectively managing our in-force block to meet our profitability objectives.They also include focusing on improving our investment margins, growing our mortality profits and fully exploiting ourtechnological capability in order to continue to reduce new business unit costs and underwriting expense. In addition, we willfurther our financial objectives by continuing to utilize reinsurance to actively manage our risk and capital profile with the goalof controlling exposure to losses, reducing volatility and protecting capital. We aim to maximize earnings and capital efficiencyin part by relieving the reserve strain for certain of our term and universal life products by means of reinsurance arrangementsand other financing transactions. We also look to transfer certain blocks of business through reinsurance in order to moreeffectively manage our capital. For example, in 2015 and 2014 we reinsured two in-force blocks comprising approximately325,000 term life insurance policies, representing approximately $190 billion of life insurance in-force and backed by over $2.7billion in statutory reserves, to a third-party reinsurer.
In addition, we have completed the introduction of re-priced offerings for term and universal life products, both of which are highcapital consuming products. We expect these actions to slow the sale of the high-capital products while we simultaneously growsales in the low capital, cash accumulation and current assumption type products.
Products and Services
Our Individual Life segment currently offers products that include UL, IUL, variable universal life and term life, insurance.These offerings are designed to address customer needs for death benefit protection, tax-advantaged wealth transfer andaccumulation, premium financing, business planning, executive benefits and supplemental retirement income. We believe thatour combination of product solutions is well-suited for the middle-market through the mass-affluent and makes us a full serviceprovider to our independent distribution partners.
21
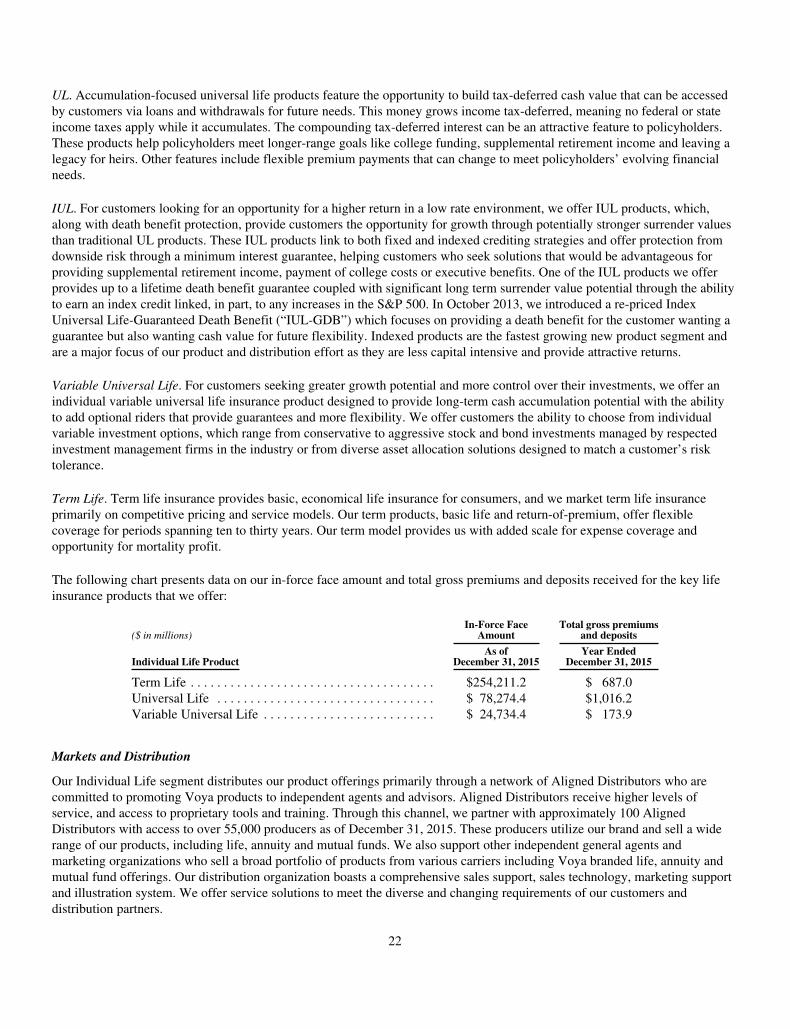
UL. Accumulation-focused universal life products feature the opportunity to build tax-deferred cash value that can be accessedby customers via loans and withdrawals for future needs. This money grows income tax-deferred, meaning no federal or stateincome taxes apply while it accumulates. The compounding tax-deferred interest can be an attractive feature to policyholders.These products help policyholders meet longer-range goals like college funding, supplemental retirement income and leaving alegacy for heirs. Other features include flexible premium payments that can change to meet policyholders’ evolving financialneeds.
IUL. For customers looking for an opportunity for a higher return in a low rate environment, we offer IUL products, which,along with death benefit protection, provide customers the opportunity for growth through potentially stronger surrender valuesthan traditional UL products. These IUL products link to both fixed and indexed crediting strategies and offer protection fromdownside risk through a minimum interest guarantee, helping customers who seek solutions that would be advantageous forproviding supplemental retirement income, payment of college costs or executive benefits. One of the IUL products we offerprovides up to a lifetime death benefit guarantee coupled with significant long term surrender value potential through the abilityto earn an index credit linked, in part, to any increases in the S&P 500. In October 2013, we introduced a re-priced IndexUniversal Life-Guaranteed Death Benefit (“IUL-GDB”) which focuses on providing a death benefit for the customer wanting aguarantee but also wanting cash value for future flexibility. Indexed products are the fastest growing new product segment andare a major focus of our product and distribution effort as they are less capital intensive and provide attractive returns.
Variable Universal Life. For customers seeking greater growth potential and more control over their investments, we offer anindividual variable universal life insurance product designed to provide long-term cash accumulation potential with the abilityto add optional riders that provide guarantees and more flexibility. We offer customers the ability to choose from individualvariable investment options, which range from conservative to aggressive stock and bond investments managed by respectedinvestment management firms in the industry or from diverse asset allocation solutions designed to match a customer’s risktolerance.
Term Life. Term life insurance provides basic, economical life insurance for consumers, and we market term life insuranceprimarily on competitive pricing and service models. Our term products, basic life and return-of-premium, offer flexiblecoverage for periods spanning ten to thirty years. Our term model provides us with added scale for expense coverage andopportunity for mortality profit.
The following chart presents data on our in-force face amount and total gross premiums and deposits received for the key lifeinsurance products that we offer:
($ in millions)In-Force Face
AmountTotal gross premiums
and deposits
Individual Life ProductAs of
December 31, 2015Year Ended
December 31, 2015
Term Life . . . . . . . . . . . . . . . . . . . . . . . . . . . . . . . . . . . . . $254,211.2 $ 687.0Universal Life . . . . . . . . . . . . . . . . . . . . . . . . . . . . . . . . . $ 78,274.4 $1,016.2Variable Universal Life . . . . . . . . . . . . . . . . . . . . . . . . . . $ 24,734.4 $ 173.9
Markets and Distribution
Our Individual Life segment distributes our product offerings primarily through a network of Aligned Distributors who arecommitted to promoting Voya products to independent agents and advisors. Aligned Distributors receive higher levels ofservice, and access to proprietary tools and training. Through this channel, we partner with approximately 100 AlignedDistributors with access to over 55,000 producers as of December 31, 2015. These producers utilize our brand and sell a widerange of our products, including life, annuity and mutual funds. We also support other independent general agents andmarketing organizations who sell a broad portfolio of products from various carriers including Voya branded life, annuity andmutual fund offerings. Our distribution organization boasts a comprehensive sales support, sales technology, marketing supportand illustration system. We offer service solutions to meet the diverse and changing requirements of our customers anddistribution partners.
22

The following table presents a breakdown of Individual Life sales by distribution channel:
($ in millions) Sales % of Sales
ChannelYear Ended
December 31, 2015Year Ended
December 31, 2015
Aligned Distribution Sales . . . . . . . . . . . . . . . . . . . . . . . . . $77.4 77.2%Non-Aligned . . . . . . . . . . . . . . . . . . . . . . . . . . . . . . . . . . . . $17.2 17.1%Direct-Term Writers . . . . . . . . . . . . . . . . . . . . . . . . . . . . . . $ 5.6 5.6%
The goal of our Individual Life distribution model is to be a full-service provider of life insurance products with a broadfootprint, offering customers multiple ways to purchase products from our diverse portfolio. Achieving this goal has allowed usto penetrate affluent markets with our non-term portfolio, while building scale through policy count with sales of term and lowerface non-term products in the middle market.
Competition
The Individual Life segment competes with large, well-established life insurance companies in a mature market, where priceand service are key drivers. Primary competitors include Lincoln, MetLife, Prudential, American General, Principal FinancialGroup, John Hancock, Transamerica and Pacific Life. Individual Life primarily competes based on service and distributionchannel relationships, price, brand recognition, financial strength ratings of our insurance subsidiaries and financial stability.We have strong capabilities to monitor competition and we utilize advanced models to benchmark our product offerings againstothers in the industry.
Factors that could influence our ability to competitively price products while achieving targeted returns include the cost andavailability of statutory reserve financing required for certain term and universal life insurance policies, internal capital fundingrequirements and an extended low interest rate environment.
Underwriting and Pricing
We set prices for many of our insurance products based upon expected mortality over the life of the product. We base thepricing of our life insurance products in part upon expected persistency of these products, which is the probability that a policywill remain in force from one period to the next. We base premiums and policy charges for individual life insurance on expecteddeath benefits, surrender benefits, expenses and required reserves. We use assumptions for mortality, interest, expenses, policypersistency and premium payment pattern in pricing policies. In addition, certain of our insurance products that includeguaranteed returns or crediting rates underwrite equity market or interest rate risks. We seek to maintain a spread between thereturn on our general account invested assets and the interest we credit on our policyholder accounts. Our underwriting and riskmanagement functions adhere to prescribed underwriting guidelines, while maintaining a competitive suite of products pricedconsistent with our mortality assessment. We generally manage mortality risks by enforcing strict underwriting standards andmaintaining sufficient scale so that the incidence of risk occurrence is likely to match statistical modeling.
With respect to our universal life secondary guarantee business, we seek to mitigate risk by pricing conservatively to recognizethe interest rate risk and are willing to forgo sales in order to maintain our profit and risk profile.
Reinsurance
In general, our reinsurance strategy is designed to limit our mortality risk and volatility. We partner with highly rated, wellregarded reinsurers and set up pools to share our excess mortality risk.
As of January 1, 2013, we revised the amount of risk we retain on a life for new business issued after January 1, 2013. For termbusiness, we continue to retain the first $3 million of risk and the excess risk is shared among a pool of reinsurers. For most ofour universal life product portfolio, we retain the first $5 million of risk and reinsure 100% of the excess over $5 million amonga pool of reinsurers. Our maximum overall retained risk on any one life is $5 million.
Prior to January 1, 2013, for term business, we retained the first $3 million of risk and the excess risk was shared among a pool ofreinsurers. For most of our universal life product portfolio, we retained the first $5 million of risk and reinsured a portion of the excess
23

over $5 million into a pool until we reached our limit of $10 million of risk. 100% of the excess over $10 million then went into thepool. Our maximum overall retained risk on any one life was $10 million.
Currently, reinsurance for new business is on a monthly renewable term basis, which only transfers mortality risk and limits ourcounterparty risk exposure. See “Item 7A. Quantitative and Qualitative Disclosures About Market Risk—Risk Management”.
Employee Benefits
Our Employee Benefits segment provides group insurance products to mid-size and large corporate employers and professionalassociations. In addition, our Employee Benefits segment serves the voluntary worksite market by providing individual andpayroll-deduction products to employees of our clients. Our Employee Benefits segment is among the largest writers of stoploss coverage in the United States, currently ranking sixth on a premium basis with approximately $824 million of in-forcepremiums. We also hold top 20 positions in the group life and voluntary benefits markets on a premium basis as ofSeptember 30, 2015. As of December 31, 2015, Employee Benefits total in-force premiums were $1.5 billion.
The Employee Benefits segment generates revenue from premiums, investment income, mortality and morbidity income and policyand other charges. Profits are driven by the spread between investment income and credited rates to policyholders on voluntaryuniversal life and whole life products, along with the difference between premiums and mortality charges collected and benefits andexpenses paid for group life, stop loss and voluntary health benefits. Our Employee Benefits segment generated operating earningsbefore income taxes of $146.1 million for the year ended December 31, 2015.
The Employee Benefits segment offers attractive growth opportunities with much less capital strain. For example, we believethere are significant opportunities through expansion in the voluntary benefits market as employers shift benefits costs to theiremployees. We have a number of new products and initiatives that we believe will help us drive growth in this market. Whileexpanding these lines, we also intend to continue to focus on profitability in our well established group life and stop loss productlines, by adding profitable new business to our in-force block, improving our persistency by retaining more of our bestperforming groups, and managing our loss ratios to below 80%, particularly on stop loss policies.
Products and Services
Our Employee Benefits segment offers stop loss insurance, group life, voluntary benefits, and group disability products. Theseofferings are designed to meet the financial needs of both employers and employees by helping employers attract and retainemployees and control costs, as well as provide ease of administration and valuable protection for employees.
Stop Loss. Our stop loss insurance provides coverage for mid-sized to large employers that self-insure their medical claims.These employers provide a health plan to their employees and generally pay all plan-related claims and administrative expenses.Our stop loss product helps these employers contain their health expenses by reimbursing specified claim amounts above certaindeductibles and by reimbursing claims that exceed a specified limit. We offer this product via two types of protection—individual stop loss insurance and aggregate stop loss insurance. The primary difference between these two types is a varyingdeductible; both coverages are re-priced and renewable annually.
Group Life. Group life products span basic and supplemental term life insurance as well as accidental death and dismembermentfor mid-sized to large employers and affinity groups. These products offer employees guaranteed issue coverage, convenientpayroll deduction, affordable rates and conversion options.
Voluntary Benefits. Our voluntary benefits business involves the sale of universal life insurance, whole life insurance, criticalillness, accident insurance and short-term disability income through the workplace. This product lineup is 100% employee-paidthrough payroll deduction. New products have been introduced that focus on group-like structures that address the cost-shiftingtrend.
Group Disability. Group disability includes group long term disability, short term disability, telephonic short term disability,voluntary long term disability and voluntary short term disability products for mid-sized to large employers. This productoffering is typically packaged for sale with group life products, especially in the middle-market.
24

The following chart presents the key employee benefits products we offer, along with data on annual premiums for eachproduct:
($ in millions) Annualized In-Force Premiums
Employee Benefits Products Year Ended December 31, 2015
Stop Loss . . . . . . . . . . . . . . . . . . . . . . . . . . . . . . . . . . . . . . $824.4Group Life . . . . . . . . . . . . . . . . . . . . . . . . . . . . . . . . . . . . . $502.6Voluntary Benefits . . . . . . . . . . . . . . . . . . . . . . . . . . . . . . . $182.9Group Disability . . . . . . . . . . . . . . . . . . . . . . . . . . . . . . . . . $ 94.1
Markets and Distribution
Our Employee Benefits segment works primarily with national and regional benefits consultants, brokers, TPAs, enrollmentfirms and technology partners. Our tenured distribution organization provides local sales and account management support tooffer customized solutions to mid-sized to large employers backed by a national accounts team. We offer innovative andflexible solutions to meet the varying and changing needs of our customers and distribution partners. We have many years ofexperience providing unique stop loss solutions and products for our customers. In addition, we are an experienced multi-lineemployee benefits insurance carrier (group life, disability, stop loss and elective benefits).
We primarily use three distribution channels to market and sell our employee benefits products. Our largest channel worksthrough hundreds of brokers and consultant firms nationwide and markets our entire product portfolio. Our Voluntary sales teamfocuses on marketing elective benefits to complement an employer’s overall benefit package. Our Affinity sales teamspecializes in working with TPAs to market to members of association and affinity groups. Voya Employee Benefits breadth ofdistribution gives us access to and the products to meet the needs of employers and their employees.
Our Employee Benefits segment primarily targets mid-sized and large corporate employers through brokers, consultants, TPAsand private exchanges. In addition, we market stop loss coverage to employer sponsors of self-funded employee health benefitsplans.
Employee Benefits products are marketed to employers and professional associations through major brokerage operations,benefits consulting firms and direct sales. In the voluntary benefits market, policies are marketed to employees at the worksitethrough enrollment firms, technology partners and brokers. When combined with distribution channels used by our IndividualLife segment, we are able to provide complete access to our products through worksite-based sales.
The following chart presents our Employee Benefits distribution, by channel:
($ in millions) Sales % of Sales
ChannelYear Ended
December 31, 2015Year Ended
December 31, 2015
Brokerage (Commissions Paid) . . . . . . . . . . . . . . . . . . . . . . . . . . . . . . $252.5 65.1%Benefits Consulting Firms (Fee Based Consulting) . . . . . . . . . . . . . . . $121.2 31.2%Worksite Sales . . . . . . . . . . . . . . . . . . . . . . . . . . . . . . . . . . . . . . . . . . . $ 14.3 3.7%
Competition
The group insurance market is mature and, due to the large number of participants in this segment, price and service are keycompetitive drivers. Our principal competitors include MetLife, Prudential and Minnesota Life in group life, Tokio MarineHCC (formerly Houston Casualty), Symetra and Sun Life in Stop Loss, and Unum, Allstate and Transamerica in voluntarybenefits.
For group life insurance products, rate guarantees have become the industry norm, with rate guarantee duration periods trendingupward in general. Technology is also a competitive driver, as employers and employees expect technology solutions tostreamline their administrative costs.
25
Underwriting and Pricing
Group insurance and disability pricing reflects the employer group’s claims experience and the risk characteristics of eachemployer group. The employer’s group claims experience is reviewed at time of policy issuance and periodically thereafter,resulting in ongoing pricing adjustments. The key pricing and underwriting criteria are morbidity and mortality assumptions, theemployer group’s demographic composition, the industry, geographic location, regional and national economic trends, plandesign and prior claims experience.
Stop loss insurance pricing reflects the risk characteristics and claims experience for each employer group. The product isannually renewable and the underwriting information is reviewed annually as a result. The key pricing and underwriting criteriaare medical cost trends, morbidity assumptions, the employer group’s demographic composition, the industry, geographiclocation, plan design and prior claims experience. Pricing in the stop loss insurance market is generally cyclical.
Reinsurance
Our Employee Benefits reinsurance strategy seeks to limit our exposure to any one individual which will help limit and controlrisk. Group Life, which includes Accidental Death and Dismemberment, cedes the excess over $750,000 of each coverage to areinsurer. Group Long Term Disability cedes substantially all of the risk including the claims servicing, to a TPA and reinsurer.Excess Stop Loss has a reinsurance program in place that limits our exposure (after an overall $5 million aggregate deductiblethat we must meet before reinsurance coverage begins) to any one specific claim to $1.25 million and there is an aggregate stoploss unit that limits our exposure to $2.0 million over the Policyholders Aggregate Excess Retention. See “Item 7A. Quantitativeand Qualitative Disclosures About Market Risk—Risk Management”. We also use an annually renewable reinsurancetransaction which lowers required capital of the Employee Benefits segment.
Closed Blocks
We have separated our CBVA and Closed Block Other segments from our other operations, placing them in run-off, and havemade a strategic decision to stop actively writing new retail variable annuity products with substantial guarantee features and torun-off the activities within the Closed Block Other segment over time. Accordingly, these segments have been classified asclosed blocks and are managed separately from our ongoing business.
We continue to focus on the controlled run-off of our Closed Block segments and look for opportunities to accelerate this run-off, where possible.
CBVA
Our CBVA segment consists of retail variable annuity insurance policies with substantial guarantee features sold primarily from2001 to early 2010, when the block entered run-off. These policies are long-term savings vehicles in which customers(policyholders) made deposits that are primarily maintained in separate accounts established by the Company and registeredwith the SEC as unit investment trusts. The deposits were invested, largely at the customer’s direction, in a variety of U.S. andinternational equity, fixed income, real estate and other investment options.
Many of these policies include living benefit riders, including guaranteed minimum withdrawal benefits for life (“GMWBL”),guaranteed minimum income benefits (“GMIB”), guaranteed minimum accumulation benefits (“GMAB”) and guaranteed minimumwithdrawal benefits (“GMWB”). All deferred variable annuity contracts included guaranteed minimum death benefits (“GMDB”).
The financial crisis of 2008-09 resulted in substantial market volatility, low interest rates and depressed equity market levels. Ourvariable annuity profitability declined markedly in 2009 and 2010 under these adverse market conditions, as customer account valuesfell below guaranteed levels and therefore our liabilities with respect to the underlying guarantees increased. Moreover, significantreduction in earnings from reduced mutual fund fees and increased hedging costs exacerbated the decline in profitability.
We have taken numerous actions since the financial crisis to strengthen our balance sheet, increase transparency and improvethe risk profile of the block, including the following:
• in 2009, we made a strategic decision to stop actively writing new retail variable annuity products with substantialguarantee features. The products were fully closed to new sales in early 2010 and the management of the block shiftedto run-off;
26
• in 2010, we also refined our capital hedge overlay (“CHO”) program to dynamically protect regulatory and ratingagency capital levels in down equity market scenarios;
• in early 2011, we began hedging the interest rate risk of our GMWBL book of business;
• in late 2011, we refined our policyholder behavior assumptions to more closely align with experience resulting in U.S.GAAP and gross U.S. statutory reserve increases of $741 million and $2,776 million in the fourth quarter of 2011,respectively; and
• in late 2014, we continued to refine our CHO program to also protect regulatory and rating agency capital fromincreased volatility as well as credit spread widening scenarios.
U.S. GAAP accounting differs from the methods used to determine regulatory and rating agency capital measures. Therefore ourhedge programs may create material earnings volatility for U.S. GAAP financial statements.
Our risk management program is focused on balancing key factors including regulatory reserves, rating agency capital, risk-based capital (“RBC”), liquidity, earnings, and economic value. There is significant operational scale (approximately 360,000variable policy holders and $35.6 billion in AUM in our CBVA segment, excluding contracts in payout status, as ofDecember 31, 2015) which ensures ongoing hedging, financial reporting and information technology maintenance expenseefficiencies.
The block continues to generate revenue from asset-based fees. On a U.S. GAAP basis, we continue to amortize capitalizedacquisition costs over estimated gross revenues and we incur operating costs and benefit expenses in support of the segment.
Our focus in managing our CBVA segment is on protecting regulatory and rating agency capital from market movements viahedging and judiciously looking for opportunities to accelerate the run-off of the block, where possible. For example, we haveoffered enhanced income for certain eligible GMIB policyholders which allowed them to annuitize prior to the end of their 10-year waiting period.
Nature of Liabilities
Substantially all of our CBVA segment products were issued by one of our operating subsidiaries, VIAC.
Each of our CBVA segment deferred variable annuity products include some combination of the following features which thecustomer elected when purchasing the product:
Guaranteed Minimum Death Benefits (GMDB)
• Standard. Guarantees that, upon the death of the individual specified in the policy, the death benefit will be no lessthan the premiums paid by the customer, adjusted for withdrawals.
• Ratchet. Guarantees that, upon the death of the individual specified in the policy, the death benefit will be no less thanthe greater of (1) Standard or (2) the maximum policy anniversary (or quarterly) value of the variable annuity,adjusted for withdrawals.
• Rollup. Guarantees that, upon the death of the individual specified in the policy, the death benefit will be no less than theaggregate premiums paid by the contract owner, with interest at the contractual rate per annum, adjusted for withdrawals.The Rollup may be subject to a maximum cap on the total benefit.
• Combo. Guarantees that, upon the death of the individual specified in the policy, the death benefit will be no less thanthe greater of (1) Ratchet or (2) Rollup.
Guaranteed Minimum Living Benefits
• Guaranteed Minimum Income Benefit (GMIB). Guarantees a minimum income payout, exercisable only on a contractanniversary on or after a specified date, in most cases 10 years after purchase of the GMIB rider. The income payout isdetermined based on contractually established annuity factors multiplied by the benefit base. The benefit base equals thepremium paid at the time of product issue and may increase over time based on a number of factors, including a rollup
27

percentage (mainly 7% or 6% depending on the version of the benefit) and ratchet frequency subject to maximum capswhich vary by product version (200%, 250% or 300% of initial premium).
• Guaranteed Minimum Withdrawal Benefit and Guaranteed Minimum Withdrawal Benefit for Life (GMWB/GMWBL).Guarantees an annual withdrawal amount for a specified period of time (GMWB) or life (GMWBL) that is calculated asa percentage of the benefit base that equals premium paid at the time of product issue and may increase over time basedon a number of factors, including a rollup percentage (mainly 7%, 6% or 0%, depending on versions of the benefit) andratchet frequency (primarily annually or quarterly, depending on versions). The percentage used to determine theguaranteed annual withdrawal amount may vary by age at first withdrawal and depends on versions of the benefit. Ajoint life-time withdrawal benefit option was available to include coverage for spouses. Most versions of the withdrawalbenefit included reset and/or step-up features that may increase the guaranteed withdrawal amount in certain conditions.Earlier versions of the withdrawal benefit guarantee that annual withdrawals of up to 7% of eligible premiums may bemade until eligible premiums previously paid by the contract owner are returned, regardless of account valueperformance. Asset allocation requirements apply at all times where withdrawals are guaranteed for life.
• Guaranteed Minimum Accumulation Benefit (GMAB). Guarantees that the account value will be at least 100% of theeligible premiums paid by the customer after 10 years, adjusted for withdrawals. We offered an alternative design thatguaranteed the account value to be at least 200% of the eligible premiums paid by contract owners after 20 years.
Reserves for Future Policy Benefits
We establish and carry actuarially-determined reserves that are calculated to meet our future obligations. The principalassumptions used to establish liabilities for future policy benefits are based on our experience and periodically reviewed againstindustry standards. These assumptions include mortality, policy lapse, investment returns, inflation, benefit utilization andexpenses. Changes in, or deviations from, the assumptions used can significantly affect our reserve levels and related futureoperations.
The determination of future policy benefit reserves is dependent on actuarial assumptions set by us in determining policyholderbehavior, as described above.
Reserves for variable annuity GMDB and GMIB are determined by estimating the value of expected benefits in excess of theprojected account balance and recognizing the excess ratably over the accumulation period based on total expected assessments.Expected assessments are based on a range of scenarios. The reserve for the GMIB guarantee incorporates an assumption for thepercentage of the contracts that will annuitize. In general, we assume that GMIB annuitization rates will be higher for policieswith more valuable (more “in the money”) guarantees. We periodically evaluate estimates used and adjust the additionalliability balance, with a related charge or credit to benefit expense, if actual experience or other evidence suggests that earlierassumptions should be revised. Changes in reserves for GMDB and GMIB are reported in Policyholder benefits in theConsolidated Statements of Operations.
Variable annuity GMAB, GMWB, and GMWBL are considered embedded derivatives, which are measured at estimated fairvalue separately from the host annuity contract, along with attributed fees collected or payments made, and reported in Other netrealized capital gains (losses) in the Consolidated Statements of Operations.
At inception of the GMAB, GMWB, and GMWBL contracts, we project fees to be attributed to the embedded derivative portion of theguarantee equal to the present value of projected future guaranteed benefits. Any excess or deficient fee is attributed to the host contractand reported in Fee income in the Consolidated Statements of Operations.
The estimated fair value of the GMAB, GMWB, and GMWBL contracts is determined based on the present value of projected futureguaranteed benefits, minus the present value of projected attributed fees. A risk neutral valuation methodology is used under which thecash flows from the guarantees are projected under multiple capital market scenarios using observable risk free rates. The projection offuture guaranteed benefits and future attributed fees require the use of assumptions for capital markets (e.g., implied volatilities,correlation among indices, risk-free swap curve, etc.) and policyholder behavior (e.g., lapse, benefit utilization, mortality, etc.). Theprojection also includes adjustments for nonperformance risk and margins for non-capital market risks, or policyholder behaviorassumptions. Risk margins are established to capture uncertainties related to policyholder behavior assumptions. The marginrepresents additional compensation a market participant would require in order to assume these risks.
28
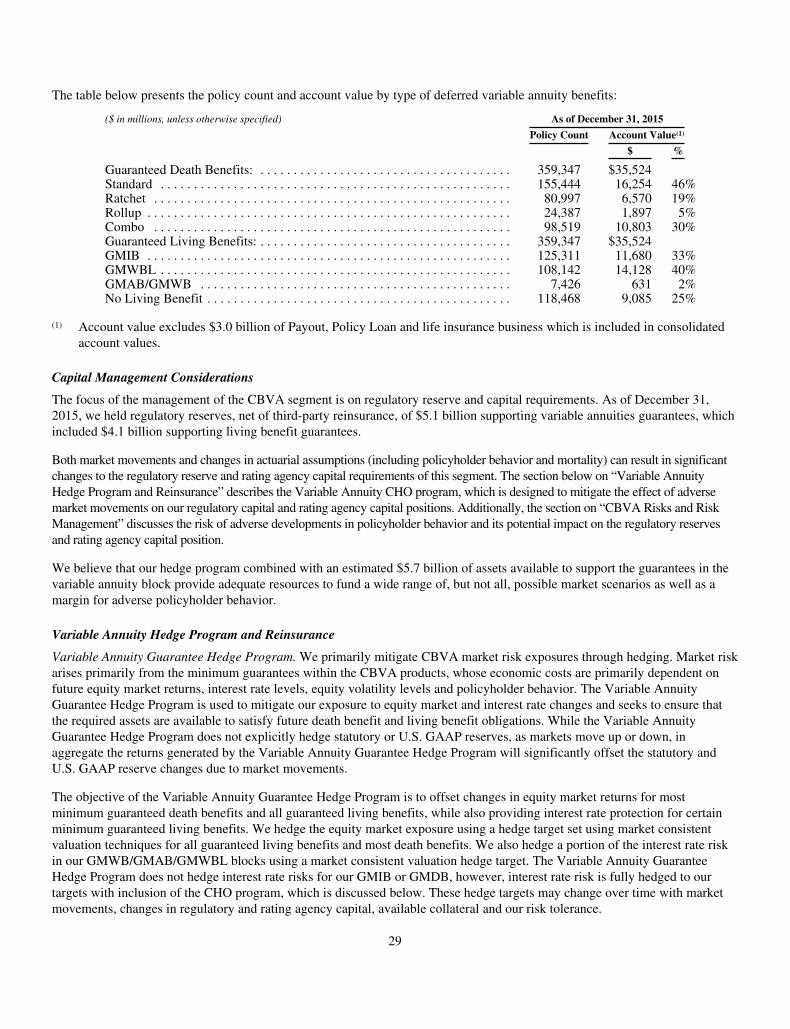
The table below presents the policy count and account value by type of deferred variable annuity benefits:
($ in millions, unless otherwise specified) As of December 31, 2015
Policy Count Account Value(1)
$ %
Guaranteed Death Benefits: . . . . . . . . . . . . . . . . . . . . . . . . . . . . . . . . . . . . . . 359,347 $35,524Standard . . . . . . . . . . . . . . . . . . . . . . . . . . . . . . . . . . . . . . . . . . . . . . . . . . . . . 155,444 16,254 46%Ratchet . . . . . . . . . . . . . . . . . . . . . . . . . . . . . . . . . . . . . . . . . . . . . . . . . . . . . . 80,997 6,570 19%Rollup . . . . . . . . . . . . . . . . . . . . . . . . . . . . . . . . . . . . . . . . . . . . . . . . . . . . . . . 24,387 1,897 5%Combo . . . . . . . . . . . . . . . . . . . . . . . . . . . . . . . . . . . . . . . . . . . . . . . . . . . . . . 98,519 10,803 30%Guaranteed Living Benefits: . . . . . . . . . . . . . . . . . . . . . . . . . . . . . . . . . . . . . . 359,347 $35,524GMIB . . . . . . . . . . . . . . . . . . . . . . . . . . . . . . . . . . . . . . . . . . . . . . . . . . . . . . . 125,311 11,680 33%GMWBL . . . . . . . . . . . . . . . . . . . . . . . . . . . . . . . . . . . . . . . . . . . . . . . . . . . . . 108,142 14,128 40%GMAB/GMWB . . . . . . . . . . . . . . . . . . . . . . . . . . . . . . . . . . . . . . . . . . . . . . . 7,426 631 2%No Living Benefit . . . . . . . . . . . . . . . . . . . . . . . . . . . . . . . . . . . . . . . . . . . . . . 118,468 9,085 25%
(1) Account value excludes $3.0 billion of Payout, Policy Loan and life insurance business which is included in consolidatedaccount values.
Capital Management Considerations
The focus of the management of the CBVA segment is on regulatory reserve and capital requirements. As of December 31,2015, we held regulatory reserves, net of third-party reinsurance, of $5.1 billion supporting variable annuities guarantees, whichincluded $4.1 billion supporting living benefit guarantees.
Both market movements and changes in actuarial assumptions (including policyholder behavior and mortality) can result in significantchanges to the regulatory reserve and rating agency capital requirements of this segment. The section below on “Variable AnnuityHedge Program and Reinsurance” describes the Variable Annuity CHO program, which is designed to mitigate the effect of adversemarket movements on our regulatory capital and rating agency capital positions. Additionally, the section on “CBVA Risks and RiskManagement” discusses the risk of adverse developments in policyholder behavior and its potential impact on the regulatory reservesand rating agency capital position.
We believe that our hedge program combined with an estimated $5.7 billion of assets available to support the guarantees in thevariable annuity block provide adequate resources to fund a wide range of, but not all, possible market scenarios as well as amargin for adverse policyholder behavior.
Variable Annuity Hedge Program and Reinsurance
Variable Annuity Guarantee Hedge Program. We primarily mitigate CBVA market risk exposures through hedging. Market riskarises primarily from the minimum guarantees within the CBVA products, whose economic costs are primarily dependent onfuture equity market returns, interest rate levels, equity volatility levels and policyholder behavior. The Variable AnnuityGuarantee Hedge Program is used to mitigate our exposure to equity market and interest rate changes and seeks to ensure thatthe required assets are available to satisfy future death benefit and living benefit obligations. While the Variable AnnuityGuarantee Hedge Program does not explicitly hedge statutory or U.S. GAAP reserves, as markets move up or down, inaggregate the returns generated by the Variable Annuity Guarantee Hedge Program will significantly offset the statutory andU.S. GAAP reserve changes due to market movements.
The objective of the Variable Annuity Guarantee Hedge Program is to offset changes in equity market returns for mostminimum guaranteed death benefits and all guaranteed living benefits, while also providing interest rate protection for certainminimum guaranteed living benefits. We hedge the equity market exposure using a hedge target set using market consistentvaluation techniques for all guaranteed living benefits and most death benefits. We also hedge a portion of the interest rate riskin our GMWB/GMAB/GMWBL blocks using a market consistent valuation hedge target. The Variable Annuity GuaranteeHedge Program does not hedge interest rate risks for our GMIB or GMDB, however, interest rate risk is fully hedged to ourtargets with inclusion of the CHO program, which is discussed below. These hedge targets may change over time with marketmovements, changes in regulatory and rating agency capital, available collateral and our risk tolerance.
29

Equity index futures on various equity indices are used to mitigate the risk of the change in value of the policyholder-directedseparate account funds underlying the variable annuity contracts with minimum guarantees. A dynamic trading program isutilized to seek replication of the performance of targeted fund groups (i.e., the fund groups that can be covered by indiceswhere liquid futures markets exist).
Total return swaps are also used to mitigate the risk of the change in value of certain policyholder-directed separate accountfunds. These include fund classes such as emerging markets and real estate. They may also be used instead of futures of moreliquid indices where it may be deemed advantageous. This hedging strategy is employed at our discretion based on current riskexposures and related transaction costs.
Interest rate swaps are used to match a portion of the hedge targets on GMWB/GMAB/GMWBL as described above.
Variance swaps and equity options were used to mitigate the impact of changes in equity volatility on the economic liabilitiesassociated with certain minimum guaranteed living benefits. In the second quarter of 2015, we chose to cease this programbecause of the limited benefit of it covering a small block of business.
Foreign exchange forwards are used to mitigate the impact of policyholder-directed investments in international funds withexposure to fluctuations in exchange rates of certain foreign currencies. Rebalancing is performed based on pre-determinednotional exposures to the specific currencies.
Variable Annuity Capital Hedge Overlay Program. CBVA guaranteed benefits are hedged based on their economic or fairvalue; however, the statutory reserves and rating agency required assets are not based on a market value. When equity marketsdecrease, the statutory reserve and rating agency required assets for the CBVA guaranteed benefits can increase more quicklythan the value of the derivatives held under the Variable Annuity Guarantee Hedge Program. This causes regulatory reserves toincrease and rating agency capital to decrease. The CHO program is intended to mitigate market risk to the regulatory and ratingagency capital of the Company. The hedge is executed through the purchase and sale of equity index derivatives, variance andcredit default swaps, and is designed to limit the uncovered reserve and rating agency capital increases and certain rebalancingcosts in an immediate down equity market, credit spread widening, or increased volatility scenario to an amount we believeprudent for a company of our size and scale. This amount will change over time with market movements, changes in regulatoryand rating agency capital, available collateral and our risk tolerance.
The following table summarizes the estimated net impacts to funding our regulatory reserves to our CBVA segment, aftergiving effect to our CHO program and the Variable Annuity Guarantee Hedge Program for various shocks in equity markets andinterest rates. This reflects the hedging we had in place as well as any collateral (in the form of a letter of credit (“LOC”) and/oravailable assets) or change in underlying asset values that would be used to achieve credit for reinsurance for the segment ofliabilities reinsured to our captive reinsurance subsidiary domiciled in Arizona (referred to in this Annual Report on Form 10-Kas “our Arizona captive”) at the close of business on December 31, 2015 in light of our determination of risk tolerance andavailable collateral at that time, which, as noted above, we assess periodically. As part of our risk management approach, wemay use LOCs to meet regulatory requirements in our Arizona captive even when capital requirements may be met in aggregatewithout LOCs. We assess and determine appropriate capital use in various scenarios including a combination of LOCs andavailable assets. See table below.
As of December 31, 2015
($ in millions) Equity Market (S&P 500) Interest Rates
-25% -15% -5% +5% +15% +25% -1% +1%
Decrease/(increase) in regulatory reserves . . . . . . . . . . . . . $(3,600) $(2,050) $(700) $ 650 $ 1,750 $ 2,600 $(950) $ 700Hedge gain/(loss) immediate impact . . . . . . . . . . . . . . . . . 2,450 1,350 400 (450) (1,150) (1,700) 700 (600)Increase/(decrease) in Market Value of Assets . . . . . . . . . . — — — — — — 500 (500)Increase/(decrease) in LOCs and/or available assets . . . . . 1,150 700 300 — — — — 350
Net impact . . . . . . . . . . . . . . . . . . . . . . . . . . . . . . . . . . . . . . $ — $ — $ — $ 200 $ 600 $ 900 $ 250 $ (50)
The foregoing sensitivities illustrate the estimated impact of the indicated shocks beginning on the first market trading dayfollowing December 31, 2015 and give effect to rebalancing over the course of the shock event. The estimates of equity market
30

shocks reflect a shock to all equity markets, domestic and global, of the same magnitude. The estimates of interest rate shocksreflect a shock to rates at all durations (a “parallel” shift in the yield curve). Decrease / (increase) in regulatory reserves includesstatutory reserves for policyholder account balances, NAIC Actuarial Guideline 43 (“AG43”) reserves and additional cash flowtesting reserves related to the CBVA segment. Hedge Gain / (Loss) includes both the Variable Annuity Guarantee Hedge Programand the CHO program and assumes that hedge positions can be rebalanced during the market shock and that the performance of thederivative contracts reasonably matches the performance of the contract owners’ variable fund returns. Increase / (decrease) inLOCs and/or available assets indicates the change in the amount of LOCs and/or available assets used to provide credit forreinsurance at those times when the assets backing the reinsurance liabilities may be less than the statutory reserve requirement.Increase / (decrease) in Market Value of Assets is the estimated potential change in market value of assets supporting the segmentof liabilities reinsured to our Arizona captive from 100 basis point upward and downward shifts in interest rates.
Results of an actual shock to equity markets or interest rates will differ from the above illustration for reasons such as variancein market volatility versus what is assumed, ‘basis risk’ (differences in the performance of the derivative contracts versus thecontract owner variable fund returns), equity shocks not occurring uniformly across all equity markets, combined effects ofinterest rates and equities, additional impacts from rebalancing of hedges and/or the effects of time and changes in assumptionsor methodology that affect reserves or hedge targets. Additionally, estimated net impact sensitivities vary over time as themarket and closed book of business evolve or if assumptions or methodologies that affect reserves or hedge targets are refined.
As stated above, the primary focus of the hedge program is to protect regulatory and rating agency capital from marketmovements. Hedge ineffectiveness, along with other aspects not directly hedged (including unexpected policyholder behavior),may cause losses of regulatory or rating agency capital. Regulatory and rating agency capital requirements may movedisproportionately (i.e., they may change by different amounts as market conditions and other factors change), and, therefore,this could also cause our hedge program to not realize its key objective of protecting both regulatory and rating agency capitalfrom market movements.
For VIAC, our hedge resources related to equity movements (which include guarantee and overlay equity hedges, as well as otherassets) increased by approximately $300.0 million for the year ended December 31, 2015. In addition, there was approximately noequity market change in AG43 reserves in excess of reserves for cash surrender value for the year ended December 31, 2015. Changesin statutory reserves due to equity and equity hedges for VIAC include the effects of non-affiliated reinsurance for variable annuitypolicies, but exclude the effect of the affiliated reinsurance transaction associated with the GMIB and GMWBL riders. Substantially allof the CBVA business was written by VIAC. In addition to equity hedge results and change in reserves due to the impact of equitymarket movements, statutory income includes fee income, investment income and other income offset by benefit payments, operatingexpenses and other costs as well as impacts to reserves and hedges due to effects of time and other market factors.
As U.S. GAAP accounting differs from the methods used to determine regulatory reserves and rating agency capital requirements,our hedge programs may result in immediate impacts that may be lower or higher than the regulatory impacts illustrated above. Thefollowing table summarizes the estimated net impacts to U.S. GAAP earnings pre-tax in our CBVA segment, which is the sum ofthe increase or decrease in U.S. GAAP reserves and the hedge gain or loss from our CHO program and the Variable AnnuityGuarantee Hedge Program for various shocks in both equity markets and interest rates. This reflects the hedging we had in place atthe close of business on December 31, 2015 in light of our determination of risk tolerance at that time, which, as noted above, weassess periodically.
December 31, 2015
($ in millions) Equity Market (S&P 500) Interest Rates
-25% -15% -5% +5% +15% +25% -1% +1%
Total estimated earnings sensitivity . . . . . . . . . . . . . . . . . . . . . . . . . $400 $250 $50 $(150) $(250) $(350) $(400) $250
The foregoing sensitivities illustrate the impact of the indicated shocks on the first market trading day following December 31,2015 and give effect to dynamic rebalancing over the course of the shock events. The estimates of equity market shocks reflect ashock to all equity markets, domestic and global, of the same magnitude. The estimates of interest rate shocks reflect a shock torates at all durations (a “parallel” shift in the yield curve). We regularly monitor and refine our hedge program targets in linewith our primary goal of protecting regulatory and rating agency capital. It is possible that further changes to our hedge programwill be made and those changes may either increase or decrease earnings sensitivity. Liabilities are based on U.S. GAAPreserves and embedded derivatives, with the latter excluding the effects of nonperformance risk. Deferred acquisition cost(“DAC”) is amortized over estimated gross revenues, which we do not expect to be volatile. Volatility could be driven by lossrecognition, however. Hedge Gain / (Loss) impacting the above estimated earnings sensitivity includes both the Variable
31
Annuity Guarantee Hedge Program and the CHO program and assumes that hedge positions can be rebalanced during themarket shock and that the performance of the derivative contracts reasonably matches the performance of the contract owners’variable fund returns.
Actual results will differ from the estimates above for reasons such as variance in market volatility versus what is assumed, ‘basis risk’(differences in the performance of the derivative contracts versus the contract owner variable fund returns), changes innonperformance spreads, equity shocks not occurring uniformly across all equity markets, combined effects of interest rates andequities, additional impacts from rebalancing of hedges, and/or the effects of time and changes in assumptions or methodology thataffect reserves or hedge targets. Additionally, estimated net impact sensitivities vary over time as the market and closed block ofbusiness evolves, or if changes in assumptions or methodologies that affect reserves or hedge targets are refined. As the closed blockof business evolves, actual net impacts are realized, or if changes are made to the target of the hedge program, the sensitivities mayvary over time. Additionally, actual results will differ from the above due to issues such as basis risk, market volatility, changes inimplied volatility, combined effects of interest rates and equities, rebalancing of hedges in the future, or the effects of time and othervariations from the assumptions in the above table.
In addition to equity market and interest rate changes, movements in other market variables that are not explicitly hedged canalso cause U.S. GAAP earnings volatility. This includes changes in implied equity market volatility (implied from the marketprices of equity options) that affects the valuation of our fair value liabilities. We do not fully hedge for equity implied volatilitygiven that such hedging introduces volatility in our regulatory reserves and rating agency capital which are not as sensitive tothis market variable.
As of December 31, 2015, the U.S. GAAP sensitivity (exclusive of our nonperformance spread) of the GMAB / GMWB andGMWBL liabilities to a 1 percentage point move in implied volatility was approximately $49 million, excluding the impact ofhedge offsets.
Hedging instruments
• Guarantee Hedge. In order to mitigate equity risk associated with non-reinsured GMDBs and non-reinsuredguaranteed living benefits, we enter into futures positions and total return swaps on various public market equityindices chosen to closely replicate contract owner variable fund returns. We also mitigate most of the foreign currencyrisk arising from its international fund exposure using forward contracts. We use market consistent valuationtechniques to establish our derivative positions and to rebalance the derivative positions in response to marketfluctuations. We also administer a hedge program that mitigates not only equity risk, but also the interest rate riskassociated with our GMWB, GMWBL and GMAB riders. This component of the hedge primarily involves enteringinto interest rate swaps.
• Capital Hedge Overlay. The Variable Annuity CHO program is an overlay to the Variable Annuity Guarantee HedgeProgram that mitigates the impact of potential declines in markets and their impact on regulatory reserves and ratingagency capital. The program’s hedge strategy involves using equity index derivatives, variance and credit defaultswaps.
32
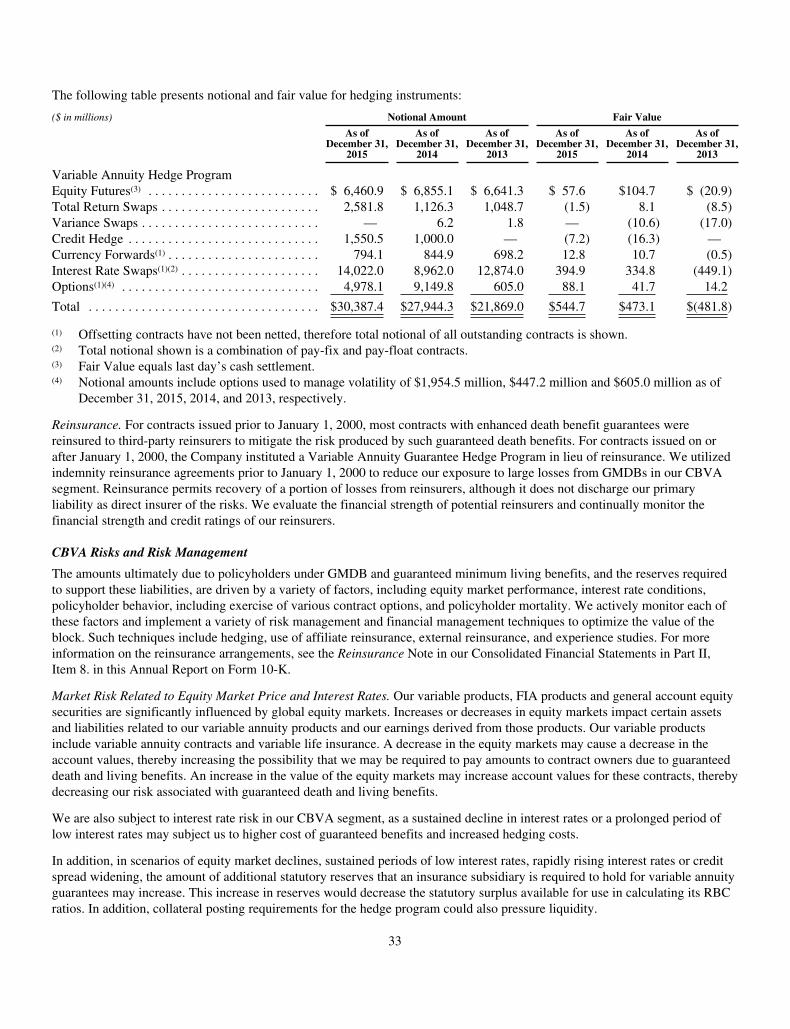
The following table presents notional and fair value for hedging instruments:
($ in millions) Notional Amount Fair Value
As ofDecember 31,
2015
As ofDecember 31,
2014
As ofDecember 31,
2013
As ofDecember 31,
2015
As ofDecember 31,
2014
As ofDecember 31,
2013
Variable Annuity Hedge ProgramEquity Futures(3) . . . . . . . . . . . . . . . . . . . . . . . . . . $ 6,460.9 $ 6,855.1 $ 6,641.3 $ 57.6 $104.7 $ (20.9)Total Return Swaps . . . . . . . . . . . . . . . . . . . . . . . . 2,581.8 1,126.3 1,048.7 (1.5) 8.1 (8.5)Variance Swaps . . . . . . . . . . . . . . . . . . . . . . . . . . . — 6.2 1.8 — (10.6) (17.0)Credit Hedge . . . . . . . . . . . . . . . . . . . . . . . . . . . . . 1,550.5 1,000.0 — (7.2) (16.3) —Currency Forwards(1) . . . . . . . . . . . . . . . . . . . . . . . 794.1 844.9 698.2 12.8 10.7 (0.5)Interest Rate Swaps(1)(2) . . . . . . . . . . . . . . . . . . . . . 14,022.0 8,962.0 12,874.0 394.9 334.8 (449.1)Options(1)(4) . . . . . . . . . . . . . . . . . . . . . . . . . . . . . . 4,978.1 9,149.8 605.0 88.1 41.7 14.2
Total . . . . . . . . . . . . . . . . . . . . . . . . . . . . . . . . . . . $30,387.4 $27,944.3 $21,869.0 $544.7 $473.1 $(481.8)
(1) Offsetting contracts have not been netted, therefore total notional of all outstanding contracts is shown.(2) Total notional shown is a combination of pay-fix and pay-float contracts.(3) Fair Value equals last day’s cash settlement.(4) Notional amounts include options used to manage volatility of $1,954.5 million, $447.2 million and $605.0 million as of
December 31, 2015, 2014, and 2013, respectively.
Reinsurance. For contracts issued prior to January 1, 2000, most contracts with enhanced death benefit guarantees werereinsured to third-party reinsurers to mitigate the risk produced by such guaranteed death benefits. For contracts issued on orafter January 1, 2000, the Company instituted a Variable Annuity Guarantee Hedge Program in lieu of reinsurance. We utilizedindemnity reinsurance agreements prior to January 1, 2000 to reduce our exposure to large losses from GMDBs in our CBVAsegment. Reinsurance permits recovery of a portion of losses from reinsurers, although it does not discharge our primaryliability as direct insurer of the risks. We evaluate the financial strength of potential reinsurers and continually monitor thefinancial strength and credit ratings of our reinsurers.
CBVA Risks and Risk Management
The amounts ultimately due to policyholders under GMDB and guaranteed minimum living benefits, and the reserves requiredto support these liabilities, are driven by a variety of factors, including equity market performance, interest rate conditions,policyholder behavior, including exercise of various contract options, and policyholder mortality. We actively monitor each ofthese factors and implement a variety of risk management and financial management techniques to optimize the value of theblock. Such techniques include hedging, use of affiliate reinsurance, external reinsurance, and experience studies. For moreinformation on the reinsurance arrangements, see the Reinsurance Note in our Consolidated Financial Statements in Part II,Item 8. in this Annual Report on Form 10-K.
Market Risk Related to Equity Market Price and Interest Rates. Our variable products, FIA products and general account equitysecurities are significantly influenced by global equity markets. Increases or decreases in equity markets impact certain assetsand liabilities related to our variable annuity products and our earnings derived from those products. Our variable productsinclude variable annuity contracts and variable life insurance. A decrease in the equity markets may cause a decrease in theaccount values, thereby increasing the possibility that we may be required to pay amounts to contract owners due to guaranteeddeath and living benefits. An increase in the value of the equity markets may increase account values for these contracts, therebydecreasing our risk associated with guaranteed death and living benefits.
We are also subject to interest rate risk in our CBVA segment, as a sustained decline in interest rates or a prolonged period oflow interest rates may subject us to higher cost of guaranteed benefits and increased hedging costs.
In addition, in scenarios of equity market declines, sustained periods of low interest rates, rapidly rising interest rates or creditspread widening, the amount of additional statutory reserves that an insurance subsidiary is required to hold for variable annuityguarantees may increase. This increase in reserves would decrease the statutory surplus available for use in calculating its RBCratios. In addition, collateral posting requirements for the hedge program could also pressure liquidity.
33

Periods of significant and sustained downturns in equity markets, increased equity volatility, reduced interest rates or a prolongedperiod of low interest rates could result in an increase in the valuation of the future policy benefit or account balance liabilitiesassociated with such products, resulting in a reduction to net income (loss). Although a certain portion of our guaranteed benefits isreinsured or covered under our Variable Annuity Guarantee Hedge Program, for those guarantees not covered by these programs, weare exposed to the risk of increased costs and/or liabilities for benefits guaranteed in excess of account values during periods of adverseeconomic market conditions. Our risk management program is constantly re-evaluated to respond to changing market conditions andachieve the optimal balance and trade-offs among several important factors, including regulatory reserves, rating agency capital, RBC,earnings and other factors. A certain portion of these strategies could focus our emphasis on the protection of regulatory and ratingagency capital, RBC, liquidity, earnings and other factors and less on the earnings impact of guarantees, resulting in materially loweror more volatile U.S. GAAP earnings in periods of changing equity market levels. While we believe that our risk managementprogram is effective in balancing numerous critical metrics, we are subject to the risk that our strategies and other managementprocedures prove ineffective or that unexpected policyholder experience, combined with unfavorable market events, produces lossesbeyond the scope of the risk management strategies employed, which may have a material adverse effect on our results of operations,financial condition and cash flows. We are also subject to the risk that the cost of hedging these guaranteed minimum benefitsincreases as implied volatilities increase and/or interest rates decrease, resulting in adverse impact to net income (loss).
Risk Related to Hedging. Our risk management program attempts to balance a number of important factors including regulatoryreserves, rating agency capital, RBC, underlying economics, earnings and other factors. As discussed above, to reduce the riskassociated with guaranteed living benefits, non-reinsured GMDB and fees related to these benefits, we enter derivative contracts onvarious public market indices chosen to closely replicate contract owner variable fund returns.
The Company’s risk management program is constantly re-evaluated to respond to changing market conditions and managetrade-offs among capital preservation, earnings and underlying economics.
Hedging instruments we use to manage risks might not perform as intended or expected, which could result in higher realizedlosses and unanticipated cash needs to collateralize or settle such transactions. Adverse market conditions can limit theavailability and increase the costs of hedging instruments, and such costs may not be recovered in the pricing of the underlyingproducts being hedged. In addition, hedging counterparties may fail to perform their obligations resulting in unhedgedexposures and losses on positions that are not collateralized.
Risk Related to Policyholder Behavior Assumptions. Our CBVA segment is subject to risks associated with the future behaviorof policyholders and future claims payment patterns, using assumptions for mortality experience, lapse rates, GMIBannuitization rates and GMWBL withdrawal rates. We are required to make assumptions about these behaviors and patterns,which may not reflect the actual behaviors and patterns we experience in the future. It is possible that future assumption changescould produce reserve changes that could be material. Any such increase to reserves could require us to make materialadditional capital contributions to one or more of our insurance company subsidiaries or could otherwise be material andadverse to the results of operations or financial condition of the Company.
In particular, we have only minimal experience regarding the long-term implications of policyholder behavior for our GMIB, and, as aresult, future experience could lead to significant changes in our assumptions. Our GMIB contracts, most of which were issued duringthe period from 2004 to 2006, have a ten-year waiting period before annuitization is available. These contracts first become eligible toannuitize during the period from 2014 through 2016, but contain significant incentives to delay annuitization beyond the first eligibilitydate. In addition, during 2014 and 2015, we made two income enhancement offers to holders of particular series of GMIB contracts,under which policy holders were offered an incentive to annuitize prior to the end of the waiting period, and we have waived theremaining waiting period on these GMIB contracts. As a result, although we have increased experience on policyholder behavior forthe first opportunity to annuitize, including from the acceptance rates of the income enhancement offers, we continue to have only astatistically small sample of experience used to set annuitization rates beyond the first eligibility date. Therefore, we anticipate thatobservable experience data will become statistically credible later in this decade, when a large volume of GMIB benefits begin toreach their maximum benefit over the four-year period from 2019 to 2022.
Similarly, most of our GMWBL contracts are still in the first seven to nine policy years, so our assumptions for withdrawal fromcontracts with GMWBL benefits may change as experience emerges. In addition, many of our GMWBL contracts contain significantincentives to delay withdrawal. Our experience for GMWBL contracts has recently become more credible, however it is possible thatpolicyholders may choose to withdraw sooner or later than the current best estimate assumes. We expect customer decisions onwithdrawal will be influenced by their financial plans and needs as well as by interest rate and market conditions over time and by theavailability and features of competing products.
34
We also make estimates of expected lapse rates, which represent the probability that a policy will not remain in force from one periodto the next, for contracts in the CBVA segment. Lapse rates of our variable annuity contracts may be significantly impacted by thevalue of guaranteed minimum benefits relative to the value of the underlying separate accounts (account value or account balance). Ingeneral, policies with guarantees that are “in the money” are assumed to be less likely to lapse. Conversely, “out of the money”guarantees are assumed to be more likely to lapse as the policyholder has less incentive to retain the policy. Lapse rates could also beadversely affected generally by developments that affect customer perception of us.
Our variable annuity lapse rate experience has varied significantly over the period from 2006 to the present, reflecting among otherfactors, both pre-and post-financial crisis experience. Relative to our current expectations, actual lapse rates have generallydemonstrated a declining trend over the period from 2006 to the present. We analyze actual experience over that entire period, as webelieve that over the duration of the variable annuity policies we may experience the full range of policyholder behavior and marketconditions. However, management’s current best estimate of variable annuity policyholder lapse behavior is weighted more heavilytoward more recent experience, as the last three years of data have shown a more consistent trend of lapse behavior. Actual lapse ratesthat are lower than our lapse assumptions could have an adverse effect on profitability in the later years of a block of business becausethe anticipated claims experience may be higher than expected in these later years, and, as discussed above, future reserve increases inconnection with experience updates could be material and adverse to the results of operations or financial condition of the Company.
We review overall policyholder experience at least annually (including lapse, annuitization, withdrawal and mortality), andupdate these assumptions when deemed necessary based on additional information that becomes available. As customerexperience continues to materialize, we may adjust our assumptions. We increased reserves in the fourth quarter of 2011 after acomprehensive review of our assumptions relating to lapses, mortality, annuitization of income benefits and utilization ofwithdrawal benefits. The review in 2011 included an analysis of a larger body of actual experience than was previouslyavailable, including a longer period with low equity markets and interest rates, which we believe provided greater insight intoanticipated policyholder behavior for contracts that are in the money. This resulted in an increase of U.S. GAAP reserves of$741 million and gross U.S. statutory reserves of $2,776 million in the fourth quarter of 2011.
In our most recent annual review of assumptions related to our CBVA contracts in the third quarter of 2015, annual assumptionchanges and revisions to projection model inputs implemented resulted in loss of $86.0 million. This $86.0 million loss includedan unfavorable $43.0 million resulting from policyholder behavior assumption changes primarily related to an update to lapseassumptions, partially offset by a favorable $27.4 million resulting from changes to mortality assumptions. The loss alsoincluded an unfavorable $70.4 million as a result of updates we have made to other assumptions, principally relating to expectedearned rates on certain investment options available to variable annuity contractholders, discount rates applicable to future cashflows from variable annuity contracts and long-term volatility. Annual assumption changes and revisions to projection modelinputs implemented during 2014 resulted in a gain of $102.3 million (excluding a gain of $37.9 million due to changes in thetechnique used to estimate nonperformance risk). This $102.3 million gain included a favorable $170.2 million resulting frompolicyholder behavior assumption changes partially offset by an unfavorable $40.5 million resulting from changes to mortalityassumptions. The gain from policyholder behavior assumption changes was primarily due to an update to the utilizationassumption on GMWBL contracts, partially offset by an unfavorable result from an update to lapse assumptions. The 2013result included a loss of $185.3 million (excluding a gain of $144.6 million due to changes in the technique used to estimatenonperformance risk) due to annual assumption changes. This $185.3 million loss included an unfavorable $117.9 millionresulting from changes to mortality assumptions and unfavorable $85.5 million resulting from policyholder behavior assumptionchanges primarily related to an update to lapse assumptions.
As discussed above, our recent changes in lapse assumptions moved our assumptions to be in line with lapse experience overthe last three years. Also as described above, future reserve increases in connection with experience updates could be materialand adverse to the results of operations or financial condition of the Company.
We will continue to monitor the emergence of experience. If adjustments to policyholder behavior assumptions (e.g., lapse,annuitization and withdrawal) are necessary, which is ordinary course for interest-sensitive long-dated liabilities, we anticipate thatthe financial impact of such a change (either under U.S. GAAP or due to increases or decreases in gross U.S. statutory reserves)will likely be in a range, either up or down, that is generally consistent with the impact experienced in the past two years.
Other Risks. Despite the closure of new product sales, some new policy amounts continue to be deposited as additional premiumto existing contracts. Benefit designs do limit the attractiveness of additional premium, but in some cases these additionalpremiums may increase the guarantee available to the policyholder. The volume of additional premiums has diminished sincewe ceased new product sales in 2010.
35
On June 2, 2014 we entered into an agreement to outsource the actuarial valuation, modeling and hedging functions of ourCBVA segment to Milliman, Inc. (“Milliman”). Under this agreement, Milliman performs the calculation of financial reportingand risk metrics, along with the analytics used to determine hedge positions. We will continue to oversee and manage theCBVA segment and retain full accountability for assumptions and methodologies, as well as the setting of the hedge objectivesand the execution of hedge positions. This agreement allows us to create a more variable cost structure for the CBVA segment.
Closed Block Other
Closed Block Other includes a GIC and funding agreement spread lending business that is in run-off, as well as continuingobligations and assets connected with the group reinsurance and individual reinsurance businesses we sold between 2004 and2009.
Prior to 2009, we operated a spread lending business funded by a block of GICs and funding agreements. However, following thefinancial crisis in 2008, investor appetite for uncollateralized liabilities not rated “AAA” and collateralized funding becameconstrained causing funding spreads on new liabilities to widen. We shifted the focus of the business strategy from growing assets andearnings to running off the business over time. As of December 31, 2015, remaining assets in the GICs and funding agreementsportfolio had an amortized cost of $1.2 billion, down from a peak of $14.3 billion in 2008. We continue to reduce the block byallowing the assets and liabilities to mature or by finding opportunities to sell assets at prices deemed attractive. New liability contractsmay be issued from time to time or be terminated early in order to better match the run-off of the asset portfolio. As the business is inrun-off, it is actively managed to limit liquidity risk and capital requirements.
In addition, we wrote super senior credit default swap (“CDS”) contracts of which, as of December 31, 2015, approximately $1billion of notional amount remained outstanding.
Effective January 2009, we sold our group reinsurance business, ING Reinsurance U.S., to RGA. The transaction was accounted for as areinsurance transaction. To effect this sale, we entered into coinsurance agreements with various subsidiaries of RGA. Between 2004 and2009, we entered into several reinsurance transactions with Scottish Re and Hannover Re pursuant to which we ceded all liabilities relatedto our individual life reinsurance block. In 2015, we divested of, via reinsurance, an in-force block of retained group reinsurance policies,backed by approximately $290 million of statutory reserves to a third party reinsurer. For more information on these reinsurancearrangements, see the Reinsurance Note in our Consolidated Financial Statements in Part II, Item 8. in this Annual Report on Form 10-Kand in “Item 7. Management’s Discussion and Analysis of Financial Condition and Results of Operations—Liquidity and CapitalResources—Reinsurance” below.
Employees
As of December 31, 2015, we had approximately 7,000 employees, with most working in one of our ten major sites in ninestates.
REGULATION
Our operations and businesses are subject to a significant number of Federal and state laws, regulations, administrativedeterminations and similar legal constraints. Such laws and regulations are generally designed to protect our policyholders,contract owners and other customers and not our stockholders or holders of our other securities. Many of the laws andregulations to which we are subject are regularly re-examined and existing or future laws and regulations may become morerestrictive or otherwise adversely affect our operations. Following is a description of certain legal and regulatory frameworks towhich we or our subsidiaries are or may be subject.
We are a holding company for all of our business operations, which we conduct through our subsidiaries. We, as an insuranceholding company, are not licensed as an insurer, investment advisor, broker-dealer, or other regulated entity. However, becausewe own regulated insurers, we are subject to regulation as an insurance holding company.
Insurance Regulation
Our insurance subsidiaries are subject to comprehensive regulation and supervision under U.S. state and federal laws. Each U.S.state, the District of Columbia and U.S. territories and possessions have insurance laws that apply to companies licensed to carryon an insurance business in the jurisdiction. The primary regulator of an insurance company, however, is located in its state ofdomicile. Each of our insurance subsidiaries is licensed and regulated in each state where it conducts insurance business.
36

State insurance regulators have broad administrative powers with respect to all aspects of the insurance business including:licensing to transact business, licensing agents, admittance of assets to statutory surplus, regulating premium rates for certaininsurance products, approving policy forms, regulating unfair trade and claims practices, establishing reserve requirements andsolvency standards, establishing credit for reinsurance requirements, fixing maximum interest rates on life insurance policyloans and minimum accumulation or surrender values and other matters. State insurance laws and regulations include numerousprovisions governing the marketplace conduct of insurers, including provisions governing the form and content of disclosures toconsumers, product illustrations, advertising, product replacement, suitability, sales and underwriting practices, complainthandling and claims handling. State regulators enforce these provisions through periodic market conduct examinations. Stateinsurance laws and regulations regulating affiliate transactions, the payment of dividends and change of control transactions arediscussed in greater detail below.
Our four principal insurance subsidiaries (SLD, VRIAC, VIAC and RLI, and collectively, the “Principal Insurance Subsidiaries”)are domiciled in Colorado, Connecticut, Iowa and Minnesota, respectively. Our other U.S. insurance subsidiaries are domiciled inIndiana and New York. Our insurance subsidiaries domiciled in Colorado, Connecticut, Indiana, Iowa, Minnesota and New Yorkare collectively referred to as “our insurance subsidiaries” in this Annual Report on Form 10-K for purposes of discussions of U.S.insurance regulatory matters. In addition, we have special purpose life reinsurance captive insurance company subsidiariesdomiciled in Missouri that provide reinsurance to our insurance subsidiaries in order to facilitate the financing of statutory reserverequirements associated with the National Association of Insurance Commissioners (“NAIC”) Model Regulation entitled“Valuation of Life Insurance Policies” (commonly known as “Regulation XXX” or “XXX”), or NAIC Actuarial Guideline 38(commonly known as “AG38” or “AXXX”), and to fund statutory Stable Value reserves in excess of the economic reserve level.Our special purpose life reinsurance captive insurance company subsidiaries domiciled in Missouri are collectively referred to as“captive reinsurance subsidiaries” in this Annual Report on Form 10-K. For more information on our use of captive reinsurancestructures, see “Item 7. Management’s Discussion and Analysis of Financial Condition and Results of Operations—Liquidity andCapital Resources—Credit Facilities and Subsidiary Credit Support Arrangements”. We also have a captive reinsurance subsidiarydomiciled in Arizona that primarily provides reinsurance to our insurance subsidiaries. Our captive reinsurance subsidiarydomiciled in Arizona is referred to as “our Arizona captive” in this Annual Report on Form 10-K.
State insurance laws and regulations require our insurance subsidiaries to file financial statements with state insuranceregulators everywhere they are licensed and the operations of our insurance subsidiaries and accounts are subject to examinationby those regulators at any time. Our insurance subsidiaries prepare statutory financial statements in accordance with accountingpractices and procedures prescribed or permitted by these regulators. The NAIC has approved a series of uniform statutoryaccounting principles (“SAP”) that have been adopted, in some cases with minor modifications, by all state insurance regulators.
As a basis of accounting, SAP was developed to monitor and regulate the solvency of insurance companies. In developing SAP,insurance regulators were primarily concerned with assuring an insurer’s ability to pay all its current and future obligations topolicyholders. As a result, statutory accounting focuses on conservatively valuing the assets and liabilities of insurers, generally inaccordance with standards specified by the insurer’s domiciliary state. The values for assets, liabilities and equity reflected infinancial statements prepared in accordance with U.S. GAAP are usually different from those reflected in financial statementsprepared under SAP.
The insurance laws and regulations of the State of Missouri, which govern our captive reinsurance subsidiaries, require such entities tofile financial statements with the Missouri Insurance Department, including statutory financial statements. The insurance laws andregulations of the State of Arizona, which govern our Arizona captive, require that entity to file financial statements with the ArizonaDepartment of Insurance (“ADOI”) and permit the filing of such financial statements on either a statutory basis or a U.S. GAAP basis.The ADOI has agreed to permit our Arizona captive to prepare its financial statements on a U.S. GAAP basis, modified for certainprescribed practices outlined in the Arizona insurance statutes. In addition, our Arizona captive obtained approval from the ADOI forcertain permitted practices, including taking reinsurance credit for certain ceded reserves where the trust assets backing the liabilitiesare held by one of our wholly owned insurance companies. Our Arizona captive has recorded a receivable for these assets held in trustby its affiliate.
State insurance regulators conduct periodic financial examinations of the books, records, accounts and business practices ofinsurers domiciled in their states, generally every three to five years. Financial examinations are generally carried out incooperation with the insurance regulators of other states under guidelines promulgated by the NAIC. State and federal insuranceand securities regulatory authorities and other state law enforcement agencies and attorneys general also from time to time makeinquiries and conduct examinations or investigations regarding the compliance by our company, as well as other companies inour industry, with, among other things, insurance laws and securities laws.
37
Our captive reinsurance subsidiaries and our Arizona captive are subject to periodic financial examinations by their respectivedomiciliary state insurance regulators.
Captive Reinsurer Regulation
State insurance regulators, the NAIC and other regulatory bodies are also investigating the use of affiliated captive reinsurers andoffshore entities to reinsure insurance risks, and the NAIC has made recent advances in captives reform.
In June 2014, the NAIC adopted a new regulatory framework for captives assuming business governed by Regulations XXX orAXXX, called the “Rector Framework”. In December 2014, the NAIC adopted Actuarial Guideline 48 (“AG48”) which establisheda new regulatory requirement applicable to XXX and AG38 reserves ceded to reinsurers, including affiliated reinsurers, as the firststep in implementing the Rector framework. AG48 limits the type of assets that may be used as collateral to cover the XXX andAG38 statutory reserves and is applied prospectively to existing reinsurance transactions that reinsure policies issued on or afterJanuary 1, 2015 and new reinsurance transactions entered into on or after January 1, 2015. The NAIC has charged multiple workinggroups with the responsibility to prepare regulations that would codify the Rector framework and that work continues at the NAIC.In 2014, the NAIC also considered a proposal to require states to apply NAIC accreditation standards, applicable to traditionalinsurers, to captive reinsurers. In 2015, the NAIC adopted such a proposal, in the form of a revised preamble to the NAICaccreditation standards (the “Standard”), with an effective date of January 1, 2016 for application of the Standard to captives thatassume XXX or AXXX business. Under the Standard, a state will be deemed in compliance as it relates to XXX or AXXX captivesif the applicable reinsurance transaction satisfies AG48. In addition, the Standard applies prospectively, so that XXX or AXXXcaptives will not be subject to the Standard if reinsured policies were issued prior to January 1, 2015 and ceded so that they were partof a reinsurance arrangement as of December 31, 2014. The NAIC left for future action application of the Standard to captives thatassume variable annuity business. As drafted, it appears that the Standard would apply to our Arizona captive.
During 2015, the NAIC Financial Conditions (E) Committee (the “E Committee”) established the Variable Annuities Issues(E) Working Group (“VAIWG”) to oversee the NAIC’s effort’s to study and address, as appropriate, regulatory issues resulting invariable annuity captive reinsurance transactions. The VAIWG retained Oliver Wyman to study the industry’s use of variable annuitycaptive reinsurance and to develop a set of recommended changes to address the issues involving variable annuity captives. InSeptember 2015, Oliver Wyman issued an initial report, which was adopted by the VAIWG, outlining its preliminary findings andmaking recommendations for enhancements to the variable annuity statutory framework. In November 2015, upon the recommendationof the VAIWG, the E Committee adopted a Variable Annuities Framework for Change (the “VA Framework for Change”) whichrecommends charges for NAIC working groups to adjust the variable annuity statutory framework applicable to all insurers that havewritten or are writing variable annuity business. The VA Framework for Change contemplates a holistic set of reforms that wouldimprove the current reserve and capital framework and address root cause issues that result in the use of captive arrangements. Althoughthe VA Framework for Change recommends an effective date of January 1, 2017, the timing of these proposals remains uncertain. InNovember 2015, the NAIC also approved funding for a quantitative impact study, to be conducted by Oliver Wyman and involvingindustry participants including the Company, of various reforms outlined in the VA Framework for Change (the “QIS Study”).
We cannot predict what revisions, if any, will be made to the Rector framework or the Standard for application to captives that assumeXXX or AXXX business, as multiple NAIC working groups undertake their implementation, to the VA Framework for Changeproposal as a result of the QIS Study and ongoing NAIC deliberations, or to the Standard, if adopted for variable annuity captives. It isalso unclear whether these or other proposals will be adopted by the NAIC, or what additional actions and regulatory changes willresult from the continued captives scrutiny and reform efforts by the NAIC and other regulatory bodies. Like many life insurancecompanies, we utilize captive reinsurers to satisfy certain reserve requirements related to certain of our policies. If state insuranceregulators determine to restrict our use of captive reinsurers, it could require us to increase statutory reserves, incur higher operating ortax costs or reduce sales. See “Item 1A. Risk Factors—Risks Related to Regulation—Our insurance businesses are heavily regulated,and changes in regulation in the United States, enforcement actions and regulatory investigations may reduce profitability”.
Insurance Holding Company Regulation
Voya Financial, Inc. and our insurance subsidiaries are subject to the insurance holding companies laws of the states in whichsuch insurance subsidiaries are domiciled. These laws generally require each insurance company directly or indirectly owned bythe holding company to register with the insurance regulator in the insurance company’s state of domicile and to furnishannually financial and other information about the operations of companies within the holding company system. Generally, alltransactions affecting the insurers in the holding company system must be fair and reasonable and, if material, require prior
38

notice and approval or non-disapproval by the state’s insurance regulator. Our captive reinsurance subsidiaries and our Arizonacaptive are not subject to insurance holding company laws.
Change of Control. State insurance holding company regulations generally provide that no person, corporation or other entity mayacquire control of an insurance company, or a controlling interest in any parent company of an insurance company, without the priorapproval of such insurance company’s domiciliary state insurance regulator. Under the laws of each of the domiciliary states of ourinsurance subsidiaries, any person acquiring, directly or indirectly, 10% or more of the voting securities of an insurance company ispresumed to have acquired “control” of the company. This statutory presumption of control may be rebutted by a showing that controldoes not exist in fact. The state insurance regulators, however, may find that “control” exists in circumstances in which a person ownsor controls less than 10% of voting securities.
To obtain approval of any change in control, the proposed acquirer must file with the applicable insurance regulator anapplication disclosing, among other information, its background, financial condition, the financial condition of its affiliates, thesource and amount of funds by which it will effect the acquisition, the criteria used in determining the nature and amount ofconsideration to be paid for the acquisition, proposed changes in the management and operations of the insurance company andother related matters. Any purchaser of shares of common stock representing 10% or more of the voting power of our capitalstock will be presumed to have acquired control of our insurance subsidiaries unless, following application by that purchaser ineach insurance subsidiary’s state of domicile, the relevant insurance commissioner determines otherwise.
The licensing orders governing our captive reinsurance subsidiaries provide that any change of control requires the approval of suchcompany’s domiciliary state insurance regulator. For our Arizona captive, a change of control requires the approval of the ADOI.Although our captive reinsurance subsidiaries and our Arizona captive are not subject to insurance holding company laws, theirdomiciliary state insurance regulators may use all or a part of the holding company law framework described above in determiningwhether to approve a proposed change of control.
NAIC Amendments. In 2010, the NAIC adopted significant changes to the insurance holding company model act and regulations (the“NAIC Amendments”). The NAIC Amendments include a requirement that an insurance holding company system’s ultimatecontrolling person submit annually to its lead state insurance regulator an “enterprise risk report” that identifies activities,circumstances or events involving one or more affiliates of an insurer that, if not remedied properly, are likely to have a materialadverse effect upon the financial condition or liquidity of the insurer or its insurance holding company system as a whole. The NAICAmendments also include a provision requiring a controlling person to submit prior notice to its domiciliary insurance regulator of adivestiture of control. Each of the states of domicile for our insurance subsidiaries has adopted its version of the NAIC Amendments.
In addition, the NAIC has proposed a “Solvency Modernization Initiative” which focuses on: (1) capital requirements;(2) corporate governance and risk management; (3) group supervision; (4) statutory accounting and financial reporting; and(5) reinsurance. This initiative has resulted in the adoption by the NAIC in September 2012 of the Risk Management and Own Riskand Solvency Assessment Model Act (“ORSA”), which has been enacted by our insurance subsidiaries’ domiciliary states. ORSArequires that insurers maintain a risk management framework and conduct an internal own risk and solvency assessment of theinsurer’s material risks in normal and stressed environments. The assessment must be documented in a confidential annualsummary report, a copy of which must be made available to regulators as required or upon request. Voya Financial prepared andsubmitted its first ORSA summary report in 2015. This initiative also resulted in the adoption by the NAIC in August 2014 of theCorporate Governance Annual Filing Model Act, which requires insurers to make an annual confidential filing regarding theircorporate governance policies. This new model has been enacted by one of our insurance subsidiaries’ domiciliary regulator andthe first filing must be made in 2016.
Dividend Payment Restrictions. As a holding company with no significant business operations of our own, we will depend ondividends and other distributions from our subsidiaries as the principal source of cash to meet our obligations, including the paymentof interest on, and repayment of principal of, our outstanding debt obligations. The states in which our insurance subsidiaries aredomiciled impose certain restrictions on such subsidiaries’ ability to pay dividends to us. These restrictions are based in part on theprior year’s statutory income and surplus. In general, dividends up to specified levels are considered ordinary and may be paid withoutprior approval. Dividends in larger amounts, or extraordinary dividends, are subject to approval by the insurance commissioner of thestate of domicile of the insurance subsidiary proposing to pay the dividend. In addition, under the insurance laws applicable to ourinsurance subsidiaries domiciled in the states of Connecticut, Iowa and Minnesota, no dividend or other distribution exceeding anamount equal to an insurance company’s earned surplus may be paid without the domiciliary insurance regulator’s prior approval (the“positive earned surplus requirement”).
39

Our captive reinsurance subsidiaries may not declare or pay dividends in any form to us other than in accordance with theirrespective insurance securitization transaction agreements and their respective governing licensing orders. Likewise, ourArizona captive may not declare or pay dividends in any form to us other than in accordance with its annual capital anddividend plan as approved by the ADOI which includes a minimum capital requirement. In addition, in no event may thedividends decrease the capital of the captive below the minimum capital requirement applicable to it, and, after giving effect tothe dividends, the assets of the captive paying the dividend must be sufficient to satisfy its domiciliary insurance regulator that itcan meet its obligations.
Approval by a captive’s domiciliary insurance regulator of an ongoing plan for the payment of dividends or other distribution isconditioned upon the retention, at the time of each payment, of capital or surplus equal to or in excess of amounts specified by, ordetermined in accordance with formulas approved for the captive by its domiciliary insurance regulator.
In March and April of 2013, in connection with our IPO recapitalization activities, our Principal Insurance Subsidiaries receivedapprovals or notices of non-objection, as the case may be, from their respective domiciliary regulators to make extraordinarydistributions to Voya Financial, Inc. or Voya Holdings Inc. (our subsidiary that is also a holding company) in the aggregateamount of $1,434.0 million. These distributions were paid on May 8, 2013, the day following completion of our IPO.
Prior to our IPO, our Principal Insurance Subsidiaries domiciled in Colorado, Iowa and Minnesota each had negative earnedsurplus accounts, and therefore did not have capacity to make ordinary dividend payments without regulatory approval. In orderto obtain dividends or distributions from these insurance companies, we historically obtained approval from the insurancecompanies’ respective state regulators, which could be granted or withheld at the regulators’ discretion, for extraordinarydividends or distributions. On May 8, 2013, in connection with the completion of our IPO and payment of $1,434.0 million ofextraordinary distributions, these insurance companies each were permitted to reset their respective negative unassigned fundsaccount as of December 31, 2012 (as reported in their respective 2012 statutory annual statements) to zero (with an offsettingreduction in gross paid-in capital and contributed surplus). These resets were made pursuant to permitted practices inaccordance with statutory accounting practices granted by their respective domiciliary insurance regulators.
This reset allowed our Principal Insurance Subsidiaries domiciled in Colorado, Iowa and Minnesota to more readily build upordinary dividend capacity to the extent their operating results subsequent to December 31, 2012 generated positive earnedsurplus. Based on legislative amendments adopted by the Colorado legislature in 2014, from and after July 1, 2014, ourinsurance subsidiary domiciled in Colorado is no longer subject to the positive earned surplus requirement, although it didgenerate sufficient positive earned surplus to pay an ordinary dividend in 2014. Under applicable domiciliary insuranceregulations, our Principal Insurance Subsidiaries must deduct any distributions or dividends paid in the preceding twelve monthsin calculating dividend capacity.
Our Principal Insurance Subsidiaries domiciled in Iowa and Minnesota had sufficient positive earned surplus to pay ordinarydividends in 2014 and 2015. VRIAC had ordinary dividend capacity in December 2013 and also in 2014 and 2015. In 2015, ourPrincipal Insurance Subsidiaries domiciled in Colorado, Iowa and Minnesota generated capital in excess of our target combinedRBC ratio of 425% and our individual insurance company ordinary dividend limits, and they sought and received domiciliaryinsurance regulatory approval for, and paid, extraordinary distributions in the aggregate amount of $508.0 million. Our PrincipalInsurance Subsidiaries domiciled in Colorado, Connecticut and Iowa each have ordinary dividend capacity for 2016. However,as a result of the extraordinary dividend it paid in 2015, our Principal Insurance Subsidiary domiciled in Minnesota currentlyhas negative earned surplus and therefore does not have capacity at this time to make ordinary dividend payments to VoyaHoldings without domiciliary insurance regulatory approval which can be granted or withheld in the discretion of the regulator.
If any of our Principal Insurance Subsidiaries do not succeed in building up sufficient positive earned surplus to have ordinarydividend capacity in future years, such subsidiary would be unable to pay dividends or distributions to our holding companiesabsent prior approval of our domiciliary insurance regulators, which can be granted or withheld in the discretion of theregulator. In addition, if our Principal Insurance Subsidiaries generate capital in excess of our target combined estimated RBCratio of 425% and our individual insurance company ordinary dividend limits in future years, then we may also seekextraordinary dividends or distributions. There can be no assurance that our Principal Insurance Subsidiaries will receiveapproval for extraordinary distribution payments in the future.
See “Item 7. Management’s Discussion and Analysis of Financial Condition and Results of Operations—Liquidity and CapitalResources—Restrictions on Dividends and Returns of Capital from Subsidiaries” for a discussion of dividends and distributionsfrom our insurance subsidiaries.
40
Financial Regulation
Policy and Contract Reserve Sufficiency Analysis. Under the laws and regulations of their states of domicile, our insurancesubsidiaries are required to conduct annual analyses of the sufficiency of their life and annuity statutory reserves. Otherjurisdictions in which these subsidiaries are licensed may have certain reserve requirements that differ from those of theirdomiciliary jurisdictions. In each case, a qualified actuary must submit an opinion that states that the aggregate statutoryreserves, when considered in light of the assets held with respect to such reserves, are sufficient to meet the insurer’s contractualobligations and related expenses. If such an opinion cannot be rendered, the affected insurer must set up additional statutoryreserves by moving funds from available statutory surplus. Our insurance subsidiaries submit these opinions annually toapplicable insurance regulatory authorities.
Recent actions by the NAIC. The NAIC has begun a process of redefining the reserve methodology for certain of our insuranceliabilities under a framework known as Principles-Based Reserving (“PBR”). Under PBR, an insurer’s reserves are still required to beconservative, since a primary focus of SAP is the protection of policyholders, however, greater credence is given to the insurer’srealized past experience and anticipated future experience as well as to current economic conditions. An important part of the PBRframework was the adoption of AG43 as of December 31, 2009 for variable annuity guaranteed benefits. Another significantdevelopment was the adoption of the new Valuation Manual (“VM”), which defines PBR for life insurance policies. The full NAICmembership adopted the new VM in December 2012. The model law that enables the new VM will become effective on theJanuary 1st after it has been adopted by at least 42 of the 55 jurisdictions that make up the NAIC, with the further provision that the 42adopting jurisdictions must also account for 75% of the premium by U.S. life insurance companies (measured as of 2008). The newVM is expected to become effective no earlier than January 1, 2017, and we anticipate that its provisions will require us to makechanges to certain of our term and universal life insurance policies, in particular, those policies with guaranteed features and may resultin more volatility in our financial results given the greater weight it places on current economic conditions.
Surplus and Capital Requirements. Insurance regulators have the discretionary authority, in connection with the ongoinglicensing of our insurance subsidiaries, to limit or prohibit the ability of an insurer to issue new policies if, in the regulators’judgment, the insurer is not maintaining a minimum amount of surplus or is in hazardous financial condition. Insuranceregulators may also limit the ability of an insurer to issue new life insurance policies and annuity contracts above an amountbased upon the face amount and premiums of policies of a similar type issued in the prior year. We do not currently believe thatthe current or anticipated levels of statutory surplus of our insurance subsidiaries present a material risk that any such regulatorwould limit the amount of new policies that our Principal Insurance Subsidiaries may issue.
Risk-Based Capital. The NAIC has adopted RBC requirements for life, health and property and casualty insurance companies.The requirements provide a method for analyzing the minimum amount of adjusted capital (statutory capital and surplus plusother adjustments) appropriate for an insurance company to support its overall business operations, taking into account the riskcharacteristics of the company’s assets, liabilities and certain off-balance sheet items. State insurance regulators use the RBCrequirements as an early warning tool to identify possibly inadequately capitalized insurers. An insurance company found tohave insufficient statutory capital based on its RBC ratio may be subject to varying levels of additional regulatory oversightdepending on the level of capital inadequacy. As of December 31, 2015, the RBC of each of our insurance subsidiaries exceededstatutory minimum RBC levels that would require any regulatory or corrective action.
The NAIC is currently working with the American Academy of Actuaries as they consider possible updates to the asset factorsthat are used to calculate the RBC requirements for investment portfolio assets. The NAIC review may lead to an expansion inthe number of NAIC asset class categories for factor-based RBC requirements and the adoption of new factors, which couldincrease capital requirements on some securities and decrease capital requirements on others. We cannot predict what, if any,changes may result from this review or their potential impact on the RBC ratios of our insurance subsidiaries that are subject toRBC requirements. We will continue to monitor developments in this area.
IRIS Tests. The NAIC has developed a set of financial relationships or tests known as the Insurance Regulatory Information System(“IRIS”) to assist state regulators in monitoring the financial condition of U.S. insurance companies and identifying companiesrequiring special attention or action. For IRIS ratio purposes, our Principal Insurance Subsidiaries submit data to the NAIC on anannual basis. The NAIC analyzes this data using prescribed financial data ratios. A ratio falling outside the prescribed “usual range” isnot considered a failing result. Rather, unusual values are viewed as part of the regulatory early monitoring system. In many cases, it isnot unusual for financially sound companies to have one or more ratios that fall outside the usual range.
Regulators typically investigate or monitor an insurance company if its IRIS ratios fall outside the prescribed usual range forfour or more of the ratios, but each state has the right to inquire about any ratios falling outside the usual range. The inquiriesmade by state insurance regulators into an insurance company’s IRIS ratios can take various forms.
41
Management does not anticipate regulatory action as a result of the 2015 IRIS ratio results. In all instances in prior years,regulators have been satisfied upon follow-up that no regulatory action was required. It is possible that similar results may notoccur in the future.
Insurance Guaranty Associations. Each state has insurance guaranty association laws that require insurance companies doingbusiness in the state to participate in various types of guaranty associations or other similar arrangements. The laws are designedto protect policyholders from losses under insurance policies issued by insurance companies that become impaired or insolvent.Typically, these associations levy assessments, up to prescribed limits, on member insurers on the basis of the member insurer’sproportionate share of the business in the relevant jurisdiction in the lines of business in which the impaired or insolvent insureris engaged. Some jurisdictions permit member insurers to recover assessments that they paid through full or partial premium taxoffsets, usually over a period of years.
Marketing and Sales
State insurance regulators are becoming more active in adopting and enforcing suitability standards with respect to sales offixed, indexed and variable annuities. In particular, the NAIC has adopted a revised Suitability in Annuity Transactions ModelRegulation (“SAT”), which will, if enacted by the states, place new responsibilities upon issuing insurance companies withrespect to the suitability of annuity sales, including responsibilities for training agents. Several states have already enacted lawsbased on the SAT.
Securities Regulation Affecting Insurance Operations
Certain of our insurance subsidiaries sell variable life insurance and variable annuities that are registered with and regulated bythe SEC as securities under the Securities Act of 1933, as amended (the “Securities Act”). These products are issued throughseparate accounts that are registered as investment companies under the Investment Company Act, and are regulated by statelaw. Each separate account is generally divided into sub-accounts, each of which invests in an underlying mutual fund which isitself a registered investment company under the Investment Company Act of 1940, as amended (the “Investment CompanyAct”). Our mutual funds, and in certain states, our variable life insurance and variable annuity products, are subject to filing andother requirements under state securities laws. Federal and state securities laws and regulations are primarily intended to protectinvestors and generally grant broad rulemaking and enforcement powers to regulatory agencies.
Federal Initiatives Affecting Insurance Operations
The U.S. federal government generally does not directly regulate the insurance business. However, the Dodd-Frank Wall StreetReform and Consumer Protection Act (the “Dodd-Frank Act”) established the Federal Stability Oversight Council (“FSOC”),which is authorized to designate non-bank financial companies as systemically significant and accordingly subject suchcompanies to regulation and supervision by the Board of Governors of the Federal Reserve System (the “Federal Reserve”) ifthe FSOC determines that material financial distress at the company or the scope of the company’s activities could pose a threatto the financial stability of the U.S. See “—Financial Reform Legislation and Initiatives–Dodd-Frank Wall Street Reform andConsumer Protection Act” below.
The Dodd-Frank Act also established FIO within the United States Department of the Treasury (“Treasury Department”). Whilenot having a general supervisory or regulatory authority over the business of insurance, the director of this office performsvarious functions with respect to insurance, including serving as a non-voting member of the FSOC, making recommendationsto the FSOC regarding insurers to be designated for more stringent regulation as a non-bank financial entity supervised by theFederal Reserve and representing the U.S. in the negotiation of international insurance agreements with foreign insuranceregulators. The Dodd-Frank Act also required the director of FIO to conduct a study on how to modernize and improve thesystem of insurance regulation in the United States. The director issued that report in December 2013, recommending increasedfederal involvement in certain areas of insurance regulation to improve uniformity, and setting out recommendations in areas ofnear-term reform for the states, including capital and marketplace oversight. The report also recommended that states develop auniform and transparent solvency oversight regime for the transfer of risk to reinsurance captives, and adopt a uniform capitalrequirement for reinsurance captives, including a prohibition on transactions that do not constitute legitimate risk transfer. FIOhas an ongoing charge to monitor all aspects of the insurance industry and will monitor state regulatory developments, includingthose called for in its modernization report and present options for federal involvement if deemed necessary.
Federal legislation and administrative policies in several areas can significantly and adversely affect insurance companies.These areas include federal health care regulation, pension regulation, financial services regulation, federal tax laws relating to
42

life insurance companies and their products and the USA PATRIOT Act of 2001 (the “Patriot Act”) requiring, among otherthings, the establishment of anti-money laundering monitoring programs.
In this regard, from time to time, federal measures are proposed which may significantly affect the insurance business, includingmeasures that would limit antitrust immunity, change the tax treatment of insurance products relative to other financial products,simplify tax-advantaged or tax-exempt savings and retirement vehicles, restructure the corporate income tax provisions, ormodify or eliminate the estate tax as well as proposals related to an optional federal charter for insurance companies. Inaddition, various forms of direct federal regulation of insurance have been proposed in recent years.
Regulation of Investment and Retirement Products and Services
Our investment, asset management and retirement products and services are subject to federal and state tax, securities, fiduciary(including the Employment Retirement Income Security Act (“ERISA”)), insurance and other laws and regulations. The SEC,the Financial Industry Regulatory Authority (“FINRA”), the U.S. Commodities Futures Trading Commission (“CFTC”), statesecurities commissions, state banking and insurance departments and the Department of Labor (“DOL”) and the TreasuryDepartment are the principal regulators that regulate these products and services. The Dodd-Frank Act may also impact ourinvestment, asset management, retirement and securities operations. See “—Financial Reform Legislation and Initiatives—Dodd-Frank Wall Street Reform and Consumer Protection Act” below.
Federal and state securities laws and regulations are primarily intended to protect investors in the securities markets andgenerally grant regulatory agencies broad enforcement and rulemaking powers, including the power to limit or restrict theconduct of business in the event of non-compliance with such laws and regulations. Federal and state securities regulatoryauthorities and FINRA from time to time make inquiries and conduct examinations regarding compliance by us and oursubsidiaries with securities and other laws and regulations.
Securities Regulation with Respect to Certain Insurance and Investment Products and Services
Our variable life insurance, variable annuity and mutual fund products are generally “securities” within the meaning of, andregistered under, the federal securities laws, and are subject to regulation by the SEC and FINRA. Our mutual funds, and incertain states our variable life insurance and variable annuity products, are also “securities” within the meaning of statesecurities laws. As securities, these products are subject to filing and certain other requirements. Sales activities with respect tothese products are generally subject to state securities regulation, which may affect investment advice, sales and relatedactivities for these products.
Some of our subsidiaries issue certain fixed and indexed annuities supported by the company’s general account and/or variable annuitycontracts and variable life insurance policies through the company’s separate accounts. These subsidiaries and their activities in offeringand selling variable insurance and annuity products are subject to extensive regulation under the federal securities laws administered bythe SEC. Some of our separate accounts, as well as mutual funds that we sponsor, are registered as investment companies under theInvestment Company Act, and the units or shares, as applicable, of certain of these investment companies are qualified for sale in someor all states, the District of Columbia and Puerto Rico. Each registered separate account is generally divided into sub-accounts, each ofwhich invests in an underlying mutual fund, which is itself a registered investment company under the Investment Company Act. Inaddition, the variable annuity contracts and variable life insurance policies issued by the separate accounts and certain fixed and indexedannuities supported by some of our insurance subsidiaries’ general accounts, as well as mutual funds we sponsor, are registered with theSEC under the Securities Act. Certain variable contract separate accounts sponsored by our insurance subsidiaries are exempt fromregistration, but may be subject to other provisions of the federal securities laws.
Broker-Dealers and Investment Advisers
Our securities operations, principally conducted by a number of SEC-registered broker-dealers, are subject to federal and statesecurities, commodities and related laws, and are regulated principally by the SEC, the CFTC, state securities authorities, FINRA,the Municipal Securities Rulemaking Board and similar authorities. Agents and employees registered or associated with any of ourbroker-dealer subsidiaries are subject to the Securities Exchange Act of 1934, as amended (the “Exchange Act”) and to regulationand examination by the SEC, FINRA and state securities commissioners. The SEC and other governmental agencies and self-regulatory organizations, as well as state securities commissions in the United States, have the power to conduct administrativeproceedings that can result in censure, fines, cease-and-desist orders or suspension, termination or limitation of the activities of theregulated entity or its employees.
43
Broker-dealers are subject to regulations that cover many aspects of the securities business, including, among other things, salesmethods and trading practices, the suitability of investments for individual customers, the use and safekeeping of customers’funds and securities, capital adequacy, recordkeeping, financial reporting and the conduct of directors, officers and employees.The federal securities laws may also require, upon a change in control, re-approval by shareholders in registered investmentcompanies of the investment advisory contracts governing management of those investment companies, including mutual fundsincluded in annuity products. Investment advisory clients may also need to approve, or consent to, investment advisoryagreements upon a change in control. In addition, broker-dealers are required to make certain monthly and annual filings withFINRA, including monthly FOCUS reports (which include, among other things, financial results and net capital calculations)and annual audited financial statements prepared in accordance with U.S. GAAP.
Pursuant to the Dodd-Frank Act, the SEC is authorized to establish a standard of conduct applicable to brokers and dealerswhereby they would be required to act in the best interest of the customer without regard to the financial or other interest of thebroker or dealer when providing personalized investment advice to retail and other customers. A January 2011 SEC studyacknowledges that the offering of proprietary products would not be a per se violation of any such standard of care and thatbroker-dealers selling proprietary or a limited range of products could be permitted to make certain disclosures about theirlimited product offerings and obtain customer consents or acknowledgments. The SEC has not yet decided whether to proposerules creating a uniform standard of conduct applicable to broker-dealers and investment advisors.
As registered broker-dealers and members of various self-regulatory organizations, our registered broker-dealer subsidiaries aresubject to the SEC’s Uniform Net Capital Rule, which specifies the minimum level of net capital a broker-dealer is required tomaintain and requires a minimum part of its assets to be kept in relatively liquid form. These net capital requirements aredesigned to measure the financial soundness and liquidity of broker-dealers. The uniform net capital rule imposes certainrequirements that may have the effect of preventing a broker-dealer from distributing or withdrawing capital and may requirethat prior notice to the regulators be provided prior to making capital withdrawals. Certain of our broker-dealers are also subjectto the net capital requirements of the CFTC and the various securities and commodities exchanges of which they are members.Compliance with net capital requirements could limit operations that require the intensive use of capital, such as tradingactivities and underwriting, and may limit the ability of our broker-dealer subsidiaries to pay dividends to us.
Some of our subsidiaries are registered as investment advisers under the Investment Advisers Act of 1940, as amended (the“Investment Advisers Act”) and provide advice to registered investment companies, including mutual funds used in our annuityproducts, as well as an array of other institutional and retail clients. The Investment Advisers Act and Investment Company Actmay require that fund shareholders be asked to approve new investment advisory contracts with respect to those registeredinvestment companies upon a change in control of a fund’s adviser. Likewise, the Investment Advisers Act may require thatother clients consent to the continuance of the advisory contract upon a change in control of the adviser. Further, proposals havebeen made that the SEC establish a self-regulatory organization with respect to registered investment advisers, which couldincrease the level of regulatory oversight over such investment advisers.
The commodity futures and commodity options industry in the United States is subject to regulation under the CommodityExchange Act of 1936, as amended (the “Commodity Exchange Act”). The CFTC is charged with the administration of theCommodity Exchange Act and the regulations adopted under that Act. Some of our subsidiaries are registered with the CFTC ascommodity pool operators and commodity trading advisors. Our futures business is also regulated by the National FuturesAssociation.
Employee Retirement Income Security Act ConsiderationsERISA is a comprehensive federal statute that applies to U.S. employee benefit plans sponsored by private employers and laborunions. Plans subject to ERISA include pension and profit sharing plans and welfare plans, including health, life and disabilityplans. Among other things, ERISA imposes reporting and disclosure obligations, prescribes standards of conduct that apply toplan fiduciaries and prohibits transactions known as “prohibited transactions,” such as conflict-of-interest transactions, self-dealing and certain transactions between a benefit plan and a party in interest. ERISA also provides for a scheme of civil andcriminal penalties and enforcement. Our insurance, investment management and retirement businesses provide services toemployee benefit plans subject to ERISA, including limited services under specific contract where we may act as an ERISAfiduciary. We are also subject to ERISA’s prohibited transaction rules for transactions with ERISA plans, which may affect ourability to, or the terms upon which we may, enter into transactions with those plans, even in businesses unrelated to those givingrise to party in interest status. The applicable provisions of ERISA and the Internal Revenue Code are subject to enforcement bythe DOL, the U.S. Internal Revenue Service (“IRS”) and the U.S. Pension Benefit Guaranty Corporation (“PBGC”).
In April 2015, the DOL published a proposed rule that would broaden the definition of “fiduciary” under ERISA and for otherpurposes. The proposal was subject to public comment and we submitted a comment letter to the DOL on July 16, 2015,
44
expressing our views on the proposed rule and participated in a DOL hearing concerning the proposal on August 11, 2015. TheDOL’s final version of the proposed rule is currently under review by the President’s Office of Management and Budget. Wecurrently expect a final rule to be published during the first half of 2016.
As proposed, the rule would expand the circumstances under which providers of investment advice to small plan sponsors, planparticipants and beneficiaries, and IRA investors are deemed to act in a fiduciary capacity. The rule would require suchproviders to act in their clients’ “best interests”, not influenced by any conflicts of interest, including due to the direct or indirectreceipt of compensation. The DOL concurrently proposed a “best interest contract exemption” intended to enable continuationof certain existing industry practices relating to receipt of commissions and other compensation, but the exemption includesconditions and requirements that may make it costly or difficult to rely upon in practice. Although the final outcome of the DOLrulemaking remains uncertain, the proposed rule, if adopted in its current form, would substantially change the legal frameworkwithin which we deliver ERISA plan distribution support and investment education, conduct rollover discussions with planparticipants and beneficiaries, and provide investment advice to IRA owners. While these changes, as proposed, would restrictcertain advisory practices and compensation arrangements that are common in our industry, we believe our experienceproviding retirement and investment products and services in a fiduciary environment positions us well to remain competitive asthe industry adjusts to any final rulemaking from the DOL.
The SEC also has indicated that it may propose rules creating a uniform standard of conduct applicable to broker-dealers andinvestment advisers, which, if adopted may affect the distribution of our products. Should the SEC rules, if adopted, not alignwith any finalized DOL regulations related to conflicts of interest in the provision of investment advice, the distribution of ourproducts could be further complicated.
The DOL has also issued a number of regulations recently, and may issue similar additional regulations, that increase the levelof disclosure that must be provided to plan sponsors and participants. These ERISA disclosure requirements will likely increasethe regulatory and compliance burden on us, resulting in increased costs.
In November 2015, the DOL published a proposed rule that would exempt certain state-sponsored IRA savings plans fromERISA. This rule, if enacted, would enable the growth of state sponsored IRA savings plans for the currently underserved small-employer market, where there has been limited adoption of workplace retirement savings plans. We do not believe this rulewould have a material impact on our business, as the state-sponsored plans would be aimed at workers who do not currentlyparticipate in any workplace retirement plan. On January 19, 2016, we submitted a comment letter to the DOL in which weurged the DOL to withdraw this proposed rule entirely, and instead make it easier for small employers to make traditional401(k) plans available to their workers—an approach that we believe would more effectively address the currently underservedmarket.
Trust Activities Regulation
Voya Institutional Trust Company (“VITC”), our wholly owned subsidiary, was formed in 2014 as a trust bank chartered by theConnecticut Department of Banking and is subject to regulation, supervision and examination by the Connecticut Department ofBanking. VITC is not permitted to, and does not, accept deposits (other than incidental to its trust and custodial activities).VITC’s activities are primarily to serve as trustee or custodian for retirement plans or IRAs.
Voya Investment Trust Co., our wholly owned subsidiary, is a limited purpose trust company chartered with the ConnecticutDepartment of Banking. Voya Investment Trust Co. is not permitted to, and does not, accept deposits (other than incidental toits trust activities). Voya Investment Trust Co.’s activities are primarily to serve as trustee for and manage various collective andcommon trust funds. Voya Investment Trust Co. is subject to regulation, supervision and examination by the ConnecticutBanking Commissioner and is subject to state fiduciary duty laws. In addition, the collective trust funds managed by VoyaInvestment Trust Co. are generally subject to ERISA.
Financial Reform Legislation and Initiatives
Dodd-Frank Wall Street Reform and Consumer Protection ActOn July 21, 2010, President Obama signed into law the Dodd-Frank Act, which effects comprehensive changes to the regulation offinancial services in the United States. The Dodd-Frank Act directs existing and newly-created government agencies and bodies toperform studies and promulgate a multitude of regulations implementing the law, a process that is underway and is expected tocontinue over the next few years. While some studies have already been completed and the rule-making process is well underway,there continues to be significant uncertainty regarding the results of ongoing studies and the ultimate requirements of those regulations
45
that have not yet been adopted. We cannot predict with certainty how the Dodd-Frank Act and such regulations will affect the financialmarkets generally, or impact our business, ratings, results of operations, cash flows or financial condition.
The Dodd-Frank Act created a new agency, the FSOC, which is authorized to subject non-bank financial companies to thesupervision of the Federal Reserve if the FSOC determines that, among other matters, material financial distress at the companyor the scope of the company’s activities could pose risks to the financial stability of the United States. If we were designated bythe FSOC as a systemically significant non-bank financial company subject to supervision by the Federal Reserve, we wouldbecome subject to a comprehensive system of prudential regulation, including minimum capital requirements, liquiditystandards, credit exposure requirements, overall risk management requirements, management interlock prohibitions, arequirement to maintain a plan for rapid and orderly dissolution in the event of severe financial distress, stress testing, andadditional fees and assessments and restrictions on proprietary trading and certain investments. The exact scope andconsequences of these standards and requirements are subject to ongoing rulemaking activity by various federal bankingregulators and therefore are currently unclear. However, this comprehensive system of prudential regulation, if applied to theCompany, would significantly impact the manner in which we operate and could materially and adversely impact theprofitability of one or more of our business lines or the level of capital required to support our activities. In designating non-bank financial companies for heightened prudential regulation by the Federal Reserve, the FSOC considers, among othermatters, their scope, size, and potential impact of their activities on the financial stability of the United States.
In addition, the Dodd-Frank Act contains numerous other provisions, some of which may have an impact on us. These include:
• The FSOC may recommend that state insurance regulators or other regulators apply new or heightened standards andsafeguards for activities or practices we and other insurers or other financial services companies engage in if theFSOC determines that those activities or practices could create or increase the risk that significant liquidity, credit orother problems spread among financial companies. We cannot predict whether any such recommendations will bemade or their effect on our business, results of operations, cash flows or financial condition.
• The Dodd-Frank Act creates a new framework for regulating over-the-counter (“OTC”) derivatives, which mayincrease the costs of hedging and other permitted derivatives trading activity undertaken by us. Under the newregulatory regime and subject to certain exceptions, certain standardized OTC interest rate and credit derivatives mustnow be cleared through a centralized clearinghouse and executed on a centralized exchange or execution facility, andthe CFTC and the SEC may designate additional types of OTC derivatives for mandatory clearing and trade executionrequirements in the future. In addition to mandatory central clearing and trade execution of certain OTC derivatives,market participants like us are or will be (directly or indirectly) subject to regulatory requirements which may includereporting and recordkeeping, and capital and margin requirements. The transition to central clearing and the newregulatory regime governing OTC derivatives (especially margin requirements for non-cleared derivatives) presentspotentially significant business, liquidity and operational risk for us which could materially and adversely impact boththe cost and our ability to effectively hedge various risks, including equity, interest rate, currency and duration riskswithin many of our insurance and annuity products and investment portfolios. In addition, inconsistencies between theDodd-Frank Act regime and parallel regimes in other jurisdictions, such as the EU, may increase costs of hedging orinhibit our ability to access market liquidity in those other jurisdictions.
• The CFTC and SEC jointly adopted final rules, which exempt various products regulated as insurance from thedefinition of “swap” and “security-based swap”. However, the exemption does not extend to certain stable valueproducts issued by insurance companies, which the SEC and CFTC are required to further study to determine whethersuch products should be regulated as swaps or security-based swaps. Pending such determination, stable valueproducts are not subject to the swap provisions of this legislation. However, until further action by the SEC andCFTC, there is uncertainty whether certain stable value products offered by our insurance subsidiaries will beregulated under the Dodd-Frank Act as swaps or security-based swaps, which could adversely affect the profitabilityor marketability of such products.
• The Dodd-Frank Act established FIO within the Treasury Department to be headed by a director appointed by theSecretary of the Treasury. See “—Insurance Regulation—Federal Initiatives Affecting Insurance Operations” above.
• The Dodd-Frank Act includes various securities law reforms that may affect our business practices and the liabilitiesand/or exposures associated therewith. See “—Broker-Dealers and Investment Advisers” above.
Until final regulations are promulgated pursuant to the Dodd-Frank Act, the full impact of the Dodd-Frank Act on ourbusinesses, products, results of operation and financial condition will remain unclear.
46
Other Laws and Regulations
USA Patriot Act
The Patriot Act contains anti-money laundering and financial transparency laws applicable to broker-dealers and other financialservices companies, including insurance companies. The Patriot Act seeks to promote cooperation among financial institutions,regulators and law enforcement entities in identifying parties that may be involved in terrorism or money laundering. Anti-moneylaundering laws outside of the United States contain provisions that may be different, conflicting or more rigorous. Internal practices,procedures and controls are required to meet the increased obligations of financial institutions to identify their customers, watch forand report suspicious transactions, respond to requests for information by regulatory authorities and law enforcement agencies andshare information with other financial institutions.
We are also required to follow certain economic and trade sanctions programs administered by the Office of Foreign AssetControl that prohibit or restrict transactions with suspected countries, their governments and, in certain circumstances, theirnationals. We are also subject to regulations governing bribery and other anti-corruption measures.
Privacy Laws and Regulation
U.S. federal and state laws and regulations require financial institutions, including insurance companies, to protect the security andconfidentiality of personal information and to notify consumers about their policies and practices relating to their collection anddisclosure of consumer information and the protection of the security and confidentiality of that information. The disclosure andsecurity of protected health information is also governed by federal and state laws. In particular, regulations promulgated by the U.S.Department of Health and Human Services regulate the disclosure and use of protected health information by health insurers andothers (including life insurers), the physical and procedural safeguards employed to protect the security of that information and theelectronic transmission of such information. Federal and state laws require notice to affected individuals, law enforcement, regulatorsand others if there is a breach of the security of certain personal information, including social security numbers, and require holders ofcertain personal information to protect the security of the data. Federal regulations require financial institutions to implement effectiveprograms to detect, prevent and mitigate identity theft. Federal and state laws and regulations regulate the ability of financialinstitutions to make telemarketing calls and to send unsolicited e-mail or fax messages to consumers and customers. Federal laws andregulations also regulate the permissible uses of certain types of personal information, including consumer report information. Federaland state governments and regulatory bodies may consider additional or more detailed regulation regarding these subjects.
Environmental Considerations
Our ownership and operation of real property and properties within our commercial mortgage loan portfolio is subject to federal, stateand local environmental laws and regulations. Risks of hidden environmental liabilities and the costs of any required clean-up areinherent in owning and operating real property. Under the laws of certain states, contamination of a property may give rise to a lien onthe property to secure recovery of the costs of clean-up, which could adversely affect the valuation of, and increase the liabilitiesassociated with, the commercial mortgage loans we hold. In several states, this lien has priority over the lien of an existing mortgageagainst such property. In addition, we may be liable, in certain circumstances, as an “owner” or “operator,” for costs of cleaning-upreleases or threatened releases of hazardous substances at a property mortgaged to us under the federal Comprehensive EnvironmentalResponse, Compensation and Liability Act of 1980 and the laws of certain states. Application of various other federal and stateenvironmental laws could also result in the imposition of liability on us for costs associated with environmental hazards.
We routinely conduct environmental assessments prior to closing any new commercial mortgage loans or to taking title to realestate. Although unexpected environmental liabilities can always arise, we seek to minimize this risk by undertaking theseenvironmental assessments and complying with our internal environmental policies and procedures.
Health Care Reform Legislation
In March 2010, the President signed into law the Patient Protection and Affordable Care Act, which was subsequently amendedby the Health Care and Education Reconciliation Act of 2010 (together, the “Health Care Act”).
There is significant uncertainty surrounding the impact of the Health Care Act on insurers which may create risks to productswe offer, including Stop Loss Insurance sold to employers offering self-insured health plans. In addition, should the Treasury
47
Department issue guidance concluding that insurers offering Stop Loss Insurance are considered health care providers, we mayface adverse tax or other financial consequences.
U.S. Supreme Court Decision regarding Same-Sex Marriage
On June 26, 2015, the United States Supreme Court held in Obergefell v. Hodges that same-sex couples have a constitutionalright to marry, and accordingly, marriages between same-sex couples may now be celebrated, and will now be recognized, in all50 states. We expect this decision to result in changes to the administration of retirement and other benefit plans in various U.S.states, although we cannot predict with certainty how these changes will affect our business. In particular, it is possible thatchanges to our tax reporting and withholding systems will be required in order to comply with applicable state tax regulations.
AVAILABLE INFORMATION
We file periodic and current reports, proxy statements and other information with the SEC. Such reports, proxy statements andother information may be obtained through the SEC’s website (www.sec.gov) or by visiting the Public Reference Room of theSEC at 100 F Street, N.E., Washington D.C. 20549 or calling the SEC at 1-800-SEC-0330.
You may also access our press releases, financial information and reports filed with the SEC (for example, our Annual Report onForm 10-K, our Proxy Statement, our Quarterly Reports on Form 10-Q, our Current Reports on Form 8-K and any amendments tothose Forms) online at investors.voya.com. Copies of any documents on our website are available without charge, and reports filedwith or furnished to the SEC will be available as soon as reasonably practicable after they are filed with or furnished to the SEC.The information found on our website is not part of this or any other report filed with or furnished to the SEC.
Item 1A. Risk Factors
We face a variety of risks that are substantial and inherent in our business, including market, liquidity, credit, operational, legal,regulatory and reputational risks. The following are some of the more important factors that could affect our business.
Risks Related to Our Business—General
Continued difficult conditions in the global capital markets and the economy generally have affected and may continue toaffect our business and results of operations.
Our business and results of operations are materially affected by conditions in the global capital markets and the economygenerally. Slowing growth rates globally and the uncertain consequences of changing monetary policies among the world’slarge central banks could create economic disruption, decrease asset prices, increase market volatility and potentially affect theavailability and cost of credit.
Although we carry out business almost exclusively in the United States, we are affected by both domestic and internationalmacroeconomic developments. In the short and medium term, the U.S. market faces difficulties that include persistent weaknessin economic growth, volatility in asset prices and questions surrounding the program announced by the Federal Open MarketCommittee (“FOMC”) of the Federal Reserve to gradually tighten monetary policy. In the longer term, concerns persist aroundthe long-term sustainability of the nation’s debt profile, especially given expectations regarding future entitlement spending andpersistent budget deficits, the effect on the financial system of the significant regulatory changes enacted in the aftermath of the2008-09 financial crisis, and the consequences of increasing Federal legislative gridlock, in particular on tax and fiscal policy.
Internationally, slowing levels of growth in developing markets, in particular in China, could have significant adverseconsequences for the level of global economic activity, and on commodity and other asset markets. In turn, falling commodityand energy prices can give rise to significant dislocations in global credit and currency markets, as the consequences of lowerprices, revenues and asset prices are felt by borrowers and exporters, and in turn creditors and investors. In addition, the Chinesemarket faces concerns surrounding the stability of its credit, equity and real estate markets, and any crisis in these markets couldhave global consequences.
In Europe, although acute concerns regarding the economic and fiscal viability of countries such as Greece have to some extent abated,long-term structural headwinds remain in the Eurozone’s move towards a closer currency, fiscal, economic and monetary union, andsignificant concerns persist regarding the sovereign debt of Greece and certain other Eurozone countries. In recent times, politicalevents have increasingly threatened the cohesiveness of the European Union, and may ultimately result in the cessation or rollback ofthe political and economic integration of Europe that has occurred over the past several decades. In particular, the United Kingdom isexpected to hold a referendum by 2017 on its future role within Europe, the outcome of which could have substantial adverse
48
consequences for the U.K. and European economies. The financial and political turmoil in Europe continues to be a long-term threat toglobal capital markets and remains a challenge to global financial stability. If countries, such as Greece, require additional financialsupport or if their sovereign credit ratings decline further, yields on such sovereign debt may increase, the cost of borrowing mayincrease and the availability of credit may become more limited. Additionally, the possibility of capital market volatility spreadingthrough a highly integrated and interdependent banking system remains elevated. In the event of any default or similar event withrespect to a sovereign issuer, some financial institutions may suffer significant losses for which they would require additional capital,which may not be available.
In 2015, the FOMC began to tighten U.S. monetary policy as it seeks to gradually reverse programs and policies that have, in recentyears, fostered a historically low interest rate environment. The effect of this effort, and the novel mechanism through which theFOMC is implementing it, remains uncertain, and could include increased volatility in debt, equity, currency and commodity markets.As the FOMC moves towards normalizing monetary policy and moving short-term interest rates off of their lower bound, the centralbank may adversely affect prospects for continued economic recovery with little headroom for incremental monetary accommodation.Any increase in interest rates resulting from the FOMC’s monetary policy would generally result in declining values for fixed incomeinvestments, including those we hold in our investment portfolio. A failure to successfully implement a tightening policy, on the otherhand, could lead to a continued persistence of low interest rates and an associated adverse effect on certain of our long-dated liabilitiesand the reserves we are required to hold against them. Our results of operations, investment portfolio and AUM are exposed to theserisks and may be adversely affected as a result.
More generally, the international system has in recent years faced heightened geopolitical risk, most notably in Eastern Europeand the Middle East, but also in Africa and Southeast Asia, and events in any one of these regions could give rise to an increasein market volatility or a decrease in global economic output.
Even in the absence of a market downturn, our insurance, annuity, retirement and investment products, as well as ourinvestment returns and our access to and cost of financing, are sensitive to equity, fixed income, real estate and other marketfluctuations and general economic and political conditions. These fluctuations and conditions could materially and adverselyaffect our results of operations, financial condition and liquidity, including in the following respects:
• We provide a number of insurance, annuity, retirement and investment products that expose us to risks associated withfluctuations in interest rates, market indices, securities prices, default rates, the value of real estate assets, currencyexchange rates and credit spreads. The profitability of many of our insurance, annuity, retirement and investmentproducts depends in part on the value of the general accounts and separate accounts supporting them, which mayfluctuate substantially depending on the foregoing conditions.
• Volatility or downturns in the equity markets can cause a reduction in fee income we earn from managing investmentportfolios for third parties and fee income on certain annuity, retirement and investment products. Because these productsand services generate fees related primarily to the value of AUM, a decline in the equity markets could reduce ourrevenues because of the reduction in the value of the investments we manage.
• A change in market conditions, including prolonged periods of high or low inflation or interest rates, could cause achange in consumer sentiment and adversely affect sales and could cause the actual persistency of these products tovary from their anticipated persistency (the probability that a product will remain in force from one period to the next)and adversely affect profitability. Changing economic conditions or adverse public perception of financial institutionscan influence customer behavior, which can result in, among other things, an increase or decrease in claims, lapses,withdrawals, deposits or surrenders in certain products, any of which could adversely affect profitability.
• An equity market decline, decreases in prevailing interest rates, or a prolonged period of low interest rates could resultin the value of guaranteed minimum benefits contained in certain of our life insurance, annuity and retirementproducts being higher than current account values or higher than anticipated in our pricing assumptions, requiring usto materially increase reserves for such products, and may result in a decrease in customer lapses, thereby increasingthe cost to us. In addition, such a scenario could lead to increased amortization and/or unfavorable unlocking of DACand value of business acquired (“VOBA”).
• Reductions in employment levels of our existing employer customers may result in a reduction in underlyingemployee participation levels, contributions, deposits and premium income for certain of our retirement products.Participants within the retirement plans for which we provide certain services may elect to make withdrawals fromthese plans, or reduce or stop their payroll deferrals to these plans, which would reduce assets under management oradministration and our revenues.
49

• We have significant investment and derivative portfolios that include, among other investments, corporate securities,ABS, equities and commercial mortgages. Economic conditions as well as adverse capital market and creditconditions, interest rate changes, changes in mortgage prepayment behavior or declines in the value of underlyingcollateral will impact the credit quality, liquidity and value of our investment and derivative portfolios, potentiallyresulting in higher capital charges and unrealized or realized losses and decreased investment income. The value ofour investments and derivative portfolios may also be impacted by reductions in price transparency, changes in theassumptions or methodology we use to estimate fair value and changes in investor confidence or preferences, whichcould potentially result in higher realized or unrealized losses and have a material adverse effect on our results ofoperations or financial condition. Market volatility may also make it difficult to value certain of our securities iftrading becomes less frequent.
• Market conditions determine the availability and cost of the reinsurance protection we purchase and may result inadditional expenses for reinsurance or an inability to obtain sufficient reinsurance on acceptable terms, which couldadversely affect the profitability of future business and the availability of capital to support new sales.
• Hedging instruments we use to manage product and other risks might not perform as intended or expected, whichcould result in higher realized losses and unanticipated cash needs to collateralize or settle such transactions. Adversemarket conditions can limit the availability and increase the costs of hedging instruments, and such costs may not berecovered in the pricing of the underlying products being hedged. In addition, hedging counterparties may fail toperform their obligations resulting in unhedged exposures and losses on positions that are not collateralized.
• Regardless of market conditions, certain investments we hold, including privately placed fixed income investments,investments in private equity funds and commercial mortgages, are relatively illiquid. If we need to sell theseinvestments, we may have difficulty selling them in a timely manner or at a price equal to what we could otherwiserealize by holding the investment to maturity.
• We are exposed to interest rate and equity risk based upon the discount rate and expected long-term rate of returnassumptions associated with our pension and other retirement benefit obligations. Sustained declines in long-terminterest rates or equity returns could have a negative effect on the funded status of these plans and/or increase ourfuture funding costs.
• Fluctuations in our operating results and realized and unrealized gains and losses on our investment and derivativeportfolio may impact our tax profile, our ability to optimally utilize tax attributes and our deferred income tax assets.See “Our ability to use beneficial U.S. tax attributes is subject to limitations.”
• A default by any financial institution or by a sovereign could lead to additional defaults by other market participants. Thefailure of a sufficiently large and influential institution could disrupt securities markets or clearance and settlementsystems and lead to a chain of defaults, because the commercial and financial soundness of many financial institutionsmay be closely related as a result of credit, trading, clearing or other relationships. Even the perceived lack ofcreditworthiness of a counterparty may lead to market-wide liquidity problems and losses or defaults by us or by otherinstitutions. This risk is sometimes referred to as “systemic risk” and may adversely affect financial intermediaries, suchas clearing agencies, clearing houses, banks, securities firms and exchanges with which we interact on a daily basis.Systemic risk could have a material adverse effect on our ability to raise new funding and on our business, results ofoperations, financial condition, liquidity and/or business prospects. In addition, such a failure could impact future productsales as a potential result of reduced confidence in the financial services industry. Regulatory changes implemented toaddress systemic risk could also cause market participants to curtail their participation in certain market activities, whichcould decrease market liquidity and increase trading and other costs.
• Widening credit spreads, if not offset by equal or greater declines in the risk-free interest rate, would also cause thetotal interest rate payable on newly issued securities to increase, and thus would have the same effect as an increase inunderlying interest rates with respect to the valuation of our current portfolio.
Adverse capital and credit market conditions may impact our ability to access liquidity and capital, as well as the cost ofcredit and capital.
Adverse capital market conditions may affect the availability and cost of borrowed funds, thereby impacting our ability tosupport or grow our businesses. We need liquidity to pay our operating expenses, interest on our debt and dividends on ourcapital stock, to carry out any share repurchases that we may undertake, to maintain our securities lending activities, to
50
collateralize certain obligations with respect to our indebtedness, and to replace certain maturing liabilities. Without sufficientliquidity, we will be forced to curtail our operations and our business will suffer. As a holding company with no directoperations, our principal assets are the capital stock of our subsidiaries.
Payments of dividends and advances or repayment of funds to us by our insurance subsidiaries are restricted by the applicablelaws and regulations of their respective jurisdictions, including laws establishing minimum solvency and liquidity thresholds.
For our insurance and other subsidiaries, the principal sources of liquidity are insurance premiums and fees, annuity depositsand cash flow from investments and assets. At the holding company level, sources of liquidity in normal markets also include avariety of short-term liquid investments and short-and long-term instruments, including credit facilities, equity securities andmedium-and long-term debt.
In the event current resources do not satisfy our needs, we may have to seek additional financing. The availability of additionalfinancing will depend on a variety of factors such as market conditions, the general availability of credit, the volume of tradingactivities, the overall availability of credit to the financial services industry and our credit ratings and credit capacity, as well as thepossibility that customers or lenders could develop a negative perception of our long- or short-term financial prospects. Similarly,our access to funds may be limited if regulatory authorities or rating agencies take negative actions against us. If our internalsources of liquidity prove to be insufficient, there is a risk that we may not be able to successfully obtain additional financing onfavorable terms, or at all. Any actions we might take to access financing may cause rating agencies to reevaluate our ratings.
Disruptions, uncertainty or volatility in the capital and credit markets, such as that experienced over the past few years, may alsolimit our access to capital. Such market conditions may in the future limit our ability to raise additional capital to support businessgrowth, or to counter-balance the consequences of losses or increased regulatory reserves and rating agency capital requirements.This could force us to (1) delay raising capital, (2) reduce, cancel or postpone interest payments on our debt or reduce or eliminatedividends paid on our capital stock, (3) issue capital of different types or under different terms than we would otherwise or (4) incura higher cost of capital than would prevail in a more stable market environment. This would have the potential to decrease both ourprofitability and our financial flexibility. Our results of operations, financial condition, liquidity, statutory capital and rating agencycapital position could be materially and adversely affected by disruptions in the financial markets.
The level of interest rates may adversely affect our profitability, particularly in the event of a continuation of the current lowinterest rate environment or a period of rapidly increasing interest rates.
Interest rates have remained at historical lows for an extended period and, although the Federal Reserve has recently moved tomarginally increase short-term interest rates, medium- and long-term interest rates have remained at historically low levels. Inaddition, central banks in Europe and Japan have recently pursued largely unprecedented negative interest rate policies, theconsequences of which are uncertain.
During periods of declining interest rates or a prolonged period of low interest rates, life insurance and annuity products may berelatively more attractive to consumers due to minimum guarantees that are frequently mandated by regulators, resulting in increasedpremium payments on products with flexible premium features and a higher percentage of insurance and annuity contracts remaining inforce from year-to-year than we anticipated in our pricing, potentially resulting in greater claims costs than we expected and asset/liability cash flow mismatches. A decrease in interest rates or a prolonged period of low interest rates may also require additionalprovisions for guarantees included in life insurance and annuity contracts, as the guarantees become more valuable to policyholders.During a period of decreasing interest rates or a prolonged period of low interest rates, our investment earnings may decrease becausethe interest earnings on our recently purchased fixed income investments will likely have declined in parallel with market interest rates.In addition, a prolonged low interest rate period may result in higher costs for certain derivative instruments that may be used to hedgecertain of our product risks. RMBS and callable fixed income securities in our investment portfolios will be more likely to be prepaid orredeemed as borrowers seek to borrow at lower interest rates. Consequently, we may be required to reinvest the proceeds in securitiesbearing lower interest rates. Accordingly, during periods of declining interest rates, our profitability may suffer as the result of adecrease in the spread between interest rates credited to policyholders and contract owners and returns on our investment portfolios. Anextended period of declining or prolonged low interest rates or a prolonged period of low interest rates may also cause us to change ourlong-term view of the interest rates that we can earn on our investments. Such a change in our view would cause us to change the long-term interest rate that we assume in our calculation of insurance assets and liabilities under U.S. GAAP. This revision would result inincreased reserves, accelerated amortization of DAC and other unfavorable consequences. In addition, certain statutory capital andreserve requirements are based on formulas or models that consider interest rates, and an extended period of low interest rates mayincrease the statutory capital we are required to hold and the amount of assets we must maintain to support statutory reserves.
51
We believe a continuation of the current low interest rate environment would negatively affect our financial performance. Inparticular, we estimate that, if the ten-year Treasury yield were to remain at the levels prevailing at the time of filing this AnnualReport on Form 10-K (approximately 1.8%) through the end of 2019, and assuming other benchmark Treasury yields were also toremain at their currently prevailing levels through the end of 2019 (we refer to this scenario as the “Flat Rate Scenario”), aggregatepre-tax operating earnings across our five ongoing business segments would be approximately 2% to 5% lower, as compared to ourcurrent expectations, in each of 2016, 2017, 2018, and 2019. In addition, we expect that a continuation of the current low interestrate environment would reduce our total company estimated combined RBC ratio in an amount that could be material. Morespecifically, we estimate that the cumulative effect of the Flat Rate Scenario over the four-year period from 2016 to 2019 would bea decline in our combined RBC ratio by approximately 50 RBC percentage points by the end of that period, as compared to ourcurrent expectations.
Conversely, in periods of rapidly increasing interest rates, policy loans, withdrawals from, and/or surrenders of, life insurance andannuity contracts and certain GICs may increase as policyholders choose to seek higher investment returns. Obtaining cash to satisfythese obligations may require us to liquidate fixed income investments at a time when market prices for those assets are depressedbecause of increases in interest rates. This may result in realized investment losses. Regardless of whether we realize an investmentloss, such cash payments would result in a decrease in total invested assets and may decrease our net income and capitalization levels.Premature withdrawals may also cause us to accelerate amortization of DAC, which would also reduce our net income. An increase inmarket interest rates could also have a material adverse effect on the value of our investment portfolio by, for example, decreasing theestimated fair values of the fixed income securities within our investment portfolio. An increase in market interest rates could alsocreate a significant collateral posting requirement associated with our interest rate hedge programs and Federal Home Loan Bankfunding agreements, which could materially and adversely affect liquidity. In addition, an increase in market interest rates couldrequire us to pay higher interest rates on debt securities we may issue in the financial markets from time to time to finance ouroperations, which would increase our interest expenses and reduce our results of operations. An increase in interest rates could result indecreased fee income associated with a decline in the value of variable annuity account balances invested in fixed income funds, whichalso might affect the value of the underlying guarantees within these variable annuities. Lastly, certain statutory reserve requirementsare based on formulas or models that consider forward interest rates and an increase in forward interest rates may increase the statutoryreserves we are required to hold thereby reducing statutory capital.
Changes in prevailing interest rates may negatively affect our business including the level of net interest margin we earn. In a period ofchanging interest rates, interest expense may increase and interest credited to policyholders may change at different rates than theinterest earned on assets. Accordingly, changes in interest rates could decrease net interest margin. Changes in interest rates maynegatively affect the value of our assets and our ability to realize gains or avoid losses from the sale of those assets, all of which alsoultimately affect earnings. In addition, our insurance and annuity products and certain of our retirement and investment products aresensitive to inflation rate fluctuations. A sustained increase in the inflation rate in our principal markets may also negatively affect ourbusiness, financial condition and results of operation. For example, a sustained increase in the inflation rate may result in an increase innominal market interest rates. A failure to accurately anticipate higher inflation and factor it into our product pricing assumptions mayresult in mispricing of our products, which could materially and adversely impact our results of operations.
A downgrade or a potential downgrade in our financial strength or credit ratings could result in a loss of business andadversely affect our results of operations and financial condition.
Ratings are important to our business. Credit ratings represent the opinions of rating agencies regarding an entity’s ability torepay its indebtedness. Our credit ratings are important to our ability to raise capital through the issuance of debt and to the costof such financing. Financial strength ratings, which are sometimes referred to as “claims-paying” ratings, represent the opinionsof rating agencies regarding the financial ability of an insurance company to meet its obligations under an insurance policy.Financial strength ratings are important factors affecting public confidence in insurers, including our insurance companysubsidiaries. The financial strength ratings of our insurance subsidiaries are important to our ability to sell our products andservices to our customers. Ratings are not recommendations to buy our securities. Each of the rating agencies reviews its ratingsperiodically, and our current ratings may not be maintained in the future.
Our ratings could be downgraded at any time and without notice by any rating agency. For a description of material rating actionsthat have occurred from the end of 2014 through the date of this Annual Report on Form 10-K, see “Item 7. Management’sDiscussion and Analysis of Financial Condition and Results of Operations—Liquidity and Capital Resources—Ratings.”
A downgrade of the financial strength rating of one of our Principal Insurance Subsidiaries could affect our competitive position bymaking it more difficult for us to market our products as potential customers may select companies with higher financial strengthratings and by leading to increased withdrawals by current customers seeking companies with higher financial strength ratings.
52

This could lead to a decrease in AUM and result in lower fee income. Furthermore, sales of assets to meet customer withdrawaldemands could also result in losses, depending on market conditions. In addition, a downgrade in either our financial strength orcredit ratings could potentially, among other things, increase our borrowing costs and make it more difficult to access financing;adversely affect the availability of LOCs and other financial guarantees; result in additional collateral requirements, or otherrequired payments or termination rights under derivative contracts or other agreements; and/or impair, or cause the termination of,our relationships with creditors, broker-dealers, distributors, reinsurers or trading counterparties, which could potentially negativelyaffect our profitability, liquidity and/or capital. In addition, we use assumptions of market participants in estimating the fair valueof our liabilities, including insurance liabilities that are classified as embedded derivatives under U.S. GAAP. These assumptionsinclude our nonperformance risk (i.e., the risk that the obligations will not be fulfilled). Therefore, changes in our credit or financialstrength ratings may affect the fair value of our liabilities.
As rating agencies continue to evaluate the financial services industry, it is possible that rating agencies will heighten the levelof scrutiny that they apply to financial institutions, increase the frequency and scope of their credit reviews, request additionalinformation from the companies that they rate and potentially adjust upward the capital and other requirements employed in therating agency models for maintenance of certain ratings levels. It is possible that the outcome of any such review of us wouldhave additional adverse ratings consequences, which could have a material adverse effect on our results of operations, financialcondition and liquidity. We may need to take actions in response to changing standards or capital requirements set by any of therating agencies which could cause our business and operations to suffer. We cannot predict what additional actions ratingagencies may take, or what actions we may take in response to the actions of rating agencies.
Certain of our securities continue to be guaranteed by ING Group. A downgrade of the credit ratings of ING Group could resultin downgrades of these securities, as occurred during the second quarter of 2015, when Moody’s downgraded these guaranteedsecurities from A3 to Baa1. For information on additional collateral requirements in case of a downgrade of our, or INGGroup’s ratings, see “Item 7. Management’s Discussion and Analysis of Financial Condition and Results of Operations—Liquidity and Capital Resources—Potential Impact of a Ratings Downgrade”.
Because we operate in highly competitive markets, we may not be able to increase or maintain our market share, which mayhave an adverse effect on our results of operations.
In each of our businesses we face intense competition, including from domestic and foreign insurance companies, broker-dealers, financial advisors, asset managers and diversified financial institutions, banks, technology companies and start-upfinancial services providers, both for the ultimate customers for our products and for distribution through independentdistribution channels. We compete based on a number of factors including brand recognition, reputation, quality of service,quality of investment advice, investment performance of our products, product features, scope of distribution, price, perceivedfinancial strength and credit ratings, scale and level of customer service. A decline in our competitive position as to one or moreof these factors could adversely affect our profitability. In addition, we may in the future sacrifice our competitive or marketposition in order to improve our profitability. Many of our competitors are large and well-established and some have greatermarket share or breadth of distribution, offer a broader range of products, services or features, assume a greater level of risk,have greater financial resources, or have higher claims-paying or credit ratings than we do. Furthermore, the preferences of theend consumers for our products and services may shift, including as a result of technological innovations affecting themarketplaces in which we operate. To the extent our competitors are more successful than we are at adopting new technologyand adapting to the changing preferences of the marketplace, our competitiveness may decline.
In recent years, there has been substantial consolidation among companies in the financial services industry resulting in increasedcompetition from large, well-capitalized financial services firms. Future economic turmoil may accelerate additional consolidationactivity. Many of our competitors also have been able to increase their distribution systems through mergers, acquisitions,partnerships or other contractual arrangements. Furthermore, larger competitors may have lower operating costs and have an abilityto absorb greater risk, while maintaining financial strength ratings, allowing them to price products more competitively. Thesecompetitive pressures could result in increased pressure on the pricing of certain of our products and services, and could harm ourability to maintain or increase profitability. In addition, if our financial strength and credit ratings are lower than our competitors,we may experience increased surrenders and/or a significant decline in sales. The competitive landscape in which we operate maybe further affected by the government sponsored programs or regulatory changes in the United States and similar governmentalactions outside of the United States. Competitors that receive governmental financing, guarantees or other assistance, or that are notsubject to the same regulatory constraints, may have or obtain pricing or other competitive advantages. Due to the competitivenature of the financial services industry, there can be no assurance that we will continue to effectively compete within the industryor that competition will not have a material adverse impact on our business, results of operations and financial condition.
53
Our risk management policies and procedures, including hedging programs, may prove inadequate for the risks we face,which could negatively affect our business or result in losses.
We have developed risk management policies and procedures, including hedging programs, that utilize derivative financialinstruments, and expect to continue to do so in the future. Nonetheless, our policies and procedures to identify, monitor and managerisks may not be fully effective, particularly during turbulent economic conditions. Many of our methods of managing risk andexposures are based upon observed historical market behavior or statistics based on historical models. As a result, these methodsmay not predict future exposures, which could be significantly greater than historical measures indicate. Other risk managementmethods depend on the evaluation of information regarding markets, customers, catastrophe occurrence or other matters that ispublicly available or otherwise accessible to us. This information may not always be accurate, complete, up-to-date or properlyevaluated. Management of operational, legal and regulatory risks requires, among other things, policies and procedures to recordand verify large numbers of transactions and events. These policies and procedures may not be fully effective.
Recently, central monetary authorities in Japan and Europe have adopted negative interest rate policies, and the FOMC has not ruledout the possibility that it may in the future adopt such policies in the United States. Because of the novelty that negative interest rateswould present, it is possible that such rates would adversely affect the functionality of our actuarial, risk and other models. This couldlead to disruptions in our hedging and other risk management programs, or have other unforeseen consequences.
We employ various strategies, including hedging and reinsurance, with the objective of mitigating risks inherent in our businessand operations. These risks include current or future changes in the fair value of our assets and liabilities, current or futurechanges in cash flows, the effect of interest rates, equity markets and credit spread changes, the occurrence of credit defaults,currency fluctuations and changes in mortality and longevity. We seek to control these risks by, among other things, enteringinto reinsurance contracts and derivative instruments, such as swaps, options, futures and forward contracts. See“—Reinsurance subjects us to the credit risk of reinsurers and may not be available, affordable or adequate to protect us againstlosses” for a description of risks associated with our use of reinsurance. Developing an effective strategy for dealing with theserisks is complex, and no strategy can completely insulate us from such risks. Our hedging strategies also rely on assumptionsand projections regarding our assets, liabilities, general market factors, and the creditworthiness of our counterparties that mayprove to be incorrect or prove to be inadequate. Accordingly, our hedging activities may not have the desired beneficial impacton our results of operations or financial condition. Hedging strategies involve transaction costs and other costs, and if weterminate a hedging arrangement, we may also be required to pay additional costs, such as transaction fees or breakage costs.We may incur losses on transactions after taking into account our hedging strategies. In particular, certain of our hedgingstrategies focus on the protection of regulatory and rating agency capital, rather than U.S. GAAP earnings. Because ourregulatory capital and rating agency capital react differently to market movements than our Variable Annuity Guarantee HedgeProgram target, we have executed a Capital Hedge Overlay program to generally target these differences. As U.S. GAAPaccounting differs from the methods used to determine regulatory reserves and rating agency capital requirements, our hedgeprograms may create earnings volatility in our U.S. GAAP financial statements. Further, the nature, timing, design or executionof our hedging transactions could actually increase our risks and losses. Our hedging strategies and the derivatives that we use,or may use in the future, may not adequately mitigate or offset the hedged risk and our hedging transactions may result in losses.
Past or future misconduct by our employees, agents, intermediaries, representatives of our broker-dealer subsidiaries or employeesof our vendors could result in violations of law by us or our subsidiaries, regulatory sanctions and/or serious reputational orfinancial harm and the precautions we take to prevent and detect this activity may not be effective in all cases. Although we employcontrols and procedures designed to monitor associates’ business decisions and to prevent us from taking excessive or inappropriaterisks, associates may take such risks regardless of such controls and procedures. Our compensation policies and practices arereviewed by us as part of our overall risk management program, but it is possible that such compensation policies and practicescould inadvertently incentivize excessive or inappropriate risk taking. If our associates take excessive or inappropriate risks, thoserisks could harm our reputation and have a material adverse effect on our results of operations and financial condition.
The inability of counterparties to meet their financial obligations could have an adverse effect on our results of operations.
Third parties that owe us money, securities or other assets may not pay or perform under their obligations. These parties include theissuers or guarantors of securities we hold, customers, reinsurers, trading counterparties, securities lending and repurchasecounterparties, counterparties under swaps, credit default and other derivative contracts, clearing agents, exchanges, clearing housesand other financial intermediaries. Defaults by one or more of these parties on their obligations to us due to bankruptcy, lack ofliquidity, downturns in the economy or real estate values, operational failure or other factors, or even rumors about potential defaultsby one or more of these parties, could have a material adverse effect on our results of operations, financial condition and liquidity.
54
We routinely execute a high volume of transactions such as unsecured debt instruments, derivative transactions and equityinvestments with counterparties and customers in the financial services industry, including broker-dealers, commercial andinvestment banks, mutual and hedge funds, institutional clients, futures clearing merchants, swap dealers, insurance companiesand other institutions, resulting in large periodic settlement amounts which may result in our having significant credit exposureto one or more of such counterparties or customers. Many of these transactions comprise derivative instruments with a numberof counterparties in order to hedge various risks, including equity and interest rate market risk features within many of ourinsurance and annuity products. Our obligations under our products are not changed by our hedging activities and we are liablefor our obligations even if our derivative counterparties do not pay us. As a result, we face concentration risk with respect toliabilities or amounts we expect to collect from specific counterparties and customers. A default by, or even concerns about thecreditworthiness of, one or more of these counterparties or customers could have an adverse effect on our results of operationsor liquidity. There is no assurance that losses on, or impairments to the carrying value of, these assets due to counterparty creditrisk would not materially and adversely affect our business, results of operations or financial condition.
We are also subject to the risk that our rights against third parties may not be enforceable in all circumstances. The deteriorationor perceived deterioration in the credit quality of third parties whose securities or obligations we hold could result in losses and/or adversely affect our ability to rehypothecate or otherwise use those securities or obligations for liquidity purposes. While inmany cases we are permitted to require additional collateral from counterparties that experience financial difficulty, disputesmay arise as to the amount of collateral we are entitled to receive and the value of pledged assets. Our credit risk may also beexacerbated when the collateral we hold cannot be realized or is liquidated at prices not sufficient to recover the full amount ofthe loan or derivative exposure that is due to us, which is most likely to occur during periods of illiquidity and depressed assetvaluations, such as those experienced during the financial crisis of 2008-09. The termination of contracts and the foreclosure oncollateral may subject us to claims for the improper exercise of rights under the contracts. Bankruptcies, downgrades anddisputes with counterparties as to the valuation of collateral tend to increase in times of market stress and illiquidity.
Requirements to post collateral or make payments related to changes in market value of specified assets may adversely affectliquidity.
The amount of collateral we may be required to post under short-term financing agreements and derivative transactions mayincrease under certain circumstances. Pursuant to the terms of some transactions, we could be required to make payment to ourcounterparties related to any change in the market value of the specified collateral assets. Such requirements could have anadverse effect on liquidity. Furthermore, with respect to any such payments, we may have unsecured risk to the counterparty asthese amounts may not be required to be segregated from the counterparty’s other funds, may not be held in a third-partycustodial account and may not be required to be paid to us by the counterparty until the termination of the transaction.Additionally, the implementation of the Dodd-Frank Act and the resultant changes in collateral requirements may increase theneed for liquidity and eligible collateral assets in excess of what is already being held.
For a discussion on certain obligations we have with respect to the posting of collateral upon the occurrence of certain events,see “Item 7. Management’s Discussion and Analysis of Financial Condition and Results of Operations—Liquidity and CapitalResources—Potential Impact of a Ratings Downgrade.”
Our investment portfolio is subject to several risks that may diminish the value of our invested assets and the investmentreturns credited to customers, which could reduce our sales, revenues, AUM and results of operations.
Fixed income securities represent a significant portion of our investment portfolio. We are subject to the risk that the issuers, orguarantors, of fixed income securities we own may default on principal and interest payments they owe us. We are also subject to therisk that the underlying collateral within asset-backed securities, including mortgage-backed securities, may default on principal andinterest payments causing an adverse change in cash flows. The occurrence of a major economic downturn, acts of corporatemalfeasance, widening mortgage or credit spreads, or other events that adversely affect the issuers, guarantors or underlying collateralof these securities could cause the estimated fair value of our fixed income securities portfolio and our earnings to decline and thedefault rate of the fixed income securities in our investment portfolio to increase. A ratings downgrade affecting issuers or guarantorsof securities in our investment portfolio, or similar trends that could worsen the credit quality of such issuers, or guarantors could alsohave a similar effect. Similarly, a ratings downgrade affecting a security we hold could indicate the credit quality of that security hasdeteriorated and could increase the capital we must hold to support that security to maintain our RBC ratio. See “A decrease in theRBC ratio (as a result of a reduction in statutory surplus and/or increase in RBC requirements) of our insurance subsidiaries couldresult in increased scrutiny by insurance regulators and rating agencies and have a material adverse effect on our business, results ofoperations and financial condition.” We are also subject to the risk that cash flows resulting from the payments on pools of mortgagesthat serve as collateral underlying the mortgage-backed securities we own may differ from our expectations in timing or size. Cashflow variability arising from an unexpected acceleration in mortgage prepayment behavior can be significant, and could cause a
55
decline in the estimated fair value of certain “interest-only” securities within our mortgage-backed securities portfolio. Any eventreducing the estimated fair value of these securities, other than on a temporary basis, could have a material adverse effect on ourbusiness, results of operations and financial condition.
We derive operating revenues from providing investment management and related services. Our revenues depend largely on thevalue and mix of AUM. Our investment management related revenues are derived primarily from fees based on a percentage ofthe value of AUM. Any decrease in the value or amount of our AUM because of market volatility or other factors negativelyimpacts our revenues and income. Global economic conditions, changes in the equity markets, currency exchange rates, interestrates, inflation rates, the yield curve, defaults by derivative counterparties and other factors that are difficult to predict affect themix, market values and levels of our AUM. The funds we manage may be subject to an unanticipated large number ofredemptions as a result of such events, causing the funds to sell securities they hold, possibly at a loss, or draw on any availablelines of credit to obtain cash, or use securities held in the applicable fund, to settle these redemptions. We may, in our discretion,also provide financial support to a fund to enable it to maintain sufficient liquidity in such an event. Additionally, changingmarket conditions may cause a shift in our asset mix towards fixed-income products and a related decline in our revenue andincome, as we generally derive higher fee revenues and income from equity products than from fixed-income products wemanage. Any decrease in the level of our AUM resulting from price declines, interest rate volatility or uncertainty, increasedredemptions or other factors could negatively impact our revenues and income.
From time to time we invest our capital to seed a particular investment strategy or investment portfolio. We may also co-investin funds or take an equity ownership interest in certain structured finance/investment vehicles that we manage for ourcustomers. Any decrease in the value of such investments could negatively affect our revenues and income.
Our investment performance is critical to the success of our investment management and related services business, as well as tothe profitability of our insurance, annuity and retirement products. Poor investment performance as compared to third-partybenchmarks or competitor products could lead to a decrease in sales of investment products we manage and lead to redemptionsfrom existing products, generally lowering the overall level of AUM and reducing the management fees we earn. We cannotassure you that past or present investment performance in the investment products we manage will be indicative of futureperformance. Any poor investment performance may negatively impact our revenues and income.
Some of our investments are relatively illiquid and in some cases are in asset classes that have been experiencing significantmarket valuation fluctuations.
We hold certain assets that may lack liquidity, such as privately placed fixed income securities, commercial mortgage loans,policy loans and limited partnership interests. These asset classes represented 29.6% of the carrying value of our total cash andinvested assets as of December 31, 2015. If we require significant amounts of cash on short notice in excess of normal cashrequirements or are required to post or return collateral in connection with our investment portfolio, derivatives transactions orsecurities lending activities, we may have difficulty selling these investments in a timely manner, be forced to sell them for lessthan we otherwise would have been able to realize, or both.
The reported values of our relatively illiquid types of investments do not necessarily reflect the current market price for theasset. If we were forced to sell certain of our assets in the current market, there can be no assurance that we would be able to sellthem for the prices at which we have recorded them and we might be forced to sell them at significantly lower prices.
We invest a portion of our invested assets in investment funds, many of which make private equity investments. The amountand timing of income from such investment funds tends to be uneven as a result of the performance of the underlyinginvestments, including private equity investments. The timing of distributions from the funds, which depends on particularevents relating to the underlying investments, as well as the funds’ schedules for making distributions and their needs for cash,can be difficult to predict. As a result, the amount of income that we record from these investments can vary substantially fromquarter to quarter. Recent equity and credit market volatility may reduce investment income for these types of investments.
Our CMO-B portfolio exposes us to market and behavior risks.
We manage a portfolio of various collateralized mortgage obligation (“CMO”) tranches in combination with financial derivatives aspart of a proprietary strategy we refer to as “CMO-B,” as described under “Investments—CMO-B Portfolio.” As of December 31,2015, our CMO-B portfolio had $3.6 billion in total assets, consisting of notional or principal securities backed by mortgages securedby single-family residential real estate, and including interest-only securities, principal-only securities, inverse-floating rate (principal)securities and inverse interest-only securities. The CMO-B portfolio is subject to a number of market and behavior risks, includinginterest rate risk and prepayment risk. Interest rate risk represents the potential for adverse changes in portfolio value resulting from
56
changes in the general level of interest rates. Prepayment risk represents the potential for adverse changes in portfolio value resultingfrom changes in residential mortgage prepayment speed, which in turn depends on a number of factors, including conditions in bothcredit markets and housing markets. As of December 31, 2015, December 31, 2014 and December 31, 2013, approximately 49.3%,44.4%, and 38.3%, respectively, of the Company’s total CMO holdings were invested in those types of CMOs, such as interest-only orprincipal-only strips, which are subject to more prepayment and extension risk than traditional CMOs. In addition, government policychanges affecting residential housing and residential housing finance, such as government agency reform and government sponsoredrefinancing programs, and Federal Reserve Bank purchases of agency mortgage securities could alter prepayment behavior and resultin adverse changes to portfolio values. While we actively monitor our exposure to these and other risks inherent in this strategy, wecannot assure you that our hedging and risk management strategies will be effective; any failure to manage these risks effectivelycould materially and adversely affect our results of operations and financial condition. In addition, although our CMO-B portfolioperformed well for a number of years, and particularly well since the financial crisis of 2008-09, primarily due to persistently lowlevels of short-term interest rates and mortgage prepayments in an atmosphere of tightened housing-related credit availability, thisportfolio may not continue to perform as well in the future. A rise in home prices, the concern over further introduction of or changesto government policies aimed at altering prepayment behavior, and an increased availability of housing-related credit could combine toincrease expected or actual prepayment speeds, which would likely lower interest only (“IO”) and inverse IO valuations. Under thesecircumstances, the results of our CMO-B portfolio would likely underperform those of recent periods.
Defaults or delinquencies in our commercial mortgage loan portfolio may adversely affect our profitability.
The commercial mortgage loans we hold face both default and delinquency risk. We establish loan specific estimatedimpairments at the balance sheet date. These impairments are based on the excess carrying value of the loan over the presentvalue of expected future cash flows discounted at the loan’s original effective interest rate, the estimated fair value of the loan’scollateral if the loan is in the process of foreclosure or otherwise collateral dependent, or the loan’s observable market price. Wealso establish valuation allowances for loan losses when, based on past experience, it is probable that a credit event has occurredand the amount of the loss can be reasonably estimated. These valuation allowances are based on loan risk characteristics,historical default rates and loss severities, real estate market fundamentals and outlook as well as other relevant factors. As ofDecember 31, 2015, our commercial loan portfolio included $3.1 million of commercial loans that were 30 days or less pastdue, and no commercial mortgage loans in process of foreclosure. The performance of our commercial mortgage loaninvestments may fluctuate in the future. In addition, legislative proposals that would allow or require modifications to the termsof commercial mortgage loans could be enacted. We cannot predict whether these proposals will be adopted, or what impact, ifany, such laws, if enacted, could have on our business or investments. An increase in the delinquency and default rate of ourcommercial mortgage loan portfolio could adversely impact our results of operations and financial condition.
Further, any geographic or sector concentration of our commercial mortgage loans may have adverse effects on our investmentportfolios and consequently on our results of operations or financial condition. While we generally seek to mitigate the risk ofsector concentration by having a broadly diversified portfolio, events or developments that have a negative effect on anyparticular geographic region or sector may have a greater adverse effect on the investment portfolios to the extent that theportfolios are concentrated, which could affect our results of operations and financial condition.
In addition, liability under environmental protection laws resulting from our commercial mortgage loan portfolio and real estateinvestments could affect our results of operations or financial condition. Under the laws of several states, contamination of aproperty may give rise to a lien on the property to secure recovery of the costs of cleanup. In some states, such a lien has priorityover the lien of an existing mortgage against the property, which would impair our ability to foreclose on that property shouldthe related loan be in default. In addition, under the laws of some states and under the federal Comprehensive EnvironmentalResponse, Compensation and Liability Act of 1980, we may be liable for costs of addressing releases or threatened releases ofhazardous substances that require remedy at a property securing a mortgage loan held by us, regardless of whether or not theenvironmental damage or threat was caused by the obligor, which could harm our results of operations and financial condition.We also may face this liability after foreclosing on a property securing a mortgage loan held by us.
Our operations are complex and a failure to properly perform services could have an adverse effect on our revenues and income.
Our operations include, among other things, retirement plan administration, policy administration, portfolio management,investment advice, retail and wholesale brokerage, fund administration, shareholder services, benefits processing and servicing,contract and sales and servicing, transfer agency, underwriting, distribution, custodial, trustee and other fiduciary services. Inorder to be competitive, we must properly perform our administrative and related responsibilities, including recordkeeping andaccounting, regulatory compliance, security pricing, corporate actions, compliance with investment restrictions, daily net assetvalue computations, account reconciliations and required distributions to fund shareholders. Further, certain of our investment
57
management subsidiaries may act as general partner for various investment partnerships, which may subject them to liability forthe partnerships’ liabilities. If we fail to properly perform and monitor our operations, our business could suffer and ourrevenues and income could be adversely affected.
Our products and services are complex and are frequently sold through intermediaries, and a failure to properly performservices or the misrepresentation of our products or services could have an adverse effect on our revenues and income.
Many of our products and services are complex and are frequently sold through intermediaries. In particular, our insurancebusinesses are reliant on intermediaries to describe and explain their products to potential customers. The intentional orunintentional misrepresentation of our products and services in advertising materials or other external communications, orinappropriate activities by our personnel or an intermediary, could adversely affect our reputation and business prospects, aswell as lead to potential regulatory actions or litigation.
Revenues, earnings and income from our Investment Management business operations could be adversely affected if theterms of our asset management agreements are significantly altered or the agreements are terminated, or if certainperformance hurdles are not realized.
Our revenues from our investment management business operations are dependent on fees earned under asset management andrelated services agreements that we have with the clients and funds we advise. Operating revenues for this segment were $622.2million for the year ended December 31, 2015, $655.4 million for the year ended December 31, 2014, and $607.7 million for theyear ended December 31, 2013 and could be adversely affected if these agreements are altered significantly or terminated in thefuture. The decline in revenue that might result from alteration or termination of our asset management services agreements couldhave a material adverse impact on our results of operations or financial condition. Operating earnings before income taxes for thissegment were $181.9 million for the year ended December 31, 2015, $210.3 million for the year ended December 31, 2014, and$178.1 million for the year ended December 31, 2013. In addition, under certain laws, most notably the Investment Company Actand the Investment Advisers Act, advisory contracts may require approval or consent from clients or fund shareholders in the eventof an assignment of the contract or a change in control of the investment adviser. Were a transaction to result in an assignment orchange in control, the inability to obtain consent or approval from clients or shareholders of mutual funds or other investment fundscould result in a significant reduction in advisory fees.
As investment manager for certain private equity funds that we sponsor, we earn both a fixed management fee and a performance-based incentive fee, or “carried interest”. Our receipt of performance-based fees is dependent on the fund exceeding a specifiedinvestment return hurdle over the life of the fund. The profitability of our investment management activities with respect to thesefunds depends to a significant extent on our ability to exceed the hurdle rates and receive performance fees. To the extent that weexceed the investment hurdle during the life of the fund, we may receive or accrue performance fees, which are generally reportedas Net investment income and net realized gains (losses) within our Investment Management segment during the period such feesare first earned. If the investment return of a fund were to subsequently decline so that the cumulative return of a fund falls belowits specified investment return hurdle, we may have to reverse previously reported performance fees, which would result in areduction to Net investment income and net realized gains (losses) during the period in which such reversal becomes due.Consequently, a decline in fund performance could require us to reverse previously reported performance fees, which could createvolatility in the results we report in our Investment Management segment, and the adverse effects of any such reversals could bematerial to our results for the period in which they occur. As of December 31, 2015, approximately $54.9 million of previouslyaccrued carried interest would be subject to full or partial reversal in future periods if cumulative fund performance hurdles are notmaintained throughout the remaining life of the affected funds.
The valuation of many of our financial instruments includes methodologies, estimations and assumptions that are subject todiffering interpretations and could result in changes to investment valuations that may materially and adversely affect ourresults of operations and financial condition.
The following financial instruments are carried at fair value in our financial statements: fixed income securities, equity securities,derivatives, embedded derivatives, assets and liabilities related to consolidated investment entities, and separate account assets. Wehave categorized these instruments into a three-level hierarchy, based on the priority of the inputs to the respective valuationtechnique. The fair value hierarchy gives the highest priority to quoted prices in active markets for identical assets or liabilities(Level 1) and the lowest priority to unobservable inputs (Level 3), while quoted prices in markets that are not active or valuationtechniques requiring inputs that are observable for substantially the full term of the asset or liability are Level 2.
Factors considered in estimating fair values of securities, and derivatives and embedded derivatives related to our securitiesinclude coupon rate, maturity, principal paydown including prepayments, estimated duration, call provisions, sinking fund
58

requirements, credit rating, industry sector of the issuer and quoted market prices of comparable securities. Factors consideredin estimating the fair values of embedded derivatives and derivatives related to product guarantees and index-crediting features(collectively, “guaranteed benefit derivatives”) include risk-free interest rates, long-term equity implied volatility, interest rateimplied volatility, correlations among mutual funds associated with variable annuity contracts, correlations between interestrates and equity funds and actuarial assumptions such as mortality rates, lapse rates and benefit utilization, as well as the amountand timing of policyholder deposits and partial withdrawals. The impact of our risk of nonperformance is also reflected in theestimated fair value of guaranteed benefit derivatives. In many situations, inputs used to measure the fair value of an asset orliability may fall into different levels of the fair value hierarchy. In these situations, we will determine the level in which the fairvalue falls based upon the lowest level input that is significant to the determination of the fair value.
The determinations of fair values are made at a specific point in time, based on available market information and judgments aboutfinancial instruments, including estimates of the timing and amounts of expected future cash flows and the credit standing of the issueror counterparty. The use of different methodologies and assumptions may have a material effect on the estimated fair value amounts.
During periods of market disruption, including periods of rapidly changing credit spreads or illiquidity, it has been in the pastand likely would be in the future difficult to value certain of our securities, such as certain mortgage-backed securities, if tradingbecomes less frequent and/or market data becomes less observable. There may be certain asset classes that, although currently inactive markets with significant observable data, could become illiquid in a difficult financial environment. In such cases, moresecurities may fall to Level 3 and thus require more subjectivity and management judgment in determining fair value. As such,valuations may include inputs and assumptions that are less observable or require greater estimation, thereby resulting in valuesthat may differ materially from the value at which the investments may be ultimately sold. Further, rapidly changing andunprecedented credit and equity market conditions could materially impact the valuation of securities as reported within thefinancial statements, and the period-to-period changes in value could vary significantly. Decreases in value could have amaterial adverse effect on our results of operations and financial condition. As of December 31, 2015, 4.4% , 93.2% and 2.4%of our available-for-sale securities were considered to be Level 1, 2 and 3, respectively.
The determination of the amount of allowances and impairments taken on our investments is subjective and could materiallyand adversely impact our results of operations or financial condition. Gross unrealized losses may be realized or result infuture impairments, resulting in a reduction in net income.
We evaluate investment securities held by us for impairment on a quarterly basis. This review is subjective and requires a highdegree of judgment. For fixed income securities held, an impairment loss is recognized if the fair value of the debt security isless than the carrying value and we no longer have the intent to hold the debt security; if it is more likely than not that we willbe required to sell the debt security before recovery of the amortized cost basis; or if a credit loss has occurred.
When we do not intend to sell a security in an unrealized loss position, potential credit related other-than-temporaryimpairments (“OTTI”) are considered using a variety of factors, including the length of time and extent to which the fair valuehas been less than cost, adverse conditions specifically related to the industry, geographic area in which the issuer conductsbusiness, financial condition of the issuer or underlying collateral of a security, payment structure of the security, changes incredit rating of the security by the rating agencies, volatility of the fair value changes and other events that adversely affect theissuer. In addition, we take into account relevant broad market and economic data in making impairment decisions.
As part of the impairment review process, we utilize a variety of assumptions and estimates to make a judgment on how fixedincome securities will perform in the future. It is possible that securities in our fixed income portfolio will perform worse thanour expectations. There is an ongoing risk that further declines in fair value may occur and additional OTTI may be recorded infuture periods, which could materially and adversely affect our results of operations and financial condition. Furthermore,historical trends may not be indicative of future impairments or allowances.
Fixed income and equity securities classified as available-for-sale are reported at their estimated fair value. Unrealized gains or losseson available-for-sale securities are recognized as a component of other comprehensive income (loss) and are therefore excluded fromnet income (loss). The accumulated change in estimated fair value of these available-for-sale securities is recognized in net income(loss) when the gain or loss is realized upon the sale of the security or in the event that the decline in estimated fair value is determinedto be other-than-temporary and an impairment charge to earnings is taken. Such realized losses or impairments may have a materialadverse effect on our net income (loss) in a particular interim or annual period. For example, we recorded OTTI of $117.0 million,$31.6 million, and $35.7 million in net realized capital losses for the years ended December 31, 2015, 2014 and 2013, respectively.
59
Our participation in a securities lending program and a repurchase program subjects us to potential liquidity and other risks.
We engage in a securities lending program whereby certain securities from our portfolio are loaned to other institutions for shortperiods of time. Initial collateral, primarily cash, is required at a rate of 102% of the market value of the loaned securities. Forcertain transactions, a lending agent may be used and the agent may retain some or all of the collateral deposited by theborrower and transfer the remaining collateral to us. Collateral retained by the agent is invested in liquid assets on our behalf.The market value of the loaned securities is monitored on a daily basis with additional collateral obtained or refunded as themarket value of the loaned securities fluctuates.
We also participate in a repurchase agreement program whereby we sell fixed income securities to a third party, primarily majorbrokerage firms or commercial banks, with a concurrent agreement to repurchase those same securities at a determined future date.During the term of the repurchase agreements, cash or other types of permitted collateral provided to us is sufficient to allow us to fundsubstantially all of the cost of purchasing replacement assets in the event of counterparty default (i.e., the sold securities are notreturned to us on the scheduled repurchase date). Cash proceeds received by us under the repurchase program are typically invested infixed income securities but may in certain circumstances be available to us for liquidity or other purposes prior to the scheduledrepurchase date. The repurchase of securities or our inability to enter into new repurchase agreements would reduce the amount ofsuch cash collateral available to us. Market conditions on or after the repurchase date may limit our ability to enter into newagreements at a time when we need access to additional cash collateral for investment or liquidity purposes.
For both securities lending and repurchase transactions, in some cases, the maturity of the securities held as invested collateral (i.e.,securities that we have purchased with cash collateral received) may exceed the term of the related securities on loan and the estimatedfair value may fall below the amount of cash received as collateral and invested. If we are required to return significant amounts ofcash collateral on short notice and we are forced to sell securities to meet the return obligation, we may have difficulty selling suchcollateral that is invested in securities in a timely manner, be forced to sell securities in a volatile or illiquid market for less than weotherwise would have been able to realize under normal market conditions, or both. In addition, under adverse capital market andeconomic conditions, liquidity may broadly deteriorate, which would further restrict our ability to sell securities. If we decrease theamount of our securities lending and repurchase activities over time, the amount of net investment income generated by these activitieswill also likely decline. See “Item 7. Management’s Discussion and Analysis of Financial Condition and Results of Operations—Liquidity and Capital Resources—Securities Lending”.
Differences between actual claims experience and reserving assumptions may adversely affect our results of operations orfinancial condition.
We establish and hold reserves to pay future policy benefits and claims. Our reserves do not represent an exact calculation of liability,but rather are actuarial or statistical estimates based on data and models that include many assumptions and projections, which areinherently uncertain and involve the exercise of significant judgment, including assumptions as to the levels and/or timing of receipt orpayment of premiums, benefits, claims, expenses, interest credits, investment results (including equity market returns), retirement,mortality, morbidity and persistency. We periodically review the adequacy of reserves and the underlying assumptions. We cannot,however, determine with precision the amounts that we will pay for, or the timing of payment of, actual benefits, claims and expensesor whether the assets supporting our policy liabilities, together with future premiums, will grow to the level assumed prior to paymentof benefits or claims. If actual experience differs significantly from assumptions or estimates, reserves may not be adequate. If weconclude that our reserves, together with future premiums, are insufficient to cover future policy benefits and claims, we would berequired to increase our reserves and incur income statement charges for the period in which we make the determination, which couldmaterially and adversely affect our results of operations and financial condition.
We may face significant losses if mortality rates, morbidity rates, persistency rates or other underwriting assumptions differsignificantly from our pricing expectations.
We set prices for many of our insurance and annuity products based upon expected claims and payment patterns, usingassumptions for mortality rates, or likelihood of death, and morbidity rates, or likelihood of sickness, of our policyholders. Inaddition to the potential effect of natural or man-made disasters, significant changes in mortality or morbidity could emergegradually over time due to changes in the natural environment, the health habits of the insured population, technologies andtreatments for disease or disability, the economic environment, or other factors. The long-term profitability of our insurance andannuity products depends upon how our actual mortality rates, and to a lesser extent actual morbidity rates, compare to ourpricing assumptions. In addition, prolonged or severe adverse mortality or morbidity experience could result in increasedreinsurance costs, and ultimately, reinsurers might not offer coverage at all. If we are unable to maintain our current level ofreinsurance or purchase new reinsurance protection in amounts that we consider sufficient, we would have to accept an increasein our net risk exposures, revise our pricing to reflect higher reinsurance premiums, or otherwise modify our product offering.
60
Pricing of our insurance and annuity products is also based in part upon expected persistency of these products, which is theprobability that a policy will remain in force from one period to the next. Persistency of our annuity products may be significantly andadversely impacted by the increasing value of guaranteed minimum benefits contained in many of our variable annuity products due topoor equity market performance or extended periods of low interest rates as well as other factors. The minimum interest rateguarantees in our fixed annuities may also be more valuable in extended periods of low interest rates. Persistency could be adverselyaffected generally by developments adversely affecting customer perception of us. Results may also vary based on differences betweenactual and expected premium deposits and withdrawals for these products. Many of our deferred annuity products also containoptional benefits that may be exercised at certain points within a contract. We set prices for such products using assumptions for therate of election of deferred annuity living benefits and other optional benefits offered to our contract owners. The profitability of ourdeferred annuity products may be less than expected, depending upon how actual contract owner decisions to elect or delay theutilization of such benefits compare to our pricing assumptions. The development of a secondary market for life insurance, includingstranger-owned life insurance, life settlements or “viaticals” and investor-owned life insurance, and the potential development of third-party investor strategies in the annuities business, could also adversely affect the profitability of existing business and our pricingassumptions for new business. Actual persistency that is lower than our persistency assumptions could have an adverse effect onprofitability, especially in the early years of a policy, primarily because we would be required to accelerate the amortization ofexpenses we defer in connection with the acquisition of the policy. Actual persistency that is higher than our persistency assumptionscould have an adverse effect on profitability in the later years of a block of business because the anticipated claims experience is higherin these later years. If actual persistency is significantly different from that assumed in our current reserving assumptions, our reservesfor future policy benefits may prove to be inadequate. Although some of our products permit us to increase premiums or adjust othercharges and credits during the life of the policy, the adjustments permitted under the terms of the policies may not be sufficient tomaintain profitability. Many of our products, however, do not permit us to increase premiums or adjust charges and credits during thelife of the policy or during the initial guarantee term of the policy. Even if permitted under the policy, we may not be able or willing toraise premiums or adjust other charges for regulatory or competitive reasons.
Pricing of our products is also based on long-term assumptions regarding interest rates, investment returns and operating costs.Management establishes target returns for each product based upon these factors, the other underwriting assumptions noted above andthe average amount of regulatory and rating agency capital that we must hold to support in-force contracts. We monitor and managepricing and sales to achieve target returns. Profitability from new business emerges over a period of years, depending on the nature andlife of the product, and is subject to variability as actual results may differ from pricing assumptions. Our profitability depends onmultiple factors, including the comparison of actual mortality, morbidity and persistency rates and policyholder behavior to ourassumptions; the adequacy of investment margins; our management of market and credit risks associated with investments; our abilityto maintain premiums and contract charges at a level adequate to cover mortality, benefits and contract administration expenses; theadequacy of contract charges and availability of revenue from providers of investment options offered in variable contracts to cover thecost of product features and other expenses; and management of operating costs and expenses.
Unfavorable developments in interest rates, credit spreads and policyholder behavior can result in adverse financialconsequences related to our stable value products, and our hedge program and risk mitigation features may not successfullyoffset these consequences.
We offer stable value products primarily as a fixed rate, liquid asset allocation option for employees of our plan sponsorcustomers within the defined contribution funding plans offered by our Retirement business. These products are designed toprovide a guaranteed annual credited rate (currently between zero and three percent) on the invested assets in addition toenabling participants the right to withdraw and transfer funds at book value.
The sensitivity of our statutory reserves and surplus established for the stable value products to changes in interest rates, creditspreads and policyholder behavior will vary depending on the magnitude of these changes, as well as on the book value ofassets, the market value of assets, the guaranteed credited rates available to customers and other product features. Realization orre-measurement of these risks may result in an increase in the reserves for stable value products, and could materially andadversely affect our financial position or results of operations. In particular, in extended low interest rate environments, we bearexposure to the risk that reserves must be added to fund book value withdrawals and transfers when guaranteed annual creditedrates exceed the earned rate on invested assets. In a rising interest rate environment, we are exposed to the risk of financialdisintermediation through a potential increase in the level of book value withdrawals.
Although we maintain a hedge program and other risk mitigating features to offset these risks, such program and features maynot operate as intended or may not be fully effective, and we may remain exposed to such risks.
61
We may be required to accelerate the amortization of DAC, deferred sales inducements (“DSI”) and/or VOBA, any of whichcould adversely affect our results of operations or financial condition.
DAC represents policy acquisition costs that have been capitalized. DSI represents benefits paid to contract owners for a specifiedperiod that are incremental to the amounts we credit on similar contracts without sales inducements and are higher than the contract’sexpected ongoing crediting rates for periods after the inducement. VOBA represents outstanding value of in-force business acquired.Capitalized costs associated with DAC, DSI and VOBA are amortized in proportion to actual and estimated gross profits, grosspremiums or gross revenues depending on the type of contract. On an ongoing basis, we test the DAC, DSI and VOBA recorded onour balance sheets to determine if these amounts are recoverable under current assumptions. In addition, we regularly review theestimates and assumptions underlying DAC, DSI and VOBA. The projection of estimated gross profits, gross premiums or grossrevenues requires the use of certain assumptions, principally related to separate account fund returns in excess of amounts credited topolicyholders, policyholder behavior such as surrender, lapse and annuitization rates, interest margin, expense margin, mortality, futureimpairments and hedging costs. Estimating future gross profits, gross premiums or gross revenues is a complex process requiringconsiderable judgment and the forecasting of events well into the future. If these assumptions prove to be inaccurate, if an estimationtechnique used to estimate future gross profits, gross premiums or gross revenues is changed, or if significant or sustained equitymarket declines occur and/or persist, we could be required to accelerate the amortization of DAC, DSI and VOBA, which would resultin a charge to earnings. Such adjustments could have a material adverse effect on our results of operations and financial condition.
Reinsurance subjects us to the credit risk of reinsurers and may not be available, affordable or adequate to protect us against losses.
We cede life insurance policies and annuity contracts or certain risks related to life insurance policies and annuity contracts to otherinsurance companies using various forms of reinsurance, including coinsurance, modified coinsurance, funds withheld, monthlyrenewable term and yearly renewable term. However, we remain liable to the underlying policyholders, even if the reinsurer defaultson its obligations with respect to the ceded business. If a reinsurer fails to meet its obligations under the reinsurance contract, we willbe forced to bear the entire liability for claims on the reinsured policies. In addition, a reinsurer insolvency may cause us to lose ourreserve credits on the ceded business, in which case we would be required to establish additional statutory reserves.
In addition, if a reinsurer does not have accredited reinsurer status, or if a currently accredited reinsurer loses that status, in anystate where we are licensed to do business, we are not entitled to take credit for reinsurance in that state if the reinsurer does notpost sufficient qualifying collateral (either qualifying assets in a qualifying trust or qualifying LOCs). In this event, we would berequired to establish additional statutory reserves. Similarly, the credit for reinsurance taken by our insurance subsidiaries underreinsurance agreements with affiliated and unaffiliated non-accredited reinsurers is, under certain conditions, dependent uponthe non-accredited reinsurer’s ability to obtain and provide sufficient qualifying assets in a qualifying trust or qualifying LOCsissued by qualifying lending banks. In order to control expenses associated with LOCs, some of our affiliated reinsurers haveestablished and will continue to pursue alternative sources for qualifying reinsurance collateral. If these steps are unsuccessful,or if unaffiliated non-accredited reinsurers that have reinsured business from our insurance subsidiaries are unsuccessful inobtaining sources of qualifying reinsurance collateral, our insurance subsidiaries might not be able to obtain full statutoryreserve credit. Loss of reserve credit by an insurance subsidiary would require it to establish additional statutory reserves andwould result in a decrease in the level of its capital, which could have a material adverse effect on our profitability, results ofoperations and financial condition.
Our reinsurance recoverable balances are periodically assessed for uncollectability and there were no significant allowances foruncollectible reinsurance as of December 31, 2015 and December 31, 2014. The collectability of reinsurance recoverables issubject to uncertainty arising from a number of factors, including whether the insured losses meet the qualifying conditions ofthe reinsurance contract, whether reinsurers or their affiliates have the financial capacity and willingness to make paymentsunder the terms of the reinsurance contract, and the degree to which our reinsurance balances are secured by sufficientqualifying assets in qualifying trusts or qualifying LOCs issued by qualifying lender banks. Although a substantial portion ofour reinsurance exposure is secured by assets held in trusts or LOCs, the inability to collect a material recovery from a reinsurercould have a material adverse effect on our profitability, results of operations and financial condition. For additional informationregarding our unsecured reinsurance recoverable balances, see “Item 7A. Quantitative and Qualitative Disclosures about MarketRisk—Market Risk Related to Credit Risk” in Part II of this Annual Report on Form 10-K.
The premium rates and other fees that we charge are based, in part, on the assumption that reinsurance will be available at acertain cost. Some of our reinsurance contracts contain provisions that limit the reinsurer’s ability to increase rates on in-forcebusiness; however, some do not. If a reinsurer raises the rates that it charges on a block of in-force business, in some instances,
62

we will not be able to pass the increased costs onto our customers and our profitability will be negatively impacted. Additionally,such a rate increase could result in our recapturing of the business, which may result in a need to maintain additional reserves,reduce reinsurance receivables and expose us to greater risks. While in recent years, we have faced a number of rate increaseactions on in-force business, our management of those actions has resulted in no material effect on our results of operations orfinancial condition. However, there can be no assurance that the outcome of future rate increase actions would similarly result inno material effect. In addition, if reinsurers raise the rates that they charge on new business, we may be forced to raise ourpremiums, which could have a negative impact on our competitive position.
A decrease in the RBC ratio (as a result of a reduction in statutory surplus and/or increase in RBC requirements) of ourinsurance subsidiaries could result in increased scrutiny by insurance regulators and rating agencies and have a materialadverse effect on our business, results of operations and financial condition.
The NAIC has established regulations that provide minimum capitalization requirements based on RBC formulas for insurancecompanies. The RBC formula for life insurance companies establishes capital requirements relating to asset, insurance, interest rateand business risks, including equity, interest rate and expense recovery risks associated with variable annuities and group annuitiesthat contain guaranteed minimum death and living benefits. Each of our insurance subsidiaries is subject to RBC standards and/orother minimum statutory capital and surplus requirements imposed under the laws of its respective jurisdiction of domicile. Foradditional discussion of possible updates to how the NAIC calculates RBC ratios, see “Item 1. Business— Regulation—RegulationAffecting Voya Financial, Inc.—Financial Regulation—Risk-Based Capital.”
In any particular year, statutory surplus amounts and RBC ratios may increase or decrease depending on a variety of factors, including theamount of statutory income or losses generated by the insurance subsidiary (which itself is sensitive to equity market and credit marketconditions), the amount of additional capital such insurer must hold to support business growth, changes in equity market levels, the valueand credit ratings of certain fixed-income and equity securities in its investment portfolio, the value of certain derivative instruments thatdo not receive hedge accounting and changes in interest rates, as well as changes to the RBC formulas and the interpretation of theNAIC’s instructions with respect to RBC calculation methodologies. Many of these factors are outside of our control. Our financialstrength and credit ratings are significantly influenced by statutory surplus amounts and RBC ratios. In addition, rating agencies mayimplement changes to their own internal models, which differ from the RBC capital model, that have the effect of increasing ordecreasing the amount of statutory capital we or our insurance subsidiaries should hold relative to the rating agencies’ expectations. Inextreme scenarios of equity market declines, sustained periods of low interest rates, rapidly rising interest rates or credit spread widening,the amount of additional statutory reserves that an insurance subsidiary is required to hold for certain types of GICs and variable annuityguarantees and stable value contracts may increase at a greater than linear rate. This increase in reserves would decrease the statutorysurplus available for use in calculating the subsidiary’s RBC ratios. To the extent that an insurance subsidiary’s RBC ratios are deemed tobe insufficient, we may seek to take actions either to increase the capitalization of the insurer or to reduce the capitalization requirements.If we were unable to accomplish such actions, the rating agencies may view this as a reason for a ratings downgrade.
The failure of any of our insurance subsidiaries to meet its applicable RBC requirements or minimum capital and surplusrequirements could subject it to further examination or corrective action imposed by insurance regulators, including limitations onits ability to write additional business, supervision by regulators or seizure or liquidation. Any corrective action imposed couldhave a material adverse effect on our business, results of operations and financial condition. A decline in RBC ratios, whether ornot it results in a failure to meet applicable RBC requirements, may still limit the ability of an insurance subsidiary to makedividends or distributions to us, could result in a loss of customers or new business, and could be a factor in causing ratingsagencies to downgrade the insurer’s financial strength ratings, each of which could have a material adverse effect on our business,results of operations and financial condition.
Our statutory reserve financings may be subject to cost increases and new financings may be subject to limited market capacity.
We have financing facilities in place for our previously written business and have remaining capacity in existing facilities tosupport writings through the end of 2016 or later. However certain of these facilities mature prior to the run off of the reserveliability so that we are subject to cost increases or unavailability of capacity upon the refinancing. If we are unable to refinancesuch facilities, or if the cost of such facilities were to significantly increase, we could be required to obtain other forms of equity ordebt financing in order to prevent a reduction in our statutory capitalization. We could incur higher operating or tax costs if the costof these facilities were to significantly increase or if the cost of replacement financing were significantly higher. For more details,see “Item 7. Management’s Discussion and Analysis of Financial Condition and Results of Operations—Liquidity and CapitalResources—Credit Facilities and Subsidiary Credit Support Arrangements.”
63
A significant portion of our institutional funding originates from two Federal Home Loan Banks, which subjects us toliquidity risks associated with sourcing a large concentration of our funding from two counterparties.
A significant portion of our institutional funding agreements originates from the Federal Home Loan Bank of Topeka and theFederal Home Loan Bank of Des Moines (each an “FHLB”). As of December 31, 2015 and 2014, we had $1.3 billion and $1.4billion of non-putable funding agreements in force, respectively, in exchange for eligible collateral in the form of cash,mortgage backed securities, commercial real estate and U.S. Treasury securities. Should the FHLBs choose to change theirdefinition of eligible collateral, or if the market value of the pledged collateral decreases in value due to changes in interest ratesor credit ratings, we may be required to post additional amounts of collateral in the form of cash or other eligible collateral.Additionally, we may be required to find other sources to replace this funding if we lose access to FHLB funding. This couldoccur if our creditworthiness falls below either of the FHLB’s requirements or if legislative or other political actions causechanges to the FHLBs’ mandate or to the eligibility of life insurance companies to be members of the FHLB system.
Any failure to protect the confidentiality of customer information could adversely affect our reputation and have a materialadverse effect on our business, financial condition and results of operation.
Our businesses and relationships with customers are dependent upon our ability to maintain the confidentiality of our and ourcustomers’ trade secrets, personal information and other confidential information (including customer transactional data andpersonal information about our customers, the employees and customers of our customers, and our own employees). We arealso subject to numerous federal and state laws regarding the privacy and security of personal information, which laws varysignificantly from jurisdiction to jurisdiction. Many of our employees and contractors and the representatives of our broker-dealer subsidiaries have access to and routinely process personal information in computerized, paper and other forms. We relyon various internal policies, procedures and controls to protect the confidentiality of personal information that is accessible to,or in the possession of, us or our employees, contractors and representatives. It is possible that an employee, contractor orrepresentative could, intentionally or unintentionally, disclose or misappropriate personal information or other confidentialinformation. If we fail to maintain adequate internal controls, including any failure to implement newly-required additionalcontrols, or if our employees, contractors or representatives fail to comply with our policies and procedures, misappropriation orintentional or unintentional inappropriate disclosure or misuse of personal information or confidential customer informationcould occur. Such internal control inadequacies or non-compliance could materially damage our reputation, result in regulatoryaction or lead to civil or criminal penalties, which, in turn, could have a material adverse effect on our business, reputation,results of operations and financial condition. For additional risks related to our potential failure to protect confidentialinformation, see “—Interruption or other operational failures in telecommunication, information technology, and otheroperational systems, including as a result of human error, could harm our business,” and “—A failure to maintain the security,integrity, confidentiality or privacy of our telecommunication, information technology or other operational systems, or thesensitive data residing on such systems, could harm our business.”
Interruption or other operational failures in telecommunication, information technology and other operational systems,including as a result of human error, could harm our business.
We are highly dependent on automated and information technology systems to record and process both our internal transactions andtransactions involving our customers, as well as to calculate reserves, value invested assets and complete certain other components ofour U.S. GAAP and statutory financial statements. We could experience a failure of one of these systems, our employees or agentscould fail to monitor and implement enhancements or other modifications to a system in a timely and effective manner, or ouremployees or agents could fail to complete all necessary data reconciliation or other conversion controls when implementing a newsoftware system or implementing modifications to an existing system. Despite the implementation of security and back-up measures,our information technology systems may remain vulnerable to disruptions. We may also be subject to disruptions of any of thesesystems arising from events that are wholly or partially beyond our control (for example, natural disasters, acts of terrorism, epidemics,computer viruses and electrical/telecommunications outages). All of these risks are also applicable where we rely on outside vendorsto provide services to us and our customers and third party service providers, including those to whom we outsource certain of ourfunctions. The failure of any one of these systems for any reason, or errors made by our employees or agents, could in each case causesignificant interruptions to our operations, which could harm our reputation, adversely affect our internal control over financialreporting, or have a material adverse effect on our business, results of operations and financial condition.
Recently, central banks in Europe and Japan have begun to pursue negative interest rate policies, and the FOMC has not ruledout the possibility that the Federal Reserve would adopt a negative interest rate policy for the United States if circumstances sowarranted. Because negative interest rates are largely unprecedented, there is uncertainty as to whether the technology used byfinancial institutions, including us, could operate correctly in such a scenario. Should negative interest rates emerge, our
64
hardware or software, or the hardware or software used by our contractual counterparties and financial services providers, maynot function as expected or at all. In such a case, our financial results and our operations could be adversely affected.
A failure to maintain the security, integrity, confidentiality or privacy of our telecommunication, information technology orother operational systems, or the sensitive data residing on such systems, could harm our business.
We are highly dependent on automated telecommunications, information technology and other operational systems to record andprocess our internal transactions and transactions involving our customers. Despite the implementation of security and back-upmeasures, our information technology systems may be vulnerable to physical or electronic intrusions, viruses or other attacks,programming errors, and similar disruptions. Businesses in the United States and in other countries have increasingly become thetargets of “cyberattacks”, “hacking” or similar illegal or unauthorized intrusions into computer systems and networks. Such eventsare often highly publicized, result in the theft of significant amounts of information, and cause extensive damage to the reputation ofthe targeted business, in addition to leading to significant expenses associated with investigation, remediation and customerprotection measures. Like others in our industry, we are subject to cyber incidents in the ordinary course of our business. Althoughwe seek to limit our vulnerability to such events through technological and other means, it is not possible to anticipate or prevent allpotential forms of cyberattack or to guarantee our ability to fully defend against all such attacks. In addition, due to the sensitivenature of much of the financial and other personal information we maintain, we may be at particular risk for targeting.
We retain confidential information in our information technology systems, and we rely on industry standard commercialtechnologies to maintain the security of those systems. Anyone who is able to circumvent our security measures and penetrate ourinformation technology systems could access, view, misappropriate, alter, or delete information in the systems, includingpersonal information and proprietary business information. Information security risks also exist with respect to the use of portableelectronic devices, such as laptops, which are particularly vulnerable to loss and theft. The laws of most states require thatindividuals be notified if a security breach compromises the security or confidentiality of their personal information. Any attackor other breach of the security of our information technology systems that compromises personal information or that otherwiseresults in unauthorized disclosure or use of personal information, could damage our reputation in the marketplace, deter purchasesof our products, subject us to heightened regulatory scrutiny, sanctions, significant civil and criminal liability or other adverselegal consequences and require us to incur significant technical, legal and other expenses.
Our third party service providers, including third parties to whom we outsource certain of our functions are also subject to therisks outlined above, any one of which could result in our incurring substantial costs and other negative consequences, including amaterial adverse effect on our business, results of operations and financial condition.
Changes in accounting standards could adversely impact our reported results of operations and our reported financial condition.
Our financial statements are subject to the application of U.S. GAAP, which is periodically revised or expanded. Accordingly,from time to time we are required to adopt new or revised accounting standards issued by recognized authoritative bodies,including the Financial Accounting Standards Board (“FASB”). It is possible that future accounting standards we are required toadopt could change the current accounting treatment that we apply to our consolidated financial statements and that such changescould have a material adverse effect on our results of operations and financial condition.
FASB is working on several projects which could result in significant changes in U.S. GAAP, including how we account for ourinsurance contracts and financial instruments and how our financial statements are presented. The changes to U.S. GAAP couldaffect the way we account for and report significant areas of our business, could impose special demands on us in the areas ofgovernance, employee training, internal controls and disclosure and will likely affect how we manage our business.
We may be required to establish an additional valuation allowance against the deferred income tax asset if: (i) our businessdoes not generate sufficient taxable income; (ii) there is a significant decline in the fair market value of our investmentportfolio; or (iii) our tax planning strategies are modified. Increases in the deferred tax valuation allowance could have amaterial adverse effect on our results of operations and financial condition.
Deferred income tax represents the tax effect of the differences between the book and tax basis of assets and liabilities. Deferred taxassets represent the tax benefit of future deductible temporary differences, operating loss carryforwards and tax credits carryforward. Weperiodically evaluate and test our ability to realize our deferred tax assets. Deferred tax assets are reduced by a valuation allowance if,based on the weight of evidence, it is more likely than not that some portion, or all, of the deferred tax assets will not be realized. Inassessing the more likely than not criteria, we consider future taxable income as well as prudent tax planning strategies. Future facts,
65
circumstances, tax law changes and FASB developments may result in an increase in the valuation allowance. An increase in thevaluation allowance could have a material adverse effect on the Company’s results of operations and financial condition.
As of December 31, 2015, we have a net deferred tax asset balance of $2.2 billion. Recognition of this asset has been based onprojections of future taxable income and on tax planning related to unrealized gains on investment assets. To the extent that ourestimates of future taxable income decrease or if actual future taxable income is less than the projected amounts, the recognitionof the deferred tax asset may be reduced. Also, to the extent unrealized gains decrease, the tax benefit may be reduced. Anyreduction in the deferred tax asset may be recorded as a tax expense in tax on continuing operations based on the intra period taxallocation rules described in ASC Topic 740, “Income Taxes.”
Our ability to use certain beneficial U.S. tax attributes is subject to limitations.
Section 382 (“Section 382”) and Section 383 of the U.S. Internal Revenue Code of 1986, as amended (the “Internal Revenue Code”),operate as anti-abuse rules, the general purpose of which is to prevent trafficking in tax losses and credits, but which can apply withoutregard to whether a “loss trafficking” transaction occurs or is intended. These rules are triggered by the occurrence of an ownershipchange—generally defined as when the ownership of a company, or its parent, changes by more than 50% (measured by value) on acumulative basis in any three year period (“Section 382 event”). If triggered, the amount of the taxable income for any post-changeyear which may be offset by a pre-change loss is subject to an annual limitation. Generally speaking, this limitation is derived bymultiplying the fair market value of the Company immediately before the date of the Section 382 event by the applicable federal long-term tax-exempt rate. Although we experienced a Section 382 event during the quarter ended March 31, 2014, the deferred tax asset,the valuation allowance, and the admitted deferred tax asset did not change as a result of this event. As of December 31, 2015 theCompany has net operating losses and capital losses of approximately $2.7 billion and tax credits of approximately $250 millionsubject to the annual Section 382 limitations. As part of our participation in the IRS’s Compliance Assurance Process (“CAP”), inDecember 2014, we entered into an Issue Resolution Agreement (“IA”) with the IRS relating to the Internal Revenue CodeSection 382 calculation of the annual limitation on the use of certain of the Company’s federal tax attributes that will apply as aconsequence of the Section 382 event experienced by the Company in March 2014. Under the IA, this annual limitation is estimated tobe (i) for the 2014 to 2018 tax years, approximately $520 million per year, plus certain capital gains and (ii) for the 2019 andsubsequent tax years, $450 million per year. To the extent the annual limitation is not met within any one year the excess will beavailable in subsequent years. The annual limitation under the IA will apply to an amount estimated to be not greater thanapproximately $2.9 billion of the Company’s federal tax attributes related to net operating losses and capital losses and approximately$270 million related to tax credits. We do not expect the annual limitation to impact our ability to utilize the losses or credits. As withissue resolution agreements entered into under the CAP, the matters addressed by the IA may be re-visited by the IRS in connectionwith a tax audit or other an examination or inquiry of the Company’s tax position.
Our business may be negatively affected by adverse publicity or increased governmental and regulatory actions with respectto us, other well-known companies or the financial services industry in general.
Governmental scrutiny with respect to matters relating to compensation, compliance with regulatory and tax requirements and otherbusiness practices in the financial services industry has increased dramatically in the past several years and has resulted in moreaggressive and intense regulatory supervision and the application and enforcement of more stringent standards. The financial crisis of2008-09 and current political and public sentiment regarding financial institutions has resulted in a significant amount of adverse presscoverage, as well as adverse statements or charges by regulators and elected officials. Press coverage and other public statements thatassert some form of wrongdoing, regardless of the factual basis for the assertions being made, could result in some type of inquiry orinvestigation by regulators, legislators and/or law enforcement officials or in lawsuits. Responding to these inquiries, investigationsand lawsuits, regardless of the ultimate outcome of the proceeding, is time-consuming and expensive and can divert the time and effortof our senior management from its business. Future legislation or regulation or governmental views on compensation may result in usaltering compensation practices in ways that could adversely affect our ability to attract and retain talented employees. Adversepublicity, governmental scrutiny, pending or future investigations by regulators or law enforcement agencies and/or legal proceedingsinvolving us or our affiliates, could also have a negative impact on our reputation and on the morale and performance of employees,and on business retention and new sales, which could adversely affect our businesses and results of operations.
Litigation may adversely affect our profitability and financial condition.
We are, and may be in the future, subject to legal actions in the ordinary course of insurance, investment management and otherbusiness operations. Some of these legal proceedings may be brought on behalf of a class. Plaintiffs may seek large or indeterminateamounts of damage, including compensatory, liquidated, treble and/or punitive damages. Our reserves for litigation may prove to beinadequate and insurance coverage may not be available or may be declined for certain matters. It is possible that our results of
66
operations or cash flows in a particular interim or annual period could be materially affected by an ultimate unfavorable resolution ofpending litigation depending, in part, upon the results of operations or cash flows for such period. Given the large or indeterminateamounts sometimes sought, and the inherent unpredictability of litigation, it is also possible that in certain cases an ultimateunfavorable resolution of one or more pending litigation matters could have a material adverse effect on our financial condition.
A loss of, or significant change in, key product distribution relationships could materially affect sales.
We distribute certain products under agreements with affiliated distributors and other members of the financial services industrythat are not affiliated with us. We compete with other financial institutions to attract and retain commercial relationships in eachof these channels, and our success in competing for sales through these distribution intermediaries depends upon factors such asthe amount of sales commissions and fees we pay, the breadth of our product offerings, the strength of our brand, our perceivedstability and financial strength ratings, and the marketing and services we provide to, and the strength of the relationships wemaintain with, individual distributors. An interruption or significant change in certain key relationships could materially affectour ability to market our products and could have a material adverse effect on our business, operating results and financialcondition. Distributors may elect to alter, reduce or terminate their distribution relationships with us, including for such reasonsas changes in our distribution strategy, adverse developments in our business, adverse rating agency actions or concerns aboutmarket-related risks. Alternatively, we may terminate one or more distribution agreements due to, for example, a loss ofconfidence in, or a change in control of, one of the distributors, which could reduce sales.
We are also at risk that key distribution partners may merge or change their business models in ways that affect how ourproducts are sold, either in response to changing business priorities or as a result of shifts in regulatory supervision or potentialchanges in state and federal laws and regulations regarding standards of conduct applicable to distributors when providinginvestment advice to retail and other customers.
The occurrence of natural or man-made disasters may adversely affect our results of operations and financial condition.
We are exposed to various risks arising from natural disasters, including hurricanes, climate change, floods, earthquakes,tornadoes and pandemic disease, as well as man-made disasters and core infrastructure failures, including acts of terrorism,military actions, power grid and telephone/internet infrastructure failures, which may adversely affect AUM, results ofoperations and financial condition by causing, among other things:
• losses in our investment portfolio due to significant volatility in global financial markets or the failure ofcounterparties to perform;
• changes in the rate of mortality, claims, withdrawals, lapses and surrenders of existing policies and contracts, as wellas sales of new policies and contracts; and
• disruption of our normal business operations due to catastrophic property damage, loss of life, or disruption of publicand private infrastructure, including communications and financial services.
There can be no assurance that our business continuation and crisis management plan or insurance coverages would be effective inmitigating any negative effects on operations or profitability in the event of a disaster, nor can we provide assurance that the businesscontinuation and crisis management plans of the independent distributors and outside vendors on whom we rely for certain services andproducts would be effective in mitigating any negative effects on the provision of such services and products in the event of a disaster.
Claims resulting from a catastrophic event could also materially harm the financial condition of our reinsurers, which wouldincrease the probability of default on reinsurance recoveries. Our ability to write new business could also be adversely affected.
In addition, the jurisdictions in which our insurance subsidiaries are admitted to transact business require life insurers doingbusiness within the jurisdiction to participate in guaranty associations, which raise funds to pay contractual benefits owedpursuant to insurance policies issued by impaired, insolvent or failed insurers. It is possible that a catastrophic event couldrequire extraordinary assessments on our insurance companies, which may have a material adverse effect on our business,results of operations and financial condition.
67

The loss of key personnel could negatively affect our financial results and impair our ability to implement our business strategy.
Our success depends in large part on our ability to attract and retain key people. Intense competition exists for key employees withdemonstrated ability, and we may be unable to hire or retain such employees. Our key employees include investment professionals,such as portfolio managers, sales and distribution professionals, actuarial and finance professionals and information technologyprofessionals. While we do not believe that the departure of any particular individual would cause a material adverse effect on ouroperations, the unexpected loss of several of our senior management, portfolio managers or other key employees could have a materialadverse effect on our operations due to the loss of their skills, knowledge of our business, and their years of industry experience as wellas the potential difficulty of promptly finding qualified replacement employees. We also rely upon the knowledge and experience ofemployees involved in functions that require technical expertise in order to provide for sound operational controls for our overallenterprise, including the accurate and timely preparation of required regulatory filings and U.S. GAAP and statutory financialstatements and operation of internal controls. A loss of such employees could adversely impact our ability to execute key operationalfunctions and could adversely affect our operational controls, including internal controls over financial reporting.
If we experience difficulties arising from outsourcing relationships, our ability to conduct business may be compromised,which may have an adverse effect on our business and results of operations.
As we continue to focus on reducing the expense necessary to support our operations, we have increasingly used outsourcing strategiesfor certain technology and business functions. If third-party providers experience disruptions or do not perform as anticipated, or weexperience problems with a transition, we may experience operational difficulties, an inability to meet obligations, including, but notlimited to, policyholder obligations, increased costs and a loss of business that may have a material adverse effect on our business andresults of operations. For other risks associated with our outsourcing of certain functions, see “—Interruption or other operationalfailures in telecommunication, information technology, and other operational systems, including as a result of human error, could harmour business,” and “—A failure to maintain the security, integrity, confidentiality or privacy of our telecommunication, informationtechnology or other operational systems, or the sensitive data residing on such systems, could harm our business.”
We may not be able to protect our intellectual property and may be subject to infringement claims.
We rely on a combination of contracts and copyright, trademark, patent and trade secret laws to protect our intellectual property.Although we endeavor to protect our rights, third parties may infringe upon or misappropriate our intellectual property. We may haveto litigate to enforce and protect our copyrights, trademarks, patents, and trade secrets or to determine their scope, validity orenforceability. This would represent a diversion of resources that may be significant and our efforts may not prove successful. Theinability to secure or protect our intellectual property could have a material adverse effect on our business and our ability to compete.
We may also be subject to claims by third parties for (i) patent, trademark or copyright infringement, (ii) breach of contractualpatent, trademark or copyright license rights, or (iii) misappropriation of trade secrets. Any such claims and any resulting litigationcould result in significant expense and liability for damages. If we were found to have infringed or misappropriated a third-partyintellectual property right, we could in some circumstances be enjoined from providing certain products or services to ourcustomers or from utilizing and benefiting from certain methods, processes, technology copyrights, trademarks, trade secrets orlicenses. Alternatively, we could be required to enter into costly licensing arrangements with third parties or implement a costlywork around. Any of these scenarios could have a material adverse effect on our business and results of operations.
We may incur further liabilities in respect of our defined benefit retirement plans for our employees if the value of planassets is not sufficient to cover potential obligations, including as a result of differences between results underlying actuarialassumptions and models.
We operate various defined benefit retirement plans covering a significant number of our employees. The liability recognized inour consolidated balance sheet in respect of our defined benefit plans is the present value of the defined benefit obligations atthe balance sheet date, less the fair value of each plan’s assets. We determine our defined benefit plan obligations based onexternal actuarial models and calculations using the projected unit credit method. Inherent in these actuarial models areassumptions including discount rates, rates of increase in future salary and benefit levels, mortality rates, consumer price indexand the expected return on plan assets. These assumptions are updated annually based on available market data and the expectedperformance of plan assets. Nevertheless, the actuarial assumptions may differ significantly from actual results due to changesin market conditions, economic and mortality trends and other assumptions. Any changes in these assumptions could have a
68

significant impact on our present and future liabilities to and costs associated with our defined benefit retirement plans and mayresult in increased expenses and reduce our profitability.
When contributing to our qualified retirement plans, we will take into consideration the minimum and maximum amountsrequired by ERISA, the attained funding target percentage of the plan, the variable-rate premiums that may be required by thePBGC, and any funding relief that might be enacted by Congress. These factors could lead to increased PBGC variable-ratepremiums and/or increases in plan funding in future years.
Although our retail variable annuity products are now managed within our CBVA segment, we continue to offer variableannuity products and other products with similar features in our ongoing business.
In 2009, we decided to cease sales of retail variable annuities with substantial guarantee features and now manage that businesswithin our CBVA segment. However, we continue to offer variable annuity products in our ongoing business as well as productsthat have some of the features of variable annuities such as guaranteed benefits. For example, certain of the deferred annuities soldby our Retirement segment are on group and individual variable annuity policy forms, since these product types allow customers toallocate their retirement savings to a variety of different investment options. These products may contain guaranteed death benefitfeatures, but they do not offer guaranteed living benefit features of the type found within the CBVA segment.
Our Annuities segment also offers guaranteed withdrawal benefit provisions on certain indexed annuity products.
To the extent that the foregoing risk-control measures do not sufficiently mitigate the risks of the GLWB and to the extent thatwe continue to offer variable annuity products and products with similar features in our ongoing business, the risks describedbelow under “Risks Related to Our CBVA Segment” will impact our ongoing business.
Risks Related to Our CBVA Segment
Although we no longer actively market retail variable annuities, our business, results of operations, financial condition andliquidity will continue to be affected by our CBVA segment for the foreseeable future.
Our CBVA segment consists of retail variable annuity insurance policies sold primarily from 2001 to early 2010, when theblock entered run-off. This segment represented 14.2% of our total AUM as of December 31, 2015, income (loss) before incometaxes was $(173.3) million, $(239.2) million and $(1,211.3) million for the years ended December 31, 2015, 2014, and 2013,respectively. Revenues for the segment were $1,584.5 million, $1,262.0 million and $(728.2) million for the years endedDecember 31, 2015, 2014, and 2013, respectively. See “Item 1. Business—Closed Blocks—CBVA.” These products offeredlong-term savings vehicles in which customers (policyholders) made deposits that were invested, largely at the customer’sdirection, in a variety of U.S. and international equity, fixed income, real estate and other investment options. In addition, theseproducts provided customers with the option to purchase living benefit riders, including GMWBL, GMIB, GMAB and GMWB.All retail variable annuity products include GMDB. In 2009, we decided to cease sales of retail variable annuity products withsubstantial guarantee features. In early 2010, we ceased all new sales of these products with substantial guarantees, although wecontinue to accept new deposits in accordance with, and subject to the limitations of, the provisions of existing contracts.
Market movements and actuarial assumption changes (including, with respect to policyholder behavior and mortality) can resultin material adverse impacts to our results of operations, financial condition and liquidity. Because policyholders have variouscontractual rights to defer withdrawals, annuitization and/or maturity of their contracts, the nature and period of contractmaturity is subject to policyholder behavior and is therefore indeterminate. Future market movements and changes in actuarialassumptions can result in significant earnings and liquidity impacts, as well as increases in regulatory reserve and capitalrequirements for the CBVA segment. The latter may necessitate additional capital contributions into the business and/oradversely impact dividend capacity.
Our CBVA segment is subject to market risks.
Our CBVA segment is subject to a number of market risks, primarily associated with U.S. and other global equity market valuesand interest rates. For example, declining equity market values, increasing equity market volatility, declining interest rates or aprolonged period of low interest rates can result in an increase in the valuation of future policy benefits, reducing our netincome. Declining market values for bonds and equities also reduce the account balances of our variable annuity contracts, andsince we collect fees and risk charges based on these account balances, our net income may be further reduced.
69
Declining interest rates, a prolonged period of low interest rates, increased equity market volatility or declining equity marketvalues may also subject us to increased hedging costs. Market events can cause an increase in the amount of statutory reservesthat our insurance subsidiaries are required to hold for variable annuity guarantees, lowering their statutory surplus, which wouldadversely impact their ability to pay dividends to us. An increase in interest rates could result in decreased fee income associatedwith a decline in the value of variable annuity account balances invested in fixed income funds, which also might affect the valueof the underlying guarantees within these variable annuities.
The performance of our CBVA segment depends on assumptions that may not be accurate.
Our CBVA segment is subject to risks associated with the future behavior of policyholders and future claims payment patterns, usingassumptions for mortality experience, lapse rates, GMIB annuitization rates and GMWBL withdrawal rates. We are required to makeassumptions about these behaviors and patterns, which may not reflect the actual behaviors and patterns we experience in the future.It is possible that future assumption changes could produce reserve changes that could be material. Any such increase to reservescould require us to make material additional capital contributions to one or more of our insurance company subsidiaries or couldotherwise be material and adverse to the results of operations or financial condition of the Company.
In particular, we have only minimal experience regarding the long-term implications of policyholder behavior for our GMIB and as aresult, future experience could lead to significant changes in our assumptions. Our GMIB contracts, most of which were issuedduring the period from 2004 to 2006, have a ten-year waiting period before annuitization is available. These contracts first becomeeligible to annuitize during the period from 2014 through 2016, but contain significant incentives to delay annuitization beyond thefirst eligibility date. In addition, during 2014 and 2015, we made two income enhancement offers to holders of particular series ofGMIB contracts, under which policy holders were offered an incentive to annuitize prior to the end of the waiting period, and wehave waived the remaining waiting period on these GMIB contracts. As a result, although we have increased experience onpolicyholder behavior for the first opportunity to annuitize, including from the acceptance rates of the income enhancement offers,we continue to have only a statistically small sample of experience used to set annuitization rates beyond the first eligibility date.Therefore, we anticipate that observable experience data will become statistically credible later in this decade, when a large volumeof GMIB benefits begin to reach their maximum benefit over the four-year period from 2019 to 2022.
Similarly, most of our GMWBL contracts are still in the first seven to nine policy years, so our assumptions for withdrawal fromcontracts with GMWBL benefits may change as experience emerges. In addition, many of our GMWBL contracts containsignificant incentives to delay withdrawal. Our experience for GMWBL contracts has recently become more credible, however itis possible that policyholders may choose to withdraw sooner or later than our current best estimate assumes. We expect customerdecisions on withdrawal will be influenced by their financial plans and needs as well as by interest rate and market conditionsover time and by the availability and features of competing products.
We also make estimates of expected lapse rates, which represent the probability that a policy will not remain in force from oneperiod to the next, for contracts in the CBVA segment. Lapse rates of our variable annuity contracts may be significantlyimpacted by the value of guaranteed minimum benefits relative to the value of the underlying separate accounts (account value oraccount balance). In general, policies with guarantees that are “in the money” are assumed to be less likely to lapse. Conversely,“out of the money” guarantees are assumed to be more likely to lapse as the policyholder has less incentive to retain the policy.Lapse rates could also be adversely affected generally by developments that affect customer perception of us.
Our variable annuity lapse rate experience has varied significantly over the period from 2006 to the present, reflecting among otherfactors, both pre-and post-financial crisis experience. Relative to our current expectations, actual lapse rates have generallydemonstrated a declining trend over the period from 2006 to the present. We analyze actual experience over that entire period, as webelieve that over the duration of the variable annuity policies we may experience the full range of policyholder behavior and marketconditions. However, management’s current best estimate of variable annuity policyholder lapse behavior is weighted more heavilytoward more recent experience, as the last three years of data have shown a more consistent trend of lapse behavior.
Actual lapse rates that are lower than our lapse rate assumptions could have an adverse effect on profitability in the later years ofa block of business because the anticipated claims experience may be higher than expected in these later years, and, as discussedabove, future reserve increases in connection with experience updates could be material and adverse to the results of operations orfinancial condition of the Company.
We make estimates regarding mortality, which refers to the ceasing of life contingent benefit payments due to the death of theannuitant. Mortality also refers to the incidence of death amongst policyholders triggering the payment of Guaranteed MinimumDeath Benefits. We use a combination of actual and industry experience when setting our mortality assumptions.
70

We review overall policyholder experience at least annually (including lapse, annuitization, withdrawal and mortality), andupdate these assumptions when deemed necessary based on additional information that becomes available. As customerexperience continues to materialize, we may adjust our assumptions. We increased reserves in the fourth quarter of 2011 after acomprehensive review of our assumptions relating to lapses, mortality, annuitization of income benefits and utilization ofwithdrawal benefits. The review in 2011 included an analysis of a larger body of actual experience than was previously available,including a longer period with low equity markets and interest rates, which we believe provided greater insight into anticipatedpolicyholder behavior for contracts that are in the money. This resulted in an increase of U.S. GAAP reserves of $741 million andgross U.S. statutory reserves of $2,776 million in the fourth quarter of 2011.
During the third quarters of 2015, 2014 and 2013, we conducted our annual review of assumptions, including projection modelinputs. Annual assumption changes and revisions to projection model inputs implemented during 2015 resulted in a loss of $86.0million. This $86.0 million loss included an unfavorable $43.0 million resulting from policyholder behavior assumption changesprimarily related to an update to lapse assumptions, partially offset by a favorable $27.4 million resulting from changes tomortality assumptions. The loss also included an unfavorable $70.4 million as a result of updates we have made to otherassumptions, principally relating to expected earned rates on certain investment options available to variable annuitycontractholders, discount rates applicable to future cash flows from variable annuity contracts, and long-term volatility.
Annual assumption changes and revisions to projection model inputs implemented during 2014 resulted in a gain of $102.3million (excluding a gain of $37.9 million due to changes in the technique used to estimate nonperformance risk). This $102.3million gain included a favorable $170.2 million resulting from policyholder behavior assumption changes partially offset by anunfavorable $40.5 million resulting from changes to mortality assumptions. The gain from policyholder behavior assumptionchanges was primarily due to an update to the utilization assumption on GMWBL contracts, partially offset by an unfavorableresult from an update to lapse assumptions.
The 2013 result included a loss of $185.3 million (excluding a gain of $144.6 million due to changes in the technique used toestimate nonperformance risk) due to annual assumption changes. This $185.3 million loss included an unfavorable $117.9million resulting from changes to mortality assumptions and unfavorable $85.5 million resulting from policyholder behaviorassumption changes primarily related to an update to lapse assumptions.
We will continue to monitor the emergence of experience. If adjustments to policyholder behavior assumptions (e.g., lapse,annuitization and withdrawal) are necessary, which is ordinary course for interest-sensitive long-dated liabilities, we anticipate thatthe financial impact of such a change (either under U.S. GAAP or due to increases or decreases in gross U.S. statutory reserves) willlikely be in a range, either up or down, that is generally consistent with the impact experienced in the past three years.
Our Variable Annuity Hedge Program currently focuses on the protection of regulatory and rating agency capital frommarket movements and less on the U.S. GAAP earnings impact of this block, which could result in materially lower or morevolatile U.S. GAAP earnings.
Our Variable Annuity Hedge Program currently focuses on the protection of regulatory and rating agency capital from marketmovements rather than on the U.S. GAAP earnings impact of this block. U.S. GAAP accounting differs from the methods used todetermine regulatory and rating agency capital measures. Therefore our Variable Annuity Hedge Program may create earningsvolatility in our U.S. GAAP financial statements, or produce lower U.S. GAAP income or U.S. GAAP losses compared to whatour unhedged results would have been. In general, in any given period rising equity market values can produce losses in ourVariable Annuity Hedge Program that substantially exceed the benefit we derive from the associated decrease in valuation of thefuture policy benefits associated with CBVA products on a U.S. GAAP basis, and the impact of declining markets can producegains in our Variable Annuity Hedge Program that substantially exceed the loss we derive from the associated increase invaluation of the future policy benefits on a U.S. GAAP basis. We recorded net gains (losses) related to incurred guaranteedbenefits and guaranteed benefit hedging, including the CHO program, but excluding the effect of nonperformance risk, of$(1,114.8) million, $(1,575.3) million, and $(1,673.3) million for the years ended December 31, 2015, 2014, and 2013,respectively. See “Item 7. Management’s Discussion and Analysis of Financial Condition and Results of Operations—Results ofOperations—Company Consolidated.”
As stated above, the primary focus of the hedge program is to protect regulatory and rating agency capital from market movements.Hedge ineffectiveness, along with other aspects not directly hedged (including unexpected policyholder experience), may cause lossesof regulatory or rating agency capital. Regulatory and rating agency capital requirements may move disproportionately (i.e., they maychange by different amounts as market conditions and other factors change), and, therefore, this could also cause our hedge program tonot realize its key objective of protecting both regulatory and rating agency capital from market movements.
71

Our Variable Annuity Hedge Program may not be effective and may be more costly than anticipated.
We periodically re-evaluate our Variable Annuity Hedge Program to respond to changing market conditions and balance the trade-offsamong several important factors, including regulatory reserves, rating agency capital, underlying economics, earnings and otherfactors. While our Variable Annuity Hedge Program is intended to balance numerous critical metrics, we are subject to the risk thatour strategies and other management decisions may prove ineffective or that unexpected policyholder experience, alone or incombination with unfavorable market events, may produce losses or unanticipated cash needs beyond the scope of the riskmanagement strategies employed. The Variable Annuity Hedge Program assumes that hedge positions can be rebalanced during amarket shock and that the performance of the derivative contracts reasonably matches the performance of the contract owners’ variablefund returns. In addition, our Variable Annuity Hedge Program does not hedge certain non-market risks inherent in this segment,including business, credit, insurance and operational risks; any of these risks could cause us to experience unanticipated losses or cashneeds. For example, hedging counterparties may fail to perform their obligations resulting in unhedged exposures and losses onpositions that are not collateralized. Finally, the cost of the Variable Annuity Hedge Program itself may be greater than anticipated asadverse market conditions can limit the availability and increase the costs of the hedging instruments we employ, and such costs maynot be recovered in the pricing of the underlying products being hedged. For example, the cost of hedging guaranteed minimumbenefits increases as market volatilities increase and/or interest rates decrease, resulting in a reduction to net income.
Risks Related to Regulation
Our businesses and those of our affiliates are heavily regulated and changes in regulation or the application of regulationmay reduce our profitability.
We are subject to detailed insurance, asset management and other financial services laws and government regulation. In additionto the insurance, asset management and other regulations and laws specific to the industries in which we operate, regulatoryagencies have broad administrative power over many aspects of our business, which may include ethical issues, moneylaundering, privacy, recordkeeping and marketing and sales practices. Also, bank regulators and other supervisory authorities inthe United States and elsewhere continue to scrutinize payment processing and other transactions under regulations governingsuch matters as money-laundering, prohibited transactions with countries subject to sanctions, and bribery or other anti-corruption measures. The financial market dislocations we have experienced have produced, and are expected to continue toproduce, extensive changes in existing laws and regulations applicable to our businesses.
Compliance with applicable laws and regulations is time consuming and personnel-intensive, and changes in laws and regulations maymaterially increase the cost of compliance and other expenses of doing business. There are a number of risks that may arise whereapplicable regulations may be unclear, subject to multiple interpretations or under development or where regulations may conflict withone another, where regulators revise their previous guidance or courts overturn previous rulings, which could result in our failure tomeet applicable standards. Regulators and other authorities have the power to bring administrative or judicial proceedings against us,which could result, among other things, in suspension or revocation of our licenses, cease and desist orders, fines, civil penalties,criminal penalties or other disciplinary action which could materially harm our results of operations and financial condition. If we failto address, or appear to fail to address, appropriately any of these matters, our reputation could be harmed and we could be subject toadditional legal risk, which could increase the size and number of claims and damages asserted against us or subject us to enforcementactions, fines and penalties. See “Item 1. Business—Regulation” for further discussion of the impact of regulations on our businesses.
The Health Care Act significantly impacts how employers provide health care to employees and how individuals obtain healthcare insurance. There is uncertainty surrounding the impact of the Health Care Act on insurers which may create risks toproducts we offer, including Stop Loss Insurance sold to employers offering self-insured health plans. In addition, should theTreasury Department issue guidance concluding that insurers offering Stop Loss Insurance are considered health care providers,we may face adverse tax or other financial consequences.
Our insurance businesses are heavily regulated, and changes in regulation in the United States, enforcement actions andregulatory investigations may reduce profitability.
Our insurance operations are subject to comprehensive regulation and supervision throughout the United States. State insurance lawsregulate most aspects of our insurance businesses, and our insurance subsidiaries are regulated by the insurance departments of thestates in which they are domiciled and the states in which they are licensed. The primary purpose of state regulation is to protectpolicyholders, and not necessarily to protect creditors and investors. See “Item 1. Business—Regulation—Insurance Regulation.”
72
State insurance guaranty associations have the right to assess insurance companies doing business in their state in order to help pay theobligations of insolvent insurance companies to policyholders and claimants. Because the amount and timing of an assessment is beyondour control, liabilities we have currently established for these potential assessments may not be adequate. State insurance regulators, theNAIC and other regulatory bodies regularly reexamine existing laws and regulations applicable to insurance companies and theirproducts. Changes in these laws and regulations, or in interpretations thereof, are often made for the benefit of the consumer at theexpense of the insurer and could materially and adversely affect our business, results of operations or financial condition. We currentlyuse captive reinsurance subsidiaries primarily to reinsure term life insurance, universal life insurance with secondary guarantees, andstable value annuity business. We also use our Arizona captive primarily to reinsure life insurance and annuity business from ourinsurance subsidiaries. Uncertainties associated with continued use of our captive reinsurance subsidiaries and our Arizona captive areprimarily related to potential regulatory changes. In June 2014, the NAIC adopted a new regulatory framework set out in the RectorReport for captives assuming XXX and AXXX business. In December 2014, the NAIC adopted AG48 which established a newregulatory requirement applicable to XXX and AXXX reserves ceded to reinsurers, including affiliated reinsurers, as the first step inimplementing the Rector framework. AG48 limits the type of assets that may be used as collateral to cover the XXX and AXXX statutoryreserves and is applied prospectively to existing reinsurance transactions that reinsure policies issued on or after January 1, 2015 and newreinsurance transactions entered into on or after January 1, 2015. The NAIC has charged multiple working groups with the responsibilityto prepare regulations that would codify the Rector framework and that work continues at the NAIC. In 2014, the NAIC also considered aproposal to require states to apply NAIC accreditation standards, applicable to traditional insurers, to captive reinsurers. In 2015, theNAIC adopted such a proposal, in the form of a revised preamble to the NAIC accreditation standards (the “Standard”), with an effectivedate of January 1, 2016 for application of the Standard to captives that assume XXX and AXXX business. Under the Standard, a state willbe deemed in compliance as it relates to XXX and AXXX captives if the applicable reinsurance transaction satisfies AG 48. In addition,the Standard applies prospectively, so that XXX/AXXX captives will not be subject to the Standard if reinsured policies were issued priorto January 1, 2015 and ceded so that they were part of a reinsurance arrangement as of December 31, 2014. The NAIC left or futureaction application of the Standard to captives that assume variable annuity business. As drafted, it appears that the Standard would applyto our Arizona captive. During 2015, the NAIC E Committee established the VAIWG to oversee the NAIC’s efforts to study and address,as appropriate, regulatory issues resulting in variable annuity captive reinsurance transactions. The VAIWG retained Oliver Wyman tostudy the industry’s use of variable annuity captive reinsurance and to develop a set of recommended changes to address the issuesinvolving variable annuity captives. In September 2015, Oliver Wyman issued an initial report, which was adopted by the VAIWG,outlining its preliminary findings and making recommendations for enhancements to the variable annuity statutory framework. InNovember 2015, upon the recommendation of the VAIWG, the E Committee adopted the VA Framework for Change whichrecommends charges for NAIC working groups to adjust the variable annuity statutory framework applicable to all insurers that havewritten or are writing variable annuity business. The VA Framework for Change contemplates a holistic set of reforms that wouldimprove the current reserve and capital framework and address root cause issues that result in the use of captive arrangements. Althoughthe VA Framework for Change recommends an effective date of January 1, 2017, the timing of these proposals remains uncertain. InNovember 2015, the NAIC also approved funding for a quantitative impact study, to be conducted by Oliver Wyman and involvingindustry participants including the Company, of various reforms outlined in the VA Framework for Change (the “QIS Study”).
We cannot predict what revisions, if any, will be made to the Rector framework or the Standard for application to captives that assumeXXX or AXXX business, as multiple NAIC working groups undertake their implementation, to the VA Framework for change proposal asa result of the QIS Study and ongoing NAIC deliberations, or to the Standard, if adopted for variable annuity captives. It is also unclearwhether these or other proposals will be adopted by the NAIC, or what additional actions and regulatory changes will result from thecontinued captives scrutiny and reform efforts by the NAIC and other regulatory bodies. Any regulatory action that limits our ability toachieve desired benefits from the use of or materially increases our cost of using captive reinsurance companies, either retroactively orprospectively, including, if adopted as proposed, without grandfathering provisions for existing captive variable annuity reinsurance entities,the Standard, could have a material adverse effect on our financial condition or results of operations. For more detail see “Item 7.Management’s Discussion and Analysis of Financial Condition and Results of Operations—Liquidity and Capital Resources—StatutoryCapital and Risk-Based Capital of Principal Insurance Subsidiaries—Captive Reinsurance Subsidiaries.”
Insurance regulators have implemented, or begun to implement significant changes in the way in which insurers must determinestatutory reserves and capital, particularly for products with contractual guarantees such as variable annuities and universal lifepolicies, and are considering further potentially significant changes in these requirements. The NAIC is currently working oncomprehensive reforms related to life insurance reserves and the accounting for such reserves. The timing and extent of furtherchanges to statutory reserves and reporting requirements are uncertain.
73

In addition, state insurance regulators are becoming more active in adopting and enforcing suitability standards with respect tosales of fixed, indexed and variable annuities. In particular, the NAIC has adopted a revised SAT, which will, if enacted by thestates, place new responsibilities upon issuing insurance companies with respect to the suitability of annuity sales, includingresponsibilities for training agents. Several states have already enacted laws based on the SAT.
In addition to the foregoing risks, the financial services industry is the focus of increased regulatory scrutiny as various state andfederal governmental agencies and self-regulatory organizations conduct inquiries and investigations into the products and practices ofthe financial services industries. For a description of certain regulatory inquiries affecting the Company, see the Litigation andRegulatory Matters section of the Commitments and Contingencies Note in our Consolidated Financial Statements in Part II, Item 8.of this Annual Report on Form 10-K. It is possible that future regulatory inquiries or investigations involving the insurance industrygenerally, or the Company specifically, could materially and adversely affect our business, results of operations or financial condition.
In some cases, this regulatory scrutiny has led to legislation and regulation, or proposed legislation and regulation that could significantlyaffect the financial services industry, or has resulted in regulatory penalties, settlements and litigation. New laws, regulations and otherregulatory actions aimed at the business practices under scrutiny could materially and adversely affect our business, results of operationsor financial condition. The adoption of new laws and regulations, enforcement actions, or litigation, whether or not involving us, couldinfluence the manner in which we distribute our products, result in negative coverage of the industry by the media, cause significant harmto our reputation and materially and adversely affect our business, results of operations or financial condition.
Our products are subject to extensive regulation and failure to meet any of the complex product requirements may reduce profitability.
Our insurance, annuity, retirement and investment products are subject to a complex and extensive array of state and federal tax,securities, insurance and employee benefit plan laws and regulations, which are administered and enforced by a number ofdifferent governmental and self-regulatory authorities, including state insurance regulators, state securities administrators, statebanking authorities, the SEC, FINRA, the DOL and the IRS.
For example, U.S. federal income tax law imposes requirements relating to insurance and annuity product design, administrationand investments that are conditions for beneficial tax treatment of such products under the Internal Revenue Code. Additionally,state and federal securities and insurance laws impose requirements relating to insurance and annuity product design, offeringand distribution and administration. Failure to administer product features in accordance with contract provisions or applicablelaw, or to meet any of these complex tax, securities, or insurance requirements could subject us to administrative penaltiesimposed by a particular governmental or self-regulatory authority, unanticipated costs associated with remedying such failure orother claims, harm to our reputation, interruption of our operations or adversely impact profitability.
The Dodd-Frank Act, its implementing regulations and other financial regulatory reform initiatives could have adverseconsequences for the financial services industry, including us, and/or materially affect our results of operations, financialcondition or liquidity.
On July 21, 2010, the Dodd-Frank Act was signed into law. It effects comprehensive changes to the regulation of financial services in theUnited States. The Dodd-Frank Act directs existing and newly-created government agencies and bodies to perform studies andpromulgate a multitude of regulations implementing the law, a process that is underway and is expected to continue over the next fewyears. While some studies have already been completed and the rule-making process is well underway, there continues to be significantuncertainty regarding the results of ongoing studies and the ultimate requirements of regulations that have not yet been adopted. Wecannot predict with certainty how the Dodd-Frank Act and such regulations will affect the financial markets generally, or impact ourbusiness, ratings, results of operations, financial condition or liquidity. The Dodd-Frank Act’s potential effects could include:
• If designated by the FSOC as a nonbank financial company subject to supervision by the Federal Reserve, we wouldbecome subject to a comprehensive system of prudential regulation, including minimum capital requirements, liquiditystandards, credit exposure requirements, overall risk management requirements, management interlock prohibitions, arequirement to maintain a plan for rapid and orderly dissolution in the event of severe financial distress, stress testing,additional fees and assessments and restrictions on proprietary trading and certain investments. The exact scope andconsequences of these standards are subject to ongoing rulemaking activity by various federal banking regulators andtherefore are currently unclear. However, this comprehensive system of prudential regulation, if applied to us, wouldsignificantly impact the manner in which we operate and could materially and adversely impact the profitability of one or
74
more of our business lines or the level of capital required to support our activities. In designating non-bank financialcompanies for heightened prudential regulation by the Federal Reserve, the FSOC considers, among other matters, theirscope, size, and potential impact of their activities on the financial stability of the United States.
• Title II of the Dodd-Frank Act provides that a financial company, such as us, may be subject to a special orderlyliquidation process outside the federal bankruptcy code, administered by the Federal Deposit Insurance Corporation asreceiver, upon a determination that it is in default or in danger of default and presents a systemic risk to U.S. financialstability. We cannot predict how rating agencies, or creditors of us or our subsidiaries, will evaluate this potential orwhether it will impact our financing or hedging costs.
• Title VII of the Dodd-Frank Act creates a new framework for regulation of the OTC derivatives markets. New marginand capital requirements on market participants could substantially increase the cost of hedging and relatedoperations, affect the profitability of our products or their attractiveness to our customers, or cause us to alter ourhedging strategy or change the composition of the risks we do not hedge.
• Pursuant to requirements of the Dodd-Frank Act, the SEC and CFTC are required to undertake a study to determinewhether stable value contracts should be regulated as “swap” derivative contracts. Pending such determination, stablevalue contracts are not subject to the swap provisions of this legislation. In the event that stable value contractsbecome subject to such regulation, certain aspects of our business could be adversely impacted, including issuance ofstable value contracts and management of assets pursuant to stable value mandates.
• The Dodd-Frank Act establishes the FIO within the Treasury Department. While not having a general supervisory orregulatory authority over the business of insurance, the director of this office performs various functions with respectto insurance, including participating in the FSOC’s decisions regarding insurers to be designated for stricter regulationby the Federal Reserve. The Dodd-Frank Act also required the director of FIO to conduct a study on how tomodernize and improve the system of insurance regulation in the United States. The director issued that report inDecember 2013, recommending, , increased federal involvement in certain areas of insurance regulation to improveuniformity, and setting out recommendations in areas of near-term reform for the states, including prudential andmarketplace oversight. The report also recommended, in part, that states develop a uniform and transparent solvencyoversight regime for the transfer of risk to reinsurance captives, and adopt a uniform capital requirement forreinsurance captives, including a prohibition on transactions that do not constitute legitimate risk transfer. FIO has anongoing charge to monitor all aspects of the insurance industry and will monitor state regulatory developments,including those called for in its report and present options for federal involvement if deemed necessary.
The Dodd-Frank Act also includes various securities law reforms that may affect our business practices. See “—Changes in U.S.federal and state securities laws and regulations may affect our operations and our profitability” below.
Although the full impact of the Dodd-Frank Act cannot be determined until the various studies mandated by the law areconducted and implementing regulations are adopted, many of the legislation’s requirements could have profound and/oradverse consequences for the financial services industry, including for us. The Dodd-Frank Act could make it more expensivefor us to conduct business, require us to make changes to our business model or satisfy increased capital requirements, subjectus to greater regulatory scrutiny or to potential increases in whistleblower claims in light of the increased awards available towhistleblowers under the Act and have a material adverse effect on our results of operations or financial condition.
See “Item 1. Business—Regulation” for further discussion of the impact of the Dodd-Frank Act on our businesses.
Changes in U.S. federal and state securities laws and regulations may affect our operations and our profitability.
U.S. federal and state securities laws apply to sales of our mutual funds and to our variable annuity and variable life insuranceproducts (which are considered to be both insurance products and securities) as well as to sales of third-party investmentproducts. As a result, some of our subsidiaries and the products they offer are subject to regulation under these federal and statesecurities laws. Our insurance subsidiaries’ separate accounts are registered as investment companies under the InvestmentCompany Act. Some variable annuity contracts and variable life insurance policies issued by our insurance subsidiaries also areregistered under the Securities Act. Other subsidiaries are registered as broker-dealers under the Exchange Act, are members of,and subject to, regulation by FINRA, and are also registered as broker-dealers in various states, as applicable. In addition, someof our subsidiaries are registered as investment advisers under the Investment Advisers Act.
75
Securities laws and regulations are primarily intended to ensure the integrity of the financial markets and to protect investors in thesecurities markets or investment advisory or brokerage clients. These laws and regulations generally grant supervisory agenciesbroad administrative powers, including the power to limit or restrict the conduct of business for failure to comply with those lawsand regulations. A number of changes have recently been proposed to the laws and regulations that govern the conduct of ourvariable insurance products business and our distributors that could have a material adverse effect on our results of operations andfinancial condition. For example, the Dodd-Frank Act authorizes the SEC to establish a standard of conduct applicable to brokersand dealers when providing personalized investment advice to retail customers. This standard of conduct would be to act in the bestinterest of the customer without regard to the financial or other interest of the broker or dealer providing the advice. Further,proposals have been made that the SEC establish a self-regulatory organization with respect to registered investment advisers, whichcould increase the level of regulatory oversight over them. Changes to these laws or regulations that restrict the conduct of ourbusiness could have an adverse effect on our results of operations and financial condition.
Changes to federal regulations could adversely affect our distribution model by restricting our ability to provide customers with advice.
The prohibited transaction rules of ERISA and the Internal Revenue Code generally restrict providing investment advice toERISA plans and participants and IRAs if the investment recommendation results in fees paid to the individual advisor, his or herfirm or their affiliates that vary according to the investment recommendation chosen. In March 2010, the DOL issued proposedregulations that provide limited relief from these investment advice restrictions. The DOL issued final rules in October of 2011and did not provide additional relief regarding these restrictions. As a result, the ability of certain of our investment advisorysubsidiaries and their advisory representatives to provide investment advice to ERISA plans and participants, and with respect toIRAs, will likely be significantly restricted. Also, the fee and revenue arrangements of certain advisory programs may be requiredto be revenue neutral, resulting in potential lost revenues for these investment advisers and their affiliates.
Other proposed regulatory initiatives under ERISA may negatively impact our broker-dealer subsidiaries. In particular, in April2015, the DOL issued a proposed rule that would, if adopted as proposed, broaden the definition of “fiduciary” for purposes ofERISA and the Internal Revenue Code, as it applies to a person or entity providing investment advice with respect to ERISAplans or IRAs. As proposed, the rule would expand the circumstances in which providers of investment advice to small plansponsors, plan participants and beneficiaries, and IRA investors are deemed to act in a fiduciary capacity. The rule would requiresuch providers to act in their clients’ “best interests”, not influenced by any conflicts of interest, including due to the direct orindirect receipt of compensation. Although the DOL concurrently proposed a “best interest contract exemption” intended toenable continuation of certain existing industry practices relating to receipt of commissions and other compensation, theexemption includes conditions and requirements that may make it difficult to rely upon in practice.
Although the final outcome of the DOL rulemaking remains uncertain, the proposed rule, if adopted in its current form, could adverselyaffect our service model regarding ERISA plan distribution support, investment education, rollover discussions with plan participants andbeneficiaries, and investment support of IRA owners. The proposed rule could have a material impact on the level and type of services wecan provide as well as the nature and amount of compensation and fees we and our advisors and employees may receive for investment-related services. In addition, the proposed rule may make it easier for the DOL in enforcement actions, and for plaintiffs’ attorneys in ERISAlitigation, to attempt to extend fiduciary status to, or to claim fiduciary or contractual breach by, advisors who would not be deemedfiduciaries under current regulations. Compliance with the proposed rule could also increase our overall operational costs for providing someof the services we currently provide. See “Item 1. Business—Regulation—Employee Retirement Income Security Act Considerations”.
In November 2015, the DOL published a proposed rule that would exempt certain state-sponsored IRA savings plans fromERISA. This rule, if enacted, would enable the growth of state-sponsored IRA savings plans for the currently underserved small-employer market, where there has been limited adoption of workplace retirement savings plans. We do not believe the rule wouldhave a material impact on our business, as the state-sponsored plans would be aimed at workers who do not currently participatein any workplace retirement plan.
Finally, the DOL has issued a number of regulations recently, and may issue additional similar regulations, that increase the levelof disclosure that must be provided to plan sponsors and participants. These ERISA disclosure requirements will likely increasethe regulatory and compliance burden upon us, resulting in increased costs.
Changes in U.S. pension laws and regulations may affect our results of operations and our profitability.
Congress from time to time considers pension reform legislation that could decrease the attractiveness of certain of our retirementproducts and services to retirement plan sponsors and administrators or have an unfavorable effect on our ability to earn revenues from
76
these products and services. In this regard, the Pension Protection Act of 2006 made significant changes in employer pension fundingobligations associated with defined benefit pension plans that are likely to increase sponsors’ costs of maintaining these plans andimposed certain requirements on defined contribution plans. Over time, these changes could negatively impact our sales of definedbenefit or defined contribution plan products and services and cause sponsors to discontinue existing plans for which we provideinsurance, asset management, administrative, or other services. Certain tax-favored savings initiatives that have been proposed couldhinder sales and persistency of our products and services that support employment-based retirement plans.
The Preservation of Access to Care for Medicare Beneficiaries and Pension Relief Act of 2010 also includes certain provisionsfor defined benefit pension plan funding relief. These provisions may impact the likelihood of corporate plan sponsorsterminating their plans and/or engaging in transactions to partially or fully transfer pension obligations to an insurancecompany. As part of our retirement services segment, we offer general account and separate account group annuity products thatenable a plan sponsor to transfer these risks, often in connection with the termination of defined benefit pension plans.Consequently, this legislation could indirectly affect the mix of our business, with fewer closeouts and more non-guaranteedfunding products, and adversely impact our results of operations.
We may not be able to mitigate the reserve strain associated with Regulation XXX and AG38, potentially resulting in anegative impact on our capital position or in a need to increase prices and/or reduce sales of term or universal life products.
Regulation XXX requires insurers to establish additional statutory reserves for certain term life insurance policies with long-term premium guarantees and for certain universal life policies with secondary guarantees. In addition, AG38 clarifies theapplication of Regulation XXX with respect to certain universal life insurance policies with secondary guarantees. Many of ournewly issued term insurance products and an increasing number of our universal life insurance products are affected byRegulation XXX and AG38, respectively. The application of both Regulation XXX and AG38 involves numerousinterpretations. At times, there may be differences of opinion between management and state insurance departments regardingthe application of these and other actuarial standards. Such differences of opinion may lead to a state insurance regulatorrequiring greater reserves to support insurance liabilities than management estimated.
We have implemented reinsurance and capital management actions to mitigate the capital impact of Regulation XXX and AG38, includingthe use of LOCs and the implementation of other transactions that provide acceptable collateral to support the reinsurance of the liabilitiesto wholly owned reinsurance captives or to third-party reinsurers. These arrangements are subject to review and approval by state insuranceregulators and review by rating agencies. State insurance regulators, the NAIC and other regulatory bodies are also investigating the use ofwholly owned reinsurance captives to reinsure these liabilities and the NAIC has made recent advances in captives reform. During 2014and 2015, the NAIC adopted captives proposals applicable to captives that assume Regulation XXX and AG38 reserves. See “Ourinsurance businesses are heavily regulated, and changes in regulation in the United States, enforcement actions and regulatoryinvestigations may reduce profitability” above and “Item 7. Management’s Discussion and Analysis of Financial Condition and Results ofOperations—Liquidity and Capital Resources—Statutory Capital and Risk-Based Capital of Principal Insurance Subsidiaries—CaptiveReinsurance Subsidiaries.” Rating agencies may include a portion of these LOCs or other collateral in their leverage calculations, whichcould increase their assessment of our leverage ratios and potentially impact our ratings. We cannot provide assurance that our ability to usecaptive reinsurance companies to achieve the desired benefit from financing statutory reserves will not be limited or that there will not beregulatory or rating agency challenges to the reinsurance and capital management actions we have taken to date or that acceptable collateralobtained through such transactions will continue to be available or available on a cost-effective basis.
The result of these potential challenges, as well as the inability to obtain acceptable collateral, could require us to increasestatutory reserves, incur higher operating and/or tax costs or reduce sales. Because term and universal life insurance areparticularly price-sensitive products, any increase in premiums charged on these products to compensate us for the increasedstatutory reserve requirements or higher costs of reinsurance may result in a significant loss of volume and materially andadversely affect our life insurance business.
Certain of the reserve financing facilities we have put in place will mature prior to the run off of the liabilities they support. As aresult, we cannot provide assurance that we will be able to continue to maintain collateral support related to our captivesreinsurance subsidiaries or our Arizona captive. If we are unable to continue to maintain collateral support related to our captivereinsurance subsidiaries or our Arizona captive, we may be required to increase statutory reserves or incur higher operating and/or tax costs than we currently anticipate.
77

Changes in tax laws and interpretations of existing tax law could increase our tax costs, impact the ability of our insurancecompany subsidiaries to make distributions to Voya Financial, Inc. or make our insurance, annuity and investment productless attractive to customers.
Changes in tax laws could increase our taxes and our effective tax rates. For example, the Obama Administration has proposedmodifying the dividends received deduction for life insurance company separate accounts, and such a modification could significantlyreduce or eliminate the dividends received deduction that we are able to claim for dividends received in separate accounts. As such, thedividend received deduction is a significant component of the difference between our actual tax expense and the expected tax expensedetermined using the federal statutory income tax rate of 35%. Also, interpretation and enforcement of existing tax law could changeand could be applied to us as part of an IRS examination and increase our tax costs. In the course of such examinations, we haveentered into agreements with the IRS to resolve issues related to (1) the application of the Section 382 limitation, (2) whether certainderivative transactions qualify for hedge treatment, (3) the proper treatment of valid tax hedge gains and losses and (4) “other thantemporary impairment” losses. These agreements may be superseded by future enacted laws, regulations or public guidance thatincrease our taxes and our effective tax rates. Further, changes in tax rates could affect the amount of our deferred tax assets anddeferred tax liabilities. One such change relates to the current debate over corporate tax reform and corporate tax rates. A reduction inthe top federal tax rate would result in lower statutory deferred tax assets. Such a reduction in the statutory deferred tax asset mayimpact the ability of the affected insurance subsidiaries to make distributions to us and consequently could negatively impact ourability to pay dividends to our stockholders and to service our debt.
Changes in tax laws could make some of our insurance, annuity and investment products less attractive to customers. Current U.S.federal income tax law permits tax-deferred accumulation of income earned under life insurance and annuity products, and permitsexclusion from taxation of death benefits paid under life insurance contracts. Changes in tax laws that restrict these tax benefitscould make some of our products less attractive to customers. Reductions in individual income tax rates or estate tax rates couldalso make some of our products less advantageous to customers. Changes in federal tax laws that reduce the amount an individualcan contribute on a pre-tax basis to an employer-provided, tax-deferred product (either directly by reducing current limits orindirectly by changing the tax treatment of such contributions from exclusions to deductions) or changes that would limit anindividual’s aggregate amount of tax-deferred savings could make our retirement products less attractive to consumers.
Congress has signaled interest in possibly pursuing limited international tax reform. If successful it is unlikely to result in reducingcorporate tax rates by broadening the taxable income base. Also viewed as unlikely is a reduction of tax preferences, including possiblythe reduction or elimination of tax preferences associated with our industry. States that stand to lose tax revenue of their own will exertpressure on the federal government not to enact additional measures as part of comprehensive tax reform that would negatively impactthem. Such a situation may result in more pressure on raising revenue from tax preferences associated with our Company and products.
Risks Related to Our Holding Company Structure
As holding companies, Voya Financial, Inc. and Voya Holdings depend on the ability of their subsidiaries to transfer fundsto them to meet their obligations.
Voya Financial, Inc. is the holding company for all our operations, and dividends, returns of capital and interest income onintercompany indebtedness from Voya Financial, Inc.’s subsidiaries are the principal sources of funds available to Voya Financial,Inc. to pay principal and interest on its outstanding indebtedness, to pay corporate operating expenses, to pay any stockholderdividends, to repurchase any stock, and to meet its other obligations. The subsidiaries of Voya Financial, Inc. are legally distinctfrom Voya Financial, Inc. and, except in the case of Voya Holdings Inc., which is the guarantor of certain of our outstandingindebtedness, have no obligation to pay amounts due on the debt of Voya Financial, Inc. or to make funds available to VoyaFinancial, Inc. for such payments. The ability of our subsidiaries to pay dividends or other distributions to Voya Financial, Inc. inthe future will depend on their earnings, tax considerations, covenants contained in any financing or other agreements andapplicable regulatory restrictions. In addition, such payments may be limited as a result of claims against our subsidiaries by theircreditors, including suppliers, vendors, lessors and employees. The ability of our insurance subsidiaries to pay dividends and makeother distributions to Voya Financial, Inc. will further depend on their ability to meet applicable regulatory standards and receiveregulatory approvals, as discussed below under “—The ability of our insurance subsidiaries to pay dividends and other distributionsto Voya Financial, Inc. and Voya Holdings is further limited by state insurance laws, and our insurance subsidiaries may notgenerate sufficient statutory earnings or have sufficient statutory surplus to enable them to pay ordinary dividends.”
Voya Holdings is wholly owned by Voya Financial, Inc. and is also a holding company, and accordingly its ability to makepayments under its guarantees of our indebtedness or on the debt for which it is the primary obligor is subject to restrictions and
78
limitations similar to those applicable to Voya Financial, Inc. Neither Voya Financial, Inc., nor Voya Holdings, has significantsources of cash flows other than from our subsidiaries that do not guarantee such indebtedness.
If the ability of our insurance or non-insurance subsidiaries to pay dividends or make other distributions or payments to VoyaFinancial, Inc. and Voya Holdings is materially restricted by regulatory requirements, other cash needs, bankruptcy orinsolvency, or our need to maintain the financial strength ratings of our insurance subsidiaries, or is limited due to operatingresults or other factors, we may be required to raise cash through the incurrence of debt, the issuance of equity or the sale ofassets. However, there is no assurance that we would be able to raise cash by these means. This could materially and adverselyaffect the ability of Voya Financial, Inc. and Voya Holdings to pay their obligations.
The ability of our insurance subsidiaries to pay dividends and other distributions to Voya Financial, Inc. and Voya HoldingsInc. is limited by state insurance laws, and our insurance subsidiaries may not generate sufficient statutory earnings or havesufficient statutory surplus to enable them to pay ordinary dividends.
The payment of dividends and other distributions to Voya Financial, Inc. and Voya Holdings Inc.by our insurance subsidiaries isregulated by state insurance laws and regulations.
The jurisdictions in which our insurance subsidiaries are domiciled impose certain restrictions on the ability to pay dividends to theirrespective parents. These restrictions are based, in part, on the prior year’s statutory income and surplus. In general, dividends up tospecified levels are considered ordinary and may be paid without prior regulatory approval. Dividends in larger amounts, orextraordinary dividends, are subject to approval by the insurance commissioner of the relevant state of domicile. Under the insurancelaws applicable to our insurance subsidiaries domiciled in Connecticut, Iowa and Minnesota, an extraordinary dividend or distribution isdefined as a dividend or distribution that, together with other dividends and distributions made within the preceding twelve months,exceeds the greater of (1) 10% of the insurer’s policyholder surplus as of the preceding December 31 or (2) the insurer’s net gain fromoperations for the twelve-month period ended the preceding December 31, in each case determined in accordance with statutoryaccounting principles. Under Colorado insurance law, an extraordinary dividend or distribution is defined as a dividend or distributionthat, together with other dividends and distributions made within the preceding twelve months, exceeds the lesser of (1) 10% of theinsurer’s policyholder surplus as of the preceding December 31 or (2) the insurer’s net gain from operations for the twelve-month periodended the preceding December 31, in each case determined in accordance with statutory accounting principles. New York has similarrestrictions, except that New York’s statutory definition of extraordinary dividend or distribution is an aggregate amount in any calendaryear that exceeds the lesser of (1) 10% of policyholder’s surplus as of the preceding December 31 or (2) the insurer’s net gain fromoperations for the twelve-month period ended the preceding December 31, not including realized capital gains. In addition, under theinsurance laws applicable to our insurance subsidiaries domiciled in Connecticut, Iowa and Minnesota, no dividend or other distributionexceeding an amount equal to an insurance company’s earned surplus may be paid without the domiciliary insurance regulator’s priorapproval (the “positive earned surplus requirement”). From time to time, the NAIC and various state insurance regulators haveconsidered, and may in the future consider, proposals to further limit dividend payments that an insurance company may make withoutregulatory approval. More stringent restrictions on dividend payments may be adopted from time to time by jurisdictions in which ourinsurance subsidiaries are domiciled, and such restrictions could have the effect, under certain circumstances, of significantly reducingdividends or other amounts payable to Voya Financial, Inc. or Voya Holdings by our insurance subsidiaries without prior approval byregulatory authorities. In addition, in the future, we may become subject to debt instruments or other agreements that limit the ability ofour insurance subsidiaries to pay dividends or make other distributions. The ability of our insurance subsidiaries to pay dividends ormake other distributions is also limited by our need to maintain the financial strength ratings assigned to such subsidiaries by the ratingagencies. These ratings depend to a large extent on the capitalization levels of our insurance subsidiaries.
Prior to our initial public offering, our Principal Insurance Subsidiaries domiciled in Colorado, Iowa and Minnesota each hadnegative earned surplus accounts, and therefore had no ordinary dividend capacity. In order to obtain dividends or distributionsfrom these insurance companies, we historically obtained approval from the insurance companies’ respective domiciliary stateregulators, which could be granted or withheld in the regulators’ discretion, for extraordinary dividends or distributions. OnMay 8, 2013, in connection with the completion of our IPO and payment of $1,434.0 million of extraordinary distributions,these insurance companies each were permitted to reset their respective negative unassigned funds account as of December 31,2012 (as reported in their respective 2012 statutory annual statements) to zero (with an offsetting reduction in gross paid-incapital and contributed surplus). These resets were made pursuant to permitted practices in accordance with statutory accountingpractices granted by their respective domiciliary insurance regulators. A detailed description of the permitted practices isincluded in “Item 1. Business—Regulation—Insurance Regulation—Insurance Holding Company Regulation.”
This reset allowed our Principal Insurance Subsidiaries domiciled in Colorado, Iowa and Minnesota to build up ordinarydividend capacity to the extent their operating results subsequent to December 31, 2012 generated positive earned surplus.
79
Based on legislative amendments adopted by the Colorado legislature in 2014, from and after July 1, 2014, our PrincipalInsurance Subsidiary domiciled in Colorado is no longer subject to the positive earned surplus requirement although it hadsufficient positive earned surplus to pay an ordinary dividend in 2014. Under applicable domiciliary insurance regulations, ourPrincipal Insurance Subsidiaries must deduct any distributions or dividends paid in the preceding twelve months in calculatingdividend capacity. Our Principal Insurance Subsidiaries domiciled in Iowa and Minnesota had sufficient positive earned surplusto pay ordinary dividends in 2014. VRIAC had ordinary dividend capacity in December 2013 and also in 2014 and 2015. In2015, our Principal Insurance Subsidiaries domiciled in Colorado, Iowa and Minnesota generated capital in excess of ourcombined RBC ratio of 425% and our individual insurance company ordinary dividend limits, and they sought and receiveddomiciliary insurance regulatory approval for, and paid, extraordinary distributions in the aggregate amount of $508.0. OurPrincipal Insurance Subsidiaries domiciled in Colorado, Connecticut and Iowa each have ordinary dividend capacity for 2016.However, as a result of the extraordinary dividend it paid in 2015, our Principal Insurance Subsidiary domiciled in Minnesotacurrently has negative earned surplus and therefore does not have capacity at this time to make ordinary dividend payments toVoya Holdings Inc. without domiciliary regulatory approval, which can be granted or withheld in the discretion of the regulator.
If any of our Principal Insurance Subsidiaries do not succeed in building up sufficient positive earned surplus to have ordinarydividend capacity in future years, such subsidiary would be unable to pay dividends or distributions to our holding companies absentprior approval of its domiciliary insurance regulator, which can be granted or withheld in the discretion of the regulator. In addition, ifour Principal Insurance Subsidiaries generate capital in excess of our target combined estimated RBC ratio of 425% and our individualinsurance company ordinary dividend limits in future years, then we may also seek extraordinary dividends or distributions. There canbe no assurance that our Principal Insurance Subsidiaries will receive approval for extraordinary distribution payments in the future.
The payment of dividends by our captive reinsurance subsidiaries is regulated by their respective governing licensing orders andrestrictions in their respective insurance securitization agreements. Generally, our captive reinsurance subsidiaries may notdeclare or pay dividends in any form to their parent companies other than in accordance with their respective insurancesecuritization transaction agreements and their respective governing licensing orders, and in no event may the dividendsdecrease the capital of the captive below the minimum capital requirement applicable to it, and, after giving effect to thedividends, the assets of the captive paying the dividend must be sufficient to satisfy its domiciliary insurance regulator that itcan meet its obligations. Likewise, our Arizona captive may not declare or pay dividends in any form to us other than inaccordance with its annual capital and dividend plan as approved by the ADOI, which includes a minimum capital requirement.
Item 1B. Unresolved Staff Comments
None.
Item 2. Properties
As of December 31, 2015, we owned or leased 69 locations totaling approximately 2.1 million square feet, of whichapproximately 0.8 million square feet was owned properties and approximately 1.3 million square feet was leased propertiesthroughout the United States.
Item 3. Legal Proceedings
See the Litigation and Regulatory Matters section of the Commitments and Contingencies Note in our Consolidated FinancialStatements in Part II, Item 8. of this Annual Report on Form 10-K for a description of our material legal proceedings.
Item 4. Mine Safety Disclosures
Not Applicable.
80

PART II
Item 5. Market for Registrant’s Common Equity, Related Stockholder Matters and Issuer Purchases of EquitySecurities
Issuer Common Equity
Voya Financial, Inc.’s common stock, par value $0.01 per share, began trading on the NYSE under the symbol “VOYA” onMay 2, 2013.
The following table summarizes high and low sales prices for the common stock on the NYSE for the periods indicated and thedividends declared per share during such periods:
2015 High LowDividendsdeclared
1st Quarter . . . . . . . . . . . . . . . . . . . . . . . . . . . . . . . . . . . . . . . . . . . . . . . . . . . $44.97 $38.28 $0.012nd Quarter . . . . . . . . . . . . . . . . . . . . . . . . . . . . . . . . . . . . . . . . . . . . . . . . . . 48.30 41.92 0.013rd Quarter . . . . . . . . . . . . . . . . . . . . . . . . . . . . . . . . . . . . . . . . . . . . . . . . . . . 48.08 36.96 0.014th Quarter . . . . . . . . . . . . . . . . . . . . . . . . . . . . . . . . . . . . . . . . . . . . . . . . . . . $42.45 $35.77 $0.01
2014 High LowDividendsdeclared
1st Quarter . . . . . . . . . . . . . . . . . . . . . . . . . . . . . . . . . . . . . . . . . . . . . . . . . . . $37.75 $32.70 $0.012nd Quarter . . . . . . . . . . . . . . . . . . . . . . . . . . . . . . . . . . . . . . . . . . . . . . . . . . 37.59 32.60 0.013rd Quarter . . . . . . . . . . . . . . . . . . . . . . . . . . . . . . . . . . . . . . . . . . . . . . . . . . . 40.08 35.73 0.014th Quarter . . . . . . . . . . . . . . . . . . . . . . . . . . . . . . . . . . . . . . . . . . . . . . . . . . . $43.35 $33.94 $0.01
The declaration and payment of dividends is subject to the discretion of our Board of Directors and depends on Voya Financial,Inc.’s financial condition, results of operations, cash requirements, future prospects, regulatory restrictions on the payment ofdividends by Voya Financial, Inc.’s other insurance subsidiaries and other factors deemed relevant by the Board. The paymentof dividends is also subject to restrictions under the terms of our junior subordinated debentures in the event we should chooseto defer interest payments on those debentures. See Management’s Discussion and Analysis of Financial Condition and Resultsof Operations-Liquidity and Capital Resources in Part II, Item 7. of this Annual Report on Form 10-K for further informationregarding common stock dividends.
At February 22, 2016, there was one stockholder of record of common stock, which is different from the number of beneficialowners of the Company’s common stock.
81
Purchases of Equity Securities by the Issuer
The following table summarizes Voya Financial, Inc.’s repurchases of its common stock for the three months endedDecember 31, 2015:
Period
TotalNumber of
SharesPurchased
AveragePricePaidPer
Share
Total Number ofShares Purchasedas Part of PubliclyAnnounced Plans
or Programs
Approximate DollarValue of Shares that
May Yet BePurchased Under the
Plans or Programs
(in millions)
October 1, 2015 - October 31, 2015 . . . . . . . . . . . . . . . . . . . . . . . . . — $ — — $170.4November 1, 2015 - November 30, 2015 . . . . . . . . . . . . . . . . . . . . . 2,538,815 41.24 2,538,815 65.8December 1, 2015 - December 31, 2015 . . . . . . . . . . . . . . . . . . . . . . 3,719,475(1) 39.10 3,719,475 20.3
Total . . . . . . . . . . . . . . . . . . . . . . . . . . . . . . . . . . . . . . . . . . . . . . . . . 6,258,290 $39.97 6,258,290 N/A
(1) Includes 2,534,475 shares delivered upon termination of a $100.0 million share repurchase arrangement entered into onSeptember 23, 2015. The transaction settled at a per-share repurchase price of $39.46, which was determined based on aformula incorporating the volume weighted average price of the Company’s common stock over the relevant purchaseperiod.
In connection with the vesting of equity-based compensation awards, employees may remit to Voya Financial, Inc., or VoyaFinancial, Inc. may withhold into treasury stock, shares of common stock in respect of tax withholding obligations associatedwith such vesting. For the three months ended December 31, 2015, there were 1,080 Treasury share increases in connection withsuch withholding activities.
Refer to the Share-based Incentive Compensation Plans Note in our Consolidated Financial Statements in Part II, Item 8. of thisAnnual Report on Form 10-K and to Item 12. Security Ownership of Certain Beneficial Owners and Management and RelatedStockholder Matters for equity compensation information.
82
Item 6. Selected Financial Data
The following selected financial data has been derived from the Company’s Consolidated Financial Statements. The Statementof Operations data for the years ended December 31, 2015, 2014 and 2013 and the Balance Sheet data as of December 31, 2015and 2014 have been derived from the Company’s Consolidated Financial Statements included elsewhere herein. As discussed inthe Revision of Previously Issued Financial Statement section of the Business, Basis of Presentation and Significant AccountingPolicies Note in our Consolidated Financial Statements in Part II, Item 8. of this Annual Report on Form 10-K, we are revisingpreviously audited Statement of Operations data for the years ended December 31, 2014 and 2013 and the Balance Sheet data asof December 31, 2014 and 2013. Additionally, the previously audited Statement of Operations data for the years endedDecember 31, 2012 and 2011 and the Balance Sheet data as of December 31, 2012 and 2011 have also been revised due to therestatement discussed in the Revision of Previously Issued Financial Statement section of the Business, Basis of Presentationand Significant Accounting Policies Note. The selected financial data set forth below should be read in conjunction withManagement’s Discussion and Analysis of Financial Condition and Results of Operations in Part II, Item 7. of this AnnualReport on Form 10-K and the Financial Statements and Supplementary Data in our Consolidated Financial Statements in PartII, Item 8. of this Annual Report on Form 10-K.
Year Ended December 31,
2015 2014(As adjusted)
2013(As adjusted)
2012(As adjusted)
2011(As adjusted)
($ in millions, except per share amounts)
Statement of Operations Data:RevenuesNet investment income . . . . . . . . . . . . . . . . . . . . . . . . . . . . . . $ 4,637.8 $ 4,614.8 $ 4,689.0 $ 4,697.9 $ 4,968.8Fee income . . . . . . . . . . . . . . . . . . . . . . . . . . . . . . . . . . . . . . . 3,481.1 3,632.5 3,666.3 3,515.4 3,603.6Premiums . . . . . . . . . . . . . . . . . . . . . . . . . . . . . . . . . . . . . . . . 3,024.5 2,626.4 1,956.3 1,861.1 1,770.0Total net realized capital gains (losses) . . . . . . . . . . . . . . . . . (733.3) (878.4) (2,536.8) (1,263.8) (1,514.4)Total revenues . . . . . . . . . . . . . . . . . . . . . . . . . . . . . . . . . . . . 11,341.2 11,086.9 8,756.5 9,632.3 9,735.8Benefits and expenses:
Interest credited and other benefits to contract owners/policyholders . . . . . . . . . . . . . . . . . . . . . . . . . . . . . . . 6,510.0 5,937.9 4,497.8 4,861.6 5,742.0
Operating expenses . . . . . . . . . . . . . . . . . . . . . . . . . . . . . 3,103.0 3,561.7 2,686.7 3,155.0 3,030.8Net amortization of Deferred policy acquisition costs
and Value of business acquired . . . . . . . . . . . . . . . . . 663.4 379.3 442.8 722.3 387.0Interest expense . . . . . . . . . . . . . . . . . . . . . . . . . . . . . . . 196.5 189.7 184.8 153.7 139.3
Total benefits and expenses . . . . . . . . . . . . . . . . . . . . . . . . . . 10,756.7 10,285.7 8,000.4 9,009.3 9,441.0Income (loss) before income taxes . . . . . . . . . . . . . . . . . . . . . 584.5 801.2 756.1 623.0 294.8Net income (loss) . . . . . . . . . . . . . . . . . . . . . . . . . . . . . . . . . . 538.6 2,532.7 788.6 628.2 119.8Less: Net income (loss) attributable to noncontrolling
interest . . . . . . . . . . . . . . . . . . . . . . . . . . . . . . . . . . . . . . . . 130.3 237.7 190.1 138.2 190.9Net income (loss) available to Voya Financial, Inc.’s
common shareholders . . . . . . . . . . . . . . . . . . . . . . . . . . . 408.3 2,295.0 598.5 490.0 (71.1)Earnings Per Share(1)
Basic . . . . . . . . . . . . . . . . . . . . . . . . . . . . . . . . . . . . . . . . . . . . $ 1.81 $ 9.07 $ 2.39 $ 2.13 $ (0.31)
Diluted . . . . . . . . . . . . . . . . . . . . . . . . . . . . . . . . . . . . . . . . . . $ 1.80 $ 9.00 $ 2.38 $ 2.13 $ (0.31)
Cash dividends declared per common share . . . . . . . . . . . $ 0.04 $ 0.04 $ 0.02 $ — $ —
83
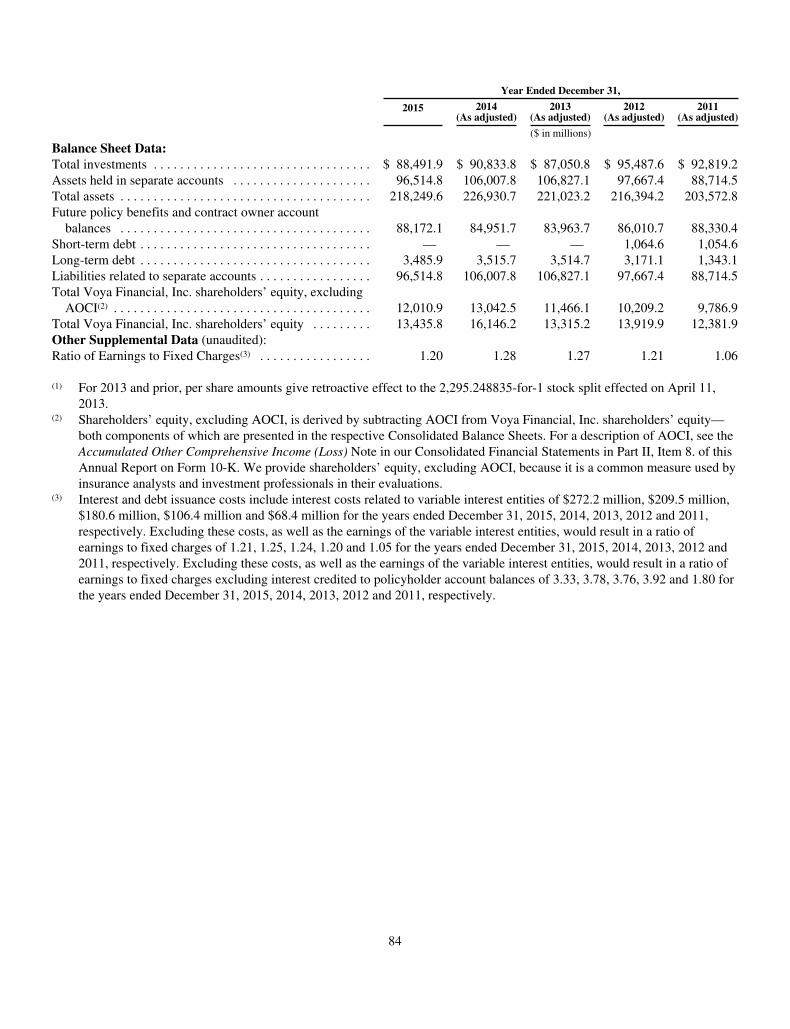
Year Ended December 31,
2015 2014(As adjusted)
2013(As adjusted)
2012(As adjusted)
2011(As adjusted)
($ in millions)
Balance Sheet Data:Total investments . . . . . . . . . . . . . . . . . . . . . . . . . . . . . . . . . $ 88,491.9 $ 90,833.8 $ 87,050.8 $ 95,487.6 $ 92,819.2Assets held in separate accounts . . . . . . . . . . . . . . . . . . . . . 96,514.8 106,007.8 106,827.1 97,667.4 88,714.5Total assets . . . . . . . . . . . . . . . . . . . . . . . . . . . . . . . . . . . . . . 218,249.6 226,930.7 221,023.2 216,394.2 203,572.8Future policy benefits and contract owner account
balances . . . . . . . . . . . . . . . . . . . . . . . . . . . . . . . . . . . . . . 88,172.1 84,951.7 83,963.7 86,010.7 88,330.4Short-term debt . . . . . . . . . . . . . . . . . . . . . . . . . . . . . . . . . . . — — — 1,064.6 1,054.6Long-term debt . . . . . . . . . . . . . . . . . . . . . . . . . . . . . . . . . . . 3,485.9 3,515.7 3,514.7 3,171.1 1,343.1Liabilities related to separate accounts . . . . . . . . . . . . . . . . . 96,514.8 106,007.8 106,827.1 97,667.4 88,714.5Total Voya Financial, Inc. shareholders’ equity, excluding
AOCI(2) . . . . . . . . . . . . . . . . . . . . . . . . . . . . . . . . . . . . . . . 12,010.9 13,042.5 11,466.1 10,209.2 9,786.9Total Voya Financial, Inc. shareholders’ equity . . . . . . . . . 13,435.8 16,146.2 13,315.2 13,919.9 12,381.9Other Supplemental Data (unaudited):Ratio of Earnings to Fixed Charges(3) . . . . . . . . . . . . . . . . . 1.20 1.28 1.27 1.21 1.06
(1) For 2013 and prior, per share amounts give retroactive effect to the 2,295.248835-for-1 stock split effected on April 11,2013.
(2) Shareholders’ equity, excluding AOCI, is derived by subtracting AOCI from Voya Financial, Inc. shareholders’ equity—both components of which are presented in the respective Consolidated Balance Sheets. For a description of AOCI, see theAccumulated Other Comprehensive Income (Loss) Note in our Consolidated Financial Statements in Part II, Item 8. of thisAnnual Report on Form 10-K. We provide shareholders’ equity, excluding AOCI, because it is a common measure used byinsurance analysts and investment professionals in their evaluations.
(3) Interest and debt issuance costs include interest costs related to variable interest entities of $272.2 million, $209.5 million,$180.6 million, $106.4 million and $68.4 million for the years ended December 31, 2015, 2014, 2013, 2012 and 2011,respectively. Excluding these costs, as well as the earnings of the variable interest entities, would result in a ratio ofearnings to fixed charges of 1.21, 1.25, 1.24, 1.20 and 1.05 for the years ended December 31, 2015, 2014, 2013, 2012 and2011, respectively. Excluding these costs, as well as the earnings of the variable interest entities, would result in a ratio ofearnings to fixed charges excluding interest credited to policyholder account balances of 3.33, 3.78, 3.76, 3.92 and 1.80 forthe years ended December 31, 2015, 2014, 2013, 2012 and 2011, respectively.
84
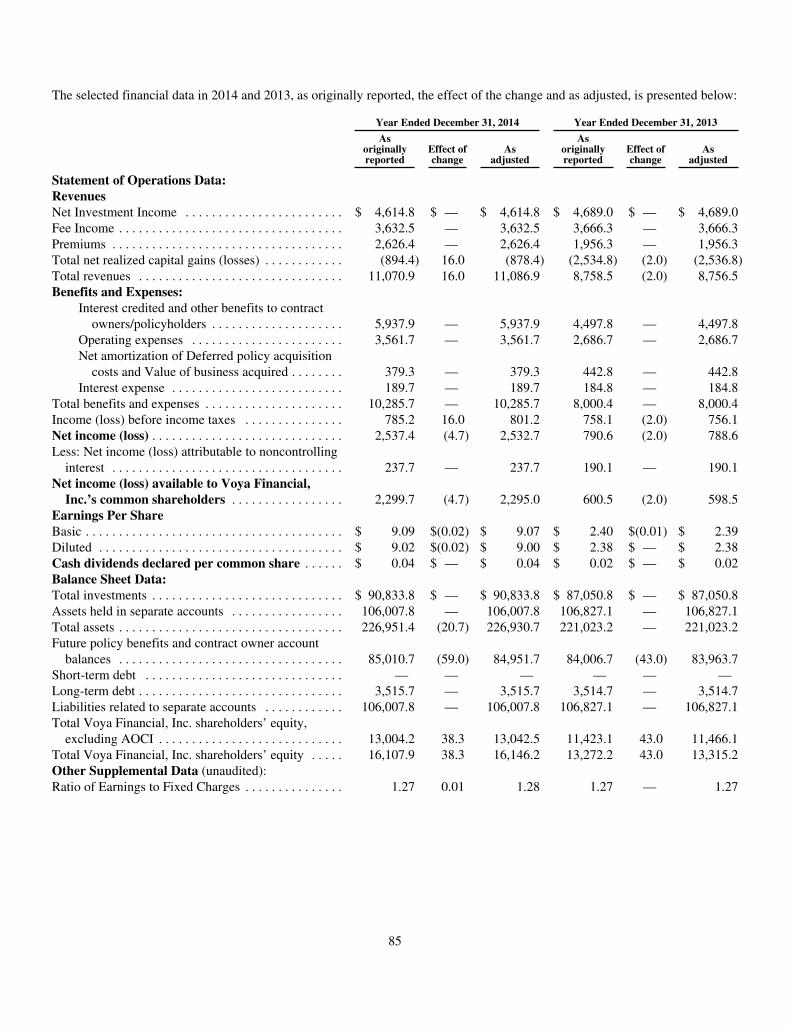
The selected financial data in 2014 and 2013, as originally reported, the effect of the change and as adjusted, is presented below:
Year Ended December 31, 2014 Year Ended December 31, 2013
Asoriginallyreported
Effect ofchange
Asadjusted
Asoriginallyreported
Effect ofchange
Asadjusted
Statement of Operations Data:RevenuesNet Investment Income . . . . . . . . . . . . . . . . . . . . . . . . $ 4,614.8 $ — $ 4,614.8 $ 4,689.0 $ — $ 4,689.0Fee Income . . . . . . . . . . . . . . . . . . . . . . . . . . . . . . . . . . 3,632.5 — 3,632.5 3,666.3 — 3,666.3Premiums . . . . . . . . . . . . . . . . . . . . . . . . . . . . . . . . . . . 2,626.4 — 2,626.4 1,956.3 — 1,956.3Total net realized capital gains (losses) . . . . . . . . . . . . (894.4) 16.0 (878.4) (2,534.8) (2.0) (2,536.8)Total revenues . . . . . . . . . . . . . . . . . . . . . . . . . . . . . . . 11,070.9 16.0 11,086.9 8,758.5 (2.0) 8,756.5Benefits and Expenses:
Interest credited and other benefits to contractowners/policyholders . . . . . . . . . . . . . . . . . . . . 5,937.9 — 5,937.9 4,497.8 — 4,497.8
Operating expenses . . . . . . . . . . . . . . . . . . . . . . . 3,561.7 — 3,561.7 2,686.7 — 2,686.7Net amortization of Deferred policy acquisition
costs and Value of business acquired . . . . . . . . 379.3 — 379.3 442.8 — 442.8Interest expense . . . . . . . . . . . . . . . . . . . . . . . . . . 189.7 — 189.7 184.8 — 184.8
Total benefits and expenses . . . . . . . . . . . . . . . . . . . . . 10,285.7 — 10,285.7 8,000.4 — 8,000.4Income (loss) before income taxes . . . . . . . . . . . . . . . 785.2 16.0 801.2 758.1 (2.0) 756.1Net income (loss) . . . . . . . . . . . . . . . . . . . . . . . . . . . . . 2,537.4 (4.7) 2,532.7 790.6 (2.0) 788.6Less: Net income (loss) attributable to noncontrolling
interest . . . . . . . . . . . . . . . . . . . . . . . . . . . . . . . . . . . 237.7 — 237.7 190.1 — 190.1Net income (loss) available to Voya Financial,
Inc.’s common shareholders . . . . . . . . . . . . . . . . . 2,299.7 (4.7) 2,295.0 600.5 (2.0) 598.5Earnings Per ShareBasic . . . . . . . . . . . . . . . . . . . . . . . . . . . . . . . . . . . . . . . $ 9.09 $(0.02) $ 9.07 $ 2.40 $(0.01) $ 2.39Diluted . . . . . . . . . . . . . . . . . . . . . . . . . . . . . . . . . . . . . $ 9.02 $(0.02) $ 9.00 $ 2.38 $ — $ 2.38Cash dividends declared per common share . . . . . . $ 0.04 $ — $ 0.04 $ 0.02 $ — $ 0.02Balance Sheet Data:Total investments . . . . . . . . . . . . . . . . . . . . . . . . . . . . . $ 90,833.8 $ — $ 90,833.8 $ 87,050.8 $ — $ 87,050.8Assets held in separate accounts . . . . . . . . . . . . . . . . . 106,007.8 — 106,007.8 106,827.1 — 106,827.1Total assets . . . . . . . . . . . . . . . . . . . . . . . . . . . . . . . . . . 226,951.4 (20.7) 226,930.7 221,023.2 — 221,023.2Future policy benefits and contract owner account
balances . . . . . . . . . . . . . . . . . . . . . . . . . . . . . . . . . . 85,010.7 (59.0) 84,951.7 84,006.7 (43.0) 83,963.7Short-term debt . . . . . . . . . . . . . . . . . . . . . . . . . . . . . . — — — — — —Long-term debt . . . . . . . . . . . . . . . . . . . . . . . . . . . . . . . 3,515.7 — 3,515.7 3,514.7 — 3,514.7Liabilities related to separate accounts . . . . . . . . . . . . 106,007.8 — 106,007.8 106,827.1 — 106,827.1Total Voya Financial, Inc. shareholders’ equity,
excluding AOCI . . . . . . . . . . . . . . . . . . . . . . . . . . . . 13,004.2 38.3 13,042.5 11,423.1 43.0 11,466.1Total Voya Financial, Inc. shareholders’ equity . . . . . 16,107.9 38.3 16,146.2 13,272.2 43.0 13,315.2Other Supplemental Data (unaudited):Ratio of Earnings to Fixed Charges . . . . . . . . . . . . . . . 1.27 0.01 1.28 1.27 — 1.27
85
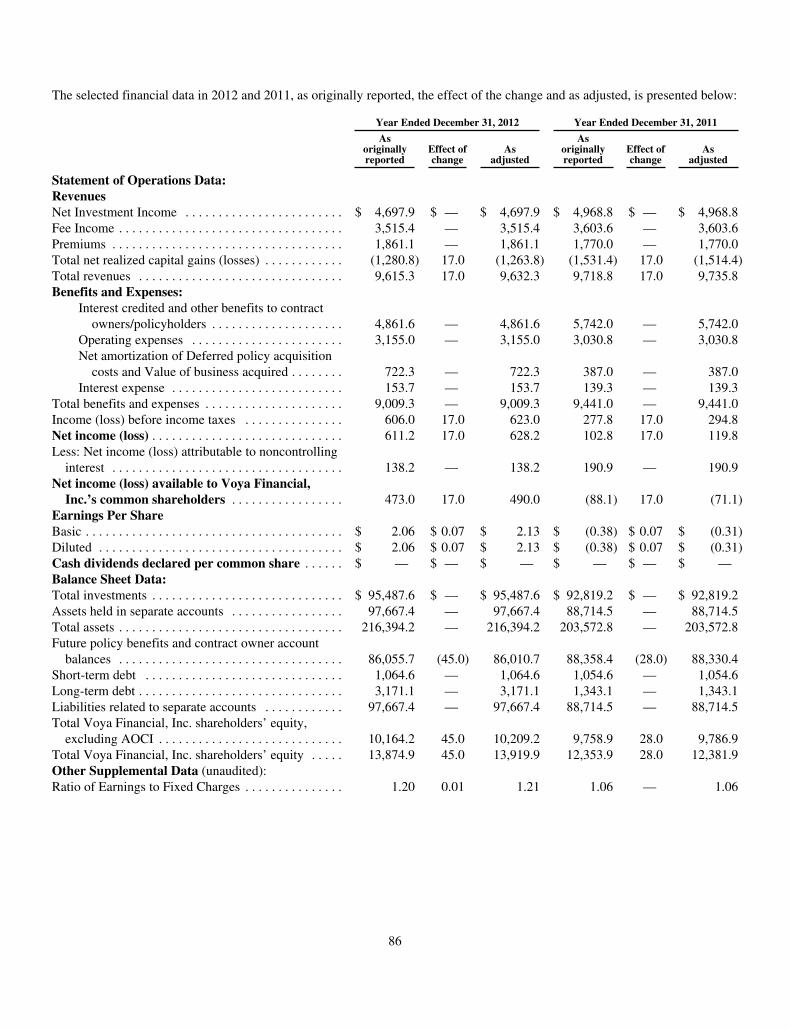
The selected financial data in 2012 and 2011, as originally reported, the effect of the change and as adjusted, is presented below:
Year Ended December 31, 2012 Year Ended December 31, 2011
Asoriginallyreported
Effect ofchange
Asadjusted
Asoriginallyreported
Effect ofchange
Asadjusted
Statement of Operations Data:RevenuesNet Investment Income . . . . . . . . . . . . . . . . . . . . . . . . $ 4,697.9 $ — $ 4,697.9 $ 4,968.8 $ — $ 4,968.8Fee Income . . . . . . . . . . . . . . . . . . . . . . . . . . . . . . . . . . 3,515.4 — 3,515.4 3,603.6 — 3,603.6Premiums . . . . . . . . . . . . . . . . . . . . . . . . . . . . . . . . . . . 1,861.1 — 1,861.1 1,770.0 — 1,770.0Total net realized capital gains (losses) . . . . . . . . . . . . (1,280.8) 17.0 (1,263.8) (1,531.4) 17.0 (1,514.4)Total revenues . . . . . . . . . . . . . . . . . . . . . . . . . . . . . . . 9,615.3 17.0 9,632.3 9,718.8 17.0 9,735.8Benefits and Expenses:
Interest credited and other benefits to contractowners/policyholders . . . . . . . . . . . . . . . . . . . . 4,861.6 — 4,861.6 5,742.0 — 5,742.0
Operating expenses . . . . . . . . . . . . . . . . . . . . . . . 3,155.0 — 3,155.0 3,030.8 — 3,030.8Net amortization of Deferred policy acquisition
costs and Value of business acquired . . . . . . . . 722.3 — 722.3 387.0 — 387.0Interest expense . . . . . . . . . . . . . . . . . . . . . . . . . . 153.7 — 153.7 139.3 — 139.3
Total benefits and expenses . . . . . . . . . . . . . . . . . . . . . 9,009.3 — 9,009.3 9,441.0 — 9,441.0Income (loss) before income taxes . . . . . . . . . . . . . . . 606.0 17.0 623.0 277.8 17.0 294.8Net income (loss) . . . . . . . . . . . . . . . . . . . . . . . . . . . . . 611.2 17.0 628.2 102.8 17.0 119.8Less: Net income (loss) attributable to noncontrolling
interest . . . . . . . . . . . . . . . . . . . . . . . . . . . . . . . . . . . 138.2 — 138.2 190.9 — 190.9Net income (loss) available to Voya Financial,
Inc.’s common shareholders . . . . . . . . . . . . . . . . . 473.0 17.0 490.0 (88.1) 17.0 (71.1)Earnings Per ShareBasic . . . . . . . . . . . . . . . . . . . . . . . . . . . . . . . . . . . . . . . $ 2.06 $ 0.07 $ 2.13 $ (0.38) $ 0.07 $ (0.31)Diluted . . . . . . . . . . . . . . . . . . . . . . . . . . . . . . . . . . . . . $ 2.06 $ 0.07 $ 2.13 $ (0.38) $ 0.07 $ (0.31)Cash dividends declared per common share . . . . . . $ — $ — $ — $ — $ — $ —Balance Sheet Data:Total investments . . . . . . . . . . . . . . . . . . . . . . . . . . . . . $ 95,487.6 $ — $ 95,487.6 $ 92,819.2 $ — $ 92,819.2Assets held in separate accounts . . . . . . . . . . . . . . . . . 97,667.4 — 97,667.4 88,714.5 — 88,714.5Total assets . . . . . . . . . . . . . . . . . . . . . . . . . . . . . . . . . . 216,394.2 — 216,394.2 203,572.8 — 203,572.8Future policy benefits and contract owner account
balances . . . . . . . . . . . . . . . . . . . . . . . . . . . . . . . . . . 86,055.7 (45.0) 86,010.7 88,358.4 (28.0) 88,330.4Short-term debt . . . . . . . . . . . . . . . . . . . . . . . . . . . . . . 1,064.6 — 1,064.6 1,054.6 — 1,054.6Long-term debt . . . . . . . . . . . . . . . . . . . . . . . . . . . . . . . 3,171.1 — 3,171.1 1,343.1 — 1,343.1Liabilities related to separate accounts . . . . . . . . . . . . 97,667.4 — 97,667.4 88,714.5 — 88,714.5Total Voya Financial, Inc. shareholders’ equity,
excluding AOCI . . . . . . . . . . . . . . . . . . . . . . . . . . . . 10,164.2 45.0 10,209.2 9,758.9 28.0 9,786.9Total Voya Financial, Inc. shareholders’ equity . . . . . 13,874.9 45.0 13,919.9 12,353.9 28.0 12,381.9Other Supplemental Data (unaudited):Ratio of Earnings to Fixed Charges . . . . . . . . . . . . . . . 1.20 0.01 1.21 1.06 — 1.06
86
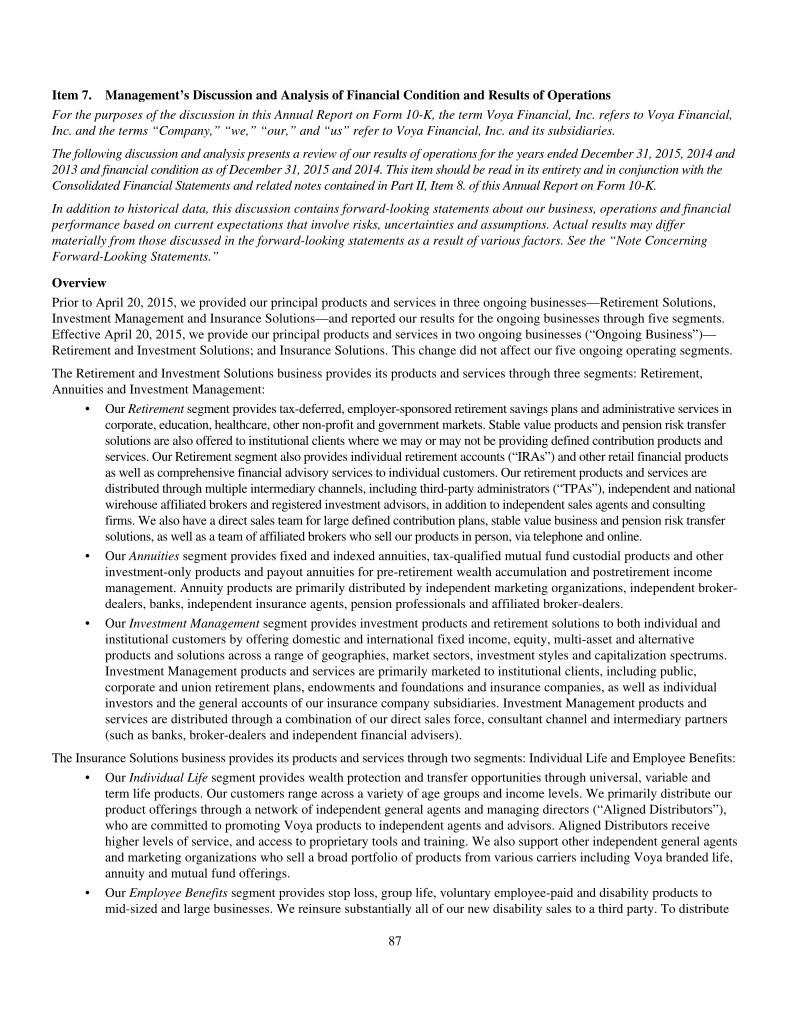
Item 7. Management’s Discussion and Analysis of Financial Condition and Results of Operations
For the purposes of the discussion in this Annual Report on Form 10-K, the term Voya Financial, Inc. refers to Voya Financial,Inc. and the terms “Company,” “we,” “our,” and “us” refer to Voya Financial, Inc. and its subsidiaries.
The following discussion and analysis presents a review of our results of operations for the years ended December 31, 2015, 2014 and2013 and financial condition as of December 31, 2015 and 2014. This item should be read in its entirety and in conjunction with theConsolidated Financial Statements and related notes contained in Part II, Item 8. of this Annual Report on Form 10-K.
In addition to historical data, this discussion contains forward-looking statements about our business, operations and financialperformance based on current expectations that involve risks, uncertainties and assumptions. Actual results may differmaterially from those discussed in the forward-looking statements as a result of various factors. See the “Note ConcerningForward-Looking Statements.”
Overview
Prior to April 20, 2015, we provided our principal products and services in three ongoing businesses—Retirement Solutions,Investment Management and Insurance Solutions—and reported our results for the ongoing businesses through five segments.Effective April 20, 2015, we provide our principal products and services in two ongoing businesses (“Ongoing Business”)—Retirement and Investment Solutions; and Insurance Solutions. This change did not affect our five ongoing operating segments.
The Retirement and Investment Solutions business provides its products and services through three segments: Retirement,Annuities and Investment Management:
• Our Retirement segment provides tax-deferred, employer-sponsored retirement savings plans and administrative services incorporate, education, healthcare, other non-profit and government markets. Stable value products and pension risk transfersolutions are also offered to institutional clients where we may or may not be providing defined contribution products andservices. Our Retirement segment also provides individual retirement accounts (“IRAs”) and other retail financial productsas well as comprehensive financial advisory services to individual customers. Our retirement products and services aredistributed through multiple intermediary channels, including third-party administrators (“TPAs”), independent and nationalwirehouse affiliated brokers and registered investment advisors, in addition to independent sales agents and consultingfirms. We also have a direct sales team for large defined contribution plans, stable value business and pension risk transfersolutions, as well as a team of affiliated brokers who sell our products in person, via telephone and online.
• Our Annuities segment provides fixed and indexed annuities, tax-qualified mutual fund custodial products and otherinvestment-only products and payout annuities for pre-retirement wealth accumulation and postretirement incomemanagement. Annuity products are primarily distributed by independent marketing organizations, independent broker-dealers, banks, independent insurance agents, pension professionals and affiliated broker-dealers.
• Our Investment Management segment provides investment products and retirement solutions to both individual andinstitutional customers by offering domestic and international fixed income, equity, multi-asset and alternativeproducts and solutions across a range of geographies, market sectors, investment styles and capitalization spectrums.Investment Management products and services are primarily marketed to institutional clients, including public,corporate and union retirement plans, endowments and foundations and insurance companies, as well as individualinvestors and the general accounts of our insurance company subsidiaries. Investment Management products andservices are distributed through a combination of our direct sales force, consultant channel and intermediary partners(such as banks, broker-dealers and independent financial advisers).
The Insurance Solutions business provides its products and services through two segments: Individual Life and Employee Benefits:
• Our Individual Life segment provides wealth protection and transfer opportunities through universal, variable andterm life products. Our customers range across a variety of age groups and income levels. We primarily distribute ourproduct offerings through a network of independent general agents and managing directors (“Aligned Distributors”),who are committed to promoting Voya products to independent agents and advisors. Aligned Distributors receivehigher levels of service, and access to proprietary tools and training. We also support other independent general agentsand marketing organizations who sell a broad portfolio of products from various carriers including Voya branded life,annuity and mutual fund offerings.
• Our Employee Benefits segment provides stop loss, group life, voluntary employee-paid and disability products tomid-sized and large businesses. We reinsure substantially all of our new disability sales to a third party. To distribute
87

our products, we utilize brokers, consultants, TPAs and private exchanges. In the voluntary market, policies aremarketed to employees at the worksite through enrollment firms, technology partners and brokers.
In addition to our Ongoing Business, we also have a Corporate and two Closed Blocks segments. The Corporate segmentincludes our corporate operations and corporate level assets and financial obligations. The Corporate segment includesinvestment income on assets backing surplus in excess of amounts held at the segment level, financing and interest expenses,other items not allocated to segments, including items such as expenses of our Strategic Investment Program (described below),certain expenses and liabilities of employee benefit plans and intercompany eliminations.
The Closed Blocks segments consist of two separate reporting segments that include run-off and legacy business lines that areno longer being actively marketed or sold. Accordingly, these segments have been classified as closed blocks and are managedseparately from our Ongoing Business.
• The Closed Block Variable Annuity (“CBVA”) segment consists of variable annuity contracts that were designed tooffer long-term savings products in which individual contract owners made deposits that are maintained in separateaccounts. These products included options for policyholders to purchase living benefit riders. In 2009, we separatedour CBVA segment from our other operations, placing it in run-off, and made a strategic decision to stop activelywriting new retail variable annuity products with substantial guarantee features (the last policies were issued in 2010and the block shifted to run-off).
• The Closed Block Other segment consists primarily of run-off activity related to a block of guaranteed investmentcontracts (“GICs”) and funding agreements that were issued with the proceeds invested to earn a spread, as well asother residual activity on closed or divested businesses, including our group reinsurance and individual reinsurancebusinesses. While the segment includes activity being managed in active run-off, we may issue liabilities from time totime to replace liabilities that are maturing.
Revision of Previously Issued Financial Statements
As part of our ongoing process of validating actuarial models, we identified during the second quarter of 2015 improper inputsto the calculation of the estimated fair value of the embedded derivative in certain of our guaranteed minimum withdrawalbenefits with life payouts (“GMWBL”) products. The products are included in our CBVA segment and are no longer offered bythe Company. The errors affected our financial statements prepared in accordance with accounting principles generally acceptedin the United States (“U.S. GAAP”) for periods prior to the second quarter of 2015 and did not impact regulatory or ratingagency capital. The errors did not affect our variable annuity policyholders in any manner.
Based on an analysis of quantitative and qualitative factors in accordance with SEC Staff Accounting Bulletins 99 and 108, weconcluded that these errors were not material to the consolidated financial position, results of operations or cash flows aspresented in our quarterly and annual financial statements that have been previously filed in our Quarterly Reports on Form 10-Q and Annual Reports on Form 10-K. As a result, amendment of such reports is not required. In preparing our ConsolidatedFinancial Statements for the year ended December 31, 2015, we made appropriate revisions to our financial statements forhistorical periods. Such changes are reflected in the financial results for the years ended December 31, 2014 and 2013, includedin this Annual Report on Form 10-K and discussed in this Management’s Discussion and Analysis of Financial Condition andResults of Operations (“MD&A”) and will also be reflected in the historical financial results included in the Company’ssubsequent quarterly and annual consolidated financial statements.
See the “Revision of Previously Issued Financial Statements” section in the Business, Basis of Presentation and SignificantAccounting Policies in our Consolidated Financial Statements in Part II, Item 8. of this Annual Report on Form 10-K for moreinformation.
Trends and Uncertainties
Throughout this MD&A, we discuss a number of trends and uncertainties that we believe may materially affect our futureliquidity, financial condition or results of operations. Where these trends or uncertainties are specific to a particular aspect ofour business, we often include such a discussion under the relevant caption of this MD&A, as part of our broader analysis ofthat area of our business. In addition, the following factors represent some of the key general trends and uncertainties that haveinfluenced the development of our business and our historical financial performance and that we believe will continue toinfluence our business and financial performance in the future.
88
Market Conditions
While extraordinary monetary accommodation has suppressed volatility in rate, credit and domestic equity markets for an extendedperiod, the start of the normalization process of monetary policy has resulted in an increase in volatility, exacerbated by heightenedconcern around the health of economic activity in China and, by extension, global economic conditions. This concern has beenparticularly acute in commodity-related sectors of the markets as investors adjust their expectations for companies in the energyand metals sectors in light of the rapid and steep decline in commodity prices. In the short- to medium-term, the potential forincreased volatility, coupled with prevailing low interest rates, can pressure sales and reduce demand as consumers hesitate to makefinancial decisions. In addition, this environment could make it difficult to manufacture products that are consistently bothattractive to customers and profitable. Financial performance can be adversely affected by market volatility as fees driven by assetsunder management (“AUM”) fluctuate, hedging costs increase and revenue declines due to reduced sales and increased outflows.In the long-term, however, we believe the financial crisis of 2008-2009 (“financial crisis”) and resultant lingering uncertainty willmotivate individuals to seek solutions combining elements of capital preservation, income and growth. Thus, as a company withstrong retirement, investment management and insurance capabilities, we believe the current market conditions noted above mayultimately enhance the attractiveness of our broad portfolio of products and services. We will need to continue to monitor thebehavior of our customers and other factors, including mortality rates, morbidity rates, annuitization rates and lapse rates, whichadjust in response to changes in market conditions in order to ensure that our products and services remain attractive as well asprofitable. For additional information on our sensitivity to equity market prices, see Quantitative and Qualitative Disclosures AboutMarket Risk in Part II, Item 7A. of this Annual Report on Form 10-K.
Interest Rate Environment
Interest rates moved modestly higher in 2015, but remain at levels that are still low by historical standards. The beginning of thenormalization of monetary policy produced a flattening of the yield curve as the market priced continued increases in theFederal Funds rate in the front end of the curve. The timing and impact of any further increases in the Federal Funds rate areuncertain and dependent on the Federal Reserve Board’s assessment of economic growth, continued development in labormarkets, the outlook for inflation and other risks that will impact the level and volatility of rates.
The continued low interest rate environment has affected and may continue to affect the demand for our products in variousways. While interest rates remain low, we may experience lower sales and reduced demand as it is more difficult to manufactureproducts that are consistently both attractive to customers and profitable. Our financial performance may also be adverselyaffected by the current low interest rate environment. The interest rate environment has historically influenced our business andfinancial performance, and we believe it will continue to do so in the future for several reasons, including the following:
• Our general account investment portfolio, which was approximately $86.5 billion as of December 31, 2015, consistspredominantly of fixed income investments and currently has an average yield of approximately 5.0%. In the nearterm and absent further material change in yields available on fixed income investments, we expect the yield we earnon new investments will be lower than the yields we earn on maturing investments, which were generally purchased inenvironments where interest rates were higher than current levels. We currently anticipate that proceeds that arereinvested in fixed income investments during 2016 will earn an average yield in the range of 4.00% to 4.25%. Ifinterest rates were to rise, we expect the yield on our new money investments would also rise and gradually convergetoward the yield of those maturing assets. In addition, while less material to financial results than new moneyinvestment rates, movements in prevailing interest rates also influence the prices of fixed income investments that wesell on the secondary market rather than holding until maturity or repayment, with rising interest rates generallyleading to lower prices in the secondary market, and falling interest rates generally leading to higher prices.
• Certain of our products pay guaranteed minimum rates. For example, fixed accounts and a portion of the stable valueaccounts included within defined contribution retirement plans, universal life (“UL”) policies and individual fixedannuities include guaranteed minimum credited rates. We are required to pay these guaranteed minimum rates even ifearnings on our investment portfolio decline, with the resulting investment margin compression negatively impactingearnings. In addition, we expect more policyholders to hold policies (lower lapses) with comparatively high guaranteedrates longer in a low interest rate environment. Conversely, a rise in average yield on our investment portfolio wouldpositively impact earnings if the average interest rate we pay on our products does not rise correspondingly. Similarly, weexpect policyholders would be less likely to hold policies (higher lapses) with existing guarantees as interest rates rise.
• Our CBVA segment provides certain guaranteed minimum benefits. A prolonged low interest rate environment maysubject us to increased hedging costs or an increase in the amount of statutory reserves that our insurance subsidiariesare required to hold for these variable annuity guarantees, lowering their statutory surplus, which would adversely
89
affect their ability to pay dividends to us. A prolonged low interest rate environment may also affect the perceivedvalue of guaranteed minimum income benefits, which in turn may lead to a higher rate of annuitization of thoseproducts over time.
For additional information on our sensitivity to interest rates, see Quantitative and Qualitative Disclosures About Market Risk inPart II, Item 7A. of this Annual Report on Form 10-K.
The Impact of our CBVA Segment on U.S. GAAP Earnings
Our ongoing management of our CBVA segment is focused on preserving our current capitalization status through careful riskmanagement and hedging. Because U.S. GAAP accounting differs from the methods used to determine regulatory and ratingagency capital measures, our hedge programs may create earnings volatility in our financial statements.
Governmental and Public Policy Impact on Demand for Our Products
The demand for our products is influenced by a dynamic combination of governmental and public policy factors. We anticipatethat legislative and other governmental activity and our ability to flexibly respond to changes resulting from such activity willbe crucial to our long-term financial performance. In particular, the demand for our products is influenced by the followingfactors:
• Availability and quality of public retirement solutions: The lack of comprehensive or sufficient government-sponsoredretirement solutions has been a significant driver of the popularity of private sector retirement products. We believethat concerns regarding Social Security and the reduced enrollment in defined benefit retirement plans may furtherincrease the demand for private sector retirement solutions. The impact of any legislative actions or new governmentprograms relating to retirement solutions on our business and financial performance will depend substantially on thelevel of private sector involvement and our ability to participate in any such programs. We believe we are wellpositioned to take advantage of any future developments involving participation in any such programs by privatesector providers.
• Tax-advantaged status: Many of the retirement savings, accumulation and protection products we sell qualify for tax-advantaged status. Changes in U.S. tax laws that alter the tax benefits of certain investment vehicles could have amaterial effect on demand for our products.
Increasing Longevity and Aging of the U.S. Population
We believe that the increasing longevity and aging of the U.S. population will affect (i) the demand, types of and pricing for ourproducts and (ii) the levels of our AUM and assets under administration (“AUA”). As the “baby boomer” generation preparesfor a longer retirement, we believe that demand for retirement savings, growth and income products will grow. The impact ofthis growth may be offset to some extent by asset outflows as an increasing percentage of the population begins withdrawingassets to convert their savings into income.
Competition
Our Ongoing Business operates in highly competitive markets. We face a variety of large and small industry participants,including diversified financial institutions, investment managers and insurance companies. These companies compete in oneform or another for the growing pool of retirement assets driven by a number of exogenous factors such as the continued agingof the U.S. population and the reduction in safety nets provided by governments and corporations. In many segments, productdifferentiation is difficult as product development and life cycles have shortened. In addition, we have experienced pressure onfees as product unbundling and lower cost alternatives have emerged. As a result, scale and the ability to provide value-addedservices and build long-term relationships are important factors to compete effectively. We believe that our leading presence inthe retirement market and resulting relationships with millions of participants, diverse range of capabilities (as a provider ofretirement, investment management and insurance products and services) and broad distribution network uniquely position us toeffectively serve consumers’ increasing demand for retirement savings, income and protection solutions.
90
Seasonality and Other Matters
Our business results can vary from quarter to quarter as a result of seasonal factors. For all of our segments, the first quarter ofeach year typically has elevated operating expenses, reflecting higher payroll taxes and certain other expenses that tend to beconcentrated in the first quarters. Additionally, alternative investment income tends to be lower in the first quarters. Otherseasonal factors that affect the reporting segments making up our Ongoing Business include:
Retirement
• The first quarters tend to have the highest level of recurring deposits in Corporate Markets, due to the increase inparticipant contributions from the receipt of annual bonus award payments or annual lump sum matches and profitsharing contributions made by many employers. Corporate Market withdrawals also tend to increase in the firstquarters as departing sponsors change providers at the start of a new year.
• In the third quarters, education tax-exempt markets typically have the lowest recurring deposits.
• The fourth quarters tend to have the highest level of single/transfer deposits due to new Corporate Market plan salesas sponsors transfer from other providers when contracts expire at the fiscal or calendar year-end. Recurring depositsin the Corporate Market may be lower in the fourth quarters as higher paid participants scale back or halt theircontributions upon reaching the annual maximums allowed for the year. Finally, Corporate Market withdrawals tendto increase in the fourth quarters, as in the first quarters, due to departing sponsors.
Investment Management
• The first quarters tend to have the lowest performance fees.
• In the fourth quarters, performance fees are typically higher due to certain performance fees being associated withcalendar-year performance against established benchmarks and hurdle rates.
Individual Life
• The fourth quarters tend to have the highest levels of universal life insurance sales. This seasonal pattern is typical forthe industry.
Employee Benefits
• The first quarters tend to have the highest Group Life loss ratio. Sales for Group Life and Stop Loss also tend to be thehighest in the first quarters, as most of our contracts have January start dates in alignment with the start of our clients’fiscal years.
• The third quarters tend to have the second highest Group Life and Stop Loss sales, as a large number of our contractshave July start dates in alignment with the start of our clients’ fiscal years.
In addition to these seasonal factors, our results are impacted by the annual review of assumptions related to future policybenefits and contract owner account balances and deferred policy acquisition costs (“DAC”), value of business acquired(“VOBA”) (collectively, “DAC/VOBA”) and other intangibles, which we generally complete in the third quarter of each year,and annual remeasurement related to our employee benefit plans, which we generally complete in the fourth quarter of eachyear. See Critical Accounting Judgments and Estimates in Part II, Item 7. of this Annual Report on Form 10-K for furtherinformation.
Furthermore, Net investment income and net realized gains (losses), within our Investment Management segment, includes, forthis and previous periods, performance fees related to sponsored private equity funds (“carried interest”) that are subject to lateradjustment based on subsequent fund performance, to the extent that cumulative rates of investment return fall below specifiedinvestment hurdles. During the first quarter of 2016, we have experienced significant declines in the market value of theinvestment portfolio of a private equity fund for which we have previously accrued $30.2 million of performance fees. If, as aresult of these declines, the cumulative rate of investment return for this fund falls below the established hurdle rate as of theend of any quarterly measuring period, some or all of such fees could be reversed in future periods with such reversals reportedin Net income (loss) attributable to noncontrolling interest in the Consolidated Statement of Operations. See Item 1A, “RiskFactors”—“Revenues, earnings and income from our Investment Management business operations could be adversely affectedif the terms of our asset management agreements are significantly altered or the agreements are terminated, or if certainperformance hurdles are not realized.”
91

Strategic Investment Program
On June 2, 2015, we announced that we would incur an incremental $350.0 million of expenses during the years 2015 through2018 as it relates to IT simplification, digital and analytics and cross-enterprise initiatives (“Strategic Investment Program”). Weexpect these strategic investments to result in expense efficiency as well as business growth by improving how we engage ourcustomers. For the year ended December 31, 2015, we incurred expenses of $79.5 million related to the Strategic InvestmentProgram, which are reported in the Corporate segment and anticipate to incur between $110.0 million and $130.0 million relatedto the Strategic Investment Program during 2016.
Operating Measures
This MD&A includes discussion of Operating earnings before income taxes and Operating revenues, each of which is a measurethat is not determined in accordance with U.S. GAAP, because our management uses these measures to manage our businessesand allocate our resources. We generally use these measures to provide our investors with useful information regarding ourfinancial performance. In particular, these measures facilitate a comparison of period-to-period results without the effect of thevolatility created by certain changes in the financial markets that affect our financial results as reported under U.S. GAAP.Other companies may use similarly titled non-U.S. GAAP financial measures that are calculated differently from the way wecalculate such measures, and accordingly, our non-U.S. GAAP financial measures may not be comparable to similar measuresused by other companies.
Operating Earnings before Income Taxes
Operating earnings before income taxes is an internal measure we use to evaluate segment performance. We use the sameaccounting policies and procedures to measure segment Operating earnings before income taxes as we do for consolidated Netincome (loss). Operating earnings before income taxes does not replace Net income (loss) as the U.S. GAAP measure of ourconsolidated results of operations. However, we believe that the definition of Operating earnings before income taxes provides avaluable measure of our business and segment performances and enhance the understanding of our performance by highlightingperformance drivers. Each segment’s Operating earnings before income taxes is calculated by adjusting Income (loss) beforeincome taxes to exclude the following items:
• Net investment gains (losses), net of related amortization of DAC/VOBA, sales inducements and unearned revenue.Net investment gains (losses) include gains (losses) on the sale of securities, impairments, changes in the fair value ofinvestments using the fair value option (“FVO”) unrelated to the implied loan-backed security income recognition forcertain mortgage-backed obligations and changes in the fair value of derivative instruments, excluding realized gains(losses) associated with swap settlements and accrued interest;
• Net guaranteed benefit hedging gains (losses), which include changes in the fair value of derivatives related toguaranteed benefits, net of related reserve increases (decreases) and net of related amortization of DAC/VOBA andsales inducements, less the estimated cost of these benefits. The estimated cost, which is reflected in operating results,reflects the expected cost of these benefits if markets perform in line with our long-term expectations and includes thecost of hedging. Other derivative and reserve changes related to guaranteed benefits are excluded from operatingresults, including the impacts related to changes in our nonperformance spread;
• Income (loss) related to businesses exited through reinsurance or divestment (including net investment gains (losses)on securities sold and expenses directly related to these transactions);
• Income (loss) attributable to noncontrolling interest;
• Income (loss) related to early extinguishment of debt;
• Impairment of goodwill, value of management contract rights and value of customer relationships acquired;
• Immediate recognition of net actuarial gains (losses) related to our pension and other postretirement benefitobligations and gains (losses) from plan amendments and curtailments; and
92

• Other items, including restructuring expenses (severance, lease write-offs, etc.), certain third-party expenses and dealincentives related to the divestment of the Company by ING Group and expenses associated with the rebranding ofVoya Financial, Inc. from ING U.S., Inc.
Operating earnings before income taxes also does not reflect the results of operations of our CBVA segment, since this segmentis managed to focus on protecting regulatory and rating agency capital rather than achieving operating metrics. When wepresent the adjustments to Income (loss) before income taxes on a consolidated basis, each adjustment excludes the relativeportions attributable to our CBVA segment.
The most directly comparable U.S. GAAP measure to Operating earnings before income taxes is Income (loss) before incometaxes. For a reconciliation of Operating earnings before income taxes to Income (loss) before income taxes, see Results ofOperations—Company Consolidated below.
Operating Revenues
Operating revenues is a measure of our segment revenues. Each segment’s Operating revenues are calculated by adjusting Totalrevenues to exclude the following items:
• Net realized investment gains (losses) and related charges and adjustments include gains (losses) on the sale ofsecurities, impairments, changes in the fair value of investments using the FVO unrelated to the implied loan-backedsecurity income recognition for certain mortgage-backed obligations and changes in the fair value of derivativeinstruments, excluding realized gains (losses) associated with swap settlements and accrued interest. These are net ofrelated amortization of unearned revenue;
• Gain (loss) on change in fair value of derivatives related to guaranteed benefits include changes in the fair value ofderivatives related to guaranteed benefits, less the estimated cost of these benefits. The estimated cost, which isreflected in operating results, reflects the expected cost of these benefits if markets perform in line with our long-termexpectations and includes the cost of hedging. Other derivative and reserve changes related to guaranteed benefits areexcluded from operating revenues, including the impacts related to changes in our nonperformance spread;
• Revenues related to businesses exited through reinsurance or divestment (including net investment gains (losses) onsecurities sold directly related to these transactions);
• Revenues attributable to noncontrolling interest; and
• Other adjustments to Operating revenues primarily reflect Fee income earned by our broker-dealers for sales of non-proprietary products, which are reflected net of commission expense in our segments’ Operating revenues, as well asother items where the income is passed on to third parties.
Operating revenues also do not reflect the revenues of our CBVA segment, since this segment is managed to focus on protectingregulatory and rating agency capital rather than achieving operating metrics. When we present the adjustments to Total revenueson a consolidated basis, each adjustment excludes the relative portions attributable to our CBVA segment.
The most directly comparable U.S. GAAP measure to Operating revenues is Total revenues. For a reconciliation of Operatingrevenues to Total revenues, see Results of Operations—Company Consolidated below.
AUM and AUA
A substantial portion of our fees, other charges and margins are based on AUM. AUM represents on-balance sheet assetssupporting customer account values/liabilities and surplus as well as off-balance sheet institutional/mutual funds. Customeraccount values reflect the amount of policyholder equity that has accumulated within retirement, annuity and universal-life typeproducts. AUM includes general account assets managed by our Investment Management segment in which we bear theinvestment risk, separate account assets in which the contract owner bears the investment risk and institutional/mutual funds,which are excluded from our balance sheets. AUM-based revenues increase or decrease with a rise or fall in the amount ofAUM, whether caused by changes in capital markets or by net flows.
AUM is principally affected by net deposits (i.e., new deposits, less surrenders and other outflows) and investment performance(i.e., interest credited to contract owner accounts for assets that earn a fixed return or market performance for assets that earn avariable return). Separate account AUM and institutional/mutual fund AUM include assets managed by our Investment
93

Management segment, as well as assets managed by third-party investment managers. Our Investment Management segmentreflects the revenues earned for managing affiliated assets for our other segments as well as assets managed for third parties.
AUA represents accumulated assets on contracts pursuant to which we either provide administrative services or productguarantees for assets managed by third parties. These contracts are not insurance contracts and the assets are excluded from theConsolidated Financial Statements. Fees earned on AUA are generally based on the number of participants, asset levels and/orthe level of services or product guarantees that are provided.
Our consolidated AUM/AUA includes eliminations of AUM/AUA managed by our Investment Management segment that isalso reflected in other segments’ AUM/AUA and adjustments for AUM not reflected in any segments.
Sales Statistics
In our discussion of our segment results under Results of Operations—Segment by Segment, we sometimes refer to sales activityfor various products. The term “sales” is used differently for different products, as described more fully below. These salesstatistics do not correspond to revenues under U.S. GAAP and are used by us as operating measures underlying our financialperformance.
Net flows are deposits less redemptions (including benefits and other product charges).
Sales for Individual Life products are based on a calculation of weighted average annual premiums (“WAP”). Sales forEmployee Benefits products are based on a calculation of annual premiums, which represent regular premiums on new policies,plus a portion of new single premiums.
WAP is defined as the amount of premium for a policy’s first year that is eligible for the highest first year commission rate, plusa varying portion of any premium in excess of this base amount, depending on the product. WAP is a key measure of recentsales performance of our products and is an indicator of the general growth or decline in certain lines of business. WAP is notequal to premium revenue under U.S. GAAP. Renewal premiums on existing policies are included in U.S. GAAP premiumrevenue in addition to first year premiums and thus changes in persistency of existing in-force business can potentially offsetgrowth from current year sales.
Total gross premiums and deposits are defined as premium revenue and deposits for policies written and assumed. This measureprovides information as to growth and persistency trends related to premium and deposits.
Other Measures
Total annualized in-force premiums are defined as a full year of premium at the rate in effect at the end of the period. Thismeasure provides information as to the growth and persistency trends in premium revenue.
Interest adjusted loss ratios are defined as the ratio of benefits expense to premium revenue exclusive of the discountcomponent in the change in benefit reserve. This measure reports the loss ratio related to mortality on life products andmorbidity on health products.
In-force face amount is defined as the total life insurance coverage in effect as of the end of the period presented for businesswritten and assumed. This measure provides information as to changes in policy growth and persistency with respect to deathbenefit coverage.
In-force policy count is defined as the number of policies written and assumed with coverage in effect as of the end of theperiod. This measure provides information as to policy growth and persistency.
New business policy count (paid) is defined as the number of policies issued during the period for which initial premiums havebeen paid by the policyholder. This measure provides information as to policy growth from sales during the period.
94
Results of Operations—Company Consolidated
The following table presents the consolidated financial information for the periods indicated:
Year Ended December 31,
($ in millions) 2015 2014 2013
Revenues:Net investment income . . . . . . . . . . . . . . . . . . . . . . . . . . . . . . . . . . . . . . . . . . . . . . . . . . $ 4,637.8 $ 4,614.8 $ 4,689.0Fee income . . . . . . . . . . . . . . . . . . . . . . . . . . . . . . . . . . . . . . . . . . . . . . . . . . . . . . . . . . . . 3,481.1 3,632.5 3,666.3Premiums . . . . . . . . . . . . . . . . . . . . . . . . . . . . . . . . . . . . . . . . . . . . . . . . . . . . . . . . . . . . . 3,024.5 2,626.4 1,956.3Net realized capital gains (losses) . . . . . . . . . . . . . . . . . . . . . . . . . . . . . . . . . . . . . . . . . . (733.3) (878.4) (2,536.8)Other revenue . . . . . . . . . . . . . . . . . . . . . . . . . . . . . . . . . . . . . . . . . . . . . . . . . . . . . . . . . . 406.9 432.8 433.0Income (loss) related to consolidated investment entities:
Net investment income . . . . . . . . . . . . . . . . . . . . . . . . . . . . . . . . . . . . . . . . . . . . . . 551.1 665.5 545.2Changes in fair value related to collateralized loan obligations . . . . . . . . . . . . . . . (26.9) (6.7) 3.5
Total revenues . . . . . . . . . . . . . . . . . . . . . . . . . . . . . . . . . . . . . . . . . . . . . . . . . . . . . . . . . . . . . 11,341.2 11,086.9 8,756.5
Benefits and expenses:Interest credited and other benefits to contract owners/policyholders . . . . . . . . . . . . . . 6,510.0 5,937.9 4,497.8Operating expenses . . . . . . . . . . . . . . . . . . . . . . . . . . . . . . . . . . . . . . . . . . . . . . . . . . . . . 3,103.0 3,561.7 2,686.7Net amortization of Deferred policy acquisition costs and Value of business
acquired . . . . . . . . . . . . . . . . . . . . . . . . . . . . . . . . . . . . . . . . . . . . . . . . . . . . . . . . . . . . 663.4 379.3 442.8Interest expense . . . . . . . . . . . . . . . . . . . . . . . . . . . . . . . . . . . . . . . . . . . . . . . . . . . . . . . . 196.5 189.7 184.8Operating expenses related to consolidated investment entities:
Interest expense . . . . . . . . . . . . . . . . . . . . . . . . . . . . . . . . . . . . . . . . . . . . . . . . . . . . 272.2 209.5 180.6Other expense . . . . . . . . . . . . . . . . . . . . . . . . . . . . . . . . . . . . . . . . . . . . . . . . . . . . . . 11.6 7.6 7.7
Total benefits and expenses . . . . . . . . . . . . . . . . . . . . . . . . . . . . . . . . . . . . . . . . . . . . . . . . . . . 10,756.7 10,285.7 8,000.4
Income (loss) before income taxes . . . . . . . . . . . . . . . . . . . . . . . . . . . . . . . . . . . . . . . . . . . . . 584.5 801.2 756.1Income tax expense (benefit) . . . . . . . . . . . . . . . . . . . . . . . . . . . . . . . . . . . . . . . . . . . . . . . . . . 45.9 (1,731.5) (32.5)
Net income (loss) . . . . . . . . . . . . . . . . . . . . . . . . . . . . . . . . . . . . . . . . . . . . . . . . . . . . . . . . . . . 538.6 2,532.7 788.6Less: Net income (loss) attributable to noncontrolling interest . . . . . . . . . . . . . . . . . . . . 130.3 237.7 190.1
Net income (loss) available to our common shareholders . . . . . . . . . . . . . . . . . . . . . . . . . $ 408.3 $ 2,295.0 $ 598.5
The following table presents information about our Operating expenses for the periods indicated:
Year Ended December 31,
($ in millions) 2015 2014 2013
Operating expenses:Commissions . . . . . . . . . . . . . . . . . . . . . . . . . . . . . . . . . . . . . . . . . . . . . . . . . . . . . . . . . . . . . . . . . $1,211.6 $1,189.5 $1,114.8General and administrative expenses:
Net actuarial (gains)/losses related to pension and other postretirement benefitobligations . . . . . . . . . . . . . . . . . . . . . . . . . . . . . . . . . . . . . . . . . . . . . . . . . . . . . . . . . . . . . (62.7) 372.7 (405.2)
Strategic Investment Program . . . . . . . . . . . . . . . . . . . . . . . . . . . . . . . . . . . . . . . . . . . . . . . . 79.5 — —Other general and administrative expenses . . . . . . . . . . . . . . . . . . . . . . . . . . . . . . . . . . . . . . 2,261.3 2,383.8 2,386.6
Total general and administrative expenses . . . . . . . . . . . . . . . . . . . . . . . . . . . . . . . . . . . . . . . . . . 2,278.1 2,756.5 1,981.4
Total operating expenses, before DAC/VOBA deferrals . . . . . . . . . . . . . . . . . . . . . . . . . . . . . . . 3,489.7 3,946.0 3,096.2DAC/VOBA deferrals . . . . . . . . . . . . . . . . . . . . . . . . . . . . . . . . . . . . . . . . . . . . . . . . . . . . . . . . . . (386.7) (384.3) (409.5)
Total operating expenses . . . . . . . . . . . . . . . . . . . . . . . . . . . . . . . . . . . . . . . . . . . . . . . . . . . . . . $3,103.0 $3,561.7 $2,686.7
95
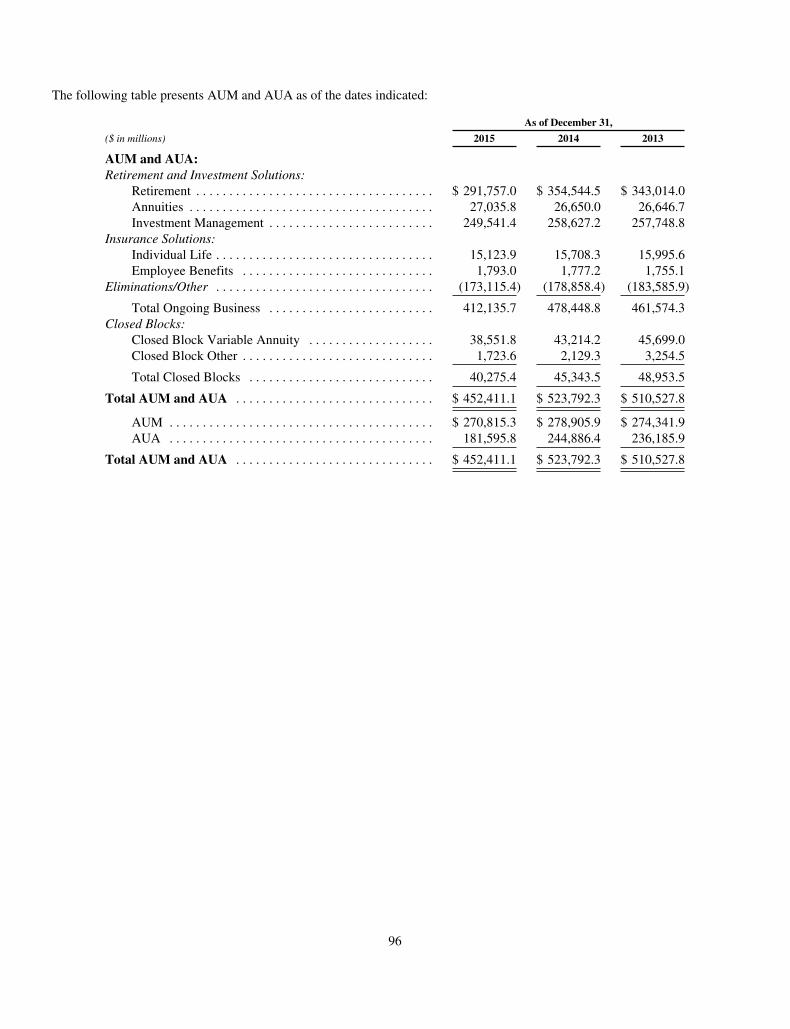
The following table presents AUM and AUA as of the dates indicated:
As of December 31,
($ in millions) 2015 2014 2013
AUM and AUA:Retirement and Investment Solutions:
Retirement . . . . . . . . . . . . . . . . . . . . . . . . . . . . . . . . . . . . $ 291,757.0 $ 354,544.5 $ 343,014.0Annuities . . . . . . . . . . . . . . . . . . . . . . . . . . . . . . . . . . . . . 27,035.8 26,650.0 26,646.7Investment Management . . . . . . . . . . . . . . . . . . . . . . . . . 249,541.4 258,627.2 257,748.8
Insurance Solutions:Individual Life . . . . . . . . . . . . . . . . . . . . . . . . . . . . . . . . . 15,123.9 15,708.3 15,995.6Employee Benefits . . . . . . . . . . . . . . . . . . . . . . . . . . . . . 1,793.0 1,777.2 1,755.1
Eliminations/Other . . . . . . . . . . . . . . . . . . . . . . . . . . . . . . . . . (173,115.4) (178,858.4) (183,585.9)
Total Ongoing Business . . . . . . . . . . . . . . . . . . . . . . . . . 412,135.7 478,448.8 461,574.3Closed Blocks:
Closed Block Variable Annuity . . . . . . . . . . . . . . . . . . . 38,551.8 43,214.2 45,699.0Closed Block Other . . . . . . . . . . . . . . . . . . . . . . . . . . . . . 1,723.6 2,129.3 3,254.5
Total Closed Blocks . . . . . . . . . . . . . . . . . . . . . . . . . . . . 40,275.4 45,343.5 48,953.5
Total AUM and AUA . . . . . . . . . . . . . . . . . . . . . . . . . . . . . . $ 452,411.1 $ 523,792.3 $ 510,527.8
AUM . . . . . . . . . . . . . . . . . . . . . . . . . . . . . . . . . . . . . . . . $ 270,815.3 $ 278,905.9 $ 274,341.9AUA . . . . . . . . . . . . . . . . . . . . . . . . . . . . . . . . . . . . . . . . 181,595.8 244,886.4 236,185.9
Total AUM and AUA . . . . . . . . . . . . . . . . . . . . . . . . . . . . . . $ 452,411.1 $ 523,792.3 $ 510,527.8
96
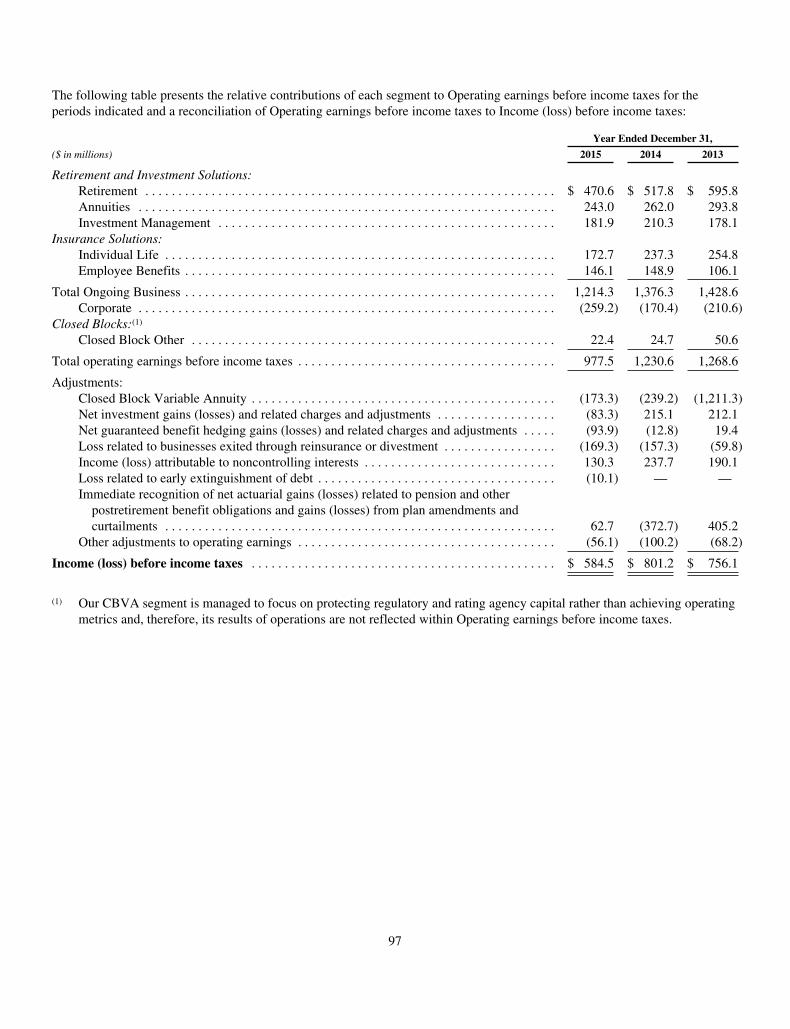
The following table presents the relative contributions of each segment to Operating earnings before income taxes for theperiods indicated and a reconciliation of Operating earnings before income taxes to Income (loss) before income taxes:
Year Ended December 31,
($ in millions) 2015 2014 2013
Retirement and Investment Solutions:Retirement . . . . . . . . . . . . . . . . . . . . . . . . . . . . . . . . . . . . . . . . . . . . . . . . . . . . . . . . . . . . . . $ 470.6 $ 517.8 $ 595.8Annuities . . . . . . . . . . . . . . . . . . . . . . . . . . . . . . . . . . . . . . . . . . . . . . . . . . . . . . . . . . . . . . . 243.0 262.0 293.8Investment Management . . . . . . . . . . . . . . . . . . . . . . . . . . . . . . . . . . . . . . . . . . . . . . . . . . . 181.9 210.3 178.1
Insurance Solutions:Individual Life . . . . . . . . . . . . . . . . . . . . . . . . . . . . . . . . . . . . . . . . . . . . . . . . . . . . . . . . . . . 172.7 237.3 254.8Employee Benefits . . . . . . . . . . . . . . . . . . . . . . . . . . . . . . . . . . . . . . . . . . . . . . . . . . . . . . . . 146.1 148.9 106.1
Total Ongoing Business . . . . . . . . . . . . . . . . . . . . . . . . . . . . . . . . . . . . . . . . . . . . . . . . . . . . . . . . 1,214.3 1,376.3 1,428.6Corporate . . . . . . . . . . . . . . . . . . . . . . . . . . . . . . . . . . . . . . . . . . . . . . . . . . . . . . . . . . . . . . . (259.2) (170.4) (210.6)
Closed Blocks:(1)
Closed Block Other . . . . . . . . . . . . . . . . . . . . . . . . . . . . . . . . . . . . . . . . . . . . . . . . . . . . . . . 22.4 24.7 50.6
Total operating earnings before income taxes . . . . . . . . . . . . . . . . . . . . . . . . . . . . . . . . . . . . . . . 977.5 1,230.6 1,268.6
Adjustments:Closed Block Variable Annuity . . . . . . . . . . . . . . . . . . . . . . . . . . . . . . . . . . . . . . . . . . . . . . (173.3) (239.2) (1,211.3)Net investment gains (losses) and related charges and adjustments . . . . . . . . . . . . . . . . . . (83.3) 215.1 212.1Net guaranteed benefit hedging gains (losses) and related charges and adjustments . . . . . (93.9) (12.8) 19.4Loss related to businesses exited through reinsurance or divestment . . . . . . . . . . . . . . . . . (169.3) (157.3) (59.8)Income (loss) attributable to noncontrolling interests . . . . . . . . . . . . . . . . . . . . . . . . . . . . . 130.3 237.7 190.1Loss related to early extinguishment of debt . . . . . . . . . . . . . . . . . . . . . . . . . . . . . . . . . . . . (10.1) — —Immediate recognition of net actuarial gains (losses) related to pension and other
postretirement benefit obligations and gains (losses) from plan amendments andcurtailments . . . . . . . . . . . . . . . . . . . . . . . . . . . . . . . . . . . . . . . . . . . . . . . . . . . . . . . . . . . 62.7 (372.7) 405.2
Other adjustments to operating earnings . . . . . . . . . . . . . . . . . . . . . . . . . . . . . . . . . . . . . . . (56.1) (100.2) (68.2)
Income (loss) before income taxes . . . . . . . . . . . . . . . . . . . . . . . . . . . . . . . . . . . . . . . . . . . . . . $ 584.5 $ 801.2 $ 756.1
(1) Our CBVA segment is managed to focus on protecting regulatory and rating agency capital rather than achieving operatingmetrics and, therefore, its results of operations are not reflected within Operating earnings before income taxes.
97
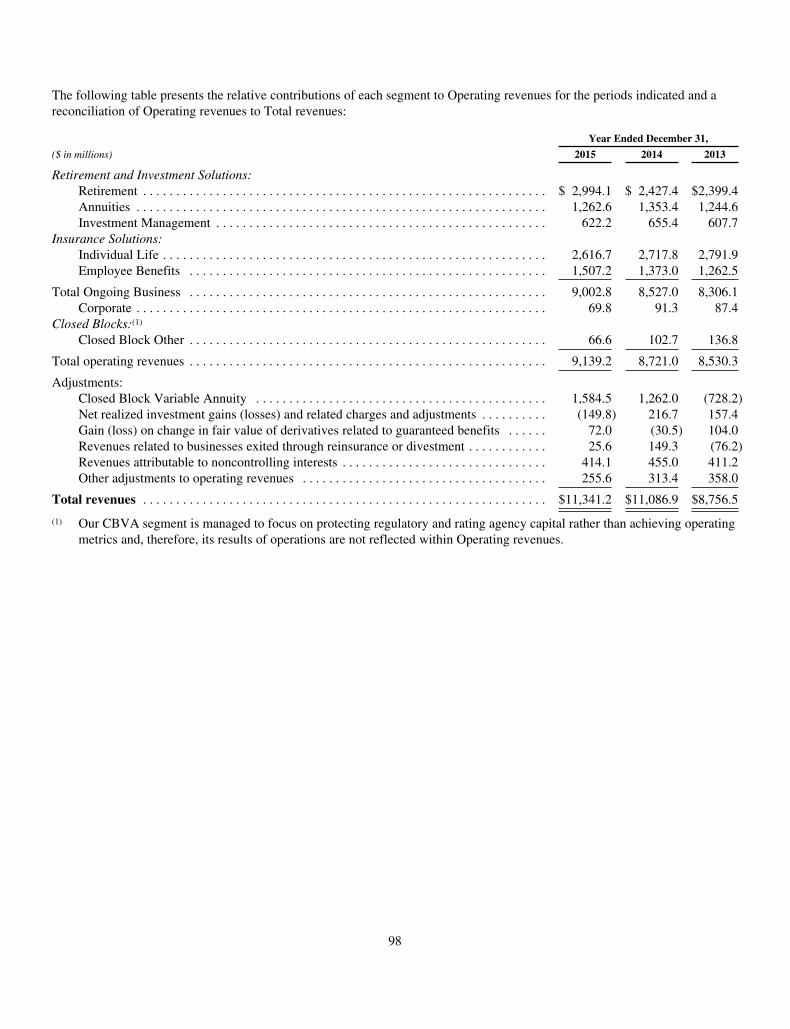
The following table presents the relative contributions of each segment to Operating revenues for the periods indicated and areconciliation of Operating revenues to Total revenues:
Year Ended December 31,
($ in millions) 2015 2014 2013
Retirement and Investment Solutions:Retirement . . . . . . . . . . . . . . . . . . . . . . . . . . . . . . . . . . . . . . . . . . . . . . . . . . . . . . . . . . . . . $ 2,994.1 $ 2,427.4 $2,399.4Annuities . . . . . . . . . . . . . . . . . . . . . . . . . . . . . . . . . . . . . . . . . . . . . . . . . . . . . . . . . . . . . . 1,262.6 1,353.4 1,244.6Investment Management . . . . . . . . . . . . . . . . . . . . . . . . . . . . . . . . . . . . . . . . . . . . . . . . . . 622.2 655.4 607.7
Insurance Solutions:Individual Life . . . . . . . . . . . . . . . . . . . . . . . . . . . . . . . . . . . . . . . . . . . . . . . . . . . . . . . . . . 2,616.7 2,717.8 2,791.9Employee Benefits . . . . . . . . . . . . . . . . . . . . . . . . . . . . . . . . . . . . . . . . . . . . . . . . . . . . . . 1,507.2 1,373.0 1,262.5
Total Ongoing Business . . . . . . . . . . . . . . . . . . . . . . . . . . . . . . . . . . . . . . . . . . . . . . . . . . . . . . 9,002.8 8,527.0 8,306.1Corporate . . . . . . . . . . . . . . . . . . . . . . . . . . . . . . . . . . . . . . . . . . . . . . . . . . . . . . . . . . . . . . 69.8 91.3 87.4
Closed Blocks:(1)
Closed Block Other . . . . . . . . . . . . . . . . . . . . . . . . . . . . . . . . . . . . . . . . . . . . . . . . . . . . . . 66.6 102.7 136.8
Total operating revenues . . . . . . . . . . . . . . . . . . . . . . . . . . . . . . . . . . . . . . . . . . . . . . . . . . . . . . 9,139.2 8,721.0 8,530.3
Adjustments:Closed Block Variable Annuity . . . . . . . . . . . . . . . . . . . . . . . . . . . . . . . . . . . . . . . . . . . . 1,584.5 1,262.0 (728.2)Net realized investment gains (losses) and related charges and adjustments . . . . . . . . . . (149.8) 216.7 157.4Gain (loss) on change in fair value of derivatives related to guaranteed benefits . . . . . . 72.0 (30.5) 104.0Revenues related to businesses exited through reinsurance or divestment . . . . . . . . . . . . 25.6 149.3 (76.2)Revenues attributable to noncontrolling interests . . . . . . . . . . . . . . . . . . . . . . . . . . . . . . . 414.1 455.0 411.2Other adjustments to operating revenues . . . . . . . . . . . . . . . . . . . . . . . . . . . . . . . . . . . . . 255.6 313.4 358.0
Total revenues . . . . . . . . . . . . . . . . . . . . . . . . . . . . . . . . . . . . . . . . . . . . . . . . . . . . . . . . . . . . . $11,341.2 $11,086.9 $8,756.5
(1) Our CBVA segment is managed to focus on protecting regulatory and rating agency capital rather than achieving operatingmetrics and, therefore, its results of operations are not reflected within Operating revenues.
98

We believe the following tables will help investors better understand the components of the reconciliation between Operatingearnings before income taxes and Income (loss) before income taxes related to Net investment gains (losses) and Net guaranteedbenefits hedging gains (losses) and related charges and adjustments.
The following table presents the adjustment to Income (loss) before taxes related to Total investment gains (losses) and therelated Net amortization of DAC/VOBA and other intangibles for the periods indicated:
Year Ended December 31,
($ in millions) 2015 2014 2013
Other-than-temporary impairments . . . . . . . . . . . . . . . . . . . . . . . . . . . . . . . . . . . . . . . . . . . . . . . . . . . $(111.9) $ (20.3) $ (35.7)CMO-B fair value adjustments(1) . . . . . . . . . . . . . . . . . . . . . . . . . . . . . . . . . . . . . . . . . . . . . . . . . . . . . (26.4) 188.0 (87.3)Gains (losses) on the sale of securities . . . . . . . . . . . . . . . . . . . . . . . . . . . . . . . . . . . . . . . . . . . . . . . . . (14.3) 42.3 116.0Other, including changes in the fair value of derivatives . . . . . . . . . . . . . . . . . . . . . . . . . . . . . . . . . . . (4.1) 2.6 170.9
Total investment gains (losses) . . . . . . . . . . . . . . . . . . . . . . . . . . . . . . . . . . . . . . . . . . . . . . . . . . . . . . . (156.7) 212.6 163.9Net amortization of DAC/VOBA and other intangibles on above . . . . . . . . . . . . . . . . . . . . . . . . . . . . 58.3 2.1 60.8
Net investment gains (losses), including Closed Block Variable Annuity . . . . . . . . . . . . . . . . . . . . . . (98.4) 214.7 224.7Less: Closed Block Variable Annuity net investment gains (losses) and related charges and
adjustments . . . . . . . . . . . . . . . . . . . . . . . . . . . . . . . . . . . . . . . . . . . . . . . . . . . . . . . . . . . . . . . . . . . . (15.1) (0.4) 12.6
Net investment gains (losses) . . . . . . . . . . . . . . . . . . . . . . . . . . . . . . . . . . . . . . . . . . . . . . . . . . . . . . . $ (83.3) $215.1 $212.1
(1) For a description of our CMO-B portfolio, see Investments—CMO-B Portfolio in Part II, Item 7. of this Annual Report onForm 10-K.
The following table presents the adjustment to Income (loss) before taxes related to Guaranteed benefit hedging gains (losses)net of DAC/VOBA and other intangibles amortization for the periods indicated. This table excludes CBVA.
Year Ended December 31,
($ in millions) 2015 2014 2013
Gain (loss), excluding nonperformance risk . . . . . . . . . . . . . . . . . . . . . . . . . . . . . . . . . . . . . . . . . . . . . $ (4.5) $(105.9) $113.0Gain (loss) due to nonperformance risk . . . . . . . . . . . . . . . . . . . . . . . . . . . . . . . . . . . . . . . . . . . . . . . . 6.7 74.5 (55.8)
Net gain (loss) prior to related amortization of DAC/VOBA and sales inducements . . . . . . . . . . . . . 2.2 (31.4) 57.2Net amortization of DAC/VOBA and sales inducements . . . . . . . . . . . . . . . . . . . . . . . . . . . . . . . . . . . (96.1) 18.6 (37.8)
Net guaranteed benefit hedging gains (losses) and related charges and adjustments . . . . . . . . . $(93.9) $ (12.8) $ 19.4
Notable Items
The tables highlight notable items that are included in Operating earnings before income taxes from the following categories:(1) large gains (losses) that are not indicative of performance in the period; and (2) items that typically recur but can be volatilefrom period to period (e.g., DAC/VOBA and other intangibles unlocking).
Each quarter, we update our DAC/VOBA and other intangibles based on actual historical gross profits and projections ofestimated gross profits. During the third quarter of 2015, 2014 and 2013, we completed our annual review of the assumptions,including projection model inputs, in each of our segments (except for the Investment Management and Corporate segments, forwhich assumption reviews are not relevant). As a result of these reviews, we have made a number of changes to our assumptionsresulting in net impacts to Operating earnings before income taxes for the years ended December 31, 2015, 2014 and 2013 of$(82.0) million, $(19.3) million and $84.8 million, respectively. These favorable/(unfavorable) impacts are included in the tablebelow as components of DAC/VOBA and other intangibles unlocking.
During 2014, we received $20.0 million related to the amendment or recapture of certain reinsurance agreements (“Gain onreinsurance recapture”), which was recorded in Interest credited and other benefits to contract owners/policyholders within theIndividual Life segment’s Operating earnings before income tax.
99

During 2013, we received distributions of cash and securities in conjunction with a Lehman Brothers bankruptcy settlement (“LehmanRecovery”). In 2008, Lehman Brothers acted as a prime broker for assets held in partnership owned by the Company. In 2008, thesepartnership assets were written down to the then-assumed realizable value. The amount of the 2013 distribution in excess of the bookvalue of these assets of $135.2 million was recognized as Net investment income. Additionally, we received cash distributions of $4.0million and $2.5 million in 2014 and 2015, respectively, which we recognized in Net investment income.
During 2013, we disposed of certain Low Income Housing Tax Credit partnerships (“LIHTC”) as a means of exiting this assetclass and as a result, we recognized losses in Net investment income of $31.6 million. During 2015, we recognized losses of$0.9 million on certain receivables associated with LIHTC, which were also recognized in Net investment income.
Collectively, the Lehman Recovery and LIHTC losses, net of DAC/VOBA and other intangibles impacts, are referred to as “Netgain from Lehman Recovery/LIHTC” and presented in the table below:
Year Ended December 31,
($ in millions) 2015 2014 2013
DAC/VOBA and other intangibles unlocking(1)(2) . . . . . . . . . . . . . . . . . . . . . . . $(67.5) $(21.6) $133.2Net gain from Lehman Recovery/LIHTC . . . . . . . . . . . . . . . . . . . . . . . . . . . . . 1.6 4.0 87.0Gain on reinsurance recapture . . . . . . . . . . . . . . . . . . . . . . . . . . . . . . . . . . . . . . — 20.0 —
(1) Unlocking related to the Net gain (loss) from Lehman Recovery is excluded from DAC/VOBA and other intangiblesunlocking for the year ended December 31, 2013 (and included in Net gain from Lehman Recovery/LIHTC).
(2) DAC/VOBA and other intangibles unlocking are included in Fee income, Interest credited and other benefits to contractowners/policyholders and Net amortization of DAC/VOBA and includes the impact of the annual review of theassumptions. See DAC/VOBA and Other Intangibles Unlocking in Part II, Item 7. of this Annual Report on Form 10-K forfurther description.
The Net gain from Lehman Recovery/LIHTC of $1.6 million in 2015 and the distribution of $4.0 million in 2014 were includedin the Operating earnings before income taxes of the Corporate segment in 2015 and 2014, respectively. The following tablepresents the net impact to Operating earnings before income taxes of the Net gain from Lehman Recovery/LIHTC and therelated amortization and unlocking of DAC/VOBA and other intangibles by segment for 2013:
December 31, 2013
($ in millions)
Netinvestment
income(loss)
DAC/VOBAand other
intangiblesamortization(1)
DAC/VOBAand other
intangiblesunlocking(1)
Net gainfrom
LehmanRecovery/
LIHTC
Retirement . . . . . . . . . . . . . . . . . . . . . . . . . . . . . . . . . . . . . . . . . . . . . . . . . . . . . $ 15.2 $ (7.0) $ 4.7 $12.9Annuities . . . . . . . . . . . . . . . . . . . . . . . . . . . . . . . . . . . . . . . . . . . . . . . . . . . . . . . 20.3 (11.4) 4.6 13.5Investment Management . . . . . . . . . . . . . . . . . . . . . . . . . . . . . . . . . . . . . . . . . . 13.2 — — 13.2Individual Life . . . . . . . . . . . . . . . . . . . . . . . . . . . . . . . . . . . . . . . . . . . . . . . . . . 47.2 (25.1) 17.6 39.7Employee Benefits . . . . . . . . . . . . . . . . . . . . . . . . . . . . . . . . . . . . . . . . . . . . . . . 4.3 — — 4.3Corporate . . . . . . . . . . . . . . . . . . . . . . . . . . . . . . . . . . . . . . . . . . . . . . . . . . . . . . 3.2 — — 3.2Closed Block Other . . . . . . . . . . . . . . . . . . . . . . . . . . . . . . . . . . . . . . . . . . . . . . 0.2 — — 0.2
Net gain included in segment Operating earnings before incometaxes(2) . . . . . . . . . . . . . . . . . . . . . . . . . . . . . . . . . . . . . . . . . . . . . . . . . . . . . . $103.6 $(43.5) $26.9 $87.0
(1) DAC/VOBA and other intangibles amortization and DAC/VOBA and other intangibles unlocking are included in Feeincome, Interest credited and other benefits to contract owners/policyholders and Net amortization of DAC/VOBA. SeeDAC/VOBA and Other Intangibles Unlocking in Part II, Item 7. of this Annual Report on Form 10-K for furtherdescription.
(2) Amount excludes net gain for the CBVA segment of $9.0 million for the year ended December 31, 2013.
Terminology Definitions
Net realized capital gains (losses), net realized investment gains (losses) and related charges and adjustments and Netguaranteed benefit hedging losses and related charges and adjustments include changes in the fair value of derivatives.Increases in the fair value of derivative assets or decreases in the fair value of derivative liabilities result in “gains.” Decreasesin the fair value of derivative assets or increases in the fair value of derivative liabilities result in “losses.”
100

In addition, we have certain products that contain guarantees that are embedded derivatives related to guaranteed benefits andindex-crediting features, while other products contain such guarantees that are considered derivatives (collectively “guaranteedbenefit derivatives”).
Consolidated—Year Ended December 31, 2015 Compared to Year Ended December 31, 2014
Net Income (Loss)
Net investment income increased $23.0 million from $4,614.8 million to $4,637.8 million primarily due to an increase in generalaccount assets in our Retirement and CBVA segments, growth in fixed indexed annuities (“FIA”) in our Annuities segment andhigher prepayment income. Partially offsetting the increase were lower AUM in our Closed Block Other segment as a result ofcontinued runoff, lower alternative investment income, the impact of the continued low interest rate environment onreinvestment rates, the continuing runoff of the Annual Reset and Multi-Year Guarantee Annuities (“AR/MYGAs”) in ourAnnuities segment and the impact of the Fourth Quarter 2014 and 2015 Reinsurance Transactions (defined below in ourIndividual Life segment’s results of operations).
Fee income decreased $151.4 million from $3,632.5 million to $3,481.1 million primarily due to lower fee income in our CBVAsegment as a result of lower average separate account AUM and lower fees in the recordkeeping and full service businesses in ourRetirement segment. Lower fees within our Investment Management segment, including fees associated with affiliated andcollateral loan obligations (“CLO”) entities, are eliminated in consolidation. These decreases were partially offset by increased costof insurance fees on the aging in-force universal life block and the impact of prospective assumptions changes in our IndividualLife segment, as well as an increase in fees from growth in assets of mutual fund custodial products in our Annuities segment.
Premiums increased $398.1 million from $2,626.4 million to $3,024.5 million primarily due to the sale of pension risk transfercontracts in our Retirement segment and higher group stop loss sales and favorable persistency in the group life and voluntaryproduct lines in our Employee Benefits segment. The increase was partially offset by lower premiums from annuitization of lifecontingent contracts in our CBVA segment, lower premiums in immediate annuities with life contingencies in our Annuitiessegment and lower premiums in our Individual Life and Closed Block Other segments as a result of the Fourth Quarter 2014 and2015 Reinsurance Transactions and the Second Quarter 2015 Reinsurance Transaction (defined below in our Closed BlockOther segment’s results of operations), respectively. The variances in Premiums correspond to changes in Interest credited andother benefits to contract owners/policyholders.
Net realized capital losses decreased $145.1 million from a loss of $878.4 million to a loss of $733.3 million primarily due to changesin fair value of derivatives and guaranteed benefit derivatives, excluding nonperformance risk, in our CBVA segment and OngoingBusiness, discussed below; the favorable variances, which included the impact of prospective assumption changes, were primarily dueto unfavorable equity market movements in the current period compared to the prior period and the impact of changes in interest rates.These improvements were partially offset by unfavorable changes in investment gains (losses), which are described below under Netinvestment gains (losses) and related charges and adjustments, and changes in fair value of guaranteed benefit derivatives due tononperformance risk, which resulted in an increase in Net realized capital losses of $323.6 million, from a gain of $402.2 million to again of $78.6 million. In addition, unfavorable variances due to market value changes and sales of securities associated with businessreinsured correspond to an increase in Interest credited and other benefits to contract owners/policyholders.
Changes in fair value of derivatives and guaranteed benefit derivatives, excluding nonperformance risk, in our CBVA segmentresulted in a $779.5 million decrease in Net realized capital losses, including a favorable variance of $206.8 million due to changesin fair value of derivatives from our CBVA hedge and capital hedge overlay (“CHO”) program, and a favorable variance of $572.7million related to changes in guaranteed benefit derivatives. In addition, net realized capital gains increased $169.6 millionprimarily due to changes in fair value of guaranteed benefit derivatives, excluding nonperformance risk in our Ongoing Business.
Other revenue decreased $25.9 million from $432.8 million to $406.9 million primarily due to unfavorable changes in marketvalue adjustments upon surrender and lower performance fees in our Investment Management segment.
Interest credited and other benefits to contract owners/policyholders increased $572.1 million from $5,937.9 million to$6,510.0 million as a result of several factors, including sales of pension risk transfer contracts in our Retirement segment,reserve changes in our CBVA segment as a result of lower favorable equity market returns in the current period compared to theprior period, as well as impacts of policyholder behavior and other assumption updates, the Gain on reinsurance recapture in theprior period, and an unfavorable change in mortality, net of reinsurance, in our Individual Life segment resulting from a higherclaims severity. Higher reserves in our Employee Benefits segment, primarily due to higher stop loss sales and higher group life
101

and voluntary in-force due to improved persistency resulting in higher benefits incurred also contributed to the increase.Partially offsetting these increases were favorable changes in intangibles unlocking from prospective assumption changesprimarily in the Individual Life segment, a decrease in reserves as a result of the Fourth Quarter 2014 and 2015 ReinsuranceTransactions, and favorable reserve refinements in the current period. Lower reserves associated with annuitization of lifecontingent contracts in our CBVA segment, a decrease in annuity payout reserves resulting from a decline in immediateannuities with life contingencies and lower interest credited driven by the continued runoff of AR/MYGAs also partially offsetthe overall increase. In addition, a favorable variance due to changes in the funds withheld reserve and the reinsurance depositasset associated with business reinsured resulting from market value changes in the related assets, is partially offset by acorresponding amount recorded in Net realized capital gains (losses).
Operating expenses decreased $458.7 million from $3,561.7 million to $3,103.0 million as a result of several factors, primarily $435.4million lower pension expenses related to the immediate recognition of $62.7 million of net actuarial gains in 2015 compared to netactuarial losses of $372.7 million in 2014, resulting from changes in assumptions primarily due to discount rates and actual versusexpected results, discussed in further detail below. In addition, lower Operating expenses in our CBVA segment as a result ofcontinued runoff, lower variable compensation costs, lower recordkeeping expenses and lower restructuring and rebranding costscontributed to the decrease. These decreases were partially offset by higher sales related expenses in our Employee Benefits andAnnuities segments, expenses from our Strategic Investment Program, and higher fees supporting reinsurance transactions, includingthe impacts of the Second Quarter 2015 Reinsurance Transaction and the Fourth Quarter 2014 and 2015 Reinsurance Transactions.
Net amortization of DAC/VOBA increased $284.1 million from $379.3 million to $663.4 million primarily due to unfavorableDAC/VOBA unlocking in the current period compared to the prior period, largely as a result of prospective assumption changesin our segments, and higher amortization resulting from higher gross profits in our Annuities segment. These increases werepartially offset by lower amortization resulting from lower gross profits and amortization rates in our Retirement segment, loweramortization in our Employee Benefits segment as a result of a lower volume of terminated cases in the current period comparedto the prior period, and lower amortization due to an unfavorable variance in Net investment gains (losses), described below.
Income (loss) before income taxes decreased $216.7 million from $801.2 million to $584.5 million primarily due to unfavorablechange in DAC/VOBA and other intangibles unlocking as a result of prospective assumption changes, lower alternativeinvestment income, the impact of the continued low interest rate environment on reinvestment rates and lower net investmentgains (losses), which are described below under Net investment gains (losses) and related charges and adjustments. In addition,lower fee income in our recordkeeping and full service businesses in our Retirement segment and higher expenses from ourStrategic Investment Program as well as the impacts of the Second Quarter 2015 Reinsurance Transaction and the FourthQuarter 2014 and 2015 Reinsurance Transactions and lower income (loss) attributable to noncontrolling interests contributed tothe decrease. These decreases were partially offset by lower expenses related to the immediate recognition of actuarial gains(losses) related to pension and other postretirement benefit obligations, favorable reserve refinements in the current period,improved margins related to the change in mix of business between AR/MYGAs and FIAs and higher prepayment income.
Income tax expense (benefit) changed by $1,777.4 million from $(1,731.5) million benefit to $45.9 million expense primarilydue to a decrease in the amount of the valuation allowance released in the current period compared to the prior period, partiallyoffset by a decrease in Income (loss) before income taxes.
Operating Earnings before Income TaxesOperating earnings before income taxes decreased $253.1 million from $1,230.6 million to $977.5 million primarily due to anunfavorable change in DAC/VOBA and other intangibles unlocking as a result of prospective assumption changes, loweralternative investment income, the impact of the continued low interest rate environment on reinvestment rates and higherOperating expenses as a result of our Strategic Investment Program. In addition, an unfavorable change in mortality largelydriven by higher claims severity primarily in our Individual Life segment and lower fee income in our recordkeeping and fullservice businesses in our Retirement segment also contributed to the decrease. These items were partially offset by favorablereserve refinements in the current period, improved margins related to the change in mix of business between AR/MYGAs andFIAs and higher prepayment income.
Adjustments from Income (Loss) before Income Taxes to Operating Earnings before Income TaxesCBVA is discussed in Results of Operations—Segment by Segment—CBVA in Part II, Item 7. of this Annual Report on Form 10-K.
Net investment gains (losses) and related charges and adjustments changed by $298.4 million from a gain of $215.1 million to aloss of $83.3 million as a result of unfavorable changes in fair value adjustments on our CMO-B portfolio, higher other-than-
102
temporary impairments, losses on the sale of securities in the current period compared to gains in the prior period, and anunfavorable variance in DAC/VOBA and other intangibles unlocking.
Net guaranteed benefit hedging gains (losses) and related charges and adjustments changed $81.1 million from $(12.8) millionto $(93.9) million primarily due to hedge losses resulting from a high level of market volatility in the current period,unfavorable changes due to prospective assumption updates and a decrease in the gain on nonperformance risk. Unfavorablechanges due to assumption updates included favorable changes in the fair value of guaranteed benefit derivatives, excludingnonperformance risk, that were more than offset by higher DAC/VOBA and other intangibles amortization and unlocking.
Loss related to businesses exited through reinsurance or divestment increased $12.0 million from $157.3 million to $169.3million primarily due to higher costs supporting reinsurance transactions including the reinsurance transactions entered intoduring 2014 and 2015.
Loss related to early extinguishment of debt of $10.1 million in the current period was primarily due to the debt extinguishmentin connection with repurchased debt. See Liquidity and Capital Resources—Debt Securities—Aetna Notes in Part II, Item 7. ofthis Annual Report on Form 10-K for further description.
Immediate recognition of net actuarial gains (losses) related to pension and other postretirement benefit obligations and gains (losses)from plan adjustments and curtailments changed $435.4 million. We immediately recognize actuarial gains and losses. An actuarialgain of $62.7 million was recorded in the current period, driven primarily by the net impact of an increase in the discount rate used tovalue benefit obligations, a favorable update to mortality assumptions, offset by unfavorable changes in asset return assumptions. A netactuarial loss of $372.7 million was recorded in the prior period, driven primarily by the net impact of a decrease in the discount rateused to value benefit obligations and an unfavorable update to mortality assumptions. See the Employee Benefits Plans section of theCritical Accounting Judgments and Estimates in Part II, Item 7. of this Annual Report on Form 10-K for further information.
Other adjustments to operating earnings changed $44.1 million from $(100.2) million to $(56.1) million primarily due to lowerrestructuring and rebranding costs.
Consolidated—Year Ended December 31, 2014 Compared to Year Ended December 31, 2013
Net Income (Loss)
Net investment income decreased $74.2 million from $4,689.0 million to $4,614.8 million primarily due to net investment income fromLehman Recovery/LIHTC in 2013 that did not recur at the same level. Excluding the impact of Lehman Recovery/LIHTC, netinvestment income increased as a result of higher prepayment income, growth in AUM related to FIA in our Annuities segment andhigher investment income on fixed interest options in our CBVA segment as a result of a higher earned rate. Partially offsetting theseincreases are the impact of the continued low interest rate environment on reinvestment rates in our Ongoing Business, the continuingrunoff of the AR/MYGAs in our Annuities segment, and decrease in block size in our Closed Block Other segment.
Fee income decreased $33.8 million from $3,666.3 million to $3,632.5 million primarily due to lower recordkeeping fees in ourRetirement segment, lower fee income in our CBVA segment as a result of lower average separate account AUM, and anunfavorable change in intangibles unlocking, primarily as a result of prospective assumption changes in our Individual Lifesegment. These decreases were partially offset by an increase in fees associated with higher AUM in our Retirement, Annuities,and Investment Management segments. Higher Fee income was also driven by increased cost of insurance fees on the aging in-force universal life block. Higher fees within our Investment Management segment, including fees associated with affiliated andCLO entities, are eliminated in consolidation.
Premiums increased $670.1 million from $1,956.3 million to $2,626.4 million primarily due to higher premiums in immediateannuities with life contingencies in our Annuities segment, as well as higher premiums associated with the annuitization of lifecontingent contracts in our CBVA segment, both of which were partially offset by a reserve increase in the correspondingInterest credited and other benefits to contract owners/policyholders. Additionally, higher Premiums in our Employee Benefitssegment were primarily due to increased group stop loss and voluntary product sales.
Net realized capital losses decreased $1,658.4 million from $2,536.8 million to $878.4 million as a result of several factors.Changes in fair value of guaranteed benefit derivatives due to nonperformance risk resulted in a decrease in Net realized capitallosses of $955.5 million, from a loss of $553.3 million to a gain of $402.2 million. Changes in fair value of derivatives andguaranteed benefit derivatives, excluding nonperformance risk in our CBVA segment, described below, resulted in a $687.7million decrease in Net realized capital losses. In addition, changes in fair value adjustments in our CMO-B portfolio as a resultof interest rate movements reduced the Net realized capital loss. Gains from market value changes and sales of securities
103
associated with business reinsured are partially offset by the corresponding increase in Interest credited and other benefits tocontract owners/policyholders. The overall improvement was reduced by changes in fair value of guaranteed benefit derivatives,excluding nonperformance risk in our Retirement Solutions business, and unfavorable derivative mark to market adjustments,which were both largely a result of interest rate movements. Declining interest rates in 2014 compared to rising interest rates in2013 resulted in unfavorable changes in the fair value of derivatives that are hedging our exposure to various market riskswithin the investment portfolio. Lower gains on the sale of securities also contributed to the offset.
As mentioned above, the result of changes in fair value of derivatives and guaranteed benefit derivatives, excludingnonperformance risk, in our CBVA segment resulted in a $687.7 million decrease in Net realized capital losses, includingfavorable changes in fair value of derivatives from our CBVA hedge and CHO program of $3,303.1 million, partially offset byan unfavorable variance of $2,615.4 million related to changes in guaranteed benefit derivatives. The favorable variance, whichincluded the impact of prospective assumption changes, was primarily due to lower equity market appreciation in 2014, partiallyoffset by interest rate movements as described above. The focus in managing our CBVA segment continues to be on protectingregulatory and rating agency capital, and our hedging program is primarily designed to mitigate the impacts of market scenarioson capital resources, rather than mitigating earnings volatility.
Interest credited and other benefits to contract owners/policyholders increased $1,440.1 million from $4,497.8 million to $5,937.9million primarily driven by unfavorable guaranteed benefit reserve changes in our CBVA segment due to lower fund returns in 2014compared to 2013 as well as the net impacts of policyholder behavior and other assumption changes in 2014 compared to 2013. Inaddition, we experienced unfavorable mortality changes, net of reinsurance on the universal life blocks due to an aging block, partiallyoffset by favorable changes in reserve from lower term sales in our Individual Life segment. An increase in reserves in our EmployeeBenefits segment was primarily due to higher stop loss volumes, resulting in higher benefits incurred, along with slightly highervoluntary benefits. The increases were partially offset by declining contract owner account balances for our Closed Block Othersegment, the Gain on reinsurance recapture in our Individual Life segment and improved loss ratios in our Employee BenefitsSegment. Higher interest credited due to an increase in FIA account balances was more than offset by a decline in account balances forAR/MYGAs due to continued runoff and lower crediting rates in our Retirement and Annuities segments.
Additionally, certain other variances impacting the increase in Interest credited and other benefits to contract owners/policyholdersare offset in other line items, as described below. Unfavorable intangibles unlocking from prospective assumption changes in 2014compared to favorable unlocking in 2013 contributed to the increase, but is offset by unlocking from prospective assumptionchanges that is explained in Net amortization of DAC/VOBA below. An increase in reserves for immediate annuities with lifecontingencies in our Annuities segment and an increase in reserves associated with the annuitization of life contingent contracts inour CBVA segment are offset by the increase in Premiums described above. An increase in the funds withheld reserve and changesin the reinsurance deposit asset associated with business reinsured resulting from market value changes in the related assets arepartially offset by a corresponding amount recorded in Net realized capital losses.
Operating expenses increased $875.0 million from $2,686.7 million to $3,561.7 million as a result of several factors, primarily $777.9million higher pension expenses related to the immediate recognition of $372.7 million of actuarial losses in the 2014 compared to again of $405.2 million in 2013, resulting from changes in assumptions primarily due to discount rates, mortality and actual versusexpected results. Additionally, investments in the business, higher expenses from operating as a public company, increased costs in2014 related to rebranding and restructuring, higher commissions, and higher share-based compensation contributed to the increase aswell as higher credit facility fees supporting reinsurance transactions, including a termination fee related to the Fourth Quarter 2014Reinsurance Transaction. These increases were partially offset by lower recordkeeping expenses and lower letter of credit (“LOC”)expenses in our Closed Block Other segment due to lower collateral requirements. In addition, we incurred certain expenses in 2013that did not reoccur, including costs related to the divestment of the Company by ING Group and LOC expenses associated with thecontingent capital LOC facility supporting our CBVA segment that was terminated in 2013.
Net amortization of DAC/VOBA decreased $63.5 million from $442.8 million to $379.3 million primarily due to favorableunlocking in 2014 compared to 2013 as a result of prospective assumption changes in our Individual Life and CBVA segmentsand lower amortization on guaranteed benefit hedging gains (losses). Additionally, lower amortization on Individual Lifesegment’s universal life blocks was driven by lower gross profits. An unfavorable variance driven by prospective assumptionschanges in our Retirement, Annuities and Employee Benefits segments, higher amortization related to realized investment gains,and higher amortization in our Employee Benefits segment resulting from terminated cases partially offset these items.
Interest expense increased $4.9 million from $184.8 million to $189.7 million primarily due to a change in debt structure overthe course of 2013. See a description of the change in debt structure under Liquidity and Capital Resources—Debt Securities inPart II, Item 7. of this Annual Report on Form 10-K.
104

Income before income taxes increased $45.1 million from $756.1 million to $801.2 million as a result of several factors. Lowerlosses related to the incurred guaranteed benefits and guarantee hedge program in our CBVA segment, including changes in thefair value of guaranteed benefit derivatives related to nonperformance risk and a favorable variance related to the impact ofprospective assumption changes, contributed to the increase. Higher sales and improved loss ratios in our Employee Benefitssegment, improved margins in our Annuities and Investment Management segments, as well as an increase in fees in ourRetirement, Annuities, and Investment Management segments associated with higher AUM also contributed to theimprovement. In addition, higher prepayment income, as well as higher income (loss) attributable to noncontrolling interestsimproved the overall result. These increases were partially offset by higher Operating expenses, including higher expensesrelated to the immediate recognition of actuarial gains (losses) related to pension and post retirement plans as well as atermination fee related to the Fourth Quarter 2014 Reinsurance Transaction. Also offsetting the overall improvement were theNet gain from Lehman Recovery/LIHTC in 2013 that did not recur at the same level, and an unfavorable variance in DAC/VOBA and other intangibles unlocking related to the impact of prospective assumption changes in our Ongoing Business, inaddition to the impact of the continued low interest rate environment on reinvestment rates.
Income tax benefit increased $1,699.0 million from $32.5 million to $1,731.5 million. The primary driver of the increase wasrelated to the change in the amount of the valuation allowance released of approximately $1.75 billion. In 2013, the valuationallowance release of $85.9 million was related to income generation. In 2014, the valuation allowance release of $1.83 billionwas related to income generation and significant positive evidence overcoming historical negative evidence, which allowedpreviously established valuation allowances to be released.
Operating Earnings before Income Taxes
Operating earnings before income taxes decreased $38.0 million from $1,268.6 million to $1,230.6 million as a result of several factors,including the Net gain from Lehman Recovery/LIHTC in 2013 that did not recur at the same level and an unfavorable variance in DAC/VOBA and other intangibles unlocking related to the impact of prospective assumption changes. Excluding these items, Operatingearnings before income taxes increased due to higher prepayment income, higher sales and improved loss ratios in our Employee Benefitssegment, improved margins in our Annuities and Investment Management segments, and an increase in fees associated with higher AUM.Reducing the improvements were unfavorable mortality changes, net of reinsurance on the universal life blocks due to an aging block,partially offset by favorable changes in reserves from lower term sales in our Individual Life segment, the impact of the continued lowinterest rate environment on reinvestment rates across multiple segments, and higher Operating expenses.
Adjustments from Income (Loss) before Income Taxes to Operating Earnings before Income Taxes
CBVA is discussed in Results of Operations—Segment by Segment—CBVA in Part II, Item 7. of this Annual Report on Form 10-K.
Net investment gains increased $3.0 million from $212.1 million to $215.1 million as a result of several factors which largely offset.Changes in fair value adjustments on our CMO-B portfolio were offset by unfavorable derivative mark to market adjustments due tointerest rate movements as well as lower gains on the sale of securities. Total investment gains were partially offset by higher DAC/VOBA and other intangibles amortization related to realized gains in our Retirement Solutions business, as well as lower favorableDAC/VOBA and other intangibles unlocking primarily related to assumption changes in our Retirement segment.
Net guaranteed benefit hedging gains (losses) and related charges and adjustments decreased $32.2 million from $19.4 million to $(12.8)million primarily due to changes in the fair value of guaranteed benefit derivatives excluding nonperformance risk, as a result of interestrate and equity market movements. The decrease was partially offset by $130.3 million in changes in the fair value of guaranteed benefitderivatives related to nonperformance risk (including changes in the technique used to estimate nonperformance risk).
Losses related to businesses exited through reinsurance or divestment increased $97.5 million from $59.8 million to $157.3million primarily due to $89.4 million of charges in 2014 as a result of our decision to exit a block of term life insurancebusiness through reinsurance. Additionally, we experienced losses associated with a block of business in our Retirementsegment that was reinsured during 2014, which were partially offset by lower costs associated with the business transferred viareinsurance from us to Hannover Re.
Immediate recognition of net actuarial gains (losses) related to pension and other postretirement benefit obligations and(losses) from plan adjustments and curtailments decreased $777.9 million. We immediately recognize actuarial gains and losses.A net actuarial loss of $372.2 million was recorded in 2014, driven primarily by the net impact of a decrease in the discount rate
105
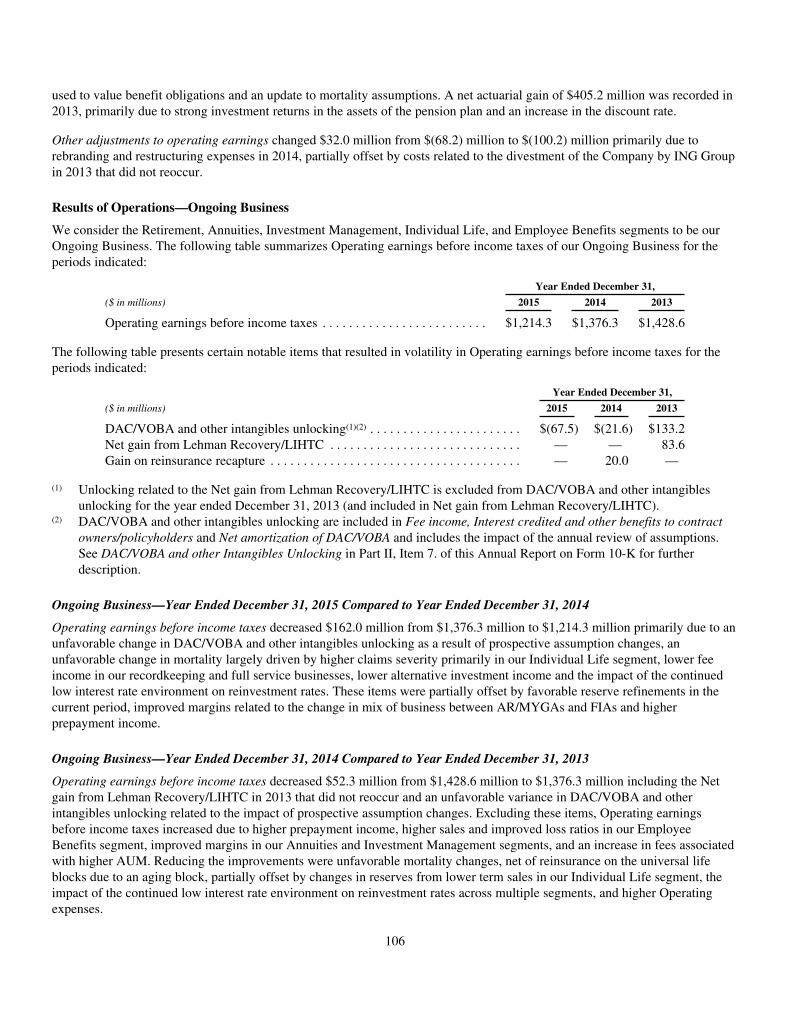
used to value benefit obligations and an update to mortality assumptions. A net actuarial gain of $405.2 million was recorded in2013, primarily due to strong investment returns in the assets of the pension plan and an increase in the discount rate.
Other adjustments to operating earnings changed $32.0 million from $(68.2) million to $(100.2) million primarily due torebranding and restructuring expenses in 2014, partially offset by costs related to the divestment of the Company by ING Groupin 2013 that did not reoccur.
Results of Operations—Ongoing Business
We consider the Retirement, Annuities, Investment Management, Individual Life, and Employee Benefits segments to be ourOngoing Business. The following table summarizes Operating earnings before income taxes of our Ongoing Business for theperiods indicated:
Year Ended December 31,
($ in millions) 2015 2014 2013
Operating earnings before income taxes . . . . . . . . . . . . . . . . . . . . . . . . . $1,214.3 $1,376.3 $1,428.6
The following table presents certain notable items that resulted in volatility in Operating earnings before income taxes for theperiods indicated:
Year Ended December 31,
($ in millions) 2015 2014 2013
DAC/VOBA and other intangibles unlocking(1)(2) . . . . . . . . . . . . . . . . . . . . . . . $(67.5) $(21.6) $133.2Net gain from Lehman Recovery/LIHTC . . . . . . . . . . . . . . . . . . . . . . . . . . . . . — — 83.6Gain on reinsurance recapture . . . . . . . . . . . . . . . . . . . . . . . . . . . . . . . . . . . . . . — 20.0 —
(1) Unlocking related to the Net gain from Lehman Recovery/LIHTC is excluded from DAC/VOBA and other intangiblesunlocking for the year ended December 31, 2013 (and included in Net gain from Lehman Recovery/LIHTC).
(2) DAC/VOBA and other intangibles unlocking are included in Fee income, Interest credited and other benefits to contractowners/policyholders and Net amortization of DAC/VOBA and includes the impact of the annual review of assumptions.See DAC/VOBA and other Intangibles Unlocking in Part II, Item 7. of this Annual Report on Form 10-K for furtherdescription.
Ongoing Business—Year Ended December 31, 2015 Compared to Year Ended December 31, 2014
Operating earnings before income taxes decreased $162.0 million from $1,376.3 million to $1,214.3 million primarily due to anunfavorable change in DAC/VOBA and other intangibles unlocking as a result of prospective assumption changes, anunfavorable change in mortality largely driven by higher claims severity primarily in our Individual Life segment, lower feeincome in our recordkeeping and full service businesses, lower alternative investment income and the impact of the continuedlow interest rate environment on reinvestment rates. These items were partially offset by favorable reserve refinements in thecurrent period, improved margins related to the change in mix of business between AR/MYGAs and FIAs and higherprepayment income.
Ongoing Business—Year Ended December 31, 2014 Compared to Year Ended December 31, 2013
Operating earnings before income taxes decreased $52.3 million from $1,428.6 million to $1,376.3 million including the Netgain from Lehman Recovery/LIHTC in 2013 that did not reoccur and an unfavorable variance in DAC/VOBA and otherintangibles unlocking related to the impact of prospective assumption changes. Excluding these items, Operating earningsbefore income taxes increased due to higher prepayment income, higher sales and improved loss ratios in our EmployeeBenefits segment, improved margins in our Annuities and Investment Management segments, and an increase in fees associatedwith higher AUM. Reducing the improvements were unfavorable mortality changes, net of reinsurance on the universal lifeblocks due to an aging block, partially offset by changes in reserves from lower term sales in our Individual Life segment, theimpact of the continued low interest rate environment on reinvestment rates across multiple segments, and higher Operatingexpenses.
106
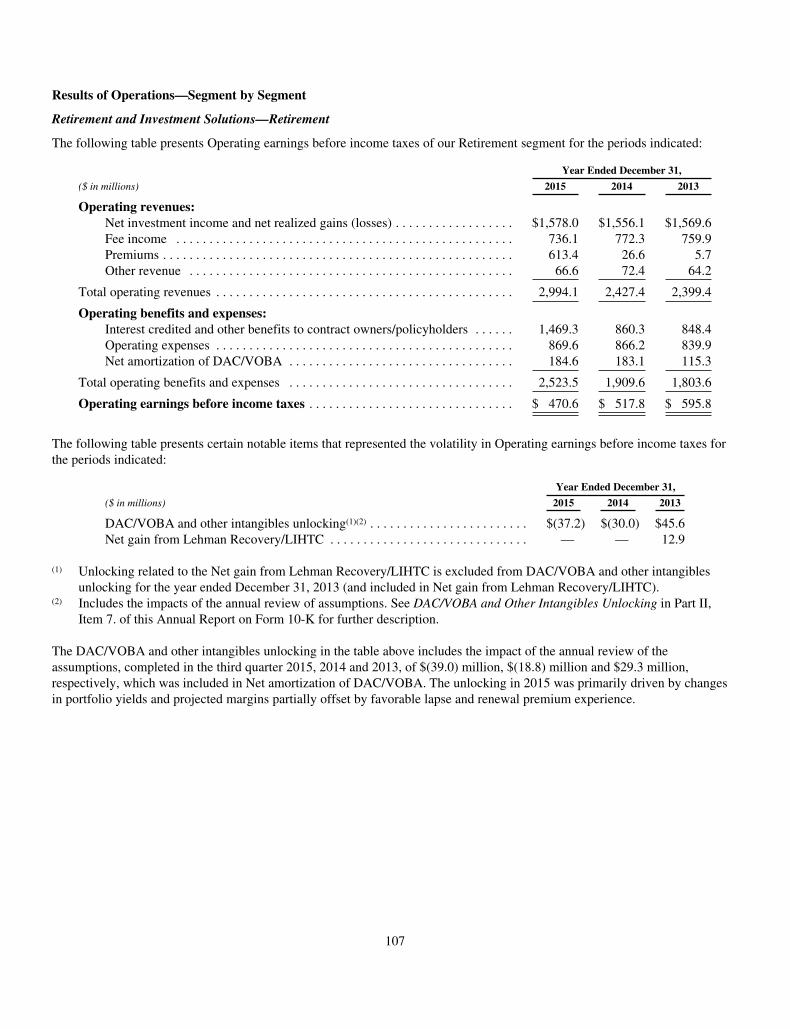
Results of Operations—Segment by Segment
Retirement and Investment Solutions—Retirement
The following table presents Operating earnings before income taxes of our Retirement segment for the periods indicated:
Year Ended December 31,
($ in millions) 2015 2014 2013
Operating revenues:Net investment income and net realized gains (losses) . . . . . . . . . . . . . . . . . . $1,578.0 $1,556.1 $1,569.6Fee income . . . . . . . . . . . . . . . . . . . . . . . . . . . . . . . . . . . . . . . . . . . . . . . . . . . 736.1 772.3 759.9Premiums . . . . . . . . . . . . . . . . . . . . . . . . . . . . . . . . . . . . . . . . . . . . . . . . . . . . . 613.4 26.6 5.7Other revenue . . . . . . . . . . . . . . . . . . . . . . . . . . . . . . . . . . . . . . . . . . . . . . . . . 66.6 72.4 64.2
Total operating revenues . . . . . . . . . . . . . . . . . . . . . . . . . . . . . . . . . . . . . . . . . . . . . 2,994.1 2,427.4 2,399.4
Operating benefits and expenses:Interest credited and other benefits to contract owners/policyholders . . . . . . 1,469.3 860.3 848.4Operating expenses . . . . . . . . . . . . . . . . . . . . . . . . . . . . . . . . . . . . . . . . . . . . . 869.6 866.2 839.9Net amortization of DAC/VOBA . . . . . . . . . . . . . . . . . . . . . . . . . . . . . . . . . . 184.6 183.1 115.3
Total operating benefits and expenses . . . . . . . . . . . . . . . . . . . . . . . . . . . . . . . . . . 2,523.5 1,909.6 1,803.6
Operating earnings before income taxes . . . . . . . . . . . . . . . . . . . . . . . . . . . . . . . $ 470.6 $ 517.8 $ 595.8
The following table presents certain notable items that represented the volatility in Operating earnings before income taxes forthe periods indicated:
Year Ended December 31,
($ in millions) 2015 2014 2013
DAC/VOBA and other intangibles unlocking(1)(2) . . . . . . . . . . . . . . . . . . . . . . . . $(37.2) $(30.0) $45.6Net gain from Lehman Recovery/LIHTC . . . . . . . . . . . . . . . . . . . . . . . . . . . . . . — — 12.9
(1) Unlocking related to the Net gain from Lehman Recovery/LIHTC is excluded from DAC/VOBA and other intangiblesunlocking for the year ended December 31, 2013 (and included in Net gain from Lehman Recovery/LIHTC).
(2) Includes the impacts of the annual review of assumptions. See DAC/VOBA and Other Intangibles Unlocking in Part II,Item 7. of this Annual Report on Form 10-K for further description.
The DAC/VOBA and other intangibles unlocking in the table above includes the impact of the annual review of theassumptions, completed in the third quarter 2015, 2014 and 2013, of $(39.0) million, $(18.8) million and $29.3 million,respectively, which was included in Net amortization of DAC/VOBA. The unlocking in 2015 was primarily driven by changesin portfolio yields and projected margins partially offset by favorable lapse and renewal premium experience.
107

The following tables present AUM and AUA for our Retirement segment as of the dates indicated:
As of December 31,
($ in millions) 2015 2014 2013
Corporate markets . . . . . . . . . . . . . . . . . . . . . . . . . . . . . . . . . . . . $ 45,088.6 $ 43,806.9 $ 40,123.7Tax exempt markets(1) . . . . . . . . . . . . . . . . . . . . . . . . . . . . . . . . . 51,641.9 53,896.6 53,200.5
Total full service plans . . . . . . . . . . . . . . . . . . . . . . . . 96,730.5 97,703.5 93,324.2Stable value(2) and pension risk transfer . . . . . . . . . . . . . . . . . . . 10,762.9 8,778.4 8,914.3Retail wealth management . . . . . . . . . . . . . . . . . . . . . . . . . . . . . 3,313.7 3,211.4 2,998.4
Total AUM . . . . . . . . . . . . . . . . . . . . . . . . . . . . . . . . . . . . . 110,807.1 109,693.3 105,236.9AUA . . . . . . . . . . . . . . . . . . . . . . . . . . . . . . . . . . . . . . . . . . . . . . 180,949.9 244,851.2 237,777.1
Total AUM and AUA(1) . . . . . . . . . . . . . . . . . . . . . . . . . . . . . . . $291,757.0 $354,544.5 $343,014.0
(1) Balances as of December 31, 2015 and 2014 reflect the reduction of assets transferred to reinsurer.(2) Consists of assets where we are the investment manager.
As of December 31,
($ in millions) 2015 2014 2013
General Account(1) . . . . . . . . . . . . . . . . . . . . . . . . . . . . . . . . $ 29,752.6 $ 27,716.3 $ 28,169.2Separate Account . . . . . . . . . . . . . . . . . . . . . . . . . . . . . . . . . 56,641.9 59,641.9 57,654.0Mutual Fund/Institutional Funds . . . . . . . . . . . . . . . . . . . . . 24,412.6 22,335.1 19,413.7AUA . . . . . . . . . . . . . . . . . . . . . . . . . . . . . . . . . . . . . . . . . . 180,949.9 244,851.2 237,777.1
Total AUM and AUA . . . . . . . . . . . . . . . . . . . . . . . . . . . . . . . . $291,757.0 $354,544.5 $343,014.0
(1) Balances as of December 31, 2015 and 2014 reflect the reduction of assets transferred to reinsurer.
The following table presents a rollforward of AUM for our Retirement segment for the periods indicated:
Year Ended December 31,
($ in millions) 2015 2014 2013
Balance as of beginning of period . . . . . . . . . . . . . . . . . . . . . . . . $109,693.3 $105,236.9 $ 90,471.2Deposits . . . . . . . . . . . . . . . . . . . . . . . . . . . . . . . . . . . . . . . . 15,921.9 14,251.1 14,856.0Surrenders, benefits and product charges . . . . . . . . . . . . . . (15,358.2) (14,497.8) (12,397.5)
Net flows . . . . . . . . . . . . . . . . . . . . . . . . . . . . . . . . . . . 563.7 (246.7) 2,458.5Interest credited and investment performance . . . . . . . . . . 550.1 5,611.9 12,307.2Transfer to reinsurer . . . . . . . . . . . . . . . . . . . . . . . . . . . . . . — (908.8) —
Balance as of end of period . . . . . . . . . . . . . . . . . . . . . . . . . . . . $110,807.1 $109,693.3 $105,236.9
Effective April 1, 2014, we entered into a coinsurance agreement to reinsure a block of in-force fixed deferred annuity contracts(the “Second Quarter 2014 Reinsurance Transaction”). This transaction was accounted for using deposit accounting. Under theagreement, the counterparty contractually assumed from us certain policyholder liabilities and obligations, although we remainobligated to contract owners. Consistent with our practice to exclude business (including blocks of business) exited viareinsurance or divestment from Operating earnings before income taxes and from Operating revenues, the revenues andexpenses of this reinsured block of business are excluded from these metrics and in the tables above for the current period.
108
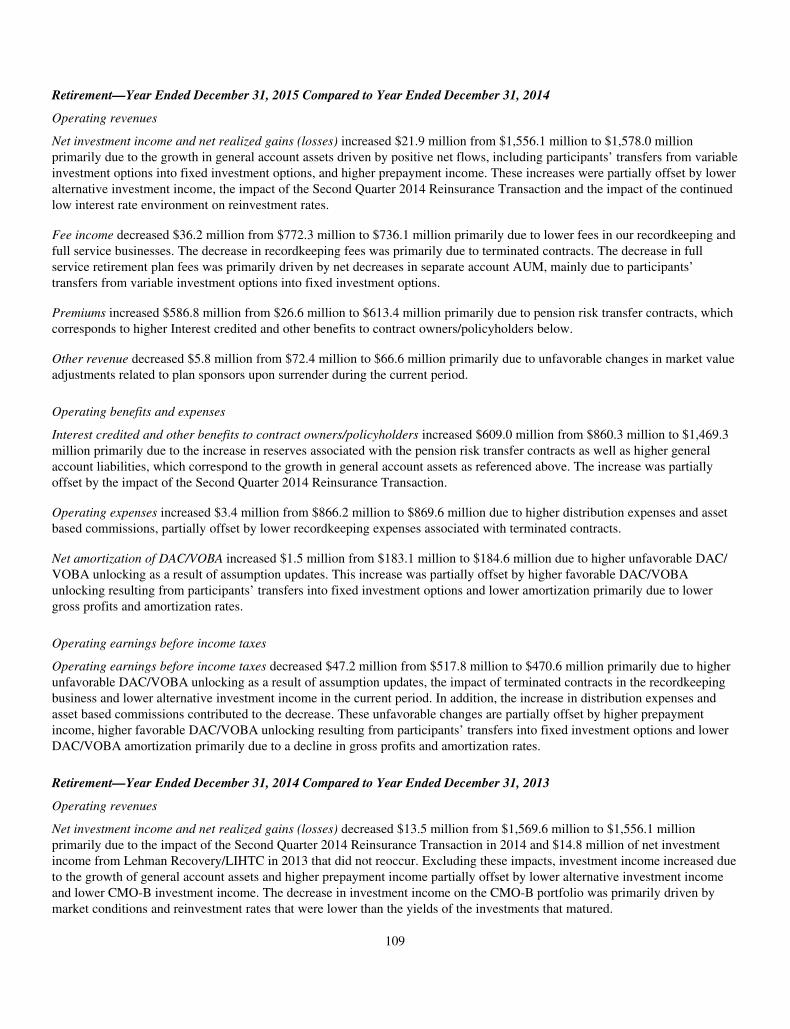
Retirement—Year Ended December 31, 2015 Compared to Year Ended December 31, 2014
Operating revenues
Net investment income and net realized gains (losses) increased $21.9 million from $1,556.1 million to $1,578.0 millionprimarily due to the growth in general account assets driven by positive net flows, including participants’ transfers from variableinvestment options into fixed investment options, and higher prepayment income. These increases were partially offset by loweralternative investment income, the impact of the Second Quarter 2014 Reinsurance Transaction and the impact of the continuedlow interest rate environment on reinvestment rates.
Fee income decreased $36.2 million from $772.3 million to $736.1 million primarily due to lower fees in our recordkeeping andfull service businesses. The decrease in recordkeeping fees was primarily due to terminated contracts. The decrease in fullservice retirement plan fees was primarily driven by net decreases in separate account AUM, mainly due to participants’transfers from variable investment options into fixed investment options.
Premiums increased $586.8 million from $26.6 million to $613.4 million primarily due to pension risk transfer contracts, whichcorresponds to higher Interest credited and other benefits to contract owners/policyholders below.
Other revenue decreased $5.8 million from $72.4 million to $66.6 million primarily due to unfavorable changes in market valueadjustments related to plan sponsors upon surrender during the current period.
Operating benefits and expenses
Interest credited and other benefits to contract owners/policyholders increased $609.0 million from $860.3 million to $1,469.3million primarily due to the increase in reserves associated with the pension risk transfer contracts as well as higher generalaccount liabilities, which correspond to the growth in general account assets as referenced above. The increase was partiallyoffset by the impact of the Second Quarter 2014 Reinsurance Transaction.
Operating expenses increased $3.4 million from $866.2 million to $869.6 million due to higher distribution expenses and assetbased commissions, partially offset by lower recordkeeping expenses associated with terminated contracts.
Net amortization of DAC/VOBA increased $1.5 million from $183.1 million to $184.6 million due to higher unfavorable DAC/VOBA unlocking as a result of assumption updates. This increase was partially offset by higher favorable DAC/VOBAunlocking resulting from participants’ transfers into fixed investment options and lower amortization primarily due to lowergross profits and amortization rates.
Operating earnings before income taxes
Operating earnings before income taxes decreased $47.2 million from $517.8 million to $470.6 million primarily due to higherunfavorable DAC/VOBA unlocking as a result of assumption updates, the impact of terminated contracts in the recordkeepingbusiness and lower alternative investment income in the current period. In addition, the increase in distribution expenses andasset based commissions contributed to the decrease. These unfavorable changes are partially offset by higher prepaymentincome, higher favorable DAC/VOBA unlocking resulting from participants’ transfers into fixed investment options and lowerDAC/VOBA amortization primarily due to a decline in gross profits and amortization rates.
Retirement—Year Ended December 31, 2014 Compared to Year Ended December 31, 2013
Operating revenues
Net investment income and net realized gains (losses) decreased $13.5 million from $1,569.6 million to $1,556.1 millionprimarily due to the impact of the Second Quarter 2014 Reinsurance Transaction in 2014 and $14.8 million of net investmentincome from Lehman Recovery/LIHTC in 2013 that did not reoccur. Excluding these impacts, investment income increased dueto the growth of general account assets and higher prepayment income partially offset by lower alternative investment incomeand lower CMO-B investment income. The decrease in investment income on the CMO-B portfolio was primarily driven bymarket conditions and reinvestment rates that were lower than the yields of the investments that matured.
109
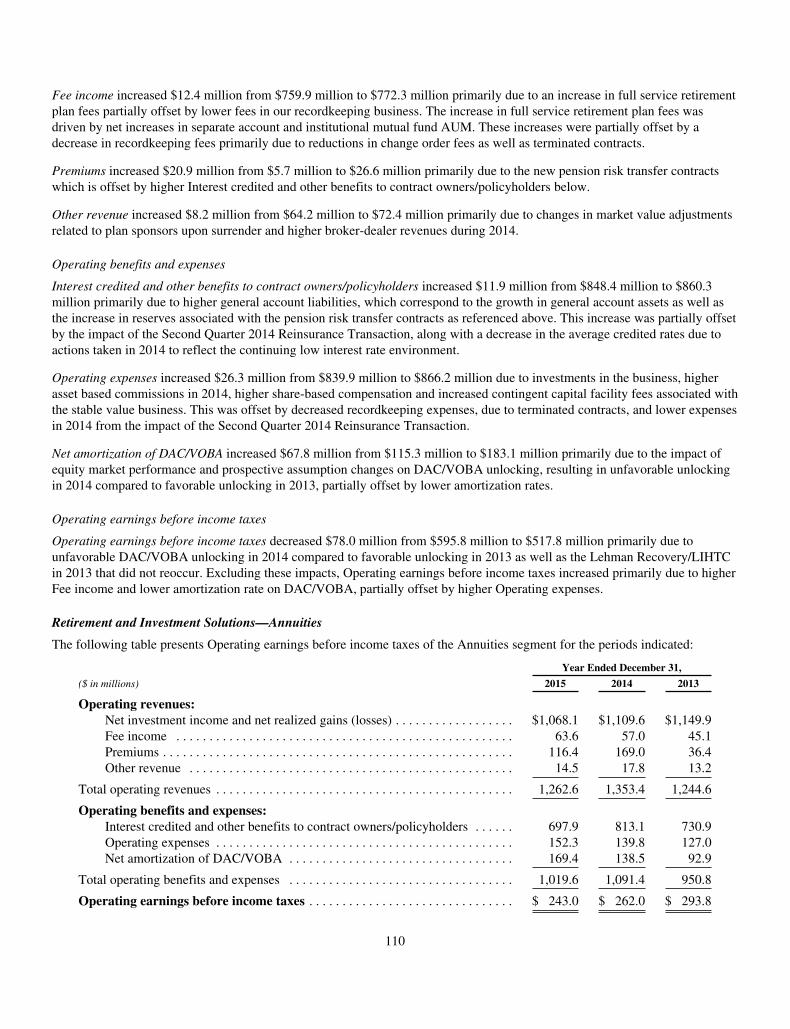
Fee income increased $12.4 million from $759.9 million to $772.3 million primarily due to an increase in full service retirementplan fees partially offset by lower fees in our recordkeeping business. The increase in full service retirement plan fees wasdriven by net increases in separate account and institutional mutual fund AUM. These increases were partially offset by adecrease in recordkeeping fees primarily due to reductions in change order fees as well as terminated contracts.
Premiums increased $20.9 million from $5.7 million to $26.6 million primarily due to the new pension risk transfer contractswhich is offset by higher Interest credited and other benefits to contract owners/policyholders below.
Other revenue increased $8.2 million from $64.2 million to $72.4 million primarily due to changes in market value adjustmentsrelated to plan sponsors upon surrender and higher broker-dealer revenues during 2014.
Operating benefits and expenses
Interest credited and other benefits to contract owners/policyholders increased $11.9 million from $848.4 million to $860.3million primarily due to higher general account liabilities, which correspond to the growth in general account assets as well asthe increase in reserves associated with the pension risk transfer contracts as referenced above. This increase was partially offsetby the impact of the Second Quarter 2014 Reinsurance Transaction, along with a decrease in the average credited rates due toactions taken in 2014 to reflect the continuing low interest rate environment.
Operating expenses increased $26.3 million from $839.9 million to $866.2 million due to investments in the business, higherasset based commissions in 2014, higher share-based compensation and increased contingent capital facility fees associated withthe stable value business. This was offset by decreased recordkeeping expenses, due to terminated contracts, and lower expensesin 2014 from the impact of the Second Quarter 2014 Reinsurance Transaction.
Net amortization of DAC/VOBA increased $67.8 million from $115.3 million to $183.1 million primarily due to the impact ofequity market performance and prospective assumption changes on DAC/VOBA unlocking, resulting in unfavorable unlockingin 2014 compared to favorable unlocking in 2013, partially offset by lower amortization rates.
Operating earnings before income taxes
Operating earnings before income taxes decreased $78.0 million from $595.8 million to $517.8 million primarily due tounfavorable DAC/VOBA unlocking in 2014 compared to favorable unlocking in 2013 as well as the Lehman Recovery/LIHTCin 2013 that did not reoccur. Excluding these impacts, Operating earnings before income taxes increased primarily due to higherFee income and lower amortization rate on DAC/VOBA, partially offset by higher Operating expenses.
Retirement and Investment Solutions—Annuities
The following table presents Operating earnings before income taxes of the Annuities segment for the periods indicated:
Year Ended December 31,
($ in millions) 2015 2014 2013
Operating revenues:Net investment income and net realized gains (losses) . . . . . . . . . . . . . . . . . . $1,068.1 $1,109.6 $1,149.9Fee income . . . . . . . . . . . . . . . . . . . . . . . . . . . . . . . . . . . . . . . . . . . . . . . . . . . 63.6 57.0 45.1Premiums . . . . . . . . . . . . . . . . . . . . . . . . . . . . . . . . . . . . . . . . . . . . . . . . . . . . . 116.4 169.0 36.4Other revenue . . . . . . . . . . . . . . . . . . . . . . . . . . . . . . . . . . . . . . . . . . . . . . . . . 14.5 17.8 13.2
Total operating revenues . . . . . . . . . . . . . . . . . . . . . . . . . . . . . . . . . . . . . . . . . . . . . 1,262.6 1,353.4 1,244.6
Operating benefits and expenses:Interest credited and other benefits to contract owners/policyholders . . . . . . 697.9 813.1 730.9Operating expenses . . . . . . . . . . . . . . . . . . . . . . . . . . . . . . . . . . . . . . . . . . . . . 152.3 139.8 127.0Net amortization of DAC/VOBA . . . . . . . . . . . . . . . . . . . . . . . . . . . . . . . . . . 169.4 138.5 92.9
Total operating benefits and expenses . . . . . . . . . . . . . . . . . . . . . . . . . . . . . . . . . . 1,019.6 1,091.4 950.8
Operating earnings before income taxes . . . . . . . . . . . . . . . . . . . . . . . . . . . . . . . $ 243.0 $ 262.0 $ 293.8
110
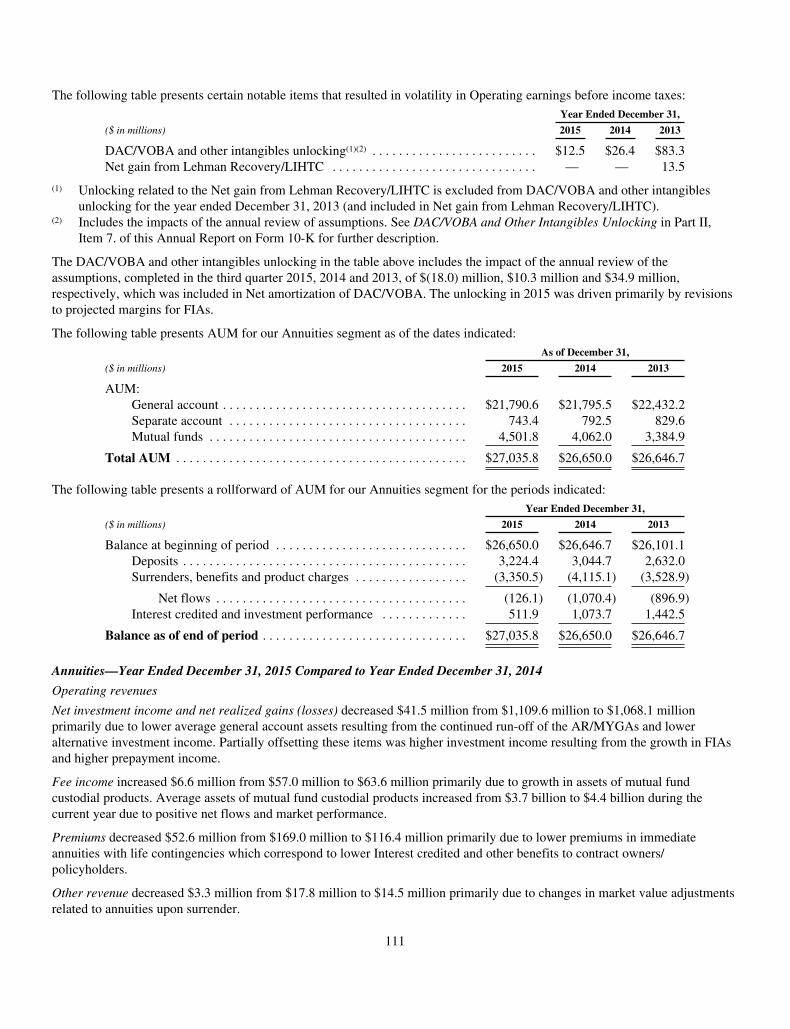
The following table presents certain notable items that resulted in volatility in Operating earnings before income taxes:Year Ended December 31,
($ in millions) 2015 2014 2013
DAC/VOBA and other intangibles unlocking(1)(2) . . . . . . . . . . . . . . . . . . . . . . . . . $12.5 $26.4 $83.3Net gain from Lehman Recovery/LIHTC . . . . . . . . . . . . . . . . . . . . . . . . . . . . . . . — — 13.5
(1) Unlocking related to the Net gain from Lehman Recovery/LIHTC is excluded from DAC/VOBA and other intangiblesunlocking for the year ended December 31, 2013 (and included in Net gain from Lehman Recovery/LIHTC).
(2) Includes the impacts of the annual review of assumptions. See DAC/VOBA and Other Intangibles Unlocking in Part II,Item 7. of this Annual Report on Form 10-K for further description.
The DAC/VOBA and other intangibles unlocking in the table above includes the impact of the annual review of theassumptions, completed in the third quarter 2015, 2014 and 2013, of $(18.0) million, $10.3 million and $34.9 million,respectively, which was included in Net amortization of DAC/VOBA. The unlocking in 2015 was driven primarily by revisionsto projected margins for FIAs.
The following table presents AUM for our Annuities segment as of the dates indicated:As of December 31,
($ in millions) 2015 2014 2013
AUM:General account . . . . . . . . . . . . . . . . . . . . . . . . . . . . . . . . . . . . . $21,790.6 $21,795.5 $22,432.2Separate account . . . . . . . . . . . . . . . . . . . . . . . . . . . . . . . . . . . . 743.4 792.5 829.6Mutual funds . . . . . . . . . . . . . . . . . . . . . . . . . . . . . . . . . . . . . . . 4,501.8 4,062.0 3,384.9
Total AUM . . . . . . . . . . . . . . . . . . . . . . . . . . . . . . . . . . . . . . . . . . . . $27,035.8 $26,650.0 $26,646.7
The following table presents a rollforward of AUM for our Annuities segment for the periods indicated:Year Ended December 31,
($ in millions) 2015 2014 2013
Balance at beginning of period . . . . . . . . . . . . . . . . . . . . . . . . . . . . . $26,650.0 $26,646.7 $26,101.1Deposits . . . . . . . . . . . . . . . . . . . . . . . . . . . . . . . . . . . . . . . . . . . 3,224.4 3,044.7 2,632.0Surrenders, benefits and product charges . . . . . . . . . . . . . . . . . (3,350.5) (4,115.1) (3,528.9)
Net flows . . . . . . . . . . . . . . . . . . . . . . . . . . . . . . . . . . . . . . (126.1) (1,070.4) (896.9)Interest credited and investment performance . . . . . . . . . . . . . 511.9 1,073.7 1,442.5
Balance as of end of period . . . . . . . . . . . . . . . . . . . . . . . . . . . . . . . $27,035.8 $26,650.0 $26,646.7
Annuities—Year Ended December 31, 2015 Compared to Year Ended December 31, 2014
Operating revenues
Net investment income and net realized gains (losses) decreased $41.5 million from $1,109.6 million to $1,068.1 millionprimarily due to lower average general account assets resulting from the continued run-off of the AR/MYGAs and loweralternative investment income. Partially offsetting these items was higher investment income resulting from the growth in FIAsand higher prepayment income.
Fee income increased $6.6 million from $57.0 million to $63.6 million primarily due to growth in assets of mutual fundcustodial products. Average assets of mutual fund custodial products increased from $3.7 billion to $4.4 billion during thecurrent year due to positive net flows and market performance.
Premiums decreased $52.6 million from $169.0 million to $116.4 million primarily due to lower premiums in immediateannuities with life contingencies which correspond to lower Interest credited and other benefits to contract owners/policyholders.
Other revenue decreased $3.3 million from $17.8 million to $14.5 million primarily due to changes in market value adjustmentsrelated to annuities upon surrender.
111
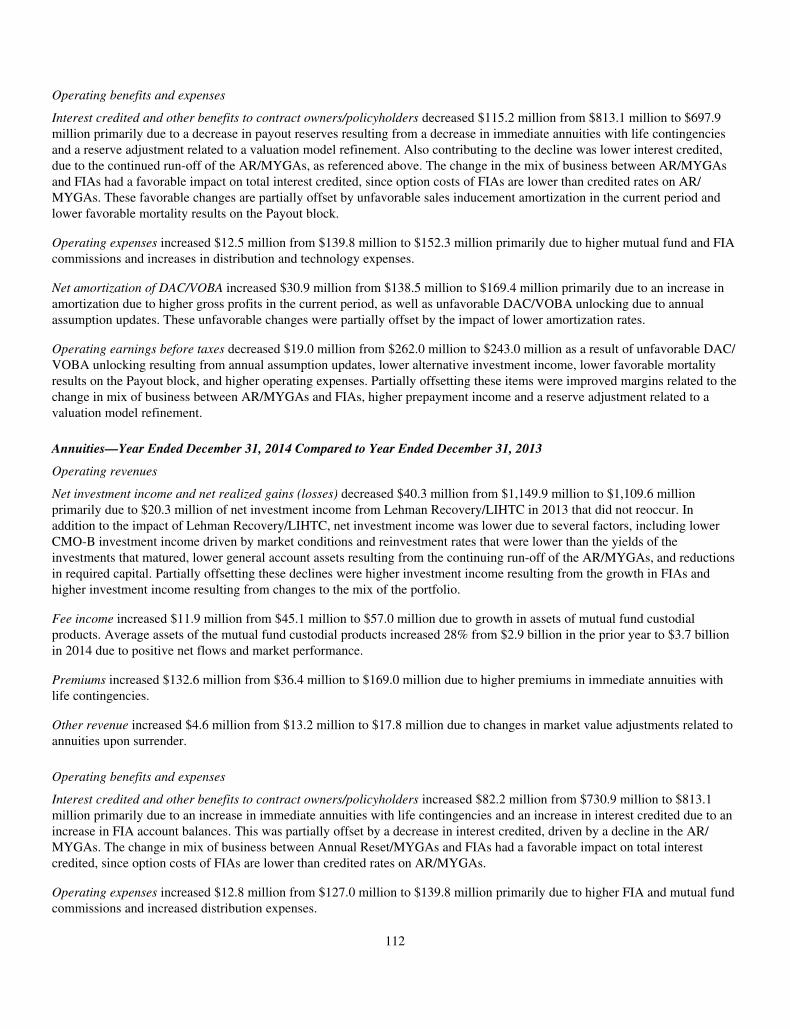
Operating benefits and expenses
Interest credited and other benefits to contract owners/policyholders decreased $115.2 million from $813.1 million to $697.9million primarily due to a decrease in payout reserves resulting from a decrease in immediate annuities with life contingenciesand a reserve adjustment related to a valuation model refinement. Also contributing to the decline was lower interest credited,due to the continued run-off of the AR/MYGAs, as referenced above. The change in the mix of business between AR/MYGAsand FIAs had a favorable impact on total interest credited, since option costs of FIAs are lower than credited rates on AR/MYGAs. These favorable changes are partially offset by unfavorable sales inducement amortization in the current period andlower favorable mortality results on the Payout block.
Operating expenses increased $12.5 million from $139.8 million to $152.3 million primarily due to higher mutual fund and FIAcommissions and increases in distribution and technology expenses.
Net amortization of DAC/VOBA increased $30.9 million from $138.5 million to $169.4 million primarily due to an increase inamortization due to higher gross profits in the current period, as well as unfavorable DAC/VOBA unlocking due to annualassumption updates. These unfavorable changes were partially offset by the impact of lower amortization rates.
Operating earnings before taxes decreased $19.0 million from $262.0 million to $243.0 million as a result of unfavorable DAC/VOBA unlocking resulting from annual assumption updates, lower alternative investment income, lower favorable mortalityresults on the Payout block, and higher operating expenses. Partially offsetting these items were improved margins related to thechange in mix of business between AR/MYGAs and FIAs, higher prepayment income and a reserve adjustment related to avaluation model refinement.
Annuities—Year Ended December 31, 2014 Compared to Year Ended December 31, 2013
Operating revenues
Net investment income and net realized gains (losses) decreased $40.3 million from $1,149.9 million to $1,109.6 millionprimarily due to $20.3 million of net investment income from Lehman Recovery/LIHTC in 2013 that did not reoccur. Inaddition to the impact of Lehman Recovery/LIHTC, net investment income was lower due to several factors, including lowerCMO-B investment income driven by market conditions and reinvestment rates that were lower than the yields of theinvestments that matured, lower general account assets resulting from the continuing run-off of the AR/MYGAs, and reductionsin required capital. Partially offsetting these declines were higher investment income resulting from the growth in FIAs andhigher investment income resulting from changes to the mix of the portfolio.
Fee income increased $11.9 million from $45.1 million to $57.0 million due to growth in assets of mutual fund custodialproducts. Average assets of the mutual fund custodial products increased 28% from $2.9 billion in the prior year to $3.7 billionin 2014 due to positive net flows and market performance.
Premiums increased $132.6 million from $36.4 million to $169.0 million due to higher premiums in immediate annuities withlife contingencies.
Other revenue increased $4.6 million from $13.2 million to $17.8 million due to changes in market value adjustments related toannuities upon surrender.
Operating benefits and expenses
Interest credited and other benefits to contract owners/policyholders increased $82.2 million from $730.9 million to $813.1million primarily due to an increase in immediate annuities with life contingencies and an increase in interest credited due to anincrease in FIA account balances. This was partially offset by a decrease in interest credited, driven by a decline in the AR/MYGAs. The change in mix of business between Annual Reset/MYGAs and FIAs had a favorable impact on total interestcredited, since option costs of FIAs are lower than credited rates on AR/MYGAs.
Operating expenses increased $12.8 million from $127.0 million to $139.8 million primarily due to higher FIA and mutual fundcommissions and increased distribution expenses.
112
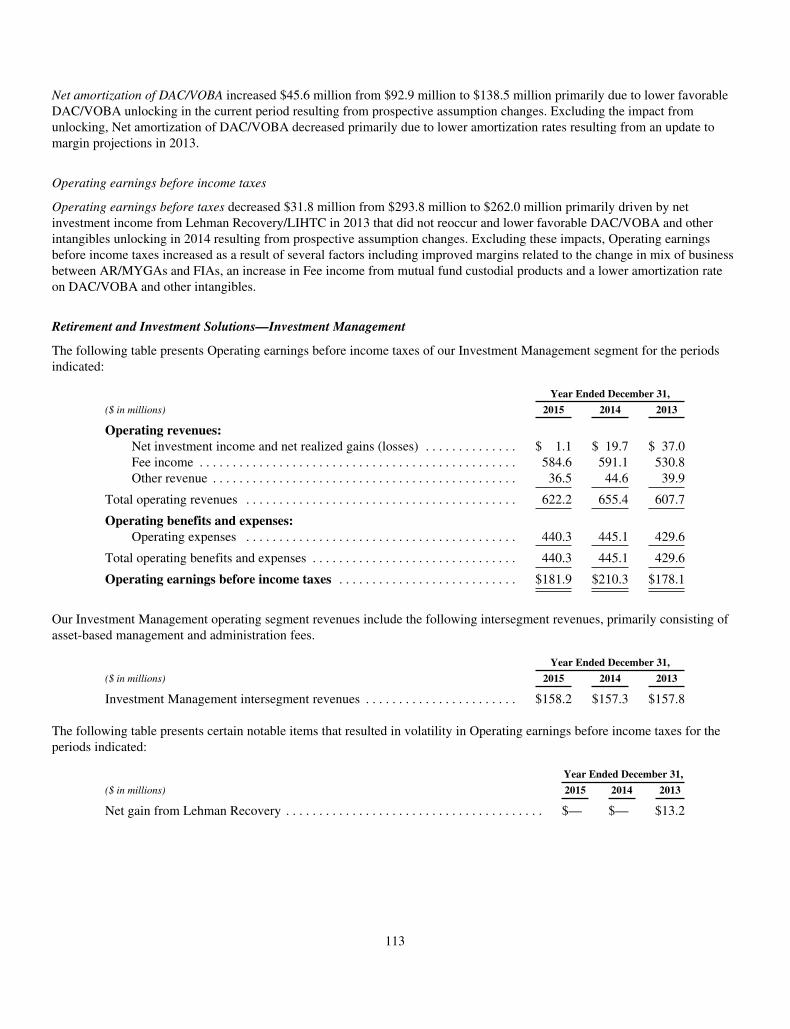
Net amortization of DAC/VOBA increased $45.6 million from $92.9 million to $138.5 million primarily due to lower favorableDAC/VOBA unlocking in the current period resulting from prospective assumption changes. Excluding the impact fromunlocking, Net amortization of DAC/VOBA decreased primarily due to lower amortization rates resulting from an update tomargin projections in 2013.
Operating earnings before income taxes
Operating earnings before taxes decreased $31.8 million from $293.8 million to $262.0 million primarily driven by netinvestment income from Lehman Recovery/LIHTC in 2013 that did not reoccur and lower favorable DAC/VOBA and otherintangibles unlocking in 2014 resulting from prospective assumption changes. Excluding these impacts, Operating earningsbefore income taxes increased as a result of several factors including improved margins related to the change in mix of businessbetween AR/MYGAs and FIAs, an increase in Fee income from mutual fund custodial products and a lower amortization rateon DAC/VOBA and other intangibles.
Retirement and Investment Solutions—Investment Management
The following table presents Operating earnings before income taxes of our Investment Management segment for the periodsindicated:
Year Ended December 31,
($ in millions) 2015 2014 2013
Operating revenues:Net investment income and net realized gains (losses) . . . . . . . . . . . . . . $ 1.1 $ 19.7 $ 37.0Fee income . . . . . . . . . . . . . . . . . . . . . . . . . . . . . . . . . . . . . . . . . . . . . . . . 584.6 591.1 530.8Other revenue . . . . . . . . . . . . . . . . . . . . . . . . . . . . . . . . . . . . . . . . . . . . . . 36.5 44.6 39.9
Total operating revenues . . . . . . . . . . . . . . . . . . . . . . . . . . . . . . . . . . . . . . . . . 622.2 655.4 607.7
Operating benefits and expenses:Operating expenses . . . . . . . . . . . . . . . . . . . . . . . . . . . . . . . . . . . . . . . . . 440.3 445.1 429.6
Total operating benefits and expenses . . . . . . . . . . . . . . . . . . . . . . . . . . . . . . . 440.3 445.1 429.6
Operating earnings before income taxes . . . . . . . . . . . . . . . . . . . . . . . . . . . $181.9 $210.3 $178.1
Our Investment Management operating segment revenues include the following intersegment revenues, primarily consisting ofasset-based management and administration fees.
Year Ended December 31,
($ in millions) 2015 2014 2013
Investment Management intersegment revenues . . . . . . . . . . . . . . . . . . . . . . . $158.2 $157.3 $157.8
The following table presents certain notable items that resulted in volatility in Operating earnings before income taxes for theperiods indicated:
Year Ended December 31,
($ in millions) 2015 2014 2013
Net gain from Lehman Recovery . . . . . . . . . . . . . . . . . . . . . . . . . . . . . . . . . . . . . . . $— $— $13.2
113
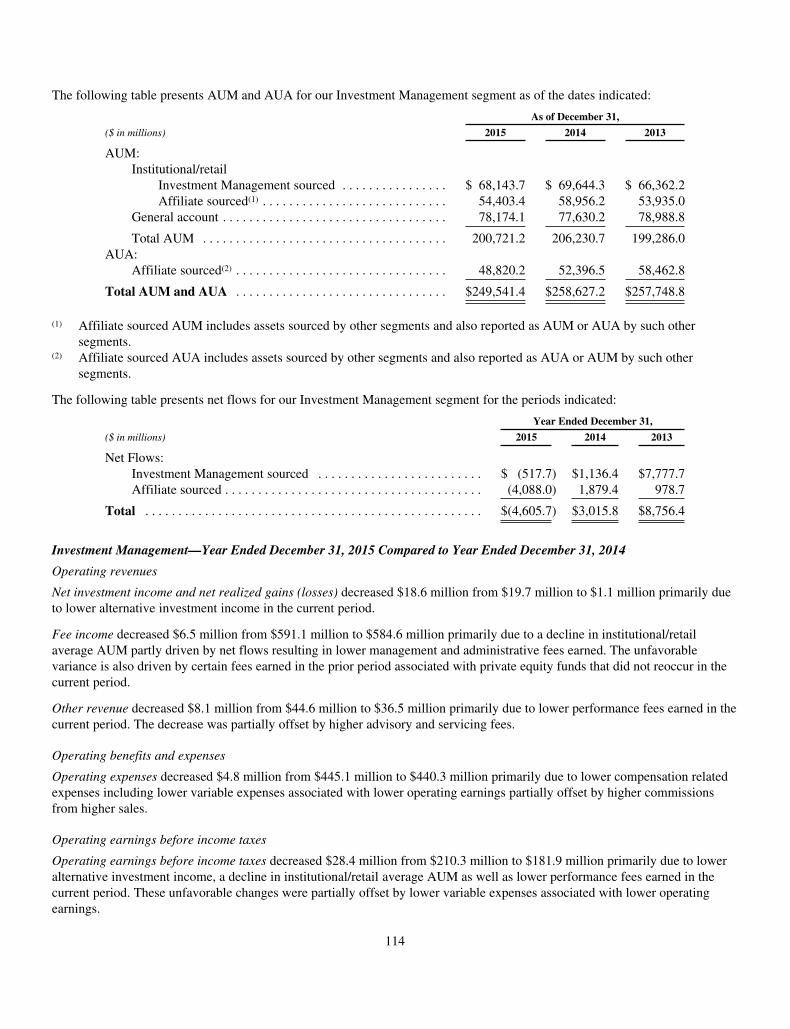
The following table presents AUM and AUA for our Investment Management segment as of the dates indicated:
As of December 31,
($ in millions) 2015 2014 2013
AUM:Institutional/retail
Investment Management sourced . . . . . . . . . . . . . . . . $ 68,143.7 $ 69,644.3 $ 66,362.2Affiliate sourced(1) . . . . . . . . . . . . . . . . . . . . . . . . . . . . 54,403.4 58,956.2 53,935.0
General account . . . . . . . . . . . . . . . . . . . . . . . . . . . . . . . . . . 78,174.1 77,630.2 78,988.8
Total AUM . . . . . . . . . . . . . . . . . . . . . . . . . . . . . . . . . . . . . 200,721.2 206,230.7 199,286.0AUA:
Affiliate sourced(2) . . . . . . . . . . . . . . . . . . . . . . . . . . . . . . . . 48,820.2 52,396.5 58,462.8
Total AUM and AUA . . . . . . . . . . . . . . . . . . . . . . . . . . . . . . . . $249,541.4 $258,627.2 $257,748.8
(1) Affiliate sourced AUM includes assets sourced by other segments and also reported as AUM or AUA by such othersegments.
(2) Affiliate sourced AUA includes assets sourced by other segments and also reported as AUA or AUM by such othersegments.
The following table presents net flows for our Investment Management segment for the periods indicated:
Year Ended December 31,
($ in millions) 2015 2014 2013
Net Flows:Investment Management sourced . . . . . . . . . . . . . . . . . . . . . . . . . $ (517.7) $1,136.4 $7,777.7Affiliate sourced . . . . . . . . . . . . . . . . . . . . . . . . . . . . . . . . . . . . . . . (4,088.0) 1,879.4 978.7
Total . . . . . . . . . . . . . . . . . . . . . . . . . . . . . . . . . . . . . . . . . . . . . . . . . . . $(4,605.7) $3,015.8 $8,756.4
Investment Management—Year Ended December 31, 2015 Compared to Year Ended December 31, 2014
Operating revenues
Net investment income and net realized gains (losses) decreased $18.6 million from $19.7 million to $1.1 million primarily dueto lower alternative investment income in the current period.
Fee income decreased $6.5 million from $591.1 million to $584.6 million primarily due to a decline in institutional/retailaverage AUM partly driven by net flows resulting in lower management and administrative fees earned. The unfavorablevariance is also driven by certain fees earned in the prior period associated with private equity funds that did not reoccur in thecurrent period.
Other revenue decreased $8.1 million from $44.6 million to $36.5 million primarily due to lower performance fees earned in thecurrent period. The decrease was partially offset by higher advisory and servicing fees.
Operating benefits and expenses
Operating expenses decreased $4.8 million from $445.1 million to $440.3 million primarily due to lower compensation relatedexpenses including lower variable expenses associated with lower operating earnings partially offset by higher commissionsfrom higher sales.
Operating earnings before income taxes
Operating earnings before income taxes decreased $28.4 million from $210.3 million to $181.9 million primarily due to loweralternative investment income, a decline in institutional/retail average AUM as well as lower performance fees earned in thecurrent period. These unfavorable changes were partially offset by lower variable expenses associated with lower operatingearnings.
114
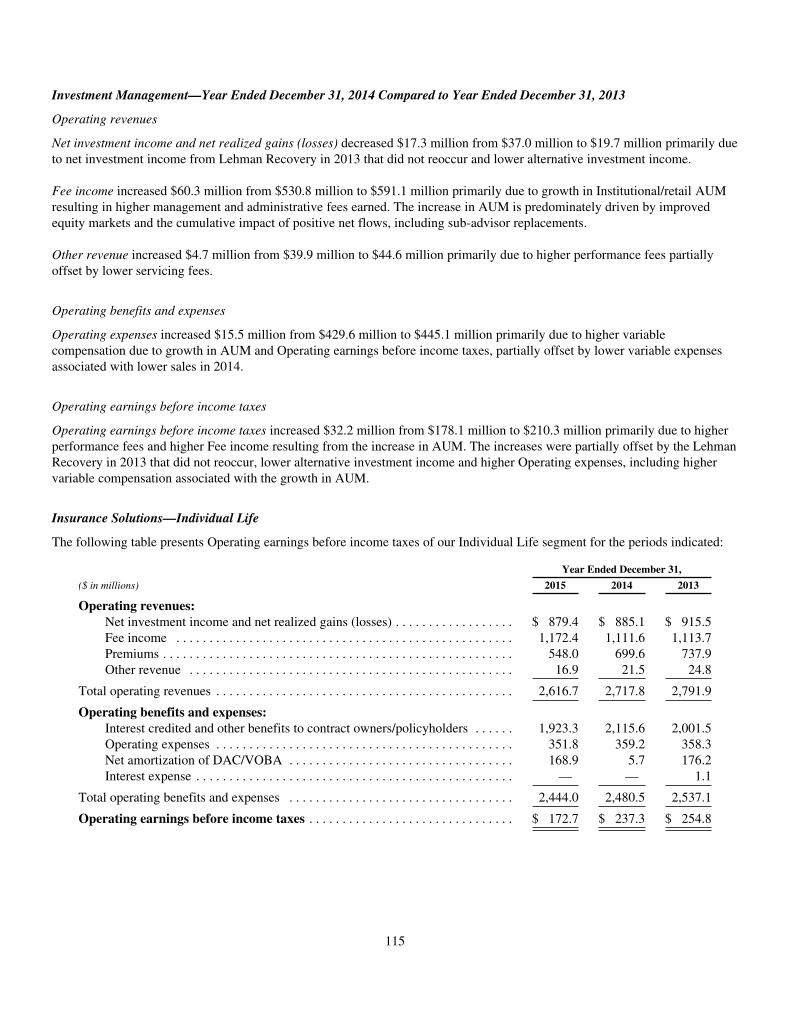
Investment Management—Year Ended December 31, 2014 Compared to Year Ended December 31, 2013
Operating revenues
Net investment income and net realized gains (losses) decreased $17.3 million from $37.0 million to $19.7 million primarily dueto net investment income from Lehman Recovery in 2013 that did not reoccur and lower alternative investment income.
Fee income increased $60.3 million from $530.8 million to $591.1 million primarily due to growth in Institutional/retail AUMresulting in higher management and administrative fees earned. The increase in AUM is predominately driven by improvedequity markets and the cumulative impact of positive net flows, including sub-advisor replacements.
Other revenue increased $4.7 million from $39.9 million to $44.6 million primarily due to higher performance fees partiallyoffset by lower servicing fees.
Operating benefits and expenses
Operating expenses increased $15.5 million from $429.6 million to $445.1 million primarily due to higher variablecompensation due to growth in AUM and Operating earnings before income taxes, partially offset by lower variable expensesassociated with lower sales in 2014.
Operating earnings before income taxes
Operating earnings before income taxes increased $32.2 million from $178.1 million to $210.3 million primarily due to higherperformance fees and higher Fee income resulting from the increase in AUM. The increases were partially offset by the LehmanRecovery in 2013 that did not reoccur, lower alternative investment income and higher Operating expenses, including highervariable compensation associated with the growth in AUM.
Insurance Solutions—Individual Life
The following table presents Operating earnings before income taxes of our Individual Life segment for the periods indicated:
Year Ended December 31,
($ in millions) 2015 2014 2013
Operating revenues:Net investment income and net realized gains (losses) . . . . . . . . . . . . . . . . . . $ 879.4 $ 885.1 $ 915.5Fee income . . . . . . . . . . . . . . . . . . . . . . . . . . . . . . . . . . . . . . . . . . . . . . . . . . . 1,172.4 1,111.6 1,113.7Premiums . . . . . . . . . . . . . . . . . . . . . . . . . . . . . . . . . . . . . . . . . . . . . . . . . . . . . 548.0 699.6 737.9Other revenue . . . . . . . . . . . . . . . . . . . . . . . . . . . . . . . . . . . . . . . . . . . . . . . . . 16.9 21.5 24.8
Total operating revenues . . . . . . . . . . . . . . . . . . . . . . . . . . . . . . . . . . . . . . . . . . . . . 2,616.7 2,717.8 2,791.9
Operating benefits and expenses:Interest credited and other benefits to contract owners/policyholders . . . . . . 1,923.3 2,115.6 2,001.5Operating expenses . . . . . . . . . . . . . . . . . . . . . . . . . . . . . . . . . . . . . . . . . . . . . 351.8 359.2 358.3Net amortization of DAC/VOBA . . . . . . . . . . . . . . . . . . . . . . . . . . . . . . . . . . 168.9 5.7 176.2Interest expense . . . . . . . . . . . . . . . . . . . . . . . . . . . . . . . . . . . . . . . . . . . . . . . . — — 1.1
Total operating benefits and expenses . . . . . . . . . . . . . . . . . . . . . . . . . . . . . . . . . . 2,444.0 2,480.5 2,537.1
Operating earnings before income taxes . . . . . . . . . . . . . . . . . . . . . . . . . . . . . . . $ 172.7 $ 237.3 $ 254.8
115
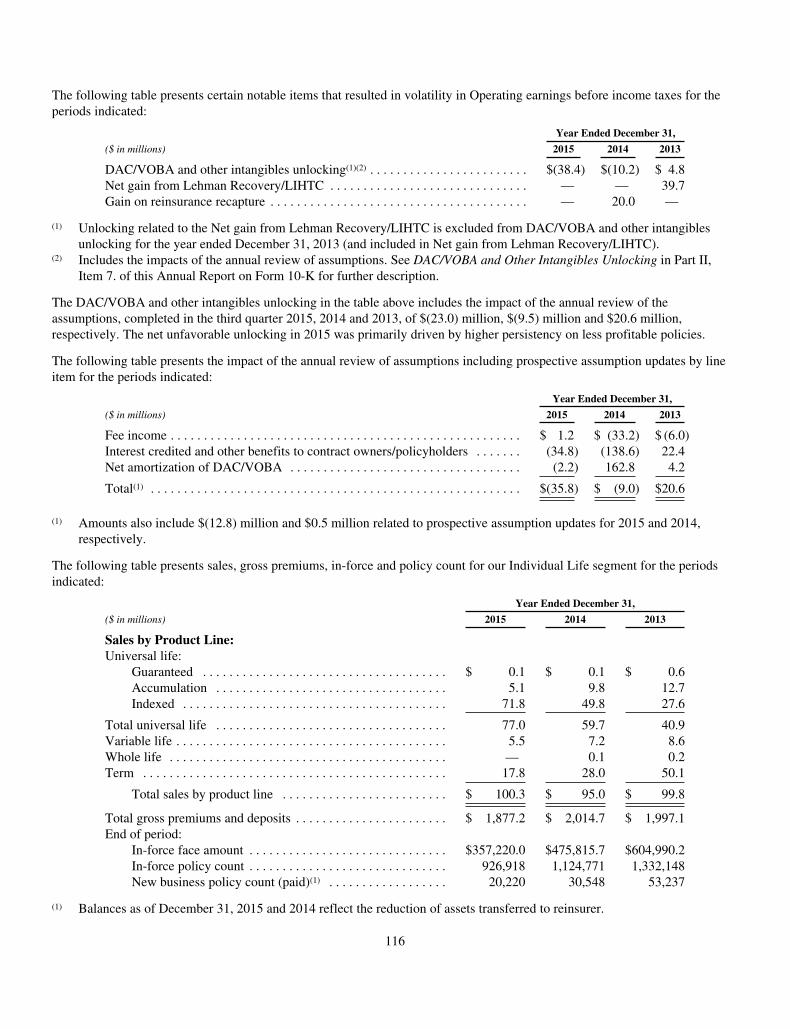
The following table presents certain notable items that resulted in volatility in Operating earnings before income taxes for theperiods indicated:
Year Ended December 31,
($ in millions) 2015 2014 2013
DAC/VOBA and other intangibles unlocking(1)(2) . . . . . . . . . . . . . . . . . . . . . . . . $(38.4) $(10.2) $ 4.8Net gain from Lehman Recovery/LIHTC . . . . . . . . . . . . . . . . . . . . . . . . . . . . . . — — 39.7Gain on reinsurance recapture . . . . . . . . . . . . . . . . . . . . . . . . . . . . . . . . . . . . . . . — 20.0 —
(1) Unlocking related to the Net gain from Lehman Recovery/LIHTC is excluded from DAC/VOBA and other intangiblesunlocking for the year ended December 31, 2013 (and included in Net gain from Lehman Recovery/LIHTC).
(2) Includes the impacts of the annual review of assumptions. See DAC/VOBA and Other Intangibles Unlocking in Part II,Item 7. of this Annual Report on Form 10-K for further description.
The DAC/VOBA and other intangibles unlocking in the table above includes the impact of the annual review of theassumptions, completed in the third quarter 2015, 2014 and 2013, of $(23.0) million, $(9.5) million and $20.6 million,respectively. The net unfavorable unlocking in 2015 was primarily driven by higher persistency on less profitable policies.
The following table presents the impact of the annual review of assumptions including prospective assumption updates by lineitem for the periods indicated:
Year Ended December 31,
($ in millions) 2015 2014 2013
Fee income . . . . . . . . . . . . . . . . . . . . . . . . . . . . . . . . . . . . . . . . . . . . . . . . . . . . . $ 1.2 $ (33.2) $ (6.0)Interest credited and other benefits to contract owners/policyholders . . . . . . . (34.8) (138.6) 22.4Net amortization of DAC/VOBA . . . . . . . . . . . . . . . . . . . . . . . . . . . . . . . . . . . (2.2) 162.8 4.2
Total(1) . . . . . . . . . . . . . . . . . . . . . . . . . . . . . . . . . . . . . . . . . . . . . . . . . . . . . . . . $(35.8) $ (9.0) $20.6
(1) Amounts also include $(12.8) million and $0.5 million related to prospective assumption updates for 2015 and 2014,respectively.
The following table presents sales, gross premiums, in-force and policy count for our Individual Life segment for the periodsindicated:
Year Ended December 31,
($ in millions) 2015 2014 2013
Sales by Product Line:Universal life:
Guaranteed . . . . . . . . . . . . . . . . . . . . . . . . . . . . . . . . . . . . . $ 0.1 $ 0.1 $ 0.6Accumulation . . . . . . . . . . . . . . . . . . . . . . . . . . . . . . . . . . . 5.1 9.8 12.7Indexed . . . . . . . . . . . . . . . . . . . . . . . . . . . . . . . . . . . . . . . . 71.8 49.8 27.6
Total universal life . . . . . . . . . . . . . . . . . . . . . . . . . . . . . . . . . . . 77.0 59.7 40.9Variable life . . . . . . . . . . . . . . . . . . . . . . . . . . . . . . . . . . . . . . . . . 5.5 7.2 8.6Whole life . . . . . . . . . . . . . . . . . . . . . . . . . . . . . . . . . . . . . . . . . . — 0.1 0.2Term . . . . . . . . . . . . . . . . . . . . . . . . . . . . . . . . . . . . . . . . . . . . . . 17.8 28.0 50.1
Total sales by product line . . . . . . . . . . . . . . . . . . . . . . . . . $ 100.3 $ 95.0 $ 99.8
Total gross premiums and deposits . . . . . . . . . . . . . . . . . . . . . . . $ 1,877.2 $ 2,014.7 $ 1,997.1End of period:
In-force face amount . . . . . . . . . . . . . . . . . . . . . . . . . . . . . . $357,220.0 $475,815.7 $604,990.2In-force policy count . . . . . . . . . . . . . . . . . . . . . . . . . . . . . . 926,918 1,124,771 1,332,148New business policy count (paid)(1) . . . . . . . . . . . . . . . . . . 20,220 30,548 53,237
(1) Balances as of December 31, 2015 and 2014 reflect the reduction of assets transferred to reinsurer.
116
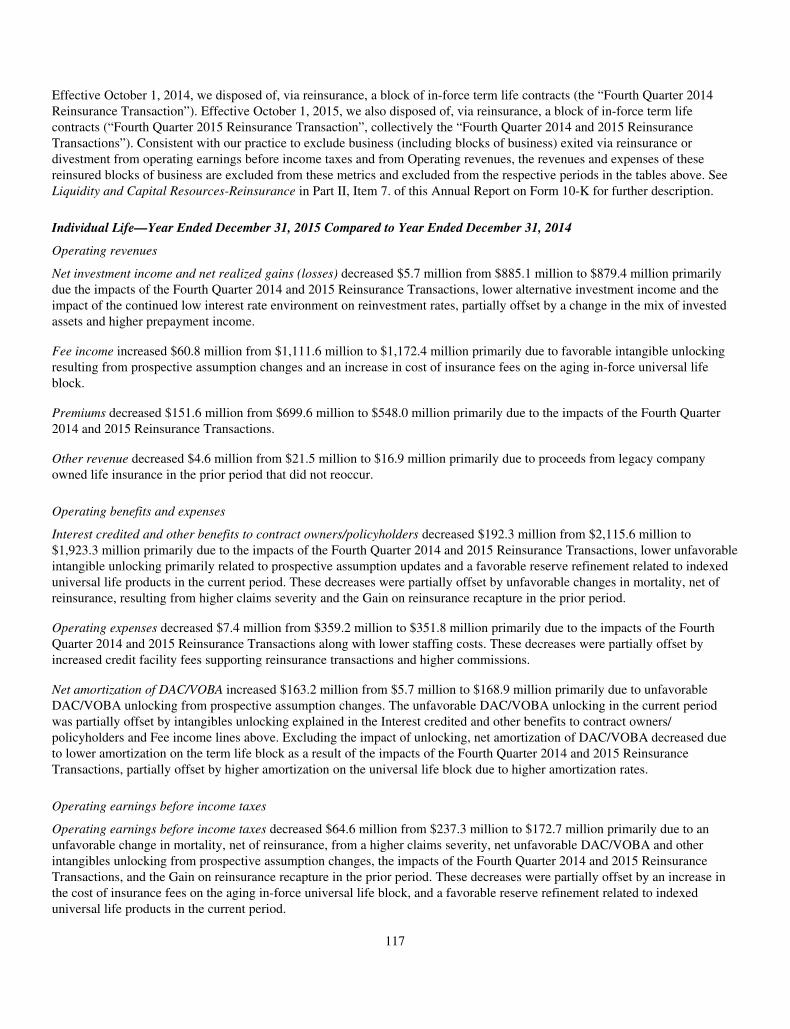
Effective October 1, 2014, we disposed of, via reinsurance, a block of in-force term life contracts (the “Fourth Quarter 2014Reinsurance Transaction”). Effective October 1, 2015, we also disposed of, via reinsurance, a block of in-force term lifecontracts (“Fourth Quarter 2015 Reinsurance Transaction”, collectively the “Fourth Quarter 2014 and 2015 ReinsuranceTransactions”). Consistent with our practice to exclude business (including blocks of business) exited via reinsurance ordivestment from operating earnings before income taxes and from Operating revenues, the revenues and expenses of thesereinsured blocks of business are excluded from these metrics and excluded from the respective periods in the tables above. SeeLiquidity and Capital Resources-Reinsurance in Part II, Item 7. of this Annual Report on Form 10-K for further description.
Individual Life—Year Ended December 31, 2015 Compared to Year Ended December 31, 2014
Operating revenues
Net investment income and net realized gains (losses) decreased $5.7 million from $885.1 million to $879.4 million primarilydue the impacts of the Fourth Quarter 2014 and 2015 Reinsurance Transactions, lower alternative investment income and theimpact of the continued low interest rate environment on reinvestment rates, partially offset by a change in the mix of investedassets and higher prepayment income.
Fee income increased $60.8 million from $1,111.6 million to $1,172.4 million primarily due to favorable intangible unlockingresulting from prospective assumption changes and an increase in cost of insurance fees on the aging in-force universal lifeblock.
Premiums decreased $151.6 million from $699.6 million to $548.0 million primarily due to the impacts of the Fourth Quarter2014 and 2015 Reinsurance Transactions.
Other revenue decreased $4.6 million from $21.5 million to $16.9 million primarily due to proceeds from legacy companyowned life insurance in the prior period that did not reoccur.
Operating benefits and expenses
Interest credited and other benefits to contract owners/policyholders decreased $192.3 million from $2,115.6 million to$1,923.3 million primarily due to the impacts of the Fourth Quarter 2014 and 2015 Reinsurance Transactions, lower unfavorableintangible unlocking primarily related to prospective assumption updates and a favorable reserve refinement related to indexeduniversal life products in the current period. These decreases were partially offset by unfavorable changes in mortality, net ofreinsurance, resulting from higher claims severity and the Gain on reinsurance recapture in the prior period.
Operating expenses decreased $7.4 million from $359.2 million to $351.8 million primarily due to the impacts of the FourthQuarter 2014 and 2015 Reinsurance Transactions along with lower staffing costs. These decreases were partially offset byincreased credit facility fees supporting reinsurance transactions and higher commissions.
Net amortization of DAC/VOBA increased $163.2 million from $5.7 million to $168.9 million primarily due to unfavorableDAC/VOBA unlocking from prospective assumption changes. The unfavorable DAC/VOBA unlocking in the current periodwas partially offset by intangibles unlocking explained in the Interest credited and other benefits to contract owners/policyholders and Fee income lines above. Excluding the impact of unlocking, net amortization of DAC/VOBA decreased dueto lower amortization on the term life block as a result of the impacts of the Fourth Quarter 2014 and 2015 ReinsuranceTransactions, partially offset by higher amortization on the universal life block due to higher amortization rates.
Operating earnings before income taxes
Operating earnings before income taxes decreased $64.6 million from $237.3 million to $172.7 million primarily due to anunfavorable change in mortality, net of reinsurance, from a higher claims severity, net unfavorable DAC/VOBA and otherintangibles unlocking from prospective assumption changes, the impacts of the Fourth Quarter 2014 and 2015 ReinsuranceTransactions, and the Gain on reinsurance recapture in the prior period. These decreases were partially offset by an increase inthe cost of insurance fees on the aging in-force universal life block, and a favorable reserve refinement related to indexeduniversal life products in the current period.
117

Individual Life—Year Ended December 31, 2014 Compared to Year Ended December 31, 2013
Operating revenues
Net investment income and net realized gains (losses) decreased $30.4 million from $915.5 million to $885.1 million primarilydue to $47.2 million of net investment income from Lehman Recovery/LIHTC in 2013 that did not reoccur. Excluding theimpact of Lehman Recovery/LIHTC, investment income increased resulting from portfolio restructuring.
Fee income decreased $2.1 million from $1,113.7 million to $1,111.6 million primarily due to higher unfavorable intangibleunlocking in the current period resulting from prospective assumption changes. Excluding the impact from unlocking, Feeincome increased primarily due to an increase in cost of insurance fees on the aging in-force universal life block.
Premiums decreased $38.3 million from $737.9 million to $699.6 million primarily due to the impact of the Fourth Quarter2014 Reinsurance Transaction. Excluding the impact of this transaction, Premiums increased slightly due to renewal premiumspartially offset by lower first year premiums due to lower term life sales.
Other revenue decreased $3.3 million from $24.8 million to $21.5 million due to lower surrender fees on the universal lifeblock.
Operating benefits and expenses
Interest credited and other benefits to contract owners/policyholders increased $114.1 million from $2,001.5 million to$2,115.6 million primarily due to unfavorable intangibles unlocking from prospective assumption changes in 2014 compared tofavorable unlocking in 2013, partially offset by the impacts of the Fourth Quarter 2014 Reinsurance Transaction and the Gainon reinsurance recapture in 2014. Excluding the impact from these items, Interest credited and other benefits to contract owners/policyholders increased primarily due to unfavorable changes in mortality, net of reinsurance on the universal life blocks due toan aging block partially offset by favorable changes in reserves from lower term sales.
Net Amortization of DAC/VOBA decreased $170.5 million from $176.2 million to $5.7 million primarily due to favorable DAC/VOBA unlocking resulting from prospective assumption changes. The favorable DAC unlocking in 2014 was more than offsetby other intangibles unlocking from prospective assumption changes as explained in Fee income and Interest credited and otherbenefits to contract owners/policyholders above. Excluding the impact from unlocking, net amortization of DAC/VOBAdecreased primarily due to lower amortization on the universal life blocks driven by lower gross profits.
Operating earnings before income taxes
Operating earnings before income taxes decreased $17.5 million from $254.8 million to $237.3 million primarily driven by netunfavorable DAC/VOBA and other intangibles unlocking from prospective assumption changes in 2014 compared to favorableunlocking in 2013 and higher net investment income from Lehman Recovery/LIHTC in 2013 that did not reoccur. Partiallyoffsetting these items were the impacts of the Fourth Quarter 2014 Reinsurance Transaction and the Gain on reinsurancerecapture in 2014. Excluding these impacts, Operating earnings before taxes increased driven by higher Net investment incomedue to portfolio restructuring, lower amortization due to lower gross profits and favorable administrative expenses primarilydriven by lower sales related expenses, partially offset by unfavorable changes in mortality, net of reinsurance on the universallife blocks.
118
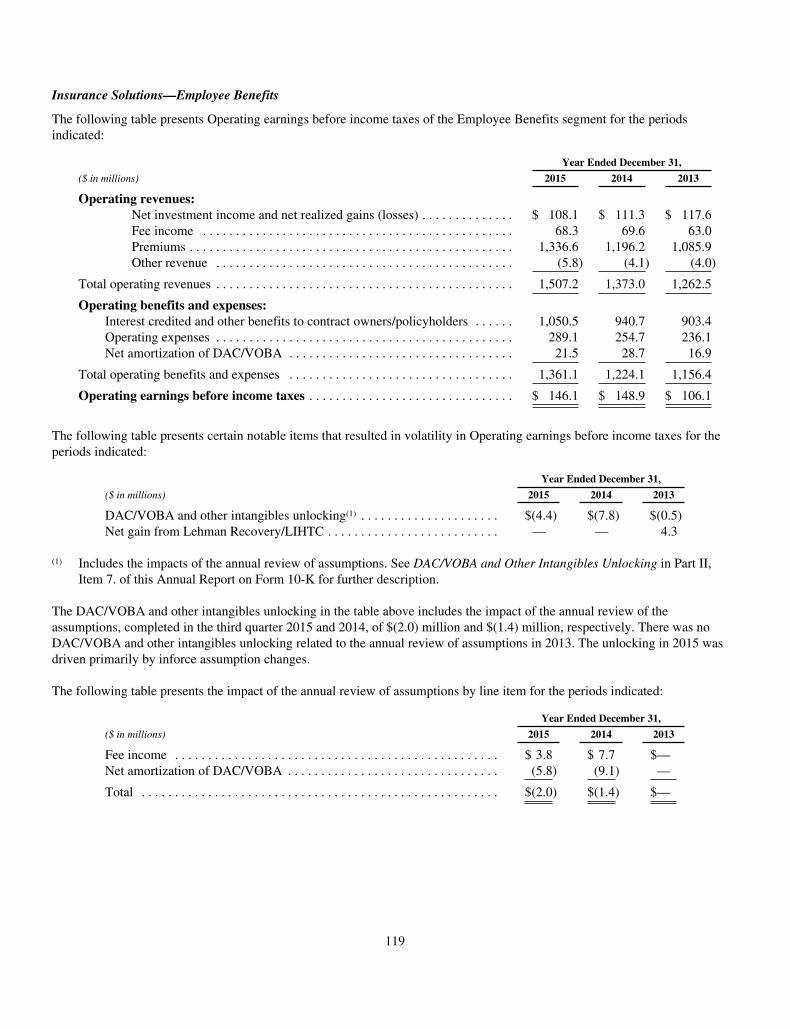
Insurance Solutions—Employee Benefits
The following table presents Operating earnings before income taxes of the Employee Benefits segment for the periodsindicated:
Year Ended December 31,
($ in millions) 2015 2014 2013
Operating revenues:Net investment income and net realized gains (losses) . . . . . . . . . . . . . . $ 108.1 $ 111.3 $ 117.6Fee income . . . . . . . . . . . . . . . . . . . . . . . . . . . . . . . . . . . . . . . . . . . . . . . 68.3 69.6 63.0Premiums . . . . . . . . . . . . . . . . . . . . . . . . . . . . . . . . . . . . . . . . . . . . . . . . . 1,336.6 1,196.2 1,085.9Other revenue . . . . . . . . . . . . . . . . . . . . . . . . . . . . . . . . . . . . . . . . . . . . . (5.8) (4.1) (4.0)
Total operating revenues . . . . . . . . . . . . . . . . . . . . . . . . . . . . . . . . . . . . . . . . . . . . . 1,507.2 1,373.0 1,262.5
Operating benefits and expenses:Interest credited and other benefits to contract owners/policyholders . . . . . . 1,050.5 940.7 903.4Operating expenses . . . . . . . . . . . . . . . . . . . . . . . . . . . . . . . . . . . . . . . . . . . . . 289.1 254.7 236.1Net amortization of DAC/VOBA . . . . . . . . . . . . . . . . . . . . . . . . . . . . . . . . . . 21.5 28.7 16.9
Total operating benefits and expenses . . . . . . . . . . . . . . . . . . . . . . . . . . . . . . . . . . 1,361.1 1,224.1 1,156.4
Operating earnings before income taxes . . . . . . . . . . . . . . . . . . . . . . . . . . . . . . . $ 146.1 $ 148.9 $ 106.1
The following table presents certain notable items that resulted in volatility in Operating earnings before income taxes for theperiods indicated:
Year Ended December 31,
($ in millions) 2015 2014 2013
DAC/VOBA and other intangibles unlocking(1) . . . . . . . . . . . . . . . . . . . . . $(4.4) $(7.8) $(0.5)Net gain from Lehman Recovery/LIHTC . . . . . . . . . . . . . . . . . . . . . . . . . . — — 4.3
(1) Includes the impacts of the annual review of assumptions. See DAC/VOBA and Other Intangibles Unlocking in Part II,Item 7. of this Annual Report on Form 10-K for further description.
The DAC/VOBA and other intangibles unlocking in the table above includes the impact of the annual review of theassumptions, completed in the third quarter 2015 and 2014, of $(2.0) million and $(1.4) million, respectively. There was noDAC/VOBA and other intangibles unlocking related to the annual review of assumptions in 2013. The unlocking in 2015 wasdriven primarily by inforce assumption changes.
The following table presents the impact of the annual review of assumptions by line item for the periods indicated:
Year Ended December 31,
($ in millions) 2015 2014 2013
Fee income . . . . . . . . . . . . . . . . . . . . . . . . . . . . . . . . . . . . . . . . . . . . . . . . . $ 3.8 $ 7.7 $—Net amortization of DAC/VOBA . . . . . . . . . . . . . . . . . . . . . . . . . . . . . . . . (5.8) (9.1) —
Total . . . . . . . . . . . . . . . . . . . . . . . . . . . . . . . . . . . . . . . . . . . . . . . . . . . . . . $(2.0) $(1.4) $—
119
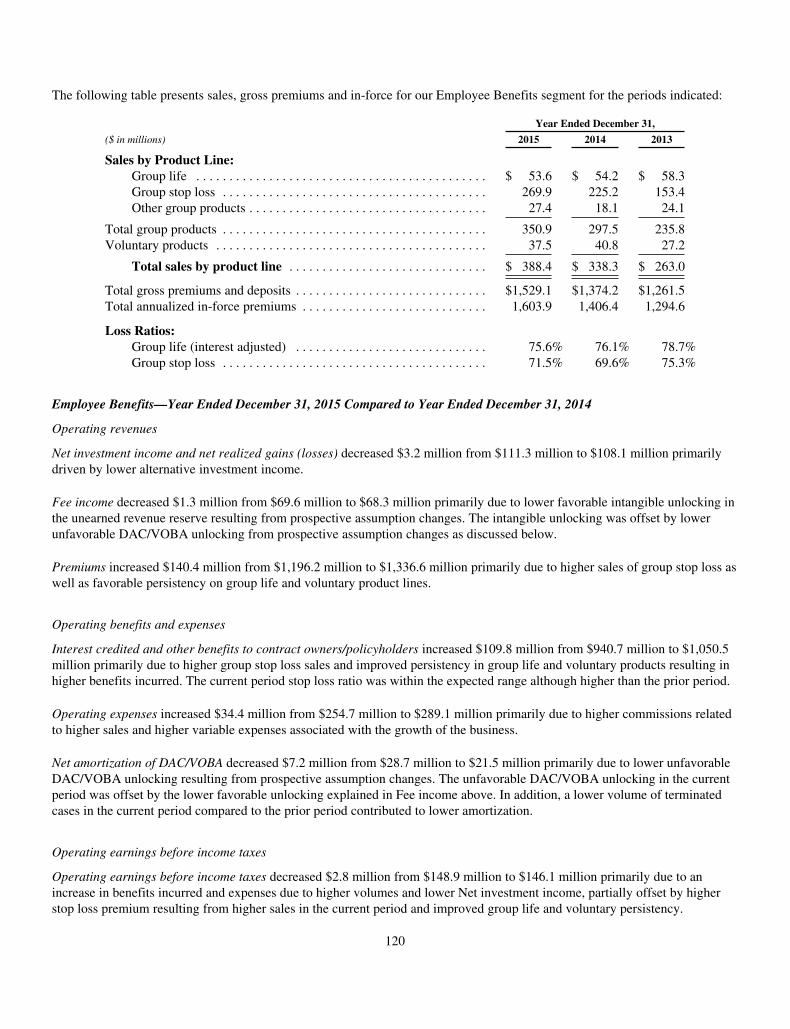
The following table presents sales, gross premiums and in-force for our Employee Benefits segment for the periods indicated:
Year Ended December 31,
($ in millions) 2015 2014 2013
Sales by Product Line:Group life . . . . . . . . . . . . . . . . . . . . . . . . . . . . . . . . . . . . . . . . . . . . $ 53.6 $ 54.2 $ 58.3Group stop loss . . . . . . . . . . . . . . . . . . . . . . . . . . . . . . . . . . . . . . . . 269.9 225.2 153.4Other group products . . . . . . . . . . . . . . . . . . . . . . . . . . . . . . . . . . . . 27.4 18.1 24.1
Total group products . . . . . . . . . . . . . . . . . . . . . . . . . . . . . . . . . . . . . . . . 350.9 297.5 235.8Voluntary products . . . . . . . . . . . . . . . . . . . . . . . . . . . . . . . . . . . . . . . . . 37.5 40.8 27.2
Total sales by product line . . . . . . . . . . . . . . . . . . . . . . . . . . . . . . $ 388.4 $ 338.3 $ 263.0
Total gross premiums and deposits . . . . . . . . . . . . . . . . . . . . . . . . . . . . . $1,529.1 $1,374.2 $1,261.5Total annualized in-force premiums . . . . . . . . . . . . . . . . . . . . . . . . . . . . 1,603.9 1,406.4 1,294.6
Loss Ratios:Group life (interest adjusted) . . . . . . . . . . . . . . . . . . . . . . . . . . . . . 75.6% 76.1% 78.7%Group stop loss . . . . . . . . . . . . . . . . . . . . . . . . . . . . . . . . . . . . . . . . 71.5% 69.6% 75.3%
Employee Benefits—Year Ended December 31, 2015 Compared to Year Ended December 31, 2014
Operating revenues
Net investment income and net realized gains (losses) decreased $3.2 million from $111.3 million to $108.1 million primarilydriven by lower alternative investment income.
Fee income decreased $1.3 million from $69.6 million to $68.3 million primarily due to lower favorable intangible unlocking inthe unearned revenue reserve resulting from prospective assumption changes. The intangible unlocking was offset by lowerunfavorable DAC/VOBA unlocking from prospective assumption changes as discussed below.
Premiums increased $140.4 million from $1,196.2 million to $1,336.6 million primarily due to higher sales of group stop loss aswell as favorable persistency on group life and voluntary product lines.
Operating benefits and expenses
Interest credited and other benefits to contract owners/policyholders increased $109.8 million from $940.7 million to $1,050.5million primarily due to higher group stop loss sales and improved persistency in group life and voluntary products resulting inhigher benefits incurred. The current period stop loss ratio was within the expected range although higher than the prior period.
Operating expenses increased $34.4 million from $254.7 million to $289.1 million primarily due to higher commissions relatedto higher sales and higher variable expenses associated with the growth of the business.
Net amortization of DAC/VOBA decreased $7.2 million from $28.7 million to $21.5 million primarily due to lower unfavorableDAC/VOBA unlocking resulting from prospective assumption changes. The unfavorable DAC/VOBA unlocking in the currentperiod was offset by the lower favorable unlocking explained in Fee income above. In addition, a lower volume of terminatedcases in the current period compared to the prior period contributed to lower amortization.
Operating earnings before income taxes
Operating earnings before income taxes decreased $2.8 million from $148.9 million to $146.1 million primarily due to anincrease in benefits incurred and expenses due to higher volumes and lower Net investment income, partially offset by higherstop loss premium resulting from higher sales in the current period and improved group life and voluntary persistency.
120

Employee Benefits—Year Ended December 31, 2014 Compared to Year Ended December 31, 2013
Operating revenues
Net investment income and net realized gains (losses) decreased $6.3 million from $117.6 million to $111.3 million primarilydue to $4.3 million of net investment income from Lehman Recovery/LIHTC in 2013 that did not reoccur. Excluding the impactof Lehman Recovery/LIHTC, investment income decreased primarily due to lower prepayment fee income.
Fee income increased $6.6 million from $63.0 million to $69.6 million primarily due to favorable intangible unlocking resultingfrom prospective assumption changes. This was offset by unfavorable DAC/VOBA unlocking from prospective assumptionchanges as discussed below.
Premiums increased $110.3 million from $1,085.9 million to $1,196.2 million primarily due to the effects of higher sales ofgroup stop loss and voluntary products. These increases were partially offset by lower group life premiums.
Operating benefits and expenses
Interest credited and other benefits to contract owners/policyholders increased $37.3 million from $903.4 million to $940.7million primarily due to higher stop loss and voluntary sales, resulting in higher benefits incurred, higher retained disabilityresults in 2013 that did not reoccur. These increases were partially offset by improved loss ratios and changes in reserves due tochanges in our risk assumption.
Operating expenses increased $18.6 million from $236.1 million to $254.7 million primarily due to higher sales-relatedexpenses from higher sales of group stop loss and voluntary products in 2014 and a reduction in estimated variablecompensation accruals in 2013 that did not reoccur.
Net amortization of DAC/VOBA increased $11.8 million from $16.9 million to $28.7 million primarily due to unfavorable DAC/VOBA unlocking resulting from prospective assumption changes. The unfavorable DAC unlocking in 2014 is partially offset bythe unlocking explained in Fee income above. Excluding the impact from unlocking, Net amortization of DAC/VOBA increasedprimarily due to increased amortization from terminated cases.
Operating earnings before income taxes
Operating earnings before income taxes increased $42.8 million from $106.1 million to $148.9 million primarily due toimproved loss ratios and higher stop loss premiums resulting from strong sales in 2014. Partially offsetting these items werehigher Operating expenses, increased Net amortization of DAC/VOBA resulting from terminated cases and lower netinvestment income due to the Lehman Recovery/LIHTC in 2013 that did not reoccur.
Corporate
The following table presents Operating earnings before income taxes of our Corporate segment for the periods indicated:
Year Ended December 31,
($ in millions) 2015 2014 2013
Interest expense . . . . . . . . . . . . . . . . . . . . . . . . . . . . . . . . . . . . . . . . . . $(194.5) $(188.0) $(179.7)Closed Block Variable Annuity contingent capital LOC . . . . . . . . . . . — — (18.4)Amortization of intangibles . . . . . . . . . . . . . . . . . . . . . . . . . . . . . . . . . (36.6) (35.6) (35.0)Strategic Investment Program . . . . . . . . . . . . . . . . . . . . . . . . . . . . . . . (79.5) — —Other . . . . . . . . . . . . . . . . . . . . . . . . . . . . . . . . . . . . . . . . . . . . . . . . . . . 51.4 53.2 22.5
Operating earnings before income taxes . . . . . . . . . . . . . . . . . . . . . . . . . $(259.2) $(170.4) $(210.6)
Our Corporate segment operating results include investment income on assets backing surplus in excess of amounts held at thesegment level, financing and interest expenses, amortization of intangibles and other items not allocated to segments.
121
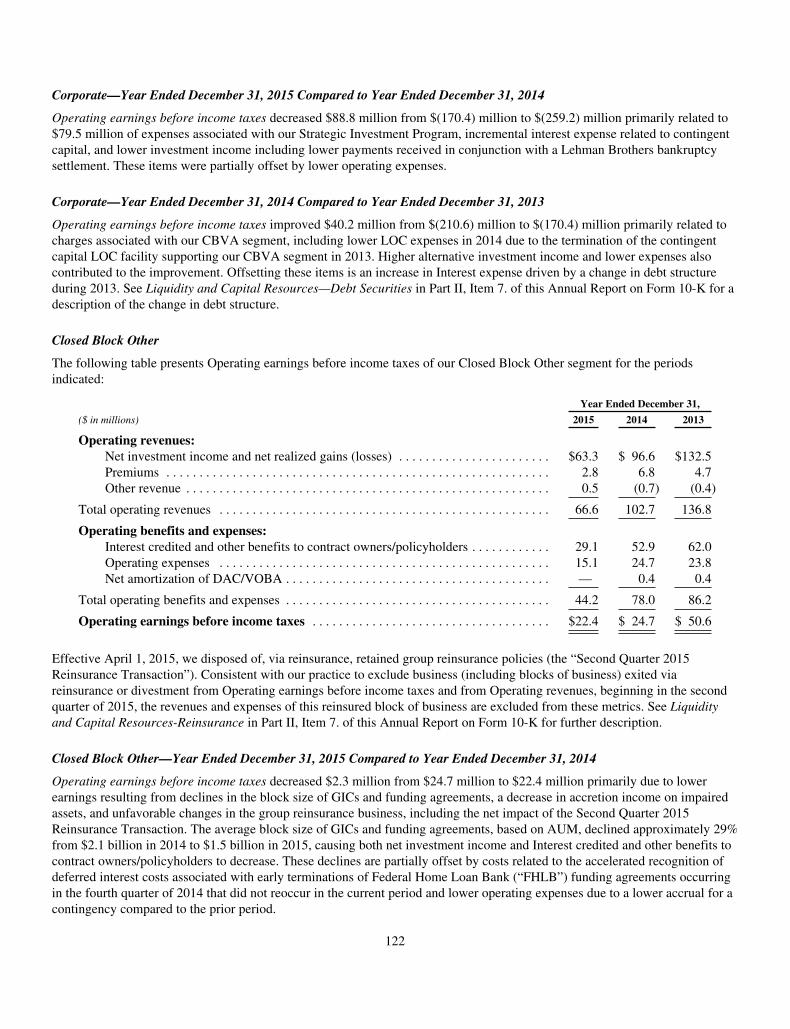
Corporate—Year Ended December 31, 2015 Compared to Year Ended December 31, 2014
Operating earnings before income taxes decreased $88.8 million from $(170.4) million to $(259.2) million primarily related to$79.5 million of expenses associated with our Strategic Investment Program, incremental interest expense related to contingentcapital, and lower investment income including lower payments received in conjunction with a Lehman Brothers bankruptcysettlement. These items were partially offset by lower operating expenses.
Corporate—Year Ended December 31, 2014 Compared to Year Ended December 31, 2013
Operating earnings before income taxes improved $40.2 million from $(210.6) million to $(170.4) million primarily related tocharges associated with our CBVA segment, including lower LOC expenses in 2014 due to the termination of the contingentcapital LOC facility supporting our CBVA segment in 2013. Higher alternative investment income and lower expenses alsocontributed to the improvement. Offsetting these items is an increase in Interest expense driven by a change in debt structureduring 2013. See Liquidity and Capital Resources—Debt Securities in Part II, Item 7. of this Annual Report on Form 10-K for adescription of the change in debt structure.
Closed Block Other
The following table presents Operating earnings before income taxes of our Closed Block Other segment for the periodsindicated:
Year Ended December 31,
($ in millions) 2015 2014 2013
Operating revenues:Net investment income and net realized gains (losses) . . . . . . . . . . . . . . . . . . . . . . . $63.3 $ 96.6 $132.5Premiums . . . . . . . . . . . . . . . . . . . . . . . . . . . . . . . . . . . . . . . . . . . . . . . . . . . . . . . . . . 2.8 6.8 4.7Other revenue . . . . . . . . . . . . . . . . . . . . . . . . . . . . . . . . . . . . . . . . . . . . . . . . . . . . . . . 0.5 (0.7) (0.4)
Total operating revenues . . . . . . . . . . . . . . . . . . . . . . . . . . . . . . . . . . . . . . . . . . . . . . . . . . 66.6 102.7 136.8
Operating benefits and expenses:Interest credited and other benefits to contract owners/policyholders . . . . . . . . . . . . 29.1 52.9 62.0Operating expenses . . . . . . . . . . . . . . . . . . . . . . . . . . . . . . . . . . . . . . . . . . . . . . . . . . 15.1 24.7 23.8Net amortization of DAC/VOBA . . . . . . . . . . . . . . . . . . . . . . . . . . . . . . . . . . . . . . . . — 0.4 0.4
Total operating benefits and expenses . . . . . . . . . . . . . . . . . . . . . . . . . . . . . . . . . . . . . . . . 44.2 78.0 86.2
Operating earnings before income taxes . . . . . . . . . . . . . . . . . . . . . . . . . . . . . . . . . . . . $22.4 $ 24.7 $ 50.6
Effective April 1, 2015, we disposed of, via reinsurance, retained group reinsurance policies (the “Second Quarter 2015Reinsurance Transaction”). Consistent with our practice to exclude business (including blocks of business) exited viareinsurance or divestment from Operating earnings before income taxes and from Operating revenues, beginning in the secondquarter of 2015, the revenues and expenses of this reinsured block of business are excluded from these metrics. See Liquidityand Capital Resources-Reinsurance in Part II, Item 7. of this Annual Report on Form 10-K for further description.
Closed Block Other—Year Ended December 31, 2015 Compared to Year Ended December 31, 2014
Operating earnings before income taxes decreased $2.3 million from $24.7 million to $22.4 million primarily due to lowerearnings resulting from declines in the block size of GICs and funding agreements, a decrease in accretion income on impairedassets, and unfavorable changes in the group reinsurance business, including the net impact of the Second Quarter 2015Reinsurance Transaction. The average block size of GICs and funding agreements, based on AUM, declined approximately 29%from $2.1 billion in 2014 to $1.5 billion in 2015, causing both net investment income and Interest credited and other benefits tocontract owners/policyholders to decrease. These declines are partially offset by costs related to the accelerated recognition ofdeferred interest costs associated with early terminations of Federal Home Loan Bank (“FHLB”) funding agreements occurringin the fourth quarter of 2014 that did not reoccur in the current period and lower operating expenses due to a lower accrual for acontingency compared to the prior period.
122

Closed Block Other—Year Ended December 31, 2014 Compared to Year Ended December 31, 2013
Operating earnings before income taxes decreased $25.9 million from $50.6 million to $24.7 million primarily due to lowerearnings resulting from declines in the block size of GICs and funding agreements, a decrease in accretion income on impairedassets as well as lower favorable reserve development in the retained portion of the group reinsurance business compared to2013 and investment income from Lehman Recovery/LIHTC in 2013 that did not reoccur in the current period. The averageblock size of GICs and funding agreements, based on AUM, declined approximately 42% from $3.6 billion in 2013 to $2.1billion in 2014, causing both Net investment income and Interest credited and other benefits to contract owners/policyholders todecrease. These declines are partially offset by an increase in prepayment income and higher premiums in 2014 due to a true-upof estimated premiums due to us from a TPA for the group reinsurance business. In addition, costs related to the acceleratedrecognition of deferred interest costs associated with early terminations of FHLB funding agreements, which occurred in bothperiods, declined slightly.
Closed Block Variable Annuity
The following table presents Income (loss) before income taxes of our CBVA segment for the periods indicated:
Year Ended December 31,
($ in millions) 2015 2014 2013
Revenues:Net investment income . . . . . . . . . . . . . . . . . . . . . . . . . . . . . . . . . . . . . . . . . $ 231.1 $ 163.2 $ 97.6Fee income . . . . . . . . . . . . . . . . . . . . . . . . . . . . . . . . . . . . . . . . . . . . . . . . . . . 1,118.3 1,251.7 1,287.1Premiums . . . . . . . . . . . . . . . . . . . . . . . . . . . . . . . . . . . . . . . . . . . . . . . . . . . . 416.2 522.2 79.2Net realized capital gains (losses) . . . . . . . . . . . . . . . . . . . . . . . . . . . . . . . . . (188.1) (689.7) (2,210.6)Other revenue . . . . . . . . . . . . . . . . . . . . . . . . . . . . . . . . . . . . . . . . . . . . . . . . . 7.0 14.6 18.5
Total revenues . . . . . . . . . . . . . . . . . . . . . . . . . . . . . . . . . . . . . . . . . . . . . . . . . . . . 1,584.5 1,262.0 (728.2)
Benefits and expenses:Interest credited and other benefits to contract owners/policyholders . . . . . 1,275.9 994.8 (51.9)Operating expenses and interest expense . . . . . . . . . . . . . . . . . . . . . . . . . . . . 431.5 473.6 467.6Net amortization of DAC/VOBA . . . . . . . . . . . . . . . . . . . . . . . . . . . . . . . . . 50.4 32.8 67.4
Total benefits and expenses . . . . . . . . . . . . . . . . . . . . . . . . . . . . . . . . . . . . . . . . . . 1,757.8 1,501.2 483.1
Income (loss) before income taxes . . . . . . . . . . . . . . . . . . . . . . . . . . . . . . . . . . . $ (173.3) $ (239.2) $(1,211.3)
123

The following table presents certain notable items that result in volatility in Income (loss) before income taxes for the periodsindicated:
Year Ended December 31,
($ in millions) 2015 2014 2013
Net gains (losses) related to incurred guaranteed benefits and guarantee hedge program,excluding nonperformance risk . . . . . . . . . . . . . . . . . . . . . . . . . . . . . . . . . . . . . . . . . . . . . . . $(1,089.0) $(1,454.2) $(1,428.5)
Gain (losses) related to capital hedge overlay (“CHO”) program . . . . . . . . . . . . . . . . . . . . . . (25.8) (121.1) (244.8)Gain (loss) due to nonperformance risk . . . . . . . . . . . . . . . . . . . . . . . . . . . . . . . . . . . . . . . . . . 71.9 327.7 (497.5)Net investment gains (losses) . . . . . . . . . . . . . . . . . . . . . . . . . . . . . . . . . . . . . . . . . . . . . . . . . . (15.1) (0.4) 12.6DAC/VOBA and other intangibles unlocking . . . . . . . . . . . . . . . . . . . . . . . . . . . . . . . . . . . . . 1.7 34.4 (4.7)
The following table presents AUM for our CBVA segment as of the dates indicated:
Year Ended December 31,
($ in millions) 2015 2014 2013
AUM:General account . . . . . . . . . . . . . . . . . . . . . . . . . . . . . . . . . . . . . $ 3,410.4 $ 2,556.3 $ 1,429.1Separate account . . . . . . . . . . . . . . . . . . . . . . . . . . . . . . . . . . . . 35,141.4 40,657.9 44,269.9
Total AUM . . . . . . . . . . . . . . . . . . . . . . . . . . . . . . . . . . . . . . . . . . . . $38,551.8 $43,214.2 $45,699.0
The following table presents a rollforward of AUM for our CBVA segment for the periods indicated:
Year Ended December 31,
($ in millions) 2015 2014 2013
Balance as of beginning of period . . . . . . . . . . . . . . . . . . . . . . . . . . . . . . . . . . . $41,132.0 $44,788.2 $42,590.6Deposits . . . . . . . . . . . . . . . . . . . . . . . . . . . . . . . . . . . . . . . . . . . . . . . . . . . 123.8 170.4 270.6Surrenders, benefits and product charges . . . . . . . . . . . . . . . . . . . . . . . . . (4,659.0) (5,593.7) (4,502.7)
Net flows . . . . . . . . . . . . . . . . . . . . . . . . . . . . . . . . . . . . . . . . . . . . . . (4,535.2) (5,423.3) (4,232.1)Interest credited and investment performance . . . . . . . . . . . . . . . . . . . . . (1,021.0) 1,767.1 6,429.7
Balance as of end of period . . . . . . . . . . . . . . . . . . . . . . . . . . . . . . . . . . . . . . . 35,575.8 41,132.0 44,788.2
End of period contracts in payout status . . . . . . . . . . . . . . . . . . . . . . . . . . . . . . 2,976.0 2,082.2 910.8
Total balance as of end of period(1) . . . . . . . . . . . . . . . . . . . . . . . . . . . . . . . . . . $38,551.8 $43,214.2 $45,699.0
(1) Includes products in accumulation and payout phase, policy loans and life insurance business.
Closed Block Variable Annuity—Year Ended December 31, 2015 Compared to Year Ended December 31, 2014
Loss before income taxes decreased $65.9 million from $239.2 million to $173.3 million. Annual assumption changes andrevisions to projection model inputs implemented during the current period resulted in a loss of $86.0 million, compared to again of $102.3 million in the prior period (which excluded a gain of $37.9 million due to changes in the technique used toestimate nonperformance risk). The $86.0 million loss included an unfavorable $43.0 million resulting from policyholderbehavior assumption changes primarily related to an update to lapse assumptions, partially offset by a favorable $27.4 millionresulting from changes to mortality assumptions. The loss also included an unfavorable $70.4 million as a result of updatesmade to other assumptions, principally relating to expected earned rates on certain investment options available to variableannuity contract holders, discount rates applicable to future cash flows from variable annuity contracts and long-term volatility.The prior period gain of $102.3 million included a favorable $170.2 million resulting from policyholder behavior assumptionchanges, partially offset by an unfavorable $40.5 million resulting from changes to mortality assumptions. The gain frompolicyholder behavior assumption changes was primarily due to an update to the utilization assumption on GMWBL contracts,partially offset by an unfavorable result from an update to lapse assumptions.
The current period results included a $255.8 million decrease in earnings due to changes in the fair value of guaranteed benefitderivatives related to nonperformance risk, from gains of $327.7 million in the prior period, which included the effects of
124

changes in the technique used to estimate nonperformance risk, to gains of $71.9 million in the current period. DAC/VOBA andother intangibles unlocking declined by $32.7 million, from a gain of $34.4 million in the prior period to a gain of $1.7 millionin the current year period, mainly due to unfavorable impacts of assumption changes mentioned above.
Net losses related to the incurred guaranteed benefits and our guarantee hedge program decreased to a loss of $1,089.0 millionin the current period compared to a loss of $1,454.2 million in the prior period. The $365.2 million favorable variance wasprimarily due to the impacts of interest rate movements and unfavorable equity market performance in the current period,partially offset by unfavorable impacts of assumption changes, mentioned above, as well as high volatility. Lower equity marketreturns and high volatility also led to a favorable variance on our CHO program of $95.3 million, from a loss of $121.1 millionto a loss of $25.8 million. The focus in managing our CBVA segment is on protecting regulatory and rating agency capital, andour hedging program is primarily designed to mitigate the impacts of market scenarios on capital resources, rather thanmitigating earnings volatility.
In addition, lower fee income was partially offset by lower operating expenses as a result of continued run off of the block.Lower premiums associated with the annuitization of life contingent contracts and higher net investment income, primarily dueto higher general account AUM, were offset by corresponding reserve changes in Interest credited and other benefits to contractowners/policyholders.
Closed Blocks Variable Annuity—Year Ended December 31, 2014 Compared to Year Ended December 31, 2013
Loss before income taxes decreased $972.1 million from $1,211.3 million to $239.2 million. Annual assumption changes andrevisions to projection model inputs implemented during 2014 resulted in a gain of $102.3 million (excluding a gain of $37.9million due to changes in the technique used to estimate nonperformance risk). This $102.3 million gain included a favorable$170.2 million resulting from policyholder behavior assumption changes partially offset by an unfavorable $40.5 millionresulting from change to mortality assumptions. The gain from policyholder behavior assumption changes was primarily due toan update to the utilization assumption on GMWBL contracts, partially offset by an unfavorable result from an update to lapseassumptions. The 2013 result included a loss of $185.3 million (excluding a gain of $144.6 million due to changes in thetechnique used to estimate nonperformance risk) due to annual assumption changes. This $185.3 million loss included anunfavorable $117.9 million resulting from changes to mortality assumptions and an unfavorable $85.5 million resulting frompolicyholder behavior assumption changes.
Including the impacts of assumption changes described above, the loss before income taxes decreased $972.1 million as a resultof several factors. The change in the fair value of guaranteed benefit derivatives related to nonperformance risk resulted in afavorable variance of $825.2 million, from a loss of $497.5 million in 2013 to a gain of $327.7 million in 2014, including theeffects of changes in the technique used to estimate nonperformance risk. Net losses related to the incurred guaranteed benefitsand our guarantee hedge program and CHO program decreased to a loss of $1,575.3 million in 2014 compared to a loss of$1,673.3 million in 2013. The $98.0 million favorable variance was primarily due to lower equity market returns, as ourguarantee hedges backing reserves are more sensitive to changes in equity markets than those reserves, as well as favorableimpacts of assumption changes, mentioned above, partially offset by an unfavorable variance due to declining interest rates in2014. The focus in managing our CBVA segment continues to be on protecting regulatory and rating agency capital, and ourhedging program is primarily designed to mitigate the impacts of market scenarios on capital resources, rather than mitigatingearnings volatility. DAC/VOBA and other intangibles unlocking improved by $39.1 million, from a loss of $4.7 million in 2013to a gain of $34.4 million in 2014, mainly due to favorable impacts of assumption changes mentioned above.
In addition, Net investment income increased primarily due to a higher earned rate, partially offset by lower Fee income as aresult of lower average separate account AUM, and lower gains on the sale of securities. Higher premiums associated with theannuitization of life contingent contracts are offset by a reserve increase in the corresponding Interest credited and other benefitsto contract owners/policyholders. The increase in annuitization of life contingent contracts is partially due to the guaranteedminimum income benefit (“GMIB”) enhanced annuitization offer completed during 2014, where contract owners elected toannuitize both GMIB life contingent contracts and non-life contingent contracts.
125

Alternative Investment Income
Investment income on certain alternative investments can be volatile due to changes in market conditions. The following tablepresents the amount of investment income (loss) on certain alternative investments that is included on segment Operatingearnings before income taxes and the average level of assets in each segment, prior to intercompany eliminations. Thesealternative investments are carried at fair value, which is estimated based on the net asset value (“NAV”) of these funds. Theinvestment income on alternative investments shown below for the periods stated excludes the net investment income fromLehman Recovery/LIHTC and net loss on the sale of certain alternative investments during the prior periods.
While investment income on these assets can be volatile, based on current plans, we expect to earn 8.0% to 9.0% on these assetsover the long-term.
The following table presents the investment income for the years ended December 31, 2015, 2014 and 2013, respectively, andthe average assets of alternative investments as of the dates indicated:
Year Ended December 31,
($ in millions) 2015 2014 2013
Retirement:Alternative investment income . . . . . . . . . . . . . . . . . . . . . . . . . . . . . . . $ 9.2 $ 28.8 $ 36.4Average alternative investments . . . . . . . . . . . . . . . . . . . . . . . . . . . . . . 406.7 310.6 262.0
Annuities:Alternative investment income . . . . . . . . . . . . . . . . . . . . . . . . . . . . . . . 5.0 25.0 25.6Average alternative investments . . . . . . . . . . . . . . . . . . . . . . . . . . . . . . 257.1 199.6 177.6
Investment Management:Alternative investment income . . . . . . . . . . . . . . . . . . . . . . . . . . . . . . . 1.1 19.7 23.8Average alternative investments . . . . . . . . . . . . . . . . . . . . . . . . . . . . . . 186.9 145.3 124.0
Individual Life:Alternative investment income . . . . . . . . . . . . . . . . . . . . . . . . . . . . . . . 5.3 19.8 20.2Average alternative investments . . . . . . . . . . . . . . . . . . . . . . . . . . . . . . 171.9 143.0 131.0
Employee Benefits:Alternative investment income . . . . . . . . . . . . . . . . . . . . . . . . . . . . . . . 0.8 3.2 3.9Average alternative investments . . . . . . . . . . . . . . . . . . . . . . . . . . . . . . 41.1 29.5 24.7
Total Ongoing Business:Alternative investment income . . . . . . . . . . . . . . . . . . . . . . . . . . . . . . . 21.4 96.5 109.9Average alternative investments . . . . . . . . . . . . . . . . . . . . . . . . . . . . . . 1,063.7 828.0 719.3
Corporate:(1)
Alternative investment income . . . . . . . . . . . . . . . . . . . . . . . . . . . . . . . 2.8 16.6 9.0Average alternative investments . . . . . . . . . . . . . . . . . . . . . . . . . . . . . . 27.5 106.7 97.8
Closed Block Other:(2)
Alternative investment income . . . . . . . . . . . . . . . . . . . . . . . . . . . . . . . 0.8 4.2 9.7Average alternative investments . . . . . . . . . . . . . . . . . . . . . . . . . . . . . . 26.4 33.2 58.1
Total Voya Financial, Inc.:Alternative investment income . . . . . . . . . . . . . . . . . . . . . . . . . . . . . . . $ 25.0 $117.3 $128.6
Average alternative investments . . . . . . . . . . . . . . . . . . . . . . . . . . . . . . $1,117.6 $967.9 $875.2
(1) Effective in the second quarter of 2015, approximately $110 million of alternative assets previously allocated to excesscapital in the Corporate segment was allocated to all segments in proportion to each segment’s target statutory capital.
(2) Our CBVA segment is managed to focus on protecting regulatory and rating agency capital rather than achieving operatingmetrics and, therefore, its results of operations are not reflected within investment income.
126

DAC/VOBA and Other Intangibles Unlocking
Changes in Operating earnings before income taxes and net income (loss) are influenced by increases and decreases inamortization of DAC, VOBA, deferred sales inducements (“DSI”), and unearned revenue (“URR”), collectively, “DAC/VOBAand other intangibles.” For Individual Life, changes in Operating earnings before income taxes and net income (loss) are alsoinfluenced by increases and decreases in amortization of net cost of reinsurance, as well as by changes in reserves associated withUL and VUL secondary guarantees and paid-up guarantees. Unlocking, described below, related to DAC, VOBA, DSI and URR,as well as amortization of net cost of reinsurance and reserve adjustments associated with UL and VUL secondary guarantees andpaid-up guarantees are referred to as “DAC/VOBA and other intangibles unlocking.” See the “Deferred Policy Acquisition Costs,Value of Business Acquired and Other Intangibles,” “Reinsurance,” and “Future Policy Benefits and Contract Owner AccountBalances” sections in the Business, Basis of Presentation and Significant Accounting Policies Note in our Consolidated FinancialStatements in Part II, Item 8. of this Annual Report on Form 10-K for more information.
We amortize DAC/VOBA and other intangibles related to universal life-type contracts and fixed and variable deferred annuity contracts inthe Ongoing Business over the estimated lives of the contracts in relation to the emergence of estimated gross profits. Net cost ofreinsurance is amortized in a similar manner. Assumptions as to mortality, persistency, interest crediting rates, returns associated withseparate account performance, impact of hedge performance, expenses to administer the business and certain economic variables, such asinflation, are based on our experience and our overall short-term and long-term future expectations for returns available in the capitalmarkets. At each valuation date, estimated gross profits are updated with actual gross profits and the assumptions underlying futureestimated gross profits are evaluated for continued reasonableness. Adjustments to estimated gross profits require that amortization rates berevised retroactively to the date of the contract issuance, which is referred to as unlocking. As a result of this process, the cumulativebalances of DAC/VOBA and other intangibles and net cost of reinsurance are adjusted with an offsetting benefit or charge to income toreflect changes in the period of the revision. An unlocking event that results in a benefit (“favorable unlocking”) generally occurs as a resultof actual experience or future expectations being favorable compared to previous estimates. Changes in DAC/VOBA and other intangiblesand net cost of reinsurance due to contract changes or contract terminations higher than estimated are also included in “unlocking.” Anunlocking event that results in a charge (“unfavorable unlocking”) generally occurs as a result of actual experience or future expectationsbeing unfavorable compared to previous estimates. As a result of unlocking, the amortization schedules for future periods are also adjusted.
Reserves for UL and VUL secondary guarantees and paid-up guarantees are calculated by estimating the expected value of deathbenefits payable and recognizing those benefits ratably over the accumulation period based on total expected assessments. The reservefor such products recognizes the portion of contract assessments received in early years used to compensate us for benefits provided inlater years. Assumptions used, such as the interest rate, lapse rate and mortality, are consistent with assumptions used in estimating grossprofits for purposes of amortizing DAC. At each valuation date, we evaluate these assumptions and, if actual experience or otherevidence suggests that earlier assumptions should be revised, we adjust the reserve balance, with a related charge or credit toPolicyholder benefits. These reserve adjustments are included in unlocking associated with our Ongoing Business.
During the third quarter of 2015, we completed our annual review of the assumptions, including projection model inputs, in eachof our segments (except for Investment Management and Corporate segments, for which assumption reviews are not relevant). Asa result of this review, we made a number of changes to our assumptions resulting in a net unfavorable impact of $82.0 million toOperating earnings before income taxes in the current period, compared to an unfavorable impact of $19.3 million in the thirdquarter of 2014 and a favorable impact of $84.8 million in the third quarter of 2013. These are included in the DAC/VOBA andother intangibles unlocking.
The following table presents the amount of DAC/VOBA and other intangibles unlocking that is included in segment Operatingearnings before income taxes for the periods indicated:
Year Ended December 31,
($ in millions) 2015 2014 2013
Retirement . . . . . . . . . . . . . . . . . . . . . . . . . . . . . . . . . . . . . . . . . . . . . . . . . . $(37.2) $(30.0) $ 45.6Annuities . . . . . . . . . . . . . . . . . . . . . . . . . . . . . . . . . . . . . . . . . . . . . . . . . . . 12.5 26.4 83.3Individual Life . . . . . . . . . . . . . . . . . . . . . . . . . . . . . . . . . . . . . . . . . . . . . . . (38.4) (10.2) 4.8Employee Benefits . . . . . . . . . . . . . . . . . . . . . . . . . . . . . . . . . . . . . . . . . . . . (4.4) (7.8) (0.5)
Total DAC/VOBA and other intangibles unlocking(1)(2) . . . . . . . . . . . . . . . . . $(67.5) $(21.6) $133.2
(1) Unlocking related to the Net gain from Lehman Recovery/LIHTC is excluded from DAC/VOBA and other intangiblesunlocking for the year ended December 31, 2013 (and included in Net gain from Lehman Recovery/LIHTC).
127
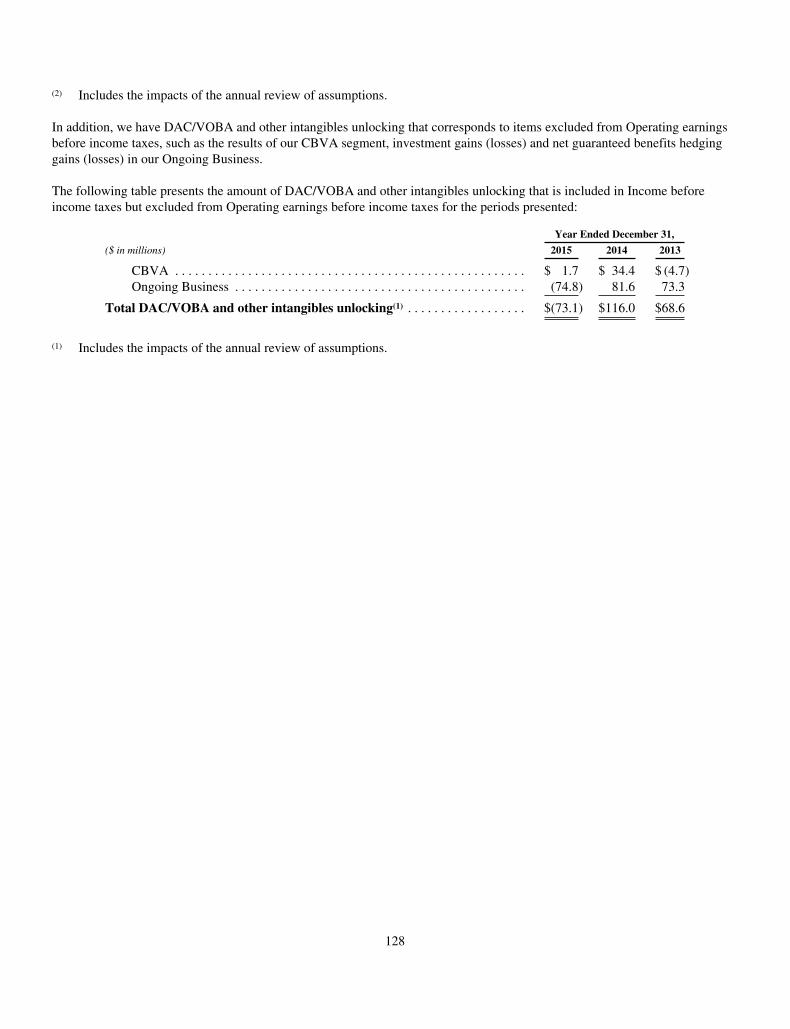
(2) Includes the impacts of the annual review of assumptions.
In addition, we have DAC/VOBA and other intangibles unlocking that corresponds to items excluded from Operating earningsbefore income taxes, such as the results of our CBVA segment, investment gains (losses) and net guaranteed benefits hedginggains (losses) in our Ongoing Business.
The following table presents the amount of DAC/VOBA and other intangibles unlocking that is included in Income beforeincome taxes but excluded from Operating earnings before income taxes for the periods presented:
Year Ended December 31,
($ in millions) 2015 2014 2013
CBVA . . . . . . . . . . . . . . . . . . . . . . . . . . . . . . . . . . . . . . . . . . . . . . . . . . . . . $ 1.7 $ 34.4 $ (4.7)Ongoing Business . . . . . . . . . . . . . . . . . . . . . . . . . . . . . . . . . . . . . . . . . . . . (74.8) 81.6 73.3
Total DAC/VOBA and other intangibles unlocking(1) . . . . . . . . . . . . . . . . . . $(73.1) $116.0 $68.6
(1) Includes the impacts of the annual review of assumptions.
128

Liquidity and Capital Resources
Liquidity is our ability to generate sufficient cash flows to meet the cash requirements of operating, investing and financingactivities. Capital refers to our long-term financial resources available to support the business operations and contribute to futuregrowth. Our ability to generate and maintain sufficient liquidity and capital depends on the profitability of the businesses,timing of cash flows on investments and products, general economic conditions and access to the capital markets and thealternate sources of liquidity and capital described herein.
Consolidated Sources and Uses of Liquidity and Capital
Our principal available sources of liquidity are product charges, investment income, proceeds from the maturity and sale ofinvestments, proceeds from debt issuance and borrowing facilities, repurchase agreements, contract deposits and securitieslending. Primary uses of these funds are payments of policyholder benefits commissions and operating expenses, interestcredits, share repurchases, investment purchases and contract maturities, withdrawals and surrenders.
Parent Company Sources and Uses of Liquidity
In evaluating liquidity, it is important to distinguish the cash flow needs of Voya Financial, Inc. from the cash flow needs of theCompany as a whole. Voya Financial, Inc. is largely dependent on cash flows from its operating subsidiaries to meet itsobligations. The principal sources of funds available to Voya Financial, Inc. include dividends and returns of capital from itsoperating subsidiaries, as well as cash and short-term investments. These sources of funds are currently supplemented by VoyaFinancial, Inc.’s access to the $750.0 million revolving credit sublimit of its Amended and Restated Revolving CreditAgreement and reciprocal borrowing facilities maintained with its subsidiaries as well as other alternate sources of liquiditydescribed below either directly or indirectly through its insurance subsidiaries.
129
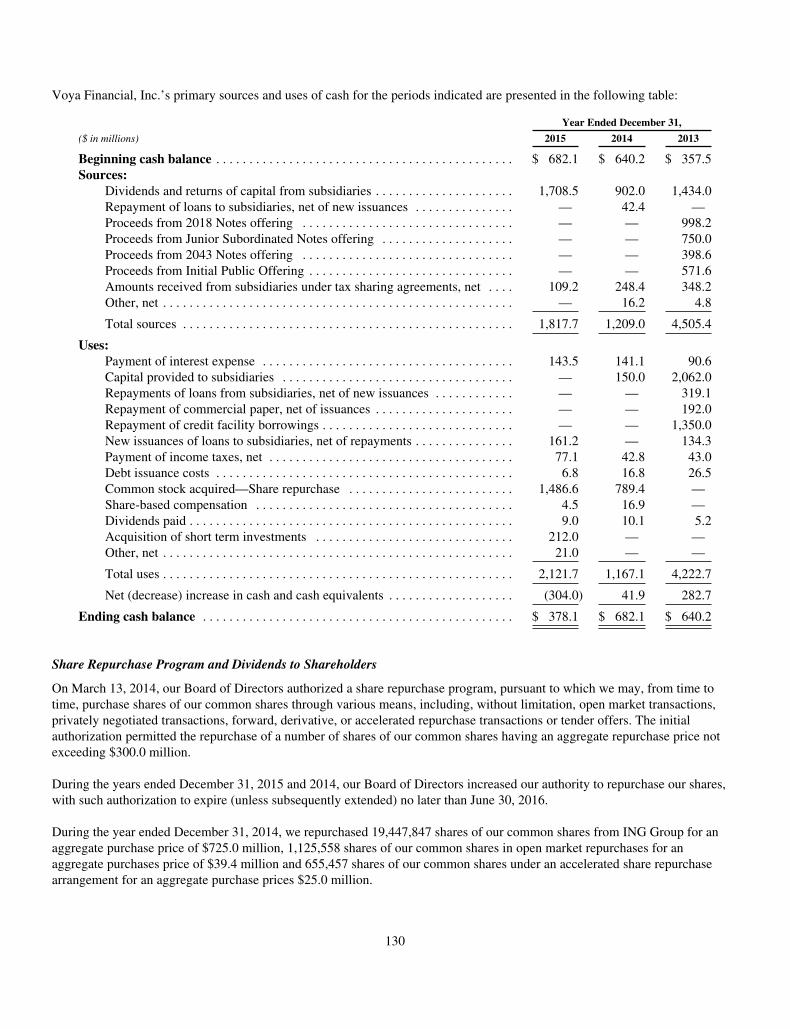
Voya Financial, Inc.’s primary sources and uses of cash for the periods indicated are presented in the following table:
Year Ended December 31,
($ in millions) 2015 2014 2013
Beginning cash balance . . . . . . . . . . . . . . . . . . . . . . . . . . . . . . . . . . . . . . . . . . . . . $ 682.1 $ 640.2 $ 357.5Sources:
Dividends and returns of capital from subsidiaries . . . . . . . . . . . . . . . . . . . . . 1,708.5 902.0 1,434.0Repayment of loans to subsidiaries, net of new issuances . . . . . . . . . . . . . . . — 42.4 —Proceeds from 2018 Notes offering . . . . . . . . . . . . . . . . . . . . . . . . . . . . . . . . — — 998.2Proceeds from Junior Subordinated Notes offering . . . . . . . . . . . . . . . . . . . . — — 750.0Proceeds from 2043 Notes offering . . . . . . . . . . . . . . . . . . . . . . . . . . . . . . . . — — 398.6Proceeds from Initial Public Offering . . . . . . . . . . . . . . . . . . . . . . . . . . . . . . . — — 571.6Amounts received from subsidiaries under tax sharing agreements, net . . . . 109.2 248.4 348.2Other, net . . . . . . . . . . . . . . . . . . . . . . . . . . . . . . . . . . . . . . . . . . . . . . . . . . . . . — 16.2 4.8
Total sources . . . . . . . . . . . . . . . . . . . . . . . . . . . . . . . . . . . . . . . . . . . . . . . . . . 1,817.7 1,209.0 4,505.4
Uses:Payment of interest expense . . . . . . . . . . . . . . . . . . . . . . . . . . . . . . . . . . . . . . 143.5 141.1 90.6Capital provided to subsidiaries . . . . . . . . . . . . . . . . . . . . . . . . . . . . . . . . . . . — 150.0 2,062.0Repayments of loans from subsidiaries, net of new issuances . . . . . . . . . . . . — — 319.1Repayment of commercial paper, net of issuances . . . . . . . . . . . . . . . . . . . . . — — 192.0Repayment of credit facility borrowings . . . . . . . . . . . . . . . . . . . . . . . . . . . . . — — 1,350.0New issuances of loans to subsidiaries, net of repayments . . . . . . . . . . . . . . . 161.2 — 134.3Payment of income taxes, net . . . . . . . . . . . . . . . . . . . . . . . . . . . . . . . . . . . . . 77.1 42.8 43.0Debt issuance costs . . . . . . . . . . . . . . . . . . . . . . . . . . . . . . . . . . . . . . . . . . . . . 6.8 16.8 26.5Common stock acquired—Share repurchase . . . . . . . . . . . . . . . . . . . . . . . . . 1,486.6 789.4 —Share-based compensation . . . . . . . . . . . . . . . . . . . . . . . . . . . . . . . . . . . . . . . 4.5 16.9 —Dividends paid . . . . . . . . . . . . . . . . . . . . . . . . . . . . . . . . . . . . . . . . . . . . . . . . . 9.0 10.1 5.2Acquisition of short term investments . . . . . . . . . . . . . . . . . . . . . . . . . . . . . . 212.0 — —Other, net . . . . . . . . . . . . . . . . . . . . . . . . . . . . . . . . . . . . . . . . . . . . . . . . . . . . . 21.0 — —
Total uses . . . . . . . . . . . . . . . . . . . . . . . . . . . . . . . . . . . . . . . . . . . . . . . . . . . . . 2,121.7 1,167.1 4,222.7
Net (decrease) increase in cash and cash equivalents . . . . . . . . . . . . . . . . . . . (304.0) 41.9 282.7
Ending cash balance . . . . . . . . . . . . . . . . . . . . . . . . . . . . . . . . . . . . . . . . . . . . . . . $ 378.1 $ 682.1 $ 640.2
Share Repurchase Program and Dividends to Shareholders
On March 13, 2014, our Board of Directors authorized a share repurchase program, pursuant to which we may, from time totime, purchase shares of our common shares through various means, including, without limitation, open market transactions,privately negotiated transactions, forward, derivative, or accelerated repurchase transactions or tender offers. The initialauthorization permitted the repurchase of a number of shares of our common shares having an aggregate repurchase price notexceeding $300.0 million.
During the years ended December 31, 2015 and 2014, our Board of Directors increased our authority to repurchase our shares,with such authorization to expire (unless subsequently extended) no later than June 30, 2016.
During the year ended December 31, 2014, we repurchased 19,447,847 shares of our common shares from ING Group for anaggregate purchase price of $725.0 million, 1,125,558 shares of our common shares in open market repurchases for anaggregate purchases price of $39.4 million and 655,457 shares of our common shares under an accelerated share repurchasearrangement for an aggregate purchase prices $25.0 million.
130
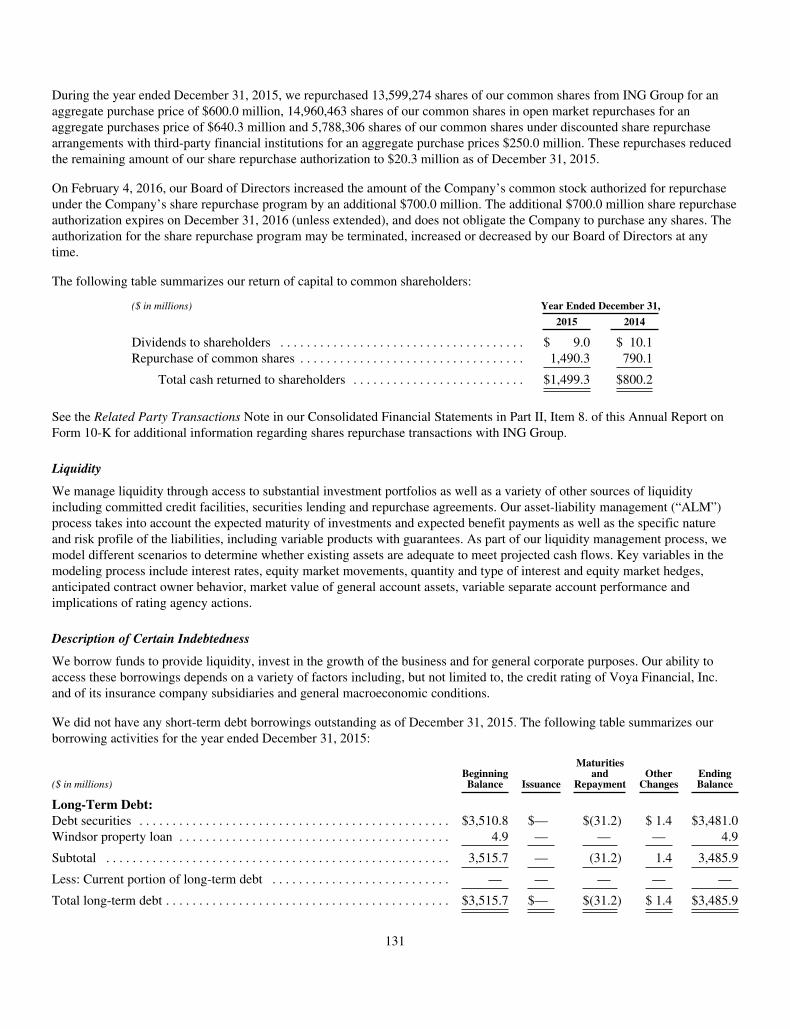
During the year ended December 31, 2015, we repurchased 13,599,274 shares of our common shares from ING Group for anaggregate purchase price of $600.0 million, 14,960,463 shares of our common shares in open market repurchases for anaggregate purchases price of $640.3 million and 5,788,306 shares of our common shares under discounted share repurchasearrangements with third-party financial institutions for an aggregate purchase prices $250.0 million. These repurchases reducedthe remaining amount of our share repurchase authorization to $20.3 million as of December 31, 2015.
On February 4, 2016, our Board of Directors increased the amount of the Company’s common stock authorized for repurchaseunder the Company’s share repurchase program by an additional $700.0 million. The additional $700.0 million share repurchaseauthorization expires on December 31, 2016 (unless extended), and does not obligate the Company to purchase any shares. Theauthorization for the share repurchase program may be terminated, increased or decreased by our Board of Directors at anytime.
The following table summarizes our return of capital to common shareholders:
($ in millions) Year Ended December 31,
2015 2014
Dividends to shareholders . . . . . . . . . . . . . . . . . . . . . . . . . . . . . . . . . . . . . $ 9.0 $ 10.1Repurchase of common shares . . . . . . . . . . . . . . . . . . . . . . . . . . . . . . . . . . 1,490.3 790.1
Total cash returned to shareholders . . . . . . . . . . . . . . . . . . . . . . . . . . $1,499.3 $800.2
See the Related Party Transactions Note in our Consolidated Financial Statements in Part II, Item 8. of this Annual Report onForm 10-K for additional information regarding shares repurchase transactions with ING Group.
Liquidity
We manage liquidity through access to substantial investment portfolios as well as a variety of other sources of liquidityincluding committed credit facilities, securities lending and repurchase agreements. Our asset-liability management (“ALM”)process takes into account the expected maturity of investments and expected benefit payments as well as the specific natureand risk profile of the liabilities, including variable products with guarantees. As part of our liquidity management process, wemodel different scenarios to determine whether existing assets are adequate to meet projected cash flows. Key variables in themodeling process include interest rates, equity market movements, quantity and type of interest and equity market hedges,anticipated contract owner behavior, market value of general account assets, variable separate account performance andimplications of rating agency actions.
Description of Certain Indebtedness
We borrow funds to provide liquidity, invest in the growth of the business and for general corporate purposes. Our ability toaccess these borrowings depends on a variety of factors including, but not limited to, the credit rating of Voya Financial, Inc.and of its insurance company subsidiaries and general macroeconomic conditions.
We did not have any short-term debt borrowings outstanding as of December 31, 2015. The following table summarizes ourborrowing activities for the year ended December 31, 2015:
($ in millions)BeginningBalance Issuance
Maturitiesand
RepaymentOther
ChangesEndingBalance
Long-Term Debt:Debt securities . . . . . . . . . . . . . . . . . . . . . . . . . . . . . . . . . . . . . . . . . . . . . . . $3,510.8 $— $(31.2) $ 1.4 $3,481.0Windsor property loan . . . . . . . . . . . . . . . . . . . . . . . . . . . . . . . . . . . . . . . . . 4.9 — — — 4.9
Subtotal . . . . . . . . . . . . . . . . . . . . . . . . . . . . . . . . . . . . . . . . . . . . . . . . . . . . 3,515.7 — (31.2) 1.4 3,485.9
Less: Current portion of long-term debt . . . . . . . . . . . . . . . . . . . . . . . . . . . — — — — —
Total long-term debt . . . . . . . . . . . . . . . . . . . . . . . . . . . . . . . . . . . . . . . . . . . $3,515.7 $— $(31.2) $ 1.4 $3,485.9
131
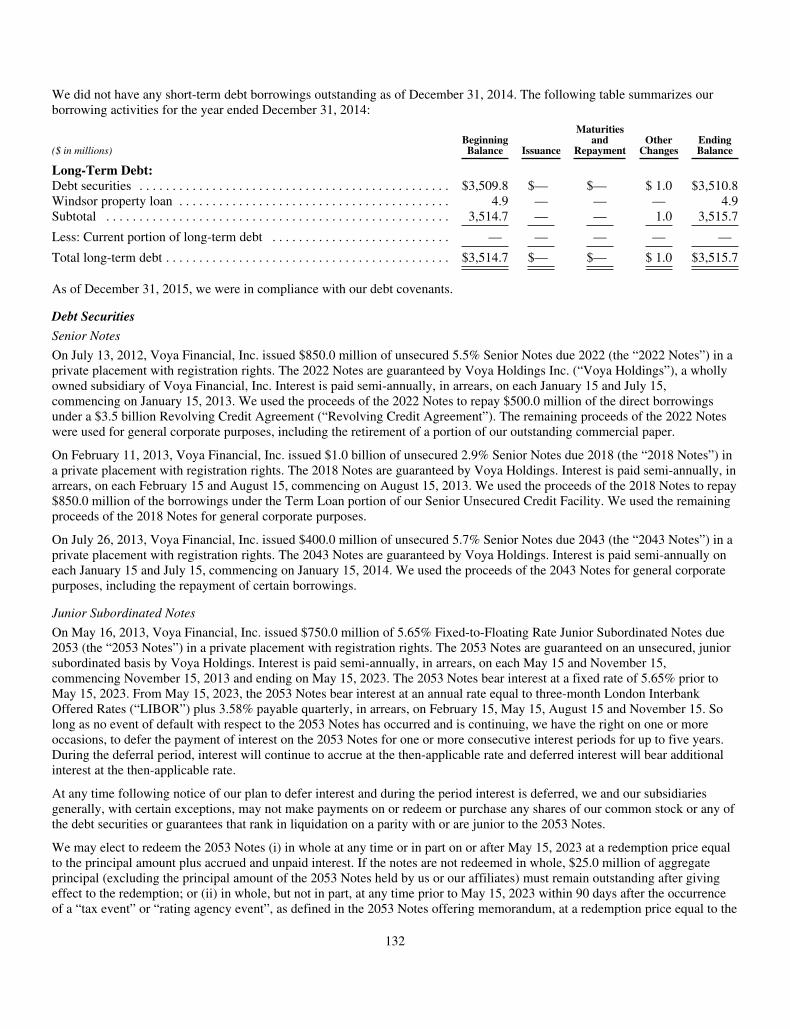
We did not have any short-term debt borrowings outstanding as of December 31, 2014. The following table summarizes ourborrowing activities for the year ended December 31, 2014:
($ in millions)BeginningBalance Issuance
Maturitiesand
RepaymentOther
ChangesEndingBalance
Long-Term Debt:Debt securities . . . . . . . . . . . . . . . . . . . . . . . . . . . . . . . . . . . . . . . . . . . . . . . $3,509.8 $— $— $ 1.0 $3,510.8Windsor property loan . . . . . . . . . . . . . . . . . . . . . . . . . . . . . . . . . . . . . . . . . 4.9 — — — 4.9Subtotal . . . . . . . . . . . . . . . . . . . . . . . . . . . . . . . . . . . . . . . . . . . . . . . . . . . . 3,514.7 — — 1.0 3,515.7
Less: Current portion of long-term debt . . . . . . . . . . . . . . . . . . . . . . . . . . . — — — — —
Total long-term debt . . . . . . . . . . . . . . . . . . . . . . . . . . . . . . . . . . . . . . . . . . . $3,514.7 $— $— $ 1.0 $3,515.7
As of December 31, 2015, we were in compliance with our debt covenants.
Debt Securities
Senior Notes
On July 13, 2012, Voya Financial, Inc. issued $850.0 million of unsecured 5.5% Senior Notes due 2022 (the “2022 Notes”) in aprivate placement with registration rights. The 2022 Notes are guaranteed by Voya Holdings Inc. (“Voya Holdings”), a whollyowned subsidiary of Voya Financial, Inc. Interest is paid semi-annually, in arrears, on each January 15 and July 15,commencing on January 15, 2013. We used the proceeds of the 2022 Notes to repay $500.0 million of the direct borrowingsunder a $3.5 billion Revolving Credit Agreement (“Revolving Credit Agreement”). The remaining proceeds of the 2022 Noteswere used for general corporate purposes, including the retirement of a portion of our outstanding commercial paper.
On February 11, 2013, Voya Financial, Inc. issued $1.0 billion of unsecured 2.9% Senior Notes due 2018 (the “2018 Notes”) ina private placement with registration rights. The 2018 Notes are guaranteed by Voya Holdings. Interest is paid semi-annually, inarrears, on each February 15 and August 15, commencing on August 15, 2013. We used the proceeds of the 2018 Notes to repay$850.0 million of the borrowings under the Term Loan portion of our Senior Unsecured Credit Facility. We used the remainingproceeds of the 2018 Notes for general corporate purposes.
On July 26, 2013, Voya Financial, Inc. issued $400.0 million of unsecured 5.7% Senior Notes due 2043 (the “2043 Notes”) in aprivate placement with registration rights. The 2043 Notes are guaranteed by Voya Holdings. Interest is paid semi-annually oneach January 15 and July 15, commencing on January 15, 2014. We used the proceeds of the 2043 Notes for general corporatepurposes, including the repayment of certain borrowings.
Junior Subordinated Notes
On May 16, 2013, Voya Financial, Inc. issued $750.0 million of 5.65% Fixed-to-Floating Rate Junior Subordinated Notes due2053 (the “2053 Notes”) in a private placement with registration rights. The 2053 Notes are guaranteed on an unsecured, juniorsubordinated basis by Voya Holdings. Interest is paid semi-annually, in arrears, on each May 15 and November 15,commencing November 15, 2013 and ending on May 15, 2023. The 2053 Notes bear interest at a fixed rate of 5.65% prior toMay 15, 2023. From May 15, 2023, the 2053 Notes bear interest at an annual rate equal to three-month London InterbankOffered Rates (“LIBOR”) plus 3.58% payable quarterly, in arrears, on February 15, May 15, August 15 and November 15. Solong as no event of default with respect to the 2053 Notes has occurred and is continuing, we have the right on one or moreoccasions, to defer the payment of interest on the 2053 Notes for one or more consecutive interest periods for up to five years.During the deferral period, interest will continue to accrue at the then-applicable rate and deferred interest will bear additionalinterest at the then-applicable rate.
At any time following notice of our plan to defer interest and during the period interest is deferred, we and our subsidiariesgenerally, with certain exceptions, may not make payments on or redeem or purchase any shares of our common stock or any ofthe debt securities or guarantees that rank in liquidation on a parity with or are junior to the 2053 Notes.
We may elect to redeem the 2053 Notes (i) in whole at any time or in part on or after May 15, 2023 at a redemption price equalto the principal amount plus accrued and unpaid interest. If the notes are not redeemed in whole, $25.0 million of aggregateprincipal (excluding the principal amount of the 2053 Notes held by us or our affiliates) must remain outstanding after givingeffect to the redemption; or (ii) in whole, but not in part, at any time prior to May 15, 2023 within 90 days after the occurrenceof a “tax event” or “rating agency event”, as defined in the 2053 Notes offering memorandum, at a redemption price equal to the
132

principal amount, or, if greater, a “make-whole redemption price,” as defined in the 2053 Notes offering memorandum, plus, ineach case accrued and unpaid interest.
On May 21, 2013, we used the proceeds of the 2053 Notes for the repayment of the remaining outstanding borrowings of $392.5million under the Term Loan portion of the Company’s Senior Unsecured Credit Facility. The remaining proceeds were used topartially repay borrowings with NN Group.
Registration Rights Agreement
Under the Registration Rights Agreements associated with the 2022 Notes, the 2018 Notes, the 2053 Notes and the 2043 Notes,Voya Financial, Inc. and Voya Holdings agreed to use reasonable best efforts to cause a registration statement to be filed with theSEC that, upon effectiveness, would permit holders of these notes to exchange them for new notes containing identical termsexcept for the restrictions on transfer contained in the original notes. The offer to exchange the 2022 Notes, the 2018 Notes andthe 2053 Notes was completed on August 14, 2013. The offer to exchange the 2043 Notes was completed on December 23, 2013.
Put Option Agreement for Senior Debt Issuance
On March 17, 2015, we entered into an off-balance sheet ten-year put option agreement with a Delaware trust that we formed, inconnection with the completion of the sale by the trust of $500.0 million aggregate amount of pre-capitalized trust securitiesredeemable February 15, 2025 (“P-Caps”) in a Rule 144A private placement. The trust invested the proceeds from the sale of the P-Caps in a portfolio of principal and interest strips of U.S. Treasury securities. The put option agreement provides Voya Financial,Inc. the right to sell to the trust at any time up to $500.0 million of its 3.976% Senior Notes due 2025 (“3.976% Senior Notes”) andreceive in exchange a corresponding amount of the principal and interest strips of U.S. Treasury securities held by the trust. The3.976% Senior Notes will not be issued unless and until the put option is exercised. In return, we agreed to pay a semi-annual putpremium to the trust at a rate of 1.875% per annum applied to the unexercised portion of the put option, and to reimburse the trustfor its expenses. The put premium is recorded in Operating expenses in the Consolidated Statements of Operations. The 3.976%Senior Notes will be fully, irrevocably and unconditionally guaranteed by Voya Holdings. Our obligations under the put optionagreement and the expense reimbursement agreement with the trust are also guaranteed by Voya Holdings.
The put option agreement with the trust provides Voya Financial, Inc. with a source of liquid assets, which could be used tomeet future financial obligations or to provide additional capital.
The put option described above will be exercised automatically in full if we fail to make certain payments to the trust, includingany failure to pay the put option premium or expense reimbursements when due, if such failure is not cured within 30 days, andupon certain bankruptcy event involving us or Voya Holdings. We are also required to exercise the put option in full: (i) if wereasonably believe that our consolidated shareholders’ equity, calculated in accordance with U.S. GAAP but excludingAccumulated other comprehensive income (loss) and Noncontrolling interest, has fallen below $3.0 billion, subject toadjustment in certain cases; (ii) upon the occurrence of an event of default under the 3.976% Senior Notes; and (iii) if certainevents occur relating to the trust’s status as an “investment company” under the Investment Company Act of 1940.
We have a one-time right to unwind a prior voluntary exercise of the put option by repurchasing all of the 3.976% Senior Notesthen held by the trust in exchange for a corresponding amount of U.S. Treasury securities. If the put option has been fullyexercised, the 3.976% Senior Notes issued may be redeemed by us prior to their maturity at par or, if greater, at a make-wholeredemption price, in each case plus accrued and unpaid interest to the date of redemption. The P-Caps are to be redeemed by thetrust on February 15, 2025 or upon any early redemption of the 3.976% Senior Notes.
Aetna Notes
As of December 31, 2015 and December 31, 2014, Voya Holdings had outstanding $162.9 million and $163.0 million principalamount of 7.25% Debentures due August 15, 2023, respectively, $204.0 million and $235.1 million principal amount of 7.63%Debentures due August 15, 2026, respectively, and $108.0 million principal amount of 6.97% Debentures due August 15, 2036(collectively, the “Aetna Notes”), which were issued by a predecessor of Voya Holdings and assumed in connection with ouracquisition of Aetna’s life insurance and related businesses. In addition, Equitable of Iowa Capital Trust II, a limited purposetrust, has outstanding $13.0 million principal amount of 8.42% Series B Capital Securities due April 1, 2027 (the “EquitableNotes”). ING Group guarantees the Aetna Notes. The Equitable Notes are guaranteed by Voya Financial, Inc.
133
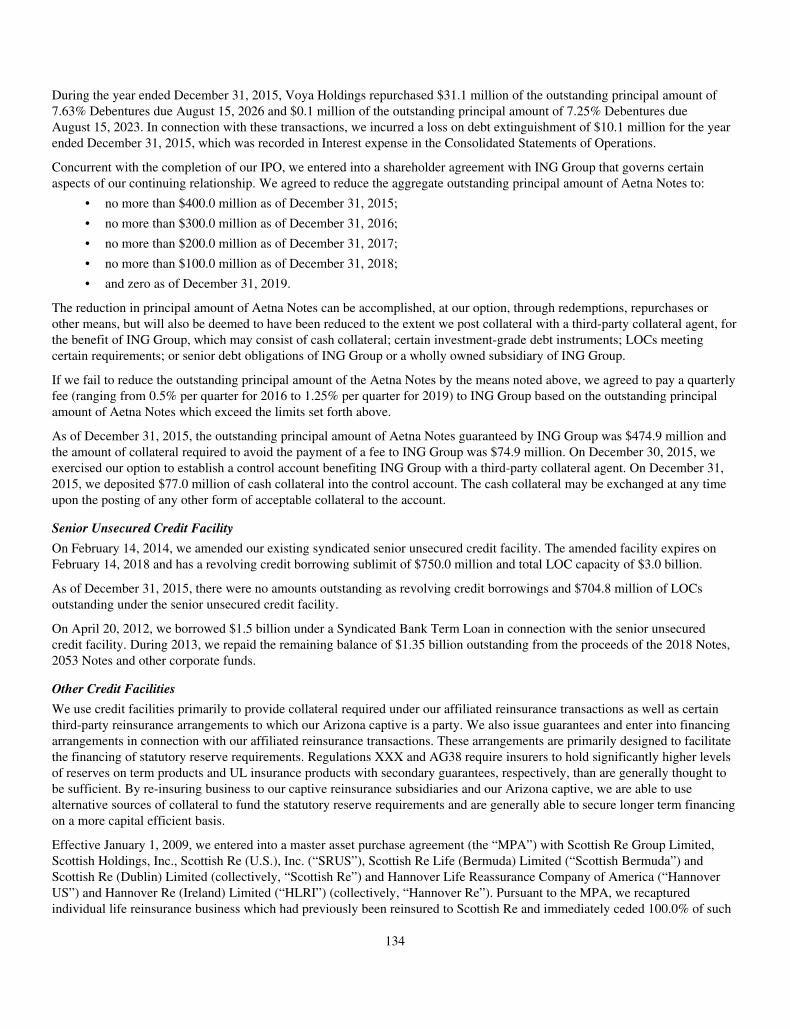
During the year ended December 31, 2015, Voya Holdings repurchased $31.1 million of the outstanding principal amount of7.63% Debentures due August 15, 2026 and $0.1 million of the outstanding principal amount of 7.25% Debentures dueAugust 15, 2023. In connection with these transactions, we incurred a loss on debt extinguishment of $10.1 million for the yearended December 31, 2015, which was recorded in Interest expense in the Consolidated Statements of Operations.
Concurrent with the completion of our IPO, we entered into a shareholder agreement with ING Group that governs certainaspects of our continuing relationship. We agreed to reduce the aggregate outstanding principal amount of Aetna Notes to:
• no more than $400.0 million as of December 31, 2015;
• no more than $300.0 million as of December 31, 2016;
• no more than $200.0 million as of December 31, 2017;
• no more than $100.0 million as of December 31, 2018;
• and zero as of December 31, 2019.
The reduction in principal amount of Aetna Notes can be accomplished, at our option, through redemptions, repurchases orother means, but will also be deemed to have been reduced to the extent we post collateral with a third-party collateral agent, forthe benefit of ING Group, which may consist of cash collateral; certain investment-grade debt instruments; LOCs meetingcertain requirements; or senior debt obligations of ING Group or a wholly owned subsidiary of ING Group.
If we fail to reduce the outstanding principal amount of the Aetna Notes by the means noted above, we agreed to pay a quarterlyfee (ranging from 0.5% per quarter for 2016 to 1.25% per quarter for 2019) to ING Group based on the outstanding principalamount of Aetna Notes which exceed the limits set forth above.
As of December 31, 2015, the outstanding principal amount of Aetna Notes guaranteed by ING Group was $474.9 million andthe amount of collateral required to avoid the payment of a fee to ING Group was $74.9 million. On December 30, 2015, weexercised our option to establish a control account benefiting ING Group with a third-party collateral agent. On December 31,2015, we deposited $77.0 million of cash collateral into the control account. The cash collateral may be exchanged at any timeupon the posting of any other form of acceptable collateral to the account.
Senior Unsecured Credit Facility
On February 14, 2014, we amended our existing syndicated senior unsecured credit facility. The amended facility expires onFebruary 14, 2018 and has a revolving credit borrowing sublimit of $750.0 million and total LOC capacity of $3.0 billion.
As of December 31, 2015, there were no amounts outstanding as revolving credit borrowings and $704.8 million of LOCsoutstanding under the senior unsecured credit facility.
On April 20, 2012, we borrowed $1.5 billion under a Syndicated Bank Term Loan in connection with the senior unsecuredcredit facility. During 2013, we repaid the remaining balance of $1.35 billion outstanding from the proceeds of the 2018 Notes,2053 Notes and other corporate funds.
Other Credit Facilities
We use credit facilities primarily to provide collateral required under our affiliated reinsurance transactions as well as certainthird-party reinsurance arrangements to which our Arizona captive is a party. We also issue guarantees and enter into financingarrangements in connection with our affiliated reinsurance transactions. These arrangements are primarily designed to facilitatethe financing of statutory reserve requirements. Regulations XXX and AG38 require insurers to hold significantly higher levelsof reserves on term products and UL insurance products with secondary guarantees, respectively, than are generally thought tobe sufficient. By re-insuring business to our captive reinsurance subsidiaries and our Arizona captive, we are able to usealternative sources of collateral to fund the statutory reserve requirements and are generally able to secure longer term financingon a more capital efficient basis.
Effective January 1, 2009, we entered into a master asset purchase agreement (the “MPA”) with Scottish Re Group Limited,Scottish Holdings, Inc., Scottish Re (U.S.), Inc. (“SRUS”), Scottish Re Life (Bermuda) Limited (“Scottish Bermuda”) andScottish Re (Dublin) Limited (collectively, “Scottish Re”) and Hannover Life Reassurance Company of America (“HannoverUS”) and Hannover Re (Ireland) Limited (“HLRI”) (collectively, “Hannover Re”). Pursuant to the MPA, we recapturedindividual life reinsurance business which had previously been reinsured to Scottish Re and immediately ceded 100.0% of such
134

business to Hannover Re on a modified coinsurance, funds withheld and coinsurance basis, which resulted in no gain or loss.We refer to this block as the Hannover Re block and its results are reported as part of the Closed Block Other segment.
Prior to September 24, 2015, we were obligated to maintain collateral for the statutory reserve requirements associated withStatutory Regulations XXX and AG38 on the business transferred from us to Hannover Re for the duration of such reserverequirements or until the underlying reinsurance contracts are novated to Hannover Re or Hannover Re elects its option toimplement its own facility providing collateral for reinsurance between SLD and Security Life of Denver International Limited(“SLDI”). Hannover Re exercised this election and consequently, on September 24, 2015, we entered into a Hannover Re BuyerFacility Agreement (“Buyer Facility Agreement”) with Hannover Life Reassurance Company of America, Hannover Re(Ireland) Limited, Hannover Ruck SE and SLDI. Under the Buyer Facility Agreement, the existing collateral, provided by SLDIthrough LOCs and a collateral note supporting the reserves on the Hannover Re block, was replaced by a $2.9 billion seniorunsecured floating rate note issued by Hannover Ruck SE and deposited into a reserve credit trust established by SLDI for thebenefit of SLD.
Voya Financial, Inc. and SLDI have reduced their use of LOCs and other collateral for reserve financing requirements by $2.3billion as of the date of the transaction. Consequently, our financing expenses associated with collateral for reinsurance betweenSLD and SLDI covering individual reinsurance business have been eliminated and, therefore, we anticipate future savings.
We also utilize LOCs to provide credit for reinsurance on portions of the CBVA segment liabilities reinsured to our Arizonacaptive in order to meet statutory reserve requirements at those times when the assets and other capital backing the reinsuranceliabilities may be less than the statutory reserve requirement. As of December 31, 2015, while there was no actual LOCrequirement, the amount of the LOCs outstanding was $500.0 million.
In addition to the $2.1 billion of Individual Life, Hannover Re block and CBVA credit facilities utilized, $230.0 million ofLOCs were outstanding to support miscellaneous requirements. In total, $2.3 billion of credit facilities were utilized as ofDecember 31, 2015. As of December 31, 2015, the capacity of our unsecured and uncommitted credit facilities totaled $1.7million and the capacity of our unsecured and committed credit facilities totaled $5.4 billion. We also have approximately$205.0 million in secured facilities.
135
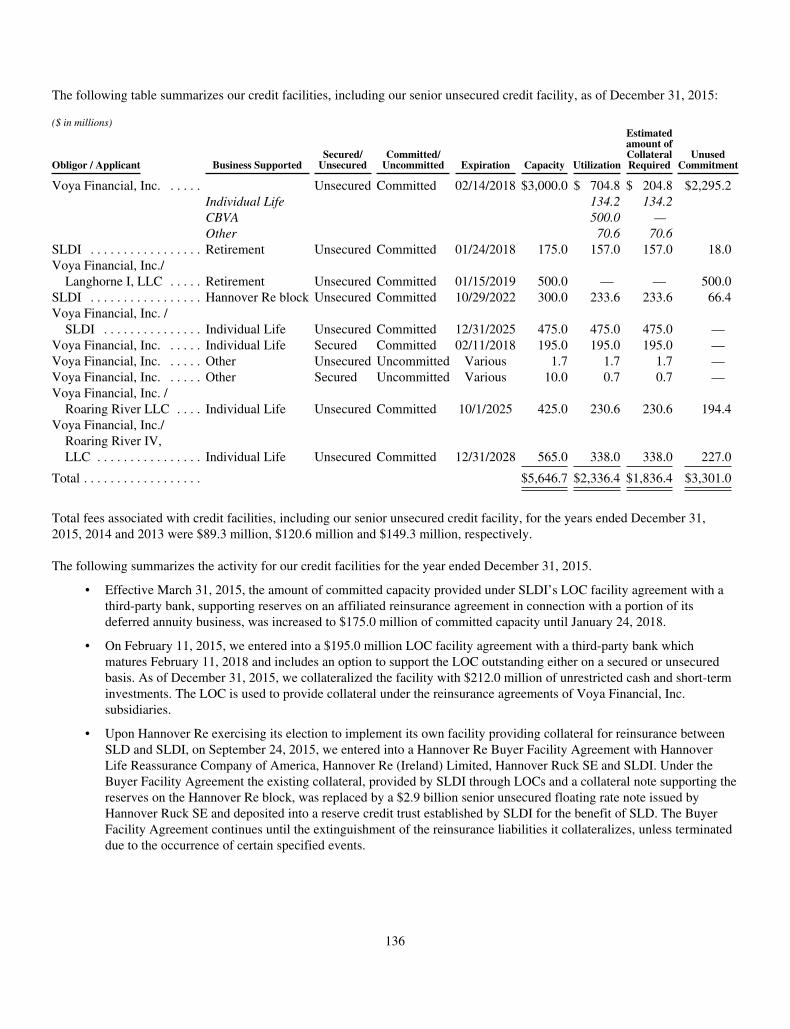
The following table summarizes our credit facilities, including our senior unsecured credit facility, as of December 31, 2015:
($ in millions)
Obligor / Applicant Business SupportedSecured/
UnsecuredCommitted/
Uncommitted Expiration Capacity Utilization
Estimatedamount ofCollateralRequired
UnusedCommitment
Voya Financial, Inc. . . . . . Unsecured Committed 02/14/2018 $3,000.0 $ 704.8 $ 204.8 $2,295.2Individual Life 134.2 134.2CBVA 500.0 —Other 70.6 70.6
SLDI . . . . . . . . . . . . . . . . . Retirement Unsecured Committed 01/24/2018 175.0 157.0 157.0 18.0Voya Financial, Inc./
Langhorne I, LLC . . . . . Retirement Unsecured Committed 01/15/2019 500.0 — — 500.0SLDI . . . . . . . . . . . . . . . . . Hannover Re block Unsecured Committed 10/29/2022 300.0 233.6 233.6 66.4Voya Financial, Inc. /
SLDI . . . . . . . . . . . . . . . Individual Life Unsecured Committed 12/31/2025 475.0 475.0 475.0 —Voya Financial, Inc. . . . . . Individual Life Secured Committed 02/11/2018 195.0 195.0 195.0 —Voya Financial, Inc. . . . . . Other Unsecured Uncommitted Various 1.7 1.7 1.7 —Voya Financial, Inc. . . . . . Other Secured Uncommitted Various 10.0 0.7 0.7 —Voya Financial, Inc. /
Roaring River LLC . . . . Individual Life Unsecured Committed 10/1/2025 425.0 230.6 230.6 194.4Voya Financial, Inc./
Roaring River IV,LLC . . . . . . . . . . . . . . . . Individual Life Unsecured Committed 12/31/2028 565.0 338.0 338.0 227.0
Total . . . . . . . . . . . . . . . . . . $5,646.7 $2,336.4 $1,836.4 $3,301.0
Total fees associated with credit facilities, including our senior unsecured credit facility, for the years ended December 31,2015, 2014 and 2013 were $89.3 million, $120.6 million and $149.3 million, respectively.
The following summarizes the activity for our credit facilities for the year ended December 31, 2015.
• Effective March 31, 2015, the amount of committed capacity provided under SLDI’s LOC facility agreement with athird-party bank, supporting reserves on an affiliated reinsurance agreement in connection with a portion of itsdeferred annuity business, was increased to $175.0 million of committed capacity until January 24, 2018.
• On February 11, 2015, we entered into a $195.0 million LOC facility agreement with a third-party bank whichmatures February 11, 2018 and includes an option to support the LOC outstanding either on a secured or unsecuredbasis. As of December 31, 2015, we collateralized the facility with $212.0 million of unrestricted cash and short-terminvestments. The LOC is used to provide collateral under the reinsurance agreements of Voya Financial, Inc.subsidiaries.
• Upon Hannover Re exercising its election to implement its own facility providing collateral for reinsurance betweenSLD and SLDI, on September 24, 2015, we entered into a Hannover Re Buyer Facility Agreement with HannoverLife Reassurance Company of America, Hannover Re (Ireland) Limited, Hannover Ruck SE and SLDI. Under theBuyer Facility Agreement the existing collateral, provided by SLDI through LOCs and a collateral note supporting thereserves on the Hannover Re block, was replaced by a $2.9 billion senior unsecured floating rate note issued byHannover Ruck SE and deposited into a reserve credit trust established by SLDI for the benefit of SLD. The BuyerFacility Agreement continues until the extinguishment of the reinsurance liabilities it collateralizes, unless terminateddue to the occurrence of certain specified events.
136
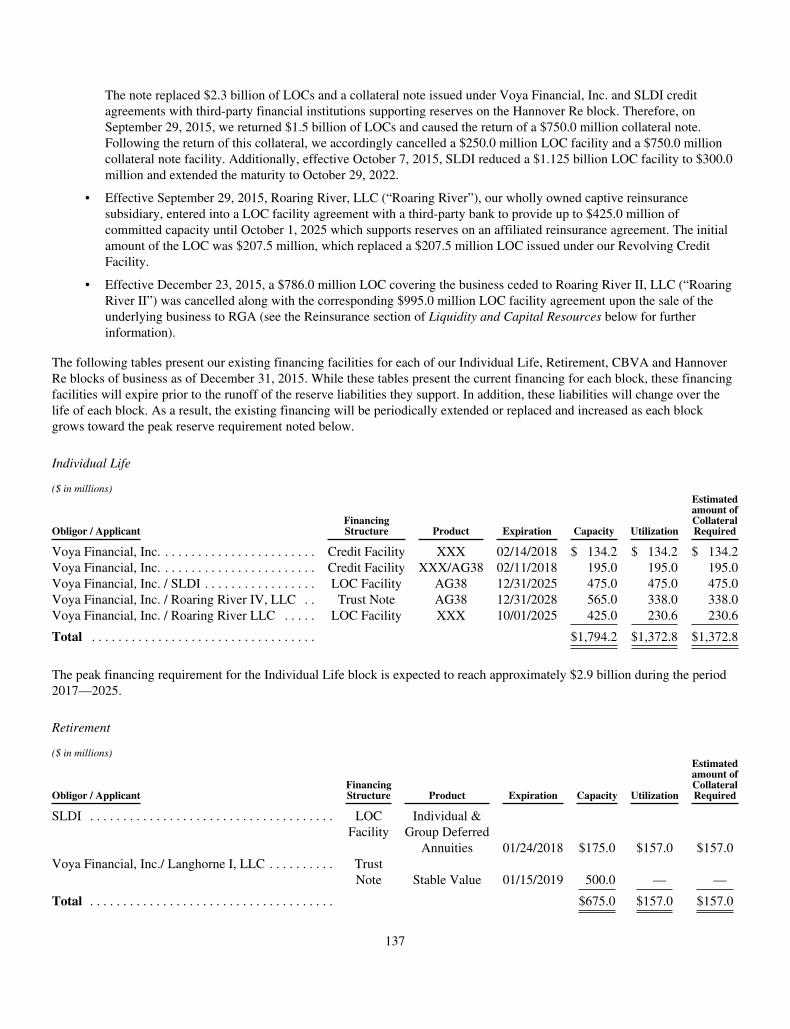
The note replaced $2.3 billion of LOCs and a collateral note issued under Voya Financial, Inc. and SLDI creditagreements with third-party financial institutions supporting reserves on the Hannover Re block. Therefore, onSeptember 29, 2015, we returned $1.5 billion of LOCs and caused the return of a $750.0 million collateral note.Following the return of this collateral, we accordingly cancelled a $250.0 million LOC facility and a $750.0 millioncollateral note facility. Additionally, effective October 7, 2015, SLDI reduced a $1.125 billion LOC facility to $300.0million and extended the maturity to October 29, 2022.
• Effective September 29, 2015, Roaring River, LLC (“Roaring River”), our wholly owned captive reinsurancesubsidiary, entered into a LOC facility agreement with a third-party bank to provide up to $425.0 million ofcommitted capacity until October 1, 2025 which supports reserves on an affiliated reinsurance agreement. The initialamount of the LOC was $207.5 million, which replaced a $207.5 million LOC issued under our Revolving CreditFacility.
• Effective December 23, 2015, a $786.0 million LOC covering the business ceded to Roaring River II, LLC (“RoaringRiver II”) was cancelled along with the corresponding $995.0 million LOC facility agreement upon the sale of theunderlying business to RGA (see the Reinsurance section of Liquidity and Capital Resources below for furtherinformation).
The following tables present our existing financing facilities for each of our Individual Life, Retirement, CBVA and HannoverRe blocks of business as of December 31, 2015. While these tables present the current financing for each block, these financingfacilities will expire prior to the runoff of the reserve liabilities they support. In addition, these liabilities will change over thelife of each block. As a result, the existing financing will be periodically extended or replaced and increased as each blockgrows toward the peak reserve requirement noted below.
Individual Life
($ in millions)
Obligor / ApplicantFinancingStructure Product Expiration Capacity Utilization
Estimatedamount ofCollateralRequired
Voya Financial, Inc. . . . . . . . . . . . . . . . . . . . . . . . Credit Facility XXX 02/14/2018 $ 134.2 $ 134.2 $ 134.2Voya Financial, Inc. . . . . . . . . . . . . . . . . . . . . . . . Credit Facility XXX/AG38 02/11/2018 195.0 195.0 195.0Voya Financial, Inc. / SLDI . . . . . . . . . . . . . . . . . LOC Facility AG38 12/31/2025 475.0 475.0 475.0Voya Financial, Inc. / Roaring River IV, LLC . . Trust Note AG38 12/31/2028 565.0 338.0 338.0Voya Financial, Inc. / Roaring River LLC . . . . . LOC Facility XXX 10/01/2025 425.0 230.6 230.6
Total . . . . . . . . . . . . . . . . . . . . . . . . . . . . . . . . . . $1,794.2 $1,372.8 $1,372.8
The peak financing requirement for the Individual Life block is expected to reach approximately $2.9 billion during the period2017—2025.
Retirement
($ in millions)
Obligor / ApplicantFinancingStructure Product Expiration Capacity Utilization
Estimatedamount ofCollateralRequired
SLDI . . . . . . . . . . . . . . . . . . . . . . . . . . . . . . . . . . . . . LOCFacility
Individual &Group Deferred
Annuities 01/24/2018 $175.0 $157.0 $157.0Voya Financial, Inc./ Langhorne I, LLC . . . . . . . . . . Trust
Note Stable Value 01/15/2019 500.0 — —
Total . . . . . . . . . . . . . . . . . . . . . . . . . . . . . . . . . . . . . $675.0 $157.0 $157.0
137
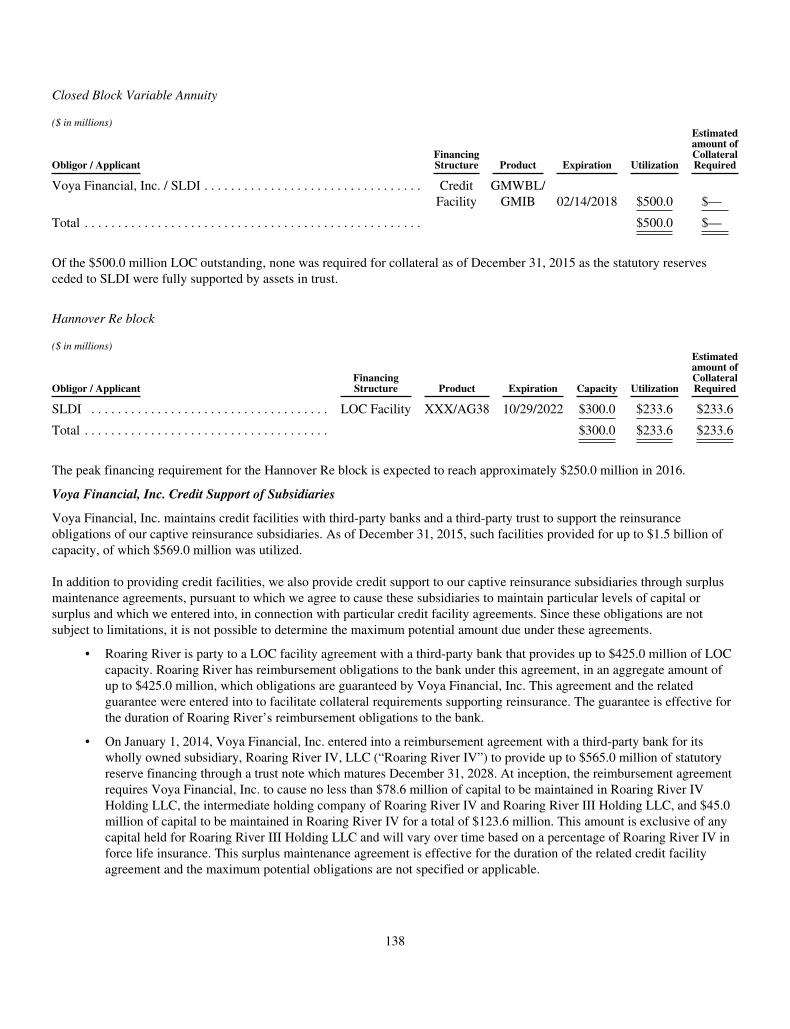
Closed Block Variable Annuity
($ in millions)
Obligor / ApplicantFinancingStructure Product Expiration Utilization
Estimatedamount ofCollateralRequired
Voya Financial, Inc. / SLDI . . . . . . . . . . . . . . . . . . . . . . . . . . . . . . . . . CreditFacility
GMWBL/GMIB 02/14/2018 $500.0 $—
Total . . . . . . . . . . . . . . . . . . . . . . . . . . . . . . . . . . . . . . . . . . . . . . . . . . . $500.0 $—
Of the $500.0 million LOC outstanding, none was required for collateral as of December 31, 2015 as the statutory reservesceded to SLDI were fully supported by assets in trust.
Hannover Re block
($ in millions)
Obligor / ApplicantFinancingStructure Product Expiration Capacity Utilization
Estimatedamount ofCollateralRequired
SLDI . . . . . . . . . . . . . . . . . . . . . . . . . . . . . . . . . . . . LOC Facility XXX/AG38 10/29/2022 $300.0 $233.6 $233.6
Total . . . . . . . . . . . . . . . . . . . . . . . . . . . . . . . . . . . . . $300.0 $233.6 $233.6
The peak financing requirement for the Hannover Re block is expected to reach approximately $250.0 million in 2016.
Voya Financial, Inc. Credit Support of Subsidiaries
Voya Financial, Inc. maintains credit facilities with third-party banks and a third-party trust to support the reinsuranceobligations of our captive reinsurance subsidiaries. As of December 31, 2015, such facilities provided for up to $1.5 billion ofcapacity, of which $569.0 million was utilized.
In addition to providing credit facilities, we also provide credit support to our captive reinsurance subsidiaries through surplusmaintenance agreements, pursuant to which we agree to cause these subsidiaries to maintain particular levels of capital orsurplus and which we entered into, in connection with particular credit facility agreements. Since these obligations are notsubject to limitations, it is not possible to determine the maximum potential amount due under these agreements.
• Roaring River is party to a LOC facility agreement with a third-party bank that provides up to $425.0 million of LOCcapacity. Roaring River has reimbursement obligations to the bank under this agreement, in an aggregate amount ofup to $425.0 million, which obligations are guaranteed by Voya Financial, Inc. This agreement and the relatedguarantee were entered into to facilitate collateral requirements supporting reinsurance. The guarantee is effective forthe duration of Roaring River’s reimbursement obligations to the bank.
• On January 1, 2014, Voya Financial, Inc. entered into a reimbursement agreement with a third-party bank for itswholly owned subsidiary, Roaring River IV, LLC (“Roaring River IV”) to provide up to $565.0 million of statutoryreserve financing through a trust note which matures December 31, 2028. At inception, the reimbursement agreementrequires Voya Financial, Inc. to cause no less than $78.6 million of capital to be maintained in Roaring River IVHolding LLC, the intermediate holding company of Roaring River IV and Roaring River III Holding LLC, and $45.0million of capital to be maintained in Roaring River IV for a total of $123.6 million. This amount is exclusive of anycapital held for Roaring River III Holding LLC and will vary over time based on a percentage of Roaring River IV inforce life insurance. This surplus maintenance agreement is effective for the duration of the related credit facilityagreement and the maximum potential obligations are not specified or applicable.
138
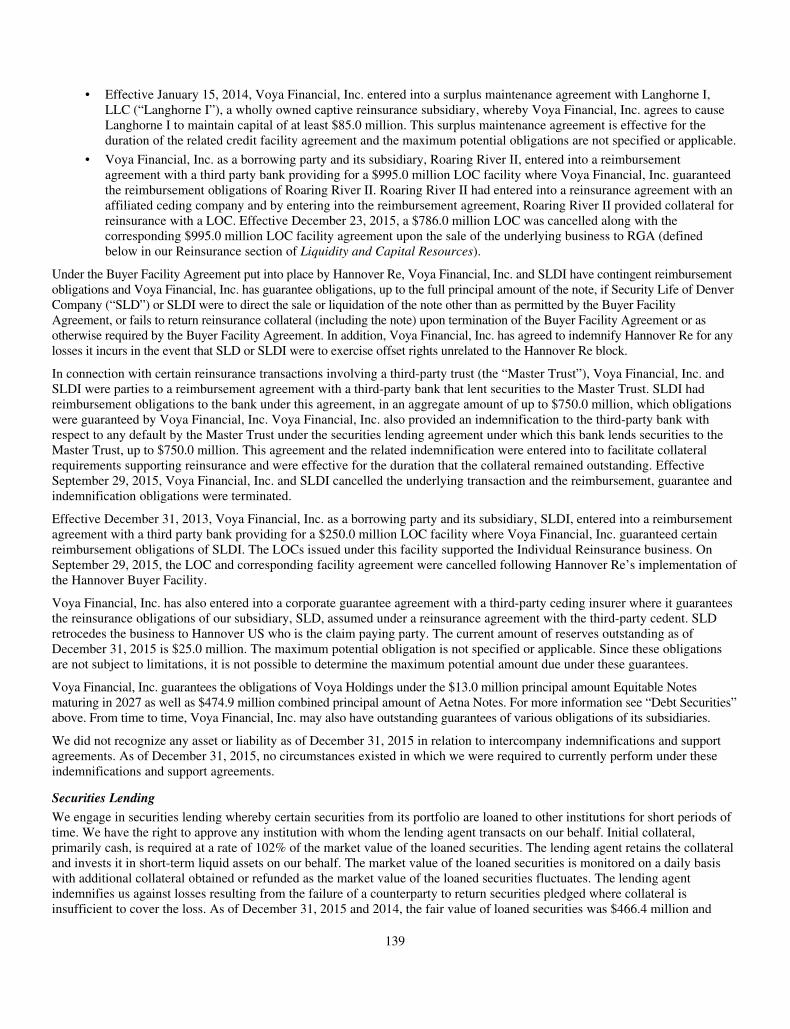
• Effective January 15, 2014, Voya Financial, Inc. entered into a surplus maintenance agreement with Langhorne I,LLC (“Langhorne I”), a wholly owned captive reinsurance subsidiary, whereby Voya Financial, Inc. agrees to causeLanghorne I to maintain capital of at least $85.0 million. This surplus maintenance agreement is effective for theduration of the related credit facility agreement and the maximum potential obligations are not specified or applicable.
• Voya Financial, Inc. as a borrowing party and its subsidiary, Roaring River II, entered into a reimbursementagreement with a third party bank providing for a $995.0 million LOC facility where Voya Financial, Inc. guaranteedthe reimbursement obligations of Roaring River II. Roaring River II had entered into a reinsurance agreement with anaffiliated ceding company and by entering into the reimbursement agreement, Roaring River II provided collateral forreinsurance with a LOC. Effective December 23, 2015, a $786.0 million LOC was cancelled along with thecorresponding $995.0 million LOC facility agreement upon the sale of the underlying business to RGA (definedbelow in our Reinsurance section of Liquidity and Capital Resources).
Under the Buyer Facility Agreement put into place by Hannover Re, Voya Financial, Inc. and SLDI have contingent reimbursementobligations and Voya Financial, Inc. has guarantee obligations, up to the full principal amount of the note, if Security Life of DenverCompany (“SLD”) or SLDI were to direct the sale or liquidation of the note other than as permitted by the Buyer FacilityAgreement, or fails to return reinsurance collateral (including the note) upon termination of the Buyer Facility Agreement or asotherwise required by the Buyer Facility Agreement. In addition, Voya Financial, Inc. has agreed to indemnify Hannover Re for anylosses it incurs in the event that SLD or SLDI were to exercise offset rights unrelated to the Hannover Re block.
In connection with certain reinsurance transactions involving a third-party trust (the “Master Trust”), Voya Financial, Inc. andSLDI were parties to a reimbursement agreement with a third-party bank that lent securities to the Master Trust. SLDI hadreimbursement obligations to the bank under this agreement, in an aggregate amount of up to $750.0 million, which obligationswere guaranteed by Voya Financial, Inc. Voya Financial, Inc. also provided an indemnification to the third-party bank withrespect to any default by the Master Trust under the securities lending agreement under which this bank lends securities to theMaster Trust, up to $750.0 million. This agreement and the related indemnification were entered into to facilitate collateralrequirements supporting reinsurance and were effective for the duration that the collateral remained outstanding. EffectiveSeptember 29, 2015, Voya Financial, Inc. and SLDI cancelled the underlying transaction and the reimbursement, guarantee andindemnification obligations were terminated.
Effective December 31, 2013, Voya Financial, Inc. as a borrowing party and its subsidiary, SLDI, entered into a reimbursementagreement with a third party bank providing for a $250.0 million LOC facility where Voya Financial, Inc. guaranteed certainreimbursement obligations of SLDI. The LOCs issued under this facility supported the Individual Reinsurance business. OnSeptember 29, 2015, the LOC and corresponding facility agreement were cancelled following Hannover Re’s implementation ofthe Hannover Buyer Facility.
Voya Financial, Inc. has also entered into a corporate guarantee agreement with a third-party ceding insurer where it guaranteesthe reinsurance obligations of our subsidiary, SLD, assumed under a reinsurance agreement with the third-party cedent. SLDretrocedes the business to Hannover US who is the claim paying party. The current amount of reserves outstanding as ofDecember 31, 2015 is $25.0 million. The maximum potential obligation is not specified or applicable. Since these obligationsare not subject to limitations, it is not possible to determine the maximum potential amount due under these guarantees.
Voya Financial, Inc. guarantees the obligations of Voya Holdings under the $13.0 million principal amount Equitable Notesmaturing in 2027 as well as $474.9 million combined principal amount of Aetna Notes. For more information see “Debt Securities”above. From time to time, Voya Financial, Inc. may also have outstanding guarantees of various obligations of its subsidiaries.
We did not recognize any asset or liability as of December 31, 2015 in relation to intercompany indemnifications and supportagreements. As of December 31, 2015, no circumstances existed in which we were required to currently perform under theseindemnifications and support agreements.
Securities Lending
We engage in securities lending whereby certain securities from its portfolio are loaned to other institutions for short periods oftime. We have the right to approve any institution with whom the lending agent transacts on our behalf. Initial collateral,primarily cash, is required at a rate of 102% of the market value of the loaned securities. The lending agent retains the collateraland invests it in short-term liquid assets on our behalf. The market value of the loaned securities is monitored on a daily basiswith additional collateral obtained or refunded as the market value of the loaned securities fluctuates. The lending agentindemnifies us against losses resulting from the failure of a counterparty to return securities pledged where collateral isinsufficient to cover the loss. As of December 31, 2015 and 2014, the fair value of loaned securities was $466.4 million and
139

$545.9 million, respectively, and is included in Securities pledged on the Consolidated Balance Sheets. As of December 31,2015 and 2014, collateral retained by the lending agent and invested in liquid assets on our behalf was $484.4 million and$563.9 million, respectively, and is recorded in Short-term investments under securities loan agreements, including collateraldelivered on the Consolidated Balance Sheets. As of December 31, 2015 and 2014, liabilities to return collateral of $484.4million and $563.9 million, respectively, are included in Payables under securities loan agreements, including collateral held onthe Consolidated Balance Sheets.
Repurchase Agreements
We engage in dollar repurchase agreements with mortgage-backed securities (“dollar rolls”) and repurchase agreements withother collateral types to increase our return on investments and improve liquidity. Such arrangements meet the requirements tobe accounted for as financing arrangements. We enter into dollar roll transactions by selling existing mortgage-backed securities(“MBS”) and concurrently entering into an agreement to repurchase similar securities within a short time frame at a lower price.Under repurchase agreements, we borrow cash from a counterparty at an agreed upon interest rate for an agreed upon timeframe and pledge collateral in the form of securities. At the end of the agreement, the counterparty returns the collateral to us,and we, in turn, repay the loan amount along with the additional agreed upon interest. We require that, at all times during theterm of the dollar roll and repurchase agreements, cash or other collateral types obtained is sufficient to allow us to fundsubstantially all of the cost of purchasing replacement assets. Cash received is invested in short-term investments, with theoffsetting obligation to repay the loan included within Other liabilities on the Consolidated Balance Sheets. As per the terms ofthe agreements, the market value of the loaned securities is monitored with additional collateral obtained or refunded as themarket value of the loaned securities fluctuates due to changes in interest rates, spreads and other risk factors.
The carrying value of the securities pledged in dollar rolls and repurchase agreement transactions and the related repurchaseobligation are included in Securities pledged and Short-term debt, respectively, on the Consolidated Balance Sheets. As ofDecember 31, 2015 and 2014, we did not have any securities pledged in dollar rolls or repurchase agreement transactions.
We also enter into reverse repurchase agreements. These transactions involve a purchase of securities and an agreement to sellsubstantially the same securities as those purchased. We require that, at all times during the term of the reverse repurchaseagreements, cash or other collateral types provided is sufficient to allow the counterparty to fund substantially all of the cost ofpurchasing the replacement assets. As of December 31, 2015 and 2014, we did not have any securities pledged under reverserepurchase agreements.
The primary risk associated with short-term collateralized borrowings is that the counterparty will be unable to perform underthe terms of the contract. Our exposure is limited to the excess of the net replacement cost of the securities over the value of theshort-term investments. We believe the counterparties to the dollar rolls, repurchase and reverse repurchase agreements arefinancially responsible and that the counterparty risk is minimal.
FHLB
We are currently a member of the FHLB of Des Moines and the FHLB of Topeka and are required to maintain a collateraldeposit to back any funding agreements issued by the FHLB. We have the ability to obtain funding from the FHLBs based on apercentage of the value of our assets and are subject to the availability of eligible collateral. The limits across all programs are20% of the total assets of the general and separate accounts of VIAC and RLI and potentially up to 40% of the total assets of thegeneral account of SLD based on credit approval from FHLB of Topeka. Furthermore, collateral is pledged based on theoutstanding balances of FHLB funding agreements. The amount varies based on the type, rating and maturity of the collateralposted to the FHLB. Generally, mortgage securities, commercial real estate and U.S. treasury securities are pledged to theFHLBs. Market value fluctuations resulting from changes in interest rates, spreads and other risk factors for each type of assetsare monitored and additional collateral is either pledged or released as needed.
Our maximum borrowing capacity under these credit facilities was $21.8 billion and $22.8 billion as of December 31, 2015 and2014, respectively, and does not have an expiration date as long as we maintain a satisfactory level of creditworthiness based onthe FHLBs’ credit assessment. As of December 31, 2015 and 2014, we had $1.3 billion and $1.4 billion in non-putable fundingagreements, respectively, which are included in Contract owner account balances on the Consolidated Balance Sheets. As ofDecember 31, 2015 and 2014, we had assets with a market value of approximately $1.5 billion and $1.6 billion, respectively,which collateralized the FHLB funding agreements.
140
Borrowings from Subsidiaries
We maintain revolving reciprocal loan agreements with a number of our life and non-life insurance subsidiaries that are used tofund short-term cash requirements that arise in the ordinary course of business. Under these agreements, either party mayborrow up to the maximum allowable under the agreement for a term not more than 270 days. For life insurance subsidiaries,the amounts that either party may borrow from the other under the agreement vary and are equal to 2%-5% of the insurancesubsidiary’s statutory net admitted assets (excluding separate accounts) as of the previous year end depending on the state ofdomicile. As of December 31, 2015, the aggregate amount that may be borrowed or lent under agreements with life insurancesubsidiaries was $2.5 billion. Each agreement with a life insurance subsidiary has received the necessary approvals from theappropriate state insurance regulatory authorities. For non-life insurance subsidiaries, the maximum allowable under theagreement is based on the assets of the subsidiaries and their particular cash requirements. As of December 31, 2015, noamounts were borrowed from subsidiaries. As of that same date, we lent $330.2 million to subsidiaries.
Collateral—Derivative Contracts
Under the terms of our over-the-counter (“OTC”) Derivative ISDA agreements, we may receive from, or deliver to,counterparties, collateral to assure that the terms of the International Swaps and Derivatives Association, Inc. (“ISDA”)agreements will be met with regard to the Credit Support Annex (“CSA”). The terms of the CSA call for us to pay interest onany cash received equal to the Federal Funds rate. To the extent cash collateral is received and delivered, it is included inPayables under securities loan agreements, including collateral held and Short-term investments under securities loanagreements, including collateral delivered, respectively, on the Consolidated Balance Sheets and is reinvested in short-terminvestments. Collateral held is used in accordance with the CSA to satisfy any obligations. Investment grade bonds owned by usare the source of noncash collateral posted, which is reported in Securities pledged on the Consolidated Balance Sheets. As ofDecember 31, 2015, we held $640.9 million and $195.9 million of net cash collateral related to OTC derivative contracts andcleared derivative contracts, respectively. As of December 31, 2014, we held $515.8 million and $119.1 million of net cashcollateral related to OTC derivative contracts and cleared derivative contracts, respectively. In addition, as of December 31,2015, we delivered $646.2 million of securities and held $24.8 million of securities as collateral. As of December 31, 2014, wedelivered $638.7 million of securities and held $159.3 million of securities as collateral.
Ratings
Our access to funding and our related cost of borrowing, requirements for derivatives collateral posting and the attractiveness ofcertain of our products to customers are affected by our credit ratings and insurance financial strength ratings, which areperiodically reviewed by the rating agencies. Financial strength ratings and credit ratings are important factors affecting publicconfidence in an insurer and its competitive position in marketing products. The credit ratings are also important for the abilityto raise capital through the issuance of debt and for the cost of such financing.
A downgrade in our credit ratings or the credit or financial strength ratings of our rated subsidiaries could potentially, amongother things, limit our ability to market products, reduce our competitiveness, increase the number or value of policy surrendersand withdrawals, increase our borrowing costs and potentially make it more difficult to borrow funds, adversely affect theavailability of financial guarantees or LOCs, cause additional collateral requirements or other required payments under certainagreements, allow counterparties to terminate derivative agreements and/or impair our relationships with creditors, distributorsor trading counterparties thereby potentially negatively affecting our profitability, liquidity and/or capital. In addition, weconsider nonperformance risk in determining the fair value of our liabilities. Therefore, changes in our credit or financialstrength ratings may affect the fair value of our liabilities.
Additionally, ratings of certain of our securities guaranteed by ING Group could be influenced by ING Group’s ratings. Adowngrade of the credit ratings of ING Group could result in downgrades of these securities.
Financial strength ratings represent the opinions of rating agencies regarding the financial ability of an insurance company tomeet its obligations under an insurance policy. Credit ratings represent the opinions of rating agencies regarding an entity’sability to repay its indebtedness. These ratings are not a recommendation to buy or hold any of our securities and they may berevised or revoked at any time at the sole discretion of the rating organization.
The financial strength and credit ratings of Voya Financial, Inc. and its principal subsidiaries as of the date of this AnnualReport on Form 10-K are summarized in the following table. In parentheses, following the initial occurrence in the table of eachrating, is an indication of that rating’s relative rank within the agency’s rating categories. That ranking refers only to the genericor major rating category and not to the modifiers appended to the rating by the rating agencies to denote relative position within
141
such generic or major category. For each rating, the relative position of the rating within the relevant rating agency’s ratingsscale is presented, with “1” representing the highest rating in the scale.
CompanyA.M. Best
(“A.M. Best”)Fitch, Inc.(“Fitch”)
Moody’s InvestorsService, Inc.(“Moody’s”)
Standard &Poor’s (“S&P”)
Voya Financial, Inc. (Long-term Issuer Credit) . . . . . . . . bbb (4 of 10) BBB+ (4 of 11) Baa2 (4 of 9) BBB (4 of 11)Voya Financial, Inc. (Senior Unsecured Debt)(1) . . . . . . . . bbb (4 of 10) BBB (4 of 9) Baa2 (4 of 9) BBB (4 of 9)Voya Financial, Inc. (Junior Subordinated Debt)(2) . . . . . . bb+ (5 of 10) BB+ (5 of 9) Ba3(hyb) (4 of 9) BB+ (5 of 9)Voya Retirement Insurance and Annuity Company . . . . .
Financial Strength Rating . . . . . . . . . . . . . . . . . . . . . A (3 of 16) A (3 of 9) A2 (3 of 9) A (3 of 9)Voya Insurance and Annuity Company . . . . . . . . . . . . . . .
Financial Strength Rating . . . . . . . . . . . . . . . . . . . . . A (3 of 16) A (3 of 9) A2 (3 of 9) A (3 of 9)Short-term Issuer Credit Rating . . . . . . . . . . . . . . . . . NR* NR WD** WD
ReliaStar Life Insurance Company . . . . . . . . . . . . . . . . . .Financial Strength Rating . . . . . . . . . . . . . . . . . . . . . A (3 of 16) A (3 of 9) A2 (3 of 9) A (3 of 9)Short-term Issuer Credit Rating . . . . . . . . . . . . . . . . . NR NR NR A-1 (1 of 8)
Security Life of Denver Insurance Company . . . . . . . . . .Financial Strength Rating . . . . . . . . . . . . . . . . . . . . . A (3 of 16) A (3 of 9) A2 (3 of 9) A (3 of 9)Short-term Issuer Credit Rating . . . . . . . . . . . . . . . . . NR NR WD A-1 (1 of 8)
Midwestern United Life Insurance Company . . . . . . . . . .Financial Strength Rating . . . . . . . . . . . . . . . . . . . . . A- (4 of 16) NR NR A (3 of 9)
Voya Holdings Inc. . . . . . . . . . . . . . . . . . . . . . . . . . . . . . .Long-term Issuer Credit Rating . . . . . . . . . . . . . . . . . NR NR Baa2 (4 of 9) BBB (4 of 11)
Backed Senior Unsecured Debt Credit Rating(3) . . . . . . . . NR NR Baa1 (4 of 9) A- (3 of 9)
* “NR” indicates not rated.** “WD” indicates withdrawn.(1) $850.0 million of our 2022 Notes, $1.0 billion of our 2018 Notes and $400.0 million of our 2043 Notes.(2) $750.0 million of our 2053 Notes.(3) $474.9 million of our Aetna Notes guaranteed by ING Group.
Rating AgencyFinancial Strength
Rating ScaleLong-term Credit
Rating ScaleSenior Unsecured Debt
Credit Rating ScaleShort-term Credit
Rating Scale
A.M. Best(1) . . . . . . . . . . . . . . . . . . . . . . . “A++” to “S” “aaa” to “rs” “aaa” to “d” “AMB-1+” to “d”Fitch(2) . . . . . . . . . . . . . . . . . . . . . . . . . . . “AAA” to “C” “AAA” to “D” “AAA” to “C” “F1” to “D”Moody’s(3) . . . . . . . . . . . . . . . . . . . . . . . . “Aaa” to “C” “Aaa” to “C” “Aaa” to “C” “Prime-1” to “Not Prime”S&P(4) . . . . . . . . . . . . . . . . . . . . . . . . . . . . “AAA” to “R” “AAA” to “D” “AAA” to “D” “A-1” to “D”(1) A.M. Best’s financial strength rating is an independent opinion of an insurer’s financial strength and ability to meet its
ongoing insurance policy and contract obligations. It is based on a comprehensive quantitative and qualitative evaluation ofa company’s balance sheet strength, operating performance and business profile. A.M. Best’s long-term credit ratingsreflect its assessment of the ability of an obligor to pay interest and principal in accordance with the terms of theobligation. Ratings from “aa” to “ccc” may be enhanced with a “+” (plus) or “-” (minus) to indicate whether credit qualityis near the top or bottom of a category. A.M. Best’s short-term credit rating is an opinion to the ability of the rated entity tomeet its senior financial commitments on obligations maturing in generally less than one year.
(2) Fitch’s financial strength ratings provide an assessment of the financial strength of an insurance organization. The NationalInsurer Financial Strength (“IFS”) Rating is assigned to the insurance company’s policyholder obligations, including assumedreinsurance obligations and contract holder obligations, such as guaranteed investment contracts. Within long-term and short-term ratings, a “+” or a “–” may be appended to a rating to denote relative status within major rating categories.
(3) Moody’s financial strength ratings are opinions of the ability of insurance companies to repay punctually senior policyholderclaims and obligations. Moody’s obligations append numerical modifiers 1, 2, and 3 to each generic rating classification fromAa through Caa. The modifier 1 indicates that the obligation ranks in the higher end of its generic rating category; the modifier2 indicates a mid-range ranking; and the modifier 3 indicates a ranking in the lower end of that generic rating category.Moody’s long-term credit ratings are opinions of the relative credit risk of fixed-income obligations with an original maturityof one year or more. They address the possibility that a financial obligation will not be honored as promised. Moody’s short-term ratings are opinions of the ability of issuers to honor short-term financial obligations.
(4) S&P’s insurer financial strength rating is a forward-looking opinion about the financial security characteristics of aninsurance organization with respect to its ability to pay under its insurance policies and contracts in accordance with theirterms. A “+” or “-” indicates relative strength within a category. An S&P credit rating is an assessment of default risk, butmay incorporate an assessment of relative seniority or ultimate recovery in the event of default. Short-term issuer creditratings reflect the obligor’s creditworthiness over a short-term time horizon.
142
Our ratings by A.M. Best, Fitch, Moody’s and S&P reflect a broader view of how the financial services industry is beingchallenged by the current economic environment, but also are based on the rating agencies’ specific views of our financial strength.In making their ratings decisions, the agencies consider past and expected future capital and earnings, asset quality and risk,profitability and risk of existing liabilities and current products, market share and product distribution capabilities.
Rating agencies use an “outlook” statement for both industry sectors and individual companies. For an industry sector, a stableoutlook generally implies that over the next 12 to 18 months the rating agency expects ratings to remain unchanged amongcompanies in the sector. For a particular company, an outlook generally indicates a medium- or long-term trend in creditfundamentals, which if continued, may lead to a rating change.
Ratings actions affirmation and outlook changes by A.M. Best, Fitch, Moody’s and S&P from December 31, 2014 throughDecember 31, 2015 and subsequently through the date of this Annual Report on Form 10-K are as follows:
• On September 15, 2015, Fitch affirmed Voya Financial, Inc.’s issuer credit rating and debt ratings. The financial strengthratings of the key operating subsidiaries were also affirmed. The rating outlook for all ratings is Stable.
• On August 18, 2015, A.M. Best affirmed the ratings of Voya Financial, Inc. and its operating subsidiaries. A.M. Bestmaintained its stable outlook on the financial strength rating of the key life subsidiaries. A.M. Best also maintained its positiveoutlook on the issuer credit rating of Voya Financial, Inc. as well as the ratings on the outstanding debt of Voya Financial, Inc.
• On August 18, 2015, Moody’s downgraded to Baa1 from A3 for the Aetna Notes which are guaranteed by ING GroepN.V. (“ING Group” or “ING”). The rating action follows the recent downgrade of the senior unsecured debt of INGGroup to Baa1 (stable outlook) from A3 (negative) on May 28, 2015. The ratings of the Aetna Notes remained on reviewfor further downgrade. On October 6, 2015, Moody’s confirmed the Baa1 senior debt rating of the Aetna Notes with astable outlook which concluded its review for downgrade initiated on August 18, 2015. No other ratings of either VoyaHoldings Inc. or Voya Financial, Inc. are affected by these rating actions.
• On March 16, 2015, Fitch raised the issuer credit ratings on Voya Financial, Inc. to BBB+ from BBB. Fitch also raisedthe senior unsecured credit ratings of Voya Financial, Inc. to BBB from BBB- and its junior subordinated debt creditratings to BB+ from BB. Fitch raised the financial strength ratings of the operating subsidiaries to A from A-. All ratingswere assigned a Stable outlook.
• On March 3, 2015, Moody’s raised the issuer credit ratings on Voya Financial, Inc. and Voya Holdings Inc. to Baa2 fromBaa3. Moody’s also raised the senior unsecured credit ratings of Voya Financial, Inc. to Baa2 from Baa3 and its juniorsubordinated debt credit ratings to Baa3(hyb) from Ba1(hyb). Moody’s raised the financial strength ratings of theoperating subsidiaries, to A2 from A3. All ratings were assigned a Stable outlook.
• On February 17, 2015, S&P raised the issuer credit ratings on Voya Financial, Inc. and Voya Holdings Inc. to BBB fromBBB-. S&P also raised the senior unsecured credit ratings of Voya Financial, Inc. to BBB from BBB- and its juniorsubordinated debt credit ratings to BB+ from BB. S&P also raised the financial strength ratings of the operatingsubsidiaries to A from A-. All ratings were assigned a Stable outlook.
Potential Impact of a Ratings Downgrade
Our ability to borrow funds and the terms under which we borrow are sensitive to our short- and long-term issuer credit ratings. Adowngrade of either or both of these credit ratings could increase our cost of borrowing. Additionally, a downgrade of either orboth of these credit ratings could decrease the total amount of new debt that we are able to issue in the future or increase the costsassociated with an issuance.
With respect to our credit facility agreements, based on the amount of credit outstanding as of December 31, 2015, no increase incollateral requirements would result due to a ratings downgrade of the credit ratings of Voya Financial, Inc. by S&P or Moody’s.
Certain of our derivative and reinsurance agreements contain provisions that are linked to the financial strength ratings of certain ofour insurance subsidiaries. If financial strength ratings were downgraded in the future, these provisions might be triggered andcounterparties to the agreements could demand collateralization which could negatively impact overall liquidity.
Based on the amount of credit outstanding as of December 31, 2015, a one-notch or two-notch downgrade in Voya Financial, Inc.’scredit ratings by S&P or Moody’s would not have resulted in an additional increase in our collateral requirements. The nature ofthe collateral that we may be required to post is principally in the form of cash and U.S. Treasury securities. Alternative forms ofcollateral, such as LOC, may also be used.
143

Certain of our reinsurance agreements contain provisions that are linked to the financial strength ratings of the individual legalentity that entered into the reinsurance agreement. If the insurance subsidiaries’ financial strength ratings were downgraded inthe future, the terms in our reinsurance agreements might be triggered and counterparties to the credit facility agreements coulddemand collateralization which could negatively impact overall liquidity. Based on the amount of credit outstanding as ofDecember 31, 2015, a two-notch downgrade of our insurance subsidiaries would have resulted in an estimated increase in ourcollateral requirements by approximately $25 million. The nature of the collateral that we may be required to post is principallyin the form of cash, highly rated securities or LOC.
Certain of our derivative agreements contain provisions that are linked to the financial strength ratings of the individual legalentity that entered into the derivative agreement. If insurance subsidiaries’ financial strength ratings were downgraded in thefuture, the terms in our derivative agreements might be triggered and counterparties to the derivative agreements could demandimmediate further collateralization which could negatively impact overall liquidity. Based on the market value of ourderivatives as of December 31, 2015, a one-notch downgrade of our insurance subsidiaries would have resulted in an estimatedincrease in our derivative collateral requirements by approximately $15 million. The nature of the collateral that we may berequired to post is principally in the form of cash and U.S. Treasury securities.
Based on the market value of our derivatives as of December 31, 2015, a two-notch downgrade of our insurance subsidiarieswould have resulted in an estimated increase in the derivative collateral requirements required by a one-notch downgrade by anadditional $30.0 million .
The amount of collateral that would be required to be posted is also dependent on the fair value of our derivative positions. Foradditional information on our derivative positions, see the Derivative Financial Instruments Note in our Consolidated FinancialStatements in Part II, Item 8. of this Annual Report on Form 10-K.
Reinsurance
We have reinsurance treaties covering a portion of the mortality risks and guaranteed death and living benefits under our lifeinsurance and annuity contracts. We remain liable to the extent our reinsurers do not meet their obligations under thereinsurance agreements.
We reinsure our business through a diversified group of well capitalized, highly rated reinsurers. We monitor trends in arbitrationand any litigation outcomes with our reinsurers. Collectability of reinsurance balances are evaluated by monitoring ratings andevaluating the financial strength of its reinsurers. Large reinsurance recoverable balances with offshore or other non-accreditedreinsurers are secured through various forms of collateral, including secured trusts, funds withheld accounts and irrevocable LOCs.
We utilize indemnity reinsurance agreements to reduce our exposure to losses from unhedged GMDBs in our annuity insurancebusiness. Reinsurance permits recovery of a portion of losses from reinsurers, although it does not discharge our primaryliability as direct insurer of the risks. We evaluate the financial strength of potential reinsurers and continually monitor thefinancial strength and credit ratings of our reinsurers.
The S&P financial strength rating of our reinsurers with the two largest reinsurance recoverable balances are AA- rated orbetter. These reinsurers are (i) Lincoln National Life Insurance Company and Lincoln Life & Annuity Company of New York,subsidiaries of Lincoln National Corporation (“Lincoln”) and (ii) Hannover Re. Only those reinsurance recoverable balanceswhere recovery is deemed probable are recognized as assets on our consolidated balance sheets.
We have a significant concentration of reinsurance arising from the divestment of a block of individual life business via areinsurance transaction prior to our acquisition of VRIAC in 2000. In 1998, we entered into an indemnity reinsurance agreementwith a subsidiary of Lincoln, which established a trust to secure its obligations to us under the reinsurance transaction. Of thereinsurance recoverable on the Consolidated Balance Sheets, $1.8 billion and $1.9 billion as of December 31, 2015 and 2014,respectively, is related to the reinsurance recoverable from the subsidiary of Lincoln under this reinsurance agreement.
On December 31, 2004, we reinsured the individual life reinsurance business (and sold certain systems and operating assetsused in the individual life reinsurance business) to Scottish Re on a 100% coinsurance basis (the “2004 Transaction”) throughour wholly owned subsidiaries, SLD and SLDI. As part of the 2004 Transaction, we paid a ceding commission and transferredassets backing reserves and miscellaneous other liabilities on the individual life reinsurance to Scottish Re. The cedingcommission (net of taxes), along with other reserve assets, was placed in trust for our benefit to secure Scottish Re’s obligationsas reinsurers of the acquired business.
144
On November 19, 2008, an existing reinsurance agreement between SRUS and Ballantyne Re, concerning a portion of thebusiness that was originally ceded to Scottish Re as part of the 2004 Transaction, was novated with the result that we weresubstituted for SRUS as the ceding company to Ballantyne Re and made the sole beneficiary of trust assets connected with theBallantyne Re facility. The trust assets support the reserve requirements of the business transferred from SLD to Ballantyne Re.As of December 31, 2015, trust assets with a market value of $965.7 million supported reserves of $266.1 million.
Effective January 1, 2009, we entered into the MPA with Scottish Re and Hannover Re such that Hannover Re acquired theindividual life reinsurance business from Scottish Re. Of the Reinsurance recoverable on the Consolidated Balance Sheets, $2.4billion and $2.5 billion as of December 31, 2015 and 2014, respectively, is related to the reinsurance recoverable fromHannover Re under this reinsurance agreement.
Effective October 1, 2014, we disposed of, via reinsurance, an in-force block of term life insurance policies to RGAReinsurance Company, a subsidiary of Reinsurance Group of America, Inc., (“RGA”) for $448.1 million. We will continue toadminister and service the policies. On October 1, 2014, there were $1.5 billion of statutory reserves on approximately $100.0billion of in-force life insurance. During the year ended December 31, 2014, we recognized a non-operating loss, before incometaxes, of $89.4 million, composed of $32.8 million in Other net realized capital gains on assets included in the transaction, $11.4million related to intent impairments and $110.8 million of transaction and ongoing expenses in the Consolidated Statements ofOperations. As of December 31, 2015 and 2014, the Reinsurance recoverable on the Consolidated Balance Sheets related to thisagreement was $517.8 million and $461.3 million, respectively.The transaction is expected to result in a non-operating U.S.GAAP loss before income taxes of approximately $10.0 million a year over the next twenty years.
Effective April 1, 2015, we disposed of, via reinsurance, retained group reinsurance policies to Enstar Group Ltd. for $304.5million. On April 1, 2015, there were $290.0 million of statutory reserves. In connection with this transaction, we recognized anon-operating loss, before income taxes, of $39.2 million primarily related to intent impairments of assets included in thetransaction and other transactions costs in the Consolidated Statement of Operations. As of December 31, 2015, the Reinsurancerecoverable on the Consolidated Balance Sheets related to this transaction was $263.4 million.
Effective October 1, 2015, we disposed of, via reinsurance, an in-force block of term life insurance policies to RGA ReinsuranceCompany. We will continue to administer and service the policies. On October 1, 2015, there were approximately $1.4 billion ofstatutory reserves on approximately $90.0 billion of in-force life insurance. During the year ended December 31, 2015, werecognized a non-operating loss, before income taxes, of $109.8 million, composed of $13.7 million in Other net realized capitalgains on assets included in the transaction, $3.6 million related to intent impairments and $119.9 million of transaction and ongoingexpenses in the Consolidated Statements of Operations. As of December 31, 2015, the Reinsurance recoverable on theConsolidated Balance Sheets related to this agreement was $462.3 million. The transaction is expected to result in a non-operatingU.S. GAAP loss, before income taxes of approximately $12.0 million a year over the next fifteen years.
Pension and Postretirement Plans
When contributing to our qualified retirement plans we will take into consideration the minimum and maximum amounts required byERISA, the attained funding target percentage of the plan, the variable-rate premiums that may be required by the PBCG and anyfunding relief that might be enacted by Congress. Contributions to our nonqualified plans and other postretirement and post-employment plans are funded from general assets of the respective sponsoring subsidiary company as benefits are paid.
For additional information on our pension and postretirement plan arrangements, see the Employee Benefit Arrangements Notein our Consolidated Financial Statements in Part II, Item 8. of this Annual Report on Form 10-K.
Restrictions on Dividends and Returns of Capital from Subsidiaries
Our business is conducted through operating subsidiaries. U.S. insurance laws and regulations regulate the payment ofdividends and other distributions by our insurance subsidiaries to their respective parents. Dividends in excess of prescribedlimits established by the applicable state regulations are considered to be extraordinary transactions and require explicitregulatory approval. In addition, under the insurance laws of our principal insurance subsidiaries domiciled in Connecticut,Iowa and Minnesota, no dividend or other distribution exceeding an amount equal to an insurance company’s earned surplusmay be paid without the domiciliary insurance regulator’s prior approval. Our Principal Insurance Subsidiaries domiciled inColorado, Connecticut and Iowa each have ordinary dividend capacity for 2016. However, as a result of the extraordinarydividend it paid in 2015, our Principal Insurance Subsidiary domiciled in Minnesota currently has negative earned surplus andtherefore does not have capacity at this time to make ordinary dividend payments to Voya Holdings without domiciliaryinsurance regulatory approval which can be granted or withheld at the discretion of the regulator.
145

For a summary of applicable laws and regulations governing dividends, see the Insurance Subsidiaries Dividend Restrictionssection of the Insurance Subsidiaries Note in our Consolidated Financial Statements in Part II, Item 8. of this Annual Report onForm 10-K.
The following table summarizes dividends permitted to be paid by our principal insurance subsidiaries to Voya Financial, Inc.or Voya Holdings without the need for insurance regulatory approval for the periods presented:
Dividends Permitted withoutApproval
($ in millions) 2016 2015 2014
Subsidiary Name (State of domicile):Voya Insurance and Annuity Company (IA) . . . . . . . . . . . . . . . . . . . . . . . . . . $447.5 $394.1 $216.3Voya Retirement Insurance and Annuity Company (CT) . . . . . . . . . . . . . . . . 364.1 321.8 371.4Security Life of Denver Insurance Company (CO) . . . . . . . . . . . . . . . . . . . . . 54.9 111.6 32.5ReliaStar Life Insurance Company (MN) . . . . . . . . . . . . . . . . . . . . . . . . . . . . — 194.2 194.0
The following table summarizes dividends and extraordinary distributions paid by each of the Company’s principal insurancesubsidiaries to Voya Financial, Inc. or Voya Holdings for the periods indicated:
Dividends PaidExtraordinary Distributions
Paid
Year Ended December 31, Year Ended December 31,
($ in millions) 2015 2014 2015 2014
Subsidiary Name (State of domicile):Voya Insurance and Annuity Company (IA) . . . . . . . . . . . . . . . . . . . . . . $394.0 $216.0 $ 98.0 $—Voya Retirement Insurance and Annuity Company (CT) . . . . . . . . . . . . 321.0 371.0 — —Security Life of Denver Insurance Company (CO) . . . . . . . . . . . . . . . . . 111.0 32.0 130.0 —ReliaStar Life Insurance Company (MN) . . . . . . . . . . . . . . . . . . . . . . . . 194.0 193.0 280.0 —
In June 2015, VIAC declared an extraordinary distribution of $98.0 million, subject to the receipt of approval by the IowaDivision of Insurance. The Iowa Division of Insurance provided notice of approval on June 25, 2015 and VIAC paid theextraordinary distribution on June 26, 2015. In June 2015, RLI declared an extraordinary distribution of $280.0 million, subjectto receipt of approval by the Minnesota Insurance Division. The Minnesota Insurance Division provided notice of approval onJuly 31, 2015 and RLI paid the extraordinary distribution on August 3, 2015. In July 2015, SLD declared an extraordinarydistribution of $130.0 million, subject to receipt of approval by the Colorado Insurance Division. The Colorado InsuranceDivision provided notice of non-disapproval on July 29, 2015 and SLD paid the extraordinary distribution on July 31, 2015.
On May 5, 2015, Voya Financial, Inc.’s principal insurance subsidiaries domiciled in Connecticut, Iowa and Minnesota declaredordinary dividends in the aggregate amount of $819.0 million, which was paid on May 20, 2015. On June 3, 2015, VoyaFinancial, Inc.’s principal insurance subsidiary domiciled in Colorado declared an ordinary dividend of $111.0 million, whichwas paid on June 25, 2015. On November 19, 2015, Voya Financial, Inc.’s Principal Insurance Subsidiary domiciled inConnecticut declared an ordinary dividend in the amount of $90.0 million which, was paid on December 23, 2015.
On May 2, 2014, Voya Financial, Inc.’s principal insurance subsidiaries domiciled in Connecticut, Iowa and Minnesota declaredordinary dividends in the aggregate amount of $690.0 million, which were paid on May 19, 2014. On June 9, 2014, VoyaFinancial, Inc.’s principal insurance subsidiary domiciled in Colorado declared an ordinary dividend in the aggregate amount of$32.0 million, which was paid on June 24, 2014. On November 20, 2014, Voya Financial, Inc.’s principal insurance subsidiarydomiciled in Connecticut declared an ordinary dividend in the amount of $90.0 million, which was paid on December 22, 2014.
Other Subsidiaries—Dividends, Returns of Capital, and Capital Contributions
We may receive dividends from or contribute capital to our wholly owned non-life insurance subsidiaries such as broker-dealers, investment management entities and intermediate holding companies. For the years ended December 31, 2015 and2014, dividends net of capital contributions received by Voya Financial, Inc. and Voya Holdings from non-life subsidiaries were$165.5 million and $258.0 million, respectively.
146

Statutory Capital and Risk-Based Capital of Principal Insurance Subsidiaries
Each of our wholly owned principal insurance subsidiaries is subject to minimum risk based capital (“RBC”) requirementsestablished by the insurance departments of their applicable state of domicile. The formulas for determining the amount of RBCspecify various weighting factors that are applied to financial balances or various levels of activity based on the perceiveddegree of risk. Regulatory compliance is determined by a ratio of total adjusted capital (“TAC”), as defined by the NAIC, toRBC requirements, as defined by the NAIC. Each of our U.S. insurance subsidiaries exceeded the minimum RBC requirementsthat would require regulatory or corrective action for all periods presented herein. The Company’s estimated RBC ratio on acombined basis primarily for our principal insurance subsidiaries, with adjustments for certain intercompany transactions, wasapproximately 485% as of December 31, 2015.
Our wholly owned insurance subsidiaries are required to prepare statutory financial statements in accordance with statutoryaccounting practices prescribed or permitted by the insurance department of the state of domicile of the respective insurancesubsidiary. Statutory accounting practices primarily differ from U.S. GAAP by charging policy acquisition costs to expense asincurred, establishing future policy benefit liabilities using different actuarial assumptions as well as valuing investments andcertain assets and accounting for deferred taxes on a different basis. Certain assets that are not admitted under statutoryaccounting principles are charged directly to surplus. Depending on the regulations of the insurance department of the state ofdomicile, the entire amount or a portion of an asset balance can be non-admitted depending on specific rules regardingadmissibility. The most significant non-admitted assets are typically deferred tax assets.
The following table summarizes the statutory capital and surplus of our principal insurance subsidiaries as of the datesindicated:
As of December 31,
($ in millions) 2015 2014
Subsidiary Name (State of domicile):Voya Insurance and Annuity Company (IA) . . . . . . . . . . . . . . . . . . . . . . . $2,074.8 $2,119.4Voya Retirement Insurance and Annuity Company (CT) . . . . . . . . . . . . . . 2,030.2 2,007.9Security Life of Denver Insurance Company (CO) . . . . . . . . . . . . . . . . . . 858.3 1,128.8ReliaStar Life Insurance Company (MN) . . . . . . . . . . . . . . . . . . . . . . . . . . 1,609.2 1,944.7
We monitor the ratio of our insurance subsidiaries’ TAC to Company Action Level Risk-Based Capital (“CAL”). A ratio inexcess of 125% indicates that the insurance subsidiary is not required to take any corrective actions to increase capital levels atthe direction of the applicable state of domicile.
The following table summarizes the ratio of TAC to CAL on a combined basis primarily for our principal insurancesubsidiaries, with adjustments for certain intercompany transactions, as of the dates indicated below:
($ in millions) ($ in millions)As of December 31, 2015 As of December 31, 2014
CAL TAC Ratio CAL TAC Ratio
$1,414.0 $6,859.6 485% $1,387.3 $7,458.7 538%
Statutory reserves established for variable annuity contracts and riders are sensitive to changes in the equity markets and areaffected by the level of account values relative to the level of any guarantees, product design and reinsurance arrangements. Asa result, the relationship between reserve changes and equity market performance is non-linear during any given reportingperiod. Market conditions greatly influence the ultimate capital required due to its effect on the valuation of reserves andderivative assets hedging these reserves.
The sensitivity of our insurance subsidiaries’ statutory reserves and surplus established for variable annuity contracts and certainminimum interest rate guarantees to changes in the interest rates, credit spreads and equity markets will vary depending on themagnitude of the decline. The sensitivity will be affected by the level of account values, the level of guaranteed amounts andproduct design. Should statutory reserves increase, this could result in future reductions in our insurance subsidiaries’ surplus,which may also impact RBC. Adverse changes in interest rates and the continued widening of credit spreads may result in anincrease in the reserves for product guarantees which adversely impact statutory surplus, which may also impact RBC.
147

RBC is also affected by the product mix of the in force book of business (i.e., the amount of business without guarantees is notsubject to the same level of reserves as the business with guarantees). RBC is an important factor in the determination of thecredit and financial strength ratings of Voya Financial, Inc. and our insurance subsidiaries.
Captive Reinsurance Subsidiaries
Our captive reinsurance subsidiaries provide reinsurance to the Company’s insurance subsidiaries in order to facilitate thefinancing of statutory reserves including those associated with Regulation XXX or AG38 and to fund certain statutory annuityand reserve requirements. Each of the captive reinsurance subsidiaries in operation as of December 31, 2015 is a wholly owneddirect or indirect subsidiary of one of the Principal Insurance Subsidiaries or Voya Holdings Inc. Each of the captive reinsurancesubsidiaries is subject to specific minimum capital requirements set forth in the insurance statutes of Missouri, the state ofdomicile and is required to prepare statutory financial statements in accordance with statutory accounting practices prescribed inthe Missouri insurance statutes or permitted by the Missouri insurance department. There are no prescribed practices material tothe captive reinsurance subsidiaries, except that certain of these subsidiaries have included the value of LOCs and trust notes asadmitted assets supporting the statutory reserves ceded to such subsidiaries. The effect of these prescribed practices was toincrease statutory capital and surplus by $590.6 million and $1,185.0 million as of December 31, 2015 and 2014, respectively.The aggregate statutory capital and surplus, including the aforementioned prescribed practices, was $351.5 million and $552.5million as of December 31, 2015 and 2014, respectively.
Our Arizona captive, SLDI, provides reinsurance to the Company’s insurance subsidiaries in order to facilitate the financing ofstatutory reserves including those associated with Regulation XXX or AG38 and to fund certain statutory annuity reserverequirements. On December 20, 2013, SLDI re-domesticated from the Cayman Islands to the State of Arizona. Arizona stateinsurance statutes and regulations require SLDI to file financial statements with the Arizona Department of Insurance (“ADOI”)and allow the filing of such financial statements on a U.S. GAAP basis modified for certain prescribed practices outlined in theArizona insurance statutes that are applicable to U.S. GAAP filers. These prescribed practices had no impact on SLDI’sShareholder’s equity as of December 31, 2015 and 2014. In addition, SLDI has obtained approval from the ADOI for certainpermitted practices, including taking reinsurance credit for certain ceded reserves where the assets backing the liabilities areheld by a wholly owned Principal Insurance Subsidiary of Voya Financial, Inc. SLDI has recorded a receivable for these assets.The effect of the permitted practice was to increase SLDI’s Shareholder’s equity by $456.6 million and $482.0 million as ofDecember 31, 2015 and 2014, respectively, but has no effect on our Consolidated total shareholders’ equity. In the unlikelyevent that the permitted practice is suspended in the future, the Company has various alternatives which could be executed toallow the reinsurance credit for these ceded reserves.
The captive reinsurance subsidiaries may not declare or pay any dividends other than in accordance with their respectiveinsurance reserve financing transaction agreements and their respective governing licensing orders. Likewise, SLDI may notdeclare or pay dividends other than in accordance with its annual capital and dividend plan as approved by the ADOI, whichincludes a minimum capital requirement. SLDI does not expect to make any dividend payments during calendar year 2016.
Uncertainties associated with our continued use of affiliated captive reinsurance subsidiaries and our Arizona captive areprimarily related to potential regulatory changes. In June 2014, the NAIC adopted a new regulatory framework for captivesassuming business governed by Regulations XXX or AXXX, called the “Rector Framework”. In December 2014, the NAICadopted Actuarial Guideline 48 which established a new regulatory requirement applicable to XXX and AXXX reserves cededto reinsurers, including affiliated reinsurers, as the first step in implementing the Rector framework. Actuarial Guideline 48limits the type of assets that may be used as collateral to back the XXX and AXXX statutory reserves, and is appliedprospectively to existing reinsurance transactions that reinsure policies issued on or after January 1, 2015 and new reinsurancetransactions entered into on or after January 1, 2015. The NAIC has charged multiple working groups with the responsibility toprepare regulations that would codify the Rector framework and that work continues at the NAIC. In 2014, the NAIC alsoconsidered a proposal to require states to apply NAIC accreditation standards, applicable to traditional insurers, to captivereinsurers. In 2015, the NAIC adopted such a proposal, in the form of a revised preamble to the NAIC accreditation standards(“the Standard”), with an effective date of January 1, 2016 for application of the Standard to captives that assume XXX orAXXX business. Under the Standard, a state will be deemed in compliance as it relates to XXX and AXXX captives if theapplicable reinsurance transaction satisfies Actuarial Guideline 48. In addition, the Standard applies prospectively, so that XXXand AXXX captives will not be subject to the Standard if reinsured policies were issued prior to January 1, 2015 and ceded sothat they were part of a reinsurance arrangement as of December 31, 2014. The NAIC left for future action application of theStandard to captives that assume variable annuity business. As drafted, it appears that the Standard would apply to our Arizonacaptive. During 2015, the NAIC Financial Conditions (E) Committee (the “E Committee”) established the Variable AnnuitiesIssues (E) Working Group (“VAIWG”) to oversee the NAIC’s effort’s to study and address, as appropriate, regulatory issuesresulting in variable annuity captive reinsurance transactions. The VAIWG retained Oliver Wyman to study the industry’s use
148
of variable annuity captive reinsurance and to develop a set of recommended changes to address the issues involving variableannuity captives. In September 2015, Oliver Wyman issued an initial report, which was adopted by the VAIWG, outlining itspreliminary findings and making recommendations for enhancements to the variable annuity statutory framework. In November2015, upon the recommendation of the VAIWG, the E Committee adopted a Variable Annuities Framework for Change (the“VA Framework for Change”) which recommends charges for NAIC working groups to adjust the variable annuity statutoryframework applicable to all insurers that have written or are writing variable annuity business. The VA Framework for Changecontemplates a holistic set of reforms that would improve the current reserve and capital framework and address root causeissues that result in the use of captive arrangements. Although the VA Framework for Change recommends an effective date ofJanuary 1, 2017, the timing of these proposals remains uncertain. In November 2015, the NAIC also approved funding for aquantitative impact study, to be conducted by Oliver Wyman and involving industry participants including the Company, ofvarious reforms outlined in the VA Framework for Change (the “QIS Study”).
We cannot predict what revisions, if any, will be made to the Rector framework or the Standard for application to captives thatassume XXX and AXXX business, as multiple NAIC working groups undertake their implementation, to the VA Framework forChange proposal as a result of the QIS Study and ongoing NAIC deliberations, or to the Standard, if adopted for variableannuity captives. It is also unclear whether these or other proposals will be adopted by the NAIC, or what additional actions andregulatory changes will result from the continued captives scrutiny and reform efforts by the NAIC and other regulatory bodies.
Although we do not believe it to be likely, a potential outcome of the continued captives scrutiny and reform efforts by theNAIC and other regulatory bodies is that we will be limited in our ability to achieve desired benefits from using our captivereinsurance subsidiaries to finance statutory reserves subject to Regulations XXX and AG 38. The extent of such a limitationwould depend on the specific changes to state regulations that are adopted, see “Item 1. Business—Regulation—FinancialRegulation—Recent Actions by the NAIC.” The VA Framework for Change is a proposal in the early stages of developmentand given that its final terms are subject to the QIS Study and ongoing NAIC deliberations, we cannot predict what impact thefinal framework would have on our Arizona captive. The Standard, if adopted for variable annuity captives as proposed withoutgrandfathering provisions for existing captive variable annuity reinsurance entities, could also limit our ability to usereinsurance structures involving our Arizona captive. Given the uncertainty around these matters, we are unable to estimate theexpected effects on our consolidated operations and financial position of the limitation of the use of our captive reinsurancesubsidiaries and our Arizona captive to finance statutory reserves subject to Regulations XXX and AG38 and statutory reservesassociated with our reinsured annuity business. If we are limited in our use of captive reinsurance subsidiaries and our Arizonacaptive on a retroactive basis, the reasonably likely impacts would include early termination fees payable with respect to certainfinancing structures, higher operating or tax costs, an increase in statutory reserves and diminished capital position. On aprospective basis, limiting the use of captive reinsurance companies could impact the types, amounts and pricing of products weoffer and could result in potential reductions in or discontinuance of new term or UL insurance sales, any of which couldadversely impact our consolidated results of operations and financial condition. In addition, we cannot be certain that affordablealternative financing would be available.
Off-Balance Sheet Arrangements
Through the normal course of investment operations, we commit to either purchase or sell securities, mortgage loans, or moneymarket instruments, at a specified future date and at a specified price or yield. The inability of counterparties to honor thesecommitments may result in either a higher or lower replacement cost. Also, there is likely to be a change in the value of thesecurities underlying the commitments.
As of December 31, 2015, we had off-balance sheet commitments to acquire mortgage loans of $771.9 million and purchaselimited partnerships and private placement investments of $970.9 million, of which $225.9 million relates to consolidatedinvestment entities. As of December 31, 2014, we had off-balance sheet commitments to acquire mortgage loans of $520.3million and purchase limited partnerships and private placement investments of $367.1 million, of which $297.0 million relatesto consolidated investment entities.
In addition, on March 17, 2015, we entered into a put option agreement with a Delaware trust that gives Voya Financial, Inc. theright, at any time over a ten-year period, to issue up to $500.0 million of senior notes to the trust in return for principal andinterest strips of U.S. Treasury securities that are held by the trust. In return, we agreed to pay a semi-annual put premium to thetrust at a rate of 1.9% per annum applied to the unexercised portion of the put option, and to reimburse the trust for its expenses.See the Financing Agreements Note in our Consolidated Financial Statements in Part II, Item 8. of this Annual Report on Form10-K for more information on this put option agreement.
149

Aggregate Contractual ObligationsAs of December 31, 2015, we had certain contractual obligations due over a period of time as summarized in the followingtable. The estimated payments reflected in this table are based on our estimates and assumptions about these obligations.Because these estimates and assumptions are necessarily subjective, the actual cash outflows in future periods will vary,possibly materially, from those presented in the table.
($ in millions) TotalLess than
1 Year 1-3 Years 3-5 YearsMore than
5 Years
Contractual ObligationsPurchase obligations(1) . . . . . . . . . . . . . . . . . . . . . . . . . . . . . . . . . . . $ 1,742.8 $1,629.3 $ 113.5 $ — $ —Reserves for insurance obligations(2)(3) . . . . . . . . . . . . . . . . . . . . . . 111,626.6 7,165.4 12,923.8 12,312.6 79,224.8Retirement and other plans(4) . . . . . . . . . . . . . . . . . . . . . . . . . . . . . . 1,592.6 126.8 274.4 299.8 891.6Short-term and long-term debt obligations(5) . . . . . . . . . . . . . . . . . 7,101.6 176.9 1,339.9 295.9 5,288.9Operating leases(6) . . . . . . . . . . . . . . . . . . . . . . . . . . . . . . . . . . . . . . 160.0 33.9 49.2 28.8 48.1Securities lending and repurchase agreements(7) . . . . . . . . . . . . . . . 484.4 484.4 — — —Total(8) . . . . . . . . . . . . . . . . . . . . . . . . . . . . . . . . . . . . . . . . . . . . . . . $122,708.0 $9,616.7 $14,700.8 $12,937.1 $85,453.4
(1) Purchase obligations consist primarily of outstanding commitments under alternative investments that may occur any timewithin the terms of the partnership and private loans. The exact timing, however, of funding these commitments related topartnerships and private loans cannot be estimated. Therefore, the amount of the commitments related to partnerships andprivate loans is included in the category “Less than 1 Year.”
(2) Reserves for insurance obligations consist of amounts required to meet our future obligations for future policy benefits andcontract owner account balances. Amounts presented in the table represent estimated cash payments under such contracts,including significant assumptions related to the receipt of future premiums, mortality, morbidity, lapse, renewal,retirement, disability and annuitization comparable with actual experience. These assumptions also include market growthand interest crediting consistent with assumptions used in amortizing DAC. Estimated cash payments are undiscounted forthe time value of money. Accordingly, the sum of cash flows presented of $111.6 billion significantly exceeds the sum ofFuture policy benefits and Contract owner account balances of $88.2 billion recorded on our Consolidated Balance Sheetsas of December 31, 2015. Estimated cash payments are also presented gross of reinsurance. Due to the significance of theassumptions used, the amounts presented could materially differ from actual results.
(3) Contractual obligations related to certain closed blocks, with reserves in the amount of $5.3 billion, have been excludedfrom the table because the blocks were divested through reinsurance contracts and collateral is provided by third partiesthat is accessible by us. Although we are not relieved of legal liability to the contract holder for these closed blocks, third-party collateral of $9.4 billion has been provided for the payment of the related insurance obligations. The sufficiency ofcollateral held for any individual block may vary.
(4) Includes estimated benefit payments under our qualified and non-qualified pension plans, estimated benefit paymentsunder our other postretirement benefit plans, and estimated payments of deferred compensation based on participantelections and an average retirement age.
(5) The estimated payments due by period for long-term debt reflects the contractual maturities of principal, as well asestimated future interest payments. The payment of principal and estimated future interest for short-term debt are reflectedin estimated payments due in less than one year. See the Financing Agreements Note in our Consolidated FinancialStatements in Part II, Item 8. of this Annual Report on Form 10-K for additional information concerning the short-term andlong-term debt obligations.
(6) Operating leases consist primarily of outstanding commitments for office space, equipment and automobiles.(7) Payables under securities loan agreements including collateral held represent the liability to return collateral received from
counterparties under securities lending agreements. Securities lending agreements include provisions which permit us tocall back securities with minimal notice and accordingly, the payable is classified as having a term of less than 1 year.
(8) Unrecognized tax benefits are excluded from the table due to immateriality.
Critical Accounting Judgments and EstimatesGeneralThe preparation of financial statements in conformity with U.S. GAAP requires us to make estimates and assumptions thataffect the reported amounts of assets and liabilities and disclosure of contingent assets and liabilities at the date of theConsolidated Financial Statements and the reported amounts of revenues and expenses during the reporting period. Criticalestimates and assumptions are evaluated on an on-going basis based on historical developments, market conditions, industrytrends and other information that is reasonable under the circumstances. There can be no assurance that actual results willconform to estimates and assumptions and that reported results of operations will not be materially affected by the need to makefuture accounting adjustments to reflect changes in these estimates and assumptions from time to time.
We have identified the following accounting judgments and estimates as critical in that they involve a higher degree ofjudgment and are subject to a significant degree of variability:
• Reserves for future policy benefits;
150
• DAC, VOBA and other intangibles (collectively, “DAC/VOBA and other intangibles”);
• Valuation of investments and derivatives;
• Impairments;
• Income taxes;
• Contingencies; and
• Employee benefit plans.
In developing these accounting estimates, we make subjective and complex judgments that are inherently uncertain and subjectto material changes as facts and circumstances develop. Although variability is inherent in these estimates, we believe theamounts provided are appropriate based on the facts available upon preparation of the Consolidated Financial Statements.
The above critical accounting estimates are described in the Business, Basis of Presentation and Significant Accounting PoliciesNote in our Consolidated Financial Statements in Part II, Item 8. of this Annual Report on Form 10-K.
Reserves for Future Policy Benefits
The determination of future policy benefit reserves is dependent on actuarial assumptions. The principal assumptions used toestablish liabilities for future policy benefits are based on our experience and periodically reviewed against industry standards.These assumptions include mortality, morbidity, policy lapse, contract renewal, payment of subsequent premiums or deposits bythe contract owner, retirement, investment returns, inflation, benefit utilization and expenses. The assumptions used requireconsiderable judgments. Changes in, or deviations from, the assumptions used can significantly affect our reserve levels andrelated results of operations.
• Mortality is the incidence of death among policyholders triggering the payment of underlying insurance coverage bythe insurer. In addition, mortality also refers to the ceasing of payments on life-contingent annuities due to the deathof the annuitant. We utilize a combination of actual and industry experience when setting our mortality assumptions.
• A lapse rate is the percentage of in-force policies surrendered by the policyholder or canceled by us due to non-payment of premiums. For certain of our variable products, the lapse rate assumption varies according to the currentaccount value relative to guarantees associated with the product and applicable surrender charges. In general, policieswith guarantees that are considered “in the money” (i.e., where the notional benefit amount is in excess of the accountvalue) are assumed to be less likely to lapse or surrender. Conversely, “out of the money” guarantees may be assumedto be more likely to lapse or surrender as the policyholder has less incentive to retain the policy.
See the Reserves for Future Policy Benefits and Contract Owner Account Balances Note and the Guaranteed Benefit FeaturesNote in our Consolidated Financial Statements in Part II, Item 8. of this Annual Report on Form 10-K for further information onour reserves for future policy benefits, contract owner account balances and product guarantees.
Insurance and Other Reserves
Reserves for traditional life insurance contracts (term insurance, participating and non-participating whole life insurance and traditionalgroup life insurance) and accident and health insurance represent the present value of future benefits to be paid to or on behalf ofcontract owners and related expenses, less the present value of future net premiums. Assumptions as to interest rates, mortality,expenses and persistency are based on our estimates of anticipated experience at the period the policy is sold or acquired, including aprovision for adverse deviation. Interest rates used to calculate the present value of these reserves ranged from 2.3% to 7.7%.
Reserves for payout contracts with life contingencies are equal to the present value of expected future payments. Assumptionsas to interest rates, mortality and expenses are based on our estimates of experience at the period the policy is sold or acquired,including a provision for adverse deviation. Such assumptions generally vary by annuity plan type, year of issue and policyduration. Interest rates used to calculate the present value of future benefits ranged from 1.0% to 8.3%.
Although assumptions are “locked-in” upon the issuance of traditional life insurance contracts, certain accident and healthinsurance contracts and payout contracts with life contingencies, significant changes in experience or assumptions may requireus to provide for expected future losses on a product by establishing premium deficiency reserves. Premium deficiency reservesare determined based on best estimate assumptions that exist at the time the premium deficiency reserve is established and donot include a provision for adverse deviation.
151

Product Guarantees and Index-crediting Features
The assumptions used to establish the liabilities for our product guarantees require considerable judgment and are established asmanagement’s best estimate of future outcomes. We periodically review these assumptions and, if necessary, update them basedon additional information that becomes available. Changes in, or deviations from, the assumptions used can significantly affectour reserve levels and related results of operations.
GMDB and GMIB: Reserves for annuity GMDB and GMIB are determined by estimating the value of expected benefits inexcess of the projected account balance and recognizing the excess ratably over the accumulation period based on total expectedassessments. Expected experience is based on a range of scenarios. Assumptions used, such as the long-term equity marketreturn, lapse rate and mortality, are consistent with assumptions used in estimating gross revenues for the purpose of amortizingDAC. In addition, the reserve for the GMIB incorporates assumptions for the likelihood and timing of the potentialannuitizations that may be elected by the contract owner. In general, we assume that GMIB annuitization rates will be higher forpolicies with more valuable (“in the money”) guarantees.
GMAB, GMWB, GMWBL, FIA, IUL, Stabilizer and MCG: We also issue certain products that contain embedded derivatives thatare measured at estimated fair value separately from the host contracts. These embedded derivatives include annuity GMAB,GMWB, GMWBL, FIA, IUL and Stabilizer. The managed custody guarantee product (“MCG”) is a stand-alone derivative andis measured in its entirety at estimated fair value.
At inception of the GMAB, GMWB and GMWBL contracts, we project a fee to be attributed to the embedded derivativeportion of the guarantee equal to the present value of projected future guaranteed benefits. After inception, the estimated fairvalue of the GMAB, GMWB and GMWBL contracts is determined based on the present value of projected future guaranteedbenefits, minus the present value of projected attributed fees. A risk neutral valuation methodology is used under which the cashflows from the guarantees are projected under multiple capital market scenarios using observable risk free rates. The projectionof future guaranteed benefits and future attributed fees require the use of assumptions for capital markets (e.g., impliedvolatilities, correlation among indices, risk-free swap curve, etc.) and policyholder behavior (e.g., lapse, benefit utilization,mortality, etc.).
The estimated fair value of the embedded derivative in the FIA contracts is based on the present value of the excess of interestpayments to the contract owners over the growth in the minimum guaranteed contract value. The excess interest payments aredetermined as the excess of projected index driven benefits over the projected guaranteed benefits. The projection horizon isover the anticipated life of the related contracts, which takes into account best estimate actuarial assumptions, such as partialwithdrawals, full surrenders, deaths, annuitizations and maturities.
Certain FIA contracts contain guaranteed withdrawal benefit provisions. Reserves for these benefits are calculated by estimatingthe value of expected benefits in excess of the projected account balance and recognizing the excess ratably over theaccumulation period based on total expected assessments.
The estimated fair value of the embedded derivative in the IUL contracts is based on the present value of the excess of interestpayments to the contract owners over the growth in the minimum guaranteed account value. The excess interest payments aredetermined as the excess of projected index driven benefits over the projected guaranteed benefits. The projection horizon isover the current indexed term of the related contracts, which takes into account best estimate actuarial assumptions, such aspartial withdrawals, full surrenders, deaths and maturities.
The estimated fair value of the Stabilizer embedded derivative and MCG contracts is determined based on the present value ofprojected future claims, minus the present value of future guaranteed premiums. At inception of the contract, we project aguaranteed premium to be equal to the present value of the projected future claims. The income associated with the contracts isprojected using actuarial and capital market assumptions, including benefits and related contract charges, over the anticipatedlife of the related contracts. The cash flow estimates are projected under multiple capital market scenarios using observable risk-free rates and other best estimate assumptions.
The liabilities for the GMAB, GMWB, GMWBL, FIA, IUL and Stabilizer embedded derivatives and the MCG stand-alonederivative include a risk margin to capture uncertainties related to policyholder behavior assumptions. The margin representsadditional compensation a market participant would require to assume these risks.
152
The discount rate used to determine the fair value of the liabilities for our GMAB, GMWB, GMWBL, FIA, IUL and Stabilizerembedded derivatives and the MCG stand-alone derivative includes an adjustment to reflect the risk that these obligations willnot be fulfilled (“nonperformance risk”). Our nonperformance risk adjustment is based on a blend of observable, similarly ratedpeer holding company credit default swap (“CDS”) spreads, adjusted to reflect the credit quality of our individual insurancesubsidiary that issued the guarantee, as well as an adjustment to reflect the priority of policyholder claims. The impact of thenonperformance risk adjustment on the fair value of these liabilities was a reduction of approximately $828.0 million and$753.0 million as of December 31, 2015 and 2014, respectively, with the change primarily due to the increases in observablecredit spreads and an increase in the associated reserves.
UL and Variable Universal Life (“VUL”): Reserves for UL and VUL secondary guarantees and paid-up guarantees are calculatedby estimating the expected value of death benefits payable and recognizing those benefits ratably over the accumulation periodbased on total expected assessments. The reserve for such products recognizes the portion of contract assessments received in earlyyears used to compensate us for benefits provided in later years. Assumptions used, such as the interest rate, lapse rate andmortality, are consistent with assumptions used in estimating gross profits for purposes of amortizing DAC.
Assumptions and Periodic Review
We have only minimal experience regarding the long-term implications of policyholder behavior for our GMIB and, as a result,future experience could lead to significant changes in our assumptions. Our GMIB contracts, most of which were issued during theperiod from 2004 to 2006, have a ten-year waiting period before annuitization is available. These contracts first become eligible toannuitize during the period from 2014 through 2016, but contain significant incentives to delay annuitization beyond the firsteligibility date. In addition, during 2014 and 2015, we made two income enhancement offers to holders of particular series ofGMIB contracts, under which policyholders were offered an incentive to annuitize prior to the end of the waiting period, and wehave waived the remaining waiting period on these GMIB contracts. As a result, although we have increased experience onpolicyholder behavior for the first opportunity to annuitize, including from the acceptance rates of the income enhancement offers,we continue to have only a statistically small sample of experience used to set annuitization rates beyond the first eligibility date.Therefore, we anticipate that observable experience data will become statistically credible later in this decade, when a large volumeof GMIB benefits begin to reach their maximum benefit over the four-year period from 2019 to 2022.
Similarly, most of our GMWBL contracts are still in the first seven to nine policy years, so our assumptions for withdrawalfrom contracts with GMWBL benefits may change as experience emerges. In addition, many of our GMWBL contracts containsignificant incentives to delay withdrawal. Our experience for GMWBL contracts has recently become more credible; however,it is possible that policyholders may choose to withdraw sooner or later than our current best estimate assumes. We expectcustomers decisions on withdrawal will be influenced by their financial plans and needs, as well as by interest rate and marketconditions over time, and by the availability and features of competing products.
We also make estimates of expected lapse rates, which represent the probability that a policy will not remain in force from oneperiod to the next, for contracts in the CBVA segment. Lapse rates of our variable annuity contracts may be significantlyimpacted by the value of guaranteed minimum benefits relative to the value of the underlying separate accounts (account valueor account balance). In general, policies with guarantees that are “in the money” are assumed to be less likely to lapse.Conversely, “out of the money” guarantees are assumed to be more likely to lapse as the policyholder has less incentive to retainthe policy. Lapse rates could also be adversely affected generally by developments that affect customer perception of us.
Our variable annuity lapse rate experience has varied significantly over the period from 2006 to the present, reflecting among otherfactors, both pre-and post-financial crisis experience. Relative to our current expectations, actual lapse rates have generallydemonstrated a declining trend over the period from 2006 to the present. We analyze actual experience over that entire period, as webelieve that over the duration of the variable annuity policies we may experience the full range of policyholder behavior and marketconditions. However, management’s current best estimate of variable annuity policyholder lapse behavior is weighted more heavilytoward more recent experience, as the last three years of data have shown a more consistent trend of lapse behavior. Actual lapse ratesthat are lower than our lapse rate assumptions could have an adverse effect on profitability in the later years of a block of businessbecause the anticipated claims experience may be higher than expected in these later years, and, as discussed above, future reserveincreases in connection with experience updates could be material and adverse to our results of operations or financial condition.
We review overall policyholder experience at least annually (including lapse, annuitization, withdrawal and mortality) and updatethese assumptions when deemed necessary, based on additional information that becomes available. If actual lapse rates aresignificantly different from those assumed, this could have a significant effect on our reserve levels and related results of operations.
153
During the third quarter of 2015, 2014 and 2013, we conducted our annual review of assumptions, including projection model inputs.
In our most recent annual review of assumptions related to our CBVA contracts in the third quarter of 2015, annual assumptionchanges and revisions to projection model inputs implemented resulted in a loss of $86.0 million. This $86.0 million lossincluded an unfavorable $43.0 million resulting from policyholder behavior assumption changes primarily related to an updateto lapse assumptions, partially offset by a favorable $27.4 million resulting from changes to mortality assumptions. The lossalso included an unfavorable $70.4 million as a result of updates we have made to other assumptions, principally relating toexpected earned rates on certain investment options available to variable annuity contractholders, discount rates applicable tofuture cash flows from variable annuity contracts and long-term volatility. Annual assumption changes and revisions toprojection model inputs implemented during 2014 resulted in a gain of $102.3 million (excluding a gain of $37.9 million due tochanges in the technique used to estimate nonperformance risk). This $102.3 million gain included a favorable $170.2 millionresulting from policyholder behavior assumption changes partially offset by an unfavorable $40.5 million resulting fromchanges to mortality assumptions. The gain from policyholder behavior assumption changes was primarily due to an update tothe utilization assumption on GMWBL contracts, partially offset by an unfavorable result from an update to lapse assumptions.The 2013 result included a loss of $185.3 million (excluding a gain of $144.6 million due to changes in the technique used toestimate nonperformance risk) due to annual assumption changes. This $185.3 million loss included an unfavorable $117.9million resulting from changes to mortality assumptions and an unfavorable $85.5 million resulting from policyholder behaviorassumption changes primarily related to an update to lapse assumptions.
See Quantitative and Qualitative Disclosures About Market Risk in Part II, Item 7A. of this Annual Report on Form 10-K foradditional information regarding the specific hedging strategies and reinsurance we utilize to mitigate risk for the productguarantees, as well as sensitivities of the embedded derivative and stand-alone derivative liabilities to changes in certain capitalmarkets assumptions.
Deferred Policy Acquisition Costs, Value of Business Acquired and Other Intangibles
DAC represents policy acquisition costs that have been capitalized and are subject to amortization and interest.VOBArepresents the outstanding value of in-force business acquired and is subject to amortization and interest. DSI represents benefitspaid to contract owners for a specified period that are incremental to the amounts we credit on similar contracts without salesinducements and are higher than the contract’s expected ongoing crediting rates for periods after the inducement. URR relates toUL and VUL products and represents policy charges for benefits or services to be provided in future periods.
Collectively, we refer to DAC, VOBA, DSI and URR as “DAC/VOBA and other intangibles”. See the Deferred PolicyAcquisition Costs and Value of Business Acquired Note in our Consolidated Financial Statements in Part II, Item 8. of thisAnnual Report on Form 10-K for additional information on DAC and VOBA.
Amortization Methodologies
We amortize DAC and VOBA related to certain traditional life insurance contracts and certain accident and health insurancecontracts over the premium payment period in proportion to the present value of expected gross premiums. Assumptions as tomortality, morbidity, persistency and interest rates, which include provisions for adverse deviation, are consistent with theassumptions used to calculate reserves for future policy benefits.
These assumptions are “locked-in” at issue and not revised unless the DAC or VOBA balance is deemed to be unrecoverablefrom future expected profits. Recoverability testing is performed for current issue year products to determine if gross premiumsare sufficient to cover DAC or VOBA, estimated benefits and related expenses. In subsequent periods, the recoverability ofDAC and VOBA is determined by assessing whether future gross premiums are sufficient to amortize DAC or VOBA, as wellas provide for expected future benefits and related expenses. If a premium deficiency is deemed to be present, charges will beapplied against the DAC and VOBA balances before an additional reserve is established. Absent such a premium deficiency,variability in amortization after policy issuance or acquisition relates only to variability in premium volumes.
154
We amortize DAC and VOBA related to universal life-type contracts and fixed and variable deferred annuity contracts, exceptfor deferred annuity contracts within the CBVA segment, over the estimated lives of the contracts in relation to the emergenceof estimated gross profits. Assumptions as to mortality, persistency, interest crediting rates, fee income, returns associated withseparate account performance, impact of hedge performance, expenses to administer the business and certain economicvariables, such as inflation, are based on our experience and overall capital markets. At each valuation date, estimated grossprofits are updated with actual gross profits, and the assumptions underlying future estimated gross profits are evaluated forcontinued reasonableness. Adjustments to estimated gross profits require that amortization rates be revised retroactively to thedate of the contract issuance (“unlocking”). If the update of assumptions causes estimated gross profits to increase, DAC andVOBA amortization will decrease, resulting in a current period increase to earnings. The opposite result occurs when theassumption update causes estimated gross profits to decrease. We amortize the DSI and URR over the estimated lives of therelated contracts using the same methodology and assumptions used to amortize DAC. For deferred annuity contracts within theCBVA segment, we amortize DAC/VOBA and DSI in relation to the emergence of estimated gross revenue.
For universal life-type contracts and fixed and variable deferred annuity contracts, including those in the CBVA segment,recoverability testing is performed for current issue year products to determine if gross profits are sufficient to cover DAC/VOBA and other intangibles, estimated benefits and related expenses. In subsequent periods, we perform testing to assess therecoverability of DAC/VOBA and other intangibles on an annual basis, or more frequently if circumstances indicate a potentialloss recognition issue exists. If DAC/VOBA or other intangibles are not deemed recoverable from future gross profits, chargeswill be applied against the DAC/VOBA or other intangible balances before an additional reserve is established.
Assumptions and Periodic Review
Changes in assumptions can have a significant impact on DAC/VOBA and other intangibles balances, amortization rates,reserve levels, and results of operations. Assumptions are management’s best estimates of future outcome. We periodicallyreview these assumptions against actual experience and, based on additional information that becomes available, update ourassumptions. Deviation of emerging experience from our assumptions could have a significant effect on our DAC/VOBA andother intangibles, reserves, and the related results of operations.
• One significant assumption is the assumed return associated with the variable account performance, which hashistorically had a greater impact on variable annuity than VUL products. To reflect the volatility in the equity markets,this assumption involves a combination of near-term expectations and long-term assumptions regarding marketperformance. The overall return on the variable account is dependent on multiple factors, including the relative mix ofthe underlying sub-accounts among bond funds and equity funds, as well as equity sector weightings. Our practiceassumes that near-term and long-term increases or decreases in equity markets revert to the long-term appreciation inequity markets (“reversion to the mean”). We monitor market events and only change the assumption when sustaineddeviations are expected. This methodology incorporates a 9% long-term equity return assumption, a 14% cap and afive-year look-forward period.
• Another significant assumption used in the estimation of gross profits for certain products is mortality. We utilize acombination of actual and industry experience when setting our mortality assumptions, which are consistent with theassumptions used to calculate reserves for future policy benefits.
• Assumptions related to interest rate spreads and credit losses also impact estimated gross profits for applicableproducts with credited rates. These assumptions are based on the current investment portfolio yields and credit quality,estimated future crediting rates, capital markets, and estimates of future interest rates and defaults.
• Other significant assumptions include estimated policyholder behavior assumptions, such as surrender, lapse, andannuitization rates. We use a combination of actual and industry experience when setting and updating ourpolicyholder behavior assumptions, and such assumptions require considerable judgment. Estimated gross revenuesand gross profits for our variable annuity contracts are particularly sensitive to these assumptions.
We include the impact of the change in value of the embedded derivative associated with the FIA and IUL contracts in grossprofits for purposes of determining DAC amortization. When performing loss recognition testing on the GMAB, GMWB andGMWBL contracts, we include the change in value of the associated embedded derivatives in gross profits. In addition, weutilize a hedge program to mitigate the exposure of our CBVA segment to adverse capital market results and economicdownturns and seek to ensure that the required assets are available to satisfy future death and living benefit guarantees. Ingeneral, our variable annuity hedge program generates gains and losses that mitigate our exposure to these guarantees. As ourhedging program does not explicitly hedge the U.S. GAAP liability, we typically experience “breakage”, or a differencebetween the change in the U.S. GAAP liability and the change in the corresponding derivative instrument. We include theimpact of our hedging activities supporting our death and living benefit guarantees in gross profits when performing lossrecognition testing.
155

During the third quarter of 2015, 2014 and 2013, we conducted our annual review of assumptions, including projection modelinputs, and made a number of changes to our assumptions which impacted our Ongoing Business segment results. During thethird quarter of 2015, the impact of assumption changes resulted in a loss of $128.4 million, of which $82.0 million wasincluded in Operating earnings before income taxes and reflects net unfavorable DAC/VOBA and other intangibles unlocking.The remaining loss of $46.4 million mainly reflects changes in FIA policyholder behavior and net unfavorable DAC/VOBA andother intangibles unlocking associated with realized investment gains and losses. During the third quarter of 2014, the impact ofassumption changes resulted in a loss of $19.3 million, which was included in Operating earnings before income taxes andreflected net unfavorable DAC/VOBA and other intangibles unlocking. The impact of assumption changes excluded fromOperating earnings before income taxes for the Ongoing Business was immaterial. During the third quarter of 2013, the impactof assumption changes resulted in a gain of $94.4 million, of which $84.8 million was included in Operating earnings beforeincome taxes and reflects net favorable DAC/VOBA and other intangibles unlocking.
In addition to the amounts above, gains of $25.1 million and $15.0 million in the third quarter of 2014 and 2013, respectively,resulted from changes in the projection model inputs related to the technique used to estimate nonperformance risk in ourOngoing Business segments. These gains are excluded from Operating earnings before income taxes.
Sensitivity
We perform sensitivity analyses to assess the impact that certain assumptions have on DAC/VOBA and other intangibles, aswell as certain reserves. The following table presents the estimated instantaneous net impact to income before income taxes ofvarious assumption changes on our DAC/VOBA and other intangible balances and the impact on related reserves for futurepolicy benefits and reinsurance. The effects presented are not representative of the aggregate impacts that could result if acombination of such changes to equity markets, interest rates and other assumptions occurred. (Assumptions regarding shifts inmarket factors may be overly simplistic and not indicative of actual market behavior in stress scenarios.)
($ in millions)As of December 31,
2015
Decrease in long-term rate of return assumption by 100 basis points . . . . . . . . $(225.5)A change to the long-term interest rate assumption of -50 basis points . . . . . . . (61.7)A change to the long-term interest rate assumption of +50 basis points . . . . . . 19.2An assumed increase in future mortality by 1% . . . . . . . . . . . . . . . . . . . . . . . . . (23.2)A one-time, 10% decrease in equity market values . . . . . . . . . . . . . . . . . . . . . . (378.7)
In addition, in our CBVA segment, assumption changes relating to the rate of return on fixed income investments backingCBVA contracts can also have a significant effect on reported financial results. The following table shows the sensitivity of theresults of operations before income taxes of the CBVA segment to changes in these assumptions:
($ in millions) As of December 31, 2015
A change of -50 basis points to the assumed rate of return on fixed-income investments backing CBVAcontracts . . . . . . . . . . . . . . . . . . . . . . . . . . . . . . . . . . . . . . . . . . . . . . . . . . . . . . . . . . . . . . . . . . . . . . . . . . . $(240.9)
A change of +50 basis points to the assumed rate of return on fixed-income investments backing CBVAcontracts . . . . . . . . . . . . . . . . . . . . . . . . . . . . . . . . . . . . . . . . . . . . . . . . . . . . . . . . . . . . . . . . . . . . . . . . . . . 227.8
We generally assume that the rate of return on fixed income investments backing CBVA contracts moves in a manner correlatedwith changes to our assumed long term rate of return. Furthermore, assumptions regarding shifts in market factors may beoverly simplistic and not indicative of actual market behavior in stress scenarios.
Lower assumed equity rates of return, lower assumed interest rates, increased assumed future mortality and decreases in equitymarket values generally decrease DAC/VOBA and other intangibles and to increase future policy benefits, thus decreasingincome before income taxes. Higher assumed interest rates generally increase DAC/VOBA and other intangibles and decreasefuture policy benefits, thus increasing income before income taxes.
156

Valuation of Investments and Derivatives
Our investment portfolio consists of public and private fixed maturity securities, commercial mortgage and other loans, equitysecurities, short-term investments, other invested assets and derivative financial instruments. Fixed maturity and equitysecurities are primarily classified as available-for-sale and are carried at fair value. We enter into interest rate, equity market,credit default and currency contracts, including swaps, futures, forwards, caps, floors and options, to reduce and manage variousrisks associated with changes in value, yield, price, cash flow or exchange rates of assets or liabilities held or intended to beheld, or to assume or reduce credit exposure associated with a referenced asset, index or pool. We also utilize options andfutures on equity indices to reduce and manage risks associated with our annuity products.
See the Investments (excluding Consolidated Investment Entities) Note and the Derivative Financial Instruments Note in ourConsolidated Financial Statements in Part II, Item 8. of this Annual Report on Form 10-K for further information.
Investments
We measure the fair value of our financial assets and liabilities based on assumptions used by market participants in pricing theasset or liability, which may include inherent risk, restrictions on the sale or use of an asset, or nonperformance risk, includingour own credit risk. The estimate of fair value is the price that would be received to sell an asset or transfer a liability (“exitprice”) in an orderly transaction between market participants in the principal market, or the most advantageous market in theabsence of a principal market, for that asset or liability. We use a number of valuation sources to determine the fair values of ourfinancial assets and liabilities, including quoted market prices, third-party commercial pricing services, third-party brokers,industry-standard, vendor-provided software that models the value based on market observable inputs, and other internalmodeling techniques based on projected cash flows.
We categorize our financial instruments into a three-level hierarchy based on the priority of the inputs to the valuationtechnique. The fair value hierarchy gives the highest priority to quoted prices in active markets for identical assets or liabilities(Level 1) and the lowest priority to unobservable inputs (Level 3). If the inputs used to measure fair value fall within differentlevels of the hierarchy, the category level is based on the lowest priority level input that is significant to the fair valuemeasurement of the instrument.
When available, the estimated fair value of securities is based on quoted prices in active markets that are readily and regularlyobtainable. When quoted prices in active markets are not available, the determination of estimated fair value is based on marketstandard valuation methodologies, including discounted cash flows, matrix pricing or other similar techniques. Inputs to thesemethodologies include, but are not limited to, market observable inputs such as benchmark yields, credit quality, issuer spreads,bids, offers and cash flow characteristics of the security. For privately placed bonds, we also consider such factors as the networth of the borrower, value of the collateral, the capital structure of the borrower, the presence of guarantees, and theborrower’s ability to compete in its relevant market. Valuations are reviewed and validated monthly by an internal valuationcommittee using price variance reports, comparisons to internal pricing models, back testing of recent trades, and monitoring oftrading volumes, as appropriate.
The valuation of financial assets and liabilities involves considerable judgment, is subject to considerable variability, isestablished using management’s best estimate, and is revised as additional information becomes available. As such, changes in,or deviations from, the assumptions used in such valuations can significantly affect our results of operations. Financial marketsare subject to significant movements in valuation and liquidity, which can impact our ability to liquidate and the selling pricethat can be realized for our securities.
Derivatives
Derivatives are carried at fair value, which is determined by using observable key financial data, such as yield curves, exchangerates, S&P 500 prices, LIBOR and Overnight Index Swap Rates (“OIS”) or through values established by third-party sources,such as brokers. Valuations for our futures contracts are based on unadjusted quoted prices from an active exchange.Counterparty credit risk is considered and incorporated in our valuation process through counterparty credit rating requirementsand monitoring of overall exposure. Our own credit risk is also considered and incorporated in our valuation process.
We have certain CDS and options that are priced using models that primarily use market observable inputs, but contain inputsthat are not observable to market participants.
157

We also have investments in certain fixed maturities and have issued certain universal life-type and product features that containembedded derivatives whose fair value is at least partially determined by levels of or changes in domestic and/or foreign interestrates (short-term or long-term), exchange rates, prepayment rates, equity markets, or credit ratings/spreads. The fair values ofthese embedded derivatives are determined using prices or valuation techniques that require inputs that are both unobservableand significant to the overall fair value measurement. For additional information regarding the valuation of and significantassumptions associated with embedded derivatives and stand-alone derivatives associated with certain annuity contracts, see the“Reserves for Future Policy Benefits” section.
In addition, we have entered into coinsurance with funds withheld reinsurance arrangements that contain embedded derivatives.The fair value of the embedded derivatives is based on the change in the fair value of the underlying assets held in the trustusing the valuation methods and assumptions described for our investments held.
The valuation of derivatives involves considerable judgment, is subject to considerable variability, is established usingmanagement’s best estimate and is revised as additional information becomes available. As such, changes in, or deviationsfrom, these assumptions used in such valuations can have a significant effect on the results of operations.
For additional information regarding the fair value of our investments and derivatives, see the Fair Value Measurements(excluding Consolidated Investment Entities) Note in our Consolidated Financial Statements in Part II, Item 8. of this AnnualReport on Form 10-K.
Impairments
We evaluate our available-for-sale general account investments quarterly to determine whether there has been an other-than-temporarydecline in fair value below the amortized cost basis. This evaluation process entails considerable judgment and estimation. Factorsconsidered in this analysis include, but are not limited to, the length of time and the extent to which the fair value has been less thanamortized cost, the issuer’s financial condition and near-term prospects, future economic conditions and market forecasts, interest ratechanges and changes in ratings of the security. An extended and severe unrealized loss position on a fixed maturity may not have anyimpact on: (a) the ability of the issuer to service all scheduled interest and principal payments and (b) the evaluation of recoverabilityof all contractual cash flows or the ability to recover an amount at least equal to its amortized cost based on the present value of theexpected future cash flows to be collected. In contrast, for certain equity securities, we give greater weight and consideration to adecline in market value and the likelihood such market value decline will recover.
When assessing our intent to sell a security or if it is more likely than not we will be required to sell a security before recoveryof its amortized cost basis, we evaluate facts and circumstances such as, but not limited to, decisions to rebalance the investmentportfolio and sales of investments to meet cash flow or capital needs.
We use the following methodology and significant inputs to determine the amount of the OTTI credit loss:
• When determining collectability and the period over which the value is expected to recover for U.S. and foreigncorporate securities, foreign government securities and state and political subdivision securities, we apply the sameconsiderations utilized in our overall impairment evaluation process, which incorporates information regarding thespecific security, the industry and geographic area in which the issuer operates and overall macroeconomic conditions.Projected future cash flows are estimated using assumptions derived from our best estimates of likely scenario-basedoutcomes, after giving consideration to a variety of variables that includes, but is not limited to: general paymentterms of the security; the likelihood that the issuer can service the scheduled interest and principal payments; thequality and amount of any credit enhancements; the security’s position within the capital structure of the issuer;possible corporate restructurings or asset sales by the issuer; and changes to the rating of the security or the issuer byrating agencies.
• Additional considerations are made when assessing the unique features that apply to certain structured securities, suchas subprime, Alt-A, non-agency RMBS, CMBS and ABS. These additional factors for structured securities include,but are not limited to: the quality of underlying collateral; expected prepayment speeds; loan-to-value ratio; debtservice coverage ratios; current and forecasted loss severity; consideration of the payment terms of the underlyingassets backing a particular security; and the payment priority within the tranche structure of the security.
• When determining the amount of the credit loss for U.S. and foreign corporate securities, foreign governmentsecurities and state and political subdivision securities, we consider the estimated fair value as the recovery valuewhen available information does not indicate that another value is more appropriate. When information is identifiedthat indicates a recovery value other than estimated fair value, we consider in the determination of recovery value thesame considerations utilized in its overall impairment evaluation process, which incorporates available information
158
and our best estimate of scenario-based outcomes regarding the specific security and issuer; possible corporaterestructurings or asset sales by the issuer; the quality and amount of any credit enhancements; the security’s positionwithin the capital structure of the issuer; fundamentals of the industry and geographic area in which the security issueroperates; and the overall macroeconomic conditions.
• We perform a discounted cash flow analysis comparing the current amortized cost of a security to the present value offuture cash flows expected to be received, including estimated defaults and prepayments. The discount rate isgenerally the effective interest rate of the fixed maturity prior to impairment.
Mortgage loans on real estate are all commercial mortgage loans. If a mortgage loan is determined to be impaired (i.e., when itis probable that we will be unable to collect all amounts due according to the contractual terms of the loan agreement), thecarrying value of the mortgage loan is reduced to the lower of either the present value of expected cash flows from the loan,discounted at the loan’s original purchase yield, or the fair value of the collateral. For those mortgages that are determined torequire foreclosure, the carrying value is reduced to the fair value of the underlying collateral, net of estimated costs to obtainand sell at the point of foreclosure.
Impairment analysis of the investment portfolio involves considerable judgment, is subject to considerable variability, isestablished using management’s best estimate and is revised as additional information becomes available. As such, changes in,or deviations from, the assumptions used in such analysis can have a significant effect on the results of operations.
For additional information regarding the evaluation process for impairments, see the Investments (excluding ConsolidatedInvestment Entities) Note in our Consolidated Financial Statements in Part II, Item 8. of this Annual Report on Form 10-K.
Income TaxesValuation AllowancesWe use certain assumptions and estimates in determining the income taxes payable or refundable for the current year, thedeferred income tax liabilities and assets for items recognized differently in our Consolidated Financial Statements fromamounts shown on our income tax returns and the federal income tax expense. Determining these amounts requires analysis andinterpretation of current tax laws and regulations, including the loss limitation rules associated with change in control. Weexercise considerable judgment in evaluating the amount and timing of recognition of the resulting income tax liabilities andassets. These judgments and estimates are reevaluated on a periodic basis. We will continue to evaluate as regulatory andbusiness factors change.
Deferred tax assets represent the tax benefit of future deductible temporary differences, net operating loss carryforwards and taxcredit carryforwards. We evaluate and test the recoverability of deferred tax assets. Deferred tax assets are reduced by avaluation allowance if, based on the weight of evidence, it is more likely than not that some portion, or all, of the deferred taxassets will not be realized. Considerable judgment and the use of estimates are required in determining whether a valuationallowance is necessary and, if so, the amount of such valuation allowance. In evaluating the need for a valuation allowance, weconsider many factors, including:
• The nature, frequency and severity of book income or losses in recent years;• The nature and character of the deferred tax assets and liabilities;• The nature and character of income by life and non-life subgroups;• The recent cumulative book income (loss) position after adjustment for permanent differences;• Taxable income in prior carryback years;• Projected future taxable income, exclusive of reversing temporary differences and carryforwards;• Projected future reversals of existing temporary differences;• The length of time carryforwards can be utilized;• Prudent and feasible tax planning strategies we would employ to avoid a tax benefit from expiring unused; and• Tax rules that would impact the utilization of the deferred tax assets.
We have assessed whether it is more likely than not that the deferred tax assets will be realized in the future. In making thisassessment, we considered the available sources of income and positive and negative evidence regarding our ability to generatesufficient taxable income to realize our deferred tax assets, which include net operating loss carryforwards (“NOLs”), capitalloss carryforwards and tax credit carryforwards.
Positive evidence includes a recent history of earnings, projected earnings attributable to our ongoing insurance and investmentbusinesses, plans or the ability to sell certain assets and streams of revenues, plans to reduce future projected losses by reductionof sales of certain products and predictable patterns of loss and income recognition. Negative evidence includes operating losses
159
in certain years in certain life businesses, large losses in the non-life business and the potential unpredictability of certaincomponents of future projected taxable income.
We use judgment in considering the relative impact of negative and positive evidence. The weight given to the potential effectof negative and positive evidence is commensurate with the extent to which it can be objectively verified. The more negativeevidence that exists, (a) the more positive evidence is necessary and (b) the more difficult it is to support a conclusion that avaluation allowance is not needed for some portion of or the entire deferred tax asset.
During the three months ended December 31, 2014, we experienced significant favorable developments, including continuedstrong results of operation of our Ongoing Business, reduction in the ING Group ownership to below 20%, the sale of certainunder-performing businesses via indemnity reinsurance, entry into an Issue Resolution Agreement (“IA”) with the InternalRevenue Service (“IRS”) regarding the Internal Revenue Code (“IRC”) Section 382 event (defined below) calculation andemergence from a cumulative loss to cumulative income in recent years. The IA with the IRS significantly reduced uncertaintyin our ability to use certain losses. During the fourth quarter of 2014, results were positive after excluding losses from items notindicative of future profitability, such as the $107.0 million loss from the sale of certain businesses and a $372.7 million lossfrom the immediate recognition of net actuarial losses related to pension and other postretirement benefit obligations. Thesefacts, coupled with strong full year results and projections of sufficient taxable income, represent significant positive evidence.As of December 31, 2014, the cumulative positive evidence outweighed the negative evidence regarding the likelihood thatcertain of our deferred tax assets for our U.S. consolidated income tax group will be realized. This assessment was evidenced byour consideration of facts and circumstances (as noted above) and resulted in our conclusion that $1.62 billion of the deferredtax asset valuation allowance for our U.S. consolidated income tax group should be released in the fourth quarter of 2014. On ayear-to-date basis, the total decrease in the valuation allowance was $1.83 billion. We determined that deferred tax assets relatedto certain federal and state loss carryforwards, state temporary differences and tax credits were not realizable on a more-likely-than not basis prior to the expiration of their respective carryforward periods. Thus, a corresponding valuation allowanceremains against these deferred tax assets.
In order to demonstrate the predictability and sufficiency of future taxable income necessary to support the recognition of thetemporary differences and NOL carryforwards related to the $1.83 billion valuation release in 2014, we considered our forecastsof future income using comparisons to historical results and actual and planned business and operational changes, whichincluded assumptions about future macroeconomic and Company-specific conditions and events. We also subjected theforecasts to stresses (considering various adverse Company-specific and macroeconomic risks) of key assumptions andeffectiveness of relevant prudent and feasible tax planning strategies. We ultimately limited our projections to amounts thatwere objectively verifiable. Our income forecasts coupled with our tax planning strategies resulted in sufficient taxable incometo achieve realization of certain deferred tax assets (other than amounts for certain federal and state loss carryforwards, statetemporary differences and certain tax credits prior to their expiration).
With the exception for changes in the deferred tax valuation allowance for state taxes, certain credits and for certain capitaldeferred tax assets, there was no change in the deferred tax valuation allowance for the year ended December 31, 2015. Wecontinued to rely on objectively verifiable income and tax planning to support the remaining deferred tax assets. There was nosignificant new evidence in 2015 to warrant a change to the valuation allowance.
As of December 31, 2015, we have recognized $401.6 million deferred tax assets based on tax planning strategies related tounrealized gains on investment assets. These tax planning strategies support recognition of deferred tax assets, which have beenprovided on deductible temporary differences. Future changes, such as interest rate movements, could adversely impact such taxplanning strategies. To the extent unrealized gains decrease or to the extent loss utilization is limited, the tax benefit will likelybe reduced by increasing the tax valuation allowance.
The deferred tax valuation allowance was approximately $1.0 billion as of December 31, 2015 and 2014. Pursuant to U.S.GAAP, we do not specifically identify the valuation allowance with individual categories. However, as of December 31, 2015,and 2014 we estimated that approximately $783 million, was related to federal net operating losses. The remaining balanceswere attributable to various items including state taxes and other deferred tax assets.
160
As of December 31, 2015, we had approximately $3.0 billion of federal net operating loss carryforwards, which expire asfollows (the deferred tax asset and offsetting valuation allowances, if any, are also presented). The life ordinary loss is an SLDI-related loss, which is subject to certain restrictions.
($ in millions)Life
OrdinaryLoss
Non-LifeOrdinary
Losses
LifeCapitalLosses
Non-LifeCapitalLosses
TotalCarryforward
Expiration2017 . . . . . . . . . . . . . . . . . . . . . . . . . . . . . . . . . . . . . . . . . . . . . . . . . . $ — $ (3.2) $— $— $ (3.2)2018 . . . . . . . . . . . . . . . . . . . . . . . . . . . . . . . . . . . . . . . . . . . . . . . . . . — (5.3) — — (5.3)2019 . . . . . . . . . . . . . . . . . . . . . . . . . . . . . . . . . . . . . . . . . . . . . . . . . . — (8.2) — — (8.2)2020 . . . . . . . . . . . . . . . . . . . . . . . . . . . . . . . . . . . . . . . . . . . . . . . . . . — (24.9) — — (24.9)2021 . . . . . . . . . . . . . . . . . . . . . . . . . . . . . . . . . . . . . . . . . . . . . . . . . . — (59.0) — — (59.0)2022 . . . . . . . . . . . . . . . . . . . . . . . . . . . . . . . . . . . . . . . . . . . . . . . . . . — (7.2) — — (7.2)2023 . . . . . . . . . . . . . . . . . . . . . . . . . . . . . . . . . . . . . . . . . . . . . . . . . . — (89.4) — — (89.4)2024 . . . . . . . . . . . . . . . . . . . . . . . . . . . . . . . . . . . . . . . . . . . . . . . . . . — — — — —2025 . . . . . . . . . . . . . . . . . . . . . . . . . . . . . . . . . . . . . . . . . . . . . . . . . . — (510.2) — — (510.2)2026 . . . . . . . . . . . . . . . . . . . . . . . . . . . . . . . . . . . . . . . . . . . . . . . . . . — (355.0) — — (355.0)2027 . . . . . . . . . . . . . . . . . . . . . . . . . . . . . . . . . . . . . . . . . . . . . . . . . . — (168.4) — — (168.4)2028 . . . . . . . . . . . . . . . . . . . . . . . . . . . . . . . . . . . . . . . . . . . . . . . . . . (43.6) (214.2) — — (257.8)2029 . . . . . . . . . . . . . . . . . . . . . . . . . . . . . . . . . . . . . . . . . . . . . . . . . . — (411.5) — — (411.5)2030 . . . . . . . . . . . . . . . . . . . . . . . . . . . . . . . . . . . . . . . . . . . . . . . . . . — (379.2) — — (379.2)2031 . . . . . . . . . . . . . . . . . . . . . . . . . . . . . . . . . . . . . . . . . . . . . . . . . . — (59.4) — — (59.4)2032 . . . . . . . . . . . . . . . . . . . . . . . . . . . . . . . . . . . . . . . . . . . . . . . . . . — (130.7) — — (130.7)2033 . . . . . . . . . . . . . . . . . . . . . . . . . . . . . . . . . . . . . . . . . . . . . . . . . . — (167.0) — — (167.0)2034 . . . . . . . . . . . . . . . . . . . . . . . . . . . . . . . . . . . . . . . . . . . . . . . . . . — (351.1) — — (351.1)2035 . . . . . . . . . . . . . . . . . . . . . . . . . . . . . . . . . . . . . . . . . . . . . . . . . . — (34.7) — — (34.7)
Total losses . . . . . . . . . . . . . . . . . . . . . . . . . . . . . . . . . . . . . . . . . . . . . . . . $(43.6) $(2,978.6) $— $— $(3,022.2)
Gross deferred tax asset . . . . . . . . . . . . . . . . . . . . . . . . . . . . . . . . . . . . . . $ 15.3 $ 1,042.5 $— $— $ 1,057.8Valuation allowance . . . . . . . . . . . . . . . . . . . . . . . . . . . . . . . . . . . . . . . . . 15.3 767.8 — — 783.1
Deferred tax asset on losses . . . . . . . . . . . . . . . . . . . . . . . . . . . . . . . . . . $ — $ 274.7 $— $— $ 274.7
During the three months ended March 31, 2014, we had an ownership change—generally defined as when the ownership of acompany, or its parent, changes by more than 50% (measured by value) on a cumulative basis in any three year period (“Section382 event”). The deferred tax asset and the valuation allowance did not change as a result of the IRC Section 382 event. As partof our participation in the IRS’s Compliance Assurance Process (“CAP”), in December 2014, we entered into an IA with theIRS relating to the IRC Section 382 calculation of the annual limitation on the use of certain of the Company’s federal taxattributes that will apply as a consequence of the Section 382 event. Under the IA, this annual limitation is estimated to be (i) forthe 2014 to 2018 tax years, approximately $520.0 million per year, plus certain capital gains and (ii) for the 2019 andsubsequent tax years, $450.0 million per year. To the extent the annual limitation is not met within any one year, the excess willbe available in subsequent years. The annual limitation under the IA will apply to an amount estimated to be not greater thanapproximately $2.9 billion of the Company’s federal tax attributes related to net operating losses and capital losses andapproximately $270.0 million related to tax credits. As with IAs entered into under the CAP, the matters addressed by the IAmay be revisited by the IRS in connection with a tax audit or other examination or inquiry of the Company’s tax position.
161

Tax Contingencies
In establishing unrecognized tax benefits, we determine whether a tax position is more likely than not to be sustained underexamination by the appropriate taxing authority. We also consider positions which have been reviewed and agreed to as part ofan examination by the appropriate taxing authority. Tax positions that do not meet the more likely than not standard are notrecognized. Tax positions that meet this standard are recognized in our Consolidated Financial Statements. We measure the taxposition as the largest amount of benefit that is greater than 50% likely of being realized upon ultimate resolution with thetaxing authority that has full knowledge of all relevant information.
Changes in Law
Certain changes or future events, such as changes in tax legislation, geographic mix of earnings, completion of tax audits,planning opportunities and expectations about future outcomes could have an impact on our estimates of valuation allowances,deferred taxes, tax provisions and effective tax rates.
For example, a reduction in the corporate tax rate would most likely result in a tax expense based on the fact that, as ofDecember 31, 2015, we have a deferred tax asset. Conversely, an increase in the corporate tax rate would most likely result inan additional tax benefit.
Contingencies
A loss contingency is an existing condition, situation or set of circumstances involving uncertainty as to possible loss that willultimately be resolved when one or more future events occur or fail to occur. Examples of loss contingencies include pending orthreatened adverse litigation, threat of expropriation of assets and actual or possible claims and assessments. Amounts related toloss contingencies involve considerable judgments and are accrued if it is probable that a loss has been incurred and the amountcan be reasonably estimated, based on our best estimate of the ultimate outcome. Reserves are established reflectingmanagement’s best estimate, reviewed on a quarterly basis and revised as additional information becomes available. When aloss contingency is reasonably possible, but not probable, disclosure is made of our best estimate of possible loss, or the rangeof possible loss, or a statement is made that such an estimate cannot be made.
We are involved in threatened or pending lawsuits/arbitrations arising from the normal conduct of business. Due to the climatein insurance and business litigation/arbitration, suits against us sometimes include claims for substantial compensatory,consequential or punitive damages and other types of relief. Moreover, certain claims are asserted as class actions, purporting torepresent a group of similarly situated individuals. It is not always possible to accurately estimate the outcome of such lawsuits/arbitrations. Therefore, changes to such estimates could be material. As facts and circumstances change, our estimates arerevised accordingly. Our reserves reflect management’s best estimate of the ultimate resolution.
Employee Benefits Plans
We sponsor defined benefit pension and other postretirement benefit plans covering eligible employees, sales representativesand other individuals. The net periodic benefit cost and projected benefit obligations are calculated based on assumptions suchas the discount rate, rate of return on plan assets, rate of future compensation increases and health care cost trend rates. Theseassumptions require considerable judgment, are subject to considerable variability and are established using our best estimate.Actual results could vary significantly from assumptions based on changes such as economic and market conditions,demographics of participants in the plans and amendments to benefits provided under the plans. Differences between theexpected return and the actual return on plan assets and other actuarial changes, which could be significant, are immediatelyrecognized in the Consolidated Statements of Operations, generally in the fourth quarter.
162
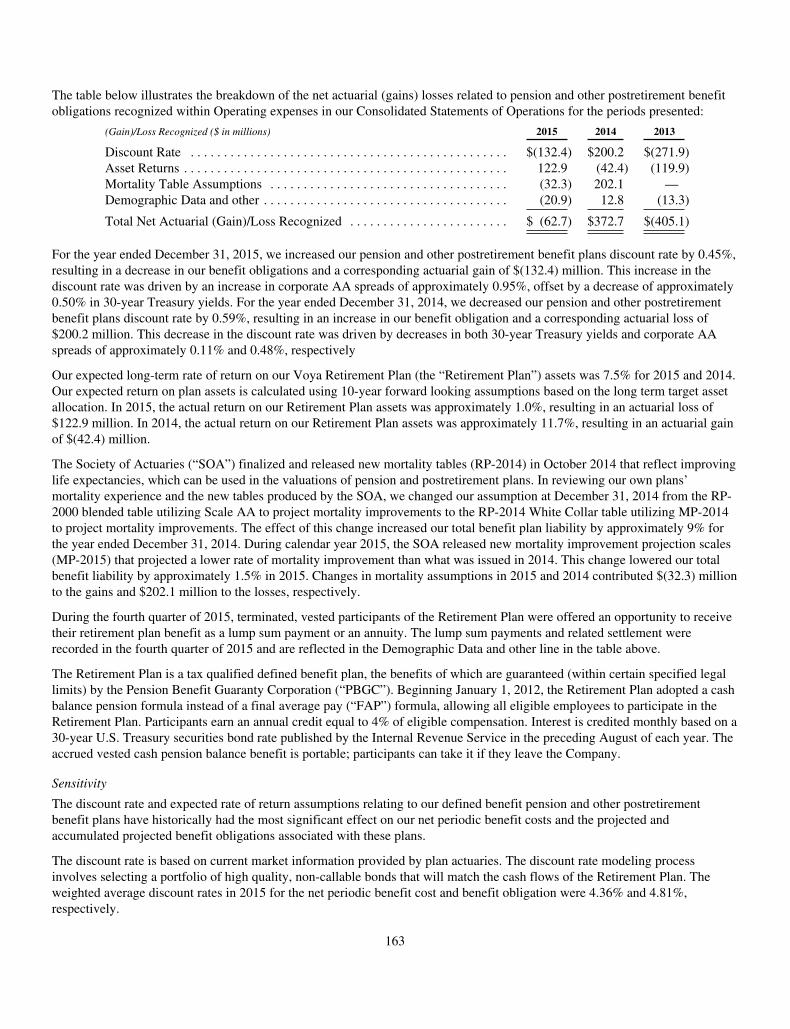
The table below illustrates the breakdown of the net actuarial (gains) losses related to pension and other postretirement benefitobligations recognized within Operating expenses in our Consolidated Statements of Operations for the periods presented:
(Gain)/Loss Recognized ($ in millions) 2015 2014 2013
Discount Rate . . . . . . . . . . . . . . . . . . . . . . . . . . . . . . . . . . . . . . . . . . . . . . . . $(132.4) $200.2 $(271.9)Asset Returns . . . . . . . . . . . . . . . . . . . . . . . . . . . . . . . . . . . . . . . . . . . . . . . . . 122.9 (42.4) (119.9)Mortality Table Assumptions . . . . . . . . . . . . . . . . . . . . . . . . . . . . . . . . . . . . (32.3) 202.1 —Demographic Data and other . . . . . . . . . . . . . . . . . . . . . . . . . . . . . . . . . . . . . (20.9) 12.8 (13.3)
Total Net Actuarial (Gain)/Loss Recognized . . . . . . . . . . . . . . . . . . . . . . . . $ (62.7) $372.7 $(405.1)
For the year ended December 31, 2015, we increased our pension and other postretirement benefit plans discount rate by 0.45%,resulting in a decrease in our benefit obligations and a corresponding actuarial gain of $(132.4) million. This increase in thediscount rate was driven by an increase in corporate AA spreads of approximately 0.95%, offset by a decrease of approximately0.50% in 30-year Treasury yields. For the year ended December 31, 2014, we decreased our pension and other postretirementbenefit plans discount rate by 0.59%, resulting in an increase in our benefit obligation and a corresponding actuarial loss of$200.2 million. This decrease in the discount rate was driven by decreases in both 30-year Treasury yields and corporate AAspreads of approximately 0.11% and 0.48%, respectively
Our expected long-term rate of return on our Voya Retirement Plan (the “Retirement Plan”) assets was 7.5% for 2015 and 2014.Our expected return on plan assets is calculated using 10-year forward looking assumptions based on the long term target assetallocation. In 2015, the actual return on our Retirement Plan assets was approximately 1.0%, resulting in an actuarial loss of$122.9 million. In 2014, the actual return on our Retirement Plan assets was approximately 11.7%, resulting in an actuarial gainof $(42.4) million.
The Society of Actuaries (“SOA”) finalized and released new mortality tables (RP-2014) in October 2014 that reflect improvinglife expectancies, which can be used in the valuations of pension and postretirement plans. In reviewing our own plans’mortality experience and the new tables produced by the SOA, we changed our assumption at December 31, 2014 from the RP-2000 blended table utilizing Scale AA to project mortality improvements to the RP-2014 White Collar table utilizing MP-2014to project mortality improvements. The effect of this change increased our total benefit plan liability by approximately 9% forthe year ended December 31, 2014. During calendar year 2015, the SOA released new mortality improvement projection scales(MP-2015) that projected a lower rate of mortality improvement than what was issued in 2014. This change lowered our totalbenefit liability by approximately 1.5% in 2015. Changes in mortality assumptions in 2015 and 2014 contributed $(32.3) millionto the gains and $202.1 million to the losses, respectively.
During the fourth quarter of 2015, terminated, vested participants of the Retirement Plan were offered an opportunity to receivetheir retirement plan benefit as a lump sum payment or an annuity. The lump sum payments and related settlement wererecorded in the fourth quarter of 2015 and are reflected in the Demographic Data and other line in the table above.
The Retirement Plan is a tax qualified defined benefit plan, the benefits of which are guaranteed (within certain specified legallimits) by the Pension Benefit Guaranty Corporation (“PBGC”). Beginning January 1, 2012, the Retirement Plan adopted a cashbalance pension formula instead of a final average pay (“FAP”) formula, allowing all eligible employees to participate in theRetirement Plan. Participants earn an annual credit equal to 4% of eligible compensation. Interest is credited monthly based on a30-year U.S. Treasury securities bond rate published by the Internal Revenue Service in the preceding August of each year. Theaccrued vested cash pension balance benefit is portable; participants can take it if they leave the Company.
Sensitivity
The discount rate and expected rate of return assumptions relating to our defined benefit pension and other postretirementbenefit plans have historically had the most significant effect on our net periodic benefit costs and the projected andaccumulated projected benefit obligations associated with these plans.
The discount rate is based on current market information provided by plan actuaries. The discount rate modeling processinvolves selecting a portfolio of high quality, non-callable bonds that will match the cash flows of the Retirement Plan. Theweighted average discount rates in 2015 for the net periodic benefit cost and benefit obligation were 4.36% and 4.81%,respectively.
163

As of December 31, 2015, the sensitivities of the effect of a change in the discount rate are as presented below:
($ in millions)
Increase (Decrease) inNet Periodic BenefitCost-Pension Plans(1)
Increase (Decrease) inNet Periodic Benefit Cost-Other
Postretirement Benefits(1)
Increase in discount rate by 100 basis points . . . . . . . . $(240.2) $(1.9)Decrease in discount rate by 100 basis points . . . . . . . . 300.7 2.3
(1) Represents the estimate of actuarial gains (losses) that would be recognized immediately through operating expenses.
($ in millions)Increase (Decrease) in
Pension Benefit Obligation
Increase (Decrease) inAccumulated Postretirement
Benefit Obligation
Increase in discount rate by 100 basis points . . . . . . . $(240.2) $(1.9)Decrease in discount rate by 100 basis points . . . . . . . 300.7 2.3
The expected rate of return considers the asset allocation, historical returns on the types of assets held and current economicenvironment. Based on these factors, we expect that the assets will earn an average percentage per year over the long term. Thisestimation is based on an active return on a compound basis, with a reduction for administrative expenses and manager fees paidto non-affiliated companies from the assets. For estimation purposes, we assume the long-term asset mix will be consistent withthe current mix. Changes in the asset mix could impact the amount of recorded pension income or expense, the funded status ofthe Retirement Plan and the need for future cash contributions.
The expected rate of return for 2015 was 7.5%, net of expenses, for the Retirement Plan. The expected rate of return assumptionis only applicable to the Retirement Plan as assets are not held by any of the other pension and other postretirement plans.
As of December 31, 2015, the effect of a change in the actual rate of return on the net periodic benefit cost is presented in thetable below:
($ in millions)Increase (Decrease) in Net Periodic
Benefit Cost-Pension Plans(1)
Increase in actual rate of return by 100 basis points . . . $(16.3)Decrease in actual rate of return by 100 basis points . . 16.3
(1) Represents the estimate of actuarial gains (losses) that would be recognized immediately through operating expenses.
For more information related to our employee benefit plans, see the Employee Benefit Arrangements Note in our ConsolidatedFinancial Statements in Part II, Item 8. of this Annual Report on Form 10-K.
Impact of New Accounting Pronouncements
For information regarding the impact of new accounting pronouncements, see the Business, Basis of Presentation andSignificant Accounting Policies Note in our Consolidated Financial Statements in Part II, Item 8. of this Annual Report on Form10-K.
164
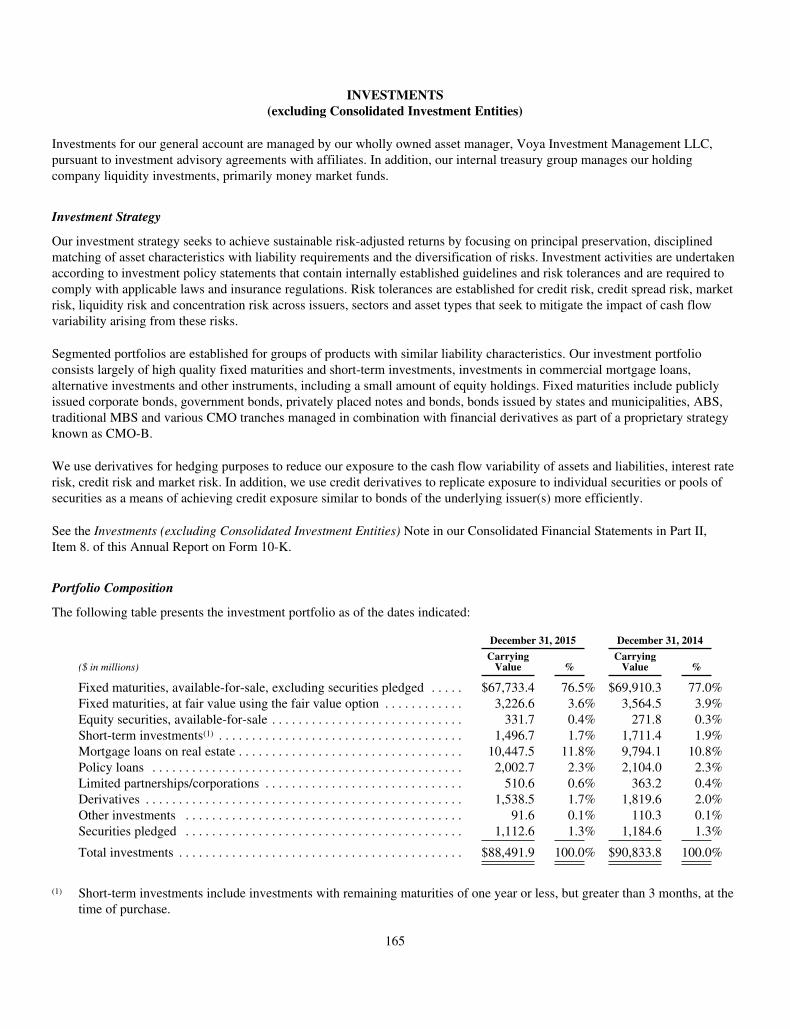
INVESTMENTS(excluding Consolidated Investment Entities)
Investments for our general account are managed by our wholly owned asset manager, Voya Investment Management LLC,pursuant to investment advisory agreements with affiliates. In addition, our internal treasury group manages our holdingcompany liquidity investments, primarily money market funds.
Investment Strategy
Our investment strategy seeks to achieve sustainable risk-adjusted returns by focusing on principal preservation, disciplinedmatching of asset characteristics with liability requirements and the diversification of risks. Investment activities are undertakenaccording to investment policy statements that contain internally established guidelines and risk tolerances and are required tocomply with applicable laws and insurance regulations. Risk tolerances are established for credit risk, credit spread risk, marketrisk, liquidity risk and concentration risk across issuers, sectors and asset types that seek to mitigate the impact of cash flowvariability arising from these risks.
Segmented portfolios are established for groups of products with similar liability characteristics. Our investment portfolioconsists largely of high quality fixed maturities and short-term investments, investments in commercial mortgage loans,alternative investments and other instruments, including a small amount of equity holdings. Fixed maturities include publiclyissued corporate bonds, government bonds, privately placed notes and bonds, bonds issued by states and municipalities, ABS,traditional MBS and various CMO tranches managed in combination with financial derivatives as part of a proprietary strategyknown as CMO-B.
We use derivatives for hedging purposes to reduce our exposure to the cash flow variability of assets and liabilities, interest raterisk, credit risk and market risk. In addition, we use credit derivatives to replicate exposure to individual securities or pools ofsecurities as a means of achieving credit exposure similar to bonds of the underlying issuer(s) more efficiently.
See the Investments (excluding Consolidated Investment Entities) Note in our Consolidated Financial Statements in Part II,Item 8. of this Annual Report on Form 10-K.
Portfolio Composition
The following table presents the investment portfolio as of the dates indicated:
December 31, 2015 December 31, 2014
($ in millions)Carrying
Value %Carrying
Value %
Fixed maturities, available-for-sale, excluding securities pledged . . . . . $67,733.4 76.5% $69,910.3 77.0%Fixed maturities, at fair value using the fair value option . . . . . . . . . . . . 3,226.6 3.6% 3,564.5 3.9%Equity securities, available-for-sale . . . . . . . . . . . . . . . . . . . . . . . . . . . . . 331.7 0.4% 271.8 0.3%Short-term investments(1) . . . . . . . . . . . . . . . . . . . . . . . . . . . . . . . . . . . . . 1,496.7 1.7% 1,711.4 1.9%Mortgage loans on real estate . . . . . . . . . . . . . . . . . . . . . . . . . . . . . . . . . . 10,447.5 11.8% 9,794.1 10.8%Policy loans . . . . . . . . . . . . . . . . . . . . . . . . . . . . . . . . . . . . . . . . . . . . . . . 2,002.7 2.3% 2,104.0 2.3%Limited partnerships/corporations . . . . . . . . . . . . . . . . . . . . . . . . . . . . . . 510.6 0.6% 363.2 0.4%Derivatives . . . . . . . . . . . . . . . . . . . . . . . . . . . . . . . . . . . . . . . . . . . . . . . . 1,538.5 1.7% 1,819.6 2.0%Other investments . . . . . . . . . . . . . . . . . . . . . . . . . . . . . . . . . . . . . . . . . . 91.6 0.1% 110.3 0.1%Securities pledged . . . . . . . . . . . . . . . . . . . . . . . . . . . . . . . . . . . . . . . . . . 1,112.6 1.3% 1,184.6 1.3%
Total investments . . . . . . . . . . . . . . . . . . . . . . . . . . . . . . . . . . . . . . . . . . . $88,491.9 100.0% $90,833.8 100.0%
(1) Short-term investments include investments with remaining maturities of one year or less, but greater than 3 months, at thetime of purchase.
165
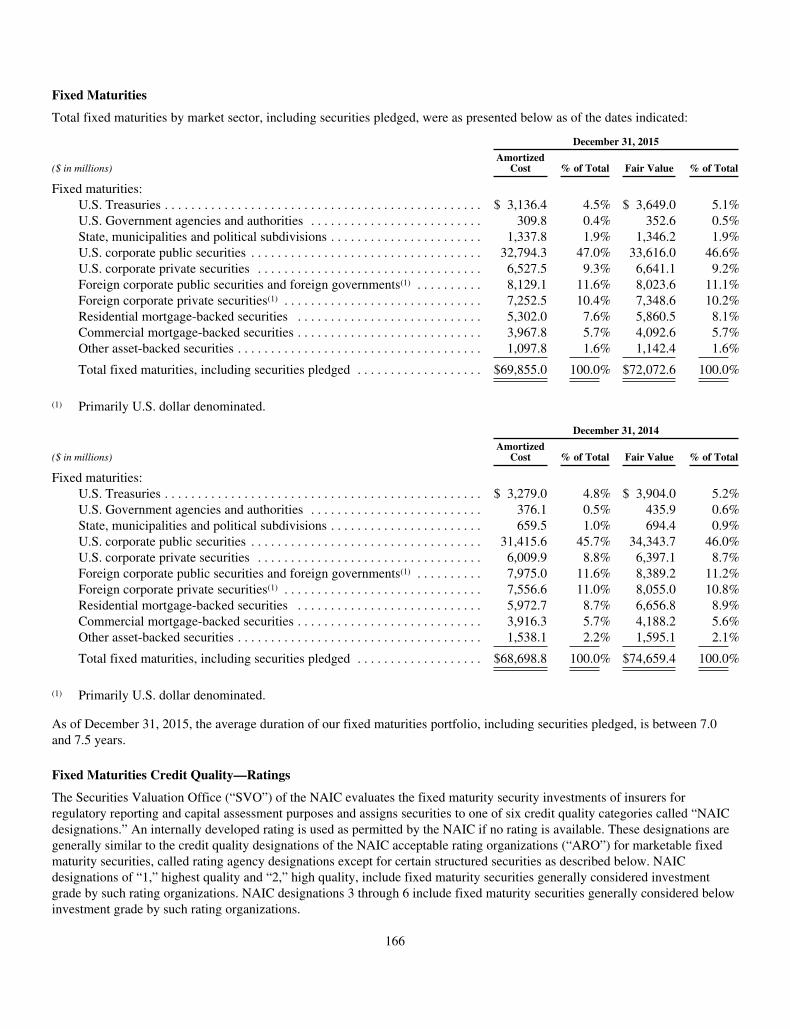
Fixed Maturities
Total fixed maturities by market sector, including securities pledged, were as presented below as of the dates indicated:
December 31, 2015
($ in millions)Amortized
Cost % of Total Fair Value % of Total
Fixed maturities:U.S. Treasuries . . . . . . . . . . . . . . . . . . . . . . . . . . . . . . . . . . . . . . . . . . . . . . . . $ 3,136.4 4.5% $ 3,649.0 5.1%U.S. Government agencies and authorities . . . . . . . . . . . . . . . . . . . . . . . . . . 309.8 0.4% 352.6 0.5%State, municipalities and political subdivisions . . . . . . . . . . . . . . . . . . . . . . . 1,337.8 1.9% 1,346.2 1.9%U.S. corporate public securities . . . . . . . . . . . . . . . . . . . . . . . . . . . . . . . . . . . 32,794.3 47.0% 33,616.0 46.6%U.S. corporate private securities . . . . . . . . . . . . . . . . . . . . . . . . . . . . . . . . . . 6,527.5 9.3% 6,641.1 9.2%Foreign corporate public securities and foreign governments(1) . . . . . . . . . . 8,129.1 11.6% 8,023.6 11.1%Foreign corporate private securities(1) . . . . . . . . . . . . . . . . . . . . . . . . . . . . . . 7,252.5 10.4% 7,348.6 10.2%Residential mortgage-backed securities . . . . . . . . . . . . . . . . . . . . . . . . . . . . 5,302.0 7.6% 5,860.5 8.1%Commercial mortgage-backed securities . . . . . . . . . . . . . . . . . . . . . . . . . . . . 3,967.8 5.7% 4,092.6 5.7%Other asset-backed securities . . . . . . . . . . . . . . . . . . . . . . . . . . . . . . . . . . . . . 1,097.8 1.6% 1,142.4 1.6%
Total fixed maturities, including securities pledged . . . . . . . . . . . . . . . . . . . $69,855.0 100.0% $72,072.6 100.0%
(1) Primarily U.S. dollar denominated.
December 31, 2014
($ in millions)Amortized
Cost % of Total Fair Value % of Total
Fixed maturities:U.S. Treasuries . . . . . . . . . . . . . . . . . . . . . . . . . . . . . . . . . . . . . . . . . . . . . . . . $ 3,279.0 4.8% $ 3,904.0 5.2%U.S. Government agencies and authorities . . . . . . . . . . . . . . . . . . . . . . . . . . 376.1 0.5% 435.9 0.6%State, municipalities and political subdivisions . . . . . . . . . . . . . . . . . . . . . . . 659.5 1.0% 694.4 0.9%U.S. corporate public securities . . . . . . . . . . . . . . . . . . . . . . . . . . . . . . . . . . . 31,415.6 45.7% 34,343.7 46.0%U.S. corporate private securities . . . . . . . . . . . . . . . . . . . . . . . . . . . . . . . . . . 6,009.9 8.8% 6,397.1 8.7%Foreign corporate public securities and foreign governments(1) . . . . . . . . . . 7,975.0 11.6% 8,389.2 11.2%Foreign corporate private securities(1) . . . . . . . . . . . . . . . . . . . . . . . . . . . . . . 7,556.6 11.0% 8,055.0 10.8%Residential mortgage-backed securities . . . . . . . . . . . . . . . . . . . . . . . . . . . . 5,972.7 8.7% 6,656.8 8.9%Commercial mortgage-backed securities . . . . . . . . . . . . . . . . . . . . . . . . . . . . 3,916.3 5.7% 4,188.2 5.6%Other asset-backed securities . . . . . . . . . . . . . . . . . . . . . . . . . . . . . . . . . . . . . 1,538.1 2.2% 1,595.1 2.1%
Total fixed maturities, including securities pledged . . . . . . . . . . . . . . . . . . . $68,698.8 100.0% $74,659.4 100.0%
(1) Primarily U.S. dollar denominated.
As of December 31, 2015, the average duration of our fixed maturities portfolio, including securities pledged, is between 7.0and 7.5 years.
Fixed Maturities Credit Quality—Ratings
The Securities Valuation Office (“SVO”) of the NAIC evaluates the fixed maturity security investments of insurers forregulatory reporting and capital assessment purposes and assigns securities to one of six credit quality categories called “NAICdesignations.” An internally developed rating is used as permitted by the NAIC if no rating is available. These designations aregenerally similar to the credit quality designations of the NAIC acceptable rating organizations (“ARO”) for marketable fixedmaturity securities, called rating agency designations except for certain structured securities as described below. NAICdesignations of “1,” highest quality and “2,” high quality, include fixed maturity securities generally considered investmentgrade by such rating organizations. NAIC designations 3 through 6 include fixed maturity securities generally considered belowinvestment grade by such rating organizations.
166
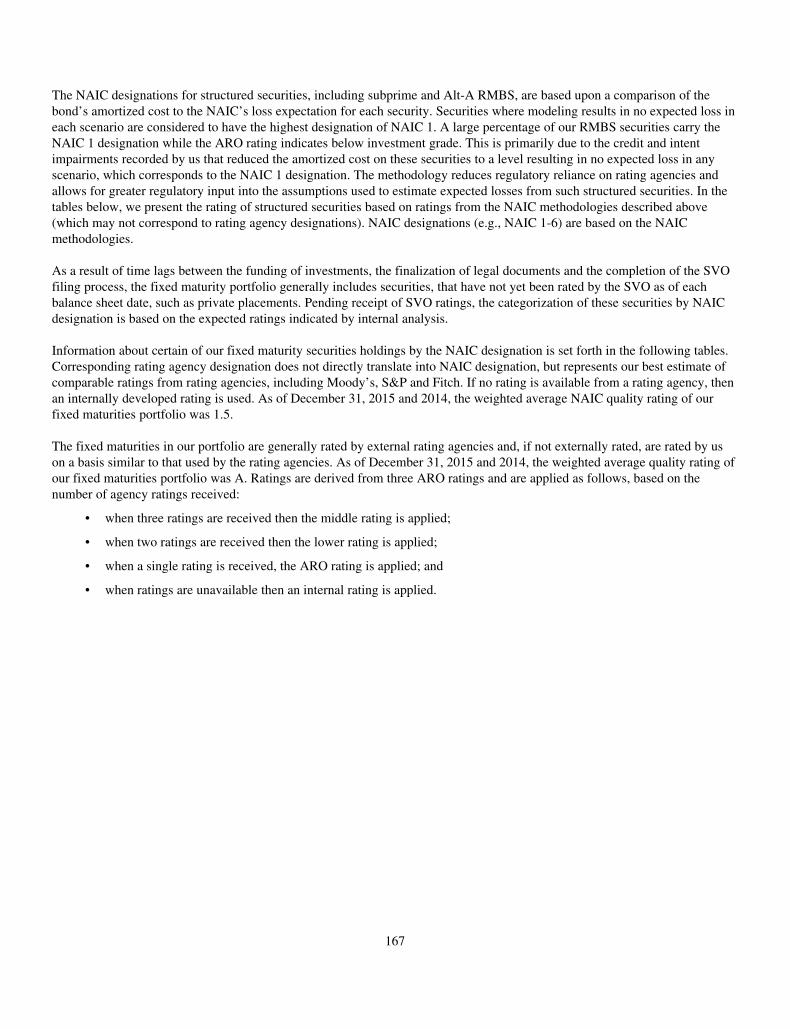
The NAIC designations for structured securities, including subprime and Alt-A RMBS, are based upon a comparison of thebond’s amortized cost to the NAIC’s loss expectation for each security. Securities where modeling results in no expected loss ineach scenario are considered to have the highest designation of NAIC 1. A large percentage of our RMBS securities carry theNAIC 1 designation while the ARO rating indicates below investment grade. This is primarily due to the credit and intentimpairments recorded by us that reduced the amortized cost on these securities to a level resulting in no expected loss in anyscenario, which corresponds to the NAIC 1 designation. The methodology reduces regulatory reliance on rating agencies andallows for greater regulatory input into the assumptions used to estimate expected losses from such structured securities. In thetables below, we present the rating of structured securities based on ratings from the NAIC methodologies described above(which may not correspond to rating agency designations). NAIC designations (e.g., NAIC 1-6) are based on the NAICmethodologies.
As a result of time lags between the funding of investments, the finalization of legal documents and the completion of the SVOfiling process, the fixed maturity portfolio generally includes securities, that have not yet been rated by the SVO as of eachbalance sheet date, such as private placements. Pending receipt of SVO ratings, the categorization of these securities by NAICdesignation is based on the expected ratings indicated by internal analysis.
Information about certain of our fixed maturity securities holdings by the NAIC designation is set forth in the following tables.Corresponding rating agency designation does not directly translate into NAIC designation, but represents our best estimate ofcomparable ratings from rating agencies, including Moody’s, S&P and Fitch. If no rating is available from a rating agency, thenan internally developed rating is used. As of December 31, 2015 and 2014, the weighted average NAIC quality rating of ourfixed maturities portfolio was 1.5.
The fixed maturities in our portfolio are generally rated by external rating agencies and, if not externally rated, are rated by uson a basis similar to that used by the rating agencies. As of December 31, 2015 and 2014, the weighted average quality rating ofour fixed maturities portfolio was A. Ratings are derived from three ARO ratings and are applied as follows, based on thenumber of agency ratings received:
• when three ratings are received then the middle rating is applied;
• when two ratings are received then the lower rating is applied;
• when a single rating is received, the ARO rating is applied; and
• when ratings are unavailable then an internal rating is applied.
167
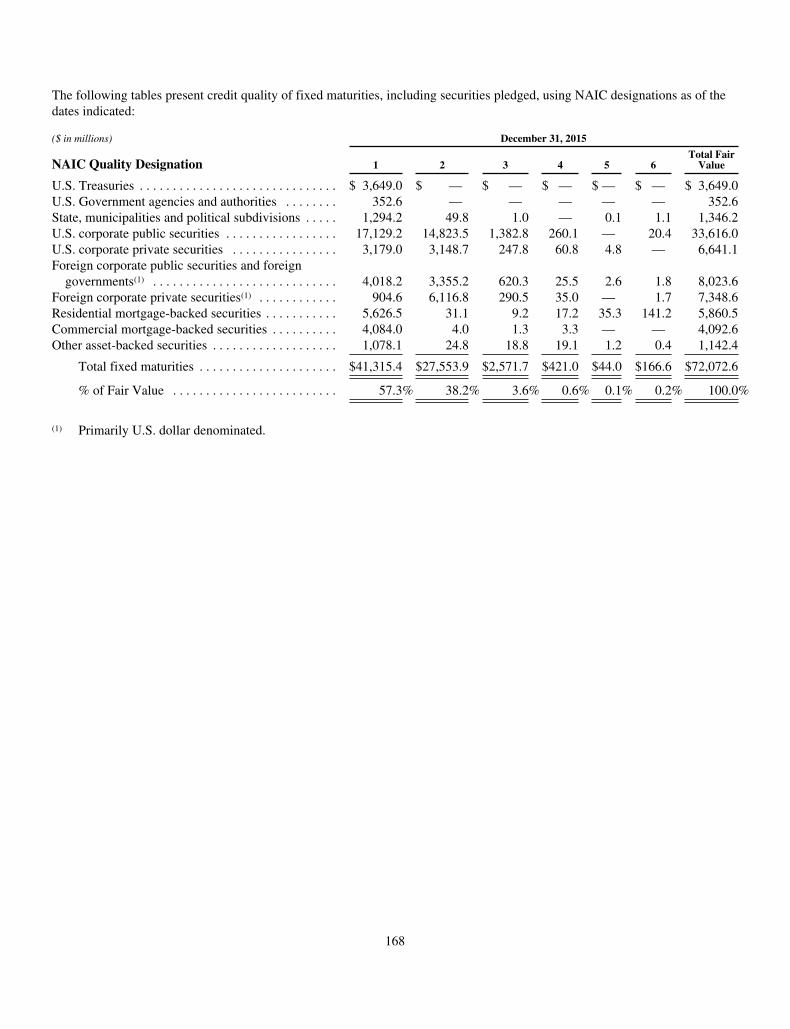
The following tables present credit quality of fixed maturities, including securities pledged, using NAIC designations as of thedates indicated:
($ in millions) December 31, 2015
NAIC Quality Designation 1 2 3 4 5 6Total Fair
Value
U.S. Treasuries . . . . . . . . . . . . . . . . . . . . . . . . . . . . . . $ 3,649.0 $ — $ — $ — $ — $ — $ 3,649.0U.S. Government agencies and authorities . . . . . . . . 352.6 — — — — — 352.6State, municipalities and political subdivisions . . . . . 1,294.2 49.8 1.0 — 0.1 1.1 1,346.2U.S. corporate public securities . . . . . . . . . . . . . . . . . 17,129.2 14,823.5 1,382.8 260.1 — 20.4 33,616.0U.S. corporate private securities . . . . . . . . . . . . . . . . 3,179.0 3,148.7 247.8 60.8 4.8 — 6,641.1Foreign corporate public securities and foreign
governments(1) . . . . . . . . . . . . . . . . . . . . . . . . . . . . 4,018.2 3,355.2 620.3 25.5 2.6 1.8 8,023.6Foreign corporate private securities(1) . . . . . . . . . . . . 904.6 6,116.8 290.5 35.0 — 1.7 7,348.6Residential mortgage-backed securities . . . . . . . . . . . 5,626.5 31.1 9.2 17.2 35.3 141.2 5,860.5Commercial mortgage-backed securities . . . . . . . . . . 4,084.0 4.0 1.3 3.3 — — 4,092.6Other asset-backed securities . . . . . . . . . . . . . . . . . . . 1,078.1 24.8 18.8 19.1 1.2 0.4 1,142.4
Total fixed maturities . . . . . . . . . . . . . . . . . . . . . $41,315.4 $27,553.9 $2,571.7 $421.0 $44.0 $166.6 $72,072.6
% of Fair Value . . . . . . . . . . . . . . . . . . . . . . . . . 57.3% 38.2% 3.6% 0.6% 0.1% 0.2% 100.0%
(1) Primarily U.S. dollar denominated.
168
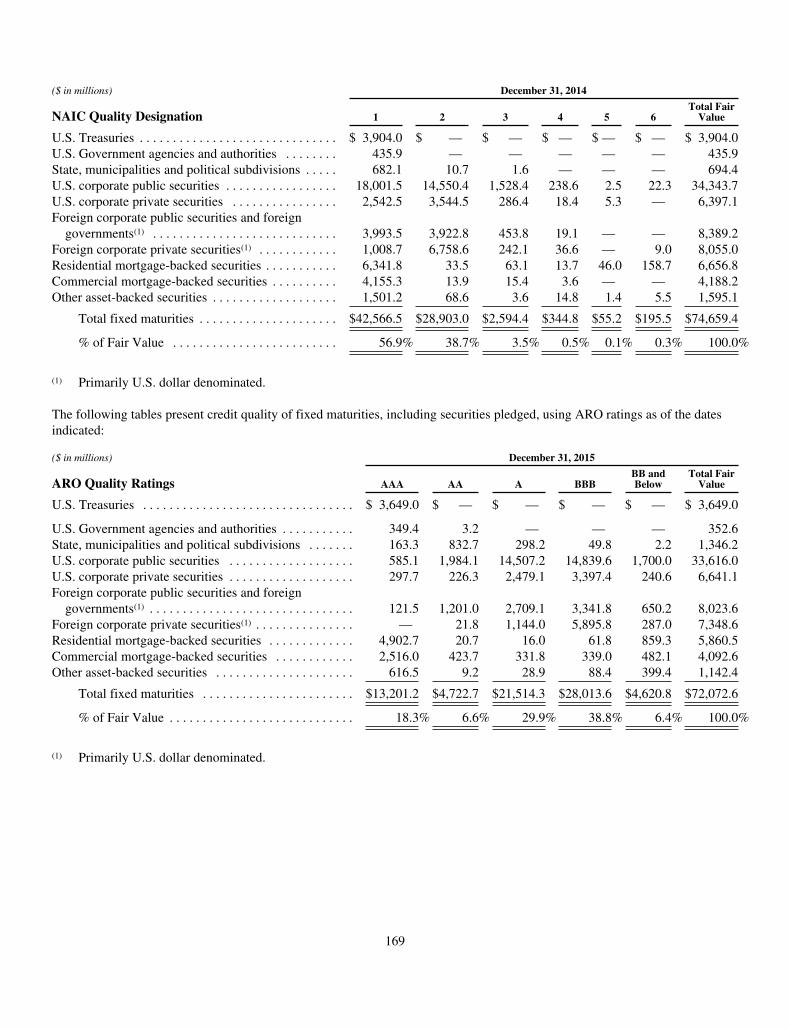
($ in millions) December 31, 2014
NAIC Quality Designation 1 2 3 4 5 6Total Fair
Value
U.S. Treasuries . . . . . . . . . . . . . . . . . . . . . . . . . . . . . . $ 3,904.0 $ — $ — $ — $ — $ — $ 3,904.0U.S. Government agencies and authorities . . . . . . . . 435.9 — — — — — 435.9State, municipalities and political subdivisions . . . . . 682.1 10.7 1.6 — — — 694.4U.S. corporate public securities . . . . . . . . . . . . . . . . . 18,001.5 14,550.4 1,528.4 238.6 2.5 22.3 34,343.7U.S. corporate private securities . . . . . . . . . . . . . . . . 2,542.5 3,544.5 286.4 18.4 5.3 — 6,397.1Foreign corporate public securities and foreign
governments(1) . . . . . . . . . . . . . . . . . . . . . . . . . . . . 3,993.5 3,922.8 453.8 19.1 — — 8,389.2Foreign corporate private securities(1) . . . . . . . . . . . . 1,008.7 6,758.6 242.1 36.6 — 9.0 8,055.0Residential mortgage-backed securities . . . . . . . . . . . 6,341.8 33.5 63.1 13.7 46.0 158.7 6,656.8Commercial mortgage-backed securities . . . . . . . . . . 4,155.3 13.9 15.4 3.6 — — 4,188.2Other asset-backed securities . . . . . . . . . . . . . . . . . . . 1,501.2 68.6 3.6 14.8 1.4 5.5 1,595.1
Total fixed maturities . . . . . . . . . . . . . . . . . . . . . $42,566.5 $28,903.0 $2,594.4 $344.8 $55.2 $195.5 $74,659.4
% of Fair Value . . . . . . . . . . . . . . . . . . . . . . . . . 56.9% 38.7% 3.5% 0.5% 0.1% 0.3% 100.0%
(1) Primarily U.S. dollar denominated.
The following tables present credit quality of fixed maturities, including securities pledged, using ARO ratings as of the datesindicated:
($ in millions) December 31, 2015
ARO Quality Ratings AAA AA A BBBBB andBelow
Total FairValue
U.S. Treasuries . . . . . . . . . . . . . . . . . . . . . . . . . . . . . . . . $ 3,649.0 $ — $ — $ — $ — $ 3,649.0
U.S. Government agencies and authorities . . . . . . . . . . . 349.4 3.2 — — — 352.6State, municipalities and political subdivisions . . . . . . . 163.3 832.7 298.2 49.8 2.2 1,346.2U.S. corporate public securities . . . . . . . . . . . . . . . . . . . 585.1 1,984.1 14,507.2 14,839.6 1,700.0 33,616.0U.S. corporate private securities . . . . . . . . . . . . . . . . . . . 297.7 226.3 2,479.1 3,397.4 240.6 6,641.1Foreign corporate public securities and foreign
governments(1) . . . . . . . . . . . . . . . . . . . . . . . . . . . . . . . 121.5 1,201.0 2,709.1 3,341.8 650.2 8,023.6Foreign corporate private securities(1) . . . . . . . . . . . . . . . — 21.8 1,144.0 5,895.8 287.0 7,348.6Residential mortgage-backed securities . . . . . . . . . . . . . 4,902.7 20.7 16.0 61.8 859.3 5,860.5Commercial mortgage-backed securities . . . . . . . . . . . . 2,516.0 423.7 331.8 339.0 482.1 4,092.6Other asset-backed securities . . . . . . . . . . . . . . . . . . . . . 616.5 9.2 28.9 88.4 399.4 1,142.4
Total fixed maturities . . . . . . . . . . . . . . . . . . . . . . . $13,201.2 $4,722.7 $21,514.3 $28,013.6 $4,620.8 $72,072.6
% of Fair Value . . . . . . . . . . . . . . . . . . . . . . . . . . . . 18.3% 6.6% 29.9% 38.8% 6.4% 100.0%
(1) Primarily U.S. dollar denominated.
169
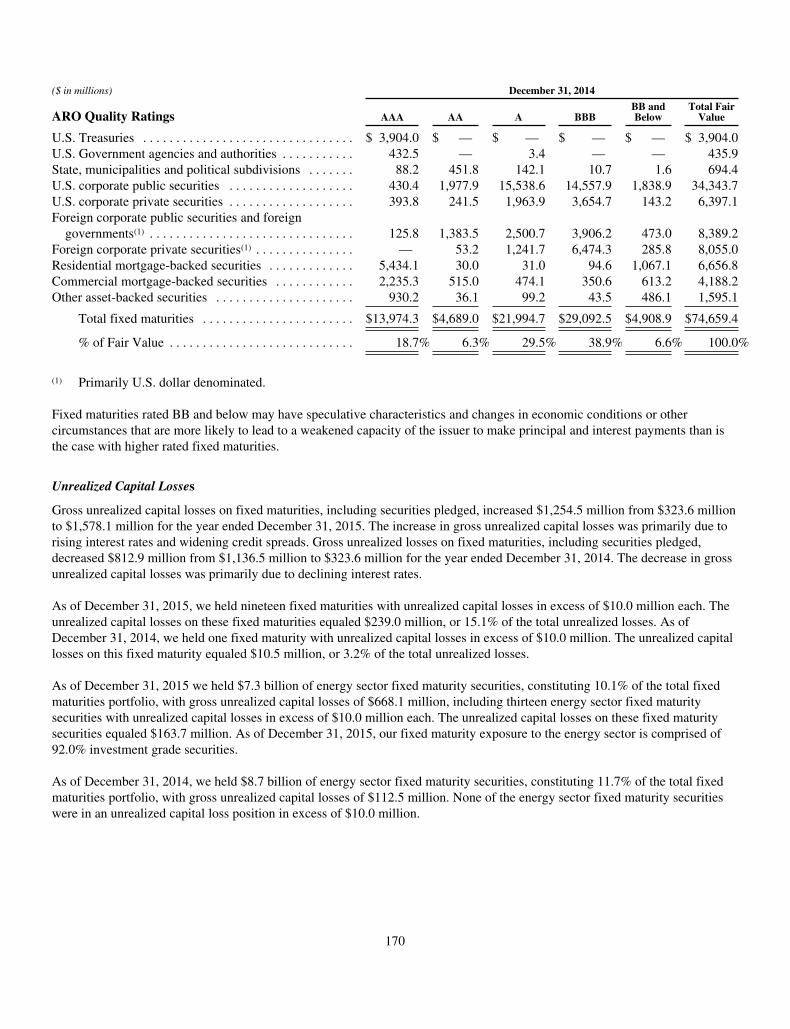
($ in millions) December 31, 2014
ARO Quality Ratings AAA AA A BBBBB andBelow
Total FairValue
U.S. Treasuries . . . . . . . . . . . . . . . . . . . . . . . . . . . . . . . . $ 3,904.0 $ — $ — $ — $ — $ 3,904.0U.S. Government agencies and authorities . . . . . . . . . . . 432.5 — 3.4 — — 435.9State, municipalities and political subdivisions . . . . . . . 88.2 451.8 142.1 10.7 1.6 694.4U.S. corporate public securities . . . . . . . . . . . . . . . . . . . 430.4 1,977.9 15,538.6 14,557.9 1,838.9 34,343.7U.S. corporate private securities . . . . . . . . . . . . . . . . . . . 393.8 241.5 1,963.9 3,654.7 143.2 6,397.1Foreign corporate public securities and foreign
governments(1) . . . . . . . . . . . . . . . . . . . . . . . . . . . . . . . 125.8 1,383.5 2,500.7 3,906.2 473.0 8,389.2Foreign corporate private securities(1) . . . . . . . . . . . . . . . — 53.2 1,241.7 6,474.3 285.8 8,055.0Residential mortgage-backed securities . . . . . . . . . . . . . 5,434.1 30.0 31.0 94.6 1,067.1 6,656.8Commercial mortgage-backed securities . . . . . . . . . . . . 2,235.3 515.0 474.1 350.6 613.2 4,188.2Other asset-backed securities . . . . . . . . . . . . . . . . . . . . . 930.2 36.1 99.2 43.5 486.1 1,595.1
Total fixed maturities . . . . . . . . . . . . . . . . . . . . . . . $13,974.3 $4,689.0 $21,994.7 $29,092.5 $4,908.9 $74,659.4
% of Fair Value . . . . . . . . . . . . . . . . . . . . . . . . . . . . 18.7% 6.3% 29.5% 38.9% 6.6% 100.0%
(1) Primarily U.S. dollar denominated.
Fixed maturities rated BB and below may have speculative characteristics and changes in economic conditions or othercircumstances that are more likely to lead to a weakened capacity of the issuer to make principal and interest payments than isthe case with higher rated fixed maturities.
Unrealized Capital Losses
Gross unrealized capital losses on fixed maturities, including securities pledged, increased $1,254.5 million from $323.6 millionto $1,578.1 million for the year ended December 31, 2015. The increase in gross unrealized capital losses was primarily due torising interest rates and widening credit spreads. Gross unrealized losses on fixed maturities, including securities pledged,decreased $812.9 million from $1,136.5 million to $323.6 million for the year ended December 31, 2014. The decrease in grossunrealized capital losses was primarily due to declining interest rates.
As of December 31, 2015, we held nineteen fixed maturities with unrealized capital losses in excess of $10.0 million each. Theunrealized capital losses on these fixed maturities equaled $239.0 million, or 15.1% of the total unrealized losses. As ofDecember 31, 2014, we held one fixed maturity with unrealized capital losses in excess of $10.0 million. The unrealized capitallosses on this fixed maturity equaled $10.5 million, or 3.2% of the total unrealized losses.
As of December 31, 2015 we held $7.3 billion of energy sector fixed maturity securities, constituting 10.1% of the total fixedmaturities portfolio, with gross unrealized capital losses of $668.1 million, including thirteen energy sector fixed maturitysecurities with unrealized capital losses in excess of $10.0 million each. The unrealized capital losses on these fixed maturitysecurities equaled $163.7 million. As of December 31, 2015, our fixed maturity exposure to the energy sector is comprised of92.0% investment grade securities.
As of December 31, 2014, we held $8.7 billion of energy sector fixed maturity securities, constituting 11.7% of the total fixedmaturities portfolio, with gross unrealized capital losses of $112.5 million. None of the energy sector fixed maturity securitieswere in an unrealized capital loss position in excess of $10.0 million.
170
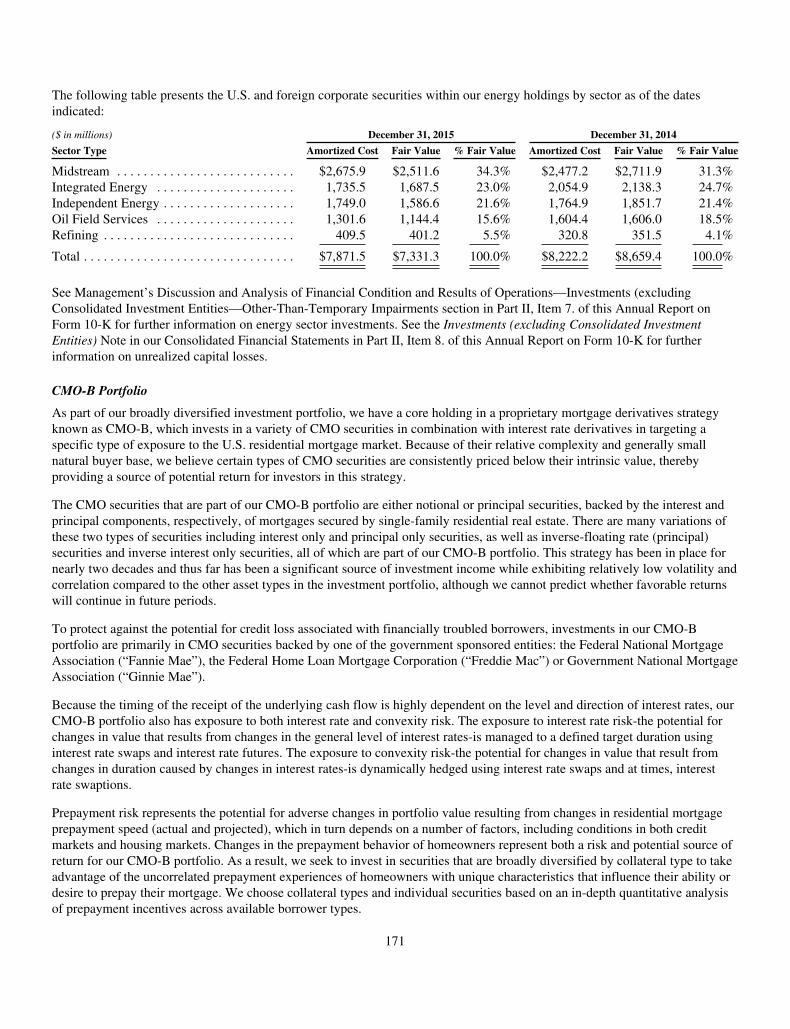
The following table presents the U.S. and foreign corporate securities within our energy holdings by sector as of the datesindicated:
($ in millions) December 31, 2015 December 31, 2014
Sector Type Amortized Cost Fair Value % Fair Value Amortized Cost Fair Value % Fair Value
Midstream . . . . . . . . . . . . . . . . . . . . . . . . . . . $2,675.9 $2,511.6 34.3% $2,477.2 $2,711.9 31.3%Integrated Energy . . . . . . . . . . . . . . . . . . . . . 1,735.5 1,687.5 23.0% 2,054.9 2,138.3 24.7%Independent Energy . . . . . . . . . . . . . . . . . . . . 1,749.0 1,586.6 21.6% 1,764.9 1,851.7 21.4%Oil Field Services . . . . . . . . . . . . . . . . . . . . . 1,301.6 1,144.4 15.6% 1,604.4 1,606.0 18.5%Refining . . . . . . . . . . . . . . . . . . . . . . . . . . . . . 409.5 401.2 5.5% 320.8 351.5 4.1%
Total . . . . . . . . . . . . . . . . . . . . . . . . . . . . . . . . $7,871.5 $7,331.3 100.0% $8,222.2 $8,659.4 100.0%
See Management’s Discussion and Analysis of Financial Condition and Results of Operations—Investments (excludingConsolidated Investment Entities—Other-Than-Temporary Impairments section in Part II, Item 7. of this Annual Report onForm 10-K for further information on energy sector investments. See the Investments (excluding Consolidated InvestmentEntities) Note in our Consolidated Financial Statements in Part II, Item 8. of this Annual Report on Form 10-K for furtherinformation on unrealized capital losses.
CMO-B Portfolio
As part of our broadly diversified investment portfolio, we have a core holding in a proprietary mortgage derivatives strategyknown as CMO-B, which invests in a variety of CMO securities in combination with interest rate derivatives in targeting aspecific type of exposure to the U.S. residential mortgage market. Because of their relative complexity and generally smallnatural buyer base, we believe certain types of CMO securities are consistently priced below their intrinsic value, therebyproviding a source of potential return for investors in this strategy.
The CMO securities that are part of our CMO-B portfolio are either notional or principal securities, backed by the interest andprincipal components, respectively, of mortgages secured by single-family residential real estate. There are many variations ofthese two types of securities including interest only and principal only securities, as well as inverse-floating rate (principal)securities and inverse interest only securities, all of which are part of our CMO-B portfolio. This strategy has been in place fornearly two decades and thus far has been a significant source of investment income while exhibiting relatively low volatility andcorrelation compared to the other asset types in the investment portfolio, although we cannot predict whether favorable returnswill continue in future periods.
To protect against the potential for credit loss associated with financially troubled borrowers, investments in our CMO-Bportfolio are primarily in CMO securities backed by one of the government sponsored entities: the Federal National MortgageAssociation (“Fannie Mae”), the Federal Home Loan Mortgage Corporation (“Freddie Mac”) or Government National MortgageAssociation (“Ginnie Mae”).
Because the timing of the receipt of the underlying cash flow is highly dependent on the level and direction of interest rates, ourCMO-B portfolio also has exposure to both interest rate and convexity risk. The exposure to interest rate risk-the potential forchanges in value that results from changes in the general level of interest rates-is managed to a defined target duration usinginterest rate swaps and interest rate futures. The exposure to convexity risk-the potential for changes in value that result fromchanges in duration caused by changes in interest rates-is dynamically hedged using interest rate swaps and at times, interestrate swaptions.
Prepayment risk represents the potential for adverse changes in portfolio value resulting from changes in residential mortgageprepayment speed (actual and projected), which in turn depends on a number of factors, including conditions in both creditmarkets and housing markets. Changes in the prepayment behavior of homeowners represent both a risk and potential source ofreturn for our CMO-B portfolio. As a result, we seek to invest in securities that are broadly diversified by collateral type to takeadvantage of the uncorrelated prepayment experiences of homeowners with unique characteristics that influence their ability ordesire to prepay their mortgage. We choose collateral types and individual securities based on an in-depth quantitative analysisof prepayment incentives across available borrower types.
171
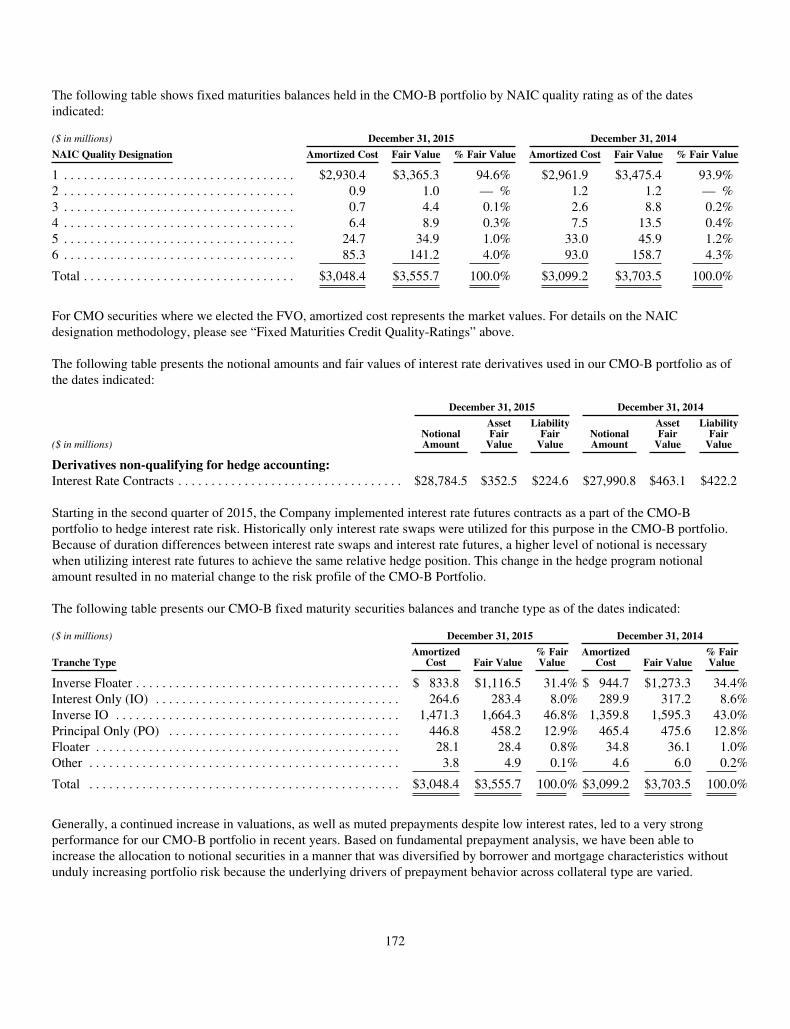
The following table shows fixed maturities balances held in the CMO-B portfolio by NAIC quality rating as of the datesindicated:
($ in millions) December 31, 2015 December 31, 2014
NAIC Quality Designation Amortized Cost Fair Value % Fair Value Amortized Cost Fair Value % Fair Value
1 . . . . . . . . . . . . . . . . . . . . . . . . . . . . . . . . . . . $2,930.4 $3,365.3 94.6% $2,961.9 $3,475.4 93.9%2 . . . . . . . . . . . . . . . . . . . . . . . . . . . . . . . . . . . 0.9 1.0 — % 1.2 1.2 — %3 . . . . . . . . . . . . . . . . . . . . . . . . . . . . . . . . . . . 0.7 4.4 0.1% 2.6 8.8 0.2%4 . . . . . . . . . . . . . . . . . . . . . . . . . . . . . . . . . . . 6.4 8.9 0.3% 7.5 13.5 0.4%5 . . . . . . . . . . . . . . . . . . . . . . . . . . . . . . . . . . . 24.7 34.9 1.0% 33.0 45.9 1.2%6 . . . . . . . . . . . . . . . . . . . . . . . . . . . . . . . . . . . 85.3 141.2 4.0% 93.0 158.7 4.3%
Total . . . . . . . . . . . . . . . . . . . . . . . . . . . . . . . . $3,048.4 $3,555.7 100.0% $3,099.2 $3,703.5 100.0%
For CMO securities where we elected the FVO, amortized cost represents the market values. For details on the NAICdesignation methodology, please see “Fixed Maturities Credit Quality-Ratings” above.
The following table presents the notional amounts and fair values of interest rate derivatives used in our CMO-B portfolio as ofthe dates indicated:
December 31, 2015 December 31, 2014
($ in millions)NotionalAmount
AssetFair
Value
LiabilityFair
ValueNotionalAmount
AssetFair
Value
LiabilityFair
Value
Derivatives non-qualifying for hedge accounting:Interest Rate Contracts . . . . . . . . . . . . . . . . . . . . . . . . . . . . . . . . . . $28,784.5 $352.5 $224.6 $27,990.8 $463.1 $422.2
Starting in the second quarter of 2015, the Company implemented interest rate futures contracts as a part of the CMO-Bportfolio to hedge interest rate risk. Historically only interest rate swaps were utilized for this purpose in the CMO-B portfolio.Because of duration differences between interest rate swaps and interest rate futures, a higher level of notional is necessarywhen utilizing interest rate futures to achieve the same relative hedge position. This change in the hedge program notionalamount resulted in no material change to the risk profile of the CMO-B Portfolio.
The following table presents our CMO-B fixed maturity securities balances and tranche type as of the dates indicated:
($ in millions) December 31, 2015 December 31, 2014
Tranche TypeAmortized
Cost Fair Value% FairValue
AmortizedCost Fair Value
% FairValue
Inverse Floater . . . . . . . . . . . . . . . . . . . . . . . . . . . . . . . . . . . . . . . . $ 833.8 $1,116.5 31.4% $ 944.7 $1,273.3 34.4%Interest Only (IO) . . . . . . . . . . . . . . . . . . . . . . . . . . . . . . . . . . . . . 264.6 283.4 8.0% 289.9 317.2 8.6%Inverse IO . . . . . . . . . . . . . . . . . . . . . . . . . . . . . . . . . . . . . . . . . . . 1,471.3 1,664.3 46.8% 1,359.8 1,595.3 43.0%Principal Only (PO) . . . . . . . . . . . . . . . . . . . . . . . . . . . . . . . . . . . 446.8 458.2 12.9% 465.4 475.6 12.8%Floater . . . . . . . . . . . . . . . . . . . . . . . . . . . . . . . . . . . . . . . . . . . . . . 28.1 28.4 0.8% 34.8 36.1 1.0%Other . . . . . . . . . . . . . . . . . . . . . . . . . . . . . . . . . . . . . . . . . . . . . . . 3.8 4.9 0.1% 4.6 6.0 0.2%
Total . . . . . . . . . . . . . . . . . . . . . . . . . . . . . . . . . . . . . . . . . . . . . . . $3,048.4 $3,555.7 100.0% $3,099.2 $3,703.5 100.0%
Generally, a continued increase in valuations, as well as muted prepayments despite low interest rates, led to a very strongperformance for our CMO-B portfolio in recent years. Based on fundamental prepayment analysis, we have been able toincrease the allocation to notional securities in a manner that was diversified by borrower and mortgage characteristics withoutunduly increasing portfolio risk because the underlying drivers of prepayment behavior across collateral type are varied.
172

For the year ended December 31, 2015, the market value of our CMO-B portfolio decreased due to modest spread wideningwithin the sector and as paydowns and maturities exceeded new purchase activity. Yields within the CMO-B portfolio continueto decline as higher yielding historical CMO-B assets paydown or mature and are replaced with lower yielding new assets.
The following table presents returns for our CMO-B portfolio for the periods indicated:Year Ended December 31,
($ in millions) 2015 2014 2013
Net investment income (loss) . . . . . . . . . . . . . . . . . . . . . . . . . . . . . . . . . . . . $ 737.9 $ 757.1 $ 791.6Net realized capital gains (losses)(1) . . . . . . . . . . . . . . . . . . . . . . . . . . . . . . . (474.7) (280.1) (555.9)
Total income (pre-tax) . . . . . . . . . . . . . . . . . . . . . . . . . . . . . . . . . . . . . . . . . $ 263.2 $ 477.0 $ 235.7
(1) Net realized capital gains (losses) also include derivatives interest settlements, mark to market adjustments and realizedgains (losses) on standalone derivatives contracts that are in the CMO-B portfolio.
In defining operating earnings before income taxes and non-operating earnings for our CMO-B portfolio, certainrecharacterizations are recognized. As indicated in footnote (1) above, derivatives activity, including net coupon settlement oninterest rate swaps, is included in Net realized capital gains (losses). Since these swaps are hedging securities whose couponpayments are reflected in Net investment income (loss) (operating earnings), it is appropriate to represent the net swap couponsas operating income before income taxes rather than non-operating income. Also included in Net realized capital gains (losses)are the premium amortization and the change in fair value for securities designated under the FVO, whereas the coupon forthese securities is included in Net investment income (loss). In order to present the economics of these fair value securities in asimilar manner to those of an available for sale security, the premium amortization is reclassified from Net realized capital gains(losses) (or non-operating income) to operating income.
After adjusting for the two items referenced immediately above, the following table presents operating earnings before incometaxes and non-operating income for our CMO-B portfolio for the periods indicated:
Year Ended December 31,
($ in millions) 2015 2014 2013
Operating earnings before income taxes . . . . . . . . . . . . . . . . . . . . . . . . . . . $284.6 $283.6 $324.1
Realized gains/losses including OTTI . . . . . . . . . . . . . . . . . . . . . . . . . . . . . . . 5.0 5.4 (1.1)Fair value adjustments . . . . . . . . . . . . . . . . . . . . . . . . . . . . . . . . . . . . . . . . . . . (26.4) 188.0 (87.3)
Non-operating income . . . . . . . . . . . . . . . . . . . . . . . . . . . . . . . . . . . . . . . . . . $ (21.4) $193.4 $ (88.4)
Income before income taxes . . . . . . . . . . . . . . . . . . . . . . . . . . . . . . . . . . . . . . . $263.2 $477.0 $235.7
Subprime and Alt-A Mortgage ExposurePre-2008 vintage subprime and Alt-A mortgage collateral continues to distance itself from the credit crisis and paymentperformance reflects a housing market firmly entrenched in recovery. While collateral losses continue to be realized, theamounts are steadily decreasing. Serious delinquencies and other measures of performance, like prepayments and loan defaults,have also displayed sustained periods of improvement. Reflecting these fundamental improvements, related bond prices andsector liquidity have increased substantially since the credit crisis. Home prices have moved steadily higher, further supportingpayment performance. Year-over-year home price measures, while at a lower magnitude than experienced in recent years,appear to have stabilized at sustainable levels, when measured on a nationwide basis. This backdrop remains supportive ofcontinued improvement in overall borrower payment behavior. In managing our risk exposure to subprime and Alt-Amortgages, we take into account collateral performance and structural characteristics associated with our various positions.
We do not originate or purchase subprime or Alt-A whole-loan mortgages. Subprime lending is the origination of loans tocustomers with weaker credit profiles. We define Alt-A mortgages to include the following: residential mortgage loans tocustomers who have strong credit profiles but lack some element(s), such as documentation to substantiate income; residentialmortgage loans to borrowers that would otherwise be classified as prime but whose loan structure provides repayment options tothe borrower that increase the risk of default; and any securities backed by residential mortgage collateral not clearlyidentifiable as prime or subprime.
We have exposure to RMBS, CMBS and ABS. Our exposure to subprime mortgage-backed securities is primarily in the form ofABS structures collateralized by subprime residential mortgages, and the majority of these holdings were included in OtherABS under “Fixed Maturities” above. As of December 31, 2015, the fair value, amortized cost and gross unrealized lossesrelated to our exposure to subprime mortgage-backed securities totaled $461.2 million, $428.6 million and $13.2 million,
173

respectively, representing 0.6% of total fixed maturities, including securities pledged, based on fair value. As of December 31,2014, the fair value, amortized cost and gross unrealized losses related to our exposure to subprime mortgage-backed securitiestotaled $549.1 million, $512.6 million and $16.2 million, respectively, representing 0.7% of total fixed maturities, includingsecurities pledged, based on fair value.
The following table presents our exposure to subprime mortgage-backed securities by credit quality using NAIC designations,ARO ratings and vintage year as of the dates indicated:
% of Total Subprime Mortgage-backed Securities
NAIC Quality Designation ARO Quality Ratings Vintage
December 31, 20151 91.4% AAA — % 2007 30.0%2 4.2% AA 1.4% 2006 26.4%3 2.5% A 3.6% 2005 and prior 43.6%
4 1.5% BBB 8.0% 100.0%
5 0.3% BB and below 87.0%
6 0.1% 100.0%
100.0%
December 31, 20141 86.8% AAA 0.1% 2007 30.3%2 8.6% AA 0.4% 2006 27.7%3 0.6% A 4.5% 2005 and prior 42.0%
4 2.7% BBB 3.9% 100.0%
5 0.3% BB and below 91.1%
6 1.0% 100.0%
100.0%
Our exposure to Alt-A mortgages is included in the “RMBS” line item in the “Fixed Maturities” table under “Fixed Maturities”above. As of December 31, 2015, the fair value, amortized cost and gross unrealized losses related to our exposure to Alt-ARMBS totaled $332.0 million, $283.3 million and $4.5 million, respectively, representing 0.5% of total fixed maturities,including securities pledged, based on fair value. As of December 31, 2014, the fair value, amortized cost and gross unrealizedlosses related to our exposure to Alt-A RMBS totaled $408.7 million, $351.7 million and $4.9 million, respectively,representing 0.5% of total fixed maturities, including securities pledged, based on fair value.
174
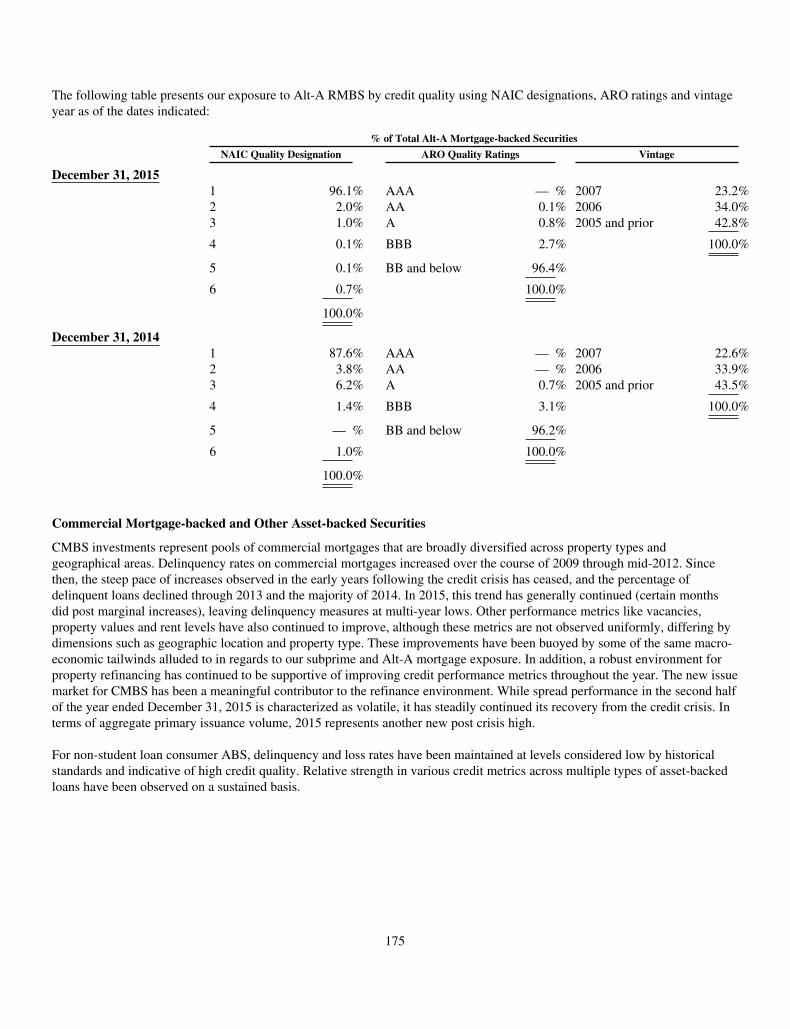
The following table presents our exposure to Alt-A RMBS by credit quality using NAIC designations, ARO ratings and vintageyear as of the dates indicated:
% of Total Alt-A Mortgage-backed Securities
NAIC Quality Designation ARO Quality Ratings Vintage
December 31, 20151 96.1% AAA — % 2007 23.2%2 2.0% AA 0.1% 2006 34.0%3 1.0% A 0.8% 2005 and prior 42.8%
4 0.1% BBB 2.7% 100.0%
5 0.1% BB and below 96.4%
6 0.7% 100.0%
100.0%
December 31, 20141 87.6% AAA — % 2007 22.6%2 3.8% AA — % 2006 33.9%3 6.2% A 0.7% 2005 and prior 43.5%
4 1.4% BBB 3.1% 100.0%
5 — % BB and below 96.2%
6 1.0% 100.0%
100.0%
Commercial Mortgage-backed and Other Asset-backed Securities
CMBS investments represent pools of commercial mortgages that are broadly diversified across property types andgeographical areas. Delinquency rates on commercial mortgages increased over the course of 2009 through mid-2012. Sincethen, the steep pace of increases observed in the early years following the credit crisis has ceased, and the percentage ofdelinquent loans declined through 2013 and the majority of 2014. In 2015, this trend has generally continued (certain monthsdid post marginal increases), leaving delinquency measures at multi-year lows. Other performance metrics like vacancies,property values and rent levels have also continued to improve, although these metrics are not observed uniformly, differing bydimensions such as geographic location and property type. These improvements have been buoyed by some of the same macro-economic tailwinds alluded to in regards to our subprime and Alt-A mortgage exposure. In addition, a robust environment forproperty refinancing has continued to be supportive of improving credit performance metrics throughout the year. The new issuemarket for CMBS has been a meaningful contributor to the refinance environment. While spread performance in the second halfof the year ended December 31, 2015 is characterized as volatile, it has steadily continued its recovery from the credit crisis. Interms of aggregate primary issuance volume, 2015 represents another new post crisis high.
For non-student loan consumer ABS, delinquency and loss rates have been maintained at levels considered low by historicalstandards and indicative of high credit quality. Relative strength in various credit metrics across multiple types of asset-backedloans have been observed on a sustained basis.
175
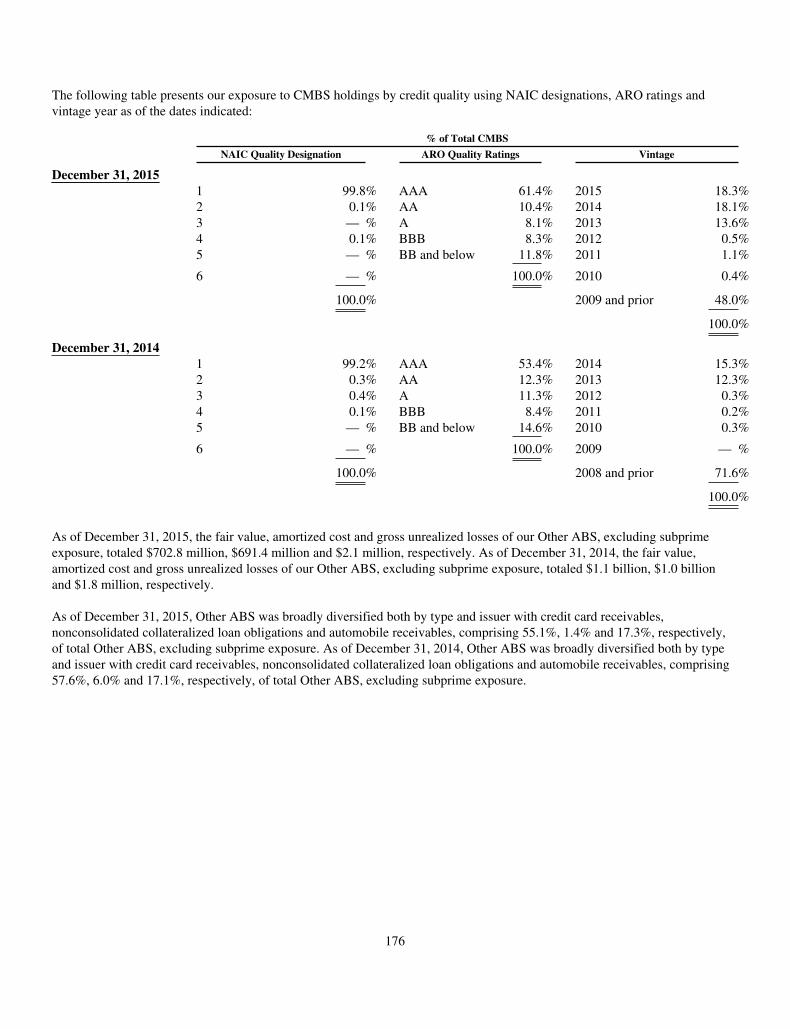
The following table presents our exposure to CMBS holdings by credit quality using NAIC designations, ARO ratings andvintage year as of the dates indicated:
% of Total CMBS
NAIC Quality Designation ARO Quality Ratings Vintage
December 31, 20151 99.8% AAA 61.4% 2015 18.3%2 0.1% AA 10.4% 2014 18.1%3 — % A 8.1% 2013 13.6%4 0.1% BBB 8.3% 2012 0.5%5 — % BB and below 11.8% 2011 1.1%
6 — % 100.0% 2010 0.4%
100.0% 2009 and prior 48.0%
100.0%
December 31, 20141 99.2% AAA 53.4% 2014 15.3%2 0.3% AA 12.3% 2013 12.3%3 0.4% A 11.3% 2012 0.3%4 0.1% BBB 8.4% 2011 0.2%5 — % BB and below 14.6% 2010 0.3%
6 — % 100.0% 2009 — %
100.0% 2008 and prior 71.6%
100.0%
As of December 31, 2015, the fair value, amortized cost and gross unrealized losses of our Other ABS, excluding subprimeexposure, totaled $702.8 million, $691.4 million and $2.1 million, respectively. As of December 31, 2014, the fair value,amortized cost and gross unrealized losses of our Other ABS, excluding subprime exposure, totaled $1.1 billion, $1.0 billionand $1.8 million, respectively.
As of December 31, 2015, Other ABS was broadly diversified both by type and issuer with credit card receivables,nonconsolidated collateralized loan obligations and automobile receivables, comprising 55.1%, 1.4% and 17.3%, respectively,of total Other ABS, excluding subprime exposure. As of December 31, 2014, Other ABS was broadly diversified both by typeand issuer with credit card receivables, nonconsolidated collateralized loan obligations and automobile receivables, comprising57.6%, 6.0% and 17.1%, respectively, of total Other ABS, excluding subprime exposure.
176

The following table presents our exposure to Other ABS holdings, excluding subprime exposure, by credit quality using NAICdesignations, ARO ratings and vintage year as of the dates indicated:
% of Total Other ABS
NAIC Quality Designation ARO Quality Ratings Vintage
December 31, 20151 95.5% AAA 87.7% 2015 13.2%2 1.8% AA 0.4% 2014 20.3%3 1.0% A 1.9% 2013 8.2%4 1.7% BBB 7.4% 2012 5.1%5 — % BB and below 2.6% 2011 — %
6 — % 100.0% 2010 1.8%
100.0% 2009 and prior 51.4%
100.0%
December 31, 20141 97.9% AAA 87.6% 2014 19.1%2 2.1% AA 3.2% 2013 10.7%3 — % A 7.1% 2012 12.3%4 — % BBB 2.1% 2011 3.1%5 — % BB and below — % 2010 1.9%
6 — % 100.0% 2009 1.0%
100.0% 2008 and prior 51.9%
100.0%
Troubled Debt Restructuring
Although our portfolio of commercial loans and private placements is high quality, a small number of these contracts have beengranted modifications, certain of which are considered to be troubled debt restructurings. See the Investments (excludingConsolidated Investment Entities) Note in our Consolidated Financial Statements in Part II, Item 8. of this Annual Report onForm 10-K for further information on troubled debt restructuring.
Mortgage Loans on Real Estate
We rate commercial mortgages to quantify the level of risk. We place those loans with higher risk on a watch list and closelymonitor these loans for collateral deficiency or other credit events that may lead to a potential loss of principal and/or interest. Ifwe determine the value of any mortgage loan to be OTTI (i.e., when it is probable that we will be unable to collect on amountsdue according to the contractual terms of the loan agreement), the carrying value of the mortgage loan is reduced to either thepresent value of expected cash flows from the loan, discounted at the loan’s effective interest rate, or fair value of the collateral.For those mortgages that are determined to require foreclosure, the carrying value is reduced to the fair value of the underlyingcollateral, net of estimated costs to obtain and sell at the point of foreclosure. The carrying value of the impaired loans isreduced by establishing an other-than-temporary write-down recorded in Net realized capital gains (losses) in the ConsolidatedStatements of Operations.
Loan-to-value (“LTV”) and debt service coverage (“DSC”) ratios are measures commonly used to assess the risk and quality ofcommercial mortgage loans. The LTV ratio, calculated at time of origination, is expressed as a percentage of the amount of theloan relative to the value of the underlying property. An LTV ratio in excess of 100% indicates the unpaid loan amount exceedsthe value of the underlying collateral. The DSC ratio, based upon the most recently received financial statements, is expressedas a percentage of the amount of a property’s Net income (loss) to its debt service payments. A DSC ratio of less than 1.0indicates that property’s operations do not generate sufficient income to cover debt payments. These ratios are utilized as part ofthe review process described above.
177
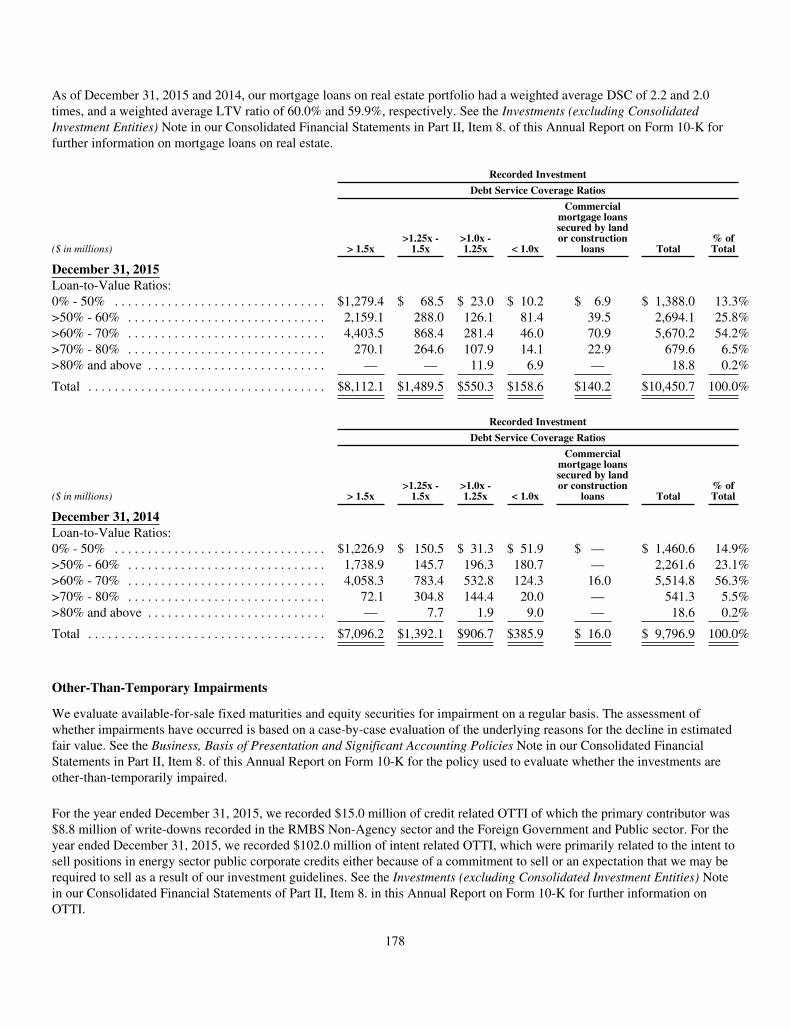
As of December 31, 2015 and 2014, our mortgage loans on real estate portfolio had a weighted average DSC of 2.2 and 2.0times, and a weighted average LTV ratio of 60.0% and 59.9%, respectively. See the Investments (excluding ConsolidatedInvestment Entities) Note in our Consolidated Financial Statements in Part II, Item 8. of this Annual Report on Form 10-K forfurther information on mortgage loans on real estate.
Recorded Investment
Debt Service Coverage Ratios
($ in millions) > 1.5x>1.25x -
1.5x>1.0x -1.25x < 1.0x
Commercialmortgage loanssecured by landor construction
loans Total% ofTotal
December 31, 2015Loan-to-Value Ratios:0% - 50% . . . . . . . . . . . . . . . . . . . . . . . . . . . . . . . . $1,279.4 $ 68.5 $ 23.0 $ 10.2 $ 6.9 $ 1,388.0 13.3%>50% - 60% . . . . . . . . . . . . . . . . . . . . . . . . . . . . . . 2,159.1 288.0 126.1 81.4 39.5 2,694.1 25.8%>60% - 70% . . . . . . . . . . . . . . . . . . . . . . . . . . . . . . 4,403.5 868.4 281.4 46.0 70.9 5,670.2 54.2%>70% - 80% . . . . . . . . . . . . . . . . . . . . . . . . . . . . . . 270.1 264.6 107.9 14.1 22.9 679.6 6.5%>80% and above . . . . . . . . . . . . . . . . . . . . . . . . . . . — — 11.9 6.9 — 18.8 0.2%
Total . . . . . . . . . . . . . . . . . . . . . . . . . . . . . . . . . . . . $8,112.1 $1,489.5 $550.3 $158.6 $140.2 $10,450.7 100.0%
Recorded Investment
Debt Service Coverage Ratios
($ in millions) > 1.5x>1.25x -
1.5x>1.0x -1.25x < 1.0x
Commercialmortgage loanssecured by landor construction
loans Total% ofTotal
December 31, 2014Loan-to-Value Ratios:0% - 50% . . . . . . . . . . . . . . . . . . . . . . . . . . . . . . . . $1,226.9 $ 150.5 $ 31.3 $ 51.9 $ — $ 1,460.6 14.9%>50% - 60% . . . . . . . . . . . . . . . . . . . . . . . . . . . . . . 1,738.9 145.7 196.3 180.7 — 2,261.6 23.1%>60% - 70% . . . . . . . . . . . . . . . . . . . . . . . . . . . . . . 4,058.3 783.4 532.8 124.3 16.0 5,514.8 56.3%>70% - 80% . . . . . . . . . . . . . . . . . . . . . . . . . . . . . . 72.1 304.8 144.4 20.0 — 541.3 5.5%>80% and above . . . . . . . . . . . . . . . . . . . . . . . . . . . — 7.7 1.9 9.0 — 18.6 0.2%
Total . . . . . . . . . . . . . . . . . . . . . . . . . . . . . . . . . . . . $7,096.2 $1,392.1 $906.7 $385.9 $ 16.0 $ 9,796.9 100.0%
Other-Than-Temporary Impairments
We evaluate available-for-sale fixed maturities and equity securities for impairment on a regular basis. The assessment ofwhether impairments have occurred is based on a case-by-case evaluation of the underlying reasons for the decline in estimatedfair value. See the Business, Basis of Presentation and Significant Accounting Policies Note in our Consolidated FinancialStatements in Part II, Item 8. of this Annual Report on Form 10-K for the policy used to evaluate whether the investments areother-than-temporarily impaired.
For the year ended December 31, 2015, we recorded $15.0 million of credit related OTTI of which the primary contributor was$8.8 million of write-downs recorded in the RMBS Non-Agency sector and the Foreign Government and Public sector. For theyear ended December 31, 2015, we recorded $102.0 million of intent related OTTI, which were primarily related to the intent tosell positions in energy sector public corporate credits either because of a commitment to sell or an expectation that we may berequired to sell as a result of our investment guidelines. See the Investments (excluding Consolidated Investment Entities) Notein our Consolidated Financial Statements of Part II, Item 8. in this Annual Report on Form 10-K for further information onOTTI.
178

Derivatives
We use derivatives for a variety of hedging purposes as further described below. We also have embedded derivatives withinfixed maturities instruments and certain product features. See the Business, Basis of Presentation and Significant AccountingPolicies Note in our Consolidated Financial Statements in Part II, Item 8. of this Annual Report on Form 10-K for furtherinformation.
Closed Block Variable Annuity Hedging
See Quantitative and Qualitative Disclosures About Market Risk in Part II, Item 7A. of this Annual Report on Form 10-K forfurther information.
Invested Asset and Credit Hedging
Interest rate caps and interest rate swaps are used to manage the interest rate risk in our fixed maturities portfolio. Interest rateswaps include forward starting swaps, which are used for anticipated purchases of fixed maturities. They represent contracts thatrequire the exchange of cash flows at regular interim periods, typically monthly or quarterly.
Foreign exchange swaps are used to reduce the risk of a change in the value, yield or cash flow with respect to invested assets.Foreign exchange swaps represent contracts that require the exchange of foreign currency cash flows for U.S. dollar cash flowsat regular interim periods, typically quarterly or semiannually.
Certain forwards are acquired to hedge certain CMO assets held by us against movements in interest rates, particularly mortgagerates. On the settlement date, we will either receive a payment (interest rate decreases on purchased forwards or interest raterises on sold forwards) or will be required to make a payment (interest rate rises on purchased forwards or interest rate decreaseson sold forwards).
CDS are used to reduce the credit loss exposure with respect to certain assets that we own, or to assume credit exposure oncertain assets that we do not own. Payments are made to or received from the counterparty at specified intervals and amounts forthe purchase or sale of credit protection. In the event of a default on the underlying credit exposure, we will either receive anadditional payment (purchased credit protection) or will be required to make an additional payment (sold credit protection)equal to par minus recovery value of the swap contract.
European Exposures
We closely monitor our exposures to European sovereign debt in general, with a primary focus on the sovereign debt of Greece,Ireland, Italy, Portugal and Spain (which we refer to as “peripheral Europe”), as these countries have applied for support fromthe European Financial Stability Facility or received support from the European Central Bank via government bond purchases inthe secondary market.
The financial turmoil in Europe continues to be a potential threat to global capital markets and remains a challenge to globalfinancial stability. Additionally, the possibility of capital market volatility spreading through a highly integrated andinterdependent banking system remains. Despite signs of continuous improvement in the region, it is our view that the riskamong European sovereigns and financial institutions still warrants scrutiny, in addition to our customary surveillance and riskmonitoring, given how highly correlated these sectors of the region have become.
The United States and European Union continue to maintain sanctions against select Russian businesses in response to theongoing conflict in eastern Ukraine. We remain comfortable with our aggregate Russian exposure given its relatively smallallocation in our total investment portfolio.
We quantify and allocate our exposure to the region, as described in the table below, by attempting to identify all aspects of theregion or country risk to which we are exposed. Among the factors we consider are the nationality of the issuer, the nationalityof the issuer’s ultimate parent, the corporate and economic relationship between the issuer and its parent, as well as the political,legal and economic environment in which each functions. By undertaking this assessment, we believe that we develop a moreaccurate assessment of the actual geographic risk, with a more integrated understanding of all contributing factors to the full riskprofile of the issuer.
179

In the normal course of our ongoing risk and portfolio management process, we closely monitor compliance with a credit limithierarchy designed to minimize overly concentrated risk exposures by geography, sector and issuer. This framework takes intoaccount various factors such as internal and external ratings, capital efficiency and liquidity and is overseen by a combination ofInvestment and Corporate Risk Management, as well as insurance portfolio managers focused specifically on managing theinvestment risk embedded in our portfolio.
As of December 31, 2015, we had $655.2 million of exposure to peripheral Europe, which consisted of a broadly diversifiedportfolio of credit-related investments primarily in the industrial and utility sectors. We did not have any fixed maturities orequity securities exposure to European sovereigns based in peripheral Europe. Peripheral European exposure included non-sovereign exposure in Ireland of $182.1 million, Italy of $290.1 million, Portugal of $10.2 million, and Spain of $172.8 million.We did not have any exposure to Greece. As of December 31, 2015, we did not have any exposure to derivative assets withinthe financial institutions based in peripheral Europe. For purposes of calculating the derivative assets exposure, we haveaggregated exposure to single name and portfolio product CDS, as well as non-CDS derivative exposure for which it either hascounterparty or direct credit exposure to a company whose country of risk is in scope.
Among the remaining $8,000.9 million of total non-peripheral European exposure, we had a portfolio of credit-related assetssimilarly diversified by country and sector across developed and developing Europe. As of December 31, 2015 our sovereignexposure was $224.4 million, which consisted of fixed maturities. We also had $1,090.8 million in net exposure to non-peripheral financial institutions with a concentration in Switzerland of $270.9 million and the United Kingdom of $368.5million. The balance of $6,685.7 million was invested across non-peripheral, non-financial institutions.
In addition to aggregate concentration in the United Kingdom of $3,385.5 million, we had significant non-peripheral Europeantotal country exposures in the Netherlands of $1,066.8 million, in Belgium of $302.3 million, in France of $690.0 million, inGermany of $740.1 million and in Switzerland of $923.8 million. We place additional scrutiny on our financial exposure in theUnited Kingdom, France, Switzerland and The Netherlands given our concern for the potential for volatility to spread throughthe European banking system. We believe the primary risk results from market value fluctuations resulting from spreadvolatility and the secondary risk is default risk, dependent upon the strength of the recovery of economic conditions in Europe.
180
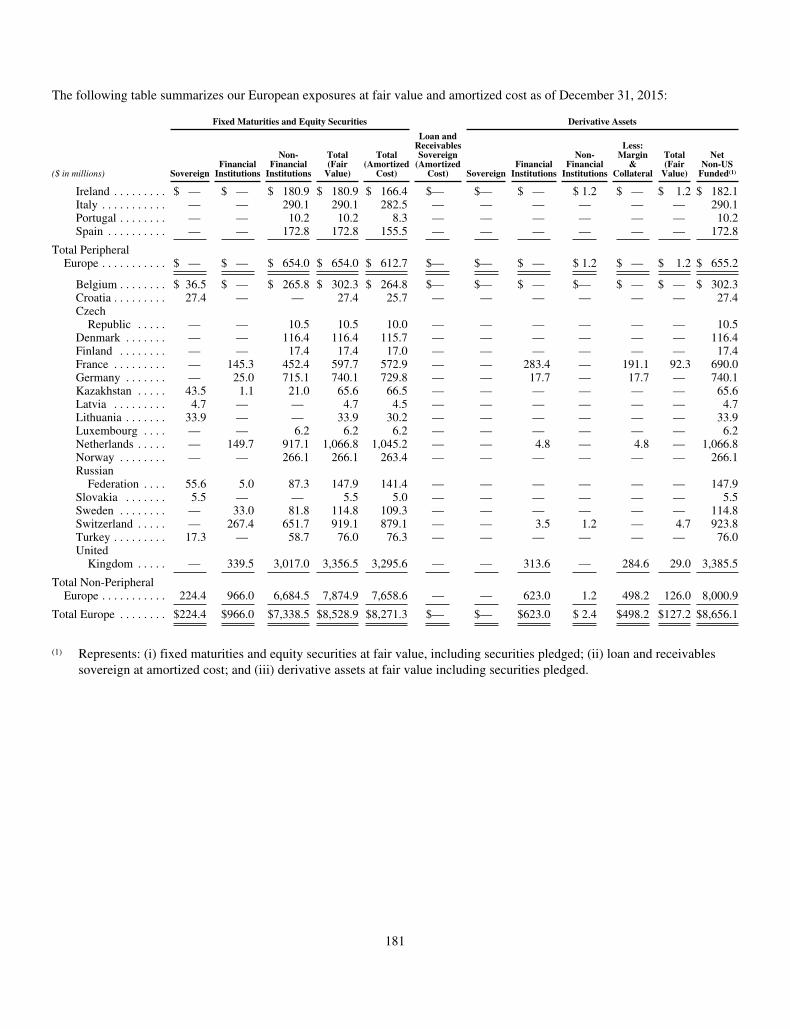
The following table summarizes our European exposures at fair value and amortized cost as of December 31, 2015:
Fixed Maturities and Equity Securities Derivative Assets
($ in millions) SovereignFinancial
Institutions
Non-Financial
Institutions
Total(Fair
Value)
Total(Amortized
Cost)
Loan andReceivablesSovereign
(AmortizedCost) Sovereign
FinancialInstitutions
Non-Financial
Institutions
Less:Margin
&Collateral
Total(Fair
Value)
NetNon-US
Funded(1)
Ireland . . . . . . . . . $ — $ — $ 180.9 $ 180.9 $ 166.4 $— $— $ — $ 1.2 $ — $ 1.2 $ 182.1Italy . . . . . . . . . . . — — 290.1 290.1 282.5 — — — — — — 290.1Portugal . . . . . . . . — — 10.2 10.2 8.3 — — — — — — 10.2Spain . . . . . . . . . . — — 172.8 172.8 155.5 — — — — — — 172.8
Total PeripheralEurope . . . . . . . . . . . $ — $ — $ 654.0 $ 654.0 $ 612.7 $— $— $ — $ 1.2 $ — $ 1.2 $ 655.2
Belgium . . . . . . . . $ 36.5 $ — $ 265.8 $ 302.3 $ 264.8 $— $— $ — $— $ — $ — $ 302.3Croatia . . . . . . . . . 27.4 — — 27.4 25.7 — — — — — — 27.4Czech
Republic . . . . . — — 10.5 10.5 10.0 — — — — — — 10.5Denmark . . . . . . . — — 116.4 116.4 115.7 — — — — — — 116.4Finland . . . . . . . . — — 17.4 17.4 17.0 — — — — — — 17.4France . . . . . . . . . — 145.3 452.4 597.7 572.9 — — 283.4 — 191.1 92.3 690.0Germany . . . . . . . — 25.0 715.1 740.1 729.8 — — 17.7 — 17.7 — 740.1Kazakhstan . . . . . 43.5 1.1 21.0 65.6 66.5 — — — — — — 65.6Latvia . . . . . . . . . 4.7 — — 4.7 4.5 — — — — — — 4.7Lithuania . . . . . . . 33.9 — — 33.9 30.2 — — — — — — 33.9Luxembourg . . . . — — 6.2 6.2 6.2 — — — — — — 6.2Netherlands . . . . . — 149.7 917.1 1,066.8 1,045.2 — — 4.8 — 4.8 — 1,066.8Norway . . . . . . . . — — 266.1 266.1 263.4 — — — — — — 266.1Russian
Federation . . . . 55.6 5.0 87.3 147.9 141.4 — — — — — — 147.9Slovakia . . . . . . . 5.5 — — 5.5 5.0 — — — — — — 5.5Sweden . . . . . . . . — 33.0 81.8 114.8 109.3 — — — — — — 114.8Switzerland . . . . . — 267.4 651.7 919.1 879.1 — — 3.5 1.2 — 4.7 923.8Turkey . . . . . . . . . 17.3 — 58.7 76.0 76.3 — — — — — — 76.0United
Kingdom . . . . . — 339.5 3,017.0 3,356.5 3,295.6 — — 313.6 — 284.6 29.0 3,385.5
Total Non-PeripheralEurope . . . . . . . . . . . 224.4 966.0 6,684.5 7,874.9 7,658.6 — — 623.0 1.2 498.2 126.0 8,000.9
Total Europe . . . . . . . . $224.4 $966.0 $7,338.5 $8,528.9 $8,271.3 $— $— $623.0 $ 2.4 $498.2 $127.2 $8,656.1
(1) Represents: (i) fixed maturities and equity securities at fair value, including securities pledged; (ii) loan and receivablessovereign at amortized cost; and (iii) derivative assets at fair value including securities pledged.
181
Consolidated Investment Entities
We provide investment management services to, and have transactions with, various collateralized loan obligations (“CLOentities”), private equity funds, single strategy hedge funds, registered investment companies, insurance entities, securitizationsand other investment entities in the normal course of business. In certain instances, we serve as the investment manager, makingday-to-day investment decisions concerning the assets of these entities. These entities are considered to be either variableinterest entities (“VIEs”) or voting interest entities (“VOEs”), and we evaluate our involvement with each entity to determinewhether consolidation is required.
Certain investment entities are consolidated under consolidation guidance. We consolidate certain entities under the VIEguidance when it is determined that we are the primary beneficiary. We consolidate certain entities under the VOE guidancewhen we act as the controlling general partner and the limited partners have no substantive rights to impact ongoing governanceand operating activities of the entity, or when we otherwise have control through voting rights. In February 2015, the FASBissued ASU 2015-02, “Consolidation (ASC Topic 810): Amendments to the Consolidation Analysis” (“ASU 2015-02”), whichsignificantly amends the consolidation analysis required under current consolidation guidance. The provisions of ASU 2015-02are effective for the Company on January 1, 2016 with either a retrospective or modified retrospective approach required. SeeBusiness, Basis of Presentation and Significant Accounting Policies in our Consolidated Financial Statements in Part II, Item 8.of this Annual Report on Form 10-K for estimated impact of future adoption of this accounting pronouncement.
We have no right to the benefits from, nor do we bear the risks associated with, these investments beyond our direct equity anddebt investments in and management fees generated from these investment products. Such direct investments amounted toapproximately $722.8 million and $694.4 million as of December 31, 2015 and 2014, respectively. If we were to liquidate, theassets held by consolidated investment entities would not be available to our general creditors as a result of the liquidation.
Fair Value Measurement
Upon consolidation of CLO entities, we elected to apply the FVO for financial assets and financial liabilities held by theseentities and have continued to measure these assets (primarily corporate loans) and liabilities (debt obligations issued by CLOentities) at fair value in subsequent periods. We have elected the FVO to more closely align the accounting with the economicsof the transactions and allow us to more effectively reflect changes in the fair value of CLO assets with a commensurate changein the fair value of CLO liabilities.
Investments held by consolidated private equity funds and single strategy hedge funds are reported at fair value in ourConsolidated Financial Statements. Changes in the fair value of consolidated investment entities are recorded as a separate lineitem within Income (loss) related to consolidated investment entities in our Consolidated Statements of Operations.
The methodology for measuring the fair value and fair value hierarchy classification of financial assets and liabilities ofconsolidated investment entities is consistent with the methodology and fair value hierarchy rules that we apply to ourinvestment portfolio. See the Fair Value Measurement section of Business, Basis of Presentation and Significant AccountingPolicies Note in our Consolidated Financial Statements in Part II, Item 8. of this Annual Report on Form 10-K.
Nonconsolidated VIEs
We also hold variable interest in certain CLO entities that we do not consolidate because we have determined that we are not theprimary beneficiary. With these CLO entities, we serve as the investment manager and receive investment management fees andcontingent performance fees. Generally, we do not hold any interest in the nonconsolidated CLO entities, but if we do, suchownership has been deemed to be insignificant. We have not provided and are not obligated to provide any financial or othersupport to these entities.
We manage or hold investments in certain private equity funds and hedge funds. With these entities, we serve as the investmentmanager and are entitled to receive investment management fees and contingent performance fees that are generally expected tobe insignificant. Although we have the power to direct the activities that significantly impact the economic performance of thefunds, we do not hold a significant variable interest in any of these funds and, as such, do not have the obligation to absorblosses or the right to receive benefits from the entity that could potentially be significant to the entity. Accordingly, we are notconsidered the primary beneficiary and did not consolidate any of these investment funds.
182

In addition, we do not consolidate funds in which our involvement takes the form of a limited partner interest and is restricted toa role of a passive investor, as a limited partner’s interest does not provide us with any substantive kick-out or participatingrights, which would overcome the presumption of control by the general partner. See the Related Party Transactions Note in ourConsolidated Financial Statements in Part II, Item 8. of this Annual Report on Form 10-K for more information.
Securitizations
We invest in various tranches of securitization entities, including RMBS, CMBS and ABS. Through our investments, we are notobligated to provide any financial or other support to these entities. Each of the RMBS, CMBS and ABS entities are thinlycapitalized by design and considered VIEs. Our involvement with these entities is limited to that of a passive investor. We haveno unilateral right to appoint or remove the servicer, special servicer or investment manager, which are generally viewed to havethe power to direct the activities that most significantly impact the securitization entities’ economic performance, in any of theseentities, nor do we function in any of these roles. We, through our investments or other arrangements, do not have the obligationto absorb losses or the right to receive benefits from the entity that could potentially be significant to the entity. Therefore, weare not the primary beneficiary and will not consolidate any of the RMBS, CMBS and ABS entities in which we holdinvestments. These investments are accounted for as investments available-for-sale as described in the Fair ValueMeasurements (excluding Consolidated Investment Entities) Note in our Consolidated Financial Statements in Part II, Item 8. ofthis Annual Report on Form 10-K and unrealized capital gains (losses) on these securities are recorded directly in AOCI, exceptfor certain RMBS which are accounted for under the FVO whose change in fair value is reflected in Other net realized gains(losses) in the Consolidated Statements of Operations. Our maximum exposure to loss on these structured investments is limitedto the amount of our investment. See the Investments (excluding Consolidated Investment Entities) Note in our ConsolidatedFinancial Statements in Part II, Item 8. of this Annual Report on Form 10-K for details regarding the carrying amounts andclassifications of these assets.
183

Item 7A. Quantitative and Qualitative Disclosures About Market Risk
Market risk is the risk that our consolidated financial position and results of operations will be affected by fluctuations in thevalue of financial instruments. We have significant holdings in financial instruments and are naturally exposed to a variety ofmarket risks. The main market risks we are exposed to include interest rate risk, equity market price risk, and credit risk. We donot have material market risk exposure to “trading” activities in our Consolidated Financial Statements.
Risk Management
As a financial services company active in retirement, investment management and insurance products and services, takingmeasured risks is part of our business. As part of our effort to ensure measured risk taking, we have integrated risk managementin our daily business activities and strategic planning.
We place a high priority on risk management and risk control. We have comprehensive risk management and control proceduresin place at all levels and have established a dedicated risk management function with responsibility for the formulation of ourrisk appetite, strategies, policies and limits. The risk management function is also responsible for monitoring our overall marketrisk exposures and provides review, oversight and support functions on risk-related issues.
Our risk appetite is aligned with how our businesses are managed and anticipates future regulatory developments. In particular,our risk appetite is aligned with regulatory capital requirements applicable to our regulated insurance subsidiaries as well asmetrics that are aligned with various ratings agency models.
Our risk governance and control systems enable us to identify, control, monitor and aggregate risks and provide assurance thatrisks are being measured, monitored and reported adequately and effectively. To promote measured risk taking, we haveintegrated risk management with our business activities and strategic planning.
Each risk that is managed has been mapped for oversight by the Board of Directors or appropriate Board Committees. The ChiefRisk Officer (“CRO”) reports to the Chief Executive Officer and has direct access to the Board on a regular basis. TheCompany’s Board of Directors and Board Committees are directly involved within the risk framework.
The CRO heads the risk management function and each of the businesses, as well as corporate, has a similar function thatreports to the CRO. This functional approach is designed to promote consistent application of guidelines and procedures, regularreporting and appropriate communication through the risk management function, as well as to provide ongoing support for thebusiness. The scope, roles, responsibilities and authorities of the risk management function at different levels are described in aRisk Management Policy to which our businesses must adhere.
Our Risk Committee discusses and approves all risk policies and reviews and approves risks associated with our activities. Thisincludes volatility (affecting earnings and value), exposure (required capital and market risk) and insurance risks. Each businesshas a Committee that reviews business specific risks and is governed by the Risk Committee.
We have implemented several limit structures to manage risk. Examples include, but are not limited to, the following:
• At-risk limits on sensitivities of earnings and regulatory capital;
• Duration and convexity mismatch limits;
• Credit risk limits;
• Liquidity limits;
• Mortality concentration limits;
• Catastrophe and mortality exposure retention limits for our insurance risk; and
• Investment and derivative guidelines.
We manage our risk appetite based on several key risk metrics, including:
• At-risk metrics on sensitivities of earnings and regulatory capital;
• Stress scenario results: forecasted results under stress events covering the impact of changes in interest rates, equitymarkets, mortality rates, credit default and spread levels, and combined impacts;
• Economic capital: the amount of capital required to cover extreme scenarios.
184

We are also subject to cash flow stress testing pursuant to regulatory requirements. This analysis measures the effect of changesin interest rate assumptions on asset and liability cash flows. The analysis includes the effects of:
• the timing and amount of redemptions and prepayments in our asset portfolio;
• our derivative portfolio;
• death benefits and other claims payable under the terms of our insurance products;
• lapses and surrenders in our insurance products;
• minimum interest guarantees in our insurance products; and
• book value guarantees in our insurance products.
We evaluate any shortfalls that our cash flow testing reveals and if needed increase statutory reserves or adjust portfoliomanagement strategies.
Derivatives are financial instruments whose values are derived from interest rates, foreign currency exchange rates, financialindices, or other prices of securities or commodities. Derivatives include swaps, futures, options and forward contracts. UnderU.S. insurance statutes, our insurance subsidiaries may use derivatives to hedge market values or cash flows of assets orliabilities; to replicate cash market instruments; and for certain limited income generating activities. Our insurance subsidiariesare generally prohibited from using derivatives for speculative purposes. References below to hedging and hedge programs referto our process of reducing exposure to various risks. This does not mean that the process necessarily results in hedge accountingtreatment for the respective derivative instruments. To qualify for hedge accounting treatment, a derivative must be highlyeffective in mitigating the designated risk of the hedged item and meet other specific requirements. Effectiveness of the hedge isassessed at inception and throughout the life of the hedging relationship. Even if a derivative qualifies for hedge accountingtreatment, there may be an element of ineffectiveness of the hedge. The ineffective portion of a hedging relationship subject tohedge accounting is recognized in Net realized capital gains (losses) in the Consolidated Statements of Operations.
Market Risk Related to Interest RatesWe define interest rate risk as the risk of an economic loss due to adverse changes in interest rates. This risk arises from ourholdings in interest sensitive assets and liabilities, primarily as a result of investing life insurance premiums, fixed annuity andguaranteed investment contract deposits received in interest-sensitive assets and carrying these funds as interest-sensitiveliabilities. We are also subject to interest rate risk on our variable annuity business, stable value contracts and secondaryguarantee universal life contracts. A sustained decline in interest rates or a prolonged period of low interest rates may subject usto higher cost of guaranteed benefits and increased hedging costs on those products that are being hedged. In a rising interestrate environment, we are exposed to the risk of financial disintermediation through a potential increase in the level of bookvalue withdrawals on certain stable value contracts. Conversely, a steady increase in interest rates would tend to improvefinancial results due to reduced hedging costs, lower costs of guaranteed benefits and improvement to fixed margins.
We use product design, pricing and ALM strategies to reduce the adverse effects of interest rate movement. Product design andpricing strategies can include the use of surrender charges, withdrawal restrictions and the ability to reset credited interest rates.ALM strategies can include the use of derivatives and duration and convexity mismatch limits. See Risk Factors-Risks Relatedto Our Business-General-The level of interest rates may adversely affect our profitability, particularly in the event of acontinuation of the current low interest rate environment or a period of rapidly increasing interest rates in Part I, Item 1A. ofthis Annual Report on Form 10-K.
Derivatives strategies include the following:
• Guaranteed Minimum Contract Value Guarantees. For certain liability contracts, we provide the contract holder aguaranteed minimum contract value. These contracts include certain fixed annuities and other insurance liabilities. Wepurchase interest rate floors, swaps and swaptions to reduce risk associated with these liability guarantees.
• Book Value Guarantees in Stable Value Contracts. For certain stable value contracts, the contract holder andparticipants may surrender the contract for the account value even if the market value of the asset portfolio is in anunrealized loss position. We purchase derivatives including interest rate caps, swaps and swaptions to reduce the riskassociated with this type of guarantee.
• Interest Risk Related to Variable Annuity Guaranteed Living Benefits. For Variable Annuity contracts withGuaranteed Living benefits, the contract holder may elect to receive income benefits over the remainder of theirlifetime. We use derivatives such as interest rate swaps to hedge a portion of the interest rate risk associated with thistype of guarantee.
• Other Market Value and Cash Flow Hedges. We also use derivatives in general to hedge present or future changes incash flows or market value changes in our assets and liabilities. We use derivatives such as interest rate swaps tospecifically hedge interest rate risks associated with our CMO-B portfolio; see Management’s Discussion and
185
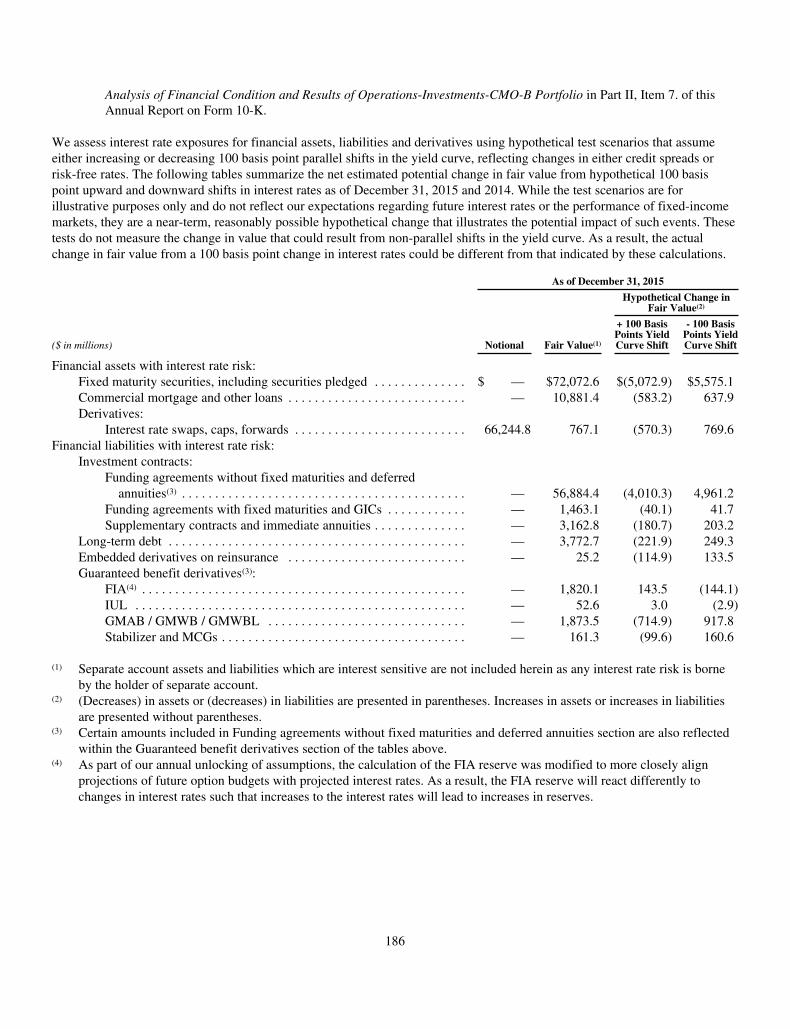
Analysis of Financial Condition and Results of Operations-Investments-CMO-B Portfolio in Part II, Item 7. of thisAnnual Report on Form 10-K.
We assess interest rate exposures for financial assets, liabilities and derivatives using hypothetical test scenarios that assumeeither increasing or decreasing 100 basis point parallel shifts in the yield curve, reflecting changes in either credit spreads orrisk-free rates. The following tables summarize the net estimated potential change in fair value from hypothetical 100 basispoint upward and downward shifts in interest rates as of December 31, 2015 and 2014. While the test scenarios are forillustrative purposes only and do not reflect our expectations regarding future interest rates or the performance of fixed-incomemarkets, they are a near-term, reasonably possible hypothetical change that illustrates the potential impact of such events. Thesetests do not measure the change in value that could result from non-parallel shifts in the yield curve. As a result, the actualchange in fair value from a 100 basis point change in interest rates could be different from that indicated by these calculations.
As of December 31, 2015
Hypothetical Change inFair Value(2)
($ in millions) Notional Fair Value(1)
+ 100 BasisPoints YieldCurve Shift
- 100 BasisPoints YieldCurve Shift
Financial assets with interest rate risk:Fixed maturity securities, including securities pledged . . . . . . . . . . . . . . $ — $72,072.6 $(5,072.9) $5,575.1Commercial mortgage and other loans . . . . . . . . . . . . . . . . . . . . . . . . . . . — 10,881.4 (583.2) 637.9Derivatives:
Interest rate swaps, caps, forwards . . . . . . . . . . . . . . . . . . . . . . . . . . 66,244.8 767.1 (570.3) 769.6Financial liabilities with interest rate risk:
Investment contracts:Funding agreements without fixed maturities and deferred
annuities(3) . . . . . . . . . . . . . . . . . . . . . . . . . . . . . . . . . . . . . . . . . . . — 56,884.4 (4,010.3) 4,961.2Funding agreements with fixed maturities and GICs . . . . . . . . . . . . — 1,463.1 (40.1) 41.7Supplementary contracts and immediate annuities . . . . . . . . . . . . . . — 3,162.8 (180.7) 203.2
Long-term debt . . . . . . . . . . . . . . . . . . . . . . . . . . . . . . . . . . . . . . . . . . . . . — 3,772.7 (221.9) 249.3Embedded derivatives on reinsurance . . . . . . . . . . . . . . . . . . . . . . . . . . . — 25.2 (114.9) 133.5Guaranteed benefit derivatives(3):
FIA(4) . . . . . . . . . . . . . . . . . . . . . . . . . . . . . . . . . . . . . . . . . . . . . . . . . — 1,820.1 143.5 (144.1)IUL . . . . . . . . . . . . . . . . . . . . . . . . . . . . . . . . . . . . . . . . . . . . . . . . . . — 52.6 3.0 (2.9)GMAB / GMWB / GMWBL . . . . . . . . . . . . . . . . . . . . . . . . . . . . . . — 1,873.5 (714.9) 917.8Stabilizer and MCGs . . . . . . . . . . . . . . . . . . . . . . . . . . . . . . . . . . . . . — 161.3 (99.6) 160.6
(1) Separate account assets and liabilities which are interest sensitive are not included herein as any interest rate risk is borneby the holder of separate account.
(2) (Decreases) in assets or (decreases) in liabilities are presented in parentheses. Increases in assets or increases in liabilitiesare presented without parentheses.
(3) Certain amounts included in Funding agreements without fixed maturities and deferred annuities section are also reflectedwithin the Guaranteed benefit derivatives section of the tables above.
(4) As part of our annual unlocking of assumptions, the calculation of the FIA reserve was modified to more closely alignprojections of future option budgets with projected interest rates. As a result, the FIA reserve will react differently tochanges in interest rates such that increases to the interest rates will lead to increases in reserves.
186

As of December 31, 2014
Hypothetical Change inFair Value(2)
($ in millions) Notional Fair Value(1)
+ 100 BasisPoints YieldCurve Shift
- 100 BasisPoints YieldCurve Shift
Financial assets with interest rate risk:Fixed maturity securities, including securities pledged . . . . . . . . . . . . . . $ — $74,659.4 $(5,254.0) $5,737.5Commercial mortgage and other loans . . . . . . . . . . . . . . . . . . . . . . . . . . . — 10,286.6 (529.0) 562.7Derivatives:
Interest rate swaps, caps, forwards . . . . . . . . . . . . . . . . . . . . . . . . . . 67,776.4 648.4 (580.1) 830.1Financial liabilities with interest rate risk:
Investment contracts:Funding agreements without fixed maturities and deferred
annuities(3) . . . . . . . . . . . . . . . . . . . . . . . . . . . . . . . . . . . . . . . . . . . — 55,112.4 (3,285.7) 4,785.0Funding agreements with fixed maturities and GICs . . . . . . . . . . . . — 1,564.8 (56.9) 59.3Supplementary contracts and immediate annuities . . . . . . . . . . . . . . — 2,706.2 (135.0) 166.4
Long-term debt . . . . . . . . . . . . . . . . . . . . . . . . . . . . . . . . . . . . . . . . . . . . . — 3,875.4 (255.3) 287.8Embedded derivatives on reinsurance . . . . . . . . . . . . . . . . . . . . . . . . . . . — 139.6 (141.6) 163.2Guaranteed benefit derivatives(3):
FIA . . . . . . . . . . . . . . . . . . . . . . . . . . . . . . . . . . . . . . . . . . . . . . . . . . — 1,970.0 (102.9) 106.0IUL . . . . . . . . . . . . . . . . . . . . . . . . . . . . . . . . . . . . . . . . . . . . . . . . . . — — — —GMAB / GMWB / GMWBL . . . . . . . . . . . . . . . . . . . . . . . . . . . . . . — 1,527.7 (736.6) 968.1Stabilizer and MCGs . . . . . . . . . . . . . . . . . . . . . . . . . . . . . . . . . . . . . — 102.9 (75.3) 129.9
(1) Separate account assets and liabilities which are interest sensitive are not included herein as any interest rate risk is borneby the holder of separate account.
(2) (Decreases) in assets or (decreases) in liabilities are presented in parentheses. Increases in assets or increases in liabilitiesare presented without parentheses.
(3) Certain amounts included in Funding agreements without fixed maturities and deferred annuities section are also reflectedwithin the Guaranteed benefit derivatives section of the tables above.
187
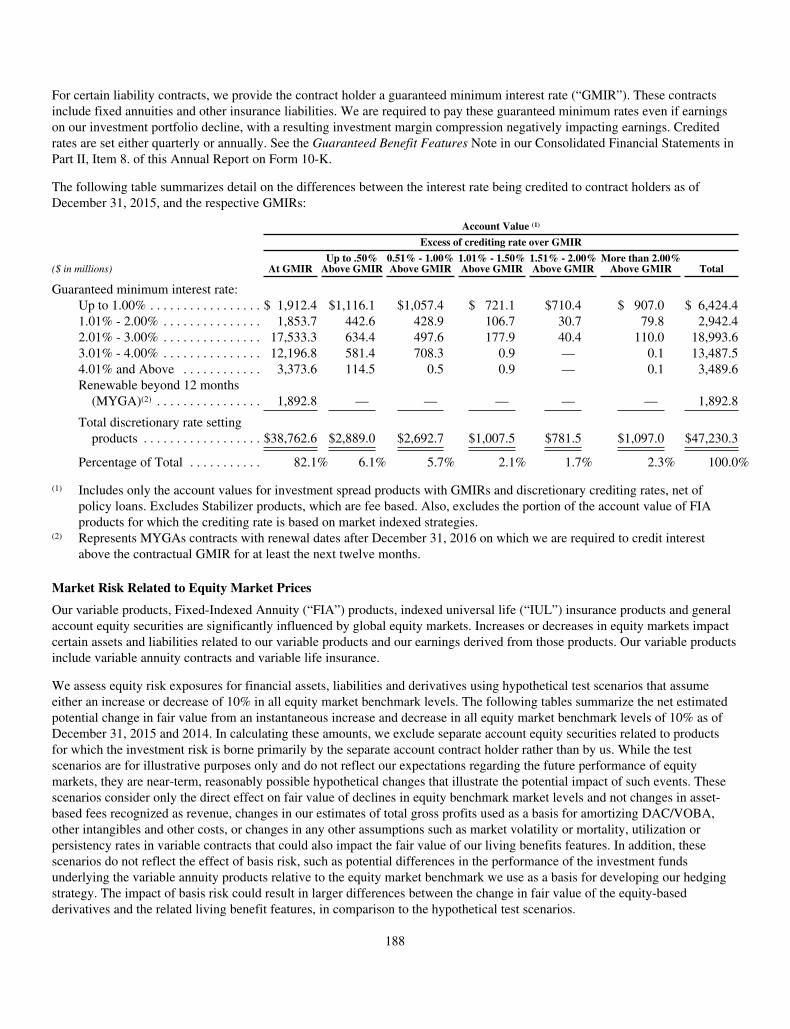
For certain liability contracts, we provide the contract holder a guaranteed minimum interest rate (“GMIR”). These contractsinclude fixed annuities and other insurance liabilities. We are required to pay these guaranteed minimum rates even if earningson our investment portfolio decline, with a resulting investment margin compression negatively impacting earnings. Creditedrates are set either quarterly or annually. See the Guaranteed Benefit Features Note in our Consolidated Financial Statements inPart II, Item 8. of this Annual Report on Form 10-K.
The following table summarizes detail on the differences between the interest rate being credited to contract holders as ofDecember 31, 2015, and the respective GMIRs:
Account Value (1)
Excess of crediting rate over GMIR
($ in millions) At GMIRUp to .50%
Above GMIR0.51% - 1.00%Above GMIR
1.01% - 1.50%Above GMIR
1.51% - 2.00%Above GMIR
More than 2.00%Above GMIR Total
Guaranteed minimum interest rate:Up to 1.00% . . . . . . . . . . . . . . . . . $ 1,912.4 $1,116.1 $1,057.4 $ 721.1 $710.4 $ 907.0 $ 6,424.41.01% - 2.00% . . . . . . . . . . . . . . . 1,853.7 442.6 428.9 106.7 30.7 79.8 2,942.42.01% - 3.00% . . . . . . . . . . . . . . . 17,533.3 634.4 497.6 177.9 40.4 110.0 18,993.63.01% - 4.00% . . . . . . . . . . . . . . . 12,196.8 581.4 708.3 0.9 — 0.1 13,487.54.01% and Above . . . . . . . . . . . . 3,373.6 114.5 0.5 0.9 — 0.1 3,489.6Renewable beyond 12 months
(MYGA)(2) . . . . . . . . . . . . . . . . 1,892.8 — — — — — 1,892.8
Total discretionary rate settingproducts . . . . . . . . . . . . . . . . . . $38,762.6 $2,889.0 $2,692.7 $1,007.5 $781.5 $1,097.0 $47,230.3
Percentage of Total . . . . . . . . . . . 82.1% 6.1% 5.7% 2.1% 1.7% 2.3% 100.0%
(1) Includes only the account values for investment spread products with GMIRs and discretionary crediting rates, net ofpolicy loans. Excludes Stabilizer products, which are fee based. Also, excludes the portion of the account value of FIAproducts for which the crediting rate is based on market indexed strategies.
(2) Represents MYGAs contracts with renewal dates after December 31, 2016 on which we are required to credit interestabove the contractual GMIR for at least the next twelve months.
Market Risk Related to Equity Market Prices
Our variable products, Fixed-Indexed Annuity (“FIA”) products, indexed universal life (“IUL”) insurance products and generalaccount equity securities are significantly influenced by global equity markets. Increases or decreases in equity markets impactcertain assets and liabilities related to our variable products and our earnings derived from those products. Our variable productsinclude variable annuity contracts and variable life insurance.
We assess equity risk exposures for financial assets, liabilities and derivatives using hypothetical test scenarios that assumeeither an increase or decrease of 10% in all equity market benchmark levels. The following tables summarize the net estimatedpotential change in fair value from an instantaneous increase and decrease in all equity market benchmark levels of 10% as ofDecember 31, 2015 and 2014. In calculating these amounts, we exclude separate account equity securities related to productsfor which the investment risk is borne primarily by the separate account contract holder rather than by us. While the testscenarios are for illustrative purposes only and do not reflect our expectations regarding the future performance of equitymarkets, they are near-term, reasonably possible hypothetical changes that illustrate the potential impact of such events. Thesescenarios consider only the direct effect on fair value of declines in equity benchmark market levels and not changes in asset-based fees recognized as revenue, changes in our estimates of total gross profits used as a basis for amortizing DAC/VOBA,other intangibles and other costs, or changes in any other assumptions such as market volatility or mortality, utilization orpersistency rates in variable contracts that could also impact the fair value of our living benefits features. In addition, thesescenarios do not reflect the effect of basis risk, such as potential differences in the performance of the investment fundsunderlying the variable annuity products relative to the equity market benchmark we use as a basis for developing our hedgingstrategy. The impact of basis risk could result in larger differences between the change in fair value of the equity-basedderivatives and the related living benefit features, in comparison to the hypothetical test scenarios.
188
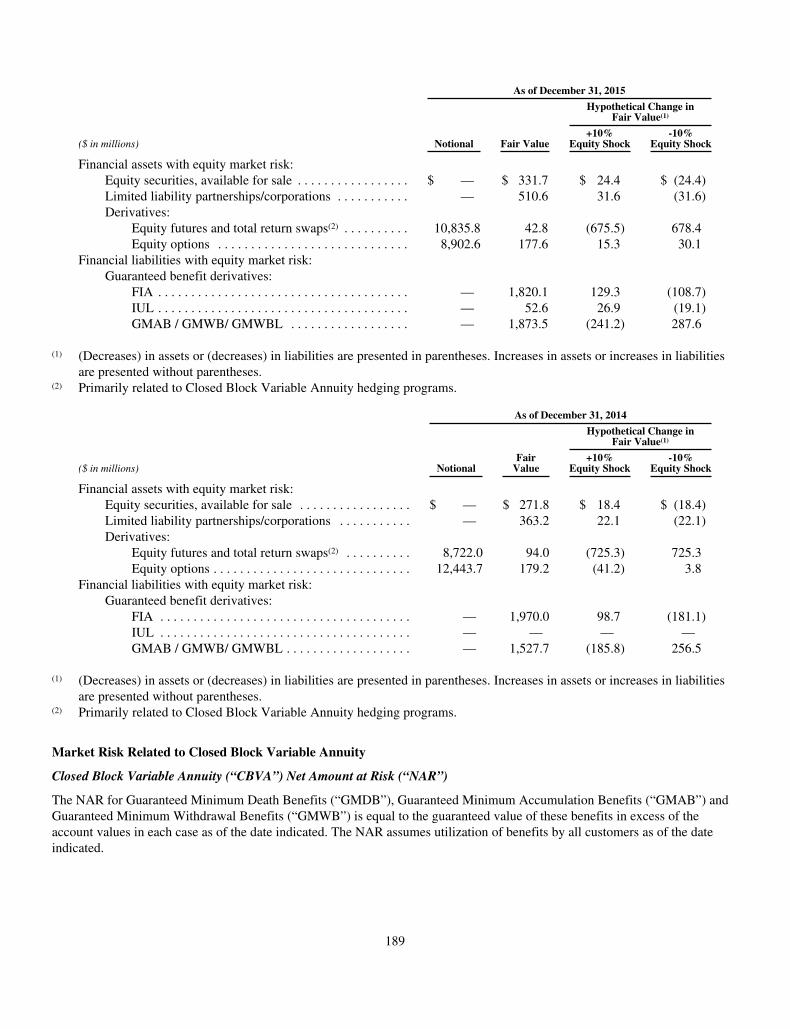
As of December 31, 2015
Hypothetical Change inFair Value(1)
($ in millions) Notional Fair Value+10%
Equity Shock-10%
Equity Shock
Financial assets with equity market risk:Equity securities, available for sale . . . . . . . . . . . . . . . . . $ — $ 331.7 $ 24.4 $ (24.4)Limited liability partnerships/corporations . . . . . . . . . . . — 510.6 31.6 (31.6)Derivatives:
Equity futures and total return swaps(2) . . . . . . . . . . 10,835.8 42.8 (675.5) 678.4Equity options . . . . . . . . . . . . . . . . . . . . . . . . . . . . . 8,902.6 177.6 15.3 30.1
Financial liabilities with equity market risk:Guaranteed benefit derivatives:
FIA . . . . . . . . . . . . . . . . . . . . . . . . . . . . . . . . . . . . . . — 1,820.1 129.3 (108.7)IUL . . . . . . . . . . . . . . . . . . . . . . . . . . . . . . . . . . . . . . — 52.6 26.9 (19.1)GMAB / GMWB/ GMWBL . . . . . . . . . . . . . . . . . . — 1,873.5 (241.2) 287.6
(1) (Decreases) in assets or (decreases) in liabilities are presented in parentheses. Increases in assets or increases in liabilitiesare presented without parentheses.
(2) Primarily related to Closed Block Variable Annuity hedging programs.
As of December 31, 2014
Hypothetical Change inFair Value(1)
($ in millions) NotionalFair
Value+10%
Equity Shock-10%
Equity Shock
Financial assets with equity market risk:Equity securities, available for sale . . . . . . . . . . . . . . . . . $ — $ 271.8 $ 18.4 $ (18.4)Limited liability partnerships/corporations . . . . . . . . . . . — 363.2 22.1 (22.1)Derivatives:
Equity futures and total return swaps(2) . . . . . . . . . . 8,722.0 94.0 (725.3) 725.3Equity options . . . . . . . . . . . . . . . . . . . . . . . . . . . . . . 12,443.7 179.2 (41.2) 3.8
Financial liabilities with equity market risk:Guaranteed benefit derivatives:
FIA . . . . . . . . . . . . . . . . . . . . . . . . . . . . . . . . . . . . . . — 1,970.0 98.7 (181.1)IUL . . . . . . . . . . . . . . . . . . . . . . . . . . . . . . . . . . . . . . — — — —GMAB / GMWB/ GMWBL . . . . . . . . . . . . . . . . . . . — 1,527.7 (185.8) 256.5
(1) (Decreases) in assets or (decreases) in liabilities are presented in parentheses. Increases in assets or increases in liabilitiesare presented without parentheses.
(2) Primarily related to Closed Block Variable Annuity hedging programs.
Market Risk Related to Closed Block Variable Annuity
Closed Block Variable Annuity (“CBVA”) Net Amount at Risk (“NAR”)
The NAR for Guaranteed Minimum Death Benefits (“GMDB”), Guaranteed Minimum Accumulation Benefits (“GMAB”) andGuaranteed Minimum Withdrawal Benefits (“GMWB”) is equal to the guaranteed value of these benefits in excess of theaccount values in each case as of the date indicated. The NAR assumes utilization of benefits by all customers as of the dateindicated.
189
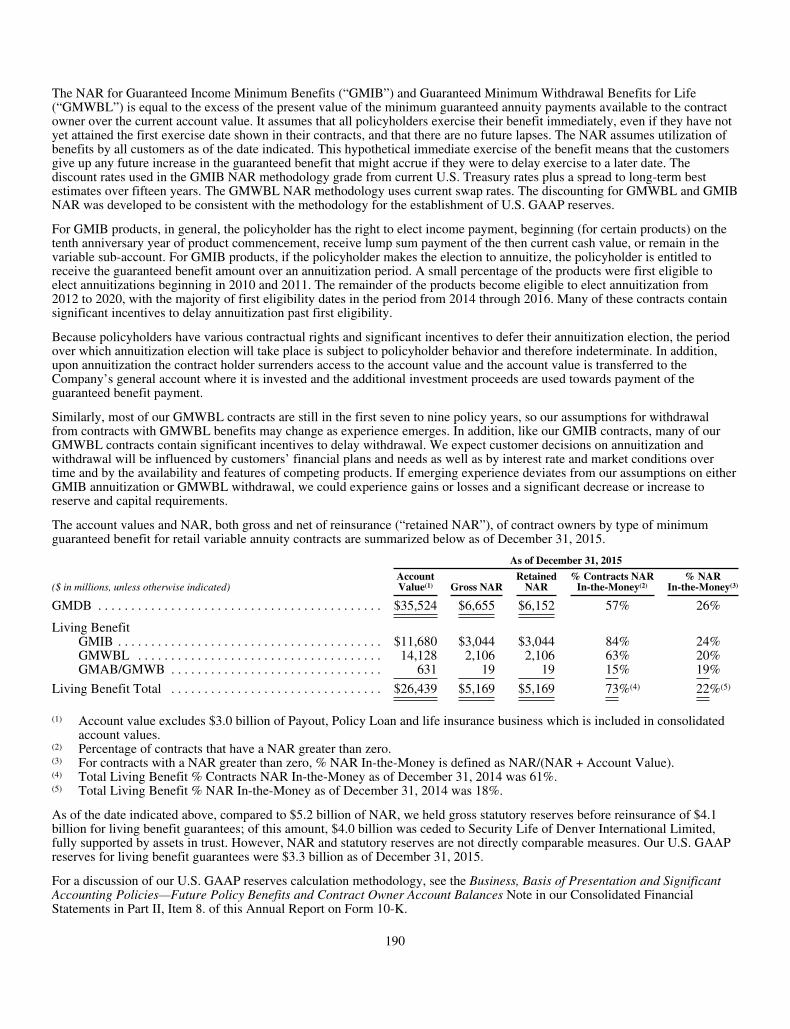
The NAR for Guaranteed Income Minimum Benefits (“GMIB”) and Guaranteed Minimum Withdrawal Benefits for Life(“GMWBL”) is equal to the excess of the present value of the minimum guaranteed annuity payments available to the contractowner over the current account value. It assumes that all policyholders exercise their benefit immediately, even if they have notyet attained the first exercise date shown in their contracts, and that there are no future lapses. The NAR assumes utilization ofbenefits by all customers as of the date indicated. This hypothetical immediate exercise of the benefit means that the customersgive up any future increase in the guaranteed benefit that might accrue if they were to delay exercise to a later date. Thediscount rates used in the GMIB NAR methodology grade from current U.S. Treasury rates plus a spread to long-term bestestimates over fifteen years. The GMWBL NAR methodology uses current swap rates. The discounting for GMWBL and GMIBNAR was developed to be consistent with the methodology for the establishment of U.S. GAAP reserves.
For GMIB products, in general, the policyholder has the right to elect income payment, beginning (for certain products) on thetenth anniversary year of product commencement, receive lump sum payment of the then current cash value, or remain in thevariable sub-account. For GMIB products, if the policyholder makes the election to annuitize, the policyholder is entitled toreceive the guaranteed benefit amount over an annuitization period. A small percentage of the products were first eligible toelect annuitizations beginning in 2010 and 2011. The remainder of the products become eligible to elect annuitization from2012 to 2020, with the majority of first eligibility dates in the period from 2014 through 2016. Many of these contracts containsignificant incentives to delay annuitization past first eligibility.
Because policyholders have various contractual rights and significant incentives to defer their annuitization election, the periodover which annuitization election will take place is subject to policyholder behavior and therefore indeterminate. In addition,upon annuitization the contract holder surrenders access to the account value and the account value is transferred to theCompany’s general account where it is invested and the additional investment proceeds are used towards payment of theguaranteed benefit payment.
Similarly, most of our GMWBL contracts are still in the first seven to nine policy years, so our assumptions for withdrawalfrom contracts with GMWBL benefits may change as experience emerges. In addition, like our GMIB contracts, many of ourGMWBL contracts contain significant incentives to delay withdrawal. We expect customer decisions on annuitization andwithdrawal will be influenced by customers’ financial plans and needs as well as by interest rate and market conditions overtime and by the availability and features of competing products. If emerging experience deviates from our assumptions on eitherGMIB annuitization or GMWBL withdrawal, we could experience gains or losses and a significant decrease or increase toreserve and capital requirements.
The account values and NAR, both gross and net of reinsurance (“retained NAR”), of contract owners by type of minimumguaranteed benefit for retail variable annuity contracts are summarized below as of December 31, 2015.
As of December 31, 2015
($ in millions, unless otherwise indicated)AccountValue(1) Gross NAR
RetainedNAR
% Contracts NARIn-the-Money(2)
% NARIn-the-Money(3)
GMDB . . . . . . . . . . . . . . . . . . . . . . . . . . . . . . . . . . . . . . . . . . . $35,524 $6,655 $6,152 57% 26%
Living BenefitGMIB . . . . . . . . . . . . . . . . . . . . . . . . . . . . . . . . . . . . . . . . $11,680 $3,044 $3,044 84% 24%GMWBL . . . . . . . . . . . . . . . . . . . . . . . . . . . . . . . . . . . . . 14,128 2,106 2,106 63% 20%GMAB/GMWB . . . . . . . . . . . . . . . . . . . . . . . . . . . . . . . . 631 19 19 15% 19%
Living Benefit Total . . . . . . . . . . . . . . . . . . . . . . . . . . . . . . . . $26,439 $5,169 $5,169 73%(4) 22%(5)
(1) Account value excludes $3.0 billion of Payout, Policy Loan and life insurance business which is included in consolidatedaccount values.
(2) Percentage of contracts that have a NAR greater than zero.(3) For contracts with a NAR greater than zero, % NAR In-the-Money is defined as NAR/(NAR + Account Value).(4) Total Living Benefit % Contracts NAR In-the-Money as of December 31, 2014 was 61%.(5) Total Living Benefit % NAR In-the-Money as of December 31, 2014 was 18%.
As of the date indicated above, compared to $5.2 billion of NAR, we held gross statutory reserves before reinsurance of $4.1billion for living benefit guarantees; of this amount, $4.0 billion was ceded to Security Life of Denver International Limited,fully supported by assets in trust. However, NAR and statutory reserves are not directly comparable measures. Our U.S. GAAPreserves for living benefit guarantees were $3.3 billion as of December 31, 2015.
For a discussion of our U.S. GAAP reserves calculation methodology, see the Business, Basis of Presentation and SignificantAccounting Policies—Future Policy Benefits and Contract Owner Account Balances Note in our Consolidated FinancialStatements in Part II, Item 8. of this Annual Report on Form 10-K.
190
Variable Annuity Hedge Program
Variable Annuity Guarantee Hedge Program
We primarily mitigate CBVA market risk exposures through hedging. Market risk arises primarily from the minimumguarantees within the CBVA products, whose economic costs are primarily dependent on future equity market returns, interestrate levels, equity volatility levels and policyholder behavior. The Variable Annuity Guarantee Hedge Program is used tomitigate our exposure to equity market and interest rate changes and seeks to ensure that the required assets are available tosatisfy future death benefit and living benefit obligations. While the Variable Annuity Guarantee Hedge Program does notexplicitly hedge statutory or U.S. GAAP reserves, as markets move up or down, in aggregate the returns generated by theVariable Annuity Guarantee Hedge Program will significantly offset the statutory and U.S. GAAP reserve changes due tomarket movements.
The objective of the Variable Annuity Guarantee Hedge Program is to offset changes in equity market returns for mostminimum guaranteed death benefits and all guaranteed living benefits, while also providing interest rate protection for certainminimum guaranteed living benefits. We hedge the equity market exposure using a hedge target set using market consistentvaluation techniques for all guaranteed living benefits and most death benefits. We also hedge a portion of the interest rate riskin our GMWB/GMAB/GMWBL blocks using a market consistent valuation hedge target. The Variable Annuity GuaranteeHedge Program does not hedge interest rate risks for our GMIB or GMDB. However, interest rate risk is fully hedged to ourtargets with inclusion of the Variable Annuity Capital Hedge Overlay (“CHO”) Program, which is discussed below. Thesehedge targets may change over time with market movements, changes in regulatory and rating agency capital, availablecollateral and our risk tolerance.
Equity index futures on various equity indices are used to mitigate the risk of the change in value of the policyholder-directedseparate account funds underlying the CBVA contracts with minimum guarantees. A dynamic trading program is utilized toseek replication of the performance of targeted fund groups (i.e., the fund groups that can be covered by indices where liquidfutures markets exist).
Total return swaps are also used to mitigate the risk of the change in value of certain policyholder directed separate accountfunds. These include fund classes such as emerging markets and real estate. They may also be used instead of futures of moreliquid indices where it may be deemed advantageous. This hedging strategy is employed at our discretion based on current riskexposures and related transaction costs.
Interest rate swaps are used to match a portion of the hedge targets on GMWB/GMAB/GMWBL as described above.
Variance swaps and equity options were used to mitigate the impact of changes in equity volatility on the economic liabilitiesassociated with certain minimum guaranteed living benefits. In the second quarter of 2015, we chose to cease this programbecause of the limited benefit of it covering a small block of business.
Foreign exchange forwards are used to mitigate the impact of policyholder-directed investments in international funds withexposure to fluctuations in exchange rates of certain foreign currencies. Rebalancing is performed based on pre-determinednotional exposures to the specific currencies.
Variable Annuity CHO Program
CBVA guaranteed benefits are hedged based on their economic or fair value; however, the statutory reserves and rating agencyrequired assets are not based on a market value. When equity markets decrease, the statutory reserve and rating agency requiredassets for the CBVA guaranteed benefits can increase more quickly than the value of the derivatives held under the VariableAnnuity Guarantee Hedge Program. This causes regulatory reserves to increase and rating agency capital to decrease. The CHOprogram is intended to mitigate market risk to the regulatory and rating agency capital of the Company. The hedge is executedthrough the purchase and sale of equity index derivatives, variance and credit default swaps , and is designed to limit theuncovered reserve and rating agency capital increases and certain rebalancing costs in an immediate down equity market, creditspread widening or increased volatility scenario to an amount we believe prudent for a company of our size and scale. Thisamount will change over time with market movements, changes in regulatory and rating agency capital, available collateral andour risk tolerance.
191
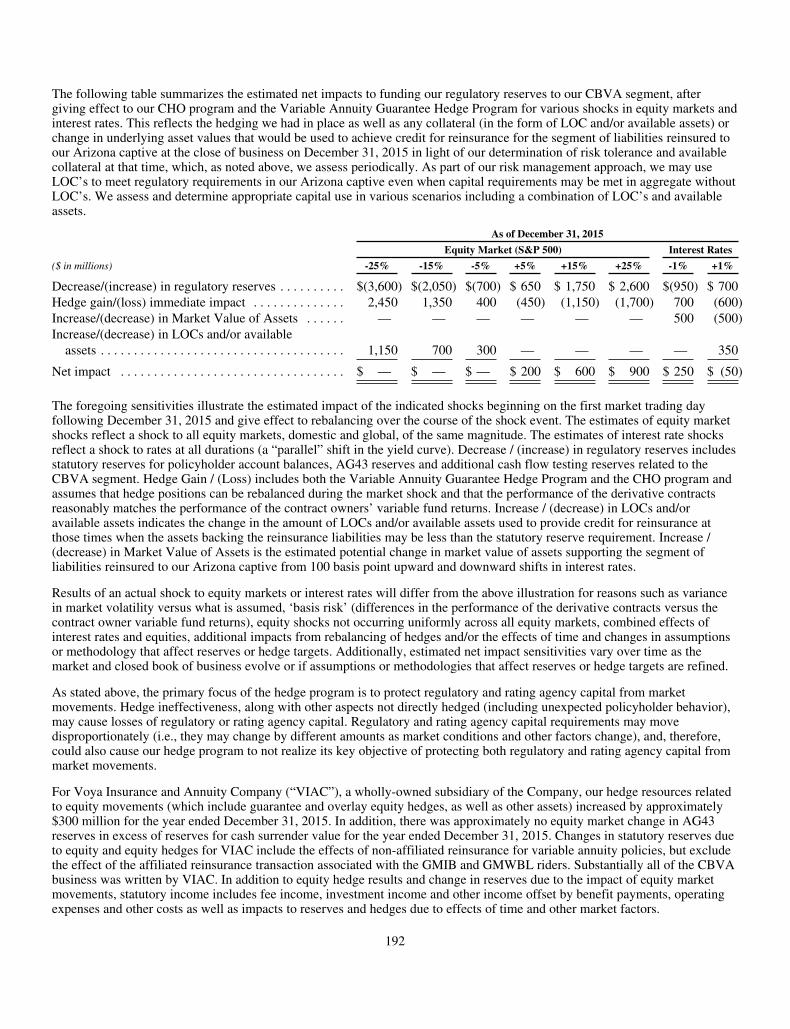
The following table summarizes the estimated net impacts to funding our regulatory reserves to our CBVA segment, aftergiving effect to our CHO program and the Variable Annuity Guarantee Hedge Program for various shocks in equity markets andinterest rates. This reflects the hedging we had in place as well as any collateral (in the form of LOC and/or available assets) orchange in underlying asset values that would be used to achieve credit for reinsurance for the segment of liabilities reinsured toour Arizona captive at the close of business on December 31, 2015 in light of our determination of risk tolerance and availablecollateral at that time, which, as noted above, we assess periodically. As part of our risk management approach, we may useLOC’s to meet regulatory requirements in our Arizona captive even when capital requirements may be met in aggregate withoutLOC’s. We assess and determine appropriate capital use in various scenarios including a combination of LOC’s and availableassets.
As of December 31, 2015
Equity Market (S&P 500) Interest Rates
($ in millions) -25% -15% -5% +5% +15% +25% -1% +1%
Decrease/(increase) in regulatory reserves . . . . . . . . . . $(3,600) $(2,050) $(700) $ 650 $ 1,750 $ 2,600 $(950) $ 700Hedge gain/(loss) immediate impact . . . . . . . . . . . . . . 2,450 1,350 400 (450) (1,150) (1,700) 700 (600)Increase/(decrease) in Market Value of Assets . . . . . . — — — — — — 500 (500)Increase/(decrease) in LOCs and/or available
assets . . . . . . . . . . . . . . . . . . . . . . . . . . . . . . . . . . . . . 1,150 700 300 — — — — 350
Net impact . . . . . . . . . . . . . . . . . . . . . . . . . . . . . . . . . . $ — $ — $ — $ 200 $ 600 $ 900 $ 250 $ (50)
The foregoing sensitivities illustrate the estimated impact of the indicated shocks beginning on the first market trading dayfollowing December 31, 2015 and give effect to rebalancing over the course of the shock event. The estimates of equity marketshocks reflect a shock to all equity markets, domestic and global, of the same magnitude. The estimates of interest rate shocksreflect a shock to rates at all durations (a “parallel” shift in the yield curve). Decrease / (increase) in regulatory reserves includesstatutory reserves for policyholder account balances, AG43 reserves and additional cash flow testing reserves related to theCBVA segment. Hedge Gain / (Loss) includes both the Variable Annuity Guarantee Hedge Program and the CHO program andassumes that hedge positions can be rebalanced during the market shock and that the performance of the derivative contractsreasonably matches the performance of the contract owners’ variable fund returns. Increase / (decrease) in LOCs and/oravailable assets indicates the change in the amount of LOCs and/or available assets used to provide credit for reinsurance atthose times when the assets backing the reinsurance liabilities may be less than the statutory reserve requirement. Increase /(decrease) in Market Value of Assets is the estimated potential change in market value of assets supporting the segment ofliabilities reinsured to our Arizona captive from 100 basis point upward and downward shifts in interest rates.
Results of an actual shock to equity markets or interest rates will differ from the above illustration for reasons such as variancein market volatility versus what is assumed, ‘basis risk’ (differences in the performance of the derivative contracts versus thecontract owner variable fund returns), equity shocks not occurring uniformly across all equity markets, combined effects ofinterest rates and equities, additional impacts from rebalancing of hedges and/or the effects of time and changes in assumptionsor methodology that affect reserves or hedge targets. Additionally, estimated net impact sensitivities vary over time as themarket and closed book of business evolve or if assumptions or methodologies that affect reserves or hedge targets are refined.
As stated above, the primary focus of the hedge program is to protect regulatory and rating agency capital from marketmovements. Hedge ineffectiveness, along with other aspects not directly hedged (including unexpected policyholder behavior),may cause losses of regulatory or rating agency capital. Regulatory and rating agency capital requirements may movedisproportionately (i.e., they may change by different amounts as market conditions and other factors change), and, therefore,could also cause our hedge program to not realize its key objective of protecting both regulatory and rating agency capital frommarket movements.
For Voya Insurance and Annuity Company (“VIAC”), a wholly-owned subsidiary of the Company, our hedge resources relatedto equity movements (which include guarantee and overlay equity hedges, as well as other assets) increased by approximately$300 million for the year ended December 31, 2015. In addition, there was approximately no equity market change in AG43reserves in excess of reserves for cash surrender value for the year ended December 31, 2015. Changes in statutory reserves dueto equity and equity hedges for VIAC include the effects of non-affiliated reinsurance for variable annuity policies, but excludethe effect of the affiliated reinsurance transaction associated with the GMIB and GMWBL riders. Substantially all of the CBVAbusiness was written by VIAC. In addition to equity hedge results and change in reserves due to the impact of equity marketmovements, statutory income includes fee income, investment income and other income offset by benefit payments, operatingexpenses and other costs as well as impacts to reserves and hedges due to effects of time and other market factors.
192
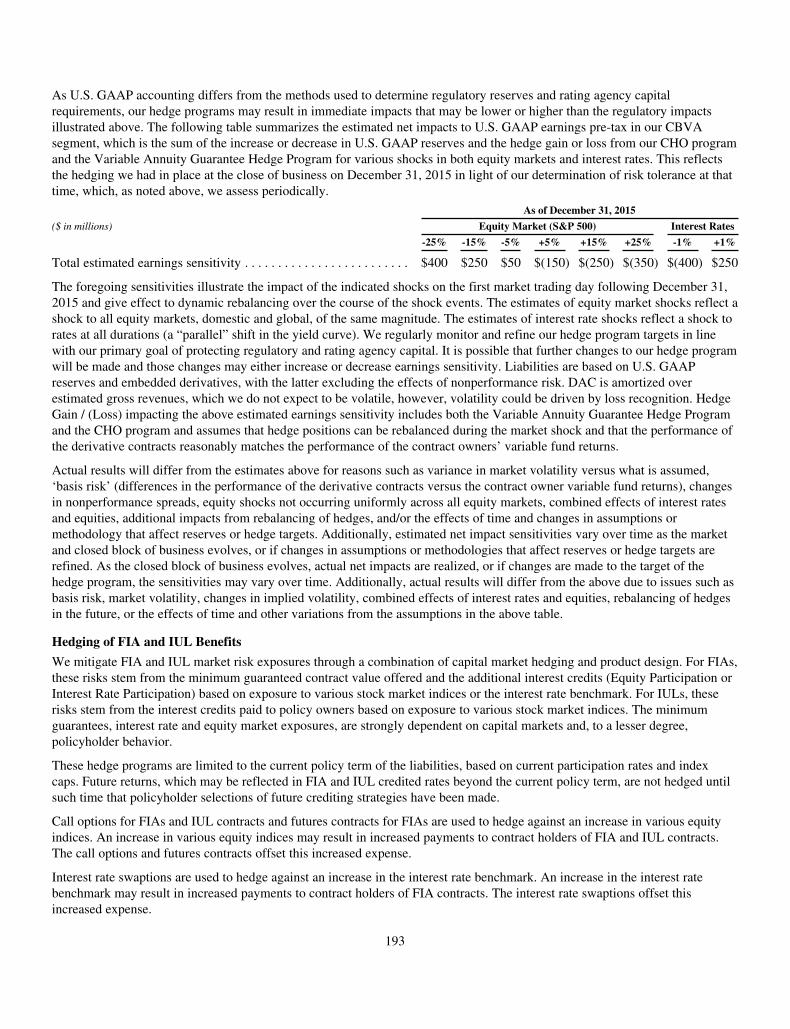
As U.S. GAAP accounting differs from the methods used to determine regulatory reserves and rating agency capitalrequirements, our hedge programs may result in immediate impacts that may be lower or higher than the regulatory impactsillustrated above. The following table summarizes the estimated net impacts to U.S. GAAP earnings pre-tax in our CBVAsegment, which is the sum of the increase or decrease in U.S. GAAP reserves and the hedge gain or loss from our CHO programand the Variable Annuity Guarantee Hedge Program for various shocks in both equity markets and interest rates. This reflectsthe hedging we had in place at the close of business on December 31, 2015 in light of our determination of risk tolerance at thattime, which, as noted above, we assess periodically.
As of December 31, 2015
($ in millions) Equity Market (S&P 500) Interest Rates
-25% -15% -5% +5% +15% +25% -1% +1%
Total estimated earnings sensitivity . . . . . . . . . . . . . . . . . . . . . . . . . $400 $250 $50 $(150) $(250) $(350) $(400) $250
The foregoing sensitivities illustrate the impact of the indicated shocks on the first market trading day following December 31,2015 and give effect to dynamic rebalancing over the course of the shock events. The estimates of equity market shocks reflect ashock to all equity markets, domestic and global, of the same magnitude. The estimates of interest rate shocks reflect a shock torates at all durations (a “parallel” shift in the yield curve). We regularly monitor and refine our hedge program targets in linewith our primary goal of protecting regulatory and rating agency capital. It is possible that further changes to our hedge programwill be made and those changes may either increase or decrease earnings sensitivity. Liabilities are based on U.S. GAAPreserves and embedded derivatives, with the latter excluding the effects of nonperformance risk. DAC is amortized overestimated gross revenues, which we do not expect to be volatile, however, volatility could be driven by loss recognition. HedgeGain / (Loss) impacting the above estimated earnings sensitivity includes both the Variable Annuity Guarantee Hedge Programand the CHO program and assumes that hedge positions can be rebalanced during the market shock and that the performance ofthe derivative contracts reasonably matches the performance of the contract owners’ variable fund returns.
Actual results will differ from the estimates above for reasons such as variance in market volatility versus what is assumed,‘basis risk’ (differences in the performance of the derivative contracts versus the contract owner variable fund returns), changesin nonperformance spreads, equity shocks not occurring uniformly across all equity markets, combined effects of interest ratesand equities, additional impacts from rebalancing of hedges, and/or the effects of time and changes in assumptions ormethodology that affect reserves or hedge targets. Additionally, estimated net impact sensitivities vary over time as the marketand closed block of business evolves, or if changes in assumptions or methodologies that affect reserves or hedge targets arerefined. As the closed block of business evolves, actual net impacts are realized, or if changes are made to the target of thehedge program, the sensitivities may vary over time. Additionally, actual results will differ from the above due to issues such asbasis risk, market volatility, changes in implied volatility, combined effects of interest rates and equities, rebalancing of hedgesin the future, or the effects of time and other variations from the assumptions in the above table.
Hedging of FIA and IUL Benefits
We mitigate FIA and IUL market risk exposures through a combination of capital market hedging and product design. For FIAs,these risks stem from the minimum guaranteed contract value offered and the additional interest credits (Equity Participation orInterest Rate Participation) based on exposure to various stock market indices or the interest rate benchmark. For IULs, theserisks stem from the interest credits paid to policy owners based on exposure to various stock market indices. The minimumguarantees, interest rate and equity market exposures, are strongly dependent on capital markets and, to a lesser degree,policyholder behavior.
These hedge programs are limited to the current policy term of the liabilities, based on current participation rates and indexcaps. Future returns, which may be reflected in FIA and IUL credited rates beyond the current policy term, are not hedged untilsuch time that policyholder selections of future crediting strategies have been made.
Call options for FIAs and IUL contracts and futures contracts for FIAs are used to hedge against an increase in various equityindices. An increase in various equity indices may result in increased payments to contract holders of FIA and IUL contracts.The call options and futures contracts offset this increased expense.
Interest rate swaptions are used to hedge against an increase in the interest rate benchmark. An increase in the interest ratebenchmark may result in increased payments to contract holders of FIA contracts. The interest rate swaptions offset thisincreased expense.
193

Market Risk Related to Credit Risk
Credit risk is primarily embedded in the general account portfolio. The carrying value of our fixed maturity, including securitiespledged, and equity portfolio totaled $72.4 billion and $74.9 billion as of December 31, 2015 and 2014, respectively. Our creditrisk materializes primarily as impairment losses and/or credit risk related trading losses. We are exposed to occasional cyclicaleconomic downturns, during which impairment losses may be significantly higher than the long-term historical average. This isoffset by years where we expect the actual impairment losses to be substantially lower than the long-term average.
Credit risk in the portfolio can also materialize as increased capital requirements caused by rating down-grades. The effect ofrating migration on our capital requirements is also dependent on the economic cycle and increased asset impairment levels maygo hand in hand with increased asset related capital requirements.
We manage the risk of default and rating migration by applying disciplined credit evaluation and underwriting standards andprudently limiting allocations to lower quality, higher risk investments. In addition, we diversify our exposure by issuer andcountry, using rating based issuer and country limits, as well as by industry segment, using specific investment constraints.Limit compliance is monitored on a daily, monthly or quarterly basis. Limit violations are reported to senior management andwe are actively involved in decisions around curing such limit violations.
We also have credit risk related to the ability of our derivatives and reinsurance counterparties to honor their obligations to paythe contract amounts under various agreements. In order to minimize the risk of credit loss on such contracts, we diversify ourexposures among several counterparties and limit the amount of exposure to each based on credit rating. For mostcounterparties, we have collateral agreements in place that would substantially limit our credit losses in case of a counterpartydefault. We also generally limit our selection of counterparties that we do new transactions with to those with an “A-” creditrating or above. When exceptions are made to that principle, we ensure that we obtain collateral to mitigate our risk of loss. Forderivatives counterparty risk exposures (which includes reverse repurchase and securities lending transactions), we measure andmonitor our risks on a market value basis daily.
194

The following table summarizes our reinsurance recoverable balances, including collateral received and credit and financialstrength ratings for our 10 largest reinsurance recoverable balances as of December 31, 2015:
($ in millions)Financial
Strength Rating Credit Rating
Parent Company/Principal ReinsurersReinsuranceRecoverable
%Collateralized(1) S&P Moody’s S&P Moody’s
Hannover RE Group . . . . . . . . . . . . . . . . . . . . . . . . . . . . . . . . . . $2,480 88% AA- NR(2)
Hannover Life Reassurance Co of America . . . . . . . . AA- NR(2)
Hannover Re (Ireland) Ltd . . . . . . . . . . . . . . . . . . . . . AA- NR(2)
Lincoln National Corp . . . . . . . . . . . . . . . . . . . . . . . . . . . . . . . . 1,849 96% A- Baa1Lincoln Life & Annuity Company of New York . . . . AA- A1Lincoln National Life Insurance Co . . . . . . . . . . . . . . AA- A1
Reinsurance Group of America Inc . . . . . . . . . . . . . . . . . . . . . . 1,297 88% A- Baa1RGA Reinsurance Company . . . . . . . . . . . . . . . . . . . . AA- A1
Prudential Plc (U.K.) . . . . . . . . . . . . . . . . . . . . . . . . . . . . . . . . . 534 59% A+ A2Jackson National Life Insurance Co . . . . . . . . . . . . . . AA A1
Scottish Re Group Ltd . . . . . . . . . . . . . . . . . . . . . . . . . . . . . . . . 289 92% NR(2) NR(2)
Ballantyne Re Plc . . . . . . . . . . . . . . . . . . . . . . . . . . . . NR(2) NR(2)
Scottish Re (US) Inc . . . . . . . . . . . . . . . . . . . . . . . . . . NR(2) NR(2)
Scottish Re Life (Bermuda) Ltd . . . . . . . . . . . . . . . . . NR(2) NR(2)
Scottish Re Life Corp . . . . . . . . . . . . . . . . . . . . . . . . . NR(2) NR(2)
Enstar Group Limited . . . . . . . . . . . . . . . . . . . . . . . . . . . . . . . . . 268 98% BBB- NR(2)
Clarendon National Insurance Co . . . . . . . . . . . . . . . . NR(2) NR(2)
Fitzwilliam Insurance Ltd . . . . . . . . . . . . . . . . . . . . . . NR(2) NR(2)
Swiss Re Ltd . . . . . . . . . . . . . . . . . . . . . . . . . . . . . . . . . . . . . . . . 215 0% AA- Aa3Westport Insurance Corp . . . . . . . . . . . . . . . . . . . . . . AA- A1Swiss Re Life & Health America Inc . . . . . . . . . . . . . AA- Aa3
Assurant Inc . . . . . . . . . . . . . . . . . . . . . . . . . . . . . . . . . . . . . . . . 191 3% BBB+ Baa2Union Security Insurance Co . . . . . . . . . . . . . . . . . . . A- A3Union Security Life Insurance Co of New York . . . . NR(2) NR(2)
Aegon N.V. . . . . . . . . . . . . . . . . . . . . . . . . . . . . . . . . . . . . . . . . . 124 0% A- A3Transamerica Financial Life Insurance Co . . . . . . . . . AA- A1Transamerica Life Insurance Co . . . . . . . . . . . . . . . . . AA- A1
Humana Inc . . . . . . . . . . . . . . . . . . . . . . . . . . . . . . . . . . . . . . . . . 41 0% BBB+ Baa3Kanawha Insurance Co . . . . . . . . . . . . . . . . . . . . . . . . BBB NR(2)
All Other Reinsurers . . . . . . . . . . . . . . . . . . . . . . . . . . . . . . . . . . 366 11%
Total . . . . . . . . . . . . . . . . . . . . . . . . . . . . . . . . . . . . . . . . . . . . . . $7,654 79%
(1) Collateral includes LOCs, assets held in trust and funds withheld. Percent collateralized is based on the total of individualcontractual exposures aggregated at the reinsurer Parent Company level, which may differ for each individual contractualexposure.
(2) Not rated.
In the normal course of business, certain reinsurance recoverables are subject to reviews by the reinsurers. We are not aware ofany material disputes arising from these reviews or other communications with the counterparties that would affectcollectability, and, therefore, as of December 31, 2015, no allowance for uncollectible amounts was recorded.
195

The following tables summarize the outstanding notional amount by contract type of exchange traded derivatives and over thecounter derivatives, which includes cleared derivatives, as of December 31, 2015 and 2014:
As of December 31, 2015
Derivative Notional Amounts
($ in millions)ExchangeTraded
Over TheCounter (OTC)
TotalNotional
Type of ContractCredit Contracts . . . . . . . . . . . . . . . . . . . . . . . . . . . . . . . . . . $ — $ 4,266.3 $ 4,266.3Equity Contracts . . . . . . . . . . . . . . . . . . . . . . . . . . . . . . . . . . 7,703.5 12,034.9 19,738.4Foreign Exchange Contracts . . . . . . . . . . . . . . . . . . . . . . . . — 1,456.6 1,456.6Interest Rate Contracts . . . . . . . . . . . . . . . . . . . . . . . . . . . . . 9,099.2 57,145.6 66,244.8
Total . . . . . . . . . . . . . . . . . . . . . . . . . . . . . . . . . . . . . . . $16,802.7 $74,903.4 $91,706.1
As of December 31, 2014
Derivative Notional Amounts
($ in millions)ExchangeTraded
Over TheCounter (OTC)
TotalNotional
Type of ContractCredit Contracts . . . . . . . . . . . . . . . . . . . . . . . . . . . . . . . . . . . $ — $ 4,221.0 $ 4,221.0Equity Contracts . . . . . . . . . . . . . . . . . . . . . . . . . . . . . . . . . . . 7,589.6 13,576.1 21,165.7Foreign Exchange Contracts . . . . . . . . . . . . . . . . . . . . . . . . . — 1,547.8 1,547.8Interest Rate Contracts . . . . . . . . . . . . . . . . . . . . . . . . . . . . . . — 67,776.4 67,776.4
Total . . . . . . . . . . . . . . . . . . . . . . . . . . . . . . . . . . . . . . . . $7,589.6 $87,121.3 $94,710.9
196

The following table summarizes our exposure by counterparty, including notional amount, fair value and the net exposure as ofdates indicated, demonstrating that we do not have a concentration of credit risk with our OTC derivative counterparties, whichincludes cleared derivative counterparties:
As of December 31, 2015
Concentration of OTC Derivative Counterparty
($ in millions, unless otherwise specified)NotionalAmount
AssetFair Value
LiabilityFair Value
OTCDerivativeExposure(1)
OTC Derivative CounterpartyBNP Paribas . . . . . . . . . . . . . . . . . . . . . . . . . . . . . . . . . . . . . . $ 7,694.7 $ 233.6 $ 50.5 $ 63.7Citibank, N.A. . . . . . . . . . . . . . . . . . . . . . . . . . . . . . . . . . . . . . 2,839.2 68.0 21.5 19.5Goldman Sachs International . . . . . . . . . . . . . . . . . . . . . . . . . 9,524.0 167.8 47.7 16.3Societe Generale . . . . . . . . . . . . . . . . . . . . . . . . . . . . . . . . . . . 4,307.5 123.4 41.0 15.4HSBC Bank USA, National Association . . . . . . . . . . . . . . . . 1,067.9 28.7 14.5 14.1Credit Agricole Corporate and Investment Bank . . . . . . . . . . 682.0 13.3 0.1 13.2Bank of America, N.A. . . . . . . . . . . . . . . . . . . . . . . . . . . . . . . 1,579.6 12.1 2.0 10.1JP Morgan Chase Bank, N.A. . . . . . . . . . . . . . . . . . . . . . . . . . 2,647.7 43.2 27.3 9.7Credit Suisse International . . . . . . . . . . . . . . . . . . . . . . . . . . . 4,065.4 161.9 36.1 8.0Morgan Stanley Capital Services LLC . . . . . . . . . . . . . . . . . . 3,683.1 73.1 13.6 6.0Barclays Bank, PLC . . . . . . . . . . . . . . . . . . . . . . . . . . . . . . . . 1,814.5 29.8 19.8 4.8The Royal Bank of Scotland PLC . . . . . . . . . . . . . . . . . . . . . 438.2 57.8 — 3.2Morgan Stanley & Co. LLC (CME) . . . . . . . . . . . . . . . . . . . . 23,015.5 340.3 167.0 3.1UBS AG . . . . . . . . . . . . . . . . . . . . . . . . . . . . . . . . . . . . . . . . . 695.2 2.3 — 2.3Wells Fargo Bank, N.A. . . . . . . . . . . . . . . . . . . . . . . . . . . . . . 3,359.7 52.4 7.9 1.9All Other OTC Counterparties . . . . . . . . . . . . . . . . . . . . . . . . 7,489.2 73.2 24.7 3.0
Total . . . . . . . . . . . . . . . . . . . . . . . . . . . . . . . . . . . . . . . . $74,903.4 $1,480.9 $473.7 $194.3
(1) Represents net exposure after offsetting derivative assets and liabilities of the same counterparty under enforceable nettingagreements and netting of collateral received and posted on a counterparty basis under CSAs.
The following table summarizes the maturities, associated notional, and fair value of our exchange traded derivatives and overthe counter derivatives, which includes cleared derivatives, as of December 31, 2015:
As of December 31, 2015
Volume of Derivative Activities
($ in millions)NotionalAmount
AssetFair Value
LiabilityFair Value
Net FairValue
By MaturityOTC Contracts:
Within 1 Year . . . . . . . . . . . . . . . . . . . . . . . . . . . . . . . . . . . . . . $18,671.9 $ 174.7 $ 54.4 $ 120.31 Year to 5 Years . . . . . . . . . . . . . . . . . . . . . . . . . . . . . . . . . . . 29,400.4 429.7 201.6 228.15 Years to 10 Years . . . . . . . . . . . . . . . . . . . . . . . . . . . . . . . . . 15,930.2 202.2 104.9 97.310 Years and longer . . . . . . . . . . . . . . . . . . . . . . . . . . . . . . . . . 10,900.9 674.3 112.8 561.5
Total OTC Contracts . . . . . . . . . . . . . . . . . . . . . . . . . . . . . . . . . . . . 74,903.4 1,480.9 473.7 1,007.2Exchange Traded Contracts . . . . . . . . . . . . . . . . . . . . . . . . . . . . . . . 16,802.7 57.6 13.8 43.8
Total Derivatives . . . . . . . . . . . . . . . . . . . . . . . . . . . . . . . . . . . . . . . $91,706.1 $1,538.5 $487.5 $1,051.0
During 2015, net cash settlements under OTC contracts (including cleared derivatives) were $37.1 million paid and net cashsettlements for exchange traded derivatives were $225.1 million paid. Net realized gains/(losses) on derivatives for the yearended December 31, 2015, were $126.4 million and $(277.7) million for OTC contracts (including cleared derivatives) andexchange traded contracts, respectively.
197
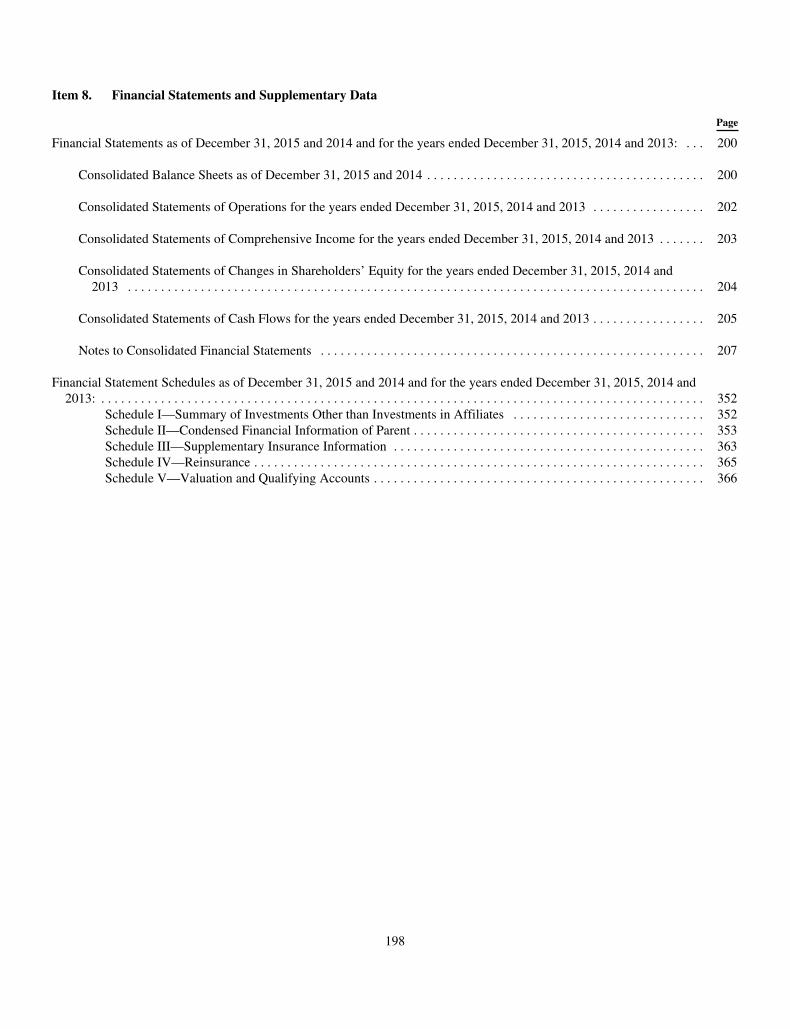
Item 8. Financial Statements and Supplementary Data
Page
Financial Statements as of December 31, 2015 and 2014 and for the years ended December 31, 2015, 2014 and 2013: . . . 200
Consolidated Balance Sheets as of December 31, 2015 and 2014 . . . . . . . . . . . . . . . . . . . . . . . . . . . . . . . . . . . . . . . . . . 200
Consolidated Statements of Operations for the years ended December 31, 2015, 2014 and 2013 . . . . . . . . . . . . . . . . . 202
Consolidated Statements of Comprehensive Income for the years ended December 31, 2015, 2014 and 2013 . . . . . . . 203
Consolidated Statements of Changes in Shareholders’ Equity for the years ended December 31, 2015, 2014 and2013 . . . . . . . . . . . . . . . . . . . . . . . . . . . . . . . . . . . . . . . . . . . . . . . . . . . . . . . . . . . . . . . . . . . . . . . . . . . . . . . . . . . . . . . 204
Consolidated Statements of Cash Flows for the years ended December 31, 2015, 2014 and 2013 . . . . . . . . . . . . . . . . . 205
Notes to Consolidated Financial Statements . . . . . . . . . . . . . . . . . . . . . . . . . . . . . . . . . . . . . . . . . . . . . . . . . . . . . . . . . . 207
Financial Statement Schedules as of December 31, 2015 and 2014 and for the years ended December 31, 2015, 2014 and2013: . . . . . . . . . . . . . . . . . . . . . . . . . . . . . . . . . . . . . . . . . . . . . . . . . . . . . . . . . . . . . . . . . . . . . . . . . . . . . . . . . . . . . . . . . . . 352
Schedule I—Summary of Investments Other than Investments in Affiliates . . . . . . . . . . . . . . . . . . . . . . . . . . . . . 352Schedule II—Condensed Financial Information of Parent . . . . . . . . . . . . . . . . . . . . . . . . . . . . . . . . . . . . . . . . . . . . 353Schedule III—Supplementary Insurance Information . . . . . . . . . . . . . . . . . . . . . . . . . . . . . . . . . . . . . . . . . . . . . . . 363Schedule IV—Reinsurance . . . . . . . . . . . . . . . . . . . . . . . . . . . . . . . . . . . . . . . . . . . . . . . . . . . . . . . . . . . . . . . . . . . . 365Schedule V—Valuation and Qualifying Accounts . . . . . . . . . . . . . . . . . . . . . . . . . . . . . . . . . . . . . . . . . . . . . . . . . . 366
198

Report of Independent Registered Public Accounting Firm
The Board of Directors and ShareholdersVoya Financial, Inc.
We have audited the accompanying consolidated balance sheets of Voya Financial, Inc. (the Company) as of December 31,2015 and 2014, and the related consolidated statements of operations, comprehensive income, changes in shareholders’ equityand cash flows for each of the three years in the period ended December 31, 2015. Our audits also included the financialstatement schedules listed in Item 15(a). These financial statements and schedules are the responsibility of the Company’smanagement. Our responsibility is to express an opinion on these financial statements and schedules based on our audits.
We conducted our audits in accordance with the standards of the Public Company Accounting Oversight Board (United States).Those standards require that we plan and perform the audit to obtain reasonable assurance about whether the financialstatements are free of material misstatement. An audit includes examining, on a test basis, evidence supporting the amounts anddisclosures in the financial statements. An audit also includes assessing the accounting principles used and significant estimatesmade by management, as well as evaluating the overall financial statement presentation. We believe that our audits provide areasonable basis for our opinion.
In our opinion, the financial statements referred to above present fairly, in all material respects, the consolidated financialposition of Voya Financial, Inc. at December 31, 2015 and 2014, and the consolidated results of their operations and their cashflows for each of the three years in the period ended December 31, 2015, in conformity with U.S. generally accepted accountingprinciples. Also, in our opinion, the related financial statement schedules, when considered in relation to the basic financialstatements taken as a whole, present fairly in all material respects the information set forth therein.
We also have audited, in accordance with the standards of the Public Company Accounting Oversight Board (United States),Voya Financial, Inc.’s internal control over financial reporting as of December 31, 2015, based on criteria established in InternalControl-Integrated Framework issued by the Committee of Sponsoring Organizations of the Treadway Commission (2013framework) and our report dated February 25, 2016 expressed an unqualified opinion thereon.
/s/ Ernst & Young LLP
Boston, MassachusettsFebruary 25, 2016
199
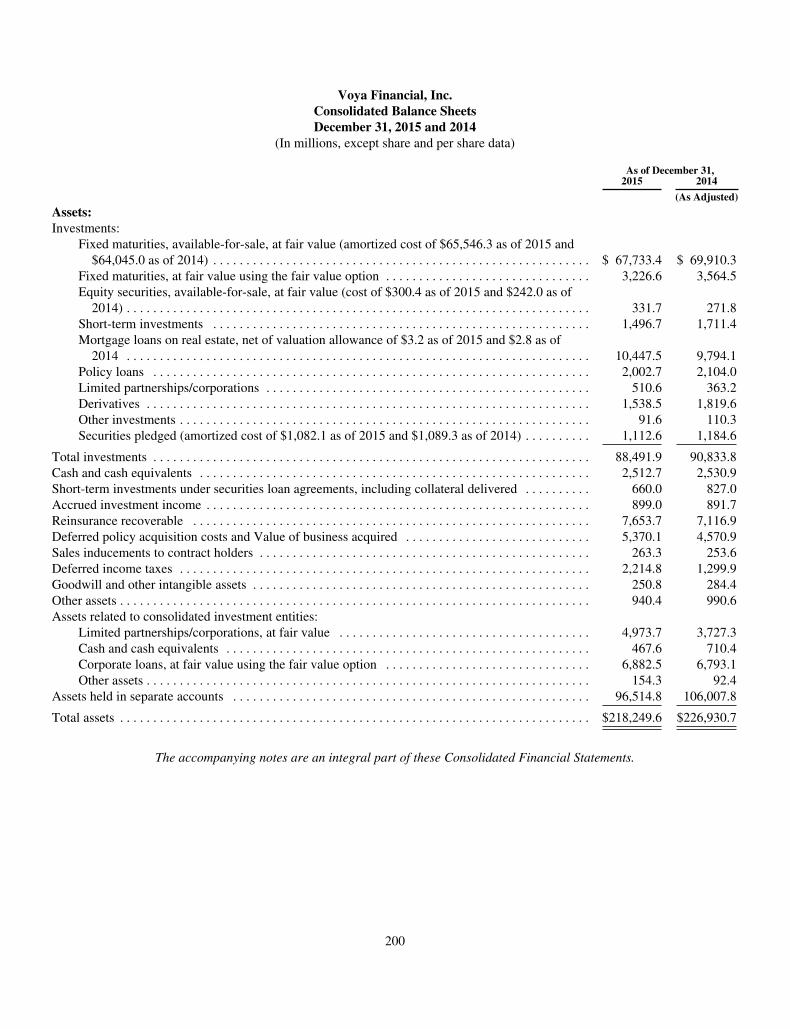
Voya Financial, Inc.Consolidated Balance SheetsDecember 31, 2015 and 2014
(In millions, except share and per share data)
As of December 31,2015 2014
(As Adjusted)
Assets:Investments:
Fixed maturities, available-for-sale, at fair value (amortized cost of $65,546.3 as of 2015 and$64,045.0 as of 2014) . . . . . . . . . . . . . . . . . . . . . . . . . . . . . . . . . . . . . . . . . . . . . . . . . . . . . . . . . $ 67,733.4 $ 69,910.3
Fixed maturities, at fair value using the fair value option . . . . . . . . . . . . . . . . . . . . . . . . . . . . . . . 3,226.6 3,564.5Equity securities, available-for-sale, at fair value (cost of $300.4 as of 2015 and $242.0 as of
2014) . . . . . . . . . . . . . . . . . . . . . . . . . . . . . . . . . . . . . . . . . . . . . . . . . . . . . . . . . . . . . . . . . . . . . . 331.7 271.8Short-term investments . . . . . . . . . . . . . . . . . . . . . . . . . . . . . . . . . . . . . . . . . . . . . . . . . . . . . . . . . 1,496.7 1,711.4Mortgage loans on real estate, net of valuation allowance of $3.2 as of 2015 and $2.8 as of
2014 . . . . . . . . . . . . . . . . . . . . . . . . . . . . . . . . . . . . . . . . . . . . . . . . . . . . . . . . . . . . . . . . . . . . . . 10,447.5 9,794.1Policy loans . . . . . . . . . . . . . . . . . . . . . . . . . . . . . . . . . . . . . . . . . . . . . . . . . . . . . . . . . . . . . . . . . . 2,002.7 2,104.0Limited partnerships/corporations . . . . . . . . . . . . . . . . . . . . . . . . . . . . . . . . . . . . . . . . . . . . . . . . . 510.6 363.2Derivatives . . . . . . . . . . . . . . . . . . . . . . . . . . . . . . . . . . . . . . . . . . . . . . . . . . . . . . . . . . . . . . . . . . . 1,538.5 1,819.6Other investments . . . . . . . . . . . . . . . . . . . . . . . . . . . . . . . . . . . . . . . . . . . . . . . . . . . . . . . . . . . . . . 91.6 110.3Securities pledged (amortized cost of $1,082.1 as of 2015 and $1,089.3 as of 2014) . . . . . . . . . . 1,112.6 1,184.6
Total investments . . . . . . . . . . . . . . . . . . . . . . . . . . . . . . . . . . . . . . . . . . . . . . . . . . . . . . . . . . . . . . . . . . 88,491.9 90,833.8Cash and cash equivalents . . . . . . . . . . . . . . . . . . . . . . . . . . . . . . . . . . . . . . . . . . . . . . . . . . . . . . . . . . . 2,512.7 2,530.9Short-term investments under securities loan agreements, including collateral delivered . . . . . . . . . . 660.0 827.0Accrued investment income . . . . . . . . . . . . . . . . . . . . . . . . . . . . . . . . . . . . . . . . . . . . . . . . . . . . . . . . . . 899.0 891.7Reinsurance recoverable . . . . . . . . . . . . . . . . . . . . . . . . . . . . . . . . . . . . . . . . . . . . . . . . . . . . . . . . . . . . 7,653.7 7,116.9Deferred policy acquisition costs and Value of business acquired . . . . . . . . . . . . . . . . . . . . . . . . . . . . 5,370.1 4,570.9Sales inducements to contract holders . . . . . . . . . . . . . . . . . . . . . . . . . . . . . . . . . . . . . . . . . . . . . . . . . . 263.3 253.6Deferred income taxes . . . . . . . . . . . . . . . . . . . . . . . . . . . . . . . . . . . . . . . . . . . . . . . . . . . . . . . . . . . . . . 2,214.8 1,299.9Goodwill and other intangible assets . . . . . . . . . . . . . . . . . . . . . . . . . . . . . . . . . . . . . . . . . . . . . . . . . . . 250.8 284.4Other assets . . . . . . . . . . . . . . . . . . . . . . . . . . . . . . . . . . . . . . . . . . . . . . . . . . . . . . . . . . . . . . . . . . . . . . . 940.4 990.6Assets related to consolidated investment entities:
Limited partnerships/corporations, at fair value . . . . . . . . . . . . . . . . . . . . . . . . . . . . . . . . . . . . . . 4,973.7 3,727.3Cash and cash equivalents . . . . . . . . . . . . . . . . . . . . . . . . . . . . . . . . . . . . . . . . . . . . . . . . . . . . . . . 467.6 710.4Corporate loans, at fair value using the fair value option . . . . . . . . . . . . . . . . . . . . . . . . . . . . . . . 6,882.5 6,793.1Other assets . . . . . . . . . . . . . . . . . . . . . . . . . . . . . . . . . . . . . . . . . . . . . . . . . . . . . . . . . . . . . . . . . . . 154.3 92.4
Assets held in separate accounts . . . . . . . . . . . . . . . . . . . . . . . . . . . . . . . . . . . . . . . . . . . . . . . . . . . . . . 96,514.8 106,007.8
Total assets . . . . . . . . . . . . . . . . . . . . . . . . . . . . . . . . . . . . . . . . . . . . . . . . . . . . . . . . . . . . . . . . . . . . . . . $218,249.6 $226,930.7
The accompanying notes are an integral part of these Consolidated Financial Statements.
200
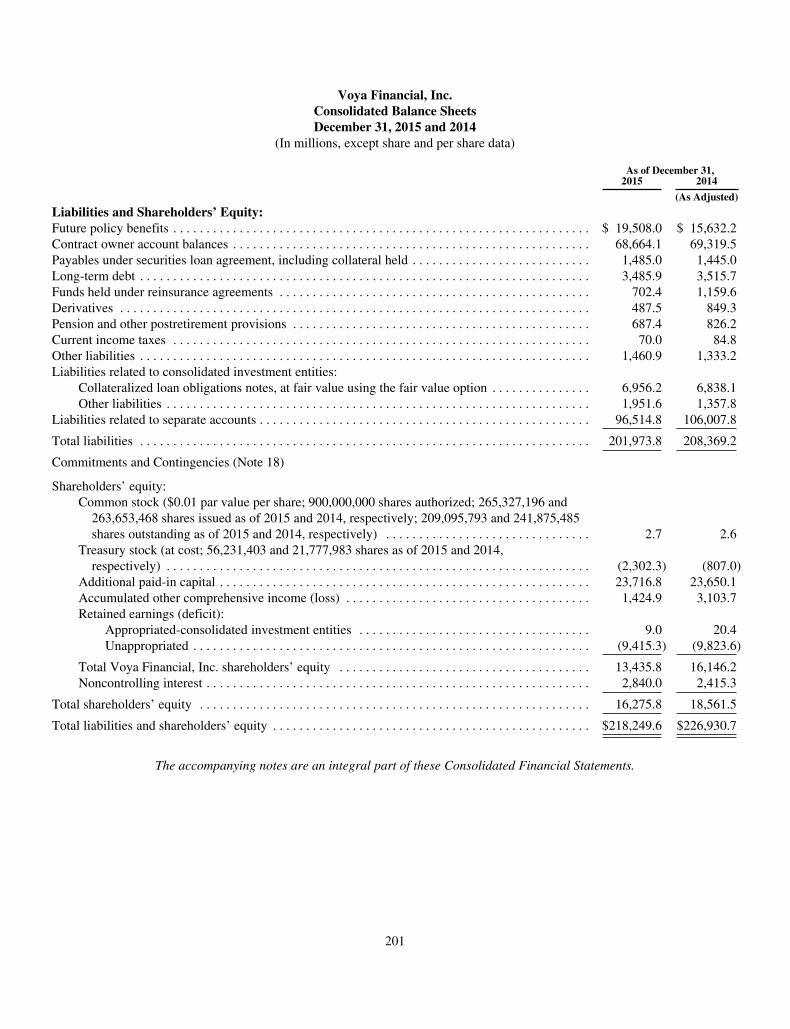
Voya Financial, Inc.Consolidated Balance SheetsDecember 31, 2015 and 2014
(In millions, except share and per share data)
As of December 31,2015 2014
(As Adjusted)
Liabilities and Shareholders’ Equity:Future policy benefits . . . . . . . . . . . . . . . . . . . . . . . . . . . . . . . . . . . . . . . . . . . . . . . . . . . . . . . . . . . . . . . $ 19,508.0 $ 15,632.2Contract owner account balances . . . . . . . . . . . . . . . . . . . . . . . . . . . . . . . . . . . . . . . . . . . . . . . . . . . . . . 68,664.1 69,319.5Payables under securities loan agreement, including collateral held . . . . . . . . . . . . . . . . . . . . . . . . . . . 1,485.0 1,445.0Long-term debt . . . . . . . . . . . . . . . . . . . . . . . . . . . . . . . . . . . . . . . . . . . . . . . . . . . . . . . . . . . . . . . . . . . . 3,485.9 3,515.7Funds held under reinsurance agreements . . . . . . . . . . . . . . . . . . . . . . . . . . . . . . . . . . . . . . . . . . . . . . . 702.4 1,159.6Derivatives . . . . . . . . . . . . . . . . . . . . . . . . . . . . . . . . . . . . . . . . . . . . . . . . . . . . . . . . . . . . . . . . . . . . . . . 487.5 849.3Pension and other postretirement provisions . . . . . . . . . . . . . . . . . . . . . . . . . . . . . . . . . . . . . . . . . . . . . 687.4 826.2Current income taxes . . . . . . . . . . . . . . . . . . . . . . . . . . . . . . . . . . . . . . . . . . . . . . . . . . . . . . . . . . . . . . . 70.0 84.8Other liabilities . . . . . . . . . . . . . . . . . . . . . . . . . . . . . . . . . . . . . . . . . . . . . . . . . . . . . . . . . . . . . . . . . . . . 1,460.9 1,333.2Liabilities related to consolidated investment entities:
Collateralized loan obligations notes, at fair value using the fair value option . . . . . . . . . . . . . . . 6,956.2 6,838.1Other liabilities . . . . . . . . . . . . . . . . . . . . . . . . . . . . . . . . . . . . . . . . . . . . . . . . . . . . . . . . . . . . . . . . 1,951.6 1,357.8
Liabilities related to separate accounts . . . . . . . . . . . . . . . . . . . . . . . . . . . . . . . . . . . . . . . . . . . . . . . . . . 96,514.8 106,007.8
Total liabilities . . . . . . . . . . . . . . . . . . . . . . . . . . . . . . . . . . . . . . . . . . . . . . . . . . . . . . . . . . . . . . . . . . . . 201,973.8 208,369.2
Commitments and Contingencies (Note 18)
Shareholders’ equity:Common stock ($0.01 par value per share; 900,000,000 shares authorized; 265,327,196 and
263,653,468 shares issued as of 2015 and 2014, respectively; 209,095,793 and 241,875,485shares outstanding as of 2015 and 2014, respectively) . . . . . . . . . . . . . . . . . . . . . . . . . . . . . . . 2.7 2.6
Treasury stock (at cost; 56,231,403 and 21,777,983 shares as of 2015 and 2014,respectively) . . . . . . . . . . . . . . . . . . . . . . . . . . . . . . . . . . . . . . . . . . . . . . . . . . . . . . . . . . . . . . . . (2,302.3) (807.0)
Additional paid-in capital . . . . . . . . . . . . . . . . . . . . . . . . . . . . . . . . . . . . . . . . . . . . . . . . . . . . . . . . 23,716.8 23,650.1Accumulated other comprehensive income (loss) . . . . . . . . . . . . . . . . . . . . . . . . . . . . . . . . . . . . . 1,424.9 3,103.7Retained earnings (deficit):
Appropriated-consolidated investment entities . . . . . . . . . . . . . . . . . . . . . . . . . . . . . . . . . . . 9.0 20.4Unappropriated . . . . . . . . . . . . . . . . . . . . . . . . . . . . . . . . . . . . . . . . . . . . . . . . . . . . . . . . . . . . (9,415.3) (9,823.6)
Total Voya Financial, Inc. shareholders’ equity . . . . . . . . . . . . . . . . . . . . . . . . . . . . . . . . . . . . . . 13,435.8 16,146.2Noncontrolling interest . . . . . . . . . . . . . . . . . . . . . . . . . . . . . . . . . . . . . . . . . . . . . . . . . . . . . . . . . . 2,840.0 2,415.3
Total shareholders’ equity . . . . . . . . . . . . . . . . . . . . . . . . . . . . . . . . . . . . . . . . . . . . . . . . . . . . . . . . . . . 16,275.8 18,561.5
Total liabilities and shareholders’ equity . . . . . . . . . . . . . . . . . . . . . . . . . . . . . . . . . . . . . . . . . . . . . . . . $218,249.6 $226,930.7
The accompanying notes are an integral part of these Consolidated Financial Statements.
201

Voya Financial, Inc.Consolidated Statements of Operations
For the Years Ended December 31, 2015, 2014 and 2013(In millions, except per share data)
Year Ended December 31,
2015 2014 2013
(As Adjusted) (As Adjusted)
Revenues:Net investment income . . . . . . . . . . . . . . . . . . . . . . . . . . . . . . . . . . . . . . . . . . . . . . . . . . . $ 4,637.8 $ 4,614.8 $ 4,689.0Fee income . . . . . . . . . . . . . . . . . . . . . . . . . . . . . . . . . . . . . . . . . . . . . . . . . . . . . . . . . . . . 3,481.1 3,632.5 3,666.3Premiums . . . . . . . . . . . . . . . . . . . . . . . . . . . . . . . . . . . . . . . . . . . . . . . . . . . . . . . . . . . . . 3,024.5 2,626.4 1,956.3Net realized gains (losses):
Total other-than-temporary impairments . . . . . . . . . . . . . . . . . . . . . . . . . . . . . . . . . (110.3) (31.9) (43.7)Less: Portion of other-than-temporary impairments recognized in Other
comprehensive income (loss) . . . . . . . . . . . . . . . . . . . . . . . . . . . . . . . . . . . . . . . . 6.7 (0.3) (8.0)
Net other-than-temporary impairments recognized in earnings . . . . . . . . . . . . . . . . (117.0) (31.6) (35.7)Other net realized capital gains (losses) . . . . . . . . . . . . . . . . . . . . . . . . . . . . . . . . . . (616.3) (846.8) (2,501.1)
Total net realized capital gains (losses) . . . . . . . . . . . . . . . . . . . . . . . . . . . . . . . . . . (733.3) (878.4) (2,536.8)Other revenue . . . . . . . . . . . . . . . . . . . . . . . . . . . . . . . . . . . . . . . . . . . . . . . . . . . . . . . . . . 406.9 432.8 433.0Income (loss) related to consolidated investment entities:
Net investment income . . . . . . . . . . . . . . . . . . . . . . . . . . . . . . . . . . . . . . . . . . . . . . . 551.1 665.5 545.2Changes in fair value related to collateralized loan obligations . . . . . . . . . . . . . . . . (26.9) (6.7) 3.5
Total revenues . . . . . . . . . . . . . . . . . . . . . . . . . . . . . . . . . . . . . . . . . . . . . . . . . . . . . . . . . . . . . . 11,341.2 11,086.9 8,756.5
Benefits and expenses:Policyholder benefits . . . . . . . . . . . . . . . . . . . . . . . . . . . . . . . . . . . . . . . . . . . . . . . . . . . . 4,536.8 3,946.7 2,409.4Interest credited to contract owner account balances . . . . . . . . . . . . . . . . . . . . . . . . . . . . 1,973.2 1,991.2 2,088.4Operating expenses . . . . . . . . . . . . . . . . . . . . . . . . . . . . . . . . . . . . . . . . . . . . . . . . . . . . . . 3,103.0 3,561.7 2,686.7Net amortization of Deferred policy acquisition costs and Value of business
acquired . . . . . . . . . . . . . . . . . . . . . . . . . . . . . . . . . . . . . . . . . . . . . . . . . . . . . . . . . . . . 663.4 379.3 442.8Interest expense . . . . . . . . . . . . . . . . . . . . . . . . . . . . . . . . . . . . . . . . . . . . . . . . . . . . . . . . 196.5 189.7 184.8Operating expenses related to consolidated investment entities:
Interest expense . . . . . . . . . . . . . . . . . . . . . . . . . . . . . . . . . . . . . . . . . . . . . . . . . . . . 272.2 209.5 180.6Other expense . . . . . . . . . . . . . . . . . . . . . . . . . . . . . . . . . . . . . . . . . . . . . . . . . . . . . . 11.6 7.6 7.7
Total benefits and expenses . . . . . . . . . . . . . . . . . . . . . . . . . . . . . . . . . . . . . . . . . . . . . . . . . . . 10,756.7 10,285.7 8,000.4
Income (loss) before income taxes . . . . . . . . . . . . . . . . . . . . . . . . . . . . . . . . . . . . . . . . . . . . . . 584.5 801.2 756.1Income tax expense (benefit) . . . . . . . . . . . . . . . . . . . . . . . . . . . . . . . . . . . . . . . . . . . . . . . . . . 45.9 (1,731.5) (32.5)
Net income (loss) . . . . . . . . . . . . . . . . . . . . . . . . . . . . . . . . . . . . . . . . . . . . . . . . . . . . . . . . . . . 538.6 2,532.7 788.6Less: Net income (loss) attributable to noncontrolling interest . . . . . . . . . . . . . . . . . . . . 130.3 237.7 190.1
Net income (loss) available to Voya Financial, Inc.’s common shareholders . . . . . . . . . . . . . $ 408.3 $ 2,295.0 $ 598.5
Net income (loss) available to Voya Financial, Inc.’s common shareholders per commonshare:
Basic . . . . . . . . . . . . . . . . . . . . . . . . . . . . . . . . . . . . . . . . . . . . . . . . . . . . . . . . . . . . . . . . . $ 1.81 $ 9.07 $ 2.39
Diluted . . . . . . . . . . . . . . . . . . . . . . . . . . . . . . . . . . . . . . . . . . . . . . . . . . . . . . . . . . . . . . . $ 1.80 $ 9.00 $ 2.38
Cash dividends declared per share of common stock . . . . . . . . . . . . . . . . . . . . . . . . . . . . $ 0.04 $ 0.04 $ 0.02
The accompanying notes are an integral part of these Consolidated Financial Statements.
202
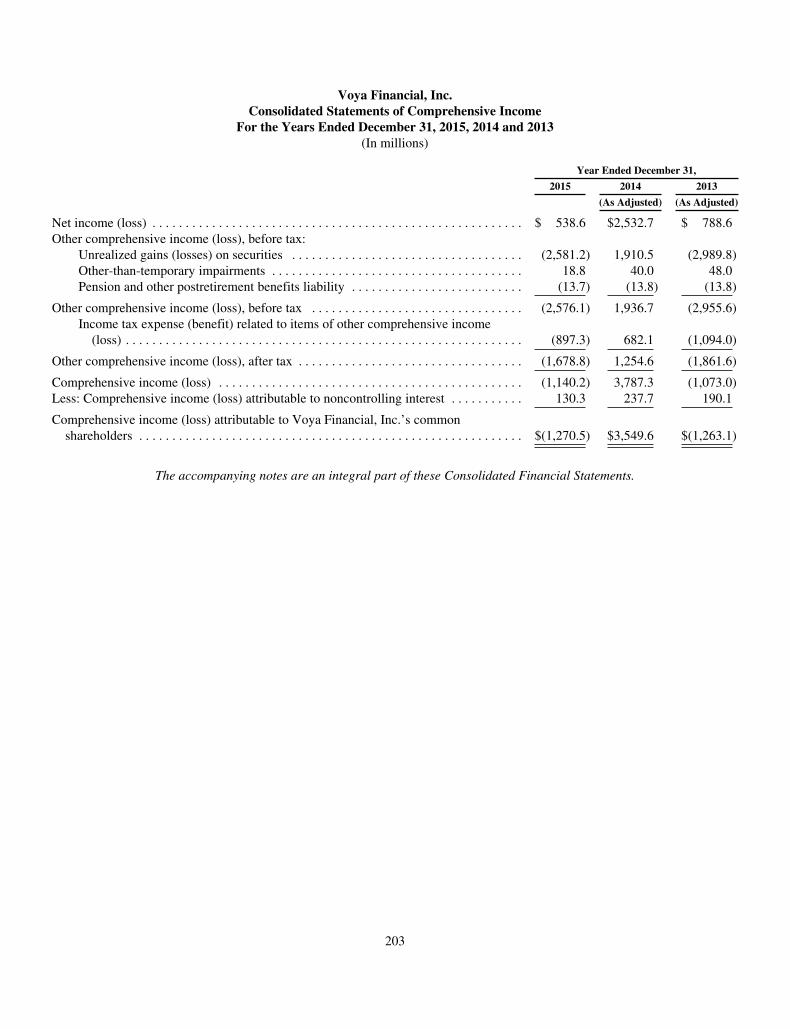
Voya Financial, Inc.Consolidated Statements of Comprehensive Income
For the Years Ended December 31, 2015, 2014 and 2013(In millions)
Year Ended December 31,
2015 2014 2013
(As Adjusted) (As Adjusted)
Net income (loss) . . . . . . . . . . . . . . . . . . . . . . . . . . . . . . . . . . . . . . . . . . . . . . . . . . . . . . . . $ 538.6 $2,532.7 $ 788.6Other comprehensive income (loss), before tax:
Unrealized gains (losses) on securities . . . . . . . . . . . . . . . . . . . . . . . . . . . . . . . . . . . (2,581.2) 1,910.5 (2,989.8)Other-than-temporary impairments . . . . . . . . . . . . . . . . . . . . . . . . . . . . . . . . . . . . . . 18.8 40.0 48.0Pension and other postretirement benefits liability . . . . . . . . . . . . . . . . . . . . . . . . . . (13.7) (13.8) (13.8)
Other comprehensive income (loss), before tax . . . . . . . . . . . . . . . . . . . . . . . . . . . . . . . . (2,576.1) 1,936.7 (2,955.6)Income tax expense (benefit) related to items of other comprehensive income
(loss) . . . . . . . . . . . . . . . . . . . . . . . . . . . . . . . . . . . . . . . . . . . . . . . . . . . . . . . . . . . . (897.3) 682.1 (1,094.0)
Other comprehensive income (loss), after tax . . . . . . . . . . . . . . . . . . . . . . . . . . . . . . . . . . (1,678.8) 1,254.6 (1,861.6)
Comprehensive income (loss) . . . . . . . . . . . . . . . . . . . . . . . . . . . . . . . . . . . . . . . . . . . . . . (1,140.2) 3,787.3 (1,073.0)Less: Comprehensive income (loss) attributable to noncontrolling interest . . . . . . . . . . . 130.3 237.7 190.1
Comprehensive income (loss) attributable to Voya Financial, Inc.’s commonshareholders . . . . . . . . . . . . . . . . . . . . . . . . . . . . . . . . . . . . . . . . . . . . . . . . . . . . . . . . . . $(1,270.5) $3,549.6 $(1,263.1)
The accompanying notes are an integral part of these Consolidated Financial Statements.
203

Voy
aF
inan
cial
,Inc
.C
onso
lidat
edSt
atem
ents
ofC
hang
esin
Shar
ehol
ders
’E
quit
yF
orth
eY
ears
End
edD
ecem
ber
31,2
015,
2014
and
2013
(In
mill
ions
)
Com
mon
Stoc
kT
reas
ury
Stoc
k
Add
itio
nal
Pai
d-In
Cap
ital
Acc
umul
ated
Oth
erC
ompr
ehen
sive
Inco
me
(Los
s)
Ret
aine
dE
arni
ngs
(Def
icit
)
Tot
alV
oya
Fin
anci
al,I
nc.
Shar
ehol
ders
’E
quit
yN
onco
ntro
lling
Inte
rest
Tot
alSh
areh
olde
rs’
Equ
ity
App
ropr
iate
dU
napp
ropr
iate
d
Bal
ance
atJa
nuar
y1,
2013
—A
sA
djus
ted
....
....
$2.
3$
—$2
2,91
7.6
$3,
710.
7$
6.4
$(12
,717
.1)
$13,
919.
9$2
,186
.3$1
6,10
6.2
Com
preh
ensi
vein
com
e(l
oss)
:N
etin
com
e(l
oss)
....
....
....
....
....
——
——
—59
8.5
598.
519
0.1
788.
6O
ther
com
preh
ensi
vein
com
e(l
oss)
,aft
erta
x..
....
....
....
....
....
....
...
——
—(1
,861
.6)
——
(1,8
61.6
)—
(1,8
61.6
)
Tot
alco
mpr
ehen
sive
inco
me
(los
s)..
....
....
(1,2
63.1
)19
0.1
(1,0
73.0
)R
ecla
ssif
icat
ion
ofno
ncon
trol
ling
inte
rest
....
——
——
12.0
—12
.0(1
2.0)
—C
omm
onst
ock
issu
ance
....
....
....
....
..0.
3—
571.
3—
——
571.
6—
571.
6C
omm
onst
ock
acqu
ired
—Sh
are
repu
rcha
se..
——
——
——
——
—D
ivid
ends
onco
mm
onst
ock
....
....
....
...
——
(5.2
)—
——
(5.2
)—
(5.2
)Sh
are-
base
dco
mpe
nsat
ion
....
....
....
....
——
80.0
——
—80
.0—
80.0
Con
trib
utio
nsfr
om(D
istr
ibut
ions
to)
nonc
ontr
ollin
gin
tere
st,n
et..
....
....
....
——
——
——
—(1
22.6
)(1
22.6
)
Bal
ance
atD
ecem
ber
31,2
013—
As
Adj
uste
d..
...
2.6
—23
,563
.71,
849.
118
.4(1
2,11
8.6)
13,3
15.2
2,24
1.8
15,5
57.0
Com
preh
ensi
vein
com
e(l
oss)
:N
etin
com
e(l
oss)
....
....
....
....
....
——
——
—2,
295.
02,
295.
023
7.7
2,53
2.7
Oth
erco
mpr
ehen
sive
inco
me
(los
s),a
fter
tax
....
....
....
....
....
....
....
.—
——
1,25
4.6
——
1,25
4.6
—1,
254.
6
Tot
alco
mpr
ehen
sive
inco
me
(los
s)..
....
....
3,54
9.6
237.
73,
787.
3R
ecla
ssif
icat
ion
ofno
ncon
trol
ling
inte
rest
....
——
——
2.0
—2.
0(2
.0)
—C
omm
onst
ock
issu
ance
....
....
....
....
..—
——
——
——
——
Com
mon
stoc
kac
quir
ed—
Shar
ere
purc
hase
..—
(790
.1)
——
——
(790
.1)
—(7
90.1
)D
ivid
ends
onco
mm
onst
ock
....
....
....
...
——
(10.
1)—
——
(10.
1)—
(10.
1)Sh
are-
base
dco
mpe
nsat
ion
....
....
....
....
—(1
6.9)
96.5
——
—79
.6—
79.6
Con
trib
utio
nsfr
om(D
istr
ibut
ions
to)
nonc
ontr
ollin
gin
tere
st,n
et..
....
....
....
——
——
——
—(6
2.2)
(62.
2)
Bal
ance
asof
Dec
embe
r31
,201
4—A
sA
djus
ted
...
2.6
(807
.0)
23,6
50.1
3,10
3.7
20.4
(9,8
23.6
)16
,146
.22,
415.
318
,561
.5
Com
preh
ensi
vein
com
e(l
oss)
:N
etin
com
e(l
oss)
....
....
....
....
....
——
——
—40
8.3
408.
313
0.3
538.
6O
ther
com
preh
ensi
vein
com
e(l
oss)
,aft
erta
x..
....
....
....
....
....
....
...
——
—(1
,678
.8)
——
(1,6
78.8
)—
(1,6
78.8
)
Tot
alco
mpr
ehen
sive
inco
me
(los
s)..
....
....
(1,2
70.5
)13
0.3
(1,1
40.2
)R
ecla
ssif
icat
ion
ofno
ncon
trol
ling
inte
rest
....
——
——
(11.
4)—
(11.
4)11
.4—
Com
mon
stoc
kis
suan
ce..
....
....
....
....
——
——
——
——
—C
omm
onst
ock
acqu
ired
—Sh
are
repu
rcha
se..
—(1
,490
.7)
——
——
(1,4
90.7
)—
(1,4
90.7
)D
ivid
ends
onco
mm
onst
ock
....
....
....
...
——
(9.0
)—
——
(9.0
)—
(9.0
)Sh
are-
base
dco
mpe
nsat
ion
....
....
....
....
0.1
(4.6
)75
.7—
——
71.2
—71
.2C
ontr
ibut
ions
from
(Dis
trib
utio
nsto
)no
ncon
trol
ling
inte
rest
,net
....
....
....
..—
——
——
——
283.
028
3.0
Bal
ance
asof
Dec
embe
r31
,201
5..
....
....
....
.$
2.7
$(2,
302.
3)$2
3,71
6.8
$1,
424.
9$
9.0
$(9
,415
.3)
$13,
435.
8$2
,840
.0$1
6,27
5.8
The
acco
mpa
nyin
gno
tes
are
anin
tegr
alpa
rtof
thes
eC
onso
lida
ted
Fin
anci
alSt
atem
ents
.
204
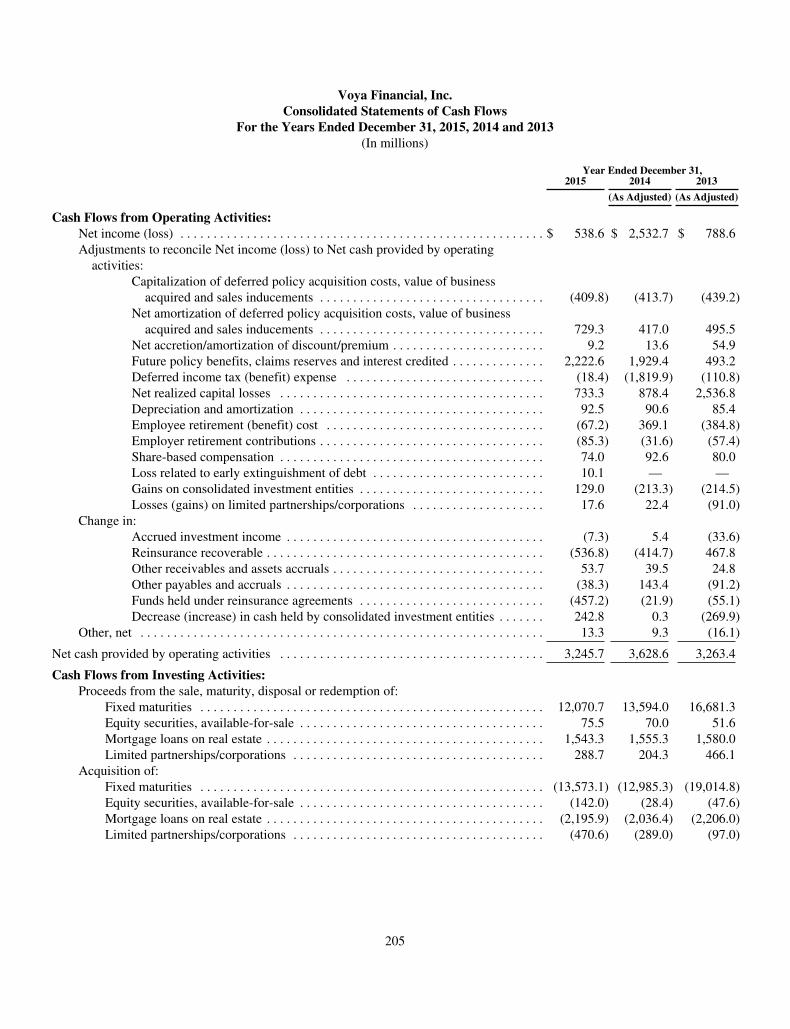
Voya Financial, Inc.Consolidated Statements of Cash Flows
For the Years Ended December 31, 2015, 2014 and 2013(In millions)
Year Ended December 31,2015 2014 2013
(As Adjusted) (As Adjusted)
Cash Flows from Operating Activities:Net income (loss) . . . . . . . . . . . . . . . . . . . . . . . . . . . . . . . . . . . . . . . . . . . . . . . . . . . . . . . $ 538.6 $ 2,532.7 $ 788.6Adjustments to reconcile Net income (loss) to Net cash provided by operating
activities:Capitalization of deferred policy acquisition costs, value of business
acquired and sales inducements . . . . . . . . . . . . . . . . . . . . . . . . . . . . . . . . . . (409.8) (413.7) (439.2)Net amortization of deferred policy acquisition costs, value of business
acquired and sales inducements . . . . . . . . . . . . . . . . . . . . . . . . . . . . . . . . . . 729.3 417.0 495.5Net accretion/amortization of discount/premium . . . . . . . . . . . . . . . . . . . . . . . 9.2 13.6 54.9Future policy benefits, claims reserves and interest credited . . . . . . . . . . . . . . 2,222.6 1,929.4 493.2Deferred income tax (benefit) expense . . . . . . . . . . . . . . . . . . . . . . . . . . . . . . (18.4) (1,819.9) (110.8)Net realized capital losses . . . . . . . . . . . . . . . . . . . . . . . . . . . . . . . . . . . . . . . . 733.3 878.4 2,536.8Depreciation and amortization . . . . . . . . . . . . . . . . . . . . . . . . . . . . . . . . . . . . . 92.5 90.6 85.4Employee retirement (benefit) cost . . . . . . . . . . . . . . . . . . . . . . . . . . . . . . . . . (67.2) 369.1 (384.8)Employer retirement contributions . . . . . . . . . . . . . . . . . . . . . . . . . . . . . . . . . . (85.3) (31.6) (57.4)Share-based compensation . . . . . . . . . . . . . . . . . . . . . . . . . . . . . . . . . . . . . . . . 74.0 92.6 80.0Loss related to early extinguishment of debt . . . . . . . . . . . . . . . . . . . . . . . . . . 10.1 — —Gains on consolidated investment entities . . . . . . . . . . . . . . . . . . . . . . . . . . . . 129.0 (213.3) (214.5)Losses (gains) on limited partnerships/corporations . . . . . . . . . . . . . . . . . . . . 17.6 22.4 (91.0)
Change in:Accrued investment income . . . . . . . . . . . . . . . . . . . . . . . . . . . . . . . . . . . . . . . (7.3) 5.4 (33.6)Reinsurance recoverable . . . . . . . . . . . . . . . . . . . . . . . . . . . . . . . . . . . . . . . . . . (536.8) (414.7) 467.8Other receivables and assets accruals . . . . . . . . . . . . . . . . . . . . . . . . . . . . . . . . 53.7 39.5 24.8Other payables and accruals . . . . . . . . . . . . . . . . . . . . . . . . . . . . . . . . . . . . . . . (38.3) 143.4 (91.2)Funds held under reinsurance agreements . . . . . . . . . . . . . . . . . . . . . . . . . . . . (457.2) (21.9) (55.1)Decrease (increase) in cash held by consolidated investment entities . . . . . . . 242.8 0.3 (269.9)
Other, net . . . . . . . . . . . . . . . . . . . . . . . . . . . . . . . . . . . . . . . . . . . . . . . . . . . . . . . . . . . . . 13.3 9.3 (16.1)
Net cash provided by operating activities . . . . . . . . . . . . . . . . . . . . . . . . . . . . . . . . . . . . . . . . 3,245.7 3,628.6 3,263.4
Cash Flows from Investing Activities:Proceeds from the sale, maturity, disposal or redemption of:
Fixed maturities . . . . . . . . . . . . . . . . . . . . . . . . . . . . . . . . . . . . . . . . . . . . . . . . . . . . 12,070.7 13,594.0 16,681.3Equity securities, available-for-sale . . . . . . . . . . . . . . . . . . . . . . . . . . . . . . . . . . . . . 75.5 70.0 51.6Mortgage loans on real estate . . . . . . . . . . . . . . . . . . . . . . . . . . . . . . . . . . . . . . . . . . 1,543.3 1,555.3 1,580.0Limited partnerships/corporations . . . . . . . . . . . . . . . . . . . . . . . . . . . . . . . . . . . . . . 288.7 204.3 466.1
Acquisition of:Fixed maturities . . . . . . . . . . . . . . . . . . . . . . . . . . . . . . . . . . . . . . . . . . . . . . . . . . . . (13,573.1) (12,985.3) (19,014.8)Equity securities, available-for-sale . . . . . . . . . . . . . . . . . . . . . . . . . . . . . . . . . . . . . (142.0) (28.4) (47.6)Mortgage loans on real estate . . . . . . . . . . . . . . . . . . . . . . . . . . . . . . . . . . . . . . . . . . (2,195.9) (2,036.4) (2,206.0)Limited partnerships/corporations . . . . . . . . . . . . . . . . . . . . . . . . . . . . . . . . . . . . . . (470.6) (289.0) (97.0)
205
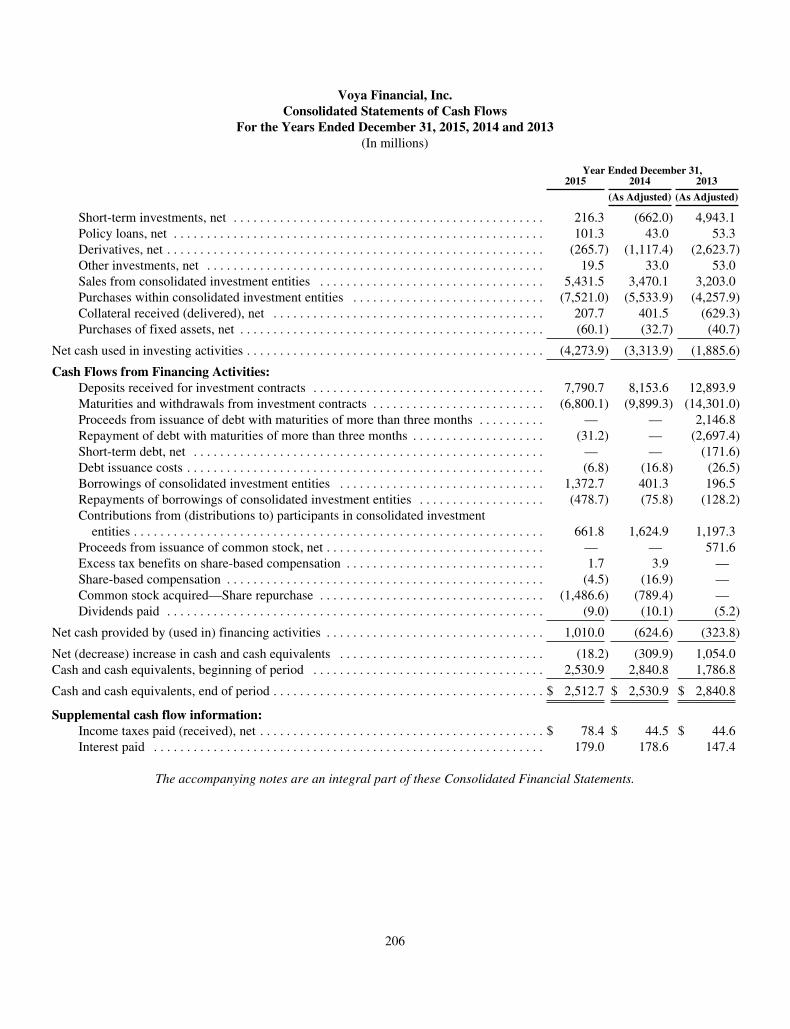
Voya Financial, Inc.Consolidated Statements of Cash Flows
For the Years Ended December 31, 2015, 2014 and 2013(In millions)
Year Ended December 31,2015 2014 2013
(As Adjusted) (As Adjusted)
Short-term investments, net . . . . . . . . . . . . . . . . . . . . . . . . . . . . . . . . . . . . . . . . . . . . . . . 216.3 (662.0) 4,943.1Policy loans, net . . . . . . . . . . . . . . . . . . . . . . . . . . . . . . . . . . . . . . . . . . . . . . . . . . . . . . . . 101.3 43.0 53.3Derivatives, net . . . . . . . . . . . . . . . . . . . . . . . . . . . . . . . . . . . . . . . . . . . . . . . . . . . . . . . . . (265.7) (1,117.4) (2,623.7)Other investments, net . . . . . . . . . . . . . . . . . . . . . . . . . . . . . . . . . . . . . . . . . . . . . . . . . . . 19.5 33.0 53.0Sales from consolidated investment entities . . . . . . . . . . . . . . . . . . . . . . . . . . . . . . . . . . 5,431.5 3,470.1 3,203.0Purchases within consolidated investment entities . . . . . . . . . . . . . . . . . . . . . . . . . . . . . (7,521.0) (5,533.9) (4,257.9)Collateral received (delivered), net . . . . . . . . . . . . . . . . . . . . . . . . . . . . . . . . . . . . . . . . . 207.7 401.5 (629.3)Purchases of fixed assets, net . . . . . . . . . . . . . . . . . . . . . . . . . . . . . . . . . . . . . . . . . . . . . . (60.1) (32.7) (40.7)
Net cash used in investing activities . . . . . . . . . . . . . . . . . . . . . . . . . . . . . . . . . . . . . . . . . . . . . (4,273.9) (3,313.9) (1,885.6)
Cash Flows from Financing Activities:Deposits received for investment contracts . . . . . . . . . . . . . . . . . . . . . . . . . . . . . . . . . . . 7,790.7 8,153.6 12,893.9Maturities and withdrawals from investment contracts . . . . . . . . . . . . . . . . . . . . . . . . . . (6,800.1) (9,899.3) (14,301.0)Proceeds from issuance of debt with maturities of more than three months . . . . . . . . . . — — 2,146.8Repayment of debt with maturities of more than three months . . . . . . . . . . . . . . . . . . . . (31.2) — (2,697.4)Short-term debt, net . . . . . . . . . . . . . . . . . . . . . . . . . . . . . . . . . . . . . . . . . . . . . . . . . . . . . — — (171.6)Debt issuance costs . . . . . . . . . . . . . . . . . . . . . . . . . . . . . . . . . . . . . . . . . . . . . . . . . . . . . . (6.8) (16.8) (26.5)Borrowings of consolidated investment entities . . . . . . . . . . . . . . . . . . . . . . . . . . . . . . . 1,372.7 401.3 196.5Repayments of borrowings of consolidated investment entities . . . . . . . . . . . . . . . . . . . (478.7) (75.8) (128.2)Contributions from (distributions to) participants in consolidated investment
entities . . . . . . . . . . . . . . . . . . . . . . . . . . . . . . . . . . . . . . . . . . . . . . . . . . . . . . . . . . . . . . 661.8 1,624.9 1,197.3Proceeds from issuance of common stock, net . . . . . . . . . . . . . . . . . . . . . . . . . . . . . . . . . — — 571.6Excess tax benefits on share-based compensation . . . . . . . . . . . . . . . . . . . . . . . . . . . . . . 1.7 3.9 —Share-based compensation . . . . . . . . . . . . . . . . . . . . . . . . . . . . . . . . . . . . . . . . . . . . . . . . (4.5) (16.9) —Common stock acquired—Share repurchase . . . . . . . . . . . . . . . . . . . . . . . . . . . . . . . . . . (1,486.6) (789.4) —Dividends paid . . . . . . . . . . . . . . . . . . . . . . . . . . . . . . . . . . . . . . . . . . . . . . . . . . . . . . . . . (9.0) (10.1) (5.2)
Net cash provided by (used in) financing activities . . . . . . . . . . . . . . . . . . . . . . . . . . . . . . . . . 1,010.0 (624.6) (323.8)
Net (decrease) increase in cash and cash equivalents . . . . . . . . . . . . . . . . . . . . . . . . . . . . . . . (18.2) (309.9) 1,054.0Cash and cash equivalents, beginning of period . . . . . . . . . . . . . . . . . . . . . . . . . . . . . . . . . . . 2,530.9 2,840.8 1,786.8
Cash and cash equivalents, end of period . . . . . . . . . . . . . . . . . . . . . . . . . . . . . . . . . . . . . . . . . $ 2,512.7 $ 2,530.9 $ 2,840.8
Supplemental cash flow information:Income taxes paid (received), net . . . . . . . . . . . . . . . . . . . . . . . . . . . . . . . . . . . . . . . . . . . $ 78.4 $ 44.5 $ 44.6Interest paid . . . . . . . . . . . . . . . . . . . . . . . . . . . . . . . . . . . . . . . . . . . . . . . . . . . . . . . . . . . 179.0 178.6 147.4
The accompanying notes are an integral part of these Consolidated Financial Statements.
206
Voya Financial, Inc.Notes to the Consolidated Financial Statements(Dollar amounts in millions, unless otherwise stated)
1. Business, Basis of Presentation and Significant Accounting Policies
Business
Voya Financial, Inc. and its subsidiaries (collectively, “the Company”) is a financial services organization in the United Statesthat offers a broad range of retirement services, annuities, investment management services, mutual funds, life insurance, groupinsurance and supplemental health products. Prior to April 20, 2015, the Company provided principal products and services inthree ongoing businesses—Retirement Solutions, Investment Management and Insurance Solutions—and reported results forthe ongoing businesses through five segments. Effective April 20, 2015, the Company provides principal products and servicesin two ongoing businesses (“Ongoing Business”)—Retirement and Investment Solutions; and Insurance Solutions. This changedid not affect the Company’s five ongoing operating segments. The Company also has a Corporate segment, which includes thefinancial data not directly related to the businesses, and Closed Block segments. See the Segments Note to these ConsolidatedFinancial Statements.
Prior to May 2013, the Company was an indirect, wholly owned subsidiary of ING Groep N.V. (“ING Group” or “ING”), aglobal financial services holding company based in The Netherlands, with American Depository Shares listed on the New YorkStock Exchange. In 2009, ING Group announced the anticipated separation of its global banking and insurance businesses,including the divestiture of the Company. On April 11, 2013, the Company announced plans to rebrand as Voya Financial. OnMay 2, 2013, the common stock of Voya Financial, Inc. began trading on the New York Stock Exchange under the symbol“VOYA.” On May 7, 2013 and May 31, 2013, Voya Financial, Inc. completed its initial public offering of common stock,including the issuance and sale by Voya Financial, Inc. of 30,769,230 shares of common stock and the sale by ING InsuranceInternational B.V. (“ING International”), an indirect, wholly owned subsidiary of ING Group and previously the solestockholder of Voya Financial, Inc., of 44,201,773 shares of outstanding common stock of Voya Financial, Inc. (collectively,“the IPO”). On September 30, 2013, ING International transferred all of its shares of Voya Financial, Inc. common stock to INGGroup.
On October 29, 2013, ING Group completed a sale of 37,950,000 shares of common stock of the Company in a registeredpublic offering (“Secondary Offering”), reducing ING Group’s ownership in the Company to 57%.
Throughout 2014, ING Group completed the sale of an aggregate of 82,783,006 shares of common stock of Voya Financial, Inc.in a series of registered public offerings. Also during 2014, pursuant to the terms of share repurchase agreements between INGGroup and Voya Financial, Inc., Voya Financial, Inc. acquired 19,447,847 shares of its common stock from ING Group. As ofthe end of 2014, ING Group’s ownership of Voya Financial, Inc. had been reduced to approximately19%.
In March of 2015, ING Group completed a sale of 32,018,100 shares of common stock of Voya Financial, Inc. in a registeredpublic offering. Concurrently with this offering, pursuant to the terms of a share repurchase agreement between ING Group andVoya Financial, Inc., Voya Financial, Inc. acquired 13,599,274 shares of its common stock from ING Group.
As a result of these transactions, ING Group satisfied the provisions of its agreement with the European Union regarding thedivestment of its U.S. insurance and investment operations, which required ING Group to divest 100% of its ownership interestin Voya Financial, Inc. together with its subsidiaries, by the end of 2016. ING Group continues to hold warrants to purchase upto 26,050,846 shares of Voya Financial, Inc. common stock at an exercise price of $48.75, in each case subject to adjustments.
207

Voya Financial, Inc.Notes to the Consolidated Financial Statements(Dollar amounts in millions, unless otherwise stated)
Revision of Previously Issued Financial Statements
As part of the Company’s ongoing process of validating actuarial models, during the second quarter of 2015, the Companyidentified improper inputs to the calculation of the estimated fair value of the embedded derivative in certain of its guaranteedminimum withdrawal benefits with life payouts (“GMWBL”) products. The products are included in the Company’s ClosedBlock Variable Annuity (“CBVA”) segment, and are no longer offered by the Company. The errors affected the Company’sU.S. GAAP financial statements for periods prior to the second quarter of 2015, and did not impact regulatory or rating agencycapital. The errors did not affect the Company’s variable annuity policyholders in any manner.
Based on an analysis of quantitative and qualitative factors in accordance with SEC Staff Accounting Bulletins 99 and 108, theCompany concluded that these errors were not material to the consolidated financial position, results of operations or cash flowsas presented in the Company’s quarterly and annual financial statements that have been previously filed in the Company’sQuarterly Reports on Form 10-Q and Annual Reports on Form 10-K. As a result, amendment of such reports is not required. Inpreparing the Company’s Consolidated Financial Statements for the year ended December 31, 2015, the Company madeappropriate revisions to its financial statements for historical periods. Such changes are reflected in the financial results for theyears ended December 31, 2014 and 2013, included in these financial statements, and will also be reflected in the historicalfinancial results included in the Company’s subsequent quarterly and annual consolidated financial statements.
The correction results in changes to the liabilities, with corresponding tax effects, as follows:
(a) Liabilities: Lower Future policy benefits, with the change recorded in Other net realized capital gains (losses).
(b) Assets: Lower Deferred income taxes (after considering the impacts of valuation allowances), with the changerecorded as Income tax expense (benefit).
The following tables quantify the prior period impact of this revision.
Balance Sheets:
December 31, 2014 December 31, 2013
As originallyreported
Effect ofchange
Asadjusted
As originallyreported
Effect ofchange
Asadjusted
Deferred income taxes . . . . . . . . . . . . . . . . . . . . . . . . . . . $ 1,320.6 $(20.7) $ 1,299.9 $ 162.1 $ — $ 162.1Future policy benefits . . . . . . . . . . . . . . . . . . . . . . . . . . . 15,691.2 (59.0) 15,632.2 14,098.4 (43.0) 14,055.4Retained earnings (deficit)—Unappropriated . . . . . . . . . (9,861.9) 38.3 (9,823.6) (12,161.6) 43.0 (12,118.6)
Statements of Operations:
Year Ended December 31, 2014 Year Ended December 31, 2013
As originallyreported
Effect ofchange
Asadjusted
As originallyreported
Effect ofchange
Asadjusted
Other net realized capital gains (losses) . . . . . . . . . . . . . . . $ (862.8) $ 16.0 $ (846.8) $(2,499.1) $ (2.0) $(2,501.1)Income tax expense (benefit) . . . . . . . . . . . . . . . . . . . . . . . (1,752.2) 20.7 (1,731.5) (32.5) — (32.5)Net income (loss) . . . . . . . . . . . . . . . . . . . . . . . . . . . . . . . . 2,537.4 (4.7) 2,532.7 790.6 (2.0) 788.6Net income (loss) available to Voya Financial, Inc.’s
common shareholders . . . . . . . . . . . . . . . . . . . . . . . . . . . 2,299.7 (4.7) 2,295.0 600.5 (2.0) 598.5Net income (loss) available to Voya Financial, Inc.’s
common shareholders per share:Basic . . . . . . . . . . . . . . . . . . . . . . . . . . . . . . . . . . . . . . . . . . $ 9.09 $(0.02) $ 9.07 $ 2.40 $(0.01) $ 2.39
Diluted . . . . . . . . . . . . . . . . . . . . . . . . . . . . . . . . . . . . . . . . $ 9.02 $(0.02) $ 9.00 $ 2.38 $ — $ 2.38
208
Voya Financial, Inc.Notes to the Consolidated Financial Statements(Dollar amounts in millions, unless otherwise stated)
Additionally, the impact of this revision to Income (loss) before income taxes was $16.0 and $(2.0) for the years endedDecember 31, 2014 and 2013 respectively.
Certain line items in the Consolidated Statements of Comprehensive Income, Cash Flows and Shareholders’ Equity wereimmaterially affected by the revision of previously issued financial statements. All of the line item changes in the ConsolidatedStatements of Cash Flows were in the operating activities section. There were no changes to the Consolidated Statements ofComprehensive Income and Shareholders’ Equity, except for the effects of the changes described above.
Basis of PresentationOn April 11, 2013, the Company filed an amended restated certificate of incorporation that provides for an authorized capitalstock consisting of 1,000,000,000 shares, of which 900,000,000 shares (par value $0.01 per share) are designated as Commonstock and 100,000,000 shares (par value $0.01 per share) are designated as preferred stock. In addition, the amended andrestated certificate of incorporation effected a 2,295.248835-for-1 split of the Company’s then outstanding Common stock,resulting in 230,079,120 shares of Common stock issued, including 79,120 shares of Treasury stock, and 230,000,000 shares ofCommon stock outstanding and held by ING International, prior to the IPO. The accompanying Consolidated FinancialStatements and Notes to the Consolidated Financial Statements give retroactive effect to the stock split for all periods presented.There are no preferred shares issued or outstanding.
The accompanying Consolidated Financial Statements of the Company have been prepared in accordance with accountingprinciples generally accepted in the United States (“U.S. GAAP”).
The Consolidated Financial Statements include the accounts of Voya Financial, Inc. and its subsidiaries, as well as partnerships(voting interest entities (“VOEs”)) in which the Company has control and variable interest entities (“VIEs”) for which theCompany is the primary beneficiary. See the Consolidated Investment Entities Note to these Consolidated Financial Statements.Intercompany transactions and balances have been eliminated.
Significant Accounting PoliciesEstimates and Assumptions
The preparation of financial statements in conformity with U.S. GAAP requires management to make estimates andassumptions that affect the reported amounts of assets and liabilities and disclosure of contingent assets and liabilities as of thedate of the Consolidated Financial Statements and the reported amounts of revenues and expenses during the reporting period.Those estimates are inherently subject to change and actual results could differ from those estimates.
The Company has identified the following accounts and policies as the most significant in that they involve a higher degree ofjudgment, are subject to a significant degree of variability and/or contain significant accounting estimates:
• Reserves for future policy benefits;
• Deferred policy acquisition costs (“DAC”), value of business acquired (“VOBA”) and other intangibles (collectively,“DAC/VOBA and other intangibles”);
• Valuation of investments and derivatives;
• Impairments;• Income taxes;
• Contingencies; and
• Employee benefit plans.
Fair Value Measurement
The Company measures the fair value of its financial assets and liabilities based on assumptions used by market participants inpricing the asset or liability, which may include inherent risk, restrictions on the sale or use of an asset, or nonperformance risk,including the Company’s own credit risk. The estimate of fair value is the price that would be received to sell an asset ortransfer a liability (“exit price”) in an orderly transaction between market participants in the principal market, or the mostadvantageous market in the absence of a principal market, for that asset or liability. The Company uses a number of valuationsources to determine the fair values of its financial assets and liabilities, including quoted market prices, third-party commercial
209
Voya Financial, Inc.Notes to the Consolidated Financial Statements(Dollar amounts in millions, unless otherwise stated)
pricing services, third-party brokers, industry-standard, vendor-provided software that models the value based on marketobservable inputs, and other internal modeling techniques based on projected cash flows.
Investments
The accounting policies for the Company’s principal investments are as follows:
Fixed Maturities and Equity Securities: The Company’s fixed maturities and equity securities are currently designated asavailable-for-sale, except those accounted for using the fair value option (“FVO”). Available-for-sale securities are reported atfair value and unrealized capital gains (losses) on these securities are recorded directly in Accumulated other comprehensiveincome (loss) (“AOCI”) and presented net of related changes in DAC/VOBA and other intangibles and Deferred income taxes.In addition, certain fixed maturities have embedded derivatives, which are reported with the host contract on the ConsolidatedBalance Sheets.
The Company has elected the FVO for certain of its fixed maturities to better match the measurement of assets and liabilities inthe Consolidated Statements of Operations. Certain collateralized mortgage obligations (“CMOs”), primarily interest-only andprincipal-only strips, are accounted for as hybrid instruments and valued at fair value with changes in the fair value recorded inOther net realized capital gains (losses) in the Consolidated Statements of Operations.
Purchases and sales of fixed maturities and equity securities, excluding private placements, are recorded on the trade date.Purchases and sales of private placements and mortgage loans are recorded on the closing date. Investment gains and losses onsales of securities are generally determined on a first-in-first-out (“FIFO”) basis.
Interest income on fixed maturities is recorded when earned using an effective yield method, giving effect to amortization ofpremiums and accretion of discounts. Dividends on equity securities are recorded when declared. Such dividends and interestincome are recorded in Net investment income in the Consolidated Statements of Operations.
Included within fixed maturities are loan-backed securities, including residential mortgage-backed securities (“RMBS”),commercial mortgage-backed securities (“CMBS”) and asset-backed securities (“ABS”). Amortization of the premium ordiscount from the purchase of these securities considers the estimated timing and amount of prepayments of the underlyingloans. Actual prepayment experience is periodically reviewed and effective yields are recalculated when differences arisebetween the prepayments originally anticipated and the actual prepayments received and currently anticipated. Prepaymentassumptions for single-class and multi-class mortgage-backed securities (“MBS”) and ABS are estimated by management usinginputs obtained from third-party specialists, including broker-dealers, and based on management’s knowledge of the currentmarket. For prepayment-sensitive securities such as interest-only and principal-only strips, inverse floaters and credit-sensitiveMBS and ABS securities, which represent beneficial interests in securitized financial assets that are not of high credit quality orthat have been credit impaired, the effective yield is recalculated on a prospective basis. For all other MBS and ABS, theeffective yield is recalculated on a retrospective basis.
Short-term Investments: Short-term investments include investments with remaining maturities of one year or less, but greaterthan three months, at the time of purchase. These investments are stated at fair value.
Assets Held in Separate Accounts: Assets held in separate accounts are reported at the fair values of the underlying investmentsin the separate accounts. The underlying investments include mutual funds, short-term investments, cash and fixed maturities.
Mortgage Loans on Real Estate: The Company’s mortgage loans on real estate are all commercial mortgage loans, which arereported at amortized cost, less impairment write-downs and allowance for losses. If a mortgage loan is determined to beimpaired (i.e., when it is probable that the Company will be unable to collect all amounts due according to the contractual termsof the loan agreement), the carrying value of the mortgage loan is reduced to the lower of either the present value of expectedcash flows from the loan, discounted at the loan’s original purchase yield, or fair value of the collateral. For those mortgagesthat are determined to require foreclosure, the carrying value is reduced to the fair value of the underlying collateral, net ofestimated costs to obtain and sell at the point of foreclosure. The carrying value of the impaired loans is reduced by establishinga permanent write-down recorded in Other net realized capital gains (losses) in the Consolidated Statements of Operations.Property obtained from foreclosed mortgage loans is recorded in Other investments on the Consolidated Balance Sheets.
210
Voya Financial, Inc.Notes to the Consolidated Financial Statements(Dollar amounts in millions, unless otherwise stated)
Mortgage loans are evaluated by the Company’s investment professionals, including an appraisal of loan-specific credit quality,property characteristics and market trends. Loan performance is continuously monitored on a loan-specific basis throughout theyear. The Company’s review includes submitted appraisals, operating statements, rent revenues and annual inspection reports,among other items. This review evaluates whether the properties are performing at a consistent and acceptable level to securethe debt.
Mortgages are rated for the purpose of quantifying the level of risk. Those loans with higher risk are placed on a watch list andare closely monitored for collateral deficiency or other credit events that may lead to a potential loss of principal or interest. TheCompany defines delinquent mortgage loans consistent with industry practice as 60 days past due.
Commercial loans are placed on non-accrual status when 90 days in arrears if the Company has concerns regarding thecollectability of future payments, or if a loan has matured without being paid off or extended. Factors considered may includeconversations with the borrower, loss of major tenant, bankruptcy of borrower or major tenant, decreased property cash flow,number of days past due, or various other circumstances. Based on an assessment as to the collectability of the principal, adetermination is made either to apply against the book value or apply according to the contractual terms of the loan. Fundsrecovered in excess of book value would then be applied to recover expenses, impairments, and then interest. Accrual of interestresumes after factors resulting in doubts about collectability have improved.
The Company records an allowance for probable losses incurred on non-impaired loans on an aggregate basis, rather thanspecifically identified probable losses incurred by individual loan.
Policy Loans: Policy loans are carried at an amount equal to the unpaid balance. Interest income on such loans is recorded asearned in Net investment income using the contractually agreed upon interest rate. Generally, interest is capitalized on thepolicy’s anniversary date. Valuation allowances are not established for policy loans, as these loans are collateralized by the cashsurrender value of the associated insurance contracts. Any unpaid principal or interest on the loan is deducted from the accountvalue or the death benefit prior to settlement of the policy.
Limited Partnerships/Corporations: The Company uses the equity method of accounting for investments in limited partnershipinterests that are not consolidated, which consists primarily of private equities, hedge funds and VIEs for which the Company isnot the primary beneficiary. Generally, the Company records its share of earnings using a lag methodology, relying on the mostrecent financial information available, generally not to exceed three months. The Company’s earnings from limited partnershipinterests accounted for under the equity method are recorded in Net investment income.
Other Investments: Other investments are comprised primarily of Federal Home Loan Bank (“FHLB”) stock and propertyobtained from foreclosed mortgage loans, as well as other miscellaneous investments. The Company is a member of the FHLBsystem and is required to own a certain amount of FHLB stock based on the level of borrowings and other factors. FHLB stockis carried at cost, classified as a restricted security and periodically evaluated for impairment based on ultimate recovery of parvalue.
Securities Lending: The Company engages in securities lending whereby certain securities from its portfolio are loaned to otherinstitutions, through a lending agent, for short periods of time. The Company has the right to approve any institution with whomthe lending agent transacts on its behalf. Initial collateral, primarily cash, is required at a rate of 102% of the market value of theloaned securities. The lending agent retains the collateral and invests it in short-term liquid assets on behalf of the Company.The market value of the loaned securities is monitored on a daily basis with additional collateral obtained or refunded as themarket value of the loaned securities fluctuates. The lending agent indemnifies the Company against losses resulting from thefailure of a counterparty to return securities pledged where collateral is insufficient to cover the loss.
Corporate Loans: Corporate loans held by consolidated collateralized loan obligations (“CLO” or “CLO entities”) are reportedin Corporate loans, at fair value using the fair value option, on the Consolidated Balance Sheets. Changes in the fair value of theloans are recorded in Changes in fair value related to collateralized loan obligations in the Consolidated Statements ofOperations. The fair values for corporate loans are determined using independent commercial pricing services. In the event thatthe third-party pricing source is unable to price an investment (which occurs in less than 1% of the loans), other relevant factorsare considered including:
• Information relating to the market for the asset, including price quotations for and trading in the asset or in similarinvestments and the market environment and investor attitudes towards the asset and interests in similar investments;
211
Voya Financial, Inc.Notes to the Consolidated Financial Statements(Dollar amounts in millions, unless otherwise stated)
• The characteristics of and fundamental analytical data relating to the investment, including the cost, current interestrate, period until next interest rate reset, maturity and base lending rate, the terms and conditions of the corporate loanand any related agreements and the position of the corporate loan in the borrower’s debt structure;
• The nature, adequacy and value of the corporate loan’s collateral, including the CLO’s rights, remedies and interestswith respect to the collateral;
• The creditworthiness of the borrower, based on an evaluation of its financial condition, financial statements andinformation about the business, cash flows, capital structure and future prospects;
• The reputation and financial condition of the agent and any intermediate participants in the corporate loan; and• General economic and market conditions affecting the fair value of the corporate loan.
ImpairmentsThe Company evaluates its available-for-sale general account investments quarterly to determine whether there has been another-than-temporary decline in fair value below the amortized cost basis. This evaluation process entails considerable judgmentand estimation. Factors considered in this analysis include, but are not limited to, the length of time and the extent to which thefair value has been less than amortized cost, the issuer’s financial condition and near-term prospects, future economic conditionsand market forecasts, interest rate changes and changes in ratings of the security. An extended and severe unrealized lossposition on a fixed maturity may not have any impact on: (a) the ability of the issuer to service all scheduled interest andprincipal payments and (b) the evaluation of recoverability of all contractual cash flows or the ability to recover an amount atleast equal to its amortized cost based on the present value of the expected future cash flows to be collected. In contrast, forcertain equity securities, the Company gives greater weight and consideration to a decline in market value and the likelihoodsuch market value decline will recover.
When assessing the Company’s intent to sell a security, or if it is more likely than not, it will be required to sell a security beforerecovery of its amortized cost basis, management evaluates facts and circumstances such as, but not limited to, decisions torebalance the investment portfolio and sales of investments to meet cash flow or capital needs.
When the Company has determined it has the intent to sell or if it is more likely than not that the Company will be required tosell a security before recovery of its amortized cost basis and the fair value has declined below amortized cost (“intentimpairment”), the individual security is written down from amortized cost to fair value, and a corresponding charge is recordedin Net realized capital gains (losses) in the Consolidated Statements of Operations as an other-than-temporary impairment(“OTTI”). If the Company does not intend to sell the security and it is not more likely than not that the Company will berequired to sell the security before recovery of its amortized cost basis, but the Company has determined that there has been another-than-temporary decline in fair value below the amortized cost basis, the OTTI is bifurcated into the amount representingthe present value of the decrease in cash flows expected to be collected (“credit impairment”) and the amount related to otherfactors (“noncredit impairment”). The credit impairment is recorded in Net realized capital gains (losses) in the ConsolidatedStatements of Operations. The noncredit impairment is recorded in Other comprehensive income (loss).
The Company uses the following methodology and significant inputs to determine the amount of the OTTI credit loss:• When determining collectability and the period over which the value is expected to recover for U.S. and foreign
corporate securities, foreign government securities and state and political subdivision securities, the Company appliesthe same considerations utilized in its overall impairment evaluation process, which incorporates informationregarding the specific security, the industry and geographic area in which the issuer operates and overallmacroeconomic conditions. Projected future cash flows are estimated using assumptions derived from the Company’sbest estimates of likely scenario-based outcomes, after giving consideration to a variety of variables that includes, butis not limited to: general payment terms of the security; the likelihood that the issuer can service the scheduled interestand principal payments; the quality and amount of any credit enhancements; the security’s position within the capitalstructure of the issuer; possible corporate restructurings or asset sales by the issuer; and changes to the rating of thesecurity or the issuer by rating agencies.
• Additional considerations are made when assessing the unique features that apply to certain structured securities, suchas subprime, Alt-A, non-agency RMBS, CMBS and ABS. These additional factors for structured securities include,but are not limited to: the quality of underlying collateral; expected prepayment speeds; loan-to-value ratios; debtservice coverage ratios; current and forecasted loss severity; consideration of the payment of the underlying assetsbacking a particular security; and the payment priority within the tranche structure of the security.
212

Voya Financial, Inc.Notes to the Consolidated Financial Statements(Dollar amounts in millions, unless otherwise stated)
• When determining the amount of the credit loss for U.S. and foreign corporate securities, foreign governmentsecurities and state and political subdivision securities, the Company considers the estimated fair value as the recoveryvalue when available information does not indicate that another value is more appropriate. When information isidentified that indicates a recovery value other than estimated fair value, the Company considers in the determinationof recovery value the same considerations utilized in its overall impairment evaluation process, which incorporatesavailable information and the Company’s best estimate of scenario-based outcomes regarding the specific security andissuer; possible corporate restructurings or asset sales by the issuer; the quality and amount of any creditenhancements; the security’s position within the capital structure of the issuer; fundamentals of the industry andgeographic area in which the security issuer operates; and the overall macroeconomic conditions.
• The Company performs a discounted cash flow analysis comparing the current amortized cost of a security to thepresent value of future cash flows expected to be received, including estimated defaults and prepayments. Thediscount rate is generally the effective interest rate of the fixed maturity prior to impairment.
In periods subsequent to the recognition of the credit related impairment components of OTTI on a fixed maturity, the Companyaccounts for the impaired security as if it had been purchased on the measurement date of the impairment. Accordingly, thediscount (or reduced premium) based on the new cost basis is accreted into Net investment income over the remaining term ofthe fixed maturity in a prospective manner based on the amount and timing of estimated future cash flows.
Derivatives
The Company’s use of derivatives is limited mainly to economic hedging to reduce the Company’s exposure to cash flowvariability of assets and liabilities, interest rate risk, credit risk, exchange rate risk and market risk. It is the Company’s policynot to offset amounts recognized for derivative instruments and amounts recognized for the right to reclaim cash collateral orthe obligation to return cash collateral arising from derivative instruments executed with the same counterparty under a masternetting arrangement.
The Company enters into interest rate, equity market, credit default and currency contracts, including swaps, futures, forwards,caps, floors and options, to reduce and manage various risks associated with changes in value, yield, price, cash flow orexchange rates of assets or liabilities held or intended to be held, or to assume or reduce credit exposure associated with areferenced asset, index or pool. The Company also utilizes options and futures on equity indices to reduce and manage risksassociated with its universal life-type and annuity products. Derivative contracts are reported as Derivatives assets or liabilitieson the Consolidated Balance Sheets at fair value. Changes in the fair value of derivatives are recorded in Other net realizedcapital gains (losses) in the Consolidated Statements of Operations.
To qualify for hedge accounting, at the inception of the hedging relationship, the Company formally documents its riskmanagement objective and strategy for undertaking the hedging transaction, as well as its designation of the hedge as either (a) ahedge of the exposure to changes in the estimated fair value of a recognized asset or liability or an identified portion thereof thatis attributable to a particular risk (“fair value hedge”) or (b) a hedge of a forecasted transaction or of the variability of cash flowsthat is attributable to interest rate risk to be received or paid related to a recognized asset or liability (“cash flow hedge”). In thisdocumentation, the Company sets forth how the hedging instrument is expected to hedge the designated risks related to thehedged item and sets forth the method that will be used to retrospectively and prospectively assess the hedging instrument’seffectiveness and the method that will be used to measure ineffectiveness. A derivative designated as a hedging instrument mustbe assessed as being highly effective in offsetting the designated risk of the hedged item. Hedge effectiveness is formallyassessed at inception and periodically throughout the life of the designated hedging relationship.
• Fair Value Hedge: For derivative instruments that are designated and qualify as a fair value hedge, the gain or loss onthe derivative instrument, as well as the hedged item, to the extent of the risk being hedged, are recognized in Othernet realized capital gains (losses) in the Consolidated Statements of Operations.
• Cash Flow Hedge: For derivative instruments that are designated and qualify as a cash flow hedge, the effectiveportion of the gain or loss on the derivative instrument is reported as a component of AOCI and reclassified intoearnings in the same periods during which the hedged transaction impacts earnings in the same line item associatedwith the forecasted transaction. The ineffective portion of the derivative’s change in value, if any, along with any ofthe derivative’s change in value that is excluded from the assessment of hedge effectiveness, are recorded in Other netrealized capital gains (losses) in the Consolidated Statements of Operations.
213

Voya Financial, Inc.Notes to the Consolidated Financial Statements(Dollar amounts in millions, unless otherwise stated)
When hedge accounting is discontinued because it is determined that the derivative is no longer expected to be highly effectivein offsetting changes in the estimated fair value or cash flows of a hedged item, the derivative continues to be carried on theConsolidated Balance Sheets at its estimated fair value, with subsequent changes in estimated fair value recognized currently inOther net realized capital gains (losses). The carrying value of the hedged asset or liability under a fair value hedge is no longeradjusted for changes in its estimated fair value due to the hedged risk, and the cumulative adjustment to its carrying value isamortized into income over the remaining life of the hedged item. Provided the hedged forecasted transaction is still probable ofoccurrence, the changes in estimated fair value of derivatives recorded in Other comprehensive income (loss) related todiscontinued cash flow hedges are released into the Consolidated Statements of Operations when the Company’s earnings areaffected by the variability in cash flows of the hedged item.
When hedge accounting is discontinued because it is no longer probable that the forecasted transactions will occur on theanticipated date or within two months of that date, the derivative continues to be carried on the Consolidated Balance Sheets atits estimated fair value, with changes in estimated fair value recognized currently in Other net realized capital gains (losses).Derivative gains and losses recorded in Other comprehensive income (loss) pursuant to the discontinued cash flow hedge of aforecasted transaction that is no longer probable are recognized immediately in Other net realized capital gains (losses).
The Company also has investments in certain fixed maturities and has issued certain universal life-type and annuity productsthat contain embedded derivatives whose fair value is at least partially determined by levels of or changes in domestic and/orforeign interest rates (short-term or long-term), exchange rates, prepayment rates, equity markets or credit ratings/spreads.Embedded derivatives within fixed maturities are included with the host contract on the Consolidated Balance Sheets, andchanges in the fair value of the embedded derivatives are recorded in Other net realized capital gains (losses) in theConsolidated Statements of Operations. Embedded derivatives within certain universal life-type and annuity products areincluded in Future policy benefits on the Consolidated Balance Sheets, and changes in the fair value of the embeddedderivatives are recorded in Other net realized capital gains (losses) in the Consolidated Statements of Operations.
In addition, the Company has entered into coinsurance with funds withheld reinsurance arrangements that contain embeddedderivatives, the fair value of which is based on the change in the fair value of the underlying assets held in trust. The embeddedderivatives within coinsurance with funds withheld reinsurance arrangements are reported in Funds held under reinsurancearrangements on the Consolidated Balance Sheets, and changes in the fair value of embedded derivatives are recorded inPolicyholder benefits in the Consolidated Statements of Operations.
Cash and Cash Equivalents
Cash and cash equivalents include cash on hand, amounts due from banks and other highly liquid investments, such as moneymarket instruments and debt instruments with maturities of three months or less at the time of purchase. Cash and cash equivalentsare stated at fair value. Cash and cash equivalents of VIEs and VOEs are not available for general use by the Company.
Property and Equipment
Property and equipment are carried at cost, less accumulated depreciation, and are included in Other assets on the ConsolidatedBalance Sheets. Expenditures for replacements and major improvements are capitalized; maintenance and repair expendituresare expensed as incurred. Depreciation on property and equipment is provided on a straight-line basis over the estimated usefullives of the assets, which generally range from 3 to 40 years, with the exception of land and artwork which are not depreciated.
As of December 31, 2015 and 2014, total cost basis was $366.6 and $408.1, of property and equipment respectively. As ofDecember 31, 2015 and 2014, total accumulated depreciation was $241.5 and $282.3, respectively. For the years endedDecember 31, 2015, 2014 and 2013, depreciation expense was $24.1, $26.6 and $33.7, respectively, and included in Operatingexpenses in the Consolidated Statements of Operations.
Deferred Policy Acquisition Costs, Value of Business Acquired and Other Intangibles
DAC represents policy acquisition costs that have been capitalized and are subject to amortization and interest. Capitalized costsare incremental, direct costs of contract acquisition and certain other costs related directly to successful acquisition activities. Suchcosts consist principally of commissions, underwriting, sales and contract issuance and processing expenses directly related to thesuccessful acquisition of new and renewal business. Indirect or unsuccessful acquisition costs, maintenance, product development
214
Voya Financial, Inc.Notes to the Consolidated Financial Statements(Dollar amounts in millions, unless otherwise stated)
and overhead expenses are charged to expense as incurred. VOBA represents the outstanding value of in-force business acquiredand is subject to amortization and interest. The value is based on the present value of estimated net cash flows embedded in theinsurance contracts at the time of the acquisition and increased for subsequent deferrable expenses on purchased policies.
Collectively, the Company refers to DAC, VOBA, deferred sales inducements (“DSI”) and unearned revenue (“URR”) as“DAC/VOBA and other intangibles”. (See respective “Sales Inducements” and “Recognition of Insurance Revenue and RelatedBenefits” sections below.) DAC/VOBA and other intangibles are adjusted for the impact of unrealized capital gains (losses) oninvestments, as if such gains (losses) have been realized, with corresponding adjustments included in AOCI.
Amortization Methodologies
The Company amortizes DAC and VOBA related to certain traditional life insurance contracts and certain accident and healthinsurance contracts over the premium payment period in proportion to the present value of expected gross premiums.Assumptions as to mortality, morbidity, persistency and interest rates, which include provisions for adverse deviation, areconsistent with the assumptions used to calculate reserves for future policy benefits.
These assumptions are “locked-in” at issue and not revised unless the DAC or VOBA balance is deemed to be unrecoverablefrom future expected profits. Recoverability testing is performed for current issue year products to determine if gross premiumsare sufficient to cover DAC or VOBA, estimated benefits and related expenses. In subsequent periods, the recoverability of theDAC or VOBA is determined by assessing whether future gross premiums are sufficient to amortize DAC or VOBA, as well asprovide for expected future benefits and related expenses. If a premium deficiency is deemed to be present, charges will beapplied against the DAC and VOBA balances before an additional reserve is established. Absent such a premium deficiency,variability in amortization after policy issuance or acquisition relates only to variability in premium volumes.
The Company amortizes DAC and VOBA related to universal life-type and fixed and variable deferred annuity contracts, exceptfor deferred annuity contracts within the CBVA segment, over the estimated lives of the contracts in relation to the emergenceof estimated gross profits. Assumptions as to mortality, persistency, interest crediting rates, fee income, returns associated withseparate account performance, impact of hedge performance, expenses to administer the business and certain economicvariables, such as inflation, are based on the Company’s experience and overall capital markets. At each valuation date,estimated gross profits are updated with actual gross profits, and the assumptions underlying future estimated gross profits areevaluated for continued reasonableness. Adjustments to estimated gross profits require that amortization rates be revisedretroactively to the date of the contract issuance (“unlocking”). For deferred annuity contracts within the CBVA segment, theCompany amortizes DAC/VOBA and DSI in relation to the emergence of estimated gross revenue.
For universal life-type contracts and fixed and variable deferred annuity contracts recoverability testing is performed for currentissue year products to determine if gross profits are sufficient to cover DAC/VOBA and other intangibles, estimated benefitsand related expenses. In subsequent years, the Company performs testing to assess the recoverability of DAC/VOBA and otherintangibles on an annual basis, or more frequently if circumstances indicate a potential loss recognition issue exists. If DAC/VOBA or other intangibles are not deemed recoverable from future gross profits, charges will be applied against the DAC/VOBA or other intangible balances before an additional reserve is established.
Internal Replacements
Contract owners may periodically exchange one contract for another, or make modifications to an existing contract. Thesetransactions are identified as internal replacements. Internal replacements that are determined to result in substantiallyunchanged contracts are accounted for as continuations of the replaced contracts. Any costs associated with the issuance of thenew contracts are considered maintenance costs and expensed as incurred. Unamortized DAC/VOBA and other intangiblesrelated to the replaced contracts continue to be deferred and amortized in connection with the new contracts. Internalreplacements that are determined to result in contracts that are substantially changed are accounted for as extinguishments of thereplaced contracts, and any unamortized DAC/VOBA and other intangibles related to the replaced contracts are written off tothe same account in which amortization is reported in the Consolidated Statements of Operations.
Assumptions
Changes in assumptions can have a significant impact on DAC/VOBA and other intangible balances, amortization rates, reservelevels, and results of operations. Assumptions are management’s best estimate of future outcome.
215
Voya Financial, Inc.Notes to the Consolidated Financial Statements(Dollar amounts in millions, unless otherwise stated)
Several assumptions are considered significant in the estimation of gross profits associated with the Company’s variable products.One significant assumption is the assumed return associated with the variable account performance. To reflect the volatility in theequity markets, this assumption involves a combination of near-term expectations and long-term assumptions regarding marketperformance. The overall return on the variable account is dependent on multiple factors, including the relative mix of theunderlying sub-accounts among bond funds and equity funds, as well as equity sector weightings. The Company’s practice assumesthat intermediate-term appreciation in equity markets reverts to the long-term appreciation in equity markets (“reversion to themean”). The Company monitors market events and only changes the assumption when sustained deviations are expected. Thismethodology incorporates a 9% long-term equity return assumption, a 14% cap and a five-year look-forward period.
Other significant assumptions used in the estimation of gross profits include mortality, and for products with credited ratesinclude interest rate spreads and credit losses. Estimated gross revenues and gross profits of variable annuity contracts aresensitive to mortality and estimated policyholder behavior assumptions, such as surrender, lapse and annuitization rates.
Sales Inducements
DSI represents benefits paid to contract owners for a specified period that are incremental to the amounts the Company creditson similar contracts without sales inducements and are higher than the contract’s expected ongoing crediting rates for periodsafter the inducement. The Company defers sales inducements and amortizes DSI over the estimated lives of the related contractsusing the same methodology and assumptions used to amortize DAC. The amortization of DSI is included in Interest credited tocontract owner account balances in the Consolidated Statements of Operations. Each year, or more frequently if circumstancesindicate a potentially significant recoverability issue exists, the Company reviews DSI to determine the recoverability of thesebalances.
For the years ended December 31, 2015, 2014 and 2013, the Company capitalized $23.1, $29.4 and $29.7, respectively, of salesinducements. For the years ended December 31, 2015, 2014 and 2013, the Company amortized $65.9, $37.8 and $52.7,respectively, of DSI.
Future Policy Benefits and Contract Owner Account Balances
Future Policy BenefitsThe Company establishes and carries actuarially-determined reserves that are calculated to meet its future obligations, includingestimates of unpaid claims and claims that the Company believes have been incurred but have not yet been reported as of thebalance sheet date. The principal assumptions used to establish liabilities for future policy benefits are based on Companyexperience and periodically reviewed against industry standards. These assumptions include mortality, morbidity, policy lapse,contract renewal, payment of subsequent premiums or deposits by the contract owner, retirement, investment returns, inflation,benefit utilization and expenses. Changes in, or deviations from, the assumptions used can significantly affect the Company’sreserve levels and related results of operations.
• Reserves for traditional life insurance contracts (term insurance, participating and non-participating whole lifeinsurance and traditional group life insurance) and accident and health insurance represent the present value of futurebenefits to be paid to or on behalf of contract owners and related expenses, less the present value of future netpremiums. Assumptions as to interest rates, mortality, expenses and persistency are based on the Company’s estimatesof anticipated experience at the period the policy is sold or acquired, including a provision for adverse deviation.Interest rates used to calculate the present value of these reserves ranged from 2.3% to 7.7%.
• Reserves for payout contracts with life contingencies are equal to the present value of expected future payments.Assumptions as to interest rates, mortality and expenses are based on the Company’s experience at the period thepolicy is sold or acquired, including a provision for adverse deviation. Such assumptions generally vary by annuityplan type, year of issue and policy duration. Interest rates used to calculate the present value of future benefits rangedfrom 1.0% to 8.3%.
Although assumptions are “locked-in” upon the issuance of traditional life insurance contracts, certain accident and healthinsurance contracts and payout contracts with life contingencies, significant changes in experience or assumptions may requirethe Company to provide for expected future losses on a product by establishing premium deficiency reserves. Premiumdeficiency reserves are determined based on best estimate assumptions that exist at the time the premium deficiency reserve isestablished and do not include a provision for adverse deviation.
216
Voya Financial, Inc.Notes to the Consolidated Financial Statements(Dollar amounts in millions, unless otherwise stated)
Contract Owner Account BalancesContract owner account balances relate to universal life-type and investment-type contracts, as follows:
• Account balances for guaranteed investment contracts and funding agreements with fixed maturities (collectivelyreferred to as “GICs”) are calculated using the amount deposited with the Company, less withdrawals, plus interestaccrued to the ending valuation date. Interest on these contracts is accrued by a predetermined index, plus a spread ora fixed rate, established at the issue date of the contract.
• Account balances for universal life-type contracts, including variable universal life (“VUL”) contracts, are equal tocumulative deposits, less charges, withdrawals and account values released upon death, plus credited interest thereon.
• Account balances for fixed annuities and payout contracts without life contingencies are equal to cumulative deposits,less charges and withdrawals, plus credited interest thereon. Credited interest rates vary by product and ranged up to8.0% for the years 2015, 2014 and 2013. Account balances for group immediate annuities without life contingentpayouts are equal to the discounted value of the payment at the implied break-even rate.
• For fixed-indexed annuity contracts (“FIAs”) and indexed universal life (“IUL”) contracts, the aggregate initialliability is equal to the deposit received, plus a bonus, if applicable, and is split into a host component and anembedded derivative component. Thereafter, the host liability accumulates at a set interest rate, and the embeddedderivative liability is recognized at fair value.
Product Guarantees and Additional ReservesThe Company calculates additional reserve liabilities for certain universal life-type products, certain variable annuity guaranteedbenefits and variable funding products. The Company periodically evaluates its estimates and adjusts the additional liabilitybalance, with a related charge or credit to benefit expense, if actual experience or other evidence suggests that earlierassumptions should be revised. Changes in, or deviations from, the assumptions used can significantly affect the Company’sreserve levels and related results of operations.
Universal and Variable Life: Reserves for universal life (“UL”) and VUL secondary guarantees and paid-up guarantees arecalculated by estimating the expected value of death benefits payable and recognizing those benefits ratably over theaccumulation period based on total expected assessments. The reserve for such products recognizes the portion of contractassessments received in early years used to compensate the Company for benefits provided in later years. Assumptions used,such as the interest rate, lapse rate and mortality, are consistent with assumptions used in estimating gross profits for purposesof amortizing DAC. Reserves for UL and VUL secondary guarantees and paid-up guarantees are recorded in Future policybenefits on the Consolidated Balance Sheets.
The Company also calculates a benefit ratio for each block of business that meets the requirements for additional reserves andcalculates an additional reserve by accumulating amounts equal to the benefit ratio multiplied by the assessments for eachperiod, reduced by excess benefits during the period. The additional reserve is accumulated at interest rates consistent with theDAC model for the period. The calculated reserve includes provisions for UL contracts that produce expected gains from theinsurance benefit function followed by losses from that function in later years. Additional reserves are recorded in Future policybenefits on the Consolidated Balance Sheets.
URR relates to UL and VUL products and represents policy charges for benefits or services to be provided in future periods (seethe “Recognition of Insurance Revenue and Related Benefits” section below). The URR balance is recorded in Contract owneraccount balances on the Consolidated Balance Sheets.
GMDB and GMIB: Reserves for annuity guaranteed minimum death benefits (“GMDB”) and guaranteed minimum incomebenefits (“GMIB”) are determined by estimating the value of expected benefits in excess of the projected account balance andrecognizing the excess ratably over the accumulation period based on total expected assessments. Expected experience is basedon a range of scenarios. Assumptions used, such as the long-term equity market return, lapse rate and mortality, are consistentwith assumptions used in estimating gross revenues for the purpose of amortizing DAC. The assumptions of investmentperformance and volatility are consistent with the historical experience of the appropriate underlying equity index, such as theStandard & Poor’s (“S&P”) 500 Index. In addition, the reserve for the GMIB incorporates assumptions for the likelihood andtiming of the potential annuitizations that may be elected by the contract owner. In general, the Company assumes that GMIBannuitization rates will be higher for policies with more valuable guarantees (“in the money”), where the notional benefitamount is in excess of the account value. Reserves for GMDB and GMIB are recorded in Future policy benefits on theConsolidated Balance Sheets. Changes in reserves for GMDB and GMIB are reported in Policyholder benefits in theConsolidated Statements of Operations.
217

Voya Financial, Inc.Notes to the Consolidated Financial Statements(Dollar amounts in millions, unless otherwise stated)
Most contracts issued on or before December 31, 1999 with enhanced death benefit guarantees were reinsured to third-partyreinsurers to mitigate the risk associated with such guarantees. For contracts issued after December 31, 1999, the Companyinstituted a variable annuity guarantee hedge program to mitigate the risks associated with these guarantees, which do notqualify for hedge accounting. The variable annuity guarantee hedge program is based on the Company entering into derivativepositions to offset such exposures to GMDB and GMIB due to adverse changes in the equity markets.
GMAB, GMWB, GMWBL, FIA and IUL: The Company also issues certain products which contain embedded derivatives that aremeasured at estimated fair value separately from the host contracts. These products include annuity guaranteed minimumaccumulation benefits (“GMAB”), guaranteed minimum withdrawal benefits without life contingencies (“GMWB”), guaranteedminimum withdrawal benefits with life payouts (“GMWBL”), FIAs and IUL contracts. Embedded derivatives associated withGMABs, GMWBs and GMWBLs are recorded in Future policy benefits on the Consolidated Balance Sheets. Embeddedderivatives associated with FIAs and IUL contracts are recorded in Contract owner account balances on the ConsolidatedBalance Sheets. Changes in estimated fair value, along with attributed fees collected or payments made, are reported in Othernet realized capital gains (losses) in the Consolidated Statements of Operations.
At inception of the GMAB, GMWB and GMWBL contracts, the Company projects a fee to be attributed to the embeddedderivative portion of the guarantee equal to the present value of projected future guaranteed benefits. After inception, theestimated fair value of the GMAB, GMWB and GMWBL contracts is determined based on the present value of projected futureguaranteed benefits, minus the present value of projected attributed fees. A risk neutral valuation methodology is used underwhich the cash flows from the guarantees are projected under multiple capital market scenarios using observable risk free rates.The projection of future guaranteed benefits and future attributed fees requires the use of assumptions for capital markets (e.g.,implied volatilities, correlation among indices, risk-free swap curve, etc.) and policyholder behavior (e.g., lapse, benefitutilization, mortality, etc.).
The estimated fair value of the embedded derivative in the FIA contracts is based on the present value of the excess of interestpayments to the contract owners over the growth in the minimum guaranteed contract value. The excess interest payments aredetermined as the excess of projected index driven benefits over the projected guaranteed benefits. The projection horizon isover the anticipated life of the related contracts, which takes into account best estimate actuarial assumptions, such as partialwithdrawals, full surrenders, deaths, annuitizations and maturities.
The estimated fair value of the embedded derivative in the IUL contracts is based on the present value of the excess of interestpayments to the contract owners over the growth in the minimum guaranteed account value. The excess interest payments aredetermined as the excess of projected index driven benefits over the projected guaranteed benefits. The projection horizon isover the current index term of the related contracts, which takes into account best estimate actuarial assumptions, such as partialwithdrawals, full surrenders, deaths and maturities.
Stabilizer and MCG: Guaranteed credited rates give rise to an embedded derivative in the Stabilizer products and a stand-alonederivative for managed custody guarantee products (“MCG”). These derivatives are measured at estimated fair value andrecorded in Contract owner account balances on the Consolidated Balance Sheets. Changes in estimated fair value, along withattributed fees collected, are reported in Other net realized capital gains (losses) in the Consolidated Statements of Operations.
The estimated fair value of the Stabilizer embedded derivatives and MCG contracts is determined based on the present value ofprojected future claims, minus the present value of future guaranteed premiums. At inception of the contract, the Companyprojects a guaranteed premium to be equal to the present value of the projected future claims. The income associated with thecontracts is projected using actuarial and capital market assumptions, including benefits and related contract charges, over theanticipated life of the related contracts. The cash flow estimates are projected under multiple capital market scenarios usingobservable risk-free rates and other best estimate assumptions.
The liabilities for the GMAB, GMWB, GMWBL, FIA, IUL and Stabilizer embedded derivatives and the MCG stand-alonederivative (collectively, “guaranteed benefit derivatives”) include a risk margin to capture uncertainties related to policyholderbehavior assumptions. The margin represents additional compensation a market participant would require to assume these risks.
The discount rate used to determine the fair value of the liabilities for the GMAB, GMWB, GMWBL, FIA, IUL and Stabilizerembedded derivatives and the MCG stand-alone derivative includes an adjustment to reflect the risk that these obligations willnot be fulfilled (“nonperformance risk”).
218

Voya Financial, Inc.Notes to the Consolidated Financial Statements(Dollar amounts in millions, unless otherwise stated)
Separate Accounts
Separate account assets and liabilities generally represent funds maintained to meet specific investment objectives of contractowners or participants who bear the investment risk, subject, in limited cases, to minimum guaranteed rates. Investment incomeand investment gains and losses generally accrue directly to such contract owners. The assets of each account are legallysegregated and are not subject to claims that arise out of any other business of the Company.
Separate account assets supporting variable options under variable annuity contracts are invested, as designated by the contractowner or participant under a contract, in shares of mutual funds that are managed by the Company or in other selected mutualfunds not managed by the Company.
The Company reports separately, as assets and liabilities, investments held in the separate accounts and liabilities of separateaccounts if:
• Such separate accounts are legally recognized;
• Assets supporting the contract liabilities are legally insulated from the Company’s general account liabilities;
• Investments are directed by the contract owner or participant; and
• All investment performance, net of contract fees and assessments, is passed through to the contract owner.
The Company reports separate account assets that meet the above criteria at fair value on the Consolidated Balance Sheets based onthe fair value of the underlying investments. Separate account liabilities equal separate account assets. Investment income and netrealized and unrealized capital gains (losses) of the separate accounts, however, are not reflected in the Consolidated Statements ofOperations, and the Consolidated Statements of Cash Flows do not reflect investment activity of the separate accounts.
Short-term and Long-term Debt
Short-term and long-term debt are carried at an amount equal to the unpaid principal balance, net of any remaining unamortizeddiscount or premium attributable to issuance. Direct and incremental costs to issue the debt are recorded in Other assets on theConsolidated Balance Sheets. Discounts, premiums and direct and incremental costs are amortized as a component of Interestexpense in the Consolidated Statements of Operations over the life of the debt using the effective interest method of amortization.
Collateralized Loan Obligations Notes
CLO notes issued by consolidated CLO entities are recorded as Collateralized loan obligations notes, at fair value using the fairvalue option, on the Consolidated Balance Sheets. Changes in the fair value of the notes are recorded in Changes in fair valuerelated to collateralized loan obligations in the Company’s Consolidated Statements of Operations.
Repurchase Agreements
The Company engages in dollar repurchase agreements with MBS (“dollar rolls”) and repurchase agreements with othercollateral types to increase its return on investments and improve liquidity. Such arrangements meet the requirements to beaccounted for as financing arrangements.
The Company enters into dollar roll transactions by selling existing MBS and concurrently entering into an agreement torepurchase similar securities within a short time frame at a lower price. Under repurchase agreements, the Company borrowscash from a counterparty at an agreed upon interest rate for an agreed upon time frame and pledges collateral in the form ofsecurities. At the end of the agreement, the counterparty returns the collateral to the Company, and the Company, in turn, repaysthe loan amount along with the additional agreed upon interest.
The Company’s policy requires that at all times during the term of the dollar roll and repurchase agreements that cash or othercollateral types obtained is sufficient to allow the Company to fund substantially all of the cost of purchasing replacementassets. Cash received is invested in Short-term investments, with the offsetting obligation to repay the loan included withinOther liabilities on the Consolidated Balance Sheets. The carrying value of the securities pledged in dollar rolls and repurchaseagreement transactions and the related repurchase obligation are included in Securities pledged and Short-term debt,respectively, on the Consolidated Balance Sheets.
219
Voya Financial, Inc.Notes to the Consolidated Financial Statements(Dollar amounts in millions, unless otherwise stated)
The primary risk associated with short-term collateralized borrowings is that the counterparty will be unable to perform underthe terms of the contract. The Company’s exposure is limited to the excess of the net replacement cost of the securities over thevalue of the short-term investments. The Company believes the counterparties to the dollar rolls and repurchase agreements arefinancially responsible and that the counterparty risk is minimal.
Recognition of Insurance Revenue and Related Benefits
Premiums related to traditional life insurance contracts and payout contracts with life contingencies are recognized in Premiumsin the Consolidated Statements of Operations when due from the contract owner. When premiums are due over a significantlyshorter period than the period over which benefits are provided, any gross premium in excess of the net premium (i.e., theportion of the gross premium required to provide for expected future benefits and expenses) is deferred and recognized intorevenue in a constant relationship to insurance in force. Benefits are recorded in Policyholder benefits in the ConsolidatedStatements of Operations when incurred.
Amounts received as payment for investment-type, universal life-type, fixed annuities, payout contracts without lifecontingencies and FIA contracts are reported as deposits to contract owner account balances. Revenues from these contractsconsist primarily of fees assessed against the contract owner account balance for mortality and policy administration chargesand are reported in Fee income. Surrender charges are reported in Other revenue. In addition, the Company earns investmentincome from the investment of contract deposits in the Company’s general account portfolio, which is reported in Netinvestment income in the Consolidated Statements of Operations. Fees assessed that represent compensation to the Company forservices to be provided in future periods and certain other fees are established as a URR liability and amortized into revenueover the expected life of the related contracts in proportion to estimated gross profits in a manner consistent with DAC for thesecontracts. URR is reported in Contract owner account balances and amortized into Fee income. Benefits and expenses for theseproducts include claims in excess of related account balances, expenses of contract administration and interest credited tocontract owner account balances.
Performance-based Incentive Fees on Private Equity Funds
Under the asset management fee arrangements of certain of its sponsored private equity funds, the Company is entitled toreceive performance-based incentive fees (“carried interest”) when the return on assets under management for such fundsexceeds prescribed investment return hurdles or other performance targets. Carried interest is accrued quarterly based onmeasuring cumulative fund performance against the performance hurdle stated in the relevant investment managementagreement, as if the fund were liquidated at its estimated fair value as of the applicable balance sheet date.
Carried interest is subject to adjustment to the extent that subsequent fund performance causes the fund’s cumulative investmentreturn to fall below the specified investment return hurdles. In such a circumstance, some or all of the previously accrued carriedinterest is reversed to the extent that the Company would no longer have an entitlement to such fee and, if such fees haveactually been received by the Company but are subject to recoupment by the fund, a liability is established for the potentialrepayment obligation.
Income Taxes
The Company files a consolidated federal income tax return, which includes many of its subsidiaries, in accordance with theInternal Revenue Code of 1986, as amended.
Items required by tax regulations to be included in the tax return may differ from the items reflected in the financial statements.As a result, the effective tax rate reflected in the financial statements may be different than the actual rate applied on the taxreturn. Some of these differences are permanent such as the dividends received deduction which is estimated using informationfrom the prior period and current year results. Other differences are temporary, reversing over time, such as the valuation ofinsurance reserves, and create deferred tax assets and liabilities.
220
Voya Financial, Inc.Notes to the Consolidated Financial Statements(Dollar amounts in millions, unless otherwise stated)
The Company’s deferred tax assets and liabilities resulting from temporary differences between financial reporting and taxbases of assets and liabilities are measured at the balance sheet date using enacted tax rates expected to apply to taxable incomein the years the temporary differences are expected to reverse.
Deferred tax assets represent the tax benefit of future deductible temporary differences, net operating loss carryforwards and taxcredit carryforwards. The Company evaluates and tests the recoverability of its deferred tax assets. Deferred tax assets arereduced by a valuation allowance if, based on the weight of evidence, it is more likely than not that some portion, or all, of thedeferred tax assets will not be realized. Considerable judgment and the use of estimates are required in determining whether avaluation allowance is necessary and, if so, the amount of such valuation allowance. In evaluating the need for a valuationallowance, the Company considers many factors, including:
• The nature, frequency and severity of book income or losses in recent years;• The nature and character of the deferred tax assets and liabilities;• The nature and character of income by life and non-life subgroups;• The recent cumulative book income (loss) position after adjustment for permanent differences;• Taxable income in prior carryback years;• Projected future taxable income, exclusive of reversing temporary differences and carryforwards;• Projected future reversals of existing temporary differences;• The length of time carryforwards can be utilized;• Prudent and feasible tax planning strategies the Company would employ to avoid a tax benefit from expiring unused; and• Tax rules that would impact the utilization of the deferred tax assets.
In establishing unrecognized tax benefits, the Company determines whether a tax position is more likely than not to be sustainedunder examination by the appropriate taxing authority. The Company also considers positions that have been reviewed andagreed to as part of an examination by the appropriate taxing authority. Tax positions that do not meet the more likely than notstandard are not recognized in the Consolidated Financial Statements. Tax positions that meet this standard are recognized in theConsolidated Financial Statements. The Company measures the tax position as the largest amount of benefit that is greater than50% likely of being realized upon ultimate resolution with the tax authority that has full knowledge of all relevant information.
ReinsuranceThe Company utilizes reinsurance agreements in most aspects of its insurance business to reduce its exposure to large losses.Such reinsurance permits recovery of a portion of losses from reinsurers, although it does not discharge the primary liability ofthe Company as direct insurer of the risks reinsured.
For each of its reinsurance agreements, the Company determines whether the agreement provides indemnification against lossor liability relating to insurance risk. The Company reviews contractual features, particularly those that may limit the amount ofinsurance risk to which the reinsurer is subject or features that delay the timely reimbursement of claims. The assumptions usedto account for both long and short-duration reinsurance agreements are consistent with those used for the underlying contracts.Ceded Future policy benefits and Contract owner account balances are reported gross on the Consolidated Balance Sheets.
Long-duration: For reinsurance of long-duration contracts that transfer significant insurance risk, the difference, if any, betweenthe amounts paid and benefits received related to the underlying contracts is included in the expected net cost of reinsurance,which is recorded as a component of the reinsurance asset or liability. Any difference between actual and expected net cost ofreinsurance is recognized in the current period and included as a component of profits used to amortize DAC.
Short-duration: For prospective reinsurance of short-duration contracts that meet the criteria for reinsurance accounting, amountspaid are recorded as ceded premiums and ceded unearned premiums and are reflected as a component of Premiums in theConsolidated Statements of Operations and Other assets on the Consolidated Balance Sheets, respectively. Ceded unearnedpremiums are amortized through premiums over the remaining contract period in proportion to the amount of protection provided.
For retroactive reinsurance of short-duration contracts that meet the criteria for reinsurance accounting, amounts paid in excessof the related insurance liabilities ceded are recognized immediately as a loss. Any gains on such retroactive agreements aredeferred in Other liabilities and amortized over the remaining life of the underlying contracts.
221
Voya Financial, Inc.Notes to the Consolidated Financial Statements(Dollar amounts in millions, unless otherwise stated)
Accounting for reinsurance requires extensive use of assumptions and estimates, particularly related to the future performanceof the underlying business and the potential impact of counterparty credit risks. The Company periodically reviews actual andanticipated experience compared to the assumptions used to establish assets and liabilities relating to ceded and assumedreinsurance. The Company also evaluates the financial strength of potential reinsurers and continually monitors the financialcondition of reinsurers. The S&P ratings for the Company’s reinsurers with the largest reinsurance recoverable balances areA-rated or better, including Lincoln National Corporation (“Lincoln”), Hannover Life Reassurance Company of America(“Hannover US”) and Hannover Re (Ireland) Limited (“HLRI”) (collectively, “Hannover Re”) and various subsidiaries ofReinsurance Group of America Incorporated (collectively, “RGA”).
Only those reinsurance recoverable balances deemed probable of recovery are recognized as assets on the Company’sConsolidated Balance Sheets and are stated net of allowances for uncollectible reinsurance. Amounts currently recoverable andpayable under reinsurance agreements are included in Reinsurance recoverable and Other liabilities, respectively. Such assetsand liabilities relating to reinsurance agreements with the same reinsurer are recorded net on the Consolidated Balance Sheets ifa right of offset exists within the reinsurance agreement. Premiums, Fee income and Policyholder benefits are reported net ofreinsurance ceded. Amounts received from reinsurers for policy administration are reported in Other revenue.
The Company has entered into coinsurance funds withheld reinsurance arrangements that contain embedded derivatives whosecarrying value is estimated based on the change in the fair value of the assets supporting the funds withheld payable under theagreements.
Employee Benefits Plans
The Company sponsors and/or administers various plans that provide defined benefit pension and other postretirement benefitplans covering eligible employees, sales representatives and other individuals. The plans are generally funded throughpayments, determined by periodic actuarial calculations, to trustee-administered funds.
A defined benefit plan is a pension plan that defines an amount of pension benefit that an employee will receive on retirement,usually dependent on one or more factors such as age, years of service and compensation. The liability recognized in respect ofdefined benefit pension plans is the present value of the projected pension benefit obligation (“PBO”) at the balance sheet date,less the fair value of plan assets, together with adjustments for unrecognized past service costs. This liability is included inPension and other postretirement provisions on the Consolidated Balance Sheets. The PBO is defined as the actuariallycalculated present value of vested and non-vested pension benefits accrued based on future salary levels. The Companyrecognizes the funded status of the PBO for pension plans and the accumulated postretirement benefit obligation (“APBO”) forother postretirement plans on the Consolidated Balance Sheets.
Net periodic benefit cost is determined using management estimates and actuarial assumptions to derive service cost, interest costand expected return on plan assets for a particular year. The obligations and expenses associated with these plans require use ofassumptions, such as discount rate, expected rate of return on plan assets, rate of future compensation increases and healthcare costtrend rates, as well as assumptions regarding participant demographics such as age of retirements, withdrawal rates and mortality.Management determines these assumptions based on a variety of factors such as historical performance of the plan and its assets,currently available market and industry data and expected benefit payout streams. Actual results could vary significantly fromassumptions based on changes, such as economic and market conditions, demographics of participants in the plans andamendments to benefits provided under the plans. These differences may have a significant effect on the Company’s ConsolidatedFinancial Statements and liquidity. Differences between the expected return and the actual return on plan assets and actuarial gains(losses) are immediately recognized in Operating expenses in the Consolidated Statements of Operations.
For postretirement healthcare and other benefits to retirees, the entitlement to these benefits is usually conditional on the employeeremaining in service up to retirement age and the completion of a minimum service period. The expected costs of these benefits areaccrued in Other liabilities over the period of employment using an accounting methodology similar to that for defined benefit pensionplans. Actuarial gains (losses) are immediately recognized in Operating expenses in the Consolidated Statements of Operations.
222
Voya Financial, Inc.Notes to the Consolidated Financial Statements(Dollar amounts in millions, unless otherwise stated)
Share-based Compensation
The Company grants certain employees and directors share-based compensation awards under various plans. Certain employeesof the Company have in the past participated in various ING Group share-based compensation plans for which awards remainoutstanding. Both the Voya Financial, Inc. and the ING Group share-based compensation plans are subject to certain vestingconditions. The Company measures the cost of the share-based awards at their grant date fair value, based on the market valueof the stock, and recognizes that cost over the vesting period. Fair value of stock options is determined using a Black-Scholesoptions valuation methodology. Differences in actual versus expected experience or changes in expected forfeitures arerecognized in the period of change. Compensation expense is principally related to the granting of performance share units,restricted stock units and stock options and is recognized in Operating expenses in the Consolidated Statements of Operations.The majority of awards granted are provided in the first quarter of each year.
The liability related to the cash-settled awards made under the Voya Financial, Inc. 2014 Employee Phantom Stock Plan isrecorded within Other liabilities on the Consolidated Balance Sheets. Unlike equity-settled awards, which have a fixed grant-datefair value, the fair value of unvested cash-settled awards is remeasured at the end of each reporting period until the awards vest.
Excess tax benefits recorded in Additional paid-in capital are accounted for in a single pool available to all share-basedcompensation awards. Excess tax benefits in Additional paid-in capital are not recognized until the benefits result in a reductionin taxes payable. The Company uses tax law ordering when determining when excess tax benefits have been realized.
Earnings per Common Share
Basic earnings per common share (“EPS”) is computed by dividing earnings available to common shareholders by the weightedaverage number of common shares outstanding during the period. Diluted EPS is computed assuming the issuance of nonvestedshares, restricted stock units, stock options, performance share units and warrants using the treasury stock method. Basic anddiluted earnings per share are calculated using unrounded, actual amounts. Under the treasury stock method, the Companyutilizes the average market price to determine the amount of cash that would be available to repurchase shares if the commonshares vested. The net incremental share count issued represents the potential dilutive or anti-dilutive securities.
For any period where a loss from earnings available to common shareholders is experienced, shares used in the diluted EPScalculation represent basic shares, as using diluted shares would be anti-dilutive to the calculation.
Consolidation and Noncontrolling Interests
The Company consolidates entities in which it, directly or indirectly, is determined to have a controlling financial interest.
VIEs: The Company consolidates VIEs for which it is the primary beneficiary. An entity is a VIE if it has equity investorswho lack the characteristics of a controlling financial interest or it does not have sufficient equity at risk to finance itsexpected activities without additional subordinated financial support from other parties. The primary beneficiary (a) has thepower to direct the activities of the entity that most significantly impact the entity’s economic performance and (b) has theobligation to absorb losses or the right to receive benefits from the entity that could potentially be significant to the entity.
VOEs: For entities determined not to be VIEs, the Company consolidates entities in which it has an equity investment ofgreater than 50% and has control over significant operating, financial and investing decisions of the entity. Additionally,the Company consolidates entities in which the Company is a substantive, controlling general partner, and the limitedpartners have no substantive rights to impact ongoing governance and operating activities of the partnership.
The Company provides investment management services to, and has transactions with, various CLO entities, private equity funds,real estate funds, funds-of-hedge funds, single strategy hedge funds, insurance entities, securitizations and other investment entitiesin the normal course of business. In certain instances, the Company serves as the investment manager, making day-to-dayinvestment decisions concerning the assets of these entities. These entities are considered to be either VIEs or VOEs, and theCompany evaluates its involvement with each entity to determine whether consolidation is required. Investment management feesand contingent performance fees are recorded in Fee income in the Consolidated Statements of Operations.
223
Voya Financial, Inc.Notes to the Consolidated Financial Statements(Dollar amounts in millions, unless otherwise stated)
For certain investment funds after January 1, 2010, and all entities prior to January 1, 2010, the determination is based onprevious consolidation guidelines that require an analysis to determine whether (a) an entity in which the Company holds avariable interest is a VIE and (b) the Company’s involvement, through holding interests directly or indirectly in the entity orcontractually through other variable interests (e.g., management fees), would be expected to absorb a majority of the entity’sexpected losses or receive a majority of residual returns in the entity, or both.
The determination of whether an entity in which the Company holds a variable interest is a VIE requires judgments, whichinclude (1) determining whether the equity investment at risk is sufficient to permit the entity to finance its activities withoutadditional subordinated financial support; (2) evaluating whether the equity holders, as a group, can make decisions that have asignificant effect on the success of the entity; (3) determining whether two or more parties’ equity interests should beaggregated; and (4) determining whether the equity investors have proportionate voting rights to their obligations to absorblosses or rights to receive returns from an entity. The Company determines whether it is the primary beneficiary of a VIE at thetime it becomes involved with a VIE. Consolidation conclusions are reviewed quarterly to identify whether any reconsiderationevents have occurred, which would require detailed reassessment of the VIE status.
The Company has elected to apply the FVO for financial assets and financial liabilities held by consolidated CLO entities andcontinues to measure these assets (primarily senior bank and corporate loans) and liabilities (debt obligations issued by CLOentities) at fair value in subsequent periods. The Company has elected the FVO to more closely align its accounting with theeconomics of its transactions. This election allows the Company to more effectively align changes in the fair value of CLOassets with a commensurate change in the fair value of CLO liabilities.
Noncontrolling interest represents the interests of shareholders, other than the Company, in consolidated entities. In theConsolidated Statements of Operations, Net income (loss) attributable to noncontrolling interest represents such shareholders’interests in the earnings and losses of those entities, or the attribution of results from consolidated VIEs or VOEs to which theCompany is not economically entitled.
Contingencies
A loss contingency is an existing condition, situation or set of circumstances involving uncertainty as to possible loss that willultimately be resolved when one or more future events occur or fail to occur. Examples of loss contingencies include pending orthreatened adverse litigation, threat of expropriation of assets and actual or possible claims and assessments. Amounts related toloss contingencies are accrued and recorded in Other liabilities on the Consolidated Balance Sheets if it is probable that a losshas been incurred and the amount can be reasonably estimated, based on the Company’s best estimate of the ultimate outcome.
Adoption of New Pronouncements
Repurchase Agreements
In June 2014, the Financial Accounting Standards Board (“FASB”) issued Accounting Standards Update (“ASU”) 2014-11,“Transfers and Servicing (Accounting Standards Codification (“ASC”) Topic 860): Repurchase-to-Maturity Transactions,Repurchase Financings, and Disclosures” (“ASU 2014-11”), which (1) changes the accounting for repurchase-to-maturitytransactions to secured borrowing accounting, and (2) requires separate accounting for a transfer of a financial asset executed with arepurchase agreement with the same counterparty. This results in secured borrowing accounting for the repurchase agreement. Theamendments also require additional disclosures for certain transactions accounted for as a sale and for repurchase agreements,securities lending transactions and repurchase-to-maturity transactions that are accounted for as secured borrowings.
The provisions of ASU 2014-11 were adopted by the Company on January 1, 2015, with the exception of disclosureamendments for repurchase agreements, securities lending transactions and repurchase-to-maturity transactions that areaccounted for as secured borrowings, which were adopted April 1, 2015. The adoption of the January 1, 2015 provisions had noeffect on the Company’s financial condition, results of operations or cash flows. The disclosures required by ASU 2014-11 areincluded in the Investments (excluding Consolidated Investment Entities) Note to these Consolidated Financial Statements.
224

Voya Financial, Inc.Notes to the Consolidated Financial Statements(Dollar amounts in millions, unless otherwise stated)
Discontinued Operations and DisposalsIn April 2014, the FASB issued ASU 2014-08, “Presentation of Financial Statements (ASC Topic 205) and Property, Plant, andEquipment (ASC Topic 360): Reporting Discontinued Operations and Disclosures of Disposals of Components of an Entity”(“ASU 2014-08”), which requires the disposal of a component of an entity to be reported in discontinued operations if thedisposal represents a strategic shift that has, or will have, a major effect on the entity’s operations and financial results. Thecomponent should be reported in discontinued operations when it meets the criteria to be classified as held for sale, is disposedof by sale or is disposed of other than by sale.
The amendments also require additional disclosures about discontinued operations, including disclosures about an entity’ssignificant continuing involvement with a discontinued operation and disclosures for a disposal of an individually significantcomponent of an entity that does not qualify for discontinued operations.
The provisions of ASU 2014-08 were adopted prospectively by the Company on January 1, 2015. The adoption had no effect onthe Company’s financial condition, results of operations or cash flows.
Future Adoption of Accounting PronouncementsFinancial InstrumentsIn January 2016, the FASB issued ASU 2016-01, “Financial Instruments-Overall (ASC Subtopic 825-10): Recognition andMeasurement of Financial Assets and Financial Liabilities” (“ASU 2016-01”), which requires:
• Equity investments (except those consolidated or accounted for under the equity method) to be measured at fair valuewith changes in fair value recognized in net income.
• Elimination of the disclosure of methods and significant assumptions used to estimate the fair value for financialinstruments measured at amortized cost.
• The use of the exit price notion when measuring the fair value of financial instruments for disclosure purposes.• Separate presentation in other comprehensive income of the portion of the total change in fair value of a liability
resulting from a change in own credit risk if the liability is measured at fair value under the fair value option.• Separate presentation on the balance sheet or financial statement notes of financial assets and financial liabilities by
measurement category and form of financial asset.
The provisions of ASU 2016-01 are effective for fiscal years, and interim periods within those fiscal years, beginning afterDecember 15, 2017, with early adoption only permitted for certain provisions. Initial adoption of ASU 2016-01 should bereported on a modified retrospective basis, with a cumulative-effect adjustment to balance sheet as of the beginning of the yearof adoption, except for certain provisions that should be applied prospectively. The Company is currently in the process ofdetermining the impact of adoption of the provisions of ASU 2016-01.
Short-Duration ContractsIn May 2015, the FASB issued ASU 2015-09, “Financial Services—Insurance (ASC Topic 944): Disclosures about Short-DurationContracts” (“ASU 2015-09”), which requires insurance entities to disclose, for annual reporting periods, information about theliability for unpaid claims and claim adjustment expenses and about significant changes in methodologies and assumptions used tocalculate the liability for unpaid claims and claims adjustment expenses. The standard also requires entities to disclose, for annualand interim reporting periods, a rollforward of the liability for unpaid claims and claim adjustment expenses.
The provisions of ASU 2015-09 are effective, retrospectively, for annual periods beginning after December 15, 2015, andinterim periods within annual periods beginning after December 15, 2016, with early adoption permitted. The Company iscurrently in the process of determining the impact of adoption of the provisions of ASU 2015-09.
Investments That Calculate Net Asset ValueIn May 2015, the FASB issued ASU 2015-07, “Fair Value Measurement (ASC Topic 820): Disclosures for Investments inCertain Entities That Calculate Net Asset Value per Share (or Its Equivalent)” (“ASU 2015-07”), which removes therequirement to categorize within the fair value hierarchy all investments for which fair value is measured using the net assetvalue per share practical expedient. In addition, the standard limits certain disclosures to investments for which the entity haselected to measure the fair value using the practical expedient, rather than for all investments that are eligible to be measured atfair value using the net asset value per share.
225
Voya Financial, Inc.Notes to the Consolidated Financial Statements(Dollar amounts in millions, unless otherwise stated)
The provisions of ASU 2015-07 are effective, retrospectively, for fiscal years beginning after December 15, 2015, and interimperiods within those fiscal years, with early adoption permitted. The Company does not expect ASU 2015-07 to have asignificant impact on the Company’s financial condition, results of operations or cash flows.
Debt Issuance Costs
In April 2015, the FASB issued ASU 2015-03, “Interest—Imputation of Interest (ASC Subtopic 835-30): Simplifying thePresentation of Debt Issuance Costs” (“ASU 2015-03”), which requires debt issuance costs related to a recognized debt liabilityto be presented in the balance sheet as a direct deduction from the carrying amount of that debt liability. In August 2015, theFASB issued ASU 2015-15, “Presentation and Subsequent Measurement of Debt Issuance Costs Associated with Line-of-CreditArrangements” (“ASU 2015-15”), to confirm that ASU 2015-03 does not address debt issuance costs related to line-of-creditarrangements. As such, an entity may defer and present such costs as an asset and subsequently amortize the costs ratably overthe term of the line-of-credit arrangement.
The provisions of ASU 2015-03 and ASU 2015-15 are effective, retrospectively, for financial statements issued for fiscal yearsbeginning after December 15, 2015, and interim periods within those fiscal years, with early adoption permitted. The adoptionof the provisions of ASU 2015-03 and ASU 2015-15 is expected to result in the reclassification of approximately $26.1 of debtissuance costs from Other assets to a reduction of Long-term debt in the Consolidated Balance Sheets as of January 1, 2016.
Consolidation
In February 2015, the FASB issued ASU 2015-02, “Consolidation (ASC Topic 810): Amendments to the ConsolidationAnalysis” (“ASU 2015-02”), which:
• Modifies the evaluation of whether limited partnerships and similar legal entities are VIEs or VOEs, including therequirement to consider the rights of all equity holders at risk to determine if they have the power to direct the entity’smost significant activities.
• Eliminates the presumption that a general partner should consolidate a limited partnership. Limited partnerships andsimilar entities will be VIEs unless the limited partners hold substantive kick-out rights or participating rights.
• Affects the consolidation analysis of reporting entities that are involved with VIEs, particularly those that have feearrangements and related party relationships.
• Provides a new scope exception for registered money market funds and similar unregistered money market funds, andends the deferral granted to investment companies from applying the VIE guidance.
The provisions of ASU 2015-02 are effective for annual periods, and for interim periods within those annual periods, beginningafter December 15, 2015, with early adoption permitted, using either a retrospective or modified retrospective approach.
The Company plans to adopt the provisions of ASU 2015-02 on January 1, 2016 using the modified retrospective approach, andis still in the process of finalizing implementation and determining the impacts of adoption; therefore, the following estimatesare subject to change. The Company currently estimates the impact to the Company’s January 1, 2016 Consolidated BalanceSheet will be the deconsolidation of approximately $7.5 billion of assets (comprised of $2.5 billion of Limited partnerships/corporations, at fair value, $0.3 billion of Cash and cash equivalents, $4.6 billion of Corporate loans, at fair value using the fairvalue option, and $0.1 billion of Other assets) and $5.9 billion of liabilities (comprised of $4.6 billion of Collateralized loanobligations notes, at fair value using the fair value option, and $1.3 billion of Other liabilities related to consolidated investmententities), with a related adjustment to Noncontrolling interest of $1.6 billion.
Subsequent to implementation, the impact of deconsolidation will result in a change in Net investment income (loss) related tothe Company’s retained interest in the deconsolidated entities, which previously was included in Income (loss) related toconsolidated investment entities. In addition, deconsolidation will result in an increase in Fee income and Other revenue relatedto management and performance fees, respectively, earned by the Company with respect to the deconsolidated entities, whichpreviously were eliminated against Other expense related to consolidated investment entities. These changes in the ConsolidatedStatements of Operations presentation will not impact Net income available to Voya Financial, Inc.’s common shareholders.
226

Voya Financial, Inc.Notes to the Consolidated Financial Statements(Dollar amounts in millions, unless otherwise stated)
Hybrid Financial Instruments
In November 2014, the FASB issued ASU 2014-16, “Derivatives and Hedging (ASC Topic 815): Determining Whether theHost Contract in a Hybrid Financial Instrument Issued in the Form of a Share Is More Akin to Debt or to Equity” (“ASU 2014-16”), which requires an entity to determine the nature of the host contract by considering the economic characteristics and risksof the entire hybrid financial instrument, including all embedded derivative features.
The provisions of ASU 2014-16 are effective for fiscal years, and interim periods within those fiscal years, beginning afterDecember 15, 2015, with early adoption permitted. Initial adoption of ASU 2014-16 may be reported on a modifiedretrospective basis, with a cumulative-effect adjustment to retained earnings as of the beginning of the year of adoption, or on afull retrospective basis, with application to all prior periods presented. The Company does not expect ASU 2014-16 to have animpact on the Company’s financial condition, results of operations or cash flows.
Collateralized Financing Entities
In August 2014, the FASB issues ASU 2014-13, “Consolidation (ASC Topic 810): Measuring the Financial Assets and theFinancial Liabilities of a Consolidated Collateralized Financing Entity” (“ASU 2014-13”), which allows an entity to elect tomeasure the financial assets and financial liabilities of a consolidated collateralized financing entity using either:
• ASC Topic 820, whereby both the financial assets and liabilities are measured using the requirements of ASC Topic820, with any difference reflected in earnings and attributed to the reporting entity in the statement of operations.
• The measurement alternative, whereby both the financial assets and liabilities are measured using the more observableof the fair value of the financial assets and the fair value of the financial liabilities.
The provisions of ASU 2014-13 are effective for annual periods, and interim periods within those annual periods, beginningafter December 15, 2015, with early adoption permitted, using either a retrospective or modified retrospective approach.
The Company plans to adopt the provisions of ASU 2014-13 on January 1, 2016 using the modified retrospective method, and isstill in the process of finalizing implementation and determining the impact of adoption; therefore, the following estimate issubject to change. The Company currently estimates that, subsequent to the adoption of ASU 2015-02, the adoption of ASU2014-13 will result in an increase of $17.8 in Collateralized loan obligations notes, at fair value using the fair value option,related to consolidated investment entities, with an offsetting decrease to appropriated retained deficit of $17.8, resulting in theelimination of appropriated retained earnings related to consolidated investment entities.
Revenue from Contracts with Customers
In May 2014, the FASB issued ASU 2014-09, “Revenue from Contracts with Customers (ASC Topic 606)” (“ASU 2014-09”),which requires an entity to recognize revenue to depict the transfer of promised goods or services to customers in an amountthat reflects the consideration to which the entity expects to be entitled in exchange for those goods or services. Revenue isrecognized when, or as, the entity satisfies a performance obligation under the contract. The standard also requires disclosuresregarding the nature, amount, timing and uncertainty of revenue and cash flows arising from contracts with customers.
In August 2015, the FASB issued ASU 2015-14 to amend the effective date of ASU 2014-09 to fiscal years, and interim periodswithin those fiscal years, beginning after December 15, 2017. Early adoption is permitted as of the original effective date, whichis January 1, 2017. The provisions of ASU 2014-09 are effective retrospectively. The Company is currently in the process ofdetermining the impact of adoption of the provisions of ASU 2014-09.
227
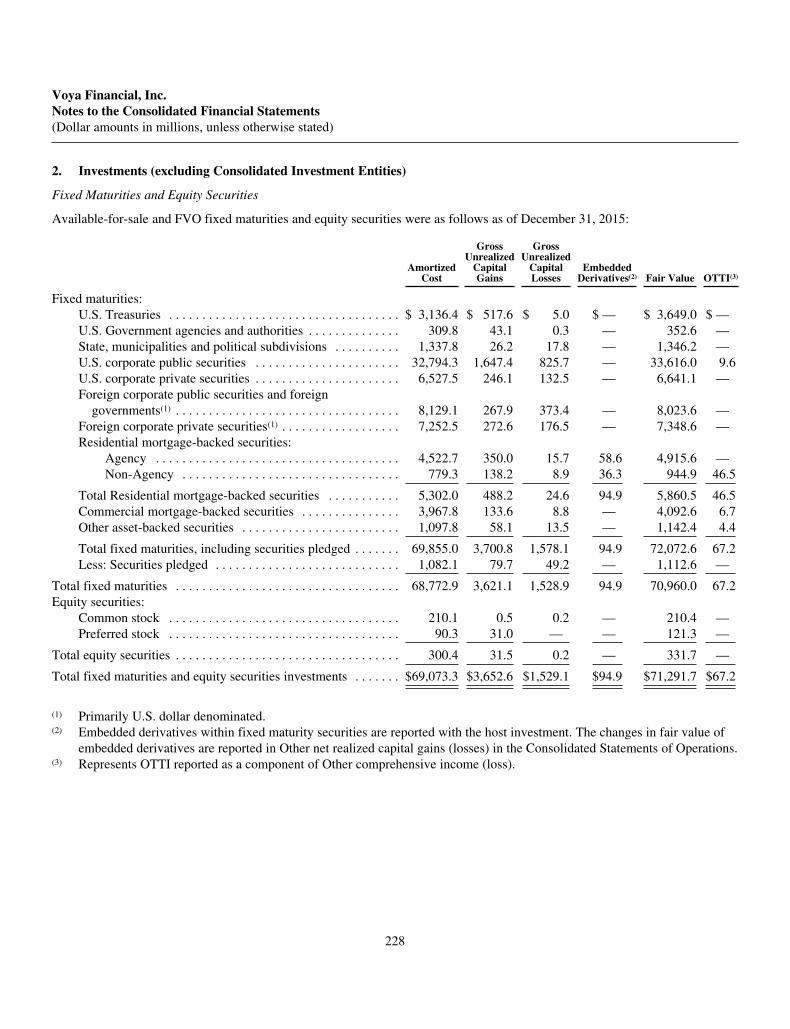
Voya Financial, Inc.Notes to the Consolidated Financial Statements(Dollar amounts in millions, unless otherwise stated)
2. Investments (excluding Consolidated Investment Entities)
Fixed Maturities and Equity Securities
Available-for-sale and FVO fixed maturities and equity securities were as follows as of December 31, 2015:
AmortizedCost
GrossUnrealized
CapitalGains
GrossUnrealized
CapitalLosses
EmbeddedDerivatives(2) Fair Value OTTI(3)
Fixed maturities:U.S. Treasuries . . . . . . . . . . . . . . . . . . . . . . . . . . . . . . . . . . . $ 3,136.4 $ 517.6 $ 5.0 $ — $ 3,649.0 $ —U.S. Government agencies and authorities . . . . . . . . . . . . . . 309.8 43.1 0.3 — 352.6 —State, municipalities and political subdivisions . . . . . . . . . . 1,337.8 26.2 17.8 — 1,346.2 —U.S. corporate public securities . . . . . . . . . . . . . . . . . . . . . . 32,794.3 1,647.4 825.7 — 33,616.0 9.6U.S. corporate private securities . . . . . . . . . . . . . . . . . . . . . . 6,527.5 246.1 132.5 — 6,641.1 —Foreign corporate public securities and foreign
governments(1) . . . . . . . . . . . . . . . . . . . . . . . . . . . . . . . . . . 8,129.1 267.9 373.4 — 8,023.6 —Foreign corporate private securities(1) . . . . . . . . . . . . . . . . . . 7,252.5 272.6 176.5 — 7,348.6 —Residential mortgage-backed securities:
Agency . . . . . . . . . . . . . . . . . . . . . . . . . . . . . . . . . . . . . 4,522.7 350.0 15.7 58.6 4,915.6 —Non-Agency . . . . . . . . . . . . . . . . . . . . . . . . . . . . . . . . . 779.3 138.2 8.9 36.3 944.9 46.5
Total Residential mortgage-backed securities . . . . . . . . . . . 5,302.0 488.2 24.6 94.9 5,860.5 46.5Commercial mortgage-backed securities . . . . . . . . . . . . . . . 3,967.8 133.6 8.8 — 4,092.6 6.7Other asset-backed securities . . . . . . . . . . . . . . . . . . . . . . . . 1,097.8 58.1 13.5 — 1,142.4 4.4
Total fixed maturities, including securities pledged . . . . . . . 69,855.0 3,700.8 1,578.1 94.9 72,072.6 67.2Less: Securities pledged . . . . . . . . . . . . . . . . . . . . . . . . . . . . 1,082.1 79.7 49.2 — 1,112.6 —
Total fixed maturities . . . . . . . . . . . . . . . . . . . . . . . . . . . . . . . . . . 68,772.9 3,621.1 1,528.9 94.9 70,960.0 67.2Equity securities:
Common stock . . . . . . . . . . . . . . . . . . . . . . . . . . . . . . . . . . . 210.1 0.5 0.2 — 210.4 —Preferred stock . . . . . . . . . . . . . . . . . . . . . . . . . . . . . . . . . . . 90.3 31.0 — — 121.3 —
Total equity securities . . . . . . . . . . . . . . . . . . . . . . . . . . . . . . . . . . 300.4 31.5 0.2 — 331.7 —
Total fixed maturities and equity securities investments . . . . . . . $69,073.3 $3,652.6 $1,529.1 $94.9 $71,291.7 $67.2
(1) Primarily U.S. dollar denominated.(2) Embedded derivatives within fixed maturity securities are reported with the host investment. The changes in fair value of
embedded derivatives are reported in Other net realized capital gains (losses) in the Consolidated Statements of Operations.(3) Represents OTTI reported as a component of Other comprehensive income (loss).
228
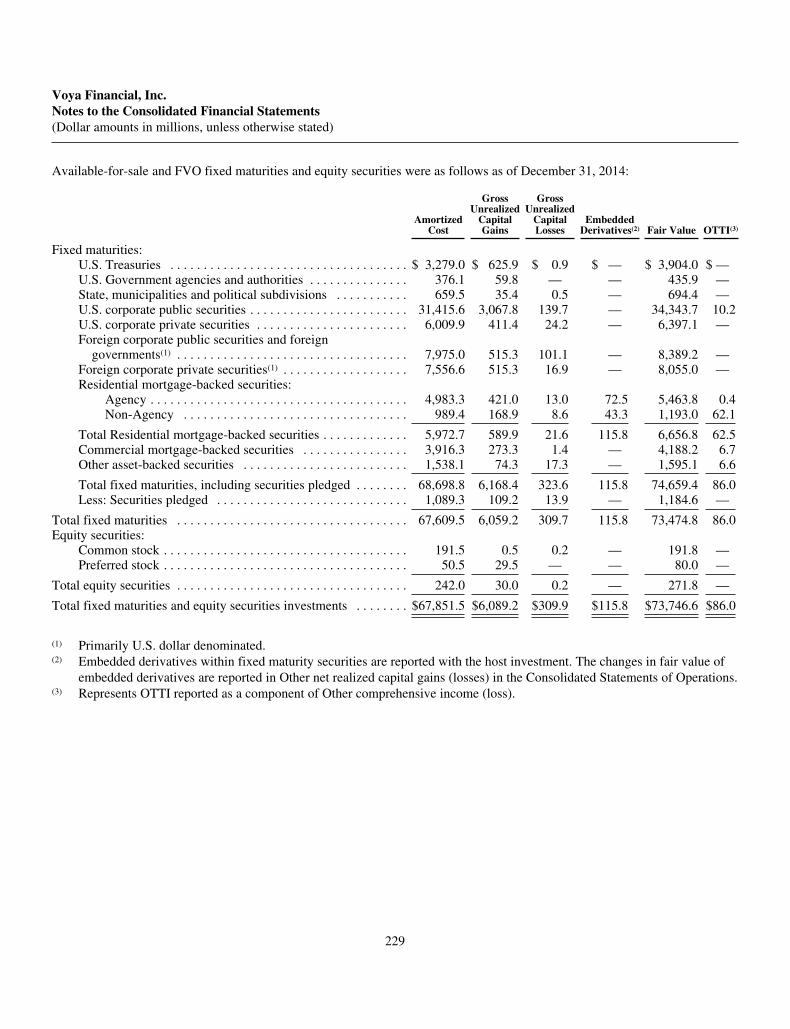
Voya Financial, Inc.Notes to the Consolidated Financial Statements(Dollar amounts in millions, unless otherwise stated)
Available-for-sale and FVO fixed maturities and equity securities were as follows as of December 31, 2014:
AmortizedCost
GrossUnrealized
CapitalGains
GrossUnrealized
CapitalLosses
EmbeddedDerivatives(2) Fair Value OTTI(3)
Fixed maturities:U.S. Treasuries . . . . . . . . . . . . . . . . . . . . . . . . . . . . . . . . . . . . $ 3,279.0 $ 625.9 $ 0.9 $ — $ 3,904.0 $ —U.S. Government agencies and authorities . . . . . . . . . . . . . . . 376.1 59.8 — — 435.9 —State, municipalities and political subdivisions . . . . . . . . . . . 659.5 35.4 0.5 — 694.4 —U.S. corporate public securities . . . . . . . . . . . . . . . . . . . . . . . . 31,415.6 3,067.8 139.7 — 34,343.7 10.2U.S. corporate private securities . . . . . . . . . . . . . . . . . . . . . . . 6,009.9 411.4 24.2 — 6,397.1 —Foreign corporate public securities and foreign
governments(1) . . . . . . . . . . . . . . . . . . . . . . . . . . . . . . . . . . . 7,975.0 515.3 101.1 — 8,389.2 —Foreign corporate private securities(1) . . . . . . . . . . . . . . . . . . . 7,556.6 515.3 16.9 — 8,055.0 —Residential mortgage-backed securities:
Agency . . . . . . . . . . . . . . . . . . . . . . . . . . . . . . . . . . . . . . . 4,983.3 421.0 13.0 72.5 5,463.8 0.4Non-Agency . . . . . . . . . . . . . . . . . . . . . . . . . . . . . . . . . . 989.4 168.9 8.6 43.3 1,193.0 62.1
Total Residential mortgage-backed securities . . . . . . . . . . . . . 5,972.7 589.9 21.6 115.8 6,656.8 62.5Commercial mortgage-backed securities . . . . . . . . . . . . . . . . 3,916.3 273.3 1.4 — 4,188.2 6.7Other asset-backed securities . . . . . . . . . . . . . . . . . . . . . . . . . 1,538.1 74.3 17.3 — 1,595.1 6.6
Total fixed maturities, including securities pledged . . . . . . . . 68,698.8 6,168.4 323.6 115.8 74,659.4 86.0Less: Securities pledged . . . . . . . . . . . . . . . . . . . . . . . . . . . . . 1,089.3 109.2 13.9 — 1,184.6 —
Total fixed maturities . . . . . . . . . . . . . . . . . . . . . . . . . . . . . . . . . . . 67,609.5 6,059.2 309.7 115.8 73,474.8 86.0Equity securities:
Common stock . . . . . . . . . . . . . . . . . . . . . . . . . . . . . . . . . . . . . 191.5 0.5 0.2 — 191.8 —Preferred stock . . . . . . . . . . . . . . . . . . . . . . . . . . . . . . . . . . . . . 50.5 29.5 — — 80.0 —
Total equity securities . . . . . . . . . . . . . . . . . . . . . . . . . . . . . . . . . . . 242.0 30.0 0.2 — 271.8 —
Total fixed maturities and equity securities investments . . . . . . . . $67,851.5 $6,089.2 $309.9 $115.8 $73,746.6 $86.0
(1) Primarily U.S. dollar denominated.(2) Embedded derivatives within fixed maturity securities are reported with the host investment. The changes in fair value of
embedded derivatives are reported in Other net realized capital gains (losses) in the Consolidated Statements of Operations.(3) Represents OTTI reported as a component of Other comprehensive income (loss).
229

Voya Financial, Inc.Notes to the Consolidated Financial Statements(Dollar amounts in millions, unless otherwise stated)
The amortized cost and fair value of fixed maturities, including securities pledged, as of December 31, 2015, are shown belowby contractual maturity. Actual maturities may differ from contractual maturities as securities may be restructured, called orprepaid. MBS and Other ABS are shown separately because they are not due at a single maturity date.
AmortizedCost
FairValue
Due to mature:One year or less . . . . . . . . . . . . . . . . . . . . . . . . . . . . . . . . . . . . . . . . $ 1,334.1 $ 1,353.2After one year through five years . . . . . . . . . . . . . . . . . . . . . . . . . . 13,423.6 13,843.2After five years through ten years . . . . . . . . . . . . . . . . . . . . . . . . . . 20,509.4 20,511.7After ten years . . . . . . . . . . . . . . . . . . . . . . . . . . . . . . . . . . . . . . . . . 24,220.3 25,269.0Mortgage-backed securities . . . . . . . . . . . . . . . . . . . . . . . . . . . . . . 9,269.8 9,953.1Other asset-backed securities . . . . . . . . . . . . . . . . . . . . . . . . . . . . . 1,097.8 1,142.4
Fixed maturities, including securities pledged . . . . . . . . . . . . . . . . . . . . $69,855.0 $72,072.6
The investment portfolio is monitored to maintain a diversified portfolio on an ongoing basis. Credit risk is mitigated bymonitoring concentrations by issuer, sector and geographic stratification and limiting exposure to any one issuer.
As of December 31, 2015 and 2014, the Company did not have any investments in a single issuer, other than obligations of theU.S. Government and government agencies, with a carrying value in excess of 10% of the Company’s consolidatedShareholders’ equity.
The following tables set forth the composition of the U.S. and foreign corporate securities within the fixed maturity portfolio byindustry category as of the dates indicated:
AmortizedCost
GrossUnrealized
CapitalGains
GrossUnrealized
CapitalLosses
FairValue
December 31, 2015Communications . . . . . . . . . . . . . . . . . . . . . . . . . . . . . . . . . . . . . . $ 3,956.0 $ 251.0 $ 73.0 $ 4,134.0Financial . . . . . . . . . . . . . . . . . . . . . . . . . . . . . . . . . . . . . . . . . . . . 7,937.8 473.0 53.2 8,357.6Industrial and other companies . . . . . . . . . . . . . . . . . . . . . . . . . . . 24,762.3 1,020.4 542.0 25,240.7Energy . . . . . . . . . . . . . . . . . . . . . . . . . . . . . . . . . . . . . . . . . . . . . . 7,871.5 127.9 668.1 7,331.3Utilities . . . . . . . . . . . . . . . . . . . . . . . . . . . . . . . . . . . . . . . . . . . . . 7,540.3 457.4 89.8 7,907.9Transportation . . . . . . . . . . . . . . . . . . . . . . . . . . . . . . . . . . . . . . . . 1,705.3 70.5 40.2 1,735.6
Total . . . . . . . . . . . . . . . . . . . . . . . . . . . . . . . . . . . . . . . . . . . . . . . . $53,773.2 $2,400.2 $1,466.3 $54,707.1
December 31, 2014Communications . . . . . . . . . . . . . . . . . . . . . . . . . . . . . . . . . . . . . . $ 3,934.5 $ 512.4 $ 5.7 $ 4,441.2Financial . . . . . . . . . . . . . . . . . . . . . . . . . . . . . . . . . . . . . . . . . . . . 7,568.1 729.3 7.6 8,289.8Industrial and other companies . . . . . . . . . . . . . . . . . . . . . . . . . . . 23,893.8 1,762.8 126.2 25,530.4Energy . . . . . . . . . . . . . . . . . . . . . . . . . . . . . . . . . . . . . . . . . . . . . . 8,222.2 549.7 112.5 8,659.4Utilities . . . . . . . . . . . . . . . . . . . . . . . . . . . . . . . . . . . . . . . . . . . . . 6,986.1 756.7 12.0 7,730.8Transportation . . . . . . . . . . . . . . . . . . . . . . . . . . . . . . . . . . . . . . . . 1,494.1 151.9 3.9 1,642.1
Total . . . . . . . . . . . . . . . . . . . . . . . . . . . . . . . . . . . . . . . . . . . . . . . . $52,098.8 $4,462.8 $ 267.9 $56,293.7
230
Voya Financial, Inc.Notes to the Consolidated Financial Statements(Dollar amounts in millions, unless otherwise stated)
Fixed Maturities and Equity Securities
The Company’s fixed maturities and equity securities are currently designated as available-for-sale, except those accounted forusing the FVO. Available-for-sale securities are reported at fair value and unrealized capital gains (losses) on these securities arerecorded directly in AOCI and presented net of related changes in DAC, VOBA and Deferred income taxes. In addition, certainfixed maturities have embedded derivatives, which are reported with the host contract on the Consolidated Balance Sheets.
The Company has elected the FVO for certain of its fixed maturities to better match the measurement of assets and liabilities inthe Consolidated Statements of Operations. Certain CMOs, primarily interest-only and principal-only strips, are accounted foras hybrid instruments and valued at fair value with changes in the fair value recorded in Other net realized capital gains (losses)in the Consolidated Statements of Operations.
The Company invests in various categories of CMOs, including CMOs that are not agency-backed, that are subject to differentdegrees of risk from changes in interest rates and defaults. The principal risks inherent in holding CMOs are prepayment andextension risks related to significant decreases and increases in interest rates resulting in the prepayment of principal from theunderlying mortgages, either earlier or later than originally anticipated. As of December 31, 2015 and 2014, approximately49.3% and 44.4% respectively, of the Company’s CMO holdings, were invested in the above mentioned types of CMOs such asinterest-only or principal-only strips, that are subject to more prepayment and extension risk than traditional CMOs.
Public corporate fixed maturity securities are distinguished from private corporate fixed maturity securities based upon themanner in which they are transacted. Public corporate fixed maturity securities are issued initially through market intermediarieson a registered basis or pursuant to Rule 144A under the Securities Act of 1933 (the “Securities Act”) and are traded on thesecondary market through brokers acting as principal. Private corporate fixed maturity securities are originally issued byborrowers directly to investors pursuant to Section 4(a)(2) of the Securities Act, and are traded in the secondary market directlywith counterparties, either without the participation of a broker or in agency transactions.
Repurchase Agreements
As of December 31, 2015 and 2014, the Company did not have any securities pledged in dollar rolls, repurchase agreementtransactions or reverse repurchase agreements.
Securities Lending
As of December 31, 2015 and 2014, the fair value of loaned securities was $466.4 and $545.9, respectively, and is included inSecurities pledged on the Consolidated Balance Sheets. As of December 31, 2015 and 2014, collateral retained by the lendingagent and invested in short-term liquid assets on the Company’s behalf was $484.4 and $563.9, respectively, and is recorded inShort-term investments under securities loan agreements, including collateral delivered on the Consolidated Balance Sheets. Asof December 31, 2015 and 2014, liabilities to return collateral of $484.4 and $563.9, respectively, is included in Payables undersecurities loan agreements, including collateral held on the Consolidated Balance Sheets.
231
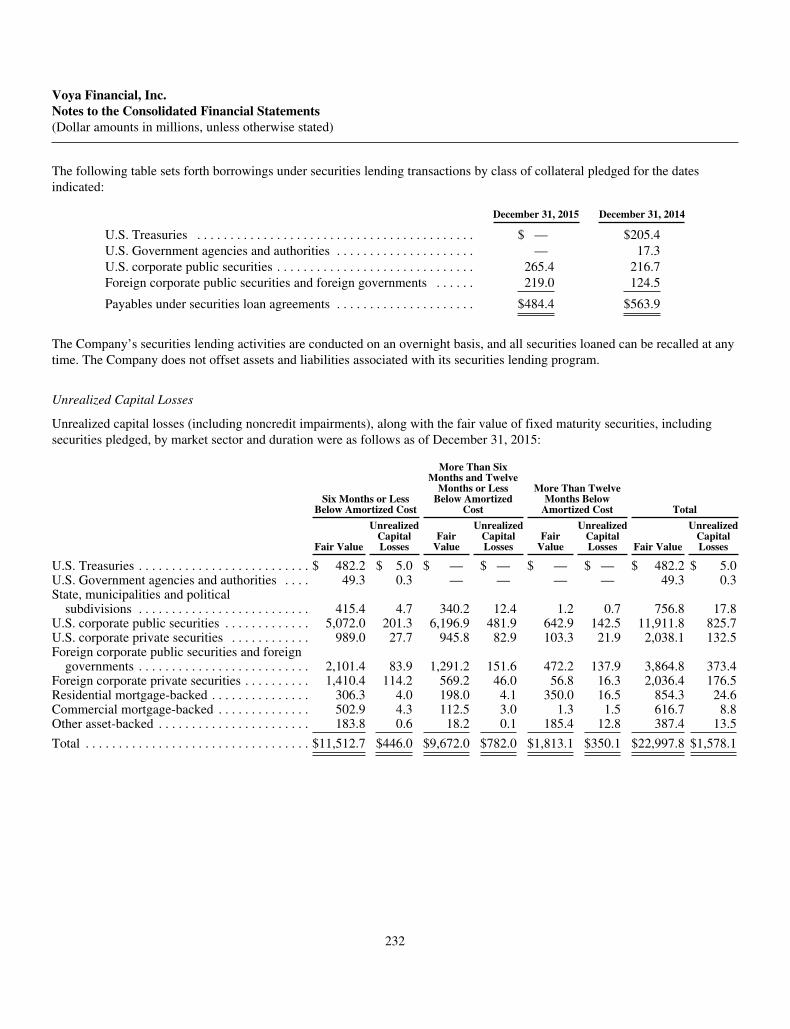
Voya Financial, Inc.Notes to the Consolidated Financial Statements(Dollar amounts in millions, unless otherwise stated)
The following table sets forth borrowings under securities lending transactions by class of collateral pledged for the datesindicated:
December 31, 2015 December 31, 2014
U.S. Treasuries . . . . . . . . . . . . . . . . . . . . . . . . . . . . . . . . . . . . . . . . . . $ — $205.4U.S. Government agencies and authorities . . . . . . . . . . . . . . . . . . . . . — 17.3U.S. corporate public securities . . . . . . . . . . . . . . . . . . . . . . . . . . . . . . 265.4 216.7Foreign corporate public securities and foreign governments . . . . . . 219.0 124.5
Payables under securities loan agreements . . . . . . . . . . . . . . . . . . . . . $484.4 $563.9
The Company’s securities lending activities are conducted on an overnight basis, and all securities loaned can be recalled at anytime. The Company does not offset assets and liabilities associated with its securities lending program.
Unrealized Capital Losses
Unrealized capital losses (including noncredit impairments), along with the fair value of fixed maturity securities, includingsecurities pledged, by market sector and duration were as follows as of December 31, 2015:
Six Months or LessBelow Amortized Cost
More Than SixMonths and Twelve
Months or LessBelow Amortized
Cost
More Than TwelveMonths Below
Amortized Cost Total
Fair Value
UnrealizedCapitalLosses
FairValue
UnrealizedCapitalLosses
FairValue
UnrealizedCapitalLosses Fair Value
UnrealizedCapitalLosses
U.S. Treasuries . . . . . . . . . . . . . . . . . . . . . . . . . . $ 482.2 $ 5.0 $ — $ — $ — $ — $ 482.2 $ 5.0U.S. Government agencies and authorities . . . . 49.3 0.3 — — — — 49.3 0.3State, municipalities and political
subdivisions . . . . . . . . . . . . . . . . . . . . . . . . . . 415.4 4.7 340.2 12.4 1.2 0.7 756.8 17.8U.S. corporate public securities . . . . . . . . . . . . . 5,072.0 201.3 6,196.9 481.9 642.9 142.5 11,911.8 825.7U.S. corporate private securities . . . . . . . . . . . . 989.0 27.7 945.8 82.9 103.3 21.9 2,038.1 132.5Foreign corporate public securities and foreign
governments . . . . . . . . . . . . . . . . . . . . . . . . . . 2,101.4 83.9 1,291.2 151.6 472.2 137.9 3,864.8 373.4Foreign corporate private securities . . . . . . . . . . 1,410.4 114.2 569.2 46.0 56.8 16.3 2,036.4 176.5Residential mortgage-backed . . . . . . . . . . . . . . . 306.3 4.0 198.0 4.1 350.0 16.5 854.3 24.6Commercial mortgage-backed . . . . . . . . . . . . . . 502.9 4.3 112.5 3.0 1.3 1.5 616.7 8.8Other asset-backed . . . . . . . . . . . . . . . . . . . . . . . 183.8 0.6 18.2 0.1 185.4 12.8 387.4 13.5
Total . . . . . . . . . . . . . . . . . . . . . . . . . . . . . . . . . . $11,512.7 $446.0 $9,672.0 $782.0 $1,813.1 $350.1 $22,997.8 $1,578.1
232
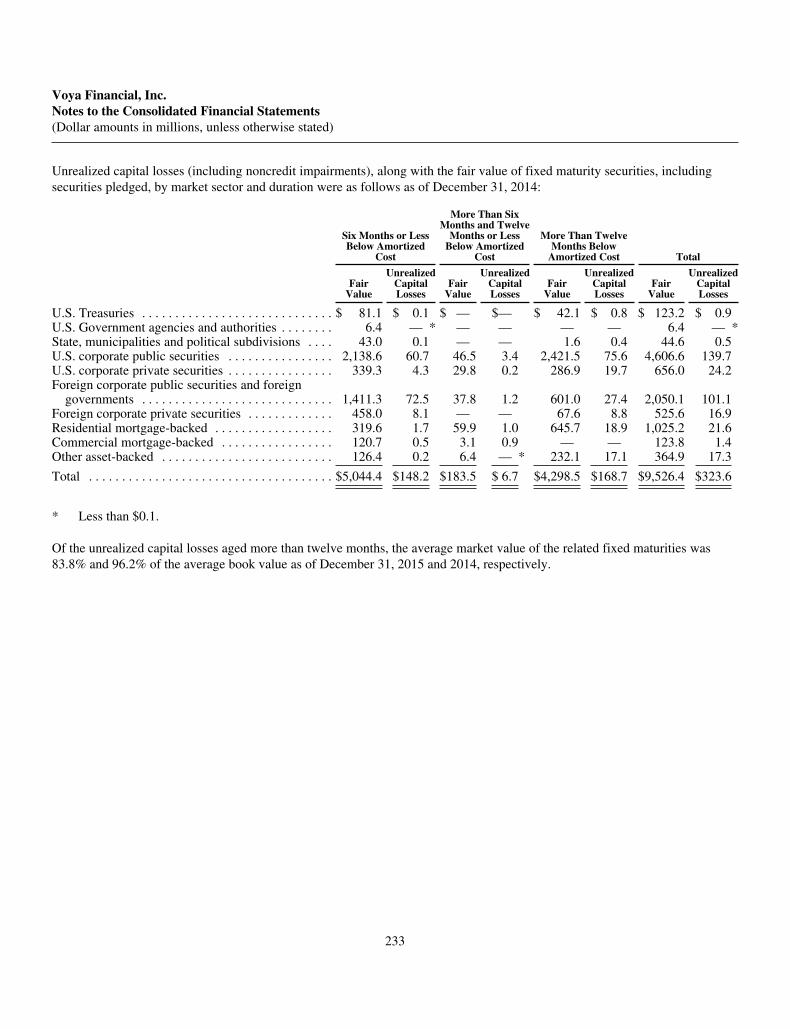
Voya Financial, Inc.Notes to the Consolidated Financial Statements(Dollar amounts in millions, unless otherwise stated)
Unrealized capital losses (including noncredit impairments), along with the fair value of fixed maturity securities, includingsecurities pledged, by market sector and duration were as follows as of December 31, 2014:
Six Months or LessBelow Amortized
Cost
More Than SixMonths and Twelve
Months or LessBelow Amortized
Cost
More Than TwelveMonths Below
Amortized Cost Total
FairValue
UnrealizedCapitalLosses
FairValue
UnrealizedCapitalLosses
FairValue
UnrealizedCapitalLosses
FairValue
UnrealizedCapitalLosses
U.S. Treasuries . . . . . . . . . . . . . . . . . . . . . . . . . . . . . $ 81.1 $ 0.1 $ — $— $ 42.1 $ 0.8 $ 123.2 $ 0.9U.S. Government agencies and authorities . . . . . . . . 6.4 — * — — — — 6.4 — *State, municipalities and political subdivisions . . . . 43.0 0.1 — — 1.6 0.4 44.6 0.5U.S. corporate public securities . . . . . . . . . . . . . . . . 2,138.6 60.7 46.5 3.4 2,421.5 75.6 4,606.6 139.7U.S. corporate private securities . . . . . . . . . . . . . . . . 339.3 4.3 29.8 0.2 286.9 19.7 656.0 24.2Foreign corporate public securities and foreign
governments . . . . . . . . . . . . . . . . . . . . . . . . . . . . . 1,411.3 72.5 37.8 1.2 601.0 27.4 2,050.1 101.1Foreign corporate private securities . . . . . . . . . . . . . 458.0 8.1 — — 67.6 8.8 525.6 16.9Residential mortgage-backed . . . . . . . . . . . . . . . . . . 319.6 1.7 59.9 1.0 645.7 18.9 1,025.2 21.6Commercial mortgage-backed . . . . . . . . . . . . . . . . . 120.7 0.5 3.1 0.9 — — 123.8 1.4Other asset-backed . . . . . . . . . . . . . . . . . . . . . . . . . . 126.4 0.2 6.4 — * 232.1 17.1 364.9 17.3
Total . . . . . . . . . . . . . . . . . . . . . . . . . . . . . . . . . . . . . $5,044.4 $148.2 $183.5 $ 6.7 $4,298.5 $168.7 $9,526.4 $323.6
* Less than $0.1.
Of the unrealized capital losses aged more than twelve months, the average market value of the related fixed maturities was83.8% and 96.2% of the average book value as of December 31, 2015 and 2014, respectively.
233

Voya Financial, Inc.Notes to the Consolidated Financial Statements(Dollar amounts in millions, unless otherwise stated)
Unrealized capital losses (including noncredit impairments) in fixed maturities, including securities pledged, for instances inwhich fair value declined below amortized cost by greater than or less than 20% for consecutive months as indicated in thetables below, were as follows as of the dates indicated:
Amortized Cost Unrealized Capital Losses Number of Securities
< 20% > 20% < 20% > 20% < 20% > 20%
December 31, 2015Six months or less below amortized cost . . . . . . . . . . . . . . . . . $11,792.1 $1,863.4 $ 394.6 $524.5 1,051 130More than six months and twelve months or less below
amortized cost . . . . . . . . . . . . . . . . . . . . . . . . . . . . . . . . . . . . 9,465.3 48.3 518.0 23.2 737 5More than twelve months below amortized cost . . . . . . . . . . . 1,351.5 55.3 102.5 15.3 322 8
Total . . . . . . . . . . . . . . . . . . . . . . . . . . . . . . . . . . . . . . . . . . . . . $22,608.9 $1,967.0 $1,015.1 $563.0 2,110 143
December 31, 2014Six months or less below amortized cost . . . . . . . . . . . . . . . . . $ 5,162.1 $ 117.8 $ 140.2 $ 26.5 537 16More than six months and twelve months or less below
amortized cost . . . . . . . . . . . . . . . . . . . . . . . . . . . . . . . . . . . . 324.3 — * 19.7 — * 68 1More than twelve months below amortized cost . . . . . . . . . . . 4,237.2 8.6 134.1 3.1 493 7
Total . . . . . . . . . . . . . . . . . . . . . . . . . . . . . . . . . . . . . . . . . . . . . $ 9,723.6 $ 126.4 $ 294.0 $ 29.6 1,098 24
* Less than $0.1.
234

Voya Financial, Inc.Notes to the Consolidated Financial Statements(Dollar amounts in millions, unless otherwise stated)
Unrealized capital losses (including noncredit impairments) in fixed maturities, including securities pledged, by market sectorfor instances in which fair value declined below amortized cost by greater than or less than 20% were as follows as of the datesindicated:
Amortized Cost Unrealized Capital Losses Number of Securities
< 20% > 20% < 20% > 20% < 20% > 20%
December 31, 2015U.S. Treasuries . . . . . . . . . . . . . . . . . . . . . . . . . . . . . . . . . . . . . . . $ 487.2 $ — $ 5.0 $ — 21 —U.S. Government agencies and authorities . . . . . . . . . . . . . . . . . . 49.6 — 0.3 — 1 —State, municipalities and political subdivisions . . . . . . . . . . . . . . 772.6 2.0 17.1 0.7 117 3U.S. corporate public securities . . . . . . . . . . . . . . . . . . . . . . . . . . 11,712.1 1,025.4 542.7 283.0 955 73U.S. corporate private securities . . . . . . . . . . . . . . . . . . . . . . . . . . 2,006.6 164.0 85.1 47.4 92 4Foreign corporate public securities and foreign governments . . . 3,570.1 668.1 173.9 199.5 331 48Foreign corporate private securities . . . . . . . . . . . . . . . . . . . . . . . 2,115.3 97.6 148.3 28.2 86 5Residential mortgage-backed . . . . . . . . . . . . . . . . . . . . . . . . . . . . 875.1 3.8 22.7 1.9 327 7Commercial mortgage-backed . . . . . . . . . . . . . . . . . . . . . . . . . . . 622.7 2.8 7.3 1.5 56 1Other asset-backed . . . . . . . . . . . . . . . . . . . . . . . . . . . . . . . . . . . . 397.6 3.3 12.7 0.8 124 2
Total . . . . . . . . . . . . . . . . . . . . . . . . . . . . . . . . . . . . . . . . . . . . . . . $22,608.9 $1,967.0 $1,015.1 $563.0 2,110 143
December 31, 2014U.S. Treasuries . . . . . . . . . . . . . . . . . . . . . . . . . . . . . . . . . . . . . . . $ 124.1 $ — $ 0.9 $ — 8 —U.S. Government agencies and authorities . . . . . . . . . . . . . . . . . . 6.4 — — * — 1 —State, municipalities and political subdivisions . . . . . . . . . . . . . . 44.1 1.0 0.2 0.3 9 1U.S. corporate public securities . . . . . . . . . . . . . . . . . . . . . . . . . . 4,737.5 8.8 137.6 2.1 383 3U.S. corporate private securities . . . . . . . . . . . . . . . . . . . . . . . . . . 635.2 45.0 13.7 10.5 31 1Foreign corporate public securities and foreign governments . . . 2,115.0 36.2 93.1 8.0 219 5Foreign corporate private securities . . . . . . . . . . . . . . . . . . . . . . . 521.5 21.0 12.6 4.3 20 1Residential mortgage-backed . . . . . . . . . . . . . . . . . . . . . . . . . . . . 1,042.8 4.0 19.5 2.1 321 8Commercial mortgage-backed . . . . . . . . . . . . . . . . . . . . . . . . . . . 121.2 4.0 0.5 0.9 17 1Other asset-backed . . . . . . . . . . . . . . . . . . . . . . . . . . . . . . . . . . . . 375.8 6.4 15.9 1.4 89 4
Total . . . . . . . . . . . . . . . . . . . . . . . . . . . . . . . . . . . . . . . . . . . . . . . $ 9,723.6 $ 126.4 $ 294.0 $ 29.6 1,098 24
* Less than $0.1.
235
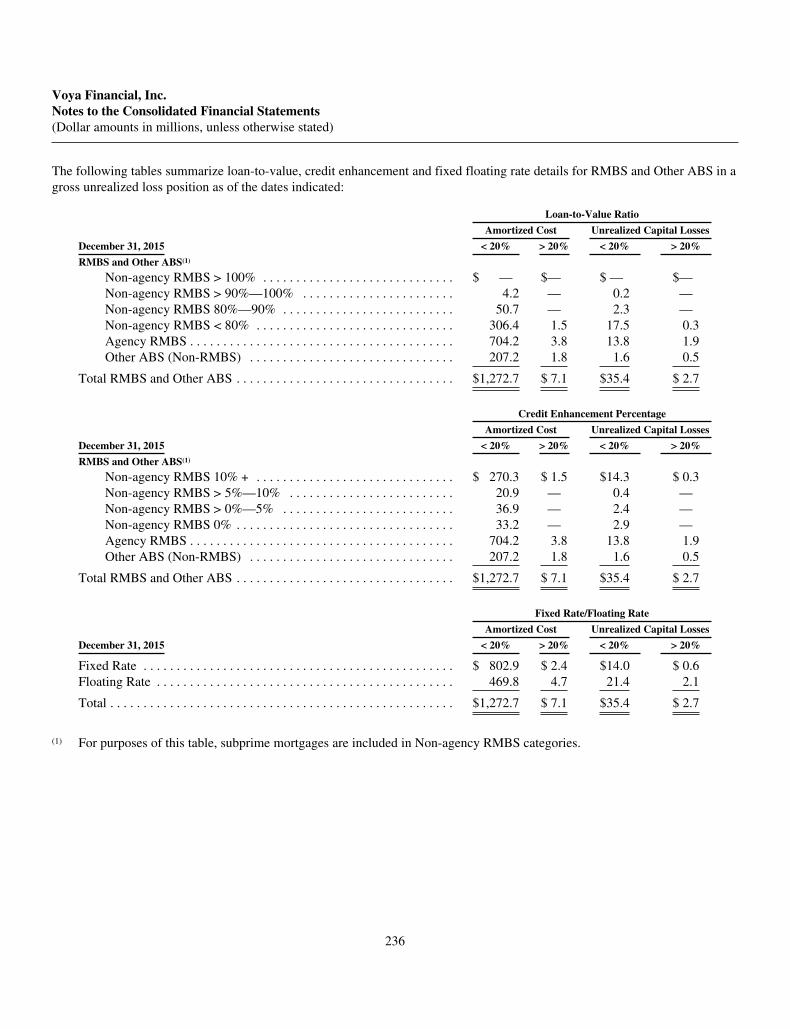
Voya Financial, Inc.Notes to the Consolidated Financial Statements(Dollar amounts in millions, unless otherwise stated)
The following tables summarize loan-to-value, credit enhancement and fixed floating rate details for RMBS and Other ABS in agross unrealized loss position as of the dates indicated:
Loan-to-Value Ratio
Amortized Cost Unrealized Capital Losses
December 31, 2015 < 20% > 20% < 20% > 20%
RMBS and Other ABS(1)
Non-agency RMBS > 100% . . . . . . . . . . . . . . . . . . . . . . . . . . . . . $ — $— $ — $—Non-agency RMBS > 90%—100% . . . . . . . . . . . . . . . . . . . . . . . 4.2 — 0.2 —Non-agency RMBS 80%—90% . . . . . . . . . . . . . . . . . . . . . . . . . . 50.7 — 2.3 —Non-agency RMBS < 80% . . . . . . . . . . . . . . . . . . . . . . . . . . . . . . 306.4 1.5 17.5 0.3Agency RMBS . . . . . . . . . . . . . . . . . . . . . . . . . . . . . . . . . . . . . . . . 704.2 3.8 13.8 1.9Other ABS (Non-RMBS) . . . . . . . . . . . . . . . . . . . . . . . . . . . . . . . 207.2 1.8 1.6 0.5
Total RMBS and Other ABS . . . . . . . . . . . . . . . . . . . . . . . . . . . . . . . . . $1,272.7 $ 7.1 $35.4 $ 2.7
Credit Enhancement Percentage
Amortized Cost Unrealized Capital Losses
December 31, 2015 < 20% > 20% < 20% > 20%
RMBS and Other ABS(1)
Non-agency RMBS 10% + . . . . . . . . . . . . . . . . . . . . . . . . . . . . . . $ 270.3 $ 1.5 $14.3 $ 0.3Non-agency RMBS > 5%—10% . . . . . . . . . . . . . . . . . . . . . . . . . 20.9 — 0.4 —Non-agency RMBS > 0%—5% . . . . . . . . . . . . . . . . . . . . . . . . . . 36.9 — 2.4 —Non-agency RMBS 0% . . . . . . . . . . . . . . . . . . . . . . . . . . . . . . . . . 33.2 — 2.9 —Agency RMBS . . . . . . . . . . . . . . . . . . . . . . . . . . . . . . . . . . . . . . . . 704.2 3.8 13.8 1.9Other ABS (Non-RMBS) . . . . . . . . . . . . . . . . . . . . . . . . . . . . . . . 207.2 1.8 1.6 0.5
Total RMBS and Other ABS . . . . . . . . . . . . . . . . . . . . . . . . . . . . . . . . . $1,272.7 $ 7.1 $35.4 $ 2.7
Fixed Rate/Floating Rate
Amortized Cost Unrealized Capital Losses
December 31, 2015 < 20% > 20% < 20% > 20%
Fixed Rate . . . . . . . . . . . . . . . . . . . . . . . . . . . . . . . . . . . . . . . . . . . . . . . $ 802.9 $ 2.4 $14.0 $ 0.6Floating Rate . . . . . . . . . . . . . . . . . . . . . . . . . . . . . . . . . . . . . . . . . . . . . 469.8 4.7 21.4 2.1
Total . . . . . . . . . . . . . . . . . . . . . . . . . . . . . . . . . . . . . . . . . . . . . . . . . . . . $1,272.7 $ 7.1 $35.4 $ 2.7
(1) For purposes of this table, subprime mortgages are included in Non-agency RMBS categories.
236
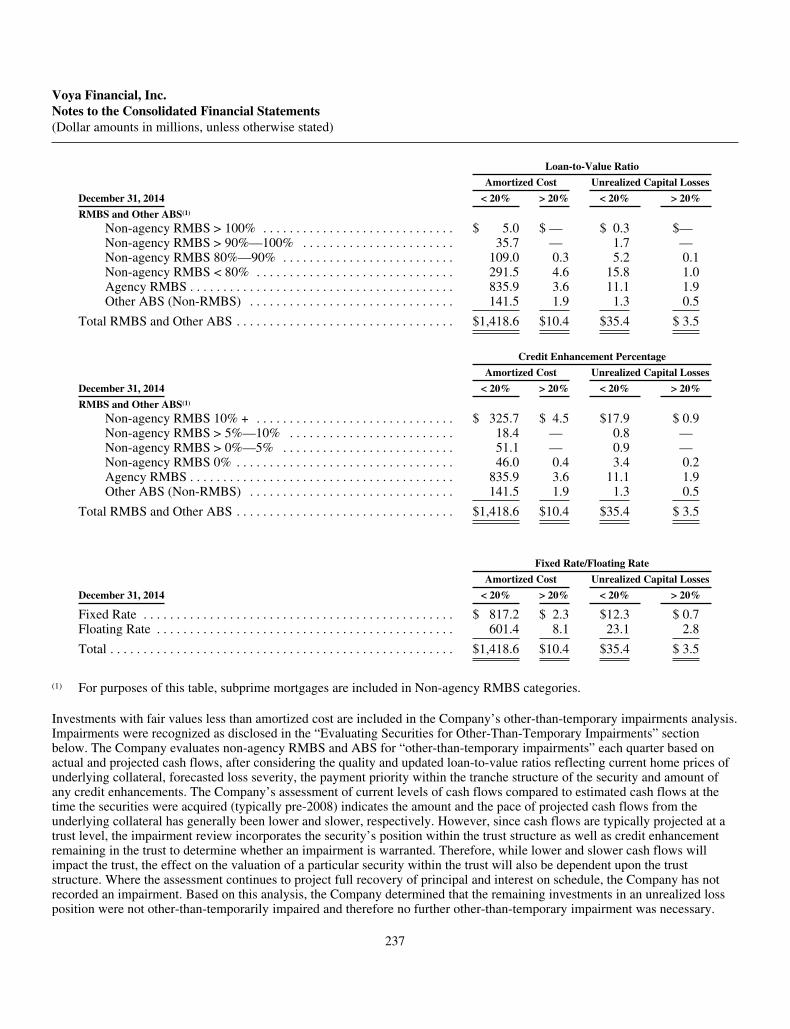
Voya Financial, Inc.Notes to the Consolidated Financial Statements(Dollar amounts in millions, unless otherwise stated)
Loan-to-Value Ratio
Amortized Cost Unrealized Capital Losses
December 31, 2014 < 20% > 20% < 20% > 20%
RMBS and Other ABS(1)
Non-agency RMBS > 100% . . . . . . . . . . . . . . . . . . . . . . . . . . . . . $ 5.0 $ — $ 0.3 $—Non-agency RMBS > 90%—100% . . . . . . . . . . . . . . . . . . . . . . . 35.7 — 1.7 —Non-agency RMBS 80%—90% . . . . . . . . . . . . . . . . . . . . . . . . . . 109.0 0.3 5.2 0.1Non-agency RMBS < 80% . . . . . . . . . . . . . . . . . . . . . . . . . . . . . . 291.5 4.6 15.8 1.0Agency RMBS . . . . . . . . . . . . . . . . . . . . . . . . . . . . . . . . . . . . . . . . 835.9 3.6 11.1 1.9Other ABS (Non-RMBS) . . . . . . . . . . . . . . . . . . . . . . . . . . . . . . . 141.5 1.9 1.3 0.5
Total RMBS and Other ABS . . . . . . . . . . . . . . . . . . . . . . . . . . . . . . . . . $1,418.6 $10.4 $35.4 $ 3.5
Credit Enhancement Percentage
Amortized Cost Unrealized Capital Losses
December 31, 2014 < 20% > 20% < 20% > 20%
RMBS and Other ABS(1)
Non-agency RMBS 10% + . . . . . . . . . . . . . . . . . . . . . . . . . . . . . . $ 325.7 $ 4.5 $17.9 $ 0.9Non-agency RMBS > 5%—10% . . . . . . . . . . . . . . . . . . . . . . . . . 18.4 — 0.8 —Non-agency RMBS > 0%—5% . . . . . . . . . . . . . . . . . . . . . . . . . . 51.1 — 0.9 —Non-agency RMBS 0% . . . . . . . . . . . . . . . . . . . . . . . . . . . . . . . . . 46.0 0.4 3.4 0.2Agency RMBS . . . . . . . . . . . . . . . . . . . . . . . . . . . . . . . . . . . . . . . . 835.9 3.6 11.1 1.9Other ABS (Non-RMBS) . . . . . . . . . . . . . . . . . . . . . . . . . . . . . . . 141.5 1.9 1.3 0.5
Total RMBS and Other ABS . . . . . . . . . . . . . . . . . . . . . . . . . . . . . . . . . $1,418.6 $10.4 $35.4 $ 3.5
Fixed Rate/Floating Rate
Amortized Cost Unrealized Capital Losses
December 31, 2014 < 20% > 20% < 20% > 20%
Fixed Rate . . . . . . . . . . . . . . . . . . . . . . . . . . . . . . . . . . . . . . . . . . . . . . . $ 817.2 $ 2.3 $12.3 $ 0.7Floating Rate . . . . . . . . . . . . . . . . . . . . . . . . . . . . . . . . . . . . . . . . . . . . . 601.4 8.1 23.1 2.8
Total . . . . . . . . . . . . . . . . . . . . . . . . . . . . . . . . . . . . . . . . . . . . . . . . . . . . $1,418.6 $10.4 $35.4 $ 3.5
(1) For purposes of this table, subprime mortgages are included in Non-agency RMBS categories.
Investments with fair values less than amortized cost are included in the Company’s other-than-temporary impairments analysis.Impairments were recognized as disclosed in the “Evaluating Securities for Other-Than-Temporary Impairments” sectionbelow. The Company evaluates non-agency RMBS and ABS for “other-than-temporary impairments” each quarter based onactual and projected cash flows, after considering the quality and updated loan-to-value ratios reflecting current home prices ofunderlying collateral, forecasted loss severity, the payment priority within the tranche structure of the security and amount ofany credit enhancements. The Company’s assessment of current levels of cash flows compared to estimated cash flows at thetime the securities were acquired (typically pre-2008) indicates the amount and the pace of projected cash flows from theunderlying collateral has generally been lower and slower, respectively. However, since cash flows are typically projected at atrust level, the impairment review incorporates the security’s position within the trust structure as well as credit enhancementremaining in the trust to determine whether an impairment is warranted. Therefore, while lower and slower cash flows willimpact the trust, the effect on the valuation of a particular security within the trust will also be dependent upon the truststructure. Where the assessment continues to project full recovery of principal and interest on schedule, the Company has notrecorded an impairment. Based on this analysis, the Company determined that the remaining investments in an unrealized lossposition were not other-than-temporarily impaired and therefore no further other-than-temporary impairment was necessary.
237
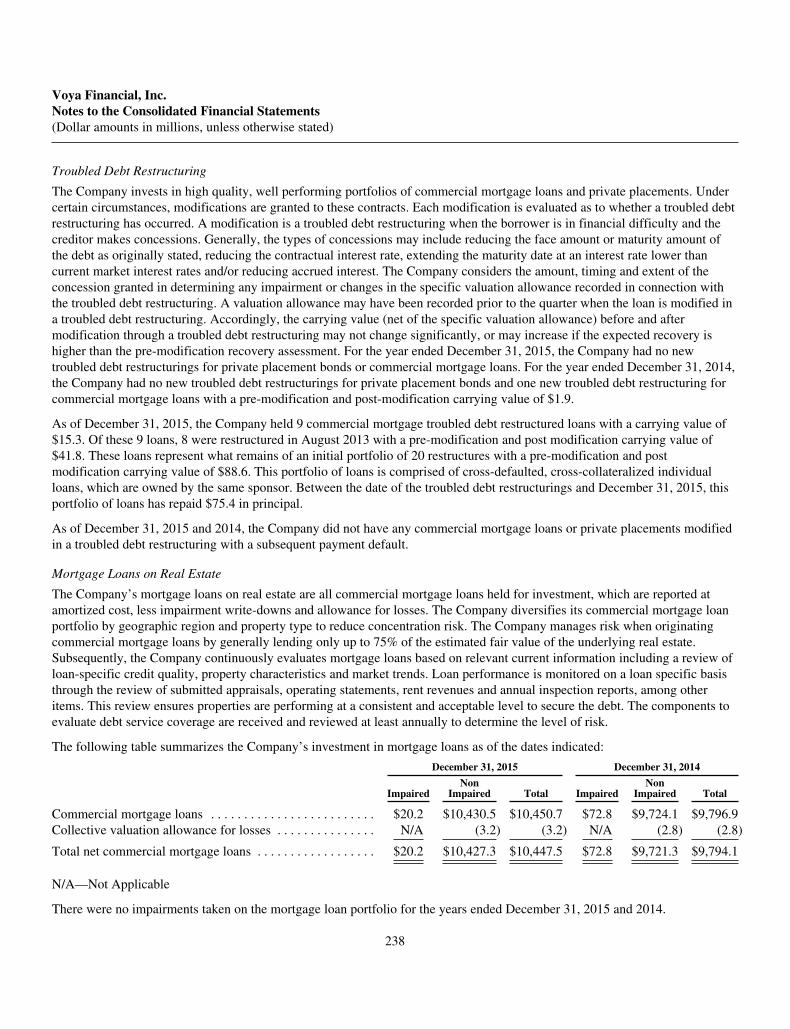
Voya Financial, Inc.Notes to the Consolidated Financial Statements(Dollar amounts in millions, unless otherwise stated)
Troubled Debt Restructuring
The Company invests in high quality, well performing portfolios of commercial mortgage loans and private placements. Undercertain circumstances, modifications are granted to these contracts. Each modification is evaluated as to whether a troubled debtrestructuring has occurred. A modification is a troubled debt restructuring when the borrower is in financial difficulty and thecreditor makes concessions. Generally, the types of concessions may include reducing the face amount or maturity amount ofthe debt as originally stated, reducing the contractual interest rate, extending the maturity date at an interest rate lower thancurrent market interest rates and/or reducing accrued interest. The Company considers the amount, timing and extent of theconcession granted in determining any impairment or changes in the specific valuation allowance recorded in connection withthe troubled debt restructuring. A valuation allowance may have been recorded prior to the quarter when the loan is modified ina troubled debt restructuring. Accordingly, the carrying value (net of the specific valuation allowance) before and aftermodification through a troubled debt restructuring may not change significantly, or may increase if the expected recovery ishigher than the pre-modification recovery assessment. For the year ended December 31, 2015, the Company had no newtroubled debt restructurings for private placement bonds or commercial mortgage loans. For the year ended December 31, 2014,the Company had no new troubled debt restructurings for private placement bonds and one new troubled debt restructuring forcommercial mortgage loans with a pre-modification and post-modification carrying value of $1.9.
As of December 31, 2015, the Company held 9 commercial mortgage troubled debt restructured loans with a carrying value of$15.3. Of these 9 loans, 8 were restructured in August 2013 with a pre-modification and post modification carrying value of$41.8. These loans represent what remains of an initial portfolio of 20 restructures with a pre-modification and postmodification carrying value of $88.6. This portfolio of loans is comprised of cross-defaulted, cross-collateralized individualloans, which are owned by the same sponsor. Between the date of the troubled debt restructurings and December 31, 2015, thisportfolio of loans has repaid $75.4 in principal.
As of December 31, 2015 and 2014, the Company did not have any commercial mortgage loans or private placements modifiedin a troubled debt restructuring with a subsequent payment default.
Mortgage Loans on Real Estate
The Company’s mortgage loans on real estate are all commercial mortgage loans held for investment, which are reported atamortized cost, less impairment write-downs and allowance for losses. The Company diversifies its commercial mortgage loanportfolio by geographic region and property type to reduce concentration risk. The Company manages risk when originatingcommercial mortgage loans by generally lending only up to 75% of the estimated fair value of the underlying real estate.Subsequently, the Company continuously evaluates mortgage loans based on relevant current information including a review ofloan-specific credit quality, property characteristics and market trends. Loan performance is monitored on a loan specific basisthrough the review of submitted appraisals, operating statements, rent revenues and annual inspection reports, among otheritems. This review ensures properties are performing at a consistent and acceptable level to secure the debt. The components toevaluate debt service coverage are received and reviewed at least annually to determine the level of risk.
The following table summarizes the Company’s investment in mortgage loans as of the dates indicated:
December 31, 2015 December 31, 2014
ImpairedNon
Impaired Total ImpairedNon
Impaired Total
Commercial mortgage loans . . . . . . . . . . . . . . . . . . . . . . . . . $20.2 $10,430.5 $10,450.7 $72.8 $9,724.1 $9,796.9Collective valuation allowance for losses . . . . . . . . . . . . . . . N/A (3.2) (3.2) N/A (2.8) (2.8)
Total net commercial mortgage loans . . . . . . . . . . . . . . . . . . $20.2 $10,427.3 $10,447.5 $72.8 $9,721.3 $9,794.1
N/A—Not Applicable
There were no impairments taken on the mortgage loan portfolio for the years ended December 31, 2015 and 2014.
238

Voya Financial, Inc.Notes to the Consolidated Financial Statements(Dollar amounts in millions, unless otherwise stated)
The following table summarizes the activity in the allowance for losses for commercial mortgage loans for the periodsindicated:
December 31, 2015 December 31, 2014
Collective valuation allowance for losses, balance at January 1 . . . . . . . . . . . . . . . $2.8 $ 3.8Addition to (reduction of) allowance for losses . . . . . . . . . . . . . . . . . . . . . . . . . . . . 0.4 (1.0)
Collective valuation allowance for losses, end of period . . . . . . . . . . . . . . . . . . . . . $3.2 $ 2.8
The carrying values and unpaid principal balances of impaired mortgage loans were as follows as of the dates indicated:
December 31, 2015 December 31, 2014
Impaired loans without allowances for losses . . . . . . . . . . . . . . . . . . . $20.2 $72.8Less: Allowances for losses on impaired loans . . . . . . . . . . . . . . . . . . — —
Impaired loans, net . . . . . . . . . . . . . . . . . . . . . . . . . . . . . . . . . . . . . . . $20.2 $72.8
Unpaid principal balance of impaired loans . . . . . . . . . . . . . . . . . . . . $21.7 $75.3
The following table presents information on restructured loans as of the dates indicated:
December 31, 2015 December 31, 2014
Troubled debt restructured loans . . . . . . . . . . . . . . . . . . . . . $15.3 $65.5
There were no mortgage loans in the Company’s portfolio in process of foreclosure as of December 31, 2015 and 2014.
There were two loans 30 days or less in arrears, with respect to principal and interest as of December 31, 2015, with a totalamortized cost of $3.1. There were no loans in arrears, with respect to principal and interest as of December 31, 2014.
The following table presents information on the average investment during the period in impaired loans and interest incomerecognized on impaired and troubled debt restructured loans for the periods indicated:
Year Ended December 31,
2015 2014 2013
Impaired loans, average investment during the period (amortized cost)(1) . . . . . . . . . . . . . . . . . . . . . . . . . $46.5 $83.6 $55.6Interest income recognized on impaired loans, on an accrual basis(1) . . . . . . . . . . . . . . . . . . . . . . . . . . . . . 2.4 4.8 2.9Interest income recognized on impaired loans, on a cash basis(1) . . . . . . . . . . . . . . . . . . . . . . . . . . . . . . . . 2.6 4.5 2.9Interest income recognized on troubled debt restructured loans, on an accrual basis . . . . . . . . . . . . . . . . . 1.9 4.2 2.4
(1) Includes amounts for Troubled debt restructured loans.
Loan-to-value (“LTV”) and debt service coverage (“DSC”) ratios are measures commonly used to assess the risk and quality ofmortgage loans. The LTV ratio, calculated at time of origination, is expressed as a percentage of the amount of the loan relative tothe value of the underlying property. A LTV ratio in excess of 100% indicates the unpaid loan amount exceeds the underlyingcollateral. The DSC ratio, based upon the most recently received financial statements, is expressed as a percentage of the amount ofa property’s net income to its debt service payments. A DSC ratio of less than 1.0 indicates that property’s operations do notgenerate sufficient income to cover debt payments. These ratios are utilized as part of the review process described above.
239

Voya Financial, Inc.Notes to the Consolidated Financial Statements(Dollar amounts in millions, unless otherwise stated)
The following table presents the LTV ratios as of the dates indicated:
December 31, 2015(1) December 31, 2014(1)
Loan-to-Value Ratio:0%—50% . . . . . . . . . . . . . . . . . . . . . . . . . . . . . . . . $ 1,388.0 $1,460.6>50%—60% . . . . . . . . . . . . . . . . . . . . . . . . . . . . . . 2,694.1 2,261.6>60%—70% . . . . . . . . . . . . . . . . . . . . . . . . . . . . . . 5,670.2 5,514.8>70%—80% . . . . . . . . . . . . . . . . . . . . . . . . . . . . . . 679.6 541.3>80% and above . . . . . . . . . . . . . . . . . . . . . . . . . . . 18.8 18.6
Total Commercial mortgage loans . . . . . . . . . . . . . . . . . $10,450.7 $9,796.9
(1) Balances do not include collective valuation allowance for losses.
The following table presents the DSC ratios as of the dates indicated:
December 31, 2015(1) December 31, 2014(1)
Debt Service Coverage Ratio:Greater than 1.5x . . . . . . . . . . . . . . . . . . . . . . . . . . . . . . . . . . . . . . . . . . . . . . . . . . . . . . $ 8,112.1 $7,096.2>1.25x—1.5x . . . . . . . . . . . . . . . . . . . . . . . . . . . . . . . . . . . . . . . . . . . . . . . . . . . . . . . . . 1,489.5 1,392.1>1.0x—1.25x . . . . . . . . . . . . . . . . . . . . . . . . . . . . . . . . . . . . . . . . . . . . . . . . . . . . . . . . . 550.3 906.7Less than 1.0x . . . . . . . . . . . . . . . . . . . . . . . . . . . . . . . . . . . . . . . . . . . . . . . . . . . . . . . . . 158.6 385.9Commercial mortgage loans secured by land or construction loans . . . . . . . . . . . . . . . 140.2 16.0
Total Commercial mortgage loans . . . . . . . . . . . . . . . . . . . . . . . . . . . . . . . . . . . . . . . . . . . . . $10,450.7 $9,796.9
(1) Balances do not include collective valuation allowance for losses.
Properties collateralizing mortgage loans are geographically dispersed throughout the United States, as well as diversified byproperty type, as reflected in the following tables as of the dates indicated:
December 31, 2015(1) December 31, 2014(1)
Gross CarryingValue
% ofTotal
Gross CarryingValue
% ofTotal
Commercial Mortgage Loans by U.S. Region:Pacific . . . . . . . . . . . . . . . . . . . . . . . . . . . . . . . . . . . . . . . . . . . $ 2,605.3 24.9% $2,395.9 24.6%South Atlantic . . . . . . . . . . . . . . . . . . . . . . . . . . . . . . . . . . . . . 2,318.9 22.2% 2,028.0 20.7%Middle Atlantic . . . . . . . . . . . . . . . . . . . . . . . . . . . . . . . . . . . . 1,499.1 14.3% 1,402.0 14.3%West South Central . . . . . . . . . . . . . . . . . . . . . . . . . . . . . . . . . 1,103.7 10.6% 1,147.7 11.7%Mountain . . . . . . . . . . . . . . . . . . . . . . . . . . . . . . . . . . . . . . . . . 924.2 8.8% 832.2 8.5%East North Central . . . . . . . . . . . . . . . . . . . . . . . . . . . . . . . . . 1,103.3 10.6% 1,030.8 10.5%New England . . . . . . . . . . . . . . . . . . . . . . . . . . . . . . . . . . . . . 222.8 2.1% 197.0 2.0%West North Central . . . . . . . . . . . . . . . . . . . . . . . . . . . . . . . . . 488.8 4.7% 514.0 5.2%East South Central . . . . . . . . . . . . . . . . . . . . . . . . . . . . . . . . . 184.6 1.8% 249.3 2.5%
Total Commercial mortgage loans . . . . . . . . . . . . . . . . . . . . . . . . . $10,450.7 100.0% $9,796.9 100.0%
(1) Balances do not include collective valuation allowance for losses.
240
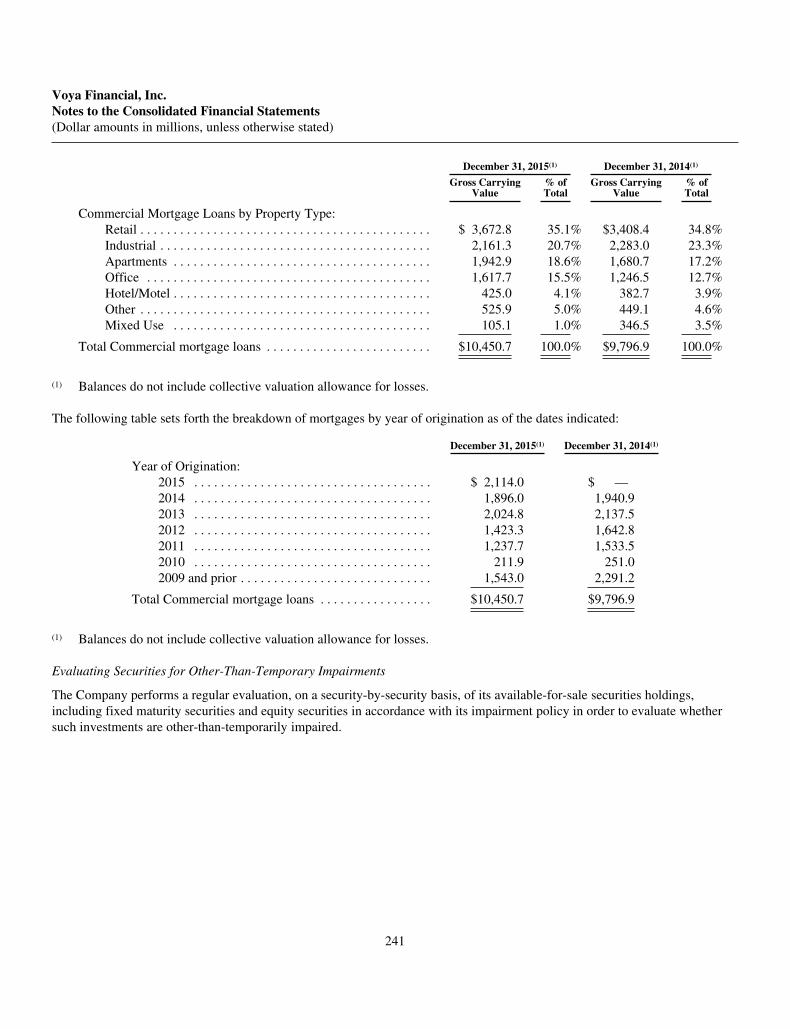
Voya Financial, Inc.Notes to the Consolidated Financial Statements(Dollar amounts in millions, unless otherwise stated)
December 31, 2015(1) December 31, 2014(1)
Gross CarryingValue
% ofTotal
Gross CarryingValue
% ofTotal
Commercial Mortgage Loans by Property Type:Retail . . . . . . . . . . . . . . . . . . . . . . . . . . . . . . . . . . . . . . . . . . . . $ 3,672.8 35.1% $3,408.4 34.8%Industrial . . . . . . . . . . . . . . . . . . . . . . . . . . . . . . . . . . . . . . . . . 2,161.3 20.7% 2,283.0 23.3%Apartments . . . . . . . . . . . . . . . . . . . . . . . . . . . . . . . . . . . . . . . 1,942.9 18.6% 1,680.7 17.2%Office . . . . . . . . . . . . . . . . . . . . . . . . . . . . . . . . . . . . . . . . . . . 1,617.7 15.5% 1,246.5 12.7%Hotel/Motel . . . . . . . . . . . . . . . . . . . . . . . . . . . . . . . . . . . . . . . 425.0 4.1% 382.7 3.9%Other . . . . . . . . . . . . . . . . . . . . . . . . . . . . . . . . . . . . . . . . . . . . 525.9 5.0% 449.1 4.6%Mixed Use . . . . . . . . . . . . . . . . . . . . . . . . . . . . . . . . . . . . . . . 105.1 1.0% 346.5 3.5%
Total Commercial mortgage loans . . . . . . . . . . . . . . . . . . . . . . . . . $10,450.7 100.0% $9,796.9 100.0%
(1) Balances do not include collective valuation allowance for losses.
The following table sets forth the breakdown of mortgages by year of origination as of the dates indicated:
December 31, 2015(1) December 31, 2014(1)
Year of Origination:2015 . . . . . . . . . . . . . . . . . . . . . . . . . . . . . . . . . . . . $ 2,114.0 $ —2014 . . . . . . . . . . . . . . . . . . . . . . . . . . . . . . . . . . . . 1,896.0 1,940.92013 . . . . . . . . . . . . . . . . . . . . . . . . . . . . . . . . . . . . 2,024.8 2,137.52012 . . . . . . . . . . . . . . . . . . . . . . . . . . . . . . . . . . . . 1,423.3 1,642.82011 . . . . . . . . . . . . . . . . . . . . . . . . . . . . . . . . . . . . 1,237.7 1,533.52010 . . . . . . . . . . . . . . . . . . . . . . . . . . . . . . . . . . . . 211.9 251.02009 and prior . . . . . . . . . . . . . . . . . . . . . . . . . . . . . 1,543.0 2,291.2
Total Commercial mortgage loans . . . . . . . . . . . . . . . . . $10,450.7 $9,796.9
(1) Balances do not include collective valuation allowance for losses.
Evaluating Securities for Other-Than-Temporary Impairments
The Company performs a regular evaluation, on a security-by-security basis, of its available-for-sale securities holdings,including fixed maturity securities and equity securities in accordance with its impairment policy in order to evaluate whethersuch investments are other-than-temporarily impaired.
241
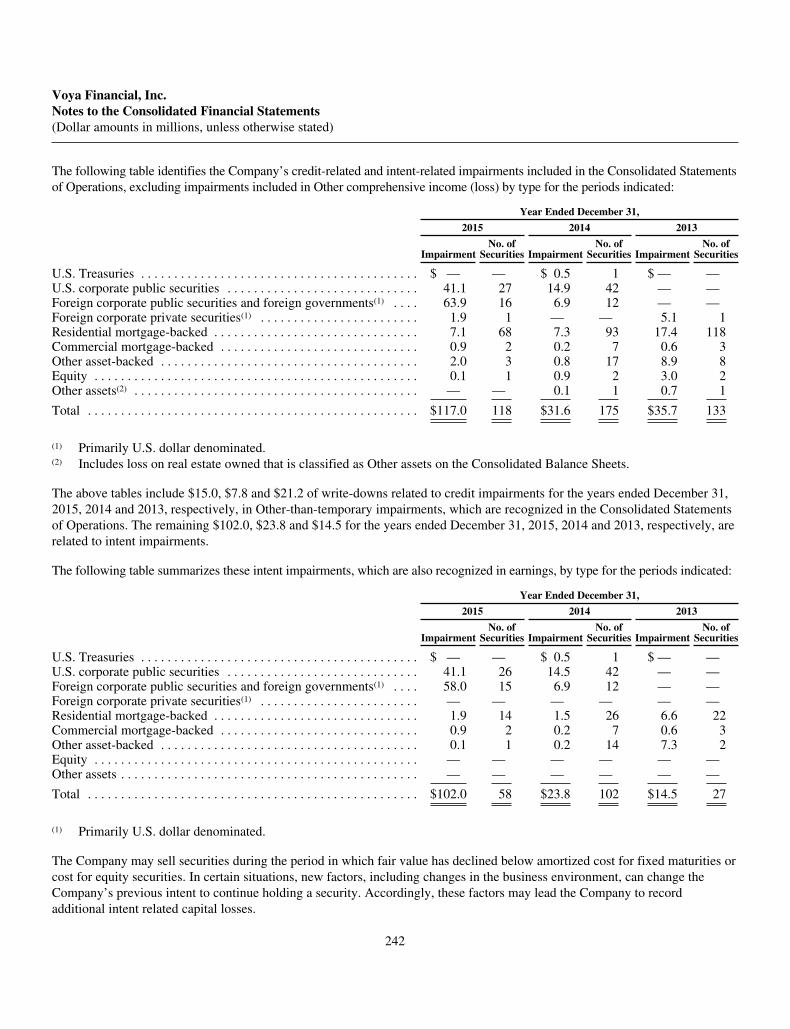
Voya Financial, Inc.Notes to the Consolidated Financial Statements(Dollar amounts in millions, unless otherwise stated)
The following table identifies the Company’s credit-related and intent-related impairments included in the Consolidated Statementsof Operations, excluding impairments included in Other comprehensive income (loss) by type for the periods indicated:
Year Ended December 31,
2015 2014 2013
ImpairmentNo. of
Securities ImpairmentNo. of
Securities ImpairmentNo. of
Securities
U.S. Treasuries . . . . . . . . . . . . . . . . . . . . . . . . . . . . . . . . . . . . . . . . . . $ — — $ 0.5 1 $ — —U.S. corporate public securities . . . . . . . . . . . . . . . . . . . . . . . . . . . . . 41.1 27 14.9 42 — —Foreign corporate public securities and foreign governments(1) . . . . 63.9 16 6.9 12 — —Foreign corporate private securities(1) . . . . . . . . . . . . . . . . . . . . . . . . 1.9 1 — — 5.1 1Residential mortgage-backed . . . . . . . . . . . . . . . . . . . . . . . . . . . . . . . 7.1 68 7.3 93 17.4 118Commercial mortgage-backed . . . . . . . . . . . . . . . . . . . . . . . . . . . . . . 0.9 2 0.2 7 0.6 3Other asset-backed . . . . . . . . . . . . . . . . . . . . . . . . . . . . . . . . . . . . . . . 2.0 3 0.8 17 8.9 8Equity . . . . . . . . . . . . . . . . . . . . . . . . . . . . . . . . . . . . . . . . . . . . . . . . . 0.1 1 0.9 2 3.0 2Other assets(2) . . . . . . . . . . . . . . . . . . . . . . . . . . . . . . . . . . . . . . . . . . . — — 0.1 1 0.7 1
Total . . . . . . . . . . . . . . . . . . . . . . . . . . . . . . . . . . . . . . . . . . . . . . . . . . $117.0 118 $31.6 175 $35.7 133
(1) Primarily U.S. dollar denominated.(2) Includes loss on real estate owned that is classified as Other assets on the Consolidated Balance Sheets.
The above tables include $15.0, $7.8 and $21.2 of write-downs related to credit impairments for the years ended December 31,2015, 2014 and 2013, respectively, in Other-than-temporary impairments, which are recognized in the Consolidated Statementsof Operations. The remaining $102.0, $23.8 and $14.5 for the years ended December 31, 2015, 2014 and 2013, respectively, arerelated to intent impairments.
The following table summarizes these intent impairments, which are also recognized in earnings, by type for the periods indicated:
Year Ended December 31,
2015 2014 2013
ImpairmentNo. of
Securities ImpairmentNo. of
Securities ImpairmentNo. of
Securities
U.S. Treasuries . . . . . . . . . . . . . . . . . . . . . . . . . . . . . . . . . . . . . . . . . . $ — — $ 0.5 1 $ — —U.S. corporate public securities . . . . . . . . . . . . . . . . . . . . . . . . . . . . . 41.1 26 14.5 42 — —Foreign corporate public securities and foreign governments(1) . . . . 58.0 15 6.9 12 — —Foreign corporate private securities(1) . . . . . . . . . . . . . . . . . . . . . . . . — — — — — —Residential mortgage-backed . . . . . . . . . . . . . . . . . . . . . . . . . . . . . . . 1.9 14 1.5 26 6.6 22Commercial mortgage-backed . . . . . . . . . . . . . . . . . . . . . . . . . . . . . . 0.9 2 0.2 7 0.6 3Other asset-backed . . . . . . . . . . . . . . . . . . . . . . . . . . . . . . . . . . . . . . . 0.1 1 0.2 14 7.3 2Equity . . . . . . . . . . . . . . . . . . . . . . . . . . . . . . . . . . . . . . . . . . . . . . . . . — — — — — —Other assets . . . . . . . . . . . . . . . . . . . . . . . . . . . . . . . . . . . . . . . . . . . . . — — — — — —
Total . . . . . . . . . . . . . . . . . . . . . . . . . . . . . . . . . . . . . . . . . . . . . . . . . . $102.0 58 $23.8 102 $14.5 27
(1) Primarily U.S. dollar denominated.
The Company may sell securities during the period in which fair value has declined below amortized cost for fixed maturities orcost for equity securities. In certain situations, new factors, including changes in the business environment, can change theCompany’s previous intent to continue holding a security. Accordingly, these factors may lead the Company to recordadditional intent related capital losses.
242
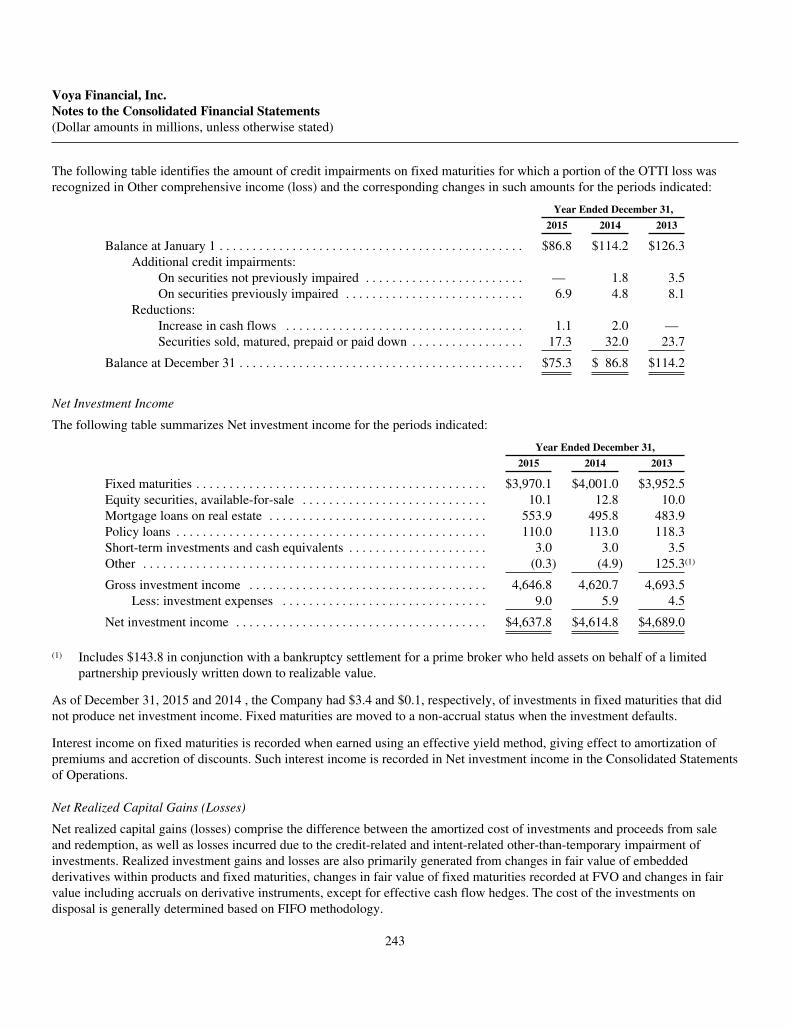
Voya Financial, Inc.Notes to the Consolidated Financial Statements(Dollar amounts in millions, unless otherwise stated)
The following table identifies the amount of credit impairments on fixed maturities for which a portion of the OTTI loss wasrecognized in Other comprehensive income (loss) and the corresponding changes in such amounts for the periods indicated:
Year Ended December 31,
2015 2014 2013
Balance at January 1 . . . . . . . . . . . . . . . . . . . . . . . . . . . . . . . . . . . . . . . . . . . . . . $86.8 $114.2 $126.3Additional credit impairments:
On securities not previously impaired . . . . . . . . . . . . . . . . . . . . . . . . — 1.8 3.5On securities previously impaired . . . . . . . . . . . . . . . . . . . . . . . . . . . 6.9 4.8 8.1
Reductions:Increase in cash flows . . . . . . . . . . . . . . . . . . . . . . . . . . . . . . . . . . . . 1.1 2.0 —Securities sold, matured, prepaid or paid down . . . . . . . . . . . . . . . . . 17.3 32.0 23.7
Balance at December 31 . . . . . . . . . . . . . . . . . . . . . . . . . . . . . . . . . . . . . . . . . . . $75.3 $ 86.8 $114.2
Net Investment Income
The following table summarizes Net investment income for the periods indicated:
Year Ended December 31,
2015 2014 2013
Fixed maturities . . . . . . . . . . . . . . . . . . . . . . . . . . . . . . . . . . . . . . . . . . . . $3,970.1 $4,001.0 $3,952.5Equity securities, available-for-sale . . . . . . . . . . . . . . . . . . . . . . . . . . . . 10.1 12.8 10.0Mortgage loans on real estate . . . . . . . . . . . . . . . . . . . . . . . . . . . . . . . . . 553.9 495.8 483.9Policy loans . . . . . . . . . . . . . . . . . . . . . . . . . . . . . . . . . . . . . . . . . . . . . . . 110.0 113.0 118.3Short-term investments and cash equivalents . . . . . . . . . . . . . . . . . . . . . 3.0 3.0 3.5Other . . . . . . . . . . . . . . . . . . . . . . . . . . . . . . . . . . . . . . . . . . . . . . . . . . . . (0.3) (4.9) 125.3(1)
Gross investment income . . . . . . . . . . . . . . . . . . . . . . . . . . . . . . . . . . . . 4,646.8 4,620.7 4,693.5Less: investment expenses . . . . . . . . . . . . . . . . . . . . . . . . . . . . . . . 9.0 5.9 4.5
Net investment income . . . . . . . . . . . . . . . . . . . . . . . . . . . . . . . . . . . . . . $4,637.8 $4,614.8 $4,689.0
(1) Includes $143.8 in conjunction with a bankruptcy settlement for a prime broker who held assets on behalf of a limitedpartnership previously written down to realizable value.
As of December 31, 2015 and 2014 , the Company had $3.4 and $0.1, respectively, of investments in fixed maturities that didnot produce net investment income. Fixed maturities are moved to a non-accrual status when the investment defaults.
Interest income on fixed maturities is recorded when earned using an effective yield method, giving effect to amortization ofpremiums and accretion of discounts. Such interest income is recorded in Net investment income in the Consolidated Statementsof Operations.
Net Realized Capital Gains (Losses)
Net realized capital gains (losses) comprise the difference between the amortized cost of investments and proceeds from saleand redemption, as well as losses incurred due to the credit-related and intent-related other-than-temporary impairment ofinvestments. Realized investment gains and losses are also primarily generated from changes in fair value of embeddedderivatives within products and fixed maturities, changes in fair value of fixed maturities recorded at FVO and changes in fairvalue including accruals on derivative instruments, except for effective cash flow hedges. The cost of the investments ondisposal is generally determined based on FIFO methodology.
243

Voya Financial, Inc.Notes to the Consolidated Financial Statements(Dollar amounts in millions, unless otherwise stated)
Net realized capital gains (losses) were as follows for the periods indicated:
Year Ended December 31,
2015 2014 2013
Fixed maturities, available-for-sale, including securities pledged . . . . . . . . . . . . . . $(122.2) $ 63.6 $ 85.0Fixed maturities, at fair value option . . . . . . . . . . . . . . . . . . . . . . . . . . . . . . . . . . . . (434.4) (177.3) (449.4)Equity securities, available-for-sale . . . . . . . . . . . . . . . . . . . . . . . . . . . . . . . . . . . . . 0.1 17.9 (2.8)Derivatives . . . . . . . . . . . . . . . . . . . . . . . . . . . . . . . . . . . . . . . . . . . . . . . . . . . . . . . . (150.6) 12.7 (3,152.9)Embedded derivatives—fixed maturities . . . . . . . . . . . . . . . . . . . . . . . . . . . . . . . . . (20.9) (10.6) (107.5)Guaranteed benefit derivatives . . . . . . . . . . . . . . . . . . . . . . . . . . . . . . . . . . . . . . . . . (7.2) (804.4) 1,092.7Other investments . . . . . . . . . . . . . . . . . . . . . . . . . . . . . . . . . . . . . . . . . . . . . . . . . . . 1.9 19.7 (1.9)
Net realized capital gains (losses) . . . . . . . . . . . . . . . . . . . . . . . . . . . . . . . . . . . . . . . $(733.3) $(878.4) $(2,536.8)
After-tax net realized capital gains (losses) . . . . . . . . . . . . . . . . . . . . . . . . . . . . . . . $(482.4) $(517.5) $(1,694.5)
Proceeds from the sale of fixed maturities and equity securities, available-for-sale and the related gross realized gains andlosses, before tax, were as follows for the periods indicated:
Year Ended December 31,
2015 2014 2013
Proceeds on sales . . . . . . . . . . . . . . . . . . . . . . . . . . . . . . . . . . $6,778.2 $8,580.8 $10,559.8Gross gains . . . . . . . . . . . . . . . . . . . . . . . . . . . . . . . . . . . . . . 101.5 188.6 185.2Gross losses . . . . . . . . . . . . . . . . . . . . . . . . . . . . . . . . . . . . . . 122.9 96.6 77.7
3. Derivative Financial Instruments
The Company enters into the following types of derivatives:
Interest rate caps: The Company uses interest rate cap contracts to hedge the interest rate exposure arising from durationmismatches between assets and liabilities. Interest rate caps are also used to hedge interest rate exposure if rates rise above aspecified level. Such increases in rates will require the Company to incur additional expenses. The future payout from theinterest rate caps fund this increased exposure. The Company pays an upfront premium to purchase these caps. The Companyutilizes these contracts in non-qualifying hedging relationships.
Interest rate swaps: Interest rate swaps are used by the Company primarily to reduce market risks from changes in interest ratesand to alter interest rate exposure arising from mismatches between assets and/or liabilities. Interest rate swaps are also used tohedge the interest rate risk associated with the value of assets it owns or in an anticipation of acquiring them. Using interest rateswaps, the Company agrees with another party to exchange, at specified intervals, the difference between fixed rate and floatingrate interest payments, calculated by reference to an agreed upon notional principal amount. These transactions are entered intopursuant to master agreements that provide for a single net payment to be made to/from the counterparty at each due date. TheCompany utilizes these contracts in qualifying hedging relationships as well as non-qualifying hedging relationships.
Foreign exchange swaps: The Company uses foreign exchange or currency swaps to reduce the risk of change in the value, yield orcash flows associated with certain foreign denominated invested assets. Foreign exchange swaps represent contracts that require theexchange of foreign currency cash flows against U.S. dollar cash flows at regular periods, typically quarterly or semi-annually. TheCompany utilizes these contracts in qualifying hedging relationships as well as non-qualifying hedging relationships.
Credit default swaps: Credit default swaps are used to reduce credit loss exposure with respect to certain assets that the Companyowns, or to assume credit exposure on certain assets that the Company does not own. Payments are made to, or received from, thecounterparty at specified intervals. In the event of a default on the underlying credit exposure, the Company will either receive apayment (purchased credit protection) or will be required to make a payment (sold credit protection) equal to the par minusrecovery value of the swap contract. The Company utilizes these contracts in non-qualifying hedging relationships.
244
Voya Financial, Inc.Notes to the Consolidated Financial Statements(Dollar amounts in millions, unless otherwise stated)
Total return swaps: The Company uses total return swaps as a hedge against a decrease in variable annuity account values, whichare invested in certain indices. Using total return swaps, the Company agrees with another party to exchange, at specified intervals,the difference between the economic risk and reward of assets or a market index and the LIBOR rate, calculated by reference to anagreed upon notional principal amount. No cash is exchanged at the onset of the contracts. Cash is paid and received over the life ofthe contract based upon the terms of the swaps. The Company utilizes these contracts in non-qualifying hedging relationships.
Currency forwards: The Company uses currency forward contracts to hedge policyholder liabilities associated with the variableannuity contracts which are linked to foreign indices. The currency fluctuations may result in a decrease in account values,which would increase the possibility of the Company incurring an expense for guaranteed benefits in excess of account values.The Company also utilizes currency forward contracts to hedge currency exposure related to its invested assets. The Companyutilizes these contracts in non-qualifying hedging relationships.
Forwards: The Company uses forward contracts to hedge certain invested assets against movement in interest rates, particularlymortgage rates. The Company uses To Be Announced mortgage-backed securities as an economic hedge against ratemovements. The Company utilizes forward contracts in non-qualifying hedging relationships.
Futures: Futures contracts are used to hedge against a decrease in certain equity indices. Such decreases may result in adecrease in variable annuity account values which would increase the possibility of the Company incurring an expense forguaranteed benefits in excess of account values. The Company also uses futures contracts as a hedge against an increase incertain equity indices. Such increases may result in increased payments to the holders of the FIA contracts. The Company alsouses interest rate futures contracts to hedge its exposure to market risks due to changes in interest rates. The Company entersinto exchange traded futures with regulated futures commissions that are members of the exchange. The Company also postsinitial and variation margins, with the exchange, on a daily basis. The Company utilizes exchange-traded futures in non-qualifying hedging relationships.
Swaptions: A swaption is an option to enter into a swap with a forward starting effective date. The Company uses swaptions tohedge the interest rate exposure associated with the minimum crediting rate and book value guarantees embedded in theretirement products that the Company offers. Increases in interest rates will generate losses on assets that are backing suchliabilities. In certain instances, the Company locks in the economic impact of existing purchased swaptions by entering intooffsetting written swaptions. Swaptions are also used to hedge against an increase in the interest rate benchmarked creditingstrategies within FIA contracts. Such increases may result in increased payments to contract holders of FIA contracts and theinterest rate swaptions offset this increased exposure. The Company pays a premium when it purchases the swaption. TheCompany utilizes these contracts in non-qualifying hedging relationships.
Options: The Company uses put options to manage the equity, interest rate and equity volatility risk of the economic liabilitiesassociated with certain variable annuity minimum guaranteed benefits and/or to mitigate certain rebalancing costs resulting fromincreased volatility. The Company also uses call options to hedge against an increase in various equity indices. Such increasesmay result in increased payments to the holders of the FIA and IUL contracts. The Company pays an upfront premium topurchase these options. The Company utilizes these options in non-qualifying hedging relationships.
Variance swaps: The Company uses variance swaps to manage equity volatility risk on the economic liabilities associated withcertain minimum guaranteed living benefits and/or to mitigate certain rebalancing costs resulting from increased volatility. Anincrease in the equity volatility results in higher valuations of such liabilities. In an equity variance swap, the Company agreeswith another party to exchange amounts in the future, based on the changes in equity volatility over a defined period. TheCompany utilizes equity variance swaps in non-qualifying hedging relationships.
Managed custody guarantees: The Company issues certain credited rate guarantees on variable fixed income portfolios thatrepresent stand-alone derivatives. The market value is partially determined by, among other things, levels of or changes ininterest rates, prepayment rates and credit ratings/spreads.
Embedded derivatives: The Company also invests in certain fixed maturity instruments and has issued certain products that containembedded derivatives whose market value is at least partially determined by, among other things, levels of or changes in domesticand/or foreign interest rates (short-term or long-term), exchange rates, prepayment rates, equity rates or credit ratings/spreads. Inaddition, the Company has entered into coinsurance with funds withheld arrangements, which contain embedded derivatives.
245
Voya Financial, Inc.Notes to the Consolidated Financial Statements(Dollar amounts in millions, unless otherwise stated)
The Company’s use of derivatives is limited mainly to economic hedging to reduce the Company’s exposure to cash flowvariability of assets and liabilities, interest rate risk, credit risk, exchange rate risk and market risk. It is the Company’s policynot to offset amounts recognized for derivative instruments and amounts recognized for the right to reclaim cash collateral orthe obligation to return cash collateral arising from derivative instruments executed with the same counterparty under a masternetting arrangement, which provides the Company with the legal right of offset.
The notional amounts and fair values of derivatives were as follows as of the dates indicated:
December 31, 2015 December 31, 2014
NotionalAmount
AssetFair
Value
LiabilityFair
ValueNotionalAmount
AssetFair
Value
LiabilityFair
Value
Derivatives: Qualifying for hedge accounting(1)
Cash flow hedges:Interest rate contracts . . . . . . . . . . . . . . . . . . . . . . . . . . . . . . $ 524.0 $ 73.3 $ — $ 736.0 $ 114.6 $ —Foreign exchange contracts . . . . . . . . . . . . . . . . . . . . . . . . . 174.7 36.4 — 174.7 25.3 —
Fair value hedges:Interest rate contracts . . . . . . . . . . . . . . . . . . . . . . . . . . . . . . 551.4 0.8 9.8 566.4 2.4 13.4
Derivatives: Non-qualifying for hedge accounting(1)
Interest rate contracts . . . . . . . . . . . . . . . . . . . . . . . . . . . . . . . . . . 65,169.4 1,055.0 352.2 66,474.0 1,108.0 563.2Foreign exchange contracts . . . . . . . . . . . . . . . . . . . . . . . . . . . . . 1,281.9 60.5 37.0 1,373.1 45.3 26.8Equity contracts . . . . . . . . . . . . . . . . . . . . . . . . . . . . . . . . . . . . . . 19,738.4 286.2 65.8 21,165.7 483.1 209.9Credit contracts . . . . . . . . . . . . . . . . . . . . . . . . . . . . . . . . . . . . . . 4,266.3 26.3 22.7 4,221.0 40.9 36.0
Embedded derivatives and Managed custody guarantees:Within fixed maturity investments . . . . . . . . . . . . . . . . . . . . . . . . N/A 94.9 — N/A 115.8 —Within products . . . . . . . . . . . . . . . . . . . . . . . . . . . . . . . . . . . . . . N/A — 3,907.2 N/A — 3,600.6Within reinsurance agreements . . . . . . . . . . . . . . . . . . . . . . . . . . N/A — 25.2 N/A — 139.6Managed custody guarantees . . . . . . . . . . . . . . . . . . . . . . . . . . . . N/A — 0.3 N/A — —
Total . . . . . . . . . . . . . . . . . . . . . . . . . . . . . . . . . . . . . . . . . . . . . . . . . . . $1,633.4 $4,420.2 $1,935.4 $4,589.5
(1) Open derivative contracts are reported as Derivatives assets or liabilities on the Consolidated Balance Sheets at fair value.
N/A—Not Applicable
The maximum length of time over which the Company is hedging its exposure to the variability in future cash flows forforecasted anticipatory hedge transactions is through the first quarter of 2017.
Based on the notional amounts, a substantial portion of the Company’s derivative positions was not designated or did notqualify for hedge accounting as part of a hedging relationship as of December 31, 2015 and 2014. The Company utilizesderivative contracts mainly to hedge exposure to variability in cash flows, interest rate risk, credit risk, foreign exchange riskand equity market risk. The majority of derivatives used by the Company are designated as product hedges, which hedge theexposure arising from insurance liabilities or guarantees embedded in the contracts the Company offers through various productlines. These derivatives do not qualify for hedge accounting as they do not meet the criteria of being “highly effective” asoutlined in ASC Topic 815, but do provide an economic hedge, which is in line with the Company’s risk managementobjectives. The Company also uses derivatives contracts to hedge its exposure to various risks associated with the investmentportfolio. The Company does not seek hedge accounting treatment for certain of these derivatives as they generally do notqualify for hedge accounting due to the criteria required under the portfolio hedging rules outlined in ASC Topic 815. TheCompany also uses credit default swaps coupled with other investments in order to produce the investment characteristics ofotherwise permissible investments that do not qualify as effective accounting hedges under ASC Topic 815.
246
Voya Financial, Inc.Notes to the Consolidated Financial Statements(Dollar amounts in millions, unless otherwise stated)
Although the Company has not elected to net its derivative exposures, the notional amounts and fair values of Over-The-Counter (“OTC”) and cleared derivatives excluding exchange traded contracts and forward contracts (To Be Announcedmortgage-backed securities) are presented in the tables below as of the dates indicated:
December 31, 2015
Notional Amount Asset Fair Value Liability Fair Value
Credit contracts . . . . . . . . . . . . . . . . . . . . . . . . . . . . $ 4,266.3 $ 26.3 $ 22.7Equity contracts . . . . . . . . . . . . . . . . . . . . . . . . . . . . 12,034.9 228.6 53.9Foreign exchange contracts . . . . . . . . . . . . . . . . . . . 1,456.6 96.9 37.0Interest rate contracts . . . . . . . . . . . . . . . . . . . . . . . . 57,145.6 1,129.1 360.1
1,480.9 473.7
Counterparty netting(1) . . . . . . . . . . . . . . . . . . . . . . . (415.6) (415.6)Cash collateral netting(1) . . . . . . . . . . . . . . . . . . . . . (848.1) (12.6)Securities collateral netting(1) . . . . . . . . . . . . . . . . . (24.3) (24.4)
Net receivables/payables . . . . . . . . . . . . . . . . . . . . . $ 192.9 $ 21.1
(1) Represents the netting of receivable balances with payable balances, net of collateral, for the same counterparty undereligible netting agreements.
December 31, 2014
Notional Amount Asset Fair Value Liability Fair Value
Credit contracts . . . . . . . . . . . . . . . . . . . . . . . . . . . . $ 4,221.0 $ 40.9 $ 36.0Equity contracts . . . . . . . . . . . . . . . . . . . . . . . . . . . . 13,576.1 378.4 201.7Foreign exchange contracts . . . . . . . . . . . . . . . . . . . 1,547.8 70.6 26.8Interest rate contracts . . . . . . . . . . . . . . . . . . . . . . . . 67,776.4 1,225.0 576.6
1,714.9 841.1
Counterparty netting(1) . . . . . . . . . . . . . . . . . . . . . . . (721.3) (721.3)Cash collateral netting(1) . . . . . . . . . . . . . . . . . . . . . (661.1) (35.9)Securities collateral netting(1) . . . . . . . . . . . . . . . . . (158.9) (46.9)
Net receivables/payables . . . . . . . . . . . . . . . . . . . . . $ 173.6 $ 37.0
(1) Represents the netting of receivable balances with payable balances, net of collateral, for the same counterparty undereligible netting agreements.
Collateral
Under the terms of the OTC Derivative International Swaps and Derivatives Association, Inc. (“ISDA”) agreements, the Companymay receive from, or deliver to, counterparties collateral to assure that terms of the ISDA agreements will be met with regard to theCredit Support Annex (“CSA”). The terms of the CSA call for the Company to pay interest on any cash received equal to the FederalFunds rate. To the extent cash collateral is received and delivered, it is included in Payables under securities loan agreements,including collateral held and Short-term investments under securities loan agreements, including collateral delivered, respectively, onthe Consolidated Balance Sheets and is reinvested in short-term investments. Collateral held is used in accordance with the CSA tosatisfy any obligations. Investment grade bonds owned by the Company are the source of noncash collateral posted, which isreported in Securities pledged on the Consolidated Balance Sheets. As of December 31, 2015, the Company held $640.9 and $195.9of net cash collateral related to OTC derivative contracts and cleared derivative contracts, respectively. As of December 31, 2014,the Company held $515.8 and $119.1 of net cash collateral related to OTC derivative contracts and cleared derivative contracts,respectively. In addition, as of December 31, 2015, the Company delivered $646.2 of securities and held $24.8 securities ascollateral. As of December 31, 2014, the Company delivered $638.7 securities and held $159.3 of securities as collateral.
247
Voya Financial, Inc.Notes to the Consolidated Financial Statements(Dollar amounts in millions, unless otherwise stated)
Net realized gains (losses) on derivatives were as follows for the periods indicated:
Year Ended December 31,
2015 2014 2013
Derivatives: Qualifying for hedge accounting(1)
Cash flow hedges:Interest rate contracts . . . . . . . . . . . . . . . . . . . . . . . . . . . . . . . . . . . . . . . . . . . . . . . . . . . $ 1.6 $ 0.7 $ 0.4Foreign exchange contracts . . . . . . . . . . . . . . . . . . . . . . . . . . . . . . . . . . . . . . . . . . . . . . . 2.3 2.0 0.4
Fair value hedges:Interest rate contracts . . . . . . . . . . . . . . . . . . . . . . . . . . . . . . . . . . . . . . . . . . . . . . . . . . . (6.1) (17.2) 21.1
Derivatives: Non-qualifying for hedge accounting(2)
Interest rate contracts . . . . . . . . . . . . . . . . . . . . . . . . . . . . . . . . . . . . . . . . . . . . . . . . . . . . . . . 80.5 821.1 (1,058.5)Foreign exchange contracts . . . . . . . . . . . . . . . . . . . . . . . . . . . . . . . . . . . . . . . . . . . . . . . . . . . 62.0 106.0 75.7Equity contracts . . . . . . . . . . . . . . . . . . . . . . . . . . . . . . . . . . . . . . . . . . . . . . . . . . . . . . . . . . . . (294.9) (909.7) (2,217.2)Credit contracts . . . . . . . . . . . . . . . . . . . . . . . . . . . . . . . . . . . . . . . . . . . . . . . . . . . . . . . . . . . . 4.0 9.8 25.2
Embedded derivatives and Managed custody guarantees:Within fixed maturity investments(2) . . . . . . . . . . . . . . . . . . . . . . . . . . . . . . . . . . . . . . . . . . . . (20.9) (10.6) (107.5)Within products(2) . . . . . . . . . . . . . . . . . . . . . . . . . . . . . . . . . . . . . . . . . . . . . . . . . . . . . . . . . . (7.1) (804.5) 1,092.5Within reinsurance agreements(3) . . . . . . . . . . . . . . . . . . . . . . . . . . . . . . . . . . . . . . . . . . . . . . 125.1 (77.6) 90.4Managed custody guarantees(2) . . . . . . . . . . . . . . . . . . . . . . . . . . . . . . . . . . . . . . . . . . . . . . . . (0.1) 0.1 0.2
Total . . . . . . . . . . . . . . . . . . . . . . . . . . . . . . . . . . . . . . . . . . . . . . . . . . . . . . . . . . . . . . . . . . . . . . . . $ (53.6) $(879.9) $(2,077.3)
(1) Changes in value for effective fair value hedges are recorded in Other net realized capital gains (losses). Changes in fairvalue upon disposal for effective cash flow hedges are amortized through Net investment income and the ineffectiveportion is recorded in Other net realized capital gains (losses) in the Consolidated Statements of Operations. For the yearsended December 31, 2015, 2014 and 2013, ineffective amounts were immaterial.
(2) Changes in value are included in Other net realized capital gains (losses) in the Consolidated Statements of Operations.(3) Changes in value are included in Policyholder benefits in the Consolidated Statements of Operations.
Credit Default Swaps
The Company has entered into various credit default swaps. When credit default swaps are sold, the Company assumes creditexposure to certain assets that it does not own. Credit default swaps may also be purchased to reduce credit exposure in theCompany’s portfolio. Credit default swaps involve a transfer of credit risk from one party to another in exchange for periodicpayments. As of December 31, 2015, the fair values of credit default swaps of $26.3 and $22.7 were included in Derivativesassets and Derivatives liabilities, respectively, on the Consolidated Balance Sheets. As of December 31, 2014, the fair values ofcredit default swaps of $40.9 and $36.0 were included in Derivatives assets and Derivatives liabilities, respectively, on theConsolidated Balance Sheets. As of December 31, 2015 and 2014, the maximum potential future net exposure to the Companywas $1.7 billion, net of purchased protection of $500.0 on credit default swaps. These instruments are typically written for amaturity period of 5 years and contain no recourse provisions. If the Company’s current debt and claims paying ratings weredowngraded in the future, the terms in the Company’s derivative agreements may be triggered, which could negatively impactoverall liquidity.
248

Voya Financial, Inc.Notes to the Consolidated Financial Statements(Dollar amounts in millions, unless otherwise stated)
4. Fair Value Measurements (excluding Consolidated Investment Entities)
Fair Value Measurement
The Company categorizes its financial instruments into a three-level hierarchy based on the priority of the inputs to thevaluation technique, pursuant to ASU 2011-04, “Fair Value Measurements (ASC Topic 820): Amendments to AchieveCommon Fair Value Measurement and Disclosure Requirements in U.S. GAAP” (“ASU 2011-04”). The fair value hierarchygives the highest priority to quoted prices in active markets for identical assets or liabilities (Level 1) and the lowest priority tounobservable inputs (Level 3). If the inputs used to measure fair value fall within different levels of the hierarchy, the categorylevel is based on the lowest priority level input that is significant to the fair value measurement of the instrument. Financialassets and liabilities recorded at fair value on the Consolidated Balance Sheets are categorized as follows:
• Level 1—Unadjusted quoted prices for identical assets or liabilities in an active market. The Company defines anactive market as a market in which transactions take place with sufficient frequency and volume to provide pricinginformation on an ongoing basis.
• Level 2—Quoted prices in markets that are not active or valuation techniques that require inputs that are observableeither directly or indirectly for substantially the full term of the asset or liability. Level 2 inputs include the following:
a) Quoted prices for similar assets or liabilities in active markets;
b) Quoted prices for identical or similar assets or liabilities in non-active markets;
c) Inputs other than quoted market prices that are observable; and
d) Inputs that are derived principally from or corroborated by observable market data through correlation or othermeans.
• Level 3—Prices or valuation techniques that require inputs that are both unobservable and significant to the overallfair value measurement. These valuations, whether derived internally or obtained from a third party, use criticalassumptions that are not widely available to estimate market participant expectations in valuing the asset or liability.
When available, the estimated fair value of financial instruments is based on quoted prices in active markets that are readily andregularly obtainable. When quoted prices in active markets are not available, the determination of estimated fair value is basedon market standard valuation methodologies, including discounted cash flow methodologies, matrix pricing or other similartechniques.
249

Voya Financial, Inc.Notes to the Consolidated Financial Statements(Dollar amounts in millions, unless otherwise stated)
The following table presents the Company’s hierarchy for its assets and liabilities measured at fair value on a recurring basis asof December 31, 2015:
Level 1 Level 2 Level 3 Total
Assets:Fixed maturities, including securities pledged:
U.S. Treasuries . . . . . . . . . . . . . . . . . . . . . . . . . . . . . . . . . . . . . . . . . . $ 3,030.6 $ 618.4 $ — $ 3,649.0U.S. Government agencies and authorities . . . . . . . . . . . . . . . . . . . . . — 352.6 — 352.6State, municipalities and political subdivisions . . . . . . . . . . . . . . . . . — 1,346.2 — 1,346.2U.S. corporate public securities . . . . . . . . . . . . . . . . . . . . . . . . . . . . . — 33,609.1 6.9 33,616.0U.S. corporate private securities . . . . . . . . . . . . . . . . . . . . . . . . . . . . . — 5,600.8 1,040.3 6,641.1Foreign corporate public securities and foreign governments(1) . . . . . — 8,009.8 13.8 8,023.6Foreign corporate private securities(1) . . . . . . . . . . . . . . . . . . . . . . . . . — 6,918.2 430.4 7,348.6Residential mortgage-backed securities . . . . . . . . . . . . . . . . . . . . . . . — 5,764.4 96.1 5,860.5Commercial mortgage-backed securities . . . . . . . . . . . . . . . . . . . . . . — 4,061.2 31.4 4,092.6Other asset-backed securities . . . . . . . . . . . . . . . . . . . . . . . . . . . . . . . — 1,097.9 44.5 1,142.4
Total fixed maturities, including securities pledged . . . . . . . . . . . . . . . . . . 3,030.6 67,378.6 1,663.4 72,072.6Equity securities, available-for-sale . . . . . . . . . . . . . . . . . . . . . . . . . . . . . . 234.3 — 97.4 331.7Derivatives:
Interest rate contracts . . . . . . . . . . . . . . . . . . . . . . . . . . . . . . . . . . . . . — 1,129.1 — 1,129.1Foreign exchange contracts . . . . . . . . . . . . . . . . . . . . . . . . . . . . . . . . . — 96.9 — 96.9Equity contracts . . . . . . . . . . . . . . . . . . . . . . . . . . . . . . . . . . . . . . . . . . 57.6 168.1 60.5 286.2Credit contracts . . . . . . . . . . . . . . . . . . . . . . . . . . . . . . . . . . . . . . . . . . — 18.0 8.3 26.3
Cash and cash equivalents, short-term investments and short-term investmentsunder securities loan agreements . . . . . . . . . . . . . . . . . . . . . . . . . . . . . . . . . . 4,617.7 51.7 — 4,669.4
Assets held in separate accounts . . . . . . . . . . . . . . . . . . . . . . . . . . . . . . . . . 91,887.2 4,623.7 3.9 96,514.8
Total assets . . . . . . . . . . . . . . . . . . . . . . . . . . . . . . . . . . . . . . . . . . . . . . . . . . . . . $99,827.4 $73,466.1 $1,833.5 $175,127.0
Percentage of Level to total . . . . . . . . . . . . . . . . . . . . . . . . . . . . . . . . . . . . . . . . . 57.0% 42.0% 1.0% 100.0%Liabilities:
Derivatives:Guaranteed benefit derivatives:
FIA . . . . . . . . . . . . . . . . . . . . . . . . . . . . . . . . . . . . . . . . . . . . . . . $ — $ — $1,820.1 $ 1,820.1IUL . . . . . . . . . . . . . . . . . . . . . . . . . . . . . . . . . . . . . . . . . . . . . . . — — 52.6 52.6GMAB/GMWB/GMWBL . . . . . . . . . . . . . . . . . . . . . . . . . . . . . — — 1,873.5 1,873.5Stabilizer and MCGs . . . . . . . . . . . . . . . . . . . . . . . . . . . . . . . . . . — — 161.3 161.3
Other derivatives:Interest rate contracts . . . . . . . . . . . . . . . . . . . . . . . . . . . . . . . . . 1.9 360.1 — 362.0Foreign exchange contracts . . . . . . . . . . . . . . . . . . . . . . . . . . . . . — 37.0 — 37.0Equity contracts . . . . . . . . . . . . . . . . . . . . . . . . . . . . . . . . . . . . . . 11.9 53.9 — 65.8Credit contracts . . . . . . . . . . . . . . . . . . . . . . . . . . . . . . . . . . . . . . — 6.3 16.4 22.7Embedded derivative on reinsurance . . . . . . . . . . . . . . . . . . . . . — 25.2 — 25.2
Total liabilities . . . . . . . . . . . . . . . . . . . . . . . . . . . . . . . . . . . . . . . . . . . . . . . . . . $ 13.8 $ 482.5 $3,923.9 $ 4,420.2
(1) Primarily U.S. dollar denominated.
250

Voya Financial, Inc.Notes to the Consolidated Financial Statements(Dollar amounts in millions, unless otherwise stated)
The following table presents the Company’s hierarchy for its assets and liabilities measured at fair value on a recurring basis asof December 31, 2014:
Level 1 Level 2 Level 3 Total
Assets:Fixed maturities, including securities pledged:
U.S. Treasuries . . . . . . . . . . . . . . . . . . . . . . . . . . . . . $ 3,262.0 $ 642.0 $ — $ 3,904.0U.S. Government agencies and authorities . . . . . . . . — 435.9 — 435.9State, municipalities and political subdivisions . . . . — 694.4 — 694.4U.S. corporate public securities . . . . . . . . . . . . . . . . — 34,239.9 103.8 34,343.7U.S. corporate private securities . . . . . . . . . . . . . . . . — 5,418.3 978.8 6,397.1Foreign corporate public securities and foreign
governments(1) . . . . . . . . . . . . . . . . . . . . . . . . . . . . — 8,375.7 13.5 8,389.2Foreign corporate private securities(1) . . . . . . . . . . . . — 7,619.8 435.2 8,055.0Residential mortgage-backed securities . . . . . . . . . . — 6,562.6 94.2 6,656.8Commercial mortgage-backed securities . . . . . . . . . — 4,166.2 22.0 4,188.2Other asset-backed securities . . . . . . . . . . . . . . . . . . — 1,585.0 10.1 1,595.1
Total fixed maturities, including securities pledged . . . . . 3,262.0 69,739.8 1,657.6 74,659.4Equity securities, available-for-sale . . . . . . . . . . . . . . . . . 215.5 — 56.3 271.8Derivatives:
Interest rate contracts . . . . . . . . . . . . . . . . . . . . . . . . — 1,225.0 — 1,225.0Foreign exchange contracts . . . . . . . . . . . . . . . . . . . . — 70.6 — 70.6Equity contracts . . . . . . . . . . . . . . . . . . . . . . . . . . . . . 104.7 296.6 81.8 483.1Credit contracts . . . . . . . . . . . . . . . . . . . . . . . . . . . . . — 30.9 10.0 40.9
Cash and cash equivalents, short-term investments and short-term investments under securities loan agreements . . . . . . . 4,924.8 138.5 6.0 5,069.3
Assets held in separate accounts . . . . . . . . . . . . . . . . . . . . 100,692.4 5,313.1 2.3 106,007.8
Total assets . . . . . . . . . . . . . . . . . . . . . . . . . . . . . . . . . . . . . . . . $109,199.4 $76,814.5 $1,814.0 $187,827.9
Percentage of Level to total . . . . . . . . . . . . . . . . . . . . . . . . . . . . 58.1% 40.9% 1.0% 100.0%Liabilities:
Derivatives:Guaranteed benefit derivatives:
FIA . . . . . . . . . . . . . . . . . . . . . . . . . . . . . . . . . . $ — $ — $1,970.0 $ 1,970.0IUL . . . . . . . . . . . . . . . . . . . . . . . . . . . . . . . . . . — — — —GMAB/GMWB/GMWBL . . . . . . . . . . . . . . . . — — 1,527.7 1,527.7Stabilizer and MCGs . . . . . . . . . . . . . . . . . . . . . — — 102.9 102.9
Other derivatives:Interest rate contracts . . . . . . . . . . . . . . . . . . . . — 576.6 — 576.6Foreign exchange contracts . . . . . . . . . . . . . . . . — 26.8 — 26.8Equity contracts . . . . . . . . . . . . . . . . . . . . . . . . . 8.2 201.7 — 209.9Credit contracts . . . . . . . . . . . . . . . . . . . . . . . . . — 16.3 19.7 36.0Embedded derivative on reinsurance . . . . . . . . — 139.6 — 139.6
Total liabilities . . . . . . . . . . . . . . . . . . . . . . . . . . . . . . . . . . . . . $ 8.2 $ 961.0 $3,620.3 $ 4,589.5
(1) Primarily U.S. dollar denominated.
251

Voya Financial, Inc.Notes to the Consolidated Financial Statements(Dollar amounts in millions, unless otherwise stated)
Valuation of Financial Assets and Liabilities at Fair Value
Certain assets and liabilities are measured at estimated fair value on the Company’s Consolidated Balance Sheets. The Companydefines fair value as the price that would be received to sell an asset or paid to transfer a liability (an exit price) in the principal ormost advantageous market for the asset or liability in an orderly transaction between market participants on the measurement date.The exit price and the transaction (or entry) price will be the same at initial recognition in many circumstances. However, in certaincases, the transaction price may not represent fair value. The fair value of a liability is based on the amount that would be paid totransfer a liability to a third party with an equal credit standing. Fair value is required to be a market-based measurement that isdetermined based on a hypothetical transaction at the measurement date, from a market participant’s perspective. The Companyconsiders three broad valuation techniques when a quoted price is unavailable: (i) the market approach, (ii) the income approachand (iii) the cost approach. The Company determines the most appropriate valuation technique to use, given the instrument beingmeasured and the availability of sufficient inputs. The Company prioritizes the inputs to fair valuation techniques and allows forthe use of unobservable inputs to the extent that observable inputs are not available.
The Company utilizes a number of valuation methodologies to determine the fair values of its financial assets and liabilities inconformity with the concepts of exit price and the fair value hierarchy as prescribed in ASC Topic 820. Valuations are obtainedfrom third-party commercial pricing services, brokers and industry-standard, vendor-provided software that models the valuebased on market observable inputs. The valuations obtained from third-party commercial pricing services are non-binding. TheCompany reviews the assumptions and inputs used by third-party commercial pricing services for each reporting period in orderto determine an appropriate fair value hierarchy level. The documentation and analysis obtained from third-party commercialpricing services are reviewed by the Company, including in-depth validation procedures confirming the observability of inputs.The valuations are reviewed and validated monthly through the internal valuation committee price variance review, comparisonsto internal pricing models, back testing to recent trades or monitoring of trading volumes.
The following valuation methods and assumptions were used by the Company in estimating the reported values for theinvestments and derivatives described below:
Fixed maturities: The fair values for actively traded marketable bonds are determined based upon the quoted market prices andare classified as Level 1 assets. Assets in this category primarily include certain U.S. Treasury securities.
For fixed maturities classified as Level 2 assets, fair values are determined using a matrix-based market approach, based onprices obtained from third-party commercial pricing services and the Company’s matrix and analytics-based pricing models,which in each case incorporate a variety of market observable information as valuation inputs. The market observable inputsused for these fair value measurements, by fixed maturity asset class, are as follows:
U.S. Treasuries: Fair value is determined using third-party commercial pricing services, with the primary inputs beingstripped interest and principal U.S. Treasury yield curves that represent a U.S. Treasury zero-coupon curve.
U.S. government agencies and authorities, State, municipalities and political subdivisions: Fair value is determined usingthird-party commercial pricing services, with the primary inputs being U.S. Treasury yield curves, trades of comparablesecurities, credit spreads off benchmark yields and issuer ratings.
U.S. corporate public securities, Foreign corporate public securities and foreign governments: Fair value is determinedusing third-party commercial pricing services, with the primary inputs being benchmark yields, trades of comparablesecurities, issuer ratings, bids and credit spreads off benchmark yields.
U.S. corporate private securities and Foreign corporate private securities: Fair values are determined using a matrix andanalytics-based pricing model. The model incorporates the current level of risk-free interest rates, current corporate creditspreads, credit quality of the issuer and cash flow characteristics of the security. The model also considers a liquidityspread, the value of any collateral, the capital structure of the issuer, the presence of guarantees, and prices and quotes forcomparably rated publicly traded securities.
RMBS, CMBS and ABS: Fair value is determined using third-party commercial pricing services, with the primary inputsbeing credit spreads off benchmark yields, prepayment speed assumptions, current and forecasted loss severity, debtservice coverage ratios, collateral type, payment priority within tranche and the vintage of the loans underlying thesecurity.
252
Voya Financial, Inc.Notes to the Consolidated Financial Statements(Dollar amounts in millions, unless otherwise stated)
Generally, the Company does not obtain more than one vendor price from pricing services per instrument. The Company uses ahierarchy process in which prices are obtained from a primary vendor and, if that vendor is unable to provide the price, the nextvendor in the hierarchy is contacted until a price is obtained or it is determined that a price cannot be obtained from acommercial pricing service. When a price cannot be obtained from a commercial pricing service, independent broker quotes aresolicited. Securities priced using independent broker quotes are classified as Level 3.
Broker quotes and prices obtained from pricing services are reviewed and validated through an internal valuation committeeprice variance review, comparisons to internal pricing models, back testing to recent trades or monitoring of trading volumes.As of December 31, 2015, $1.6 billion and $57.6 billion of a total fair value of $72.1 billion in fixed maturities, includingsecurities pledged, were valued using unadjusted broker quotes and unadjusted prices obtained from pricing services,respectively, and verified through the review process. The remaining balance in fixed maturities consisted primarily of privatelyplaced bonds valued using a matrix-based pricing. As of December 31, 2014, $1.5 billion and $59.7 billion of a total fair valueof $74.7 billion in fixed maturities, including securities pledged, were valued using unadjusted broker quotes and unadjustedprices obtained from pricing services, respectively, and verified through the review process. The remaining balance in fixedmaturities consisted primarily of privately placed bonds valued using a matrix-based pricing.
All prices and broker quotes obtained go through the review process described above including valuations for which only onebroker quote is obtained. After review, for those instruments where the price is determined to be appropriate, the unadjustedprice provided is used for financial statement valuation. If it is determined that the price is questionable, another price may berequested from a different vendor. The internal valuation committee then reviews all prices for the instrument again, along withinformation from the review, to determine which price best represents exit price for the instrument.
Fair values of privately placed bonds are determined primarily using a matrix-based pricing model and are generally classifiedas Level 2 assets. The model considers the current level of risk-free interest rates, current corporate spreads, the credit quality ofthe issuer and cash flow characteristics of the security. Also considered are factors such as the net worth of the borrower, thevalue of collateral, the capital structure of the borrower, the presence of guarantees and the Company’s evaluation of theborrower’s ability to compete in its relevant market. Using this data, the model generates estimated market values, which theCompany considers reflective of the fair value of each privately placed bond.
Equity securities, available-for-sale: Fair values of publicly traded equity securities are based upon quoted market price and areclassified as Level 1 assets. Other equity securities, typically private equities or equity securities not traded on an exchange, arevalued by other sources such as analytics or brokers and are classified as Level 2 or Level 3 assets.
Derivatives: Derivatives are carried at fair value, which is determined using the Company’s derivative accounting system inconjunction with observable key financial data from third-party sources, such as yield curves, exchange rates, S&P 500 Indexprices, London Interbank Offered Rates (“LIBOR”) and Overnight Index Swap (“OIS”) rates. The Company uses OIS forvaluations of collateralized interest rate derivatives, which are obtained from third-party sources. For those derivatives that areunable to be valued by the accounting system, the Company typically utilizes values established by third-party brokers.Counterparty credit risk is considered and incorporated in the Company’s valuation process through counterparty credit ratingrequirements and monitoring of overall exposure. It is the Company’s policy to transact only with investment gradecounterparties with a credit rating of A- or better. The Company’s nonperformance risk is also considered and incorporated inthe Company’s valuation process. Valuations for the Company’s futures and interest rate forward contracts are based onunadjusted quoted prices from an active exchange and, therefore, are classified as Level 1. The Company also has certain creditdefault swaps and options that are priced using models that primarily use market observable inputs, but contain inputs that arenot observable to market participants, which have been classified as Level 3. The remaining derivative instruments, includingthose priced by third party vendors, are valued based on market observable inputs and are classified as Level 2.
Cash and cash equivalents, Short-term investments and Short-term investments under securities loan agreement: The carryingamounts for cash reflect the assets’ fair values. The fair values for cash equivalents and most short-term investments aredetermined based on quoted market prices. These assets are classified as Level 1. Other short-term investments are valued andclassified in the fair value hierarchy consistent with the policies described herein, depending on investment type.
253

Voya Financial, Inc.Notes to the Consolidated Financial Statements(Dollar amounts in millions, unless otherwise stated)
Assets held in separate accounts: Assets held in separate accounts are reported at the quoted fair values of the underlyinginvestments in the separate accounts. The underlying investments include mutual funds, short-term investments and cash, thevaluations of which are based upon a quoted market price and are included in Level 1. Fixed maturity valuations are obtainedfrom third-party commercial pricing services and brokers and are classified in the fair value hierarchy consistent with the policydescribed above for fixed maturities.
Guaranteed benefit derivatives: The Company records reserves for annuity contracts containing GMAB, GMWB and GMWBLriders. The guarantee is an embedded derivative and is required to be accounted for separately from the host variable annuitycontract. The fair value of the obligation is calculated based on actuarial and capital market assumptions related to the projectedcash flows, including benefits and related contract charges, over the anticipated life of the related contracts. The cash flowestimates are produced by using stochastic techniques under a variety of market return scenarios and other market impliedassumptions. These derivatives are classified as Level 3 liabilities in the fair value hierarchy.
The index-crediting feature in the Company’s FIA and IUL contracts is an embedded derivative that is required to be accountedfor separately from the host contract. The fair value of the obligation is calculated based on actuarial and capital marketassumptions related to the projected cash flows, including benefits and related contract charges, over the anticipated life of therelated contracts for FIAs and over the current indexed term for IULs. The cash flow estimates are produced by market impliedassumptions. These derivatives are classified as Level 3 liabilities in the fair value hierarchy.
The Company records reserves for Stabilizer and MCG contracts containing guaranteed credited rates. The guarantee is treatedas an embedded derivative or a stand-alone derivative (depending on the underlying product) and is required to be reported atfair value. The estimated fair value is determined based on the present value of projected future claims, minus the present valueof future guaranteed premiums. At inception of the contract, the Company projects a guaranteed premium to be equal to thepresent value of the projected future claims. The income associated with the contracts is projected using relevant actuarial andcapital market assumptions, including benefits and related contract charges, over the anticipated life of the related contracts. Thecash flow estimates are produced by using stochastic techniques under a variety of risk neutral scenarios and other marketimplied assumptions. These derivatives are classified as Level 3 liabilities.
The discount rate used to determine the fair value of the Company’s GMAB, GMWB, GMWBL, FIA, IUL and Stabilizerembedded derivative liabilities and the stand-alone derivative for MCG includes an adjustment to reflect the risk that theseobligations will not be fulfilled (“nonperformance risk”). The nonperformance risk adjustment incorporates a blend ofobservable, similarly rated peer holding company credit default swap spreads, adjusted to reflect the credit quality of theindividual insurance subsidiary that issued the guarantee, as well as an adjustment to reflect the priority of policyholder claims.
The Company’s valuation actuaries are responsible for the policies and procedures for valuing the embedded derivatives,reflecting the capital markets and actuarial valuation inputs and nonperformance risk in the estimate of the fair value of theembedded derivatives. The actuarial and capital market assumptions for each liability are approved by each product’s ChiefRisk Officer (“CRO”), including an independent annual review by the CRO. Models used to value the embedded derivativesmust comply with the Company’s governance policies.
Quarterly, an attribution analysis is performed to quantify changes in fair value measurements and a sensitivity analysis is usedto analyze the changes. The changes in fair value measurements are also compared to corresponding movements in the hedgetarget to assess the validity of the attributions. The results of the attribution analysis are reviewed by the valuation actuaries,responsible CFOs, Controllers, CROs and/or others as nominated by management.
Embedded derivatives on reinsurance: The carrying value of embedded derivatives is estimated based upon the change in thefair value of the assets supporting the funds withheld payable under reinsurance agreements. As the fair value of the assets heldin trust is based on a quoted market price (Level 1), the fair value of the embedded derivative is based on market observableinputs and is classified as Level 2.
Transfers in and out of Level 1 and 2
There were no securities transferred between Level 1 and Level 2 for the years ended December 31, 2015 and 2014. TheCompany’s policy is to recognize transfers in and transfers out as of the beginning of the reporting period.
254
Voya Financial, Inc.Notes to the Consolidated Financial Statements(Dollar amounts in millions, unless otherwise stated)
Level 3 Financial Instruments
The fair values of certain assets and liabilities are determined using prices or valuation techniques that require inputs that areboth unobservable and significant to the overall fair value measurement (i.e., Level 3 as defined by ASC Topic 820), includingbut not limited to liquidity spreads for investments within markets deemed not currently active. These valuations, whetherderived internally or obtained from a third party, use critical assumptions that are not widely available to estimate marketparticipant expectations in valuing the asset or liability. In addition, the Company has determined, for certain financialinstruments, an active market is such a significant input to determine fair value that the presence of an inactive market may leadto classification in Level 3. In light of the methodologies employed to obtain the fair values of financial assets and liabilitiesclassified as Level 3, additional information is presented below.
255
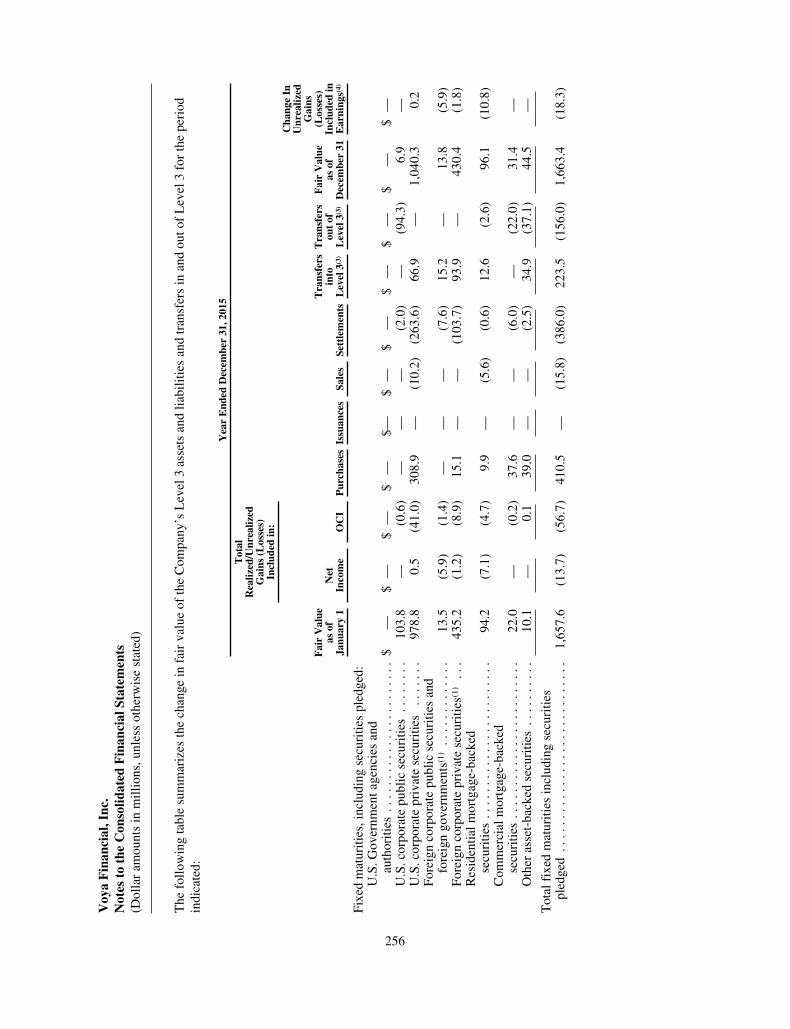
Voy
aF
inan
cial
,Inc
.N
otes
toth
eC
onso
lidat
edF
inan
cial
Stat
emen
ts(D
olla
ram
ount
sin
mill
ions
,unl
ess
othe
rwis
est
ated
)
The
follo
win
gta
ble
sum
mar
izes
the
chan
gein
fair
valu
eof
the
Com
pany
’sL
evel
3as
sets
and
liabi
litie
san
dtr
ansf
ers
inan
dou
tof
Lev
el3
for
the
peri
odin
dica
ted:
Yea
rE
nded
Dec
embe
r31
,201
5
Tot
alR
ealiz
ed/U
nrea
lized
Gai
ns(L
osse
s)In
clud
edin
:
Fai
rV
alue
asof
Janu
ary
1N
etIn
com
eO
CI
Pur
chas
esIs
suan
ces
Sale
sSe
ttle
men
ts
Tra
nsfe
rsin
toL
evel
3(3)
Tra
nsfe
rsou
tof
Lev
el3(
3)
Fai
rV
alue
asof
Dec
embe
r31
Cha
nge
InU
nrea
lized
Gai
ns(L
osse
s)In
clud
edin
Ear
ning
s(4)
Fixe
dm
atur
ities
,inc
ludi
ngse
curi
ties
pled
ged:
U.S
.Gov
ernm
enta
genc
ies
and
auth
oriti
es..
....
....
....
....
....
.$
—$
—$
—$
—$—
$—
$—
$—
$—
$—
$—
U.S
.cor
pora
tepu
blic
secu
ritie
s..
....
..10
3.8
—(0
.6)
——
—(2
.0)
—(9
4.3)
6.9
—U
.S.c
orpo
rate
priv
ate
secu
ritie
s..
....
.97
8.8
0.5
(41.
0)30
8.9
—(1
0.2)
(263
.6)
66.9
—1,
040.
30.
2Fo
reig
nco
rpor
ate
publ
icse
curi
ties
and
fore
ign
gove
rnm
ents
(1)
....
....
....
.13
.5(5
.9)
(1.4
)—
——
(7.6
)15
.2—
13.8
(5.9
)Fo
reig
nco
rpor
ate
priv
ate
secu
ritie
s(1)
...
435.
2(1
.2)
(8.9
)15
.1—
—(1
03.7
)93
.9—
430.
4(1
.8)
Res
iden
tialm
ortg
age-
back
edse
curi
ties
....
....
....
....
....
....
94.2
(7.1
)(4
.7)
9.9
—(5
.6)
(0.6
)12
.6(2
.6)
96.1
(10.
8)C
omm
erci
alm
ortg
age-
back
edse
curi
ties
....
....
....
....
....
....
22.0
—(0
.2)
37.6
——
(6.0
)—
(22.
0)31
.4—
Oth
eras
set-
back
edse
curi
ties
....
....
..10
.1—
0.1
39.0
——
(2.5
)34
.9(3
7.1)
44.5
—
Tot
alfi
xed
mat
uriti
esin
clud
ing
secu
ritie
spl
edge
d..
....
....
....
....
....
....
...
1,65
7.6
(13.
7)(5
6.7)
410.
5—
(15.
8)(3
86.0
)22
3.5
(156
.0)
1,66
3.4
(18.
3)
256
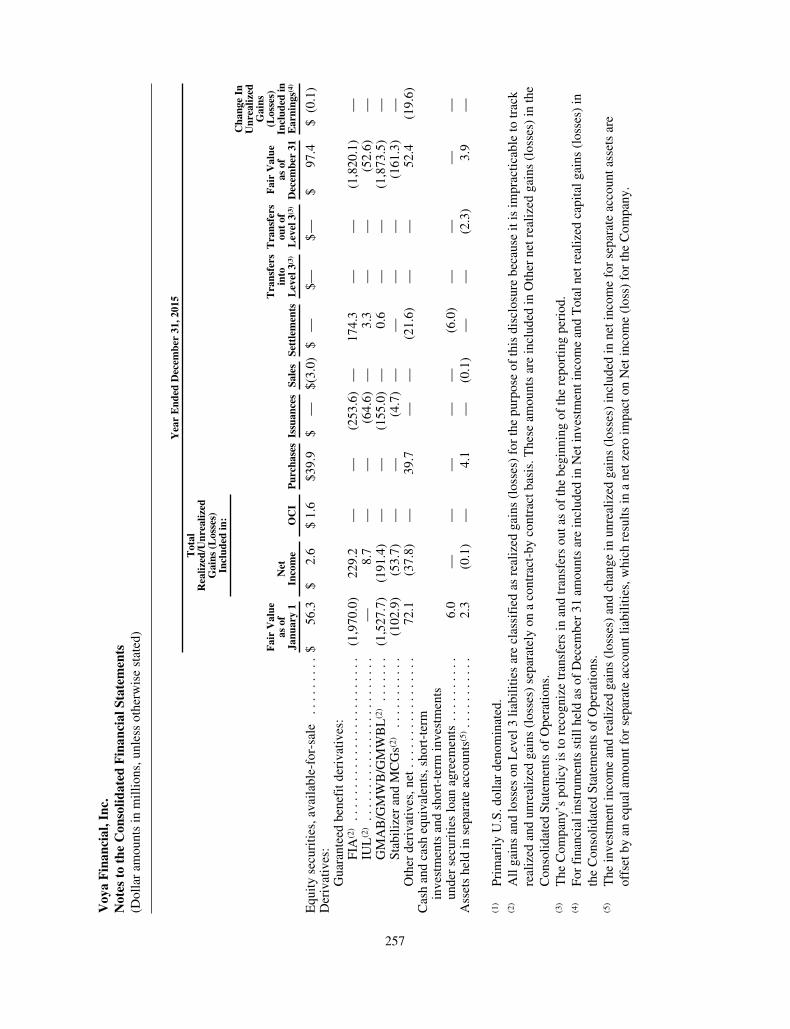
Voy
aF
inan
cial
,Inc
.N
otes
toth
eC
onso
lidat
edF
inan
cial
Stat
emen
ts(D
olla
ram
ount
sin
mill
ions
,unl
ess
othe
rwis
est
ated
)
Yea
rE
nded
Dec
embe
r31
,201
5
Tot
alR
ealiz
ed/U
nrea
lized
Gai
ns(L
osse
s)In
clud
edin
:
Fai
rV
alue
asof
Janu
ary
1N
etIn
com
eO
CI
Pur
chas
esIs
suan
ces
Sale
sSe
ttle
men
ts
Tra
nsfe
rsin
toL
evel
3(3)
Tra
nsfe
rsou
tof
Lev
el3(
3)
Fai
rV
alue
asof
Dec
embe
r31
Cha
nge
InU
nrea
lized
Gai
ns(L
osse
s)In
clud
edin
Ear
ning
s(4)
Equ
ityse
curi
ties,
avai
labl
e-fo
r-sa
le..
....
...
$56
.3$
2.6
$1.
6$3
9.9
$—
$(3.
0)$
—$—
$—
$97
.4$
(0.1
)D
eriv
ativ
es:
Gua
rant
eed
bene
fitd
eriv
ativ
es:
FIA
(2)
....
....
....
....
....
....
.(1
,970
.0)
229.
2—
—(2
53.6
)—
174.
3—
—(1
,820
.1)
—IU
L(2
)..
....
....
....
....
....
...
—8.
7—
—(6
4.6)
—3.
3—
—(5
2.6)
—G
MA
B/G
MW
B/G
MW
BL
(2)
....
...
(1,5
27.7
)(1
91.4
)—
—(1
55.0
)—
0.6
——
(1,8
73.5
)—
Stab
ilize
ran
dM
CG
s(2)
....
....
...
(102
.9)
(53.
7)—
—(4
.7)
——
——
(161
.3)
—O
ther
deri
vativ
es,n
et..
....
....
....
...
72.1
(37.
8)—
39.7
——
(21.
6)—
—52
.4(1
9.6)
Cas
han
dca
sheq
uiva
lent
s,sh
ort-
term
inve
stm
ents
and
shor
t-te
rmin
vest
men
tsun
der
secu
ritie
slo
anag
reem
ents
....
....
..6.
0—
——
——
(6.0
)—
——
—A
sset
she
ldin
sepa
rate
acco
unts
(5)..
....
....
.2.
3(0
.1)
—4.
1—
(0.1
)—
—(2
.3)
3.9
—
(1)
Prim
arily
U.S
.dol
lar
deno
min
ated
.(2
)A
llga
ins
and
loss
eson
Lev
el3
liabi
litie
sar
ecl
assi
fied
asre
aliz
edga
ins
(los
ses)
for
the
purp
ose
ofth
isdi
sclo
sure
beca
use
itis
impr
actic
able
totr
ack
real
ized
and
unre
aliz
edga
ins
(los
ses)
sepa
rate
lyon
aco
ntra
ct-b
yco
ntra
ctba
sis.
The
seam
ount
sar
ein
clud
edin
Oth
erne
trea
lized
gain
s(l
osse
s)in
the
Con
solid
ated
Stat
emen
tsof
Ope
ratio
ns.
(3)
The
Com
pany
’spo
licy
isto
reco
gniz
etr
ansf
ers
inan
dtr
ansf
ers
outa
sof
the
begi
nnin
gof
the
repo
rtin
gpe
riod
.(4
)Fo
rfi
nanc
iali
nstr
umen
tsst
illhe
ldas
ofD
ecem
ber
31am
ount
sar
ein
clud
edin
Net
inve
stm
enti
ncom
ean
dT
otal
netr
ealiz
edca
pita
lgai
ns(l
osse
s)in
the
Con
solid
ated
Stat
emen
tsof
Ope
ratio
ns.
(5)
The
inve
stm
enti
ncom
ean
dre
aliz
edga
ins
(los
ses)
and
chan
gein
unre
aliz
edga
ins
(los
ses)
incl
uded
inne
tinc
ome
for
sepa
rate
acco
unta
sset
sar
eof
fset
byan
equa
lam
ount
for
sepa
rate
acco
untl
iabi
litie
s,w
hich
resu
ltsin
ane
tzer
oim
pact
onN
etin
com
e(l
oss)
for
the
Com
pany
.
257
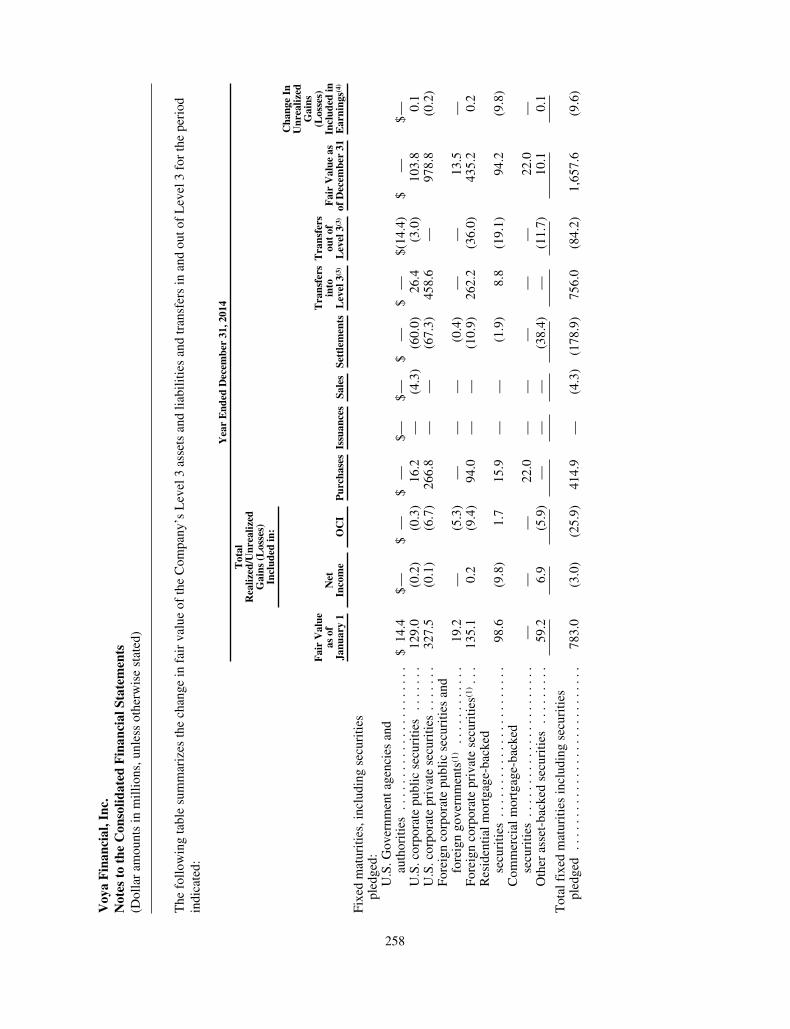
Voy
aF
inan
cial
,Inc
.N
otes
toth
eC
onso
lidat
edF
inan
cial
Stat
emen
ts(D
olla
ram
ount
sin
mill
ions
,unl
ess
othe
rwis
est
ated
)
The
follo
win
gta
ble
sum
mar
izes
the
chan
gein
fair
valu
eof
the
Com
pany
’sL
evel
3as
sets
and
liabi
litie
san
dtr
ansf
ers
inan
dou
tof
Lev
el3
for
the
peri
odin
dica
ted:
Yea
rE
nded
Dec
embe
r31
,201
4
Tot
alR
ealiz
ed/U
nrea
lized
Gai
ns(L
osse
s)In
clud
edin
:
Fai
rV
alue
asof
Janu
ary
1N
etIn
com
eO
CI
Pur
chas
esIs
suan
ces
Sale
sSe
ttle
men
ts
Tra
nsfe
rsin
toL
evel
3(3)
Tra
nsfe
rsou
tof
Lev
el3(
3)F
air
Val
ueas
ofD
ecem
ber
31
Cha
nge
InU
nrea
lized
Gai
ns(L
osse
s)In
clud
edin
Ear
ning
s(4)
Fixe
dm
atur
ities
,inc
ludi
ngse
curi
ties
pled
ged:
U.S
.Gov
ernm
enta
genc
ies
and
auth
oriti
es..
....
....
....
....
....
$14
.4$
—$
—$
—$—
$—
$—
$—
$(14
.4)
$—
$—
U.S
.cor
pora
tepu
blic
secu
ritie
s..
....
.12
9.0
(0.2
)(0
.3)
16.2
—(4
.3)
(60.
0)26
.4(3
.0)
103.
80.
1U
.S.c
orpo
rate
priv
ate
secu
ritie
s..
....
.32
7.5
(0.1
)(6
.7)
266.
8—
—(6
7.3)
458.
6—
978.
8(0
.2)
Fore
ign
corp
orat
epu
blic
secu
ritie
san
dfo
reig
ngo
vern
men
ts(1
)..
....
....
..19
.2—
(5.3
)—
——
(0.4
)—
—13
.5—
Fore
ign
corp
orat
epr
ivat
ese
curi
ties(
1)..
.13
5.1
0.2
(9.4
)94
.0—
—(1
0.9)
262.
2(3
6.0)
435.
20.
2R
esid
entia
lmor
tgag
e-ba
cked
secu
ritie
s..
....
....
....
....
....
.98
.6(9
.8)
1.7
15.9
——
(1.9
)8.
8(1
9.1)
94.2
(9.8
)C
omm
erci
alm
ortg
age-
back
edse
curi
ties
....
....
....
....
....
...
——
—22
.0—
——
——
22.0
—O
ther
asse
t-ba
cked
secu
ritie
s..
....
...
59.2
6.9
(5.9
)—
——
(38.
4)—
(11.
7)10
.10.
1
Tot
alfi
xed
mat
uriti
esin
clud
ing
secu
ritie
spl
edge
d..
....
....
....
....
....
....
..78
3.0
(3.0
)(2
5.9)
414.
9—
(4.3
)(1
78.9
)75
6.0
(84.
2)1,
657.
6(9
.6)
258
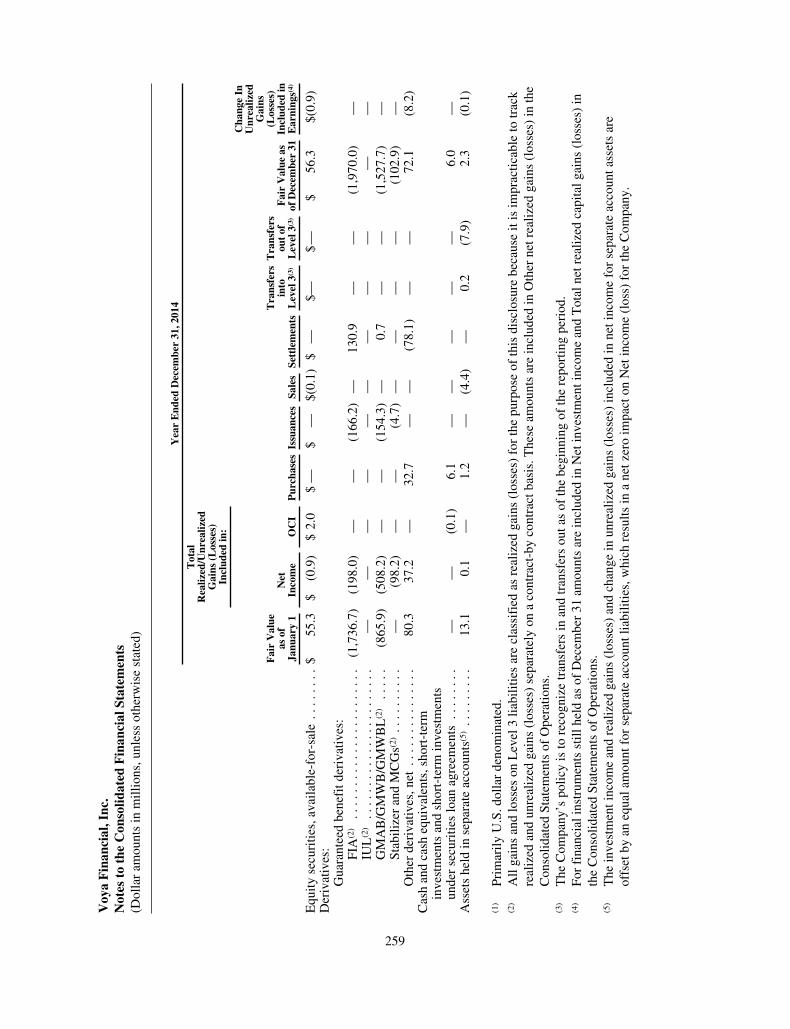
Voy
aF
inan
cial
,Inc
.N
otes
toth
eC
onso
lidat
edF
inan
cial
Stat
emen
ts(D
olla
ram
ount
sin
mill
ions
,unl
ess
othe
rwis
est
ated
)
Yea
rE
nded
Dec
embe
r31
,201
4
Tot
alR
ealiz
ed/U
nrea
lized
Gai
ns(L
osse
s)In
clud
edin
:
Fai
rV
alue
asof
Janu
ary
1N
etIn
com
eO
CI
Pur
chas
esIs
suan
ces
Sale
sSe
ttle
men
ts
Tra
nsfe
rsin
toL
evel
3(3)
Tra
nsfe
rsou
tof
Lev
el3(
3)F
air
Val
ueas
ofD
ecem
ber
31
Cha
nge
InU
nrea
lized
Gai
ns(L
osse
s)In
clud
edin
Ear
ning
s(4)
Equ
ityse
curi
ties,
avai
labl
e-fo
r-sa
le..
....
..$
55.3
$(0
.9)
$2.
0$
—$
—$(
0.1)
$—
$—$
—$
56.3
$(0.
9)D
eriv
ativ
es:
Gua
rant
eed
bene
fitd
eriv
ativ
es:
FIA
(2)
....
....
....
....
....
...
(1,7
36.7
)(1
98.0
)—
—(1
66.2
)—
130.
9—
—(1
,970
.0)
—IU
L(2
)..
....
....
....
....
....
.—
——
——
——
——
——
GM
AB
/GM
WB
/GM
WB
L(2
)..
...
(865
.9)
(508
.2)
——
(154
.3)
—0.
7—
—(1
,527
.7)
—St
abili
zer
and
MC
Gs(
2)..
....
....
—(9
8.2)
——
(4.7
)—
——
—(1
02.9
)—
Oth
erde
riva
tives
,net
....
....
....
...
80.3
37.2
—32
.7—
—(7
8.1)
——
72.1
(8.2
)C
ash
and
cash
equi
vale
nts,
shor
t-te
rmin
vest
men
tsan
dsh
ort-
term
inve
stm
ents
unde
rse
curi
ties
loan
agre
emen
ts..
....
..—
—(0
.1)
6.1
——
——
—6.
0—
Ass
ets
held
inse
para
teac
coun
ts(5
)..
....
...
13.1
0.1
—1.
2—
(4.4
)—
0.2
(7.9
)2.
3(0
.1)
(1)
Prim
arily
U.S
.dol
lar
deno
min
ated
.(2
)A
llga
ins
and
loss
eson
Lev
el3
liabi
litie
sar
ecl
assi
fied
asre
aliz
edga
ins
(los
ses)
for
the
purp
ose
ofth
isdi
sclo
sure
beca
use
itis
impr
actic
able
totr
ack
real
ized
and
unre
aliz
edga
ins
(los
ses)
sepa
rate
lyon
aco
ntra
ct-b
yco
ntra
ctba
sis.
The
seam
ount
sar
ein
clud
edin
Oth
erne
trea
lized
gain
s(l
osse
s)in
the
Con
solid
ated
Stat
emen
tsof
Ope
ratio
ns.
(3)
The
Com
pany
’spo
licy
isto
reco
gniz
etr
ansf
ers
inan
dtr
ansf
ers
outa
sof
the
begi
nnin
gof
the
repo
rtin
gpe
riod
.(4
)Fo
rfi
nanc
iali
nstr
umen
tsst
illhe
ldas
ofD
ecem
ber
31am
ount
sar
ein
clud
edin
Net
inve
stm
enti
ncom
ean
dT
otal
netr
ealiz
edca
pita
lgai
ns(l
osse
s)in
the
Con
solid
ated
Stat
emen
tsof
Ope
ratio
ns.
(5)
The
inve
stm
enti
ncom
ean
dre
aliz
edga
ins
(los
ses)
and
chan
gein
unre
aliz
edga
ins
(los
ses)
incl
uded
inne
tinc
ome
for
sepa
rate
acco
unta
sset
sar
eof
fset
byan
equa
lam
ount
for
sepa
rate
acco
untl
iabi
litie
s,w
hich
resu
ltsin
ane
tzer
oim
pact
onN
etin
com
e(l
oss)
for
the
Com
pany
.
259
Voya Financial, Inc.Notes to the Consolidated Financial Statements(Dollar amounts in millions, unless otherwise stated)
For the years ended December 31, 2015 and 2014, the transfers in and out of Level 3 for fixed maturities and equity securities,as well as separate accounts, were due to the variation in inputs relied upon for valuation each quarter. Securities that areprimarily valued using independent broker quotes when prices are not available from one of the commercial pricing services arereflected as transfers into Level 3. When securities are valued using more widely available information, the securities aretransferred out of Level 3 and into Level 1 or 2, as appropriate.
Significant Unobservable Inputs
The Company’s Level 3 fair value measurements of its fixed maturities, equity securities available-for-sale and equity and creditderivative contracts are primarily based on broker quotes for which the quantitative detail of the unobservable inputs is neitherprovided nor reasonably corroborated, thus negating the ability to perform a sensitivity analysis. The Company performs a reviewof broker quotes by performing a monthly price variance comparison and back tests broker quotes to recent trade prices.
Quantitative information about the significant unobservable inputs used in the Company’s Level 3 fair value measurements ofits guaranteed benefit derivatives is presented in the following sections and table.
Significant unobservable inputs used in the fair value measurements of GMABs, GMWBs and GMWBLs include long-termequity and interest rate implied volatility, correlations between the rate of return on policyholder funds and between interestrates and equity returns, nonperformance risk, mortality and policyholder behavior assumptions, such as benefit utilization,lapses and partial withdrawals. Such inputs are monitored quarterly.
Significant unobservable inputs used in the fair value measurements of FIAs include nonperformance risk and policyholderbehavior assumptions, such as lapses and partial withdrawals. Such inputs are monitored quarterly.
Significant unobservable inputs used in the fair value measurements of IULs include nonperformance risk and policyholderbehavior assumptions, such as lapses. Such inputs are monitored quarterly.
The significant unobservable inputs used in the fair value measurement of the Stabilizer embedded derivatives and MCG derivativeare interest rate implied volatility, nonperformance risk, lapses and policyholder deposits. Such inputs are monitored quarterly.
Following is a description of selected inputs:
Equity/Interest Rate Volatility: A term-structure model is used to approximate implied volatility for the equity indices andswap rates for GMAB, GMWB and GMWBL fair value measurements and swap rates for the Stabilizer and MCG fairvalue measurements. Where no implied volatility is readily available in the market, an alternative approach is appliedbased on historical volatility.
Correlations: Integrated interest rate and equity scenarios are used in GMAB, GMWB and GMWBL fair valuemeasurements to better reflect market interest rates and interest rate volatility correlations between equity and fixed incomefund groups and between equity fund groups and interest rates. The correlations are based on historical fund returns andswap rates from external sources.
Nonperformance Risk: For the estimate of the fair value of embedded derivatives associated with the Company’s productguarantees, the Company uses a blend of observable, similarly rated peer company credit default swap spreads, adjusted toreflect the credit quality of the individual insurance company subsidiary that issued the guarantee and the priority ofpolicyholder claims.
Actuarial Assumptions: Management regularly reviews actuarial assumptions, which are based on the Company’sexperience and periodically reviewed against industry standards. Industry standards and Company experience may belimited on certain products.
260
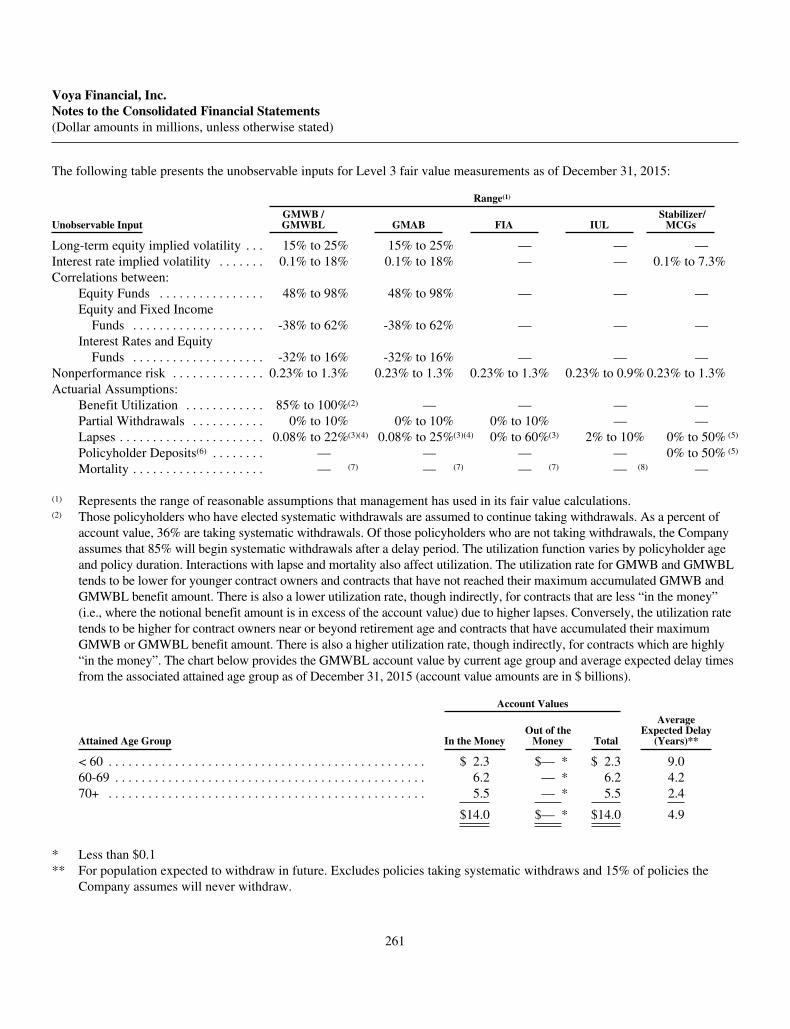
Voya Financial, Inc.Notes to the Consolidated Financial Statements(Dollar amounts in millions, unless otherwise stated)
The following table presents the unobservable inputs for Level 3 fair value measurements as of December 31, 2015:
Range(1)
Unobservable InputGMWB /GMWBL GMAB FIA IUL
Stabilizer/MCGs
Long-term equity implied volatility . . . 15% to 25% 15% to 25% — — —Interest rate implied volatility . . . . . . . 0.1% to 18% 0.1% to 18% — — 0.1% to 7.3%Correlations between:
Equity Funds . . . . . . . . . . . . . . . . 48% to 98% 48% to 98% — — —Equity and Fixed Income
Funds . . . . . . . . . . . . . . . . . . . . -38% to 62% -38% to 62% — — —Interest Rates and Equity
Funds . . . . . . . . . . . . . . . . . . . . -32% to 16% -32% to 16% — — —Nonperformance risk . . . . . . . . . . . . . . 0.23% to 1.3% 0.23% to 1.3% 0.23% to 1.3% 0.23% to 0.9% 0.23% to 1.3%Actuarial Assumptions:
Benefit Utilization . . . . . . . . . . . . 85% to 100%(2) — — — —Partial Withdrawals . . . . . . . . . . . 0% to 10% 0% to 10% 0% to 10% — —Lapses . . . . . . . . . . . . . . . . . . . . . . 0.08% to 22%(3)(4) 0.08% to 25%(3)(4) 0% to 60%(3) 2% to 10% 0% to 50% (5)
Policyholder Deposits(6) . . . . . . . . — — — — 0% to 50% (5)
Mortality . . . . . . . . . . . . . . . . . . . . — (7) — (7) — (7) — (8) —
(1) Represents the range of reasonable assumptions that management has used in its fair value calculations.(2) Those policyholders who have elected systematic withdrawals are assumed to continue taking withdrawals. As a percent of
account value, 36% are taking systematic withdrawals. Of those policyholders who are not taking withdrawals, the Companyassumes that 85% will begin systematic withdrawals after a delay period. The utilization function varies by policyholder ageand policy duration. Interactions with lapse and mortality also affect utilization. The utilization rate for GMWB and GMWBLtends to be lower for younger contract owners and contracts that have not reached their maximum accumulated GMWB andGMWBL benefit amount. There is also a lower utilization rate, though indirectly, for contracts that are less “in the money”(i.e., where the notional benefit amount is in excess of the account value) due to higher lapses. Conversely, the utilization ratetends to be higher for contract owners near or beyond retirement age and contracts that have accumulated their maximumGMWB or GMWBL benefit amount. There is also a higher utilization rate, though indirectly, for contracts which are highly“in the money”. The chart below provides the GMWBL account value by current age group and average expected delay timesfrom the associated attained age group as of December 31, 2015 (account value amounts are in $ billions).
Account Values
Attained Age Group In the MoneyOut of the
Money Total
AverageExpected Delay
(Years)**
< 60 . . . . . . . . . . . . . . . . . . . . . . . . . . . . . . . . . . . . . . . . . . . . . . . . $ 2.3 $— * $ 2.3 9.060-69 . . . . . . . . . . . . . . . . . . . . . . . . . . . . . . . . . . . . . . . . . . . . . . . 6.2 — * 6.2 4.270+ . . . . . . . . . . . . . . . . . . . . . . . . . . . . . . . . . . . . . . . . . . . . . . . . 5.5 — * 5.5 2.4
$14.0 $— * $14.0 4.9
* Less than $0.1** For population expected to withdraw in future. Excludes policies taking systematic withdraws and 15% of policies the
Company assumes will never withdraw.
261

Voya Financial, Inc.Notes to the Consolidated Financial Statements(Dollar amounts in millions, unless otherwise stated)
(3) Lapse rates tend to be lower during the contractual surrender charge period and higher after the surrender charge periodends; the highest lapse rates occur in the year immediately after the end of the surrender charge period.
(4) The Company makes dynamic adjustments to lower the lapse rates for contracts that are more “in the money.” The table belowshows an analysis of policy account values according to whether they are in or out of the surrender charge period and to whetherthey are “in the money” or “out of the money” as of December 31, 2015 (account value amounts are in $ billions).
GMAB GMWB/GMWBL
MoneynessAccount
Value Lapse RangeAccount
Value Lapse Range
During Surrender Charge PeriodIn the Money** $— * 0.08% to 7.2% $ 5.0 0.08% to 5.6%
Out of the Money — * 0.41% to 7.9% — * 0.36% to 5.9%After Surrender Charge Period
In the Money** $— * 2.5% to 22.5% $ 9.1 1.4% to 20.7%Out of the Money — * 11.9% to 24.8% 0.6 5.0% to 21.7%
* Less than $0.1.** The low end of the range corresponds to policies that are highly “in the money.” The high end of the range corresponds to
the policies that are close to zero in terms of “in the moneyness.”(5) Stabilizer contracts with recordkeeping agreements have a different range of lapse and policyholder deposit assumptions
from Stabilizer (Investment only) and MCG contracts as shown below:
Percentageof Plans
OverallRange of
Lapse Rates
Range ofLapse Ratesfor 85% of
Plans
OverallRange of
PolicyholderDeposits
Range ofPolicyholder
Deposits for 85% ofPlans
Stabilizer (Investment Only) and MCG Contracts . . . . . . . . 90% 0-25% 0-15% 0-30% 0-15%Stabilizer with Recordkeeping Agreements . . . . . . . . . . . . . 10% 0-50% 0-30% 0-50% 0-25%
Aggregate of all plans . . . . . . . . . . . . . . . . . . . . . . . . . . . . . . 100% 0-50% 0-30% 0-50% 0-25%
(6) Measured as a percentage of assets under management or assets under administration.(7) The mortality rate is based on the 2012 Individual Annuity Mortality Basic table with mortality improvements.(8) The mortality rate, along with the associated cost of insurance charges, are based on the 2001 Commissioner’s Standard
Ordinary table with mortality improvements.
The following table presents the unobservable inputs for Level 3 fair value measurements as of December 31, 2014:
Range(1)
Unobservable InputGMWB /GMWBL GMAB FIA IUL
Stabilizer/MCGs
Long-term equity implied volatility . . . . 15% to 25% 15% to 25% — — —Interest rate implied volatility . . . . . . . . . 0.2% to 16% 0.2% to 16% — — 0.2% to 7.6%Correlations between:
Equity Funds . . . . . . . . . . . . . . . . . . 49% to 98% 49% to 98% — — —Equity and Fixed Income Funds . . . -38% to 62% -38% to 62% — — —Interest Rates and Equity Funds . . . -32% to -4% -32% to -4% — — —
Nonperformance risk . . . . . . . . . . . . . . . . 0.13% to 1.1% 0.13% to 1.1% 0.13% to 1.1% — 0.13% to 1.1%Actuarial Assumptions:
Benefit Utilization . . . . . . . . . . . . . . 85% to 100% (2) — — — —Partial Withdrawals . . . . . . . . . . . . . 0% to 10% 0% to 10% 0% to 5 % — —Lapses . . . . . . . . . . . . . . . . . . . . . . . 0.08% to 24% (3)(4) 0.08% to 31% (3)(4) 0% to 60%(3) — 0% to 50%(5)
Policyholder Deposits(5) . . . . . . . . . . — — — — 0% to 65%(5)
Mortality . . . . . . . . . . . . . . . . . . . . . — (7) — (7) — (8) — —
(1) Represents the range of reasonable assumptions that management has used in its fair value calculations.
262
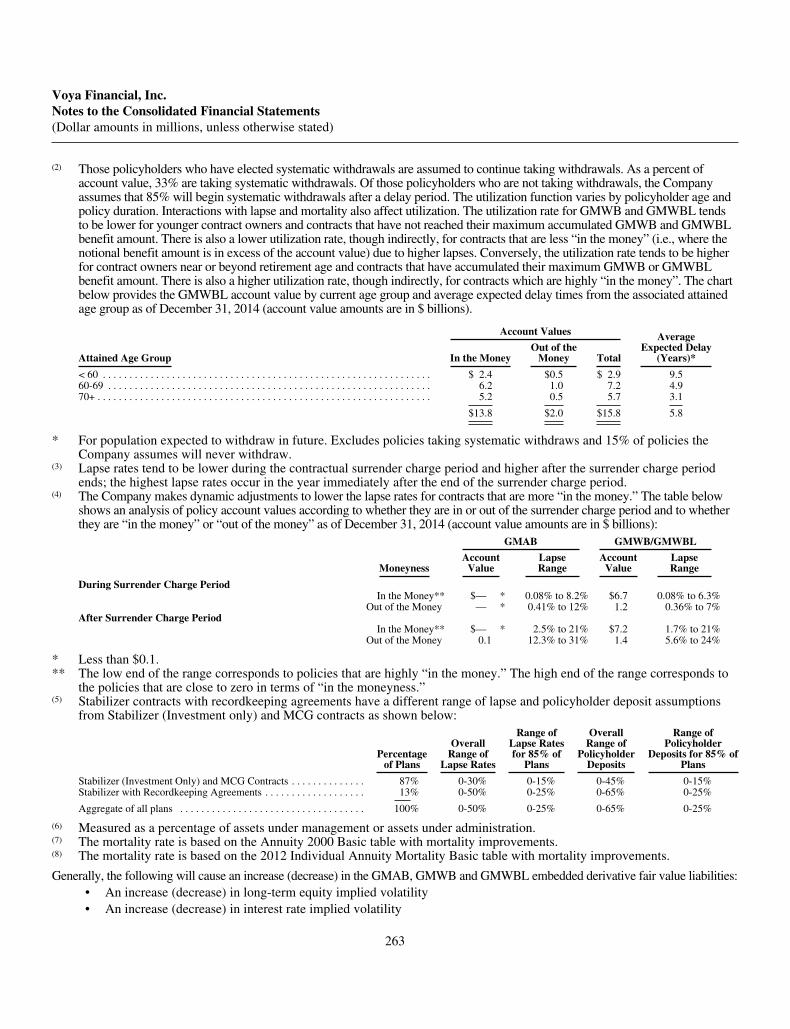
Voya Financial, Inc.Notes to the Consolidated Financial Statements(Dollar amounts in millions, unless otherwise stated)
(2) Those policyholders who have elected systematic withdrawals are assumed to continue taking withdrawals. As a percent ofaccount value, 33% are taking systematic withdrawals. Of those policyholders who are not taking withdrawals, the Companyassumes that 85% will begin systematic withdrawals after a delay period. The utilization function varies by policyholder age andpolicy duration. Interactions with lapse and mortality also affect utilization. The utilization rate for GMWB and GMWBL tendsto be lower for younger contract owners and contracts that have not reached their maximum accumulated GMWB and GMWBLbenefit amount. There is also a lower utilization rate, though indirectly, for contracts that are less “in the money” (i.e., where thenotional benefit amount is in excess of the account value) due to higher lapses. Conversely, the utilization rate tends to be higherfor contract owners near or beyond retirement age and contracts that have accumulated their maximum GMWB or GMWBLbenefit amount. There is also a higher utilization rate, though indirectly, for contracts which are highly “in the money”. The chartbelow provides the GMWBL account value by current age group and average expected delay times from the associated attainedage group as of December 31, 2014 (account value amounts are in $ billions).
Account Values AverageExpected Delay
(Years)*Attained Age Group In the MoneyOut of the
Money Total
< 60 . . . . . . . . . . . . . . . . . . . . . . . . . . . . . . . . . . . . . . . . . . . . . . . . . . . . . . . . . . . . . . $ 2.4 $0.5 $ 2.9 9.560-69 . . . . . . . . . . . . . . . . . . . . . . . . . . . . . . . . . . . . . . . . . . . . . . . . . . . . . . . . . . . . . 6.2 1.0 7.2 4.970+ . . . . . . . . . . . . . . . . . . . . . . . . . . . . . . . . . . . . . . . . . . . . . . . . . . . . . . . . . . . . . . . 5.2 0.5 5.7 3.1
$13.8 $2.0 $15.8 5.8
* For population expected to withdraw in future. Excludes policies taking systematic withdraws and 15% of policies theCompany assumes will never withdraw.
(3) Lapse rates tend to be lower during the contractual surrender charge period and higher after the surrender charge periodends; the highest lapse rates occur in the year immediately after the end of the surrender charge period.
(4) The Company makes dynamic adjustments to lower the lapse rates for contracts that are more “in the money.” The table belowshows an analysis of policy account values according to whether they are in or out of the surrender charge period and to whetherthey are “in the money” or “out of the money” as of December 31, 2014 (account value amounts are in $ billions):
GMAB GMWB/GMWBL
MoneynessAccount
ValueLapseRange
AccountValue
LapseRange
During Surrender Charge PeriodIn the Money** $— * 0.08% to 8.2% $6.7 0.08% to 6.3%
Out of the Money — * 0.41% to 12% 1.2 0.36% to 7%After Surrender Charge Period
In the Money** $— * 2.5% to 21% $7.2 1.7% to 21%Out of the Money 0.1 12.3% to 31% 1.4 5.6% to 24%
* Less than $0.1.** The low end of the range corresponds to policies that are highly “in the money.” The high end of the range corresponds to
the policies that are close to zero in terms of “in the moneyness.”(5) Stabilizer contracts with recordkeeping agreements have a different range of lapse and policyholder deposit assumptions
from Stabilizer (Investment only) and MCG contracts as shown below:
Percentageof Plans
OverallRange of
Lapse Rates
Range ofLapse Ratesfor 85% of
Plans
OverallRange of
PolicyholderDeposits
Range ofPolicyholder
Deposits for 85% ofPlans
Stabilizer (Investment Only) and MCG Contracts . . . . . . . . . . . . . . 87% 0-30% 0-15% 0-45% 0-15%Stabilizer with Recordkeeping Agreements . . . . . . . . . . . . . . . . . . . 13% 0-50% 0-25% 0-65% 0-25%
Aggregate of all plans . . . . . . . . . . . . . . . . . . . . . . . . . . . . . . . . . . . 100% 0-50% 0-25% 0-65% 0-25%
(6) Measured as a percentage of assets under management or assets under administration.(7) The mortality rate is based on the Annuity 2000 Basic table with mortality improvements.(8) The mortality rate is based on the 2012 Individual Annuity Mortality Basic table with mortality improvements.
Generally, the following will cause an increase (decrease) in the GMAB, GMWB and GMWBL embedded derivative fair value liabilities:• An increase (decrease) in long-term equity implied volatility• An increase (decrease) in interest rate implied volatility
263

Voya Financial, Inc.Notes to the Consolidated Financial Statements(Dollar amounts in millions, unless otherwise stated)
• An increase (decrease) in equity-interest rate correlations
• A decrease (increase) in nonperformance risk
• A decrease (increase) in mortality
• An increase (decrease) in benefit utilization
• A decrease (increase) in lapses
Changes in fund correlations may increase or decrease the fair value depending on the direction of the movement and the mix offunds. Changes in partial withdrawals may increase or decrease the fair value depending on the timing and magnitude ofwithdrawals.
Generally, the following will cause an increase (decrease) in the FIA and IUL embedded derivative fair value liabilities:
• A decrease (increase) in nonperformance risk
• A decrease (increase) in lapses
Generally, the following will cause an increase (decrease) in the derivative and embedded derivative fair value liabilities relatedto Stabilizer and MCG contracts:
• An increase (decrease) in interest rate implied volatility
• A decrease (increase) in nonperformance risk
• A decrease (increase) in lapses
• A decrease (increase) in policyholder deposits
The Company notes the following interrelationships:
• Higher long-term equity implied volatility is often correlated with lower equity returns, which will result in higher in-the-moneyness, which in turn, results in lower lapses due to the dynamic lapse component reducing the lapses. Thisincreases the projected number of policies that are available to use the GMWBL benefit and may also increase the fairvalue of the GMWBL.
• Generally, an increase (decrease) in benefit utilization will decrease (increase) lapses for GMWB and GMWBL.
• Generally, an increase (decrease) in interest rate volatility will increase (decrease) lapses of Stabilizer and MCGcontracts due to dynamic participant behavior.
264
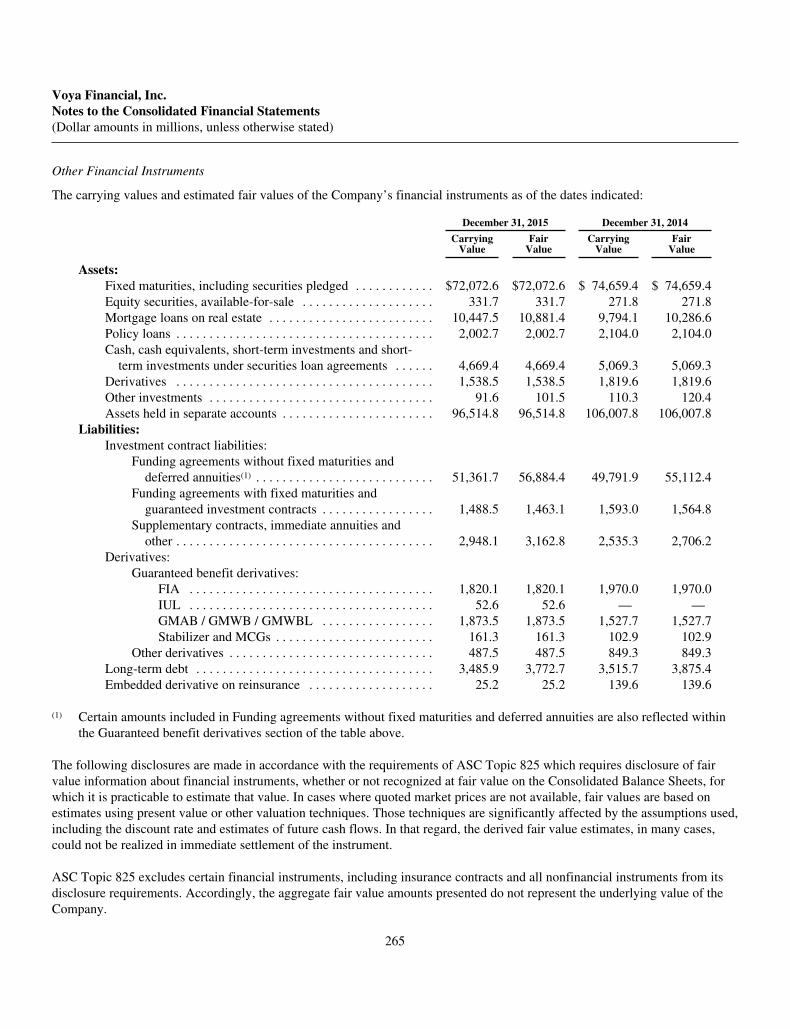
Voya Financial, Inc.Notes to the Consolidated Financial Statements(Dollar amounts in millions, unless otherwise stated)
Other Financial Instruments
The carrying values and estimated fair values of the Company’s financial instruments as of the dates indicated:
December 31, 2015 December 31, 2014
CarryingValue
FairValue
CarryingValue
FairValue
Assets:Fixed maturities, including securities pledged . . . . . . . . . . . . $72,072.6 $72,072.6 $ 74,659.4 $ 74,659.4Equity securities, available-for-sale . . . . . . . . . . . . . . . . . . . . 331.7 331.7 271.8 271.8Mortgage loans on real estate . . . . . . . . . . . . . . . . . . . . . . . . . 10,447.5 10,881.4 9,794.1 10,286.6Policy loans . . . . . . . . . . . . . . . . . . . . . . . . . . . . . . . . . . . . . . . 2,002.7 2,002.7 2,104.0 2,104.0Cash, cash equivalents, short-term investments and short-
term investments under securities loan agreements . . . . . . 4,669.4 4,669.4 5,069.3 5,069.3Derivatives . . . . . . . . . . . . . . . . . . . . . . . . . . . . . . . . . . . . . . . 1,538.5 1,538.5 1,819.6 1,819.6Other investments . . . . . . . . . . . . . . . . . . . . . . . . . . . . . . . . . . 91.6 101.5 110.3 120.4Assets held in separate accounts . . . . . . . . . . . . . . . . . . . . . . . 96,514.8 96,514.8 106,007.8 106,007.8
Liabilities:Investment contract liabilities:
Funding agreements without fixed maturities anddeferred annuities(1) . . . . . . . . . . . . . . . . . . . . . . . . . . . 51,361.7 56,884.4 49,791.9 55,112.4
Funding agreements with fixed maturities andguaranteed investment contracts . . . . . . . . . . . . . . . . . 1,488.5 1,463.1 1,593.0 1,564.8
Supplementary contracts, immediate annuities andother . . . . . . . . . . . . . . . . . . . . . . . . . . . . . . . . . . . . . . . 2,948.1 3,162.8 2,535.3 2,706.2
Derivatives:Guaranteed benefit derivatives:
FIA . . . . . . . . . . . . . . . . . . . . . . . . . . . . . . . . . . . . . 1,820.1 1,820.1 1,970.0 1,970.0IUL . . . . . . . . . . . . . . . . . . . . . . . . . . . . . . . . . . . . . 52.6 52.6 — —GMAB / GMWB / GMWBL . . . . . . . . . . . . . . . . . 1,873.5 1,873.5 1,527.7 1,527.7Stabilizer and MCGs . . . . . . . . . . . . . . . . . . . . . . . . 161.3 161.3 102.9 102.9
Other derivatives . . . . . . . . . . . . . . . . . . . . . . . . . . . . . . . 487.5 487.5 849.3 849.3Long-term debt . . . . . . . . . . . . . . . . . . . . . . . . . . . . . . . . . . . . 3,485.9 3,772.7 3,515.7 3,875.4Embedded derivative on reinsurance . . . . . . . . . . . . . . . . . . . 25.2 25.2 139.6 139.6
(1) Certain amounts included in Funding agreements without fixed maturities and deferred annuities are also reflected withinthe Guaranteed benefit derivatives section of the table above.
The following disclosures are made in accordance with the requirements of ASC Topic 825 which requires disclosure of fairvalue information about financial instruments, whether or not recognized at fair value on the Consolidated Balance Sheets, forwhich it is practicable to estimate that value. In cases where quoted market prices are not available, fair values are based onestimates using present value or other valuation techniques. Those techniques are significantly affected by the assumptions used,including the discount rate and estimates of future cash flows. In that regard, the derived fair value estimates, in many cases,could not be realized in immediate settlement of the instrument.
ASC Topic 825 excludes certain financial instruments, including insurance contracts and all nonfinancial instruments from itsdisclosure requirements. Accordingly, the aggregate fair value amounts presented do not represent the underlying value of theCompany.
265

Voya Financial, Inc.Notes to the Consolidated Financial Statements(Dollar amounts in millions, unless otherwise stated)
The following valuation methods and assumptions were used by the Company in estimating the fair value of the followingfinancial instruments, which are not carried at fair value on the Consolidated Balance Sheets:
Mortgage loans on real estate: The fair values for mortgage loans on real estate are estimated on a monthly basis usingdiscounted cash flow analyses and rates currently being offered in the marketplace for similar loans to borrowers with similarcredit ratings. Loans with similar characteristics are aggregated for purposes of the calculations. Mortgage loans on real estateare classified as Level 3.
Policy loans: The fair value of policy loans approximates the carrying value of the loans. Policy loans are collateralized by thecash surrender value of the associated insurance contracts and are classified as Level 2.
Other investments: Primarily FHLB stock which is carried at cost and periodically evaluated for impairment based on ultimaterecovery of par value and is classified as Level 1.
Investment contract liabilities:
Funding agreements without fixed maturities and deferred annuities: Fair value is estimated as the mean present value ofstochastically modeled cash flows associated with the contract liabilities taking into account assumptions about contractholder behavior. The stochastic valuation scenario set is consistent with current market parameters and discount is takenusing stochastically evolving risk-free rates in the scenarios plus an adjustment for nonperformance risk. Margins for non-financial risks associated with the contract liabilities are also included. These liabilities are classified as Level 3.
Funding agreements with fixed maturities and guaranteed investment contracts: Fair value is estimated by discountingcash flows, including associated expenses for maintaining the contracts, at rates, that are risk-free rates plus an adjustmentfor nonperformance risk. These liabilities are classified as Level 2.
Supplementary contracts and immediate annuities: Fair value is estimated as the mean present value of the singledeterministically modeled cash flows associated with the contract liabilities discounted using stochastically evolving shortrisk-free rates in the scenarios plus an adjustment for nonperformance risk. The valuation is consistent with current marketparameters. Margins for non-financial risks associated with the contract liabilities are also included. These liabilities areclassified as Level 3.
Long-term debt: Estimated fair value of the Company’s long-term debt is based upon discounted future cash flows using adiscount rate approximating the current market rate, incorporating nonperformance risk. Long-term debt is classified as Level 2.
Fair value estimates are made at a specific point in time, based on available market information and judgments about variousfinancial instruments, such as estimates of timing and amounts of future cash flows. Such estimates do not reflect any premiumor discount that could result from offering for sale at one time the Company’s entire holdings of a particular financialinstrument, nor do they consider the tax impact of the realization of unrealized capital gains (losses). In many cases, the fairvalue estimates cannot be substantiated by comparison to independent markets, nor can the disclosed value be realized inimmediate settlement of the instruments. In evaluating the Company’s management of interest rate, price and liquidity risks, thefair values of all assets and liabilities should be taken into consideration, not only those presented above.
266
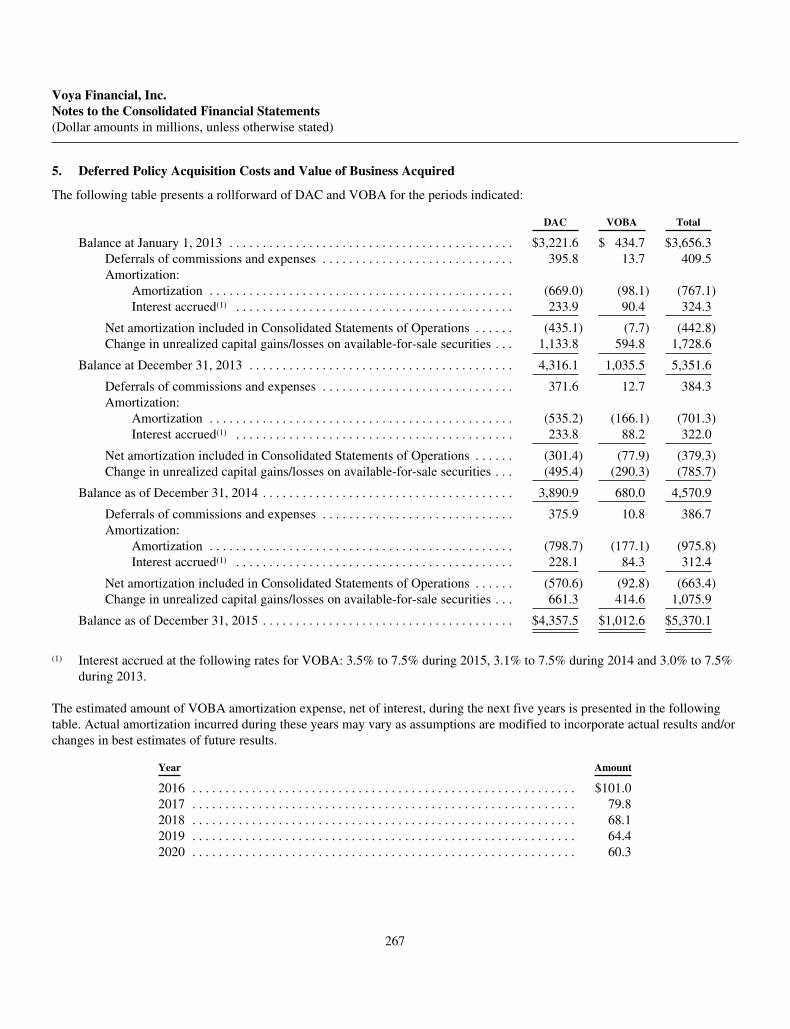
Voya Financial, Inc.Notes to the Consolidated Financial Statements(Dollar amounts in millions, unless otherwise stated)
5. Deferred Policy Acquisition Costs and Value of Business Acquired
The following table presents a rollforward of DAC and VOBA for the periods indicated:
DAC VOBA Total
Balance at January 1, 2013 . . . . . . . . . . . . . . . . . . . . . . . . . . . . . . . . . . . . . . . . . . . $3,221.6 $ 434.7 $3,656.3Deferrals of commissions and expenses . . . . . . . . . . . . . . . . . . . . . . . . . . . . . 395.8 13.7 409.5Amortization:
Amortization . . . . . . . . . . . . . . . . . . . . . . . . . . . . . . . . . . . . . . . . . . . . . . (669.0) (98.1) (767.1)Interest accrued(1) . . . . . . . . . . . . . . . . . . . . . . . . . . . . . . . . . . . . . . . . . . 233.9 90.4 324.3
Net amortization included in Consolidated Statements of Operations . . . . . . (435.1) (7.7) (442.8)Change in unrealized capital gains/losses on available-for-sale securities . . . 1,133.8 594.8 1,728.6
Balance at December 31, 2013 . . . . . . . . . . . . . . . . . . . . . . . . . . . . . . . . . . . . . . . . 4,316.1 1,035.5 5,351.6
Deferrals of commissions and expenses . . . . . . . . . . . . . . . . . . . . . . . . . . . . . 371.6 12.7 384.3Amortization:
Amortization . . . . . . . . . . . . . . . . . . . . . . . . . . . . . . . . . . . . . . . . . . . . . . (535.2) (166.1) (701.3)Interest accrued(1) . . . . . . . . . . . . . . . . . . . . . . . . . . . . . . . . . . . . . . . . . . 233.8 88.2 322.0
Net amortization included in Consolidated Statements of Operations . . . . . . (301.4) (77.9) (379.3)Change in unrealized capital gains/losses on available-for-sale securities . . . (495.4) (290.3) (785.7)
Balance as of December 31, 2014 . . . . . . . . . . . . . . . . . . . . . . . . . . . . . . . . . . . . . . 3,890.9 680.0 4,570.9
Deferrals of commissions and expenses . . . . . . . . . . . . . . . . . . . . . . . . . . . . . 375.9 10.8 386.7Amortization:
Amortization . . . . . . . . . . . . . . . . . . . . . . . . . . . . . . . . . . . . . . . . . . . . . . (798.7) (177.1) (975.8)Interest accrued(1) . . . . . . . . . . . . . . . . . . . . . . . . . . . . . . . . . . . . . . . . . . 228.1 84.3 312.4
Net amortization included in Consolidated Statements of Operations . . . . . . (570.6) (92.8) (663.4)Change in unrealized capital gains/losses on available-for-sale securities . . . 661.3 414.6 1,075.9
Balance as of December 31, 2015 . . . . . . . . . . . . . . . . . . . . . . . . . . . . . . . . . . . . . . $4,357.5 $1,012.6 $5,370.1
(1) Interest accrued at the following rates for VOBA: 3.5% to 7.5% during 2015, 3.1% to 7.5% during 2014 and 3.0% to 7.5%during 2013.
The estimated amount of VOBA amortization expense, net of interest, during the next five years is presented in the followingtable. Actual amortization incurred during these years may vary as assumptions are modified to incorporate actual results and/orchanges in best estimates of future results.
Year Amount
2016 . . . . . . . . . . . . . . . . . . . . . . . . . . . . . . . . . . . . . . . . . . . . . . . . . . . . . . . . . . $101.02017 . . . . . . . . . . . . . . . . . . . . . . . . . . . . . . . . . . . . . . . . . . . . . . . . . . . . . . . . . . 79.82018 . . . . . . . . . . . . . . . . . . . . . . . . . . . . . . . . . . . . . . . . . . . . . . . . . . . . . . . . . . 68.12019 . . . . . . . . . . . . . . . . . . . . . . . . . . . . . . . . . . . . . . . . . . . . . . . . . . . . . . . . . . 64.42020 . . . . . . . . . . . . . . . . . . . . . . . . . . . . . . . . . . . . . . . . . . . . . . . . . . . . . . . . . . 60.3
267

Voya Financial, Inc.Notes to the Consolidated Financial Statements(Dollar amounts in millions, unless otherwise stated)
6. Reserves for Future Policy Benefits and Contract Owner Account Balances
Future policy benefits and contract owner account balances were as follows as of December 31, 2015 and 2014:
2015 2014
Future policy benefits:Individual and group life insurance contracts . . . . . . . . . . . . . . . . . . . . . . . . . . . . . . . . . . . . . . . . . . . $ 8,356.5 $ 8,421.5Product guarantees on universal life and deferred annuity contracts, and payout contracts with life
contingencies . . . . . . . . . . . . . . . . . . . . . . . . . . . . . . . . . . . . . . . . . . . . . . . . . . . . . . . . . . . . . . . . . . 10,262.9 6,277.2Accident and health . . . . . . . . . . . . . . . . . . . . . . . . . . . . . . . . . . . . . . . . . . . . . . . . . . . . . . . . . . . . . . . 888.6 933.5
Total . . . . . . . . . . . . . . . . . . . . . . . . . . . . . . . . . . . . . . . . . . . . . . . . . . . . . . . . . . . . . . . . . . . . . . . . . . . . . . $19,508.0 $15,632.2
Contract owner account balances:GICs . . . . . . . . . . . . . . . . . . . . . . . . . . . . . . . . . . . . . . . . . . . . . . . . . . . . . . . . . . . . . . . . . . . . . . . . . . $ 1,430.0 $ 1,512.6Universal life-type contracts . . . . . . . . . . . . . . . . . . . . . . . . . . . . . . . . . . . . . . . . . . . . . . . . . . . . . . . . 14,892.2 17,032.9Fixed annuities and payout contracts without life contingencies . . . . . . . . . . . . . . . . . . . . . . . . . . . . 38,531.7 37,201.8Fixed-indexed annuities . . . . . . . . . . . . . . . . . . . . . . . . . . . . . . . . . . . . . . . . . . . . . . . . . . . . . . . . . . . 13,810.2 13,572.2
Total . . . . . . . . . . . . . . . . . . . . . . . . . . . . . . . . . . . . . . . . . . . . . . . . . . . . . . . . . . . . . . . . . . . . . . . . . . . . . . $68,664.1 $69,319.5
7. Guaranteed Benefit Features
While the Company ceased new sales of certain retail variable annuity products in 2010, its currently-sold retail variable annuitycontracts with separate account options guarantee the contract owner a return of no less than (i) total deposits made to thecontract less any partial withdrawals, (ii) total deposits made to the contract less any partial withdrawals plus a minimum return,or (iii) the highest contract value on a specified date minus any withdrawals. These guarantees include benefits that are payablein the event of death, annuitization or at specified dates.
The Company also issues variable life, UL and VUL contracts where the Company contractually guarantees to the contractowner a death benefit even when there is insufficient value to cover monthly mortality and expense charges, whereas otherwisethe contract would typically lapse (“no lapse guarantee”), and other provisions that would produce expected gains from theinsurance benefit function followed by losses from that function in later years.
In addition, the Company’s Stabilizer and MCG products have guaranteed credited rates. Credited rates are set either quarterlyor annually. Most contracts have a zero percent minimum credited rate guarantee, although some contracts have minimumcredited rate guarantees up to 3% and allow the contract holder to select either the market value of the account or the book valueof the account at termination. The book value of the account is equal to deposits plus interest, less any withdrawals. The fairvalue is estimated using the income approach.
The Company also has certain indexed annuity products which contain guaranteed withdrawal benefit provisions. This provisionguarantees an annual withdrawal amount for life that is calculated as a percentage of the benefit base, which equals premiumpaid at the time of product issue, and can increase by a rollup percentage (mainly 7%, 6% or a percentage linked to indexedcredits earned, depending on versions of the benefit) or annual ratchet. The percentage used to determine the guaranteed annualwithdrawal amount may vary by age at first withdrawal and depends on whether the benefit is for a single life or joint lives.
The Company’s major source of income from guaranteed benefit features is the base contract mortality, expense and guaranteeddeath and living benefit rider fees charged to the contract owner, less the costs of administering the product and providing forthe guaranteed death and living benefits.
268

Voya Financial, Inc.Notes to the Consolidated Financial Statements(Dollar amounts in millions, unless otherwise stated)
The Company’s CBVA contracts offer one or more of the following guaranteed death and living benefits:
Guaranteed Minimum Death Benefits (GMDB)
• Standard: Guarantees that, upon the death of the individual specified in the policy, the death benefit will be no less than thepremiums paid by the customer, adjusted for withdrawals.
• Ratchet: Guarantees that, upon the death of the individual specified in the policy, the death benefit will be no less than thegreater of (1) Standard or (2) the maximum policy anniversary (or quarterly) value of the variable annuity, adjusted forwithdrawals.
• Rollup: Guarantees that, upon the death of the individual specified in the policy, the death benefit will be no less than theaggregate premiums paid by the contract owner, with interest at the contractual rate per annum, adjusted for withdrawals.The Rollup may be subject to a maximum cap on the total benefit.
• Combo: Guarantees that, upon the death of the individual specified in the policy, the death benefit will be no less than thegreater of (1) Ratchet or (2) Rollup.
Guaranteed Minimum Living Benefits
Guaranteed Minimum Income Benefit (GMIB): Guarantees a minimum income payout, exercisable only on a contractanniversary on or after a specified date, in most cases 10 years after purchase of the GMIB rider. The income payout isdetermined based on contractually established annuity factors multiplied by the benefit base. The benefit base equals thepremium paid at the time of product issue and may increase over time based on a number of factors, including a rolluppercentage (mainly 7% or 6% depending on the version of the benefit) and ratchet frequency subject to maximum caps whichvary by product version (200%, 250% or 300% of initial premium).
Guaranteed Minimum Withdrawal Benefit and Guaranteed Minimum Withdrawal Benefit for Life (GMWB/GMWBL):Guarantees an annual withdrawal amount for a specified period of time (GMWB) or life (GMWBL) that is calculated as apercentage of the benefit base that equals premium paid at the time of product issue and may increase over time based on anumber of factors, including a rollup percentage (mainly 7%, 6% or 0%, depending on versions of the benefit) and ratchetfrequency (primarily annually or quarterly, depending on versions). The percentage used to determine the guaranteed annualwithdrawal amount may vary by age at first withdrawal and depends on versions of the benefit. A joint life-time withdrawalbenefit option was available to include coverage for spouses. Most versions of the withdrawal benefit included reset and/or step-up features that may increase the guaranteed withdrawal amount in certain conditions. Earlier versions of the withdrawal benefitguarantee that annual withdrawals of up to 7.0% of eligible premiums may be made until eligible premiums previously paid bythe contract owner are returned, regardless of account value performance. Asset allocation requirements apply at all times wherewithdrawals are guaranteed for life.
Guaranteed Minimum Accumulation Benefit (GMAB): Guarantees that the account value will be at least 100% of the eligiblepremiums paid by the customer after 10 years, adjusted for withdrawals. The Company offered an alternative design thatguaranteed the account value to be at least 200% of the eligible premiums paid by contract owners after 20 years.
269

Voya Financial, Inc.Notes to the Consolidated Financial Statements(Dollar amounts in millions, unless otherwise stated)
The following assumptions and methodologies were used to determine the guaranteed reserves for CBVA contracts as ofDecember 31, 2015 and 2014:
Area Assumptions/Basis for Assumptions
Data used Based on 1,000 investment performance scenarios.
Mean investmentperformance
GMDB: The mean investment performance varies by fund group. In general, the Company groups separateaccount returns into 6 fund groups, and generate stochastic returns for each of these fund groups. Theoverall blended mean separate account return is 8.1%. The general account fixed portion is a smallpercentage of the overall total.
GMIB: The overall blended mean is 8.1% based on a single fund group.
GMAB/GMWB/GMWBL: Zero rate curve.
Volatility GMDB: 15.1% for 2015 and 15.8% for 2014.
GMIB: 15.1% for 2015 and 15.8% for 2014.
GMAB/GMWB/GMWBL: Implied volatilities through the first 5 years and then a blend of implied andhistorical thereafter.
Mortality Depending on the type of benefit and gender, the Company uses the 2012 Individual Annuity MortalityBasic table with mortality improvement as of December 31, 2015 and the Annuity 2000 Basic table withmortality improvement as of December 31, 2014, further adjusted for company experience.
Lapse rates Vary by contract type, share class, time remaining in the surrender charge period and in-the-moneyness.
Discount rates GMDB/GMIB: 5.5% for 2015 and 2014.
GMAB/GMWB/GMWBL: Zero rate curve plus adjustment for nonperformance risk.
Variable annuity contracts containing guaranteed minimum death and living benefits expose the Company to equity risk. With adecline in the equity markets, the Company has exposure to increasing claims due to the guaranteed minimum benefits. On theother hand, with an increase in the equity markets, the Company’s exposure to risks associated with the guaranteed minimumbenefits generally decreases. In order to mitigate the risk associated with guaranteed death and living benefits, the Companyenters into reinsurance agreements and derivative positions on various public market indices chosen to closely replicate contractowner variable fund returns.
The calculation of the GMDB, GMIB, GMAB, GMWB and GMWBL liabilities assumes dynamic surrenders and dynamicutilization of the guaranteed living benefit feature.
270
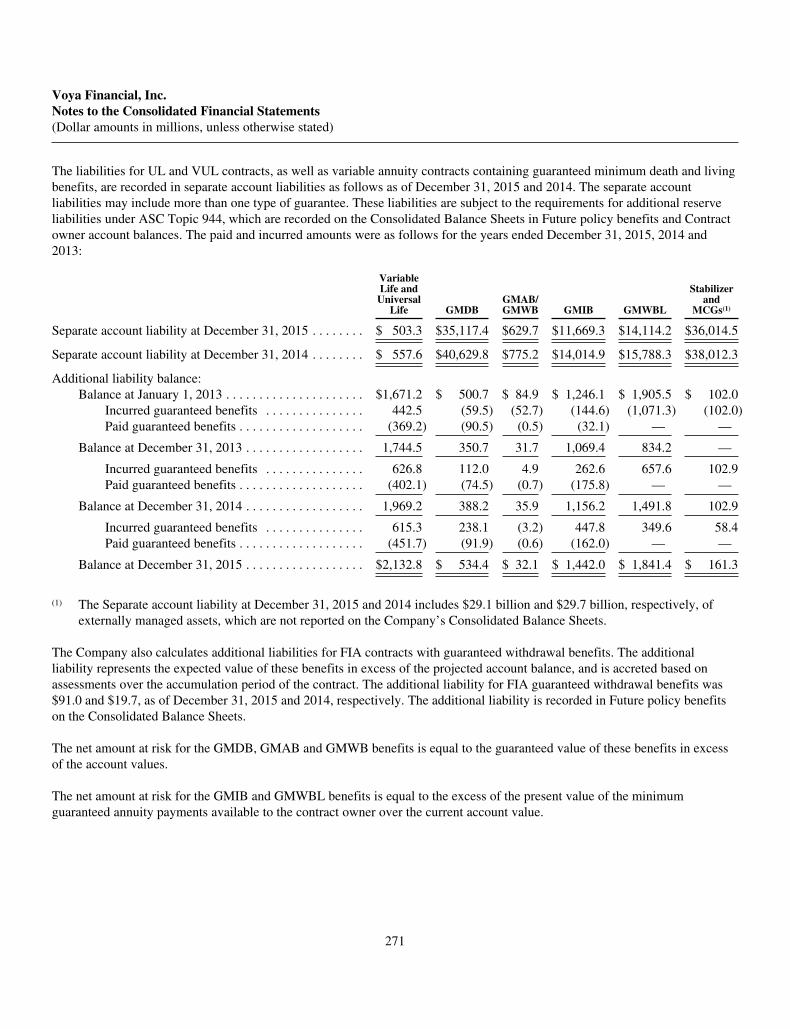
Voya Financial, Inc.Notes to the Consolidated Financial Statements(Dollar amounts in millions, unless otherwise stated)
The liabilities for UL and VUL contracts, as well as variable annuity contracts containing guaranteed minimum death and livingbenefits, are recorded in separate account liabilities as follows as of December 31, 2015 and 2014. The separate accountliabilities may include more than one type of guarantee. These liabilities are subject to the requirements for additional reserveliabilities under ASC Topic 944, which are recorded on the Consolidated Balance Sheets in Future policy benefits and Contractowner account balances. The paid and incurred amounts were as follows for the years ended December 31, 2015, 2014 and2013:
VariableLife and
UniversalLife GMDB
GMAB/GMWB GMIB GMWBL
Stabilizerand
MCGs(1)
Separate account liability at December 31, 2015 . . . . . . . . $ 503.3 $35,117.4 $629.7 $11,669.3 $14,114.2 $36,014.5
Separate account liability at December 31, 2014 . . . . . . . . $ 557.6 $40,629.8 $775.2 $14,014.9 $15,788.3 $38,012.3
Additional liability balance:Balance at January 1, 2013 . . . . . . . . . . . . . . . . . . . . . $1,671.2 $ 500.7 $ 84.9 $ 1,246.1 $ 1,905.5 $ 102.0
Incurred guaranteed benefits . . . . . . . . . . . . . . . 442.5 (59.5) (52.7) (144.6) (1,071.3) (102.0)Paid guaranteed benefits . . . . . . . . . . . . . . . . . . . (369.2) (90.5) (0.5) (32.1) — —
Balance at December 31, 2013 . . . . . . . . . . . . . . . . . . 1,744.5 350.7 31.7 1,069.4 834.2 —
Incurred guaranteed benefits . . . . . . . . . . . . . . . 626.8 112.0 4.9 262.6 657.6 102.9Paid guaranteed benefits . . . . . . . . . . . . . . . . . . . (402.1) (74.5) (0.7) (175.8) — —
Balance at December 31, 2014 . . . . . . . . . . . . . . . . . . 1,969.2 388.2 35.9 1,156.2 1,491.8 102.9
Incurred guaranteed benefits . . . . . . . . . . . . . . . 615.3 238.1 (3.2) 447.8 349.6 58.4Paid guaranteed benefits . . . . . . . . . . . . . . . . . . . (451.7) (91.9) (0.6) (162.0) — —
Balance at December 31, 2015 . . . . . . . . . . . . . . . . . . $2,132.8 $ 534.4 $ 32.1 $ 1,442.0 $ 1,841.4 $ 161.3
(1) The Separate account liability at December 31, 2015 and 2014 includes $29.1 billion and $29.7 billion, respectively, ofexternally managed assets, which are not reported on the Company’s Consolidated Balance Sheets.
The Company also calculates additional liabilities for FIA contracts with guaranteed withdrawal benefits. The additionalliability represents the expected value of these benefits in excess of the projected account balance, and is accreted based onassessments over the accumulation period of the contract. The additional liability for FIA guaranteed withdrawal benefits was$91.0 and $19.7, as of December 31, 2015 and 2014, respectively. The additional liability is recorded in Future policy benefitson the Consolidated Balance Sheets.
The net amount at risk for the GMDB, GMAB and GMWB benefits is equal to the guaranteed value of these benefits in excessof the account values.
The net amount at risk for the GMIB and GMWBL benefits is equal to the excess of the present value of the minimumguaranteed annuity payments available to the contract owner over the current account value.
271
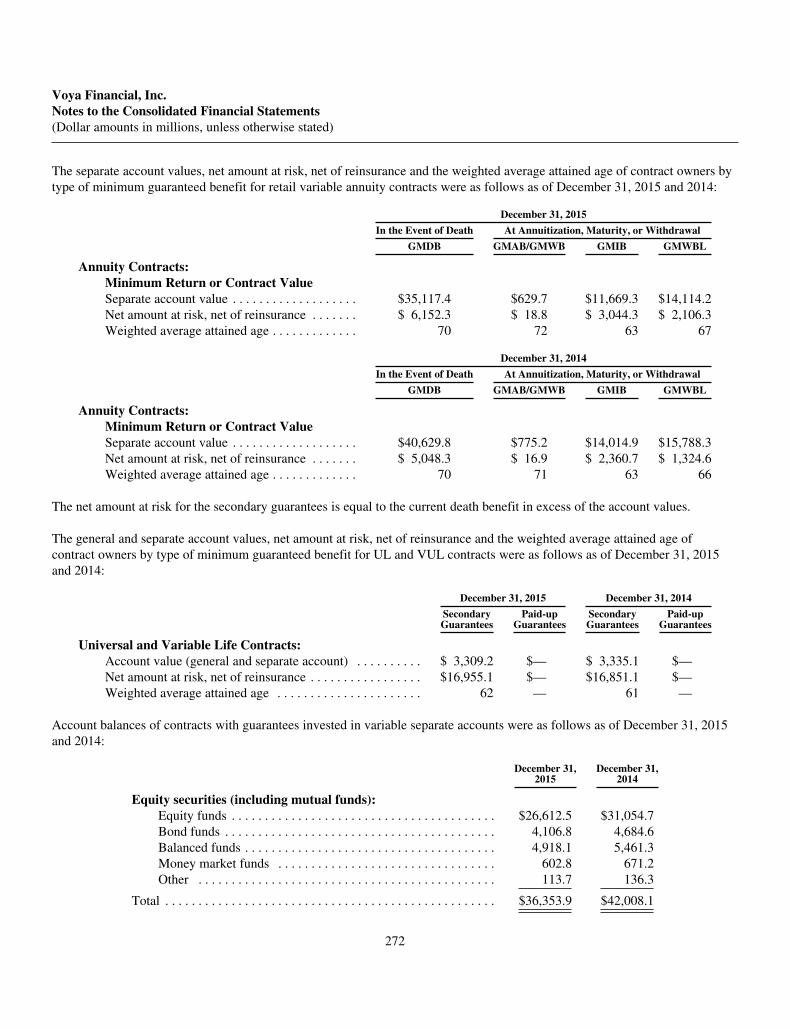
Voya Financial, Inc.Notes to the Consolidated Financial Statements(Dollar amounts in millions, unless otherwise stated)
The separate account values, net amount at risk, net of reinsurance and the weighted average attained age of contract owners bytype of minimum guaranteed benefit for retail variable annuity contracts were as follows as of December 31, 2015 and 2014:
December 31, 2015
In the Event of Death At Annuitization, Maturity, or Withdrawal
GMDB GMAB/GMWB GMIB GMWBL
Annuity Contracts:Minimum Return or Contract ValueSeparate account value . . . . . . . . . . . . . . . . . . . $35,117.4 $629.7 $11,669.3 $14,114.2Net amount at risk, net of reinsurance . . . . . . . $ 6,152.3 $ 18.8 $ 3,044.3 $ 2,106.3Weighted average attained age . . . . . . . . . . . . . 70 72 63 67
December 31, 2014
In the Event of Death At Annuitization, Maturity, or Withdrawal
GMDB GMAB/GMWB GMIB GMWBL
Annuity Contracts:Minimum Return or Contract ValueSeparate account value . . . . . . . . . . . . . . . . . . . $40,629.8 $775.2 $14,014.9 $15,788.3Net amount at risk, net of reinsurance . . . . . . . $ 5,048.3 $ 16.9 $ 2,360.7 $ 1,324.6Weighted average attained age . . . . . . . . . . . . . 70 71 63 66
The net amount at risk for the secondary guarantees is equal to the current death benefit in excess of the account values.
The general and separate account values, net amount at risk, net of reinsurance and the weighted average attained age ofcontract owners by type of minimum guaranteed benefit for UL and VUL contracts were as follows as of December 31, 2015and 2014:
December 31, 2015 December 31, 2014
SecondaryGuarantees
Paid-upGuarantees
SecondaryGuarantees
Paid-upGuarantees
Universal and Variable Life Contracts:Account value (general and separate account) . . . . . . . . . . $ 3,309.2 $— $ 3,335.1 $—Net amount at risk, net of reinsurance . . . . . . . . . . . . . . . . . $16,955.1 $— $16,851.1 $—Weighted average attained age . . . . . . . . . . . . . . . . . . . . . . 62 — 61 —
Account balances of contracts with guarantees invested in variable separate accounts were as follows as of December 31, 2015and 2014:
December 31,2015
December 31,2014
Equity securities (including mutual funds):Equity funds . . . . . . . . . . . . . . . . . . . . . . . . . . . . . . . . . . . . . . . . $26,612.5 $31,054.7Bond funds . . . . . . . . . . . . . . . . . . . . . . . . . . . . . . . . . . . . . . . . . 4,106.8 4,684.6Balanced funds . . . . . . . . . . . . . . . . . . . . . . . . . . . . . . . . . . . . . . 4,918.1 5,461.3Money market funds . . . . . . . . . . . . . . . . . . . . . . . . . . . . . . . . . 602.8 671.2Other . . . . . . . . . . . . . . . . . . . . . . . . . . . . . . . . . . . . . . . . . . . . . 113.7 136.3
Total . . . . . . . . . . . . . . . . . . . . . . . . . . . . . . . . . . . . . . . . . . . . . . . . . . $36,353.9 $42,008.1
272

Voya Financial, Inc.Notes to the Consolidated Financial Statements(Dollar amounts in millions, unless otherwise stated)
In addition, the aggregate fair value of fixed income securities supporting separate accounts with Stabilizer benefits as ofDecember 31, 2015 and 2014 was $6.9 billion and $8.3 billion, respectively.
8. Reinsurance
The Company has reinsurance treaties covering a portion of the mortality risks and guaranteed death and living benefits underits life insurance and annuity contracts. The Company remains liable to the extent its reinsurers do not meet their obligationsunder the reinsurance agreements.
The Company reinsures its business through a diversified group of reinsurers. The Company monitors trends in arbitration andany litigation outcomes with its reinsurers. Collectability of reinsurance balances are evaluated by monitoring ratings andevaluating the financial strength of its reinsurers. Large reinsurance recoverable balances with offshore or other non-accreditedreinsurers are secured through various forms of collateral, including secured trusts, funds withheld accounts and irrevocableletters of credit (“LOC”).
Information regarding the effect of reinsurance is as follows as of the periods indicated:
December 31, 2015
Direct Assumed Ceded
Total,Net of
Reinsurance
AssetsPremiums receivable . . . . . . . . . . . . . . . . . . . . . . . . . . . . . . . . . . . . . . . . . . . $ 98.5 $ 387.6 $ (453.0) $ 33.1Reinsurance recoverable . . . . . . . . . . . . . . . . . . . . . . . . . . . . . . . . . . . . . . . . — — 7,653.7 7,653.7
Total . . . . . . . . . . . . . . . . . . . . . . . . . . . . . . . . . . . . . . . . . . . . . . . . . . . . . . . . . . . $ 98.5 $ 387.6 $ 7,200.7 $ 7,686.8
LiabilitiesFuture policy benefits and contract owner account balances . . . . . . . . . . . . $84,653.9 $3,518.2 $(7,653.7) $80,518.4Liability for funds withheld under reinsurance agreements . . . . . . . . . . . . . 702.4 — — 702.4
Total . . . . . . . . . . . . . . . . . . . . . . . . . . . . . . . . . . . . . . . . . . . . . . . . . . . . . . . . . . . $85,356.3 $3,518.2 $(7,653.7) $81,220.8
December 31, 2014
Direct Assumed Ceded
Total,Net of
Reinsurance
AssetsPremiums receivable . . . . . . . . . . . . . . . . . . . . . . . . . . . . . . . . . . . . . . . . . . . $ 98.0 $ 393.1 $ (444.4) $ 46.7Reinsurance recoverable . . . . . . . . . . . . . . . . . . . . . . . . . . . . . . . . . . . . . . . . — — 7,116.9 7,116.9
Total . . . . . . . . . . . . . . . . . . . . . . . . . . . . . . . . . . . . . . . . . . . . . . . . . . . . . . . . . . . $ 98.0 $ 393.1 $ 6,672.5 $ 7,163.6
LiabilitiesFuture policy benefits and contract owner account balances . . . . . . . . . . . . $81,237.8 $3,713.9 $(7,116.9) $77,834.8Liability for funds withheld under reinsurance agreements . . . . . . . . . . . . . 1,159.6 — — 1,159.6
Total . . . . . . . . . . . . . . . . . . . . . . . . . . . . . . . . . . . . . . . . . . . . . . . . . . . . . . . . . . . $82,397.4 $3,713.9 $(7,116.9) $78,994.4
273
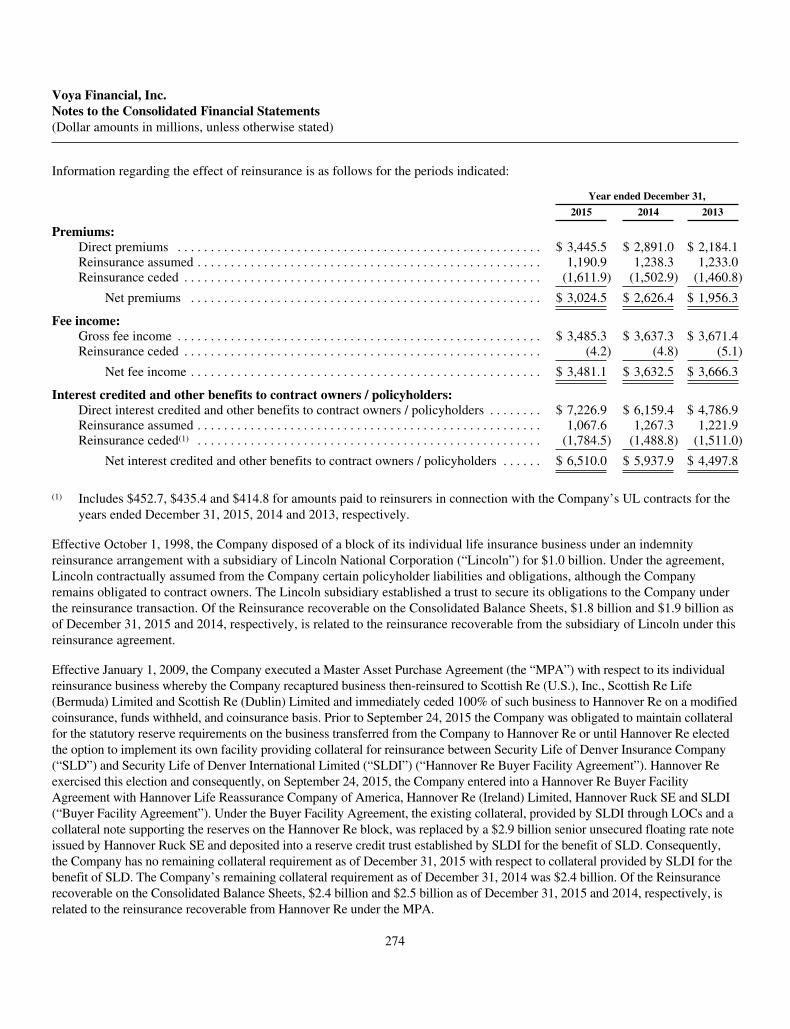
Voya Financial, Inc.Notes to the Consolidated Financial Statements(Dollar amounts in millions, unless otherwise stated)
Information regarding the effect of reinsurance is as follows for the periods indicated:
Year ended December 31,
2015 2014 2013
Premiums:Direct premiums . . . . . . . . . . . . . . . . . . . . . . . . . . . . . . . . . . . . . . . . . . . . . . . . . . . . . . . $ 3,445.5 $ 2,891.0 $ 2,184.1Reinsurance assumed . . . . . . . . . . . . . . . . . . . . . . . . . . . . . . . . . . . . . . . . . . . . . . . . . . . . 1,190.9 1,238.3 1,233.0Reinsurance ceded . . . . . . . . . . . . . . . . . . . . . . . . . . . . . . . . . . . . . . . . . . . . . . . . . . . . . . (1,611.9) (1,502.9) (1,460.8)
Net premiums . . . . . . . . . . . . . . . . . . . . . . . . . . . . . . . . . . . . . . . . . . . . . . . . . . . . . $ 3,024.5 $ 2,626.4 $ 1,956.3
Fee income:Gross fee income . . . . . . . . . . . . . . . . . . . . . . . . . . . . . . . . . . . . . . . . . . . . . . . . . . . . . . . $ 3,485.3 $ 3,637.3 $ 3,671.4Reinsurance ceded . . . . . . . . . . . . . . . . . . . . . . . . . . . . . . . . . . . . . . . . . . . . . . . . . . . . . . (4.2) (4.8) (5.1)
Net fee income . . . . . . . . . . . . . . . . . . . . . . . . . . . . . . . . . . . . . . . . . . . . . . . . . . . . . $ 3,481.1 $ 3,632.5 $ 3,666.3
Interest credited and other benefits to contract owners / policyholders:Direct interest credited and other benefits to contract owners / policyholders . . . . . . . . $ 7,226.9 $ 6,159.4 $ 4,786.9Reinsurance assumed . . . . . . . . . . . . . . . . . . . . . . . . . . . . . . . . . . . . . . . . . . . . . . . . . . . . 1,067.6 1,267.3 1,221.9Reinsurance ceded(1) . . . . . . . . . . . . . . . . . . . . . . . . . . . . . . . . . . . . . . . . . . . . . . . . . . . . (1,784.5) (1,488.8) (1,511.0)
Net interest credited and other benefits to contract owners / policyholders . . . . . . $ 6,510.0 $ 5,937.9 $ 4,497.8
(1) Includes $452.7, $435.4 and $414.8 for amounts paid to reinsurers in connection with the Company’s UL contracts for theyears ended December 31, 2015, 2014 and 2013, respectively.
Effective October 1, 1998, the Company disposed of a block of its individual life insurance business under an indemnityreinsurance arrangement with a subsidiary of Lincoln National Corporation (“Lincoln”) for $1.0 billion. Under the agreement,Lincoln contractually assumed from the Company certain policyholder liabilities and obligations, although the Companyremains obligated to contract owners. The Lincoln subsidiary established a trust to secure its obligations to the Company underthe reinsurance transaction. Of the Reinsurance recoverable on the Consolidated Balance Sheets, $1.8 billion and $1.9 billion asof December 31, 2015 and 2014, respectively, is related to the reinsurance recoverable from the subsidiary of Lincoln under thisreinsurance agreement.
Effective January 1, 2009, the Company executed a Master Asset Purchase Agreement (the “MPA”) with respect to its individualreinsurance business whereby the Company recaptured business then-reinsured to Scottish Re (U.S.), Inc., Scottish Re Life(Bermuda) Limited and Scottish Re (Dublin) Limited and immediately ceded 100% of such business to Hannover Re on a modifiedcoinsurance, funds withheld, and coinsurance basis. Prior to September 24, 2015 the Company was obligated to maintain collateralfor the statutory reserve requirements on the business transferred from the Company to Hannover Re or until Hannover Re electedthe option to implement its own facility providing collateral for reinsurance between Security Life of Denver Insurance Company(“SLD”) and Security Life of Denver International Limited (“SLDI”) (“Hannover Re Buyer Facility Agreement”). Hannover Reexercised this election and consequently, on September 24, 2015, the Company entered into a Hannover Re Buyer FacilityAgreement with Hannover Life Reassurance Company of America, Hannover Re (Ireland) Limited, Hannover Ruck SE and SLDI(“Buyer Facility Agreement”). Under the Buyer Facility Agreement, the existing collateral, provided by SLDI through LOCs and acollateral note supporting the reserves on the Hannover Re block, was replaced by a $2.9 billion senior unsecured floating rate noteissued by Hannover Ruck SE and deposited into a reserve credit trust established by SLDI for the benefit of SLD. Consequently,the Company has no remaining collateral requirement as of December 31, 2015 with respect to collateral provided by SLDI for thebenefit of SLD. The Company’s remaining collateral requirement as of December 31, 2014 was $2.4 billion. Of the Reinsurancerecoverable on the Consolidated Balance Sheets, $2.4 billion and $2.5 billion as of December 31, 2015 and 2014, respectively, isrelated to the reinsurance recoverable from Hannover Re under the MPA.
274

Voya Financial, Inc.Notes to the Consolidated Financial Statements(Dollar amounts in millions, unless otherwise stated)
Effective October 1, 2014, the Company disposed of an in-force block of term life insurance policies to RGA ReinsuranceCompany, a subsidiary of Reinsurance Group of America, Inc., (“RGA”) under an indemnity reinsurance arrangement for$448.1. Under the agreement, RGA contractually assumed from the Company the policyholder liabilities and obligations relatedto the policies, although the Company remains obligated to policyholders. The Company recognized a loss of $89.4, composedof $32.8 in Other net realized capital gains on assets included in the transaction, $11.4 in Other-than-temporary impairmentsrelated to intent and $110.8 of transaction and ongoing expenses, recorded in Operating expenses in the ConsolidatedStatements of Operations for the year ended December 31, 2014. As of December 31, 2015 and 2014, the Reinsurancerecoverable on the Consolidated Balance Sheets related to the Term Life Coinsurance Agreement was $517.8 and $461.3,respectively.
Effective April 1, 2015, the Company disposed of, via reinsurance, retained group reinsurance policies to Enstar Group Ltd. for$304.5. In connection with this transaction, the Company recognized a loss of $39.2, primarily related to intent impairments ofassets included in the transaction and other transactions costs. As of December 31, 2015, the Reinsurance recoverable on theConsolidated Balance Sheets related to this transaction was $263.4.
Effective October 1, 2015, the Company disposed of, via reinsurance, an in-force block of term life insurance policies to RGAReinsurance Company for $419.2. Under the terms of the agreement, RGA Reinsurance Company contractually assumed fromthe Company the policyholder liabilities and obligations related to the policies, although the Company remains obligated topolicyholders. The Company recognized a loss of $109.8, composed of $13.7 in Other net realized capital gains on assetsincluded in the transaction, $3.6 in Other-than-temporary impairments related to intent and $119.9 of transaction and ongoingexpenses recorded in Operating expenses in the Consolidated Statements of Operations for the year ended December 31, 2015.As of December 31, 2015, the Reinsurance recoverable on the Consolidated Balance Sheets related to this agreement was$462.3.
9. Goodwill and Other Intangible Assets
Goodwill
Goodwill is the excess of cost over the estimated fair value of net assets acquired. As of December 31, 2015 and 2014, theCompany had $31.1 in goodwill, which was related to the Investment Management segment. There is no accumulatedimpairment balance associated with this goodwill. The Company performs a goodwill impairment analysis annually as ofOctober 1 and more frequently if facts and circumstances indicate that goodwill may be impaired.
Other Intangible Assets
The Company has the following assets included in Other intangible assets, which have been capitalized and are amortized overtheir expected economic lives.
The Company recorded Value of Management Contracts (“VMCR”) from the acquisition of ReliaStar Life Insurance Companyin 2000 that represent the right by the mutual fund advisor company to manage the assets that are held in the mutual fundsbusiness.
Customer relationship lists from the acquisition of CitiStreet, LLC in 2008 represent Value of Customer Relationship Acquired(“VOCRA”) for contracts with customers that were in place at the time of the acquisition.
In addition, computer software that has been purchased or developed internally for own use is stated at cost, less amortizationand any impairment losses. Amortization is calculated on a straight-line basis over its useful life. When assessing potentialimpairment, the unamortized capitalized costs are compared with the net realizable value of the computer software. The amountby which the unamortized capitalized costs exceed the net realizable value is written off.
275
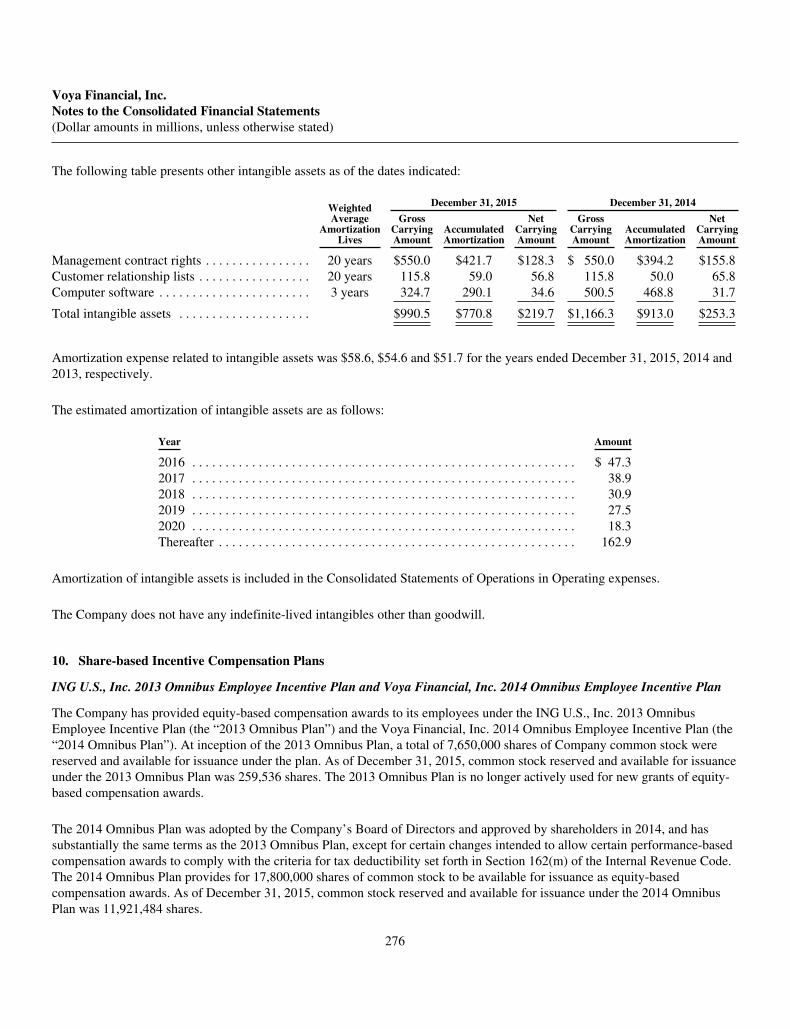
Voya Financial, Inc.Notes to the Consolidated Financial Statements(Dollar amounts in millions, unless otherwise stated)
The following table presents other intangible assets as of the dates indicated:
WeightedAverage
AmortizationLives
December 31, 2015 December 31, 2014
GrossCarryingAmount
AccumulatedAmortization
NetCarryingAmount
GrossCarryingAmount
AccumulatedAmortization
NetCarryingAmount
Management contract rights . . . . . . . . . . . . . . . . 20 years $550.0 $421.7 $128.3 $ 550.0 $394.2 $155.8Customer relationship lists . . . . . . . . . . . . . . . . . 20 years 115.8 59.0 56.8 115.8 50.0 65.8Computer software . . . . . . . . . . . . . . . . . . . . . . . 3 years 324.7 290.1 34.6 500.5 468.8 31.7
Total intangible assets . . . . . . . . . . . . . . . . . . . . $990.5 $770.8 $219.7 $1,166.3 $913.0 $253.3
Amortization expense related to intangible assets was $58.6, $54.6 and $51.7 for the years ended December 31, 2015, 2014 and2013, respectively.
The estimated amortization of intangible assets are as follows:
Year Amount
2016 . . . . . . . . . . . . . . . . . . . . . . . . . . . . . . . . . . . . . . . . . . . . . . . . . . . . . . . . . . $ 47.32017 . . . . . . . . . . . . . . . . . . . . . . . . . . . . . . . . . . . . . . . . . . . . . . . . . . . . . . . . . . 38.92018 . . . . . . . . . . . . . . . . . . . . . . . . . . . . . . . . . . . . . . . . . . . . . . . . . . . . . . . . . . 30.92019 . . . . . . . . . . . . . . . . . . . . . . . . . . . . . . . . . . . . . . . . . . . . . . . . . . . . . . . . . . 27.52020 . . . . . . . . . . . . . . . . . . . . . . . . . . . . . . . . . . . . . . . . . . . . . . . . . . . . . . . . . . 18.3Thereafter . . . . . . . . . . . . . . . . . . . . . . . . . . . . . . . . . . . . . . . . . . . . . . . . . . . . . . 162.9
Amortization of intangible assets is included in the Consolidated Statements of Operations in Operating expenses.
The Company does not have any indefinite-lived intangibles other than goodwill.
10. Share-based Incentive Compensation Plans
ING U.S., Inc. 2013 Omnibus Employee Incentive Plan and Voya Financial, Inc. 2014 Omnibus Employee Incentive Plan
The Company has provided equity-based compensation awards to its employees under the ING U.S., Inc. 2013 OmnibusEmployee Incentive Plan (the “2013 Omnibus Plan”) and the Voya Financial, Inc. 2014 Omnibus Employee Incentive Plan (the“2014 Omnibus Plan”). At inception of the 2013 Omnibus Plan, a total of 7,650,000 shares of Company common stock werereserved and available for issuance under the plan. As of December 31, 2015, common stock reserved and available for issuanceunder the 2013 Omnibus Plan was 259,536 shares. The 2013 Omnibus Plan is no longer actively used for new grants of equity-based compensation awards.
The 2014 Omnibus Plan was adopted by the Company’s Board of Directors and approved by shareholders in 2014, and hassubstantially the same terms as the 2013 Omnibus Plan, except for certain changes intended to allow certain performance-basedcompensation awards to comply with the criteria for tax deductibility set forth in Section 162(m) of the Internal Revenue Code.The 2014 Omnibus Plan provides for 17,800,000 shares of common stock to be available for issuance as equity-basedcompensation awards. As of December 31, 2015, common stock reserved and available for issuance under the 2014 OmnibusPlan was 11,921,484 shares.
276

Voya Financial, Inc.Notes to the Consolidated Financial Statements(Dollar amounts in millions, unless otherwise stated)
The 2013 Omnibus Plan and the 2014 Omnibus Plan (together, the “Omnibus Plans”) each permit the granting of a wide rangeof equity-based awards, including restricted stock units (“RSUs”), which represent the right to receive a number of shares ofCompany common stock upon vesting; restricted stock, which are shares of Company stock that are issued subject to sale andtransfer restrictions until the vesting conditions are met; performance share units (“PSUs”), which are RSUs subject to certainperformance-based vesting conditions, and under which the number of shares of common stock delivered upon vesting varieswith the level of achievement of performance criteria; and stock options. Grants of equity-based awards under the OmnibusPlans are approved in advance by the Compensation and Benefits Committee (the “Committee”) of the Board of Directors of theCompany, and are subject to such terms and conditions as the Committee may determine, including in respect of vesting andforfeiture, subject to certain limitations provided in the Omnibus Plans. Equity-based awards under the Omnibus Plans maycarry dividend equivalent rights, pursuant to which notional dividends accumulate on unvested equity awards and are paid, incash, upon vesting. Except for stock option awards made during 2015, awards made under the Omnibus Plans, to date, haveincluded dividend equivalent rights. Dividend equivalents are credited to the recipient and are paid only to the extent theapplicable performance criteria and service conditions are met.
During each of the years ended December 31, 2015, 2014 and 2013 the Company awarded RSUs and PSUs to its employeesunder the Omnibus Plans. The PSU awards entitle recipients to receive, upon vesting, a number of shares of common stock thatranges from 0% to 150% of the number of PSUs awarded, depending on the level of achievement of the specified performanceconditions. The establishment and the achievement of performance objectives are determined and approved by the Committee.Except under certain termination conditions, RSUs and PSUs generally vest no earlier than one year from the date of the awardand no later than three years from the date of the award. In the case of retirement (eligibility for which is based on theemployee’s age and years of service as provided in the relevant award agreement), awards vest in full, but subject to thesatisfaction of any applicable performance criteria.
During the year ended December 31, 2015, the Company also awarded contingent stock options under the 2014 Omnibus Plan.These options are subject to vesting conditions based on the achievement of specified performance measures, and generallybecome exercisable one year following satisfaction of the relevant vesting condition. The options have a term of ten years fromthe grant date, but to the extent that the relevant vesting condition has not been met by December 31, 2018, any unvestedoptions will expire without value. If vested, the options have an exercise price of $37.60 per share.
If an award under the Omnibus Plans is forfeited, expired, terminated or otherwise lapses, the shares of Company common stockunderlying that award will again become available for issuance. Shares withheld by the Company to pay employee taxes, orwhich are withheld by or tendered to the Company to pay the exercise price of stock options (or are repurchased from an optionholder by the Company with proceeds from the exercise of stock options) are not available for reissuance.
Deal Incentive Awards: Upon closing of the IPO, RSUs were granted to employees of the Company under the 2013 Omnibus Planin connection with Deal Incentive Awards. Deal Incentive Awards are conditional agreements to grant equity awards to certainemployees of the Company, upon the closing of the IPO or upon the satisfaction of certain other conditions. RSUs granted inconnection with Deal Incentive Awards were subject to certain vesting conditions, lockup period and other holding requirements.
During the years ended December 31, 2015 and 2014, 70,880 and 952,528 RSUs granted in connection with Deal IncentiveAwards vested, respectively, and the underlying stock was issued.
Voya Financial, Inc. 2013 Omnibus Non-Employee Director Incentive Plan
The Company offers equity-based awards to Voya Financial, Inc. non-employee directors under the Voya Financial, Inc. 2013Omnibus Non-Employee Director Incentive Plan (“2013 Director Plan”), which the Company adopted in connection with theIPO. A total of 288,000 shares of Company common stock may be issued under the 2013 Director Plan. The material terms ofthe 2013 Director Plan are substantially consistent with the material terms of the 2013 Omnibus Plan described above.
Non-Employee Director Service Grants: During the years ended December 31, 2015, 2014, and 2013, the Company granted19,913, 13,404 and 10,932 RSUs, respectively, to certain of its non-employee directors. These awards vest one-third on each ofthe first, second and third anniversary of the grant date, in each case provided that the grantee remains a director of theCompany on the relevant vesting date, however no shares are delivered in connection with the RSUs until such time as thedirector’s service on the Board is terminated.
277
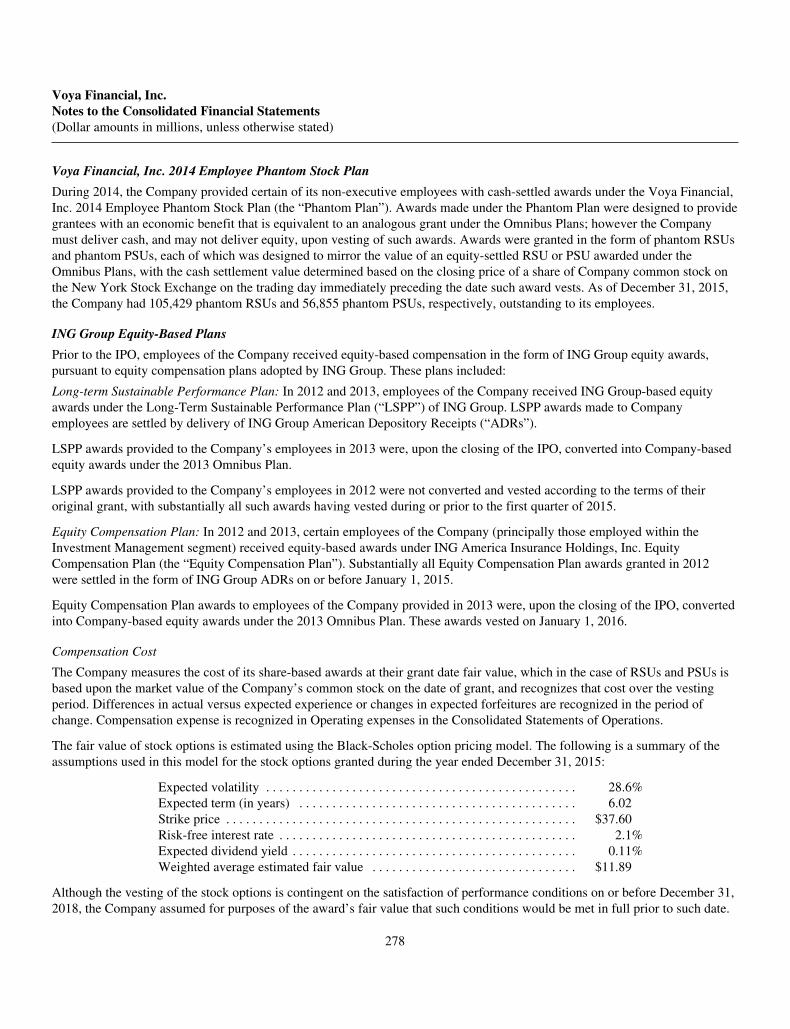
Voya Financial, Inc.Notes to the Consolidated Financial Statements(Dollar amounts in millions, unless otherwise stated)
Voya Financial, Inc. 2014 Employee Phantom Stock Plan
During 2014, the Company provided certain of its non-executive employees with cash-settled awards under the Voya Financial,Inc. 2014 Employee Phantom Stock Plan (the “Phantom Plan”). Awards made under the Phantom Plan were designed to providegrantees with an economic benefit that is equivalent to an analogous grant under the Omnibus Plans; however the Companymust deliver cash, and may not deliver equity, upon vesting of such awards. Awards were granted in the form of phantom RSUsand phantom PSUs, each of which was designed to mirror the value of an equity-settled RSU or PSU awarded under theOmnibus Plans, with the cash settlement value determined based on the closing price of a share of Company common stock onthe New York Stock Exchange on the trading day immediately preceding the date such award vests. As of December 31, 2015,the Company had 105,429 phantom RSUs and 56,855 phantom PSUs, respectively, outstanding to its employees.
ING Group Equity-Based Plans
Prior to the IPO, employees of the Company received equity-based compensation in the form of ING Group equity awards,pursuant to equity compensation plans adopted by ING Group. These plans included:
Long-term Sustainable Performance Plan: In 2012 and 2013, employees of the Company received ING Group-based equityawards under the Long-Term Sustainable Performance Plan (“LSPP”) of ING Group. LSPP awards made to Companyemployees are settled by delivery of ING Group American Depository Receipts (“ADRs”).
LSPP awards provided to the Company’s employees in 2013 were, upon the closing of the IPO, converted into Company-basedequity awards under the 2013 Omnibus Plan.
LSPP awards provided to the Company’s employees in 2012 were not converted and vested according to the terms of theiroriginal grant, with substantially all such awards having vested during or prior to the first quarter of 2015.
Equity Compensation Plan: In 2012 and 2013, certain employees of the Company (principally those employed within theInvestment Management segment) received equity-based awards under ING America Insurance Holdings, Inc. EquityCompensation Plan (the “Equity Compensation Plan”). Substantially all Equity Compensation Plan awards granted in 2012were settled in the form of ING Group ADRs on or before January 1, 2015.
Equity Compensation Plan awards to employees of the Company provided in 2013 were, upon the closing of the IPO, convertedinto Company-based equity awards under the 2013 Omnibus Plan. These awards vested on January 1, 2016.
Compensation Cost
The Company measures the cost of its share-based awards at their grant date fair value, which in the case of RSUs and PSUs isbased upon the market value of the Company’s common stock on the date of grant, and recognizes that cost over the vestingperiod. Differences in actual versus expected experience or changes in expected forfeitures are recognized in the period ofchange. Compensation expense is recognized in Operating expenses in the Consolidated Statements of Operations.
The fair value of stock options is estimated using the Black-Scholes option pricing model. The following is a summary of theassumptions used in this model for the stock options granted during the year ended December 31, 2015:
Expected volatility . . . . . . . . . . . . . . . . . . . . . . . . . . . . . . . . . . . . . . . . . . . . . . . 28.6%Expected term (in years) . . . . . . . . . . . . . . . . . . . . . . . . . . . . . . . . . . . . . . . . . . 6.02Strike price . . . . . . . . . . . . . . . . . . . . . . . . . . . . . . . . . . . . . . . . . . . . . . . . . . . . . $37.60Risk-free interest rate . . . . . . . . . . . . . . . . . . . . . . . . . . . . . . . . . . . . . . . . . . . . . 2.1%Expected dividend yield . . . . . . . . . . . . . . . . . . . . . . . . . . . . . . . . . . . . . . . . . . . 0.11%Weighted average estimated fair value . . . . . . . . . . . . . . . . . . . . . . . . . . . . . . . $11.89
Although the vesting of the stock options is contingent on the satisfaction of performance conditions on or before December 31,2018, the Company assumed for purposes of the award’s fair value that such conditions would be met in full prior to such date.
278
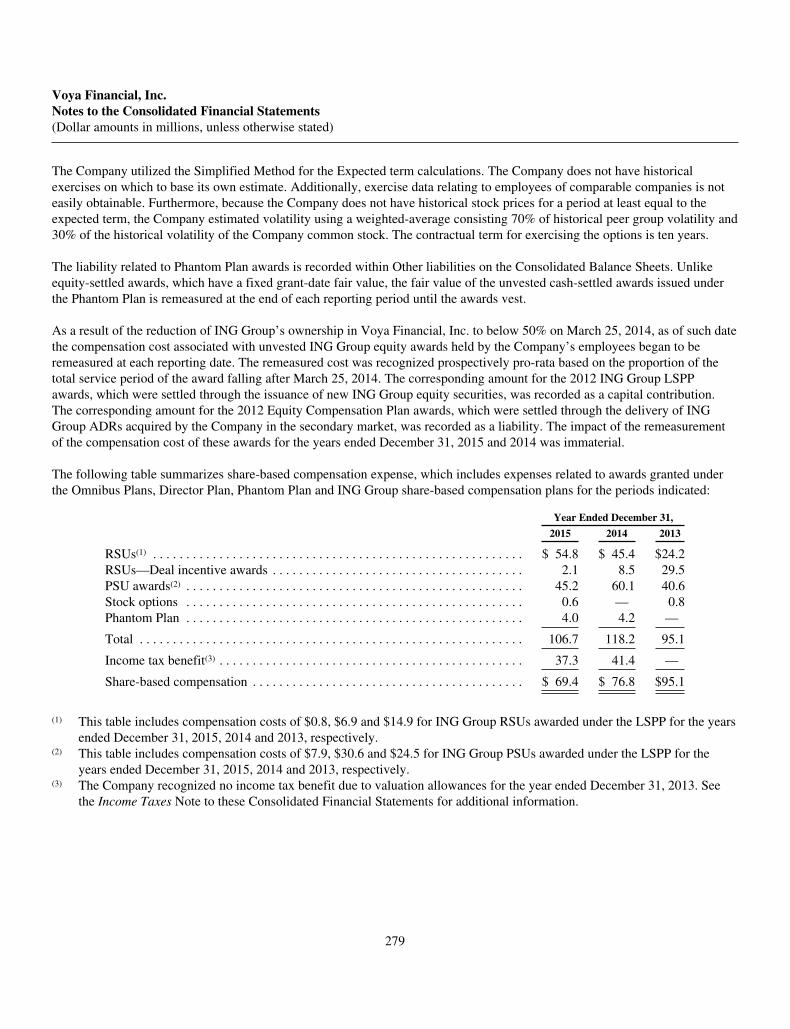
Voya Financial, Inc.Notes to the Consolidated Financial Statements(Dollar amounts in millions, unless otherwise stated)
The Company utilized the Simplified Method for the Expected term calculations. The Company does not have historicalexercises on which to base its own estimate. Additionally, exercise data relating to employees of comparable companies is noteasily obtainable. Furthermore, because the Company does not have historical stock prices for a period at least equal to theexpected term, the Company estimated volatility using a weighted-average consisting 70% of historical peer group volatility and30% of the historical volatility of the Company common stock. The contractual term for exercising the options is ten years.
The liability related to Phantom Plan awards is recorded within Other liabilities on the Consolidated Balance Sheets. Unlikeequity-settled awards, which have a fixed grant-date fair value, the fair value of the unvested cash-settled awards issued underthe Phantom Plan is remeasured at the end of each reporting period until the awards vest.
As a result of the reduction of ING Group’s ownership in Voya Financial, Inc. to below 50% on March 25, 2014, as of such datethe compensation cost associated with unvested ING Group equity awards held by the Company’s employees began to beremeasured at each reporting date. The remeasured cost was recognized prospectively pro-rata based on the proportion of thetotal service period of the award falling after March 25, 2014. The corresponding amount for the 2012 ING Group LSPPawards, which were settled through the issuance of new ING Group equity securities, was recorded as a capital contribution.The corresponding amount for the 2012 Equity Compensation Plan awards, which were settled through the delivery of INGGroup ADRs acquired by the Company in the secondary market, was recorded as a liability. The impact of the remeasurementof the compensation cost of these awards for the years ended December 31, 2015 and 2014 was immaterial.
The following table summarizes share-based compensation expense, which includes expenses related to awards granted underthe Omnibus Plans, Director Plan, Phantom Plan and ING Group share-based compensation plans for the periods indicated:
Year Ended December 31,
2015 2014 2013
RSUs(1) . . . . . . . . . . . . . . . . . . . . . . . . . . . . . . . . . . . . . . . . . . . . . . . . . . . . . . . . $ 54.8 $ 45.4 $24.2RSUs—Deal incentive awards . . . . . . . . . . . . . . . . . . . . . . . . . . . . . . . . . . . . . . 2.1 8.5 29.5PSU awards(2) . . . . . . . . . . . . . . . . . . . . . . . . . . . . . . . . . . . . . . . . . . . . . . . . . . . 45.2 60.1 40.6Stock options . . . . . . . . . . . . . . . . . . . . . . . . . . . . . . . . . . . . . . . . . . . . . . . . . . . 0.6 — 0.8Phantom Plan . . . . . . . . . . . . . . . . . . . . . . . . . . . . . . . . . . . . . . . . . . . . . . . . . . . 4.0 4.2 —
Total . . . . . . . . . . . . . . . . . . . . . . . . . . . . . . . . . . . . . . . . . . . . . . . . . . . . . . . . . . 106.7 118.2 95.1
Income tax benefit(3) . . . . . . . . . . . . . . . . . . . . . . . . . . . . . . . . . . . . . . . . . . . . . . 37.3 41.4 —
Share-based compensation . . . . . . . . . . . . . . . . . . . . . . . . . . . . . . . . . . . . . . . . . $ 69.4 $ 76.8 $95.1
(1) This table includes compensation costs of $0.8, $6.9 and $14.9 for ING Group RSUs awarded under the LSPP for the yearsended December 31, 2015, 2014 and 2013, respectively.
(2) This table includes compensation costs of $7.9, $30.6 and $24.5 for ING Group PSUs awarded under the LSPP for theyears ended December 31, 2015, 2014 and 2013, respectively.
(3) The Company recognized no income tax benefit due to valuation allowances for the year ended December 31, 2013. Seethe Income Taxes Note to these Consolidated Financial Statements for additional information.
279
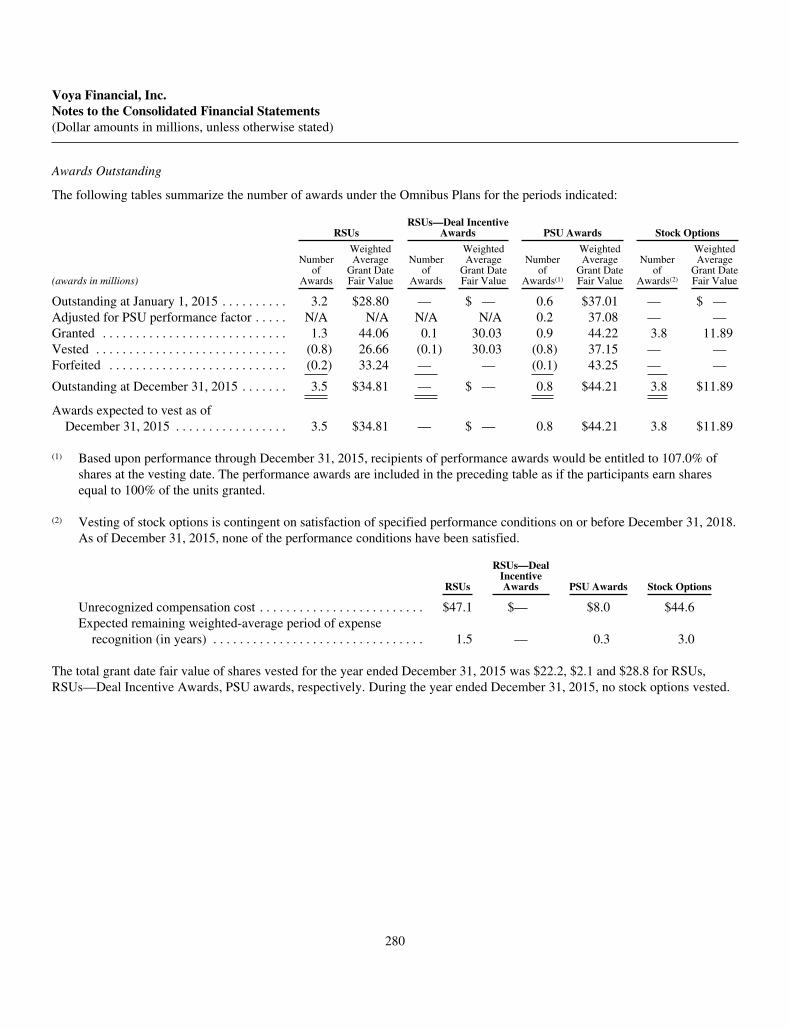
Voya Financial, Inc.Notes to the Consolidated Financial Statements(Dollar amounts in millions, unless otherwise stated)
Awards Outstanding
The following tables summarize the number of awards under the Omnibus Plans for the periods indicated:
RSUsRSUs—Deal Incentive
Awards PSU Awards Stock Options
(awards in millions)
Numberof
Awards
WeightedAverage
Grant DateFair Value
Numberof
Awards
WeightedAverage
Grant DateFair Value
Numberof
Awards(1)
WeightedAverage
Grant DateFair Value
Numberof
Awards(2)
WeightedAverage
Grant DateFair Value
Outstanding at January 1, 2015 . . . . . . . . . . 3.2 $28.80 — $ — 0.6 $37.01 — $ —Adjusted for PSU performance factor . . . . . N/A N/A N/A N/A 0.2 37.08 — —Granted . . . . . . . . . . . . . . . . . . . . . . . . . . . . 1.3 44.06 0.1 30.03 0.9 44.22 3.8 11.89Vested . . . . . . . . . . . . . . . . . . . . . . . . . . . . . (0.8) 26.66 (0.1) 30.03 (0.8) 37.15 — —Forfeited . . . . . . . . . . . . . . . . . . . . . . . . . . . (0.2) 33.24 — — (0.1) 43.25 — —
Outstanding at December 31, 2015 . . . . . . . 3.5 $34.81 — $ — 0.8 $44.21 3.8 $11.89
Awards expected to vest as ofDecember 31, 2015 . . . . . . . . . . . . . . . . . 3.5 $34.81 — $ — 0.8 $44.21 3.8 $11.89
(1) Based upon performance through December 31, 2015, recipients of performance awards would be entitled to 107.0% ofshares at the vesting date. The performance awards are included in the preceding table as if the participants earn sharesequal to 100% of the units granted.
(2) Vesting of stock options is contingent on satisfaction of specified performance conditions on or before December 31, 2018.As of December 31, 2015, none of the performance conditions have been satisfied.
RSUs
RSUs—DealIncentiveAwards PSU Awards Stock Options
Unrecognized compensation cost . . . . . . . . . . . . . . . . . . . . . . . . . $47.1 $— $8.0 $44.6Expected remaining weighted-average period of expense
recognition (in years) . . . . . . . . . . . . . . . . . . . . . . . . . . . . . . . . 1.5 — 0.3 3.0
The total grant date fair value of shares vested for the year ended December 31, 2015 was $22.2, $2.1 and $28.8 for RSUs,RSUs—Deal Incentive Awards, PSU awards, respectively. During the year ended December 31, 2015, no stock options vested.
280
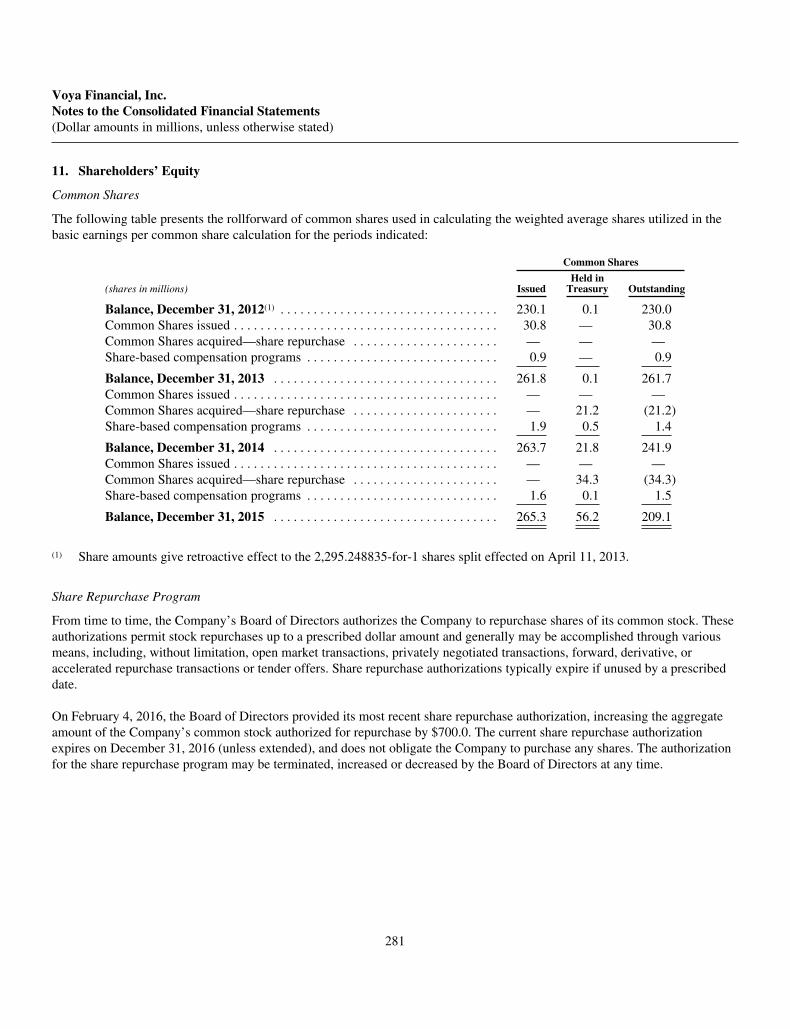
Voya Financial, Inc.Notes to the Consolidated Financial Statements(Dollar amounts in millions, unless otherwise stated)
11. Shareholders’ Equity
Common Shares
The following table presents the rollforward of common shares used in calculating the weighted average shares utilized in thebasic earnings per common share calculation for the periods indicated:
Common Shares
(shares in millions) IssuedHeld in
Treasury Outstanding
Balance, December 31, 2012(1) . . . . . . . . . . . . . . . . . . . . . . . . . . . . . . . . . 230.1 0.1 230.0Common Shares issued . . . . . . . . . . . . . . . . . . . . . . . . . . . . . . . . . . . . . . . . 30.8 — 30.8Common Shares acquired—share repurchase . . . . . . . . . . . . . . . . . . . . . . — — —Share-based compensation programs . . . . . . . . . . . . . . . . . . . . . . . . . . . . . 0.9 — 0.9
Balance, December 31, 2013 . . . . . . . . . . . . . . . . . . . . . . . . . . . . . . . . . . 261.8 0.1 261.7Common Shares issued . . . . . . . . . . . . . . . . . . . . . . . . . . . . . . . . . . . . . . . . — — —Common Shares acquired—share repurchase . . . . . . . . . . . . . . . . . . . . . . — 21.2 (21.2)Share-based compensation programs . . . . . . . . . . . . . . . . . . . . . . . . . . . . . 1.9 0.5 1.4
Balance, December 31, 2014 . . . . . . . . . . . . . . . . . . . . . . . . . . . . . . . . . . 263.7 21.8 241.9Common Shares issued . . . . . . . . . . . . . . . . . . . . . . . . . . . . . . . . . . . . . . . . — — —Common Shares acquired—share repurchase . . . . . . . . . . . . . . . . . . . . . . — 34.3 (34.3)Share-based compensation programs . . . . . . . . . . . . . . . . . . . . . . . . . . . . . 1.6 0.1 1.5
Balance, December 31, 2015 . . . . . . . . . . . . . . . . . . . . . . . . . . . . . . . . . . 265.3 56.2 209.1
(1) Share amounts give retroactive effect to the 2,295.248835-for-1 shares split effected on April 11, 2013.
Share Repurchase Program
From time to time, the Company’s Board of Directors authorizes the Company to repurchase shares of its common stock. Theseauthorizations permit stock repurchases up to a prescribed dollar amount and generally may be accomplished through variousmeans, including, without limitation, open market transactions, privately negotiated transactions, forward, derivative, oraccelerated repurchase transactions or tender offers. Share repurchase authorizations typically expire if unused by a prescribeddate.
On February 4, 2016, the Board of Directors provided its most recent share repurchase authorization, increasing the aggregateamount of the Company’s common stock authorized for repurchase by $700.0. The current share repurchase authorizationexpires on December 31, 2016 (unless extended), and does not obligate the Company to purchase any shares. The authorizationfor the share repurchase program may be terminated, increased or decreased by the Board of Directors at any time.
281
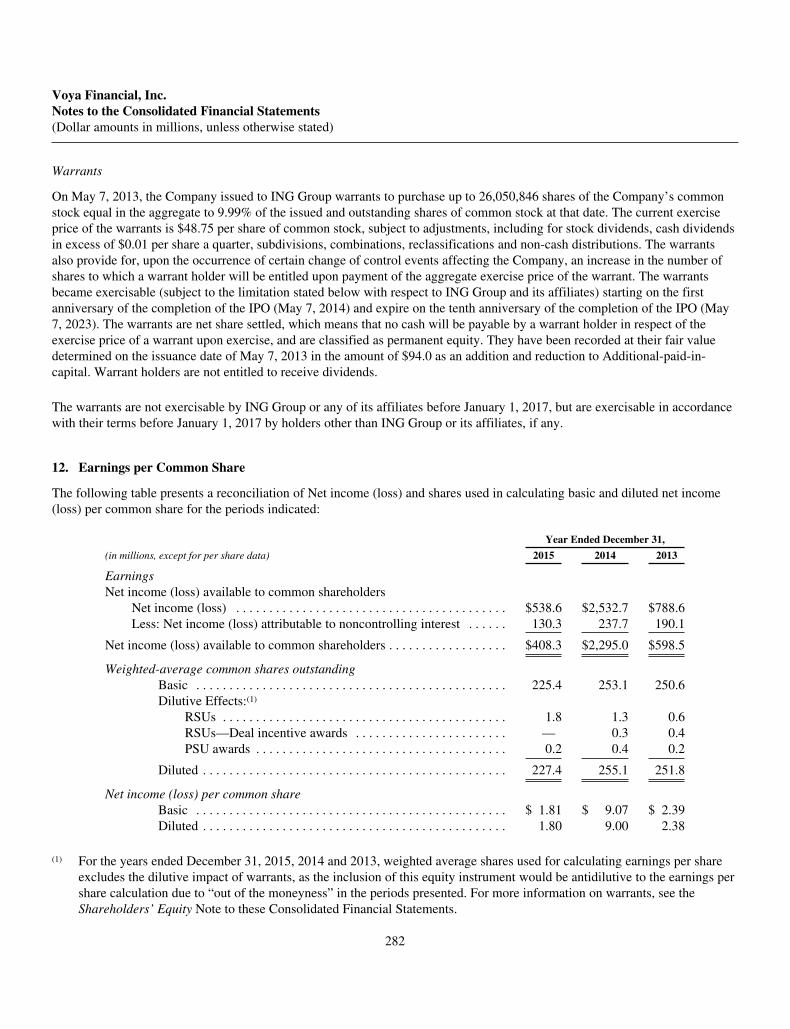
Voya Financial, Inc.Notes to the Consolidated Financial Statements(Dollar amounts in millions, unless otherwise stated)
Warrants
On May 7, 2013, the Company issued to ING Group warrants to purchase up to 26,050,846 shares of the Company’s commonstock equal in the aggregate to 9.99% of the issued and outstanding shares of common stock at that date. The current exerciseprice of the warrants is $48.75 per share of common stock, subject to adjustments, including for stock dividends, cash dividendsin excess of $0.01 per share a quarter, subdivisions, combinations, reclassifications and non-cash distributions. The warrantsalso provide for, upon the occurrence of certain change of control events affecting the Company, an increase in the number ofshares to which a warrant holder will be entitled upon payment of the aggregate exercise price of the warrant. The warrantsbecame exercisable (subject to the limitation stated below with respect to ING Group and its affiliates) starting on the firstanniversary of the completion of the IPO (May 7, 2014) and expire on the tenth anniversary of the completion of the IPO (May7, 2023). The warrants are net share settled, which means that no cash will be payable by a warrant holder in respect of theexercise price of a warrant upon exercise, and are classified as permanent equity. They have been recorded at their fair valuedetermined on the issuance date of May 7, 2013 in the amount of $94.0 as an addition and reduction to Additional-paid-in-capital. Warrant holders are not entitled to receive dividends.
The warrants are not exercisable by ING Group or any of its affiliates before January 1, 2017, but are exercisable in accordancewith their terms before January 1, 2017 by holders other than ING Group or its affiliates, if any.
12. Earnings per Common Share
The following table presents a reconciliation of Net income (loss) and shares used in calculating basic and diluted net income(loss) per common share for the periods indicated:
Year Ended December 31,
(in millions, except for per share data) 2015 2014 2013
EarningsNet income (loss) available to common shareholders
Net income (loss) . . . . . . . . . . . . . . . . . . . . . . . . . . . . . . . . . . . . . . . . . $538.6 $2,532.7 $788.6Less: Net income (loss) attributable to noncontrolling interest . . . . . . 130.3 237.7 190.1
Net income (loss) available to common shareholders . . . . . . . . . . . . . . . . . . $408.3 $2,295.0 $598.5
Weighted-average common shares outstandingBasic . . . . . . . . . . . . . . . . . . . . . . . . . . . . . . . . . . . . . . . . . . . . . . . 225.4 253.1 250.6Dilutive Effects:(1)
RSUs . . . . . . . . . . . . . . . . . . . . . . . . . . . . . . . . . . . . . . . . . . . 1.8 1.3 0.6RSUs—Deal incentive awards . . . . . . . . . . . . . . . . . . . . . . . — 0.3 0.4PSU awards . . . . . . . . . . . . . . . . . . . . . . . . . . . . . . . . . . . . . . 0.2 0.4 0.2
Diluted . . . . . . . . . . . . . . . . . . . . . . . . . . . . . . . . . . . . . . . . . . . . . . 227.4 255.1 251.8
Net income (loss) per common shareBasic . . . . . . . . . . . . . . . . . . . . . . . . . . . . . . . . . . . . . . . . . . . . . . . $ 1.81 $ 9.07 $ 2.39Diluted . . . . . . . . . . . . . . . . . . . . . . . . . . . . . . . . . . . . . . . . . . . . . . 1.80 9.00 2.38
(1) For the years ended December 31, 2015, 2014 and 2013, weighted average shares used for calculating earnings per shareexcludes the dilutive impact of warrants, as the inclusion of this equity instrument would be antidilutive to the earnings pershare calculation due to “out of the moneyness” in the periods presented. For more information on warrants, see theShareholders’ Equity Note to these Consolidated Financial Statements.
282
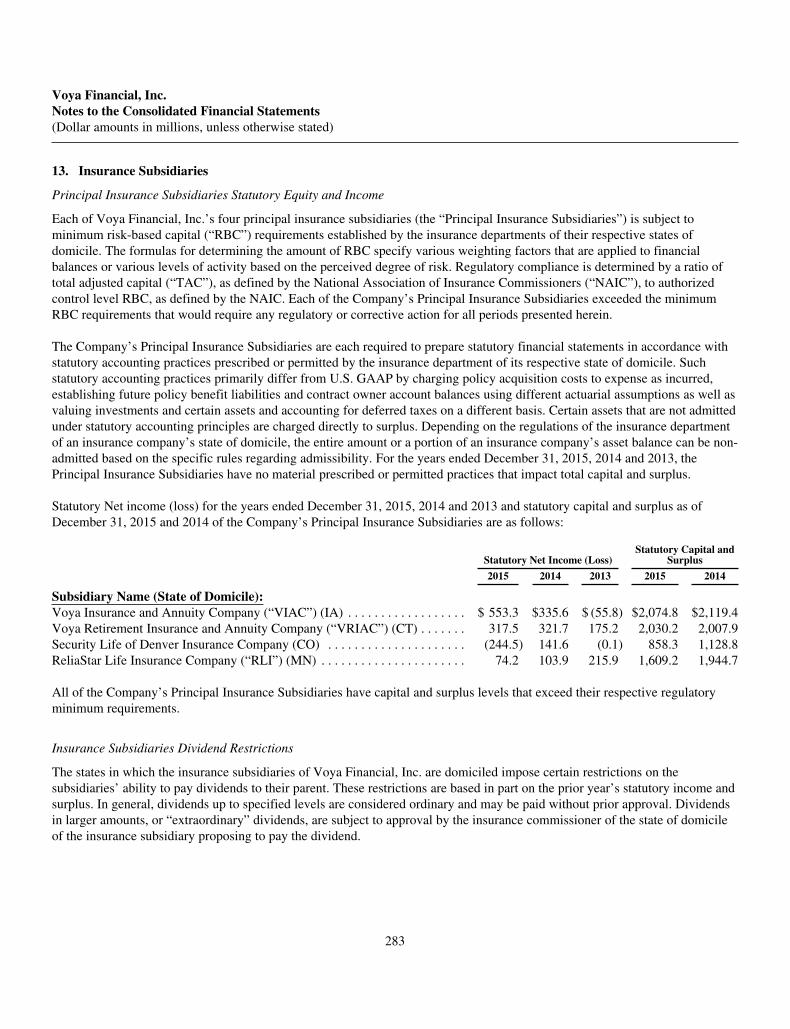
Voya Financial, Inc.Notes to the Consolidated Financial Statements(Dollar amounts in millions, unless otherwise stated)
13. Insurance Subsidiaries
Principal Insurance Subsidiaries Statutory Equity and Income
Each of Voya Financial, Inc.’s four principal insurance subsidiaries (the “Principal Insurance Subsidiaries”) is subject tominimum risk-based capital (“RBC”) requirements established by the insurance departments of their respective states ofdomicile. The formulas for determining the amount of RBC specify various weighting factors that are applied to financialbalances or various levels of activity based on the perceived degree of risk. Regulatory compliance is determined by a ratio oftotal adjusted capital (“TAC”), as defined by the National Association of Insurance Commissioners (“NAIC”), to authorizedcontrol level RBC, as defined by the NAIC. Each of the Company’s Principal Insurance Subsidiaries exceeded the minimumRBC requirements that would require any regulatory or corrective action for all periods presented herein.
The Company’s Principal Insurance Subsidiaries are each required to prepare statutory financial statements in accordance withstatutory accounting practices prescribed or permitted by the insurance department of its respective state of domicile. Suchstatutory accounting practices primarily differ from U.S. GAAP by charging policy acquisition costs to expense as incurred,establishing future policy benefit liabilities and contract owner account balances using different actuarial assumptions as well asvaluing investments and certain assets and accounting for deferred taxes on a different basis. Certain assets that are not admittedunder statutory accounting principles are charged directly to surplus. Depending on the regulations of the insurance departmentof an insurance company’s state of domicile, the entire amount or a portion of an insurance company’s asset balance can be non-admitted based on the specific rules regarding admissibility. For the years ended December 31, 2015, 2014 and 2013, thePrincipal Insurance Subsidiaries have no material prescribed or permitted practices that impact total capital and surplus.
Statutory Net income (loss) for the years ended December 31, 2015, 2014 and 2013 and statutory capital and surplus as ofDecember 31, 2015 and 2014 of the Company’s Principal Insurance Subsidiaries are as follows:
Statutory Net Income (Loss)Statutory Capital and
Surplus
2015 2014 2013 2015 2014
Subsidiary Name (State of Domicile):Voya Insurance and Annuity Company (“VIAC”) (IA) . . . . . . . . . . . . . . . . . . $ 553.3 $335.6 $ (55.8) $2,074.8 $2,119.4Voya Retirement Insurance and Annuity Company (“VRIAC”) (CT) . . . . . . . 317.5 321.7 175.2 2,030.2 2,007.9Security Life of Denver Insurance Company (CO) . . . . . . . . . . . . . . . . . . . . . (244.5) 141.6 (0.1) 858.3 1,128.8ReliaStar Life Insurance Company (“RLI”) (MN) . . . . . . . . . . . . . . . . . . . . . . 74.2 103.9 215.9 1,609.2 1,944.7
All of the Company’s Principal Insurance Subsidiaries have capital and surplus levels that exceed their respective regulatoryminimum requirements.
Insurance Subsidiaries Dividend Restrictions
The states in which the insurance subsidiaries of Voya Financial, Inc. are domiciled impose certain restrictions on thesubsidiaries’ ability to pay dividends to their parent. These restrictions are based in part on the prior year’s statutory income andsurplus. In general, dividends up to specified levels are considered ordinary and may be paid without prior approval. Dividendsin larger amounts, or “extraordinary” dividends, are subject to approval by the insurance commissioner of the state of domicileof the insurance subsidiary proposing to pay the dividend.
283

Voya Financial, Inc.Notes to the Consolidated Financial Statements(Dollar amounts in millions, unless otherwise stated)
Under the insurance laws applicable to Voya Financial, Inc.’s insurance subsidiaries domiciled in Connecticut, Iowa andMinnesota, an “extraordinary” dividend or distribution is defined as a dividend or distribution that, together with otherdividends and distributions made within the preceding twelve months, exceeds the greater of (i) 10% of the insurer’spolicyholder surplus as of the preceding December 31, or (ii) the insurer’s net gain from operations for the twelve-month periodending the preceding December 31, in each case determined in accordance with statutory accounting principles. Under Coloradoinsurance law, an “extraordinary dividend” or distribution is defined as a dividend or distribution that, together with otherdividends and distributions made within the preceding twelve months, exceeds the lesser of (i) 10% of the insurer’s policyholdersurplus as of the preceding December 31, or (ii) the insurer’s net gain from operations for the twelve-month period ending thepreceding December 31, in each case determined in accordance with statutory accounting principles. In addition, under theinsurance laws of Connecticut, Iowa and Minnesota, no dividend or other distribution exceeding an amount equal to a domesticinsurance company’s earned surplus may be paid without the domiciliary insurance regulator’s prior approval. The Company’sPrincipal Insurance Subsidiaries domiciled in Colorado, Connecticut and Iowa each have ordinary dividend capacity for 2016.However, as a result of the extraordinary dividend it paid in 2015, the Company’s Principal Insurance Subsidiary domiciled inMinnesota currently has negative earned surplus and therefore does not have capacity at this time to make ordinary dividendpayments to Voya Holdings Inc. without domiciliary insurance regulatory approval which can be granted or withheld at thediscretion of the regulator.
Principal Insurance Subsidiaries—Dividends and Return of Capital
The following table summarizes dividends permitted to be paid by the Company’s Principal Insurance Subsidiaries to VoyaFinancial, Inc. or Voya Holdings Inc. without the need for insurance regulatory approval for the periods presented:
Dividends Permitted without Approval
2016 2015 2014
Subsidiary Name (State of domicile):Voya Insurance and Annuity Company (IA) . . . . . . . . . . . . . . . . . . . . . $447.5 $394.1 $216.3Voya Retirement Insurance and Annuity Company (CT) . . . . . . . . . . . 364.1 321.8 371.4Security Life of Denver Insurance Company (CO) . . . . . . . . . . . . . . . . 54.9 111.6 32.5ReliaStar Life Insurance Company (MN) . . . . . . . . . . . . . . . . . . . . . . . . — 194.2 194.0
The following table summarizes dividends and extraordinary distributions paid by each of the Company’s Principal InsuranceSubsidiaries to its parent for the periods indicated:
Dividends PaidExtraordinary
Distributions Paid
Year Ended December 31, Year Ended December 31,2015 2014 2015 2014
Subsidiary Name (State of domicile):Voya Insurance and Annuity Company (IA) . . . . . . . . . . . . . . . . . $394.0 $216.0 $ 98.0 $—Voya Retirement Insurance and Annuity Company (CT) . . . . . . . . 321.0 371.0 — —Security Life of Denver Insurance Company (CO) . . . . . . . . . . . . . 111.0 32.0 130.0 —ReliaStar Life Insurance Company (MN) . . . . . . . . . . . . . . . . . . . . 194.0 193.0 280.0 —
284

Voya Financial, Inc.Notes to the Consolidated Financial Statements(Dollar amounts in millions, unless otherwise stated)
In June 2015, VIAC declared an extraordinary distribution of $98.0, subject to the receipt of approval by the Iowa Division ofInsurance. The Iowa Division of Insurance provided notice of approval on June 25, 2015 and VIAC paid the extraordinarydistribution on June 26, 2015. In June 2015, RLI declared an extraordinary distribution of $280.0, subject to receipt of approvalby the Minnesota Insurance Division. The Minnesota Insurance Division provided notice of approval on July 31, 2015 and RLIpaid the extraordinary distribution on August 3, 2015. In July 2015, SLD declared an extraordinary distribution of $130.0,subject to receipt of approval by the Colorado Insurance Division. The Colorado Insurance Division provided notice of non-disapproval on July 29, 2015 and SLD paid the extraordinary distribution on July 31, 2015.
On May 5, 2015, Voya Financial, Inc.’s Principal Insurance Subsidiaries domiciled in Connecticut, Iowa and Minnesotadeclared ordinary dividends in the aggregate amount of $819.0, which were paid on May 20, 2015. On June 3, 2015, VoyaFinancial, Inc.’s Principal Insurance Subsidiary domiciled in Colorado declared an ordinary dividend of $111.0, which was paidon June 25, 2015. On November 19, 2015, Voya Financial, Inc.’s Principal Insurance Subsidiary domiciled in Connecticutdeclared an ordinary dividend in the amount of $90.0, which was paid on December 23, 2015.
On May 2, 2014, Voya Financial, Inc.’s Principal Insurance Subsidiaries domiciled in Connecticut, Iowa and Minnesotadeclared ordinary dividends in the aggregate amount of $690.0, which were paid on May 19, 2014. On June 9, 2014, VoyaFinancial, Inc.’s Principal Insurance Subsidiary domiciled in Colorado declared an ordinary dividend in the aggregate amount of$32.0, which was paid on June 24, 2014. On November 20, 2014 Voya Financial, Inc.’s Principal Insurance Subsidiarydomiciled in Connecticut declared an ordinary dividend in the amount of $90.0, which was paid on December 22, 2014.
Captive Reinsurance Subsidiaries
Voya Financial, Inc.’s special purpose life reinsurance captive insurance company subsidiaries domiciled in Missouri(collectively referred to as the “captive reinsurance subsidiaries”) provide reinsurance to the Company’s insurance subsidiariesin order to facilitate the financing of statutory reserves including those associated with Regulation XXX or AG38 and to fundcertain statutory annuity reserve requirements. Each of the captive reinsurance subsidiaries in operation as of December 31,2015 is a wholly owned direct or indirect subsidiary of one of the Principal Insurance Subsidiaries or Voya Holdings Inc. Eachof the captive reinsurance subsidiaries is subject to specific minimum capital requirements set forth in the insurance statutes ofMissouri, the state of domicile, and is required to prepare statutory financial statements in accordance with statutory accountingpractices prescribed in the Missouri insurance statutes or permitted by the Missouri insurance department. There are noprescribed practices material to the captive reinsurance subsidiaries, except that certain of these subsidiaries have included thevalue of LOCs and trust notes as admitted assets supporting the statutory reserves ceded to such subsidiaries. The effect of theseprescribed practices was to increase statutory capital and surplus by $590.6 and $1,185.0 as of December 31, 2015 and 2014,respectively. The aggregate statutory capital and surplus, including the aforementioned prescribed practices, was $351.5 and$552.5 as of December 31, 2015 and 2014, respectively.
The Company’s Arizona captive, SLDI, provides reinsurance to the Company’s insurance subsidiaries in order to facilitate thefinancing of statutory reserves including those associated with Regulation XXX or AG38 and to fund certain statutory annuityreserve requirements. Arizona state insurance statutes and regulations require SLDI to file financial statements with the ArizonaDepartment of Insurance (“ADOI”) and allow the filing of such financial statements on a U.S. GAAP basis modified for certainprescribed practices outlined in the Arizona insurance statutes that are applicable to U.S. GAAP filers. These prescribed practiceshad no impact on SLDI’s Shareholder’s equity as of December 31, 2015 and 2014. In addition, SLDI has obtained approval fromthe ADOI for certain permitted practices, including taking reinsurance credit for certain ceded reserves where the assets backing theliabilities are held by a wholly owned Principal Insurance Subsidiary of Voya Financial, Inc. SLDI has recorded a receivable forthese assets. The effect of the permitted practice was to increase SLDI’s Shareholder’s equity by $456.6 and $482.0 as ofDecember 31, 2015 and 2014, respectively, but has no effect on the Company’s consolidated Total shareholders’ equity.
The captive reinsurance subsidiaries may not declare or pay any dividends other than in accordance with their respectiveinsurance reserve financing transaction agreements and their respective governing licensing orders. Likewise, SLDI may notdeclare or pay dividends other than in accordance with its annual capital and dividend plan as approved by the ADOI, whichincludes a minimum capital requirement. SLDI does not expect to make any dividend payments during calendar year 2016.
285

Voya Financial, Inc.Notes to the Consolidated Financial Statements(Dollar amounts in millions, unless otherwise stated)
14. Employee Benefit Arrangements
Pension, Other Postretirement Benefit Plans and Other Benefit Plans
Voya Financial, Inc.’s subsidiaries maintain both qualified and non-qualified defined benefit pension plans (the “Plans”). Theseplans generally cover all employees and certain sales representatives who meet specified eligibility requirements. Pensionbenefits are based on a formula using compensation and length of service. Annual contributions are paid to the Plans at a ratenecessary to adequately fund the accrued liabilities of the Plans calculated in accordance with legal requirements. The Planscomply with applicable regulations concerning investments and funding levels.
The Voya Retirement Plan (the “Retirement Plan”) is a tax qualified defined benefit plan, the benefits of which are guaranteed(within certain specified legal limits) by the Pension Benefit Guaranty Corporation (“PBGC”). Beginning January 1, 2012, theRetirement Plan adopted a cash balance pension formula instead of a final average pay (“FAP”) formula, allowing all eligibleemployees to participate in the Retirement Plan. Participants will earn an annual credit equal to 4% of eligible compensation.Interest is credited monthly based on a 30-year U.S. Treasury securities bond rate published by the Internal Revenue Service inthe preceding August of each year. The accrued vested cash pension balance benefit is portable; participants can take it if theyleave the Company. For participants in the Retirement Plan as of December 31, 2011, there was a two-year transition periodfrom the Retirement Plan’s previous FAP formula to the cash balance pension formula which ended December 31, 2013.
During the fourth quarter of 2015, terminated, vested participants of the Retirement Plan were offered an opportunity to receivetheir retirement plan benefit as a lump sum payment or an annuity. The lump sum payments and related settlement wererecorded in the fourth quarter of 2015 and are reflected in the Demographic Data and other line in the net actuarial (gains) lossesrelated to pension and other postretirement benefit obligations table below.
In addition to providing qualified retirement benefit plans, the Company provides certain supplemental retirement benefits toeligible employees, non-qualified pension plans for insurance sales representatives who have entered into a career agentagreement and certain other individuals. These plans are non-qualified defined benefit plans, which means all benefits arepayable from the general assets of the sponsoring company.
The Company also offers deferred compensation plans for eligible employees, including eligible career agents and certain otherindividuals who meet the eligibility criteria. The Company’s deferred compensation commitment for employees is recorded on theConsolidated Balance Sheets in Other liabilities and totaled $270.2 and $272.3 as of December 31, 2015 and 2014, respectively.
Voya Financial, Inc.’s subsidiaries also provide other postretirement and post-employment benefits to certain employees. Theseare primarily postretirement healthcare and life insurance benefits to retired employees and other eligible dependents and post-employment/pre-retirement plans provided to employees and former employees.
286
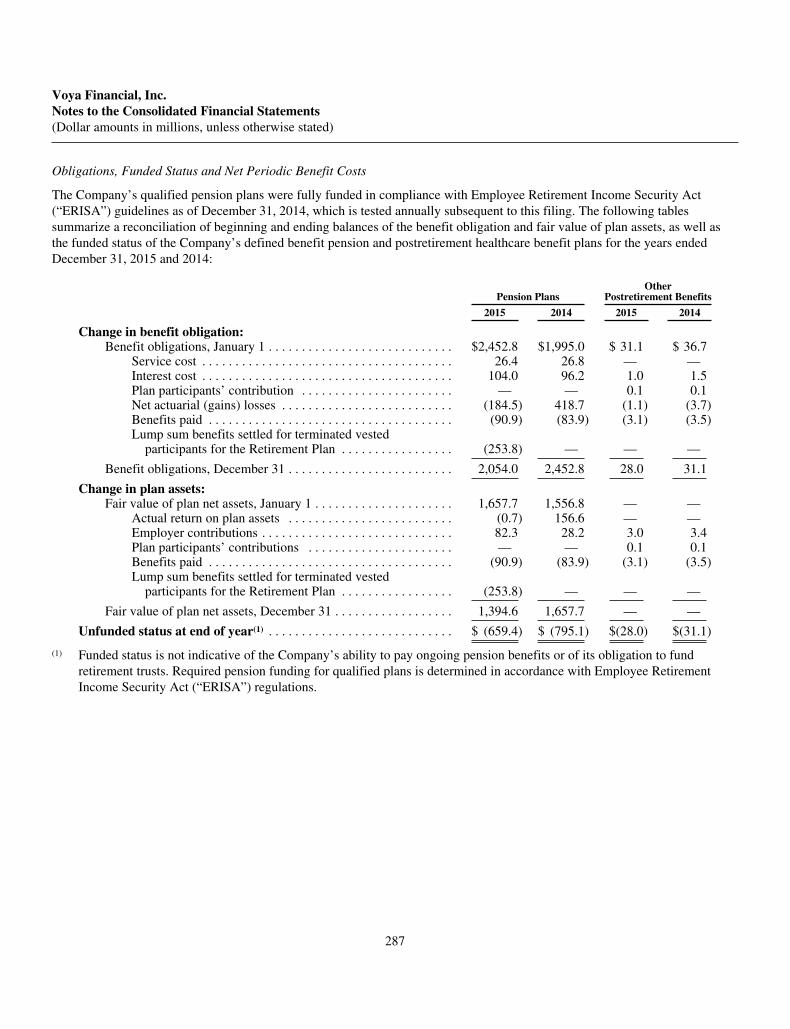
Voya Financial, Inc.Notes to the Consolidated Financial Statements(Dollar amounts in millions, unless otherwise stated)
Obligations, Funded Status and Net Periodic Benefit Costs
The Company’s qualified pension plans were fully funded in compliance with Employee Retirement Income Security Act(“ERISA”) guidelines as of December 31, 2014, which is tested annually subsequent to this filing. The following tablessummarize a reconciliation of beginning and ending balances of the benefit obligation and fair value of plan assets, as well asthe funded status of the Company’s defined benefit pension and postretirement healthcare benefit plans for the years endedDecember 31, 2015 and 2014:
Pension PlansOther
Postretirement Benefits
2015 2014 2015 2014
Change in benefit obligation:Benefit obligations, January 1 . . . . . . . . . . . . . . . . . . . . . . . . . . . . $2,452.8 $1,995.0 $ 31.1 $ 36.7
Service cost . . . . . . . . . . . . . . . . . . . . . . . . . . . . . . . . . . . . . . 26.4 26.8 — —Interest cost . . . . . . . . . . . . . . . . . . . . . . . . . . . . . . . . . . . . . . 104.0 96.2 1.0 1.5Plan participants’ contribution . . . . . . . . . . . . . . . . . . . . . . . — — 0.1 0.1Net actuarial (gains) losses . . . . . . . . . . . . . . . . . . . . . . . . . . (184.5) 418.7 (1.1) (3.7)Benefits paid . . . . . . . . . . . . . . . . . . . . . . . . . . . . . . . . . . . . . (90.9) (83.9) (3.1) (3.5)Lump sum benefits settled for terminated vested
participants for the Retirement Plan . . . . . . . . . . . . . . . . . (253.8) — — —
Benefit obligations, December 31 . . . . . . . . . . . . . . . . . . . . . . . . . 2,054.0 2,452.8 28.0 31.1
Change in plan assets:Fair value of plan net assets, January 1 . . . . . . . . . . . . . . . . . . . . . 1,657.7 1,556.8 — —
Actual return on plan assets . . . . . . . . . . . . . . . . . . . . . . . . . (0.7) 156.6 — —Employer contributions . . . . . . . . . . . . . . . . . . . . . . . . . . . . . 82.3 28.2 3.0 3.4Plan participants’ contributions . . . . . . . . . . . . . . . . . . . . . . — — 0.1 0.1Benefits paid . . . . . . . . . . . . . . . . . . . . . . . . . . . . . . . . . . . . . (90.9) (83.9) (3.1) (3.5)Lump sum benefits settled for terminated vested
participants for the Retirement Plan . . . . . . . . . . . . . . . . . (253.8) — — —
Fair value of plan net assets, December 31 . . . . . . . . . . . . . . . . . . 1,394.6 1,657.7 — —
Unfunded status at end of year(1) . . . . . . . . . . . . . . . . . . . . . . . . . . . . $ (659.4) $ (795.1) $(28.0) $(31.1)
(1) Funded status is not indicative of the Company’s ability to pay ongoing pension benefits or of its obligation to fundretirement trusts. Required pension funding for qualified plans is determined in accordance with Employee RetirementIncome Security Act (“ERISA”) regulations.
287
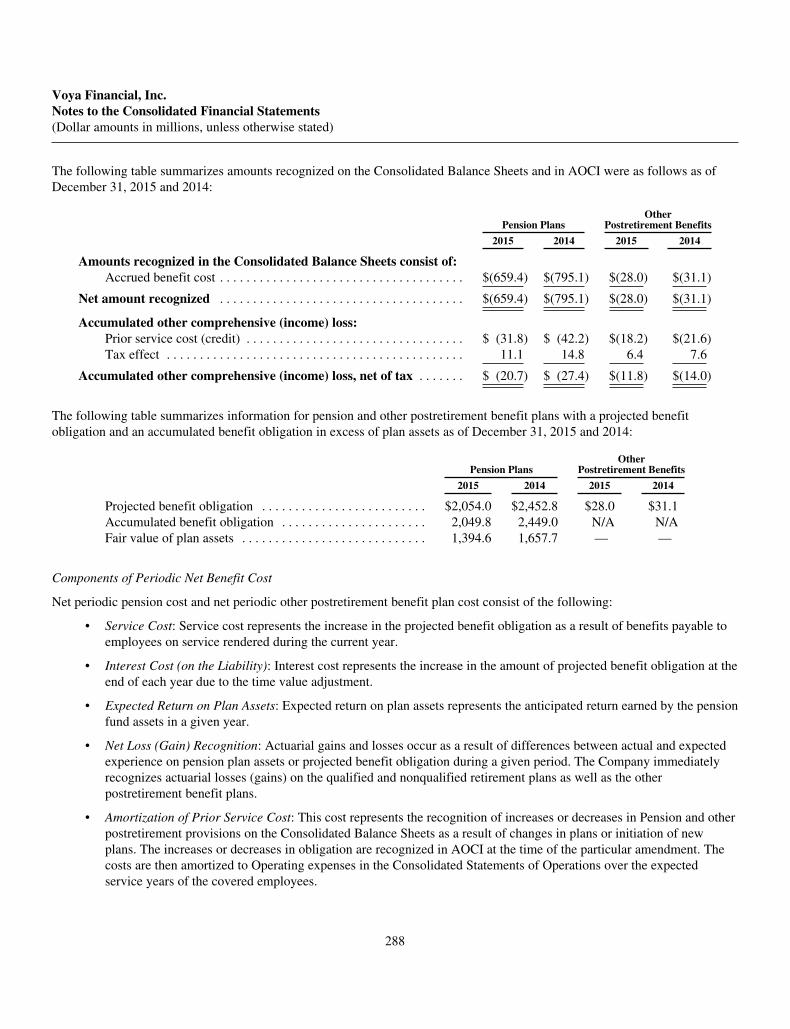
Voya Financial, Inc.Notes to the Consolidated Financial Statements(Dollar amounts in millions, unless otherwise stated)
The following table summarizes amounts recognized on the Consolidated Balance Sheets and in AOCI were as follows as ofDecember 31, 2015 and 2014:
Pension PlansOther
Postretirement Benefits
2015 2014 2015 2014
Amounts recognized in the Consolidated Balance Sheets consist of:Accrued benefit cost . . . . . . . . . . . . . . . . . . . . . . . . . . . . . . . . . . . . . $(659.4) $(795.1) $(28.0) $(31.1)
Net amount recognized . . . . . . . . . . . . . . . . . . . . . . . . . . . . . . . . . . . . . $(659.4) $(795.1) $(28.0) $(31.1)
Accumulated other comprehensive (income) loss:Prior service cost (credit) . . . . . . . . . . . . . . . . . . . . . . . . . . . . . . . . . $ (31.8) $ (42.2) $(18.2) $(21.6)Tax effect . . . . . . . . . . . . . . . . . . . . . . . . . . . . . . . . . . . . . . . . . . . . . 11.1 14.8 6.4 7.6
Accumulated other comprehensive (income) loss, net of tax . . . . . . . $ (20.7) $ (27.4) $(11.8) $(14.0)
The following table summarizes information for pension and other postretirement benefit plans with a projected benefitobligation and an accumulated benefit obligation in excess of plan assets as of December 31, 2015 and 2014:
Pension PlansOther
Postretirement Benefits
2015 2014 2015 2014
Projected benefit obligation . . . . . . . . . . . . . . . . . . . . . . . . . $2,054.0 $2,452.8 $28.0 $31.1Accumulated benefit obligation . . . . . . . . . . . . . . . . . . . . . . 2,049.8 2,449.0 N/A N/AFair value of plan assets . . . . . . . . . . . . . . . . . . . . . . . . . . . . 1,394.6 1,657.7 — —
Components of Periodic Net Benefit Cost
Net periodic pension cost and net periodic other postretirement benefit plan cost consist of the following:
• Service Cost: Service cost represents the increase in the projected benefit obligation as a result of benefits payable toemployees on service rendered during the current year.
• Interest Cost (on the Liability): Interest cost represents the increase in the amount of projected benefit obligation at theend of each year due to the time value adjustment.
• Expected Return on Plan Assets: Expected return on plan assets represents the anticipated return earned by the pensionfund assets in a given year.
• Net Loss (Gain) Recognition: Actuarial gains and losses occur as a result of differences between actual and expectedexperience on pension plan assets or projected benefit obligation during a given period. The Company immediatelyrecognizes actuarial losses (gains) on the qualified and nonqualified retirement plans as well as the otherpostretirement benefit plans.
• Amortization of Prior Service Cost: This cost represents the recognition of increases or decreases in Pension and otherpostretirement provisions on the Consolidated Balance Sheets as a result of changes in plans or initiation of newplans. The increases or decreases in obligation are recognized in AOCI at the time of the particular amendment. Thecosts are then amortized to Operating expenses in the Consolidated Statements of Operations over the expectedservice years of the covered employees.
288

Voya Financial, Inc.Notes to the Consolidated Financial Statements(Dollar amounts in millions, unless otherwise stated)
The components of net periodic benefit costs recognized in Operating expenses in the Consolidated Statements of Operationsand other changes in plan assets and benefit obligations recognized in Other comprehensive income (loss) were as follows forthe years ended December 31, 2015, 2014 and 2013:
Pension Plans Other Postretirement Benefits
2015 2014 2013 2015 2014 2013
Net Periodic (Benefit) Costs Recognized in ConsolidatedStatements of Operations:
Service cost . . . . . . . . . . . . . . . . . . . . . . . . . . . . . . . . . . . . . . . . . . $ 26.4 $ 26.8 $ 45.3 $— $— $—Interest cost . . . . . . . . . . . . . . . . . . . . . . . . . . . . . . . . . . . . . . . . . . 104.0 96.2 88.3 1.0 1.5 1.7Expected return on plan assets . . . . . . . . . . . . . . . . . . . . . . . . . . . (122.2) (114.3) (101.2) — — —Amortization of prior service cost (credit) . . . . . . . . . . . . . . . . . . (10.4) (10.4) (10.4) (3.3) (3.4) (3.4)Net (gain) loss recognition . . . . . . . . . . . . . . . . . . . . . . . . . . . . . . (61.6) 376.4 (397.9) (1.1) (3.7) (7.2)
Net periodic (benefit) costs . . . . . . . . . . . . . . . . . . . . . . . . . . . . . . . . . . (63.8) 374.7 (375.9) (3.4) (5.6) (8.9)
Other Changes in Plan Assets and Benefit ObligationsRecognized in AOCI:
Amortization of prior service (credit) cost . . . . . . . . . . . . . . . . . . 10.4 10.4 10.4 3.3 3.4 3.4
Total recognized in AOCI . . . . . . . . . . . . . . . . . . . . . . . . . . . . . . . . . . . 10.4 10.4 10.4 3.3 3.4 3.4
Total recognized in net periodic (benefit) costs and AOCI . . . . . . . . . $ (53.4) $ 385.1 $(365.5) $(0.1) $(2.2) $(5.5)
The table below illustrates the breakdown of the net actuarial (gains) losses related to Pension and Other postretirement benefitobligations reported within Operating expenses in the Consolidated Statements of Operations as of the periods presented:
(Gain)/Loss Recognized 2015 2014 2013
Discount Rate . . . . . . . . . . . . . . . . . . . . . . . . . . . . . . . . . . . . . . . . . . . . . . . . $(132.4) $200.2 $(271.9)Asset Returns . . . . . . . . . . . . . . . . . . . . . . . . . . . . . . . . . . . . . . . . . . . . . . . . . 122.9 (42.4) (119.9)Mortality Table Assumptions . . . . . . . . . . . . . . . . . . . . . . . . . . . . . . . . . . . . (32.3) 202.1 —Demographic Data and other . . . . . . . . . . . . . . . . . . . . . . . . . . . . . . . . . . . . . (20.9) 12.8 (13.3)
Total Net Actuarial (Gain)/Loss Recognized . . . . . . . . . . . . . . . . . . . . . . . . $ (62.7) $372.7 $(405.1)
The estimated prior service cost for the pension plans and other postretirement benefit plans are amortized from AOCI into netperiodic (benefit) cost. Such amounts included in AOCI and expected to be recognized as components of periodic (benefit) costin 2016 are as follows:
Pension Plans
OtherPostretirement
Benefits
Amortization of prior service cost (credit) . . . . . . . . . . . . . . . . . . . $(10.4) $(3.3)
289
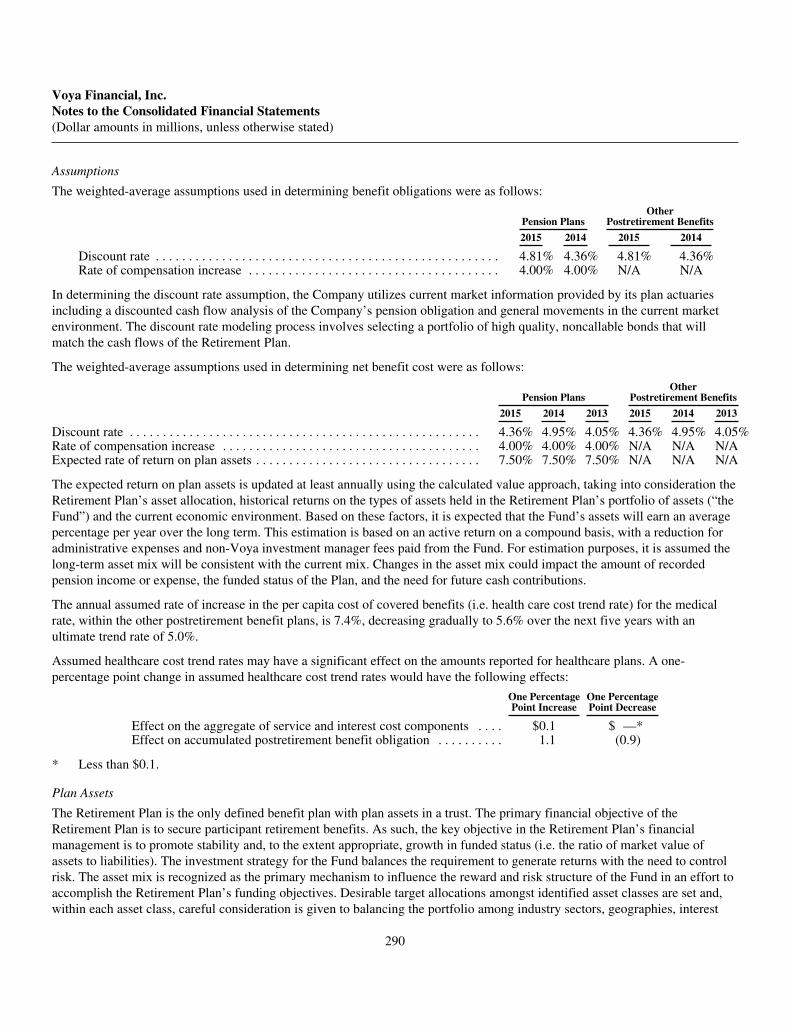
Voya Financial, Inc.Notes to the Consolidated Financial Statements(Dollar amounts in millions, unless otherwise stated)
Assumptions
The weighted-average assumptions used in determining benefit obligations were as follows:
Pension PlansOther
Postretirement Benefits
2015 2014 2015 2014
Discount rate . . . . . . . . . . . . . . . . . . . . . . . . . . . . . . . . . . . . . . . . . . . . . . . . . . . . 4.81% 4.36% 4.81% 4.36%Rate of compensation increase . . . . . . . . . . . . . . . . . . . . . . . . . . . . . . . . . . . . . . 4.00% 4.00% N/A N/A
In determining the discount rate assumption, the Company utilizes current market information provided by its plan actuariesincluding a discounted cash flow analysis of the Company’s pension obligation and general movements in the current marketenvironment. The discount rate modeling process involves selecting a portfolio of high quality, noncallable bonds that willmatch the cash flows of the Retirement Plan.
The weighted-average assumptions used in determining net benefit cost were as follows:
Pension PlansOther
Postretirement Benefits
2015 2014 2013 2015 2014 2013
Discount rate . . . . . . . . . . . . . . . . . . . . . . . . . . . . . . . . . . . . . . . . . . . . . . . . . . . . . 4.36% 4.95% 4.05% 4.36% 4.95% 4.05%Rate of compensation increase . . . . . . . . . . . . . . . . . . . . . . . . . . . . . . . . . . . . . . . 4.00% 4.00% 4.00% N/A N/A N/AExpected rate of return on plan assets . . . . . . . . . . . . . . . . . . . . . . . . . . . . . . . . . . 7.50% 7.50% 7.50% N/A N/A N/A
The expected return on plan assets is updated at least annually using the calculated value approach, taking into consideration theRetirement Plan’s asset allocation, historical returns on the types of assets held in the Retirement Plan’s portfolio of assets (“theFund”) and the current economic environment. Based on these factors, it is expected that the Fund’s assets will earn an averagepercentage per year over the long term. This estimation is based on an active return on a compound basis, with a reduction foradministrative expenses and non-Voya investment manager fees paid from the Fund. For estimation purposes, it is assumed thelong-term asset mix will be consistent with the current mix. Changes in the asset mix could impact the amount of recordedpension income or expense, the funded status of the Plan, and the need for future cash contributions.
The annual assumed rate of increase in the per capita cost of covered benefits (i.e. health care cost trend rate) for the medicalrate, within the other postretirement benefit plans, is 7.4%, decreasing gradually to 5.6% over the next five years with anultimate trend rate of 5.0%.
Assumed healthcare cost trend rates may have a significant effect on the amounts reported for healthcare plans. A one-percentage point change in assumed healthcare cost trend rates would have the following effects:
One PercentagePoint Increase
One PercentagePoint Decrease
Effect on the aggregate of service and interest cost components . . . . $0.1 $ —*Effect on accumulated postretirement benefit obligation . . . . . . . . . . 1.1 (0.9)
* Less than $0.1.
Plan Assets
The Retirement Plan is the only defined benefit plan with plan assets in a trust. The primary financial objective of theRetirement Plan is to secure participant retirement benefits. As such, the key objective in the Retirement Plan’s financialmanagement is to promote stability and, to the extent appropriate, growth in funded status (i.e. the ratio of market value ofassets to liabilities). The investment strategy for the Fund balances the requirement to generate returns with the need to controlrisk. The asset mix is recognized as the primary mechanism to influence the reward and risk structure of the Fund in an effort toaccomplish the Retirement Plan’s funding objectives. Desirable target allocations amongst identified asset classes are set and,within each asset class, careful consideration is given to balancing the portfolio among industry sectors, geographies, interest
290
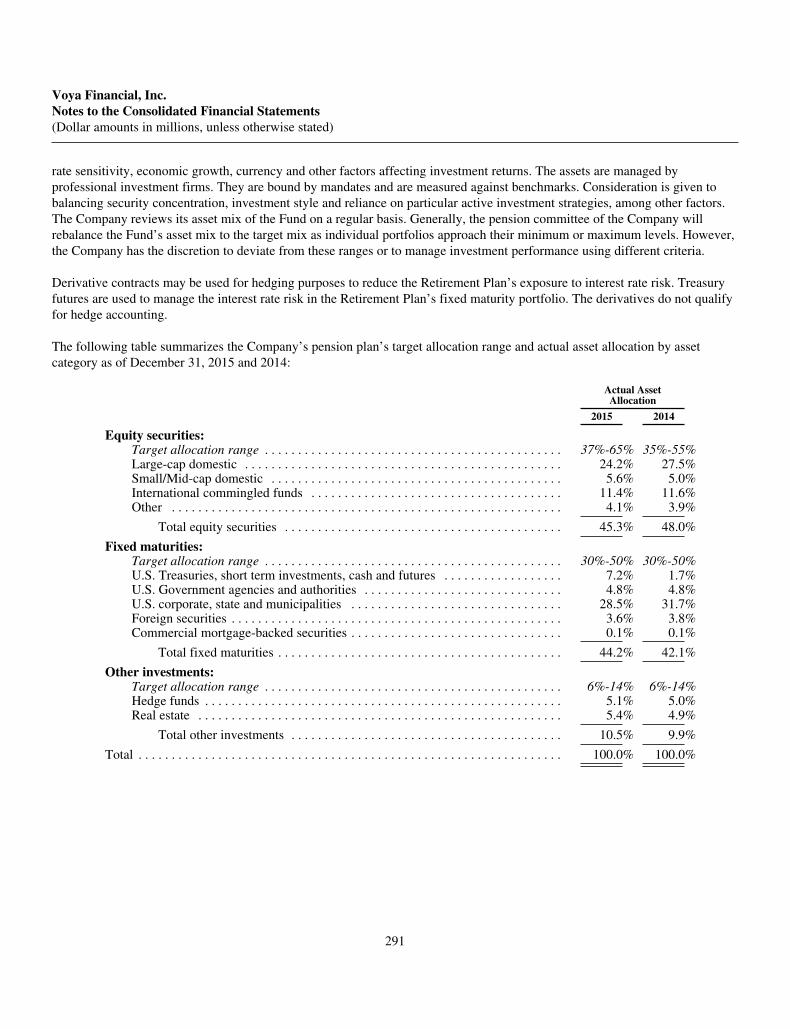
Voya Financial, Inc.Notes to the Consolidated Financial Statements(Dollar amounts in millions, unless otherwise stated)
rate sensitivity, economic growth, currency and other factors affecting investment returns. The assets are managed byprofessional investment firms. They are bound by mandates and are measured against benchmarks. Consideration is given tobalancing security concentration, investment style and reliance on particular active investment strategies, among other factors.The Company reviews its asset mix of the Fund on a regular basis. Generally, the pension committee of the Company willrebalance the Fund’s asset mix to the target mix as individual portfolios approach their minimum or maximum levels. However,the Company has the discretion to deviate from these ranges or to manage investment performance using different criteria.
Derivative contracts may be used for hedging purposes to reduce the Retirement Plan’s exposure to interest rate risk. Treasuryfutures are used to manage the interest rate risk in the Retirement Plan’s fixed maturity portfolio. The derivatives do not qualifyfor hedge accounting.
The following table summarizes the Company’s pension plan’s target allocation range and actual asset allocation by assetcategory as of December 31, 2015 and 2014:
Actual AssetAllocation
2015 2014
Equity securities:Target allocation range . . . . . . . . . . . . . . . . . . . . . . . . . . . . . . . . . . . . . . . . . . . . . 37%-65% 35%-55%Large-cap domestic . . . . . . . . . . . . . . . . . . . . . . . . . . . . . . . . . . . . . . . . . . . . . . . . 24.2% 27.5%Small/Mid-cap domestic . . . . . . . . . . . . . . . . . . . . . . . . . . . . . . . . . . . . . . . . . . . . 5.6% 5.0%International commingled funds . . . . . . . . . . . . . . . . . . . . . . . . . . . . . . . . . . . . . . 11.4% 11.6%Other . . . . . . . . . . . . . . . . . . . . . . . . . . . . . . . . . . . . . . . . . . . . . . . . . . . . . . . . . . . 4.1% 3.9%
Total equity securities . . . . . . . . . . . . . . . . . . . . . . . . . . . . . . . . . . . . . . . . . . 45.3% 48.0%
Fixed maturities:Target allocation range . . . . . . . . . . . . . . . . . . . . . . . . . . . . . . . . . . . . . . . . . . . . . 30%-50% 30%-50%U.S. Treasuries, short term investments, cash and futures . . . . . . . . . . . . . . . . . . 7.2% 1.7%U.S. Government agencies and authorities . . . . . . . . . . . . . . . . . . . . . . . . . . . . . . 4.8% 4.8%U.S. corporate, state and municipalities . . . . . . . . . . . . . . . . . . . . . . . . . . . . . . . . 28.5% 31.7%Foreign securities . . . . . . . . . . . . . . . . . . . . . . . . . . . . . . . . . . . . . . . . . . . . . . . . . . 3.6% 3.8%Commercial mortgage-backed securities . . . . . . . . . . . . . . . . . . . . . . . . . . . . . . . . 0.1% 0.1%
Total fixed maturities . . . . . . . . . . . . . . . . . . . . . . . . . . . . . . . . . . . . . . . . . . . 44.2% 42.1%
Other investments:Target allocation range . . . . . . . . . . . . . . . . . . . . . . . . . . . . . . . . . . . . . . . . . . . . . 6%-14% 6%-14%Hedge funds . . . . . . . . . . . . . . . . . . . . . . . . . . . . . . . . . . . . . . . . . . . . . . . . . . . . . . 5.1% 5.0%Real estate . . . . . . . . . . . . . . . . . . . . . . . . . . . . . . . . . . . . . . . . . . . . . . . . . . . . . . . 5.4% 4.9%
Total other investments . . . . . . . . . . . . . . . . . . . . . . . . . . . . . . . . . . . . . . . . . 10.5% 9.9%
Total . . . . . . . . . . . . . . . . . . . . . . . . . . . . . . . . . . . . . . . . . . . . . . . . . . . . . . . . . . . . . . . . 100.0% 100.0%
291

Voya Financial, Inc.Notes to the Consolidated Financial Statements(Dollar amounts in millions, unless otherwise stated)
The following table summarizes the fair values of the pension plan assets as of December 31, 2015 by asset class were as follows:Level 1 Level 2 Level 3(1) Total
AssetsFixed maturities, short-term investments and cash:
Cash and cash equivalents . . . . . . . . . . . . . . . . . . . . . . . . . . . . . $ 1.4 $ — $ — $ 1.4Short-term investment fund(2) . . . . . . . . . . . . . . . . . . . . . . . . . . . — 98.3 — 98.3U.S. Government securities . . . . . . . . . . . . . . . . . . . . . . . . . . . . 66.2 — — 66.2U.S. corporate, state and municipalities . . . . . . . . . . . . . . . . . . . 1.0 396.3 — 397.3Foreign securities . . . . . . . . . . . . . . . . . . . . . . . . . . . . . . . . . . . . — 50.3 — 50.3Commercial mortgage-backed securities . . . . . . . . . . . . . . . . . . — 1.4 — 1.4Other asset-backed securities . . . . . . . . . . . . . . . . . . . . . . . . . . . — 0.3 — 0.3
Total fixed maturities . . . . . . . . . . . . . . . . . . . . . . . . . . . . . . . . . . . . . 68.6 546.6 — 615.2Equity securities:
Large-cap domestic . . . . . . . . . . . . . . . . . . . . . . . . . . . . . . . . . . . 337.5 — — 337.5Small/Mid-cap domestic . . . . . . . . . . . . . . . . . . . . . . . . . . . . . . . 77.8 — — 77.8International commingled funds(3) . . . . . . . . . . . . . . . . . . . . . . . — 159.4 — 159.4Limited partnerships(4) . . . . . . . . . . . . . . . . . . . . . . . . . . . . . . . . — — 57.9 57.9
Total equity securities . . . . . . . . . . . . . . . . . . . . . . . . . . . . . . . . . . . . . 415.3 159.4 57.9 632.6Other investments:
Real estate(5) . . . . . . . . . . . . . . . . . . . . . . . . . . . . . . . . . . . . . . . . — — 75.5 75.5Limited partnerships(6) . . . . . . . . . . . . . . . . . . . . . . . . . . . . . . . . — — 71.0 71.0Futures . . . . . . . . . . . . . . . . . . . . . . . . . . . . . . . . . . . . . . . . . . . . . 0.3 — — 0.3Total other investments . . . . . . . . . . . . . . . . . . . . . . . . . . . . . . . . 0.3 — 146.5 146.8
Net, total pension assets . . . . . . . . . . . . . . . . . . . . . . . . . . . . . . . . . . . . . . $484.2 $706.0 $204.4 $1,394.6
(1) Level 3 net assets accounted for 14.7% of total net assets measured at fair value on a recurring basis.(2) This category includes common collective trust funds invested in the EB Temporary Investment Fund of The Bank of New
York Mellon (“Short-term Investment Fund”). The Short-term Investment Fund is designed to provide a rate of return byinvesting in a full range of high-quality, short-term money market securities. Participant’s redemptions in the Short-termInvestment Fund may be requested by 2 p.m. eastern standard time and are processed by the following day.
(3) International Commingled funds are comprised of two assets that use NAV to calculate fair value. Baillie Gifford Funds has abalance of $79.6 and uses a bottom up approach to stock picking. In determining the potential of a company, the fund manageranalyzes industry background, competitive advantage, management attitudes and financial strength and valuation. There are noredemption restrictions in the Baillie Gifford Funds. Silchester has a fund balance of $79.8 that has an investment objective toachieve long-term growth primarily by investing in a diversified portfolio of equity securities of companies located in anycountry other than the United States. Silchester clients may contribute to and redeem monies from the funds on a monthly basis asof the last business day of each month. Clients must notify Silchester at least six business days before the month-end to make aredemption request. Baillie Gifford and Silchester, as a normal course of business, enter into contracts (commitments) thatcontain indemnifications or warranties. The funds’ maximum exposure under these arrangements is unknown, as this wouldinvolve future claims that have not yet occurred. Baillie Gifford and Silchester have no unfunded commitments.
(4) Limited partnerships are comprised of two assets that use NAV to calculate fair value. Pantheon Europe has a balance of $9.8 andPantheon USA has a balance of $48.1. Their strategy is to create a portfolio of high quality private equity funds, operating across Europeand diversified by stage, sector, geography, manager and vintage year. For the year ended December 31, 2015, Pantheon Europe andPantheon USA have unfunded commitments of $1.5 and $5.6, respectively, and there were no significant redemption restrictions.
(5) UBS Trumbull Property Fund (“UBS”) uses the NAV to calculate fair value. UBS has a balance of $75.5 and is an activelymanaged core portfolio of equity real estate. The Fund has both relative and real return objectives. Its relative performanceobjective is to outperform the National Council of Real Estate investment Fiduciaries Open-End Diversified Core(“NFI_ODCE”) index over any given three-to-five-year period. The Fund’s real return performance objective is to achieveat least a 5.0% real rate of return (i.e., inflation-adjusted return), before advisory fees, over any given three-to-five-yearperiod. Investors may request redemptions of all or a portion of their units as of the end of a calendar quarter by deliveringwritten notice to the Fund at least sixty days prior to the end of the quarter.
(6) Magnitude Institutional, Ltd. (“MIL”) has a balance of $71.0 and is designed to realize appreciation in value primarilythrough the allocation of capital directly and indirectly among investment funds and accounts. There are significantredemption restrictions in the MIL fund.
292
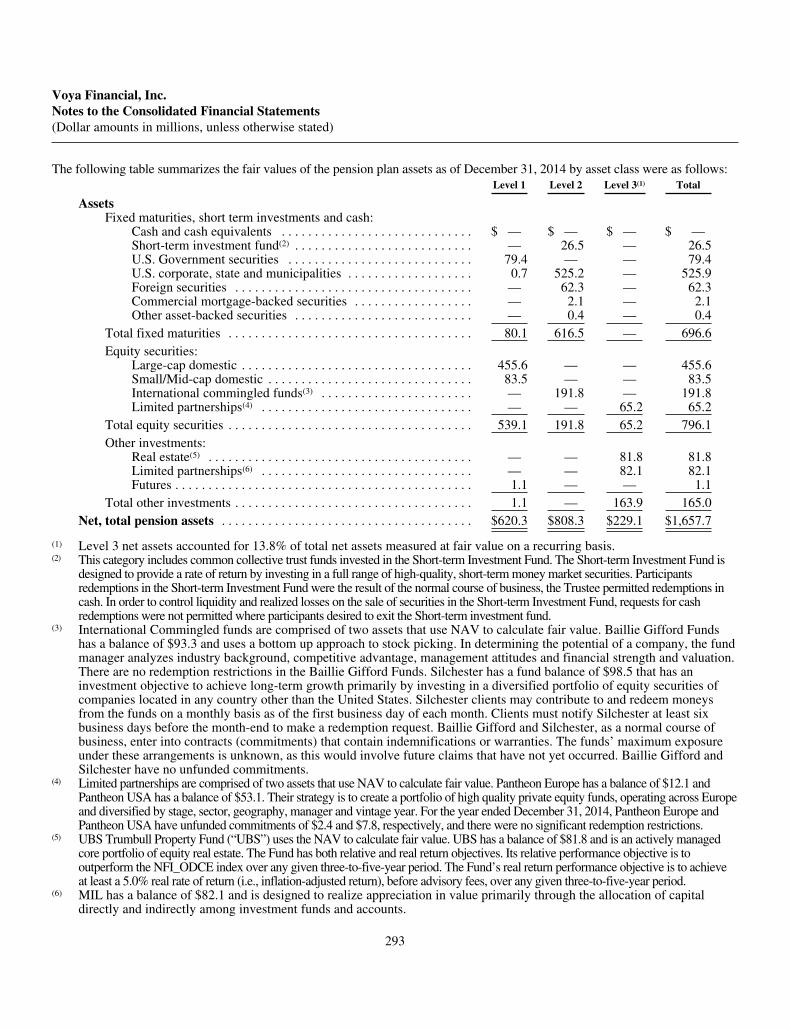
Voya Financial, Inc.Notes to the Consolidated Financial Statements(Dollar amounts in millions, unless otherwise stated)
The following table summarizes the fair values of the pension plan assets as of December 31, 2014 by asset class were as follows:Level 1 Level 2 Level 3(1) Total
AssetsFixed maturities, short term investments and cash:
Cash and cash equivalents . . . . . . . . . . . . . . . . . . . . . . . . . . . . . $ — $ — $ — $ —Short-term investment fund(2) . . . . . . . . . . . . . . . . . . . . . . . . . . . — 26.5 — 26.5U.S. Government securities . . . . . . . . . . . . . . . . . . . . . . . . . . . . 79.4 — — 79.4U.S. corporate, state and municipalities . . . . . . . . . . . . . . . . . . . 0.7 525.2 — 525.9Foreign securities . . . . . . . . . . . . . . . . . . . . . . . . . . . . . . . . . . . . — 62.3 — 62.3Commercial mortgage-backed securities . . . . . . . . . . . . . . . . . . — 2.1 — 2.1Other asset-backed securities . . . . . . . . . . . . . . . . . . . . . . . . . . . — 0.4 — 0.4
Total fixed maturities . . . . . . . . . . . . . . . . . . . . . . . . . . . . . . . . . . . . . 80.1 616.5 — 696.6Equity securities:
Large-cap domestic . . . . . . . . . . . . . . . . . . . . . . . . . . . . . . . . . . . 455.6 — — 455.6Small/Mid-cap domestic . . . . . . . . . . . . . . . . . . . . . . . . . . . . . . . 83.5 — — 83.5International commingled funds(3) . . . . . . . . . . . . . . . . . . . . . . . — 191.8 — 191.8Limited partnerships(4) . . . . . . . . . . . . . . . . . . . . . . . . . . . . . . . . — — 65.2 65.2
Total equity securities . . . . . . . . . . . . . . . . . . . . . . . . . . . . . . . . . . . . . 539.1 191.8 65.2 796.1Other investments:
Real estate(5) . . . . . . . . . . . . . . . . . . . . . . . . . . . . . . . . . . . . . . . . — — 81.8 81.8Limited partnerships(6) . . . . . . . . . . . . . . . . . . . . . . . . . . . . . . . . — — 82.1 82.1Futures . . . . . . . . . . . . . . . . . . . . . . . . . . . . . . . . . . . . . . . . . . . . . 1.1 — — 1.1
Total other investments . . . . . . . . . . . . . . . . . . . . . . . . . . . . . . . . . . . . 1.1 — 163.9 165.0Net, total pension assets . . . . . . . . . . . . . . . . . . . . . . . . . . . . . . . . . . . . . . $620.3 $808.3 $229.1 $1,657.7
(1) Level 3 net assets accounted for 13.8% of total net assets measured at fair value on a recurring basis.(2) This category includes common collective trust funds invested in the Short-term Investment Fund. The Short-term Investment Fund is
designed to provide a rate of return by investing in a full range of high-quality, short-term money market securities. Participantsredemptions in the Short-term Investment Fund were the result of the normal course of business, the Trustee permitted redemptions incash. In order to control liquidity and realized losses on the sale of securities in the Short-term Investment Fund, requests for cashredemptions were not permitted where participants desired to exit the Short-term investment fund.
(3) International Commingled funds are comprised of two assets that use NAV to calculate fair value. Baillie Gifford Fundshas a balance of $93.3 and uses a bottom up approach to stock picking. In determining the potential of a company, the fundmanager analyzes industry background, competitive advantage, management attitudes and financial strength and valuation.There are no redemption restrictions in the Baillie Gifford Funds. Silchester has a fund balance of $98.5 that has aninvestment objective to achieve long-term growth primarily by investing in a diversified portfolio of equity securities ofcompanies located in any country other than the United States. Silchester clients may contribute to and redeem moneysfrom the funds on a monthly basis as of the first business day of each month. Clients must notify Silchester at least sixbusiness days before the month-end to make a redemption request. Baillie Gifford and Silchester, as a normal course ofbusiness, enter into contracts (commitments) that contain indemnifications or warranties. The funds’ maximum exposureunder these arrangements is unknown, as this would involve future claims that have not yet occurred. Baillie Gifford andSilchester have no unfunded commitments.
(4) Limited partnerships are comprised of two assets that use NAV to calculate fair value. Pantheon Europe has a balance of $12.1 andPantheon USA has a balance of $53.1. Their strategy is to create a portfolio of high quality private equity funds, operating across Europeand diversified by stage, sector, geography, manager and vintage year. For the year ended December 31, 2014, Pantheon Europe andPantheon USA have unfunded commitments of $2.4 and $7.8, respectively, and there were no significant redemption restrictions.
(5) UBS Trumbull Property Fund (“UBS”) uses the NAV to calculate fair value. UBS has a balance of $81.8 and is an actively managedcore portfolio of equity real estate. The Fund has both relative and real return objectives. Its relative performance objective is tooutperform the NFI_ODCE index over any given three-to-five-year period. The Fund’s real return performance objective is to achieveat least a 5.0% real rate of return (i.e., inflation-adjusted return), before advisory fees, over any given three-to-five-year period.
(6) MIL has a balance of $82.1 and is designed to realize appreciation in value primarily through the allocation of capitaldirectly and indirectly among investment funds and accounts.
293

Voya Financial, Inc.Notes to the Consolidated Financial Statements(Dollar amounts in millions, unless otherwise stated)
As described in the Fair Value Measurements (excluding Consolidated Investment Entities) Note to these ConsolidatedFinancial Statements, pension plan assets are categorized into a three-level fair value hierarchy based upon the inputs availablein evaluating each of the assets. The fair value hierarchy gives the highest priority to quoted prices in active markets foridentical assets (Level 1) and the lowest priority to unobservable inputs (Level 3). The leveling hierarchy is applied to thepension plans assets as follows:
Cash and cash equivalents: The carrying amounts for cash and cash equivalents reflect the assets’ fair value. The fair values forcash and cash equivalents are determined based on quoted market prices. These assets are classified as Level 1.
Short-term Investment Funds: Short term investment funds are valued by investment managers and are reported as a NAV pershare and are classified as Level 2. See subscript (2) in Fair Value Hierarchy table footnotes for a description of the fund’sredemption policies.
U.S. Government securities, corporate bonds and notes and foreign securities: Fair values for actively traded marketable bondsare determined based upon quoted market prices or dealer quotes and are classified as Level 1 assets. Corporate bonds, ABS andU.S. agency bonds use observable pricing method such as matrix pricing, market corroborated pricing or inputs such as yieldcurves and indices. These investments are classified as Level 2.
International Commingled Funds: Commingled funds are classified as Level 2 investments. These investments categorizealternative assets as Level 2 when there is an ability to redeem its investments with the investee at the NAV per share at themeasurement date. If it is redeemable at a future date, the entity must consider the length of time in which the investment isredeemable in making the determination of the fair value hierarchy level. See subscript (3) in Fair Value Hierarchy tablefootnotes for description of the fund’s redemption policies.
Equity securities: Fair values are based upon a quoted market price determined in an active market and are included in Level 1.The valuations obtained from broker-dealers are non-binding.
Real estate: Real estate is based on unobservable inputs. The fair value used relies on the investment manager’s ownassumptions and the use of appraisals. These investments are included in Level 3. The fair value of the investment in thiscategory has been estimated using the NAV per share. See subscript (5) in Fair Value Hierarchy table footnotes for moreinformation on real estate.
Limited partnerships: Limited partnerships are classified as Level 3 because of the investment manager’s use of unobservableinputs in its valuation assumptions. The fair value of the investments in this category has been estimated using the NAV pershare. See subscript (6) in Fair Value Hierarchy table footnotes for more information on limited partnerships.
Derivatives: Futures contracts are based on unadjusted quoted prices from an active exchange and therefore, are classified asLevel 1.
Transfers in and out of Level 1 and 2
There were no securities transferred between Level 1 and Level 2 for the years ended December 31, 2015 and 2014. TheCompany’s policy is to recognize transfers in and transfers out as of the beginning of the reporting period.
294
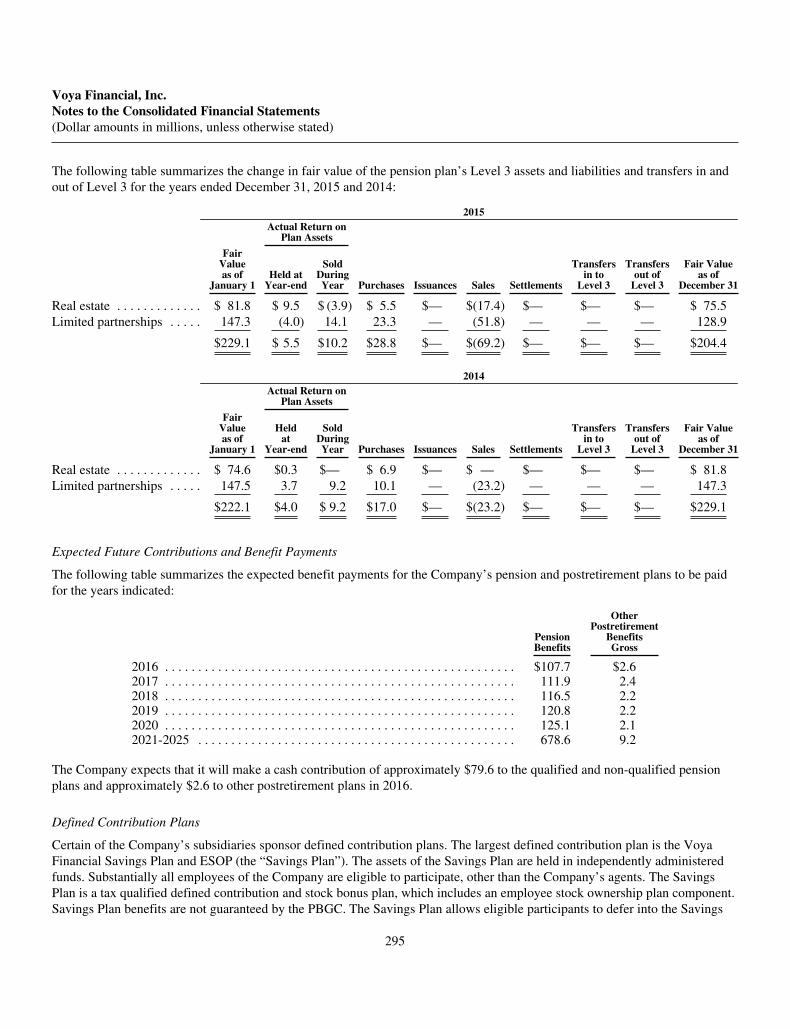
Voya Financial, Inc.Notes to the Consolidated Financial Statements(Dollar amounts in millions, unless otherwise stated)
The following table summarizes the change in fair value of the pension plan’s Level 3 assets and liabilities and transfers in andout of Level 3 for the years ended December 31, 2015 and 2014:
2015Actual Return on
Plan Assets
Settlements
Transfersin to
Level 3
Transfersout of
Level 3
FairValueas of
January 1Held at
Year-end
SoldDuringYear Purchases Issuances Sales
Fair Valueas of
December 31
Real estate . . . . . . . . . . . . . $ 81.8 $ 9.5 $ (3.9) $ 5.5 $— $(17.4) $— $— $— $ 75.5Limited partnerships . . . . . 147.3 (4.0) 14.1 23.3 — (51.8) — — — 128.9
$229.1 $ 5.5 $10.2 $28.8 $— $(69.2) $— $— $— $204.4
2014Actual Return on
Plan Assets
Settlements
Transfersin to
Level 3
Transfersout of
Level 3
FairValueas of
January 1
Heldat
Year-end
SoldDuringYear Purchases Issuances Sales
Fair Valueas of
December 31
Real estate . . . . . . . . . . . . . $ 74.6 $0.3 $— $ 6.9 $— $ — $— $— $— $ 81.8Limited partnerships . . . . . 147.5 3.7 9.2 10.1 — (23.2) — — — 147.3
$222.1 $4.0 $ 9.2 $17.0 $— $(23.2) $— $— $— $229.1
Expected Future Contributions and Benefit Payments
The following table summarizes the expected benefit payments for the Company’s pension and postretirement plans to be paidfor the years indicated:
PensionBenefits
OtherPostretirement
BenefitsGross
2016 . . . . . . . . . . . . . . . . . . . . . . . . . . . . . . . . . . . . . . . . . . . . . . . . . . . . . $107.7 $2.62017 . . . . . . . . . . . . . . . . . . . . . . . . . . . . . . . . . . . . . . . . . . . . . . . . . . . . . 111.9 2.42018 . . . . . . . . . . . . . . . . . . . . . . . . . . . . . . . . . . . . . . . . . . . . . . . . . . . . . 116.5 2.22019 . . . . . . . . . . . . . . . . . . . . . . . . . . . . . . . . . . . . . . . . . . . . . . . . . . . . . 120.8 2.22020 . . . . . . . . . . . . . . . . . . . . . . . . . . . . . . . . . . . . . . . . . . . . . . . . . . . . . 125.1 2.12021-2025 . . . . . . . . . . . . . . . . . . . . . . . . . . . . . . . . . . . . . . . . . . . . . . . . 678.6 9.2
The Company expects that it will make a cash contribution of approximately $79.6 to the qualified and non-qualified pensionplans and approximately $2.6 to other postretirement plans in 2016.
Defined Contribution Plans
Certain of the Company’s subsidiaries sponsor defined contribution plans. The largest defined contribution plan is the VoyaFinancial Savings Plan and ESOP (the “Savings Plan”). The assets of the Savings Plan are held in independently administeredfunds. Substantially all employees of the Company are eligible to participate, other than the Company’s agents. The SavingsPlan is a tax qualified defined contribution and stock bonus plan, which includes an employee stock ownership plan component.Savings Plan benefits are not guaranteed by the PBGC. The Savings Plan allows eligible participants to defer into the Savings
295
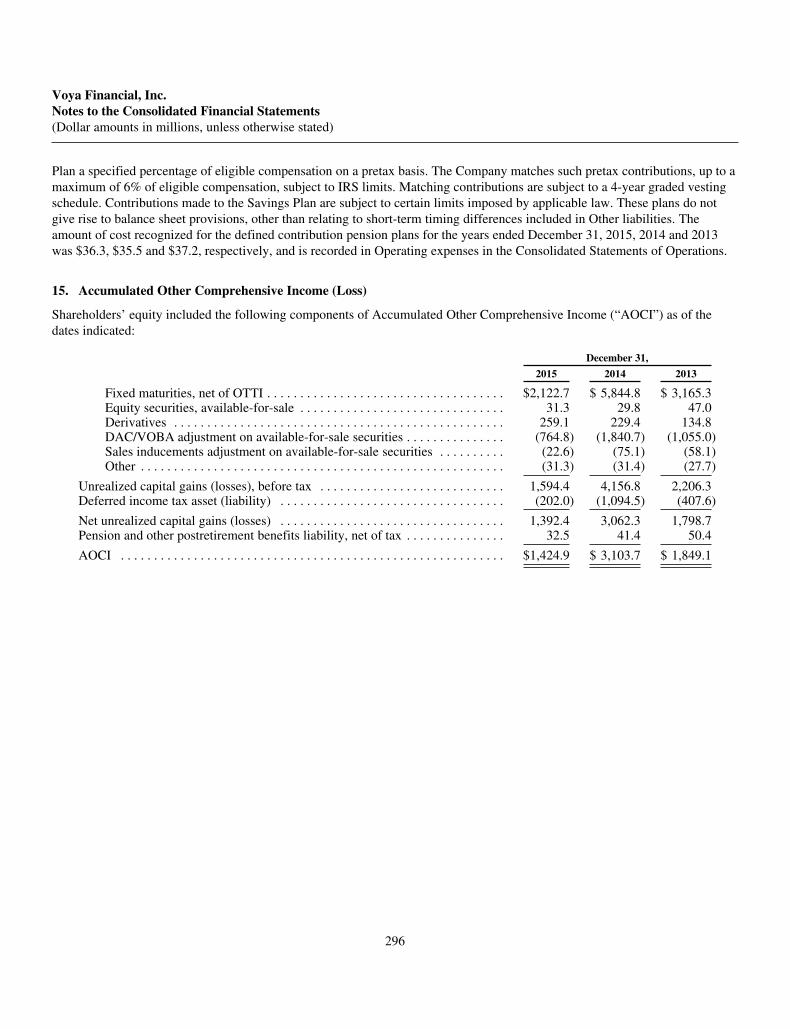
Voya Financial, Inc.Notes to the Consolidated Financial Statements(Dollar amounts in millions, unless otherwise stated)
Plan a specified percentage of eligible compensation on a pretax basis. The Company matches such pretax contributions, up to amaximum of 6% of eligible compensation, subject to IRS limits. Matching contributions are subject to a 4-year graded vestingschedule. Contributions made to the Savings Plan are subject to certain limits imposed by applicable law. These plans do notgive rise to balance sheet provisions, other than relating to short-term timing differences included in Other liabilities. Theamount of cost recognized for the defined contribution pension plans for the years ended December 31, 2015, 2014 and 2013was $36.3, $35.5 and $37.2, respectively, and is recorded in Operating expenses in the Consolidated Statements of Operations.
15. Accumulated Other Comprehensive Income (Loss)
Shareholders’ equity included the following components of Accumulated Other Comprehensive Income (“AOCI”) as of thedates indicated:
December 31,
2015 2014 2013
Fixed maturities, net of OTTI . . . . . . . . . . . . . . . . . . . . . . . . . . . . . . . . . . . . $2,122.7 $ 5,844.8 $ 3,165.3Equity securities, available-for-sale . . . . . . . . . . . . . . . . . . . . . . . . . . . . . . . 31.3 29.8 47.0Derivatives . . . . . . . . . . . . . . . . . . . . . . . . . . . . . . . . . . . . . . . . . . . . . . . . . . 259.1 229.4 134.8DAC/VOBA adjustment on available-for-sale securities . . . . . . . . . . . . . . . (764.8) (1,840.7) (1,055.0)Sales inducements adjustment on available-for-sale securities . . . . . . . . . . (22.6) (75.1) (58.1)Other . . . . . . . . . . . . . . . . . . . . . . . . . . . . . . . . . . . . . . . . . . . . . . . . . . . . . . . (31.3) (31.4) (27.7)
Unrealized capital gains (losses), before tax . . . . . . . . . . . . . . . . . . . . . . . . . . . . 1,594.4 4,156.8 2,206.3Deferred income tax asset (liability) . . . . . . . . . . . . . . . . . . . . . . . . . . . . . . . . . . (202.0) (1,094.5) (407.6)
Net unrealized capital gains (losses) . . . . . . . . . . . . . . . . . . . . . . . . . . . . . . . . . . 1,392.4 3,062.3 1,798.7Pension and other postretirement benefits liability, net of tax . . . . . . . . . . . . . . . 32.5 41.4 50.4
AOCI . . . . . . . . . . . . . . . . . . . . . . . . . . . . . . . . . . . . . . . . . . . . . . . . . . . . . . . . . . $1,424.9 $ 3,103.7 $ 1,849.1
296
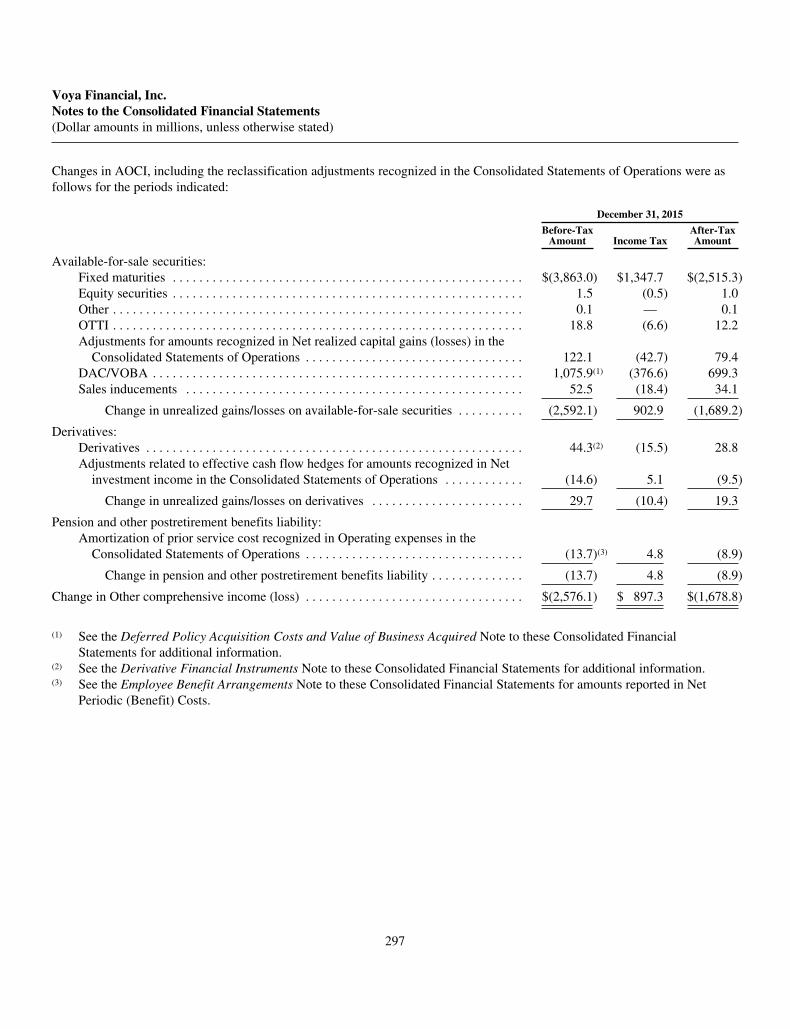
Voya Financial, Inc.Notes to the Consolidated Financial Statements(Dollar amounts in millions, unless otherwise stated)
Changes in AOCI, including the reclassification adjustments recognized in the Consolidated Statements of Operations were asfollows for the periods indicated:
December 31, 2015
Before-TaxAmount Income Tax
After-TaxAmount
Available-for-sale securities:Fixed maturities . . . . . . . . . . . . . . . . . . . . . . . . . . . . . . . . . . . . . . . . . . . . . . . . . . . . . $(3,863.0) $1,347.7 $(2,515.3)Equity securities . . . . . . . . . . . . . . . . . . . . . . . . . . . . . . . . . . . . . . . . . . . . . . . . . . . . . 1.5 (0.5) 1.0Other . . . . . . . . . . . . . . . . . . . . . . . . . . . . . . . . . . . . . . . . . . . . . . . . . . . . . . . . . . . . . . 0.1 — 0.1OTTI . . . . . . . . . . . . . . . . . . . . . . . . . . . . . . . . . . . . . . . . . . . . . . . . . . . . . . . . . . . . . . 18.8 (6.6) 12.2Adjustments for amounts recognized in Net realized capital gains (losses) in the
Consolidated Statements of Operations . . . . . . . . . . . . . . . . . . . . . . . . . . . . . . . . . 122.1 (42.7) 79.4DAC/VOBA . . . . . . . . . . . . . . . . . . . . . . . . . . . . . . . . . . . . . . . . . . . . . . . . . . . . . . . . 1,075.9(1) (376.6) 699.3Sales inducements . . . . . . . . . . . . . . . . . . . . . . . . . . . . . . . . . . . . . . . . . . . . . . . . . . . 52.5 (18.4) 34.1
Change in unrealized gains/losses on available-for-sale securities . . . . . . . . . . (2,592.1) 902.9 (1,689.2)
Derivatives:Derivatives . . . . . . . . . . . . . . . . . . . . . . . . . . . . . . . . . . . . . . . . . . . . . . . . . . . . . . . . . 44.3(2) (15.5) 28.8Adjustments related to effective cash flow hedges for amounts recognized in Net
investment income in the Consolidated Statements of Operations . . . . . . . . . . . . (14.6) 5.1 (9.5)
Change in unrealized gains/losses on derivatives . . . . . . . . . . . . . . . . . . . . . . . 29.7 (10.4) 19.3
Pension and other postretirement benefits liability:Amortization of prior service cost recognized in Operating expenses in the
Consolidated Statements of Operations . . . . . . . . . . . . . . . . . . . . . . . . . . . . . . . . . (13.7)(3) 4.8 (8.9)
Change in pension and other postretirement benefits liability . . . . . . . . . . . . . . (13.7) 4.8 (8.9)
Change in Other comprehensive income (loss) . . . . . . . . . . . . . . . . . . . . . . . . . . . . . . . . . $(2,576.1) $ 897.3 $(1,678.8)
(1) See the Deferred Policy Acquisition Costs and Value of Business Acquired Note to these Consolidated FinancialStatements for additional information.
(2) See the Derivative Financial Instruments Note to these Consolidated Financial Statements for additional information.(3) See the Employee Benefit Arrangements Note to these Consolidated Financial Statements for amounts reported in Net
Periodic (Benefit) Costs.
297

Voya Financial, Inc.Notes to the Consolidated Financial Statements(Dollar amounts in millions, unless otherwise stated)
December 31, 2014
Before-TaxAmount
IncomeTax
After-TaxAmount
Available-for-sale securities:Fixed maturities . . . . . . . . . . . . . . . . . . . . . . . . . . . . . . . . . . . . . . . . . . . . . . . . . . . . . . . . $2,693.0 $(946.8) $1,746.2Equity securities . . . . . . . . . . . . . . . . . . . . . . . . . . . . . . . . . . . . . . . . . . . . . . . . . . . . . . . (17.2) 6.0 (11.2)Other . . . . . . . . . . . . . . . . . . . . . . . . . . . . . . . . . . . . . . . . . . . . . . . . . . . . . . . . . . . . . . . . (3.7) 1.3 (2.4)OTTI . . . . . . . . . . . . . . . . . . . . . . . . . . . . . . . . . . . . . . . . . . . . . . . . . . . . . . . . . . . . . . . . 40.0 (14.0) 26.0Adjustments for amounts recognized in Net realized capital gains (losses) in the
Consolidated Statements of Operations . . . . . . . . . . . . . . . . . . . . . . . . . . . . . . . . . . . (53.5) 18.7 (34.8)DAC/VOBA . . . . . . . . . . . . . . . . . . . . . . . . . . . . . . . . . . . . . . . . . . . . . . . . . . . . . . . . . . (785.7)(1) 275.0 (510.7)Sales inducements . . . . . . . . . . . . . . . . . . . . . . . . . . . . . . . . . . . . . . . . . . . . . . . . . . . . . . (17.0) 6.0 (11.0)
Change in unrealized gains/losses on available-for-sale securities . . . . . . . . . . . . . 1,855.9 (653.8) 1,202.1
Derivatives:Derivatives . . . . . . . . . . . . . . . . . . . . . . . . . . . . . . . . . . . . . . . . . . . . . . . . . . . . . . . . . . . . 102.0(2) (35.7) 66.3Adjustments related to effective cash flow hedges for amounts recognized in Net
investment income in the Consolidated Statements of Operations . . . . . . . . . . . . . . . (7.4) 2.6 (4.8)
Change in unrealized gains/losses on derivatives . . . . . . . . . . . . . . . . . . . . . . . . . . 94.6 (33.1) 61.5
Pension and other postretirement benefits liability:Amortization of prior service cost recognized in Operating expenses in the
Consolidated Statements of Operations . . . . . . . . . . . . . . . . . . . . . . . . . . . . . . . . . . . (13.8)(3) 4.8 (9.0)
Change in pension and other postretirement benefits liability . . . . . . . . . . . . . . . . (13.8) 4.8 (9.0)
Change in Other comprehensive income (loss) . . . . . . . . . . . . . . . . . . . . . . . . . . . . . . . . . . . . $1,936.7 $(682.1) $1,254.6
(1) See the Deferred Policy Acquisition Costs and Value of Business Acquired Note to these Consolidated FinancialStatements for additional information.
(2) See the Derivative Financial Instruments Note to these Consolidated Financial Statements for additional information.(3) See the Employee Benefit Arrangements Note to these Consolidated Financial Statements for amounts reported in Net
Periodic (Benefit) Costs.
298
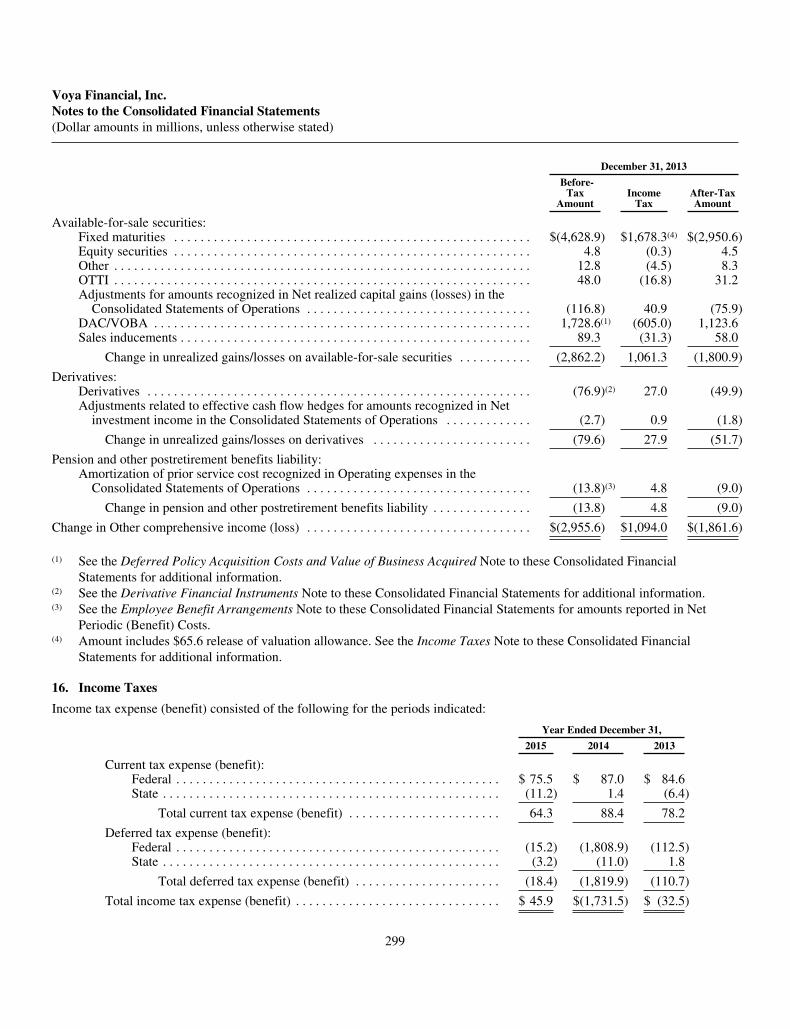
Voya Financial, Inc.Notes to the Consolidated Financial Statements(Dollar amounts in millions, unless otherwise stated)
December 31, 2013
Before-Tax
AmountIncome
TaxAfter-TaxAmount
Available-for-sale securities:Fixed maturities . . . . . . . . . . . . . . . . . . . . . . . . . . . . . . . . . . . . . . . . . . . . . . . . . . . . . . $(4,628.9) $1,678.3(4) $(2,950.6)Equity securities . . . . . . . . . . . . . . . . . . . . . . . . . . . . . . . . . . . . . . . . . . . . . . . . . . . . . . 4.8 (0.3) 4.5Other . . . . . . . . . . . . . . . . . . . . . . . . . . . . . . . . . . . . . . . . . . . . . . . . . . . . . . . . . . . . . . . 12.8 (4.5) 8.3OTTI . . . . . . . . . . . . . . . . . . . . . . . . . . . . . . . . . . . . . . . . . . . . . . . . . . . . . . . . . . . . . . . 48.0 (16.8) 31.2Adjustments for amounts recognized in Net realized capital gains (losses) in the
Consolidated Statements of Operations . . . . . . . . . . . . . . . . . . . . . . . . . . . . . . . . . . (116.8) 40.9 (75.9)DAC/VOBA . . . . . . . . . . . . . . . . . . . . . . . . . . . . . . . . . . . . . . . . . . . . . . . . . . . . . . . . . 1,728.6(1) (605.0) 1,123.6Sales inducements . . . . . . . . . . . . . . . . . . . . . . . . . . . . . . . . . . . . . . . . . . . . . . . . . . . . . 89.3 (31.3) 58.0
Change in unrealized gains/losses on available-for-sale securities . . . . . . . . . . . (2,862.2) 1,061.3 (1,800.9)
Derivatives:Derivatives . . . . . . . . . . . . . . . . . . . . . . . . . . . . . . . . . . . . . . . . . . . . . . . . . . . . . . . . . . (76.9)(2) 27.0 (49.9)Adjustments related to effective cash flow hedges for amounts recognized in Net
investment income in the Consolidated Statements of Operations . . . . . . . . . . . . . (2.7) 0.9 (1.8)
Change in unrealized gains/losses on derivatives . . . . . . . . . . . . . . . . . . . . . . . . (79.6) 27.9 (51.7)
Pension and other postretirement benefits liability:Amortization of prior service cost recognized in Operating expenses in the
Consolidated Statements of Operations . . . . . . . . . . . . . . . . . . . . . . . . . . . . . . . . . . (13.8)(3) 4.8 (9.0)
Change in pension and other postretirement benefits liability . . . . . . . . . . . . . . . (13.8) 4.8 (9.0)
Change in Other comprehensive income (loss) . . . . . . . . . . . . . . . . . . . . . . . . . . . . . . . . . . $(2,955.6) $1,094.0 $(1,861.6)
(1) See the Deferred Policy Acquisition Costs and Value of Business Acquired Note to these Consolidated FinancialStatements for additional information.
(2) See the Derivative Financial Instruments Note to these Consolidated Financial Statements for additional information.(3) See the Employee Benefit Arrangements Note to these Consolidated Financial Statements for amounts reported in Net
Periodic (Benefit) Costs.(4) Amount includes $65.6 release of valuation allowance. See the Income Taxes Note to these Consolidated Financial
Statements for additional information.
16. Income Taxes
Income tax expense (benefit) consisted of the following for the periods indicated:
Year Ended December 31,
2015 2014 2013
Current tax expense (benefit):Federal . . . . . . . . . . . . . . . . . . . . . . . . . . . . . . . . . . . . . . . . . . . . . . . . . $ 75.5 $ 87.0 $ 84.6State . . . . . . . . . . . . . . . . . . . . . . . . . . . . . . . . . . . . . . . . . . . . . . . . . . . (11.2) 1.4 (6.4)
Total current tax expense (benefit) . . . . . . . . . . . . . . . . . . . . . . . 64.3 88.4 78.2
Deferred tax expense (benefit):Federal . . . . . . . . . . . . . . . . . . . . . . . . . . . . . . . . . . . . . . . . . . . . . . . . . (15.2) (1,808.9) (112.5)State . . . . . . . . . . . . . . . . . . . . . . . . . . . . . . . . . . . . . . . . . . . . . . . . . . . (3.2) (11.0) 1.8
Total deferred tax expense (benefit) . . . . . . . . . . . . . . . . . . . . . . (18.4) (1,819.9) (110.7)
Total income tax expense (benefit) . . . . . . . . . . . . . . . . . . . . . . . . . . . . . . . $ 45.9 $(1,731.5) $ (32.5)
299

Voya Financial, Inc.Notes to the Consolidated Financial Statements(Dollar amounts in millions, unless otherwise stated)
Income taxes were different from the amount computed by applying the federal income tax rate to Income (loss) before incometaxes for the following reasons for the periods indicated:
Year Ended December 31,
2015 2014 2013
Income (loss) before income taxes . . . . . . . . . . . . . . . . . . . . . . . . . . . . . . $ 584.5 $ 801.2 $ 756.1Tax Rate . . . . . . . . . . . . . . . . . . . . . . . . . . . . . . . . . . . . . . . . . . . . . . . . . . 35.0% 35.0% 35.0%
Income tax expense (benefit) at federal statutory rate . . . . . . . . . . . . . . . 204.5 280.4 264.6Tax effect of:
Valuation allowance . . . . . . . . . . . . . . . . . . . . . . . . . . . . . . . . . . . . . (13.7) (1,834.9) (85.9)Dividend received deduction . . . . . . . . . . . . . . . . . . . . . . . . . . . . . . . (109.3) (99.0) (119.3)Audit settlement . . . . . . . . . . . . . . . . . . . . . . . . . . . . . . . . . . . . . . . . (0.1) (1.7) (4.1)State tax expense (benefit) . . . . . . . . . . . . . . . . . . . . . . . . . . . . . . . . 2.3 2.0 5.9Noncontrolling interest . . . . . . . . . . . . . . . . . . . . . . . . . . . . . . . . . . . (45.6) (83.2) (66.5)Tax credits . . . . . . . . . . . . . . . . . . . . . . . . . . . . . . . . . . . . . . . . . . . . . 6.7 1.8 (14.8)Nondeductible expenses . . . . . . . . . . . . . . . . . . . . . . . . . . . . . . . . . . 3.1 1.2 (14.6)Other . . . . . . . . . . . . . . . . . . . . . . . . . . . . . . . . . . . . . . . . . . . . . . . . . (2.0) 1.9 2.2
Income tax expense (benefit) . . . . . . . . . . . . . . . . . . . . . . . . . . . . . . . . . . $ 45.9 $(1,731.5) $ (32.5)
Effective tax rate . . . . . . . . . . . . . . . . . . . . . . . . . . . . . . . . . . . . . . . . . . . . 7.9% (216.1)% (4.3)%
Temporary Differences
The tax effects of temporary differences that give rise to deferred tax assets and deferred tax liabilities were as follows as of thedates indicated:
December 31,
2015 2014
Deferred tax assetsFederal and state loss carryforwards . . . . . . . . . . . . . . . . . . . . . . . . . . . . . . . . $ 1,118.8 $ 1,100.6Investments . . . . . . . . . . . . . . . . . . . . . . . . . . . . . . . . . . . . . . . . . . . . . . . . . . . . 2,684.3 2,959.7Insurance reserves . . . . . . . . . . . . . . . . . . . . . . . . . . . . . . . . . . . . . . . . . . . . . . . 942.6 739.8Compensation and benefits . . . . . . . . . . . . . . . . . . . . . . . . . . . . . . . . . . . . . . . . 490.2 502.2Other assets . . . . . . . . . . . . . . . . . . . . . . . . . . . . . . . . . . . . . . . . . . . . . . . . . . . . 450.8 483.6
Total gross assets before valuation allowance . . . . . . . . . . . . . . . . . . . . . . . . . 5,686.7 5,785.9Less: Valuation allowance . . . . . . . . . . . . . . . . . . . . . . . . . . . . . . . . . . . . 963.1 971.9
Assets, net of valuation allowance . . . . . . . . . . . . . . . . . . . . . . . . . . . . . . . . . . 4,723.6 4,814.0
Deferred tax liabilitiesNet unrealized investment gains . . . . . . . . . . . . . . . . . . . . . . . . . . . . . . . . . . . . (833.6) (2,125.4)Deferred policy acquisition costs . . . . . . . . . . . . . . . . . . . . . . . . . . . . . . . . . . . (1,633.7) (1,331.3)Other liabilities . . . . . . . . . . . . . . . . . . . . . . . . . . . . . . . . . . . . . . . . . . . . . . . . . (41.5) (57.4)
Total gross liabilities . . . . . . . . . . . . . . . . . . . . . . . . . . . . . . . . . . . . . . . . (2,508.8) (3,514.1)
Net deferred income tax asset (liability) . . . . . . . . . . . . . . . . . . . . . . . . . . . . . . . . . $ 2,214.8 $ 1,299.9
300
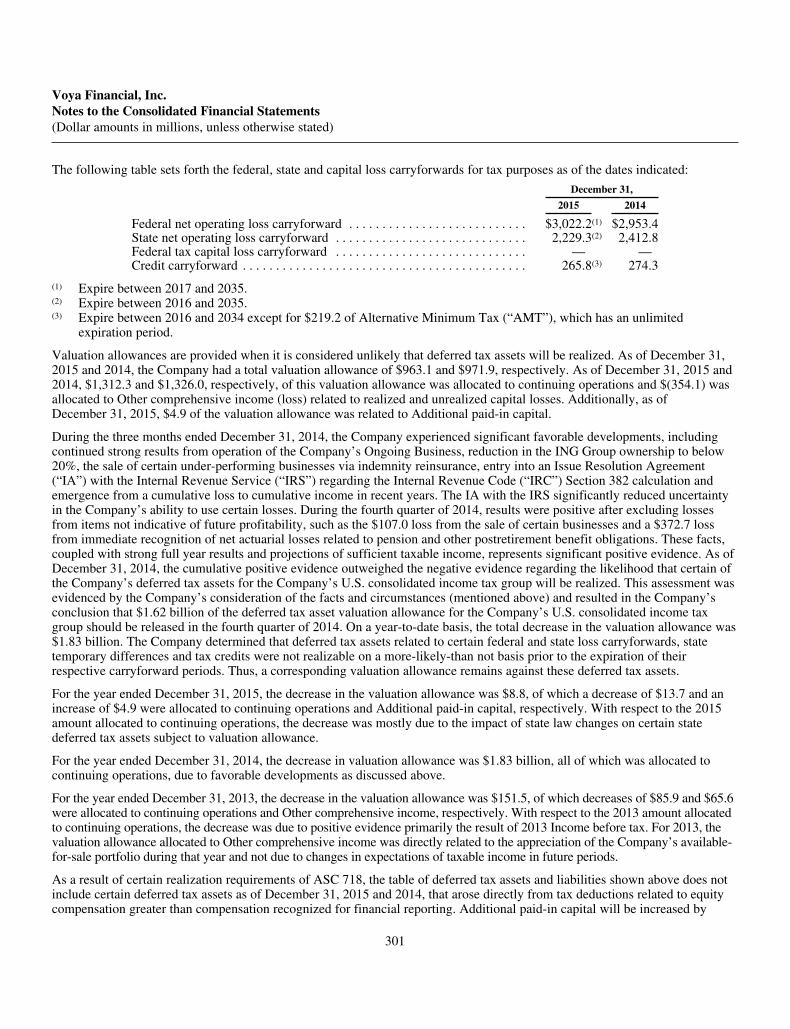
Voya Financial, Inc.Notes to the Consolidated Financial Statements(Dollar amounts in millions, unless otherwise stated)
The following table sets forth the federal, state and capital loss carryforwards for tax purposes as of the dates indicated:
December 31,
2015 2014
Federal net operating loss carryforward . . . . . . . . . . . . . . . . . . . . . . . . . . . $3,022.2(1) $2,953.4State net operating loss carryforward . . . . . . . . . . . . . . . . . . . . . . . . . . . . . 2,229.3(2) 2,412.8Federal tax capital loss carryforward . . . . . . . . . . . . . . . . . . . . . . . . . . . . . — —Credit carryforward . . . . . . . . . . . . . . . . . . . . . . . . . . . . . . . . . . . . . . . . . . . 265.8(3) 274.3
(1) Expire between 2017 and 2035.(2) Expire between 2016 and 2035.(3) Expire between 2016 and 2034 except for $219.2 of Alternative Minimum Tax (“AMT”), which has an unlimited
expiration period.
Valuation allowances are provided when it is considered unlikely that deferred tax assets will be realized. As of December 31,2015 and 2014, the Company had a total valuation allowance of $963.1 and $971.9, respectively. As of December 31, 2015 and2014, $1,312.3 and $1,326.0, respectively, of this valuation allowance was allocated to continuing operations and $(354.1) wasallocated to Other comprehensive income (loss) related to realized and unrealized capital losses. Additionally, as ofDecember 31, 2015, $4.9 of the valuation allowance was related to Additional paid-in capital.
During the three months ended December 31, 2014, the Company experienced significant favorable developments, includingcontinued strong results from operation of the Company’s Ongoing Business, reduction in the ING Group ownership to below20%, the sale of certain under-performing businesses via indemnity reinsurance, entry into an Issue Resolution Agreement(“IA”) with the Internal Revenue Service (“IRS”) regarding the Internal Revenue Code (“IRC”) Section 382 calculation andemergence from a cumulative loss to cumulative income in recent years. The IA with the IRS significantly reduced uncertaintyin the Company’s ability to use certain losses. During the fourth quarter of 2014, results were positive after excluding lossesfrom items not indicative of future profitability, such as the $107.0 loss from the sale of certain businesses and a $372.7 lossfrom immediate recognition of net actuarial losses related to pension and other postretirement benefit obligations. These facts,coupled with strong full year results and projections of sufficient taxable income, represents significant positive evidence. As ofDecember 31, 2014, the cumulative positive evidence outweighed the negative evidence regarding the likelihood that certain ofthe Company’s deferred tax assets for the Company’s U.S. consolidated income tax group will be realized. This assessment wasevidenced by the Company’s consideration of the facts and circumstances (mentioned above) and resulted in the Company’sconclusion that $1.62 billion of the deferred tax asset valuation allowance for the Company’s U.S. consolidated income taxgroup should be released in the fourth quarter of 2014. On a year-to-date basis, the total decrease in the valuation allowance was$1.83 billion. The Company determined that deferred tax assets related to certain federal and state loss carryforwards, statetemporary differences and tax credits were not realizable on a more-likely-than not basis prior to the expiration of theirrespective carryforward periods. Thus, a corresponding valuation allowance remains against these deferred tax assets.
For the year ended December 31, 2015, the decrease in the valuation allowance was $8.8, of which a decrease of $13.7 and anincrease of $4.9 were allocated to continuing operations and Additional paid-in capital, respectively. With respect to the 2015amount allocated to continuing operations, the decrease was mostly due to the impact of state law changes on certain statedeferred tax assets subject to valuation allowance.
For the year ended December 31, 2014, the decrease in valuation allowance was $1.83 billion, all of which was allocated tocontinuing operations, due to favorable developments as discussed above.
For the year ended December 31, 2013, the decrease in the valuation allowance was $151.5, of which decreases of $85.9 and $65.6were allocated to continuing operations and Other comprehensive income, respectively. With respect to the 2013 amount allocatedto continuing operations, the decrease was due to positive evidence primarily the result of 2013 Income before tax. For 2013, thevaluation allowance allocated to Other comprehensive income was directly related to the appreciation of the Company’s available-for-sale portfolio during that year and not due to changes in expectations of taxable income in future periods.
As a result of certain realization requirements of ASC 718, the table of deferred tax assets and liabilities shown above does notinclude certain deferred tax assets as of December 31, 2015 and 2014, that arose directly from tax deductions related to equitycompensation greater than compensation recognized for financial reporting. Additional paid-in capital will be increased by
301

Voya Financial, Inc.Notes to the Consolidated Financial Statements(Dollar amounts in millions, unless otherwise stated)
$15.4 and $10.2, respectively, if and when such deferred tax assets are ultimately realized. The Company uses tax law orderingwhen determining when excess tax benefits have been realized.
Unrecognized Tax Benefits
Reconciliations of the change in the unrecognized income tax benefits were as follows for the periods indicated:
Year Ended December 31,
2015 2014 2013
Balance at beginning of period . . . . . . . . . . . . . . . . . . . . . . . . . . . . . . . . . . . . . . . $ 62.4 $60.9 $61.1Additions for tax positions related to current year . . . . . . . . . . . . . . . . . . . . . . . . 3.4 4.7 1.7Additions for tax positions related to prior years . . . . . . . . . . . . . . . . . . . . . . . . . — 4.9 4.4Reductions for tax positions related to prior years . . . . . . . . . . . . . . . . . . . . . . . . (18.1) (6.1) (1.2)Reductions for settlements with taxing authorities . . . . . . . . . . . . . . . . . . . . . . . . (2.2) (0.2) —Reductions for expiring statutes . . . . . . . . . . . . . . . . . . . . . . . . . . . . . . . . . . . . . . (0.3) (1.8) (5.1)
Balance at end of period . . . . . . . . . . . . . . . . . . . . . . . . . . . . . . . . . . . . . . . . . . . . $ 45.2 $62.4 $60.9
The Company had $9.1, $14.1 and $16.1 of unrecognized tax benefits as of December 31, 2015, 2014 and 2013, respectively,which would affect the Company’s effective rate if recognized.
Interest and Penalties
The Company recognizes interest expense and penalties, if applicable, related to unrecognized tax benefits in tax expense net offederal income tax. The total amounts of gross accrued interest and penalties on the Company’s Consolidated Balance Sheets asof December 31, 2015 and 2014 were $1.2 and $7.0, respectively. The Company recognized gross interest (benefit) related tounrecognized tax in its Consolidated Statements of Operations of $(5.8), $0.8 and $0.3 for the years ended December 31, 2015,2014 and 2013, respectively.
The timing of the payment of the remaining allowance of $45.2 cannot be reasonably estimated.
Tax Regulatory Matters
During April 2015, the IRS completed its examination of the Company’s returns through tax year 2013. The 2013 auditsettlement did not have a material impact on the Company. The Company is currently under audit by the IRS, and it is expectedthat the examination of tax year 2014 will be finalized within the next twelve months. The Company and the IRS have agreed toparticipate in the Compliance Assurance Process for the tax years 2014 through 2016.
The IRS issued a Directive dated July 17, 2014 that it should not challenge the qualification of certain hedges and should notchallenge certain tax accounting methods. The Company does not expect this Directive to have a material impact on theCompany.
302

Voya Financial, Inc.Notes to the Consolidated Financial Statements(Dollar amounts in millions, unless otherwise stated)
17. Financing Agreements
Short-term Debt
The Company did not have any short-term debt borrowings outstanding as of December 31, 2015 and 2014.
Long-term Debt
The following table summarizes the carrying value of the Company’s long-term debt securities issued and outstanding as ofDecember 31, 2015 and 2014:
Maturity 2015 2014
7.25% Voya Holdings Inc. debentures, due 2023(1) . . . . . . . . . . . . . . . . . . . . . . 08/15/2023 $ 159.4 $ 159.07.63% Voya Holdings Inc. debentures, due 2026(1) . . . . . . . . . . . . . . . . . . . . . . 08/15/2026 201.8 232.38.42% Equitable of Iowa Companies Capital Trust II Notes, due 2027 . . . . . . . 04/01/2027 13.7 13.86.97% Voya Holdings Inc. debentures, due 2036(1) . . . . . . . . . . . . . . . . . . . . . . 08/15/2036 108.6 108.61.00% Windsor Property Loan . . . . . . . . . . . . . . . . . . . . . . . . . . . . . . . . . . . . . . 06/14/2027 4.9 4.95.5% Senior Notes, due 2022 . . . . . . . . . . . . . . . . . . . . . . . . . . . . . . . . . . . . . . . 07/15/2022 849.7 849.62.9% Senior Notes, due 2018 . . . . . . . . . . . . . . . . . . . . . . . . . . . . . . . . . . . . . . . 02/15/2018 999.2 998.95.65% Fixed-to-Floating Rate Junior Subordinated Notes, due 2053 . . . . . . . . 05/15/2053 750.0 750.05.7% Senior Notes, due 2043 . . . . . . . . . . . . . . . . . . . . . . . . . . . . . . . . . . . . . . . 07/15/2043 398.6 398.6
Subtotal . . . . . . . . . . . . . . . . . . . . . . . . . . . . . . . . . . . . . . . . . . . . . . . . . . . . . . . . 3,485.9 3,515.7Less: Current portion of long-term debt . . . . . . . . . . . . . . . . . . . . . . . . . . . . . . . — —
Total . . . . . . . . . . . . . . . . . . . . . . . . . . . . . . . . . . . . . . . . . . . . . . . . . . . . . . . . . . $3,485.9 $3,515.7
(1) Guaranteed by ING Group.
As of December 31, 2015 and 2014, the Company was in compliance with its debt covenants.
Unsecured senior debt, which consists of senior fixed rate notes and guarantees of fixed rate notes, ranks highest in priority,followed by subordinated debt, which consists of junior subordinated debt securities.
As of December 31, 2015, aggregate amounts of future principal payments of long-term debt for the next five years andthereafter are as follows:
2016 . . . . . . . . . . . . . . . . . . . . . . . . . . . . . . . . . . . . . . . . . . . . . . . . . . . . . . . . . $ —2017 . . . . . . . . . . . . . . . . . . . . . . . . . . . . . . . . . . . . . . . . . . . . . . . . . . . . . . . . . —2018 . . . . . . . . . . . . . . . . . . . . . . . . . . . . . . . . . . . . . . . . . . . . . . . . . . . . . . . . . 1,000.02019 . . . . . . . . . . . . . . . . . . . . . . . . . . . . . . . . . . . . . . . . . . . . . . . . . . . . . . . . . —2020 . . . . . . . . . . . . . . . . . . . . . . . . . . . . . . . . . . . . . . . . . . . . . . . . . . . . . . . . . —Thereafter . . . . . . . . . . . . . . . . . . . . . . . . . . . . . . . . . . . . . . . . . . . . . . . . . . . . 2,492.8
Total . . . . . . . . . . . . . . . . . . . . . . . . . . . . . . . . . . . . . . . . . . . . . . . . . . . . . . . . $3,492.8
Senior Notes
On July 13, 2012, Voya Financial, Inc. issued $850.0 of unsecured 5.5% Senior Notes due 2022 (the “2022 Notes”) in a privateplacement with registration rights. The 2022 Notes are guaranteed by Voya Holdings. Interest is paid semi-annually, in arrears,on each January 15 and July 15, commencing on January 15, 2013. The Company used the proceeds of the 2022 Notes to repay$500.0 of the direct borrowings under a $3.5 billion Revolving Credit Agreement (“Revolving Credit Agreement”). Theremaining proceeds were used for general corporate purposes, including the retirement of a portion of the Company’soutstanding commercial paper.
303

Voya Financial, Inc.Notes to the Consolidated Financial Statements(Dollar amounts in millions, unless otherwise stated)
On February 11, 2013, Voya Financial, Inc. issued $1.0 billion of unsecured 2.9% Senior Notes due 2018 (the “2018 Notes”), aprivate placement with registration rights. The 2018 Notes are guaranteed by Voya Holdings. Interest is paid semi-annually, inarrears, on each February 15 and August 15, commencing on August 15, 2013. The Company made payments totaling $850.0 onthe Term Loan portion of the Company’s Senior Unsecured Credit Facility from the proceeds of the 2018 Notes. The remainingproceeds were used for general corporate purposes.
On July 26, 2013, Voya Financial, Inc. issued $400.0 of unsecured 5.7% Senior Notes due 2043 (the “2043 Notes”) in a privateplacement with registration rights. The 2043 Notes are guaranteed by Voya Holdings. Interest is paid semi-annually on eachJanuary 15 and July 15, commencing on January 15, 2014. The Company used the proceeds of the 2043 Notes for generalcorporate purposes, including the repayment of certain borrowings.
Put Option Agreement for Senior Debt Issuance
On March 17, 2015, the Company entered into an off-balance sheet ten-year put option agreement with a Delaware trust formed by theCompany, in connection with the sale by the trust of $500.0 aggregate amount of pre-capitalized trust securities redeemableFebruary 15, 2025 (“P-Caps”) in a Rule 144A private placement. The trust invested the proceeds from the sale of the P-Caps in aportfolio of principal and interest strips of U.S. Treasury securities. The put option agreement provides Voya Financial, Inc. the right tosell to the trust at any time up to $500.0 of its 3.976% Senior Notes due 2025 (“3.976% Senior Notes”) and receive in exchange acorresponding amount of the principal and interest strips of U.S. Treasury securities held by the trust. The 3.976% Senior Notes willnot be issued unless and until the put option is exercised. In return, the Company agreed to pay a semi-annual put premium to the trustat a rate of 1.875% per annum applied to the unexercised portion of the put option, and to reimburse the trust for its expenses. The putpremium is recorded in Operating expenses in the Consolidated Statements of Operations. The 3.976% Senior Notes will be fully,irrevocably and unconditionally guaranteed by Voya Holdings. The Company’s obligations under the put option agreement and theexpense reimbursement agreement with the trust are also guaranteed by Voya Holdings.
The put option described above will be exercised automatically in full upon the Company’s failure to make certain payments tothe trust, including any failure to pay the put option premium or expense reimbursements when due, if the failure to pay is notcured within 30 days, and upon certain bankruptcy events involving the Company or Voya Holdings. The Company is alsorequired to exercise the put option in full: (i) if the Company reasonably believes that its consolidated shareholders’ equity,calculated in accordance with U.S. GAAP but excluding AOCI and Noncontrolling interest, has fallen below $3.0 billion,subject to adjustment in certain cases; (ii) upon the occurrence of an event of default under the 3.976% Senior Notes; and (iii) ifcertain events occur relating to the trust’s status as an “investment company” under the Investment Company Act of 1940.
The Company has a one-time right to unwind a prior voluntary exercise of the put option by repurchasing all of the 3.976%Senior Notes then held by the trust in exchange for a corresponding amount of U.S. Treasury securities. If the put option hasbeen fully exercised, the 3.976% Senior Notes issued may be redeemed by the Company prior to their maturity at par or, ifgreater, at a make-whole redemption price, in each case plus accrued and unpaid interest to the date of redemption. The P-Capsare to be redeemed by the trust on February 15, 2025 or upon any early redemption of the 3.976% Senior Notes.
Junior Subordinated Notes
On May 16, 2013, Voya Financial, Inc. issued $750.0 of 5.65% Fixed-to-Floating Rate Junior Subordinated Notes due 2053 (the“2053 Notes”) in a private placement with registration rights. The 2053 Notes are guaranteed on junior subordinated basis byVoya Holdings. Interest is paid semi-annually, in arrears, on each May 15 and November 15, commencing November 15, 2013and ending on May 15, 2023. The 2053 Notes bear interest at a fixed rate of 5.65% prior to May 15, 2023. From May 15, 2023,the 2053 Notes will bear interest at an annual rate equal to three-month LIBOR plus 3.58% payable quarterly, in arrears, onFebruary 15, May 15, August 15 and November 15. So long as no event of default with respect to the 2053 Notes has occurredand is continuing, the Company has the right on one or more occasions, to defer the payment of interest on the 2053 Notes forone or more consecutive interest periods for up to five years. During the deferral period, interest will continue to accrue at thethen-applicable rate and deferred interest will bear additional interest at the then-applicable rate.
At any time following notice of the Company’s plan to defer interest and during the period interest is deferred, the Company and itssubsidiaries generally, with certain exceptions, may not make payments on or redeem or purchase any shares of the Company’scommon stock or any of the debt securities or guarantees that rank in liquidation on a parity with or are junior to the 2053 Notes.
304
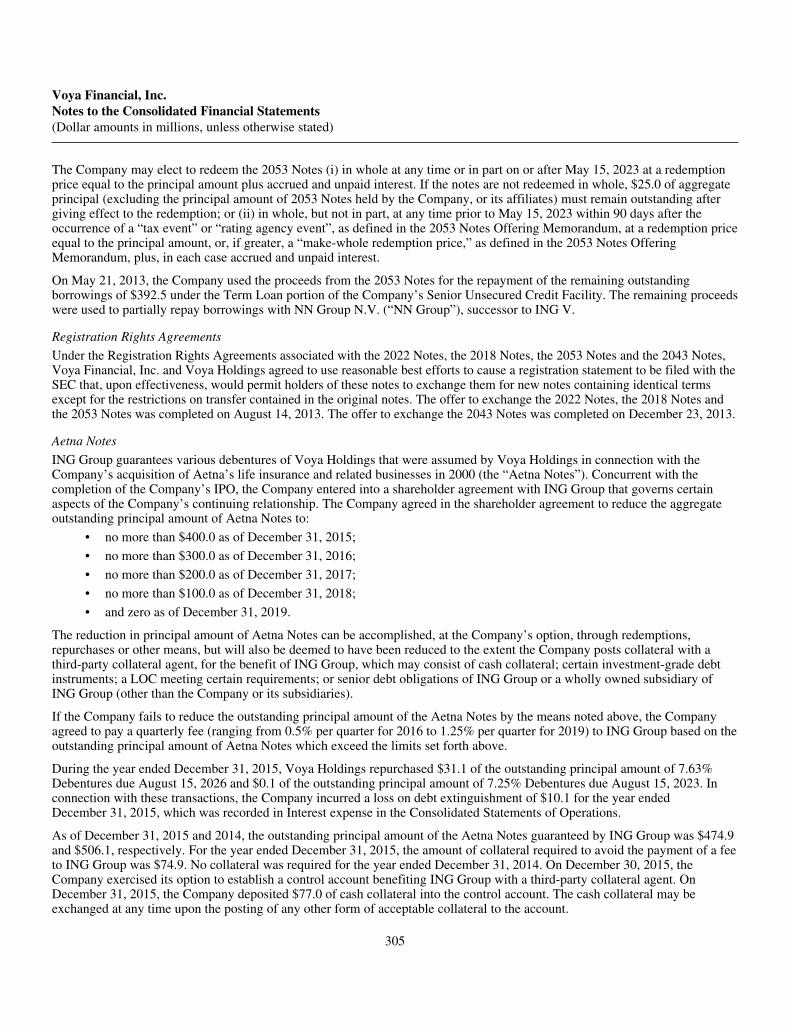
Voya Financial, Inc.Notes to the Consolidated Financial Statements(Dollar amounts in millions, unless otherwise stated)
The Company may elect to redeem the 2053 Notes (i) in whole at any time or in part on or after May 15, 2023 at a redemptionprice equal to the principal amount plus accrued and unpaid interest. If the notes are not redeemed in whole, $25.0 of aggregateprincipal (excluding the principal amount of 2053 Notes held by the Company, or its affiliates) must remain outstanding aftergiving effect to the redemption; or (ii) in whole, but not in part, at any time prior to May 15, 2023 within 90 days after theoccurrence of a “tax event” or “rating agency event”, as defined in the 2053 Notes Offering Memorandum, at a redemption priceequal to the principal amount, or, if greater, a “make-whole redemption price,” as defined in the 2053 Notes OfferingMemorandum, plus, in each case accrued and unpaid interest.
On May 21, 2013, the Company used the proceeds from the 2053 Notes for the repayment of the remaining outstandingborrowings of $392.5 under the Term Loan portion of the Company’s Senior Unsecured Credit Facility. The remaining proceedswere used to partially repay borrowings with NN Group N.V. (“NN Group”), successor to ING V.
Registration Rights Agreements
Under the Registration Rights Agreements associated with the 2022 Notes, the 2018 Notes, the 2053 Notes and the 2043 Notes,Voya Financial, Inc. and Voya Holdings agreed to use reasonable best efforts to cause a registration statement to be filed with theSEC that, upon effectiveness, would permit holders of these notes to exchange them for new notes containing identical termsexcept for the restrictions on transfer contained in the original notes. The offer to exchange the 2022 Notes, the 2018 Notes andthe 2053 Notes was completed on August 14, 2013. The offer to exchange the 2043 Notes was completed on December 23, 2013.
Aetna Notes
ING Group guarantees various debentures of Voya Holdings that were assumed by Voya Holdings in connection with theCompany’s acquisition of Aetna’s life insurance and related businesses in 2000 (the “Aetna Notes”). Concurrent with thecompletion of the Company’s IPO, the Company entered into a shareholder agreement with ING Group that governs certainaspects of the Company’s continuing relationship. The Company agreed in the shareholder agreement to reduce the aggregateoutstanding principal amount of Aetna Notes to:
• no more than $400.0 as of December 31, 2015;
• no more than $300.0 as of December 31, 2016;
• no more than $200.0 as of December 31, 2017;
• no more than $100.0 as of December 31, 2018;
• and zero as of December 31, 2019.
The reduction in principal amount of Aetna Notes can be accomplished, at the Company’s option, through redemptions,repurchases or other means, but will also be deemed to have been reduced to the extent the Company posts collateral with athird-party collateral agent, for the benefit of ING Group, which may consist of cash collateral; certain investment-grade debtinstruments; a LOC meeting certain requirements; or senior debt obligations of ING Group or a wholly owned subsidiary ofING Group (other than the Company or its subsidiaries).
If the Company fails to reduce the outstanding principal amount of the Aetna Notes by the means noted above, the Companyagreed to pay a quarterly fee (ranging from 0.5% per quarter for 2016 to 1.25% per quarter for 2019) to ING Group based on theoutstanding principal amount of Aetna Notes which exceed the limits set forth above.
During the year ended December 31, 2015, Voya Holdings repurchased $31.1 of the outstanding principal amount of 7.63%Debentures due August 15, 2026 and $0.1 of the outstanding principal amount of 7.25% Debentures due August 15, 2023. Inconnection with these transactions, the Company incurred a loss on debt extinguishment of $10.1 for the year endedDecember 31, 2015, which was recorded in Interest expense in the Consolidated Statements of Operations.
As of December 31, 2015 and 2014, the outstanding principal amount of the Aetna Notes guaranteed by ING Group was $474.9and $506.1, respectively. For the year ended December 31, 2015, the amount of collateral required to avoid the payment of a feeto ING Group was $74.9. No collateral was required for the year ended December 31, 2014. On December 30, 2015, theCompany exercised its option to establish a control account benefiting ING Group with a third-party collateral agent. OnDecember 31, 2015, the Company deposited $77.0 of cash collateral into the control account. The cash collateral may beexchanged at any time upon the posting of any other form of acceptable collateral to the account.
305
Voya Financial, Inc.Notes to the Consolidated Financial Statements(Dollar amounts in millions, unless otherwise stated)
Windsor Property Loan
On June 16, 2007, the State of Connecticut acting on behalf of the Department of Economic and Community Development(“DECD”) loaned VRIAC $9.9 (the “DECD Loan”) in connection with the development of a corporate office facility located atOne Orange Way, Windsor, Connecticut (the “Windsor Property”). The loan has a term of twenty years and bears an annualinterest rate of 1.00%. As long as no defaults have occurred under the loan, no payments of principal or interest are due for theinitial ten years of the loan. For the second ten years of the DECD Loan term, VRIAC is obligated to make monthly payments ofprincipal and interest.
The DECD Loan provided for loan forgiveness during the first five years of the term at varying amounts up to $5.0 if VRIACand its affiliates met certain employment thresholds at the Windsor Property during that period. On December 1, 2008, theDECD determined that the Company had met the employment thresholds for loan forgiveness and, accordingly, forgave $5.0 ofthe DECD Loan to VRIAC in accordance with the terms of the DECD Loan. The DECD Loan provides additional loanforgiveness at varying amounts up to $4.9 if VRIAC and its Voya affiliates meet certain employment thresholds at the WindsorProperty during years five through ten of the loan. VRIAC’s obligations under the DECD Loan are secured by an unlimitedrecourse guaranty from Voya Services Company. In November 2012, VRIAC provided a LOC to the DECD in the amount of$10.6 as security for its repayment obligations with respect to the loan.
As of December 31, 2015 and 2014, the amount of the loan outstanding was $4.9, which is reflected in Long-term debt on theConsolidated Balance Sheets.
Credit Facilities
The Company maintains credit facilities used primarily for collateral required under affiliated reinsurance transactions and alsofor general corporate purposes. As of December 31, 2015, unsecured and uncommitted credit facilities totaled $1.7, unsecuredand committed credit facilities totaled $5.4 billion and secured facilities totaled $205.0. Of the aggregate $5.6 billion capacityavailable, the Company utilized $2.3 billion in credit facilities as of December 31, 2015. Total fees associated with creditfacilities for the years ended 2015, 2014 and 2013 were $89.3, $120.6 and $149.3, respectively.
306

Voya Financial, Inc.Notes to the Consolidated Financial Statements(Dollar amounts in millions, unless otherwise stated)
The following table outlines the Company’s credit facilities as of December 31, 2015:
Secured/Unsecured
Committed/Uncommitted Expiration Capacity Utilization
UnusedCommitment
Obligor / ApplicantVoya Financial, Inc. . . . . . . . . . . . . . . . . . . Unsecured Committed 2/14/2018 $3,000.0 $ 704.8 $2,295.2Security Life of Denver International
Limited . . . . . . . . . . . . . . . . . . . . . . . . . . Unsecured Committed 1/24/2018 175.0 157.0 18.0Voya Financial, Inc./ Langhorne I, LLC . . . Unsecured Committed 1/15/2019 500.0 — 500.0Security Life of Denver International
Limited . . . . . . . . . . . . . . . . . . . . . . . . . . Unsecured Committed 10/29/2022 300.0 233.6 66.4Voya Financial, Inc. / Security Life of
Denver International Limited . . . . . . . . . Unsecured Committed 12/31/2025 475.0 475.0 —Voya Financial, Inc. . . . . . . . . . . . . . . . . . . Secured Committed 02/11/2018 195.0 195.0 —Voya Financial, Inc. . . . . . . . . . . . . . . . . . . Unsecured Uncommitted Various 1.7 1.7 —Voya Financial, Inc. . . . . . . . . . . . . . . . . . . Secured Uncommitted Various 10.0 0.7 —Voya Financial, Inc. / Roaring River
LLC . . . . . . . . . . . . . . . . . . . . . . . . . . . . . Unsecured Committed 10/1/2025 425.0 230.6 194.4Voya Financial, Inc. / Roaring River IV,
LLC . . . . . . . . . . . . . . . . . . . . . . . . . . . . . Unsecured Committed 12/31/2028 565.0 338.0 227.0
Total . . . . . . . . . . . . . . . . . . . . . . . . . . . . . . . . . . . $5,646.7 $2,336.4 $3,301.0
Secured facilities . . . . . . . . . . . . . . . . . . . . . . . . . $ 205.0 $ 195.7 $ —Unsecured and uncommitted . . . . . . . . . . . . . . . . 1.7 1.7 —Unsecured and committed . . . . . . . . . . . . . . . . . . 5,440.0 2,139.0 3,301.0
Total . . . . . . . . . . . . . . . . . . . . . . . . . . . . . . . . . . . $5,646.7 $2,336.4 $3,301.0
Senior Unsecured Credit Facility
On February 14, 2014, the Company amended its existing syndicated senior unsecured credit facility. The amended facilityexpires on February 14, 2018 and has a revolving credit borrowing sublimit of $750.0 and total LOC capacity of $3.0 billion.
As of December 31, 2015, there were no amounts outstanding as revolving credit borrowings and $704.8 of LOCs outstandingunder the senior unsecured credit facility.
307

Voya Financial, Inc.Notes to the Consolidated Financial Statements(Dollar amounts in millions, unless otherwise stated)
18. Commitments and Contingencies
Leases
The Company leases its office space and certain equipment under operating leases, the longest term of which expires in 2025.
For the years ended December 31, 2015, 2014 and 2013, rent expense for leases was $39.9, $37.9 and $40.5, respectively. Thefuture net minimum payments under non-cancelable leases are as follows as of December 31, 2015:
2016 . . . . . . . . . . . . . . . . . . . . . . . . . . . . . . . . . . . . . . . . . . . . . . . . . . . . . . $ 33.92017 . . . . . . . . . . . . . . . . . . . . . . . . . . . . . . . . . . . . . . . . . . . . . . . . . . . . . . 30.02018 . . . . . . . . . . . . . . . . . . . . . . . . . . . . . . . . . . . . . . . . . . . . . . . . . . . . . . 19.22019 . . . . . . . . . . . . . . . . . . . . . . . . . . . . . . . . . . . . . . . . . . . . . . . . . . . . . . 15.62020 . . . . . . . . . . . . . . . . . . . . . . . . . . . . . . . . . . . . . . . . . . . . . . . . . . . . . . 13.2Thereafter . . . . . . . . . . . . . . . . . . . . . . . . . . . . . . . . . . . . . . . . . . . . . . . . . . 48.1
Total minimum lease payments . . . . . . . . . . . . . . . . . . . . . . . . . . . . . . . . . . . . . $160.0
Commitments
Through the normal course of investment operations, the Company commits to either purchase or sell securities, mortgageloans, or money market instruments, at a specified future date and at a specified price or yield. The inability of counterparties tohonor these commitments may result in either a higher or lower replacement cost. Also, there is likely to be a change in thevalue of the securities underlying the commitments.
As of December 31, 2015, the Company had off-balance sheet commitments to acquire mortgage loans of $771.9 and purchaselimited partnerships and private placement investments of $970.9, of which $225.9 relates to consolidated investment entities.As of December 31, 2014, the Company had off-balance sheet commitments to acquire mortgage loans of $520.3 and purchaselimited partnerships and private placement investments of $367.1, of which $297.0 relates to consolidated investment entities.
Insurance Company Guaranty Fund Assessments
Insurance companies are assessed on the costs of funding the insolvencies of other insurance companies by the various stateguaranty associations, generally based on the amount of premiums companies collect in that state.
The Company accrues the cost of future guaranty fund assessments based on estimates of insurance company’s insolvenciesprovided by the National Organization of Life and Health Insurance Guaranty Associations and the amount of premiums writtenin each state. The Company has estimated this undiscounted liability, which is included in Other liabilities on the ConsolidatedBalance Sheets, to be $12.6 and $14.5 as of December 31, 2015 and 2014, respectively. The Company has also recorded anasset, in Other assets on the Consolidated Balance Sheets of $22.9 and $26.5 as of December 31, 2015 and 2014, respectively,for future credits to premium taxes. The Company estimates its liabilities for future assessments under state insurance guarantyassociation laws. The Company believes the reserves established are adequate for future assessments relating to insurancecompanies that are currently subject to insolvency proceedings.
308

Voya Financial, Inc.Notes to the Consolidated Financial Statements(Dollar amounts in millions, unless otherwise stated)
Restricted AssetsThe Company is required to maintain assets on deposit with various regulatory authorities to support its insurance operations.The Company may also post collateral in connection with certain securities lending, repurchase agreements, fundingagreements, credit facilities and derivative transactions. The components of the fair value of the restricted assets were as followsas of December 31, 2015 and 2014:
2015 2014
Fixed maturity collateral pledged to FHLB . . . . . . . . . . . . . . . . . . . . . . . . $1,528.5 $1,614.8FHLB restricted stock(1) . . . . . . . . . . . . . . . . . . . . . . . . . . . . . . . . . . . . . . . 73.3 76.3Other fixed maturities-state deposits . . . . . . . . . . . . . . . . . . . . . . . . . . . . . . 210.3 241.7Securities pledged(2) . . . . . . . . . . . . . . . . . . . . . . . . . . . . . . . . . . . . . . . . . . 1,112.6 1,184.6
Total restricted assets . . . . . . . . . . . . . . . . . . . . . . . . . . . . . . . . . . . . . . . . . $2,924.7 $3,117.4
(1) Included in Other investments on the Consolidated Balance Sheets.(2) Includes the fair value of loaned securities of $466.4 and $545.9 as of December 31, 2015 and 2014, respectively. In addition,
as of December 31, 2015 and 2014, the Company delivered securities as collateral of $646.2 and $638.7, respectively. Loanedsecurities and securities delivered as collateral are included in Securities pledged on the Consolidated Balance Sheet.
Federal Home Loan Bank Funding AgreementsThe Company is a member of the FHLB of Des Moines and the FHLB of Topeka and is required to pledge collateral to backfunding agreements issued to the FHLB. As of December 31, 2015 and 2014, the Company had $1.3 billion and $1.4 billion,respectively, in non-putable funding agreements, which are included in Contract owner account balances on the ConsolidatedBalance Sheets. As of December 31, 2015 and 2014, assets with a market value of approximately $1.5 billion and $1.6 billion,respectively, collateralized the FHLB funding agreements.
Litigation, Regulatory Matters and Loss ContingenciesLitigation, regulatory and other loss contingencies arise in connection with the Company’s activities as a diversified financialservices firm. The Company is a defendant in a number of litigation matters arising from the conduct of its business, both in theordinary course and otherwise. In some of these matters, claimants seek to recover very large or indeterminate amounts,including compensatory, punitive, treble and exemplary damages. Modern pleading practice in the U.S. permits considerablevariation in the assertion of monetary damages and other relief. Claimants are not always required to specify the monetarydamages they seek or they may be required only to state an amount sufficient to meet a court’s jurisdictional requirements.Moreover, some jurisdictions allow claimants to allege monetary damages that far exceed any reasonably possible verdict. Thevariability in pleading requirements and past experience demonstrates that the monetary and other relief that may be requestedin a lawsuit or claim often bears little relevance to the merits or potential value of a claim. Litigation against the Companyincludes a variety of claims including negligence, breach of contract, fraud, violation of regulation or statute, breach of fiduciaryduty, negligent misrepresentation, failure to supervise, elder abuse and other torts.
As with other financial services companies, the Company periodically receives informal and formal requests for informationfrom various state and federal governmental agencies and self-regulatory organizations in connection with inquiries andinvestigations of the products and practices of the Company or the financial services industry. It is the practice of the Companyto cooperate fully in these matters.
The outcome of a litigation or regulatory matter is difficult to predict and the amount or range of potential losses associated withthese or other loss contingencies requires significant management judgment. It is not possible to predict the ultimate outcome orto provide reasonably possible losses or ranges of losses for all pending regulatory matters, litigation and other losscontingencies. While it is possible that an adverse outcome in certain cases could have a material adverse effect upon theCompany’s financial position, based on information currently known, management believes that neither the outcome of pendinglitigation and regulatory matters, nor potential liabilities associated with other loss contingencies, are likely to have such aneffect. However, given the large and indeterminate amounts sought in certain litigation and the inherent unpredictability of allsuch matters, it is possible that an adverse outcome in certain of the Company’s litigation or regulatory matters, or liabilities
309
Voya Financial, Inc.Notes to the Consolidated Financial Statements(Dollar amounts in millions, unless otherwise stated)
arising from other loss contingencies, could, from time to time, have a material adverse effect upon the Company’s results ofoperations or cash flows in a particular quarterly or annual period.
For some matters, the Company is able to estimate a possible range of loss. For such matters in which a loss is probable, anaccrual has been made. For matters where the Company, however, believes a loss is reasonably possible, but not probable, noaccrual is required. For matters for which an accrual has been made, but there remains a reasonably possible range of loss inexcess of the amounts accrued or for matters where no accrual is required, the Company develops an estimate of the unaccruedamounts of the reasonably possible range of losses, As of December 31, 2015, the Company estimates the aggregate range ofreasonably possible losses, in excess of any amounts accrued for these matters as of such date, to be up to approximately$100.0.
For other matters, the Company is currently not able to estimate the reasonably possible loss or range of loss. The Company isoften unable to estimate the possible loss or range of loss until developments in such matters have provided sufficientinformation to support an assessment of the range of possible loss, such as quantification of a damage demand from plaintiffs,discovery from plaintiffs and other parties, investigation of factual allegations, rulings by a court on motions or appeals, analysisby experts and the progress of settlement discussions. On a quarterly and annual basis, the Company reviews relevantinformation with respect to litigation and regulatory contingencies and updates the Company’s accruals, disclosures andreasonably possible losses or ranges of loss based on such reviews.
Litigation includes Beeson, et al. v SMMS, Lion Connecticut Holdings, Inc. and ING NAIC (Marin County CA Superior Court,CIV-092545). Thirty-four Plaintiff households (husband/wife/trust) assert that SMMS, which was purchased in 2000 and sold in2003, breached a duty to monitor the performance of investments that Plaintiffs made with independent financial advisors theymet in conjunction with retirement planning seminars presented at Fireman’s Fund Insurance Company. SMMS recommendedthe advisors to Fireman’s Fund as seminar presenters. Some of the seminars were arranged by SMMS. As a result of theperformance of their investments, Plaintiffs claim they incurred damages. Fireman’s Fund has asserted breach of contract andconcealment claims against SMMS alleging that SMMS failed to fulfill its ongoing obligation to monitor the financial advisorsand the investments they recommended to Plaintiffs and by failing to disclose that a primary purpose of the seminars was todevelop business for the financial advisors. The Company denied all claims and vigorously defended this case at trial. Duringtrial, the Court ruled that SMMS had duties to Plaintiffs and Fireman’s Fund that it has breached. On December 12, 2014, theCourt issued a Statement of Decision in which it awarded damages in the aggregate of $36.8 to Plaintiffs and $7.5 to Fireman’sFund. The Company objected to the Court’s decisions and the Statement of Decision on the grounds that they were inconsistentwith California law and the evidence presented at trial. On January 7, 2015, the Court made final the award in favor of thePlaintiffs. The Company filed an appellate bond that stays execution of that judgment while an appeal is pursued. On June 8,2015, the Court issued a Statement of Decision denying Fireman’s Fund’s request for punitive damages.
Contingencies related to Performance-based Incentive Fees on Private Equity Funds
Certain performance fees related to sponsored private equity funds (“carried interest”) are not final until the conclusion of aninvestment term specified in the relevant asset management contract. As a result, such fees, if accrued or paid to the Companyduring such term, are subject to later adjustment based on subsequent fund performance. As of December 31, 2015,approximately $54.9 of previously accrued carried interest would be subject to full or partial reversal in future periods ifcumulative fund performance hurdles are not maintained throughout the remaining life of the affected funds.
310
Voya Financial, Inc.Notes to the Consolidated Financial Statements(Dollar amounts in millions, unless otherwise stated)
19. Related Party Transactions
Parties are considered to be related if one party has the ability to control or exercise significant influence over the other party inmaking financial or operating decisions. Effective March 9, 2015, ING Group divested its remaining ownership interest in VoyaFinancial, Inc. As such, as of the date of this Annual Report, ING Group and its affiliates are no longer considered relatedparties of Voya Financial, Inc. Transactions with ING Group and its affiliates continue to be reported as related partytransactions for periods prior to March 9, 2015.
The following table summarizes income and expense from transactions with related parties for the periods indicated:
Years Ended December 31,
2015 2014 2013
Income Expense Income Expense Income Expense
NN Group . . . . . . . . . . . . . . . . . . . . . . . . . . . . . . . . . . . . . . . . . . . . . . . . . . $ 0.4 $ 0.1 $ 2.5 $ 0.6 $ 1.9 $ 6.1ING Group . . . . . . . . . . . . . . . . . . . . . . . . . . . . . . . . . . . . . . . . . . . . . . . . . 2.8 3.0 11.8 14.7 7.4 18.0ING Bank . . . . . . . . . . . . . . . . . . . . . . . . . . . . . . . . . . . . . . . . . . . . . . . . . . 18.2 5.7 5.6 19.8 7.2 39.5Other . . . . . . . . . . . . . . . . . . . . . . . . . . . . . . . . . . . . . . . . . . . . . . . . . . . . . . 3.8 3.4 19.6 14.0 18.6 14.6
Total . . . . . . . . . . . . . . . . . . . . . . . . . . . . . . . . . . . . . . . . . . . . . . . . . . . . . . $25.2 $12.2 $39.5 $49.1 $35.1 $78.2
Assets and liabilities from transactions with related parties as of December 31, 2014 are shown below:
Assets Liabilities
NN Group . . . . . . . . . . . . . . . . . . . . . . . . . . . . . . . . . . . . . . . . . . . . . . . . . . . . . $ 0.1 $0.2ING Group . . . . . . . . . . . . . . . . . . . . . . . . . . . . . . . . . . . . . . . . . . . . . . . . . . . . 1.9 1.2ING Bank . . . . . . . . . . . . . . . . . . . . . . . . . . . . . . . . . . . . . . . . . . . . . . . . . . . . . 12.9 4.0Other . . . . . . . . . . . . . . . . . . . . . . . . . . . . . . . . . . . . . . . . . . . . . . . . . . . . . . . . . 2.2 1.4
Total . . . . . . . . . . . . . . . . . . . . . . . . . . . . . . . . . . . . . . . . . . . . . . . . . . . . . . . . . $17.1 $6.8
As of March 9, 2015, ING Group and its affiliates are no longer considered related parties of Voya Financial, Inc.
The material agreements whereby the Company generates revenues and expenses with affiliated entities are as follows:
Credit Facilities
The Company is a borrower in several credit facility agreements with ING Bank, in which ING Bank provides LOC capacity.While there were outstanding payables related to credit facility agreements with ING Bank, because ING Bank is no longer arelated party, there were no outstanding payables related to credit facility agreements with related parties as of December 31,2015. As of December 31, 2014, when ING Bank was a related party, the Company had outstanding payables of $4.0 related tocredit facility agreements with related parties. The Company incurred expenses of $5.7, $15.9, and $38.2 for the years endedDecember 31, 2015, 2014 and 2013, respectively.
Share Repurchase Program
During the year ended December 31, 2015, the Company repurchased 13,599,274 shares of its common stock from ING Groupfor an aggregate purchase price of $600.0. During the year ended December 31, 2014, the Company repurchased 19,447,847shares of our common shares from ING Group for an aggregate purchase price of $725.0. The repurchases were each madepursuant to a Direct Share Repurchase Program with ING Group. The per share purchase price paid by the Company in eachcase was equal to the per share purchase price paid by the underwriters in registered public offerings of the Company’s commonstock by ING Group which were completed concurrently with each of the repurchase transactions.
311
Voya Financial, Inc.Notes to the Consolidated Financial Statements(Dollar amounts in millions, unless otherwise stated)
Derivatives
The Company is party to several derivative contracts with NN Group and ING Bank and one or more of ING Bank’ssubsidiaries. The Company is exposed to various risks relating to its ongoing operations, including but not limited to interestrate risk, foreign currency risk and equity market risk. To manage these risks, the Company uses various strategies, includingderivatives contracts, certain of which are with related parties, such as interest rate swaps, equity options and currency forwards.
As of December 31, 2015, notional amounts are outstanding with ING Group and NN Group; however, ING Group and NNGroup are no longer related parties. As of December 31, 2014, the outstanding notional amount with ING Bank and NN Groupwas $464.1 (consisting of currency forwards of $178.0 and equity options of $286.1). As of December 31, 2014, the marketvalue for these contracts was $11.5. For the years ended December 31, 2015, 2014 and 2013, the Company recorded Other netrealized capital gains (losses) in the Consolidated Statements of Operations of $18.2, $5.1 and $1.7, respectively, with INGBank and NN Group.
The Company has sold protection under certain credit default swap derivative contracts that were previously supported by aguarantee provided by NN Group. During 2013, the guarantee provided by NN Group on the sold protection was replaced withguarantees provided by Voya Financial, Inc. The Company purchased protection under one credit default swap derivativecontract that is supported by the NN Group guarantee with potential exposure limited to swap premiums to be paid. As ofDecember 31, 2015 and 2014, the maximum potential future exposure to the Company on credit default swaps supported by theNN Group guarantee was $24.3 and $33.1, respectively.
Operating Agreements
Voya Investment Management LLC (“VIM”), a wholly owned subsidiary of the Company, has certain operating agreementswhereby it generates revenues and incurs expenses with affiliated entities. For the year ended December 31, 2015, VIMgenerated revenues and incurred expenses of $4.3 and $3.5, respectively, with NN Group, ING Group and other affiliates underthe following operating agreements. For the year ended December 31, 2014, VIM generated revenues and incurred expenses of$22.7 and $15.0, respectively, with NN Group, ING Group and other affiliates under the following operating agreements. Forthe year ended December 31, 2013, VIM generated revenues and incurred expenses of $26.0 and $15.0, respectively, with NNGroup and other affiliates under the following operating agreements:
• VIM manages, co-manages, and distributes certain investment products for various affiliates. For the years endedDecember 31, 2015, 2014 and 2013, revenue earned under these agreements was $4.3, $22.7, and $25.7 respectively.
• VIM receives distribution fees for the sale of certain offshore funds to U.S. clients and closed end funds in the U.S.For the years ended December 31, 2015 and 2014, there was no revenue under these arrangements. For the year endedDecember 31, 2013, there was $0.3 revenue under these arrangements.
• VIM pays sub advisory and other fees to certain affiliates related to the management and sales of mutual funds andother investment products. For the year ended December 31, 2015, fees incurred under these agreements were $3.5.For the years ended December 31, 2014 and 2013, fees incurred under these arrangements were $15.0.
• VIM entered into a services agreement in January 2014 with ING Bank, which was further amended in July 2014.ING Bank engages in certain short-term secured lending transactions with counterparties that post collateral in theform of securitized assets, and pursuant to the services agreement, VIM provides evaluation services to ING Bank onthe collateral. For the years ended December 31, 2015 and 2014, VIM earned $0.1 and $0.4, respectively.
20. Consolidated Investment Entities
The Company provides investment management services to, and has transactions with, various collateralized loan obligations,private equity funds, single strategy hedge funds, insurance entities, securitizations and other investment entities in the normalcourse of business. In certain instances, the Company serves as the investment manager, making day-to-day investmentdecisions concerning the assets of these entities. These entities are considered to be either VIEs or VOEs and the Companyevaluates its involvement with each entity to determine whether consolidation is required.
312
Voya Financial, Inc.Notes to the Consolidated Financial Statements(Dollar amounts in millions, unless otherwise stated)
Certain investment entities are consolidated under consolidation guidance. The Company consolidates certain entities under theVIE guidance when it is determined that the Company is the primary beneficiary. The Company consolidates certain entitiesunder the VOE guidance when it acts as the controlling general partner and the limited partners have no substantive rights toimpact ongoing governance and operating activities of the entity, or when it otherwise has control through voting rights. InFebruary 2015, the FASB issued ASU 2015-02, which significantly amends the consolidation analysis required under currentconsolidation guidance. The provisions of ASU 2015-02 are effective for the Company on January 1, 2016, with either aretrospective or modified retrospective approach required. See the Business, Basis of Presentation and Significant AccountingPolicies Note for estimated impact of future adoption of this accounting pronouncement.
The Company has no right to the benefits from, nor does it bear the risks associated with these investments beyond theCompany’s direct equity and debt investments in and management fees generated from these investment products. Such directinvestments amounted to approximately $722.8 and $694.4 as of December 31, 2015 and 2014, respectively. If the Companywere to liquidate, the assets held by consolidated investment entities would not be available to the general creditors of theCompany as a result of the liquidation.
Consolidated Investments
Collateral Loan Obligations (“CLO”) Entities
Certain subsidiaries of the Company structure and manage CLO entities created for the sole purpose of offering investorsvarious maturity and risk characteristics by issuing multiple tranches of collateralized debt. The notes issued by the CLO entitiesare backed by diversified portfolios consisting primarily of senior secured floating rate leveraged loans.
The Company provides collateral management services to the CLO entities. In return for providing management services, theCompany earns investment management fees and contingent performance fees. The Company has invested in certain of theentities, generally taking an ownership position in the unrated junior subordinated tranches. The CLO entities are structured andmanaged similarly but have differing fee structures and initial capital investments made by the Company. The Company’sownership interests and management and contingent performance fees were assessed to determine if the Company is theprimary beneficiary of these entities.
As of December 31, 2015 and 2014, the Company consolidated 17 CLOs and 16 CLOs, respectively.
Private Equity Funds and Single Strategy Hedge Funds (Limited Partnerships)
The Company invests in and manages various limited partnerships, including private equity funds and single strategy hedgefunds. The Company, as a general partner or managing member of certain sponsored investment funds, is generally presumed tocontrol the limited partnerships unless the limited partners have the substantive ability to remove the general partner withoutcause based upon a simple majority vote, or can otherwise dissolve the partnership, or have substantive participating rights overdecision-making of the partnerships.
As of December 31, 2015 and 2014, the Company consolidated 33 and 35 funds respectively, which were structured aspartnerships.
Registered Investment Companies
On May 7, 2015, the Company launched the Pomona Investment Fund (the “PIF”) which is a private equity mutual fund. ThePIF is a non-diversified, closed-end registered investment company that invests in a variety of private equity investment typesand strategies. Formed as a Delaware statutory trust, investors in the PIF will receive fund shares, representing proportionalinterests in the assets of the PIF and voting rights on matters submitted to vote by shareholders. As of December 31, 2015, theCompany is a majority investor in the PIF, and as such has a controlling financial interest in the fund.
The Company is invested in the Voya Strategic Income Opportunities Fund, which is a separately managed series fund. TheVoya Strategic Income Opportunities Fund is a multi-credit unconstrained Fixed Income Mutual Fund that invests in acombination of underlying funds and direct fixed income investments. Investors in the fund receive fund shares, representingproportional interests in the assets of the fund and voting rights on matters submitted to vote by shareholders. As ofDecember 31, 2015, the Company is a majority investor in the Voya Strategic Income Opportunities Fund, and as such has acontrolling financial interest in the fund.
313
Voya Financial, Inc.Notes to the Consolidated Financial Statements(Dollar amounts in millions, unless otherwise stated)
Collateral Support for Reinsurance Contracts
Beginning in December 2009, the Company entered into various guarantee agreements involving Karson Capital Limited(“Karson”). Karson is an unaffiliated company that provides collateral alternatives to LOCs for reinsurance transactions. Karsonestablished the KCL Master Trust (“Master Trust” or “Borrower”), which is a Delaware statutory series trust. The Master Trustenters into securities lending agreements as borrower with various unaffiliated banks (“Securities Lenders”) as lenders. Alltransactions with Karson were terminated as of September 30, 2015. Fair value of the loaned securities was $750.0 as ofDecember 31, 2014.
Collateral notes backed by the borrowed securities, with a face value of $750.0 as of December 31, 2014, were issued by theMaster Trust and placed in reinsurance trusts established for the benefit of the Company’s insurance subsidiaries, which wereeliminated in the Company’s Consolidated Financial Statements.
The Company provided certain guarantees of the Borrower’s performance obligations to the Securities Lenders as collateral forthe Borrower’s obligations under the securities lending agreements. Additional collateral in the form of liquidity obligations wasprovided by banks for $750.0 for the year ended December 31, 2014.
The Master Trust sponsored by Karson had minimal equity, and therefore fell under the VIE model. The Company held variableinterests in this VIE relating to the guarantees of the obligations under the securities lending agreements. The Companyconsidered its implicit and explicit financial responsibility to ensure that the Master Trust operated as designed and, thus,determined that the Company had the implied power to direct the activities that most significantly impacted the Master Trust’seconomic performance under the VIE model. The Company also determined it had the obligation to absorb losses under thesecurities lending guarantees. Based on these conclusions, the Company determined it was the primary beneficiary under theVIE model and should consolidate the Master Trust. The Master Trust is no longer subject to consolidation following theSeptember 30, 2015 termination noted above.
314
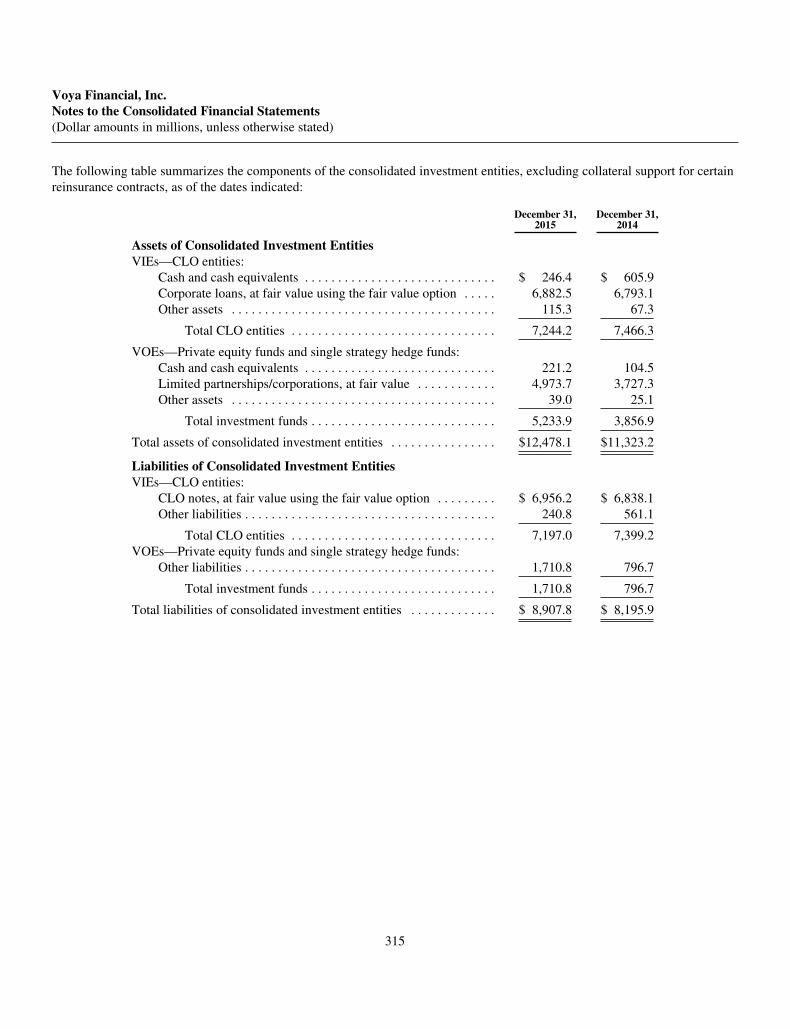
Voya Financial, Inc.Notes to the Consolidated Financial Statements(Dollar amounts in millions, unless otherwise stated)
The following table summarizes the components of the consolidated investment entities, excluding collateral support for certainreinsurance contracts, as of the dates indicated:
December 31,2015
December 31,2014
Assets of Consolidated Investment EntitiesVIEs—CLO entities:
Cash and cash equivalents . . . . . . . . . . . . . . . . . . . . . . . . . . . . . $ 246.4 $ 605.9Corporate loans, at fair value using the fair value option . . . . . 6,882.5 6,793.1Other assets . . . . . . . . . . . . . . . . . . . . . . . . . . . . . . . . . . . . . . . . 115.3 67.3
Total CLO entities . . . . . . . . . . . . . . . . . . . . . . . . . . . . . . . 7,244.2 7,466.3
VOEs—Private equity funds and single strategy hedge funds:Cash and cash equivalents . . . . . . . . . . . . . . . . . . . . . . . . . . . . . 221.2 104.5Limited partnerships/corporations, at fair value . . . . . . . . . . . . 4,973.7 3,727.3Other assets . . . . . . . . . . . . . . . . . . . . . . . . . . . . . . . . . . . . . . . . 39.0 25.1
Total investment funds . . . . . . . . . . . . . . . . . . . . . . . . . . . . 5,233.9 3,856.9
Total assets of consolidated investment entities . . . . . . . . . . . . . . . . $12,478.1 $11,323.2
Liabilities of Consolidated Investment EntitiesVIEs—CLO entities:
CLO notes, at fair value using the fair value option . . . . . . . . . $ 6,956.2 $ 6,838.1Other liabilities . . . . . . . . . . . . . . . . . . . . . . . . . . . . . . . . . . . . . . 240.8 561.1
Total CLO entities . . . . . . . . . . . . . . . . . . . . . . . . . . . . . . . 7,197.0 7,399.2VOEs—Private equity funds and single strategy hedge funds:
Other liabilities . . . . . . . . . . . . . . . . . . . . . . . . . . . . . . . . . . . . . . 1,710.8 796.7
Total investment funds . . . . . . . . . . . . . . . . . . . . . . . . . . . . 1,710.8 796.7
Total liabilities of consolidated investment entities . . . . . . . . . . . . . $ 8,907.8 $ 8,195.9
315

Voya Financial, Inc.Notes to the Consolidated Financial Statements(Dollar amounts in millions, unless otherwise stated)
The following tables summarize the impact of consolidation of investment entities into the Consolidated Balance Sheets as ofthe dates indicated:
BeforeConsolidation(1) CLOs VOEs
CLOsAdjustments(2)
VOEsAdjustments(2) Total
December 31, 2015Total investments and cash . . . . . . . . . . . . . . . . . . . . $ 91,727.4 $ — $ — $(38.2) $ (684.6) $ 91,004.6Other assets . . . . . . . . . . . . . . . . . . . . . . . . . . . . . . . . 18,252.1 — — — — 18,252.1Assets held in consolidated investment entities . . . . — 7,244.2 5,235.4 — (1.5) 12,478.1Assets held in separate accounts . . . . . . . . . . . . . . . . 96,514.8 — — — — 96,514.8
Total assets . . . . . . . . . . . . . . . . . . . . . . . . . . . . . . . . . $206,494.3 $7,244.2 $5,235.4 $(38.2) $ (686.1) $218,249.6
Future policy benefits and contract owner accountbalances . . . . . . . . . . . . . . . . . . . . . . . . . . . . . . . . . $ 88,172.1 $ — $ — $ — $ — $ 88,172.1
Other liabilities . . . . . . . . . . . . . . . . . . . . . . . . . . . . . 8,380.6 — — — (1.5) 8,379.1Liabilities held in consolidated investment
entities . . . . . . . . . . . . . . . . . . . . . . . . . . . . . . . . . . — 7,235.2 1,710.8 (38.2) — 8,907.8Liabilities related to separate accounts . . . . . . . . . . . 96,514.8 — — — — 96,514.8
Total liabilities . . . . . . . . . . . . . . . . . . . . . . . . . . . . . . 193,067.5 7,235.2 1,710.8 (38.2) (1.5) 201,973.8
Equity attributable to common shareholders . . . . . . . 13,426.8 — 3,524.6 — (3,524.6) 13,426.8Retained earnings appropriated for investors in
consolidated investment entities . . . . . . . . . . . . . . — 9.0 — — — 9.0Equity attributable to noncontrolling interest in
consolidated investment entities . . . . . . . . . . . . . . — — — — 2,840.0 2,840.0
Total liabilities and equity . . . . . . . . . . . . . . . . . . . . . $206,494.3 $7,244.2 $5,235.4 $(38.2) $ (686.1) $218,249.6
(1) The Before Consolidation column includes the Company’s equity interest in the investment products subsequentlyconsolidated, accounted for as equity method and available-for-sale investments.
(2) Adjustments include the elimination of intercompany transactions between the Company and its consolidated investmententities, primarily the elimination of the Company’s equity at risk recorded as investments by the Company (beforeconsolidation) against either equity (private equity and real estate partnership funds) or senior and subordinated debt(CLOs) of the funds.
316
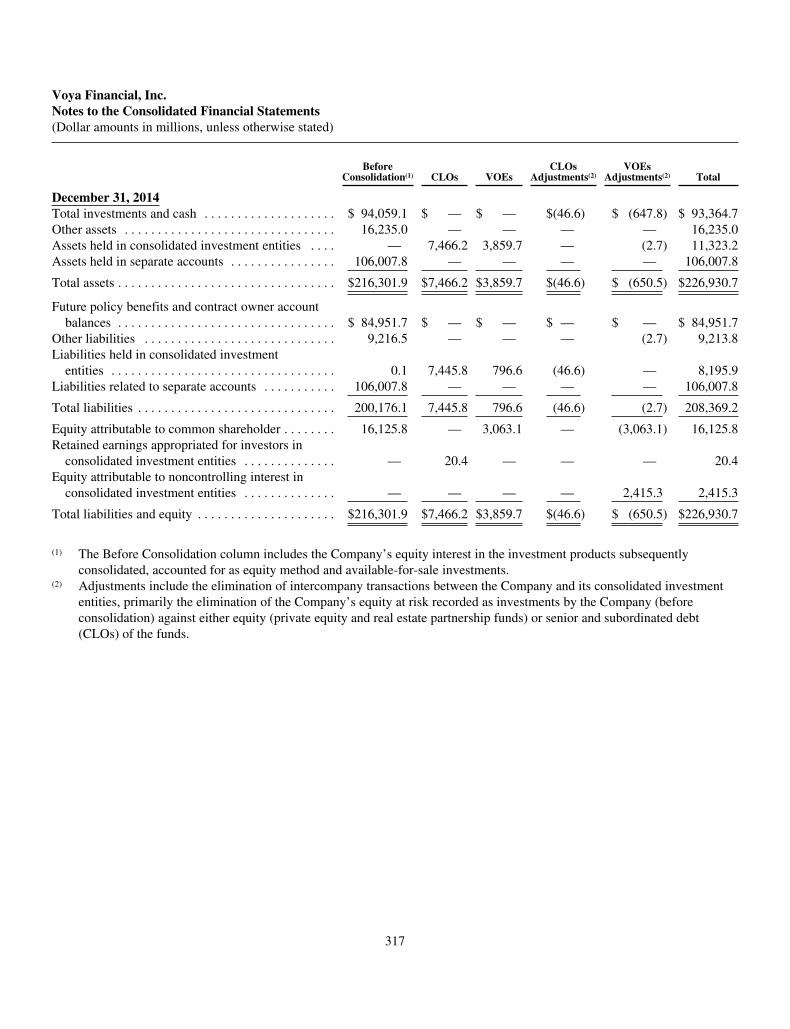
Voya Financial, Inc.Notes to the Consolidated Financial Statements(Dollar amounts in millions, unless otherwise stated)
BeforeConsolidation(1) CLOs VOEs
CLOsAdjustments(2)
VOEsAdjustments(2) Total
December 31, 2014Total investments and cash . . . . . . . . . . . . . . . . . . . . $ 94,059.1 $ — $ — $(46.6) $ (647.8) $ 93,364.7Other assets . . . . . . . . . . . . . . . . . . . . . . . . . . . . . . . . 16,235.0 — — — — 16,235.0Assets held in consolidated investment entities . . . . — 7,466.2 3,859.7 — (2.7) 11,323.2Assets held in separate accounts . . . . . . . . . . . . . . . . 106,007.8 — — — — 106,007.8
Total assets . . . . . . . . . . . . . . . . . . . . . . . . . . . . . . . . . $216,301.9 $7,466.2 $3,859.7 $(46.6) $ (650.5) $226,930.7
Future policy benefits and contract owner accountbalances . . . . . . . . . . . . . . . . . . . . . . . . . . . . . . . . . $ 84,951.7 $ — $ — $ — $ — $ 84,951.7
Other liabilities . . . . . . . . . . . . . . . . . . . . . . . . . . . . . 9,216.5 — — — (2.7) 9,213.8Liabilities held in consolidated investment
entities . . . . . . . . . . . . . . . . . . . . . . . . . . . . . . . . . . 0.1 7,445.8 796.6 (46.6) — 8,195.9Liabilities related to separate accounts . . . . . . . . . . . 106,007.8 — — — — 106,007.8
Total liabilities . . . . . . . . . . . . . . . . . . . . . . . . . . . . . . 200,176.1 7,445.8 796.6 (46.6) (2.7) 208,369.2
Equity attributable to common shareholder . . . . . . . . 16,125.8 — 3,063.1 — (3,063.1) 16,125.8Retained earnings appropriated for investors in
consolidated investment entities . . . . . . . . . . . . . . — 20.4 — — — 20.4Equity attributable to noncontrolling interest in
consolidated investment entities . . . . . . . . . . . . . . — — — — 2,415.3 2,415.3
Total liabilities and equity . . . . . . . . . . . . . . . . . . . . . $216,301.9 $7,466.2 $3,859.7 $(46.6) $ (650.5) $226,930.7
(1) The Before Consolidation column includes the Company’s equity interest in the investment products subsequentlyconsolidated, accounted for as equity method and available-for-sale investments.
(2) Adjustments include the elimination of intercompany transactions between the Company and its consolidated investmententities, primarily the elimination of the Company’s equity at risk recorded as investments by the Company (beforeconsolidation) against either equity (private equity and real estate partnership funds) or senior and subordinated debt(CLOs) of the funds.
317
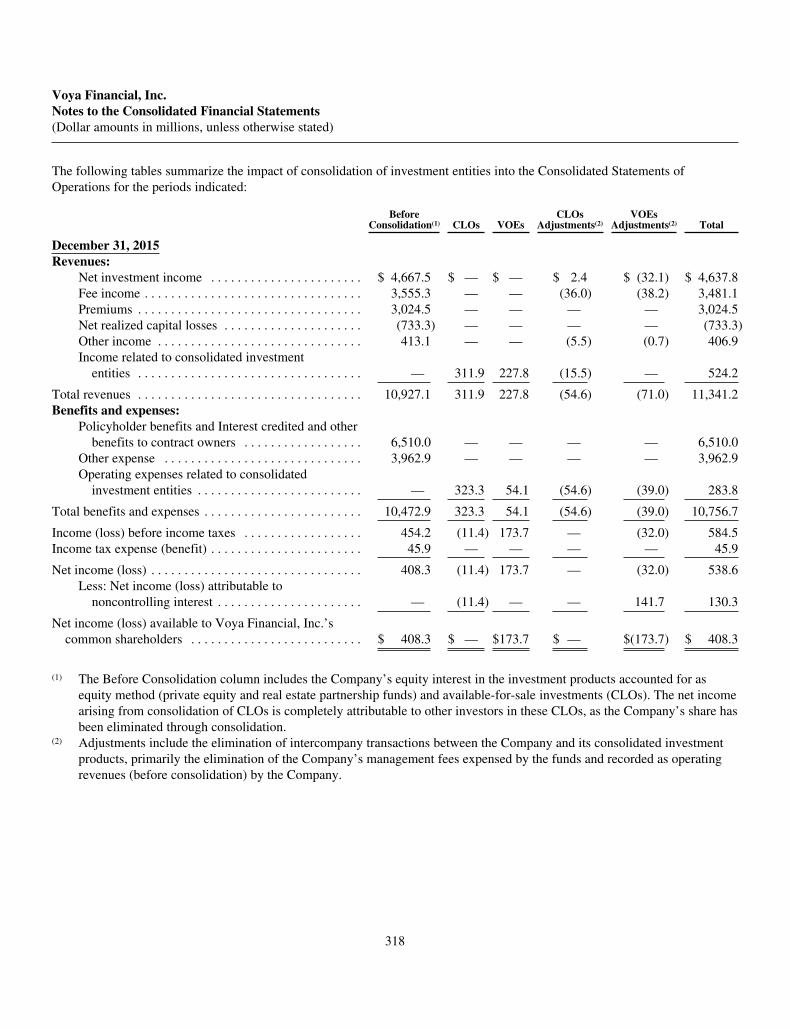
Voya Financial, Inc.Notes to the Consolidated Financial Statements(Dollar amounts in millions, unless otherwise stated)
The following tables summarize the impact of consolidation of investment entities into the Consolidated Statements ofOperations for the periods indicated:
BeforeConsolidation(1) CLOs VOEs
CLOsAdjustments(2)
VOEsAdjustments(2) Total
December 31, 2015Revenues:
Net investment income . . . . . . . . . . . . . . . . . . . . . . . $ 4,667.5 $ — $ — $ 2.4 $ (32.1) $ 4,637.8Fee income . . . . . . . . . . . . . . . . . . . . . . . . . . . . . . . . . 3,555.3 — — (36.0) (38.2) 3,481.1Premiums . . . . . . . . . . . . . . . . . . . . . . . . . . . . . . . . . . 3,024.5 — — — — 3,024.5Net realized capital losses . . . . . . . . . . . . . . . . . . . . . (733.3) — — — — (733.3)Other income . . . . . . . . . . . . . . . . . . . . . . . . . . . . . . . 413.1 — — (5.5) (0.7) 406.9Income related to consolidated investment
entities . . . . . . . . . . . . . . . . . . . . . . . . . . . . . . . . . . — 311.9 227.8 (15.5) — 524.2
Total revenues . . . . . . . . . . . . . . . . . . . . . . . . . . . . . . . . . . 10,927.1 311.9 227.8 (54.6) (71.0) 11,341.2Benefits and expenses:
Policyholder benefits and Interest credited and otherbenefits to contract owners . . . . . . . . . . . . . . . . . . 6,510.0 — — — — 6,510.0
Other expense . . . . . . . . . . . . . . . . . . . . . . . . . . . . . . 3,962.9 — — — — 3,962.9Operating expenses related to consolidated
investment entities . . . . . . . . . . . . . . . . . . . . . . . . . — 323.3 54.1 (54.6) (39.0) 283.8
Total benefits and expenses . . . . . . . . . . . . . . . . . . . . . . . . 10,472.9 323.3 54.1 (54.6) (39.0) 10,756.7
Income (loss) before income taxes . . . . . . . . . . . . . . . . . . 454.2 (11.4) 173.7 — (32.0) 584.5Income tax expense (benefit) . . . . . . . . . . . . . . . . . . . . . . . 45.9 — — — — 45.9
Net income (loss) . . . . . . . . . . . . . . . . . . . . . . . . . . . . . . . . 408.3 (11.4) 173.7 — (32.0) 538.6Less: Net income (loss) attributable to
noncontrolling interest . . . . . . . . . . . . . . . . . . . . . . — (11.4) — — 141.7 130.3
Net income (loss) available to Voya Financial, Inc.’scommon shareholders . . . . . . . . . . . . . . . . . . . . . . . . . . $ 408.3 $ — $173.7 $ — $(173.7) $ 408.3
(1) The Before Consolidation column includes the Company’s equity interest in the investment products accounted for asequity method (private equity and real estate partnership funds) and available-for-sale investments (CLOs). The net incomearising from consolidation of CLOs is completely attributable to other investors in these CLOs, as the Company’s share hasbeen eliminated through consolidation.
(2) Adjustments include the elimination of intercompany transactions between the Company and its consolidated investmentproducts, primarily the elimination of the Company’s management fees expensed by the funds and recorded as operatingrevenues (before consolidation) by the Company.
318
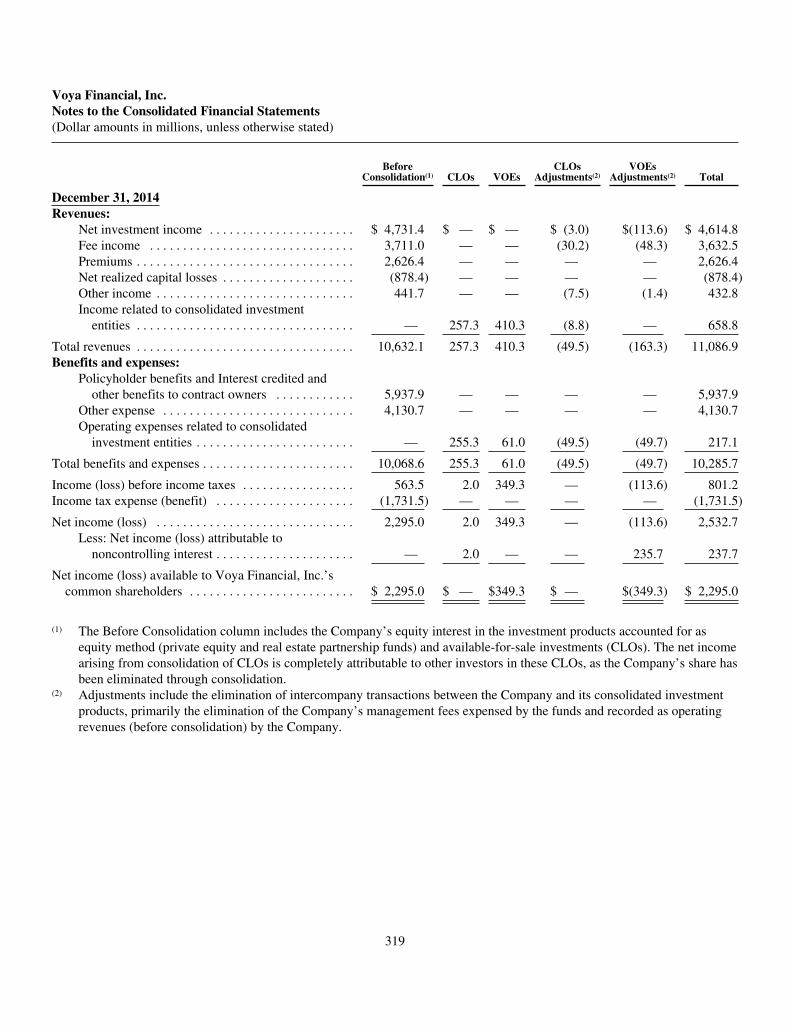
Voya Financial, Inc.Notes to the Consolidated Financial Statements(Dollar amounts in millions, unless otherwise stated)
BeforeConsolidation(1) CLOs VOEs
CLOsAdjustments(2)
VOEsAdjustments(2) Total
December 31, 2014Revenues:
Net investment income . . . . . . . . . . . . . . . . . . . . . . $ 4,731.4 $ — $ — $ (3.0) $(113.6) $ 4,614.8Fee income . . . . . . . . . . . . . . . . . . . . . . . . . . . . . . . 3,711.0 — — (30.2) (48.3) 3,632.5Premiums . . . . . . . . . . . . . . . . . . . . . . . . . . . . . . . . . 2,626.4 — — — — 2,626.4Net realized capital losses . . . . . . . . . . . . . . . . . . . . (878.4) — — — — (878.4)Other income . . . . . . . . . . . . . . . . . . . . . . . . . . . . . . 441.7 — — (7.5) (1.4) 432.8Income related to consolidated investment
entities . . . . . . . . . . . . . . . . . . . . . . . . . . . . . . . . . — 257.3 410.3 (8.8) — 658.8
Total revenues . . . . . . . . . . . . . . . . . . . . . . . . . . . . . . . . . 10,632.1 257.3 410.3 (49.5) (163.3) 11,086.9Benefits and expenses:
Policyholder benefits and Interest credited andother benefits to contract owners . . . . . . . . . . . . 5,937.9 — — — — 5,937.9
Other expense . . . . . . . . . . . . . . . . . . . . . . . . . . . . . 4,130.7 — — — — 4,130.7Operating expenses related to consolidated
investment entities . . . . . . . . . . . . . . . . . . . . . . . . — 255.3 61.0 (49.5) (49.7) 217.1
Total benefits and expenses . . . . . . . . . . . . . . . . . . . . . . . 10,068.6 255.3 61.0 (49.5) (49.7) 10,285.7
Income (loss) before income taxes . . . . . . . . . . . . . . . . . 563.5 2.0 349.3 — (113.6) 801.2Income tax expense (benefit) . . . . . . . . . . . . . . . . . . . . . (1,731.5) — — — — (1,731.5)
Net income (loss) . . . . . . . . . . . . . . . . . . . . . . . . . . . . . . 2,295.0 2.0 349.3 — (113.6) 2,532.7Less: Net income (loss) attributable to
noncontrolling interest . . . . . . . . . . . . . . . . . . . . . — 2.0 — — 235.7 237.7
Net income (loss) available to Voya Financial, Inc.’scommon shareholders . . . . . . . . . . . . . . . . . . . . . . . . . $ 2,295.0 $ — $349.3 $ — $(349.3) $ 2,295.0
(1) The Before Consolidation column includes the Company’s equity interest in the investment products accounted for asequity method (private equity and real estate partnership funds) and available-for-sale investments (CLOs). The net incomearising from consolidation of CLOs is completely attributable to other investors in these CLOs, as the Company’s share hasbeen eliminated through consolidation.
(2) Adjustments include the elimination of intercompany transactions between the Company and its consolidated investmentproducts, primarily the elimination of the Company’s management fees expensed by the funds and recorded as operatingrevenues (before consolidation) by the Company.
319
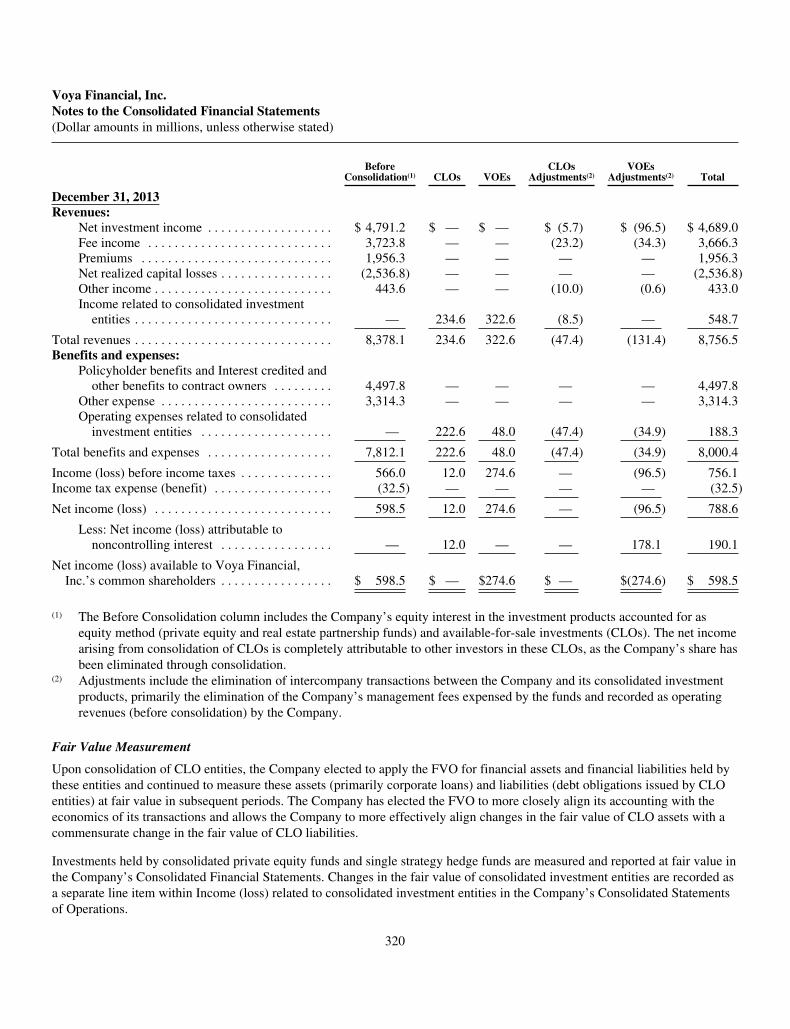
Voya Financial, Inc.Notes to the Consolidated Financial Statements(Dollar amounts in millions, unless otherwise stated)
BeforeConsolidation(1) CLOs VOEs
CLOsAdjustments(2)
VOEsAdjustments(2) Total
December 31, 2013Revenues:
Net investment income . . . . . . . . . . . . . . . . . . . $ 4,791.2 $ — $ — $ (5.7) $ (96.5) $ 4,689.0Fee income . . . . . . . . . . . . . . . . . . . . . . . . . . . . 3,723.8 — — (23.2) (34.3) 3,666.3Premiums . . . . . . . . . . . . . . . . . . . . . . . . . . . . . 1,956.3 — — — — 1,956.3Net realized capital losses . . . . . . . . . . . . . . . . . (2,536.8) — — — — (2,536.8)Other income . . . . . . . . . . . . . . . . . . . . . . . . . . . 443.6 — — (10.0) (0.6) 433.0Income related to consolidated investment
entities . . . . . . . . . . . . . . . . . . . . . . . . . . . . . . — 234.6 322.6 (8.5) — 548.7
Total revenues . . . . . . . . . . . . . . . . . . . . . . . . . . . . . . 8,378.1 234.6 322.6 (47.4) (131.4) 8,756.5Benefits and expenses:
Policyholder benefits and Interest credited andother benefits to contract owners . . . . . . . . . 4,497.8 — — — — 4,497.8
Other expense . . . . . . . . . . . . . . . . . . . . . . . . . . 3,314.3 — — — — 3,314.3Operating expenses related to consolidated
investment entities . . . . . . . . . . . . . . . . . . . . — 222.6 48.0 (47.4) (34.9) 188.3
Total benefits and expenses . . . . . . . . . . . . . . . . . . . 7,812.1 222.6 48.0 (47.4) (34.9) 8,000.4
Income (loss) before income taxes . . . . . . . . . . . . . . 566.0 12.0 274.6 — (96.5) 756.1Income tax expense (benefit) . . . . . . . . . . . . . . . . . . (32.5) — — — — (32.5)
Net income (loss) . . . . . . . . . . . . . . . . . . . . . . . . . . . 598.5 12.0 274.6 — (96.5) 788.6
Less: Net income (loss) attributable tononcontrolling interest . . . . . . . . . . . . . . . . . — 12.0 — — 178.1 190.1
Net income (loss) available to Voya Financial,Inc.’s common shareholders . . . . . . . . . . . . . . . . . $ 598.5 $ — $274.6 $ — $(274.6) $ 598.5
(1) The Before Consolidation column includes the Company’s equity interest in the investment products accounted for asequity method (private equity and real estate partnership funds) and available-for-sale investments (CLOs). The net incomearising from consolidation of CLOs is completely attributable to other investors in these CLOs, as the Company’s share hasbeen eliminated through consolidation.
(2) Adjustments include the elimination of intercompany transactions between the Company and its consolidated investmentproducts, primarily the elimination of the Company’s management fees expensed by the funds and recorded as operatingrevenues (before consolidation) by the Company.
Fair Value Measurement
Upon consolidation of CLO entities, the Company elected to apply the FVO for financial assets and financial liabilities held bythese entities and continued to measure these assets (primarily corporate loans) and liabilities (debt obligations issued by CLOentities) at fair value in subsequent periods. The Company has elected the FVO to more closely align its accounting with theeconomics of its transactions and allows the Company to more effectively align changes in the fair value of CLO assets with acommensurate change in the fair value of CLO liabilities.
Investments held by consolidated private equity funds and single strategy hedge funds are measured and reported at fair value inthe Company’s Consolidated Financial Statements. Changes in the fair value of consolidated investment entities are recorded asa separate line item within Income (loss) related to consolidated investment entities in the Company’s Consolidated Statementsof Operations.
320
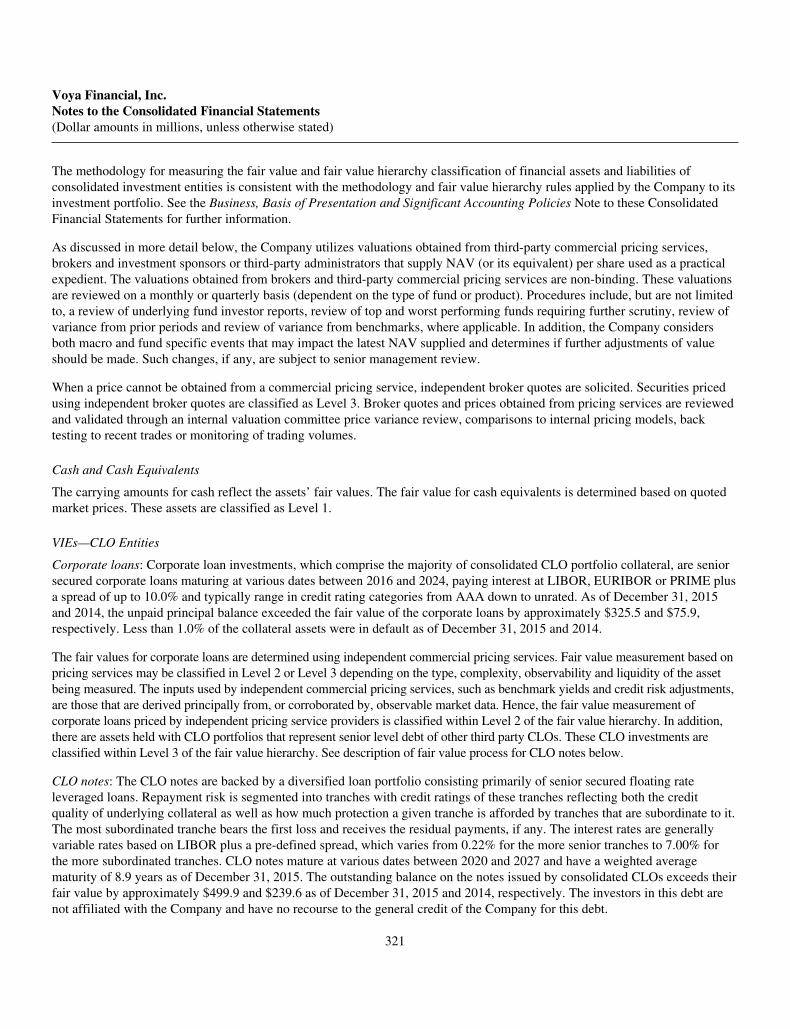
Voya Financial, Inc.Notes to the Consolidated Financial Statements(Dollar amounts in millions, unless otherwise stated)
The methodology for measuring the fair value and fair value hierarchy classification of financial assets and liabilities ofconsolidated investment entities is consistent with the methodology and fair value hierarchy rules applied by the Company to itsinvestment portfolio. See the Business, Basis of Presentation and Significant Accounting Policies Note to these ConsolidatedFinancial Statements for further information.
As discussed in more detail below, the Company utilizes valuations obtained from third-party commercial pricing services,brokers and investment sponsors or third-party administrators that supply NAV (or its equivalent) per share used as a practicalexpedient. The valuations obtained from brokers and third-party commercial pricing services are non-binding. These valuationsare reviewed on a monthly or quarterly basis (dependent on the type of fund or product). Procedures include, but are not limitedto, a review of underlying fund investor reports, review of top and worst performing funds requiring further scrutiny, review ofvariance from prior periods and review of variance from benchmarks, where applicable. In addition, the Company considersboth macro and fund specific events that may impact the latest NAV supplied and determines if further adjustments of valueshould be made. Such changes, if any, are subject to senior management review.
When a price cannot be obtained from a commercial pricing service, independent broker quotes are solicited. Securities pricedusing independent broker quotes are classified as Level 3. Broker quotes and prices obtained from pricing services are reviewedand validated through an internal valuation committee price variance review, comparisons to internal pricing models, backtesting to recent trades or monitoring of trading volumes.
Cash and Cash Equivalents
The carrying amounts for cash reflect the assets’ fair values. The fair value for cash equivalents is determined based on quotedmarket prices. These assets are classified as Level 1.
VIEs—CLO Entities
Corporate loans: Corporate loan investments, which comprise the majority of consolidated CLO portfolio collateral, are seniorsecured corporate loans maturing at various dates between 2016 and 2024, paying interest at LIBOR, EURIBOR or PRIME plusa spread of up to 10.0% and typically range in credit rating categories from AAA down to unrated. As of December 31, 2015and 2014, the unpaid principal balance exceeded the fair value of the corporate loans by approximately $325.5 and $75.9,respectively. Less than 1.0% of the collateral assets were in default as of December 31, 2015 and 2014.
The fair values for corporate loans are determined using independent commercial pricing services. Fair value measurement based onpricing services may be classified in Level 2 or Level 3 depending on the type, complexity, observability and liquidity of the assetbeing measured. The inputs used by independent commercial pricing services, such as benchmark yields and credit risk adjustments,are those that are derived principally from, or corroborated by, observable market data. Hence, the fair value measurement ofcorporate loans priced by independent pricing service providers is classified within Level 2 of the fair value hierarchy. In addition,there are assets held with CLO portfolios that represent senior level debt of other third party CLOs. These CLO investments areclassified within Level 3 of the fair value hierarchy. See description of fair value process for CLO notes below.
CLO notes: The CLO notes are backed by a diversified loan portfolio consisting primarily of senior secured floating rateleveraged loans. Repayment risk is segmented into tranches with credit ratings of these tranches reflecting both the creditquality of underlying collateral as well as how much protection a given tranche is afforded by tranches that are subordinate to it.The most subordinated tranche bears the first loss and receives the residual payments, if any. The interest rates are generallyvariable rates based on LIBOR plus a pre-defined spread, which varies from 0.22% for the more senior tranches to 7.00% forthe more subordinated tranches. CLO notes mature at various dates between 2020 and 2027 and have a weighted averagematurity of 8.9 years as of December 31, 2015. The outstanding balance on the notes issued by consolidated CLOs exceeds theirfair value by approximately $499.9 and $239.6 as of December 31, 2015 and 2014, respectively. The investors in this debt arenot affiliated with the Company and have no recourse to the general credit of the Company for this debt.
321

Voya Financial, Inc.Notes to the Consolidated Financial Statements(Dollar amounts in millions, unless otherwise stated)
The fair values of the CLO notes including subordinated tranches in which the Company retains an ownership interest areobtained from a third-party commercial pricing service. The service combines the modeling of projected cash flow activity andthe calibration of modeled results with transactions that have taken place in the specific debt issue as well as debt issues withsimilar characteristics. Several of the more significant inputs to the models including default rate, recovery rate, prepayment rateand discount margin, are determined primarily based on the nature of the investments in the underlying collateral pools andcannot be corroborated by observable market data. Accordingly, CLO notes are classified within Level 3 of the fair valuehierarchy.
The Company reviews the detailed prices, including comparisons to prior periods, for reasonableness. The Company utilizes aformal pricing challenge process to request a review of any price during which time the vendor examines its assumptions andrelevant market inputs to determine if a price change is warranted.
The following table summarizes significant unobservable inputs for Level 3 fair value measurements as of the dates indicated:
Fair Value Valuation Technique Unobservable Inputs
December 31, 2015Assets:CLO Investments . . . . . . . . . . . $18.3 Discounted Cash Flow Default Rate
Recovery RatePrepayment RateDiscount Margin
Liabilities:CLO Notes . . . . . . . . . . . . . . . . $6,956.2 Discounted Cash Flow Default Rate
Recovery RatePrepayment RateDiscount Margin
Fair Value Valuation Technique Unobservable Inputs
December 31, 2014Assets:CLO Investments . . . . . . . . . . . $19.2 Discounted Cash Flow Default Rate
Recovery RatePrepayment RateDiscount Margin
Liabilities:CLO Notes . . . . . . . . . . . . . . . . $6,838.1 Discounted Cash Flow Default Rate
Recovery RatePrepayment RateDiscount Margin
The following narrative indicates the sensitivity of inputs:
• Default Rate: An increase (decrease) in the expected default rate would likely increase (decrease) the discount margin(increase risk premium) used to value the CLO investments and CLO notes and, as a result, would potentiallydecrease the value of the CLO investments and CLO notes.
• Recovery Rate: A decrease (increase) in the expected recovery of defaulted assets would potentially decrease(increase) the valuation of CLO investments and CLO notes.
322

Voya Financial, Inc.Notes to the Consolidated Financial Statements(Dollar amounts in millions, unless otherwise stated)
• Prepayment Rate: A decrease (increase) in the expected rate of collateral prepayments would potentially decrease(increase) the valuation of CLO investments and CLO notes as the expected weighted average life (“WAL”) wouldincrease.
• Discount Margin (spread over LIBOR): An increase (decrease) in the discount margin used to value the CLOinvestments and CLO notes and would decrease (increase) the value of the CLO investments and CLO notes.
VOEs—Private Equity Funds, Single Strategy Hedge Funds, and Registered Investment Companies
Limited partnerships, at fair value, and the PIF, at fair value, primarily represent the Company’s investments in private equityfunds. At times, the limited partnerships and the PIF make strategic co-investments directly into private equity companies,including, but not limited to, buyout, venture capital, distressed and mezzanine. The Company’s investment in a single strategyhedge fund is also at fair value. The fair value for these investments is estimated based on the NAV from the latest financialstatements of these funds, provided by the fund’s investment manager or third party administrator.
The Voya Strategic Income Opportunities Fund, at fair value, represents the Company’s investment in a fixed income seriesfund, and the fair value for the investment is based on quoted market price.
Private Equity Funds
As prescribed in ASC Topic 820, the unit of account for these investments is the interest in the investee fund. The Companyowns an undivided interest in the fund portfolio and does not have the ability to dispose of individual assets and liabilities in thefund portfolio. Rather, the Company would be required to redeem or dispose of its entire interest in the investee fund. There isno current active market for interests in underlying private equity funds.
Valuation is generally based on the valuations provided by the fund’s general partner or investment manager. The valuationstypically reflect the fair value of the Company’s capital account balance of each fund investment, including unrealized capitalgains (losses), as reported in the financial statements of the respective investee fund as of the respective year end or the latestavailable date. In circumstances where fair values are not provided, the Company seeks to determine the fair value of fundinvestments based upon other information provided by the fund’s general partner or investment manager or from other sources.
The fair value of securities received in-kind from fund investments is determined based on the restrictions around the securities.
• Unrestricted, publicly traded securities are valued at the closing public market price on the reporting date;
• Restricted, publicly traded securities may be valued at a discount from the closing public market price on the reportingdate, depending on the circumstances; and
• Privately held securities are valued by the directors/general partner of the investee fund, based on a variety of factors,including the price of recent transactions in the company’s securities and the company’s earnings, revenue and bookvalue.
In the case of direct investments or co-investments in private equity companies, the Company initially recognizes investments atcost and subsequently adjusts investments to fair value. On a quarterly basis, the Company reviews the general partner or leadinvestor’s valuation of the investee company, taking into account other available information, such as indications of a marketvalue through subsequent issues of capital or transactions between third parties, performance of the investee company during theperiod and public, comparable companies’ analysis, where appropriate.
Investments in these funds typically may not be fully redeemed at NAV within 90 days because of inherent restriction on nearterm redemptions. Therefore, these investments are classified within Level 3 of the fair value hierarchy.
As of December 31, 2015 and 2014, certain private equity funds maintained revolving lines of credit of $597.0 and $550.0,respectively, which renew annually and bear interest at LIBOR/EURIBOR plus 150 and 160 bps, respectively. The lines ofcredit are used for funding transactions before capital is called from investors, as well as for the financing of certain purchases.The private equity funds generally may borrow an amount that does not exceed the lesser of a certain percentage of the funds’undrawn commitments or a certain percentage of the funds’ undrawn commitments plus 250% asset coverage from the investedassets of the funds as of December 31, 2015 and 2014. As of December 31, 2015 and 2014, outstanding borrowings amount to$553.7 and $261.4, respectively. The borrowings are reflected in Liabilities related to consolidated investment entities—otherliabilities on the Consolidated Balance Sheets. The borrowings are carried at an amount equal to the unpaid principal balance.
323
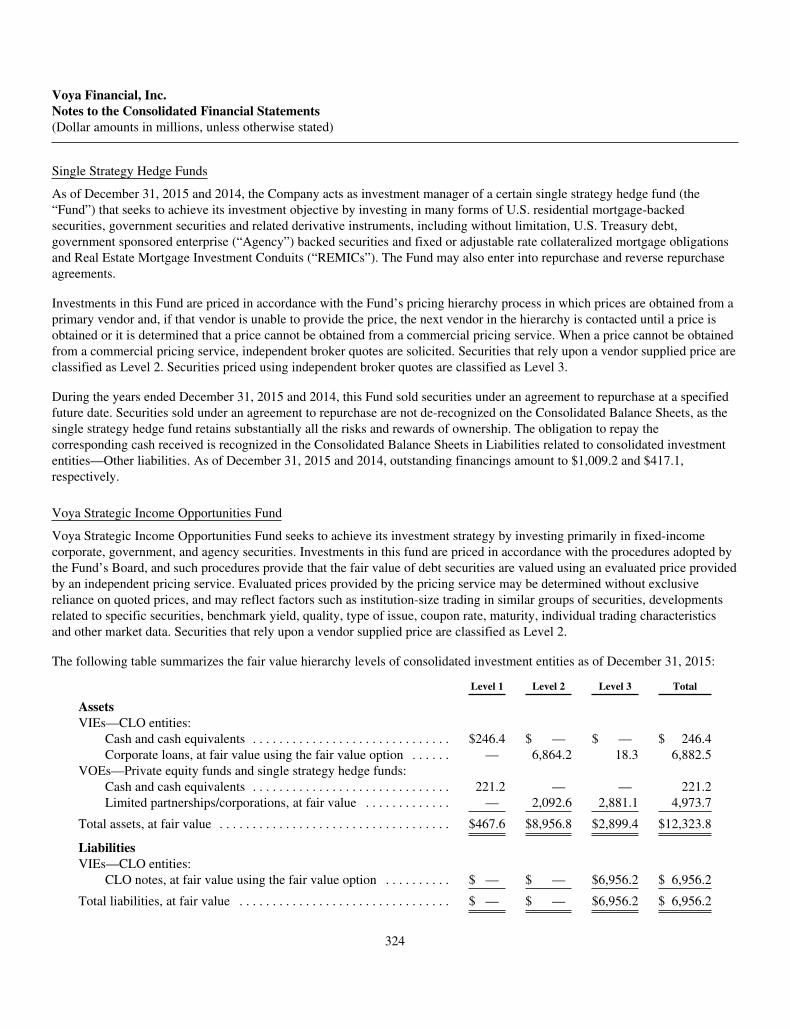
Voya Financial, Inc.Notes to the Consolidated Financial Statements(Dollar amounts in millions, unless otherwise stated)
Single Strategy Hedge Funds
As of December 31, 2015 and 2014, the Company acts as investment manager of a certain single strategy hedge fund (the“Fund”) that seeks to achieve its investment objective by investing in many forms of U.S. residential mortgage-backedsecurities, government securities and related derivative instruments, including without limitation, U.S. Treasury debt,government sponsored enterprise (“Agency”) backed securities and fixed or adjustable rate collateralized mortgage obligationsand Real Estate Mortgage Investment Conduits (“REMICs”). The Fund may also enter into repurchase and reverse repurchaseagreements.
Investments in this Fund are priced in accordance with the Fund’s pricing hierarchy process in which prices are obtained from aprimary vendor and, if that vendor is unable to provide the price, the next vendor in the hierarchy is contacted until a price isobtained or it is determined that a price cannot be obtained from a commercial pricing service. When a price cannot be obtainedfrom a commercial pricing service, independent broker quotes are solicited. Securities that rely upon a vendor supplied price areclassified as Level 2. Securities priced using independent broker quotes are classified as Level 3.
During the years ended December 31, 2015 and 2014, this Fund sold securities under an agreement to repurchase at a specifiedfuture date. Securities sold under an agreement to repurchase are not de-recognized on the Consolidated Balance Sheets, as thesingle strategy hedge fund retains substantially all the risks and rewards of ownership. The obligation to repay thecorresponding cash received is recognized in the Consolidated Balance Sheets in Liabilities related to consolidated investmententities—Other liabilities. As of December 31, 2015 and 2014, outstanding financings amount to $1,009.2 and $417.1,respectively.
Voya Strategic Income Opportunities Fund
Voya Strategic Income Opportunities Fund seeks to achieve its investment strategy by investing primarily in fixed-incomecorporate, government, and agency securities. Investments in this fund are priced in accordance with the procedures adopted bythe Fund’s Board, and such procedures provide that the fair value of debt securities are valued using an evaluated price providedby an independent pricing service. Evaluated prices provided by the pricing service may be determined without exclusivereliance on quoted prices, and may reflect factors such as institution-size trading in similar groups of securities, developmentsrelated to specific securities, benchmark yield, quality, type of issue, coupon rate, maturity, individual trading characteristicsand other market data. Securities that rely upon a vendor supplied price are classified as Level 2.
The following table summarizes the fair value hierarchy levels of consolidated investment entities as of December 31, 2015:
Level 1 Level 2 Level 3 Total
AssetsVIEs—CLO entities:
Cash and cash equivalents . . . . . . . . . . . . . . . . . . . . . . . . . . . . . . $246.4 $ — $ — $ 246.4Corporate loans, at fair value using the fair value option . . . . . . — 6,864.2 18.3 6,882.5
VOEs—Private equity funds and single strategy hedge funds:Cash and cash equivalents . . . . . . . . . . . . . . . . . . . . . . . . . . . . . . 221.2 — — 221.2Limited partnerships/corporations, at fair value . . . . . . . . . . . . . — 2,092.6 2,881.1 4,973.7
Total assets, at fair value . . . . . . . . . . . . . . . . . . . . . . . . . . . . . . . . . . . $467.6 $8,956.8 $2,899.4 $12,323.8
LiabilitiesVIEs—CLO entities:
CLO notes, at fair value using the fair value option . . . . . . . . . . $ — $ — $6,956.2 $ 6,956.2
Total liabilities, at fair value . . . . . . . . . . . . . . . . . . . . . . . . . . . . . . . . $ — $ — $6,956.2 $ 6,956.2
324
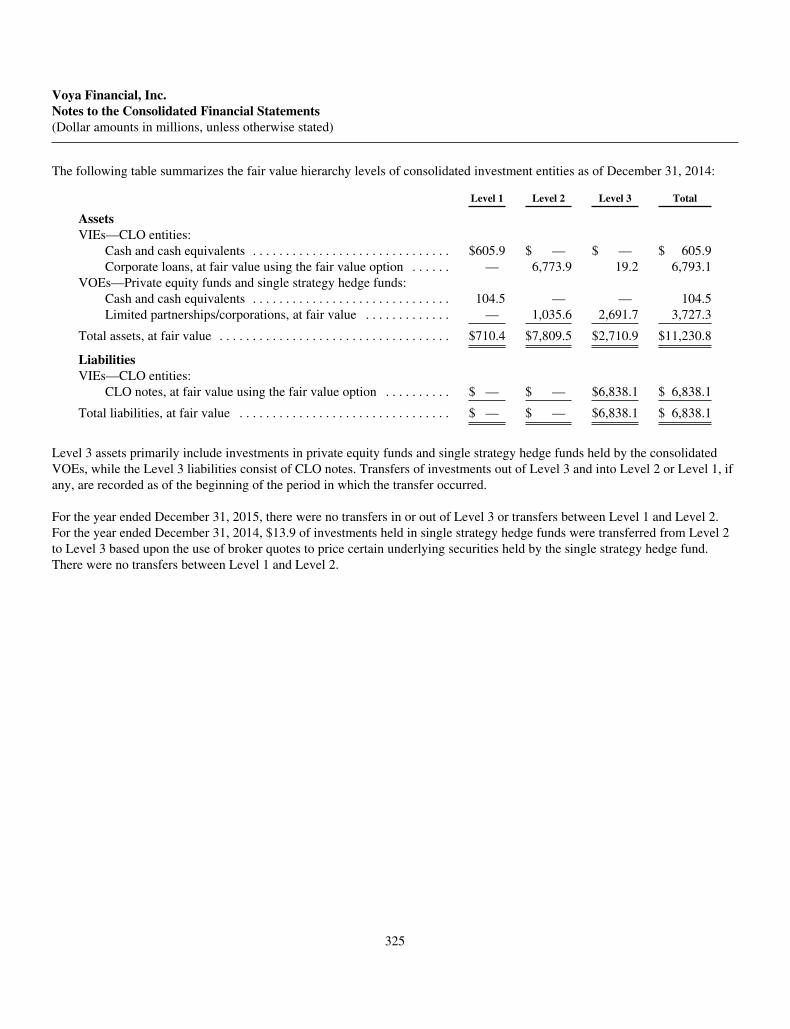
Voya Financial, Inc.Notes to the Consolidated Financial Statements(Dollar amounts in millions, unless otherwise stated)
The following table summarizes the fair value hierarchy levels of consolidated investment entities as of December 31, 2014:
Level 1 Level 2 Level 3 Total
AssetsVIEs—CLO entities:
Cash and cash equivalents . . . . . . . . . . . . . . . . . . . . . . . . . . . . . . $605.9 $ — $ — $ 605.9Corporate loans, at fair value using the fair value option . . . . . . — 6,773.9 19.2 6,793.1
VOEs—Private equity funds and single strategy hedge funds:Cash and cash equivalents . . . . . . . . . . . . . . . . . . . . . . . . . . . . . . 104.5 — — 104.5Limited partnerships/corporations, at fair value . . . . . . . . . . . . . — 1,035.6 2,691.7 3,727.3
Total assets, at fair value . . . . . . . . . . . . . . . . . . . . . . . . . . . . . . . . . . . $710.4 $7,809.5 $2,710.9 $11,230.8
LiabilitiesVIEs—CLO entities:
CLO notes, at fair value using the fair value option . . . . . . . . . . $ — $ — $6,838.1 $ 6,838.1
Total liabilities, at fair value . . . . . . . . . . . . . . . . . . . . . . . . . . . . . . . . $ — $ — $6,838.1 $ 6,838.1
Level 3 assets primarily include investments in private equity funds and single strategy hedge funds held by the consolidatedVOEs, while the Level 3 liabilities consist of CLO notes. Transfers of investments out of Level 3 and into Level 2 or Level 1, ifany, are recorded as of the beginning of the period in which the transfer occurred.
For the year ended December 31, 2015, there were no transfers in or out of Level 3 or transfers between Level 1 and Level 2.For the year ended December 31, 2014, $13.9 of investments held in single strategy hedge funds were transferred from Level 2to Level 3 based upon the use of broker quotes to price certain underlying securities held by the single strategy hedge fund.There were no transfers between Level 1 and Level 2.
325
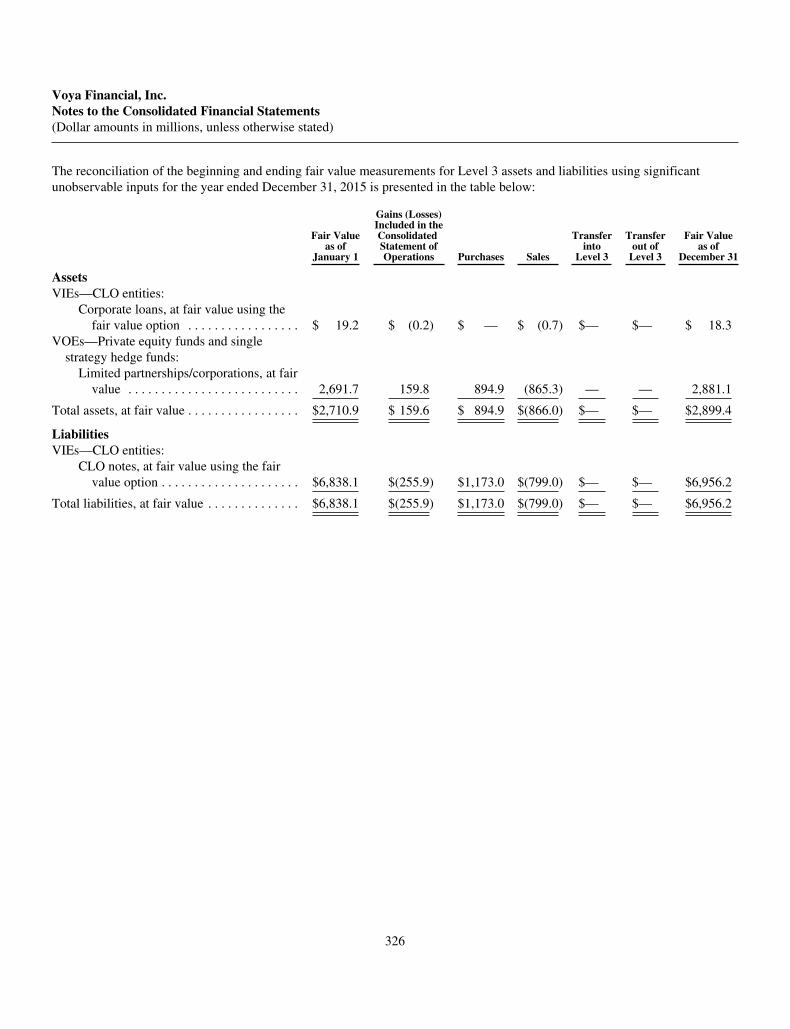
Voya Financial, Inc.Notes to the Consolidated Financial Statements(Dollar amounts in millions, unless otherwise stated)
The reconciliation of the beginning and ending fair value measurements for Level 3 assets and liabilities using significantunobservable inputs for the year ended December 31, 2015 is presented in the table below:
Fair Valueas of
January 1
Gains (Losses)Included in theConsolidatedStatement ofOperations Purchases Sales
Transferinto
Level 3
Transferout of
Level 3
Fair Valueas of
December 31
AssetsVIEs—CLO entities:
Corporate loans, at fair value using thefair value option . . . . . . . . . . . . . . . . . $ 19.2 $ (0.2) $ — $ (0.7) $— $— $ 18.3
VOEs—Private equity funds and singlestrategy hedge funds:
Limited partnerships/corporations, at fairvalue . . . . . . . . . . . . . . . . . . . . . . . . . . 2,691.7 159.8 894.9 (865.3) — — 2,881.1
Total assets, at fair value . . . . . . . . . . . . . . . . . $2,710.9 $ 159.6 $ 894.9 $(866.0) $— $— $2,899.4
LiabilitiesVIEs—CLO entities:
CLO notes, at fair value using the fairvalue option . . . . . . . . . . . . . . . . . . . . . $6,838.1 $(255.9) $1,173.0 $(799.0) $— $— $6,956.2
Total liabilities, at fair value . . . . . . . . . . . . . . $6,838.1 $(255.9) $1,173.0 $(799.0) $— $— $6,956.2
326
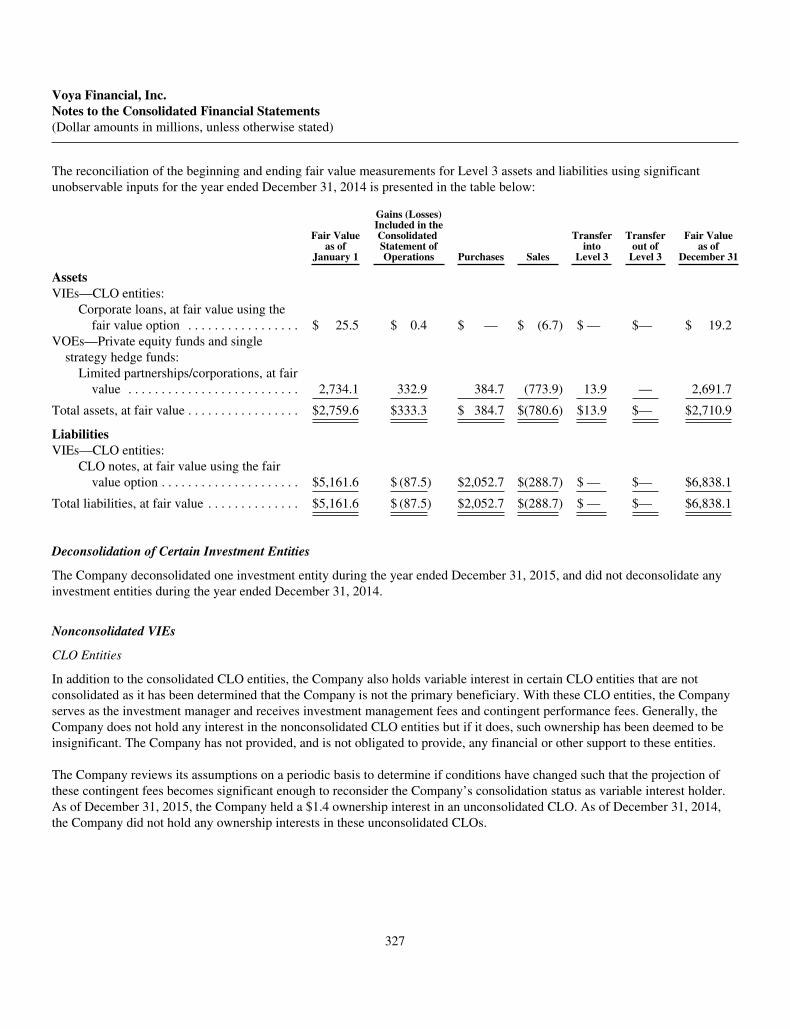
Voya Financial, Inc.Notes to the Consolidated Financial Statements(Dollar amounts in millions, unless otherwise stated)
The reconciliation of the beginning and ending fair value measurements for Level 3 assets and liabilities using significantunobservable inputs for the year ended December 31, 2014 is presented in the table below:
Fair Valueas of
January 1
Gains (Losses)Included in theConsolidatedStatement ofOperations Purchases Sales
Transferinto
Level 3
Transferout of
Level 3
Fair Valueas of
December 31
AssetsVIEs—CLO entities:
Corporate loans, at fair value using thefair value option . . . . . . . . . . . . . . . . . $ 25.5 $ 0.4 $ — $ (6.7) $ — $— $ 19.2
VOEs—Private equity funds and singlestrategy hedge funds:
Limited partnerships/corporations, at fairvalue . . . . . . . . . . . . . . . . . . . . . . . . . . 2,734.1 332.9 384.7 (773.9) 13.9 — 2,691.7
Total assets, at fair value . . . . . . . . . . . . . . . . . $2,759.6 $333.3 $ 384.7 $(780.6) $13.9 $— $2,710.9
LiabilitiesVIEs—CLO entities:
CLO notes, at fair value using the fairvalue option . . . . . . . . . . . . . . . . . . . . . $5,161.6 $ (87.5) $2,052.7 $(288.7) $ — $— $6,838.1
Total liabilities, at fair value . . . . . . . . . . . . . . $5,161.6 $ (87.5) $2,052.7 $(288.7) $ — $— $6,838.1
Deconsolidation of Certain Investment Entities
The Company deconsolidated one investment entity during the year ended December 31, 2015, and did not deconsolidate anyinvestment entities during the year ended December 31, 2014.
Nonconsolidated VIEs
CLO Entities
In addition to the consolidated CLO entities, the Company also holds variable interest in certain CLO entities that are notconsolidated as it has been determined that the Company is not the primary beneficiary. With these CLO entities, the Companyserves as the investment manager and receives investment management fees and contingent performance fees. Generally, theCompany does not hold any interest in the nonconsolidated CLO entities but if it does, such ownership has been deemed to beinsignificant. The Company has not provided, and is not obligated to provide, any financial or other support to these entities.
The Company reviews its assumptions on a periodic basis to determine if conditions have changed such that the projection ofthese contingent fees becomes significant enough to reconsider the Company’s consolidation status as variable interest holder.As of December 31, 2015, the Company held a $1.4 ownership interest in an unconsolidated CLO. As of December 31, 2014,the Company did not hold any ownership interests in these unconsolidated CLOs.
327
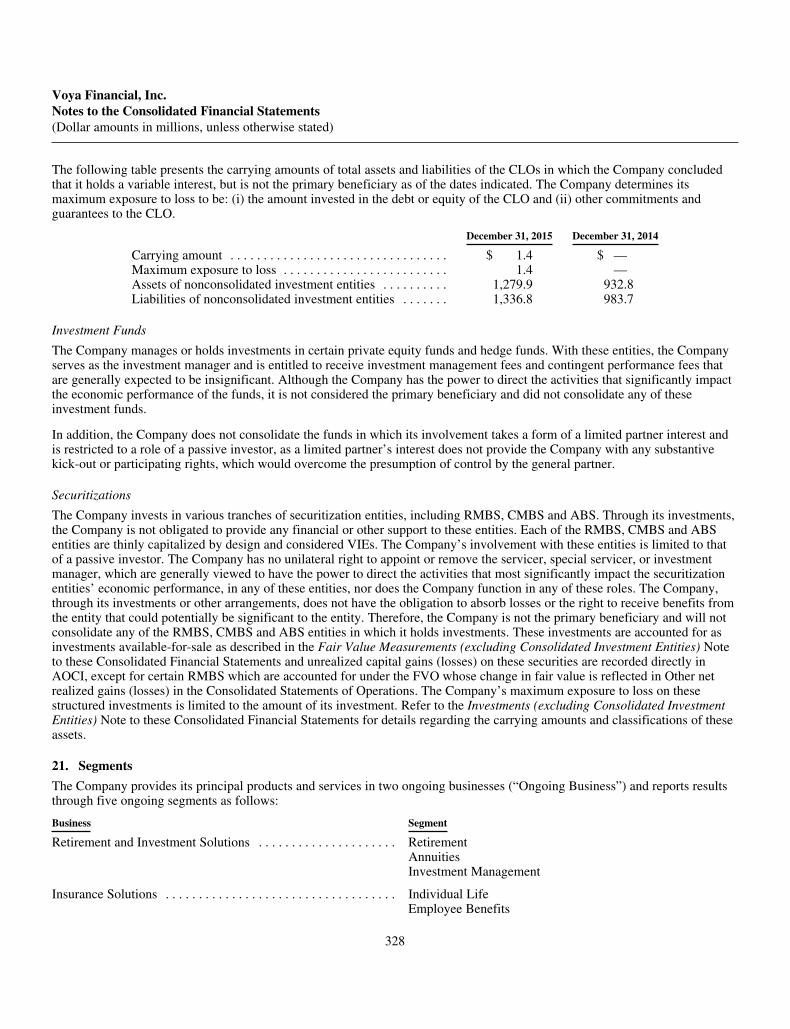
Voya Financial, Inc.Notes to the Consolidated Financial Statements(Dollar amounts in millions, unless otherwise stated)
The following table presents the carrying amounts of total assets and liabilities of the CLOs in which the Company concludedthat it holds a variable interest, but is not the primary beneficiary as of the dates indicated. The Company determines itsmaximum exposure to loss to be: (i) the amount invested in the debt or equity of the CLO and (ii) other commitments andguarantees to the CLO.
December 31, 2015 December 31, 2014
Carrying amount . . . . . . . . . . . . . . . . . . . . . . . . . . . . . . . . . $ 1.4 $ —Maximum exposure to loss . . . . . . . . . . . . . . . . . . . . . . . . . 1.4 —Assets of nonconsolidated investment entities . . . . . . . . . . 1,279.9 932.8Liabilities of nonconsolidated investment entities . . . . . . . 1,336.8 983.7
Investment Funds
The Company manages or holds investments in certain private equity funds and hedge funds. With these entities, the Companyserves as the investment manager and is entitled to receive investment management fees and contingent performance fees thatare generally expected to be insignificant. Although the Company has the power to direct the activities that significantly impactthe economic performance of the funds, it is not considered the primary beneficiary and did not consolidate any of theseinvestment funds.
In addition, the Company does not consolidate the funds in which its involvement takes a form of a limited partner interest andis restricted to a role of a passive investor, as a limited partner’s interest does not provide the Company with any substantivekick-out or participating rights, which would overcome the presumption of control by the general partner.
Securitizations
The Company invests in various tranches of securitization entities, including RMBS, CMBS and ABS. Through its investments,the Company is not obligated to provide any financial or other support to these entities. Each of the RMBS, CMBS and ABSentities are thinly capitalized by design and considered VIEs. The Company’s involvement with these entities is limited to thatof a passive investor. The Company has no unilateral right to appoint or remove the servicer, special servicer, or investmentmanager, which are generally viewed to have the power to direct the activities that most significantly impact the securitizationentities’ economic performance, in any of these entities, nor does the Company function in any of these roles. The Company,through its investments or other arrangements, does not have the obligation to absorb losses or the right to receive benefits fromthe entity that could potentially be significant to the entity. Therefore, the Company is not the primary beneficiary and will notconsolidate any of the RMBS, CMBS and ABS entities in which it holds investments. These investments are accounted for asinvestments available-for-sale as described in the Fair Value Measurements (excluding Consolidated Investment Entities) Noteto these Consolidated Financial Statements and unrealized capital gains (losses) on these securities are recorded directly inAOCI, except for certain RMBS which are accounted for under the FVO whose change in fair value is reflected in Other netrealized gains (losses) in the Consolidated Statements of Operations. The Company’s maximum exposure to loss on thesestructured investments is limited to the amount of its investment. Refer to the Investments (excluding Consolidated InvestmentEntities) Note to these Consolidated Financial Statements for details regarding the carrying amounts and classifications of theseassets.
21. Segments
The Company provides its principal products and services in two ongoing businesses (“Ongoing Business”) and reports resultsthrough five ongoing segments as follows:
Business Segment
Retirement and Investment Solutions . . . . . . . . . . . . . . . . . . . . . RetirementAnnuitiesInvestment Management
Insurance Solutions . . . . . . . . . . . . . . . . . . . . . . . . . . . . . . . . . . . Individual LifeEmployee Benefits
328

Voya Financial, Inc.Notes to the Consolidated Financial Statements(Dollar amounts in millions, unless otherwise stated)
The Company also has a Corporate segment, which includes corporate obligations, assets and obligations and assets notallocated to other segments, and two Closed Block segments, which comprise products that are in run-off and no longer beingactively marketed and sold.
These segments reflect the manner by which the Company’s chief operating decision maker views and manages the business. Abrief description of these segments follows.
Retirement and Investment Solutions
The Retirement and Investment Solutions business provides its products and services through three segments: Retirement,Annuities and Investment Management.
The Retirement segment provides tax-deferred, employer-sponsored retirement savings plans and administrative services tocorporate, education, healthcare, other non-profit and government entities, stable value products and pension risk transfersolutions to institutional clients where the Company may or may not be providing defined contribution products and services, aswell as individual retirement accounts (“IRAs”), other retail financial products and comprehensive financial services toindividual customers.
The Annuities segment primarily provides fixed and indexed annuities, tax-qualified mutual fund custodial products and otherinvestment-only products and payout annuities for pre-retirement wealth accumulation and postretirement income managementsold through multiple channels.
The Investment Management segment provides investment products and retirement solutions across a broad range of geographies,market sectors, investment styles and capitalization spectrums. Products and services are offered to institutional clients, includingpublic, corporate and union retirement plans, endowments and foundations and insurance companies, as well as individualinvestors and general accounts of the Company’s insurance subsidiaries and are distributed through the Company’s direct salesforce, consultant channel and intermediary partners (such as banks, broker-dealers and independent financial advisers).
Insurance Solutions
The Insurance Solutions business provides its products through two segments: Individual Life and Employee Benefits.
The Individual Life segment provides wealth protection and transfer opportunities through universal, variable and term lifeproducts, distributed through a network of independent general agents and managing directors, to meet the needs of a broadrange of customers from the middle market through affluent market segments.
The Employee Benefits segment provides stop loss, group life, voluntary employee-paid and disability products to mid-sizedand large businesses.
Corporate
The Corporate segment includes corporate operations and corporate level assets and financial obligations. The Corporatesegment includes investment income on assets backing surplus in excess of amounts held at the segment level, financing andinterest expenses, and other items not allocated to segments, including items such as expenses of the Company’s strategicinvestment program, certain expenses and liabilities of employee benefit plans and intercompany eliminations.
Closed Blocks
The Closed Blocks segments consist of two separate reporting segments that include run-off and legacy business lines that areno longer being actively marketed or sold.
The Closed Block Variable Annuity (“CBVA”) segment consists of variable annuity contracts that were designed to offer long-term savings products in which individual contract owners made deposits that are maintained in separate accounts. Theseproducts included options for policyholders to purchase living benefit riders. In 2009, the Company separated its CBVA
329
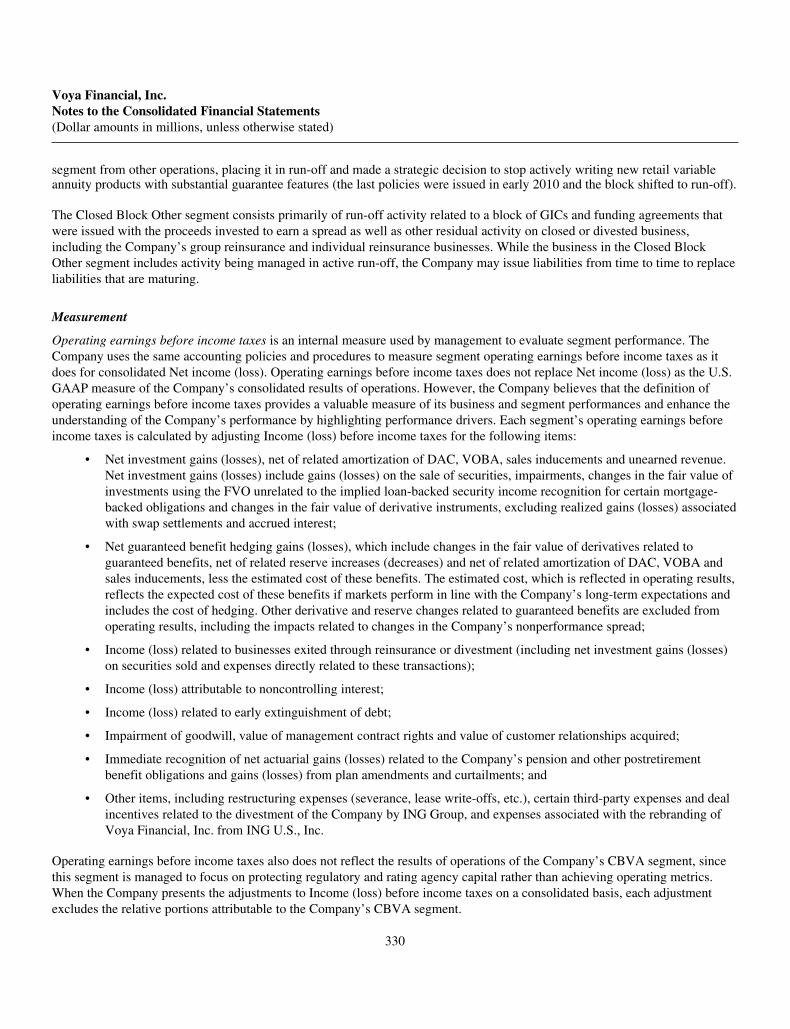
Voya Financial, Inc.Notes to the Consolidated Financial Statements(Dollar amounts in millions, unless otherwise stated)
segment from other operations, placing it in run-off and made a strategic decision to stop actively writing new retail variableannuity products with substantial guarantee features (the last policies were issued in early 2010 and the block shifted to run-off).
The Closed Block Other segment consists primarily of run-off activity related to a block of GICs and funding agreements thatwere issued with the proceeds invested to earn a spread as well as other residual activity on closed or divested business,including the Company’s group reinsurance and individual reinsurance businesses. While the business in the Closed BlockOther segment includes activity being managed in active run-off, the Company may issue liabilities from time to time to replaceliabilities that are maturing.
Measurement
Operating earnings before income taxes is an internal measure used by management to evaluate segment performance. TheCompany uses the same accounting policies and procedures to measure segment operating earnings before income taxes as itdoes for consolidated Net income (loss). Operating earnings before income taxes does not replace Net income (loss) as the U.S.GAAP measure of the Company’s consolidated results of operations. However, the Company believes that the definition ofoperating earnings before income taxes provides a valuable measure of its business and segment performances and enhance theunderstanding of the Company’s performance by highlighting performance drivers. Each segment’s operating earnings beforeincome taxes is calculated by adjusting Income (loss) before income taxes for the following items:
• Net investment gains (losses), net of related amortization of DAC, VOBA, sales inducements and unearned revenue.Net investment gains (losses) include gains (losses) on the sale of securities, impairments, changes in the fair value ofinvestments using the FVO unrelated to the implied loan-backed security income recognition for certain mortgage-backed obligations and changes in the fair value of derivative instruments, excluding realized gains (losses) associatedwith swap settlements and accrued interest;
• Net guaranteed benefit hedging gains (losses), which include changes in the fair value of derivatives related toguaranteed benefits, net of related reserve increases (decreases) and net of related amortization of DAC, VOBA andsales inducements, less the estimated cost of these benefits. The estimated cost, which is reflected in operating results,reflects the expected cost of these benefits if markets perform in line with the Company’s long-term expectations andincludes the cost of hedging. Other derivative and reserve changes related to guaranteed benefits are excluded fromoperating results, including the impacts related to changes in the Company’s nonperformance spread;
• Income (loss) related to businesses exited through reinsurance or divestment (including net investment gains (losses)on securities sold and expenses directly related to these transactions);
• Income (loss) attributable to noncontrolling interest;
• Income (loss) related to early extinguishment of debt;
• Impairment of goodwill, value of management contract rights and value of customer relationships acquired;
• Immediate recognition of net actuarial gains (losses) related to the Company’s pension and other postretirementbenefit obligations and gains (losses) from plan amendments and curtailments; and
• Other items, including restructuring expenses (severance, lease write-offs, etc.), certain third-party expenses and dealincentives related to the divestment of the Company by ING Group, and expenses associated with the rebranding ofVoya Financial, Inc. from ING U.S., Inc.
Operating earnings before income taxes also does not reflect the results of operations of the Company’s CBVA segment, sincethis segment is managed to focus on protecting regulatory and rating agency capital rather than achieving operating metrics.When the Company presents the adjustments to Income (loss) before income taxes on a consolidated basis, each adjustmentexcludes the relative portions attributable to the Company’s CBVA segment.
330
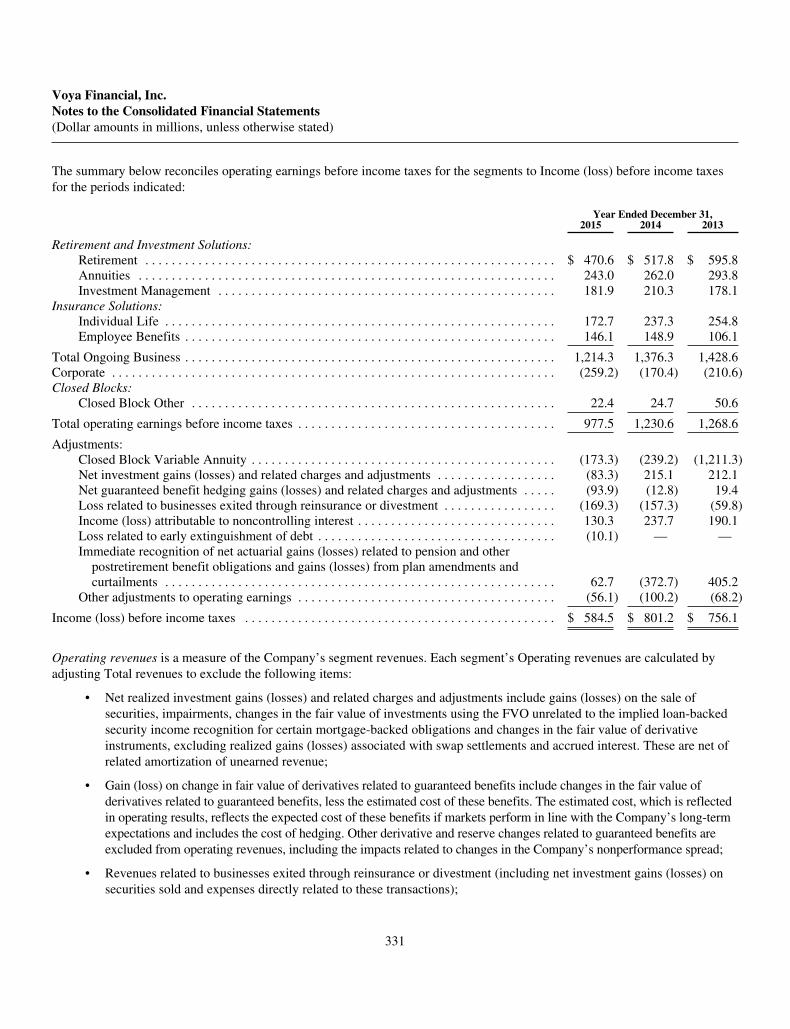
Voya Financial, Inc.Notes to the Consolidated Financial Statements(Dollar amounts in millions, unless otherwise stated)
The summary below reconciles operating earnings before income taxes for the segments to Income (loss) before income taxesfor the periods indicated:
Year Ended December 31,2015 2014 2013
Retirement and Investment Solutions:Retirement . . . . . . . . . . . . . . . . . . . . . . . . . . . . . . . . . . . . . . . . . . . . . . . . . . . . . . . . . . . . . . $ 470.6 $ 517.8 $ 595.8Annuities . . . . . . . . . . . . . . . . . . . . . . . . . . . . . . . . . . . . . . . . . . . . . . . . . . . . . . . . . . . . . . . 243.0 262.0 293.8Investment Management . . . . . . . . . . . . . . . . . . . . . . . . . . . . . . . . . . . . . . . . . . . . . . . . . . . 181.9 210.3 178.1
Insurance Solutions:Individual Life . . . . . . . . . . . . . . . . . . . . . . . . . . . . . . . . . . . . . . . . . . . . . . . . . . . . . . . . . . . 172.7 237.3 254.8Employee Benefits . . . . . . . . . . . . . . . . . . . . . . . . . . . . . . . . . . . . . . . . . . . . . . . . . . . . . . . . 146.1 148.9 106.1
Total Ongoing Business . . . . . . . . . . . . . . . . . . . . . . . . . . . . . . . . . . . . . . . . . . . . . . . . . . . . . . . . 1,214.3 1,376.3 1,428.6Corporate . . . . . . . . . . . . . . . . . . . . . . . . . . . . . . . . . . . . . . . . . . . . . . . . . . . . . . . . . . . . . . . . . . . (259.2) (170.4) (210.6)Closed Blocks:
Closed Block Other . . . . . . . . . . . . . . . . . . . . . . . . . . . . . . . . . . . . . . . . . . . . . . . . . . . . . . . 22.4 24.7 50.6
Total operating earnings before income taxes . . . . . . . . . . . . . . . . . . . . . . . . . . . . . . . . . . . . . . . 977.5 1,230.6 1,268.6
Adjustments:Closed Block Variable Annuity . . . . . . . . . . . . . . . . . . . . . . . . . . . . . . . . . . . . . . . . . . . . . . (173.3) (239.2) (1,211.3)Net investment gains (losses) and related charges and adjustments . . . . . . . . . . . . . . . . . . (83.3) 215.1 212.1Net guaranteed benefit hedging gains (losses) and related charges and adjustments . . . . . (93.9) (12.8) 19.4Loss related to businesses exited through reinsurance or divestment . . . . . . . . . . . . . . . . . (169.3) (157.3) (59.8)Income (loss) attributable to noncontrolling interest . . . . . . . . . . . . . . . . . . . . . . . . . . . . . . 130.3 237.7 190.1Loss related to early extinguishment of debt . . . . . . . . . . . . . . . . . . . . . . . . . . . . . . . . . . . . (10.1) — —Immediate recognition of net actuarial gains (losses) related to pension and other
postretirement benefit obligations and gains (losses) from plan amendments andcurtailments . . . . . . . . . . . . . . . . . . . . . . . . . . . . . . . . . . . . . . . . . . . . . . . . . . . . . . . . . . . 62.7 (372.7) 405.2
Other adjustments to operating earnings . . . . . . . . . . . . . . . . . . . . . . . . . . . . . . . . . . . . . . . (56.1) (100.2) (68.2)
Income (loss) before income taxes . . . . . . . . . . . . . . . . . . . . . . . . . . . . . . . . . . . . . . . . . . . . . . . $ 584.5 $ 801.2 $ 756.1
Operating revenues is a measure of the Company’s segment revenues. Each segment’s Operating revenues are calculated byadjusting Total revenues to exclude the following items:
• Net realized investment gains (losses) and related charges and adjustments include gains (losses) on the sale ofsecurities, impairments, changes in the fair value of investments using the FVO unrelated to the implied loan-backedsecurity income recognition for certain mortgage-backed obligations and changes in the fair value of derivativeinstruments, excluding realized gains (losses) associated with swap settlements and accrued interest. These are net ofrelated amortization of unearned revenue;
• Gain (loss) on change in fair value of derivatives related to guaranteed benefits include changes in the fair value ofderivatives related to guaranteed benefits, less the estimated cost of these benefits. The estimated cost, which is reflectedin operating results, reflects the expected cost of these benefits if markets perform in line with the Company’s long-termexpectations and includes the cost of hedging. Other derivative and reserve changes related to guaranteed benefits areexcluded from operating revenues, including the impacts related to changes in the Company’s nonperformance spread;
• Revenues related to businesses exited through reinsurance or divestment (including net investment gains (losses) onsecurities sold and expenses directly related to these transactions);
331
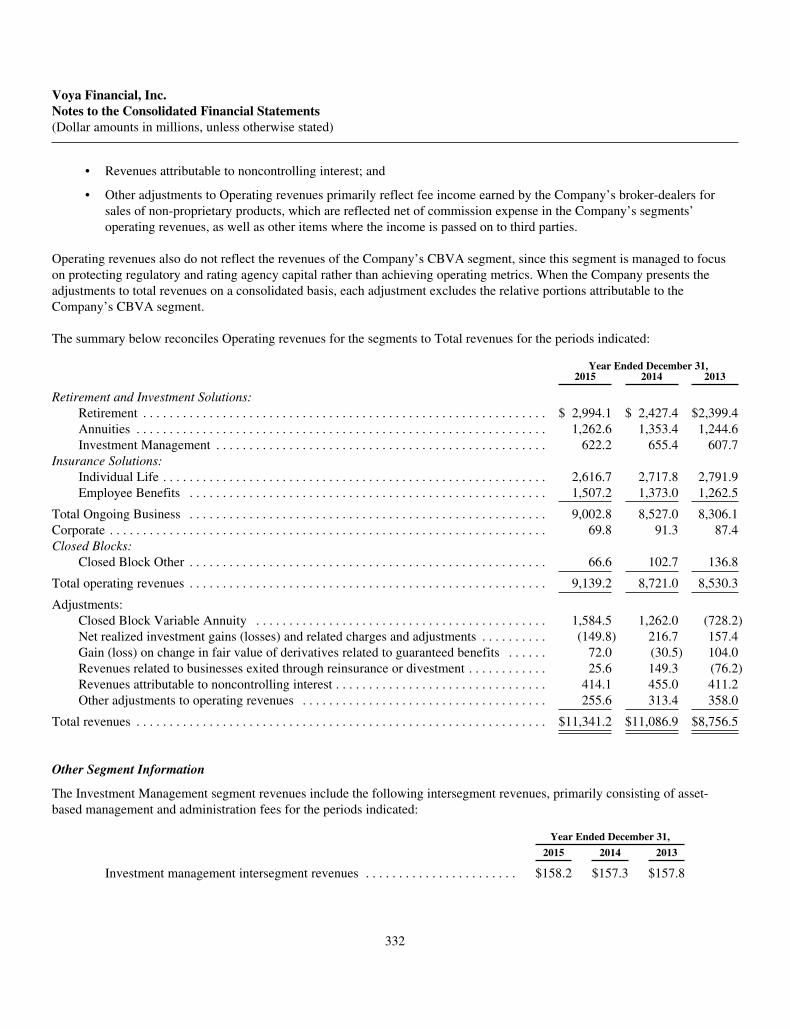
Voya Financial, Inc.Notes to the Consolidated Financial Statements(Dollar amounts in millions, unless otherwise stated)
• Revenues attributable to noncontrolling interest; and
• Other adjustments to Operating revenues primarily reflect fee income earned by the Company’s broker-dealers forsales of non-proprietary products, which are reflected net of commission expense in the Company’s segments’operating revenues, as well as other items where the income is passed on to third parties.
Operating revenues also do not reflect the revenues of the Company’s CBVA segment, since this segment is managed to focuson protecting regulatory and rating agency capital rather than achieving operating metrics. When the Company presents theadjustments to total revenues on a consolidated basis, each adjustment excludes the relative portions attributable to theCompany’s CBVA segment.
The summary below reconciles Operating revenues for the segments to Total revenues for the periods indicated:
Year Ended December 31,2015 2014 2013
Retirement and Investment Solutions:Retirement . . . . . . . . . . . . . . . . . . . . . . . . . . . . . . . . . . . . . . . . . . . . . . . . . . . . . . . . . . . . . $ 2,994.1 $ 2,427.4 $2,399.4Annuities . . . . . . . . . . . . . . . . . . . . . . . . . . . . . . . . . . . . . . . . . . . . . . . . . . . . . . . . . . . . . . 1,262.6 1,353.4 1,244.6Investment Management . . . . . . . . . . . . . . . . . . . . . . . . . . . . . . . . . . . . . . . . . . . . . . . . . . 622.2 655.4 607.7
Insurance Solutions:Individual Life . . . . . . . . . . . . . . . . . . . . . . . . . . . . . . . . . . . . . . . . . . . . . . . . . . . . . . . . . . 2,616.7 2,717.8 2,791.9Employee Benefits . . . . . . . . . . . . . . . . . . . . . . . . . . . . . . . . . . . . . . . . . . . . . . . . . . . . . . 1,507.2 1,373.0 1,262.5
Total Ongoing Business . . . . . . . . . . . . . . . . . . . . . . . . . . . . . . . . . . . . . . . . . . . . . . . . . . . . . . 9,002.8 8,527.0 8,306.1Corporate . . . . . . . . . . . . . . . . . . . . . . . . . . . . . . . . . . . . . . . . . . . . . . . . . . . . . . . . . . . . . . . . . . 69.8 91.3 87.4Closed Blocks:
Closed Block Other . . . . . . . . . . . . . . . . . . . . . . . . . . . . . . . . . . . . . . . . . . . . . . . . . . . . . . 66.6 102.7 136.8
Total operating revenues . . . . . . . . . . . . . . . . . . . . . . . . . . . . . . . . . . . . . . . . . . . . . . . . . . . . . . 9,139.2 8,721.0 8,530.3
Adjustments:Closed Block Variable Annuity . . . . . . . . . . . . . . . . . . . . . . . . . . . . . . . . . . . . . . . . . . . . 1,584.5 1,262.0 (728.2)Net realized investment gains (losses) and related charges and adjustments . . . . . . . . . . (149.8) 216.7 157.4Gain (loss) on change in fair value of derivatives related to guaranteed benefits . . . . . . 72.0 (30.5) 104.0Revenues related to businesses exited through reinsurance or divestment . . . . . . . . . . . . 25.6 149.3 (76.2)Revenues attributable to noncontrolling interest . . . . . . . . . . . . . . . . . . . . . . . . . . . . . . . . 414.1 455.0 411.2Other adjustments to operating revenues . . . . . . . . . . . . . . . . . . . . . . . . . . . . . . . . . . . . . 255.6 313.4 358.0
Total revenues . . . . . . . . . . . . . . . . . . . . . . . . . . . . . . . . . . . . . . . . . . . . . . . . . . . . . . . . . . . . . . $11,341.2 $11,086.9 $8,756.5
Other Segment Information
The Investment Management segment revenues include the following intersegment revenues, primarily consisting of asset-based management and administration fees for the periods indicated:
Year Ended December 31,
2015 2014 2013
Investment management intersegment revenues . . . . . . . . . . . . . . . . . . . . . . . $158.2 $157.3 $157.8
332

Voya Financial, Inc.Notes to the Consolidated Financial Statements(Dollar amounts in millions, unless otherwise stated)
The summary below presents Total assets for the Company’s segments as of the dates indicated:
December 31,2015
December 31,2014
Retirement and Investment Solutions:Retirement . . . . . . . . . . . . . . . . . . . . . . . . . . . . . . . . . . . . . . . . . $ 93,771.5 $ 96,433.9Annuities . . . . . . . . . . . . . . . . . . . . . . . . . . . . . . . . . . . . . . . . . . 25,055.7 25,901.5Investment Management . . . . . . . . . . . . . . . . . . . . . . . . . . . . . . 556.8 492.6
Insurance Solutions:Individual Life . . . . . . . . . . . . . . . . . . . . . . . . . . . . . . . . . . . . . . 26,068.9 26,877.1Employee Benefits . . . . . . . . . . . . . . . . . . . . . . . . . . . . . . . . . . . 2,554.8 2,602.4
Total Ongoing Business . . . . . . . . . . . . . . . . . . . . . . . . . . . . . . . . . . . 148,007.7 152,307.5Corporate . . . . . . . . . . . . . . . . . . . . . . . . . . . . . . . . . . . . . . . . . . . . . . 5,919.2 5,889.3Closed Blocks:
Closed Block Variable Annuity . . . . . . . . . . . . . . . . . . . . . . . . . 44,322.9 48,706.9Closed Block Other . . . . . . . . . . . . . . . . . . . . . . . . . . . . . . . . . . 8,244.5 9,398.2
Closed Blocks . . . . . . . . . . . . . . . . . . . . . . . . . . . . . . . . . . . . . . . . . . 52,567.4 58,105.1
Total assets of segments . . . . . . . . . . . . . . . . . . . . . . . . . . . . . . . . . . . 206,494.3 216,301.9Noncontrolling interest . . . . . . . . . . . . . . . . . . . . . . . . . . . . . . . 11,755.3 10,628.8
Total assets . . . . . . . . . . . . . . . . . . . . . . . . . . . . . . . . . . . . . . . . . . . . . $218,249.6 $226,930.7
22. Condensed Consolidating Financial Information
The accompanying condensed consolidating financial information has been prepared and presented pursuant to SEC RegulationS-X, Rule 3-10, “Financial Statements of Guarantors and Issuers of Guaranteed Securities Registered or Being Registered”(“Rule 3-10”). The condensed consolidating financial information presents the financial position of Voya Financial, Inc.(“Parent Issuer”), Voya Holdings (“Subsidiary Guarantor”) and all other subsidiaries (“Non-Guarantor Subsidiaries”) of theCompany as of December 31, 2015 and 2014, and their results of operations, comprehensive income and cash flows for theyears ended December 31, 2015, 2014 and 2013.
The 5.5% senior notes due 2022, the 2.9% senior notes due 2018 and the 5.7% senior notes due 2043 (collectively, the “SeniorNotes”) and the 5.65% fixed-to-floating rate junior subordinated notes due 2053 (the “Junior Subordinated Notes”) are fully andunconditionally guaranteed by Voya Holdings, a 100% owned subsidiary of the Company. No other subsidiary of VoyaFinancial, Inc. guarantees the Senior Notes or the Junior Subordinated Notes. Rule 3-10(h) provides that a guarantee is full andunconditional if, when the issuer of a guaranteed security has failed to make a scheduled payment, the guarantor is obligated tomake the scheduled payment immediately and, if it does not, any holder of the guaranteed security may immediately bring suitdirectly against the guarantor for payment of amounts due and payable. In the event that Voya Holdings does not fulfill theguaranteed obligations, any holder of the Senior Notes or the Junior Subordinated Notes may immediately bring a claim againstVoya Holdings for amounts due and payable. See the Insurance Subsidiaries Note to these Consolidated Financial Statementsfor information on any significant restrictions on the ability of the Parent Issuer or Subsidiary Guarantor to obtain funds from itssubsidiaries by dividend or return of capital.
The following condensed consolidating financial information is presented in conformance with the components of theCondensed Consolidated Financial Statements. Investments in subsidiaries are accounted for using the equity method forpurposes of illustrating the consolidating presentation. Equity in the subsidiaries is therefore reflected in the Parent Issuer’s andSubsidiary Guarantor’s Investment in subsidiaries and Equity in earnings of subsidiaries. Non-Guarantor Subsidiaries representall other subsidiaries on a combined basis. The consolidating adjustments presented herein eliminate investments in subsidiariesand intercompany balances and transactions.
333

Voya Financial, Inc.Notes to the Consolidated Financial Statements(Dollar amounts in millions, unless otherwise stated)
Condensed Consolidating Balance SheetDecember 31, 2015
ParentIssuer
SubsidiaryGuarantor
Non-GuarantorSubsidiaries
ConsolidatingAdjustments Consolidated
Assets:Investments:
Fixed maturities, available-for-sale, at fair value . . . . . $ — $ — $ 67,748.7 $ (15.3) $ 67,733.4Fixed maturities, at fair value using the fair value
option . . . . . . . . . . . . . . . . . . . . . . . . . . . . . . . . . . . . — — 3,226.6 — 3,226.6Equity securities, available-for-sale, at fair value . . . . 83.7 — 248.0 — 331.7Short-term investments . . . . . . . . . . . . . . . . . . . . . . . . . 212.0 — 1,284.7 — 1,496.7Mortgage loans on real estate, net of valuation
allowance . . . . . . . . . . . . . . . . . . . . . . . . . . . . . . . . . — — 10,447.5 — 10,447.5Policy loans . . . . . . . . . . . . . . . . . . . . . . . . . . . . . . . . . . — — 2,002.7 — 2,002.7Limited partnerships/corporations . . . . . . . . . . . . . . . . — — 510.6 — 510.6Derivatives . . . . . . . . . . . . . . . . . . . . . . . . . . . . . . . . . . 67.2 — 1,605.7 (134.4) 1,538.5Investments in subsidiaries . . . . . . . . . . . . . . . . . . . . . . 15,110.5 11,092.2 — (26,202.7) —Other investments . . . . . . . . . . . . . . . . . . . . . . . . . . . . . — 0.5 91.1 — 91.6Securities pledged . . . . . . . . . . . . . . . . . . . . . . . . . . . . . — — 1,112.6 — 1,112.6
Total investments . . . . . . . . . . . . . . . . . . . . . . . . . . . . . . . . . 15,473.4 11,092.7 88,278.2 (26,352.4) 88,491.9Cash and cash equivalents . . . . . . . . . . . . . . . . . . . . . . . . . . 378.1 18.4 2,116.2 — 2,512.7Short-term investments under securities loan agreements,
including collateral delivered . . . . . . . . . . . . . . . . . . . . . . 10.6 — 649.4 — 660.0Accrued investment income . . . . . . . . . . . . . . . . . . . . . . . . . — — 899.0 — 899.0Reinsurance recoverable . . . . . . . . . . . . . . . . . . . . . . . . . . . . — — 7,653.7 — 7,653.7Deferred policy acquisition costs, Value of business
acquired . . . . . . . . . . . . . . . . . . . . . . . . . . . . . . . . . . . . . . . — — 5,370.1 — 5,370.1Sales inducements to contract holders . . . . . . . . . . . . . . . . . — — 263.3 — 263.3Deferred income taxes . . . . . . . . . . . . . . . . . . . . . . . . . . . . . 404.4 32.7 1,777.7 — 2,214.8Goodwill and other intangible assets . . . . . . . . . . . . . . . . . . — — 250.8 — 250.8Loans to subsidiaries and affiliates . . . . . . . . . . . . . . . . . . . . 330.2 — — (330.2) —Due from subsidiaries and affiliates . . . . . . . . . . . . . . . . . . . 6.1 0.1 1.9 (8.1) —Other assets . . . . . . . . . . . . . . . . . . . . . . . . . . . . . . . . . . . . . . 45.9 — 894.5 — 940.4Assets related to consolidated investment entities:
Limited partnerships/corporations, at fair value . . . . . . — — 4,973.7 — 4,973.7Cash and cash equivalents . . . . . . . . . . . . . . . . . . . . . . — — 467.6 — 467.6Corporate loans, at fair value using the fair value
option . . . . . . . . . . . . . . . . . . . . . . . . . . . . . . . . . . . . — — 6,882.5 — 6,882.5Other assets . . . . . . . . . . . . . . . . . . . . . . . . . . . . . . . . . . — — 154.3 — 154.3
Assets held in separate accounts . . . . . . . . . . . . . . . . . . . . . . — — 96,514.8 — 96,514.8
Total assets . . . . . . . . . . . . . . . . . . . . . . . . . . . . . . . . . . . . . . $16,648.7 $11,143.9 $217,147.7 $(26,690.7) $218,249.6
334
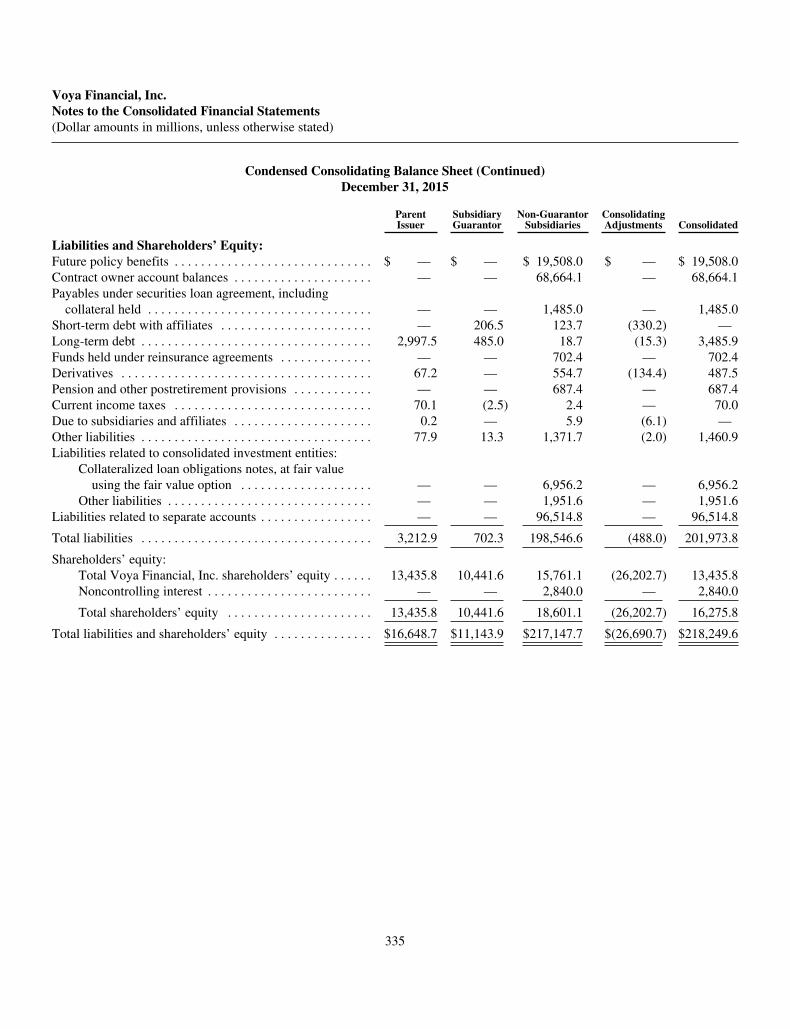
Voya Financial, Inc.Notes to the Consolidated Financial Statements(Dollar amounts in millions, unless otherwise stated)
Condensed Consolidating Balance Sheet (Continued)December 31, 2015
ParentIssuer
SubsidiaryGuarantor
Non-GuarantorSubsidiaries
ConsolidatingAdjustments Consolidated
Liabilities and Shareholders’ Equity:Future policy benefits . . . . . . . . . . . . . . . . . . . . . . . . . . . . . . $ — $ — $ 19,508.0 $ — $ 19,508.0Contract owner account balances . . . . . . . . . . . . . . . . . . . . . — — 68,664.1 — 68,664.1Payables under securities loan agreement, including
collateral held . . . . . . . . . . . . . . . . . . . . . . . . . . . . . . . . . . — — 1,485.0 — 1,485.0Short-term debt with affiliates . . . . . . . . . . . . . . . . . . . . . . . — 206.5 123.7 (330.2) —Long-term debt . . . . . . . . . . . . . . . . . . . . . . . . . . . . . . . . . . . 2,997.5 485.0 18.7 (15.3) 3,485.9Funds held under reinsurance agreements . . . . . . . . . . . . . . — — 702.4 — 702.4Derivatives . . . . . . . . . . . . . . . . . . . . . . . . . . . . . . . . . . . . . . 67.2 — 554.7 (134.4) 487.5Pension and other postretirement provisions . . . . . . . . . . . . — — 687.4 — 687.4Current income taxes . . . . . . . . . . . . . . . . . . . . . . . . . . . . . . 70.1 (2.5) 2.4 — 70.0Due to subsidiaries and affiliates . . . . . . . . . . . . . . . . . . . . . 0.2 — 5.9 (6.1) —Other liabilities . . . . . . . . . . . . . . . . . . . . . . . . . . . . . . . . . . . 77.9 13.3 1,371.7 (2.0) 1,460.9Liabilities related to consolidated investment entities:
Collateralized loan obligations notes, at fair valueusing the fair value option . . . . . . . . . . . . . . . . . . . . — — 6,956.2 — 6,956.2
Other liabilities . . . . . . . . . . . . . . . . . . . . . . . . . . . . . . . — — 1,951.6 — 1,951.6Liabilities related to separate accounts . . . . . . . . . . . . . . . . . — — 96,514.8 — 96,514.8
Total liabilities . . . . . . . . . . . . . . . . . . . . . . . . . . . . . . . . . . . 3,212.9 702.3 198,546.6 (488.0) 201,973.8
Shareholders’ equity:Total Voya Financial, Inc. shareholders’ equity . . . . . . 13,435.8 10,441.6 15,761.1 (26,202.7) 13,435.8Noncontrolling interest . . . . . . . . . . . . . . . . . . . . . . . . . — — 2,840.0 — 2,840.0
Total shareholders’ equity . . . . . . . . . . . . . . . . . . . . . . 13,435.8 10,441.6 18,601.1 (26,202.7) 16,275.8
Total liabilities and shareholders’ equity . . . . . . . . . . . . . . . $16,648.7 $11,143.9 $217,147.7 $(26,690.7) $218,249.6
335

Voya Financial, Inc.Notes to the Consolidated Financial Statements(Dollar amounts in millions, unless otherwise stated)
Condensed Consolidating Balance SheetDecember 31, 2014
ParentIssuer
SubsidiaryGuarantor
Non-GuarantorSubsidiaries
ConsolidatingAdjustments Consolidated
Assets:Investments:
Fixed maturities, available-for-sale, at fair value . . . . . $ — $ — $ 69,925.6 $ (15.3) $ 69,910.3Fixed maturities, at fair value using the fair value
option . . . . . . . . . . . . . . . . . . . . . . . . . . . . . . . . . . . . — — 3,564.5 — 3,564.5Equity securities, available-for-sale, at fair value . . . . 83.4 — 188.4 — 271.8Short-term investments . . . . . . . . . . . . . . . . . . . . . . . . . — — 1,711.4 — 1,711.4Mortgage loans on real estate, net of valuation
allowance . . . . . . . . . . . . . . . . . . . . . . . . . . . . . . . . . — — 9,794.1 — 9,794.1Policy loans . . . . . . . . . . . . . . . . . . . . . . . . . . . . . . . . . . — — 2,104.0 — 2,104.0Limited partnerships/corporations . . . . . . . . . . . . . . . . — — 363.2 — 363.2Derivatives . . . . . . . . . . . . . . . . . . . . . . . . . . . . . . . . . . 69.0 — 1,923.1 (172.5) 1,819.6Investments in subsidiaries . . . . . . . . . . . . . . . . . . . . . . 17,918.1 13,312.0 — (31,230.1) —Other investments . . . . . . . . . . . . . . . . . . . . . . . . . . . . . — 14.4 95.9 — 110.3Securities pledged . . . . . . . . . . . . . . . . . . . . . . . . . . . . . — — 1,184.6 — 1,184.6
Total investments . . . . . . . . . . . . . . . . . . . . . . . . . . . . . . . . . 18,070.5 13,326.4 90,854.8 (31,417.9) 90,833.8Cash and cash equivalents . . . . . . . . . . . . . . . . . . . . . . . . . . 682.1 1.6 1,847.2 — 2,530.9Short-term investments under securities loan agreements,
including collateral delivered . . . . . . . . . . . . . . . . . . . . . . 30.7 — 816.4 (20.1) 827.0Accrued investment income . . . . . . . . . . . . . . . . . . . . . . . . . — — 891.7 — 891.7Reinsurance recoverable . . . . . . . . . . . . . . . . . . . . . . . . . . . . — — 7,116.9 — 7,116.9Deferred policy acquisition costs, Value of business
acquired . . . . . . . . . . . . . . . . . . . . . . . . . . . . . . . . . . . . . . . — — 4,570.9 — 4,570.9Sales inducements to contract holders . . . . . . . . . . . . . . . . . — — 253.6 — 253.6Deferred income taxes . . . . . . . . . . . . . . . . . . . . . . . . . . . . . 398.2 49.2 852.5 — 1,299.9Goodwill and other intangible assets . . . . . . . . . . . . . . . . . . — — 284.4 — 284.4Loans to subsidiaries and affiliates . . . . . . . . . . . . . . . . . . . . 169.0 — 0.3 (169.3) —Due from subsidiaries and affiliates . . . . . . . . . . . . . . . . . . . 13.0 0.1 6.0 (19.1) —Other assets . . . . . . . . . . . . . . . . . . . . . . . . . . . . . . . . . . . . . . 49.2 — 942.2 (0.8) 990.6Assets related to consolidated investment entities:
Limited partnerships/corporations, at fair value . . . . . . — — 3,727.3 — 3,727.3Cash and cash equivalents . . . . . . . . . . . . . . . . . . . . . . — — 710.4 — 710.4Corporate loans, at fair value using the fair value
option . . . . . . . . . . . . . . . . . . . . . . . . . . . . . . . . . . . . — — 6,793.1 — 6,793.1Other assets . . . . . . . . . . . . . . . . . . . . . . . . . . . . . . . . . . — — 92.4 — 92.4
Assets held in separate accounts . . . . . . . . . . . . . . . . . . . . . . — — 106,007.8 — 106,007.8
Total assets . . . . . . . . . . . . . . . . . . . . . . . . . . . . . . . . . . . . . . $19,412.7 $13,377.3 $225,767.9 $(31,627.2) $226,930.7
336

Voya Financial, Inc.Notes to the Consolidated Financial Statements(Dollar amounts in millions, unless otherwise stated)
Condensed Consolidating Balance Sheet (Continued)December 31, 2014
ParentIssuer
SubsidiaryGuarantor
Non-GuarantorSubsidiaries
ConsolidatingAdjustments Consolidated
Liabilities and Shareholders’ Equity:Future policy benefits . . . . . . . . . . . . . . . . . . . . . . . . . . . . . . $ — $ — $ 15,632.2 $ — $ 15,632.2Contract owner account balances . . . . . . . . . . . . . . . . . . . . . — — 69,319.5 — 69,319.5Payables under securities loan agreement, including
collateral held . . . . . . . . . . . . . . . . . . . . . . . . . . . . . . . . . . — — 1,445.0 — 1,445.0Short-term debt with affiliates . . . . . . . . . . . . . . . . . . . . . . . — 149.7 19.3 (169.0) —Long-term debt . . . . . . . . . . . . . . . . . . . . . . . . . . . . . . . . . . . 2,997.1 515.3 18.6 (15.3) 3,515.7Funds held under reinsurance agreements . . . . . . . . . . . . . . — — 1,159.6 — 1,159.6Derivatives . . . . . . . . . . . . . . . . . . . . . . . . . . . . . . . . . . . . . . 103.5 — 918.3 (172.5) 849.3Pension and other postretirement provisions . . . . . . . . . . . . — — 826.2 — 826.2Current income taxes . . . . . . . . . . . . . . . . . . . . . . . . . . . . . . 84.8 (5.7) 5.7 — 84.8Due to subsidiaries and affiliates . . . . . . . . . . . . . . . . . . . . . 4.8 1.2 (1.9) (4.1) —Other liabilities . . . . . . . . . . . . . . . . . . . . . . . . . . . . . . . . . . . 76.3 14.9 1,278.3 (36.3) 1,333.2Liabilities related to consolidated investment entities:
Collateralized loan obligations notes, at fair valueusing the fair value option . . . . . . . . . . . . . . . . . . . . — — 6,838.1 — 6,838.1
Other liabilities . . . . . . . . . . . . . . . . . . . . . . . . . . . . . . . — — 1,357.8 — 1,357.8Liabilities related to separate accounts . . . . . . . . . . . . . . . . . — — 106,007.8 — 106,007.8
Total liabilities . . . . . . . . . . . . . . . . . . . . . . . . . . . . . . . . . . . 3,266.5 675.4 204,824.5 (397.2) 208,369.2
Shareholders’ equity:Total Voya Financial, Inc. shareholders’ equity . . . . . . 16,146.2 12,701.9 18,528.1 (31,230.0) 16,146.2Noncontrolling interest . . . . . . . . . . . . . . . . . . . . . . . . . — — 2,415.3 — 2,415.3
Total shareholder’s equity . . . . . . . . . . . . . . . . . . . . . . 16,146.2 12,701.9 20,943.4 (31,230.0) 18,561.5
Total liabilities and shareholders’ equity . . . . . . . . . . . . . . . $19,412.7 $13,377.3 $225,767.9 $(31,627.2) $226,930.7
337
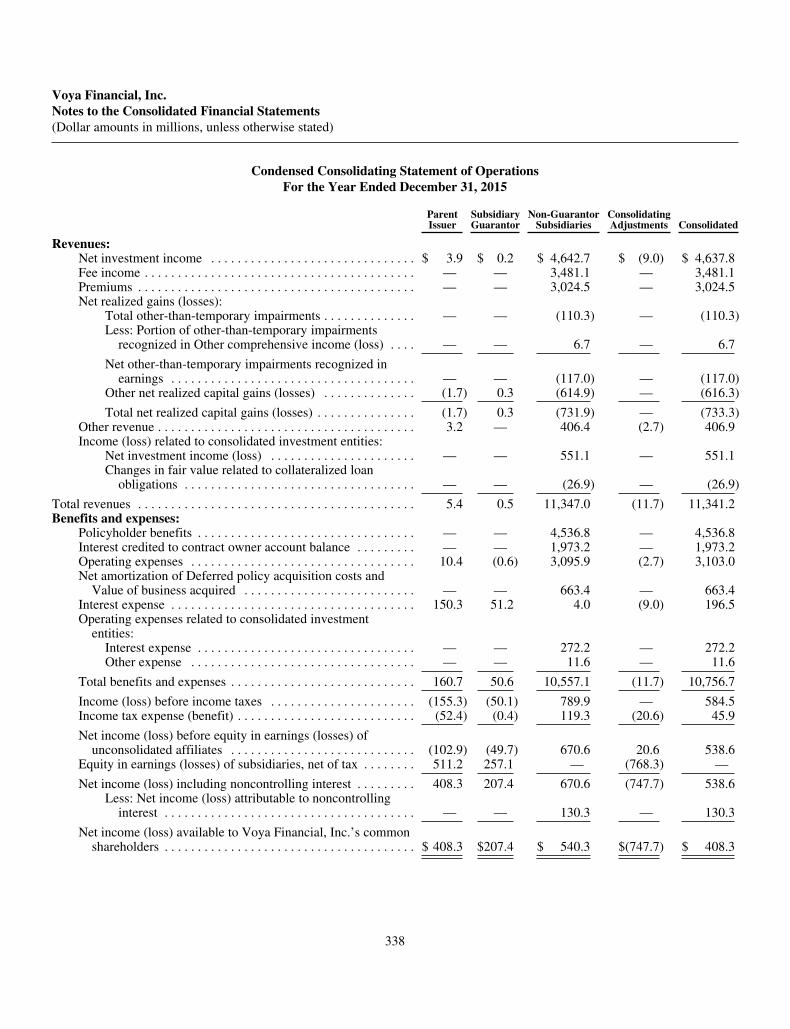
Voya Financial, Inc.Notes to the Consolidated Financial Statements(Dollar amounts in millions, unless otherwise stated)
Condensed Consolidating Statement of OperationsFor the Year Ended December 31, 2015
ParentIssuer
SubsidiaryGuarantor
Non-GuarantorSubsidiaries
ConsolidatingAdjustments Consolidated
Revenues:Net investment income . . . . . . . . . . . . . . . . . . . . . . . . . . . . . . . $ 3.9 $ 0.2 $ 4,642.7 $ (9.0) $ 4,637.8Fee income . . . . . . . . . . . . . . . . . . . . . . . . . . . . . . . . . . . . . . . . . — — 3,481.1 — 3,481.1Premiums . . . . . . . . . . . . . . . . . . . . . . . . . . . . . . . . . . . . . . . . . . — — 3,024.5 — 3,024.5Net realized gains (losses):
Total other-than-temporary impairments . . . . . . . . . . . . . . — — (110.3) — (110.3)Less: Portion of other-than-temporary impairments
recognized in Other comprehensive income (loss) . . . . — — 6.7 — 6.7
Net other-than-temporary impairments recognized inearnings . . . . . . . . . . . . . . . . . . . . . . . . . . . . . . . . . . . . . — — (117.0) — (117.0)
Other net realized capital gains (losses) . . . . . . . . . . . . . . (1.7) 0.3 (614.9) — (616.3)
Total net realized capital gains (losses) . . . . . . . . . . . . . . . (1.7) 0.3 (731.9) — (733.3)Other revenue . . . . . . . . . . . . . . . . . . . . . . . . . . . . . . . . . . . . . . . 3.2 — 406.4 (2.7) 406.9Income (loss) related to consolidated investment entities:
Net investment income (loss) . . . . . . . . . . . . . . . . . . . . . . — — 551.1 — 551.1Changes in fair value related to collateralized loan
obligations . . . . . . . . . . . . . . . . . . . . . . . . . . . . . . . . . . . — — (26.9) — (26.9)
Total revenues . . . . . . . . . . . . . . . . . . . . . . . . . . . . . . . . . . . . . . . . . . 5.4 0.5 11,347.0 (11.7) 11,341.2Benefits and expenses:
Policyholder benefits . . . . . . . . . . . . . . . . . . . . . . . . . . . . . . . . . — — 4,536.8 — 4,536.8Interest credited to contract owner account balance . . . . . . . . . — — 1,973.2 — 1,973.2Operating expenses . . . . . . . . . . . . . . . . . . . . . . . . . . . . . . . . . . 10.4 (0.6) 3,095.9 (2.7) 3,103.0Net amortization of Deferred policy acquisition costs and
Value of business acquired . . . . . . . . . . . . . . . . . . . . . . . . . . — — 663.4 — 663.4Interest expense . . . . . . . . . . . . . . . . . . . . . . . . . . . . . . . . . . . . . 150.3 51.2 4.0 (9.0) 196.5Operating expenses related to consolidated investment
entities:Interest expense . . . . . . . . . . . . . . . . . . . . . . . . . . . . . . . . . — — 272.2 — 272.2Other expense . . . . . . . . . . . . . . . . . . . . . . . . . . . . . . . . . . — — 11.6 — 11.6
Total benefits and expenses . . . . . . . . . . . . . . . . . . . . . . . . . . . . 160.7 50.6 10,557.1 (11.7) 10,756.7
Income (loss) before income taxes . . . . . . . . . . . . . . . . . . . . . . (155.3) (50.1) 789.9 — 584.5Income tax expense (benefit) . . . . . . . . . . . . . . . . . . . . . . . . . . . (52.4) (0.4) 119.3 (20.6) 45.9
Net income (loss) before equity in earnings (losses) ofunconsolidated affiliates . . . . . . . . . . . . . . . . . . . . . . . . . . . . (102.9) (49.7) 670.6 20.6 538.6
Equity in earnings (losses) of subsidiaries, net of tax . . . . . . . . 511.2 257.1 — (768.3) —
Net income (loss) including noncontrolling interest . . . . . . . . . 408.3 207.4 670.6 (747.7) 538.6Less: Net income (loss) attributable to noncontrolling
interest . . . . . . . . . . . . . . . . . . . . . . . . . . . . . . . . . . . . . . — — 130.3 — 130.3
Net income (loss) available to Voya Financial, Inc.’s commonshareholders . . . . . . . . . . . . . . . . . . . . . . . . . . . . . . . . . . . . . . $ 408.3 $207.4 $ 540.3 $(747.7) $ 408.3
338
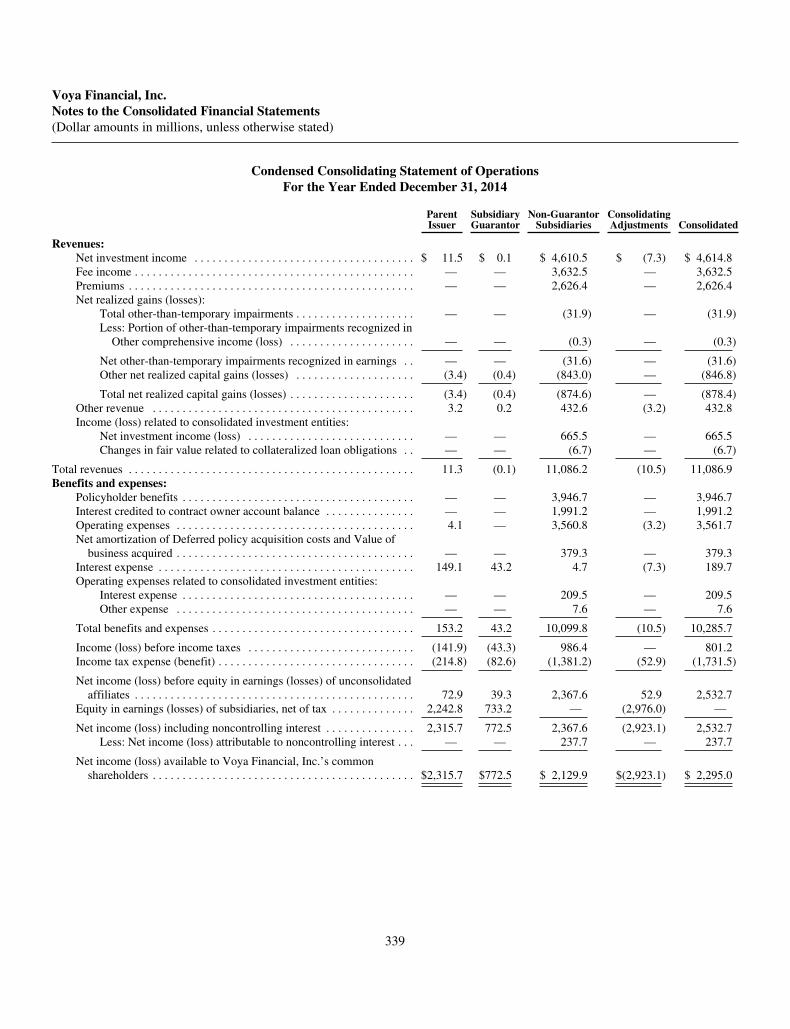
Voya Financial, Inc.Notes to the Consolidated Financial Statements(Dollar amounts in millions, unless otherwise stated)
Condensed Consolidating Statement of OperationsFor the Year Ended December 31, 2014
ParentIssuer
SubsidiaryGuarantor
Non-GuarantorSubsidiaries
ConsolidatingAdjustments Consolidated
Revenues:Net investment income . . . . . . . . . . . . . . . . . . . . . . . . . . . . . . . . . . . . . $ 11.5 $ 0.1 $ 4,610.5 $ (7.3) $ 4,614.8Fee income . . . . . . . . . . . . . . . . . . . . . . . . . . . . . . . . . . . . . . . . . . . . . . . — — 3,632.5 — 3,632.5Premiums . . . . . . . . . . . . . . . . . . . . . . . . . . . . . . . . . . . . . . . . . . . . . . . . — — 2,626.4 — 2,626.4Net realized gains (losses):
Total other-than-temporary impairments . . . . . . . . . . . . . . . . . . . . — — (31.9) — (31.9)Less: Portion of other-than-temporary impairments recognized in
Other comprehensive income (loss) . . . . . . . . . . . . . . . . . . . . . — — (0.3) — (0.3)
Net other-than-temporary impairments recognized in earnings . . — — (31.6) — (31.6)Other net realized capital gains (losses) . . . . . . . . . . . . . . . . . . . . (3.4) (0.4) (843.0) — (846.8)
Total net realized capital gains (losses) . . . . . . . . . . . . . . . . . . . . . (3.4) (0.4) (874.6) — (878.4)Other revenue . . . . . . . . . . . . . . . . . . . . . . . . . . . . . . . . . . . . . . . . . . . . 3.2 0.2 432.6 (3.2) 432.8Income (loss) related to consolidated investment entities:
Net investment income (loss) . . . . . . . . . . . . . . . . . . . . . . . . . . . . — — 665.5 — 665.5Changes in fair value related to collateralized loan obligations . . — — (6.7) — (6.7)
Total revenues . . . . . . . . . . . . . . . . . . . . . . . . . . . . . . . . . . . . . . . . . . . . . . . . 11.3 (0.1) 11,086.2 (10.5) 11,086.9Benefits and expenses:
Policyholder benefits . . . . . . . . . . . . . . . . . . . . . . . . . . . . . . . . . . . . . . . — — 3,946.7 — 3,946.7Interest credited to contract owner account balance . . . . . . . . . . . . . . . — — 1,991.2 — 1,991.2Operating expenses . . . . . . . . . . . . . . . . . . . . . . . . . . . . . . . . . . . . . . . . 4.1 — 3,560.8 (3.2) 3,561.7Net amortization of Deferred policy acquisition costs and Value of
business acquired . . . . . . . . . . . . . . . . . . . . . . . . . . . . . . . . . . . . . . . . — — 379.3 — 379.3Interest expense . . . . . . . . . . . . . . . . . . . . . . . . . . . . . . . . . . . . . . . . . . . 149.1 43.2 4.7 (7.3) 189.7Operating expenses related to consolidated investment entities:
Interest expense . . . . . . . . . . . . . . . . . . . . . . . . . . . . . . . . . . . . . . . — — 209.5 — 209.5Other expense . . . . . . . . . . . . . . . . . . . . . . . . . . . . . . . . . . . . . . . . — — 7.6 — 7.6
Total benefits and expenses . . . . . . . . . . . . . . . . . . . . . . . . . . . . . . . . . . 153.2 43.2 10,099.8 (10.5) 10,285.7
Income (loss) before income taxes . . . . . . . . . . . . . . . . . . . . . . . . . . . . (141.9) (43.3) 986.4 — 801.2Income tax expense (benefit) . . . . . . . . . . . . . . . . . . . . . . . . . . . . . . . . . (214.8) (82.6) (1,381.2) (52.9) (1,731.5)
Net income (loss) before equity in earnings (losses) of unconsolidatedaffiliates . . . . . . . . . . . . . . . . . . . . . . . . . . . . . . . . . . . . . . . . . . . . . . . 72.9 39.3 2,367.6 52.9 2,532.7
Equity in earnings (losses) of subsidiaries, net of tax . . . . . . . . . . . . . . 2,242.8 733.2 — (2,976.0) —
Net income (loss) including noncontrolling interest . . . . . . . . . . . . . . . 2,315.7 772.5 2,367.6 (2,923.1) 2,532.7Less: Net income (loss) attributable to noncontrolling interest . . . — — 237.7 — 237.7
Net income (loss) available to Voya Financial, Inc.’s commonshareholders . . . . . . . . . . . . . . . . . . . . . . . . . . . . . . . . . . . . . . . . . . . . $2,315.7 $772.5 $ 2,129.9 $(2,923.1) $ 2,295.0
339
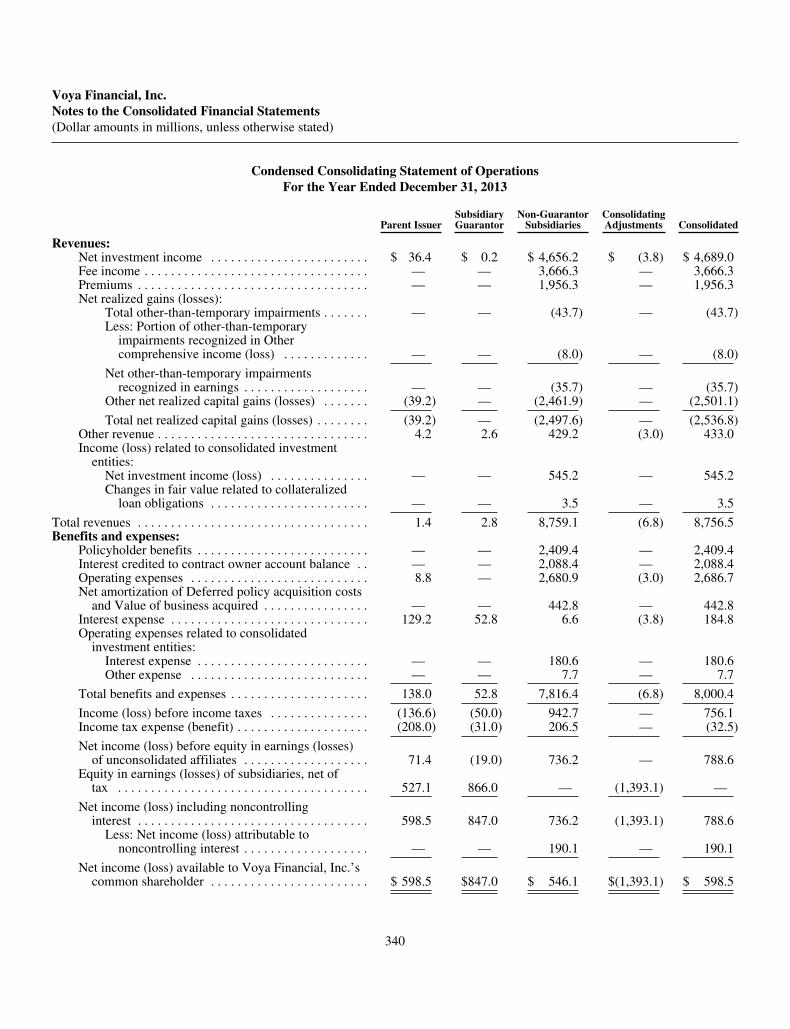
Voya Financial, Inc.Notes to the Consolidated Financial Statements(Dollar amounts in millions, unless otherwise stated)
Condensed Consolidating Statement of OperationsFor the Year Ended December 31, 2013
Parent IssuerSubsidiaryGuarantor
Non-GuarantorSubsidiaries
ConsolidatingAdjustments Consolidated
Revenues:Net investment income . . . . . . . . . . . . . . . . . . . . . . . . $ 36.4 $ 0.2 $ 4,656.2 $ (3.8) $ 4,689.0Fee income . . . . . . . . . . . . . . . . . . . . . . . . . . . . . . . . . . — — 3,666.3 — 3,666.3Premiums . . . . . . . . . . . . . . . . . . . . . . . . . . . . . . . . . . . — — 1,956.3 — 1,956.3Net realized gains (losses):
Total other-than-temporary impairments . . . . . . . — — (43.7) — (43.7)Less: Portion of other-than-temporary
impairments recognized in Othercomprehensive income (loss) . . . . . . . . . . . . . — — (8.0) — (8.0)
Net other-than-temporary impairmentsrecognized in earnings . . . . . . . . . . . . . . . . . . . — — (35.7) — (35.7)
Other net realized capital gains (losses) . . . . . . . (39.2) — (2,461.9) — (2,501.1)
Total net realized capital gains (losses) . . . . . . . . (39.2) — (2,497.6) — (2,536.8)Other revenue . . . . . . . . . . . . . . . . . . . . . . . . . . . . . . . . 4.2 2.6 429.2 (3.0) 433.0Income (loss) related to consolidated investment
entities:Net investment income (loss) . . . . . . . . . . . . . . . — — 545.2 — 545.2Changes in fair value related to collateralized
loan obligations . . . . . . . . . . . . . . . . . . . . . . . . — — 3.5 — 3.5
Total revenues . . . . . . . . . . . . . . . . . . . . . . . . . . . . . . . . . . . 1.4 2.8 8,759.1 (6.8) 8,756.5Benefits and expenses:
Policyholder benefits . . . . . . . . . . . . . . . . . . . . . . . . . . — — 2,409.4 — 2,409.4Interest credited to contract owner account balance . . — — 2,088.4 — 2,088.4Operating expenses . . . . . . . . . . . . . . . . . . . . . . . . . . . 8.8 — 2,680.9 (3.0) 2,686.7Net amortization of Deferred policy acquisition costs
and Value of business acquired . . . . . . . . . . . . . . . . — — 442.8 — 442.8Interest expense . . . . . . . . . . . . . . . . . . . . . . . . . . . . . . 129.2 52.8 6.6 (3.8) 184.8Operating expenses related to consolidated
investment entities:Interest expense . . . . . . . . . . . . . . . . . . . . . . . . . . — — 180.6 — 180.6Other expense . . . . . . . . . . . . . . . . . . . . . . . . . . . — — 7.7 — 7.7
Total benefits and expenses . . . . . . . . . . . . . . . . . . . . . 138.0 52.8 7,816.4 (6.8) 8,000.4
Income (loss) before income taxes . . . . . . . . . . . . . . . (136.6) (50.0) 942.7 — 756.1Income tax expense (benefit) . . . . . . . . . . . . . . . . . . . . (208.0) (31.0) 206.5 — (32.5)
Net income (loss) before equity in earnings (losses)of unconsolidated affiliates . . . . . . . . . . . . . . . . . . . 71.4 (19.0) 736.2 — 788.6
Equity in earnings (losses) of subsidiaries, net oftax . . . . . . . . . . . . . . . . . . . . . . . . . . . . . . . . . . . . . . 527.1 866.0 — (1,393.1) —
Net income (loss) including noncontrollinginterest . . . . . . . . . . . . . . . . . . . . . . . . . . . . . . . . . . . 598.5 847.0 736.2 (1,393.1) 788.6
Less: Net income (loss) attributable tononcontrolling interest . . . . . . . . . . . . . . . . . . . — — 190.1 — 190.1
Net income (loss) available to Voya Financial, Inc.’scommon shareholder . . . . . . . . . . . . . . . . . . . . . . . . $ 598.5 $847.0 $ 546.1 $(1,393.1) $ 598.5
340

Voya Financial, Inc.Notes to the Consolidated Financial Statements(Dollar amounts in millions, unless otherwise stated)
Condensed Consolidated Statements of Comprehensive IncomeFor the Year Ended December 31, 2015
Parent IssuerSubsidiaryGuarantor
Non-GuarantorSubsidiaries
ConsolidatingAdjustments Consolidated
Net income (loss) including noncontrolling interest . . . . . . $ 408.3 $ 207.4 $ 670.6 $ (747.7) $ 538.6Other comprehensive income (loss), before tax:
Unrealized gains/losses on securities . . . . . . . . . . . . . (2,581.2) (1,874.5) (2,581.3) 4,455.8 (2,581.2)Other-than-temporary impairments . . . . . . . . . . . . . . . 18.8 12.9 18.8 (31.7) 18.8Pension and other postretirement benefit liability . . . (13.7) (3.2) (13.7) 16.9 (13.7)
Other comprehensive income (loss), before tax . . . . . . . . . (2,576.1) (1,864.8) (2,576.2) 4,441.0 (2,576.1)Income tax expense (benefit) related to items of other
comprehensive income (loss) . . . . . . . . . . . . . . . . . (897.3) (648.3) (897.4) 1,545.7 (897.3)
Other comprehensive income (loss), after tax . . . . . . . . . . (1,678.8) (1,216.5) (1,678.8) 2,895.3 (1,678.8)
Comprehensive income (loss) . . . . . . . . . . . . . . . . . . . . . . . (1,270.5) (1,009.1) (1,008.2) 2,147.6 (1,140.2)Less: Comprehensive income (loss) attributable to
noncontrolling interest . . . . . . . . . . . . . . . . . . . . . . — — 130.3 — 130.3
Comprehensive income (loss) attributable to VoyaFinancial, Inc.’s common shareholders . . . . . . . . . . . . . . $(1,270.5) $(1,009.1) $(1,138.5) $2,147.6 $(1,270.5)
341
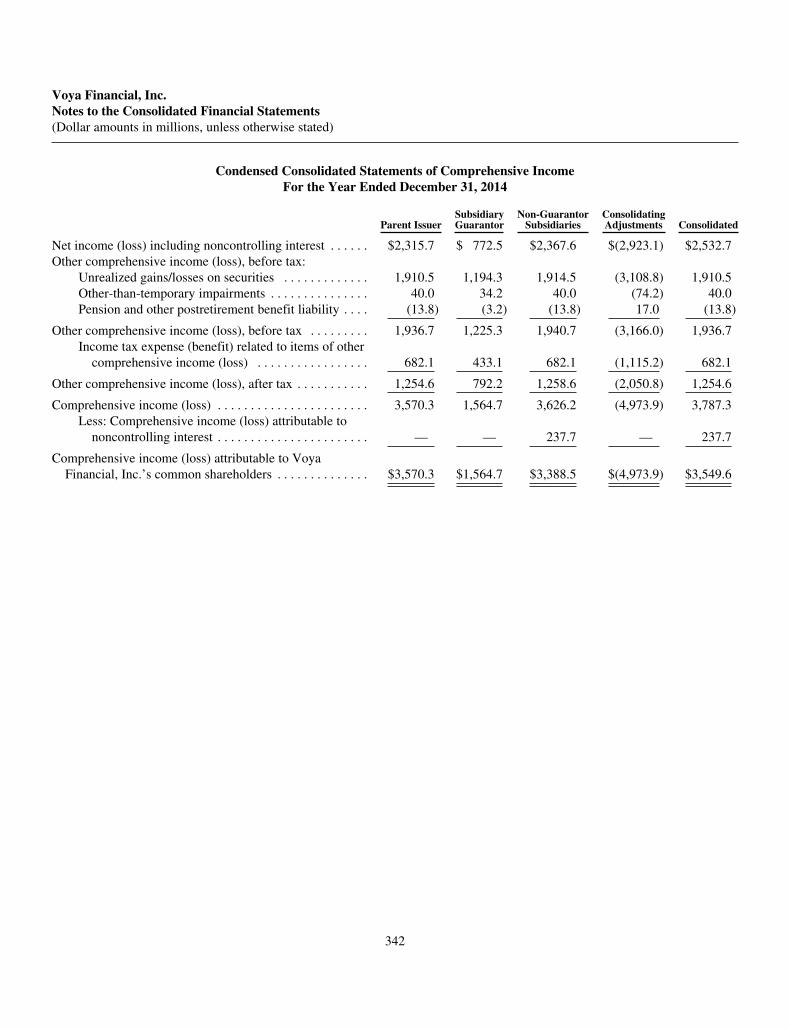
Voya Financial, Inc.Notes to the Consolidated Financial Statements(Dollar amounts in millions, unless otherwise stated)
Condensed Consolidated Statements of Comprehensive IncomeFor the Year Ended December 31, 2014
Parent IssuerSubsidiaryGuarantor
Non-GuarantorSubsidiaries
ConsolidatingAdjustments Consolidated
Net income (loss) including noncontrolling interest . . . . . . $2,315.7 $ 772.5 $2,367.6 $(2,923.1) $2,532.7Other comprehensive income (loss), before tax:
Unrealized gains/losses on securities . . . . . . . . . . . . . 1,910.5 1,194.3 1,914.5 (3,108.8) 1,910.5Other-than-temporary impairments . . . . . . . . . . . . . . . 40.0 34.2 40.0 (74.2) 40.0Pension and other postretirement benefit liability . . . . (13.8) (3.2) (13.8) 17.0 (13.8)
Other comprehensive income (loss), before tax . . . . . . . . . 1,936.7 1,225.3 1,940.7 (3,166.0) 1,936.7Income tax expense (benefit) related to items of other
comprehensive income (loss) . . . . . . . . . . . . . . . . . 682.1 433.1 682.1 (1,115.2) 682.1
Other comprehensive income (loss), after tax . . . . . . . . . . . 1,254.6 792.2 1,258.6 (2,050.8) 1,254.6
Comprehensive income (loss) . . . . . . . . . . . . . . . . . . . . . . . 3,570.3 1,564.7 3,626.2 (4,973.9) 3,787.3Less: Comprehensive income (loss) attributable to
noncontrolling interest . . . . . . . . . . . . . . . . . . . . . . . — — 237.7 — 237.7
Comprehensive income (loss) attributable to VoyaFinancial, Inc.’s common shareholders . . . . . . . . . . . . . . $3,570.3 $1,564.7 $3,388.5 $(4,973.9) $3,549.6
342
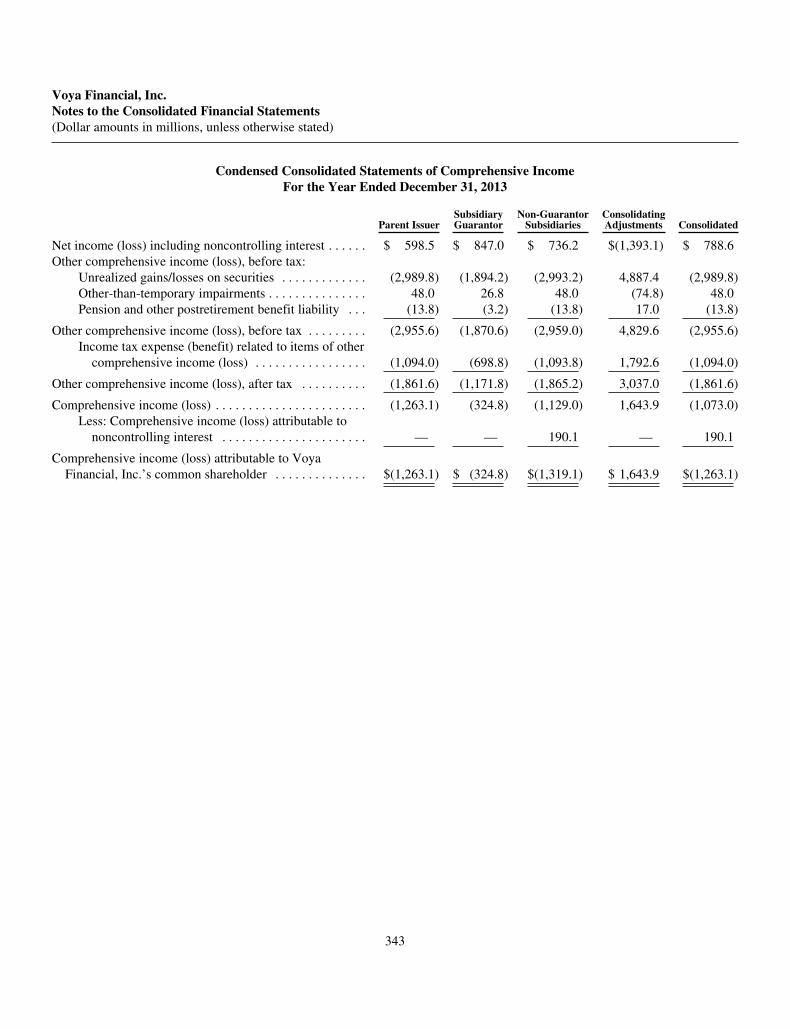
Voya Financial, Inc.Notes to the Consolidated Financial Statements(Dollar amounts in millions, unless otherwise stated)
Condensed Consolidated Statements of Comprehensive IncomeFor the Year Ended December 31, 2013
Parent IssuerSubsidiaryGuarantor
Non-GuarantorSubsidiaries
ConsolidatingAdjustments Consolidated
Net income (loss) including noncontrolling interest . . . . . . $ 598.5 $ 847.0 $ 736.2 $(1,393.1) $ 788.6Other comprehensive income (loss), before tax:
Unrealized gains/losses on securities . . . . . . . . . . . . . (2,989.8) (1,894.2) (2,993.2) 4,887.4 (2,989.8)Other-than-temporary impairments . . . . . . . . . . . . . . . 48.0 26.8 48.0 (74.8) 48.0Pension and other postretirement benefit liability . . . (13.8) (3.2) (13.8) 17.0 (13.8)
Other comprehensive income (loss), before tax . . . . . . . . . (2,955.6) (1,870.6) (2,959.0) 4,829.6 (2,955.6)Income tax expense (benefit) related to items of other
comprehensive income (loss) . . . . . . . . . . . . . . . . . (1,094.0) (698.8) (1,093.8) 1,792.6 (1,094.0)
Other comprehensive income (loss), after tax . . . . . . . . . . (1,861.6) (1,171.8) (1,865.2) 3,037.0 (1,861.6)
Comprehensive income (loss) . . . . . . . . . . . . . . . . . . . . . . . (1,263.1) (324.8) (1,129.0) 1,643.9 (1,073.0)Less: Comprehensive income (loss) attributable to
noncontrolling interest . . . . . . . . . . . . . . . . . . . . . . — — 190.1 — 190.1
Comprehensive income (loss) attributable to VoyaFinancial, Inc.’s common shareholder . . . . . . . . . . . . . . $(1,263.1) $ (324.8) $(1,319.1) $ 1,643.9 $(1,263.1)
343

Voya Financial, Inc.Notes to the Consolidated Financial Statements(Dollar amounts in millions, unless otherwise stated)
Condensed Consolidating Statement of Cash FlowsFor the Year Ended December 31, 2015
Parent IssuerSubsidiaryGuarantor
Non-GuarantorSubsidiaries
ConsolidatingAdjustments Consolidated
Net cash provided by (used in) operating activities . . . . $ 127.8 $ 261.7 $ 3,373.0 $ (516.8) $ 3,245.7
Cash Flows from Investing Activities:Proceeds from the sale, maturity, disposal or
redemption of:Fixed maturities . . . . . . . . . . . . . . . . . . . . . . . . . . — — 12,070.7 — 12,070.7Equity securities, available-for-sale . . . . . . . . . . 24.1 — 51.4 — 75.5Mortgage loans on real estate . . . . . . . . . . . . . . . — — 1,543.3 — 1,543.3Limited partnerships/corporations . . . . . . . . . . . — — 288.7 — 288.7
Acquisition of:Fixed maturities . . . . . . . . . . . . . . . . . . . . . . . . . . — — (13,573.1) — (13,573.1)Equity securities, available-for-sale . . . . . . . . . . (30.5) — (111.5) — (142.0)Mortgage loans on real estate . . . . . . . . . . . . . . . — — (2,195.9) — (2,195.9)Limited partnerships/corporations . . . . . . . . . . . — — (470.6) — (470.6)
Short-term investments, net . . . . . . . . . . . . . . . . . . . . (212.0) — 428.3 — 216.3Policy loans, net . . . . . . . . . . . . . . . . . . . . . . . . . . . . . — — 101.3 — 101.3Derivatives, net . . . . . . . . . . . . . . . . . . . . . . . . . . . . . . (32.9) — (232.8) — (265.7)Other investments, net . . . . . . . . . . . . . . . . . . . . . . . . . — 14.2 5.3 — 19.5Sales from consolidated investments entities . . . . . . . — — 5,431.5 — 5,431.5Purchases of consolidated investment entities . . . . . . — — (7,521.0) — (7,521.0)Maturity of intercompany loans with maturities more
than three months . . . . . . . . . . . . . . . . . . . . . . . . . . 0.7 — — (0.7) —Net maturity of short-term intercompany loans to
subsidiaries . . . . . . . . . . . . . . . . . . . . . . . . . . . . . . . (161.9) — — 161.9 —Return of capital contributions and dividends from
subsidiaries . . . . . . . . . . . . . . . . . . . . . . . . . . . . . . . 1,467.5 1,197.7 — (2,665.2) —Capital contributions to subsidiaries . . . . . . . . . . . . . . — (15.0) — 15.0 —Collateral received (delivered), net . . . . . . . . . . . . . . . 20.1 — 187.6 — 207.7Purchases of fixed assets, net . . . . . . . . . . . . . . . . . . . — — (60.1) — (60.1)
Net cash provided by (used in) investing activities . . . . . . $ 1,075.1 $ 1,196.9 $ (4,056.9) $(2,489.0) $ (4,273.9)
344
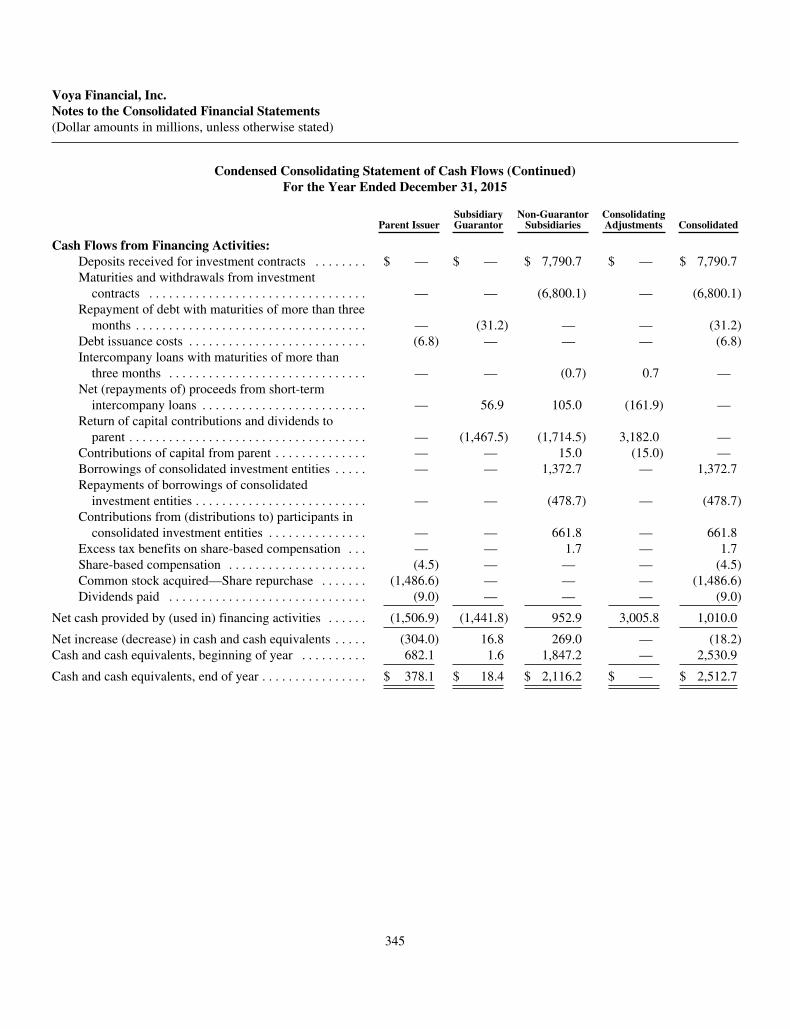
Voya Financial, Inc.Notes to the Consolidated Financial Statements(Dollar amounts in millions, unless otherwise stated)
Condensed Consolidating Statement of Cash Flows (Continued)For the Year Ended December 31, 2015
Parent IssuerSubsidiaryGuarantor
Non-GuarantorSubsidiaries
ConsolidatingAdjustments Consolidated
Cash Flows from Financing Activities:Deposits received for investment contracts . . . . . . . . $ — $ — $ 7,790.7 $ — $ 7,790.7Maturities and withdrawals from investment
contracts . . . . . . . . . . . . . . . . . . . . . . . . . . . . . . . . . — — (6,800.1) — (6,800.1)Repayment of debt with maturities of more than three
months . . . . . . . . . . . . . . . . . . . . . . . . . . . . . . . . . . . — (31.2) — — (31.2)Debt issuance costs . . . . . . . . . . . . . . . . . . . . . . . . . . . (6.8) — — — (6.8)Intercompany loans with maturities of more than
three months . . . . . . . . . . . . . . . . . . . . . . . . . . . . . . — — (0.7) 0.7 —Net (repayments of) proceeds from short-term
intercompany loans . . . . . . . . . . . . . . . . . . . . . . . . . — 56.9 105.0 (161.9) —Return of capital contributions and dividends to
parent . . . . . . . . . . . . . . . . . . . . . . . . . . . . . . . . . . . . — (1,467.5) (1,714.5) 3,182.0 —Contributions of capital from parent . . . . . . . . . . . . . . — — 15.0 (15.0) —Borrowings of consolidated investment entities . . . . . — — 1,372.7 — 1,372.7Repayments of borrowings of consolidated
investment entities . . . . . . . . . . . . . . . . . . . . . . . . . . — — (478.7) — (478.7)Contributions from (distributions to) participants in
consolidated investment entities . . . . . . . . . . . . . . . — — 661.8 — 661.8Excess tax benefits on share-based compensation . . . — — 1.7 — 1.7Share-based compensation . . . . . . . . . . . . . . . . . . . . . (4.5) — — — (4.5)Common stock acquired—Share repurchase . . . . . . . (1,486.6) — — — (1,486.6)Dividends paid . . . . . . . . . . . . . . . . . . . . . . . . . . . . . . (9.0) — — — (9.0)
Net cash provided by (used in) financing activities . . . . . . (1,506.9) (1,441.8) 952.9 3,005.8 1,010.0
Net increase (decrease) in cash and cash equivalents . . . . . (304.0) 16.8 269.0 — (18.2)Cash and cash equivalents, beginning of year . . . . . . . . . . 682.1 1.6 1,847.2 — 2,530.9
Cash and cash equivalents, end of year . . . . . . . . . . . . . . . . $ 378.1 $ 18.4 $ 2,116.2 $ — $ 2,512.7
345

Voya Financial, Inc.Notes to the Consolidated Financial Statements(Dollar amounts in millions, unless otherwise stated)
Condensed Consolidating Statement of Cash FlowsFor the Year Ended December 31, 2014
Parent IssuerSubsidiaryGuarantor
Non-GuarantorSubsidiaries
ConsolidatingAdjustments Consolidated
Net cash provided by (used in) operating activities $ 85.7 $ 160.1 $ 3,565.8 $ (183.0) $ 3,628.6
Cash Flows from Investing Activities:Proceeds from the sale, maturity, disposal or
redemption of:Fixed maturities . . . . . . . . . . . . . . . . . . . . . . . . . . — — 13,594.0 — 13,594.0Equity securities, available-for-sale . . . . . . . . . . 18.7 13.1 38.2 — 70.0Mortgage loans on real estate . . . . . . . . . . . . . . . — — 1,555.3 — 1,555.3Limited partnerships/corporations . . . . . . . . . . . . — — 204.3 — 204.3
Acquisition of:Fixed maturities . . . . . . . . . . . . . . . . . . . . . . . . . . — — (12,985.3) — (12,985.3)Equity securities, available-for-sale . . . . . . . . . . (25.0) — (3.4) — (28.4)Mortgage loans on real estate . . . . . . . . . . . . . . . — — (2,036.4) — (2,036.4)Limited partnerships/corporations . . . . . . . . . . . . — — (289.0) — (289.0)
Short-term investments, net . . . . . . . . . . . . . . . . . . . . . — — (662.0) — (662.0)Policy loans, net . . . . . . . . . . . . . . . . . . . . . . . . . . . . . . — — 43.0 — 43.0Derivatives, net . . . . . . . . . . . . . . . . . . . . . . . . . . . . . . 1.3 — (1,118.7) — (1,117.4)Other investments, net . . . . . . . . . . . . . . . . . . . . . . . . . — (11.0) 44.0 — 33.0Sales from consolidated investments entities . . . . . . . — — 3,470.1 — 3,470.1Purchases of consolidated investment entities . . . . . . . — — (5,533.9) — (5,533.9)Maturity of Intercompany loans with maturities more
than three months . . . . . . . . . . . . . . . . . . . . . . . . . . . 0.9 — — (0.9) —Net maturity of short-term intercompany loans . . . . . 41.5 — — (41.5) —Return of capital contributions and dividends from
subsidiaries . . . . . . . . . . . . . . . . . . . . . . . . . . . . . . . 902.0 780.0 — (1,682.0) —Capital contributions to subsidiaries . . . . . . . . . . . . . . (150.0) (171.0) — 321.0 —Collateral received (delivered), net . . . . . . . . . . . . . . . — — 401.5 — 401.5Purchases of fixed assets, net . . . . . . . . . . . . . . . . . . . — — (32.7) — (32.7)
Net cash provided by (used in) investing activities . . . . . . . $ 789.4 $ 611.1 $ (3,311.0) $(1,403.4) $ (3,313.9)
346
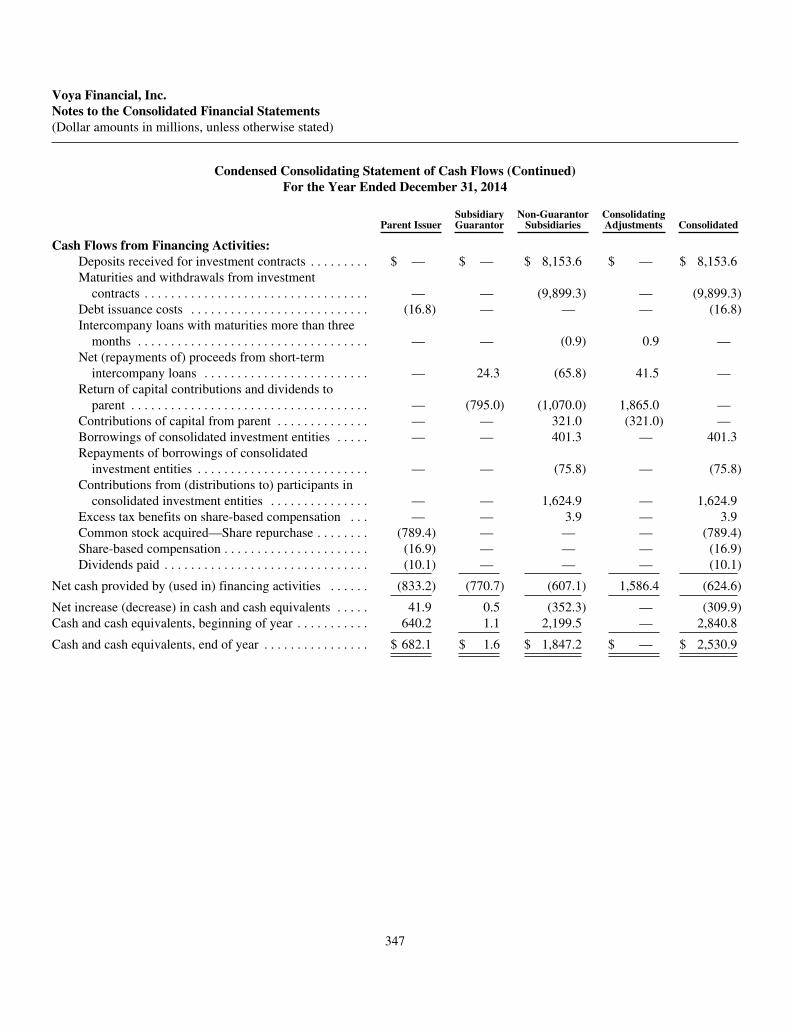
Voya Financial, Inc.Notes to the Consolidated Financial Statements(Dollar amounts in millions, unless otherwise stated)
Condensed Consolidating Statement of Cash Flows (Continued)For the Year Ended December 31, 2014
Parent IssuerSubsidiaryGuarantor
Non-GuarantorSubsidiaries
ConsolidatingAdjustments Consolidated
Cash Flows from Financing Activities:Deposits received for investment contracts . . . . . . . . . $ — $ — $ 8,153.6 $ — $ 8,153.6Maturities and withdrawals from investment
contracts . . . . . . . . . . . . . . . . . . . . . . . . . . . . . . . . . . — — (9,899.3) — (9,899.3)Debt issuance costs . . . . . . . . . . . . . . . . . . . . . . . . . . . (16.8) — — — (16.8)Intercompany loans with maturities more than three
months . . . . . . . . . . . . . . . . . . . . . . . . . . . . . . . . . . . — — (0.9) 0.9 —Net (repayments of) proceeds from short-term
intercompany loans . . . . . . . . . . . . . . . . . . . . . . . . . — 24.3 (65.8) 41.5 —Return of capital contributions and dividends to
parent . . . . . . . . . . . . . . . . . . . . . . . . . . . . . . . . . . . . — (795.0) (1,070.0) 1,865.0 —Contributions of capital from parent . . . . . . . . . . . . . . — — 321.0 (321.0) —Borrowings of consolidated investment entities . . . . . — — 401.3 — 401.3Repayments of borrowings of consolidated
investment entities . . . . . . . . . . . . . . . . . . . . . . . . . . — — (75.8) — (75.8)Contributions from (distributions to) participants in
consolidated investment entities . . . . . . . . . . . . . . . — — 1,624.9 — 1,624.9Excess tax benefits on share-based compensation . . . — — 3.9 — 3.9Common stock acquired—Share repurchase . . . . . . . . (789.4) — — — (789.4)Share-based compensation . . . . . . . . . . . . . . . . . . . . . . (16.9) — — — (16.9)Dividends paid . . . . . . . . . . . . . . . . . . . . . . . . . . . . . . . (10.1) — — — (10.1)
Net cash provided by (used in) financing activities . . . . . . (833.2) (770.7) (607.1) 1,586.4 (624.6)
Net increase (decrease) in cash and cash equivalents . . . . . 41.9 0.5 (352.3) — (309.9)Cash and cash equivalents, beginning of year . . . . . . . . . . . 640.2 1.1 2,199.5 — 2,840.8
Cash and cash equivalents, end of year . . . . . . . . . . . . . . . . $ 682.1 $ 1.6 $ 1,847.2 $ — $ 2,530.9
347

Voya Financial, Inc.Notes to the Consolidated Financial Statements(Dollar amounts in millions, unless otherwise stated)
Condensed Consolidating Statement of Cash FlowsFor the Year Ended December 31, 2013
Parent IssuerSubsidiaryGuarantor
Non-GuarantorSubsidiaries
ConsolidatingAdjustments Consolidated
Net cash provided by (used in) operating activities . . . . . $ 203.4 $ 83.3 $ 3,076.7 $ (100.0) $ 3,263.4
Cash Flows from Investing Activities:Proceeds from the sale, maturity, disposal or
redemption of:Fixed maturities . . . . . . . . . . . . . . . . . . . . . . . . . . . — — 16,681.3 — 16,681.3Equity securities, available-for-sale . . . . . . . . . . . 14.5 14.0 23.1 — 51.6Mortgage loans on real estate . . . . . . . . . . . . . . . . — — 1,580.0 — 1,580.0Limited partnerships/corporations . . . . . . . . . . . . — — 466.1 — 466.1
Acquisition of:Fixed maturities . . . . . . . . . . . . . . . . . . . . . . . . . . . — — (19,014.8) — (19,014.8)Equity securities, available-for-sale . . . . . . . . . . . (19.6) (11.1) (16.9) — (47.6)Mortgage loans on real estate . . . . . . . . . . . . . . . . — 0.4 (2,206.4) — (2,206.0)Limited partnerships/corporations . . . . . . . . . . . . — — (97.0) — (97.0)
Short-term investments, net . . . . . . . . . . . . . . . . . . . . . — — 4,943.1 — 4,943.1Policy loans, net . . . . . . . . . . . . . . . . . . . . . . . . . . . . . . — — 53.3 — 53.3Derivatives, net . . . . . . . . . . . . . . . . . . . . . . . . . . . . . . . (6.6) — (2,617.1) — (2,623.7)Other investments, net . . . . . . . . . . . . . . . . . . . . . . . . . . — — 53.0 — 53.0Sales from consolidated investments entities . . . . . . . . — — 3,203.0 — 3,203.0Purchases of consolidated investment entities . . . . . . . — — (4,257.9) — (4,257.9)Maturity of intercompany loans with maturities more
than three months . . . . . . . . . . . . . . . . . . . . . . . . . . . 2.3 — — (2.3) —Net maturity of short-term intercompany loans . . . . . . (136.6) 58.0 261.1 (182.5) —Return of capital contributions and dividends from
subsidiaries . . . . . . . . . . . . . . . . . . . . . . . . . . . . . . . . 1,434.0 1,077.0 — (2,511.0) —Capital contributions to subsidiaries . . . . . . . . . . . . . . . (2,062.0) (0.3) — 2,062.3 —Collateral received (delivered), net . . . . . . . . . . . . . . . . 27.7 — (657.0) — (629.3)Purchases of fixed assets, net . . . . . . . . . . . . . . . . . . . . — — (40.7) — (40.7)Other, net . . . . . . . . . . . . . . . . . . . . . . . . . . . . . . . . . . . . — (0.4) 0.4 — —
Net cash provided by (used in) investing activities . . . . . . . $ (746.3) $ 1,137.6 $ (1,643.4) $ (633.5) $ (1,885.6)
348
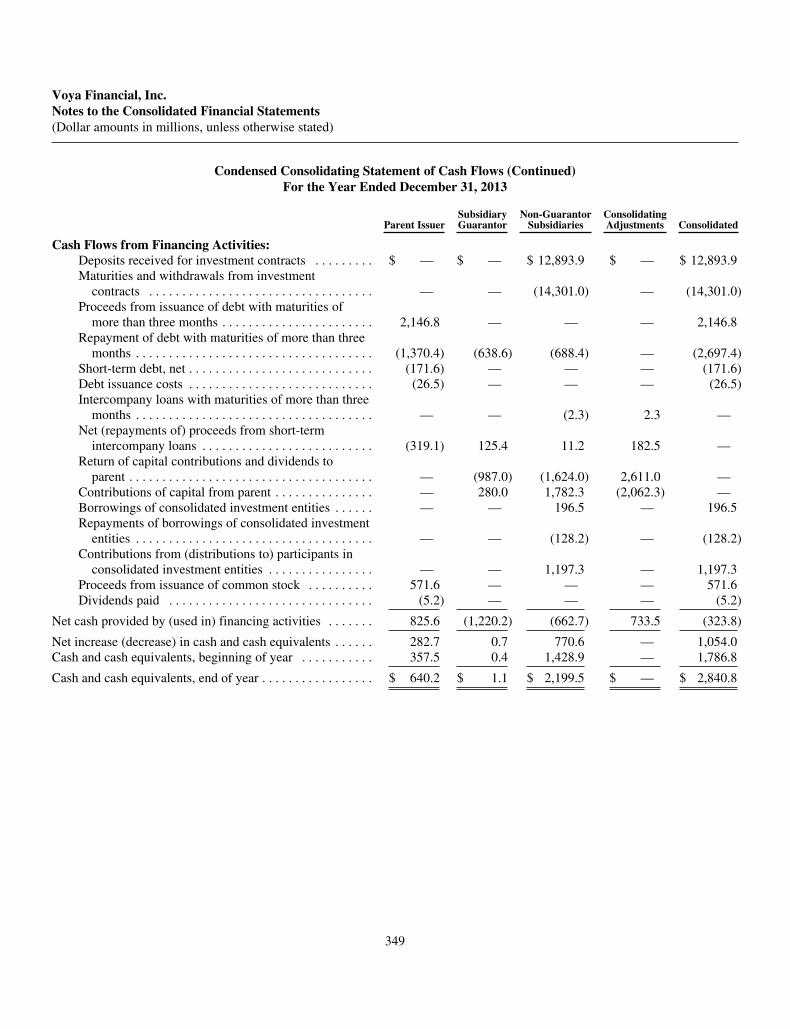
Voya Financial, Inc.Notes to the Consolidated Financial Statements(Dollar amounts in millions, unless otherwise stated)
Condensed Consolidating Statement of Cash Flows (Continued)For the Year Ended December 31, 2013
Parent IssuerSubsidiaryGuarantor
Non-GuarantorSubsidiaries
ConsolidatingAdjustments Consolidated
Cash Flows from Financing Activities:Deposits received for investment contracts . . . . . . . . . $ — $ — $ 12,893.9 $ — $ 12,893.9Maturities and withdrawals from investment
contracts . . . . . . . . . . . . . . . . . . . . . . . . . . . . . . . . . . — — (14,301.0) — (14,301.0)Proceeds from issuance of debt with maturities of
more than three months . . . . . . . . . . . . . . . . . . . . . . . 2,146.8 — — — 2,146.8Repayment of debt with maturities of more than three
months . . . . . . . . . . . . . . . . . . . . . . . . . . . . . . . . . . . . (1,370.4) (638.6) (688.4) — (2,697.4)Short-term debt, net . . . . . . . . . . . . . . . . . . . . . . . . . . . . (171.6) — — — (171.6)Debt issuance costs . . . . . . . . . . . . . . . . . . . . . . . . . . . . (26.5) — — — (26.5)Intercompany loans with maturities of more than three
months . . . . . . . . . . . . . . . . . . . . . . . . . . . . . . . . . . . . — — (2.3) 2.3 —Net (repayments of) proceeds from short-term
intercompany loans . . . . . . . . . . . . . . . . . . . . . . . . . . (319.1) 125.4 11.2 182.5 —Return of capital contributions and dividends to
parent . . . . . . . . . . . . . . . . . . . . . . . . . . . . . . . . . . . . . — (987.0) (1,624.0) 2,611.0 —Contributions of capital from parent . . . . . . . . . . . . . . . — 280.0 1,782.3 (2,062.3) —Borrowings of consolidated investment entities . . . . . . — — 196.5 — 196.5Repayments of borrowings of consolidated investment
entities . . . . . . . . . . . . . . . . . . . . . . . . . . . . . . . . . . . . — — (128.2) — (128.2)Contributions from (distributions to) participants in
consolidated investment entities . . . . . . . . . . . . . . . . — — 1,197.3 — 1,197.3Proceeds from issuance of common stock . . . . . . . . . . 571.6 — — — 571.6Dividends paid . . . . . . . . . . . . . . . . . . . . . . . . . . . . . . . (5.2) — — — (5.2)
Net cash provided by (used in) financing activities . . . . . . . 825.6 (1,220.2) (662.7) 733.5 (323.8)
Net increase (decrease) in cash and cash equivalents . . . . . . 282.7 0.7 770.6 — 1,054.0Cash and cash equivalents, beginning of year . . . . . . . . . . . 357.5 0.4 1,428.9 — 1,786.8
Cash and cash equivalents, end of year . . . . . . . . . . . . . . . . . $ 640.2 $ 1.1 $ 2,199.5 $ — $ 2,840.8
349
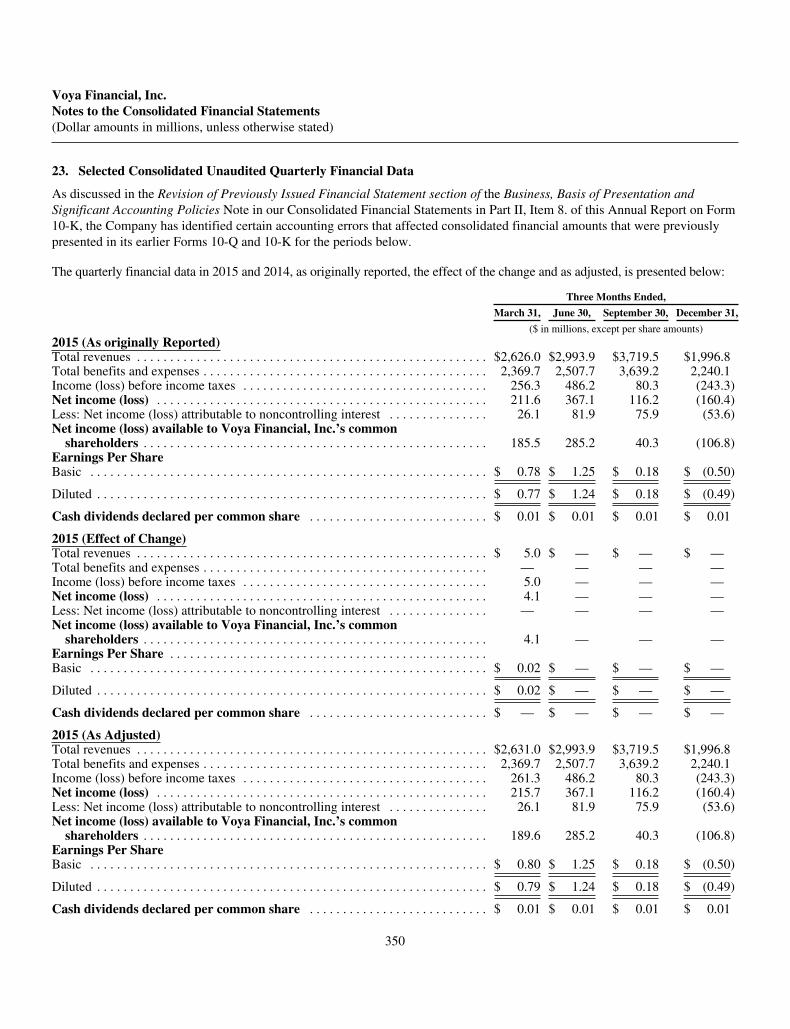
Voya Financial, Inc.Notes to the Consolidated Financial Statements(Dollar amounts in millions, unless otherwise stated)
23. Selected Consolidated Unaudited Quarterly Financial Data
As discussed in the Revision of Previously Issued Financial Statement section of the Business, Basis of Presentation andSignificant Accounting Policies Note in our Consolidated Financial Statements in Part II, Item 8. of this Annual Report on Form10-K, the Company has identified certain accounting errors that affected consolidated financial amounts that were previouslypresented in its earlier Forms 10-Q and 10-K for the periods below.
The quarterly financial data in 2015 and 2014, as originally reported, the effect of the change and as adjusted, is presented below:
Three Months Ended,
March 31, June 30, September 30, December 31,
($ in millions, except per share amounts)2015 (As originally Reported)Total revenues . . . . . . . . . . . . . . . . . . . . . . . . . . . . . . . . . . . . . . . . . . . . . . . . . . . . . $2,626.0 $2,993.9 $3,719.5 $1,996.8Total benefits and expenses . . . . . . . . . . . . . . . . . . . . . . . . . . . . . . . . . . . . . . . . . . . 2,369.7 2,507.7 3,639.2 2,240.1Income (loss) before income taxes . . . . . . . . . . . . . . . . . . . . . . . . . . . . . . . . . . . . . 256.3 486.2 80.3 (243.3)Net income (loss) . . . . . . . . . . . . . . . . . . . . . . . . . . . . . . . . . . . . . . . . . . . . . . . . . . 211.6 367.1 116.2 (160.4)Less: Net income (loss) attributable to noncontrolling interest . . . . . . . . . . . . . . . 26.1 81.9 75.9 (53.6)Net income (loss) available to Voya Financial, Inc.’s common
shareholders . . . . . . . . . . . . . . . . . . . . . . . . . . . . . . . . . . . . . . . . . . . . . . . . . . . . 185.5 285.2 40.3 (106.8)Earnings Per ShareBasic . . . . . . . . . . . . . . . . . . . . . . . . . . . . . . . . . . . . . . . . . . . . . . . . . . . . . . . . . . . . $ 0.78 $ 1.25 $ 0.18 $ (0.50)
Diluted . . . . . . . . . . . . . . . . . . . . . . . . . . . . . . . . . . . . . . . . . . . . . . . . . . . . . . . . . . . $ 0.77 $ 1.24 $ 0.18 $ (0.49)
Cash dividends declared per common share . . . . . . . . . . . . . . . . . . . . . . . . . . . $ 0.01 $ 0.01 $ 0.01 $ 0.01
2015 (Effect of Change)Total revenues . . . . . . . . . . . . . . . . . . . . . . . . . . . . . . . . . . . . . . . . . . . . . . . . . . . . . $ 5.0 $ — $ — $ —Total benefits and expenses . . . . . . . . . . . . . . . . . . . . . . . . . . . . . . . . . . . . . . . . . . . — — — —Income (loss) before income taxes . . . . . . . . . . . . . . . . . . . . . . . . . . . . . . . . . . . . . 5.0 — — —Net income (loss) . . . . . . . . . . . . . . . . . . . . . . . . . . . . . . . . . . . . . . . . . . . . . . . . . . 4.1 — — —Less: Net income (loss) attributable to noncontrolling interest . . . . . . . . . . . . . . . — — — —Net income (loss) available to Voya Financial, Inc.’s common
shareholders . . . . . . . . . . . . . . . . . . . . . . . . . . . . . . . . . . . . . . . . . . . . . . . . . . . . 4.1 — — —Earnings Per Share . . . . . . . . . . . . . . . . . . . . . . . . . . . . . . . . . . . . . . . . . . . . . . . .Basic . . . . . . . . . . . . . . . . . . . . . . . . . . . . . . . . . . . . . . . . . . . . . . . . . . . . . . . . . . . . $ 0.02 $ — $ — $ —
Diluted . . . . . . . . . . . . . . . . . . . . . . . . . . . . . . . . . . . . . . . . . . . . . . . . . . . . . . . . . . . $ 0.02 $ — $ — $ —
Cash dividends declared per common share . . . . . . . . . . . . . . . . . . . . . . . . . . . $ — $ — $ — $ —
2015 (As Adjusted)Total revenues . . . . . . . . . . . . . . . . . . . . . . . . . . . . . . . . . . . . . . . . . . . . . . . . . . . . . $2,631.0 $2,993.9 $3,719.5 $1,996.8Total benefits and expenses . . . . . . . . . . . . . . . . . . . . . . . . . . . . . . . . . . . . . . . . . . . 2,369.7 2,507.7 3,639.2 2,240.1Income (loss) before income taxes . . . . . . . . . . . . . . . . . . . . . . . . . . . . . . . . . . . . . 261.3 486.2 80.3 (243.3)Net income (loss) . . . . . . . . . . . . . . . . . . . . . . . . . . . . . . . . . . . . . . . . . . . . . . . . . . 215.7 367.1 116.2 (160.4)Less: Net income (loss) attributable to noncontrolling interest . . . . . . . . . . . . . . . 26.1 81.9 75.9 (53.6)Net income (loss) available to Voya Financial, Inc.’s common
shareholders . . . . . . . . . . . . . . . . . . . . . . . . . . . . . . . . . . . . . . . . . . . . . . . . . . . . 189.6 285.2 40.3 (106.8)Earnings Per ShareBasic . . . . . . . . . . . . . . . . . . . . . . . . . . . . . . . . . . . . . . . . . . . . . . . . . . . . . . . . . . . . $ 0.80 $ 1.25 $ 0.18 $ (0.50)
Diluted . . . . . . . . . . . . . . . . . . . . . . . . . . . . . . . . . . . . . . . . . . . . . . . . . . . . . . . . . . . $ 0.79 $ 1.24 $ 0.18 $ (0.49)
Cash dividends declared per common share . . . . . . . . . . . . . . . . . . . . . . . . . . . $ 0.01 $ 0.01 $ 0.01 $ 0.01
350

Voya Financial, Inc.Notes to the Consolidated Financial Statements(Dollar amounts in millions, unless otherwise stated)
Three Months Ended,
March 31, June 30, September 30, December 31,
($ in millions, except per share amounts)
2014 (As originally Reported)Total revenues . . . . . . . . . . . . . . . . . . . . . . . . . . . . . . . . . . . . . . . . . . . . . . . . . . $2,670.9 $2,698.1 $3,191.1 $2,510.8Total benefits and expenses . . . . . . . . . . . . . . . . . . . . . . . . . . . . . . . . . . . . . . . 2,368.6 2,279.1 2,636.3 3,001.7Income (loss) before income taxes . . . . . . . . . . . . . . . . . . . . . . . . . . . . . . . . . . 302.3 419.0 554.8 (490.9)Net income (loss) . . . . . . . . . . . . . . . . . . . . . . . . . . . . . . . . . . . . . . . . . . . . . . . 271.6 412.9 517.4 1,335.5Less: Net income (loss) attributable to noncontrolling interest . . . . . . . . . . . . 13.5 166.6 116.6 (59.0)Net income (loss) available to Voya Financial, Inc.’s common
shareholders . . . . . . . . . . . . . . . . . . . . . . . . . . . . . . . . . . . . . . . . . . . . . . . . . 258.1 246.3 400.8 1,394.5Earnings Per ShareBasic . . . . . . . . . . . . . . . . . . . . . . . . . . . . . . . . . . . . . . . . . . . . . . . . . . . . . . . . . $ 0.99 $ 0.97 $ 1.59 $ 5.71
Diluted . . . . . . . . . . . . . . . . . . . . . . . . . . . . . . . . . . . . . . . . . . . . . . . . . . . . . . . . $ 0.98 $ 0.96 $ 1.58 $ 5.66
Cash dividends declared per common share . . . . . . . . . . . . . . . . . . . . . . . . $ 0.01 $ 0.01 $ 0.01 $ 0.01
2014 (Effect of Change)Total revenues . . . . . . . . . . . . . . . . . . . . . . . . . . . . . . . . . . . . . . . . . . . . . . . . . . $ 4.0 $ 2.0 $ 5.0 $ 5.0Total benefits and expenses . . . . . . . . . . . . . . . . . . . . . . . . . . . . . . . . . . . . . . . — — — —Income (loss) before income taxes . . . . . . . . . . . . . . . . . . . . . . . . . . . . . . . . . . 4.0 2.0 5.0 5.0Net income (loss) . . . . . . . . . . . . . . . . . . . . . . . . . . . . . . . . . . . . . . . . . . . . . . . 4.0 2.0 5.0 (15.7)Less: Net income (loss) attributable to noncontrolling interest . . . . . . . . . . . . — — — —Net income (loss) available to Voya Financial, Inc.’s common
shareholders . . . . . . . . . . . . . . . . . . . . . . . . . . . . . . . . . . . . . . . . . . . . . . . . . 4.0 2.0 5.0 (15.7)Earnings Per Share . . . . . . . . . . . . . . . . . . . . . . . . . . . . . . . . . . . . . . . . . . . . .Basic . . . . . . . . . . . . . . . . . . . . . . . . . . . . . . . . . . . . . . . . . . . . . . . . . . . . . . . . . $ 0.01 $ 0.01 $ 0.02 $ (0.06)
Diluted . . . . . . . . . . . . . . . . . . . . . . . . . . . . . . . . . . . . . . . . . . . . . . . . . . . . . . . . $ 0.01 $ 0.01 $ 0.01 $ (0.06)
Cash dividends declared per common share . . . . . . . . . . . . . . . . . . . . . . . . $ — $ — $ — $ —
2014 (As Adjusted)Total revenues . . . . . . . . . . . . . . . . . . . . . . . . . . . . . . . . . . . . . . . . . . . . . . . . . . $2,674.9 $2,700.1 $3,196.1 $2,515.8Total benefits and expenses . . . . . . . . . . . . . . . . . . . . . . . . . . . . . . . . . . . . . . . 2,368.6 2,279.1 2,636.3 3,001.7Income (loss) before income taxes . . . . . . . . . . . . . . . . . . . . . . . . . . . . . . . . . . 306.3 421.0 559.8 (485.9)Net income (loss) . . . . . . . . . . . . . . . . . . . . . . . . . . . . . . . . . . . . . . . . . . . . . . . 275.6 414.9 522.4 1,319.8Less: Net income (loss) attributable to noncontrolling interest . . . . . . . . . . . . 13.5 166.6 116.6 (59.0)Net income (loss) available to Voya Financial, Inc.’s common
shareholders . . . . . . . . . . . . . . . . . . . . . . . . . . . . . . . . . . . . . . . . . . . . . . . . . 262.1 248.3 405.8 1,378.8Earnings Per ShareBasic . . . . . . . . . . . . . . . . . . . . . . . . . . . . . . . . . . . . . . . . . . . . . . . . . . . . . . . . . $ 1.00 $ 0.98 $ 1.61 $ 5.65
Diluted . . . . . . . . . . . . . . . . . . . . . . . . . . . . . . . . . . . . . . . . . . . . . . . . . . . . . . . . $ 0.99 $ 0.97 $ 1.59 $ 5.60
Cash dividends declared per common share . . . . . . . . . . . . . . . . . . . . . . . . $ 0.01 $ 0.01 $ 0.01 $ 0.01
351
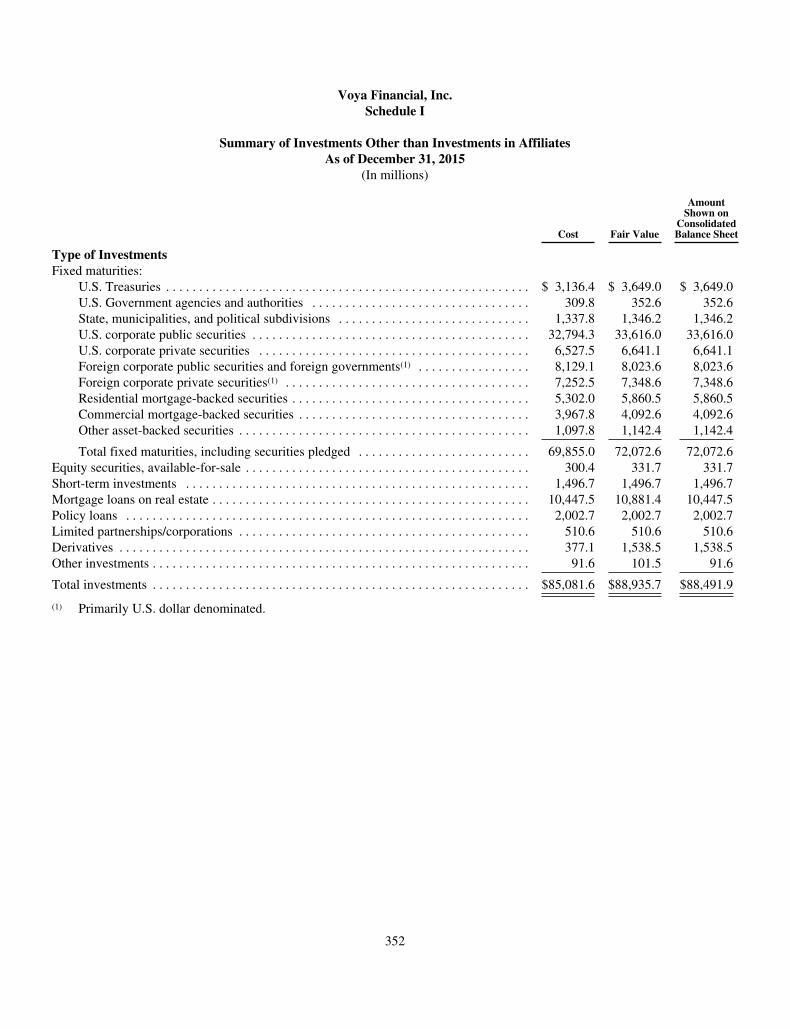
Voya Financial, Inc.Schedule I
Summary of Investments Other than Investments in AffiliatesAs of December 31, 2015
(In millions)
Cost Fair Value
AmountShown on
ConsolidatedBalance Sheet
Type of InvestmentsFixed maturities:
U.S. Treasuries . . . . . . . . . . . . . . . . . . . . . . . . . . . . . . . . . . . . . . . . . . . . . . . . . . . . . . . $ 3,136.4 $ 3,649.0 $ 3,649.0U.S. Government agencies and authorities . . . . . . . . . . . . . . . . . . . . . . . . . . . . . . . . . 309.8 352.6 352.6State, municipalities, and political subdivisions . . . . . . . . . . . . . . . . . . . . . . . . . . . . . 1,337.8 1,346.2 1,346.2U.S. corporate public securities . . . . . . . . . . . . . . . . . . . . . . . . . . . . . . . . . . . . . . . . . . 32,794.3 33,616.0 33,616.0U.S. corporate private securities . . . . . . . . . . . . . . . . . . . . . . . . . . . . . . . . . . . . . . . . . 6,527.5 6,641.1 6,641.1Foreign corporate public securities and foreign governments(1) . . . . . . . . . . . . . . . . . 8,129.1 8,023.6 8,023.6Foreign corporate private securities(1) . . . . . . . . . . . . . . . . . . . . . . . . . . . . . . . . . . . . . 7,252.5 7,348.6 7,348.6Residential mortgage-backed securities . . . . . . . . . . . . . . . . . . . . . . . . . . . . . . . . . . . . 5,302.0 5,860.5 5,860.5Commercial mortgage-backed securities . . . . . . . . . . . . . . . . . . . . . . . . . . . . . . . . . . . 3,967.8 4,092.6 4,092.6Other asset-backed securities . . . . . . . . . . . . . . . . . . . . . . . . . . . . . . . . . . . . . . . . . . . . 1,097.8 1,142.4 1,142.4
Total fixed maturities, including securities pledged . . . . . . . . . . . . . . . . . . . . . . . . . . 69,855.0 72,072.6 72,072.6Equity securities, available-for-sale . . . . . . . . . . . . . . . . . . . . . . . . . . . . . . . . . . . . . . . . . . . 300.4 331.7 331.7Short-term investments . . . . . . . . . . . . . . . . . . . . . . . . . . . . . . . . . . . . . . . . . . . . . . . . . . . . 1,496.7 1,496.7 1,496.7Mortgage loans on real estate . . . . . . . . . . . . . . . . . . . . . . . . . . . . . . . . . . . . . . . . . . . . . . . . 10,447.5 10,881.4 10,447.5Policy loans . . . . . . . . . . . . . . . . . . . . . . . . . . . . . . . . . . . . . . . . . . . . . . . . . . . . . . . . . . . . . 2,002.7 2,002.7 2,002.7Limited partnerships/corporations . . . . . . . . . . . . . . . . . . . . . . . . . . . . . . . . . . . . . . . . . . . . 510.6 510.6 510.6Derivatives . . . . . . . . . . . . . . . . . . . . . . . . . . . . . . . . . . . . . . . . . . . . . . . . . . . . . . . . . . . . . . 377.1 1,538.5 1,538.5Other investments . . . . . . . . . . . . . . . . . . . . . . . . . . . . . . . . . . . . . . . . . . . . . . . . . . . . . . . . . 91.6 101.5 91.6
Total investments . . . . . . . . . . . . . . . . . . . . . . . . . . . . . . . . . . . . . . . . . . . . . . . . . . . . . . . . . $85,081.6 $88,935.7 $88,491.9
(1) Primarily U.S. dollar denominated.
352
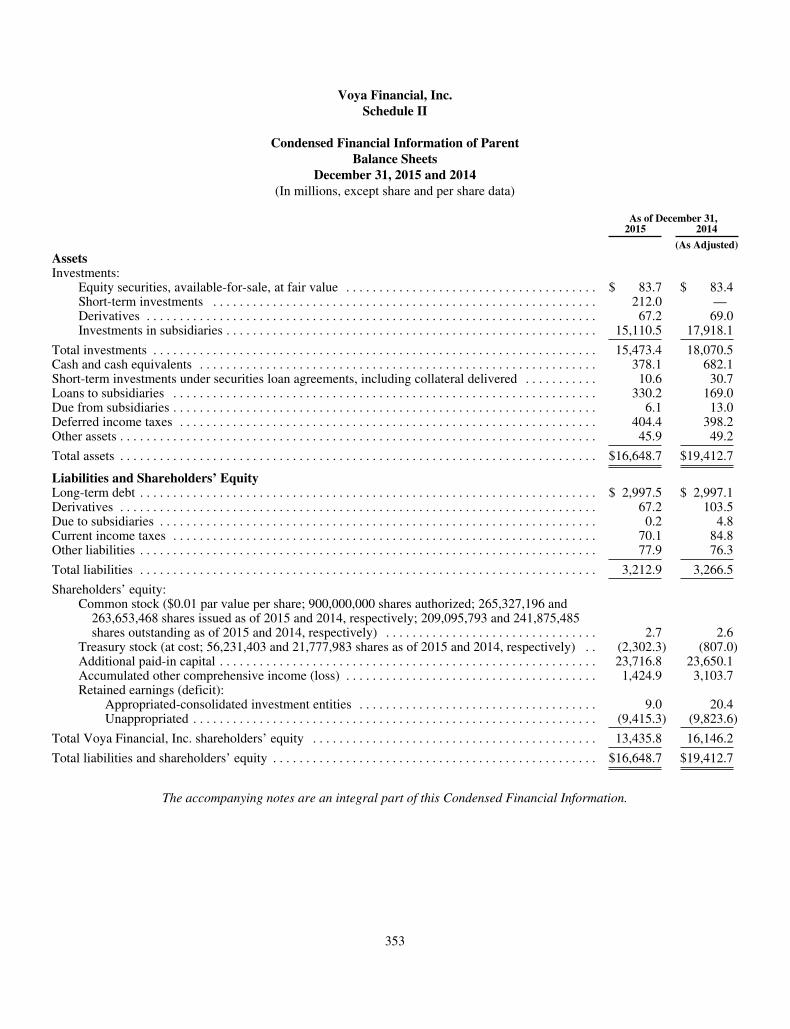
Voya Financial, Inc.Schedule II
Condensed Financial Information of ParentBalance Sheets
December 31, 2015 and 2014(In millions, except share and per share data)
As of December 31,2015 2014
(As Adjusted)AssetsInvestments:
Equity securities, available-for-sale, at fair value . . . . . . . . . . . . . . . . . . . . . . . . . . . . . . . . . . . . . . $ 83.7 $ 83.4Short-term investments . . . . . . . . . . . . . . . . . . . . . . . . . . . . . . . . . . . . . . . . . . . . . . . . . . . . . . . . . . 212.0 —Derivatives . . . . . . . . . . . . . . . . . . . . . . . . . . . . . . . . . . . . . . . . . . . . . . . . . . . . . . . . . . . . . . . . . . . . 67.2 69.0Investments in subsidiaries . . . . . . . . . . . . . . . . . . . . . . . . . . . . . . . . . . . . . . . . . . . . . . . . . . . . . . . . 15,110.5 17,918.1
Total investments . . . . . . . . . . . . . . . . . . . . . . . . . . . . . . . . . . . . . . . . . . . . . . . . . . . . . . . . . . . . . . . . . . . 15,473.4 18,070.5Cash and cash equivalents . . . . . . . . . . . . . . . . . . . . . . . . . . . . . . . . . . . . . . . . . . . . . . . . . . . . . . . . . . . . 378.1 682.1Short-term investments under securities loan agreements, including collateral delivered . . . . . . . . . . . 10.6 30.7Loans to subsidiaries . . . . . . . . . . . . . . . . . . . . . . . . . . . . . . . . . . . . . . . . . . . . . . . . . . . . . . . . . . . . . . . . 330.2 169.0Due from subsidiaries . . . . . . . . . . . . . . . . . . . . . . . . . . . . . . . . . . . . . . . . . . . . . . . . . . . . . . . . . . . . . . . . 6.1 13.0Deferred income taxes . . . . . . . . . . . . . . . . . . . . . . . . . . . . . . . . . . . . . . . . . . . . . . . . . . . . . . . . . . . . . . . 404.4 398.2Other assets . . . . . . . . . . . . . . . . . . . . . . . . . . . . . . . . . . . . . . . . . . . . . . . . . . . . . . . . . . . . . . . . . . . . . . . . 45.9 49.2
Total assets . . . . . . . . . . . . . . . . . . . . . . . . . . . . . . . . . . . . . . . . . . . . . . . . . . . . . . . . . . . . . . . . . . . . . . . . $16,648.7 $19,412.7
Liabilities and Shareholders’ EquityLong-term debt . . . . . . . . . . . . . . . . . . . . . . . . . . . . . . . . . . . . . . . . . . . . . . . . . . . . . . . . . . . . . . . . . . . . . $ 2,997.5 $ 2,997.1Derivatives . . . . . . . . . . . . . . . . . . . . . . . . . . . . . . . . . . . . . . . . . . . . . . . . . . . . . . . . . . . . . . . . . . . . . . . . 67.2 103.5Due to subsidiaries . . . . . . . . . . . . . . . . . . . . . . . . . . . . . . . . . . . . . . . . . . . . . . . . . . . . . . . . . . . . . . . . . . 0.2 4.8Current income taxes . . . . . . . . . . . . . . . . . . . . . . . . . . . . . . . . . . . . . . . . . . . . . . . . . . . . . . . . . . . . . . . . 70.1 84.8Other liabilities . . . . . . . . . . . . . . . . . . . . . . . . . . . . . . . . . . . . . . . . . . . . . . . . . . . . . . . . . . . . . . . . . . . . . 77.9 76.3
Total liabilities . . . . . . . . . . . . . . . . . . . . . . . . . . . . . . . . . . . . . . . . . . . . . . . . . . . . . . . . . . . . . . . . . . . . . 3,212.9 3,266.5
Shareholders’ equity:Common stock ($0.01 par value per share; 900,000,000 shares authorized; 265,327,196 and
263,653,468 shares issued as of 2015 and 2014, respectively; 209,095,793 and 241,875,485shares outstanding as of 2015 and 2014, respectively) . . . . . . . . . . . . . . . . . . . . . . . . . . . . . . . . 2.7 2.6
Treasury stock (at cost; 56,231,403 and 21,777,983 shares as of 2015 and 2014, respectively) . . (2,302.3) (807.0)Additional paid-in capital . . . . . . . . . . . . . . . . . . . . . . . . . . . . . . . . . . . . . . . . . . . . . . . . . . . . . . . . . 23,716.8 23,650.1Accumulated other comprehensive income (loss) . . . . . . . . . . . . . . . . . . . . . . . . . . . . . . . . . . . . . . 1,424.9 3,103.7Retained earnings (deficit):
Appropriated-consolidated investment entities . . . . . . . . . . . . . . . . . . . . . . . . . . . . . . . . . . . . 9.0 20.4Unappropriated . . . . . . . . . . . . . . . . . . . . . . . . . . . . . . . . . . . . . . . . . . . . . . . . . . . . . . . . . . . . . (9,415.3) (9,823.6)
Total Voya Financial, Inc. shareholders’ equity . . . . . . . . . . . . . . . . . . . . . . . . . . . . . . . . . . . . . . . . . . . 13,435.8 16,146.2
Total liabilities and shareholders’ equity . . . . . . . . . . . . . . . . . . . . . . . . . . . . . . . . . . . . . . . . . . . . . . . . . $16,648.7 $19,412.7
The accompanying notes are an integral part of this Condensed Financial Information.
353
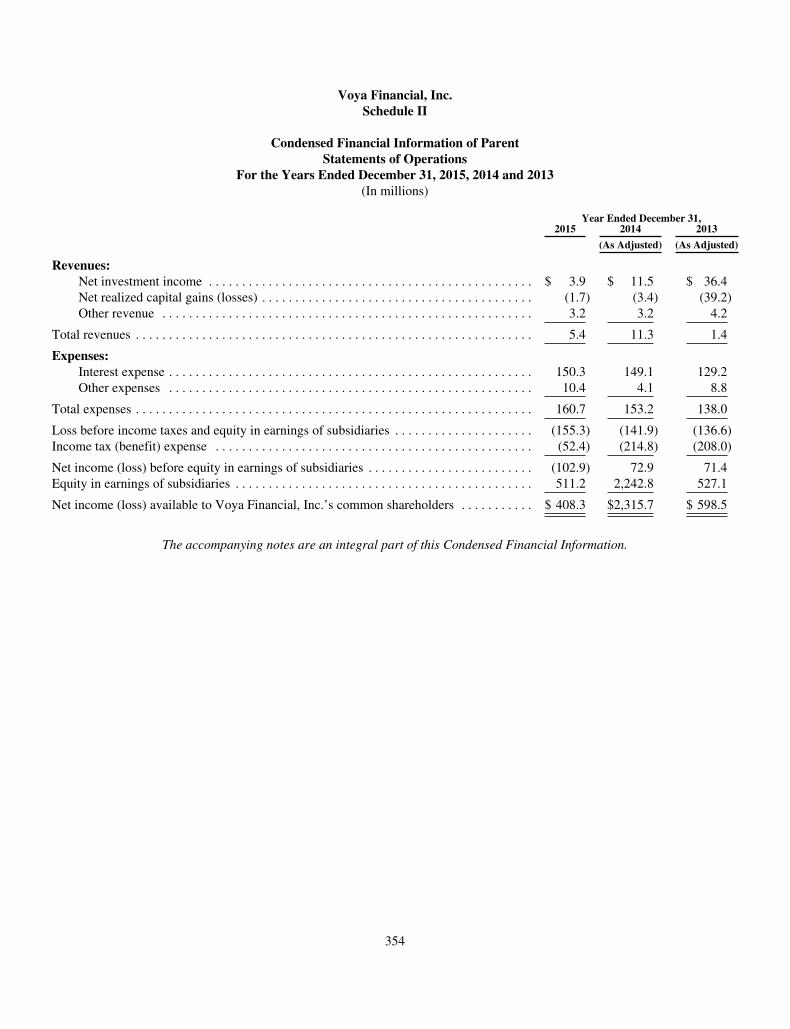
Voya Financial, Inc.Schedule II
Condensed Financial Information of ParentStatements of Operations
For the Years Ended December 31, 2015, 2014 and 2013(In millions)
Year Ended December 31,2015 2014 2013
(As Adjusted) (As Adjusted)
Revenues:Net investment income . . . . . . . . . . . . . . . . . . . . . . . . . . . . . . . . . . . . . . . . . . . . . . . . . $ 3.9 $ 11.5 $ 36.4Net realized capital gains (losses) . . . . . . . . . . . . . . . . . . . . . . . . . . . . . . . . . . . . . . . . . (1.7) (3.4) (39.2)Other revenue . . . . . . . . . . . . . . . . . . . . . . . . . . . . . . . . . . . . . . . . . . . . . . . . . . . . . . . . 3.2 3.2 4.2
Total revenues . . . . . . . . . . . . . . . . . . . . . . . . . . . . . . . . . . . . . . . . . . . . . . . . . . . . . . . . . . . . 5.4 11.3 1.4
Expenses:Interest expense . . . . . . . . . . . . . . . . . . . . . . . . . . . . . . . . . . . . . . . . . . . . . . . . . . . . . . . 150.3 149.1 129.2Other expenses . . . . . . . . . . . . . . . . . . . . . . . . . . . . . . . . . . . . . . . . . . . . . . . . . . . . . . . 10.4 4.1 8.8
Total expenses . . . . . . . . . . . . . . . . . . . . . . . . . . . . . . . . . . . . . . . . . . . . . . . . . . . . . . . . . . . . 160.7 153.2 138.0
Loss before income taxes and equity in earnings of subsidiaries . . . . . . . . . . . . . . . . . . . . . (155.3) (141.9) (136.6)Income tax (benefit) expense . . . . . . . . . . . . . . . . . . . . . . . . . . . . . . . . . . . . . . . . . . . . . . . . (52.4) (214.8) (208.0)
Net income (loss) before equity in earnings of subsidiaries . . . . . . . . . . . . . . . . . . . . . . . . . (102.9) 72.9 71.4Equity in earnings of subsidiaries . . . . . . . . . . . . . . . . . . . . . . . . . . . . . . . . . . . . . . . . . . . . . 511.2 2,242.8 527.1
Net income (loss) available to Voya Financial, Inc.’s common shareholders . . . . . . . . . . . $ 408.3 $2,315.7 $ 598.5
The accompanying notes are an integral part of this Condensed Financial Information.
354

Voya Financial, Inc.Schedule II
Condensed Financial Information of ParentStatements of Comprehensive Income
For the Years Ended December 31, 2015, 2014 and 2013(In millions)
Year Ended December 31,2015 2014 2013
(As Adjusted) (As Adjusted)
Net income (loss) available to Voya Financial, Inc.’s common shareholders . . . . . . . . . . $ 408.3 $2,315.7 $ 598.5Other comprehensive income (loss), after tax . . . . . . . . . . . . . . . . . . . . . . . . . . . . . . . . . . (1,678.8) 1,254.6 (1,861.6)
Comprehensive income (loss) attributable to Voya Financial, Inc.’s commonshareholders . . . . . . . . . . . . . . . . . . . . . . . . . . . . . . . . . . . . . . . . . . . . . . . . . . . . . . . . . . $(1,270.5) $3,570.3 $(1,263.1)
The accompanying notes are an integral part of this Condensed Financial Information.
355
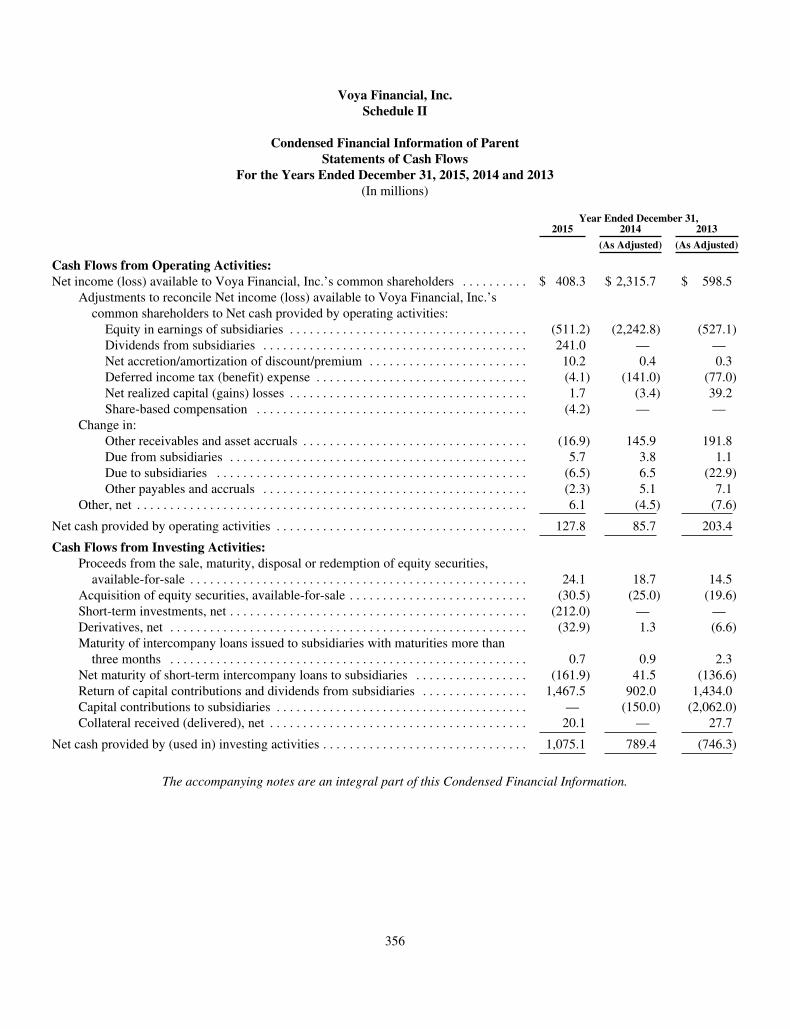
Voya Financial, Inc.Schedule II
Condensed Financial Information of ParentStatements of Cash Flows
For the Years Ended December 31, 2015, 2014 and 2013(In millions)
Year Ended December 31,2015 2014 2013
(As Adjusted) (As Adjusted)
Cash Flows from Operating Activities:Net income (loss) available to Voya Financial, Inc.’s common shareholders . . . . . . . . . . $ 408.3 $ 2,315.7 $ 598.5
Adjustments to reconcile Net income (loss) available to Voya Financial, Inc.’scommon shareholders to Net cash provided by operating activities:
Equity in earnings of subsidiaries . . . . . . . . . . . . . . . . . . . . . . . . . . . . . . . . . . . . (511.2) (2,242.8) (527.1)Dividends from subsidiaries . . . . . . . . . . . . . . . . . . . . . . . . . . . . . . . . . . . . . . . . 241.0 — —Net accretion/amortization of discount/premium . . . . . . . . . . . . . . . . . . . . . . . . 10.2 0.4 0.3Deferred income tax (benefit) expense . . . . . . . . . . . . . . . . . . . . . . . . . . . . . . . . (4.1) (141.0) (77.0)Net realized capital (gains) losses . . . . . . . . . . . . . . . . . . . . . . . . . . . . . . . . . . . . 1.7 (3.4) 39.2Share-based compensation . . . . . . . . . . . . . . . . . . . . . . . . . . . . . . . . . . . . . . . . . (4.2) — —
Change in:Other receivables and asset accruals . . . . . . . . . . . . . . . . . . . . . . . . . . . . . . . . . . (16.9) 145.9 191.8Due from subsidiaries . . . . . . . . . . . . . . . . . . . . . . . . . . . . . . . . . . . . . . . . . . . . . 5.7 3.8 1.1Due to subsidiaries . . . . . . . . . . . . . . . . . . . . . . . . . . . . . . . . . . . . . . . . . . . . . . . (6.5) 6.5 (22.9)Other payables and accruals . . . . . . . . . . . . . . . . . . . . . . . . . . . . . . . . . . . . . . . . (2.3) 5.1 7.1
Other, net . . . . . . . . . . . . . . . . . . . . . . . . . . . . . . . . . . . . . . . . . . . . . . . . . . . . . . . . . . . 6.1 (4.5) (7.6)
Net cash provided by operating activities . . . . . . . . . . . . . . . . . . . . . . . . . . . . . . . . . . . . . . 127.8 85.7 203.4
Cash Flows from Investing Activities:Proceeds from the sale, maturity, disposal or redemption of equity securities,
available-for-sale . . . . . . . . . . . . . . . . . . . . . . . . . . . . . . . . . . . . . . . . . . . . . . . . . . . 24.1 18.7 14.5Acquisition of equity securities, available-for-sale . . . . . . . . . . . . . . . . . . . . . . . . . . . (30.5) (25.0) (19.6)Short-term investments, net . . . . . . . . . . . . . . . . . . . . . . . . . . . . . . . . . . . . . . . . . . . . . (212.0) — —Derivatives, net . . . . . . . . . . . . . . . . . . . . . . . . . . . . . . . . . . . . . . . . . . . . . . . . . . . . . . (32.9) 1.3 (6.6)Maturity of intercompany loans issued to subsidiaries with maturities more than
three months . . . . . . . . . . . . . . . . . . . . . . . . . . . . . . . . . . . . . . . . . . . . . . . . . . . . . . 0.7 0.9 2.3Net maturity of short-term intercompany loans to subsidiaries . . . . . . . . . . . . . . . . . (161.9) 41.5 (136.6)Return of capital contributions and dividends from subsidiaries . . . . . . . . . . . . . . . . 1,467.5 902.0 1,434.0Capital contributions to subsidiaries . . . . . . . . . . . . . . . . . . . . . . . . . . . . . . . . . . . . . . — (150.0) (2,062.0)Collateral received (delivered), net . . . . . . . . . . . . . . . . . . . . . . . . . . . . . . . . . . . . . . . 20.1 — 27.7
Net cash provided by (used in) investing activities . . . . . . . . . . . . . . . . . . . . . . . . . . . . . . . 1,075.1 789.4 (746.3)
The accompanying notes are an integral part of this Condensed Financial Information.
356
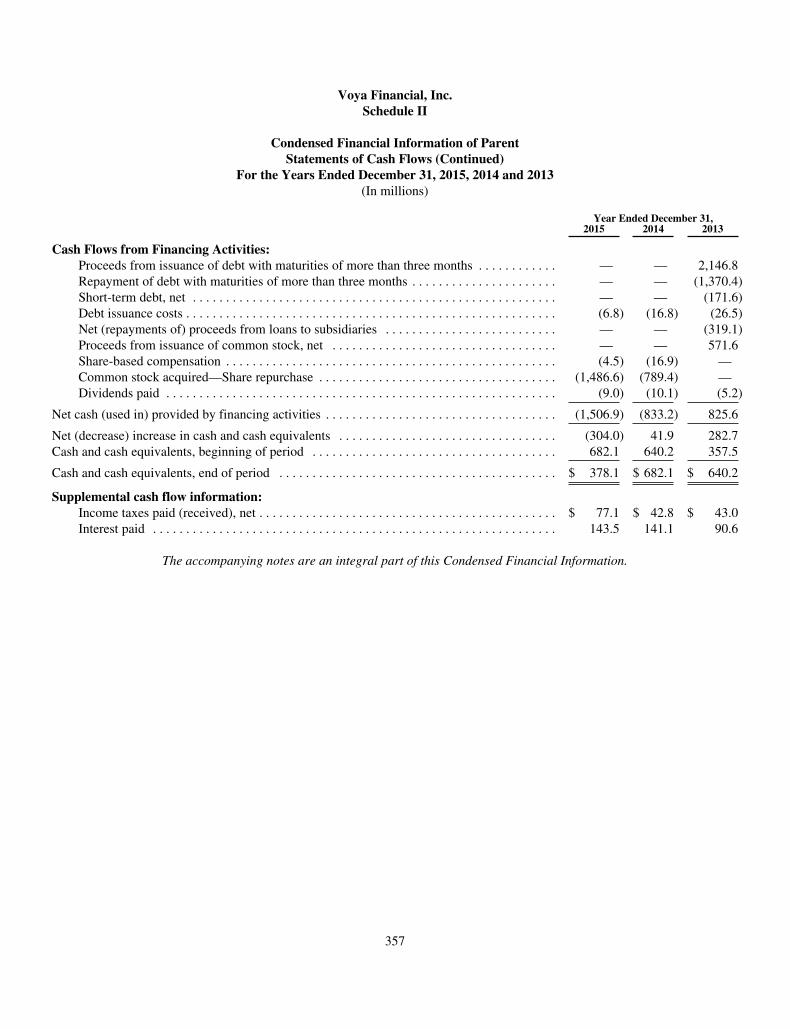
Voya Financial, Inc.Schedule II
Condensed Financial Information of ParentStatements of Cash Flows (Continued)
For the Years Ended December 31, 2015, 2014 and 2013(In millions)
Year Ended December 31,2015 2014 2013
Cash Flows from Financing Activities:Proceeds from issuance of debt with maturities of more than three months . . . . . . . . . . . . — — 2,146.8Repayment of debt with maturities of more than three months . . . . . . . . . . . . . . . . . . . . . . — — (1,370.4)Short-term debt, net . . . . . . . . . . . . . . . . . . . . . . . . . . . . . . . . . . . . . . . . . . . . . . . . . . . . . . . — — (171.6)Debt issuance costs . . . . . . . . . . . . . . . . . . . . . . . . . . . . . . . . . . . . . . . . . . . . . . . . . . . . . . . . (6.8) (16.8) (26.5)Net (repayments of) proceeds from loans to subsidiaries . . . . . . . . . . . . . . . . . . . . . . . . . . — — (319.1)Proceeds from issuance of common stock, net . . . . . . . . . . . . . . . . . . . . . . . . . . . . . . . . . . — — 571.6Share-based compensation . . . . . . . . . . . . . . . . . . . . . . . . . . . . . . . . . . . . . . . . . . . . . . . . . . (4.5) (16.9) —Common stock acquired—Share repurchase . . . . . . . . . . . . . . . . . . . . . . . . . . . . . . . . . . . . (1,486.6) (789.4) —Dividends paid . . . . . . . . . . . . . . . . . . . . . . . . . . . . . . . . . . . . . . . . . . . . . . . . . . . . . . . . . . . (9.0) (10.1) (5.2)
Net cash (used in) provided by financing activities . . . . . . . . . . . . . . . . . . . . . . . . . . . . . . . . . . . (1,506.9) (833.2) 825.6
Net (decrease) increase in cash and cash equivalents . . . . . . . . . . . . . . . . . . . . . . . . . . . . . . . . . (304.0) 41.9 282.7Cash and cash equivalents, beginning of period . . . . . . . . . . . . . . . . . . . . . . . . . . . . . . . . . . . . . 682.1 640.2 357.5
Cash and cash equivalents, end of period . . . . . . . . . . . . . . . . . . . . . . . . . . . . . . . . . . . . . . . . . . $ 378.1 $ 682.1 $ 640.2
Supplemental cash flow information:Income taxes paid (received), net . . . . . . . . . . . . . . . . . . . . . . . . . . . . . . . . . . . . . . . . . . . . . $ 77.1 $ 42.8 $ 43.0Interest paid . . . . . . . . . . . . . . . . . . . . . . . . . . . . . . . . . . . . . . . . . . . . . . . . . . . . . . . . . . . . . 143.5 141.1 90.6
The accompanying notes are an integral part of this Condensed Financial Information.
357

Voya Financial, Inc.Schedule IINotes to Condensed Financial Information of Parent(Dollar amounts in millions, unless otherwise stated)
1. Basis of Presentation
The condensed financial information of Voya Financial, Inc. should be read in conjunction with the consolidated financialstatements of Voya Financial, Inc. and its subsidiaries (collectively the “Company”) and the notes thereto (the “ConsolidatedFinancial Statements”).
Prior to May 2013, the Company was an indirect, wholly owned subsidiary of ING Groep N.V. (“ING Group” or “ING”), a globalfinancial services holding company based in The Netherlands, with American Depository Shares listed on the New York StockExchange. In 2009, ING Group announced the anticipated separation of its global banking and insurance businesses, including thedivestiture of the Company. On April 11, 2013, the Company announced plans to rebrand in the future as Voya Financial, Inc. OnMay 2, 2013, the common stock of Voya Financial, Inc. began trading on the New York Stock Exchange under the symbol“VOYA.” On May 7, 2013 and May 31, 2013, Voya Financial, Inc. completed its initial public offering of common stock,including the issuance and sale by Voya Financial, Inc. of 30,769,230 shares of common stock and the sale by ING InsuranceInternational B.V. (“ING International”), an indirect, wholly owned subsidiary of ING Group and previously the sole stockholderof Voya Financial, Inc., of 44,201,773 shares of outstanding common stock of Voya Financial, Inc. (collectively, “the IPO”). OnSeptember 30, 2013, ING International transferred all of its shares of Voya Financial, Inc. common stock to ING Group.
On October 29, 2013, ING Group completed a sale of 37,950,000 shares of common stock of the Company in a registeredpublic offering (“Secondary Offering”), reducing ING Group’s ownership in the Company to 57%.
Throughout 2014, ING Group completed the sale of an aggregate of 82,783,006 shares of common stock of Voya Financial, Inc.in a series of registered public offerings. Also during 2014, pursuant to the terms of share repurchase agreements between INGGroup and Voya Financial, Inc., Voya Financial, Inc. acquired 19,447,847 shares of its common stock from ING Group. As ofthe end of 2014, ING Group’s ownership of Voya Financial, Inc. had been reduced to approximately19%.
In March of 2015, ING Group completed a sale of 32,018,100 shares of common stock of Voya Financial, Inc. in a registeredpublic offering. Concurrently with this offering, pursuant to the terms of a share repurchase agreement between ING Group andVoya Financial, Inc., Voya Financial, Inc. acquired 13,599,274 shares of its common stock from ING Group.
As a result of these transactions, ING Group satisfied the provisions of its agreement with the European Union regarding thedivestment of its U.S. insurance and investment operations, which required ING Group to divest 100% of its ownership interestin Voya Financial, Inc. together with its subsidiaries, by the end of 2016. ING Group continues to hold warrants to purchase upto 26,050,846 shares of Voya Financial, Inc. common stock at an exercise price of $48.75, in each case subject to adjustments.
The accompanying financial information reflects the results of operations, financial position and cash flows for Voya Financial,Inc. The financial information is in conformity with accounting principles generally accepted in the United States, which requiremanagement to adopt accounting policies and make certain estimates and assumptions. Investments in subsidiaries areaccounted for using the equity method of accounting.
358
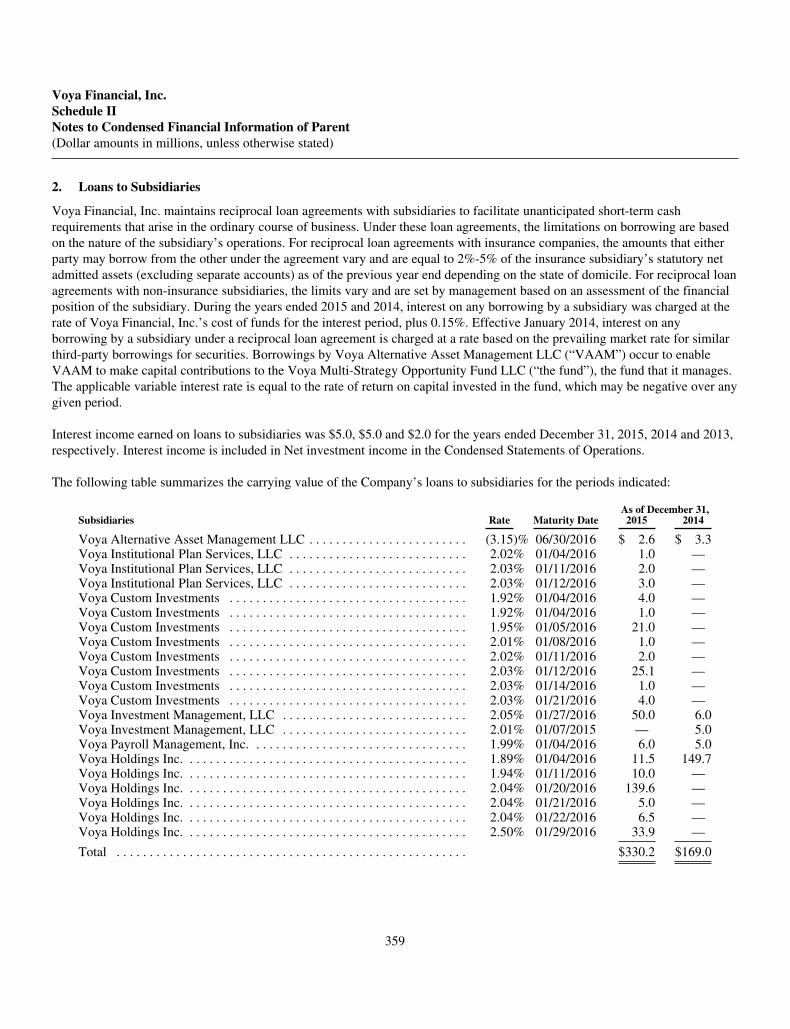
Voya Financial, Inc.Schedule IINotes to Condensed Financial Information of Parent(Dollar amounts in millions, unless otherwise stated)
2. Loans to Subsidiaries
Voya Financial, Inc. maintains reciprocal loan agreements with subsidiaries to facilitate unanticipated short-term cashrequirements that arise in the ordinary course of business. Under these loan agreements, the limitations on borrowing are basedon the nature of the subsidiary’s operations. For reciprocal loan agreements with insurance companies, the amounts that eitherparty may borrow from the other under the agreement vary and are equal to 2%-5% of the insurance subsidiary’s statutory netadmitted assets (excluding separate accounts) as of the previous year end depending on the state of domicile. For reciprocal loanagreements with non-insurance subsidiaries, the limits vary and are set by management based on an assessment of the financialposition of the subsidiary. During the years ended 2015 and 2014, interest on any borrowing by a subsidiary was charged at therate of Voya Financial, Inc.’s cost of funds for the interest period, plus 0.15%. Effective January 2014, interest on anyborrowing by a subsidiary under a reciprocal loan agreement is charged at a rate based on the prevailing market rate for similarthird-party borrowings for securities. Borrowings by Voya Alternative Asset Management LLC (“VAAM”) occur to enableVAAM to make capital contributions to the Voya Multi-Strategy Opportunity Fund LLC (“the fund”), the fund that it manages.The applicable variable interest rate is equal to the rate of return on capital invested in the fund, which may be negative over anygiven period.
Interest income earned on loans to subsidiaries was $5.0, $5.0 and $2.0 for the years ended December 31, 2015, 2014 and 2013,respectively. Interest income is included in Net investment income in the Condensed Statements of Operations.
The following table summarizes the carrying value of the Company’s loans to subsidiaries for the periods indicated:
As of December 31,Subsidiaries Rate Maturity Date 2015 2014
Voya Alternative Asset Management LLC . . . . . . . . . . . . . . . . . . . . . . . . (3.15)% 06/30/2016 $ 2.6 $ 3.3Voya Institutional Plan Services, LLC . . . . . . . . . . . . . . . . . . . . . . . . . . . 2.02% 01/04/2016 1.0 —Voya Institutional Plan Services, LLC . . . . . . . . . . . . . . . . . . . . . . . . . . . 2.03% 01/11/2016 2.0 —Voya Institutional Plan Services, LLC . . . . . . . . . . . . . . . . . . . . . . . . . . . 2.03% 01/12/2016 3.0 —Voya Custom Investments . . . . . . . . . . . . . . . . . . . . . . . . . . . . . . . . . . . . 1.92% 01/04/2016 4.0 —Voya Custom Investments . . . . . . . . . . . . . . . . . . . . . . . . . . . . . . . . . . . . 1.92% 01/04/2016 1.0 —Voya Custom Investments . . . . . . . . . . . . . . . . . . . . . . . . . . . . . . . . . . . . 1.95% 01/05/2016 21.0 —Voya Custom Investments . . . . . . . . . . . . . . . . . . . . . . . . . . . . . . . . . . . . 2.01% 01/08/2016 1.0 —Voya Custom Investments . . . . . . . . . . . . . . . . . . . . . . . . . . . . . . . . . . . . 2.02% 01/11/2016 2.0 —Voya Custom Investments . . . . . . . . . . . . . . . . . . . . . . . . . . . . . . . . . . . . 2.03% 01/12/2016 25.1 —Voya Custom Investments . . . . . . . . . . . . . . . . . . . . . . . . . . . . . . . . . . . . 2.03% 01/14/2016 1.0 —Voya Custom Investments . . . . . . . . . . . . . . . . . . . . . . . . . . . . . . . . . . . . 2.03% 01/21/2016 4.0 —Voya Investment Management, LLC . . . . . . . . . . . . . . . . . . . . . . . . . . . . 2.05% 01/27/2016 50.0 6.0Voya Investment Management, LLC . . . . . . . . . . . . . . . . . . . . . . . . . . . . 2.01% 01/07/2015 — 5.0Voya Payroll Management, Inc. . . . . . . . . . . . . . . . . . . . . . . . . . . . . . . . . 1.99% 01/04/2016 6.0 5.0Voya Holdings Inc. . . . . . . . . . . . . . . . . . . . . . . . . . . . . . . . . . . . . . . . . . . 1.89% 01/04/2016 11.5 149.7Voya Holdings Inc. . . . . . . . . . . . . . . . . . . . . . . . . . . . . . . . . . . . . . . . . . . 1.94% 01/11/2016 10.0 —Voya Holdings Inc. . . . . . . . . . . . . . . . . . . . . . . . . . . . . . . . . . . . . . . . . . . 2.04% 01/20/2016 139.6 —Voya Holdings Inc. . . . . . . . . . . . . . . . . . . . . . . . . . . . . . . . . . . . . . . . . . . 2.04% 01/21/2016 5.0 —Voya Holdings Inc. . . . . . . . . . . . . . . . . . . . . . . . . . . . . . . . . . . . . . . . . . . 2.04% 01/22/2016 6.5 —Voya Holdings Inc. . . . . . . . . . . . . . . . . . . . . . . . . . . . . . . . . . . . . . . . . . . 2.50% 01/29/2016 33.9 —
Total . . . . . . . . . . . . . . . . . . . . . . . . . . . . . . . . . . . . . . . . . . . . . . . . . . . . . $330.2 $169.0
359
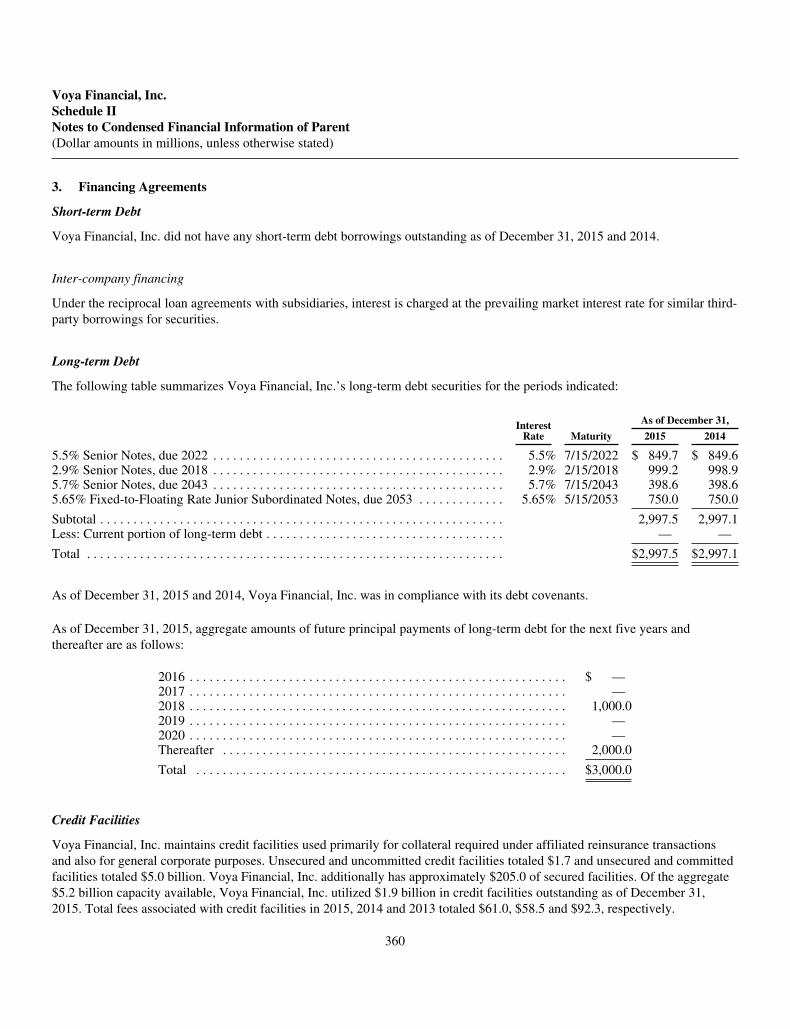
Voya Financial, Inc.Schedule IINotes to Condensed Financial Information of Parent(Dollar amounts in millions, unless otherwise stated)
3. Financing Agreements
Short-term Debt
Voya Financial, Inc. did not have any short-term debt borrowings outstanding as of December 31, 2015 and 2014.
Inter-company financing
Under the reciprocal loan agreements with subsidiaries, interest is charged at the prevailing market interest rate for similar third-party borrowings for securities.
Long-term Debt
The following table summarizes Voya Financial, Inc.’s long-term debt securities for the periods indicated:
InterestRate Maturity
As of December 31,
2015 2014
5.5% Senior Notes, due 2022 . . . . . . . . . . . . . . . . . . . . . . . . . . . . . . . . . . . . . . . . . . . . 5.5% 7/15/2022 $ 849.7 $ 849.62.9% Senior Notes, due 2018 . . . . . . . . . . . . . . . . . . . . . . . . . . . . . . . . . . . . . . . . . . . . 2.9% 2/15/2018 999.2 998.95.7% Senior Notes, due 2043 . . . . . . . . . . . . . . . . . . . . . . . . . . . . . . . . . . . . . . . . . . . . 5.7% 7/15/2043 398.6 398.65.65% Fixed-to-Floating Rate Junior Subordinated Notes, due 2053 . . . . . . . . . . . . . 5.65% 5/15/2053 750.0 750.0
Subtotal . . . . . . . . . . . . . . . . . . . . . . . . . . . . . . . . . . . . . . . . . . . . . . . . . . . . . . . . . . . . . 2,997.5 2,997.1Less: Current portion of long-term debt . . . . . . . . . . . . . . . . . . . . . . . . . . . . . . . . . . . . — —
Total . . . . . . . . . . . . . . . . . . . . . . . . . . . . . . . . . . . . . . . . . . . . . . . . . . . . . . . . . . . . . . . $2,997.5 $2,997.1
As of December 31, 2015 and 2014, Voya Financial, Inc. was in compliance with its debt covenants.
As of December 31, 2015, aggregate amounts of future principal payments of long-term debt for the next five years andthereafter are as follows:
2016 . . . . . . . . . . . . . . . . . . . . . . . . . . . . . . . . . . . . . . . . . . . . . . . . . . . . . . . . . $ —2017 . . . . . . . . . . . . . . . . . . . . . . . . . . . . . . . . . . . . . . . . . . . . . . . . . . . . . . . . . —2018 . . . . . . . . . . . . . . . . . . . . . . . . . . . . . . . . . . . . . . . . . . . . . . . . . . . . . . . . . 1,000.02019 . . . . . . . . . . . . . . . . . . . . . . . . . . . . . . . . . . . . . . . . . . . . . . . . . . . . . . . . . —2020 . . . . . . . . . . . . . . . . . . . . . . . . . . . . . . . . . . . . . . . . . . . . . . . . . . . . . . . . . —Thereafter . . . . . . . . . . . . . . . . . . . . . . . . . . . . . . . . . . . . . . . . . . . . . . . . . . . . 2,000.0
Total . . . . . . . . . . . . . . . . . . . . . . . . . . . . . . . . . . . . . . . . . . . . . . . . . . . . . . . . $3,000.0
Credit Facilities
Voya Financial, Inc. maintains credit facilities used primarily for collateral required under affiliated reinsurance transactionsand also for general corporate purposes. Unsecured and uncommitted credit facilities totaled $1.7 and unsecured and committedfacilities totaled $5.0 billion. Voya Financial, Inc. additionally has approximately $205.0 of secured facilities. Of the aggregate$5.2 billion capacity available, Voya Financial, Inc. utilized $1.9 billion in credit facilities outstanding as of December 31,2015. Total fees associated with credit facilities in 2015, 2014 and 2013 totaled $61.0, $58.5 and $92.3, respectively.
360
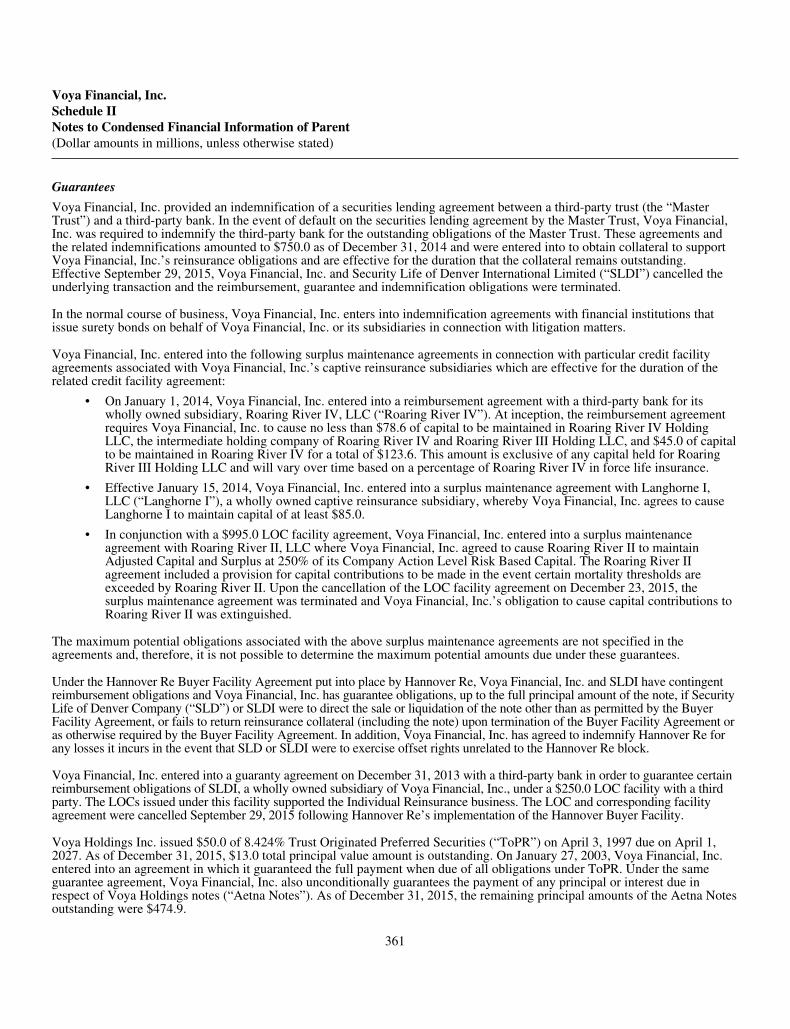
Voya Financial, Inc.Schedule IINotes to Condensed Financial Information of Parent(Dollar amounts in millions, unless otherwise stated)
Guarantees
Voya Financial, Inc. provided an indemnification of a securities lending agreement between a third-party trust (the “MasterTrust”) and a third-party bank. In the event of default on the securities lending agreement by the Master Trust, Voya Financial,Inc. was required to indemnify the third-party bank for the outstanding obligations of the Master Trust. These agreements andthe related indemnifications amounted to $750.0 as of December 31, 2014 and were entered into to obtain collateral to supportVoya Financial, Inc.’s reinsurance obligations and are effective for the duration that the collateral remains outstanding.Effective September 29, 2015, Voya Financial, Inc. and Security Life of Denver International Limited (“SLDI”) cancelled theunderlying transaction and the reimbursement, guarantee and indemnification obligations were terminated.
In the normal course of business, Voya Financial, Inc. enters into indemnification agreements with financial institutions thatissue surety bonds on behalf of Voya Financial, Inc. or its subsidiaries in connection with litigation matters.
Voya Financial, Inc. entered into the following surplus maintenance agreements in connection with particular credit facilityagreements associated with Voya Financial, Inc.’s captive reinsurance subsidiaries which are effective for the duration of therelated credit facility agreement:
• On January 1, 2014, Voya Financial, Inc. entered into a reimbursement agreement with a third-party bank for itswholly owned subsidiary, Roaring River IV, LLC (“Roaring River IV”). At inception, the reimbursement agreementrequires Voya Financial, Inc. to cause no less than $78.6 of capital to be maintained in Roaring River IV HoldingLLC, the intermediate holding company of Roaring River IV and Roaring River III Holding LLC, and $45.0 of capitalto be maintained in Roaring River IV for a total of $123.6. This amount is exclusive of any capital held for RoaringRiver III Holding LLC and will vary over time based on a percentage of Roaring River IV in force life insurance.
• Effective January 15, 2014, Voya Financial, Inc. entered into a surplus maintenance agreement with Langhorne I,LLC (“Langhorne I”), a wholly owned captive reinsurance subsidiary, whereby Voya Financial, Inc. agrees to causeLanghorne I to maintain capital of at least $85.0.
• In conjunction with a $995.0 LOC facility agreement, Voya Financial, Inc. entered into a surplus maintenanceagreement with Roaring River II, LLC where Voya Financial, Inc. agreed to cause Roaring River II to maintainAdjusted Capital and Surplus at 250% of its Company Action Level Risk Based Capital. The Roaring River IIagreement included a provision for capital contributions to be made in the event certain mortality thresholds areexceeded by Roaring River II. Upon the cancellation of the LOC facility agreement on December 23, 2015, thesurplus maintenance agreement was terminated and Voya Financial, Inc.’s obligation to cause capital contributions toRoaring River II was extinguished.
The maximum potential obligations associated with the above surplus maintenance agreements are not specified in theagreements and, therefore, it is not possible to determine the maximum potential amounts due under these guarantees.
Under the Hannover Re Buyer Facility Agreement put into place by Hannover Re, Voya Financial, Inc. and SLDI have contingentreimbursement obligations and Voya Financial, Inc. has guarantee obligations, up to the full principal amount of the note, if SecurityLife of Denver Company (“SLD”) or SLDI were to direct the sale or liquidation of the note other than as permitted by the BuyerFacility Agreement, or fails to return reinsurance collateral (including the note) upon termination of the Buyer Facility Agreement oras otherwise required by the Buyer Facility Agreement. In addition, Voya Financial, Inc. has agreed to indemnify Hannover Re forany losses it incurs in the event that SLD or SLDI were to exercise offset rights unrelated to the Hannover Re block.
Voya Financial, Inc. entered into a guaranty agreement on December 31, 2013 with a third-party bank in order to guarantee certainreimbursement obligations of SLDI, a wholly owned subsidiary of Voya Financial, Inc., under a $250.0 LOC facility with a thirdparty. The LOCs issued under this facility supported the Individual Reinsurance business. The LOC and corresponding facilityagreement were cancelled September 29, 2015 following Hannover Re’s implementation of the Hannover Buyer Facility.
Voya Holdings Inc. issued $50.0 of 8.424% Trust Originated Preferred Securities (“ToPR”) on April 3, 1997 due on April 1,2027. As of December 31, 2015, $13.0 total principal value amount is outstanding. On January 27, 2003, Voya Financial, Inc.entered into an agreement in which it guaranteed the full payment when due of all obligations under ToPR. Under the sameguarantee agreement, Voya Financial, Inc. also unconditionally guarantees the payment of any principal or interest due inrespect of Voya Holdings notes (“Aetna Notes”). As of December 31, 2015, the remaining principal amounts of the Aetna Notesoutstanding were $474.9.
361

Voya Financial, Inc.Schedule IINotes to Condensed Financial Information of Parent(Dollar amounts in millions, unless otherwise stated)
Voya Financial, Inc. has also entered into a Corporate Guarantee Agreement with a third-party ceding insurer where VoyaFinancial, Inc. guarantees the reinsurance obligations of one of its subsidiary, SLD, assumed under a reinsurance agreementwith the third-party cedent. The maximum potential obligation is not specified or applicable. Since these obligations are notsubject to limitations, it is not possible to determine the maximum potential amount due under these guarantees.
Roaring River, LLC (“Roaring River”) is party to a LOC facility agreement with a third-party bank that provides up to $425.0 ofLOC capacity. Roaring River has reimbursement obligations to the bank under this agreement, in an aggregate amount of up to$425.0, which obligations are guaranteed by Voya Financial, Inc. This agreement and the related guarantee were entered into tofacilitate collateral requirements supporting reinsurance and are effective for the duration.
There were no assets or liabilities recognized by Voya Financial, Inc. as of December 31, 2015 and 2014 in relation to theseintercompany indemnifications and support agreements. As of December 31, 2015 and 2014, no circumstances existed in whichVoya Financial, Inc. was required to currently perform under these indemnifications and support agreements.
4. Returns of Capital and Dividends
Voya Financial, Inc. received returns of capital and dividends from the following subsidiaries for the periods indicated:
Years Ended December 31,
2015 2014 2013
Voya Holdings Inc. . . . . . . . . . . . . . . . . . . . . . . . . . . . . . . . . . . . . . . . . . . $1,467.5 $795.0 $ 987.0Security Life of Denver Insurance Company . . . . . . . . . . . . . . . . . . . . . . . 241.0 32.0 447.0Voya Financial Products Company, Inc. . . . . . . . . . . . . . . . . . . . . . . . . . . — 75.0 —
Total . . . . . . . . . . . . . . . . . . . . . . . . . . . . . . . . . . . . . . . . . . . . . . . . . . . . . . $1,708.5 $902.0 $1,434.0
5. Income Taxes
As of December 31, 2015 and 2014, Voya Financial, Inc. held deferred tax assets related to loss and credit carryforwards, someof which have not been realized by its subsidiaries but have been reimbursed to the subsidiaries by Voya Financial, Inc.pursuant to the intercompany tax sharing agreement. The total deferred tax assets were primarily comprised of federal netoperating loss, state net operating loss and credit carryforwards.
Valuation allowances have been applied to these deferred tax assets as of December 31, 2015 and 2014. Character, amount andestimated expiration date of the carryforwards and the related allowances are disclosed in the Income Taxes Note to theseConsolidated Financial Statements.
As of December 31, 2015 and 2014, Voya Financial, Inc. has recognized deferred tax assets of $404.4 and $398.2, respectively,primarily related to federal net operating loss carryforwards and AMT credit carryforwards.
Tax Sharing Agreement
Voya Financial, Inc. has entered into a federal tax sharing agreement with members of an affiliated group as defined inSection 1504 of the Internal Revenue Code of 1986, as amended. The agreement provides for the manner of calculation and theamounts/timing of the payments between the parties as well as other related matters in connection with the filing of consolidatedfederal income tax returns. The federal tax sharing agreement provides that Voya Financial, Inc. will pay its subsidiaries for thetax benefits of ordinary and capital losses only in the event that the consolidated tax group actually uses the tax benefit of lossesgenerated.
Voya Financial, Inc. has also entered into a state tax sharing agreement with each of the specific subsidiaries that are parties tothe agreement. The state tax agreement applies to situations in which Voya Financial, Inc. and all or some of the subsidiariesjoin in the filing of a state or local franchise, income tax, or other tax return on a consolidated, combined or unitary basis.
362
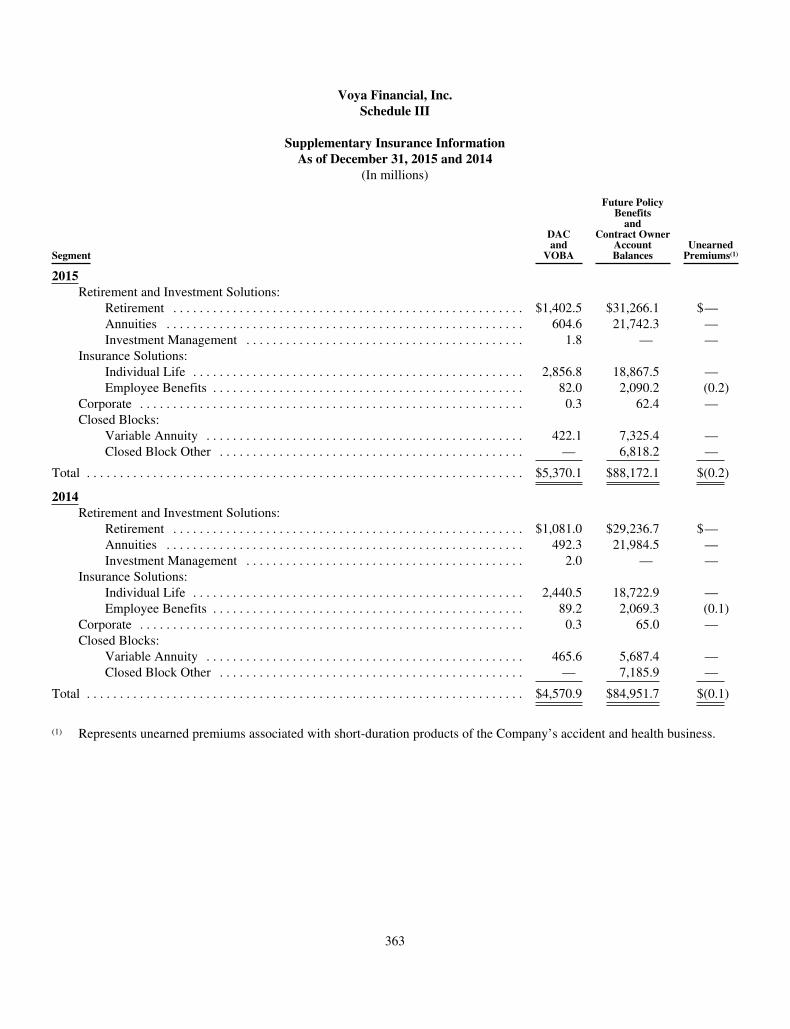
Voya Financial, Inc.Schedule III
Supplementary Insurance InformationAs of December 31, 2015 and 2014
(In millions)
Segment
DACand
VOBA
Future PolicyBenefits
andContract Owner
AccountBalances
UnearnedPremiums(1)
2015Retirement and Investment Solutions:
Retirement . . . . . . . . . . . . . . . . . . . . . . . . . . . . . . . . . . . . . . . . . . . . . . . . . . . . . $1,402.5 $31,266.1 $—Annuities . . . . . . . . . . . . . . . . . . . . . . . . . . . . . . . . . . . . . . . . . . . . . . . . . . . . . . 604.6 21,742.3 —Investment Management . . . . . . . . . . . . . . . . . . . . . . . . . . . . . . . . . . . . . . . . . . 1.8 — —
Insurance Solutions:Individual Life . . . . . . . . . . . . . . . . . . . . . . . . . . . . . . . . . . . . . . . . . . . . . . . . . . 2,856.8 18,867.5 —Employee Benefits . . . . . . . . . . . . . . . . . . . . . . . . . . . . . . . . . . . . . . . . . . . . . . . 82.0 2,090.2 (0.2)
Corporate . . . . . . . . . . . . . . . . . . . . . . . . . . . . . . . . . . . . . . . . . . . . . . . . . . . . . . . . . . 0.3 62.4 —Closed Blocks:
Variable Annuity . . . . . . . . . . . . . . . . . . . . . . . . . . . . . . . . . . . . . . . . . . . . . . . . 422.1 7,325.4 —Closed Block Other . . . . . . . . . . . . . . . . . . . . . . . . . . . . . . . . . . . . . . . . . . . . . . — 6,818.2 —
Total . . . . . . . . . . . . . . . . . . . . . . . . . . . . . . . . . . . . . . . . . . . . . . . . . . . . . . . . . . . . . . . . . . $5,370.1 $88,172.1 $(0.2)
2014Retirement and Investment Solutions:
Retirement . . . . . . . . . . . . . . . . . . . . . . . . . . . . . . . . . . . . . . . . . . . . . . . . . . . . . $1,081.0 $29,236.7 $—Annuities . . . . . . . . . . . . . . . . . . . . . . . . . . . . . . . . . . . . . . . . . . . . . . . . . . . . . . 492.3 21,984.5 —Investment Management . . . . . . . . . . . . . . . . . . . . . . . . . . . . . . . . . . . . . . . . . . 2.0 — —
Insurance Solutions:Individual Life . . . . . . . . . . . . . . . . . . . . . . . . . . . . . . . . . . . . . . . . . . . . . . . . . . 2,440.5 18,722.9 —Employee Benefits . . . . . . . . . . . . . . . . . . . . . . . . . . . . . . . . . . . . . . . . . . . . . . . 89.2 2,069.3 (0.1)
Corporate . . . . . . . . . . . . . . . . . . . . . . . . . . . . . . . . . . . . . . . . . . . . . . . . . . . . . . . . . . 0.3 65.0 —Closed Blocks:
Variable Annuity . . . . . . . . . . . . . . . . . . . . . . . . . . . . . . . . . . . . . . . . . . . . . . . . 465.6 5,687.4 —Closed Block Other . . . . . . . . . . . . . . . . . . . . . . . . . . . . . . . . . . . . . . . . . . . . . . — 7,185.9 —
Total . . . . . . . . . . . . . . . . . . . . . . . . . . . . . . . . . . . . . . . . . . . . . . . . . . . . . . . . . . . . . . . . . . $4,570.9 $84,951.7 $(0.1)
(1) Represents unearned premiums associated with short-duration products of the Company’s accident and health business.
363
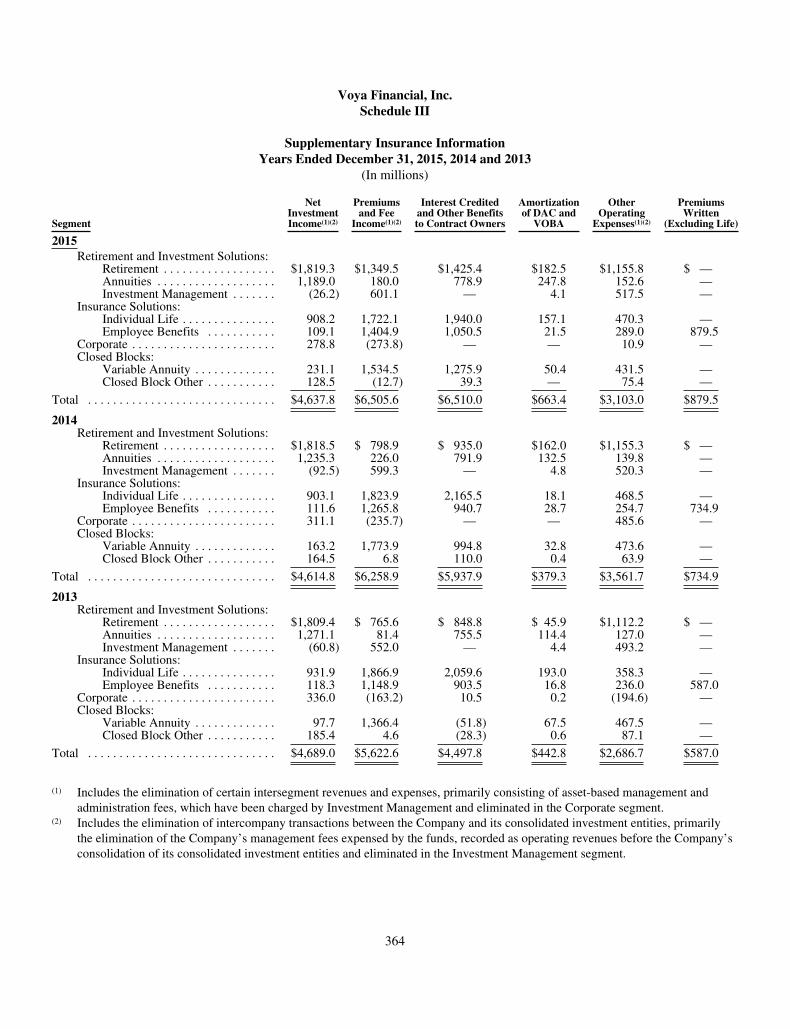
Voya Financial, Inc.Schedule III
Supplementary Insurance InformationYears Ended December 31, 2015, 2014 and 2013
(In millions)
Segment
NetInvestmentIncome(1)(2)
Premiumsand Fee
Income(1)(2)
Interest Creditedand Other Benefitsto Contract Owners
Amortizationof DAC and
VOBA
OtherOperating
Expenses(1)(2)
PremiumsWritten
(Excluding Life)
2015Retirement and Investment Solutions:
Retirement . . . . . . . . . . . . . . . . . . $1,819.3 $1,349.5 $1,425.4 $182.5 $1,155.8 $ —Annuities . . . . . . . . . . . . . . . . . . . 1,189.0 180.0 778.9 247.8 152.6 —Investment Management . . . . . . . (26.2) 601.1 — 4.1 517.5 —
Insurance Solutions:Individual Life . . . . . . . . . . . . . . . 908.2 1,722.1 1,940.0 157.1 470.3 —Employee Benefits . . . . . . . . . . . 109.1 1,404.9 1,050.5 21.5 289.0 879.5
Corporate . . . . . . . . . . . . . . . . . . . . . . . 278.8 (273.8) — — 10.9 —Closed Blocks:
Variable Annuity . . . . . . . . . . . . . 231.1 1,534.5 1,275.9 50.4 431.5 —Closed Block Other . . . . . . . . . . . 128.5 (12.7) 39.3 — 75.4 —
Total . . . . . . . . . . . . . . . . . . . . . . . . . . . . . . $4,637.8 $6,505.6 $6,510.0 $663.4 $3,103.0 $879.5
2014Retirement and Investment Solutions:
Retirement . . . . . . . . . . . . . . . . . . $1,818.5 $ 798.9 $ 935.0 $162.0 $1,155.3 $ —Annuities . . . . . . . . . . . . . . . . . . . 1,235.3 226.0 791.9 132.5 139.8 —Investment Management . . . . . . . (92.5) 599.3 — 4.8 520.3 —
Insurance Solutions:Individual Life . . . . . . . . . . . . . . . 903.1 1,823.9 2,165.5 18.1 468.5 —Employee Benefits . . . . . . . . . . . 111.6 1,265.8 940.7 28.7 254.7 734.9
Corporate . . . . . . . . . . . . . . . . . . . . . . . 311.1 (235.7) — — 485.6 —Closed Blocks:
Variable Annuity . . . . . . . . . . . . . 163.2 1,773.9 994.8 32.8 473.6 —Closed Block Other . . . . . . . . . . . 164.5 6.8 110.0 0.4 63.9 —
Total . . . . . . . . . . . . . . . . . . . . . . . . . . . . . . $4,614.8 $6,258.9 $5,937.9 $379.3 $3,561.7 $734.9
2013Retirement and Investment Solutions:
Retirement . . . . . . . . . . . . . . . . . . $1,809.4 $ 765.6 $ 848.8 $ 45.9 $1,112.2 $ —Annuities . . . . . . . . . . . . . . . . . . . 1,271.1 81.4 755.5 114.4 127.0 —Investment Management . . . . . . . (60.8) 552.0 — 4.4 493.2 —
Insurance Solutions:Individual Life . . . . . . . . . . . . . . . 931.9 1,866.9 2,059.6 193.0 358.3 —Employee Benefits . . . . . . . . . . . 118.3 1,148.9 903.5 16.8 236.0 587.0
Corporate . . . . . . . . . . . . . . . . . . . . . . . 336.0 (163.2) 10.5 0.2 (194.6) —Closed Blocks:
Variable Annuity . . . . . . . . . . . . . 97.7 1,366.4 (51.8) 67.5 467.5 —Closed Block Other . . . . . . . . . . . 185.4 4.6 (28.3) 0.6 87.1 —
Total . . . . . . . . . . . . . . . . . . . . . . . . . . . . . . $4,689.0 $5,622.6 $4,497.8 $442.8 $2,686.7 $587.0
(1) Includes the elimination of certain intersegment revenues and expenses, primarily consisting of asset-based management andadministration fees, which have been charged by Investment Management and eliminated in the Corporate segment.
(2) Includes the elimination of intercompany transactions between the Company and its consolidated investment entities, primarilythe elimination of the Company’s management fees expensed by the funds, recorded as operating revenues before the Company’sconsolidation of its consolidated investment entities and eliminated in the Investment Management segment.
364

Voya Financial, Inc.Schedule IVReinsurance
Years Ended December 31, 2015, 2014 and 2013(In millions)
Gross Ceded Assumed Net
Percentageof Assumed
to Net
2015Life insurance in force . . . . . . . . . . . . . . . . . . . . . . . . . . . . . . . $799,341.4 $642,889.8 $340,241.3 $496,692.9 68.5%
Premiums:Life insurance . . . . . . . . . . . . . . . . . . . . . . . . . . . . . . . . . $ 1,351.7 $ 1,475.6 $ 1,189.2 $ 1,065.3 111.6%Accident and health insurance . . . . . . . . . . . . . . . . . . . . . 947.9 136.3 1.6 813.2 0.2%Annuities . . . . . . . . . . . . . . . . . . . . . . . . . . . . . . . . . . . . . 1,145.9 — 0.1 1,146.0 — %
Total premiums . . . . . . . . . . . . . . . . . . . . . . . . . . . . . . . . . . . . $ 3,445.5 $ 1,611.9 $ 1,190.9 $ 3,024.5 39.4%
2014Life insurance in force . . . . . . . . . . . . . . . . . . . . . . . . . . . . . . . $801,371.3 $599,504.5 $363,894.1 $565,760.9 64.3%
Premiums:Life insurance . . . . . . . . . . . . . . . . . . . . . . . . . . . . . . . . . $ 1,358.9 $ 1,394.2 $ 1,234.4 $ 1,199.1 102.9%Accident and health insurance . . . . . . . . . . . . . . . . . . . . . 814.2 108.7 3.8 709.3 0.5%Annuities . . . . . . . . . . . . . . . . . . . . . . . . . . . . . . . . . . . . . 717.9 — 0.1 718.0 — %
Total premiums . . . . . . . . . . . . . . . . . . . . . . . . . . . . . . . . . . . . $ 2,891.0 $ 1,502.9 $ 1,238.3 $ 2,626.4 47.1%
2013Life insurance in force . . . . . . . . . . . . . . . . . . . . . . . . . . . . . . . $811,134.1 $541,044.0 $393,712.4 $663,802.5 59.3%
Premiums:Life insurance . . . . . . . . . . . . . . . . . . . . . . . . . . . . . . . . . $ 1,387.7 $ 1,360.4 $ 1,228.5 $ 1,255.8 97.8%Accident and health insurance . . . . . . . . . . . . . . . . . . . . . 675.1 100.4 4.4 579.1 0.8%Annuities . . . . . . . . . . . . . . . . . . . . . . . . . . . . . . . . . . . . . 121.3 — 0.1 121.4 0.1%
Total premiums . . . . . . . . . . . . . . . . . . . . . . . . . . . . . . . . . . . . $ 2,184.1 $ 1,460.8 $ 1,233.0 $ 1,956.3 63.0%
365

Voya Financial, Inc.Schedule V
Valuation and Qualifying AccountsYears Ended December 31, 2015, 2014 and 2013
(In millions)
Balance atJanuary 1,
Charged toCosts andExpenses
Write-offs/Payments/
OtherBalance at
December 31,
2015Valuation allowance on deferred tax assets . . . . . . . . . . . . . . . . . . . . . . . . . . . . . $ 971.9 $ (13.7) $ 4.9(2) $ 963.12014Valuation allowance on deferred tax assets . . . . . . . . . . . . . . . . . . . . . . . . . . . . . $2,806.8 $(1,834.9) $ — $ 971.92013Valuation allowance on deferred tax assets . . . . . . . . . . . . . . . . . . . . . . . . . . . . . $2,958.3 $ (85.9) $(65.6)(1) $2,806.8
(1) This amount represents valuation allowances allocated to Other comprehensive income directly related to the appreciationof the Company’s available-for-sale portfolio, and not pertaining to expectations of taxable income in future years.
(2) This amount represents valuation allowances allocated to Additional paid-in capital.
366
Item 9. Changes in and Disagreements with Accountants on Accounting and Financial Disclosure
None
Item 9A. Controls and Procedures
Evaluation of Disclosure Controls and Procedures
The Company carried out an evaluation, under the supervision and with the participation of its management, including its ChiefExecutive Officer and Chief Financial Officer, of the effectiveness of the design and operation of the Company’s disclosurecontrols and procedures (as defined in Rule 13a-15(e) and 15d-15(e) of the Securities Exchange Act of 1934, as amended(“Exchange Act”)) as of the end of the period covered by this report. Based on that evaluation, the Chief Executive Officer andthe Chief Financial Officer have concluded that the Company’s current disclosure controls and procedures are effective inensuring that material information relating to the Company required to be disclosed in the Company’s periodic filings with theU.S. Securities and Exchange Commission (“SEC”) is made known to them in a timely manner.
Management’s Annual Report on Internal Control Over Financial Reporting
Management of Voya Financial, Inc. and subsidiaries is responsible for establishing and maintaining adequate internal controlover financial reporting (as defined in Rules 13a-15(f) and 15d-15(f) under the Exchange Act) for the Company. TheCompany’s internal control over financial reporting is designed to provide reasonable assurance regarding the reliability offinancial reporting and the preparation of the financial statements of the Company in accordance with U.S. generally acceptedaccounting principles. The Company’s internal control over financial reporting includes those policies and procedures that:
• pertain to the maintenance of records that, in reasonable detail, accurately and fairly reflect the transactions anddispositions of the assets of the Company;
• provide reasonable assurance that transactions are recorded as necessary to permit preparation of financial statementsin accordance with U.S. generally accepted accounting principles and that receipts and expenditures are being madeonly in accordance with authorizations of the Company’s management and directors; and
• provide reasonable assurance regarding prevention or timely detection of unauthorized acquisition, use, or dispositionof assets that could have a material effect on the financial statements.
Because of its inherent limitations, internal control over financial reporting may not prevent or detect misstatements. Also,projections of any evaluation of effectiveness to future periods are subject to the risk that controls may become inadequatebecause of changes in conditions, or that the degree of compliance with the policies or procedures may deteriorate.
Management has assessed the effectiveness of the Company’s internal control over financial reporting as of December 31, 2015pertaining to financial reporting in accordance with the criteria established in Internal Control—Integrated Framework(2013) issued by the Committee of Sponsoring Organizations of the Treadway Commission.
In the opinion of management, Voya Financial, Inc. has maintained effective internal control over financial reporting as ofDecember 31, 2015.
Attestation Report of the Company’s Registered Public Accounting Firm
The Company’s independent registered public accounting firm, Ernst & Young LLP, has issued their attestation report onmanagement’s internal control over financial reporting which is set forth below.
Changes in Internal Control Over Financial Reporting
There were no changes to the Company’s internal control over financial reporting as defined in Exchange Act Rule 13a-15(f)during the quarter ended December 31, 2015 that have materially affected, or are reasonably likely to materially affect, theCompany’s internal control over financial reporting.
367
Report of Independent Registered Public Accounting Firm
The Board of Directors and ShareholdersVoya Financial, Inc.
We have audited Voya Financial, Inc.’s (the Company) internal control over financial reporting as of December 31, 2015, basedon criteria established in Internal Control-Integrated Framework issued by the Committee of Sponsoring Organizations of theTreadway Commission “(2013 framework)” (the COSO criteria). Voya Financial, Inc.’s management is responsible formaintaining effective internal control over financial reporting, and for its assessment of the effectiveness of internal control overfinancial reporting included in the accompanying Management’s Annual Report on Internal Control Over Financial Reporting.Our responsibility is to express an opinion on the Company’s internal control over financial reporting based on our audit.
We conducted our audit in accordance with the standards of the Public Company Accounting Oversight Board (United States).Those standards require that we plan and perform the audit to obtain reasonable assurance about whether effective internalcontrol over financial reporting was maintained in all material respects. Our audit included obtaining an understanding ofinternal control over financial reporting, assessing the risk that a material weakness exists, testing and evaluating the design andoperating effectiveness of internal control based on the assessed risk, and performing such other procedures as we considerednecessary in the circumstances. We believe that our audit provides a reasonable basis for our opinion.
A company’s internal control over financial reporting is a process designed to provide reasonable assurance regarding thereliability of financial reporting and the preparation of financial statements for external purposes in accordance with generallyaccepted accounting principles. A company’s internal control over financial reporting includes those policies and proceduresthat (1) pertain to the maintenance of records that, in reasonable detail, accurately and fairly reflect the transactions anddispositions of the assets of the company; (2) provide reasonable assurance that transactions are recorded as necessary to permitpreparation of financial statements in accordance with generally accepted accounting principles, and that receipts andexpenditures of the company are being made only in accordance with authorizations of management and directors of thecompany; and (3) provide reasonable assurance regarding prevention or timely detection of unauthorized acquisition, use, ordisposition of the company’s assets that could have a material effect on the financial statements.
Because of its inherent limitations, internal control over financial reporting may not prevent or detect misstatements. Also,projections of any evaluation of effectiveness to future periods are subject to the risk that controls may become inadequatebecause of changes in conditions, or that the degree of compliance with the policies or procedures may deteriorate.
In our opinion, Voya Financial, Inc. maintained, in all material respects, effective internal control over financial reporting as ofDecember 31, 2015, based on the COSO criteria.
We also have audited, in accordance with the standards of the Public Company Accounting Oversight Board (United States), theconsolidated balance sheets of Voya Financial, Inc. as of December 31, 2015 and 2014, and the related consolidated statementsof operations, comprehensive income, changes in shareholders’ equity and cash flows for each of the three years in the periodended December 31, 2015 and our report dated February 25, 2016 expressed an unqualified opinion thereon.
/s/ Ernst & Young LLP
Boston, MassachusettsFebruary 25, 2016
368
Item 9B. Other Information
Section 219 of the Iran Threat Reduction and Syria Human Rights Act of 2012, which was signed into law on August 10, 2012,added a new subsection (r) to Section 13 of the Exchange Act, which requires us to disclose whether the Company or any of itsaffiliates, including ING Groep N.V. (“ING Group” or “ING”) or its affiliates, has engaged during the year ended December 31,2015 in certain Iran-related activities, including any transaction or dealing with the Government of Iran that is not conductedpursuant to a specific authorization of the U.S. Government. For purposes of this disclosure, “affiliates” included ING Groupthrough March 9, 2015.
Neither Voya Financial, Inc. nor any of its subsidiaries, has knowingly engaged in any transaction or dealing reportable underSection 13(r) of the Exchange Act during the year ended December 31, 2015. The disclosure below relates solely to a limitedlegacy portfolio of guarantees, accounts, loans and relationships maintained by ING Bank N.V. (“ING Bank”), a subsidiary ofING Group and therefore an affiliate of Voya Financial, Inc. through March 9, 2015, and does not relate to any activitiesconducted by Voya Financial, Inc. or its subsidiaries, or involve the management of Voya Financial, Inc. or its subsidiaries andthe information below is based on information provided to the Company by ING Bank.
Other than the transactions described below, at no time during the period in which ING Group continued to be an affiliate ofVoya Financial, Inc. did ING Group or any of its affiliates knowingly conduct or engage in any activities that would requiredisclosure to the SEC pursuant to Section 13(r) of the Exchange Act. During the period that ING Group continued to be anaffiliate of Voya Financial, Inc., ING Bank maintained a limited legacy portfolio of guarantees, accounts, and loans thatinvolved various entities owned by the Government of Iran. ING Bank also had limited legacy relationships with certain personswho were designated under Executive Orders 13224 and 13382. These positions remained on the books, but accounts relatedthereto may be ‘frozen’ under applicable laws and procedures. In such cases, any interest or other payments ING Bank waslegally required to make in connection with said positions were made into ‘frozen’ accounts. Funds could only be withdrawn byrelevant parties from these ‘frozen’ accounts after due regulatory consent from the relevant competent authorities. ING Bankhad strict controls in place to ensure that no unauthorized account activity took place while the account was ‘frozen’. ING Bankmay receive loan repayments, but all legacy loan repayments received by ING Bank had been duly authorized by the relevantcompetent authorities. During the period of 2015 in which ING Group continued to be an affiliate of Voya Financial, Inc., INGBank had gross revenues of approximately $5.8 million related to these activities, which was principally related to legacy loanrepayments and commissions on guarantees. ING Bank estimates that it had net profit of approximately $31.5 thousand relatedto these activities. ING Bank has informed us that it intends to terminate each of the legacy positions as the nature thereof andapplicable law permits.
PART III
Item 10. Directors, Executive Officers, and Corporate Governance
The information required by this Item is omitted pursuant to General Instruction G to Form 10-K. Such information isincorporated by reference from the definitive Proxy Statement relating to the Company’s 2016 Annual Meeting of Shareholders,which will be filed with the SEC within 120 days after the end of the fiscal year covered by this Annual Report on Form 10-K.
Item 11. Executive Compensation
The information required by this Item is omitted pursuant to General Instruction G to Form 10-K. Such information isincorporated by reference from the definitive Proxy Statement relating to the Company’s 2016 Annual Meeting of Shareholders,which will be filed with the SEC within 120 days after the end of the fiscal year covered by this Annual Report on Form 10-K.
Item 12. Security Ownership of Certain Beneficial Owners and Management and Related Stockholder Matters
The following table provides information as of December 31, 2015, regarding securities authorized for issuance under ourequity compensation plans. All outstanding awards relate to our Common Stock. For additional information about our equitycompensation plans, see the Share-based Incentive Compensation Plans Note in our Consolidated Financial Statements inPart II, Item 8. of this Annual Report on Form 10-K.
369
(shares in millions) 2014 Omnibus Plan 2013 Omnibus Plan
Authorized for issuance . . . . . . . . . . . . . . . . . . . . . . . . . . . . . . . . . . . . . . . $17.8 $ 7.7Issued and reserved for issuance of outstanding:
RSUs . . . . . . . . . . . . . . . . . . . . . . . . . . . . . . . . . . . . . . . . . . . . . . . . . 1.3 3.2RSUs—Deal incentive awards . . . . . . . . . . . . . . . . . . . . . . . . . . . . . — 1.9PSU awards(1) . . . . . . . . . . . . . . . . . . . . . . . . . . . . . . . . . . . . . . . . . . . 0.8 2.3Stock options . . . . . . . . . . . . . . . . . . . . . . . . . . . . . . . . . . . . . . . . . . . 3.8 —
Shares available for issuance . . . . . . . . . . . . . . . . . . . . . . . . . . . . . . . . . . . $11.9 $ 0.3
(1) PSUs awarded under the Omnibus Plans entitle recipients to receive, upon vesting, a number of shares of common stockthat ranges from 0% to 150% of the number of PSUs awarded, depending on the level of achievement of the specifiedperformance conditions.
The information required by this Item is omitted pursuant to General Instruction G to Form 10-K. Such information is incorporatedby reference to the definitive Proxy Statement relating to the Company’s 2016 Annual Meeting of Shareholders, which will be filedwith the SEC within 120 days after the end of the fiscal year covered by this Annual Report on Form 10-K.
Item 13. Certain Relationships and Related Transactions, and Director Independence
The information required by this Item is omitted pursuant to General Instruction G to Form 10-K. Such information isincorporated by reference from the definitive Proxy Statement relating to the Company’s 2016 Annual Meeting of Shareholders,which will be filed with the SEC within 120 days after the end of the fiscal year covered by this Annual Report on Form 10-K.
Item 14. Principal Accounting Fees and Services
The information required by this Item is omitted pursuant to General Instruction G to Form 10-K. Such information is incorporatedby reference from the definitive Proxy Statement relating to the Company’s 2016 Annual Meeting of Shareholders, which will befiled with the SEC within 120 days after the end of the fiscal year covered by this Annual Report on Form 10-K.
Part IV
Item 15. Exhibits, Financial Statement Schedules
a. Documents filed as part of this report
1. Financial Statements (See Item 8. Financial Statements and Supplementary Data)
Consolidated Balance Sheets
Consolidated Statements of Operations
Consolidated Statements of Comprehensive Income
Consolidated Statements of Changes in Shareholders’ Equity
Consolidated Statements of Cash Flows
Notes to Consolidated Financial Statements
Independent Auditor’s Report
2. Schedule I—Summary of Investments Other than Investments in Affiliates
Schedule II—Condensed Financial Information of Parent
Schedule III—Supplementary Insurance Information
Schedule IV—Reinsurance
Schedule V—Valuation and Qualifying Accounts
All other provisions for which provision is made in the applicable accounting regulation of the Securities and ExchangeCommission are not required under the related instructions or are inapplicable and therefore have been omitted.
3. Exhibits
370

Voya Financial, Inc.
Exhibit Index
Exhibit No. Description of Exhibit
3.1 Amended and Restated Certificate of Incorporation of ING U.S., Inc. (incorporated by reference to Exhibit 3.2 tothe Company’s Amendment No. 4 to Registration Statement on Form S-1 (File No. 333-184847) filed onApril 16, 2013)
3.2 Amended and Restated By -Laws of ING U.S., Inc. (incorporated by reference to Exhibit 3.1 to the Company’sCurrent Report on Form 8-K (File No. 001-35897) filed on May 7, 2013)
3.3 Certificate of Ownership and Merger (incorporated by reference to Exhibit 3.1 to the Company’s Current Reporton Form 8-K (File No. 001-35897) filed on April 7, 2014)
4.1 Form of Common Stock Certificate (incorporated by reference to Exhibit 4.2 to Amendment No. 4 to theCompany’s Registration Statement on Form S-1 (File No. 333-184847), filed on April 16, 2013)
10.01 Registration Rights Agreement, dated as of May 7, 2013 between ING U.S., Inc. and ING Groep N.V.(incorporated by reference to Exhibit 10.4 to the Company’s Current Report on Form 8-K (File No. 001-35897)filed on May 7, 2013)
10.02 Warrant Agreement, dated as of May 7, 2013, among ING U.S., Inc., Computershare Inc. and ComputershareTrust Company, N.A. (incorporated by reference to Exhibit 99.1 to the Company’s Current Report on Form 8-K(File No. 001-35897) filed on May 7, 2013)
10.03 Warrant issued to ING Groep N.V, dated May 7, 2013 (incorporated by reference to Exhibit 99.2 to theCompany’s Current Report on Form 8-K (File No. 001-35897) filed on May 7, 2013)
10.04 Indenture, dated as of July 13, 2012, among ING U.S., Inc., Lion Connecticut Holdings Inc. and U.S. BankNational Association, as trustee (incorporated by reference to Exhibit 10.1 to the Company’s Amendment No. 1to Registration Statement on Form S-1 (File No. 333-184847) filed on January 23, 2013)
10.05 First Supplemental Indenture, dated as of July 13, 2012, among ING U.S., Inc., Lion Connecticut Holdings Inc.and U.S. Bank National Association, as trustee (incorporated by reference to Exhibit 10.2 to the Company’sAmendment No. 1 to Registration Statement on Form S-1 (File No. 333-184847) filed on January 23, 2013)
10.06 Second Supplemental Indenture, dated as of February 11, 2013, among ING U.S., Inc., Lion Connecticut HoldingsInc. and U.S. Bank National Association, as trustee (incorporated by reference to Exhibit 10.74 to the Company’sAmendment No. 2 to Registration Statement on Form S-1 (File No. 333-184847) filed on March 19, 2013)
10.07 Third Supplemental Indenture, dated as of July 26, 2013, among ING U.S., Inc., Lion Connecticut Holdings Inc.and U.S. Bank National Association, as trustee (incorporated by reference to Exhibit 10.01 to the Company’sCurrent Report on Form 8-K (File No. 001-35897) filed on July 26, 2013)
10.08 Junior Subordinated Indenture, dated as of May 16, 2013, among ING U.S., Inc., Lion Connecticut Holdings Inc.and U.S. Bank National Association, as trustee (incorporated by reference to Exhibit 10.15 to the Company’sQuarterly Report on Form 10-Q (File No. 001-35897) filed on May 23, 2013)
10.09 First Supplemental Indenture, dated as of May 16, 2013, among ING U.S., Inc., Lion Connecticut Holdings Inc.and U.S. Bank National Association, as trustee (incorporated by reference to Exhibit 10.16 to the Company’sQuarterly Report on Form 10-Q (File No. 001-35897) filed on May 23, 2013)
10.10 Indenture, dated as of August 1, 1993, between Aetna Life and Casualty Company and State Street Bank andTrust Company of Connecticut, National Association, as trustee (incorporated by reference to Exhibit 10.4 to theCompany’s Amendment No. 1 to Registration Statement on Form S-1 (File No. 333-184847) filed on January 23,2013)
10.11 First Indenture Supplement, dated as of August 1, 1996 between Aetna Services, Inc. (F/K/A Aetna Life andCasualty Company) and State Street Bank and Trust Company of Connecticut, National Association, as trustee(incorporated by reference to Exhibit 10.5 to the Company’s Amendment No. 1 to Registration Statement onForm S-1 (File No. 333-184847) filed on January 23, 2013)
10.12 Second Indenture Supplement, dated as of October 30, 2000, among Aetna Services, Inc. (F/K/A Aetna Life andCasualty Company), Aetna Inc. and State Street Bank and Trust Company of Connecticut, National Association,as trustee (incorporated by reference to Exhibit 10.6 to the Company’s Amendment No. 1 to RegistrationStatement on Form S-1 (File No. 333-184847) filed on January 23, 2013)
10.13 Third Indenture Supplement, dated as of December 13, 2000, among Aetna, Inc., ING Groep N.V. and StateStreet Bank and Trust Company of Connecticut, National Association, as trustee (incorporated by reference toExhibit 10.7 to the Company’s Amendment No. 1 to Registration Statement on Form S-1 (File No. 333-184847)filed on January 23, 2013)
371

Exhibit No. Description of Exhibit
10.14 Indenture, dated as of July 1, 1996, among Aetna Life and Casualty Company, Aetna, Inc. and State Street Bankand Trust Company of Connecticut, National Association, as trustee (incorporated by reference to Exhibit 10.8 tothe Company’s Amendment No. 1 to Registration Statement on Form S-1 (File No. 333-184847) filed onJanuary 23, 2013)
10.15 First Indenture Supplement dated as of October 30, 2000 among Aetna Services, Inc. (F/K/A Aetna Life andCasualty Company), Aetna Inc. and State Street Bank and Trust Company of Connecticut, National Association,as trustee (incorporated by reference to Exhibit 10.9 to the Company’s Amendment No. 1 to RegistrationStatement on Form S-1 (File No. 333-184847) filed on January 23, 2013)
10.16 Second Indenture Supplement dated as of December 13, 2000, between Lion Connecticut Holdings, Inc. (as successorto Aetna, Inc., Aetna Services, Inc. and Aetna Life and Casualty Company) and State Street Bank and Trust Companyof Connecticut, National Association, as trustee (incorporated by reference to Exhibit 10.10 to the Company’sAmendment No. 1 to Registration Statement on Form S-1 (File No. 333- 184847) filed on January 23, 2013)
10.17 Revolving Credit Agreement, dated as of April 20, 2012, among ING America Insurance Holdings, Inc., Bank ofAmerica, N.A. and the other parties thereto (incorporated by reference to Exhibit 10.11 to the Company’sAmendment No. 1 to Registration Statement on Form S-1 (File No. 333-184847) filed on January 23, 2013)
10.18 Term Loan Agreement, dated as of April 20, 2012, among Bank of America, N.A. and the other parties thereto(incorporated by reference to Exhibit 10.12 to the Company’s Amendment No. 1 to Registration Statement onForm S-1 (File No. 333-184847) filed on January 23, 2013)
10.19 Amended and Restated Revolving Credit Agreement dated as of February 14, 2014, among ING U.S., Inc., Bankof America, N.A. and the other parties thereto (incorporated by reference to Exhibit 10.1 to the Company’sCurrent Report on Form 8-K (File No. 001-35897) filed on February 21, 2014)
10.20 Credit Agreement, dated as of December 30, 2011, by and between Security Life of Denver InternationalLimited, ING Bank N.V., London Branch, as administrative agent, and the Issuing Banks described therein(incorporated by reference to Exhibit 10.13 to the Company’s Amendment No. 1 to Registration Statement onForm S-1 (File No. 333-184847) filed on January 23, 2013)
10.21 Master Transaction Agreement, dated as of May 1, 2006, by and between ING USA Annuity and Life InsuranceCompany and the Federal Home Loan Bank of Des Moines (incorporated by reference to Exhibit 10.14 to theCompany’s Amendment No. 1 to Registration Statement on Form S-1 (File No. 333-184847) filed on January 23, 2013)
10.22 Advances, Pledge and Security Agreement, dated as of March 27, 2009, by and between ING USA Annuity andLife Insurance Company and the Federal Home Loan Bank of Des Moines (incorporated by reference toExhibit 10.15 to the Company’s Amendment No. 1 to Registration Statement on Form S-1 (File No. 333-184847)filed on January 23, 2013)
10.23 Deposit Agreement, dated as of May 15, 2000 between the Federal Home Loan Bank of Topeka and SecurityLife of Denver Insurance Company (incorporated by reference to Exhibit 10.16 to the Company’s AmendmentNo. 1 to Registration Statement on Form S-1 (File No. 333-184847) filed on January 23, 2013)
10.24 Advance, Pledge and Security Agreement, dated as of August 30, 2004, by and between the Federal Home LoanBank of Topeka and Security Life of Denver Insurance Company (incorporated by reference to Exhibit 10.17 tothe Company’s Amendment No. 1 to Registration Statement on Form S-1 (File No. 333-184847) filed onJanuary 23, 2013)
10.25 Amended and Restated Institutional Custody Agreement, dated as of May 12, 2004, by and between Security Lifeof Denver Insurance Company and the Federal Home Loan Bank of Topeka (incorporated by reference toExhibit 10.18 to the Company’s Amendment No. 1 to Registration Statement on Form S-1 (File No. 333-184847)filed on January 23, 2013)
10.26 Master Asset Purchase Agreement, dated as of January 22, 2009, by and among Scottish Re Group Limited, ScottishHoldings, Inc., Scottish Re (U.S.), Inc., Scottish Re Life (Bermuda) Limited, Scottish Re (Dublin) Limited, HannoverLife Reassurance Company of America, Hannover Life Reassurance (Ireland) Limited, Security Life of DenverInsurance Company, Security Life of Denver International Limited (incorporated by reference to Exhibit 10.19 to theCompany’s Amendment No. 1 to Registration Statement on Form S-1 (File No. 333-184847) filed on January 23, 2013)
10.27 Reinsurance Agreement, effective as of January 1, 2009, between Security Life of Denver Insurance Company andHannover Life Reassurance Company of America (incorporated by reference to Exhibit 10.20 to the Company’sAmendment No. 1 to Registration Statement on Form S-1 (File No. 333-184847) filed on January 23, 2013)
10.28 Reinsurance Agreement, effective as of July 1, 2011, between Security Life of Denver International Limited andHannover Life Reassurance (Ireland) Limited (incorporated by reference to Exhibit 10.21 to the Company’sAmendment No. 1 to Registration Statement on Form S-1 (File No. 333-184847) filed on January 23, 2013)
372

Exhibit No. Description of Exhibit
10.29 Reinsurance Agreement, effective as of July 1, 2011, between Security Life of Denver International Limited andHannover Life Reassurance (Ireland) Limited (incorporated by reference to Exhibit 10.22 to the Company’sAmendment No. 1 to Registration Statement on Form S-1 (File No. 333-184847) filed on January 23, 2013)
10.30 Reinsurance Agreement, effective as of July 1, 2011, between Security Life of Denver International Limited andHannover Life Reassurance (Ireland) Limited (incorporated by reference to Exhibit 10.23 to the Company’sAmendment No. 1 to Registration Statement on Form S-1 (File No. 333-184847) filed on January 23, 2013)
10.31 Coinsurance Agreement, dated as of October 1, 1998, between Aetna Life Insurance and Annuity Company andThe Lincoln National Life Insurance Company (incorporated by reference to Exhibit 10.24 to the Company’sAmendment No. 1 to Registration Statement on Form S-1 (File No. 333-184847) filed on January 23, 2013)
10.32 Modified Coinsurance Agreement, dated as of October 1, 1998, between Aetna Life Insurance and Annuity Companyand The Lincoln National Life Insurance Company (incorporated by reference to Exhibit 10.25 to the Company’sAmendment No. 1 to Registration Statement on Form S-1 (File No. 333-184847) filed on January 23, 2013)
10.33 Coinsurance Agreement, dated as of October 1, 1998, between Aetna Life Insurance and Annuity Company andLincoln Life & Annuity Company of New York (incorporated by reference to Exhibit 10.26 to the Company’sAmendment No. 1 to Registration Statement on Form S-1 (File No. 333-184847) filed on January 23, 2013)
10.34 Amendment No. 1 to Coinsurance Agreement, effective March 1, 2007 between ING Life Insurance and AnnuityCompany (F/K/A Aetna Life Insurance and Annuity Company) and Lincoln Life & Annuity Company of NewYork (incorporated by reference to Exhibit 10.27 to the Company’s Amendment No. 1 to Registration Statementon Form S-1 (File No. 333-184847) filed on January 23, 2013)
10.35 Modified Coinsurance Agreement, dated as of October 1, 1998, between Aetna Life Insurance and Annuity Companyand Lincoln Life & Annuity Company of New York (incorporated by reference to Exhibit 10.28 to the Company’sAmendment No. 1 to Registration Statement on Form S-1 (File No. 333-184847) filed on January 23, 2013)
10.36 Master Services Agreement for Business Processes, dated as of June 5, 2012, between ING North AmericaInsurance Corporation and Cognizant Technology Solutions U.S. Corporation (incorporated by reference toExhibit 10.29 to the Company’s Amendment No. 1 to Registration Statement on Form S-1 (File No. 333-184847)filed on January 23, 2013)
10.37 Tax Sharing Agreement by and between ING America Insurance Holdings, Inc. and various subsidiaries withrespect to federal taxes (incorporated by reference to Exhibit 10.30 to the Company’s Amendment No. 2 toRegistration Statement on Form S-1 (File No. 333-184847) filed on March 19, 2013)
10.38 Tax Sharing Agreement by and between ING America Insurance Holdings, Inc. and various subsidiaries withrespect to state taxes (incorporated by reference to Exhibit 10.31 to the Company’s Amendment No. 1 toRegistration Statement on Form S-1 (File No. 333-184847) filed on January 23, 2013)
10.39 Shareholder Agreement, dated as of May 7, 2013, between ING U.S., Inc. and ING Groep N.V. (incorporated byreference to Exhibit 10.1 to the Company’s Current Report on Form 8-K (File No. 001-35897) filed on May 7, 2013)
10.40 Transitional Intellectual Property License Agreement, dated as of May 7, 2013, between ING U.S., Inc. and INGGroep N.V. (incorporated by reference to Exhibit 10.2 to the Company’s Current Report on Form 8-K (FileNo. 001-35897) filed on May 7, 2013)
10.41 Equity Administration Agreement between ING U.S., Inc. and ING Groep N.V. dated as of May 7, 2013(incorporated by reference to Exhibit 10.3 to the Company’s Current Report on Form 8-K (File No. 001-35897)filed on May 7, 2014)
10.42 Termination Agreement, dated May 3, 2013, between Security Life of Denver International Limited and INGBank N.V., London Branch (incorporated by reference to Exhibit 10.1 to the Company’s Current Report onForm 8-K (File No. 001-35897) filed on May 8, 2013)
10.43 Master Claim Agreement, dated April 17, 2012, between ING Groep N.V., ING America Insurance Holdings,Inc. and ING Insurance Eurasia N.V. (incorporated by reference to Exhibit 10.35 to the Company’s AmendmentNo. 1 to Registration Statement on Form S-1 (File No. 333- 184847) filed on January 23, 2013)
10.44 Form of Director Indemnification Agreement (incorporated by reference to Exhibit 10.37 to the Company’sAmendment No. 3 to Registration Statement on Form S-1 (File No. 333-184847) filed on April 5, 2013)
10.45+ Employment Agreement, dated December 11, 2014, of Rodney O. Martin, Jr. (incorporated by reference toExhibit 10.1 to the Company’s Current Report on Form 8-K (File No. 001-35897) filed on December 16, 2014)
10.46+ Offer Letter, dated July 5, 1994, between Jeffrey Becker and Aetna Life and Casualty (incorporated by referenceto Exhibit 10.39 to the Company’s Amendment No. 2 to Registration Statement on Form S-1 (File No. 333-184847) filed on March 19, 2013)
373

Exhibit No. Description of Exhibit
10.47+ Retention Award, dated March 30, 2010, between Jeffrey Becker and ING Investment Management HoldingsN.V. (incorporated by reference to Exhibit 10.40 to the Company’s Amendment No. 2 to Registration Statementon Form S-1 (File No. 333-184847) filed on March 19, 2013)
10.48+ Deal Incentive Award Agreement, dated July 2011, between Jeffrey Becker, ING Groep, N.V. and ING U.S., Inc.(f/k/a ING America Insurance Holdings, Inc.) (incorporated by reference to Exhibit 10.41 to the Company’sAmendment No. 2 to Registration Statement on Form S-1 (File No. 333-184847) filed on March 19, 2013)
10.49+ Amended and Restated Offer Letter of Alain M. Karaoglan, (incorporated by reference to Exhibit 10.02 to theCompany’s Current Report on Form 8-K (File No. 001-35897) filed on July 31, 2013)
10.50+ Employment Contract, dated May 19, 2004, between Ewout Steenbergen and ING Personnel VOF (incorporatedby reference to Exhibit 10.43 to the Company’s Amendment No. 2 to Registration Statement on Form S-1 (FileNo. 333-184847) filed on March 19, 2013)
10.51+ Amendment to Employment Contract, dated December 8, 2005, between Ewout Steenbergen and ING PersonnelVOF (incorporated by reference to Exhibit 10.44 to the Company’s Amendment No. 2 to Registration Statementon Form S-1 (File No. 333-184847) filed on March 19, 2013)
10.52+ Retention Award, dated March 19, 2010, between Ewout Steenbergen and ING U.S., Inc. (incorporated byreference to Exhibit 10.45 to the Company’s Amendment No. 2 to Registration Statement on Form S-1 (FileNo. 333-184847) filed on March 19, 2013)
10.53+ Deal Incentive Award Agreement, dated July 2011, between Ewout Steenbergen, ING Groep, N.V. and ING U.S.,Inc. (f/k/a ING America Insurance Holdings, Inc.) (incorporated by reference to Exhibit 10.46 to the Company’sAmendment No. 2 to Registration Statement on Form S-1 (File No. 333-184847) filed on March 19, 2013)
10.54+ International Assignment Agreement, dated October 27, 2009, between Ewout Steenbergen and ING Group asamended on November 12, 2009 (incorporated by reference to Exhibit 10.47 to the Company’s AmendmentNo. 2 to Registration Statement on Form S-1 (File No. 333-184847) filed on March 19, 2013)
10.55+ Letter, dated October 27, 2009, relating to appointment of Ewout Steenbergen as CFO of ING U.S. Insurance(incorporated by reference to Exhibit 10.48 to the Company’s Amendment No. 2 to Registration Statement onForm S-1 (File No. 333-184847) filed on March 19, 2013)
10.56+ ING Group Incentive Compensation Plan (incorporated by reference to Exhibit 10.52 to the Company’sAmendment No. 1 to Registration Statement on Form S-1 (File No. 333-184847) filed on January 23, 2013)
10.57+ ING Group Long-Term Sustainable Performance Plan (incorporated by reference to Exhibit 10.53 to the Company’sAmendment No. 1 to Registration Statement on Form S-1 (File No. 333-184847) filed on January 23, 2013)
10.58+ Form of ING Group Long-Term Sustainable Performance Plan Grant (incorporated by reference to Exhibit 10.54to the Company’s Amendment No. 1 to Registration Statement on Form S-1 (File No. 333-184847) filed onJanuary 23, 2013)
10.59+ Form of ING Group Grant of Deferred Shares (incorporated by reference to Exhibit 10.55 to the Company’sAmendment No. 1 to Registration Statement on Form S-1 (File No. 333-184847) filed on January 23, 2013)
10.60+ ING Group Long-Term Equity Ownership Plan (incorporated by reference to Exhibit 10.56 to the Company’sAmendment No. 1 to Registration Statement on Form S-1 (File No. 333-184847) filed on January 23, 2013)
10.61+ Form of ING Group Long-Term Equity Ownership Plan Grant (incorporated by reference to Exhibit 10.57 to theCompany’s Amendment No. 1 to Registration Statement on Form S-1 (File No. 333-184847) filed on January 23,2013)
10.62+ ING Group Standard Share Option Plan (incorporated by reference to Exhibit 10.58 to the Company’sAmendment No. 1 to Registration Statement on Form S-1 (File No. 333-184847) filed on January 23, 2013).
10.63+ ING Americas Supplemental Executive Retirement Plan (Amended/Restated December 2011) (incorporated byreference to Exhibit 10.59 to the Company’s Amendment No. 1 to Registration Statement on Form S-1 (FileNo. 333-184847) filed on January 23, 2013)
10.64+ ING Americas Retirement Plan (Amended/Restated December 2011) (incorporated by reference to Exhibit 10.60to the Company’s Amendment No. 1 to Registration Statement on Form S-1 (File No. 333-184847) filed onJanuary 23, 2013)
10.65+ ING Insurance Americas 409A Deferred Compensation Savings Plan (incorporated by reference to Exhibit 10.61to the Company’s Amendment No. 1 to Registration Statement on Form S-1 (File No. 333-184847) filed onJanuary 23, 2013)
10.66+ Amendment No. 1 to ING Insurance Americas 409A Deferred Compensation Savings Plan (Amended/RestatedJanuary 1, 2010) (incorporated by reference to Exhibit 10.62 to the Company’s Amendment No. 1 to RegistrationStatement on Form S-1 (File No. 333-184847) filed on January 23, 2013)
374
Exhibit No. Description of Exhibit
10.67+ ING Americas Severance Pay Plan (As Amended and Restated Effective as of January 1, 2008) (incorporated byreference to Exhibit 10.63 to the Company’s Amendment No. 1 to Registration Statement on Form S-1 (FileNo. 333-184847) filed on January 23, 2013)
10.68+ Amendment No. 1 to ING Americas Severance Pay Plan (Amended/Restated October 1, 2008) (incorporated byreference to Exhibit 10.64 to the Company’s Amendment No. 1 to Registration Statement on Form S-1 (FileNo. 333-184847) filed on January 23, 2013)
10.69+ Amendment No. 2 to ING Americas Severance Pay Plan (Amended/Restated June 22, 2009) (incorporated byreference to Exhibit 10.65 to the Company’s Amendment No. 1 to Registration Statement on Form S-1 (FileNo. 333-184847) filed on January 23, 2013)
10.70+ Amendment No. 3 to ING Americas Severance Pay Plan (Amended/Restated October 1, 2009) (incorporated byreference to Exhibit 10.66 to the Company’s Amendment No. 1 to Registration Statement on Form S-1 (FileNo. 333-184847) filed on January 23, 2013)
10.71+ Amendment No. 4 to ING Americas Severance Pay Plan (Amended/Restated December 1, 2010) (incorporatedby reference to Exhibit 10.67 to the Company’s Amendment No. 1 to Registration Statement on Form S-1 (FileNo. 333-184847) filed on January 23, 2013)
10.72+ ING Investment Management—Retention Participation Plan (incorporated by reference to Exhibit 10.68 to theCompany’s Amendment No. 1 to Registration Statement on Form S-1 (File No. 333-184847) filed on January 23,2013)
10.73+ ING Investment Management, LLC Annual Incentive Plan (incorporated by reference to Exhibit 10.69 to theCompany’s Amendment No. 1 to Registration Statement on Form S-1 (File No. 333-184847) filed on January 23,2013)
10.74+ ING Investment Management—Deferred Compensation Plan (incorporated by reference to Exhibit 10.70 to theCompany’s Amendment No. 1 to Registration Statement on Form S-1 (File No. 333-184847) filed on January 23,2013)
10.75+ ING Americas Insurance Holdings, Inc. Equity Compensation Plan (incorporated by reference to Exhibit 10.71 tothe Company’s Amendment No. 1 to Registration Statement on Form S-1 (File No. 333-184847) filed onJanuary 23, 2013)
10.76+ ING Directors’ Pension Scheme (incorporated by reference to Exhibit 10.72 to the Company’s Amendment No. 1to Registration Statement on Form S-1 (File No. 333-184847) filed on January 23, 2013)
10.77+ ING International Assignments Long-Term Assignments Policy (incorporated by reference to Exhibit 10.73 tothe Company’s Amendment No. 1 to Registration Statement on Form S-1 (File No. 333-184847) filed onJanuary 23, 2013)
10.78+ Equity Administration Agreement, dated as of May 7, 2013 between ING U.S., Inc. and ING Groep N.V.(incorporated by reference to Exhibit 10.3 to the Company’s Current Report on Form 8-K (File No. 001-35897)filed on May 7, 2013)
10.79+ Offer Letter, dated March 28, 2013, between Ewout Steenbergen and ING. U.S., Inc. (incorporated by referenceto Exhibit 10.78 to the Company’s Amendment No. 3 to Registration Statement on Form S-1 (FileNo. 333-184847) filed on April 5, 2013)
10.80+ Form of ING U.S., Inc. 2013 Omnibus Employee Incentive Plan (incorporated by reference to Exhibit 10.79 tothe Company’s Amendment No. 4 to Registration Statement on Form S-1 (File No. 333-184847) filed onApril 16, 2013)
10.81+ Voya Financial, Inc. Amended and Restated 2013 Omnibus Non-Employee Director Incentive Plan (incorporatedby reference to Exhibit 10.3 to the Company’s Quarterly Report on Form 10-Q (File No. 001-35897) filed onAugust 7, 2014)
10.82+ Deal Incentive Award Agreement, dated April 30, 2013, between Fred Hubbell, ING Groep, N.V. and ING U.S.,Inc. (incorporated by reference to Exhibit 10.22 to the Company’s Quarterly Report on Form 10-Q (FileNo. 001-35897) filed on August 9, 2013)
10.83+ Form of 2013 Converted Award Agreement under the ING U.S., Inc. 2013 Omnibus Employee Incentive Planrelated to the conversion of deferred shares granted in 2013 as both a mandatory partial deferral of 2012 annualincentive awards and an annual long -term incentive award to “Identified Staff” (as defined by the EuropeanUnion’s Capital Requirements Directive) pursuant to the ING Group Long-Term Sustainable Performance Plan(incorporated by reference to Exhibit 10.09 to the Company’s Quarterly Report on Form 10- Q/A (FileNo. 001-35897) filed on June 20, 2013)
375

Exhibit No. Description of Exhibit
10.84+ Form of 2013 Converted Award Agreement under the ING U.S., Inc. 2013 Omnibus Employee Incentive Plan relatedto the conversion of deferred shares granted in 2013 as mandatory partial deferrals of 2012 long term incentiveawards to “Identified Staff” (as defined by the European Union’s Capital Requirements Directive) pursuant to theING Group Long-Term Sustainable Performance Plan (incorporated by reference to Exhibit 10.10 to AmendmentNo. 1 of the Company’s Quarterly Report on Form 10-Q/A (File No. 001-35897) filed on June 20, 2013)
10.85+ Form of 2013 Converted Award Agreement under the ING U.S., Inc. 2013 Omnibus Employee Incentive Planrelated to the conversion of deferred shares and performance shares granted in 2013 to non-“Identified Staff” (asdefined by the European Union’s Capital Requirements Directive) pursuant to the ING Group Long-TermSustainable Performance Plan (incorporated by reference to Exhibit 10.11 to Amendment No. 1 to theCompany’s Quarterly Report on Form 10-Q/A (File No. 001-35897) filed on June 20, 2013)
10.86+ Form of 2013 Converted Award Agreement under the ING U.S., Inc. 2013 Omnibus Employee Incentive Planrelated to the conversion of performance shares granted in 2013 to non-“Identified Staff” (as defined by theEuropean Union’s Capital Requirements Directive) pursuant to the ING Group Long-Term SustainablePerformance Plan (incorporated by reference to Exhibit 10.12 to Amendment No. 1 to the Company’s QuarterlyReport on Form 10-Q/A (File No. 001-35897) filed on June 20, 2013)
10.87+ Notice of conversion of restricted stock units granted in 2013 under the ING America Insurance Holdings, Inc.Equity Compensation Plan, as amended, into restricted stock units of ING U.S., Inc. under the 2013 OmnibusEmployee Incentive Plan (incorporated by reference to Exhibit 10.13 to Amendment No. 1 to the Company’sQuarterly Report on Form 10-Q/A (File No. 001-35897) filed on June 20, 2013)
10.88+ Form of ING U.S., Inc. 2013 Omnibus Non-Employee Director Incentive Plan Restricted Stock Unit AwardAgreement (incorporated by reference to Exhibit 10.94 to the Company’s Registration Statement on Form S-1(File No. 333-191163) filed on September 13, 2013)
10.89+ Form of ING U.S., Inc. 2013 Omnibus Employee Incentive Plan Award Supplement Providing for DividendEquivalent Rights (incorporated by reference to Exhibit 10.95 to the Company’s Registration Statement onForm S-1 (File No. 333-191163) filed on September 13, 2013)
10.90+ Form of 2014 Restricted Stock Unit Award Agreement under the Voya Financial, Inc. 2013 Omnibus EmployeeIncentive Plan (incorporated by reference to Exhibit 10.95 to the Company’s Annual Report on Form 10-K (FileNo. 001-35897) filed on March 10, 2014)
10.91 Share Repurchase Agreement, dated as of March 18, 2014, between the Company and ING Groep N.V.(incorporated by reference to Exhibit 10.96 to the Company’s Amendment No. 1 to Registration Statement onForm S-1 (No. 333-194469) filed on March 18, 2014)
10.92 Master Outsourcing Services Agreement between ING North America Insurance Corporation and Milliman, Inc.dated as of June 2, 2014 (incorporated by reference to Exhibit 10.1 to the Company’s Current Report onForm 8-K filed on June 2, 2014)
10.93+ Voya Financial, Inc. 2014 Omnibus Employee Incentive Plan (incorporated by reference to Exhibit 10.2 to theCompany’s Quarterly Report on Form 10-Q (File No. 001-35897) filed on August 7, 2014)
10.94 Share Repurchase Agreement, dated as of September 1, 2014, between the Company and ING Groep N.V.(incorporated by reference to Exhibit 10.1 to the Company’s Current Report on Form 8-K (File No. 001-35897)filed on September 2, 2014)
10.95 Share Repurchase Agreement, dated as of November 11, 2014, between the Company and ING Groep N.V.(incorporated by reference to Exhibit 10.1 to the Company’s Current Report on Form 8-K (File No. 001-35897)filed on November 12, 2014)
10.96 Share Repurchase Agreement dated as of March 2, 2015 between the Company and ING Groep, N.V.(incorporated by reference to Exhibit 10.1 to the Company’s Current Report on Form 8-K (File No. 001-35897)filed on March 3, 2015)
10.97 Addendum, dated as of March 4, 2015, to Share Repurchase Agreement between Voya Financial, Inc. and INGGroep, N.V. (incorporated by reference to Exhibit 10.1 to the Company’s Current Report on Form 8-K(File No. 001-35897) filed on March 9, 2015)
10.98+ Form of 2015 Award Agreement under the Voya Financial, Inc. 2014 Omnibus Employee Incentive Plan(incorporated by reference to Exhibit 10.3 to the Company’s Quarterly Report on Form 10-Q (FileNo. 001-35897) filed on May 8, 2015)
10.99+ Form of Chief Executive Officer 2015 Award Agreement under the Voya Financial, Inc. 2014 OmnibusEmployee Incentive Plan (incorporated by reference to Exhibit 10.4 to the Company’s Quarterly Report onForm 10-Q (File No. 001-35897) filed on May 8, 2015)
10.100 Hannover Re Buyer Facility Agreement Dated as of September 24, 2015 Among Security Life of DenverInternational Limited, Voya Financial, Inc., Hannover Life Reassurance Company of America, Hannover Re(Ireland) Limited and Hannover Rück SE (incorporated by reference to Exhibit 10.1 to the Company’s QuarterlyReport on Form 10-Q (File No. 001-35897) filed on November 6, 2015)
376

Exhibit No. Description of Exhibit
10.101+ Form of Option Plan Grant Agreement under the Voya Financial, Inc. 2014 Omnibus Employee Incentive Plan(incorporated by reference to Exhibit 10.1 to the Company’s Current Report on Form 8-K (File No. 001-35897)filed on December 18, 2015)
10.102+* Offer Letter of Charles P. Nelson, dated April 7, 2015
12.1* Statement of Computation of Ratios of Earnings to Fixed Charges
21.1* List of Subsidiaries of Voya Financial, Inc.
23.1* Consent of Ernst & Young LLP
24.1 Power of Attorney (included on signature pages)
31.1* Rule 13a-14(a)/15d-14(a) Certification of Rodney O. Martin, Chief Executive Officer
31.2* Rule 13a-14(a)/15d-14(a) Certification of Ewout L. Steenbergen, Chief Financial Officer
32.1* Section 1350 Certification of Rodney O. Martin, Chief Executive Officer
32.2* Section 1350 Certification of Ewout L. Steenbergen, Chief Financial Officer
101.INS* XBRL Instance Document
101.SCH* XBRL Taxonomy Extension Schema
101.CAL* XBRL Taxonomy Extension Calculation Linkbase
101.DEF* XBRL Taxonomy Extension Definition Linkbase
101.LAB* XBRL Taxonomy Extension Label Linkbase
101.PRE* XBRL Taxonomy Extension Presentation Linkbase
* Filed herewith.+ This exhibit is a management contract or compensatory plan or arrangement
377

SIGNATURE
Pursuant to the requirements of Section 13 or 15(d) of the Securities Exchange Act of 1934, the registrant has duly caused thisreport to be signed on its behalf by the undersigned, thereunto duly authorized.
February 25, 2016 Voya Financial, Inc.
(Date) (Registrant)
By: /s/ Ewout L. Steenbergen
Ewout L. SteenbergenExecutive Vice President and
Chief Financial Officer(Duly Authorized Officer and Principal Financial Officer)
POWER OF ATTORNEY
KNOW ALL PERSONS BY THESE PRESENTS, that each person whose signature below constitutes and appoints Rodney O.Martin, Jr., Alain M. Karaoglan, Ewout L. Steenbergen and Patricia J. Walsh as his or her true and lawful attorneys-in-fact andagents, with full power of substitution and resubstitution, for him or her and in his or her name, place and stead, in any and allcapacities, to sign this Annual Report on Form 10-K, and all amendments thereto, and to file the same, with all exhibits thereto,and other documents in connection therewith, with the Securities and Exchange Commission, granting unto said attorneys-in-fact and agents and each of them, full power and authority to do and perform each and every act and thing requisite andnecessary to be done in connection therewith, as fully to all intents and purposes as he or she might or could do in person,hereby ratifying and confirming all that said attorneys-in-fact and agents, or any of them, or their or his or her substitutes orsubstitute, may lawfully do or cause to be done by virtue hereof.
Pursuant to the requirements of the Securities Exchange Act of 1934, this report has been signed below by the following personson behalf of the registrant and in the capacities and on the dates indicated.
378

Signatures Title Date
/s/ Rodney O. Martin, Jr.
Rodney O. Martin, Jr.
Chairman and Chief Executive Officer(Principal Executive Officer) February 25, 2016
/s/ Lynne Biggar
Lynne Biggar
Director February 25, 2016
/s/ Jane P. Chwick
Jane P. Chwick
Director February 25, 2016
/s/ Ruth Ann M. Gillis
Ruth Ann M. Gillis
Director February 25, 2016
/s/ J. Barry Griswell
J. Barry Griswell
Director February 25, 2016
/s/ Frederick S. Hubbell
Frederick S. Hubbell
Director February 25, 2016
/s/ Byron H. Pollitt, Jr.
Byron H. Pollitt, Jr.
Director February 25, 2016
/s/ Joseph V. Tripodi
Joseph V. Tripodi
Director February 25, 2016
/s/ Deborah C. Wright
Deborah C. Wright
Director February 25, 2016
/s/ David Zwiener
David Zwiener
Director February 25, 2016
/s/ Ewout L. Steenbergen
Ewout L. Steenbergen
Chief Financial Officer(Principal Financial Officer) February 25, 2016
/s/ C. Landon Cobb, Jr.
C. Landon Cobb, Jr.
Chief Accounting Officer(Principal Accounting Officer) February 25, 2016
379

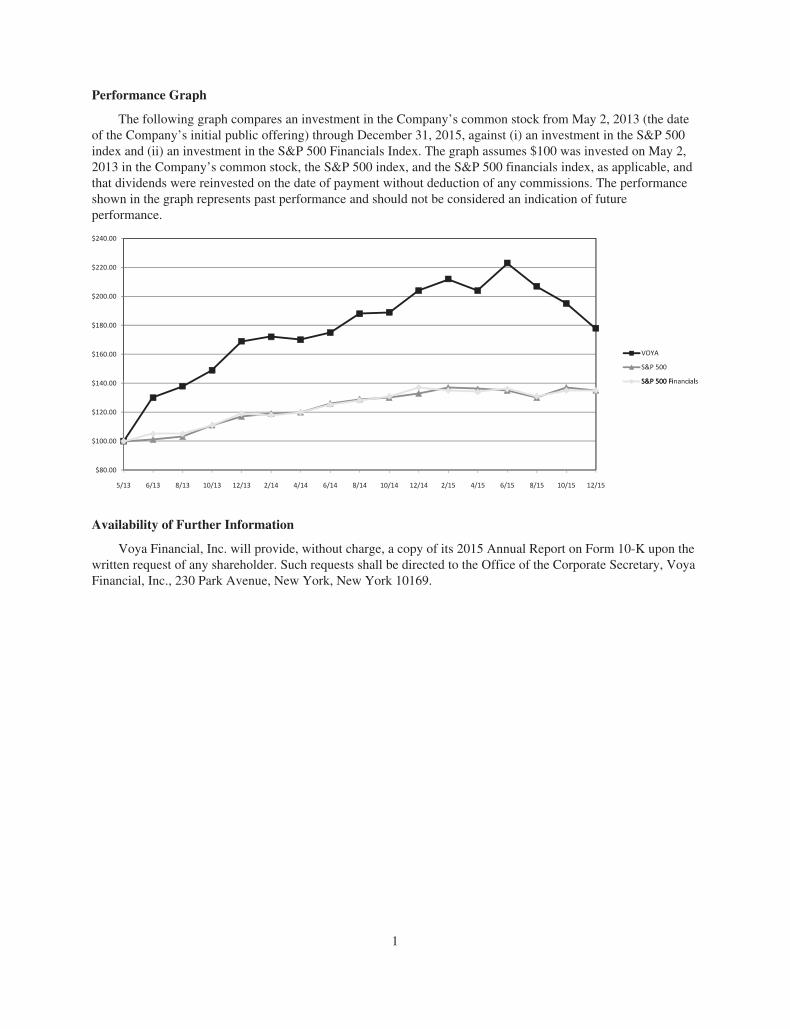
Performance Graph
The following graph compares an investment in the Company’s common stock from May 2, 2013 (the dateof the Company’s initial public offering) through December 31, 2015, against (i) an investment in the S&P 500index and (ii) an investment in the S&P 500 Financials Index. The graph assumes $100 was invested on May 2,2013 in the Company’s common stock, the S&P 500 index, and the S&P 500 financials index, as applicable, andthat dividends were reinvested on the date of payment without deduction of any commissions. The performanceshown in the graph represents past performance and should not be considered an indication of futureperformance.
$160.00
$180.00
$200.00
$220.00
$240.00
VOYA
S&P 500
S&P 500 Fi i l
$80.00
$100.00
$120.00
$140.00 S&P 500 Financials
5/13 6/13 8/13 10/13 12/13 2/14 4/14 6/14 8/14 10/14 12/14 2/15 4/15 6/15 8/15 10/15 12/15
Availability of Further Information
Voya Financial, Inc. will provide, without charge, a copy of its 2015 Annual Report on Form 10-K upon thewritten request of any shareholder. Such requests shall be directed to the Office of the Corporate Secretary, VoyaFinancial, Inc., 230 Park Avenue, New York, New York 10169.
1

Non-GAAP Measures
This Annual Report contains references to Ongoing Business Adjusted Operating Return on Equity andOngoing Business Adjusted Operating Earnings, each of which is a “non-GAAP financial measure”, whichmeans it is a financial measure calculated other than in accordance with U.S. generally accepted accountingprinciples (US GAAP).
The following tables provide a reconciliation of (i) Ongoing Business Adjusted Operating Return on Equityto Return on equity, and (ii) Ongoing Business Adjusted Operating Earnings to Net income, each of which is themost comparable financial measure calculated in accordance with US GAAP.
Additional information on these non-GAAP financial measures may be found in the Voya Financial, Inc.investor supplement for the three months ended December 31, 2015 and in the Voya Financial, Inc. earningsrelease for the three and twelve months ended December 31, 2015, each of which is available on the company’sinvestor website at investors.voya.com.
Voya FinancialCalculation and Reconciliation of Ongoing Business Adjusted Operating Return on Equity and
US GAAP Return on Equity
($ in millions, unless otherwise indicated)
Year endedDecember 31,
2015
Year endedDecember 31,
2014
Year endedDecember 31,
2013
Year endedDecember 31,
2012
Net income (loss) available to Voya Financial, Inc.’s commonshareholders . . . . . . . . . . . . . . . . . . . . . . . . . . . . . . . . . . . . . . $ 408.3 $2,295.0 $ 598.5 $ 490.0
Voya Financial, Inc. shareholders’ equity: beginning ofperiod . . . . . . . . . . . . . . . . . . . . . . . . . . . . . . . . . . . . . . . . . . . . $ 16,146 $ 13,315 $ 13,920 $ 12,382
Voya Financial, Inc. shareholders’ equity: end of period . . . . . . . $ 13,436 $ 16,146 $ 13,315 $ 13,920Voya Financial, Inc. shareholders’ equity: average for period . . . $ 15,019 $ 14,571 $ 13,618 $ 13,151GAAP Return on Equity . . . . . . . . . . . . . . . . . . . . . . . . . . . . . . 2.7% 15.8% 4.4% 3.7%
Ongoing Business Adjusted Operating Return on EquityOngoing Business adjusted operating earnings before
income taxes1 . . . . . . . . . . . . . . . . . . . . . . . . . . . . . . . . . . . . . . $1,281.8 $1,377.9 $1,211.8 $1,093.2Income taxes on adjusted operating earnings* . . . . . . . . . . . . . . . (410.3) (482.2) (424.2) (382.7)
Ongoing Business adjusted operating earnings after incometaxes . . . . . . . . . . . . . . . . . . . . . . . . . . . . . . . . . . . . . . . . . . . . . 871.5 895.7 787.6 710.5
Interest expense after-tax2 . . . . . . . . . . . . . . . . . . . . . . . . . . . . . . . (82.1) (77.3) (79.9) (88.7)
Ongoing Business adjusted operating earnings after incometaxes and interest expense . . . . . . . . . . . . . . . . . . . . . . . . . . . $ 789.4 $ 818.4 $ 707.7 $ 621.7
Beginning of period capital for Ongoing Business $8,777.0 $ 9,216 $ 9,057 $ 10,037End of period capital for Ongoing Business3,4 $ 8,377 $ 8,777 $ 9,216 $ 9,823Average capital for Ongoing Business5 $ 8,697 $ 9,028 9,137 9,930Average debt (based on 25% debt-to-capital ratio) $ (2,175) $ (2,257) (2,284) (2,482)
Average equity for Ongoing Business $ 6,522 $ 6,771 $ 6,853 $ 7,448
Adjusted Operating Return on Equity for Ongoing Business 12.1% 12.1% 10.3% 8.3%
* Assumes 32% tax rate for 2015 and 35% tax rate for all years prior to 2015 on operating earnings.
2

1 Reconciliation of Ongoing Business Adjusted Operating Earnings Before Income Taxes to Net Income(Loss)
($ in millions)Year ended
December 31, 2015Year ended
December 31, 2014Year ended
December 31, 2013Year ended
December 31, 2012
Ongoing Business adjustedoperating earnings beforeincome taxes . . . . . . . . . . . . . . $1,281.8 $1,377.9 $1,211.8 $1,093.2
DAC/VOBA and otherintangibles unlocking . . . . . . . . (67.5) (21.6) 133.2 (77.0)
Gain on reinsurance recapture . . . — 20.0 — —Lehman bankruptcy/LIHTC loss,
net of DAC . . . . . . . . . . . . . . . . — — 83.6 —Impact of Investment Portfolio
Restructuring . . . . . . . . . . . . . . — — — (25.3)
Operating earnings beforeincome taxes for OngoingBusiness . . . . . . . . . . . . . . . . . . 1,214.3 1,376.3 1,428.6 990.9
Corporate . . . . . . . . . . . . . . . . . . . (259.2) (170.4) (210.6) (182.3)Closed Blocks Institutional
Spread Products and Other . . . 22.4 24.7 50.6 109.7
Total operating earnings beforeincome taxes . . . . . . . . . . . . . . 977.5 1,230.6 1,268.6 918.3
Income taxes* . . . . . . . . . . . . . . . (312.8) (430.7) (444.0) (321.4)
Operating earnings,after-tax . . . . . . . . . . . . . . . . . 664.7 799.9 824.6 596.9
Closed Block Variable Annuity,after-tax . . . . . . . . . . . . . . . . . . (112.6) (155.5) (788.0) (433.0)
Net investment gains (losses) andrelated charges andadjustments, after-tax . . . . . . . . (54.1) 139.8 137.9 296.0Other, after-tax . . . . . . . . . . . . . (89.7) 1,510.8 a 424.0 30.1
Net income (loss) available toVoya Financial, Inc.’scommon shareholders . . . . . . 408.3 2,295.0 598.5 490.0
Net income (loss) attributable tononcontrolling interest . . . . . . . 130.3 237.7 190.1 138.2
Net income (loss) . . . . . . . . . . . . $ 538.6 $2,532.7 $ 788.6 $ 628.2
a Amount for the year ended December 31, 2014 includes $1,834.9 of decrease in tax valuationallowance.
* Assumes 32% tax rate for 2015 and 35% tax rate for all years prior to 2015 on operating earnings.2 Assumes debt-to-capital ratio of approximately 25%, a weighted average pre-tax interest rate of 5.5% for all
periods prior to the third quarter of 2013 (the quarter during which the company completed itsrecapitalization initiatives), and the actual weighted average pre-tax interest rate for all periods beginningwith the third quarter of 2013.
3 Reconciliation of End of Period Capital for Ongoing Business to Shareholders’ Equity
($ in millions)As of
December 31, 2015As of
December 31, 2014As of
December 31, 2013As of
December 31, 2012
End of Period Capital forOngoing Business . . . . . . . . . . $ 8,377 $ 8,777 $ 9,216 $ 9,823
Closed Block Variable Annuity,Corporate, and Other ClosedBlocks . . . . . . . . . . . . . . . . . . . . $ 7,120 $ 7,781 5,765 4,195
End of Period Capital . . . . . . . . $15,497 $16,558 14,981 14,018Financial Leverageb . . . . . . . . . . . $ (3,486) $ (3,515) (3,515) (3,809)
Voya Financial, Inc. shareholders’equity excluding AOCI end ofperiod . . . . . . . . . . . . . . . . . . . . $12,011 $13,043 11,466 10,209
AOCI . . . . . . . . . . . . . . . . . . . . . . $ 1,425 $ 3,103 1,849 3,711
Voya Financial, Inc.shareholders’ equity: end ofperiod . . . . . . . . . . . . . . . . . . . . $13,436 $16,146 $13,315 $13,920
3

b Reconciliation of Financial Leverage to Short-term and Long-term Debt
($ in millions)As of
December 31, 2015As of
December 31, 2014As of
December 31, 2013As of
December 31, 2012
Short-term debt . . . . . . . $ — $ — $ — $1,064.6Long-term debt . . . . . . . 3,485.9 3,515.7 3,514.7 3,171.1
Total Debt . . . . . . . . . . . 3,485.9 3,515.7 3,514.7 4,235.7Less operating
leverage . . . . . . . . . . . — — — (688.5)Plus loans from
subsidiaries . . . . . . . . — — — 261.1
Financial Leverage . . . $3,485.9 $3,515.7 $3,514.7 $3,808.3
4 The January 1, 2013 beginning capital is different from the December 31, 2012 ending capital at thesegment level due to certain reallocations of capital, primarily due to recapitalization activity (completedand anticipated)
5 Average capital and equity for 2014 are calculated by taking the average of the quarterly capital and equityaverages for the trailing four quarters, while average capital and equity for 2012 and 2013 are calculated asthe average of beginning of period and end of period capital and equity, as applicable.
4
Forward-Looking and Other Cautionary Statements
This annual report contains forward-looking statements. Forward-looking
statements include statements relating to future developments in our
business or expectations for our future financial performance and any
statement not involving a historical fact. Forward-looking statements
use words such as “anticipate,” “believe,” “estimate,” “expect,” “intend,”
“plan,” and other words and terms of similar meaning in connection with
a discussion of future operating or financial performance. Actual results,
performance or events may differ materially from those projected in
any forward-looking statement due to, among other things, (i) general
economic conditions, particularly economic conditions in our core
markets, (ii) performance of financial markets, including emerging
markets, (iii) the frequency and severity of insured loss events, (iv)
mortality and morbidity levels, (v) persistency and lapse levels, (vi) interest
rates, (vii) currency exchange rates, (viii) general competitive factors,
(ix) changes in laws and regulations, including those relating to the use
of and possible application of NAIC accreditation standards to captive
reinsurance entities and those made pursuant to the Dodd-Frank Wall
Street Reform and Consumer Protection Act or the U.S. Department of
Labor’s proposed rules and exemptions pertaining to the fiduciary status
of providers of investment advice, and (x) changes in the policies of
governments and/or regulatory authorities. Factors that may cause actual
results to differ from those in any forward-looking statement also include
those described under “Risk Factors” and “Management’s Discussion
and Analysis of Results of Operations and Financial Condition — Trends
and Uncertainties” in our Annual Report on Form 10-K for the year ended
December 31, 2015, filed with the Securities and Exchange Commission
on February 25, 2016.

Voya Financial
230 Park Avenue
New York, NY 10169
voya.com
PLAN | INVEST | PROTECT