New Feast Sites Being Planned for 2003 - United Church of God
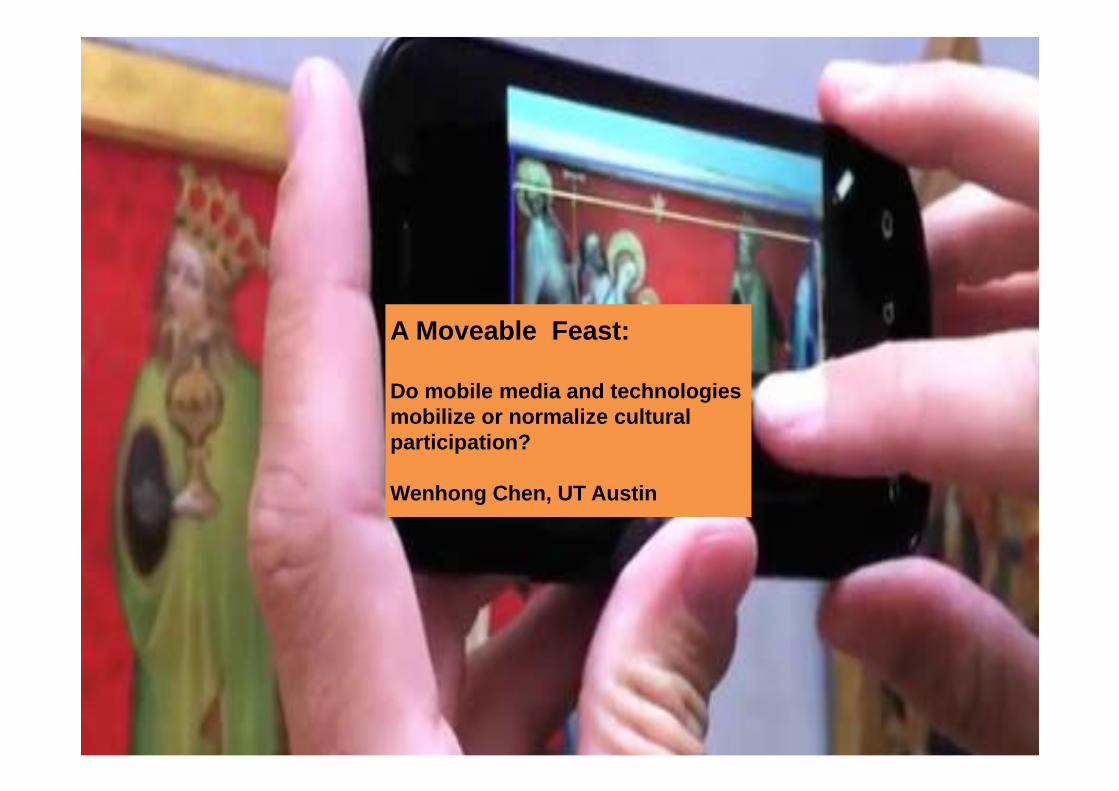
A Moveable Feast:
Do mobile media and technologies mobilize or normalize cultural participation?
Wenhong Chen, UT Austin
There has been an emerging literature on the implications of mobile media & communication for sociability, civic engagement, or political participation
Chen, W., & Ling, R. (2014). Mobile Media and Communication. In P. J. Schulz & P. Cobley (Eds.), The Handbook of Communication Science (Vol. 5 Communication and Technology, edited by L. Cantoni & J.Danowski): SAGE Publications.
Few studies on cultural capital• Bourdieu (1986) understood cultural capital as the extent to which
an individual had been socialized into the highbrow culture. • People draw on cultural capital to distinguish, differentiate, and
connect with one another, reinforcing symbolic and social boundaries (Bennett and Silva, 2011; DiMaggio, 1987; Lamont and Molnár, 2002).
• In empirical research, cultural capital is often operationalized as the participation in highbrow and middlebrow cultural activities such as visiting museums, galleries, shows, craft affairs, historic sites or attending popular or live performing art events (DiMaggio and Ostrower, 1990; López-Sintas and Katz-Gerro, 2005).
0
5
10
15
20
25
30
35
40
45
1982 1992 2002 2008
Jazz*
Classical music*
Opera*
Latin music
Performing artsfestivalsMusical plays*
Non-musical plays*
Ballet*
Other dance
Art museums/ galleries*
Data source: National Endowment for the Arts, 2009
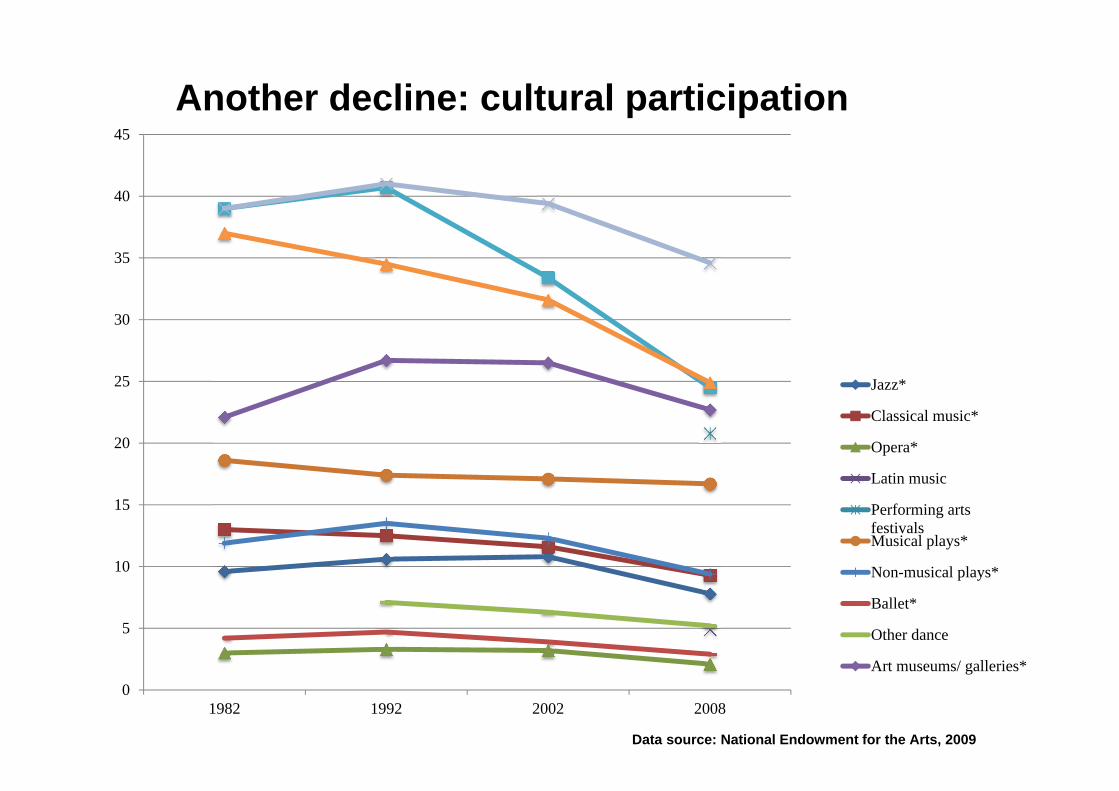
Another decline: cultural participation
Mobile cultural participation
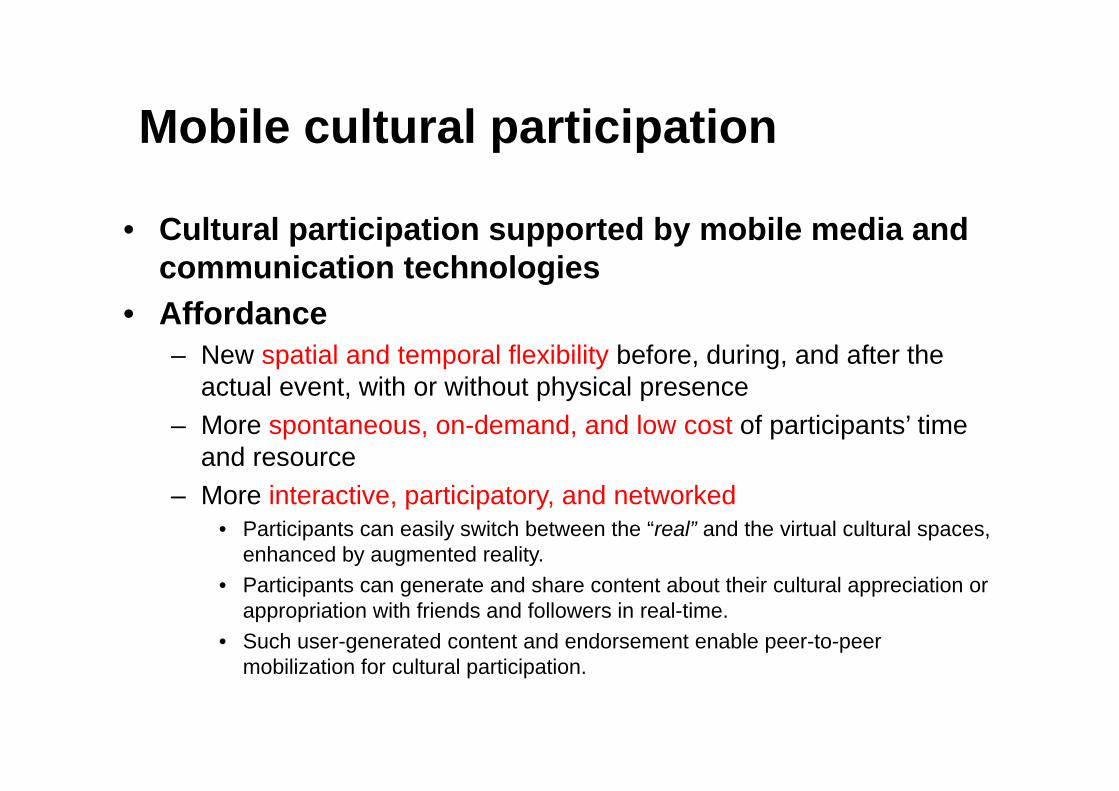
• Cultural participation supported by mobile media and communication technologies
• Affordance– New spatial and temporal flexibility before, during, and after the
actual event, with or without physical presence – More spontaneous, on-demand, and low cost of participants’ time
and resource – More interactive, participatory, and networked
• Participants can easily switch between the “real” and the virtual cultural spaces, enhanced by augmented reality.
• Participants can generate and share content about their cultural appreciation or appropriation with friends and followers in real-time.
• Such user-generated content and endorsement enable peer-to-peer mobilization for cultural participation.
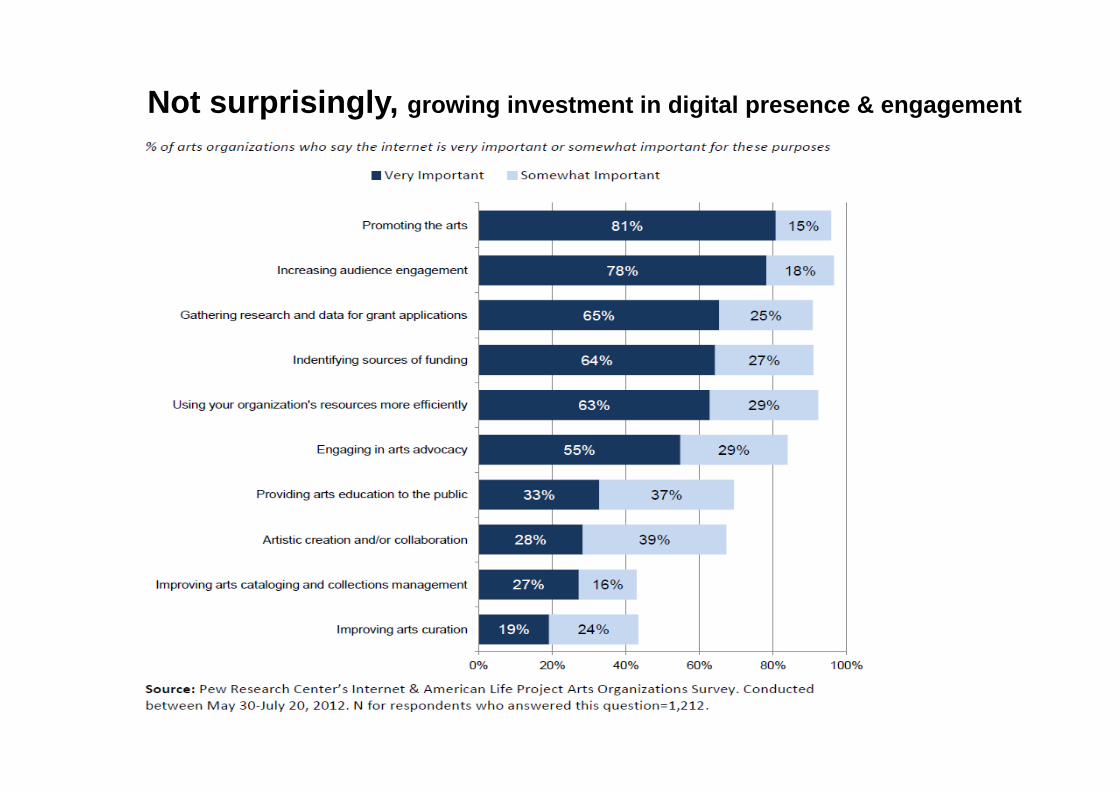
Not surprisingly, growing investment in digital presence & engagement
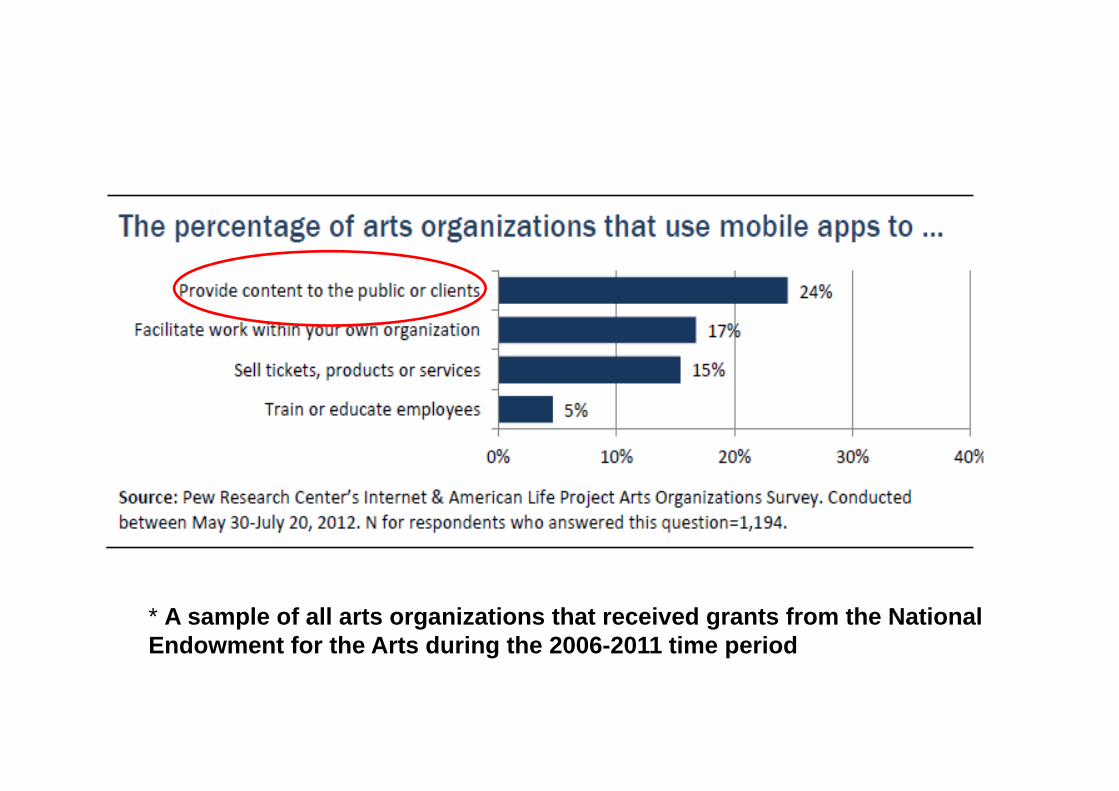
* A sample of all arts organizations that received grants from the National Endowment for the Arts during the 2006-2011 time period
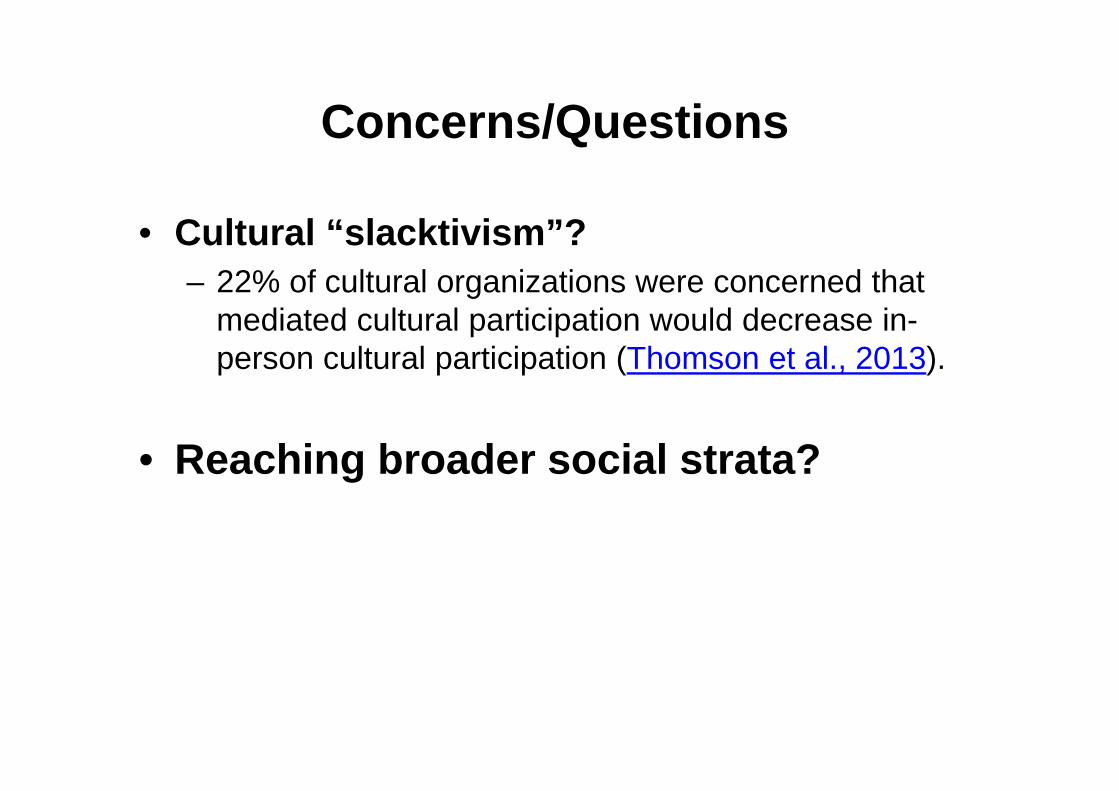
Concerns/Questions
• Cultural “slacktivism”? – 22% of cultural organizations were concerned that
mediated cultural participation would decrease in-person cultural participation (Thomson et al., 2013).
• Reaching broader social strata?
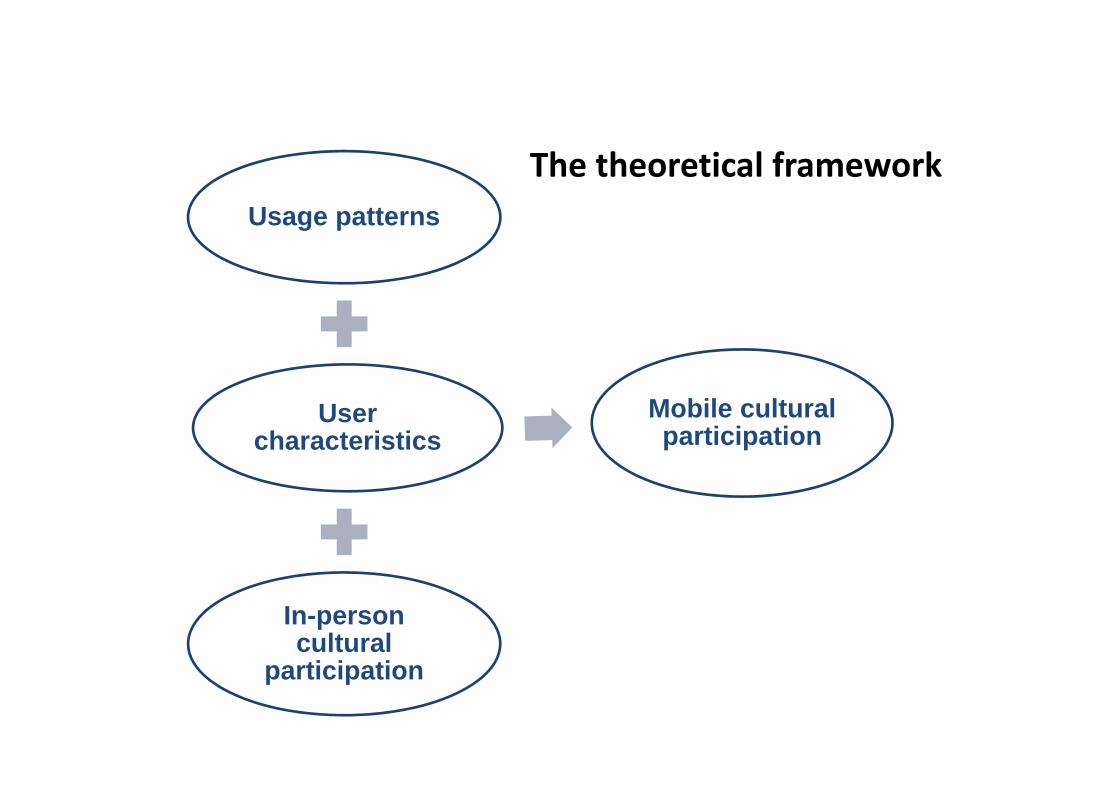
Usage patterns
User characteristics
In-person cultural
participation
Mobile cultural participation
The theoretical framework
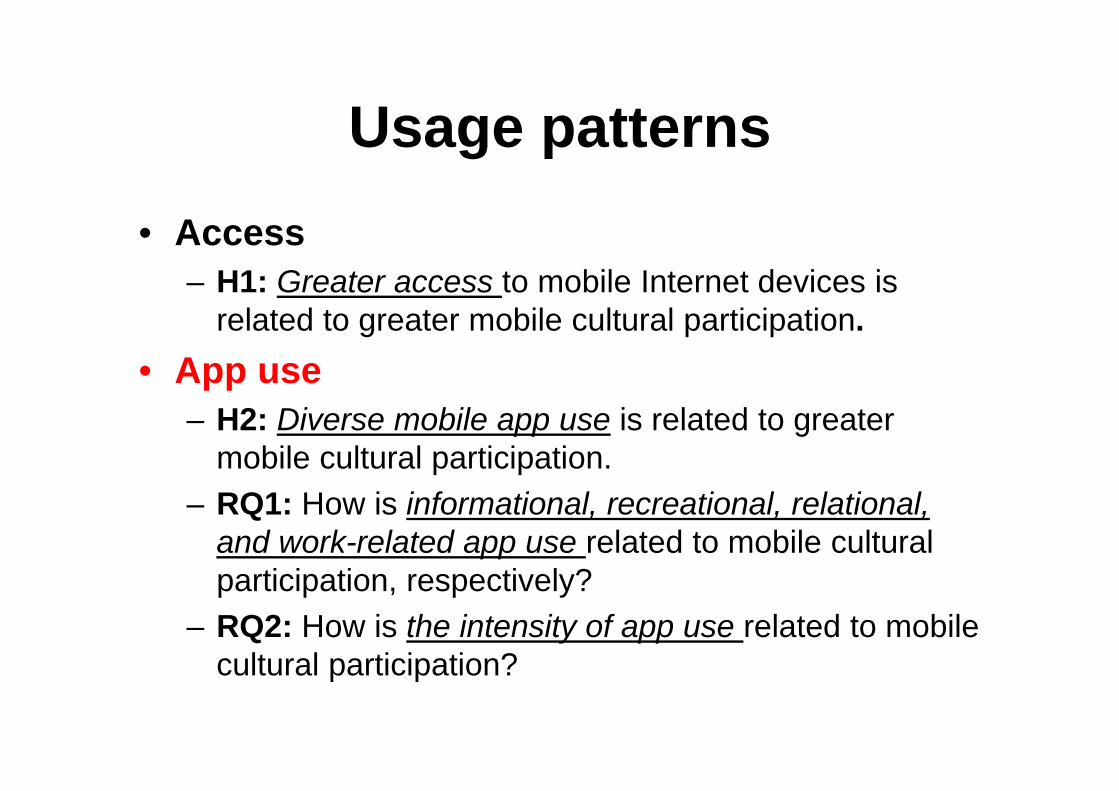
Usage patterns• Access
– H1: Greater access to mobile Internet devices is related to greater mobile cultural participation.
• App use – H2: Diverse mobile app use is related to greater
mobile cultural participation. – RQ1: How is informational, recreational, relational,
and work-related app use related to mobile cultural participation, respectively?
– RQ2: How is the intensity of app use related to mobile cultural participation?
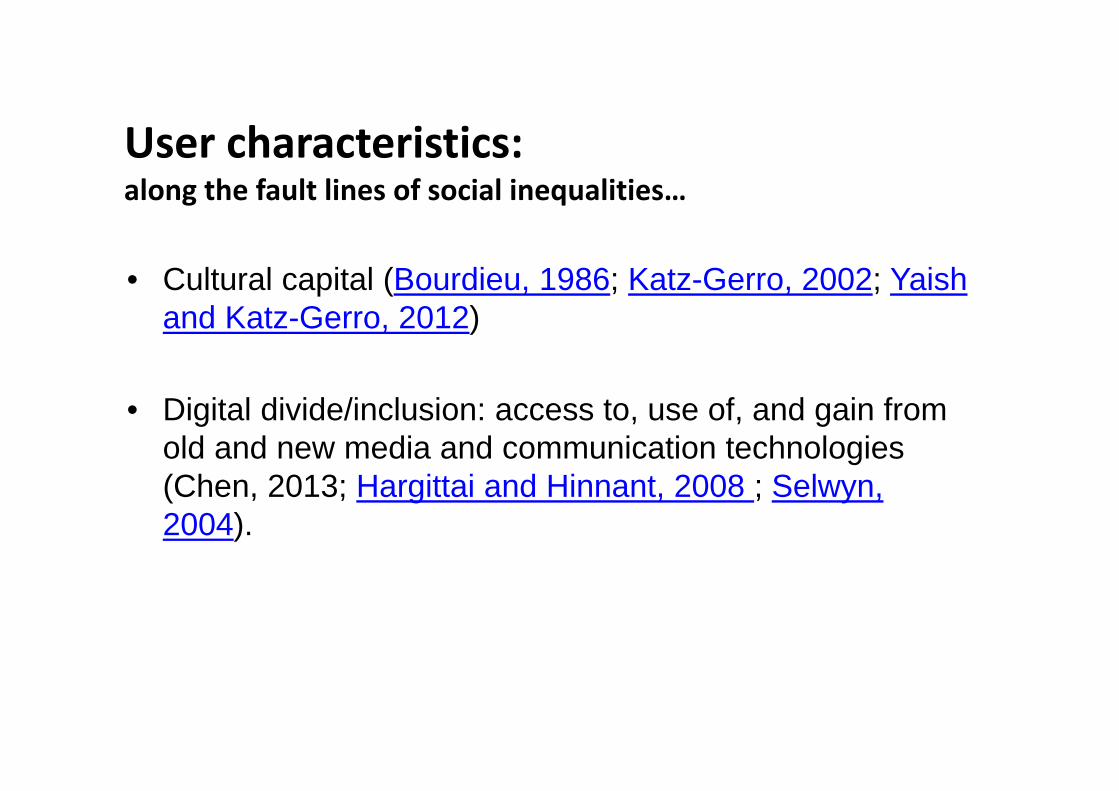
User characteristics:along the fault lines of social inequalities…
• Cultural capital (Bourdieu, 1986; Katz-Gerro, 2002; Yaish and Katz-Gerro, 2012)
• Digital divide/inclusion: access to, use of, and gain from old and new media and communication technologies (Chen, 2013; Hargittai and Hinnant, 2008 ; Selwyn, 2004).
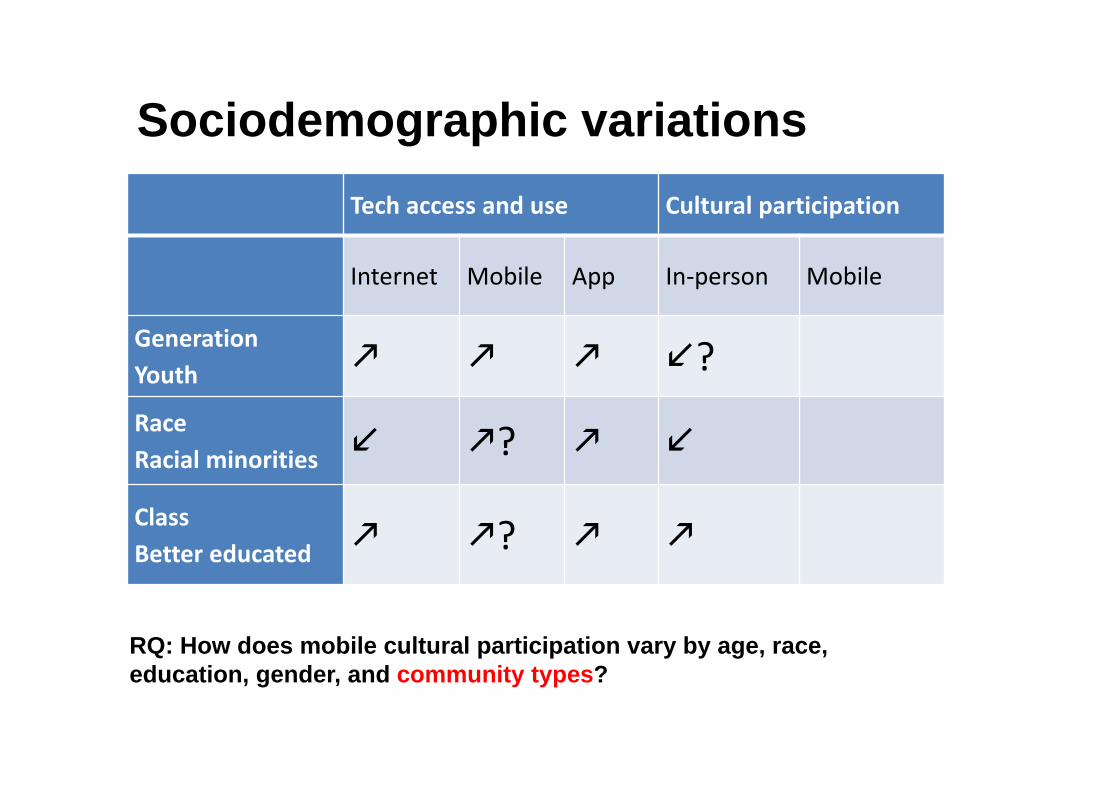
Sociodemographic variations Tech access and use Cultural participation
Internet Mobile App In‐person Mobile
GenerationYouth ?RaceRacial minorities ?
ClassBetter educated ?
RQ: How does mobile cultural participation vary by age, race, education, gender, and community types?
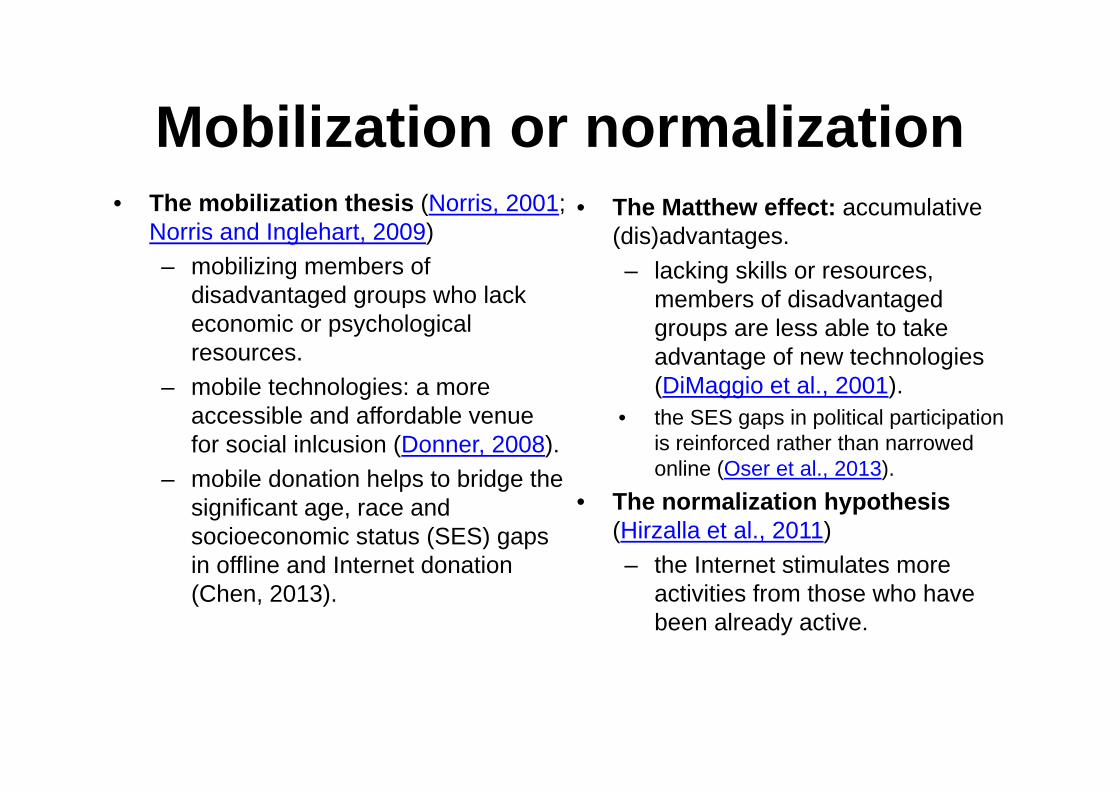
Mobilization or normalization • The mobilization thesis (Norris, 2001;
Norris and Inglehart, 2009)– mobilizing members of
disadvantaged groups who lack economic or psychological resources.
– mobile technologies: a more accessible and affordable venue for social inlcusion (Donner, 2008).
– mobile donation helps to bridge the significant age, race and socioeconomic status (SES) gaps in offline and Internet donation (Chen, 2013).
• The Matthew effect: accumulative (dis)advantages. – lacking skills or resources,
members of disadvantaged groups are less able to take advantage of new technologies (DiMaggio et al., 2001).
• the SES gaps in political participation is reinforced rather than narrowed online (Oser et al., 2013).
• The normalization hypothesis (Hirzalla et al., 2011)– the Internet stimulates more
activities from those who have been already active.
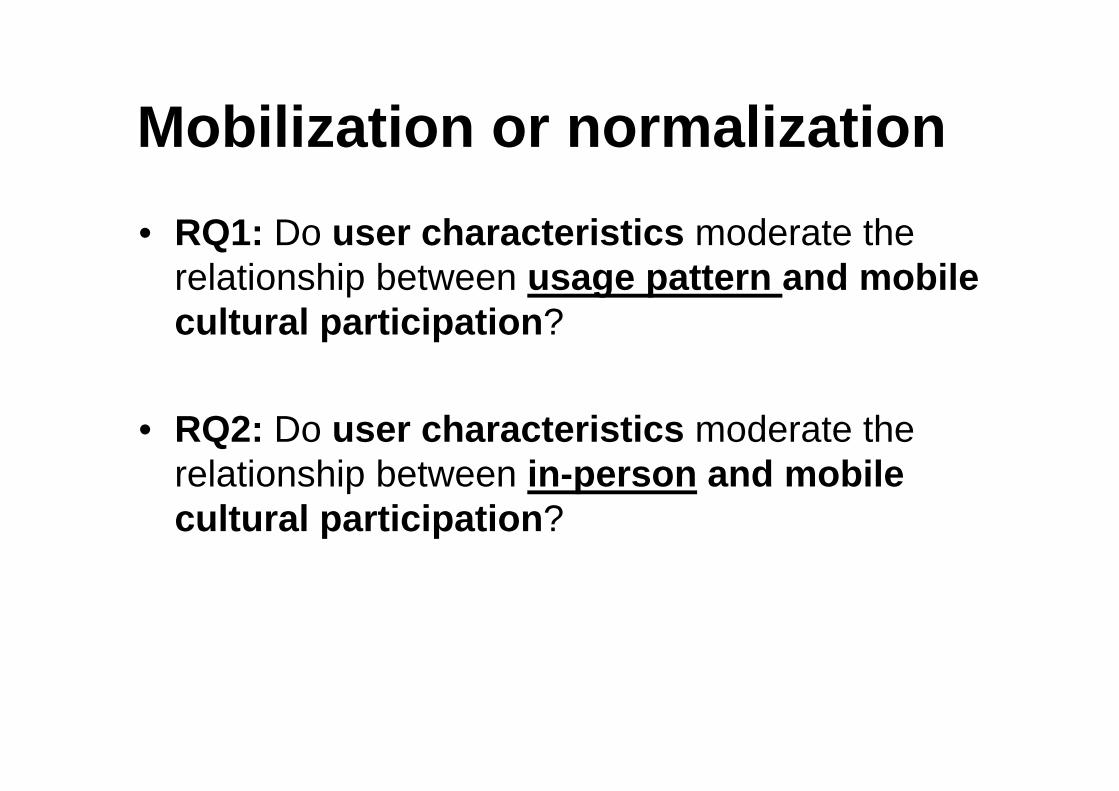
Mobilization or normalization • RQ1: Do user characteristics moderate the
relationship between usage pattern and mobile cultural participation?
• RQ2: Do user characteristics moderate the relationship between in-person and mobile cultural participation?
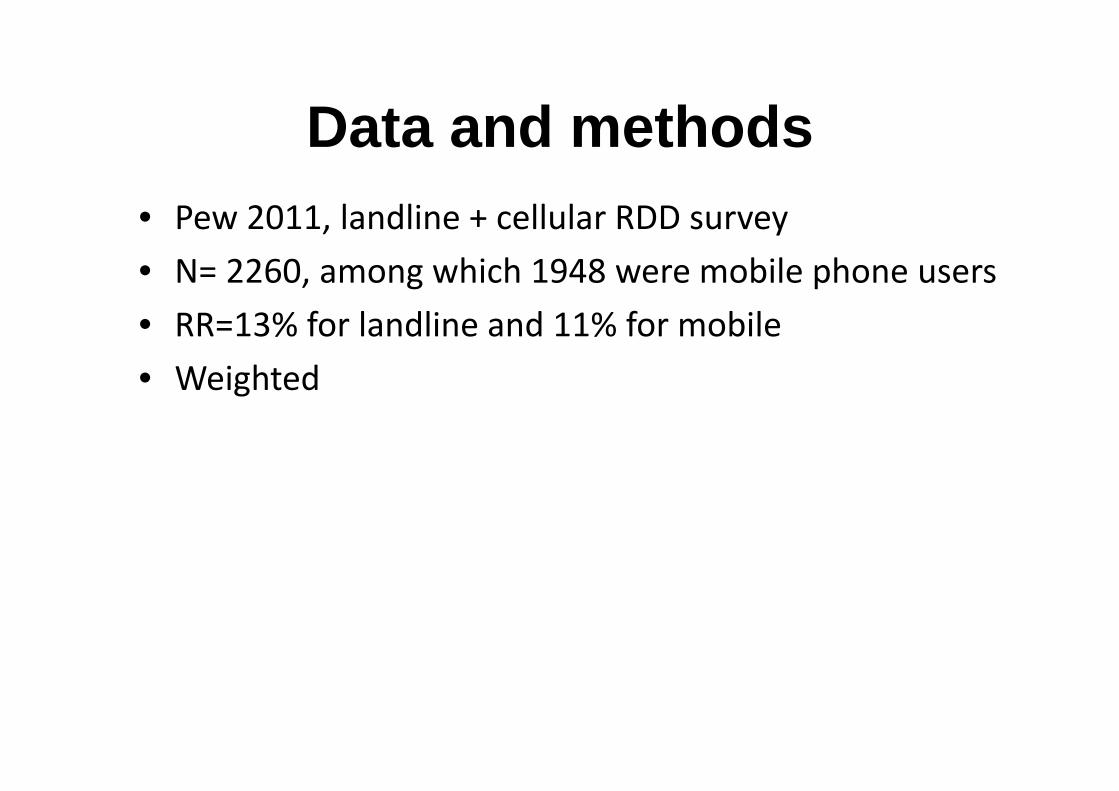
Data and methods• Pew 2011, landline + cellular RDD survey• N= 2260, among which 1948 were mobile phone users• RR=13% for landline and 11% for mobile• Weighted
Mobile cultural participation
02468
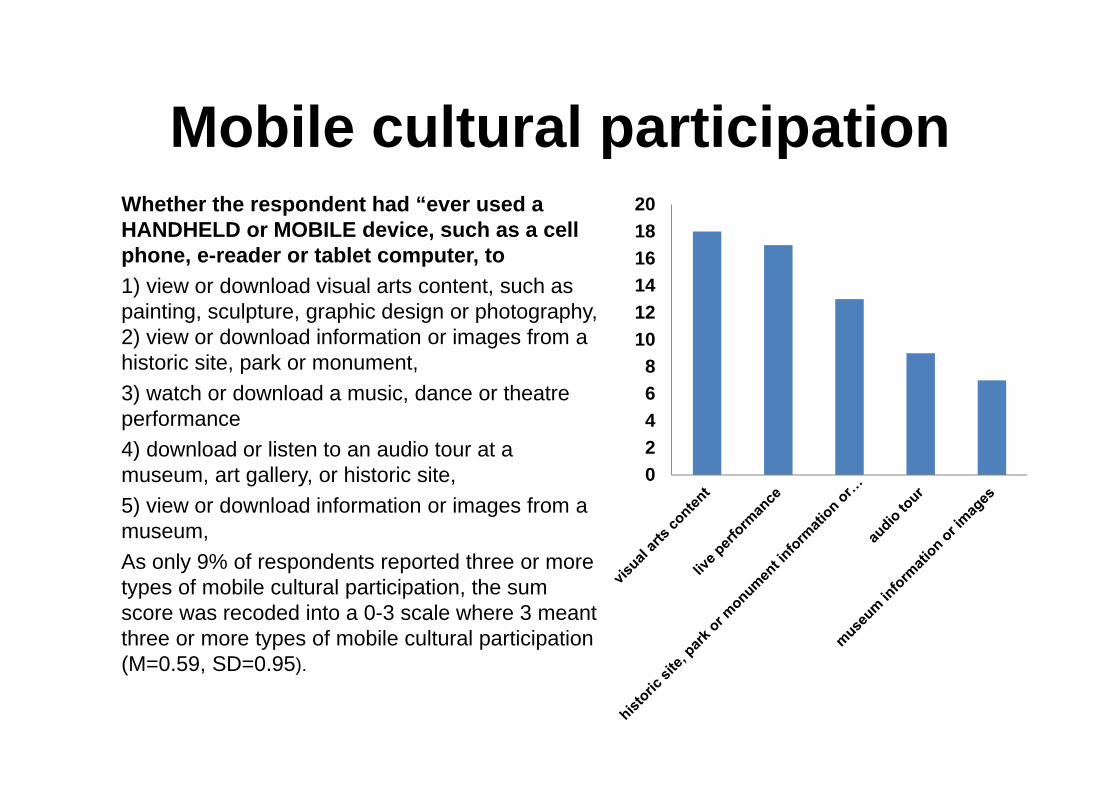
101214161820Whether the respondent had “ever used a
HANDHELD or MOBILE device, such as a cell phone, e-reader or tablet computer, to 1) view or download visual arts content, such as painting, sculpture, graphic design or photography, 2) view or download information or images from a historic site, park or monument,3) watch or download a music, dance or theatre performance4) download or listen to an audio tour at a museum, art gallery, or historic site, 5) view or download information or images from a museum, As only 9% of respondents reported three or more types of mobile cultural participation, the sum score was recoded into a 0-3 scale where 3 meant three or more types of mobile cultural participation (M=0.59, SD=0.95).
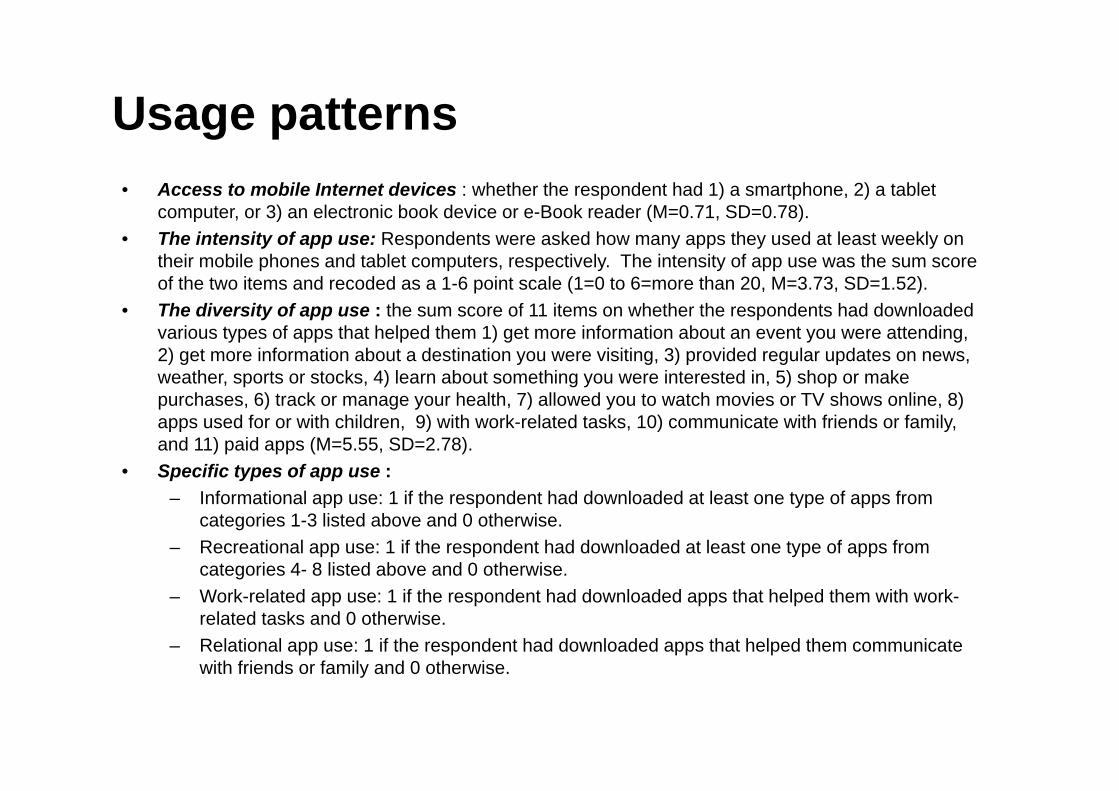
Usage patterns• Access to mobile Internet devices : whether the respondent had 1) a smartphone, 2) a tablet
computer, or 3) an electronic book device or e-Book reader (M=0.71, SD=0.78). • The intensity of app use: Respondents were asked how many apps they used at least weekly on
their mobile phones and tablet computers, respectively. The intensity of app use was the sum score of the two items and recoded as a 1-6 point scale (1=0 to 6=more than 20, M=3.73, SD=1.52).
• The diversity of app use : the sum score of 11 items on whether the respondents had downloaded various types of apps that helped them 1) get more information about an event you were attending, 2) get more information about a destination you were visiting, 3) provided regular updates on news, weather, sports or stocks, 4) learn about something you were interested in, 5) shop or make purchases, 6) track or manage your health, 7) allowed you to watch movies or TV shows online, 8) apps used for or with children, 9) with work-related tasks, 10) communicate with friends or family, and 11) paid apps (M=5.55, SD=2.78).
• Specific types of app use :– Informational app use: 1 if the respondent had downloaded at least one type of apps from
categories 1-3 listed above and 0 otherwise. – Recreational app use: 1 if the respondent had downloaded at least one type of apps from
categories 4- 8 listed above and 0 otherwise. – Work-related app use: 1 if the respondent had downloaded apps that helped them with work-
related tasks and 0 otherwise. – Relational app use: 1 if the respondent had downloaded apps that helped them communicate
with friends or family and 0 otherwise.

Table 1 Baseline Models of In-person and Mobile Cultural Participation (Zero-inflated Poisson Model) In-person Mobile Model 1 Model 2 Model 3 Model 4 Female 0.05 (0.04) 0.05 (0.03) -0.04 (0.08) -0.06 (0.07)Age -0.01*** (0.00) -0.00*** (0.00) -0.01*** (0.00) -0.01** (0.00)Education 0.16*** (0.01) 0.15*** (0.01) 0.09** (0.03) -0.01 (0.03)Race (White=ref)
Black -0.13 (0.07) -0.16* (0.07) 0.04 (0.14) 0.16 (0.13)Hispanics -0.06 (0.07) -0.13* (0.07) 0.33** (0.10) 0.37*** (0.11)Asian -0.05 (0.11) -0.10 (0.10) 0.10 (0.24) 0.13 (0.21)Other 0.00 (0.09) -0.05 (0.08) 0.13 (0.19) 0.08 (0.16)
Partnered 0.09* (0.04) 0.09* (0.04) 0.02 (0.10) -0.04 (0.10)Parent with children under 18 -0.10* (0.04) -0.09* (0.04) -0.04 (0.09) 0.06 (0.09)Community type (Rural=ref)
Urban 0.19** (0.06) 0.18** (0.06) 0.14 (0.14) 0.02 (0.13)Suburban 0.12* (0.06) 0.12* (0.05) 0.10 (0.13) 0.04 (0.12)
Mobile cultural participation 0.17*** (0.01) In-person cultural participation 0.29*** (0.03)Constant 0.44*** (0.10) 0.26** (0.09) 0.10 (0.22) -0.58* (0.23)Inflate -1.13*** (0.17) -1.19*** (0.19) -1.30*** (0.18) -1.58*** (0.27)
Mobile Internet devices Constant -0.97*** (0.12) -1.12*** (0.13) 0.78*** (0.14) 0.35* (0.18)
Log pseudo-likelihood -9517 -9350 -5263 -5038 Note: Robust standard errors in parentheses. N=1746 (*** p<0.001, ** p<0.01, * p<0.05).
}
}
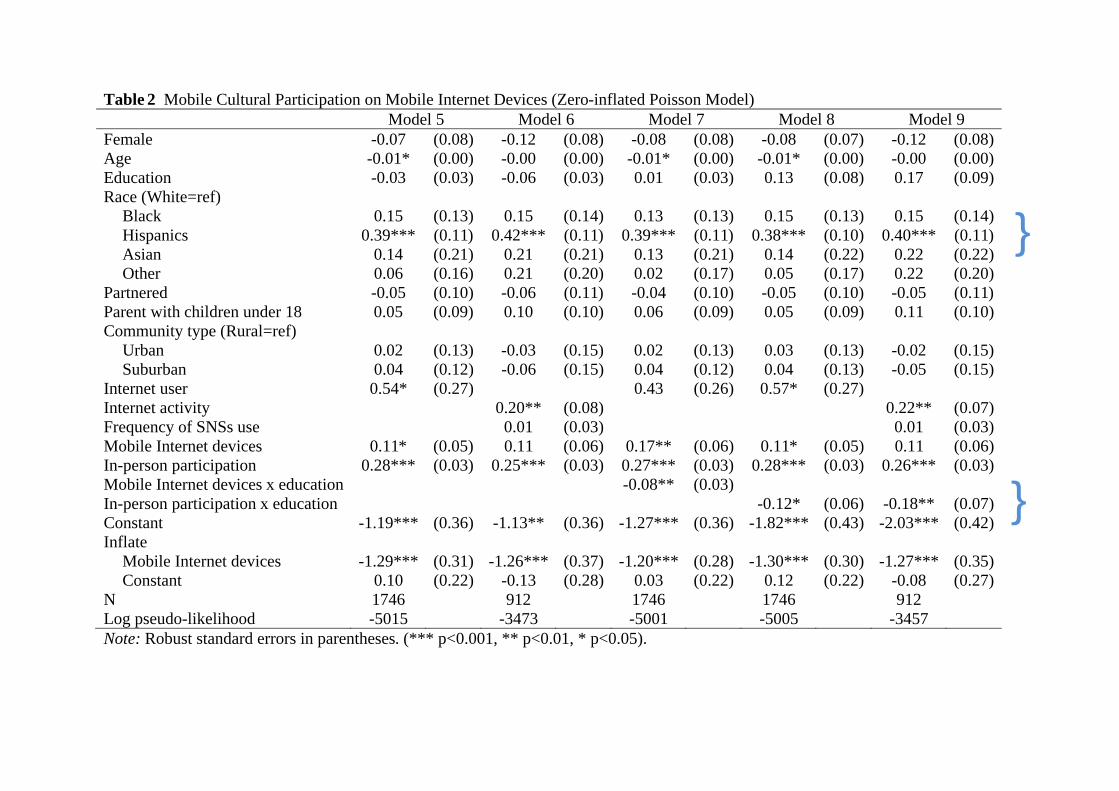
Table 2 Mobile Cultural Participation on Mobile Internet Devices (Zero-inflated Poisson Model) Model 5 Model 6 Model 7 Model 8 Model 9 Female -0.07 (0.08) -0.12 (0.08) -0.08 (0.08) -0.08 (0.07) -0.12 (0.08) Age -0.01* (0.00) -0.00 (0.00) -0.01* (0.00) -0.01* (0.00) -0.00 (0.00) Education -0.03 (0.03) -0.06 (0.03) 0.01 (0.03) 0.13 (0.08) 0.17 (0.09) Race (White=ref)
Black 0.15 (0.13) 0.15 (0.14) 0.13 (0.13) 0.15 (0.13) 0.15 (0.14) Hispanics 0.39*** (0.11) 0.42*** (0.11) 0.39*** (0.11) 0.38*** (0.10) 0.40*** (0.11) Asian 0.14 (0.21) 0.21 (0.21) 0.13 (0.21) 0.14 (0.22) 0.22 (0.22) Other 0.06 (0.16) 0.21 (0.20) 0.02 (0.17) 0.05 (0.17) 0.22 (0.20)
Partnered -0.05 (0.10) -0.06 (0.11) -0.04 (0.10) -0.05 (0.10) -0.05 (0.11) Parent with children under 18 0.05 (0.09) 0.10 (0.10) 0.06 (0.09) 0.05 (0.09) 0.11 (0.10) Community type (Rural=ref)
Urban 0.02 (0.13) -0.03 (0.15) 0.02 (0.13) 0.03 (0.13) -0.02 (0.15) Suburban 0.04 (0.12) -0.06 (0.15) 0.04 (0.12) 0.04 (0.13) -0.05 (0.15)
Internet user 0.54* (0.27) 0.43 (0.26) 0.57* (0.27) Internet activity 0.20** (0.08) 0.22** (0.07) Frequency of SNSs use 0.01 (0.03) 0.01 (0.03) Mobile Internet devices 0.11* (0.05) 0.11 (0.06) 0.17** (0.06) 0.11* (0.05) 0.11 (0.06) In-person participation 0.28*** (0.03) 0.25*** (0.03) 0.27*** (0.03) 0.28*** (0.03) 0.26*** (0.03) Mobile Internet devices x education -0.08** (0.03) In-person participation x education -0.12* (0.06) -0.18** (0.07) Constant -1.19*** (0.36) -1.13** (0.36) -1.27*** (0.36) -1.82*** (0.43) -2.03*** (0.42) Inflate
Mobile Internet devices -1.29*** (0.31) -1.26*** (0.37) -1.20*** (0.28) -1.30*** (0.30) -1.27*** (0.35) Constant 0.10 (0.22) -0.13 (0.28) 0.03 (0.22) 0.12 (0.22) -0.08 (0.27)
N 1746 912 1746 1746 912 Log pseudo-likelihood -5015 -3473 -5001 -5005 -3457 Note: Robust standard errors in parentheses. (*** p<0.001, ** p<0.01, * p<0.05).
}
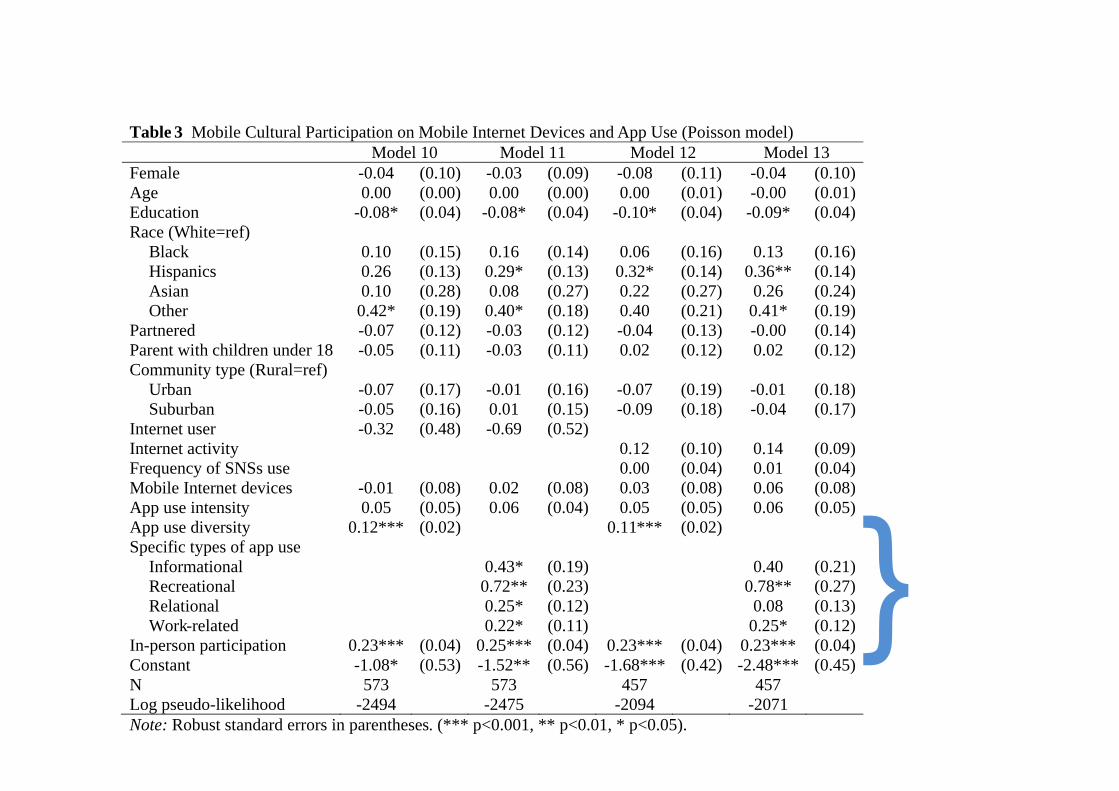
Table 3 Mobile Cultural Participation on Mobile Internet Devices and App Use (Poisson model) Model 10 Model 11 Model 12 Model 13 Female -0.04 (0.10) -0.03 (0.09) -0.08 (0.11) -0.04 (0.10)Age 0.00 (0.00) 0.00 (0.00) 0.00 (0.01) -0.00 (0.01)Education -0.08* (0.04) -0.08* (0.04) -0.10* (0.04) -0.09* (0.04)Race (White=ref)
Black 0.10 (0.15) 0.16 (0.14) 0.06 (0.16) 0.13 (0.16)Hispanics 0.26 (0.13) 0.29* (0.13) 0.32* (0.14) 0.36** (0.14)Asian 0.10 (0.28) 0.08 (0.27) 0.22 (0.27) 0.26 (0.24)Other 0.42* (0.19) 0.40* (0.18) 0.40 (0.21) 0.41* (0.19)
Partnered -0.07 (0.12) -0.03 (0.12) -0.04 (0.13) -0.00 (0.14)Parent with children under 18 -0.05 (0.11) -0.03 (0.11) 0.02 (0.12) 0.02 (0.12)Community type (Rural=ref)
Urban -0.07 (0.17) -0.01 (0.16) -0.07 (0.19) -0.01 (0.18)Suburban -0.05 (0.16) 0.01 (0.15) -0.09 (0.18) -0.04 (0.17)
Internet user -0.32 (0.48) -0.69 (0.52) Internet activity 0.12 (0.10) 0.14 (0.09)Frequency of SNSs use 0.00 (0.04) 0.01 (0.04)Mobile Internet devices -0.01 (0.08) 0.02 (0.08) 0.03 (0.08) 0.06 (0.08)App use intensity 0.05 (0.05) 0.06 (0.04) 0.05 (0.05) 0.06 (0.05)App use diversity 0.12*** (0.02) 0.11*** (0.02) Specific types of app use
Informational 0.43* (0.19) 0.40 (0.21)Recreational 0.72** (0.23) 0.78** (0.27)Relational 0.25* (0.12) 0.08 (0.13)Work-related 0.22* (0.11) 0.25* (0.12)
In-person participation 0.23*** (0.04) 0.25*** (0.04) 0.23*** (0.04) 0.23*** (0.04)Constant -1.08* (0.53) -1.52** (0.56) -1.68*** (0.42) -2.48*** (0.45)N 573 573 457 457 Log pseudo-likelihood -2494 -2475 -2094 -2071 Note: Robust standard errors in parentheses. (*** p<0.001, ** p<0.01, * p<0.05).
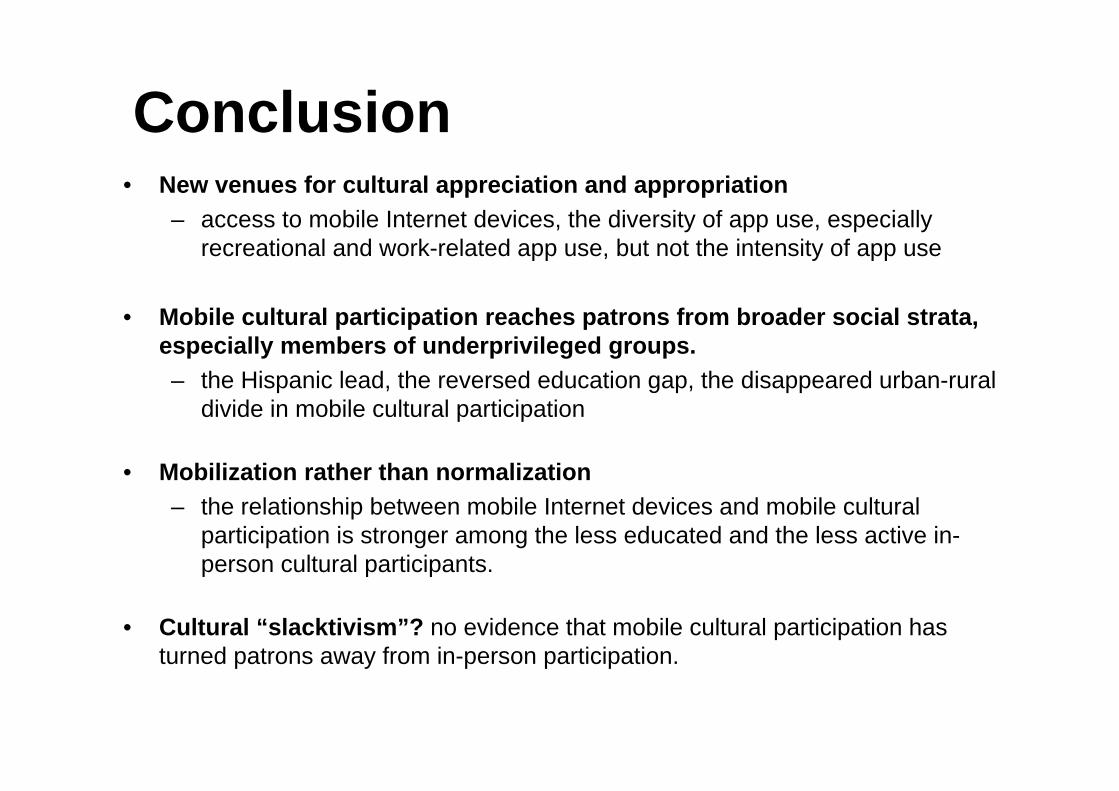
Conclusion• New venues for cultural appreciation and appropriation
– access to mobile Internet devices, the diversity of app use, especially recreational and work-related app use, but not the intensity of app use
• Mobile cultural participation reaches patrons from broader social strata, especially members of underprivileged groups. – the Hispanic lead, the reversed education gap, the disappeared urban-rural
divide in mobile cultural participation
• Mobilization rather than normalization– the relationship between mobile Internet devices and mobile cultural
participation is stronger among the less educated and the less active in-person cultural participants.
• Cultural “slacktivism”? no evidence that mobile cultural participation has turned patrons away from in-person participation.

Whatever art offered the men and women of previous eras, what it offers our own…is space -
a certain breathing room for the spirit. - John Updike
A few words in defense of the armature reader, 1984,
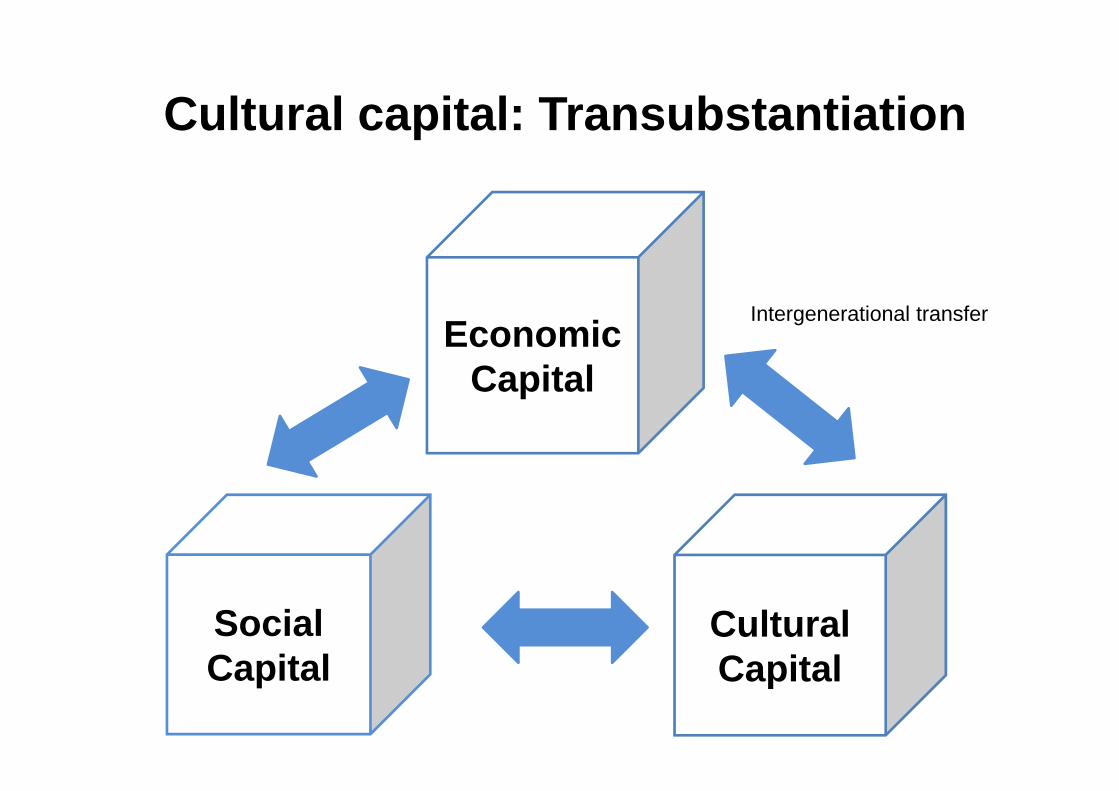
Cultural capital: Transubstantiation
Social Capital
Cultural Capital
Economic Capital
Intergenerational transfer
inferior substitute?
Copyright © 2022 FDOKUMEN