A Study on Fp Z/8 of Anti-Backlash Gear in an Engine - Korea ...
http://apr.sagepub.com/American Politics Research
http://apr.sagepub.com/content/early/2012/10/22/1532673X12463423The online version of this article can be found at:
DOI: 10.1177/1532673X12463423
published online 29 October 2012American Politics ResearchRichard E. Matland and Gregg R. Murray
Techniques Used to Mobilize VotersAn Experimental Test for ''Backlash'' Against Social Pressure
Published by:
http://www.sagepublications.com
On behalf of:
APR at the University of Illinois
can be found at:American Politics ResearchAdditional services and information for
http://apr.sagepub.com/cgi/alertsEmail Alerts:
http://apr.sagepub.com/subscriptionsSubscriptions:
http://www.sagepub.com/journalsReprints.navReprints:
http://www.sagepub.com/journalsPermissions.navPermissions:
What is This?
- Oct 29, 2012OnlineFirst Version of Record >>
at LOYOLA UNIVERSITY CHICAGO on January 10, 2013apr.sagepub.comDownloaded from
American Politics ResearchXX(X) 1 –28
© The Author(s) 2012Reprints and permission:
sagepub.com/journalsPermissions.navDOI: 10.1177/1532673X12463423
http://apr.sagepub.com
463423 APRXXX10.1177/1532673X12463423American Politics ResearchMatland and Murray© The Author(s) 2011
Reprints and permission: http://www.sagepub.com/journalsPermissions.nav
1Loyola University Chicago, Chicago, IL, USA2Texas Tech University, Lubbock, TX, USA
Corresponding Author:Richard E. Matland, Department of Political Science, Loyola University Chicago, 1032 W. Sheridan Road, Chicago, IL 60660, USAEmail: [email protected]
An Experimental Test for “Backlash” Against Social Pressure Techniques Used to Mobilize Voters
Richard E. Matland1 and Gregg R. Murray2
Abstract
This research explores the possibility of psychological reactance, or “back-lash,” against political candidates who use social pressure to mobilize vot-ers. There is a compelling theoretical argument and solid empirical evidence suggesting social pressure substantially increases voter turnout. There is, however, equally noteworthy evidence suggesting social pressure frequently stimulates a negative reaction in targets. This research uses a lab-in-the-field experimental design that employs a hypothetical social pressure message to evaluate whether a candidate’s use of social pressure to turnout voters may increase anger and hostility toward that candidate, possibly to the point it increases the likelihood a citizen will actually vote against that candidate. Our findings indicate social pressure mobilization techniques evoke consequential psychological reactance against their sponsor. Until future research can fur-ther assess these effects, we suggest social pressure mobilization techniques should be used by campaigns only after careful consideration.
at LOYOLA UNIVERSITY CHICAGO on January 10, 2013apr.sagepub.comDownloaded from
2 American Politics Research XX(X)
Keywords
backlash, reactance, voter mobilization, experiment, social pressure, elections, campaigns
Researchers using field experiments have amassed a wealth of evidence con-cerning the effectiveness of get-out-the-vote (GOTV) techniques (see Green & Gerber, 2008, for a review). This literature suggests some techniques are rela-tively ineffective, although others show considerable promise. The literature has been growing as scholars start to fill gaps, such as exploring the factors that explain which voters are most sensitive to GOTV efforts (Arceneaux & Nicker-son, 2009; Matland & Murray, 2012) and methods to enhance GOTV techniques (Arceneaux & Nickerson, 2010; Garcia Bedolla & Michelson, 2009; Gerber, Green, & Larimer, 2008; Gerber & Rogers, 2009; Michelson, Garcia Bedolla, & McConnell, 2009; Panagopoulos, 2009, 2011). One promising thread is the use of social pressure to motivate individuals to turn out to vote. As conceptualized here, social pressure leads to compliance by tapping into a desire to receive posi-tive feedback and avoid negative feedback. Social pressure techniques have been used to influence people’s behavior in such areas as recycling, littering, and tax evasion (see Cialdini & Goldstein, 2004, for a review). Social pressure also has been shown to be effective in mobilizing voters by making individuals aware that their turnout is being monitored, usually through providing them with copies of their past voting history (Davenport, 2010; Gerber, Green, & Larimer, 2008, 2010; Mann, 2010; Panagopoulos, 2010).
Most GOTV research to this point has focused on the positive effects of these techniques. Substantial evidence shows, however, social pressure mes-saging may entail nontrivial risk for its sponsor. People are motivated to resist pressure to comply with limitations on their personal freedoms (Brehm, 1966). Psychological reactance, a theory of social influence, is “the motiva-tional state that is hypothesized to occur when a freedom is eliminated or threatened with elimination” (Brehm & Brehm, 1981, p. 37). Reactance leads to subjects devaluing the actions being promoted, increasing their affect toward the actions being discouraged, refusing to submit to pressure, or expressing aggression or hostility toward the source of the message (Wicklund, 1974). Over decades of research, reactance effects have been found in conjunction with efforts to pursue normatively positive outcomes such as preventing smoking or drug use (Kohn & Barnes, 1977; Wolburg, 2006), limiting alcohol intake or television viewing (Bensley & Wu, 1991; Dillard & Shen, 2005; Herman & Leyens, 1977), and reducing littering and pollution (Geller, Witmer, & Orebaugh, 1976; Mann & Hill, 1984; Mazis,
at LOYOLA UNIVERSITY CHICAGO on January 10, 2013apr.sagepub.comDownloaded from
Matland and Murray 3
1975). Moreover, it has been used to explain unintended consequences result-ing from efforts to promote a wide range of prosocial behaviors, from com-pliance with laws and probation recidivism to helping behavior and gift giving (see Burgoon, Alvaro, Grandpre, & Voulodakis, 2002, for a review). This suggests that using social pressure to turn out voters may not be a risk-less tactic for political actors.
The objective of this research is to explore the potential for psychological reactance (i.e., “backlash”) against candidates who use social pressure to mobilize voters. Despite evidence that social pressure increases turnout, sponsors must also consider how the technique might affect targets’ attitudes toward the sponsor. Does it increase anger and hostility toward the sponsor as reactance theory suggests? More importantly, for the thousands of candidates running for office each electoral season, might this powerful tool demobilize otherwise sympathetic voters, or worse, might it increase the probability that otherwise likely supporters will vote against the candidate?
To address these questions, we provide an overview of the social pressure and psychological reactance literatures as they relate to voter turnout. These literatures provide the basis for three hypotheses, which follow. Subsequent sections describe our lab-in-the-field experimental design and the empirical results. The article concludes with a discussion of the implications, which suggest those who wish to use social pressure as an electoral tool should do so with caution.
Social Pressure to Vote and Psychological ReactanceMotivated by research showing social pressure can influence a wide range of behaviors, Gerber, Green, and Larimer (2008) found social pressure can substantially increase voter turnout. As used in this line of research, social pressure is defined as “communications that play upon a basic human drive to win praise and avoid chastisement” (Green & Gerber, 2010, p. 331). The initial finding has been expanded upon by a number of scholars (Davenport, 2010; Gerber et al., 2010; Mann, 2010; Panagopoulos, 2010). The social pressure exerted in this line of research has ranged from benign to brazen and positive to negative. Light-handed pressure typically includes conventional prompts regarding civic duty, whereas heavy-handed pressure has included threatening public shaming of nonvoters via newspaper advertisements and in mailings to neighbors (Gerber et al., 2008; Panagopoulos, 2010).
The research suggests the more heavy-handed the pressure the greater the increase in turnout. For instance, Gerber et al. (2008) simultaneously tested a
at LOYOLA UNIVERSITY CHICAGO on January 10, 2013apr.sagepub.comDownloaded from
4 American Politics Research XX(X)
series of GOTV mailers. They found that a basic message emphasizing a citi-zen’s civic duty increased turnout by 1.8 percentage points, whereas emphasiz-ing civic duty plus showing subjects their own voting record increased voting by 4.8 percentage points. Finally, emphasizing civic duty plus showing subjects their own voting record and that of their neighbors, as well as suggesting a later mailing would report voting behavior among those living in the neighborhood after the election, increased turnout by a remarkable 8.1 percentage points. In another experimental manipulation of social pressure treatments, Gerber, Green, and Larimer (2010) found that admonishing subjects by pointing to an election in which they abstained, which was intended to evoke feelings of shame, had a greater impact on increasing turnout than praising subjects by pointing out elections in which they voted, which was intended to evoke feel-ings of pride. The variety of treatments used in the social pressure studies has been large, but Green and Gerber summarize the early results of this emerging thread of research by concluding that “monitoring of compliance with social norms appears to be crucial” and “calling attention to past nonvoting is particu-larly effective, as is the threat of shaming non-compliers” (2010, p. 334).
Despite social scientists’ ability to produce striking increases in turnout experiments, political campaigns have been reluctant to adopt these social pres-sure techniques (Issenberg, 2012; Mann, 2010). Their concern is driven by a fear that such messages antagonize voters. This concern has a solid grounding in psychological theory that identifies a negative side to social pressure. Public service messages meant to influence social behavior, such as public health mes-sages, often fail to achieve their intended result (e.g., Noar, 2006). Furthermore, it is not unusual for them to result in a “boomerang” effect in which they pro-duce results contrary to their intent (Byrne & Hart, 2009).
Psychological reactance theory, in particular, “contends that when a per-ceived freedom is eliminated or threatened with elimination, the individual will be motivated to reestablish that freedom” (Dillard & Shen, 2005, p. 145). This motivation is distinct from the motivation to receive positive feedback and avoid negative feedback and is driven by people’s fundamental desire for self-determination in their own environment and strong preference to see themselves as “masters of their own fate” (Burgoon et al., 2002, p. 216). Although the theory suggests any persuasive message can stimulate reac-tance, evidence suggests that more forceful messages arouse stronger reac-tance (Dillard & Shen, 2005; Miller, Lane, Deatrick, Young, & Potts, 2007).
Psychological reactance has been studied widely in social psychology through applications to abstract tasks such as evaluating the attractiveness of unobtainable objects as well as to more concrete, socially beneficial behaviors such as reducing littering, preventing the initiation of smoking in adolescents,
at LOYOLA UNIVERSITY CHICAGO on January 10, 2013apr.sagepub.comDownloaded from
Matland and Murray 5
encouraging the acceptance of public health messages, and stopping illegal drug use (Burgoon et al., 2002). According to the theory, individuals attempt to restore threatened freedoms generally by negative cognition and anger (Dillard & Shen, 2005; Quick & Stephenson, 2007) and more specifically by engaging in the proscribed behavior or a related behavior, increasing positive affect toward the proscribed behavior, ignoring the existence of the threat, and/or derogating the source of the threat (Dillard & Shen, 2005; Kohn & Barnes, 1977; Schwarz, Frey, & Kumpf, 1980; Smith, 1977; Wicklund, 1974; Worchel, 1974).
The only work to measure reactance in the GOTV context has been Mann (2010). Mann’s (2010) field experiment evaluates reactance to social pressure indirectly by looking at the net effect of social pressure and reactance based on applying different levels of social pressure and measuring if they lead to varia-tions in individual turnout. In other words he tests for reactance in terms of nonvoting or engaging in the proscribed behavior (versus derogation of the source of the message). Mann discovers that “gentler” social pressure treat-ments are as successful as more forceful treatments at mobilizing actual voter turnout in his sample of female, unmarried, and low- and moderate-propensity voters in Kentucky. Although Mann’s results suggest there are better and worse ways to mobilize voters with social pressure, he only tests one form of reactance (i.e., engaging in the proscribed behavior) by comparing rates of turnout.
The potential to provoke derogation of the source is a nontrivial consider-ation for candidates and other political actors interested in improving the turnout of targeted audiences. Indeed, Mann’s (2010) test was motivated by the desire of the civic organization with which he partnered to find ways to increase turnout using social pressure “while reducing the risk of backlash.” Although Mann’s design considered failing to vote as a form of reactance, it did not evaluate alternative forms of reactance. As such, we have explicitly developed an experiment to test an alternative, and highly plausible, form of reactance, denigration of the source of social pressure.
To recapitulate, reactance theory suggests individuals who feel pressured to act will resist. The existing literature regarding the effects of social pressure has concentrated on the impact on individual turnout. This research shows individuals do not resist social pressure by ignoring the GOTV message or by acting in contradiction to it; registered voters are more likely to vote. Reactance theory suggests another response may be to attack the source of the message, implying the message is not worthy of serious consideration, thereby restoring in some way the threatened freedom. One could expect this response to be manifested by increased levels of hostility toward the sponsoring candidate
at LOYOLA UNIVERSITY CHICAGO on January 10, 2013apr.sagepub.comDownloaded from
6 American Politics Research XX(X)
and decreased levels of support. We develop an experiment to test directly for reactance by measuring whether social pressure leads to a generalized drop in affective evaluations of the candidate and in willingness to support the candi-date.1 More formally our first two hypotheses are:
Hypothesis 1: Subjects exposed to a GOTV message with social pres-sure will exhibit greater negative affect toward the candidate spon-soring the message than those exposed to a GOTV message without social pressure.
Hypothesis 2: Subjects exposed to a GOTV message with social pres-sure will be less politically supportive of the candidate sponsoring the message than those exposed to a GOTV message without social pressure.
Does Partisan Congruence Mediate Backlash?Although reactance theory leads us to expect a negative response to the appli-cation of social pressure, it is crucial to consider contextual factors that may impact the level of reactivity. Given the salience of partisanship to political behavior and electoral evaluations (e.g., Lewis-Beck, Jacoby, Norpoth, & Weisberg, 2008), we know that co-partisans (those with the same party iden-tification as the candidate) generally evaluate a candidate more positively than out-partisans (those with different party identification than the candidate) across a wide range of characteristics. In this context we are interested in assessing if partisan congruence mediates the reactance effect. Although reac-tance theory suggests both co-partisans and out-partisans should react nega-tively to the social pressure treatment, the literature on partisanship shows that individuals interpret information from their co-partisans more positively and information from opposing partisans more negatively (Bartels, 2002; Druckman, 2001; Kam, 2005), if they do not discount or completely ignore the information. As a result, we predict that for co-partisans the reaction will be negative but moderated because it is being interpreted as positively as pos-sible. There is no such moderating effect for out-partisans; therefore, we expect a larger negative reaction among these subjects.
It would be a concern for a candidate if voters’ reactions are unaffected by their partisan sympathies, and all voters updated their predispositions toward the candidate equally in a negative direction. Certainly, among these initially sympathetic subjects, candidate support and approval have more room to decline. From a practical perspective this is a crucial question. A tactic that mobilizes a candidate’s own voters with only a small negative impact on their
at LOYOLA UNIVERSITY CHICAGO on January 10, 2013apr.sagepub.comDownloaded from
Matland and Murray 7
evaluation of the candidate may be a useful and highly effective tool. Conversely, if the negative effect on a candidate’s “base” is large, then the tactic could be deleterious to a campaign’s primary objective, getting sympa-thetic voters to the polls. Based on evidence concerning the mediating effect of partisan identification on the assessment of political information, we test whether co-partisans are less sensitive to social pressure in terms of reactance than out-partisans. Formally our third hypothesis is:
Hypothesis 3: Among subjects exposed to a GOTV message with social pressure, those who have the same party identification as the sponsoring candidate will exhibit lower levels of reactance than those who do not have the same party identification as the sponsor-ing candidate.
Data and MethodThis research employs a lab-in-the-field experimental design, which permits laboratory-like control of assignment and treatments in more ecologically valid field settings (Morton & Williams, 2010). The data were collected in January and February 2011 from citizens of Lubbock County, Texas, who were called and appeared for jury duty. The county randomly selects potential jurors from lists of individuals 18 years old or older who are registered to vote in Lubbock County or who hold a driver’s license or identification card issued by the Texas Department of Public Safety with a Lubbock County address. This selection procedure makes jury pool subjects similar, although not iden-tical, to the adult population in Lubbock County (Murray, Rugeley, Mitchell, & Mondak, 2012). Subjects were recruited to the study through voluntary participation while they awaited assignment to a trial or dismissal.2
Procedurally, all potential jurors are required to be at the Courthouse by 8 a.m. on the day they are called. They are to remain in the jury pool waiting room until they are impaneled in a jury or dismissed. Generally, jurors have an open period of about 30 minutes at the start of the day in which they can complete surveys. We place clipboards with pencils, explanatory cover let-ters and instructions, which include confidentiality statements, and ran-domly ordered survey-experiments on the first 100 seats before jurors begin to arrive at 7:30 a.m. A researcher or assistant, who is in the waiting room at all times, collects the surveys as subjects complete them. Our sample includes 580 subjects, which represents a response rate of 79%. The response rate is calculated as the number of completed questionnaires divided by the number of distributed questionnaires. The refusals consist of those who refused to
at LOYOLA UNIVERSITY CHICAGO on January 10, 2013apr.sagepub.comDownloaded from
8 American Politics Research XX(X)
answer the questionnaire (17.7%) and those who did answer, but answered less than 50% of the questions (3.3%).3
To gauge the representativeness of our sample, we compare it with county-level data (primarily from the U.S. Census). Online Appendix 1 shows the mean age is 47, just above 60% of the sample is married, and there is signifi-cant variation in reported family income with 42% below US$50,000, 39% between US$50,000 and US$100,000, and 19% above US$100,000. Although the jury pool provides subjects from a limited geographic area who do not perfectly match U.S. Census data, there is no question they are vastly more diverse and representative of typical voters than a student sample (Murray et al., 2012). This can be seen in online Appendix 1 where we also compare our sam-ple to a sample of student subjects who participated in a contemporaneous sur-vey project. To be clear, we believe this sample to be reasonably representative of voters in Lubbock County. As Lubbock County is one of the most politically conservative counties in the country, giving 73% of the two-party vote to the Republican candidate in the 2008 presidential election, it should not be implied this is a representative sample of all U.S. voters.
We use a between-subjects posttest-only 2×2 experimental design. Each subject read a vignette about a hypothetical candidate for the U.S. Senate and viewed a postcard mailer. All postcards included identical civic duty mes-sages. The manipulations consisted of the party identification of the candi-date (two control-related conditions) and the presentation or not of the subject’s hypothetical voting history (two social pressure conditions). The hypothetical voting histories show whether the person had “voted” in the past six statewide elections (see appendix for the vignette and sample mailers). We did not have the names of the jury pool participants, so it was not possible to use their actual voting histories or address the hypothetical mailers to them personally. Instead the mailers were addressed to (“Your Name” at “Your Street Address” in “Your City, State Zip Code”) from the candidate. After reading the vignette and viewing the postcard, subjects then responded to questions about the candidate, mailer, and themselves.
Subjects were assigned randomly to one of four treatment groups. The vot-ing history treatment includes (a) no voting history reported and (b) a hypo-thetical voting history reported.4 In terms of psychological reactance theory, third-party monitoring of an individual’s voting history can be viewed as vio-lating a democratic citizens’ normative expectation of political privacy, which warrants a behavioral or attitudinal response to restore balance. We therefore expect a stronger reactance among voters who receive a voting history. The party identification treatment describes the candidate as either a (a) Democrat or (b) Republican. This controls for candidate-subject party congruence and
at LOYOLA UNIVERSITY CHICAGO on January 10, 2013apr.sagepub.comDownloaded from
Matland and Murray 9
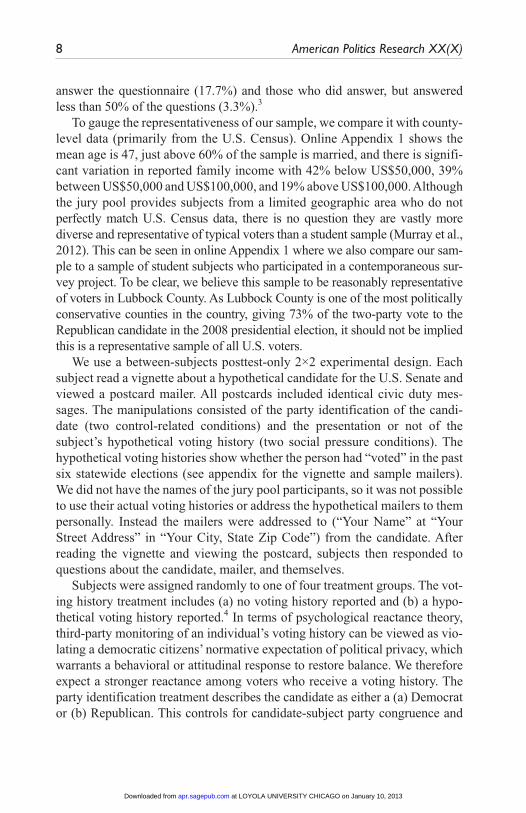
allows us to see if party congruence diminishes the reaction effect. Table 1 summarizes the treatments.
The hypothetical nature of the election makes it possible for the effect of the treatment to be either weaker or stronger than it would be in an actual election. In one sense this design makes the tests for reactance fairly conser-vative, as both the vignette and vote history treatments are fictitious. It seems likely that a postcard with an individual’s actual name and actual voting his-tory concerning an actual election would have a greater impact than a post-card addressed to “your name” at “your street.” However, because we ask for a reaction immediately after seeing the postcard and the respondent has no other information on the candidate other than our short vignette, the impact may be stronger than it would be under different circumstances. As with all experimental research we do not believe one iteration can establish convinc-ing levels of external validity, but we do see this experiment as realistic enough that it will allow us to test whether reactance does occur. Later empir-ical realizations of the treatment in other contexts will be needed to assess accurately the generalizability of our findings.
A comparison of the experimental groups using multinomial probit and standard sociodemographic and political predictors (i.e., subject sex, age, age-squared, education, income, race, marital status, and party identification) sug-gests the subjects do not differ across groups in any meaningful way (Wald χ2 = 67.04, p = .34). The empirical tests assess the effects of the social pressure treatment on multiple dependent variables related to the candidate. We expect subjects assigned to the social pressure treatment groups (M
3 and M
4) will
evaluate the candidate more negatively than subjects in the control groups (M1
and M2) both in terms of affect toward the candidate and support for the
candidate.
Empirical ResultsWe present below a series of statistical models in which seven dependent variables related to evaluations of the candidate are regressed on variables
Table 1. Summary of Treatments
Manipulation Civic duty Vote history Candidate party n
M1
Yes No Democrat 96M
2Yes No Republican 100
M3
Yes Yes Democrat 195M
4Yes Yes Republican 189
at LOYOLA UNIVERSITY CHICAGO on January 10, 2013apr.sagepub.comDownloaded from
10 American Politics Research XX(X)
that represent the experimental manipulations and sociodemographic and political controls. Hypothesis 1 suggests subjects receiving the social pres-sure treatment will have less favorable feelings toward the candidate, be angrier at the candidate, be more afraid of the candidate, and be more likely to call the candidate to complain than subjects in the control group who receive the generic civic duty message with no voting history. Hypothesis 2 suggests subjects receiving the social pressure treatment, when compared with the control group, will be less likely to support, less likely to vote for, and more likely to vote against the candidate.
The sociodemographic control variables include subject age and age-squared, sex (female = 1, male = 0), education (dummy variables for college/professional degree, high school, and less than high school, with the median value of some college or a two-year degree as the base category), race (White = 1, nonwhite = 0), and income (dummy variables for less than US$25,000, US$25,000 to US$49,999, US$75,000 to US$99,999, and US$100,000 or more, with the median value of US$50,000 to US$74,999 as the base cate-gory). The political controls include subject-candidate party congruence and political knowledge. Partisan congruence is coded 1 if the subject identifies with the same party as the candidate and 0 otherwise. Subject partisanship is measured using a 7-point scale with Democrat coded 1 to 3, Independent coded 4, and Republican coded 5 to 7. The political knowledge measure is a five-item, multiple-choice “civics” knowledge scale composed of items such as “Whose responsibility is it to nominate judges to the Federal Courts?” and “Which one of the political parties is more conservative than the other at the national level?” Subjects receive 1 point for each correct answer for a possi-ble minimum score of 0 and maximum score of 5 (see online Appendix 2 for all question wording). To recapture a substantial number of observations that otherwise would be lost due to missing values, the control variables (i.e., sex, race, income, political knowledge, and partisan congruence) are specified as a series of indicator variables that includes an indicator for missing observa-tions on each measure. Including indicators for the missing observations for these measures allows us to retain a number of observations (approximately 25% in each model) that would be deleted otherwise.
Manipulation ChecksGreen and Gerber’s (2010) findings regarding the application of social pres-sure to voter mobilization emphasize monitoring of the social norm to vote as critical. Further, according to reactance theory, backlash is an attempt to
at LOYOLA UNIVERSITY CHICAGO on January 10, 2013apr.sagepub.comDownloaded from
Matland and Murray 11
resist pressure to comply with limitations on personal freedoms (e.g., Brehm, 1966; Brehm & Brehm, 1981; Dillard & Shen, 2005). In these contexts, individuals subject to social pressure are expected to feel their voting behav-ior is being monitored and to note greater limitations on their personal free-dom (i.e., violation of their political privacy).
To confirm these theoretical mechanisms, we presented, through online survey instruments, the postcard treatments, as well as a series of questions, to 440 undergraduate students at a large public university in the same county. The treatments were randomly assigned.5 The students were enrolled in intro-ductory political science classes that are required for graduation, so students in these classes represent a diverse range of majors. Student subjects received extra credit on a class assignment for completing the experiment. Participation was voluntary. Subjects’ mean age was 21. There were more males (52%) than females. Almost 73% indicated that the racial or ethnic group that best describes them is White or Caucasian, 13% indicated Hispanic or Latino/Latina, and 7% indicated Black or African American.
To confirm the treatments invoked feelings of being monitored, subjects responded to two questions: “If you received the postcard sent by the Harper for Senate campaign, how likely or unlikely would it be to (a) “make you feel like someone is watching whether or not you vote,” and (b) “make you feel like the Harper campaign is monitoring you.” Both measures were coded 1 for very unlikely to 7 for very likely. As expected, compared with the control group, which received only the civic duty message, subjects treated with social pressure indicated they were more likely to feel like someone was watching whether or not they vote (4.3 vs. 3.3; p < .001) and more likely to indicate they feel the campaign is monitoring them (3.8 vs. 2.9; p < .001).
To confirm the treatments invoked feelings of violated privacy, subjects responded to two questions following the same question stem: “If you received the postcard sent by the Harper for Senate campaign, how likely or unlikely would it be to” (a) “make you feel like your right to privacy has been violated,” and (b) “the Harper campaign has too much information about you.” The measures were coded as above. Again, as expected, subjects treated with social pressure indicated they were more likely to feel their right to pri-vacy has been violated (3.8 vs. 3.0; p < .001) and more likely to feel the campaign has too much information about them (3.9 vs. 3.2; p < .001). These results present solid confirmation that the theoretical mechanisms operate as expected. The treatments indeed lead subjects to feel they are being moni-tored and their privacy is being infringed upon.
at LOYOLA UNIVERSITY CHICAGO on January 10, 2013apr.sagepub.comDownloaded from
12 American Politics Research XX(X)
Finally, a discussion of a related check is in order. This research is motivated by findings that social pressure can increase voter turnout (e.g., Gerber et al., 2008). We tested to see if our social pressure treatment increased subjects’ self-reported likelihood of voting. It did not (p = .41). Although this differs from the results of previously published research, it is consistent with our own work. We found, in the context of the gubernatorial election in Texas in 2010, that non-partisan GOTV postcards with vote history had no greater impact than a generic GOTV mailer (Matland & Murray, 2011). It may be, for instance, that this sample is so sensitive that it not only reacts negatively in terms of the messen-ger, that is, the affective evaluations of and willingness to support the sponsor-ing candidate, but also in terms of the message, that is, voter mobilization. For now it is useful to note that the impact of the hypothetical social pressure post-card in our experiment does not deviate from the results in an actual field test of the postcard. At a minimum the ability to generalize about the impact of social pressure mobilization across all states has not been established. Let us then turn to whether those feelings lead to reactance.
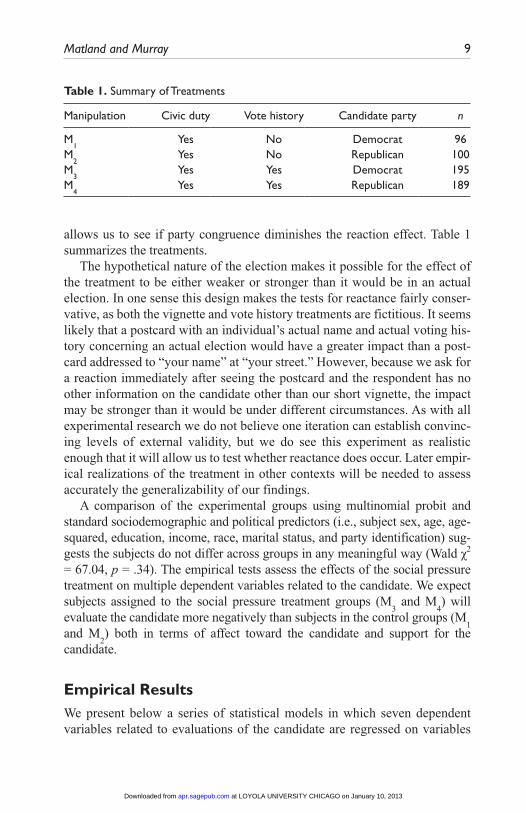
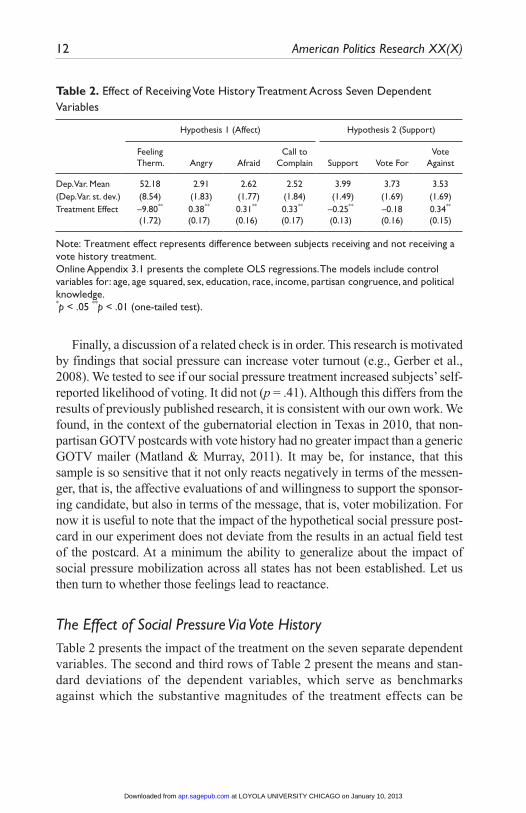
The Effect of Social Pressure Via Vote HistoryTable 2 presents the impact of the treatment on the seven separate dependent variables. The second and third rows of Table 2 present the means and stan-dard deviations of the dependent variables, which serve as benchmarks against which the substantive magnitudes of the treatment effects can be
Table 2. Effect of Receiving Vote History Treatment Across Seven Dependent Variables
Hypothesis 1 (Affect) Hypothesis 2 (Support)
Feeling Therm. Angry Afraid
Call to Complain Support Vote For
Vote Against
Dep. Var. Mean 52.18 2.91 2.62 2.52 3.99 3.73 3.53(Dep. Var. st. dev.) (8.54) (1.83) (1.77) (1.84) (1.49) (1.69) (1.69)Treatment Effect –9.80**
(1.72)0.38** (0.17)
0.31** (0.16)
0.33** (0.17)
–0.25** (0.13)
–0.18 (0.16)
0.34** (0.15)
Note: Treatment effect represents difference between subjects receiving and not receiving a vote history treatment.Online Appendix 3.1 presents the complete OLS regressions. The models include control variables for: age, age squared, sex, education, race, income, partisan congruence, and political knowledge.*p < .05 **p < .01 (one-tailed test).
at LOYOLA UNIVERSITY CHICAGO on January 10, 2013apr.sagepub.comDownloaded from
Matland and Murray 13
assessed; these are followed by the estimated treatment effect, given by the unstandardized regression coefficient for the treatment.6 Due to the greater ease of interpretability over alternative estimation methods we used ordinary least squares (OLS) regressions with robust standard errors for our analyses. To confirm the reliability of this approach, the models were estimated using ordered probit, and the results do not differ meaningfully from the reported OLS estimates. We expect subjects who receive a mailer with a voter history (treatment groups M
3 and M
4) to evaluate the candidate more negatively than
subjects receiving a mailer with no voter history (control groups M1 and M
2).
The first test of Hypothesis 1 is shown in the second column where the dependent variable is the feeling thermometer score toward the candidate. The measure is a 101-point scale coded 0 when the subject felt maximally unfavor-able toward the candidate to 100 when the subject felt maximally favorable toward the candidate. The postcard with the explicit social pressure message statistically and substantively reduced the feeling thermometer ratings of the candidate by almost 10 degrees. With all variables set at values equal to their median this translates into a decrease in predicted feeling thermometer ratings from 50.1 for untreated subjects to 40.3 for treated subjects.
The second and third dependent variables also test Hypothesis 1 and directly reference the mailer. They employ two standard measures of nega-tive affect from the American National Election Studies: “If you received the postcard sent by the Harper for Senate campaign, how likely or unlikely would it be to:” “make you angry?” and “make you afraid?” Both items are measured on a 7-point scale coded 1 for very unlikely to 7 for very likely. The results support Hypothesis 1. This form of social pressure is more likely to make those who receive it angry (p = .01, one-tailed) and afraid (p = .03, one-tailed). With the controls set at their median values, these effects translate into an increase in the predicted anger score from 3.3 to 3.7 and in the pre-dicted fear score from 2.9 to 3.2.
We also asked if the postcard increases the likelihood that an individual will take the unusual step to make their displeasure known to the campaign. The questionnaire includes an item asking how likely the mailer is to moti-vate the subject to call the campaign to complain. As expected, the fourth dependent variable indicates that social pressure is more likely to motivate a subject to call the campaign to complain (p = .03, one-tailed), which trans-lates into a predicted increase in motivation to call to complain for the typical subject from 2.8 to 3.1.
Columns 6-8 report tests of Hypothesis 2, which asserts that increased social pressure leads to less support for the sponsor of social pressure.
at LOYOLA UNIVERSITY CHICAGO on January 10, 2013apr.sagepub.comDownloaded from
14 American Politics Research XX(X)
Column 6 indicates the impact of being given a vote history on likely support for the candidate. Likely support is a 7-point scale coded 1 when the subject was “very unlikely” to support the candidate and 7 when the subject was “very likely” to support the candidate. Consistent with Hypothesis 2, the results suggest using social pressure created a backlash against the candidate. Receiving a voter history reduced subjects’ likely support scores for the can-didate by a statistically significant one-quarter of a point. This effect trans-lates into a drop in predicted support score from 3.4 for the subjects not receiving the treatment to 3.1 for those receiving it.
Our sixth and seventh dependent variables ask, “If you received the post-card sent by the Harper for Senate campaign, how likely or unlikely would it be to motivate you to vote for [Harper]” or “against [Harper]?” The items are measured on a 7-point scale coded 1 for very unlikely to 7 for very likely. The results are generally supportive of Hypothesis 2. Although the social pressure treatment decreases motivation to vote for the candidate, the impact is not statistically significant. The postcard does, however, statistically increase motivation to vote against the candidate. Receiving a voter history increased the motivation to vote against the candidate by one-third of a point. With the controls again held at values that represent the typical subject, this effect translates into an increase in predicted score for voting against the candidate from 4.0 for untreated subjects to 4.4 for treated subjects.
These results broadly support Hypotheses 1 and 2. This form of social pres-sure leads to increased negative affect toward and decreased support for a spon-soring candidate. Although the impacts are not dramatic, they are statistically significant and persistent. Furthermore, it is worth noting these results are obtained despite the impersonal nature of the stimuli. The mailers participants viewed were addressed to “Your Name” at “Your Street Address” in “Your City, State Zip Code” and the voting records they received were fictitious.
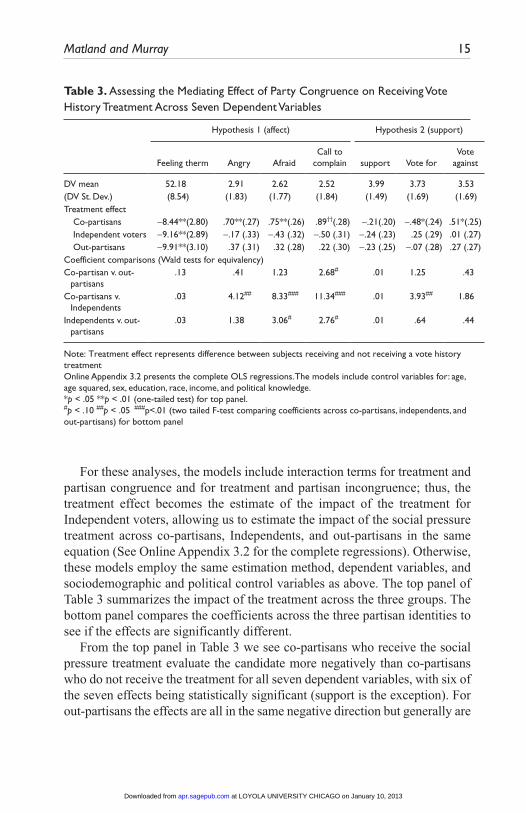
The Effect of Partisan Congruence on ReactanceAs we noted the effect of partisan mailings may be impacted by the partisan congruence of the respondent and the candidate. To test the mediating effects of partisanship and, in particular, partisan congruence, we estimated the separate effects of backlash across three separate groups of respondents: co-partisans, whom we expect to be somewhat more tolerant of the mes-sage, Independents, whom we expect a priori are unlikely to have a positive or negative perspective on the candidate, and out-partisans, whom we expect to show greater skepticism to the candidate because the message comes from across the party divide.
at LOYOLA UNIVERSITY CHICAGO on January 10, 2013apr.sagepub.comDownloaded from
Matland and Murray 15
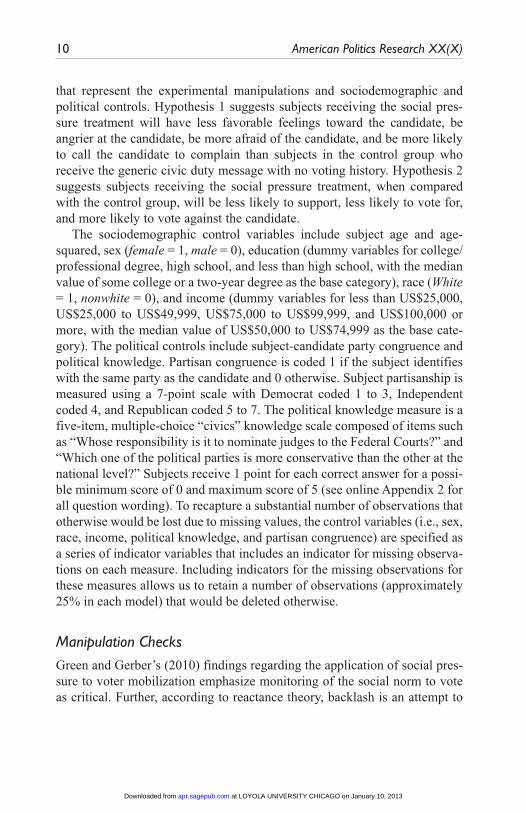
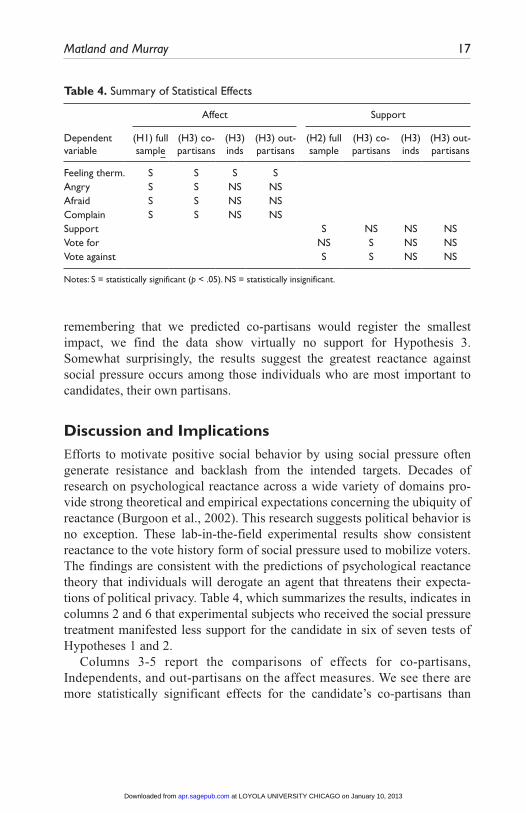
For these analyses, the models include interaction terms for treatment and partisan congruence and for treatment and partisan incongruence; thus, the treatment effect becomes the estimate of the impact of the treatment for Independent voters, allowing us to estimate the impact of the social pressure treatment across co-partisans, Independents, and out-partisans in the same equation (See Online Appendix 3.2 for the complete regressions). Otherwise, these models employ the same estimation method, dependent variables, and sociodemographic and political control variables as above. The top panel of Table 3 summarizes the impact of the treatment across the three groups. The bottom panel compares the coefficients across the three partisan identities to see if the effects are significantly different.
From the top panel in Table 3 we see co-partisans who receive the social pressure treatment evaluate the candidate more negatively than co-partisans who do not receive the treatment for all seven dependent variables, with six of the seven effects being statistically significant (support is the exception). For out-partisans the effects are all in the same negative direction but generally are
Table 3. Assessing the Mediating Effect of Party Congruence on Receiving Vote History Treatment Across Seven Dependent Variables
Hypothesis 1 (affect) Hypothesis 2 (support)
Feeling therm Angry AfraidCall to
complain support Vote forVote
against
DV mean 52.18 2.91 2.62 2.52 3.99 3.73 3.53(DV St. Dev.) (8.54) (1.83) (1.77) (1.84) (1.49) (1.69) (1.69)Treatment effect Co-partisans -8.44**(2.80) .70**(.27) .75**(.26) .89††(.28) -.21(.20) -.48*(.24) .51*(.25) Independent voters -9.16**(2.89) -.17 (.33) -.43 (.32) -.50 (.31) -.24 (.23) .25 (.29) .01 (.27) Out-partisans -9.91**(3.10) .37 (.31) .32 (.28) .22 (.30) -.23 (.25) -.07 (.28) .27 (.27)Coefficient comparisons (Wald tests for equivalency)Co-partisan v. out-
partisans.13 .41 1.23 2.68# .01 1.25 .43
Co-partisans v. Independents
.03 4.12## 8.33### 11.34### .01 3.93## 1.86
Independents v. out-partisans
.03 1.38 3.06# 2.76# .01 .64 .44
Note: Treatment effect represents difference between subjects receiving and not receiving a vote history treatmentOnline Appendix 3.2 presents the complete OLS regressions. The models include control variables for: age, age squared, sex, education, race, income, and political knowledge.*p < .05 **p < .01 (one-tailed test) for top panel.#p < .10 ##p < .05 ###p<.01 (two tailed F-test comparing coefficients across co-partisans, independents, and out-partisans) for bottom panel
at LOYOLA UNIVERSITY CHICAGO on January 10, 2013apr.sagepub.comDownloaded from
16 American Politics Research XX(X)
smaller. Although out-partisans who receive the social pressure treatment evaluate the candidate in a more negative manner than untreated out-partisans, in only one case is the difference statistically significant (feeling thermome-ter). For Independents, some effects are not even in the expected direction and more importantly they are only statistically significant in one case (feeling thermometer).
In the bottom panel of Table 3, Wald test results indicate whether there is a statistically significant difference between coefficients measur-ing the impact of the treatment variable across the three subgroups. Although the regression coefficients are generally larger for co-partisans than out-partisans, there is only one case where the difference between the coefficients is sufficiently large to be statistically different (call to complain). Even in this case the stronger impact may not indicate greater anger or reactance on the part of co-partisans compared with out-partisans, but rather may be a consequence of out-partisans being more dismissive of the candidate of the other party and feeling no need or desire to “waste their time” complaining.
Although the effects appear smaller for out-partisans, we did have some concern that part of the explanation for the smaller effects might be a floor effect. Inspecting the data, there is some rationale for such a concern for a couple of the dependent variables. Analysis of the control sample finds incongruent respondents generally score lower than congruent respondents, and at least for a couple of dependent variables there is a noticeably larger proportion of the incongruent respondents in the control sample that are already at a corner solution. For example, on the question of willingness to vote for Harper, 17.6% of the incongruent subjects are already at 1 (the low-est, most unfavorable, response possible), whereas only 5.2% of the congru-ent subjects are at this level. If the treatment groups were equivalent, as they are expected to be, this is 12.4 percentage points more of the incongruent sample than the congruent sample that cannot go lower on their scores because they are already at the lowest possible point. The dependent vari-able with the next highest proportion at the floor level is 8.3% for support of the candidate versus 3.9% for co-partisans. A larger portion of the sample at the floor level for out-partisans may help to explain the appearance of a stronger negative effect for co-partisans, although the effects are not strong enough that they could lead to the effect being stronger for out-partisans.
When comparing co-partisans with Independents we see consistent differ-ences. For four of the seven dependent variables the reaction is stronger and more negative among co-partisans than among Independent voters. Overall,
at LOYOLA UNIVERSITY CHICAGO on January 10, 2013apr.sagepub.comDownloaded from
Matland and Murray 17
remembering that we predicted co-partisans would register the smallest impact, we find the data show virtually no support for Hypothesis 3. Somewhat surprisingly, the results suggest the greatest reactance against social pressure occurs among those individuals who are most important to candidates, their own partisans.
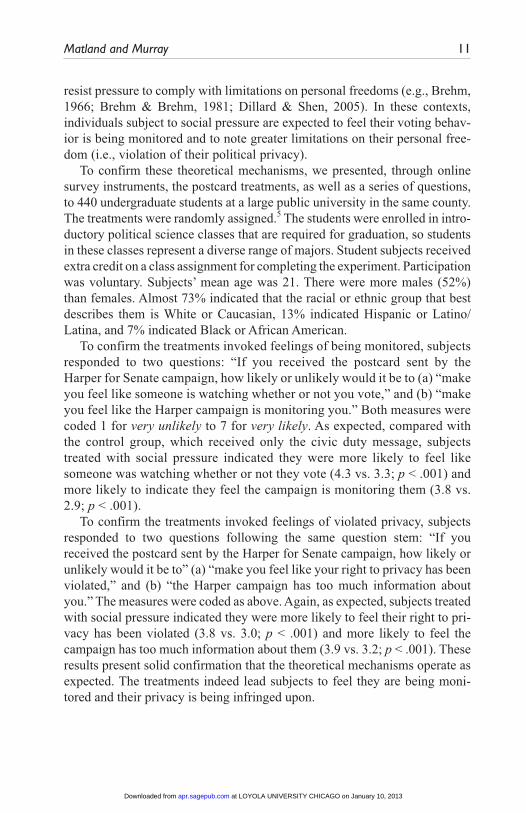
Discussion and ImplicationsEfforts to motivate positive social behavior by using social pressure often generate resistance and backlash from the intended targets. Decades of research on psychological reactance across a wide variety of domains pro-vide strong theoretical and empirical expectations concerning the ubiquity of reactance (Burgoon et al., 2002). This research suggests political behavior is no exception. These lab-in-the-field experimental results show consistent reactance to the vote history form of social pressure used to mobilize voters. The findings are consistent with the predictions of psychological reactance theory that individuals will derogate an agent that threatens their expecta-tions of political privacy. Table 4, which summarizes the results, indicates in columns 2 and 6 that experimental subjects who received the social pressure treatment manifested less support for the candidate in six of seven tests of Hypotheses 1 and 2.
Columns 3-5 report the comparisons of effects for co-partisans, Independents, and out-partisans on the affect measures. We see there are more statistically significant effects for the candidate’s co-partisans than
Table 4. Summary of Statistical Effects
Affect Support
Dependent variable
(H1) full sample
(H3) co-partisans
(H3) inds
(H3) out-partisans
(H2) full sample
(H3) co-partisans
(H3) inds
(H3) out-partisans
Feeling therm. S S S S Angry S S NS NS Afraid S S NS NS Complain S S NS NS Support S NS NS NSVote for NS S NS NSVote against S S NS NS
Notes: S = statistically significant (p < .05). NS = statistically insignificant.
at LOYOLA UNIVERSITY CHICAGO on January 10, 2013apr.sagepub.comDownloaded from
18 American Politics Research XX(X)
either Independents or out-partisans. Further, treated subjects manifested sta-tistically greater negative impact with respect to support and willingness to vote against the candidate than untreated subjects in two of the three direct tests of Hypothesis 2, reported in column 6. Columns 7-9 present the tests of the mediating effects of partisan congruence with respect to support. We see two of the three effects for co-partisans were significant, whereas none were significant for Independents or out-partisans.
If we take into consideration the tests for statistical differences and the size of the impact of the coefficients, we can piece together a story regarding the mediating effects of partisanship. Part of the story is unambiguous. There is clear and strong reactance occurring among co-partisans as six of the seven dependent variables showed a statistically significant impact from the treat-ment. Although a candidate receives an initial positive endorsement because of party congruence, social pressure can weaken the endorsement. We see there is a consistent drop in candidate regard for all of the dependent vari-ables by the co-partisans of the candidate. The candidate has farther to fall with co-partisans. Also, there may be a greater sense of annoyance when it is “one of your own” who engages in coercive pressuring behavior, which may lead to the strong drop across the affect and support variables. More ambiguous is the impact among out-partisans and Independents. Although out-partisans only had one statistically significant impact (feeling thermometer score), it also is true that there was only one case where the impact of the treatment on out-partisans was different enough from the impact on co-partisans to meet a stan-dard test of significance. Part of this weaker impact may be caused by floor effects among out-partisans. We cautiously suggest the data indicate reac-tance is occurring among out-partisans, but the impact is possibly weaker than for co-partisans. There is no basis on which to argue the effect is weaker among co-partisans than out-partisans. Finally, the impact for Independent voters is the least consistent. We suspect this at least partially is explained by a general disinterest in politics among a significant number of Independents.7 They simply care less about politics and as such they are less likely to react strongly against the social pressure postcard. They are noticeably different from co-partisans (four of the seven coefficients are significantly different), and they are not strongly upset by the postcard they viewed.
Regardless of how the results for out-partisans and Independents are interpreted, it is clear there is a strong reactance effect among co-partisans. This raises important questions for political practitioners, who are at least as concerned about alienating sympathetic voters as they are about mobilizing them. Does this form of social pressure turn voters against a sponsoring
at LOYOLA UNIVERSITY CHICAGO on January 10, 2013apr.sagepub.comDownloaded from
Matland and Murray 19
candidate? The affective evaluations drop as all treated subjects give the candidate a dramatically lower feeling thermometer score than untreated subjects; furthermore, co-partisan subjects treated with a vote history are more likely to be angry, afraid, and to complain to the campaign. In no way are these characteristics with which candidates want to be associated. Further the treatment substantially increases the likelihood that an otherwise sympa-thetic voter (i.e., a co-partisan) will vote against the candidate. These results suggest this form of social pressure has the potential to turn voters against its sponsor.
Before political scholars and practitioners draw definitive conclusions about the technique, a number of important issues should be addressed in future studies. First, one cannot infer directly from these findings that social pressure mobilization techniques result in a net loss of votes cast for a spon-soring candidate. Even if the technique may negatively impact some voters’ views of the candidate, if it were highly effective in getting a candidate’s supporters to the polls it may be a wise strategic decision to use such a tool. This research design cannot discern if the technique drives away more voters, either to abstention or the opponent, than it drives to the polls in support of a candidate. Future research should specifically assess the trade-off between vote choice losses and turnout gains.
Second, the external validity of the results, as with all experiments, must be considered. We believe this research is especially important because it is the first that directly, rather than indirectly, measures reactance to social pres-sure in the voter mobilization context. It finds a consequential reactance impact, and clearly finding a direct reactance effect is a crucial first step. The next steps are to study the conditions under which reactance occurs. There are a number of factors to consider when evaluating external validity.
We believe our sample should increase confidence in the experiment’s external validity. By drawing our subjects from jury pools, which are com-posed of randomly selected individuals who are required by law to appear, we believe we are tapping a sample that looks like typical voters, at least for Lubbock County. By using this sample, we also believe we are overcoming several of the well-known problems of college student samples such as homogeneity and inchoate attitudes, which raise questions about the general-izability of results beyond campus boundaries (e.g., Henrich, Heine, & Norenzayan, 2010; Mintz, Redd, & Vedlitz, 2006; Sears, 1986). In our spe-cific context, with a median age of 47 these respondents have seen many pieces of political mail over their lifetime, and many will have very strong
at LOYOLA UNIVERSITY CHICAGO on January 10, 2013apr.sagepub.comDownloaded from
20 American Politics Research XX(X)
and set political leanings that should make them less sensitive to our treat-ments. Despite this, we find unambiguous results.
It is clear, however, these subjects are not representative of the general vot-ing population in the United States. Lubbock County is one of the most politi-cally conservative counties in the country, and these results may be an artifact of the general political orientation of the area.8 Further, regional differences may account for these findings, such as a southern “culture of honor” (Nisbett & Cohen, 1996), in which individuals tend to respond more aggressively to challenges to personal reputation. There is a need for replications in different sites, under different conditions, and with different messages.
Third, increasing experimental realism would both augment external validity and help us gain a better understanding of the magnitude of the treat-ment effect. Despite the generic and impersonal nature of the stimuli (i.e., a mailer addressed to “Your Name” at “Your Street Address” in “Your City, State Zip Code” with a hypothetical voting record), the treatments were forceful enough to generate consistent effects across our seven dependent variables. That said, the treatment effects are modest. It is not unreasonable to conclude, however, that personalized treatments (e.g., using subject’s actual name and vote history, as would be possible with a field experiment) would result in even stronger effects. On the other hand, this experiment may magnify the impact of the treatments as we focus voters’ attention on the mailer with no other information on the campaign. In a richer context, it is possible the impact may be smaller. Further, the questionnaire asks individu-als to predict their future behavior with respect to voting, which is difficult to predict for all but the most ardent habitual voters and abstainers. We are quite confident of the direction of the impact, but less confident of the size of the impact. The next step is to conduct a field test to evaluate carefully the reac-tance effects and weigh them against the increases in turnout.
Finally, the use of social pressure by noncandidate organizations should be evaluated. Even if further study confirms candidates’ use of the technique creates backlash against sponsoring candidates, it may not have the same negative effect if used by non-partisan civic organizations whose use of social pressure may be justified by voters as for the greater good of the com-munity. Alternatively, political groups with more narrow interests such as independent groups and “Super PACs” may evoke a strong negative response when using these techniques, but such a response may only indirectly impact a candidate’s affective evaluation. These groups may be more willing to employ techniques that are likely to engender backlash due to their lack of accountability and feeling of relative security that their candidate will not be
at LOYOLA UNIVERSITY CHICAGO on January 10, 2013apr.sagepub.comDownloaded from
Matland and Murray 21
hurt by reactance. These organizations have no reputation to protect and therefore, little long-term concern about angering voters.
Brooks and Murov (2012) look at the impact of negative advertising and find that varying the sponsor had no impact on the persuasiveness of an attack ad, but it had a direct and very large impact on the backlash against the can-didate who stood to gain from the attack. When the advertisement was pre-sented as sponsored by a specific candidate, the ad was persuasive in terms of the attack on the opposing candidate, but in addition the backlash against the sponsoring candidate was approximately equal in size to the drop in the eval-uation of the candidate who was attacked. When the same advertisement was attributed to an independent organization with no clear ties to a candidate or party, or to no sponsor at all, the advertisement was just as effective in per-suading voters of the negative characteristics of the candidate being attacked, but the candidate who gained from the attack was effectively shielded, with a much smaller drop in evaluations. In other words, backlash was minimized by shielding the preferred candidates from reactance behind the anonymity of a nondescript organization. If this is true of attack ads, it is likely to be even truer of high pressure GOTV drives. By using generic and virtuous sounding names and operating with a general lack of transparency, it would be exceed-ingly hard for voters, even if socially pressured, to know which candidate they should be mad at.
In summary, one of the most interesting and powerful findings in GOTV experiments is that social pressure can be used to mobilize voters. Research from social psychology and communications, though, predicts that individu-als may respond negatively to such efforts to induce positive social behavior. Political campaigns intuitively have been hesitant to employ these techniques (Issenberg, 2012; Mann, 2010), and scholars investigating the powerful effects of social pressure on voter turnout have speculated that political orga-nizations using these measures may antagonize targeted citizens (Green & Gerber, 2008; Mann, 2010). Informed by psychological reactance theory, this research presents systematic evidence that, indeed, there can be undesired consequences when social pressure is used by candidates to mobilize voters. Despite its power to increase turnout, we find a candidate’s use of social pres-sure to get out the vote may increase voter anger toward the candidate, increase negative evaluations of the candidate, and increase the likelihood that a voter will vote against the candidate, even though the voter may be predisposed to vote for the candidate. Although these results need to be rep-licated and expanded, they indicate social pressure should be used by politi-cal practitioners with caution.
at LOYOLA UNIVERSITY CHICAGO on January 10, 2013apr.sagepub.comDownloaded from
22 American Politics Research XX(X)
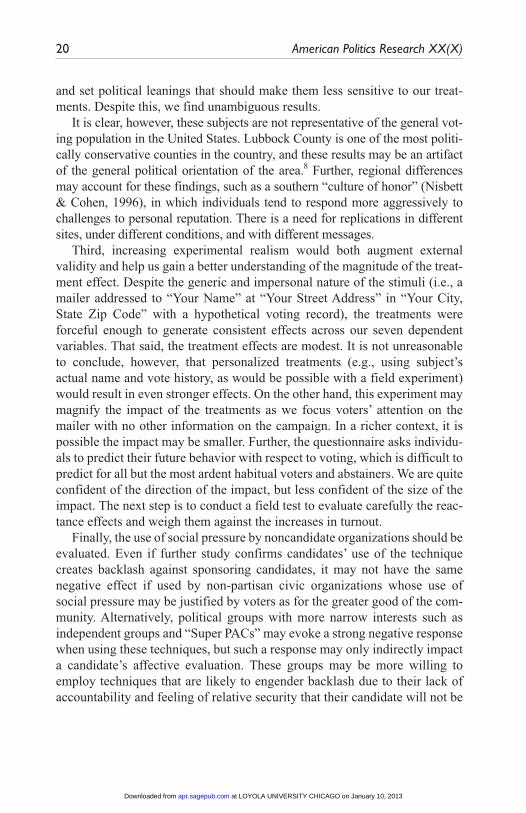
Appendix: Vignette and Mailers
John Harper is running for U.S. Senator in Texas. Harper is a widely respected member of the U.S. House of Representatives who has served in the U.S. House for five terms. The congressman has a long list of political achievements. He has been the chair of the House Armed Services committee for four years, is credited with leading congressional negotiations over a major tax reform bill, sponsored a popular bill that changed how federal public education funding is distributed, introduced legislation to signifi-cantly amend energy and environmental laws, and is an active and influential member of the House-Senate Joint Committee on Economic Development.
Before being elected to the U.S. House, Harper served two terms in the Texas State House of Representatives and practiced law for several years. Supporters and opponents agree that Harper, a Democrat [Republican], is intelligent and articulate with proven leadership skills. The congressman has been married for 26 years and has two adult children.
Three days before the election, you receive the following postcard in the mail addressed to you from John Harper’s campaign:
[Front of Mailer, All Groups]
[Back of Mailer, Control Groups]
at LOYOLA UNIVERSITY CHICAGO on January 10, 2013apr.sagepub.comDownloaded from
Matland and Murray 23
Declaration of Conflicting Interests
The author(s) declared no potential conflicts of interest with respect to the research, authorship, and/or publication of this article.
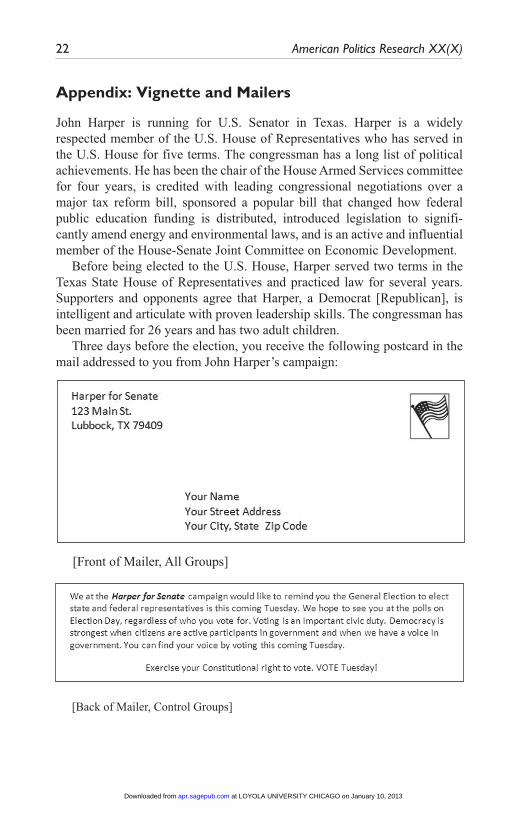
[Back of Mailer, Vote History: Frequent (50% of treatment mailers)]
[Back of Mailer, Vote History: Infrequent (50% of treatment mailers)]
at LOYOLA UNIVERSITY CHICAGO on January 10, 2013apr.sagepub.comDownloaded from
24 American Politics Research XX(X)
FundingThe author(s) received no financial support for the research, authorship, and/or pub-lication of this article.
Notes
1. There is of course a cost, as we are forced to develop an experiment with a hypo-thetical election to measure reactance directly.
2. The Lubbock County Board of Judges approved the use of the jury pool for these research purposes. Court personnel did not participate in the administration or processing of the surveys or data.
3. Our results are robust to whatever survey completion rate (i.e., what proportion of the survey they must answer to be included in the study) we choose as acceptable. We believe a 50% survey completion rate is a reasonable attempt at trading off cov-erage with quality of responses. There are very few people who started the survey yet answered less than half the questions (only 3.3% of the sample). Most of these do not have values on the dependent variables and would be deleted anyway in our models. If we set our standards higher, for instance, at 75% of questions answered, we lose an additional 4% of the sample. When we rerun the regressions with the more rigorous 75% standard we find the treatments have slightly larger effects.
4. Following Gerber et al. (2010) and Panagopoulos (2010), we initially hypothesized differential effects for frequent (pride inducing) and infrequent (shame inducing) vote history treatments. Therefore, we presented one-third of the subjects with a frequent voting treatment (hypothetically voted in five of six elections) and one-third of the subjects with an infrequent voting treatment (hypothetically voted in two of six elections). The final third represents the controls who only received the civic duty message. This explains why there are three different versions of the mailer as seen in the appendix. Statistical analyses of the seven dependent variables showed no differential effects for the two voting treatments except for the depen-dent variable: call to complain. We suspect the stimuli (i.e., the postcards) have suf-ficient impact to relay the message that campaigns are monitoring an individuals’ voting behavior, but using a hypothetical voting record to assess different effects for high- and low-turnout records is demanding too much of our intervention. We believe people realize their voting record could be included in a similar postcard, but when reacting they think in terms of their actual voting history rather than the one we have made up. To simplify the analyses and to focus as directly as possible on the key relationships, we treat the two voting treatments as one in our analyses.
5. Running a multinomial probit model using sex, party identification, income, and race as independent variables, we find the different treatment groups are statisti-cally equivalent (p = .37).
at LOYOLA UNIVERSITY CHICAGO on January 10, 2013apr.sagepub.comDownloaded from
Matland and Murray 25
6. The full models are presented in detail in online Appendix 3.1. For Tables 2 and 3 and for the models reported in online Appendices 3.1 and 3.2, we present unstan-dardized OLS regression coefficients with robust standard errors. The substantive results are equivalent when no controls are included.
7. Independent subjects expressed substantially less political interest than their partisan counterparts. In response to a question asking if the respondent is interested in politi-cal campaigns, the mean for Independents was 3.60 (.15), whereas the mean for par-tisans was 4.80 (.09), with the scale coded 1 (very uninterested) to 7 (very interested).
8. To test whether these results are sensitive to the skewed distribution that is highly Republican, we reweighted the cases using a weight of .66 for each Republican respondent and a weight of 1.8 for each Democratic respondent. This changes the marginal distribution of our sample from 20.2% Democrats and 54.2% Republi-can in the initial distribution to 36.2% Democratic and 35.7% Republican in the weighted sample. Rerunning the analyses in Table 3 results in no changes in signifi-cance levels for the dependent variables and no changes in the F-tests comparing the treatment effects across the congruent, independent, and incongruent samples.
References
Arceneaux, K., & Nickerson, D. W. (2009). Who is mobilized to vote? A re-analysis of 11 field experiments. American Journal of Political Science, 53, 1-16.
Arceneaux, K., & Nickerson, D. W. (2010). Comparing negative and positive cam-paign messages: Evidence from two field experiments. American Politics Research, 38, 54-83.
Bartels, L. M. (2002). Beyond the running tally: Partisan bias in political perceptions. Political Behavior, 24, 117-150.
Bensley, L. S., & Wu, R. (1991). The role of psychological reactance in drinking fol-lowing alcohol prevention messages. Journal of Social Psychology, 21, 1111-1124.
Brehm, J. W. (1966). A theory of psychological reactance. New York, NY: Academic Press.
Brehm, S. S., & Brehm, J. W. (1981). Psychological reactance: A theory of freedom and control. New York, NY: Academic Press.
Brooks, D. J., & Murov, M. (2012). Assessing accountability in a post-Citizens United era: The effects of attack ad sponsorship by unknown independent groups. Ameri-can Politics Research, 40, 383-418.
Burgoon, M., Alvaro, E., Grandpre, J., & Voulodakis, M. (2002). Revisiting the the-ory of psychological reactance: Communicating threats to attitudinal freedom. In J. P. Dillard & M. Pfau (Eds.), The persuasion handbook: Developments in theory and practice (pp. 213-232) Thousand Oaks, CA: SAGE.
Byrne, S., & Hart, P. S. (2009). The boomerang effect: A synthesis of findings and a preliminary theoretical framework. Communication Yearbook, 33, 3-38.
at LOYOLA UNIVERSITY CHICAGO on January 10, 2013apr.sagepub.comDownloaded from
26 American Politics Research XX(X)
Cialdini, R. B., & Goldstein, N. J. (2004). Social influence: Compliance and confor-mity. Annual Review of Psychology, 55, 591-621.
Davenport, T. C. (2010). Public accountability and political participation: Effects of a face-to-face feedback intervention on voter turnout of public housing residents. Political Behavior, 32, 337-368.
Dillard, J. P., & Shen, L. (2005). On the nature of reactance and its role in persuasive health communication. Communication Monographs, 72, 144-168.
Druckman, J. (2001). Using credible advice to overcome framing effects. Journal of Law, Economic and Organization, 17, 62-82.
García Bedolla, L., & Michelson, M. R. (2009). What do voters need to know? Testing the role of cognitive information in Asian American voter mobilization. American Politics Research, 37, 254-274.
Geller, E. S., Witmer, J. F., & Orebaugh, A. L. (1976). Instructions as a determinant of paper-disposal behaviors. Environment and Behavior, 8, 417-439.
Gerber, A. S., Green, D. P., & Larimer, C. W. (2008). Social pressure and voter turn-out: Evidence from a large-scale field experiment. American Political Science Review, 102, 33-48.
Gerber, A. S., Green, D. P., & Larimer, C. W. (2010). An experiment testing the rela-tive effectiveness of encouraging voter participation by inducing feelings of pride or shame. Political Behavior, 32, 409-422.
Gerber, A. S., & Rogers, T. (2009). Descriptive social norms and motivation to vote: Everybody’s voting and so should you. Journal of Politics, 71, 178-191.
Green, D. P., & Gerber, A. S. (2008). Get out the vote! How to increase voter turnout, 2nd Edition. Washington, DC: Brookings Institution Press.
Green, D. P., & Gerber, A. S. (2010). Introduction to social pressure and voting: New experimental evidence. Political Behavior, 32, 331-336.
Henrich, J., Heine, S. J., & Norenzayan, A. (2010). The weirdest people in the world? Behavioral and Brain Sciences, 33, 61-83.
Herman, G., & Leyens, J. (1977). Rating films on T.V. Journal of Communication, 27, 48-53.
Issenberg, S. (2012). The victory lab: The secret science of winning campaigns. New York: Crown Publishers.
Kam, C. D. (2005). Who toes the party line? Cues, values, and individual differences. Political Behavior, 27, 163-182.
Kohn, P. M., & Barnes, G. E. (1977). Subject variables and reactance to persuasive communications about drugs. European Journal of Social Psychology, 7, 97-109.
Lewis-Beck, M., Jacoby, W. G., Norpoth, H., & Weisberg, H. F. (2008). The American voter revisited. Ann Arbor, MI: University of Michigan Press.
Mann, C. B. (2010). Is there backlash to social pressure? A large-scale field experi-ment on voter mobilization. Political Behavior, 32, 387-407.
at LOYOLA UNIVERSITY CHICAGO on January 10, 2013apr.sagepub.comDownloaded from
Matland and Murray 27
Mann, M. F., & Hill, T. (1984). Persuasive communications and the boomerang effect: Some limiting conditions to the effectiveness of positive influence attempts. Advances in Consumer Research, 11, 66-70.
Matland, R. E., & Murray, G. R. (2011). Mobilization effects using mail: Social pres-sure, invoking injunctive norms, and timing. Paper presented at the 2011 meetings of the American Political Science Association, Seattle, WA.
Matland, R. E., & Murray, G. R. (2012). An experimental test of mobilization effects in a Latino community. Political Research Quarterly, 65, 192-205.
Mazis, M. B. (1975). Antipollution measures and psychological reactance theory: A field experiment. Journal of Personality and Social Psychology, 31, 654-660.
Michelson, M. R., Garcıa Bedolla, L., & McConnell, M. A. (2009). Heeding the call: The effect of targeted two-round phone banks on voter turnout. Journal of Poli-tics, 71, 1549-1563.
Miller, C. H., Lane, L. T., Deatrick, L. M., Young, A. M., & Potts, K. A. (2007). Psy-chological reactance and promotional health messages: The effects of controlling language, lexical concreteness, and the restoration of freedom. Human Communi-cation Research, 33, 219-240.
Mintz, A., Redd, S. B., & Vedlitz, A. (2006). Can we generalize from student experi-ments to the real world in political science, military affairs, and international rela-tions? Journal of Conflict Resolution, 50, 757-776.
Morton, R. B., & Williams, K. C. (2010). Experimental political science and the study of causality: From nature to the lab. New York, NY: Cambridge University Press.
Murray, G. R., Rugeley, C. R., Mitchell, D., & Mondak, J. J. (2012). Convenient yet not a convenience sample: Jury pools as experimental subject pools. Social Sci-ence Research, doi: http://dx.doi.org/10.1016/j.ssresearch.2012.06.002.
Murray, G. R., Rugeley, C. R., Mitchell, D., & Mondak, J. J. (forthcoming). Conve-nient yet not a convenience sample: Jury pools as experimental subject pools. Social Science Research.
Nisbett, R. E., & Cohen, C. (1996). Culture of honor: The psychology of violence in the South. Boulder, CO: Westview Press.
Noar, S. M. (2006). A 10-year retrospective of research in health mass media cam-paigns: Where do we go from here? Journal of Health Communication, 11, 21-42.
Panagopoulos, C. (2009). Partisan and nonpartisan message content and voter mobi-lization: Field experimental evidence. Political Research Quarterly, 62, 70-76.
Panagopoulos, C. (2010). Affect, social pressure and prosocial motivation: Field experimental evidence of the mobilizing effects of pride, shame and publicizing voting behavior. Political Behavior, 32, 369-386.
Panagopoulos, C. (2011). Thank you for voting: Gratitude expression and voter mobi-lization. Journal of Politics, 73, 707-717.
at LOYOLA UNIVERSITY CHICAGO on January 10, 2013apr.sagepub.comDownloaded from
28 American Politics Research XX(X)
Quick, B. L., & Stephenson, M. T. (2007). Further evidence that psychological reac-tance can be modeled as a combination of anger and negative cognitions. Com-munication Research, 34, 255-276.
Schwarz, N., Frey, D., & Kumpf, M. (1980). Interactive effects of writing and reading a persuasive essay on attitude change and selective exposure. Journal of Experi-mental Social Psychology, 16, 1-17.
Sears, D. O. (1986). College sophomores in the laboratory: Influences of a narrow data base on social psychology’s view of human nature. Journal of Personality and Social Psychology, 51, 515-530.
Smith, M. J. (1977). The effects of threats to attitudinal freedom as a function of message quality and initial receiver attitude. Communication Monographs, 44, 196-206.
Wicklund, R. A. (1974). Freedom and reactance. Potomac, MD: Lawrence Erlbaum.Wolburg, J. M. (2006). College students’ responses to antismoking messages: Denial,
defiance, and other boomerang effects. Journal of Consumer Affairs, 40, 294-323.Worchel, S. (1974). The effect of three types of arbitrary thwarting on the instigation
to aggression. Journal of Personality, 42, 300-318.
Bio
Richard E. Matland is Professor of Political Science at Loyola University Chicago. His research covers a broad set of subfields with an emphasis on experimental methods.
Gregg R. Murray is an Assistant Professor of Political Science at Texas Tech University. His research focuses on political behavior and attitudes and their antecedents.
at LOYOLA UNIVERSITY CHICAGO on January 10, 2013apr.sagepub.comDownloaded from
Copyright © 2022 FDOKUMEN