2012 5 -- - CORE
234
PRIVATE LABEL APPAREL RETAIL: A Study of Consumer Attitudes and Market Potential in India THESIS SUBMITTED FOR THE AWARD OF PhD in Business Administration By ALEKHYA TALAPATRA Under the Supervision of DR. MOHAMMAD NAVED KHAN Associate Professor Department of Business Administration Aligarh Muslim University, Aligarh (Internal Advisor) DR. SAJJAN RAJ SINGHVI Professor - Marketing X International Management Irii 5 New Delhi (External Advisor) DEPARTMENT OF BUSINESS ADMINISTRATION FACULTY OF MANAGEMENT STUDIES & RESEARCH ALIGARH MUSLIM UNIVERSITY ALIGARH — 202002 (INDIA) 2012 5 --
-
Upload
khangminh22 -
Category
Documents
-
view
1 -
download
0
Transcript of 2012 5 -- - CORE

PRIVATE LABEL APPAREL RETAIL: A Study of Consumer Attitudes and Market Potential in
India
THESIS
SUBMITTED FOR THE AWARD OF
PhD in Business Administration
By
ALEKHYA TALAPATRA
Under the Supervision of
DR. MOHAMMAD NAVED KHAN Associate Professor Department of Business Administration Aligarh Muslim University, Aligarh (Internal Advisor)
DR. SAJJAN RAJ SINGHVI Professor - Marketing X International Management Irii 5 New Delhi (External Advisor)
DEPARTMENT OF BUSINESS ADMINISTRATION FACULTY OF MANAGEMENT STUDIES & RESEARCH
ALIGARH MUSLIM UNIVERSITY ALIGARH — 202002 (INDIA)
2012 5 --
1 7 NOV 2074
IRIIIIII 11111111 tIll! 111(1 11111111 T9072

CERTIFICATE
This is to certify that the thesis entitled "PRIVATE LABEL APPAREL
RETAIL — A Study of Consumer Attitudes and Market Potential in India" submitted to the Faculty of Management Studies and Research,
Aligarh Muslim University, Aligarh, India, in partial fulfillment of the
requirements for the award of the degree of PhD in Business Administration
is a record of original work done by Mr. Alekhya Talapatra during the
period of his study in the Department of Business Administration, Faculty of ' S
Management Studies and Research, Aligarh Muslim University, Aligarh,
India, under my supervision and guidance and to the best of my knowledge
the thesis has not formed the basis for the award of any Degree / Diploma /
Fellowship or similar title to any candidate of any university.
(Dr. Mohammed leaved Khan) Internal Advisor
Place: Aligarh
Date: 12/03/2012

DECLARATION
I do hereby declare that the thesis entitled "PRIVATE LABEL APPAREL
RETAIL — A Study of Consumer ' Attitudes and Market Potential in
India" submitted to the Faculty of Management Studies and Research,
Aligarh, Muslim University, Aligarh, India, for the award of the Degree of
PhD in Business Administration is a record of original work done by me
under the supervision and guidance of Dr. Mohammed Naved Khan,
Professor, Department of Business Administration, Faculty of Management
Studies and Research, Aligarh Muslim University, Aligarh (Internal Adviser),
and Dr. Sajjan R. Singhvi, Professor, International Management Institute,
New Delhi (External Advisor), and it has not previously formed the basis for
the award of any Degree / Diploma / Associateship / Fellowship or other
similar title to any candidate of any university.
(ALEKHYA TALAPATRA)
Place : New Delhi
Date : 11/03/2012

CERTIFICATE
This is to certify that the thesis entitled "PRIVATE LABEL APPAREL
RETAIL — A Study of Consumer Attitudes and Market Potential in
India" submitted to the Faculty of Management Studies and Research,
Aligarh Muslim University, Aligarh, India, in partial fulfillment of the
requirements for the award of the degree of PhD in Business Administration
is a record of original work done by Mr. Alekhya Talapatra during the
period of his study in the Department of Business Administration, Faculty of
Management Studies and Research, Aligarh Muslim University, Aligarh,
India. under my supervision and guidance and to the best of my knowledge
the thesis has not formed the basis for the award of any Degree / Diploma I
Fellowship or similar title to any candidate of any university,
(Dr. Sajjan R. Singhvi) External Advisor
Place : New Delhi
Date : 09/03/2012
Ded ca tea & e4
ACKNOWLEDGEMENTS
I express my thanks to my teacher Prof. Sajjan Singhvi for his valuable inputs during the study. I am also indebted to Prof. Asif Zameer and Prof. Ravikesh Srivastava for their constructive comments related to methodology and schema of analysis followed in the study. I shall remain ever grateful to is Prof. M. Khalid Azam, Chairman, Department of Business Administration and Dean, Faculty of Management Studies and Research, Aligarh Muslim University, Aligarh, India, for lending all possible support in the completion of the thesis.
A constant source of encouragement was my mother and wife.
The administration of the questionnaire required support and cooperation of Store Managers viz. Mr. Anil K. of Big Bazaar, Mr. Vijay Kakkar of Reliance Trends, Mr. Shashank of Shoppers' Stop, Mr. Kuldeep Singh of Westside and Mr. S. Kumar of Shipra Mall, Noida and Ms. Kusum Neogi of DT Mall, Gurgaon. I will also like to acknowledge the respondents of the study who spared their precious time in patiently going through the questionnaire and providing their responses.
I would like to thank and acknowledge all the esteemed Faculty and Research scholars who gave their valuable suggestions and advice during the pre-submission seminar at Aligarh.
This entire work would not have been achieved without the constant help, guidance and support of two persons, Prof Mohammad Naved Khan, my guide and Professor S.K. Pandey. Prof. Naved Khan guided me at every step and corrected me constantly. Prof. Pandey helped me with the logic and analytics. I will remain eternally grateful to these two individuals.
I am thankful to my colleagues in Sanvei Overseas Pvt. Ltd. and in particular, Mr. Randheer Singh for providing me constant support and help.
LJLLvt0&rL (A1ekiya Talapatra)

PREFACE
With daunting challenges of the emerging business environment, the retailing
industry in the world is fast realizing the worth of Private Labels as an
invincible and inimitable strength for attaining long-lasting competitive
advantage.
The growing apparel market in fast developing countries like India is one of
the largest opportunity for organized retailers. One of the major challenges for
the national and international brands within apparel retailing is the emergence
of private labels. Private labels at the same time provides a huge source of
advantage for large retailers.
Including private labels in the merchandise mix of retailers enables them to
drive the following objectives viz, enhancing the self-image, increase
category margins, provide value for money to customers by competitive
pricing, improve bargaining power with national manufacturers and
sometimes create differentiation of the store in minds of customers through
price-quality association by premium pricing of select store brands.
Reasons and entry of store brands have been extensively covered in retailing
literature as has been the impact of store brands on retailers profitability.
Similarly there has been many papers for studying the strategic positioning of
store brand and success of store brand itself.
Due to the growing importance of private labels, marketing managers and
academicians have always been interested in research on these. The research
on private labels can be broadly divided in two streams. One stream of
research has been conducted for identifying factors associated with adoption
of private label brands. The main objectives of this stream of research has
been to uncover stable personal characteristics resulting in private label
brands proneness and specify demographics, psychographic and other III

variable leading to identification of market segments. Identification of market
segments have been based on consumer demographic and psychographic
variables to assess attitudinal and behavioral factors that tempt the consumer
towards private labels. The other stream of research is based on competition
between national brands and private label brands to identify differentiation
and competitive strategies.
Scant practically non-existent studies have been conducted so far in India for
understanding consumer attitudes for private label in the context of garment
lifestyle retailing store. An understanding of this will help large format
retailers and also fine tune marketing strategies for private labels, national and
international brands. In the absence of empirical data availability of private
label share in organized apparel retailing, a deduction of potential assessment
can give some indications for further exploration.
The thesis is divided into six chapters. The first chapter deals with providing
an overview to the world of retailing and the potential of organized retailing.
It traces the evolution of Private Labels across product categories in organized
retailing. The chapter also discusses the rationale behind the present research.
It discusses the objectives of the study and explains why a study of consumer
attitudes towards private labels in apparels war under in India is important. In
the end the chapter provides a bird's — eye view of the research framework.
The second chapter undertakes an extensive review of the literature on Private
Labels'. It gives an overview of the various classifications and taxonomies of
Private Labels as identified by different researchers. Thereafter, it elaborates
on the major research streams. It then discusses the emerging importance of
private labels and identifies various attributes shaping. Finally, it gives an
overview of consumer attitudes towards' private labels and importance of
private labels in shaping store image.
The third chapter attempts to identify research gaps in the existing literature
on Private Labels apparel retailing in organized retail in India. It seeks to
iv

point out the problem areas existing in the literature on Private Label apparel
retailing. These problem areas and gaps relate to both theory and practice of
Private Labels Apparel Retailing and apply to both Indian and Global studies.
It gives details of the methodology of research, which begins by stating the
objectives of the study and framing of hypothesis. The research methodology
process is mentioned in detail followed by research design, instrument
development, sampling procedure, pilots undertaken with method of analysis
and limitations of the study.
The fourth chapter deals with a discussion of the analysis of primary data and
result of the three pilots. It proceeds on to analysis of the questionnaire and
summarizes the demographic characteristics of the sample. The analysis done
by Exploratory Factor analysis and Analysis of Covariance in testing the
hypothesis is then mentioned. For the eight hypotheses, binomial testing is
done and the results of the analysis mentioned.
The fifth chapter commences with a discussion of the results of factor analysis
and ANCOVA. The second part of this chapter discusses the findings of the
research and supports with relevant secondary data. A comparison of the
findings of the present research is undertaken in the light of previous
researchers and studies by other researchers; it then presents the conclusions
of the study.
The sixth chapter discusses in detail the deductions from the study and then
the managerial implications are presented from the perspectives of national
brands and private label brands. The chapter concludes with possible
directions for future research.
V

LIST OF EXHIBITS
PAGE NO. CHAPTER 1: INTRODUCTION
Exhibit 1.1 : Estimated Growth Percentage of Organized 3 Retail Exhibit 1.2 : Worldwide Private Label Share & Growth Rate 5 — 6 (2004 — 05) Exhibit 1.3 : Research Framework 13
CHAPTER 2: REVIEW OF LITERATURE Exhibit 2.1 : Private Label Share in Organized Retail Groups 14 Exhibit 2.2: Schematic Diagram 26 Exhibit 2.3 : Conceptual Model United States Vs. Local 34 Brand
CHAPTER 3: RESEARCH METHODOLOGY Exhibit 3.1 : Schematic Diagram for Research Process 60 Exhibit 3.2 : Diagrammatic Representation of Analysis 75
CHAPTER 4: ANALYSIS AND RESULTS Exhibit 4.1 : Flow Chart Depicting Schema of Analysis 79 Exhibit 4.2 : Demographic Profile — Gender 84 Exhibit 4.3 : Demographic Profile — Annual Income 85 Exhibit 4.4: Demographic Profile — Age 86 Exhibit 4.5 : Demographic Profile — Education 87 Exhibit 4.6 : Demographic Profile — Staying in Delhi / NCR 88 Exhibit 4.7 : Estimated Marginal Means of Evaluation of 102 Shirt Brand by National Store Exhibit 4.8 : Estimated Marginal Means of Evaluation of 104 Shirt Brand by Income Exhibit 4.9 : Estimated Marginal Means of Evaluation of 105 Shirt Brand by Education Exhibit 4.10: Estimated Marginal Means of REGR Factor 109 Score Exhibit 4.11 : Percentage of Respondent who knew the 110 difference between National and Store Brands Exhibit 4.12: Estimated Marginal Means of REGR score 113 Exhibit 4.13: Estimated Marginal Means of REGR Factor 117 score. At Price = Regular Exhibit 4.14 : Estimated Marginal Means of REGR Factor 117 score. At Price = Discounted
vi

Exhibit 4.15: Recall Percentage of National Shirt Brand and 119 Private Label Shirt Brand (Option 1) Exhibit 4.16: Recall Percentage of National Shirt Brand and 120 Private Label Shirt Brand (Option 2) Exhibit 4.17: Recall Percentage of National Shirt Brand and 121 Private Label Shirt Brand (Option 3) Exhibit 4.18: Recall Percentage of National Shirt Brand and 122 Private Label Shirt Brand Purchased (Option 1) Exhibit 4.19: Recall Percentage of National Shirt Brand and 123 Private Label Shirt Brand Purchased (Option 2) Exhibit 4.20: Recall Percentage of National Shirt Brand and 124 Private Label Shirt Brand Purchased (Option 3)
CHAPTER 5: DISCUSSION AND FINDINGS Exhibit 5.1: Category wise Growth (in Volume) in Menswear 141 Shirt (2006 - 09).
vii

LIST OF TABLES
PAGE NO. CHAPTER 2: REVIEW OF LITERATURE
Table 2.1 : Private Label Shares and Product with Higher 20 Growth Rates Table 2.2 : Private Label in Apparel Categories 22
CHAPTER 3: RESEARCH METHODOLOGY Table 3.1 : A look at the private labels presently being retailed 52 in India Table 3.2: Reliability Statistics of Constructs 70 Table 3.3 : KMO & Bartlett's Test 74
CHAPTER 4: ANALYSIS AND RESULTS Table 4.1 : Reliability Consistency of First Wave of 63 80 Respondents Table 4.2 : Reliability Consistency of Second Wave of 39 81 Respondents Table 4.3 : Reliability Consistency of Third Wave of 19 81 Respondents Table 4.4 : Summary of the Demographic Characteristics of 82 the Sample Table 4.5 : KMO and Bartlett's Test 91 Table 4.6 : Communalities for Factor Extraction 91 Table 4.7 : Communalities for Total Variance Explained for 91 Principal Components Table 4.8 : Communalities for Component Matrix 92 Table 4.9 : KMO and Bartlett's Test 92 Table 4.10: Communalities for Factor Extraction 92 Table 4.11: Communalities for Total Variance Explained for 93 Principal Components Table 4.12: Communalities for Component Matrix 93 Table 4.13 : KMO and Bartlett's Test 94 Table 4.14: Communalities for Factor Extraction 94 Table 4.15 : Communalities for Total Variance Explained for 94 Principal Components Table 4.16: Communalities for Component Matrix 95 Table 4.17: KMO and Bartlett's Test 95 Table 4.18: Communalities for Factor Extraction 95
VIII

Table 4.19 : Communalities for Total Variance Explained for 96 Principal Components Table 4,20: Communalities for Component Matrix 96 Table 4.21 KMO and Bartlett's Test 97 Table 4.22: Communalities for Factor Extraction 97 Table 4.23: Communalities for Total Variance Explained for 97 Principal Components Table 4.24: Communalities for Component Matrix 98 Table 4.25: KMO and Bartlett's Test 98 Table 4.26: Communalities for Factor Extraction 98 Table 4.27: Communalities for Total Variance Explained for 99 Principal Components Table 4.28: Communalities for Component Matrix 99 Table 4.29: KMO and Bartlett's Test 99 Table 4.30: Communalities for Factor Extraction 100 Table 4.31: Communalities for Total Variance Explained for 100 Principal Components Table 4.32: Communalities for Component Matrix 101 Table 4.33: Dependent Variable : Evaluation of shirt brand 102 Table 4.34 : Correlation between Brand Consciousness and 103 Evaluation of Shirt Brand Table 4.35 : Univariate Analysis of Variance for Between- 106 Subjects Factors Table 4.36 : Summarized Results of Hypothesis Testing 106-108 Table 4.37 : Univariate Analysis of Variance for Between- 110 Subjects Factors Table 4.38 : Summarized Results of Hypothesis Testing 111-112 Table 4.39 : Univariate Analysis of Variance for Between- 114 Subjects Factors Table 4.40: Summarized Results of Hypothesis Testing 115-116 Table 4.41: Percentage Recall of a few Shirt Brands (Option 118 1) Table 4.42: Percentage Recall of a few Shirt Brands (Option 119 2) Table 4.43: Percentage Recall of a few Shirt Brands (Option 120 3) Table 4.44 : Percentage Recall of a few Shirt Brands 121 Purchased (Option 1) Table 4.45 : Percentage Recall of a few Shirt Brands 122 Purchased (Option 2) Table 4.46 : Percentage Recall of a few Shirt Brands 123 Purchased (Option 3)
ix

Table 4.47 : Binomial Test on First Brand Recall and Second 124 Brand Recall Table 4.48 : Binomial Test on Second Brand Recall and Third 125 Brand Recall Table 4.49 : Binomial Test on First Brand Recall and Third 125 Brand Recall Table 4.50 : Binomial Test on First Purchase Recall and 126 Second Purchase Recall Table 4.51 : Binomial Test on Second Purchase Recall and 126 Third Purchase Recall Table 4.52 : Binomial Test on First Purchase Recall and Third 126 Purchase Recall
CHAPTER 5: DISCUSSION AND FINDINGS Table 5.1 : Summary of the Results of Factor Analysis 129 Table 5.2 : Summary Table for the ANCOVA on entire data 130 set N = 957 Table 5.3 : Summary Table for the ANCOVA on entire data 130 set N = 957 Table 5.4 : Summary Table for the ANCOVA on respondents 133 who knew the difference between national brands and private label N = 744 Table 5.5 : Summary Table for the ANCOVA on Respondents 135 who differentiated between National Brands and Private Labels with Income as random factor N = 744 Table 5.6 : Significance of Internal and External Factors 136 Table 5.7 : Summary of Percentages of Unaided Brand Recall 137 of Shirts in Three Instances Table 5.8 : Results of Hypotheses Testing for Drop in 137 Percentages of National Brand Recall in unaided recall Table 5.9 : Summary of Percentages for Unaided Brand Recall 138 of Purchased Shirts in Three Instances Table 5.10 : Result of Hypotheses Testing for drop in 138 Percentages of National Brand Recall in Unaided Recall Table 5.11: Estimates of Growth Trends in Private Label by 139 Top Executives with respect to their companies. Table 5.12 : Menswear (Vol. in 000 units) (Value in INR 140 Crores) (Average MRP in [NR)
x
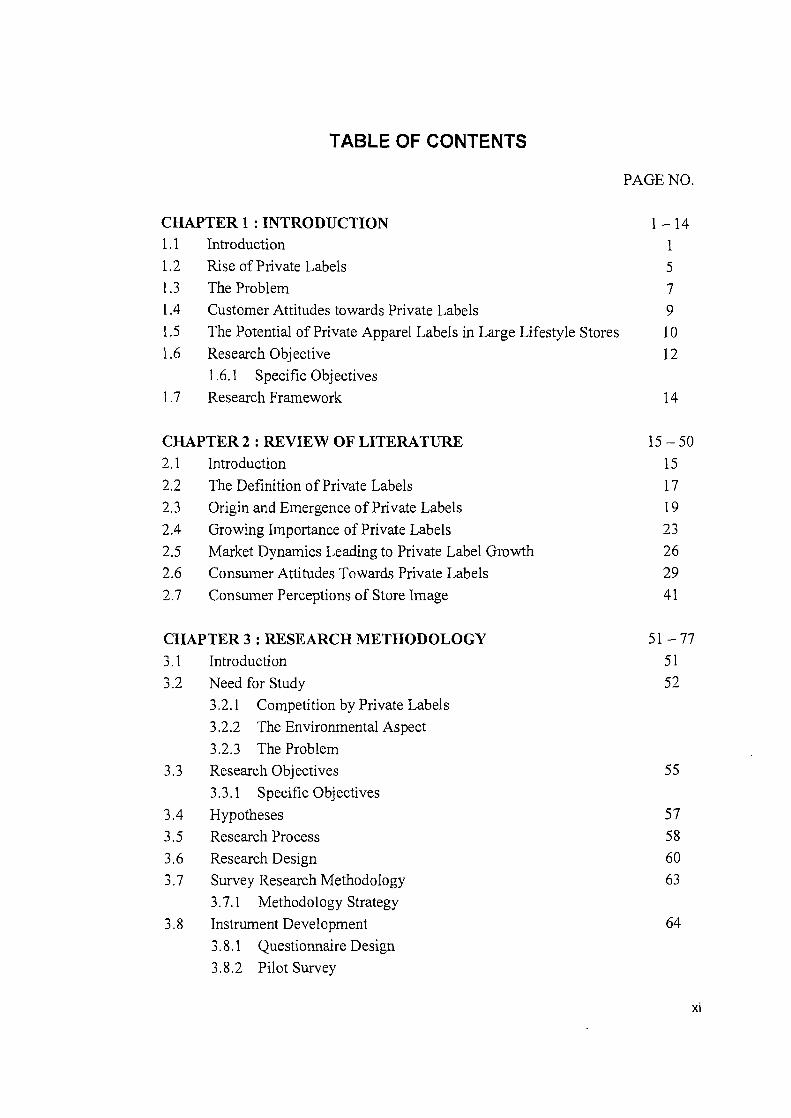
TABLE OF CONTENTS
PAGE NO.
CHAPTER 1: INTRODUCTION 1 —14 1.1 Introduction 1 1.2 Rise of Private Labels 5 1.3 The Problem 7 1.4 Customer Attitudes towards Private Labels 9 1.5 The Potential of Private Apparel Labels in Large Lifestyle Stores 10 1.6 Research Objective 12
1.6.1 Specific Objectives 1.7 Research Framework 14
CHAPTER 2: REVIEW OF LITERATURE 15—SO 2.1 Introduction 15 2.2 The Definition of Private Labels 17 2.3 Origin and Emergence of Private Labels 19 2.4 Growing Importance of Private Labels 23 2.5 Market Dynamics Leading to Private Label Growth 26 2.6 Consumer Attitudes Towards Private Labels 29 2.7 Consumer Perceptions of Store Image 41
CHAPTER 3: RESEARCH METHODOLOGY 51 — 77 3.1 Introduction 51 3.2 Need for Study 52
3.2.1 Competition by Private Labels 3.2.2 The Environmental Aspect 3.2.3 The Problem
3.3 Research Objectives 55 3.3.1 Specific Objectives
3.4 Hypotheses 57 3.5 Research Process 58 3.6 Research Design 60 3.7 Survey Research Methodology 63
3.7.1 Methodology Strategy 3.8 Instrument Development 64
3.8.1 Questionnaire Design 3.8.2 Pilot Survey
xi
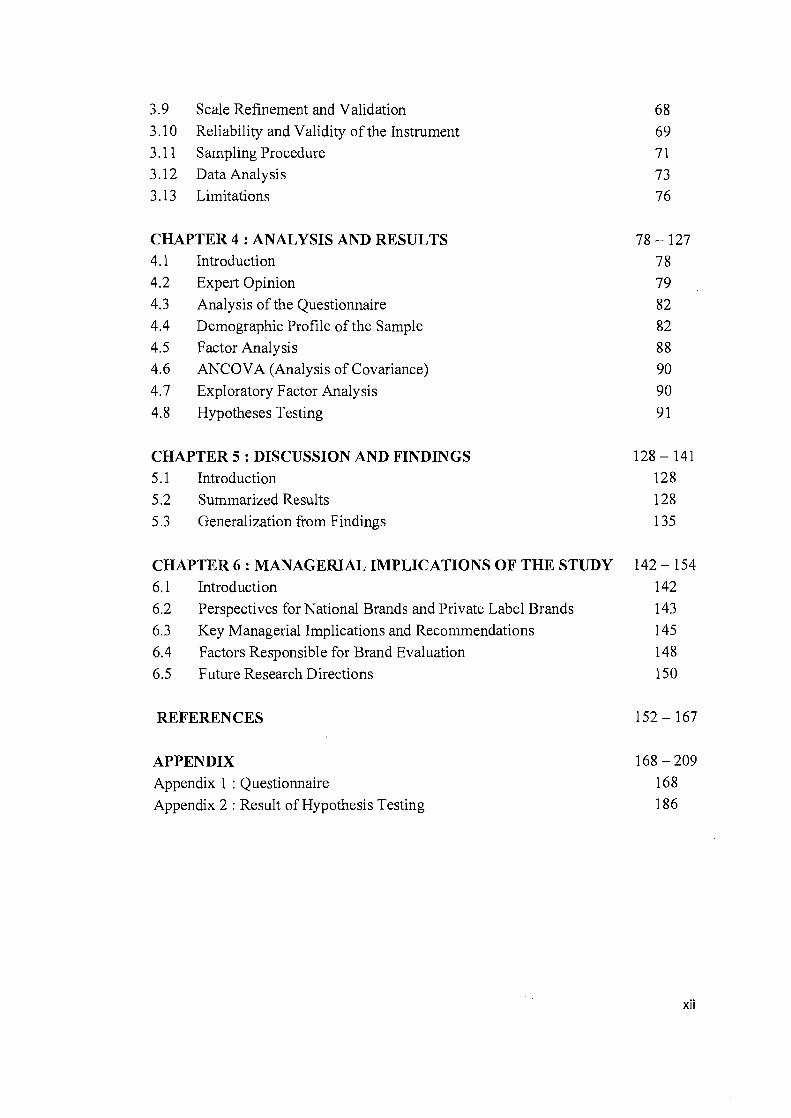
3.9 Scale Refinement and Validation 68 3.10 Reliability and Validity of the Instrument 69 3.11 Sampling Procedure 71 3.12 Data Analysis 73 3.13 Limitations 76
CHAPTER 4: ANALYSIS AND RESULTS 78-127 4.1 Introduction 78 4.2 Expert Opinion 79 4.3 Analysis of the Questionnaire 82 4.4 Demographic Profile of the Sample 82 4.5 Factor Analysis 88 4.6 ANCOVA (Analysis of Covariance) 90 4.7 Exploratory Factor Analysis 90 4.8 Hypotheses Testing 91
CHAPTER 5: DISCUSSION AND FINDINGS 128 —141 5.1 Introduction 128 5.2 Summarized Results 128 5.3 Generalization from Findings 135
CHAPTER 6 : MANAGERIAL IMPLICATIONS OF THE STUDY 142 —154 6.1 Introduction 142 6.2 Perspectives for National Brands and Private Label Brands 143 6.3 Key Managerial Implications and Recommendations 145 6.4 Factors Responsible for Brand Evaluation 148 6.5 Future Research Directions 150
REFERENCES 152 — 167
APPENDIX 168 —209 Appendix 1: Questionnaire 168 Appendix 2 : Result of Hypothesis Testing 186
xii

CHAPTER 1: INTRODUCTION 1.1 Introduction 1.2 Rise of Private Labels 1.3 The Problem 1.4 Customer Attitudes towards Private Labels 1.5 The Potential of Private Apparel Labels in Large Lifestyle Stores 1.6 Research Objective
1.6.1 Specific Objectives 1.7 Research Framework

CHAPTER 1: INTRODUCTION
CHAPTER OVERVIEW
This chapter starts with the general introduction to the world of retailing and trends
in private label retailing. It mentions factors influencing customer attitudes towards
private label apparels in organized retailing. The chapter also discusses the
background of research in private labels in with emphasis on apparels in organized
retailing. Together with discussing the various dimensions of the research problem,
this chapter states the research objectives and also presents the research framework.
1.1 INTRODUCTION
The study emphasizes the importance of factors like branding, store image, store
merchandise mix, pricing, quality, positioning of usage as critical factors for
building fashion consciousness towards private labels. It is expected that an
understanding of role of these factors on the attitudes of consumers towards private
label apparel brands will be of interest to large lifestyle store owners.
Worldwide retailing is the single biggest industry. It has an annual sales figure of $
6.6 trillion (Economic Times, 2006) out of which textile and clothing has a lion's
share of 22 per cent. Apparel sector has been the most important segment in the
context of retail revolution, not only because of the size but by the way it has
affected lifestyle changes in the lives of the people.
India is the youngest country today with 50 per cent of its population being below
25 years and 66 per cent population below 35 years. In the following years India will
be the leading contributor to world's working population. Urban India is currently
home to three generations with very different outlooks on life. Liberalization's
children (born pre-liberalization, grew up in liberalized India) and Midnight's
children (pre-independence generation) are driving dichotomous consumption
compulsions. India is witnessing an unprecedented consumption boom and
developments in retailing domain need to be viewed in this context. Its imperative
11P i c

for marketers to not only recognize the Indian diversity, dichotomy and complexity,
but to incorporate it into their strategic plan (India Retail Report, 2009).
At US $ 511 billion in 2008, the overall retail industry of India is expected to rise to
US $ 833 billion by 2013 and further to US $ 1.3 trillion by 2018, a CAGR of 10 per
cent. Organized retail, which accounts for almost 5 per cent of the market is
expected to grow at a CAGR of 40 per cent from $ 20 billion in 2007 to $ 107
billion by 2013. Indian's organized retail is estimated at $ 28 billion with around 7
per cent penetration but is expected to grow to 21 per cent and become a $260
billion business over next decade, said a recent report by Boston Consulting Group
in 2011. Sales from large format stores like supermarkets, department stores and
hypermarkets, have expanded at commendable growth rates during the period 2003-
2008, ranging from 24 per cent to 49 per cent per year (Ghosh, Tripathi & Kumar,
2010).
The current economic environment has raised a fear of dip in consumption and
slowdown of growth for organized retailers. According to Retailer's Association of
India, growth in the Rs. 45000 crore organized retail sector slowed down to 5 per
cent in the fourth quarter of 2008-09, a far cry from the 35 per cent growth recorded
in Jan. — March, 2008. A report by KPMG (March 2009) states that the ongoing
slowdown in the economy has taken a major toll on the dissemination of India's
organized retail. The report also revealed that India's investment flow in organized
retailing, which is expected to touch $ 25 billion over the next 5 years period, is
showing temporary signs of slowdown.
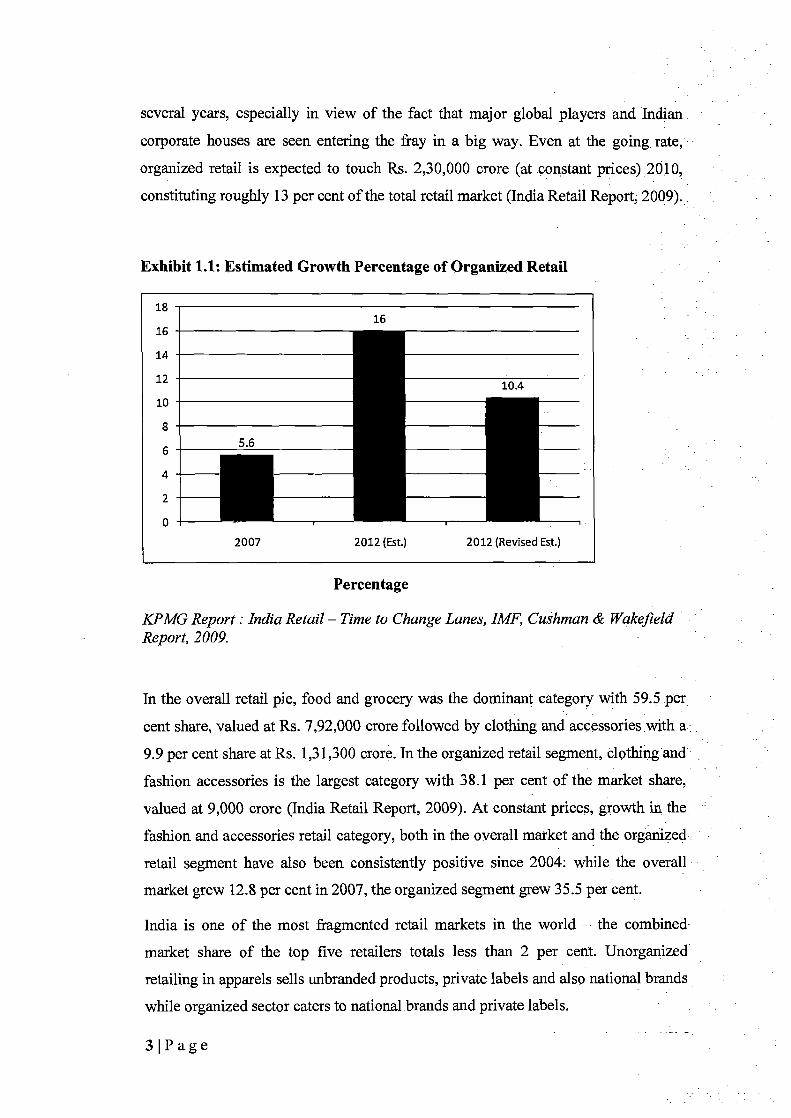
The growth in organized retail decreased from 35 per cent in 2007-08 to 10-- 12 per
cent in 2008 — 09. Organized retail share which was expected to rise to 16 per cent
by 2012 from 5 per cent in 2008-09 is now expected to touch 10.4 per cent by the
end of 2012 (Mittal & Prashar, 2010).
Retailing contributes to over 10 per cent of GDP and 8 per cent of total employment.
As per the Images F&R Research estimates for India, retail, the Indian retail market
stood at Rs. 1,330,000 crore in 2007 with annual growth of about 10.8 per cent. Of
this the share of organized retail in 2007 was estimated to be only 5.9 per cent,
which was Rs. 78,300 crore. But the modern retail segment grew at the rate of 42.4
per cent in 2007 and is expected to maintain a faster growth rate over the next
2 1 P e
several years, especially in view of the fact that major global players and Indian.
corporate houses are seen entering the fray in a big way. Even at the going- rate,
organized retail is expected to touch Rs. 2,30,000 crore (at constant prices). 2010,
constituting roughly 13 per cent of the total retail market (India Retail Report; 2009)..
Exhibit 1.1: Estimated Growth Percentage of Organized Retail
18 16
16
14
12 10.4 10
8 6 5.6
4
2
0
2007 2012 (Est.) 2012 (Revised Est.)
Percentage
KPMG Report : India Retail — Time to Change Lanes, IMF, Cushman & Wakefield Report, 2009.
In the overall retail pie, food and grocery was the dominant category with 59.5 per
cent share, valued at Rs. 7,92,000 crore followed by clothing and accessories with a.
9.9 per cent share at Rs. 1,31,300 crore. In the organized retail segment, clothing-and
fashion accessories is the largest category with 38.1 per cent of the market share,
valued at 9,000 crore (India Retail Report, 2009). At constant prices, growth in. the.
fashionand accessories retail category, both in the overall market and the organized
retail segment have also been consistently positive since 2004: while the overall -
market grew 12.8 per cent in 2007, the organized segment grew 35.5 per cent.
India is one of the most fragmented retail markets in the world — the combined
market share of the top five retailers totals less than 2 per cent. Unorganized
retailing in apparels sells unbranded products, private labels and also national brands
while organized sector caters to national brands and private labels.
3P age

Indian apparel market was valued at Rs. 1,224 billion in 2007, as against the
previous figures of Rs. 1060 billion. In volume terms, 5644 million units were sold
in 2007 as against last years 5332 million units. The overall value growth in 2007
over 2006 was 15.5 per cent while volumes grew at 5.9 per cent. Based on the
existing trend, it is projected that the Indian apparel market will grow to Rs. 1715
billion by 2010. The effect of ensuing growth indicators on the Indian apparel
industry is more than evident from the spurt in growth rates: a 5.9 percent growth in
volume sales in 2007 as compared to 4.7 per cent in 2005 and 15.5 per cent growth
in value terms from 13.6 per cent in 2005 giving a market size of Rs. 122,400 crore
in 2007. Of the total Rs. 122,400 crore apparel market, the menswear segment
continues to take up Lion's share at Rs. 49,260 crore (40.2 per cent share), even
though this is a substantial decline from 40.9 per cent market share in 2006.
Women's wear accounts for 34.8 per cent market share (Rs. 42,630 crore), followed
by 24.9 per cent for the kidswear and uniform segments (Rs. 30,510 crone). (IRR,
2009). Indian apparel sales were pegged at estimated $25 billion in 2010. This
growth was faster than overall India retail market and the trajectory is expected to
continue. It is to be noted that apparel, in India, is the largest retail category (behind
food and groceries) representing approximately 10 per cent of the total market (CSI
Insights Flash, 2010).
India's $ 3.5 billion urban clothing market is the country's second largest
opportunity for organized retailers. But the low penetration of brands (20 per cent of
the market) and the popularity of traditional clothing (30 per cent) conspire to male
this a difficult market to enter. Since the early 1990s the domestic apparel market is
undergoing a major information with the branded segment showing an encouraging
growth in the past few years. Demand for branded apparel is growing at a rate of 12
— 15 per cent per annum and is expected to increase further fuelled by the fast
growth in retailing, rising incomes and aspirational lifestyles. Despite being a
medium sized market presently, almost every reputable international apparel brand
is in some form of negotiation and eyeing the Indian market, invariably talking to
well-established Indian textile and apparel companies about licensing.
With some relaxation in Foreign Direct Investment (FDI) norms, a large number of
foreign brands (like Benetton, Lacoste, Levi Strauss, Mark & Spencers) have opted
to enter the Indian market through the franchisee route or through shop-in-shop
411'agc

arrangements with leading department store chains. New formats like hypermarkets with their value offering and appeal to a broader section of consumer-base are-further likely to increase the penetration of organized apparel retailing like Big
Bazar, Reliance Retail and Vishal Mega Mart. Most shopping centers attract large
retailers since they act as anchor tenants and thus offer attractive terms.
1.2 RISE OF PRIVATE LABELS
One of the major challenges for the national and international brands, within _the. apparel retailing is the emergence of private labels (retailers own brand). For each
US $ 100 spent by consumers globally, US $ 17 is spent on private label. World. -
private label market in 2007 was about US $ 1600 billion and is growing at about 6 — 7 per cent vis-a-vis manufacturers brands which are growing at 2 — 4 per . cent
annually. In emerging markets, private label sales growth is at 17 per cent. Private
label market in India is estimated to be around Rs. 1200 — Rs. 1500 crore (India
Retail Report, 2009) As per Technopak, organized retail is expected to: grow at a• CAGR of about 30 per cent between 2008 and 2018. This growth in itself will play an important role in furthering private labels cause within India retail - private label market in India is estimated to grow 15 folds by 2010 — 11 to reach around Rs. 20,000 — Rs. 25,000 crores.
Exhibit 1.2: Worldwide Private Label Share & Growth Rate (2004 — 05)
Private Label Share
Global • 17
Europe 2
North America I 16
Emerging Markets 6 ■ PL Share
Asia Pacific
Latin America U 2
0 5 10 15 20 25
(Percentage %)
Source: Nielsen A. C. (2005)
51Page

Private Label Growth
Global
Europe
North America
Emerging Markets ® PL Growth
Asia Pacific
Latin America
0 2 4 6 8 10 12
(Percentage %)
Source: Nielsen A.C. (2005)
The retailers like Shoppers' Stop, Pantaloons, Westside, Central, Big Bazaar et al.
are coming up with their own set of brands like Stop, Kashisk, Life, Westside,
Ascot, Premium Harvest, E-Kids, Knighthood and tying up with private label
designer brands, catering to both men and women. The average private -labels have
carved their niche in the Indian apparel retailing industry. Pricing and quality form
the main base. Private labeled brands are about 15 — 20 per cent- cheaper than that of
branded apparels (Kumar & Jene-Benedict, 2007). Westside by the Tata Group was
among the first one to bring out private labels and others soon joined the..
bandwagon. The apparel industry has also seen emergence of new players like
Reliance Retail which has also decided to cash in on the private label wave by
launching its own private label brands into the market. Private labels give retailers
the option to control its design or cost structure according to the needs. Moreover,
over the broad advertising expenditures need not be incurred as in case for national
brands. Private labels constitute a considerable share of their revenue and are used. as
an attribute to enhance the store image in the fiercely competitive urban retail
organized market. This follows the worldwide trend where apparel- is - one of the.
largest sectors for private label. The store's image and exclusivity offered to
6~Page

customer through private label goes hand-in-hand to increase customer base and sale
of private labels.
1.3 THE PROBLEM
India's apparel market is in the throes of a change owing to increase in disposable
incomes, more socializing opportunities, purchase of apparels for specific purpose,
growth in women's segment, awareness of fashion trends and brands, fashion turning
into a form of self expression, and growth in urbanization. Consumers have
increased spending on apparel and moved to being `affordable trendy' from bargain
hunters. Customers today are more product conscious rather than being only brand
conscious. They are looking for quality products at an affordable price, thus, giving
private labels an opportunity to offer the customers good quality products, which are
competitive priced. The market size is huge and there is a large potential for the
growth of private labels. Only 20 - 25 per cent consumers are brand conscious,
whereas the remaining are not, just looking for specific brand attributes but also
product benefits and quality.
This complex scenario in the cut throat competition of organized retailing makes it
important for the retailers to understand the needs of the consumers, consumer
behavior and lifestyle changes, as people no longer buy the way, they used to. In this
context, to acquire value and fashion conscious consumer, it is important to
understand the attitudes of consumers towards private labels and national brands and
mix required for enhancing store loyalty.
For national brands, emergence of private labels, poses a considerable threat. This is
compounded by the fact that there are few national or regional clothing brands
having revenues touching $50 million. Absence of many dominant players may lead
to some large players cornered out by large retailers, who will be controlling the
power equation, in the emerging organized apparel retailing. Private labels,
introduced by large retail stores pose a challenge to the brand strength of national
players.
Private label contribution in the Pantaloon departmental stores is currently over 70
per cent and they are in the process of increasing it more than 80 per cent (Biyani,
2007), whereas at Lifestyle, private labels currently contribute 10 per cent of their
7I11apc

total business and they are in the expansion mode. In case of Shoppers' Stop, though
the chain is growing at about 35 per cent per annum, the private labels at the store
have been growing at about 40 — 45 per cent. Meanwhile, Westside follows a
somewhat different model, stocking a very small percentage of outside labels. At
present, about 90 per cent of Westside's sales come from its 15 private labels.
(Menon, 2006)
Indian apparel industry has the potential to be among the biggest consumer market
of the world, next only to China. Out of more than I billion population, India has a
middle class segment of 350 million consumers. According to an analysis by Ernest
& Young, the number of households in the upper middle class and high income
groups in India has increased from 30 million to 81 million, thus growing by 270 per
cent (Ghosh, Tripathi & Kumar, 2010). With over 50 per cent of the population
under the age of 25 years, the Indian youth is during the growth in the retail industry
(The Economic Times, 9`" January, 2008). The revolution is fuelled by huge sums of
money being poured into real estate, modern logistics and the creation of new retail
brands. Some of the hurdles (e.g. reservation in the garment sectors) including tariff
distortions between the organized and unorganized sectors have now been
systematically been removed by policy initiatives of Government of India providing
a positive impetus to organized retailing. The Free Trade Agreement with Singapore
and Thailand will allow overseas producers to meet the aspirations of domestic
buyers with quality and prices that are competitive in the domestic market. On 25 x̀'
November, 2011, Cabinet of Ministers of Government of India approved foreign
retailers to own a 51 per cent stake in the multibrand retail sector with limited
conditions paving the way for global groups such as Walmart, Carrefour and Tesco
to open supermarkets in India. It also allowed 100 per cent Foreign Direct
Investment in single brand retail (The Economic Times, 251x ' November, 2011).
Once approved, this will change the course of organized retail. As of now, 100 per
cent foreign direct investment in the retailing sector is not permitted yet, but with
prior government approval upto 51 per cent foreign direct investment is allowed in
single brand products. This will provide for emerging new retail stores stocking
premium and luxury brands serving select clientele. This scenario is being eyed
closely by international brands. European brands have increased their focus on the
Indian market and proving to be American brands closest competition. To play a
81 1'a(̀'c

dominant role in the existing cut throat competitive organized apparel market, they
have to be innovative.
Studies are practically non-existent in India in the context of understanding
consumer attitudes for private label in apparels lifestyle retail stores. A
comprehension of this will help large format retailers and also fine tune marketing
strategies for private labels, national and international brands. With increased focus
on the Indian market the growing macro-economic indicators, liberalization and
changing socio-demographic factors indicate need for potential assessment for
further exploration in private label apparel share in organized retailing.
1.4 CUSTOMER ATTITUDES TOWARDS PRIVATE LABELS
Present understanding of consumer responses to private labels is mainly based on
studies of groceries and commodities bought from the local supermarket (e.g.
Anselmsson et al., 2008; Deleersnyder et al., 2007; Juhl et al., 2006; Labeaga et al.,
2007; Meder et al., 2008) while studies of other categories are rare. For instance, the
rise of retailers own brand and designer labels has received scarce attention in
marketing and branding literature (d'Astous & Saint-louis, 2005; Moore, 1995;
Morgansky 1990; Vackie & Paswan, 2006).
Bauer's (1960) seminal article on the concept of consumer perceived risk set off a
surge of research that peaked in the 1970s. Perceived risk is important for
understanding many consumer behaviors, such as the willingness to buy private
label products (Batra & Sinha, 2000; Richardson et al., 1994; Sinha & Batra, 1999).
Detailed reviews of research on risk can be found, for example by Gemunden
(1985), Stone & Glonhaug (1993) & Mitchell (2001).
Past studies on private label products seem to have taken for granted that all
consumers are able to identify which products are retailer brands and which are not.
In addition, these appears to be no studies on if or how consumers differentiate
between private label clothes of different departmental stores, sports stores,
hypermarkets or specialized clothing retailers that exclusively sell their own brands
(e.g. Beneton, H&M and Zara). At what point does a private label becomes a
national or international brand in the mind of consumers, or when do the actual
brands of the clothes become more important than the brand of the store itself?
9 I 11 a ,C

(Kumar, Jan — Benedict & Sternkamp, 2007). In some cases, store brands seem to
have given way to own brands with fictional names, implying that the latter are more
attractive to consumers, Research shows that the effect of a positively perceived
brand name will enhance buyer's perception of the quality, value and hence their
willingness to buy the product (Dodds, Monroe & Grewal, 1991) while also
decreasing social, psychological and functional risk. Three critical facets that need to
be examined include, the role of national brands, the role of private labels and the
role that the store itself plays as a brand.
1.5 THE POTENTIAL OF PRIVATE APPAREL LABELS in LARGE
LIFESTYLE STORES
To study `potential', we need to understand its meaning thereof. The market forecast
shows expected market demand, not maximum market demand. For the latter, we
need to visualize the level of market demand resulting from a "very high" level of
industry marketing expenditure where further increases in marketing effort would
have little effect in stimulating further demand. Market potential is the limit
approached by market demand as industry marketing expenditures approach infinity
for a given marketing environment.
The phrase `for a given market environment' is crucial. Consider the market
potential for automobiles—higher during prosperity than during a recession. Market
analysts distinguish between the position of the market demand function and
movement along it. Companies cannot do anything about the position of the market-
demand function, which is determined by the marketing environment. However,
they influence their particular location on the function when they decide how much
to spend on marketing.
Companies interested in market potential have a special interest in the product
penetration percentage, which is the percentage of ownership or use of a product or
service in a population. Companies assume that the lower the product-penetration
percentage, the higher the market potential, although this assumes that everyone will
eventually be in the market for every product (Kotler, Keller, Koshy & Jha, 2008).
Responses obtained on the merchandise purchased show that the commonly
purchased items from a retail outlet are garments, followed by lifestyle products,
10I~'~,;

grocery and household appliances. Exclusivity and value are desired by shoppers
while purchasing. A private label can add significant value when it is well
recognized and has built positive association in the mind of the consumers (Ghosh,
Tripathi & Kumar, 2010).
Wal-Mart is a major force that propelled other retailers into the private-label
business. When Wal-Mart started offering Wrangler jeans at lower prices a few
years ago, other retailers had to pressure their vendors to lower their prices. But
Wal-Mart's prices for big-brand products such as Wrangler dropped so low that
other retailers could not compete by selling Wrangler or similar big brands. The only
way they could compete was to buy products directly from contract manufacturers
and put their own private labels on them. One example is J.C. Penney's private
label, Arizona jeans. Using a private label, J.C. Penney was able to offer a
comparable product at a comparable price to Wal-Mart's, yet make a profit by
buying directly from the contract manufacturer (Field, 2006).
The private labels pose a threat to the in-store brand because of the higher value
proposition they offer to both the consumers as well as the retailers. The emergence
of the fast growing retail chains in India have given the retailers the opportunity of
coming up with private labels. The Tata's have had the first mover's advantage by
introducing private labels in Westside stores. This has helped them in building
markets for their brands and has transformed them into one of the leading players in
the private label market (Menon, 2006).
Following the global phenomenon, most retailers in India have adopted the private
label model. Major retailers like Westside, Globus, Shoppers' Stop and Pantaloons
have adopted a 50 — 90 percent private label model. Merchandise assortments that
are new and fresh, including exclusive private labels that are distinguished from
competition, are key founders of the concept. Young consumers are attracted to
basic relocation concepts like moving certain merchandise categorize within the
stores thus creating a critical mass of prioritized merchandise (Kumar & Jan-
Benedict EM, 2007).
The store brand is different from brands in the store. This model is quite evident in a
number of the existing brands like Lifestyle, Shoppers' Stop and Pantaloons -- rather
than the private label brands in these stores and have great difficulty in articulating
11 Paa

the values of these brands. Since the in-store brand is never going to be sold
anywhere else, except in the store, the fortunes of this brand are indelibly linked to
the frontrunner of the store brand. The unique advantage of private brands is that
they provide the end delivery or fulfillment to consumers within the purview of the
store brand.
Efforts should be made to see that the store brand is a shopping product and not a
convenience product. Customers should be made to hop around to get the product in
store. By doing so, the shopping experience of the customer is enhanced. A retailer
should make it a point that he develops the private labels with innovative features
and ease the task of conversion. The challenge of converting a convenience product
into a shopping product is the major task of the retailer (Chavadi & Kokatnur, 2008).
In India, we find stores like Pantaloons and Westside putting stress on private label
and we find the same plan for new entrants too. Pantaloon Retail (India) Ltd.
operates some 1000 stores under different formats in 70 cities. What is especially
interesting about Pantaloon is its branding strategy where private label plays a key
role. It's John Miller is the flagship brand of Pantaloons. It's Buffalo brand for jeans,
T-shirts and accessories, sold in Big Bazar stores, is even being extended into the
footwear category. Bharti Retail the partner of Wal-Mart in India, reportedly plans
to introduce eight Wal-Mart private labels into its chain. In the intense competition
between private labels and national labels in a growing and emerging economy like
India, each will try to vie for a larger pie. The customer behavior is often a
manifestation of their attitudes towards objects and therefore understanding the
attitudes of consumers towards private labels may be fruitful for assessing future
potential.
1.6 RESEARCH OBJECTIVES
The study attempts to empirically explore the following broad objective:
Customer attitude towards private label apparels in the context of store image is the
focus of this study. Deductions about potential of private label can be made, based
on this.
12 1' ~. ,

1.6.1 SPECIFIC OBJECTIVES
Category I: To identify factors influencing customer attitude from literature like
price, brand name, fashion consciousness, usage, etc. which might play a crucial
role in the success and failures ofprivate label apparels in organized retail in India.
Category II: To explore the importance of various factors identified above in
describing the evaluation of the brand in purchasing apparel from an organized
retail store.
Some of the most important factors, on which the attitude towards private label may
depend are brand name, price, store image, purpose for which the apparel has been
bought and merchandise mix of the retailer.
Category III: To explore the differences between various sub-classes of respondents
based on demographic and other segmentation variables. The differences, if any
found, can help the marketer target the segments better.
Category IV: To finally be able to predict and comment on the filture of'privote
label organized retail in India in the apparel target.
The overall purpose of this research is to explore the attitude of consumers towards
private label in apparels. Need for uniqueness, fashion and lifestyle influences create
positive attitudes in consumers and thereby positively enhances store image leading
to increased intentional of purchase, the main focus of this study. It discusses and
suggests private label initiatives to increase their growth in organized apparel
retailing.
1311',i~~c

1.7 RESEARCH FRAMEWORK
The research framework followed in the present study is given below:
Exhibit 1.3: Research Framework
Preliminary Literature Research Identification Instrument
Conceptualization Review Gap of Research Development Constructs
Reporting of Analysis Data Cleaning Primary Data Pilot Findings & Tabulation Collection Study
Managerial Directions for Future
Conclusions Implications Research
The first and the most important step of the research process is to identify the path of
enquiry in the form of a research problem. It is like the onset of a journey, in this
instance the research journey and the identification of the problem gives an
indication of the expected result being sought (Chawla & Sondhi, 2011).
This study emphasizes the need to explore factors like branding, store image, store
merchandise mix, pricing, quality, and positioning of usage and the role played by
them in building fashion consciousness towards private labels.
14 I!'a c

CHAPTER 2 : REVIEW OF LITERATURE 2.1 . Introduction 2.2 The Definition of Private Labels 2.3 Origin and Emergence of Private Labels 2.4 Growing Importance of Private Labels 2.5 Market Dynamics Leading to Private Label Growth 2.6 Consumer Attitudes Towards Private Labels 2.7 Consumer Perceptions of Store Image
CHAPTER 2: REVIEW OF LITERATURE
CHAPTER OVERVIEW
This chapter presents the literature survey for the study. It mentions the reasons for
emergence of private labels, definition and terminologies of private labels in
retailing and development of private label brands in apparels. It further elaborates on
consumer attitudes towards private labels. This attitude depends on the perception of
different attributes which influences consumer decision towards private labels. It
covers in detail the store image and other attributes which influences consumers'
attitude towards private labels and the contribution of private labels in building store
image. The chapter attempts to identify the variables of relevance from the point of
view of the present study based on which research constructs were developed.
2.1 INTRODUCTION
The concept of private labels has been in existence and is almost a century old.
Originating from groceries and packaged food items, private label share has been
increasing in apparels also in the past few decades. Large retailers try to increase the
share of private labels for increasing their bargaining power vis-a-vis national brands
as well as enhancing the store image.
Apparels involve more involvement and experience characteristics than groceries as
consumers rely on how the clothes fit, how it looks on them when worn and
expectation of how it would withstand the wear and tear of use. The dimensions of
purchase behavior of clothes are different from that of purchase behavior of
groceries.
Consumer attitudes towards private labels depend on intrinsic as well as extrinsic
cues. Brand, store image, usage of apparel, quality perception, price, etc, influence
the modern day shoppers. The consumer's individual characteristics also shape his
fashion and shopping perceptions. They are shopping involvement, importance of
clothing image, fashion commitment, fashion aversion and quality consciousness
(Summers, Belleau & Wozniak, 1992). The individuality of consumers is also
reflected in the choice of his clothes. This is the concept of extended self which
151''.._~~

emphasizes that people need products to express who they are. This implies that
there exist differences in psychographics and demographics of people who go for
private and national brands (Salmon, Bell & Lal, 2004). This need for uniqueness
drives the commitment to fashion. The need for uniqueness can be measured by a
validated scale (Tien et al., 2001). Fashion has always influenced creation of
demand in the apparel industry, especially after the risk of retailer's control of the
commodity chain. Compared to men's wear, women's and children's wear is subject
to more fashion based design changes. Influenced by socio-economic and related
cultural changes there has been trends in clothing towards more informal and casual
wears since 1970s (Leopold & Fine, 1993). Creation of market niches has been
facilitated by consumption based patterns in marketing one's position in the social
hierarchy (Hill, I-logg & Bruce, 1998). There is evidence of social activities
influencing clothing attitude and social acceptance (Shim, Morris & Morgan, 1989).
Aesthetics play an important role in women's assessment of apparel. Five essential
qualities of aesthetic judgment, which include interest, subjectivity, exclusivity,
thoughtfulness and internality, need to be nurtured among consumers to develop
conviction in buying. The quality of aesthetic judgment, driven by in-store aura and
arousal on new products, exercised by the customers in association with the sales
promoters, determines the extent to which the promoted new products and brands
enhance quality of life (Rajagopal, 2008). Color, pattern, styling and fabric are some
of the critical factors in influencing women for selection of garments from the
display racks during the intention phase at point of purchase (Eckman, Damhorstand
& Kandolph, 1990). To Fit specific roles in lifestyle, female consumers choose
apparel products (Cassill & Drake, 1987).
Allocation of spending power across a growing number of product categories
including clothing and footwear is also influenced by young consumers (Paxton &
John, 1995).The awareness of symbolic and emblematic meanings of clothing and
fashion goods and in particular the meanings attached to the sportswear brands by
young consumer support the importance attached to clothing by younger generation
(Hill, Hogg & Bruce, 1998). The influence of peers and `significant others' (such as
celebrities) was central to the acquisition of consumption symbolism. With need for
uniqueness growing stronger, emotional value has started playing a more important
role than functional value in shopping for apparels.
16! d i.c

2.2 THE DEFINITION OF PRIVATE LABELS
Brands owned, controlled and sold exclusively by a retailer are known as store
brands or Private Label Brands (Baltas, 1997). Private Label Brands (PLBs)
appeared over a century ago, PLBs have been popular with US consumers and
retailers. In the 1970s and 1980s, PLBs averaged 140 percent of US supermarket
dollar sales. By 1990, PLBs had become the dominant brand for roughly 20 percent
of US supermarket product categories. In 2000, PLBs comprised roughly 20 percent
of items sold by US supermarkets, drug chains and mass merchandisers (that is, 144
percent of dollar market share and 28 per cent per cent of unit volume share) and
represented more than US $ 50 billion in gross revenue. Roughly, 3000 PI.l3
producers now operate in the United States, and more than 50 percent of branded
consumer package goods producers also make PLBs. Although generally popular
internationally as well, overall PLB market shares vary markedly by country. In
2005, PLB market shares in Europe averaged 23 per cent, yet ranged from 4 percent
in Greece to 45 percent in Switzerland. PLBs are less popular in North America than
in Europe with market shares in Canada and Mexico of 19 percent and 1 percent,
respectively. Factors such as differing market conditions (for example, retailer
concentrations) and differing consumer attitudes (for example, consumer price
consciousness) contribute to this inter-country variance (1-Lyman, Kopf & Lee,
2010).
There is a host of terminologies used for various forms of retailers' private labels,
such as private brands, store brands, own brands, wholesome brands and
distributor's own brands (Hakansson, 2000; Moore, 1995), all of which appear to be
used interchangeably in the literature (Ailawadi el al., 2001; De Wulf et al., 2002;
Sethuraman, 2003).
Private Labels (PLs) are defined as the "products owned and branded by the
organizations whose primary objective is distribution rather than production
(Schutte, 1969). Private Label Manufacturers Association (PLMA) defines it as
"Private Label products encompass all merchandize sold under a retailer's brand.
That brand can be the retailer's own name or a name created exclusively by that
17 1) a_c
retailer. In some cases, a retailer may belong to a wholesale group that owns the
brands that are available only to the members of the group."
The above definition suggests two aspects. First, it is the retailer who owns and
controls the brand, whereas this was traditionally the role of the producer. Second,
the retailer has exclusive rights over the product. This means that different retailers
do not sell identical PLs, which is not the case when retailers sell name brands.
Thus, the development of PLs does not only alter the relationship between producers
and retailers but also affects competition between retailers because PLs become an
additional way of differentiating between the retailers. The two main advantages
derived from the adoption of PLs by the retailers are: bigger margins and increased
store loyalty. In order to be truly successful, retailers must advance from the generic
or store brand mindset of the past to a new private label paradigm. Many retailers
have begun to describe their private label brands as `own' brands because there is a
recognition that these proprietary, exclusive offerings are tools that represent
momentous power and potential for the retail store. PLs are articulated and
developed in a way that they not only fit with the brand promise of the retail store,
but if effective, they also give consumer a key point of departure to enhance and
celebrate the overall brand proposition to keep consumers coming back for more
(Pandya & Joshi, 2011).
It may be of relevance to draw distinction between private label brands that have
been given the name of a store or store chain i.e. same name brands e.g. Kmart; and
private label brands eg. J.C. Penny's Arizona brand. In recent times, retailer named
brands has almost given way in favour of store brands (Henricks, 1998; Ryan, 2003,
2004). There are advantages and risks of launching a store brand by retailers and
similarly there are pros and cons of introducing brand or line extensions of retailer
named brands (Gronhaung et al., 2002; Keller, 2003; Van Riel et crl., 2001). In
categories like ready-to-wear clothing, a store name may not always be appropriate
to brand ego — expressive products (Hirsclunan & Holbrook, 1982).
181 'a,_0

2.3 ORIGIN AND EMERGENCE OF PRIVATE LABELS
Though in existence for more than a century now, private labels had an impressive
growth in past few decades and proliferated in a number of product categories. In
recent times, the growth of private label is outpacing the growth of national brands
(Cohen, 2007). Most of the large retailers are expanding rapidly into private labels.
The same is true of apparels also. Worldwide, the private label apparel share in total
apparel sales has increased from 35 per cent in 2002 to 39 per cent in 2005 to 45 per
cent in 2006. The share is expected to increase to 55 per cent by 2012. In categories
like women's and children's clothing, the share of private labels is higher. (Kumar ei
cil., 2007), One of the major contributions to the rapid growth and success of private
label apparel has been fashion trends (Jolulson & Moore, 2000). Recent surveys
taken in US apparel stores leads to findings of 45 per cent being the share of private
labels in total apparel sales. These figures are as high as 76 per cent in adult apparel
categories and 65 per cent in children clothes. A share of 55 per cent is projected to
be the private label share of total apparel sales of US by end of 2010
(www.fibre2 fashion. com).
Store brands now account for one of every five items sold in U.S. supermarkets,
drug chains and mass merchandiser. They represent more than $ 83 Billion of
current business in retail and are achieving new levels of growth every year (Store
brands Achieving New Heights of Consumer Popularity and Growth, 2009).
The main driving force seems to be the profitability of the brands and sometimes
when the national brands are unable to drive profits, the retailer often tries to
substitute them for private labels (Ashley, 1998; Ryan, 2004). Apart from the
profitability angle, added benefits also accrue to the retailer in terms of
differentiating its offerings from other competing retailers by adding private label
brands. It also gives greater leverage with manufacturers' national brands depending
on the experience nature of the product category. In product categories where need
fulfillment comes from consumers personally experiencing the product, experience
nature of the product is higher (Batra & Sinha, 2000).
Some studies have shown that private label proneness of consumer increases when
price consciousness is low, the nature of category is more search and lesser
experience, quality variations is low and the consequences of purchase mistake is
19I"a~~c

also low. However, these variables do not directly affect the private label proneness
and are also moderated by other variables (Batra & Sinha, 2000), Research has also
been conducted to highlight private label proneness of retailers for enhancing the
overall image and brand perceptions.
Currently the Indian retail segment is witnessing the emergence of corporate house
viz. RPG Enterprises, Tata, ITC, Future Group, etc. Given the attractiveness of the
Indian retail sector, the retail chains were keen enough to enter this growing market
and introduce private labels in different product categories. Private labels are
witnessed prominently in categories such as apparels, food and grocery. life style
and consumer durables. Following Tables provides the various products and private
labels of organized retailers in India.
Table 2.1: Private Label Shares and Product with Higher Growth Rates
S.No. i Product Area
Private Label -
Share (2004-05) Growth (2004-05) (%)
l Refrigerated Food 32 9
2 I Pet Food 21 11
3 Shelf-Stable Food 19 i 5
4 Snacks and Confectionary 9 j S
Cosmetics 2 ----
23 — -- ----
6 - --
Baby Foods ; -- 2 -- '
1 3
Source: Nielsen 's A C (2005). The power ofprivate label.
20

Exhibit 2.1: Private Label Share in Organized. Retail Groups
FUTURE GROUP
Packaged Rice 1
Utensil Cleaner 20%
Spices I 22%
Scouring Pads 9%
Packaged Pure Ghee 9%
Packaged Atta I 42%
Glass Cleaner 52%
Foor Cleaner I 52%
0% 10% 20% 30% 40% 50% 60%
BHARTI RETAIL
Branded Spices 1/70
Salty Snacks 20%
Branded Tea 22%
Packaged Rice 31%
Packaged Atta •359(
Foor Cleaner 50%
0% 10% 20% 30% 40% 50%
ADITYA BIRAL RETAIL
Pickles
Hand Wash
28% 29% 30% 31% 32% 33%
Private Label Share .in the Category
Source: Malviya, S. (2012). Private labels owned by retailers such as Bharti Retail, Future Group outsell national brands in own stores. The Economic Times, New Delhi.
211Page

Table 2.2: Private Labels in Apparel Categories
Retailer Private Brands Product Shoppers Stop Kashish Ethnic Ladieswear Shoppers Stop Stop, Life Clothin Shop ers Stop Vittorio Frattini Premium men's wear Piram d Rudra and Kaanz Ethnic women's wear Piram d Ventiuno Shirts for men Ebony ETC Formal, casual, woolen and
evening wear range of clothing in men, women and kidswear.
Westside Westside Clothing Westside Ascot Premium range of clothing for
men. Westside SRC, Westsport, 2 Fast 4 Clothing
You, Richmond, Urban Angels and Westside
Hypereity City Sense Value packs of tees, socks, briefs, vests, basic denim, etc., for men, women and kids.
I-lypercity City Life Everyday wear for men, women, kids and footwear, styled for value.
Hypercity City Style Offers the latest trends in clothing in the market, at prices that are affordable.
Ilypercity River Inc. A range of quality denials for men, ladies and kids. The range comprises of basic denims, fashion denims, tees, cargos, denial shirts and jackets.
Globus Globus and Fashion 21 Men's and women's wear. Big Bazaar Knighthood Shirts Big Bazaar AFL `Wrinkle-free' apparel
Shyla Wornenswear Big Bazaar Big Bazaar Pink & Blue Children's Apparel Big Bazaar DJ & C Denim Wear Big Bazaar Shatranj Ethnic Apparel Big Bazaar Privilege Club and Studio Evening Wear
NYX Pantaloons Springboard and Victoria Designer pr0t lines Pantaloons Shristi Ethnic Salwar "Karneez (mix
and match range) Pantaloons Fresh Fashion Bare Denim, Bare Leisure, Men's Wear store John Miller, Indigo Nation,
Scullers, zJM Sports, Ajile, Urban Yoga, Akkriti and F Factor.
Pantaloons Fresh Fashion Bare, Annabele, Honey, Ladies Wear store Ajile and Akkriti Pantaloons Fresh Fashion Chalk Boys, Chalk Girls, Kids Wear store Bare 7214, Giny & Jony,
Barbie and Bob the Builder
Source- Chovadi & Kokatnur (2007). Private abe/s in retailing. Marketing Mastermind, Vol. 7, Issue 6, pp. /3— 17.
The rise of private labels in different categories has given a boost to the retail
industry.
22 1 P e

2.4 GROWING IMPORTANCE OF PRIVATE LABELS
Including private labels in the merchandise mix of retailers enables them to drive the
following objectives viz, increasing the image, increase category margins, provide
value for money to customers by competitive pricing, improve bargaining power
with national manufacturers and sometimes create differentiation of the store in
minds of customers through price-quality association by premium pricing of select
store brands (Dhar & Hoch, 1997). The power of a store brand, however, varies
dramatically across product categories even for a powerful retailer (Jan-Benedict &
Dekimpe, 1997). Reasons and entry of store brands have been extensively covered
in retailing literature (Morton & Zeltelmeeyer, 2000) as has been the impact of store
brands on retailers profitability (Ailwadi & I-Iarlam, 2004). Similarly there have
been studies focusing on the strategic positioning of store brands (Sayman el crl.,
2002) and success of store brand itself (Raju el al., 1995).
Retail marketing literature has highlighted the advantages of private label
involvement for retailers as mentioned above. The performance of private label
programs systematically varies across retailers. Although the push and pull tactics of
the national brands exert an important influence on store brand performance, it has
been found that a substantial part of the variation in the market share comes about
from actions taken by the retailer, either independently as part of its overall
marketing strategy or in response to manufacturer's action (Dhar & Hoch, 1997).
Factors like number, competitiveness and actions of national brands manufacturers
influence the category environment in which private labels operate (I-loch & Banerji,
1993).
Categories with higher dollar sales, higher gross margin, less number of national
manufacturers leading to lower levels of national brand advertising spend, may lead
to higher private label share. Hence, private labels tend to do better in large
categories. The demand side of private label success is affected by needs,
expectations and behavior of consumers. In large categories, surprisingly, high
quality may be a more important factor than lower price. The supply side is defined
by retailer's allocation decisions.
Retailing literature of the eighties points to reasons explaining the development of
private brands in retail clothing. Firstly, many consumers shop in shopping centres
231„~~

where they can find a large array of clothes. Specialty shops and boutiques within
large retail stores usually concentrate on offering more restricted lines of clothing in
order to target specific segments. Secondly, new technologies permit quicker
responses to consumer demand in terms of clothing, collection and stocks. Thirdly,
retailers have more negotiating power over manufacturers than they used to. They
may, therefore offer their customers their own brands as well as national brands with
no prejudice on their sourcing capabilities (Salmon & Cmar, 1987).
Prior research has described risk taking in product choices, innovativeness in the
adoption of new products and retail facilities, variety seeking in purchase behavior,
browsing, looking at window displays, and recreational shopping as examples of'
exploratory consumer behaviors. These behaviors have the capacity to lead
individuals to exciting and novel purchase experiences, offer a change of pace and
relief from boredom. The unifying element underlying all these activities is that they
provide consumers with a means of regulating their exposure to sensory and
cognitive stimulation (Sharma, Sivkumaran & Marshall, 2010). These behaviors are
exploratory in the sense that consumes engage in them primarily for the pleasure
inherent in changing the stimulus field and not for extrinsic reasons (Baumgartner &
Jan-Benedict, 1996). Variety seeking is defined as alternating between familiar
choice objects such as brands or stores simply for the sake of change (Jan-Benedict
& Baumgartner, 1995). It is shown to be a result of boredom and attribute satiation
(McAlister, 1982) and a means for seeking one's optimum sensation level
(Baumgartner & Jan-Benedict, 1996). Hence, it is clearly identified as an example of
exploratory behavior. Optimum stimulization level (OSL) is a property that
characterizes individuals in terms of their general response to environmental stimuli
(Leuba, 1955). Many argue that every organism prefers a certain level of stimulation
(called OSL), such that it will attempt to increase stimulation when the
environmental stimulation is below the optimum and vice versa. Hence, individuals
with high OSL are known to be chronically lower in their arousal level, making
them indulge in sensation — seeking activities to achieve their desired (optimum)
stimulation level (Jan-Benedict & Baurngartner, 1995).
Research on variety-seeking behavior shows that changing social situations require
an individual to select a variety of items appropriate to the demands of divergent
contexts and audiences (McAlister & Pessemier, 1982). For example, a consumer
24~"~,.

shopping for clothes for the new season may feel compelled to buy some clothes
appropriate for formal occasions, some for business meetings and others for casual
weekend outings with friends and family. In a study of choices made sequentially in
a group context, Ariely and Levan (2000) found that choosing something different
from others allows consumers to assert their uniqueness and get information about
additional options. The level of variety seeking is also greater when people make
choices for others, especially when they are held accountable for their choices (Choi
ei a/., 2006).
A major change that has come up in private label selling in apparel industry is that
the retailers have improved the quality. Nineties saw the growth of private labels in
apparels and the store brands became national as much as a brand as any other
(Henricks, 1998). Store brands are very much present in the retail apparel market
and in near future the growth of the same will increase (NDP Group, 2003). It was
beneficial for private brands to extend into categories similar to their existing private
labels. Extensions similar to the private brand are more likely to yield a positive
outcome than extensions into similar product categories. Brand reputation and
similarity are important when extending into categories that are difficult to judge
(Gronhaug et al., 2002).
Due to the growing importance of private labels, marketing managers and
academicians have always been interested in research on these. The research on
private labels can be broadly divided in two streams. One stream of research has
been conducted for identifying factors associated with adoption of private label
brands. The main objectives of this stream of research has been to uncover stable
personal characteristics resulting in private label brands proneness and specify
demographics, psychographic and other variable leading to identification of market
segments. Identification of market segments have been based on consumer
demographic and psychographic variables to assess attitudinal and behavioral factors
that tempt the consumer towards private labels.
The other stream of research has been focused on competition between national
label brands (also called Manufacturer's brands) and private label brands to identify
differentiation and competitive strategies.
25 c

Exhibit 2.2: Schematic Diagram
Research on Private Labels
Factors affecting Private label Patronage Competitive Strategies for
Demographic Psychographic Behavioral
Private Label National Brand
Earlier studies on Private Label brands (PLBs) were mostly descriptive and often
focused on differentiating either National Brands (NBs) from PLBs or PLB users
from PLB non-users. Later studies often profiled behavioral differences among users
of NBs are most influenced by advertising than consumers who prefer PLI3s or
generic brands, and consumer groups rate attributes — such as quality and reliability
— differently for each brand type. Retailing scholars have shifted their focus from
behavioral differences among PLB users to PLB success factors, for example, high
quality is more important than discounted price. High-loyalty and store-switching
cost, boost market share by attracting price — insensitive consumers who were once
loyal to NBs and eventually yield higher profits (Hyman, Kopf & Lee, 2010)
2.5 MARKET DYNAMICS LEADING TO PRIVATE LABEL GROWTH
In the classic definition of Appelbaum and Gereffi (1994), the textile and clothing
sector constitutes a typical buyer-driven commodity chain in which retailers, instead
of manufacturers, are the main driving force shaping the networks of production.
Generally, the most value-added intensive phases are at the beginning of the chain,
in the design of clothes and the organization of production networks, and at the end,
in the marketing and retailing. These are precisely the phases that have been taken
over by retailers, who, as a result, then hold the strongest economic position and
command the power to shape the rest of the chain to their advantage.
In many countries, the increasing role of retailers in shaping the production chain by
a concentration process and a verticalization process. Concentration basically means
that fewer retailers concentrate an ever larger market share. Verticalization means
261:;'a

that retailers take over part of the production themselves, either by acquiring
knowledge that used to be a prerogative of manufacturers or by establishing their
own manufacturing enterprises (Boconni University ei al., 2007). Regarding the
concentration process of retailing, important differences persist across countries.
While in the US and UK large chains dominate the market in Italy (and to some
extent Germany), concentrated distribution channels have a lower market share and
individual retailers maintain an important role. A high degree of retail concentration
has a negative impact on domestic manufacturers and enterprises, which produce for
retailers' labels have limited capacity to innovate (Reinecke, 2010).
Data on private labels indicate that initially private labels increased their share of the
organized retail market very fast. It posed a threat to the national brands. Store brand
products directly compete with national brand manufacturers' products, thus
providing a source of channel conflict. Retailers draw benefits from store brand
products that mitigate their dependence on national brand manufacturers and
increase bargaining power, improve profit margins, and help differentiate a retail
chain from its competitors, leading to stronger customer relations (Dunne &
Narasimhan, 1999). To avoid competition from store brand products, national brand
manufacturers often grant concessions to reduce their store brand introduction
incentives. In many cases, such concessions take the form of national brand
wholesale price reductions that render a store brand introduction unattractive to the
retailer. However, such strategic wholesale price reductions can only be used to
prevent store brand introductions if the National Brand manufacturer can credibly
commit to maintaining a wholesale price irrespective of whether the retailer
introduces a store brand product or not (Groznik & Sebastian, 2010).
However, in developed economies, the private label share increased at a decreasing
rate and now has more or less stabilized. Some researchers felt that the threat of
private labels is very often overrated. By following certain strategies, the national
brands can ward of this threat and continue to dominate the market. One of the
strategies that the national brands at times resort to is introducing a fighting brand
with similar positioning as the private label. However, introducing fighting brands
by national manufacturers to compete with private labels is not considered a good
strategy. It's because fighting brands often cannibalize the national brand more than
they compete with private labels (Quelch & Harding, 1996). Still, manufacturers
27 Pa -c

have reason to be concerned as there are more private labels on the market than ever
before. This is more so in the case of growing economies like India and China. The
growth of private labels has got fuelled by the economic recession in the recent past.
Research indicates that the private-label market share generally goes up when
economy is suffering during spells of recession.
In a series of reports on consumer attitudes and behavior toward store brands,
Private Label Manufacturers Association (PLMA) has found that shoppers bought
more store brands at the onset of the recession, even in categories where they were
once loyal to national brands. Since then buyers have continued to purchase more
and more store brands and expect to do so even after the economy rebounds.
Research revealed that the percentage of shoppers who identify themselves as
frequent buyers of store brands is at an all time high, more than 57 per cent and 76
per cent of consumers across all income levels who changed their shopping habits
during the recession say they will continue to buy more store brands even as the
economy returns to normal (Mason, 2011).
Not all researchers considers private labels to be a threat to national brands. Some
are of the opinion that private labels, specially the premium one, challenge the
national brands. This doesn't allow the national brands to become complacent and
force them to innovate. Thus, premium private labels can actually boost innovation
and not kill it (Donne & Narasimha, 1999). The future for national brands survival
and growth lies in their being innovative and thought leaders. They will have to
innovate and provide new designs and fabrications while maintaining the quality
leadership to sustain their share (Ryan, 2004).
As national manufacturers struggle to connect with consumers through increasingly
fragmented media, the retail environment has become the new battleground for
shoppers who once believed private labels sacrificed quality for economy. Store
brands are fighting big brands in several keyways, a new sensitivity to consumers'
changing lifestyles, quick response times (a result of their ability to collect data at
point-of-purchase) stylish packaging and higher quality ingredients. One new
development United States retailers are offering is an increasing number of tiered
private label options, a strategy well-entrenched in the more sophisticated United
Kingdom private-label market. National manufacturers slow to respond to private
28 ' i c

label practices, are finally working up to the changing world order, with more
fighting back and in some instance, even joining the enemy camp (Noreen, 2007). W
2.6 CONSUMER ATTITUDES TOWARDS PRIVATE LABELS
The growth of private labels is also an indicative of the change in consumer attitudes
towards these over a period of time. A lot of early research studies on private labels
were based on groceries and commodities bought from the local supermarket. They
were mainly undertaken to understand consumer responses to private labels in the
groceries market. The studies indicated that there was a clear perceptual bias in
favour of national brands. Regardless of the product category or real ingredient
differences manipulated, ingredients disclosed to be of national manufacturers
received significantly more favorable quality assessment than ingredients disclosed
to be of store brand origin (Richardson et al., 1994). In the nineties, the store brands
started concentrating on improving the quality of their product and also its image.
They understood that even with the same ingredients in two packets, the packet
having national brand is evaluated better in quality than the store brand. This effort
on the part of private labels started yielding results and a lot of studies conducted in
this domain started indicating a decreasing quality difference between the national
brands and private labels. The difference in image, though, still remains but the pap
between the two started decreasing. In some cases, the premium private labels were
considered similar in quality than the national brands (Anselmsson et al., 2008;
Deleersnyder et al., 2007; Juhl et al., 2006; Labeaga el al., 2007; Mendez el ail.,
2008).
The image gap reduction came because the private label managers understood the
process by which the consumers evaluated brand quality. In early nineties, an
experimental study on grocery items was conducted to know the reasons of the store
brands being considered inferior to national brands in evaluation. It indicated that
consumers' unfavorable reactions to store brand grocery items were largely the
result of consumers' propensity to rely on extrinsic cues when assessing product
quality. The consumer often could not assess the actual intrinsic quality of the
product and compare the national brands vis-a-vis store brands. In such uncertain
situations he largely takes shortcuts like brand name, price etc. to evaluate the
29js' ~51

product quality (Richardson et al., 1994). This revelation leads the retailers to
concentrate on both the intrinsic quality as well as extrinsic cues. The inherent
quality of national brands and some premium private labels came so close that in
blind tests the respondents were unable to recognize the national brand against the
private labels. For giving extrinsic cues, the private labels concentrated on
packaging and labeling. The retailer margins were very high in private labels as
compared to national brands, so retailers started giving a preferential treatment in
allocating shelf space to their private labels. Research also indicated that store
brands should be positioned very closely to the national brand in order to give it stiff
competition. With all these efforts, the store brands were able to decrease the quality
perception gap between them and the national brands. However, even when the
extrinsic cues give similarity, the customers still are not always very convinced
about the intrinsic quality of store brands and the gap still exists (Sayman, Hoch &
Raju, 2002). The reason for the customer not being very confident is the uncertainty
associated with the performance of the private label. This fear of uncertainty is even
more when the customer has never experienced the private label before. This
uncertainty is termed consumer perceived risk in literature and has been studied
extensively and is the deciding factor for a consumer to decide in favour or against
private labels.
The concept of consumer perceived risk was first deliberated by Bauer in 1960. His
article threw light on the decision making process of consumers and set off a surge
of research from 1960s onwards. The consumers were assumed to be rational human
beings who weigh the benefits and risks associated with any purchase. If the
perceived benefit appeared to be more than the perceived risk, the consumers' were
more likely to buy the product. In case of garments purchase, the consumers'
undertook various activities to evaluate based on the perceived benefit of the activity
to reduce perceived risk. If the perceived risk was within the acceptable limit, then
they didn't go much for information search related behavior but the behavior is
significantly different when the opposite is true (Dowling & Staelin, 1994). As the
perceived risk in case of national brands is less as compared to private labels, the
customer often engaged less in information search for national brands but enquired
extensively in case of private labels before purchase. It signifies the importance of
studying the perceived risk in case of private labels. The willingness to buy private
3011'agC

label products is influenced greatly by the perceived risk associated with it. The
consumers go for private labels only when the perceived risk is lesser than the
perceived benefit. The managers of private labels need to implement strategies that
will reduce the perceived risk associated with their brands (Batra & Sinha, 2000;
Richardson et al., 1994; Sinha & Batra, 1999; Stone & Gronhaug, 1993; Gemunden,
1985; Mitchell, 2001).
Customer perceived risk is conceptualized as the result of two dimensions. One is
the perceived adverse consequences that may take place. The other is the probability
of occurrence of the perceived adverse consequence (Arndt, 1967). It was found that
the impact of risk was often highly correlated to the likelihood of occurrence thus
making the impact component to he considered redundant. The likelihood of
occurrence was enough to understand the impact of risk, thereby giving the estimate
of customer perceived risk (Dowling, 1986; Peter & Ryan, 1976). The overall risk
was further divided into financial risk (paying more than value), performance risk
(product not performing up to expectations), etc. Research were more skewed
towards measuring overall, financial and performance risks as they appear to be less
product — specific than other dimensions (Agarwal & Teas. 2001; Grewal er cr/.,
1988; Shimp & Bearden, 1982; Sweeney et al., 1999). In order to reduce the
performance and financial risk, suppliers of durable goods direct attention in their
promotional materials towards these. Though, building a strong quality image helps
in reducing risk perceptions, perceived risk also mediates the impact of quality and
service contributions. Hence, specific training of store staff and promotional
activities to reduce consumer concerns about future use deserves attention. In order
to develop a scale to measure customers' perception of the value of a consumer
durable, the four noticeable dimensions proposed were emotional, social,
quality/performance and price/value for money (Sweeney, Soutar & Johnson, 1999).
In a study conducted in select cities of Gujarat in 2010, it was observed that retailers
should promote private labels by which it decreases the level of perceived risk while
increases the level of perceived image of private labels / store / retail outlets. Across
categories of consumer durables and personal care products, attitude towards
perceived risk as well as image was found to be unfavorable (Pandya & .loshi,
2011).
311!' p
The various dimensions of risk are dependent on various factors. The social risk or
risk to self — image is more in case of products that are visible to others than with
those which cannot be seen by others. According to social identity theory,
individuals aspire to belong to entities that compare favorably with or are distinct
from other entities as such affiliations enhance their self-esteem (Taifel & I-ienri,
1985). Identification is positively associated with prestige and distinctiveness
(Ashforth & Mael, 1989; Bhattacharya, Rao & Glynn, 1995; Mael & Ashforth,
1992), and when individuals believe than an organization has a favorable reputation,
public affiliation with that organization is viewed as an opportunity for a positive
identity (Taifel & Turner, 1985), that is, associations with a highly regarded
organization help individuals satisfy the need for self-continuity (i.e. maintain a
consistent sense of self, self-distinctiveness (i.e. distinguish from other in social
contexts) and self-enhancement (i.e. enhance self-concept through associations).
Social identity theory suggests that individuals are more likely to cognitively
associate themselves with superior entities or "winners" (Ashforth & Mael, 1989) as
such entities offer the potential to enhance their self-esteem and bask in reflected
glory (Campbell, Aiken & Kent, 2004). As quality perceptions form a critical
component of a brand's identity (Aaker, 1996), high brand quality fosters
identification by enhancing the attractiveness of the brand's identity, that is the
brand is perceived to contribute more to self-esteem, self-consistency, and self-
distinctiveness than other brands (Badrinarayanan & Laverie, 2011).
1-Ience, for products which are visible to others, social risk (Campbell & Goodstein
2001; Stone & Grounhaug, 1993) or self— image risk (Dowling & Staclin, 1984) are
particularly important. Since, clothes are visible to others, they lie under this
category. Clothes and other fashion items are related to consumers' social identity
and used to communicate that social status with others (Feinberg el a/. 1992). The
amount of risk also determines the time spent and importance given to the purchase
by a consumer. This is termed degree of involvement. It influences the consumers
buying behaviour and can be measured. The low involvement behaviour is
significantly different from high involvement decisions (Zaichkowsky, 1985). For
example, when there is no risk associated with the evaluated product, it can be
termed a low involvement decision. The customers have a tendency to try different
things. That is, in this situation a product which is slightly different from the
32(!'a_.-

expectation (called a moderately incongruent option) is evaluated more positively
than the usual (called a congruent option). This explains the behaviour of variety
seeking in low risk/low involvement products. However, when the risk is high, the
moderately incongruent option is evaluated less positively than the congruent option.
Overall, analyses support the idea that relatively high levels of risk lead consumers
to have preference for the norm. High risk leads consumers to prefer the
conventional that matches expectations rather than going for new thing (Campbell &
Goodstein, 2001).
The mangers also need to know how the perception of risk is formed. The customers
evaluate risk of a decision based on signals or cues. They are called intrinsic and
extrinsic. Intrinsic cues are the inherent quality of the product. Extrinsic cues are the
packaging and the environment in which the product is sold. The relation between
cues and perceived risk is also related to the cognitive model of preference in
consumer behavior. Cognitive model takes the rational thinking into account as
compared to affective model which considers the importance of emotions and
feelings in consumer decision making. Cognitive affective model is considered
better in comparison to cognitive model in explaining consumer behavior (Li
Monroe, 1994). Sometimes the affective component plays an equally important role
and it sometimes precedes the cognition. The cognition is such case merely becomes
justification for the presence of attitude. It indicates that attitudes based on affective
component cannot be changed merely by cognition (Zajonc & Markus, 1982). Scales
called consumption emotion set has been developed to capture the emotions of
consumers during their shopping experience due to affective component (Richins,
1997).
1-Iirschman and Holbrook (1982) suggest that individual differences have an effect
on cognitive and affective factors, which in turn affect behavior. In a study
conducted by Archana Kumar, Hyun-Joo Lee and Youn-Kyung Kim among college
students in Mumbai in 2009, effects of individual characteristics (i.e. consumers
need for uniqueness and attitudes toward American products) and brand-specific
variables (i.e. perceived quality and emotional value) were examined on purchase
intention toward a U.S. Retail brand versus a local brand. Need for uniqueness is a
trait or personality characteristic that is inherent in a person (Tian et al., 2001), while
consumers learn attitudes over time (Wells & Prensky, 1996) and become more
3311'

3
susceptible to marketing efforts (Roper & Parker, 2006). Existing attitudes toward a
country might affect how consumers evaluate a particular product category from that
country and a particular brand from that country (Haubl, 1996). The study in
Mumbai proposes that need for uniqueness (inherent characteristic) influences
attitudes toward American products, which in turn influence the cognitive and
affective responses toward a U.S. versus an Indian local brand as per the conceptual
model depicted below.
Exhibit 2.3: Conceptual Model United States Vs. Local Brand
INDIVIDUAL COGNITIVE Characteristics RESPONSE
Perceived
Quality Attitudes Need for Toward Purchase
Uniquenes American Intention Products
Emotional Value
AFFECTIVE RESPONSE
Source: Klmnar, Archana, Lee, Hvlm-Joo & Kim, Yong-kylnlg (2010). Indian Co17Slllnel's Purchase intention towards United States Vs. Local Brand. Journal of Business Research, Vol. 62, p. 522.
The study by Kumar et al. (2010) using structural equation modeling (SEM) finds
that Indian consumers need for uniqueness positively influences attitude towards
American products. Attitudes toward American products positively affect perceived
quality and emotional value for a U.S. brand while this effect is negative in case of a
local brand. Indian consumers may suspect quality assurance of local apparel brands
when variations in quality occur. However, other aspects like aesthetics or fashion
trends could, take precedence over quality informing Indian consumers purchase
intention toward a specific local apparel brand. The study supports Sinha's (200 3)
finding that Indian consumers are more oriented toward emotional value than
functional value for shopping.
The current literature adds one more dimension to attitude, which is conative. Now,
the attitude towards private labels will be a combination of cognitive, affective and
34 C

conative (experience) components. In case of apparels, brand plays a pivotal role in
the shaping of attitudes. A brand has a personality which has different dimensions
(Aaker, 1997). Brand name cues are relied more by the consumers than price or
physical appearance, which is, in turn relied on more heavily than retailer reputation
for judging product quality. If the dimension of brand personality is communicated
as a specific signal, it has more chances of being relied on in assessing quality by the
consumer. This phenomenon is similar across cultures but affected by individual
characteristics of shoppers (Dawar & Parker, 1994).
Brand image has been operationalized with three dimensions — corporate image,
social image and product image (Biel, 1992). Corporate image is the consumer's
image of the good producer or service provider. Social image involves society's
acceptance of the brands and what the brand stands for. Product image involves the
image associated with the good or service. Brand image associations can be viewed
as hard (tangible / functional attributes) and soft (emotional attributes) (Biel, 1992).
Thus brands that are user-friendly (hard) and trustworthy (soft) may generate
favorable consumer purchase intentions (Sierra, Heiser, Williams & Taute, 2010).
The perceptions, idea, feelings and attitudes that consumers have toward a certain
brand strongly affect their decision to purchase and to remain loyal to that brand
(Gardner & Levy, 1955). Accordingly, the importance of retail brand image has
experienced long-standing interest (Jacoby & Mazursky, 1984; Louviere & Johnson,
1990, Ailawadi & Keller, 2004). Retailers must be cognizant that their brand image
is closely linked to their offerings and store operations (Grewal, el al., 1998).
It is in the interest of the retailer to develop loyalty towards its brands. Research has
been done earlier to address the issues of loyalty to brand or a particular store
(Cunningham, 1961). Loyalty decreases customers' propensity to switch brands.
Brand loyalty development is a process. In fashion retailing, it can be improved by
understanding of customer perception of store attributes (Birtwistle, Clarke &
Freathy, 1998). Most consumers abandon extensive search behavior to return to their
preferred brands after sometime (McConnell, 1968). A small price increase does not
affect a change in purchase intention but a decrease in the price of the preferred
brand results in significant responses. When price is the only differentiator, the
preference of consumers towards the lower priced product may be weak. When
brand familiarity is equivalent between national and distributor brands, there are
35 I '

clear preferences towards the former (Monroe, 1976). Established brands also leads
to increased advertisement memorability and moderate competitive interference due
to consumers' being more familiar with the brand (Kent & Allen, 1994).
Evaluation of a garment by the consumer depends on the type of brand it carried.
Other extrinsic attributes such as price, type of store and store image may also
impact assessment of value of a piece of clothing, although brand name is an
important cue. In addition, what consumers intend to do with the desired garment is
likely to shape the buying process. If the purchase of the garment is made in the
context of a special occasion, the brand name and the store where it is bought may
have more importance than if the purchase is made for the garment to be worn on
everyday (d'Astous & Saint Louis, 2005). An experimental research was conducted
by Alain d' Astous and Odile Saint Louis in 2005, to figure the interactive effects of
brand name (national versus store brand), intended usage situation (everyday use
versus special occasion), price (regular price versus discount), type of store
(department store versus boutique) and store image (upper-class versus lower class)
on consumer evaluation of a shirt among 127 Canadian adult female consumers. The
experimental manipulations were realized by means of short vignettes describing a
fictitious buying situation. The data were analyzed using an analysis of covariance
(ANCOVA) mode (Keppel & Wickens, 2004). The dependent variable was the
overall evaluation of the garment after adjusting for familiarity with the brand and
store stimuli and the independent variables were the fine experimental factors, i.e.
within-subjects: brand name, type of store and store image; between subjects : price
and intended usage situation. In this model, involvement in shopping, interest in
fashion, and brand sensitivity were included in the ANCOVA model as covariates.
The results of this study by Alain d' Astous and Odile Saint-Louis (2005), suggest
that the popular perceived superiority of national brands over private brands must be
questioned, at least in apparels. Consumer preferences for branded garments result
from the interplay of store image and purchase motivation. When a shirt was offered
in an upper-class store, in the context of buying a shirt for a special occasion, the
consumers valued more a store brand than a national brand. For decisions on
purchase of a shirt to be worn everyday, which is a less involving decision,
participants gave their best appreciation to store brands available in low-reputation
stores. One possible explanation for this result in the inference made by consumers
36 1 ''

that this is where they would get the best deal. One of the problem of this study have
been the non-observation of a price effect and some implicit price information was
obtained in the store image factor (d'Astous & Saint-Louis, 2005).
Previous research indicates lesser impact of price increase as compared to price
decrease. Price preference is also a weak differentiator (Monroe, 1976) but there is
evidence of the opposite also. Sandra M. Forsythe (1991) found that perceptions of
price among store, national and designer brands of apparels are found to influence
consumers' decision-making style. Different consumers have different degree of
proneness towards private labels. The propensity to go for private labels depends
heavily on the consumer's attitude towards private label. Studies have shown both
conceptually and empirically that internal reference price is influenced by price
discounts, brand's perceived quality and brand name. More than 40 per cent of
variance in purchase intention can be explained by direct and indirect effects of price
discounts, brand name and store name. Although these three cues are not the only
cues consumers are likely to use in assessing intentions to buy, they are certainly key
variables that should be included by retailers while examining the effectiveness of
their merchandising strategy. More than 85 per cent of variation in perceived value
is explained by brand name and price discounts. Merchandise selection and price
discount strategies of retailers play an important role in shaping consumer's
perceptions of value (Grewal el al., 1998). The consumers' attitudes towards private
label brands, in turn, is positively related to deal proneness, value consciousness and
smart shopper self perceptions while the measure is negatively related towards
propensity of brand loyalty (Burton, Lichtenstein, Netemeyer & Garretson, 1998).
The consumer going for private label is prone to deals in private labels but may not
be very sensitive to the price gap with the national brand or to the absolute level of
the price of the store brand (Kumar & Jan-Benedict, 2007). The price perceptions of
shoppers are influenced by brand name but brand may not affect perception of
quality.
Quality perception is also influenced by the country of origin and affects the buying
behaviour. Goods and brands of industrialized nations are considered superior to
developing nations (Cordell, 1992). Product quality perception may increase as price
increases while at the same time high sensitivity towards minor fluctuations in
pricing levels are not observed while evaluation of products subjectively by
37

consumers (Dodds & Monroe, 1985). Study of orientation of Indian shoppers
indicates that they seek emotional value more than the functional value. The country
of origin also influences buying behavior as consumers consider the goods and
brands of industrialized nations to be superior to developing nations (Cordell, 1992).
Also Jaffe and Martinez (1995) find that Mexicans rates American and Japanese
electronic products much more positively than Mexican brands. Kinra's (2006)
study deals with consumers in India and finds that they perceive foreign brands to be
of a higher quality than local brands. Indian consumers hold positive attitudes
toward American product because of their association with modernity, individuality
and non-conformity to traditional values (Batra el al., 2000). Brand loyalty also
tends to be lower for younger generations (Celmer, 2011).
Indian shoppers are a bit different from the western counterparts. The Indian
consumer, who is being wooed by most global brands, has also been analyzed and
profiled by researchers (Bharadwaj el al., 2005). Study on orientation of Indian
shoppers indicates that they seek emotional value more than the functional value.
However, some perceptions of Indian customers are similar to other countries in the
study in 2009 of Bapat & Panwar. They were trying to find the probability of
success in case of brand extensions in India through customer perceptions. It was
found that brand extensions in similar categories were perceived by customers to
have more chances of success than those which were in dissimilar categories.
Most studies on private label products have presumed that consumers are able to
identify which are retailer brands and which are not. Literature review seems to be
scarce on how consumers differentiate between private label clothes of different
departmental stores hypermarkets or specialized clothing retailers that exclusively
sell their own brands e.g. Benetton, I-I & M and Zara (Kumar & Jan-Benedict, 2007).
At what point does a private label becomes a national or international brand in the
minds of consumers or when do the actual brands of the clothes become more
important than the brand of the store itself? There are instances where store brands
have been replaced by own brands with Fictional names, implying that the latter are
more attractive to consumers. A positively perceived brand name will augment
perceptions of consumers of the quality, value and hence willingness to buy the
product (Dodds, Monroe & Grewal, 1991) while simultaneously decreasing social,
psychological and functional risk. Store brands of clothing are indeed marketed as if

they were national brands Premium private label brands are luring consumers and
are trendsetters in creating entirely new categories (NDP Group, 2003).
As mentioned earlier, most literature review of past has shown that consumers
usually perceive private label brands as being inferior to national brands (Ward et
crl., 1986). The picture has changed dramatically over the last decade. Whereas
traditionally store brand names used to be associated with lower value and lower
prices, today's private label brands are competing aggressively against national
brands in terms of image quality and value (A.C. Nielsen, 2003). Like national
brands, private label brands use advertising, designer names, celebrity endorsements
and other promotional retail techniques to be marketed and positioned like national
brands for creating a distinct personality (Aaker, 1997). Research involving ad
appeals that use themes of beauty and attraction (eg. Belch, Belch & Villareal, 1987,
Percy & Rossiter, 1992) as a source effect (Petty, Cacioppo & Schumann, 1983) to
influence brand attitudes and purchase intentions hint at an important role for beauty
and attractiveness in the retail context (Argo, Dahl & Morales, 2008).
In case of private label apparels, the important determinants of customers' intention
to buy are perceived risk of buying, the perceived product quality and value
associated with the private label and store image. The store image is the external cue
and product quality and value are intrinsic cues which affect his decision making
(Lilijander, Polsa & Van Riel, 2009). When the customer is unable to evaluate the
intrinsic cues like the product quality etc., lie depends on extrinsic cues like the store
image, packaging etc., for his decision. In case there is lack of familiarity or no prior
experience exists with the private label, consumer reliance on extrinsic cues such as
brand name, packaging, price in quality assessment increases. At the time of
consumption and in pre-purchase situations, the consumer depends on intrinsic
attributes if he is able to judge/predict it. In contrast, he depends more on extrinsic
cues in initial purchase situations, when evaluation of intrinsic cues are not
available, when evaluation of intrinsic cues require more effort and time than the
consumer perceives is worthwhile or when quality is difficult to evaluate (%eithaml,
1988). One of the major extrinsic cues that consumers often rely upon is the price to
evaluate quality called the price — quality relationship. It means higher the products
price the better the quality perceived. However, researchers have tried to compare
39 1 ' ,, ~

the price — quality relationship cue with other external cues like brand name and
store name. It has been found that consumers are less likely to rely on the price -
quality relationship if the cues of brand name and store name are familiar (Dodds el
crl., 1991). Therefore, improving intrinsic quality and educating the customer to
evaluate intrinsic quality by increasing the information processing stage of
consumers can help private brands. Alongside this, the private labels also need to
improve the extrinsic cues to increase customers' proneness towards private label
brands (Richardson, Jain & Dick, 1994).
However, in case of innovative products, extrinsic cues appear incapable of
lessening the uncertainty associated with the performance of the product. Most
consumers then rely on actual product usage experience or on word of mouth
assurances from more innovative consumers in order to achieve tolerance levels of
perceived risk prior to purchasing an innovative product (Shimp & Bearden, 1982).
if the consumer is exposed to favorable word of mouth, it increases the perceived
value of the purchase while exposures to unfavorable comments decrease the
profitability. The closely an individual is integrated with his society, the more it
increases the possibility of early purchase because of positive word of mouth. Based
on the risk perception, consumers can be divided into low-risk perceivers and high
risk-perceivers. Compared with low-risk perceivers, the high risk perceivers were
less likely to buy the new product but were more affected by the information
received (Arndt, 1967).
Beandoin, Moore and Goldsmith (2000) examined if fashion leaders and fashion
followers differ (a) in the importance they give to selected apparel attributes, and (h)
in their attitudes toward buying domestic and imported apparel. Fashion leaders
have been defined as people who are more interested in fashion than other
consumers in the market, who are the first to purchase new styles, more confident of
their taste and influence others to adopt and buy new fashion items (Greenberg,
Lumpkin & Bruner, 1982; Kaiser, 1990; Polegato & Wall, 1980; Schrank &
Gilmore, 1973). Definition of fashion leaders also include two other constructs:
fashion innovators and fashion opinion leaders in this study among women in
Florida. Results depict that fashion leaders had a significantly more positive attitude
toward imported apparel than followers. The choice of Fishbein model to measure
attitudes towards domestic and imported apparel provided a context For results and
401!':,,

showed that leaders placed more importance than followers to attributes related to
the symbolic aspects of the apparel, no difference regarding attributes was found
between the two groups. Considering the leaders are impulsive buyers, attributes
such as color, fashionableness or attractiveness may represent more determinant
buying factors in the store. As many retailers procure more imported apparel than
domestic apparel due to the higher profit, it is possible that leaders may choose from
a larger selection of imported apparel than domestic apparel (Beaudoin, Moore &
Goldsmith, 2000). In an industry that traditionally skimped on packaging, the new
emphasis on private label has meant a switch in aesthetics. Now, appearance at point
of purchase is one of the most compelling strategies being employed (Noreen,
2007).
Apart from cues, the need for consuming a product also affects the buying of private
labels. Most research indicates the requirement of a product and its utility (utilitarian
approach) to be the main reason for purchase. Although, this utilitarian aspect has
been able to explain a large part of buying behavior but sometimes product are
bought for experience (experiential approach). Both the approaches together explain
the consumer behaviour better (Holbrook & Hirschman, l 982).
2.7 CONSUMER PERCEPTIONS OF STORE IMAGE
Store image is an important factor in decision making. Store is a personality that
draws shoppers to one store rather than another. Apart from value and quality of
merchandise retailers should also be concerned with a wide range of other factors
(Martineau, 1958). In fact, total conceptualization or expected reinforcement that a
person associates with shopping at a particular store, may be defined as store image
(Kunkel & Berty, 1968).
Image creation is a major component of retail strategy. Consumers often use image
to help evaluate and select retailers. Retail store image is the schematic memory
(sometimes called knowledge structure) of a store as a result of many different
stimuli. For example, knowledge structure of a target audience for McDonald's
restaurants may be based on the association of the restaurants' fast service, friendly
staff, low price, child-friendly atmosphere, limited menu, and clean facilities. Store
411 i'aga

image can be used to position a retailer vis-a-vis other stores in consumers' evoked
sets (Borna, Stearns, Smith & Emamalizadeh, 2008).
Retail store image may be thought of as a combination or association of discrete
elements. The web of tangible and intangible discrete elements in a store's image is
linked together in a molecule-like whole. The multiple-element molecule nature of
store image suggests that if an element deliberately or inadvertently, is changed,
such a change may completely alter the essence of a store's entity and hence its
image. Using an analogy from chemistry, switching Fe302 to Fe203 creates a new
substance (Borna el al., 2008).
Since the seminal work of Martineau (1958), the literature yields several conclusions
about image, Among these are:
1. There is general agreement about the definition of store image.
2. There is still disagreement concerning the potential major elements of store
image:
- Merchandise
- Services
- Clientele
- Physical Facilities
- Convenience
- Promotion
- Store atmosphere
- Institutional attributes
- Post-purchase satisfaction
- Store employees
The most frequently examined store image attributes are: merchandise, quality and
price, location, convenience, general service, and employee / sales clerk image and
service. Research findings state store image as a major success factor in retail
industry. Forecast of marketing performance for retail success can be done by a
measurement model of store image that conceptualizes the perception of store image
attributes (Hildebrant, 1988).
A mix of functional and psychological attributes of a retail outlet, form attributes of
the store as perceived by the customer. Merchandise selection, price range, credit
42I1',~

policies, store layout and some other factors comprise functional attributes. These
attributes are measurable to some extent and can be used to compare one store with
its competitors, objectively. Psychological attributes include considerations such as a
sense of belonging, a feeling of warmth, friendliness and a feeling of excitement.
These attributes may be difficult to identify and used for comparing the extent of
presence across outlets (Lindquist, 1974). Literature available shows store image to
be key construct in understanding inferences of store choice, store satisfaction and
store quality. Store image is used to predict consumer behavior and store
performance, and is also an antecedent of competitive positioning (Hartman &
Spiro, 2005).
Past researchers have successfully developed objective measurements for measuring
store image. INDSCAL, based on individual difference scaling has been developed
to measure store image (Doyle & Fenwick, 1974). Content analysis has also been
used to draw frequencies and based on the same, perceptual map of various stores
may be plotted to depict the image of stores in the minds of people (Jain & Etgar,
1976). Research based on content analysis also demonstrates that consumers think of
retail store image both in terms of specific store attributes and global or overall
impressions (Zimmer & Golden, 1988).
The image of the store has also been studied using a multi attribute model. Through
the identification of salient attributes, a quantification of the importance of these
attributes as indicated by target set of customers can be obtained. Evaluation of
stores on these attributes leads to better comprehension of the target market. Not
only can a retailer tell how his store image compares to other stores on overall
measures and on various attributes, but the retailer can also quantify the importance
of the various attributes that he has been ranked on. Furthermore, by cross-
classifying groups of respondents on the basis of demographics versus importance
rankings, the retailer can better segment the target market and aim specific
marketing program (James et al., 1976). Formation of store image is based on cues.
Consumers rely on different sets of objective cues to infer different image aspects.
Brand name information may be considered to be most important cue in forming
quality of merchandise impressions. Number of salespersons per department may be
considered the most important cue for evaluating quality of service (Mazursky &
Jacoby, 1986; Turnbull & Wilson, 1989). Consumer attitudes towards a store are
43 1 ' .;

linked to customer expectations, previous purchase experience and customer
perception of the store. Store image is formed .by consistency between expectations
and what a customer wants in a store. Impression of store image is negated by
incongruity (Osman, 1993).
Visser et ul. (2006) studied the importance of apparel store image attributes as
perceived by female consumers by means of eight focus groups. Results indicated
that merchandise and clientele were perceived as the most important dimensions,
followed by service, physical facilities were the least important.
Leung and Oppewal (1999) had conducted research on the roles of store and brand
names in consumes' choice of a retail outlet and concluded that a high quality brand
or high-quality store is sufficient to attract the customer to a retail store. The study
also revealed that store names have a larger impact on store choice than the brand
names of the products that these stores have on offer.
Customer's choice of a particular store depends on shopping orientation as well as
satisfying experience. In addition, a customer's attitude towards the store may result
from his / her evaluation of the perceived importance of store attributes, molded and
remolded by direct experiences with the stores overall offerings (Ghosh, Tripathi &
Kumar, 2010). Fashion has always influenced creation of demand in this industry,
especially after the risk of retailer's control of the commodity chain. Compared to
men's wear, women's and children's wear is subject to more fashion based design
changes. Influenced by socio-economic and related cultural changes there has been
trends in clothing towards more informal and casual wears since 1970s (Leopold,
1993). Creation of market niches has been facilitated by consumption based patterns
in marketing one's position in the social hierarchy (Hill, 1998).
The important contributors to fashion and shopping perceptions are shopping
involvement, importance of clothing image, fashion commitment, fashion aversion
and quality consciousness (Summers, Belleau & Wozniak, 1992). Customer loyalty
in fashion retailing can be improved by understanding of customer perception of
store attributes (Birtwistle, Clarke & Freathy, 1998). Intriguing is the concept of
extended self which emphasizes that people need products to express who they are
implying differences in psychographics and demographics of people who go for
private and national brands (Salmon et al., 2004). Customers' need for uniqueness
441 !}

drives the commitment to fashion. The need for uniqueness can be measured by a
validated scale (Tian et al., 2001). Certain individuals have a need for separate
identity or a need for uniqueness (NFU) (Fromkin, 1970). These consumers express
NFU by possessing and displaying original, novel and unique consumer products for
the purpose of developing and enhancing their self-image and social image (Kroh,
1983; Tien et al. 2001). Younger generations have a strong desire to be unique and
express their individuality through personalized products like clothing and
accessories (Salmon et al., 2004). U
Literature shows that store name mitigates perceived risk of consumers of buying a
brand in non-apparel categories (Agarwal & Teas, 2001). Retailers own brands are
generally associated with higher perceived risk levels than corresponding national
brands. A store with a good image can add value to the product by revealing the
store as the manufacturer and endorser of the brand (Moore, 1995) and thereby
reducing the perceived risk of the consumer (Semeijn el al., 2004). By improving
store differentiation vis-a-vis other retailers, store brands make shopping easier for
consumers by increasing store loyalty (Legswear Trends and Fashion, 2003). Recent
empirical findings have found significant relationship between store brand usage and
store loyalty (Ailawadi et al., 2001; Corstjens & Lal, 2000). Customer loyalty in
fashion retailing can be increased by the understanding of customer perception of
store attributes (Birtwistle, Clarke & Freathy, 1999).
Consistent with previous research (Nijssen et.al., 2003) loyalty intentions are
defined as the customer's intention to perform a diverse set of behaviors, like
recommending the store time in the store, that signal a motivation to maintain value
is defined as the customer's perception of the benefits enjoyed versus costs incurred
in buying products at the store or what you get for what you pay (Bolton & Lemnon,
1999; Sirohi el al., 1998). Trust can be defined as one party's confidence in an
exchange partner's reliability and integrity (Morgan & Hunt, 1994).
A model of customer relationship with a store should incorporate not only the focal
construct of customer trust in the store but also the related constructs of customer's
trust in the sales people of the store and in store branded products while examining
the linkages between the three trusts constructs. Store assortment increases both
overall trust and trust in store branded products (Guenzi, Johnson & Castaldo,
2009).
45~ e

Research indicates that store image atmosphere increases store brand quality and
reduces social risk (Lijander, Polsa & Van Riel, 2009). Previous research on price-
perceived quality has been relatively narrow in scope. Estimates of the size of the
effect of price, brand name and store name on quality perceptions can be found but
there is a lack of consistent results across studies. Whether the strength of the
association increases for higher priced, less frequently purchased goods cannot be
stated beyond doubt (Rao & Monroe, 1989). Conventional retail marketing mix
deals with factors like variety (product selection) and availability (Bitner, 1992).
Shopper would like to be able to choose from an assortment of different products,
both in terms of different styles and different colour / sizes within one style.
Retailers who rely on a single brand formula can find themselves forced out of some
markets, as Eddie Bayer, Marks & Spencer and Wal Mart can attest.
To foster store patronage in grocery retailing services, retailers have typically
invested in price cuts, promotions and loyalty schemes. Store managers may rather
use sales associates, store environment, store assortment, store branded products and
communication to foster customer trust and increase customer loyalty. Managing
store brands with the goal to build trust as opposed to increase immediate profit
margins. may call for a completely different approach to private labels (Guenzi,
Johnson & Castaldo, 2009).
Unique apparel labels and private labels are added by retailers to negate store
patronage driven by loyalty towards manufacturer brands. This type of assortment,
with mix of private labels, has also been hypothesized to build retail store image
(Lindquist, 1979; Zimmer & Golden, 1988). The benefits of a broad assortment are
appreciated by most stores. The greater the breadth and depth of product assortment,
the greater the range of different situations in which the retailer is recalled and
considered by the consumer and therefore the stronger its salience. Further, for
today's time constrained consumer, the one-stop shopping convenience that a broad
product assortment enables in becoming increasingly important (Narasimlza &
Wilcox, 1998). In-store assortment and marketing mix activities are attracting
customers to purchase a category in a particular store which, otherwise, they would
have purchased in another store, considering the fact that consumers regularly shop
at more than one store.
461 1:,`,c

Variables such as variety seeking, perceived financial benefit, brand loyalty and
store loyalty towards point-of-sales promotions have specific influences on the
buying behavior and volume of retail sales. It is found that legal customers are
attracted to the store brands during the promotional offers (Rajagopal, 2008). In a
study conducted in Chennai, it was observed that a consumer with variety seeking
behavior will not be loyal to any brand of apparel and similarly consumer with
impulse buying tendency will not be loyal. Store patronage is influenced strongly by
private label loyalty (Sasinandini & Lysander, 2010).
Store image may be conceived at the retailer level or the store-category level. At the
retailer level image is determined by consumer benefits about retailer-specific
attributes. For example, consumers tend to view Wal-Mart as the world's largest
discount chain that sells various everyday goods at low prices, is open at convenient
times and maintains a good return policy. In contrast, consumers tend to view Sears
as an old and steady chain that sells dependable store brands at reasonable prices
(Lisant, 2002). At the store category level, image is more abstract because it is
determined by typical elements among stores at the same categorical level. For
example, consumers generally view department stores as more upscale and fashion
oriented than general merchandise stores, and they view discount stores as more
lower class and economy oriented than general merchandise stores. 1-sere, image is
conceived at the store-category level (Lee & Hyman, 2008).
There are two basic dimensions of the store variable, One is related to the extent to
which the store specializes in one or a few types of products (e.g. a departmental
store vis-a-vis a boutique) and the other is concerned with the overall store image.
These two dimensions are more often than not dependent on each other, as specialty
shops may have a better reputation among consumers who prefer distinctive
products and may think that specialty stores have more competence in a given
product category. It is expected that perception of product quality improves in direct
relation with store image (Szybillo & Jacoby, 1974). Store and national brands may
also have a complimentary role in retail. While store differentiation and loyalty may
be created by store brands, national brands enable retailer to increase prices and
store profitability (Corstjens & Lal, 2000). Segments that are attracted by store
brands or national brands cannot be differentiated based only on demographics as
choice of brands is funded through psychographics. Store brand usage is particularly
47j i ` a

associated with price consciousness, low quality consciousness and store loyalty.
Store brand users may transfer their store loyalty into more of frugality, even at the
expense of quality (Ailawadi, Neslin & Gedenk, 2001).
Consumers assign more value on store based retailing for purchasing experimental
products (i.e. clothing), where consumers would need to examine the product in
person before making purchases (Balasubramanian el al., 2005) A consumer's
choice of a product or store is driven by both hedonic and functional considerations
(Childer et.al., 2001; Dhar & Klaus, 2000; Hirshman and Holbrook 1982; Kempf,
1999; Okada 2005; Voss, Span genberg, and Grohmann, 2003). 1-ledonic
considerations relate to fantasies, feelings, fun and enjoyment (Holbrook and
Hirschman 1982; Mano & Oliver 1993); functional considerations relate to needs,
value, fundamentals, necessity, essentials and problem solving (Barbin, Darden, &
Griffin 1994; Mano & Oliver 1993).
Products may be classified as either hedonic or functional (Batra & Sinha 2000;
Sethuraman & Cole, 1999). Crystal and jewelery are hedonic products because they
are viewed as symbols; bleach and room air cleaners are functional products because
they are viewed as objective entities. Likewise, many expensive, luxurious and
emotive products such as sports cars, women apparel, perfumes, games and
entertainment services are hedonic products, but most inexpensive and fundamental
necessities — such as facial tissues, pencils, towels and distilled water — are
functional products.
Similarly, retail stores may be classified as either hedonic or functional. Hedonic
stores generally differ from functional stores in terms of their atmosphere, floor
layout and shoppers' motivations. Specifically, hedonic stores have a high quality
and stakes orientation, higher prices, extensive services, a relaxed and affable
atmosphere, many active and affable sales people, a free-form store layout, an
exciting and multisensory design, a fantasy-related and emotional environment, an
affluent and extravagant image and a capacity for wandering around pleasure
(Baker, Levy and Grewel 1992; Roy 1994; Vrechopoulos et al. 2004; Wakefield &
Baker 1998; Wakefield & Barnes 1996). Manufacturer's showcase stores (Nike in
Chicago), high-fashion stores (Louis Vuitton or Gucci), designer shops (Anna Sui in
New York), high-quality jewelery stores (Tiffany & Co.), women's apparel specialty
stores (Anne Fontaine in New York) and high-end department stores (Neiman
48'd

Marcus or Dillard's) exemplify hedonic stores. The hedonic / functional nature of
products and stores meaningfully influences consumers' choices and their
justifications for those choices. Because Private label brands are always store
specific and often product-category specific, consumers' choice of private label
brands may be better understood by studying the hedonic / functional nature of
products and services (Lee & Hyman, 2008). When hedonic / functional beliefs
about a store and its private label brand are (in) congruent, the private label brand is
evaluated (less) more favorably. Thus more hedonic stores, such as department
stores, should be more successful with hedonic private label brands and more
functional stores, such as discount stores should be more successful with functional
private label brands (Lee & Hyman, 2008).
The role of customer satisfaction in predicting loyalty intention towards the retailer
or product is well noted in the literature. Consumers who are satisfied with the
retailer make product purchases more frequently and repeatedly from the same
retailer. When consumers are loyal to the retailer, they revisit the retailer, repurchase
products / service from the retailer and recommend the product / retailers to their
friends and / or family (Zeithaml et al., 1996; Bolton el crl., 2000). This suggests that
the apparel retailing industry needs to ensure all three aspects of their product /
service offerings to the customers in order to have their customers satisfied Lee &
Kim, 2008). Variables such as quality, number of categories, innovativeness, price
gap, promotion has strong association with store loyalty, while the store name as
private label name has no association with store loyalty (Chavadi & Kokatnur,
2008). Customer satisfaction with a purchase items from these factors, such as
consumer service quality and value attributes of a retailer (Lee & Kim, 2008).
Affinity customers try to shop at stores that suit people like themselves or member
of groups they aspire to join (Child, Heywood & Klizer, 2002). Affinity — the social
association of stores — is a more important consideration for all groups that
marketers have traditionally recognized.
There is a positive relationship between store image and attitudes towards store
brand products and store image is the strongest predictor of private label attitude.
Good store image can enhance the attractiveness of each store brand. however,
attitude towards national brands are less influenced by store image. Manufacturers
should alternatively try to increase the good image of promoted brands (Liu &
4911'a-,c

Wang, 2008). As retail chains attempt to go global, they will have to pay greater
attention to such market nuances in presenting one face to the world, otherwise a
retailer risks presenting the wrong face to entire nations.
50I Pa;gC

CHAPTER 3: RESEARCH METHODOLOGY 3.1 Introduction 3.2 Need for Study
3.2.1 Competition by Private Labels 3.2.2 The Environmental Aspect 3.2.3 The Problem
3.3 Research Objectives 3.3.1 Specific Objectives
3.4 Hypotheses 3.5 Research Process 3.6 Research Design 3.7 Survey Research Methodology
3.7.1 Methodology Strategy 3.8 Instrument Development
3.8.1 Questionnaire Design 3.8.2 Pilot Survey
3.9 Scale Refinement and Validation 3.10 Reliability and Validity of the Instrument 3.11 Sampling Procedure 3.12 Data Analysis 3.13 Limitations
CHAPTER 3: RESEARCH METHDOLOGY
CHAPTER OVERVIEW
This chapter starts with need for study and identification of problem related with
choice by the customers in purchasing an apparel brand of private label. It gives
details of the methodology of research which begins by stating the objectives of the
study and hypotheses considered for the study. The research methodology followed
is highlighted in detail including research design, instrument development, sampling
procedure adopted, pilot study undertaken with method of analysis and limitations of
the study.
3.1 INTRODUCTION
Research methodology refers to the research process, the procedural framework
within which the research is conducted. This methodology, as defined by Leedey
and cited by Rernenyi et al. (1998) is "an operational framework within which the
facts are placed so that their meaning may be seen more clearly".
Some methods provide data, which are quantitative and some that are qualitative.
This study is mainly based on quantitative research methods. Quantitative methods
are those, which focus on numbers and frequencies rather than on meaning and
experience. Quantitative methods (e.g. experiments, questionnaires and
psychometric tests) provide information, which is easy to analyze statistically and
fairly reliable. Quantitative methods are associated with the scientific and
experimental approach and are criticized for not providing an in depth description.
Qualitative methods are ways of collecting data, which are concerned with
describing meaning, rather than with drawing statistical inferences. What qualitative
methods (e.g. case studies and interviews) lose on reliability, they gain in terms of'
validity. They provide a more in depth and rich description.
511.'

3.2. NEED FOR STUDY
3.2.1 COMPETITION BY PRIVATE LABELS
Growing competition is being faced by major national brands because of the rise of
private labels in apparel sector. In recent years, many major retailers have
understood the importance of private labels and are increasing their percentage in
the stores (India Retail Report. 2009).
Table 3.1: A Look at Private Labels in India
Retailer % share of private label Shoppers Stop 20% Trent 90% Pantaloon 75% Ebony 10% Indiabulls/P ram d 30% Nilgiri's 38% Reliance (Large Format Stores) 80% Spencer 10%
Source: Prepared by the researcher
The strategy being followed by Indian private brands and the counter strategy being
followed by the national brands is going to shape the future landscape of organized
apparel retail in India. It is therefore, a requirement to understand the consumers'
buying behaviour in this regard which makes him buy a national or a private label. A
lot of studies have taken place in the domain of consumer choice in the foreign
countries but such behaviour has not been studied in India in great detail. Consumer
responses to private labels have been understood from studies based on groceries
and commodities bought from the local supermarket in U.S. and Europe
(Anselmsson et cal. 2008; Juhl et al. 2006; Labeaga et cd. 2007; Mendez et cii. 2008).
Customers' intention to purchase private label apparels have been understood from
the determinants of perceived risk of buying a private label like perceived product
quality and value associated with the private label and store image (Lilijander, Polsa
& Van Riel, 2009). Also, our causal research design and control of variables,
differentiates our study from previous studies.
Whilst definitions are widespread, we require adopting a definition of private labels
which will be used throughout the present study. Brands owned, controlled and sold
exclusively by a retailer are known as store brands or private label brands (Baltas,
52 !'

1997). Private labels have been referred as private brands, store brands, own brands
of retailers, wholesome brands and distributor's own brands (Hakansson, 2000;
Moore, 1995; Ailawadi et.al. 2001). In recent times, store brands have almost given
way in favor of retailer named brands (Henricks, 1998; Ryan, 2003, 2004). In
categories like ready-to-wear clothing, a store named brand may not always be
appropriate to brand ego expressive products (I-lirschman & I-Iolbrook, 1982). For
apparels large retailers have brands like Stop, FirstClass, KnightHood, wherein the
named private label brand and its brand extensions is available only with the
concerned retailer and to that extent there is exclusivity of the brand and the retailer.
There are some exceptions to this, like 'Westside', in which case the store name is
itself the brand name like that of a store brand. For the purpose of this study of
apparels, retailers named brand and store brand are both considered as private label.
Studies are practically non-existent in India in the context of understanding of
consumer attitudes for private label in apparels lifestyle retail stores, A
comprehension of this will help large format retailers and also Fine tune marketing
strategies for private labels, national and international brands. With increased focus
on the Indian market the growing macro-economic indicators, liberalization and
changing socio-demographic factors indicate need for potential assessment for
further exploration in private label apparel share in organized retailing.
d Not much of the studies on why Indian consumers choose private labels or
national brands have been conducted. The literature is ripe with many studies
conducted in foreign countries but not much published academic research has
taken place in this area. Few Indian studies which have focused on this area have
also not used causal research methodology and/or attempted to control for
variables. Our use of factorial design is also an improvisation in the context of
internal validity of the research.
The phenomenon of private labels has been growing in India but availability of
reliable statistics is a problem. Even the reports compiled by various commercial
bodies provide percentage of private labels with various retailers bul do not
reveal much about comparative share in terms of value. Our attempt is to find the
relevant secondary data also and provide a clear picture of what is happening in
the apparel retail in India.
53 1

> There is a need to understand the current percentage of private labels as well as
track their growth trends. It would be interesting to compare the private label
growth or percentage pre and post recession period in India.
There is also a need to understand the impact of retailing mix (the factors like
retailer's image, location, ambience etc.) on the buying as compared to the
internal factors of the consumer. Internal factors may be his/her purpose of
buying, his/her sensitiveness to price, shopping expertise etc.
3.2.2 THE ENVIRONMENTAL ASPECT
The private labels share is on the rise in most categories of apparels. The consumer
has also become sensitive to price changes and discounts. Even national brands like
Raymonds have to give discounts a couple of times in a year to boost sales. The
national brands are trying to compete in this intensely competitive product category
with the private labels. Most big organized retailers have introduced their own
brands in their retail stores and it is in their interest to promote these brands at the
expense of national brands. Increased awareness of fashion trends and brand values,
driven by style and fashion more than price or quality, is emerging and is combined
with rising disposable incomes. Consumers' expenditure on apparel has also
increased. In this environment, a lot of contemporary research is taking place with a
focus on the competition between store brands and national brands in various
product categories. However, most of these researches have adopted descriptive
research design where the cause and effect relationship cannot be very well
established. Also, scenario analysis is also not possible in such a situation because
descriptive studies give limited answer to `what if analysis. So an attempt has been
made to fill this gap be using an experimental/causal research design which is a five
factorial one. This research design, although has more validity in comparison to the
other designs, has the drawback of execution for a researcher with limited resources.
For example, suppose price is taken as one important variable and we want to see
the change of price affecting the customer's purchase decision. This theoretically
requires changing price of the product the customer is interested in and noting the
behaviour of the customer because of price change. In real set ups, this requires very
high collaboration with the retailers to be able to change various factors and see the
response of the same subjects to various changes in the factors. Hence, an

established approach for substituting real change was adapted by using vignettes.
These are written statements describing a situation to the respondent and his/her
reaction is measured. The behaviour was also substituted by measuring the _purchase
intention. ``T
- 4oz2 3.2.3 THE PROBLEM
. ' ir !̀17)Jt I ;., i`; There exits intense competition between private labels and nationa[4r-asaz,d
important for both players to know the extent and rate of growth of private label
players because marketing strategies of the entire retailing industry will hinge on
this aspect. We are trying to gauge the growth of organized private labels and its
future potential in India. This in turn depends on the Indian customers. The
customers' behaviour is often a manifestation of their attitudes towards objects and
therefore a natural offshoot of the problem is to understand the attitude of consumers
towards private labels.
3.3 RESEARCH OBJECTIVES
This study aims to explore the attitudes of Indian consumers and assess the potential
thereof, towards 'private label apparel retail. The rationale behind this is that the
attitude towards private label will manifest itself in the buying preference and
behaviour. This will in turn decide the future potential of private labels in India.
The study attempts to empirically explore the following broad objective:
Consumers' attitude towards private label apparel brands in India.
3.3.1 SPECIFIC OBJECTIVES
The study attempts to empirically explore the following specific objectives:
Caiegory I: To develop a reliable and valid instrument for measuring the
consumer's attitude towards private label as compared to national brands in
apparel category in India.
The variables will be identified from extensive literature review. An appropriate
scale will be used to measure the consumer's attitude. The extraneous variables will
55111 a1!, .

also be measured and their reliability and validity checked before using them in the
final analysis.
Category II: To measure the importance of factors those contribute to the attitude
towards private label brands.
The attitude towards private label brands is dependent on many variables. A valid
and reliable instrument to measure the attitude and all independent as well as
extraneous variables will be developed and tested for reliability and validity in the
previous stage. Now, all the variables don't affect the attitude towards private labels
equally. Also, some variables may not significantly affect attitude at all. The
variables may also interact will each other and create a interactive effect on the
attitude towards the private label. In this, we will try to find out the significant
variables that affect the attitude and also the interaction effects, if any.
Category III: To explore the differences in attitudes of different sub classes of
respondents.
We will explore if the differences exist between the overall population and its
various subclasses like the customers who know the difference between the national
brand and the private label. Over the years, some private labels have become very
close to national brands in quality, styling, shelf space etc., so it is important to find
whether the sub groups from the population differ in their attitude towards private
labels. Income is an important factor deciding the affordability for the consumer. We
wish to explore as to whether income as a factor affects the attitude towards private
labels and hence subclass based on income has been explored for differences in
attitudes.
Category IV: To explore the growth of private labels vis-a-vis national brands in
organized apparel retailing in India.
The study attempts to explore the growth of private labels over the last few years
and also the growth of national brands. Further, we will try to assess whether the
growth of private labels is reducing the market share of national brands or the
growth of private labels is increasing due to the overall growth of the apparel
industry in India.
56 c

3.4 HYPOTHESES
The objective of finding the relevant factors which can affect the evaluation of the
shirt brand was primarily achieved through existing literature. After the literature
identified the variables, some of these were modified in consultation with subject
experts keeping in mind the Indian customers and socio-cultural milieu.
Once the scale was developed, it required to be tested for reliability and validity.
This was the basis of first hypothesis because without the reliability of the
measurement instrument, we cannot say anything with regarding the relationship
between the constructs measured by the instrument. Once the instrument was found
to be satisfactory, the next stage was to test whether the dependent construct was
affected by the independent factors or not. Since, factors were the main area of
concern, in the next stage appropriate hypotheses were framed to test the effect of
factors on the dependent construct (evaluation), It is important to note that one of the
independent factors manipulated was the brand of the shirt. Hence, this hypothesis
testing could provide answer of the effect of brand on the evaluation of the brand.
Since, interactions can also take place and the effect of one factor can increase or
decrease in the presence of another factor therefore we needed to test the interaction
effects also.
The third objective was to segment the entire population on the basis of
demographic variables and see if the evaluation of shirt brands differs because of
gender, knowledge, income, education etc. The third set of objectives therefore were
included to give a micro analysis into the segments so that differences found, if any,
can help the marketer in strategy formulation.
Since, most studies require both a qualitative and quantitative approach, it was
decided to include a secondary analysis based on contemporary reports and media
clippings. This was to corroborate the findings of the earlier categories of
hypothesis. It was opined that if this qualitative approach was in line with the
findings of the quantitative research, the recommendations will carry more weight.
HI: The five factors viz. brand name, price, store image, usage and merchandise mix
have no effect on the attitude towards private label.
H2: The covariates viz, familiarity with national label shirt brands, familiarity with
private label shirt brands, familiarity of stores, fashion consciousness, shopping as
57~~':,~~

an activity and brand consciousness have no effect on the attitude towards private
label.
1-I3: There is no interaction effect of all the possible combinations of five factors viz.
brand name, price, store image, usage and merchandise mix on the attitude towards
private label.
H4: The five factors viz, brand name, price, store image, usage and merchandise mix
have no independent effect on the attitude towards private labels in the subset of
respondents who are knowledgeable about the difference between private labels and
national brands.
I-I5: Attitude towards private labels is not affected by the demographics of the
consumer.
I-I6: There is no significant difference between the growth of private labels as
compared to the growth of national brands.
I-17: Market share of private labels is independent of market share of national brands
in multi brand organized retail outlets.
3.5 RESEARCH PROCESS
There are three basic types of research designs. They include exploratory.
descriptive, and causal designs used to collect primary data and create data
structures and information (Hair, Bush, & Ortinau. 2006). The research
methodology and methods for this research were chosen in order to successfully
achieve the research objectives.
This research was conducted as follows:
1) Obtaining information through literature survey so that we could identify hoNv
growth of private label organized retailing has been tackled by other
researchers in different situations.
2) Developing a model incorporating the relevant variables contributing to the
consumer attitude to purchase private label apparels. It included reviewing of
prominent theories and adoption of private labels in different product
categories and geographies.
58 I ' :, ,_ ,:

3) Generating various hypotheses to examine whether the models formulated
were valid or not.
4) Developing a questionnaire as a survey tool to collect data.
5) Analyzing data obtained through the questionnaire to see what factors
influence behavioural intention.
6) Interpreting the meaning of the results of the data analyzed and arriving at
conclusions
59 'agC

Exhibit 3.1: Schematic Diagram for Research Process
Literature Survey
Developing Models
Generating Hypotheses
Developing Research Instrument
Collecting Data
Analyzing Data
Interpreting the Results
3.6 RESEARCH DESIGN
Research design can be thought of as the structure of research — it is the "glue" that
holds all of the elements in a research project together. A marketing research
process cannot be completed without an effective research design. A research
design precisely specifies particular means and methods through which required
information can be collected for structuring the research as well as seeking specific
practical solutions to the problem (Kapoor & Kulshrestha, 2010). The following
are the design considerations for this research in accordance with the guidelines
suggested by Sethuraman (2003).
60 C
1. The Purpose of the Study: The development of a research purpose that
links the research to the decision making, and the formulation of
research objectives that serve to guide the research, are unquestionably
the most important steps in the research process. If they are correct, the
research stands a good chance of being both useful and appropriate
(Aaker, Kumar & Day, 2006). The purpose of the research was to find
the significant factors that effected the evaluation of a shirt brand. This
was achieved through hypothesis testing. A hypothesis is an expectation
about the population parameter based on prior knowledge, assumptions,
or intuition. A hypothesis test is a statistical procedure used to accept or
reject the hypothesis based on sample information. With all hypothesis
tests, one should keep in mind that the sample is the only source of
current information about the population (Burns & Bush, 2007).
Hypothesis testing was used in this case because usually studies relating
to hypothesis testing explain the nature of certain relationships; establish
the differences among groups or the independence of two or more
factors in a situation. In other words, hypothesis testing is undertaken to
explain the variance in the dependent variable. Hypothesis testing offers
an enhanced understanding of the relationships that exist among
variables, and could also establish cause and effect relationships.
2. The Type of Study: All research can be classified into the three
categories — exploratory, descriptive and causal. This approach is often
used when the research problem has not been clearly defined, or its real
scope is as yet unclear (Easwaran & Singh, 2006). The descriptive
research study is typically concerned with determining the frequency
with which something occurs or the relationship between two variables.
The descriptive study is typically guided by an initial hypothesis
(Churchill & Iacobucci, 2005). A causal design investigates the cause
and effect relationship between two or more variables. Although, this
design is widely used in marketing studies but it may not give very
conclusive results if we fail to control extraneous variables (Berl, 2008).
The research design followed in the present study is causal one as we are
trying to see the effect of causes like store image, merchandise mix of
611 Ggc

private label, price etc. on the attitude of consumers towards private
label apparel brands. These cause and effect relationship can be
influenced by the presence of extraneous variables which needed to be
controlled. The extraneous variables were constructs like familiarity
with national shirt brands, familiarity with private label shirt brands,
familiarity with stores, fashion consciousness, shopping as an activity
and brand consciousness. There were some demographic variables also
like gender, age and income. The casual research design was
implemented using vignette method. A vignette describes a buying
situation (d' Astous, Alain & Saint-Louis, Odile, 2005). Since there
were 5 factors, each having 2 levels, 2 = 32 vignettes were created each
representing a different buying situation.
3. The Study Setting: As this research is a correlational study it was
conducted in non-contrived settings, whereas rigorous causal studies are
done in contrived lab settings. A contrived observation is an observation
in which the investigator creates an artificial environment in order to test
a hypothesis (Zigmund & Babin, 2007).
4. Time Horizon of the Study: There are two types of research designs
based on time. One is cross sectional and the other is longitudinal. Cross
sectional designs involve measuring the product of interest for several
groups at the same time, the groups having been exposed to differing
levels of treatments of the producer whose effect is being studied
(Green, Tull & Albaum, 1988). The present research study is cross-
sectional in nature as it aimed to collect data just once in order to answer
the research objectives.
5. Data Collection and Unit of Analysis: It refers to the process of
collecting data associated with variables in the hypotheses being
considered for the study. In the present study, a structured closed-ended
questionnaire designed specifically for the study was personally
administered by the researcher in the shopping malls of National Capital
Region (NCR) comprising of New Delhi, and surrounding cities like
Noida, Greater Noida, Gurgan, Faridabad, and Ghaziabad. Since some
62 1 ;'a ._

of the variables to control were metric and some non metric, the
technique used for analysis was ANalysis of COVAriance (ANCOVA).
6. Data Analysis: The step where data is analysed statistically to see if the
hypotheses can be substantiated (For details please see Chapter 4).
3.7 SURVEY RESEARCH METHODOLOGY
Methodology is the strategy, plan of action, process, or design lying behind the
choice and use of particular methods and linking the choice and use of methods to
the desired outcomes (Crotty, 1998). Hussey and Hussey (1997) also define
methodology as the overall approach to the research process, from the theoretical
underpinning to the collection and analysis of data, and also suggest that
methodology is concerned with the following main issues: why you collected certain
data, what data you collected, from where you collected it, when you collected it,
how you collected it, and how you will analyse it.
3.7.1 METHODOLOGY STRATEGY
Among several methodologies viz, experimental research, survey research,
ethnography, etc., the survey research methodology was considered to be the most
appropriate for this research. It is concerned with drawing a sample of subjects from
a population and studying this in order to make inferences about the population. In
the case of a large population, only a sample of the whole population is used
(Hussey & Hussey, 1997). This was the case for this study. In particular, this study
was classified as an analytical survey where the main intention was to determine
whether there exists any relationship between different variables. Because
methodology is the process or design lying behind the choice and use of particular
methods and linking to the desired outcomes (Crotty, 1998), it was therefore
necessary to identify which methods should be used in the research. Methods are the
various means or techniques or procedures used to gather and analyse data related to
some research question or hypothesis (Crotty, 1998; Hussey & Hussey, 1997).
Methods used in this research were categorised into two groups (1) questionnaire
method which is the most important method used to collect primary data in the
survey, and (2) many statistical methods were used to analyse data such as
63 a

descriptive statistics, T-tests, ANCOVA and Binomial testing (For details please
see Chapter 4).
Administering questionnaire is one of the main data collection methods in survey
research (Gay & Diehl, 1992; Sethuraman 2003; Veal, 2005). On the other hand,
even though the primary data source for this research was questionnaire, it is often
necessary to make use of other existing information viz, secondary data such as
government statistics and previous research (Ticehurst & Veal, 2000), obtained
through the literature survey (Please see Chapter 2). Secondary data are data that
already exist and do not have to be collected by the researcher (Sethuraman, 2003).
3.8 INSTRUMENT DEVELOPMENT
A questionnaire is a pre-formulated written set of questions to which respondents
record their answers, usually within rather closely defined alternatives (Sethuraman,
2003). The rationales behind the use of questionnaire method as a major survey tool
in this research are:
1) It was used because it is an efficient data collection mechanism when the
researcher knows exactly what is required and how to measure the variables of
interest. Field studies, comparative surveys and experimental designs often use
questionnaires to measure the variables of interest (Sethuraman, 2003).
2) It was used because quantified information is required concerning a specific
population and students' behaviour and attitudes are acceptable as a source of
information (Ticehurst & Veal, 2000)
Sethuraman (2003) suggests that the advantage of the questionnaire method is that
administering questionnaires to large numbers of individuals simultaneously is less
expensive and less time consuming than other methods. It also does not require as
much skill to administer a questionnaire. In the present study, questionnaires were
personally administered, because it is one of the best ways to collect data when the
survey is confined to a local area (Sethuraman, 2003) as was the case here.
The research instrument (Appendix 1) consisted of structured questionnaire and the
respondents were required to indicate their responses with the help of the
64 I i : u

interviewer. The survey instrument, questionnaire contained items under various
constructs like familiarity with national shirt brands, familiarity with private label
shirt brands, familiarity with stores, fashion consciousness, shopping as an activity
and Brand consciousness. The dependant variable which measured the attitude
towards the shirt brand was also a construct. As such, each construct had a number
of metric variables measured on a 5-point interval scale. The instrument employed
for the study also consisted of questions on demographics however the most
important part of the research instrument was the development of vignettes in the
context of all possible combinations of the five factors. The research instrument was
developed in three stages:
Stage 1: Identification of measures/constructs and development of draRquestionr7aire
Stage 2: Pilot testing
Stage 3: Modification of questionnaire
3.8.1 QUESTIONNAIRE DESIGN
Survey questionnaires were used to investigate whether the attitude towards private
label was different from the attitudes towards national brands so this study was
based on questionnaire investigation. A questionnaire is essentially a data capture
instrument. It lists all the questions to which the researcher wants the respondents to
answer, and it records the response of the interviewee. We recognize two main
purposes of questionnaires:
To draw accurate information from the respondent.
The questionnaire is to provide a standard format on which facts, comments
and attitudes can be recorded.
The research instrument consisted of structured questionnaire and the respondents
were required to indicate their responses in the presence of interviewer.
Questionnaire survey has been widely acknowledged as an efficient tool for
assessing the perceptions of individuals / organizations on a particular subject. Pilot
testing of the measurement instrument was necessary to validate the items and the
whole scale. This is because some of the measurement items were developed or
modified for the purpose of this research (Vellis, 1991).
651 ?'a.

The pilot testing was conducted in a series of steps. Before the survey instrument
was finalized , a preliminary questionnaire was developed and tested to validate the
scale items to be used in the study. Pilot testing of the measurement instrument was
necessary to validate the items and the whole scale. This is because some of the
measurement items were developed or modified for the purposes of this research.
The development of the measurement scales for this research followed the
procedures recommended by (Churchill, 1979) and (Vellis, 1991) for developing a
standardized survey instrument. The initial task in developing the scale was to
devise the item pool from previous studies. Then, the preliminary survey
questionnaire was distributed to some consumers. Feedback from the first pilot
regarding the content, layout, wording and ease of understanding the measurement
items were incorporated and a second pilot was conducted. They were also asked to
offer suggestions for improving the proposed scale and to edit the items to enhance
clarity, readability, and content adequacy. The questionnaire was then revised and
again the procedure was repeated for a third pilot. The questionnaire was thus
appropriately modified to suit the context of shopping behavior in India.
Questionnaires are a useful research tool when a large samples or even a population
need to be surveyed. This is because each person was asked to respond to a similar
set of questions, this provides an efficient way of collecting responses from a large
sample. Other advantages of questionnaires are that they require less skill and
sensitivity to administer than interviews and they reduce the possibility of
interviewer bias.
Open ended questions are those that ask for unprompted opinions. In other words,
there is no predetermined set of responses, and the participant is free to answer
however, he chooses. Open ended questions are good for soliciting subjective data
or when the range of responses is not tightly defined. An obvious advantage is that
the variety of responses should be wider and more truly reflect the opinions of the
respondents. This increases the likelihood of receiving unexpected and insightful
suggestions, for it is impossible to predict the full range of opinion. It is common for
a questionnaire to end with and open format question asking the respondent for ideas
for changes or improvements. This type of questionnaire provides qualitative data.
Closed questions, are also known as fixed response. This type of questions force the
respondent to choose one or more responses from a number of possible replies
661 1 IC

provided in the question. These types of questions provide quantitative data. There
are two broad groups of closed questions they are dichotomous and multiple choice,
Dichotomous questions allow only two possible answers, for example, yes/no,
true/false etc. This is the simplest of all closed questions. Multiple-choice questions
present a list of possible responses from which the respondent may choose.
Multiple-choice questions must be designed carefully to incorporate all possible
answers. By offering an "other, please specify" category, that can be collected, that
was not originally conceived, or responses that do not fit neatly into the imposed
structure.
Close ended questions were used in this investigation as they offer many advantages
in both time and money. By restricting the answer set, it is easy to calculate
percentages and other hard statistical data over the whole group or over any
subgroup of participants. Closed format questions also make it easier to track
opinion over time by administering the same questionnaire to different but similar
participant groups at regular intervals. Finally closed format questions allow the
researcher to filter out useless or extreme answers that might occur in an open ended
question.
The complete instrument consisted of seven constructs viz, familiarity with national
shirt brands (NATFAM), familiarity with private label shirt brands (PVTFAM),
familiarity of stores (STORFAM), fashion quotient (FASI-IIONQ), shopping as an
activity (SHOPPING) and brand consciousness (BRANDCON). The dependant
variable, evaluation of the shirt brand was also a construct which was named
EVALUATN. Each item employed a five point semantic differential scale, anchored
by strongly disagree/strongly agrees at one end to not important/very important at
the other. Additional data on demographics was also generated in line with the
objectives of the study.
3.8.2 PILOT SURVEY
A pilot survey is a small-scale version of the larger survey; it relates particularly to
questionnaire survey but can relate to any type of research procedure. It is always
advisable to carry out one or more pilot surveys before starting the. main data
collection exercise (Malhotra, 2005; Sethuraman, 2003). It should draw subjects
671. a c

from the target population and simulate the procedures and protocols that have
been designed for data collection. It helps detect weaknesses in design and
instrumentation. In fact, pilot survey can be used to test out all aspects of the
survey and not just question wording (Ticehurst & Veal, 2000).
The size of the pilot group may range from 25 to 100 subjects (Cooper &
Schindler 1998). In the present study, the pilot survey was initially conducted on
63 respondents, thereon 39 respondents and thereafter on 19 respondents.
The questionnaire was administered in three waves:
First Wave: Preliminary questionnaire was mall administered to the consumers to
ascertain the reliability and validity of the instrument. Opinion was also
elicited from subject experts. The total number of responses obtained were
63.
Second Wave: After the first administration, some problem areas were identified
in the questionnaire. The experts also suggested some changes which were
incorporated. Another round of data was collected through the modified
questionnaire. The collected data was again subjected tests of reliability and
validity. This stage resulted in 39 responses.
Third Wave: The modified instrument possessed satisfactory reliability and
validity for most of the constructs. However, for two constructs the scores
were comparatively lower. Thus, appropriate modifications were made and
questionnaire administered on specific gender resulting in 19 responses. As
the results were now found to be satisfactory, research instrument was
finalized and the final data collection procedure initiated.
From the results of reliability tests, validity tests and some basic data analysis, a
minor change related to format was made to the questionnaire design to further
improve understanding.
3.9 SCALE REFINEMENT AND VALIDATION
There is a necessity to develop valid and reliable measures as this would enable
proper framework for establishing dimensions under study. Unless reliability and
validity are established, it is hard to standardize the measurement scales, without
681:'. ;

which it is difficult to know whether the scales actually measure what they are,
supposed to measure.
The validity of a scale takes three forms, content, criterion and construct validity.
The face validity is simply if the appearance of the scale seems to measure what it
intends to measure (McDaniel & Gates, 2011). Face validity is the weakest form of
validity and in this research most variable terms were standard and seem to measure
what they are intended for. The content validity was also established. Exhaustive
literature review resulted into a set of variables supposed to affect the dependent
variable. Based on these, the independent and dependent variables were chosen to
ensure content validity. Construct validity was established by using constructs from
already established valid and reliable scales. However, it was provided to the experts
on the basis of which minor adjustments were done keeping in mind the Indian
scenario. The preliminary questionnaire was then circulated to both experts and
consumers and data was collected through a field survey, The collected data was
subjected to the reliability analysis (Cronbach Alpha) and constructs which did not
show good reliability were informed to the experts. Based on the experts' opinion,
the items in the unreliable constructs were modified and again a sample data was
collected. This procedure was repeated till a satisfactory reliable and valid
questionnaire was developed. In all it required, three iterations.
3.10 RELIABILITY AND VALIDITY OF THE INSTRUMENT
Reliability refers to the consistency of measurement results and the extent to which
they are accurate, error free, and stable. Reliable measurement results are
reproducible and generalizable to other measurement occasions. Reliability evidence
most often is reported as a correlation coefficient. In classical test theory reliability
is defined mathematically as the ratio of the variation of the true score and the
variation of the observed score. Unfortunately, there is no way to directly observe or
calculate the true score, so a variety of methods is used to estimate the reliability of a
test (Goodwin, 1997).
Researchers make inferences from measurement results about how much of the
variable being measured is present. Validity refers to the extent to which these
inferences are sound. A researcher's interpretation of a score is valid if it yields
69 a c

accurate conclusions about the variable. Validity, therefore, is not a characteristic of
the research instrument itself, the term refers to the ways a researcher interprets and
uses measurement results. Researchers make inferences from measurement results
about how much of the variable being measured is present. Validity refers to the
extent to which these inferences are sound. A researcher's interpretation of a score is
valid if it yields accurate conclusions about the variable. Validity, therefore, is not a
characteristic of the research instrument itself, the term refers to the ways a
researcher interprets and uses measurement results.
In order to assess reliability, the Cronbach alpha was determined for each construct
(factor) identified through literature review and experts opinion. If the Cronbach
alpha is greater than 0.7, the construct is deemed reliable (Cronbach, 1951; Nunally,
1978).
Table 3.2: Reliability Statistics of Constructs Factor No. of
items Cronbach's
Alpha Familiarity with national shirt brands (NATFAM) 3 .7004 Familiarity with private label shirt brands (PVTFAM
3 .8214
Awareness about stores (STOREAWRNT) 3 .6832 Fashion Quotient (FASHIONQ) 3 .9885 Shopping as an activity (SHOPPING) 3 .9538_ Brand consciousness (BRANDCON) 3 .7890 Evaluation of the shirt brand (EVALUATN) (dependant variable)
5 .7534
Measures of variables should have validity and reliability (Cronbach, 1951; Nunally,
1978) in order to draw valid inferences from the research. Reliability deals with how
consistently similar measures produce similar results (Rosenthal & Rosnow, 1984),
and it has the two dimensions of repeatability and internal consistency (Zigmund,
1995). Internal consistency refers to the ability of a scale item to correlate with other
items in the scale that are intended to measure the same construct. Items measuring
i(
the same construct are expected to be positively correlated with each other. A
common measure of the internal consistency of a measurement instrument is
Cronbach's alpha. In this research, the content validity of the measurement
instrument was assessed by asking experts to examine it and provide their feedback
for revision.
70~''. ..

3.11 SAMPLING PROCEDURE
The sample for the study comprised 960 respondents. For deciding on the
sampling procedure, location of the data sources is an important option to be
considered. Traditionally, there have been three common types of locations:
1. Where the subject lives (at home)
2. Where the subject works or
3. On the street or at traffic locations.
For consumer studies, their congregating in shopping malls has been a boon to
researchers. "Mall intercepts" in which people are importuned in shopping malls to
participate in a study (typically in a mall facility that a research agency maintains)
have rapidly increased in usage (Luck & Rubin, 2010). Because of these advantages,
mall intercept was used but the facility was not maintained by the research agency
and people were interviewed inside actual malls as they were coming out of stores.
In researcher controlled sampling, sometimes also referred to as judgment sampling
or purposive sampling, sample respondents are selected because the researcher
believes they meet the requirements of the study. If the judgment of the researcher is
correct, the sample generated will be better than one generated by convenience
sampling. However, as with all non probability sampling procedures, one cannot
measure the representativeness of the sample. At best, the data collected from
researcher controlled or judgment sampling should be interpreted cautiously (Hair,
Bush & Ortinau, 2006).
In order to control for variability arising out of days of the week, effect and time of
the day, the responses were collected on different days and at different hours of the
day. The interviewers (or enumerators) were trained and the researcher randomly
checked the data for the interviewer errors. For example, the interviewers were told
to collect responses from only those respondents who seemed shoppers and not just
window shoppers. They were told to be station themelves at the exit gates and
interview only those respondents who had bought something from the apparel store
indicated by the shopping bags. They were told to ask for the interview with every
such qualified prospect after a fixed interval of 9 persons whereby every 10`'
shopper is interviewed. The respondents were required to be given only one vignette
randomly and all other questions were asked from each respondent from 960
71 'a~

respondents. For this, 32 different questionnaires were constructed each having a
single vignette. Thus, the quota given to each enumerator each day was 32
questionnaires having one vignette each so that the balanced design could be
achieved. There were some screening questions asked in the beginning to ascertain
the suitability of the respondent.
As discussed, research data was collected with the help of structured questionnaire
developed for the study. The area of interest was to know the affect of factors like
brand name, price, store image, purpose for which the apparel has been bought and
strategy of the retailer to have more private label or more national brands in the store
based on the attitude towards the shirt brand. This required manipulation of these
factors. It was very difficult to achieve this in a real environment because this
required simulating a mall/shop or better actually having a control over a mall/shop.
Thus, as explained vignettes were used instead of actual chang in the variables.
A multi-factorial design involving five factors was used for analysis because:
> Multi-factorial designs are better tests of theories because it can assess the
effects of two or more factors of shared features and number of distracters
simultaneously (Abdi el al., 2009).
Multi-factorial designs have, potentially, a greater ecological validity. Few
factors that affect human behavior operate in isolation, and most operate in
different ways depending on the real-world context the experiment is
modeling.
Multi-factorial designs can explicitly take into account the effect of an
interfering independent variable. Therefore, they constitute a way of
controlling parasite independent variables.
A factorial design was employed through use of vignettes and manipulation of the
five factors was achieved. Each factor had two levels viz, the brand name (national
versus private label), intended usage situation (everyday use versus special
occasion), price (regular versus discount price), store image (upper class and middle
class), merchandise mix (lower percentage of private labels and more percentage of
private labels as compared to national brands). The store image as was found in
literature pertaining mostly to foreign countries was termed as upper class store or
lower class store. However, an overview of Indian organized retail market and
72 l'itt~c

opinion of experts indicated that organized rE
, As middle class is a very commonly used t
was used. The factorial design thus had 2x2
created for each unique combination of
balanced factorial designs are considered bett
design, each cell should have roughly samf
design was conducted and each combination x
are not considered low class.
instead of low class, middle class
32 cells and 32 vignettes were
five factors. It is to be noted that
than unbalanced ones. In a balanced
number of respondents. A balanced
1uired a minimum of 30 responses.
3.12 DATA ANALYSIS
Factor analysis is a multivariate statisti procedure primarily used for data
reduction and summarization— large number of correlated variables is reduced to set
of independent underlying factors. This technique is used because it analyzes the
structure of interrelationships among large number of variables by defining a set of
common underlying dimensions, known as factors or dimensions. This leads to
summarization and data reduction. Factor analysis is an interdependent technique in
which all variables are simultaneously cons
employing the concept of the variate, the
variables are dependant variables that are
of dimensions that are themselves made tip o
Factor analysis helps in understanding the
not possible with bi variate and univa:
, each related to all others and still
.r composite of variables. The original
tion of some underlying and latent set
3.11 other variables (Gorusch, 1983).
plex relationships, which is otherwise
methods. The other benefit of this
technique is that researcher gets insight into empirical estimation of relationships
with conceptual foundation and interpretation of results. An important tool in
interpreting factors is factor rotation. Rotation means that the factors are turned
about the origin until some other position has been reached. This redistributes the
variance from earlier factors to later ones to achieve a simpler, theoretically more
meaningful factor pattern.
This analysis includes preliminary tests to dh inc the appropriateness of factor
analysis: the anti-image correlation matrix, 3artlett's test of sphericity, and the
Kaiser-Meyer-Olkin measure of sampling ade, uacy (MSA). In factor analysis, some
degree of multicollinearity is desirable, b cause the objective is to identify
interrelated sets of variables. The correlation., among variables can be analyzed by
7311'~iy~c

computing the partial correlations among variables. If "true" factors exist in the data,
the values of partial correlation should be small. The anti-image correlation matrix
contains the negative values of the partial correlations among variables; smaller anti-
image correlations are indicative of a data matrix suited to factor analysis.
Bartlett's test of sphericity is a statistical test for the presence of correlations among
variables. It provides the statistical probability that the correlation matrix has
significant correlations among at least some of variables. Thus, a significant
Bartlett's test of sphericity is required (Hair et al., 1998). The Kaiser-Meyer-Olkin
MSA index, which can range from 0 to 1, indicates the degree to which each
variable in a set is predicted without error by the other variables. If the MSA index
reaches 1, each variable is perfectly predicted by the other variables without error.
According to Hair et al. (1998), a value of 0.50 or more from the Kaiser-Meyer-
Olkin MSA test indicates that the data are adequate for Exploratory Factor Analysis
(EFA). The Kaiser-Meyer-Olkin measure of sampling adequacy test and Bartlett's
test of sphericity (p<.001) indicated that the data on satisfaction of the customer with
banks services were appropriate for factor analysis. Given these results, the EFA
was conducted.
0.- The objective of factor analysis in this research was to reduce the constructs. The
constructs already had variables which should have high correlation. As expected,
all constructs resulted in only one factor having an Eigen value greater than one.
Also, the single factor explained around 60 per cent of the overall variation in most
cases.
Table 3.3: KMO & Bartlett's Test
S.NO. Factor KMO Bartlett's Test 1 NATFAM .696 .000 2 PVTFAM .702 .000 3 STOREA WRN .652 .000 4 FASHIONQ .642 .000 5 SHOPPING .658 .000 6 BRAND C ON .641 .000 7 EVALUATN .826 .000
In addition to Factor analysis, ANCOVA was used to address the research
hypotheses. There are so many extraneous variables other than those included in
ANOVA model as independent variables (factors) that might have an impact on the
74 "a f_

dependent variable. The marketing researcher, therefore, should be extremely
careful in identifying and isolating the impact of such extraneous variables. While
there are so many extraneous factors that would have an impact on the dependent
variable, it is a utopian task for the marketing researcher to incorporate all of them in
the model. Hence, only a few (one or two) major covariates are chosen and their
impact removed from the model. In other words, our interest is to find out the
significant impact of the treatment variable(s) [independent variable(s) or factor(s)]
on the dependent variable after eliminating or controlling the effect of the covariates.
It is only for such situations, ANCOVA is performed (Churchill, lacobucci & Israel,
2009). This technique requires one dependent variable measured on a continuous
(interval or ratio) scale, and the independent (treatment or factor) variables measured
on a nominal or categorical scale. Nonetheless, it demands that the covariate should
be measured on an interval or ratio scale (Churchill, Iacobucci & Israel, 2009).
Since, in our research there were 5 major factors and 3 major covariates, ANCOVA
was considered as the suitable technique for analysis.
Exhibit 3.2: Diagrammatic Representation of Analysis
Research Problem
Exploratory Factor Analysis
Extract Factors with Component Analysis
I Calculate the factor scores
Use the factor score as a variable in ANCOVA I
I ANCOVA Used to test hypotheses ~
75 I a

3.13 LIMITATIONS
Though a number of precautions have been taken to increase the reliability of the
present study, yet the researcher feels that there are certain limitations which may be
given due consideration:
The sampling technique used was researcher controlled mall intercept and
judgment sampling. Researcher controlled sampling is a non probability
technique and therefore the representativeness of the sample is not known.
Precautions were taken to ensure better representativeness by going to different
malls, at different times of the day and week, training the enumerators, selecting
the shoppers after judgment and screening the window shoppers etc. however,
the limitation of non probability sampling still remains and the results should be
used with caution.
The design used in research is causal. Although this design limits the
generalization of results, we believe that it is still is good and because of the
large sample size and quality response, it still can be generalized.
> The research was mainly conducted in Delhi and National Capital Region of
Delhi due to limitations of time and money. It was not conducted on pan India
basis therefore the sample is not a very good representative of the entire Indian
population. But, it still is a farily good representation because most organized
retail apparels started with A class metros only and have now started targeting
smaller towns. Still, big brands are targeting A class metro cities only.
Therefore, Delhi still qualifies as a good representation from the point of view of
the present study.
> The research was limited to apparels and within apparels only shirt brands.
Literature reveals that a high involvement purchase like shirt is very different
like a low involvement product like soaps. Therefore, the generalization of the
results should be only done for high involvement purchase decisions only.
The research was intended to check behavior but evaluation of the shirt brand
was used as a proxy to the behavioral intention. The real behavior can be very
different from the evaluation through a vignette.
v We have given only one vignette to one person. This was intentionally done
because only subtle variations were there between vignettes and it would have
761. .,.._

been impossible for consumers to comprehend and correctly answer questions on
all 32 vignettes. However, in a real scenario, if the consumer is not going to an
exclusive national brand store, he chooses between various brands at the same
time. He can compare and make more informed decision. This aspect was not
captured in our research.
The current study has not focussed specifically on demographics e.g. females &
youth.
Internet has drastically changed the way that business organizations manage
their brands. With the popularization of interactive devices available via the
Internet, brand management principles dictate the need for utilizing blogs,
podcasting, and social network sites (e.g., Facebook) to build and enhance brand
image with consumers which has not been covered in the present study.
Another related area of research that requires further exploration is how
consumer perceptions are likely to be shaped by brand characteristics, such as
the intrinsic properties of different brand names.
This study focused only on Delhi and National Capital Region (NCR). Further
studies may need to be conducted if the findings need to be generalised to other
regional markets of India e.g. South, West & East.
77 C

CHAPTER 4: ANALYSIS AND RESULTS 4.1 Introduction 4.2 Expert Opinion 4.3 Analysis of the Questionnaire 4.4 Demographic Profile of the Sample 4.5 Factor Analysis 4.6 ANCOVA (Analysis of Covariance) 4.7 Exploratory Factor Analysis 4.8 Hypotheses Testing

CHAPTER 4: ANALYSIS AND RESULTS
The chapter starts with a discussion of the analysis of primary data and result of the
three pilots. It proceeds on to analysis of the questionnaire and summarizes the
demographic characteristics of the sample. Subsequently, use of Exploratory Factor
Analysis and ANalysis of COVAriance (ANCOVA) in testing the hypotheses are
then mentioned. For the selected hypotheses, binomial test was performed and the
results of the analysis presented.
4.1 INTRODUCTION
This Chapter deals with the analysis of primary data, which was, collected for the
study of the attitude towards private label products. The analysis starts with the
discussion with experts on the available constructs and its applicability in Indian
context. This was accompanied by internal consistency reliability (Cronbach's
Alpha) analysis of the initial constructs. Since some constructs were not found
reliable, the items comprising the questionnaire were again reviewed with subject
experts and their opinions incorporated. It was followed by another pilot survey and
the constructs were again tested for internal consistency. When the questionnaire
was found reliable, the data was collected. EFA was performed on the constructs to
find out the principal components. As expected, in all cases, only one factor with
Eigen value more than one emerged and explained more than 60 per cent of the
variance of the construct. The factor score was used in place of the variables in a
construct. The independent factors, covariates and random factors were put in the
ANCOVA model and analyzed to test the hypotheses framed for the study.
78 u .:

Exhibit 4.1 Flow Chart Depicting Schema of Analysis
Literatu
EDevelopment
Pilot study I from consumers
Survey Instrument Pilot study II from consumers
View of S Pilot study !II from consumers
Checking of validity and reliability of scales
Data collection from consumers
Reduction of variables using Factor Analysis
II Reduced variables and independent factors used in the ANCOVA model
to Test the hypothesis
Findings & Managerial Implications
4.2. EXPERT OPINION
The pilot study was conducted to know the stores consumers are most familiar with
and find the private label and national brand kept in these stores. Expert opinions
were also taken and the four stores were identified. The two high class stores having
a good recall were Shopper's Stop and Westside. Shopper's Stop has a lower
percentage of private labels (around 20 per cent) and Westside has 100 per cent
private label. The private label shirt at Shopper's Stop is branded as STOP and the
national brand that people recalled was Louis Phillipe. Westside has the private label
shirt brand also known as Westside but it wasn't having any national brand. The two
middle class stores identified were Big Bazaar and Reliance Retail. Reliance Retail
has a percentage of private labels (around 60 per cent) but Big Bazaar has almost 90
per cent private labels and in formal shirts there are no national brands. The private
label shirt in Reliance Retail is branded as First Class and the national brand kept is
Peter England. The private label in Big Bazaar is called Knighthood. Researcher
faced a problem in that Westside and Big Bazaar were not having any national
79 1, a t c

brands. A sample of ten respondents were asked about the possible national brands
that they associated with these stores. Based on their feedback, the national brand
considered in our vignettes for Westside was Arrow and for Big Bazaar it was
Zodiac. While based on the suggestions given by the experts, the data was collected
from 63 respondents and the reliability of the constructs was estimated.
Table 4.1: Reliability Consistency for First Wave of 63 respondents.
Construct Variables Internal Consistency Reliability
(Cronbach's Alpha)
Familiarity National shirt brands like LP, Vl-1 etc. are .7004 with National familiar/unfamiliar Shirt Brands Not worn/worn
Not knowledgeable/knowledgeable Familiarity Private label shirt brands like Stop, First Class, etc, are .8214 with Private familiar/unfamiliar label Shirt Not worn/worn Brands Not knowledgeable/knowledgeable Familiarity of The store of Shoppers' Stop, Big Bazaar etc. are .6832 stores unfamiliar/familiar
Have not purchased from these stores/have purchased Not knowledgeable/knowledgeable
Shopping as For me, shopping is .3163 an activity Unimportant/Important
Irrelevant/Relevant Low involvement/High involvement
Fashion I am very interested in fashion -.0058 Consciousness I keep myself up to date on latest fashion trends
My peers consider me fashionable Brand When making a purchase, I always pay attention to the .0042 Consciousness brand
The Brand name of a garment is a very important information to me In general, a garments' brand tells a lot about its quality
Evaluation of A given vignette .7534 the shirt Evaluate the shirt on a 5 point totally disagree/totally
agree It is a good quality shirt It is a shirt which makes me think I'm getting my money's worth It is a shirt that I would buy It is a shirt I would like to wear It is a shirt which should make a good impression
A very poor reliability score was found for three constructs, namely, shopping as an
activity, fashion consciousness and brand consciousness. The interviewers were
80 l a c

trained to explain the questions and also how to identify target respondents. Again a
survey was conducted, the result of which are reproduced below:
Table 4.2: Reliability Consistency for Second Wave of 39 respondents.
Construct Variables Internal Consistency Reliability
(Cronbacli's Alp ha)
Shopping as For me, shopping is .3937 an activity Unimportant/Important
Irrelevant/Relevant Low involvement/High involvement
Fashion I am very interested in fashion .4706 Consciousness I keep myself up to date on latest fashion trends
M eers consider me fashionable Brand When making a purchase, I always pay attention to .789 Consciousness the brand
The Brand name of a garment is a very important information to me In general, a garments' brand tells a lot about its
uality
The results of the second wave were encouraging. The reliability estimate for brand
consciousness construct was now within the acceptable limits. The other two
constructs, shopping as an activity and fashion consciousness also saw improvement
in the Cronbach Alpha scores however it was still unsatisfactory. A final survey was
conducted keeping only the two constructs under observation. In the case of one
construct, one question was changed. The target respondents kept in this wave were
only female shoppers who were intercepted while exiting the stores. The results of
the third wave are produced below:
Table 4.3: Reliability Consistency for Third Wave of 19 respondents.
Construct Variables Internal Consistency Reliability
(Cronbach's Alp Ii a)
Shopping as an For me, shopping is .9538 activity Unimportant/Important
Irrelevant/Relevant Low involvement/I-Ii gh involvement
Fashion I am very interested in fashion .9885 Consciousness I keep myself up to date on latest fashion trends
My eers consider me fashionable
81 P a a c

As the results were satisfactory, we proceeded with final data collection with the
final modified questionnaire.
4.3 ANALYSIS OF THE QUESTIONNAIRE
Since there were six constructs having twenty three items in the data set, Principal
Components Analysis (PCA) was conducted to reduce the number of items. The
PCA method of extraction begins by finding a linear combination of variables (a
component) that accounts for as much variation in the original variables as possible.
It then finds another component that accounts for as much of the remaining variation
as possible and is uncorrelated with the previous component, continuing in this way
until there are as many components as original variables (Freedman, 2005). Usually,
a few components will account for most of the variation, and these components can
be used to replace the original variables. This method is most often used to reduce
the number of variables in the data file.
4.4 DEMOGRAPHIC PROFILE OF THE SAMPLE
As discussed, sample size for present research was 960. Approximately 75 per cent
of these were males and 25 per cent females. Roughly 11.7 per cent respondents had
monthly income of less than Rs. 1.6 lacs/annum, 40.2 per cent between Rs. 1.6 —3
lacs/annum, 37.8 per cent between Rs. 3 — 5 lacs/annum and 7.8 per cent with more
than 5 lacs/annum. 2.5 per cent respondents chose not to disclose their yearly
income. The mean age of the sample was 28.14 with the youngest being 18 years
and the oldest 58 years. There were 12.17 per cent undergraduates, 50.3 per cent
graduates, 24.4 per cent post graduates and 13 per cent had some professional
qualification. About 51.5 per cent were living in Delhi/NCR for more than one year,
38.1 per cent for less than a year and 10.4 per cent people chose not to answer this
question,
821J11aac

Table 4.4: Summary of the Demographic Characteristics of the Sample
Demographics Percentage (%)
1. Gender
a. Male 75%
b. Female 25%
2. Annual Income
a. Less than 1.6 lacs 11.7%
b. Rs. 1.6 lacs — Rs. 3 lacs 40.2%
c. Rs. 3 lacs — Rs. 5 lacs 37.8%
d. More than Rs. 5 lacs 7.8%
e. Missing Values 2.5%
3. Age
a. Mean 28.14
b. Minimum 18
c. Maximum 58
d. Std. Deviation 7.0079
4. Education
a. Under Graduate 12.17%
b. Graduate 50.3%
c. Post Graduate 24.4%
d. Professional 13%
5. Living in Delhi/NCR
a. More than one year 51.5%
b. Less than a year 38.1%
c. Missing Values 10.4%
83 P ..

Descriptive Statistics of the Sample
Exhibit 4.2: Demographic Profile — Gender
24
1%
gender'.
male
0 female
Pies show percents
Demographic Profile — Gender
Gender Percentage (%)
Male 75.26%
Female 24.74%
841Page

Exhibit 4.3: Demographic Profile — Annual Income
AO/ 41%
40% 39%
35%
30%
25%
20% ■ Percentage
15%
10% °
5%
0%
< 1.6 lacs Rs.1.6 - Rs. 3 Rs. 3 — Rs.5 > Rs. 5 Lacs lacs lacs
Demographic Profile - Annual Income
Income Category Percentage (%)
Less than 1.6 lacs 12%
Rs.1.6 - Rs. 3 Lacs - 41%
Rs. 3 — Rs.5lacs 39%
More than Rs.5 Lacs 8%
85IPage

Exhibit 4.4: Demogranhic: Profile — Age
Demographic Profile -Age
Mean 28.1385
Minimum 18
Maximum 58
Std. Deviation 7.0079
861Page

Exhibit 4.5: Demographic Profile — Education
24.3
7%
education • undergraduate
graduate • post graduate
• professional
Pies show percents
Demographic Profile- Education
Undergraduate 12.17%
Graduate 50.3%
Post Graduate 24.4%
Professional 13%
87IPage

Exhibit 4.6: Demographic Profile — Staying in Delhi/NCR
42.61
39%
staying in ncr • more than one year ® less than one year.
Pies show percents
Demographic Profile- Staying in Delhi/NCR
More than one year 57.39%
Less than one year 42.6 1 %
4.5 FACTOR ANALYSIS
EFA was performed on each scale separately to check as to whether all items load
on the single construct as expected. To determine if the data are likely to factor well,
before proceeding with EFA, Kaiser-Meyer-Olkin (KMO) Measure of Sampling.
Adequacy and Bartlett's Tests of Sphericity were performed. KMO measure
quantifies the degree of inter-correlations among the variables. and hence the
appropriateness of factor analysis. KMO value should be greater than 0.50 to
conduct the factor analysis (Malhotra, 2005). The KMO values of all the scales were. found to be meritorious (the lowest being .641 for brand consciousness) signaling
that data was suitable for factor analysis.
88IPage

Another measure is Bartlett's Test of Sphericity which measures the presence of
correlations among the variables. It provides the statistical probability that the
correlation matrix has significant correlations among at least some of variables.
Thus, a significant Bartlett's Test of Sphericity is required (Malhotra, 2005).
Because p =0.000 (its associated probability is less than 0.05) for all scales, we
could proceed with factor analysis.
Communalities indicate the amount of variance in each variable that is accounted
for. Initial communalities are estimates of the variance in each variable accounted
for by all components or factors. For principal components extraction, this is always
equal to 1.0. Extraction communalities are estimates of the variance in each variable
accounted for by the components. The communalities of each construct was found to
be high, which indicates that the extracted components represent the variables well.
If any communality were very low in a principal components extraction, another
component might have been needed to extract (Tabachnick & Fidell, 1996). Usually,
a few components will account for most of the variation, and these components can
be used to replace the original variables. This method is most often used to reduce
the number of variables in the data file (Freedman, 2005).
The objective of doing EFA in this research was to reduce the number of items in a
construct preferably to only one, If only a single component can be used to replace
the original variables, then the component can be used in the ANCOVA model to
test the hypothesis. In our questionnaire, most of the construct had three questions
and the dependant construct was evaluation of the brand which had 5 questions. For
e.g. Three sub-sections of question number 5 of the questionnaire were to know the
national brand awareness of the respondent. Similarly, private brand awareness
(three sub-sections of question 6), store awareness (three sub-sections of question 7),
shopping involvement (three sub-sections of question 8) and fashion quotient had
questions 9, 10 and 11. Brand consciousness was formed from three questions asked
on brand consciousness i.e. questions 12, 13 and 14. Factor analysis was used to
reduce these construct preferably to a single component. However, the dependant
variable evaluation of the shirt brand comprised of five questions which also were
reduced by factor analysis. These factor scores were saved and renamed to indicate
the factors. These factors were then used in the ANCOVA model as variables. For
example, the evaluation factor was used as the dependent variable in the ANCOVA
89

model and the previous factors were used as covariates in the ANCOVA model as
they may affect the evaluation of the shirt brand in question.
In line with the expectations, all the factor analysis produced only one component
which explained a considerable (usually above 60 per cent) of the variation.
4.6 ANCOVA (Analysis of Covariance)
ANCOVA is a technique to analyze the effect of multiple factors on a dependant
metric variable when some metric variables (covariates) can act as extraneous
variables. A full factorial model (as used in this research) contains all factor main
effects, all covariate main effects, and all factor-by-factor interactions. It does not
contain covariate interactions. Factors are the independent categorical variables like
price, having more than two categories. In this case, all factors were dichotomous
and there were 5 factors. These factors are called fixed factors. The fixed factors are
changed and their effect on dependant metric variable is studied. If there are other
factors, which can affect this relationship and need to be controlled, they are called
random factors. For example, in this research, gender was a random factor. If there
are other metric variables which can affect the relationship and we need to control
them, they are called covariates. In this research, the covariates were constructs like
fashion quotient, store awareness etc.
There are four methods of calculating the sums of squares for ANCOVA. For
balanced or unbalanced models with no missing cells, the Type III sum-of-squares
method is most commonly used and has been applied in the present study. This
method calculates the sums of squares of an effect in the design as the sums of
squares adjusted for any other effects that do not contain it and orthogonal to any
effects (if any) that contains it. The Type III sums of squares have one major
advantage in that they are invariant with respect to the cell frequencies as long as the
general form of estimability remains constant. Hence, this type of sums of squares is
often considered useful for an unbalanced model with no missing cells. In a factorial
design with no missing cells, this method is equivalent to the Yates' weighted-
squares-of-means technique.
Interaction is the joint effect of more than one independent variable on the
dependant variable. Individually, both may or may not effect but jointly they do. The
90 P a a

individual effects are called main effects and joint effects are called interaction
effects. All possible main and interaction effects were considered. Some significant
interaction effects are presented in the analysis as graphs in the subsequent section.
4.7 Exploratory Factor Analysis
Factor Analysis 1 (Three parts of Question 5 of Questionnaire in Appendix -1)
Table 4.5: KMO and Bartlett's Test
I Kaiser-Meyer-Olkin Measure of Sampling Adequacy I .696
~ Bartlett's Test of Sphericity Approx. Chi-Square j 810.701
df 1 3
Sig. .000
Table 4.6: Communalities for Factor Extraction
Initial Extraction
National Brand Familiarity 1.000 .738
National brand Worn 1.000 .667
National brand knowledge 1.000 i .682
Extraction Method: Principal Component Analysis.
Table 4.7: Communalities for Total Variance Explained for Principal Components
Comp. Initial Eigen values Extraction Sums of Squared
Loadings
% of Cumulative % of Cumulative Total Variance % Total Variance
1 2.088 69.585 69.585 2.088 69.585 69.585
2 .508 I 16.942 86.527
3 .404 13.473 100.000
Extraction Method: Principal Component Analysis.
911P:i!Ie

Table 4.8: Communalities for Component Matrix*
Component
National Brand Familiarity
National Brand Worn
National Brand Knowledge
.859
.817
.826
Extraction Method: Principal Cornponenl Analysis.
* I components extracted.
The factor is named NATFAM because it indicates the subjects' familiarity
with the national brands. It comprises brand familiarity, experience and
knowledge of the national brands.
Factor Analysis 2 (Three parts of Question 6 of Questionnaire in Appendix -1)
Table 4.9: KMO and Bartlett's Test
Kaiser-Meyer-Olkin Measure of Sampling Adequacy .702
Bartlett's Test of Sphericity Approx. Chi-Square 798.955
df 3
Sig. .000
Table 4.10: Communalities for Factor Extraction
Initial Extraction
Private Brand Familiarity 1.000 .719
Private Brand Worn 1.000 .687
Private Brand Knowledge 1.000 .681
Extraction Method: Principal Component Analysis.
921!':;

Table 4.11: Communalities for Total Variance Explained for Principal
Components
Comp. Extraction Sums of Squared
Initial Eigen Values Loadings
% of Cumulative % of Cumulative Total Variance % Total Variance
1 2.087 69.558 69.558 2.087 69.558 69.558
2 .485 16.153 85.711
3 .429 14.289 100.000
Extraction Method. Principal Component Analysis.
Table 4.12: Communalities for Component Matrix*
Component
1
Private Brand Familiarity
Private Brand Worn
Private Brand Knowledge
.848
.829
.825
Extraction Method: Principal Component Analysis.
* 1 components extracted.
This factor was named PVTFAM as this measured the familiarity of the
respondent with private brands.
93111aiL,

Factor Analysis 3 (Three parts of Question 7 of Questionnaire in
Appendix -1)
Table 4.13: KMO and Bartlett's Test
Kaiser-Meyer-Olkin Measure of Sampling Adequacy .652
Bartlett's Test of Sphericity Approx. Chi-Square 418.288
df 3
Sig. .000
Table 4.14: Communalities for Factor Extraction
Initial Extraction
Familiarity with Store 1.000 .642
Purchased from the store 1.000 .537
Knowledge about the store 1.000 .615
Extraction Method: Principal Component Analysis.
Table 4.15: Communalities for Total Variance Explained for Principal
Components
Comp. Initial Eigen Values Extraction Sums of Squared
Loadings
% of Cumulative % of Cumulative Total Variance % Total Variance °/>
1 1.794 59.814 59.814 1.794 59.814 59,814
2 .663 22.107 81.920
3 .542 18.080 100.000 i w
Extraction Iviethod:: Principal Component Analysis.
9411' age

Table 4.16: Communalities for Component Matrix'
Component
1
Familiarity with Store
Purchased from the store
Knowledge about the store
.801
.733
.784
Extraction Method: Principal Component Analysis.
* 1 components extracted.
This factor was given the name STORFAM indicating familiarity about the
stores which are both specialty or hypermarket stores.
Factor Analysis 4 (Three parts of Question 8 of Questionnaire in
Appendix -1)
Table 4.17: KMO and Bartlett's Test
Kaiser-Meyer-Olkin Measure of Sampling Adequacy .642
Bartlett's Test of Sphericity Approx. Chi-Square 442.244
Df 3
Sig. .000
Table 4.18: Communalities for Factor Extraction
Initial i Extraction
Shopping is important 1.000 .677
Relevant 1.000 .530
Involvement 1.000 ! .598
Extraction Method: Principal Component Analysis.

Table 4.19: Communalities for Total Variance Explained for Principal
Components
Comp. Initial Eigen values Extraction Sums of Squared
Loadings
% of Cumulative % of Cumulative Total Variance % Total Variance
1 1.805 60.161 60.161 1.805 60.161 60.161
2 .684 22.806 82.967 1
3 .511 17.033 100.000 I 4
Extraction Method: Principal Component Analysis.
Table 4.20: Communalities for Component Matrix*
Component
1
Shopping is important
Relevant
Involvement
.823
.728
.773
Extraction Method: Principal Component Analysis.
* I components extracted.
The component was named SHOPPING because it indicated the importance
given to shopping by the respondents.
96 e

Factor Analysis 5 (Three parts of Q 9, 10 and 11 of Questionnaire in
Appendix -1)
Table 4.21: KMO and Bartlett's Test
Kaiser-Meyer-Olkin Measure of Sampling Adequacy .658
Bartlett's Test of Sphericity Approx. Chi-Square 433.791
Df ; 3
Sig. J .000
Table 4.22: Communalities for Factor Extraction
Initial Extraction
Interested in Fashion 1.000 .648
Remain up-to-date 1.000 .570
Consider myself fashionable 1.000 .595
Extraction Method. Principal Component Analysis.
Table 4.23: Communalities for Total Variance Explained for Principal
Components
Comp. Initial Eigenvalues Extraction Sums of Squared
Loadings
% of Cumulative % of j Cumulative Total Variance % Total Variance
1 1.812 60.413 60.413 1.812 60.413 I 60.413
2 .641 21.365 81.777
3 .547 18.223 100.000
Extraction Method. Principal Component Analysis.
97 .._

Table 4.24: Communalities for Component Matrix*
Component
Interested in Fashion
Remain up-to-date
Consider myself fashionable
.805
.755
.771
Extraction Method: Principal Component Analysis.
* 1 components extracted.
The factor was named FASHIONQ because it indicated the fashion quotient of
the respondent i.e. how fashionable the respondent is.
Factor Analysis 6 (Three Parts of Question 9, 10 and 11 of
Questionnaire in Appendix -1)
Table 4.25: KMO and Bartlett's Test
Kaiser-Meyer-Olkin Measure of Sampling Adequacy .641
Bartlett's Test of Sphericity Approx. Chi-Square 342.590
df
Sig. .000
Table 4.26: Communalities for Factor Extraction
Initial Extraction
Give attention to the Brand name 1.000 .524
Brand name is important 1.000 .574
Brand name tells about the quality 1.000 .623
Extraction Method: Principal Component Analysis.
98 1''.

Table 4.27: Communalities for Total Variance Explained for Principal Components
Comp. Extraction Sums of Squared
Initial Eigen Values Loadings
% of Cumulative % of Cumulative Total Variance % Total Variance
1 1.721 57.357 57.357 1.721 1 57.357 57.357
2 .694 23.128 80.485
3 .585 19.515 100.000
Extraction. Method: Principal Component Analysis.
Table 4.28: Communalities for Component Matrix*
Component
1
Give attention to the Brand name
Brand name is important
Brand name tells about the quality
.724
.757
.789
Extraction Method: Principal Component Analysis. * 1 components extracted.
This factor was named BRANIDCON because it indicated the brand
consciousness of the respondent while purchasing any product.
Factor Analysis 7 (Five parts of Question 15 of Questionnaire in Appendix -1)
Table 4.29: KMO and Bartlett's Test
Kaiser-Meyer-Olkin Measure of Sampling Adequacy .826
Bartlett's Test of Sphericity Approx. Chi-Square 1728.366
df 10
Sig. .000
991;'a_;~:

Table 4.30: Communalities for Factor Extraction
Initial Extraction
It is a quality shirt 1.000 .523
Value for money 1.000 .611
Will buy 1,000 .710
Will like to wear 1.000 .502
Create a good impression 1.000 .642
Extraction Method: Principal Component Analysis.
Table 4.31: Communalities for Total Variance Explained for Principal
Components
Comp. Initial Eigen Values
Extraction Sums of Squared
Loadings
% of Cumulative % of i Cumulative
Total Variance % I Total Variance
1 2.988 59.754 59.754 2.988 59.754 ; 59.754
2 .752 15.039 74.793
3 .469 9.370 84.163
4 .426 8.526 92.689
5 .366 7.311 100.000
Extraction Method: Principal Component Analysis.
1001Pa`_~

Table 4.32: Communalities for Component Matrix*
Component
1
It is a quality shirt .723
Value for money .782
Will buy .843
Will like to wear .708
Create a good impression .801
Extraction Method: Principal Component Analysis.
* I components extracted.
This factor was designated as EVALUATN as it is the overall evaluation of the
brand of shirt in terms of its quality, value, readiness to buy, likability and
impression that it creates.
4.8 HYPOTHESES TESTING
The broad hypothesis considered was that the evaluation of the brand of shirt is not
dependent on any of the independent factors which we have manipulated in our
research design i.e. USAGE, CLASS, PRIVATE PERCENTAGE, PRICING &
SI-HIRT BRAND. These are the fixed factors whose affect on the evaluation of the
shirt is of our prime interest. The hypotheses were tested using ANCOVA
procedure. However, it was expected that the relationship might get affected by
covariates like the NATFAM, PVTFAM, STORFAM, SHOPPING, FAST-IIONQ &
BRANDCON therefore these variables are taken as covariates in the model whose
affect on the evaluation of the shirt brand is to be controlled. The demographic
variables like gender, age, income, education and period of stay in NCR were likely
to affect the evaluation of shirt brand so they too were considered in the model.
101 1 Page

Estimated
C C
.20000
b C 01
.00000 -
E -20000
W
Means of Evaluation of shirt brand
shirt brand —national — store brand
Table 4.33: Dependent Variable: Evaluation of shirt brand FACTOR (S) / INTERACTIONS P Value RESULT TERCEPT .605 Not Rejected..
ATFAM .151 Not Rejected VTFAM .063 Not Rejected
STORFAM .293 Not Rejected SHOPPING .391 Not Rejected
ASHIONQ .184 Not Rejected RANDCON .000 Rejected SAGE .000 Rejected
CLASS .469 Not Rejected VTPERCN .720 Not Rejected
PRICING .474 Not Rejected SHIRTBRN .917 Not Rejected GENDER .212 Not Rejected AGE .902 Not Rejected
COME .000 Rejected DUCATON .039 Rejected
STAYNCR .421 Not Rejected
Four hypotheses were rejected. Surprisingly, only one of the fixed factors USAGE.
came out to be significant. One covariate brand consciousness and two demographic
factors income and education came out to be significantly effecting the evaluation of
the shirt brand.
Exhibit 4.7: Estimated Marginal Means of Evaluation of Shirt Brand by National Store
everyday special occasion
usage
1021Page

Post hoc analysis revealed that store brand is evaluated slightly better for an everyday usage whereas national brand is preferred for a special occasion.
Table 4.34: Correlation between Brand Consciousness and Evaluation of Shirt I3 rand
CORRELATIONS Evaluation of Brand
SHIRT BRAND shirt brand Consciousness NATIONAL Evaluation of shirt Pearson 1 .285**
brand Correlation Sig. (2-tailed) .000 N 503 503
.285** 1 Brand Pearson Consciousness Correlation
Sig. (2-tailed) .000 N 503 503
STORE Evaluation of shirt Pearson 1 .196** BRAND brand Correlation
Sig. (2-tailed) .000
N 455 455
Brand Pearson .196** 1 Consciousness Correlation
Sig. (2-tailed) .000 N 455 455
**. Correlation is significant at the 0.01 level (2-tailed).
As regards the covariate brand consciousness, it was positively related with
evaluation of the shirt brand. This means a higher brand consciousness resulted in a
better evaluation of the shirt brand. When we compared this result within national
and store brands, it was found that national brand was positively correlated as
compared to store brand. Simply put, it can be inferred that brand conscious people
evaluated the national brands higher than store brands, although both were
significantly positively related.
103jPa_c

Exhibit 4.8: Estimated Marginal Means of Evaluation of Shirt Brand - by Income
Estimated Marginal Means of Evaluation of.shirt brand
a C R ar 5 Is C
Is R 2 V W
E N W
income
less than 1.6 lacs 1.6.- 3 lacs 3 - 5 lees more than Sacs
national store brand
shirt brand
Interesting findings got revealed during the analysis of income and evaluation of the
shirt brand. It was found that less than Rs. 1.6 lacs income group considered national
brand slightly better than private label. The Rs. 1.6 to Rs. 3 lacs/annum income
group considered national brand to be far superior to private labels. However, the
Rs. 3 — Rs. 5 lacs group considered both the national brands and private brands to be
similar and the above 5 lacs group considered private labels to be better than
national brands. The results were a bit surprising especially for the higher income
groups considering the private label brands to be almost similar or in some cases
better than the national brands. It gives credence to the argument that private labels
are no more only a cheap imitator of national brands but have significantly become
better in quality also.
1041Page

Exhibit 4.9: Estimated Marginal Means of Evaluation of Shirt Brand by Education
Estimated Marginal Means of Evaluation of shirt brand education
--undergraduate —graduate
—post graduate .20000 —professional
.00000 gal
V ay+
E 'a+ W -.20000
national store brand
shirt brand
The analysis of education and its effect on evaluation of different brands of shirts-
was more or less on expected lines. The undergraduates, post- graduates and
professionals considered national brands to be better than store brands however the
graduates gave store brands a bit better evaluation than national brands. 'It. may be
because the store brands are considered often more trendier than national, brands
which might appeal to the college goers just out of school. In India, it is also not
very uncommon for the graduates to try out newer outfits from non-branded
unorganized retail outlets. One thing common in the four significant factors is that as
expected personal characteristics (e.g. income, education, usage of the shirt and
brand consciousness) of the shopper are not much in control of marketer.
We thought that the gender and age (demographic variables) may also have some
effect on this relationship and thus so age has been taken as a covariate in the model
and gender taken as as random factor.
105 age

Table 4.35: Univariate Analysis of Variance for Between-Subjects Factors
Dependent Variable. Evaluation of the Shirt Brand
Value Label N Usage 1.00 everyday 481
2.00 special occasion 476
Class 1.00 upper class store 483
2.00 middle class store 474
Pvt. Percentage 1.00 private less 475 2.00 private more 482
Price 1.00 Regular 478 2.00 discounted 479
Shirt Brand 1.00 national 503 2.00 store brand 454
Gender 1.00 Male 720 2.00 Female 237
Table 4.36: Summarized Results of Hypotheses Testing
FACTOR (S) / INTERACTIONS P Value RESULT Intercept .289 Not Rejected NATFAM .059 Not Rejected PVTFAM .211 Not Rejected STORFAM .024 Rejected SHOPPING .030 Rejected FASHIONQ .108 Not Rejected BRANDCON .000 Rejected AGE .337 Not Rejected USAGE .057 Not Rejected CLASS .649 Not Rejected PVTPERCN .711 Not Rejected PRICING .583 Not Rejected SHIRTBRN .700 Not Rejected GENDER .934 Not Rejected USAGE * CLASS .794 Not Rejected USAGE * PVTPERCN .589 Not Rejected CLASS * PVTPERCN .923 Not Rejected USAGE * CLASS * PVTPERCN .616 Not Rejected USAGE * PRICING .262 Not Rejected CLASS * PRICING .022 Rejected USAGE * CLASS * PRICING .551 Not Rejected
106 I . `

PVTPERCN * PRICING .558 Not Rejected USAGE * PVTPERCN * PRICING .603 Not Rejected CLASS * PVTPERCN * PRICING .643 Not Rejected USAGE * CLASS * PVTPERCN * PRICING
.626 Not Rejected
USAGE * SHIRTBRN .343 Not Rejected CLASS * SHIRTBRN .463 Not Rejected USAGE * CLASS * SHIRTBRN .798 Not Rejected PVTPERCN * SHIRTBRN .912 Not Rejected USAGE * PVTPERCN * SHIRTBRN .378 Not Rejected CLASS * PVTPERCN * SHIRTBRN .216 Not Rejected USAGE * CLASS * PVTPERCN * SI-IIRTBRN
.794 Not Rejected
PRICING * SHIRTBRN .374 Not Rejected USAGE * PRICING * SHIRTBRN .286 Not Rejected CLASS * PRICING * SHIRTBRN .495 Not Rejected USAGE * CLASS * PRICING * SHIRTBRN
.227 Not Rejected
PVTPERCN * PRICING * SHIRTBRN .792 Not Rejected USAGE * PVTPERCN * PRICING * SHIRTBRN
.128 Not Rejected
CLASS * PVTPERCN * PRICING * SHIRTBRN
.372 Not Rejected
USAGE * CLASS * PVTPERCN * PRICING * SHIRTBRN
.299 Not Rejected
USAGE * GENDER .990 Not Rejected CLASS * GENDER Not Rejected USAGE * CLASS * GENDER .803 Not Rejected PVTPERCN * GENDER .874 Not Rejected USAGE * PVTPERCN * GENDER .724 Not Rejected CLASS * PVTPERCN * GENDER .926 Not Rejected USAGE * CLASS * PVTPERCN * GENDER
.575 Not Rejected
PRICING * GENDER Not Rejected USAGE * PRICING * GENDER .495 Not Rejected CLASS * PRICING * GENDER .959 Not Rejected USAGE * CLASS * PRICING * GENDER Not Rejected PVTPERCN * PRICING * GENDER .788 Not Rejected USAGE * PVTPERCN * PRICING * GENDER
Not Rejected
CLASS * PVTPERCN * PRICING * GENDER
Not Rejected
USAGE * CLASS * PVTPERCN * PRICING * GENDER
.936 Not Rejected
SHIRTBRN * GENDER .781 Not Rejected USAGE * SI-HIRTBRN * GENDER Not Rejected CLASS * SHIRTBRN * GENDER Not Rejected USAGE * CLASS * SHIRTBRN * .856 Not Rejected
107 ' _ t

GENDER PVTPERCN * SHIRTBRN * GENDER Not Rejected USAGE * PVTPERCN * SHIRTBRN * Not Rejected GENDER CLASS * PVTPERCN * SHIRTBRN * Not Rejected GENDER USAGE * CLASS * PVTPERCN * .133 Not Rejected SHIRTBRN * GENDER PRICING * SHIRTBRN * GENDER .774 Not Rejected USAGE * PRICING * SHIRTBRN * Not Rejected GENDER CLASS * PRICING * SHIRTBRN * Not Rejected GENDER USAGE * CLASS * PRICING * .788 Not Rejected S14IRTBRN * GENDER PVTPERCN * PRICING * SHIRTBRN * Not Rejected GENDER USAGE * PVTPERCN * PRICING * .803 Not Rejected SHIRTBRN * GENDER CLASS * PVTPERCN * PRICING * .390 Not Rejected SIIIRTBRN * GENDER
Only 4 hypotheses were rejected. The covariates store familiarity (STORFAM),
involvement in shopping (SHOPPING), brand consciousness (BRANDCON) were
found to be significantly affecting the evaluation of the brand. All these attributes
are personal attributes of the buyer however the variables which were of interest to
the marketer like the brand name, price etc. had no significant influence on the
evaluation of the brand. Interestingly, the interaction effect of class (high class or
middle class) with price (regular vs. discount) significantly affected the evaluation
of the shirt brand. None of the two fixed factors affected the decision of the buyer
individually.
108 IPa

upper class store
Exhibit 4.10: Estimated Marginal Means of REGR Factor Score 1
0.0
price
13 regular
E discounted rriddle class store
Class
It indicates that a regular price shirt is evaluated significantly better in a -upper class -
store than a middle class store. Surprisingly, it also shows that a discounted shirt is
evaluated better in a middle class store. So, it poses a question on the strategy of
some national brand players which at times try to put a discount on their brands. It.
might be counterproductive whereas in a middle class store people do expect a
discounted price and it doesn't devalue the brand.
One of the questions asked from the respondents was if they knew the difference
between the national brand and the store brand. Around 78% of the respondents
knew the difference between the store brand and the national brands. However, the
rest around 22% didn't know the difference. Our analysis includes both categories in
the first phase but later on we select only those cases that were aware_ of this.
difference and analyze their responses.
109 age

Exhibit 4.11: Percentage of Respondent who knew the difference between
National and Store Brands.
100
80
60
40
20
Missing Yes No
Know Difference
It is because one of the fixed factors changed was the brand name (national or
private) so respondents who didn't know this difference were dropped. The
hypothesis remains the same that none of the factors affect the evaluation of the shirt
brand.
Table 4.37: Univariate Analysis of Variance for Between-Subjects Factors Dependent Variable: Evaluation of the Shirt Brand
Value Label N Usage 1.00 everyday 368
2.00 special occasion 376
class 1.00 upper class store 384
2.00 middle class store 360
Pvt. percentage 1.00 private less 368 2.00 private more 376
price 1.00 regular 368 2.00 discounted 376
shirt brand 1.00 national 394 2.00 store brand 350
gender 1.00 male 567 2.00 female 177
110IPage

Table 4.38: Summarized Results of Hypothesis Testing
FACTOR (S) / INTERACTION (S) P Value RESULT Intercept .697 Not Rejected PVTFAM .020 Rejected STORFAM .029 Rejected SHOPPING .383 Not Rejected FASHIONQ .471 Not Rejected BRANDCON .000 Rejected AGE .882 Not Rejected NATFAM .900 Not Rejected USAGE .001 Rejected CLASS .161 Not Rejected PVTPERCN .745 Not Rejected PRICING .497 Not Rejected SHIRTBRN .512 Not Rejected GENDER .957 Not Rejected USAGE * CLASS .342 Not Rejected USAGE * PVTPERCN .552 Not Rejected CLASS * PVTPERCN .868 Not Rejected USAGE * CLASS * PVTPERCN .432 Not Rejected USAGE * PRICING .475 Not Rejected CLASS * PRICING .053 Not Rejected USAGE * CLASS * PRICING .405 Not Rejected PVTPERCN * PRICING .265 Not Rejected USAGE * PVTPERCN * PRICING .927 Not Rejected CLASS * PVTPERCN * PRICING .416 Not Rejected USAGE * CLASS * PVTPERCN * PRICING .889 Not Rejected USAGE * SHIRTBRN .171 Not Rejected CLASS * SHIRTBRN .434 _ Not Rejected USAGE * CLASS * SHIRTBRN .908 Not Rejected PVTPERCN * SHIRTBRN .639 Not Rejected USAGE * PVTPERCN * SHIRTBRN .126 Not Rejected CLASS * PVTPERCN * SHIRTBRN .078 Not Rejected USAGE * CLASS * PVTPERCN * SHIRTBRN .745 Not Rejected PRICING * SHIRTBRN .881 Not Rejected USAGE * PRICING * SHIRTBRN Not Rejected CLASS * PRICING * SIIIRTBRN .424 Not Rejected USAGE * CLASS * PRICING * SHIRTBRN .216 Not Rejected PVTPERCN * PRICING * SHIRTBRN .984 Not Rejected USAGE * PVTPERCN * PRICING * SHIRTBRN
.232 Not Rejected
CLASS * PVTPERCN * PRICING * SFIIRTBRN
.588 Not Rejected
USAGE * CLASS * PVTPERCN * PRICING * SHIRTBRN
.722 Not Rejected
USAGE * GENDER .977 Not Rejected CLASS* GENDER Not Rejected USAGE * CLASS * GENDER .730 Not Rejected
111 Pa`oe

PVTPERCN * GENDER .737 Not Rejected USAGE * PVTPERCN * GENDER .370 Not Rejected CLASS * PVTPERCN * GENDER .878 Not Rejected USAGE * CLASS * PVTPERCN * GENDER .976 Not Rejected PRICING * GENDER Not Rejected USAGE * PRICING * GENDER .463 Not Rejected CLASS * PRICING * GENDER .963 Not Rejected USAGE * CLASS * PRICING * GENDER Not Rejected PVTPERCN * PRICING * GENDER .949 Not Rejected USAGE * PVTPERCN * PRICING * GENDER Not Rejected CLASS * PVTPERCN * PRICING * GENDER Not Rejected USAGE * CLASS * PVTPERCN * PRICING * GENDER
.897 Not Rejected
SHIRTBRN * GENDER .802 Not Rejected USAGE f SHIRTBRN * GENDER .870 Not Rejected CLASS * SHIRTBRN * GENDER .926 Not Rejected USAGE * CLASS * SHIRTBRN * GENDER .850 Not Rejected PVTPERCN * SHIRTBRN * GENDER .625 Not Rejected USAGE * PVTPERCN * SHIRTBRN * GENDER
.961 Not Rejected
CLASS * PVTPIERCN * SHIRTBRN * GENDER
.925 Not Rejected
USAGE * CLASS * PVTPERCN * SHIRTBRN * GENDER
.302 Not Rejected
PRICING * SHIRTBRN * ,GENDER .560 Not Rejected USAGE * PRICING * SHIRTBRN * GENDER Not Rejected CLASS * PRICING * SHIRTBRN * GENDER .976 Not Rejected USAGE * CLASS * PRICING * SHIRTBRN * GENDER
.648 Not Rejected
PVTPERCN * PRICING * SHIRTBRN * GENDER
Not Rejected
USAGE * PVTPERCN * PRICING * SHIRTBRN * GENDER
.772 Not Rejected
CLASS * PVTPERCN * PRICING * SHIRTBRN * GENDER
.356 Not Rejected
Only 4 hypotheses were rejected. The covariates store familiarity (sroRiAM-i),
familiarity to private brands (PVTFAM), brand consciousness (BRANDCON) were
found to be significantly affecting the evaluation of the brand. However,
involvement in shopping (SHOPPING) was not significant in this case. Very
importantly, one of the fixed factors usage (daily or special purpose) was found to be
significant in this case. None of the other factors or interaction affects was found to
be significant. Even the interaction effect of class (high class or middle class) with
price (regular vs. discount) came very close to becoming significant.
1121Pa e

Exhibit 4.12: Estimated Marginal Means of REGR Score
.6
.4
E
Co C ca
c -.2
to
co -.4
E CD c W .6
everyday special occasion
Usage
As expected, a brand is evaluated better if it's for a special occasion than if it's
purchased for everyday use.
HYPOTHESES TESTING
One of the important demographic variables which might affect the evaluation is the
income of the respondents. Income is also related to the affordability of the brand
and therefore we included it as the random variable in the ANCOVA with the
hypothesis that it doesn't affect the evaluation.
113~Page

Table 4.39: Univariate Analysis of Variance for Between-Subjects Factors
Dependent Variable. Evaluation of the Shirt Brand
Value Label N
usage 1.00 everyday 463
2.00 special occasion ! 471
Class 1.00 upper class store 470
2.00 middle class store 464
Pvt. Percentage 1.00 private less 464
2.00 private more 470
Price 1.00 regular 471
2.00 discounted 463
shirt brand 1.00 national 488
2.00 store brand 446
Income 1.00 less than 1.6 lacs 111
2.00 1.6-3Lacs j 386
3.00 3 - 5 lass 362
4.00 more than 5 lacs 75
1141 rage
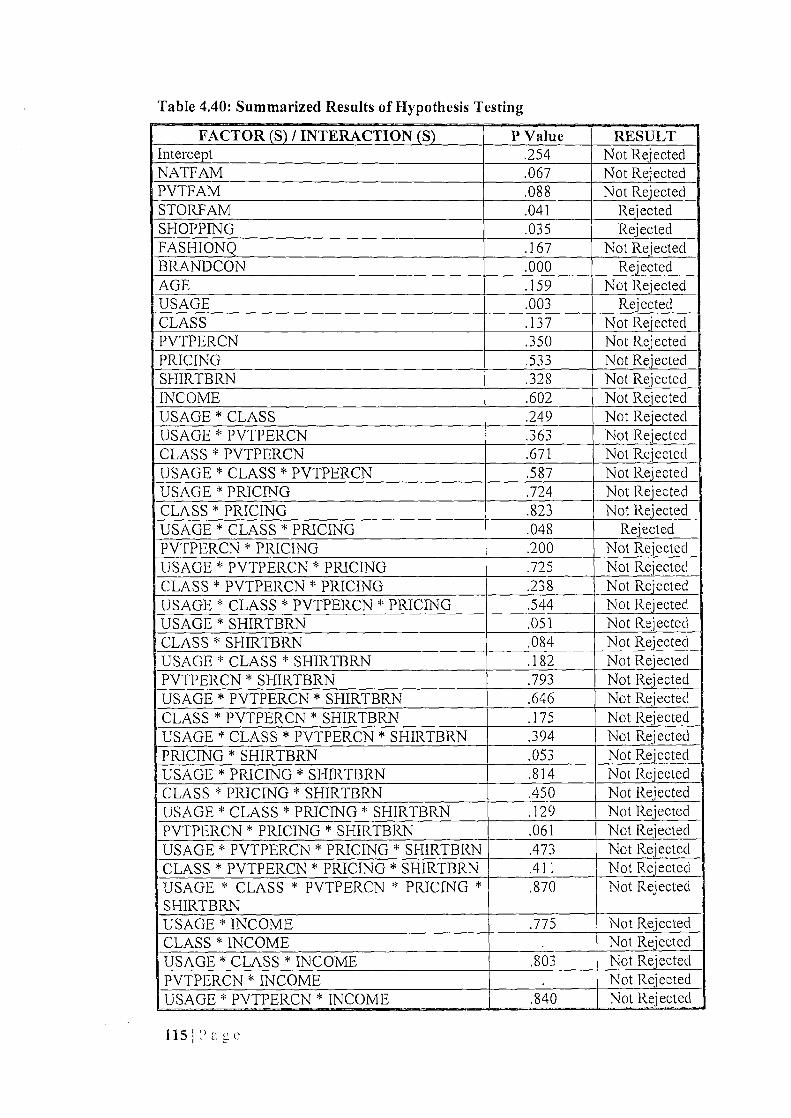
Table 4.40: Summarized Results of Hypothesis Testing
FACTOR (S) / INTERACTION (S) P Value RESULT Intercept .254 Not Rejected NATFAM .067 Not Rejected PVTFAM .088 Not Rejected STORFAM .041 Rejected SHOPPING .035 Rejected FASHIONQ .167 Not Rejected BRANDCON .000 Rejected AGE .159 Not Rejected USAGE .003 Rejected CLASS .137 Not Rejected PVTPERCN .350 Not Rejected PRICING .533 Not Rejected SI-IIRTBRN .328 Not Rejected INCOME .602 Not Rejected USAGE * CLASS .249 Not Rejected USAGE * PVTPERCN .363 Not Rejected CLASS * PVTPERCN .671 Not Rejected USAGE * CLASS * PVTPERCN .587 Not Rejected USAGE * PRICING .724 Not Rejected CLASS * PRICING .823 Not Rejected USAGE * CLASS * PRICING .048 Rejected PVTPERCN * PRICING .200 Not Rejected USAGE * PVTPERCN * PRICING .725 Not Rejected CLASS * PVTPERCN * PRICING .238 Not Rejected USAGE * CLASS * PVTPERCN * PRICING .544 Not Rejected USAGE * SHIRTBRN .051 Not Rejected CLASS * SHIRTBRN .084 Not Rejected USAGE * CLASS * SHIRTBRN .182 Not Rejected PVTPERCN * SHIRTBRN .793 Not Rejected USAGE * PVTPERCN * SHIRTBRN .646 Not Rejected CLASS * PVTPERCN * SHIRTBRN .175 Not Rejected USAGE * CLASS * PVTPERCN * SHIRTBRN .394 Not Rejected PRICING * SHIRTBRN .053 Not Rejected USAGE * PRICING * SHIRTBRN .814 Not Rejected CLASS * PRICING * SHIRTBRN .450 Not Rejected USAGE * CLASS * PRICING * SHIRTBRN .129 Not Rejected PVTPERCN * PRICING * SHIRTBRN .061 Not Rejected USAGE * PVTPERCN * PRICING * SI-IIRTBRN .473 Not Rejected CLASS * PVTPERCN * PRICING * SHIRTBRN .411 Not Rejected USAGE * CLASS * PVTPERCN * PRICING * SHIRTBRN
.870 Not Rejected
USAGE INCOME .775 Not Rejected CLASS * INCOME Not Rejected USAGE * CLASS * INCOME .803 Not Rejected PVTPERCN * INCOME Not Rejected USAGE * PVTPERCN * INCOME 840 Not Rejected
11511 a ,c

CLASS * PVTPERCN * INCOME .923 Not Rejected USAGE * CLASS * PVTPERCN * INCOME .431 Not Rejected PRICING * INCOME .771 Not Rejected USAGE * PRICING * INCOME .973 Not Rejected CLASS * PRICING * INCOME Not Rejected USAGE * CLASS * PRICING * INCOME .827 Not Rejected PVTPERCN * PRICING * INCOME Not Rejected USAGE * PVTPERCN * PRICING * INCOME .788 Not Rejected CLASS * PVTPERCN * PRICING * INCOME .503 Not Rejected USAGE * CLASS * PVTPERCN * PRICING * INCOME
.230 Not Rejected
SHIRTBRN * INCOME Not Rejected USAGE * SHIRTBRN * INCOME Not Rejected CLASS * SHIRTBRN * INCOME .854 Not Rejected USAGE * CLASS * SHIRTBRN * INCOME .585 Not Rejected PVTPERCN * SHIRTBRN * INCOME .608 Not Rejected USAGE * PVTPERCN * SHIRTBRN * INCOME .752 Not Rejected CLASS * PVTPERCN * SHIRTBRN * INCOME .324 Not Rejected USAGE * CLASS * PVTPERCN * SHIRTBRN * INCOME
.277 Not Rejected
PRICING * SHIRTBRN * INCOME Not Rejected USAGE * PRICING * SHIRTBRN * INCOME .461 Not Rejected CLASS * PRICING * SHIRTBRN * INCOME .786 Not Rejected USAGE * CLASS * PRICING * SHIRTBRN * INCOME
.169 Not Rejected
PVTPERCN * PRICING * SHIRTBRN * INCOME
Not Rejected
USAGE * PVTPERCN * PRICING * Sl-IIRTBRN * INCOME
Not Rejected
CLASS * PVTPERCN * PRICING * SHIRTBRN * INCOME
Not Rejected
In all 5 hypotheses were rejected. The covariates store familiarity (STORFAM),
involvement in shopping (SHOPPING) and brand consciousness (BRANDCON)
was significantly affecting the evaluation of the brand. Also, one of the fixed factors
USAGE (daily or special purpose) which was significant earlier was found to be
significant in this case too. None of the other fixed factors were significant but some
interaction affects were also found to be significant. Even the interaction effect of
USAGE*CLASS*PRICING was found to be significant which is a major finding.
The other two interaction effects which came very close to becoming significant at
95 per cent were USAGE*SI-IIRTBRN (p=0.051) and the other
PRICING*SI-IIRTBRN (p=0.053).
1161Pa c

Exhibit 4.13: Estimated Marginal Means of REGR factor score
At Price = Regular
.6
.4
Co .2 Co
4)
-.0 c 0) L- Co 2 0 m Cu -.4 E
CO
w -.6 everyday
class
upper class store
0 middle class store special occasion.
Usage
Exhibit 4.14: Estimated Marginal Means of REGR factor score
At Price = Discounted
.8
.6
en .4 c co
.2
Co 0) Co
Co -.4 E -.6
everyday
class
upper class store
0 middle class store special occasion
Usage
1171Page
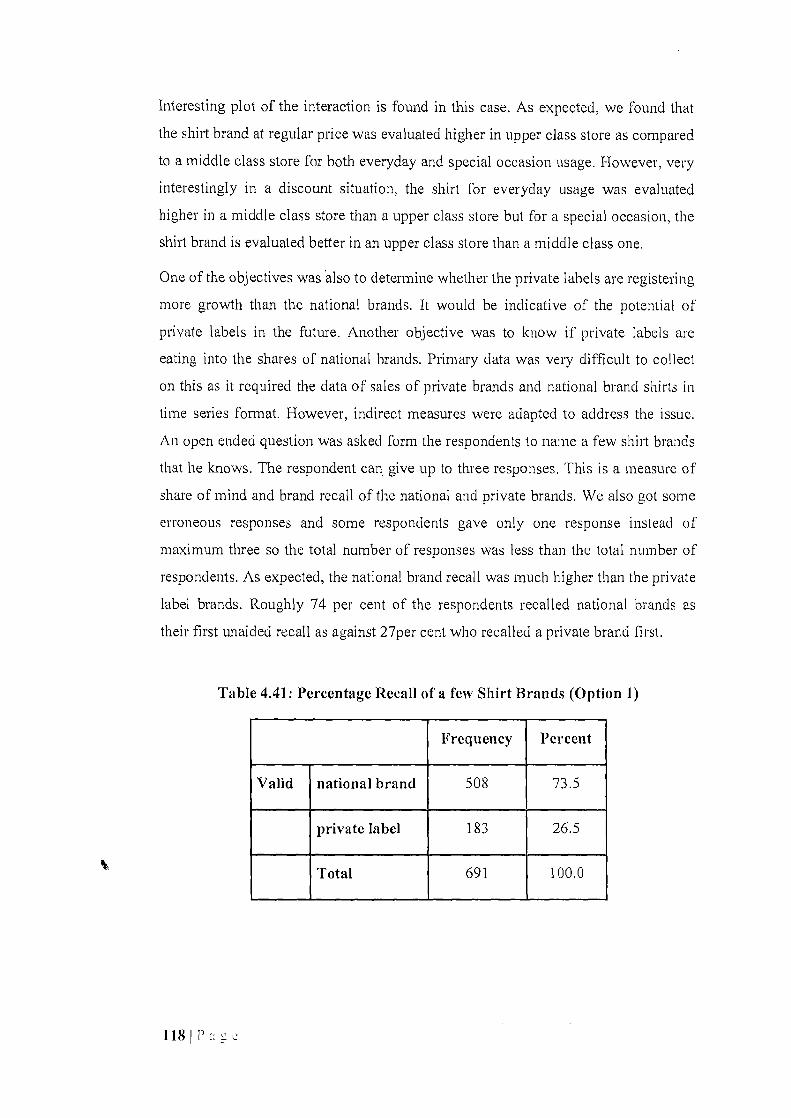
1
Interesting plot of the interaction is found in this case. As expected, we found that
the shirt brand at regular price was evaluated higher in upper class store as compared
to a middle class store for both everyday and special occasion usage. However, very
interestingly in a discount situation, the shirt for everyday usage was evaluated
higher in a middle class store than a upper class store but for a special occasion, the
shirt brand is evaluated better in an upper class store than a middle class one.
One of the objectives was 'also to determine whether the private labels are registering
more growth than the national brands. It would be indicative of the potential of
private labels in the future. Another objective was to know if private labels are
eating into the shares of national brands. Primary data was very difficult to collect
on this as it required the data of sales of private brands and national brand shirts in
time series format. However, indirect measures were adapted to address the issue.
An open ended question was asked form the respondents to name a few shirt brands
that he knows. The respondent can give up to three responses. This is a measure of
share of mind and brand recall of the national and private brands. We also got some
erroneous responses and some respondents gave only one response instead of
maximum three so the total number of responses was less than the total number of
respondents. As expected, the national brand recall was much higher than the private
label brands. Roughly 74 per cent of the respondents recalled national brands as
their first unaided recall as against 27per cent who recalled a private brand first.
Table 4.41: Percentage Recall of a few Shirt Brands (Option 1)
Frequency Percent
Valid national brand 508 73.5
private label 183 26.5
Total 691 100.0
11811'a-"c

Exhibit 4.15: Recall Percentage of National Shirt Brand and Private Label Shirt Brand (Option 1)
80
60
40
20
national brand private label
Shirt Brand
Interestingly, the percentage of people who named national brands declined. In-the-
second option, the national brand percentage got reduced from 73.5 to 72.2 and the private label percentage increased from 26.5 to 27.8.
Table 4.42: Percentage Recall of a few Shirt Brands (Option 2)
Frequency Percent
Valid national brand 502 72.2
private label 193 27.8
Total 695 100.0
119IPage
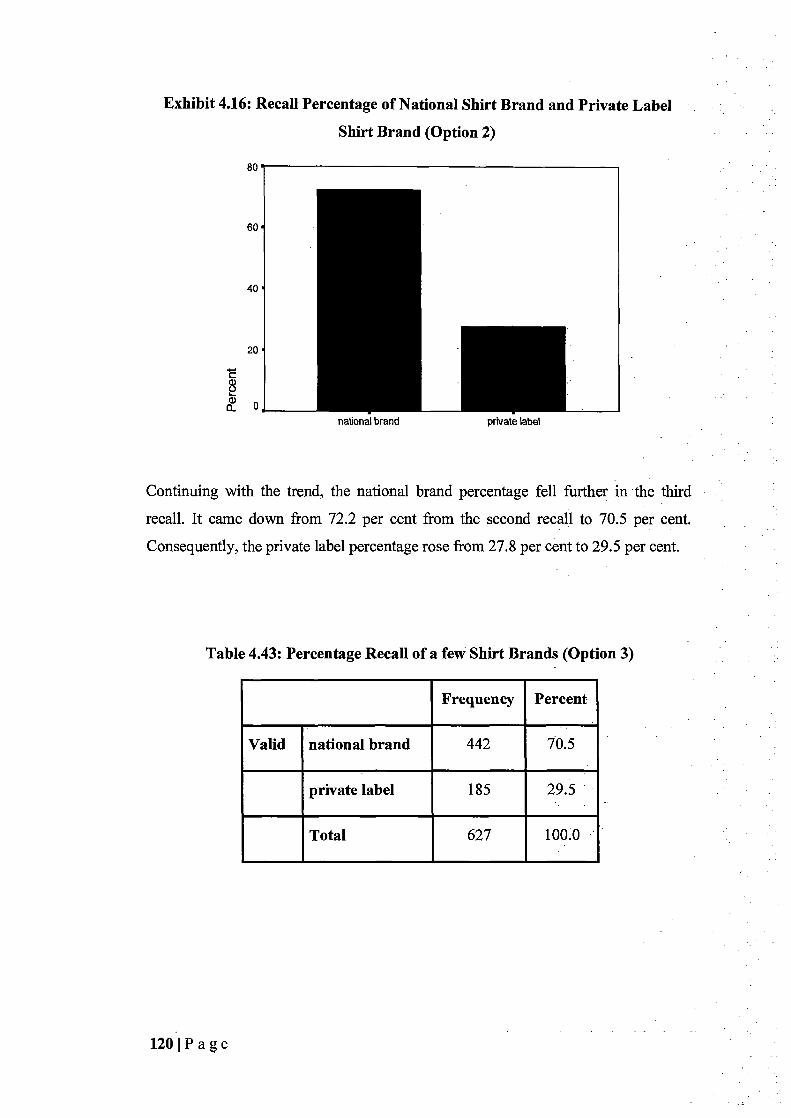
Exhibit 4.16: Recall Percentage of National Shirt Brand and Private Label
Shirt Brand (Option 2)
80
60
40
20
C 4) U
0 national brand private label
Continuing with the trend, the national brand percentage fell further . in the third
recall. It came down from 72.2 per cent from the second recall to 70.5 per cent.
Consequently, the private label percentage rose from 27.8 per cent to 29.5 per cent.
Table 4.43: Percentage Recall of a few Shirt Brands (Option 3)
Frequency Percent
Valid national brand 442 70.5
private label 185 29.5
Total 627 100.0
120 I P a g e

Exhibit 4.17: Recall Percentage of National Shirt Brand and Private Label
Shirt Brand (Option 3)
80
60
40
20
Jo] national brand private label
Another question asked in screening was to name a few brands which the respondent
has purchased. It followed a similar pattern to the national brands. People recalled
the purchase of national brands more than the private labels. As a first recall, 73.5
per cent recalled purchasing a national brand shirt as compared to 26.5 per cent for
the private label.
Table 4.44: Recall of a few Shirt Brand Purchased (Option 1)
Frequency Percent
Valid national brand 503 73.5
private label 181 26.5
Total 684 100.0
121IPage

Exhibit 4.18: Recall Percentage of National.Shirt Brand and Private Label
Shirt Brand Purchased (Option 1)
80
60
40
20
national brand private label
Opposite to what was observed in the shirt brand recall, the purchase recall actually
increased in favor of national brands in the second recall. In the, second recall, the
percentage of national brands increased from 73.5 to 74.1 per cent.
Table 4.45: Recall of a few Shirt Brand Purchased (Option 2)
Frequency Percent
Valid national brand 378 74.1
private label 132 25.9
Total 510. 100.0.
1221Page

Exhibit 4.19: Recall Percentage of National Shirt Brand and Private Label Shirt Brand Purchased (Option 2)
80
40
20
national brand private label
However, at the third recall there was a drop in the purchase recall . of national
brands. It dropped from 74.1 per cent to 72.1 per cent for national brands.
Consequently, the private label brand purchased recall rose from 25.9 per cent to 27.9 per cent.
Table 4.46: Recall of a few Shirt Brand Purchased (Option 3)
Frequency Percent
Valid national brand 181 72.1.
private label 70 27.9
Total 251 100.0
123 I P a g e

80
60
40
20
Exhibit 4.20: Recall Percentage of National Shirt Brand and Private Label Shirt Brand Purchased (Option 3)
national brand private label
In the case of recalling a few shirt brands that the respondent knew, the percentage
of national brands dropped from the first to the second recall and further from
second to third recall. It was thought proper to explore whether drop in the share of•
mind of national brand was significant at different stages. Hypothesis was tested
comparing the first and the second recall, second and third recall and also the first
and the third recall. The null hypothesis was that the percentage of national. brand . .
remains same in three options. However, the alternate hypothesis is one tailed
meaning the drop of national brand percentage is significant. The percentage drop.
from first recall to second recall did not come out to be be significant.
Table 4.47: Binomial Test on First Brand Recall and Second Brand Recall
Category N
Observed
Prop.
Test
Prop. ..
Asymp. Sig. (1-tailed)
KNWSB2 Group 1 private 193 .277698 .265000 . .236*
label
Group 2 national 502 .722302
brand
Total 695 1.000000
* Based on Z Approximation.
124jPage
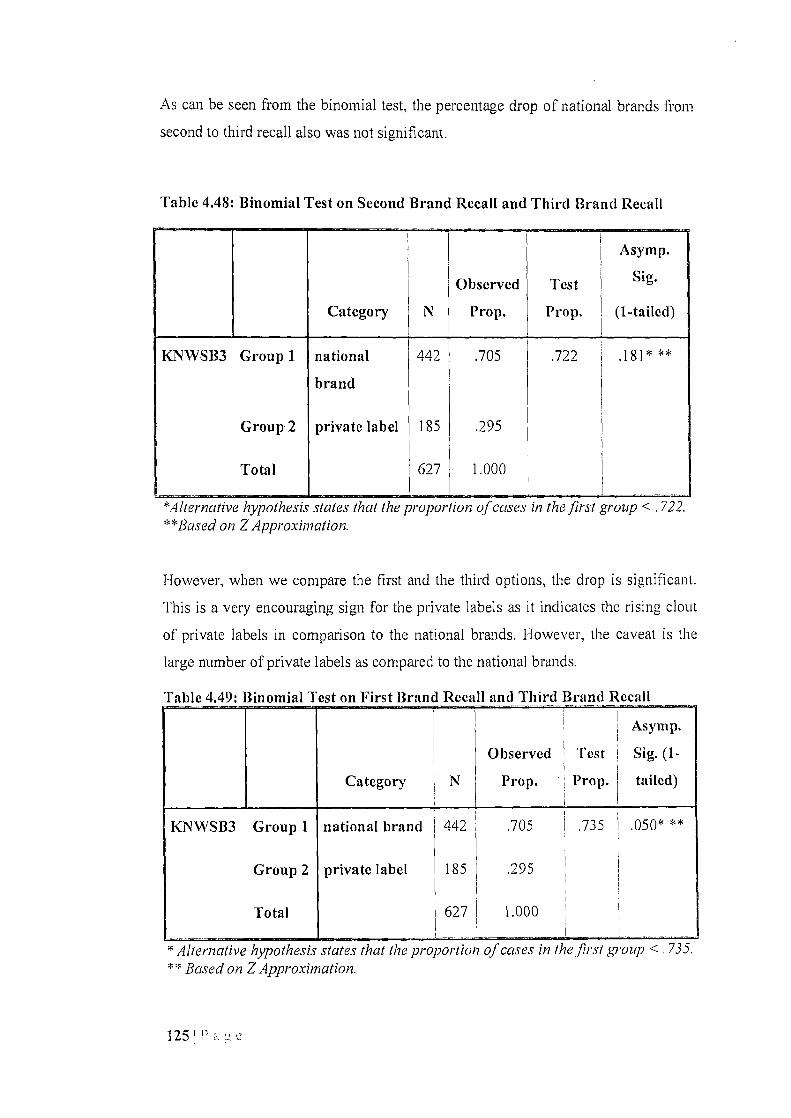
As can be seen from the binomial test, the percentage drop of national brands from
second to third recall also was not significant.
Table 4.48: Binomial Test on Second Brand Recall and Third Brand Recall
Asymp.
Observed Test Sig.
Category N Prop. Prop. (1- tailed)
KNWSB3 Group 1 national 442 .705 .722 .181* "F*
brand
Group 2 private label 185 .295
Total 627 1.000
*Alternative hypothesis states that the proportion of cases in the first group < .722. **Based on ZApproximation.
However, when we compare the first and the third options, the drop is significant.
This is a very encouraging sign for the private labels as it indicates the rising clout
of private labels in comparison to the national brands. However, the caveat is the
large number of private labels as compared to the national brands.
Table 4.49: Binomial Test on First Brand Recall and Third Brand Recall
Asymp.
Observed Test Sig. (1-
Category N f Prop. Prop. tailed)
KNWSB3 Group 1 national brand 442 .705 .735 I .050* **
Group 2 private label 185 .295
Total 627 1.000
Alternative hypothesis states that the proportion of cases in the first group <.735. * * Based on Z Approximation.
125 1{'

Similar, testing of hypothesis was conducted for purchase recall of brands. None of
the comparisons came out to be significant. No definite conclusion can be made
based on the purchase recall.
Table 4.50: Binomial Test on First Purchase Recall and Second Purchase Recall
Asymp.
Observed Test Sig. Category N Prop. Prop. (1-tailed)
PURCHSD2 Group 1 private label j 132 .258824 .26500 .398** 0
Group 2 national brand 378 .741176
Total 510 1.000000
* Alternative hypothesis states that the proportion of cases in the first group < 265000. ** Based on Z Approximation.
Table 4.51: Binomial Test on Second Purchase Recall and Third Purchase Recall
Observed "I'est Asymp. Sig.
Category N Prop. Prop. (1-tailed)
PURCHSD3 Group 1 national brand 181 .721 .735 .331 * **
Group 2 private label 70 .279
Total 251 1.000
* Alternative hypothesis states that the proportion of cases in the first group < . 735. * * Based on Z Approximation.
Table 4.52: Binomial Test on First Purchase Recall and Third Purchase Recall
Observed Test Asymp. Sig. Category N Prop. Prop. (1-tailed)
PURCHSD3 Group 1 national brand 181 .721 .741 .257 * **
Group 2 private label 70 1 .279 '
Total 251 f
1.000
* Alternative hypothesis slates that the proportion of cases in the first group <.741. * Based on Z Approximation.
126I1'a`gc

Based on the above analysis, not much can be said about the Hypothesis 6 regarding
the growth of private labels. However, the average recall at 23 per cent is higher
than the actual private label percentage in the Indian retail -market (India Retail
Report, 2009). This may indicate that the private label might be growing faster if the
recall can be considered a substitute for buying. In case the assumption is not true,
the results will be misleading. Conservatively, we can only tentatively say that the
growth of private labels may be more than the national brands.
For Hypothesis 7, the binomial test was used to check the percentage drop of
national brands in comparison to private labels. It is no denying the fact that the
brand recall and brand recall of purchase of national shirt brands is almost three
times than that of private labels but the silver lining for the private labels is the drop
in the percentage from the first to subsequent recalls. Even then, the pattern is not
followed in purchase recall. The private label recall percentage increased
significantly from first to the third recall eating the national brand recall. However,
the percentage change in purchase recall was not significant. Rather, the national
brand percentage rose from first to second recall and then decreased. In the absence
of clear pattern in the two comparisons, nothing conclusive can be deduced.
Tentatively, we can say that the private label percentage sales might eat into the
national brand sales if recall of brand can be considered a substitute for buying.
127 1 P a ,c

CHAPTER 5: DISCUSSION AND FINDINGS 5.1 Introduction 5.2 Summarized Results 5.3 Generalization from Findings

CHAPTER 5: DISCUSSION AND FINDINGS
,PIER OVERVIEW
chapter is divided into two parts. The first part chapter discusses the summary
e results of factor analysis and ANCOVA. The second part discusses the results
:findings in the light of existing literature for deriving conclusions.
5,1 INTRODUCTION
ANCOVA was applied to find the factors or covariates that affect the evaluation of
the shirt brand to reduce the variables of a construct principal component method of
factor analysis were used. Store familiarity, brand consciousness were found to be
significant. Familiarity to private brands was also found to affect the evaluation.
Division between internal and external factors was further required to analyze
further significance. The analysis gives credence to the idea that potential for growth
of private labels exists.
5.2 SUMMARIZED RESULTS
The first ANCOVA procedure was conducted on the entire data set of data, It was to
explore if the factors or covariates or any combination of them affect the evaluation
of the shirt brand. Since many of the covariates were constructs and not variables,
factor analysis was used to reduce the variables of a construct into preferably only
one component explaining a considerable percentage of variance contained in
original variables. For attaining this goal, Principal Component Analysis (PCA)
method was used.
128j1'ac

Table 5.1 Summary of the Results of Factor Annlvcis Variables No. of
component s extracted
(Eigen value >
than one
Name given to the factor
% of Variance
Explained
Brands of Louis Phillipe, Peter England, Arrow, Zodiac are unfamiliar/familiar to me
One Familiarity to National Brands
(NATFAM)
69.585
Not worn/ worn by me Not Knowledgeable! Knowledgeable Brands of Stop, First class, Westside, Knighthood are unfamiliar/familiar to me
One Familiarity to Private Brands
(PVTFAM)
69.558
Not worn/ worn by me Not Knowledgeable! Knowledgeable Stores of Shoppers' Stop, Big Bazaar, Reliance Retail, Westside are unfamiliar/familiar to me
One Familiarity of Stores
(STORFAM)
59.814
Not purchased from these stores/ Purchased Not Knowledgeable! Knowledgeable Shopping for me is unimportant/important One SHOPPING 60.161 Irrelevant activity/relevant Low involvement/high involvement I am very interested in fashion One Fashion
Quotient (FASHIONQ)
60,413 keep myself up to date on latest fashion
trends My peers consider me fashionable When making a purchase I always pay attention to the brand
One Brand Consciousness (BRANDCON)
57.357
The brand name of a garment is a very important information to me In general, a garments' brand tells a lot about its uali It is a good quality shirt One Overall
Evaluation of the shirt
(EVALUATN)
59.754 I am getting my money's worth It is a shirt that I would buy It is a shirt I would like to wear It is a shirt which should make a good impression
The ANCOVA model required a metric dependant variable; some fixed non metric
factors, some random non metric factors and some metric covariates. The dependant
variable used was taken as overall evaluation of the shirt (EVALUATN). The
independent fixed factors which were manipulated included USAGE, CLASS,
PRIVATE PERCENTAGE & PRICING & SHIRT BRAND. The random variables
were income, gender etc. The covariates were Familiarity to the National Brands
(NATFAM), Familiarity to the Private Brands (PVTFAM), Familiarity of Stores
1291P u

(STORFAM), SHOPPING, Fashion Quotient (FASHIONQ) and Brand
Consciousness (BRANDCON). The first analysis was conducted on the entire data
set. The significant results of this analysis are summarized below:
Table 5.2: Summary Table for the ANCOVA on entire data set N = 957
S. No. Source P value 1 USAGE .000 2 BRANDCON .000 3 INCOME .000 4 EDUCATION .039
The results indicate that usage, brand consciousness, income and education effected
the evaluation of the shirt brands. These were the main effects. None of the other
fixed factors, covariates or demographics came out to be significant. Noticeably, all
the four significant variables are not much affected by the marketer except that
advertising may increase a bit of brand consciousness among consumers.
Table 5.3: Summary Table for the ANCOVA on entire data set N = 957
S. No. Source P value 1 STORAFAM .024 2 SHOPPING .030 3 BRANDCON .000 4 CLASS*PRICING .022
The results indicate that the store familiarity (STORFAM) affects the evaluation of
the shirt brand. This is in accordance with the studies of Cunningham (1961) as one
of the important variables deciding loyalty towards a particular store was the
knowledge and awareness about the store and its competitors. The stores have an
image called store image and it rubs off on the products kept in the store. However,
opposite is also true that the kind of garments etc. are kept in a store creates its store
image. Actually, we can say that store image is a construct which is the sum total of
all marketing and retailing mix of the store. Shopping as an activity is also perceived
differently by different class of people. For some it is a need fulfillment, for some it
is a favorite pastime and for some it becomes an obsession. Apparel shopping
1301Pape

behaviour is the manifestation of browsing for apparel as well as the decision to buy
a specific clothing item (Schiffinan & Kanuk, 2007). However, the evaluation of the
brand which helps in decision making to buy a particular brand is influenced by the
importance given to shopping. The consumers' use of various shopping activities
appears to be positively influenced by their perceived benefit of the activity to
reduce perceived risk. If the perceived risk is within the acceptable risk then they
don't go much for information search related behavior but the behavior is
significantly different when the opposite is true (Dowling & Staelin, 1994). Hence,
the information available with the consumer and the resultant image of the store
should be a major extrinsic cue in determining the evaluation of the brand.
The surprising finding in this study is that STORFAM is significantly affecting the
evaluation of the brand but results for more specific factor CLASS (High Class and
Middle Class) were not significant. It is difficult to give any plausible reasons for
this. It might be that the organized retail stores in India are all considered of similar
in class. To some extent the same might be true because in the exploratory study no
store was considered low class. Brand Consciousness (BRANDCON) i.e.
importance given to brand by a consurnerwas found to be a significant covariate that
affected the evaluation of the shirt brand. This finding is quite surprising. Simply,
because the brand consciousness is significant but the particular shirt brand like
Louis Phillipe, Peter England, STOP etc. is not found to be significant in the
ANCOVA model. The reason for this is difficult to ascertain however some
evidence is available in literature. Over the years, the private labels have also
improvised significantly. They no longer are cheap imitations of the national brands.
Whereas store name brands used to be associated with lower value and cheap prices,
today's store brands are competing aggressively against national brands in terms of
quality image and value (ACNielsen, 2003). Store brands of clothing are indeed
marketed as if they were national brands (NDP Group, 2003). The customer, though,
brand conscious, considers all the brands as belonging to a similar class even if he
buys a private label. But there is no distinction as far as the shopping experience is
concerned. The private labels are also given enough shelf space, are properly
displayed in organized retail outlets mostly in premium locations. Perhaps, the only
difference is the price differential which at times is quite large. An Indian
customer's psyche also plays an important role here. Private label are in fact
131111a~~c

considered to be value for money brands. Therefore, Brand Consciousness
(BRANDCON) is significant but the specific brand of shirt did not affect the
evaluation of the shirt brand.
One of the five factors which were manipulated was the price of the shirt brand.
Surprisingly, price has not come out to be significant. It is important to note that
high quality is much more important than lower price. Private label share is
observed to be higher in a category with higher rupee sales, higher gross profit
margin, fewer national brands and less national brand advertising spending (Hoch &
Banerji, 1993). The number and quality of private labels directly affects the
readiness of buyers to accept them. The more better quality private label products
are available in the market, the more readily consumers choose a private label over a
higher priced national brand as also observed by Quelch & Harding (1996) in their
study.
As discussed earlier, another variable manipulated was CLASS (Upper class or
Middle class) which hasn't come out to be significant. The surprising finding is that
the CLASS (Upper class or Middle class) and PRICE (Regular vs. Discount)
interaction is significant. It indicates that a regular price shirt is evaluated
significantly better in an upper class store than a middle class store. Surprisingly, a
discounted shirt is evaluated better in a middle class store. So, it poses a question on
the strategy of some national brand players which put discounts on their brand. With
the same logic, introducing a shirt brand with lower price by a national brand to
compete with private labels might be counterproductive. In view of Quelch and
Harding (1996), introducing fighting brands by the manufacturers to compete with
private labels often cannibalizes the manufacturer brand more than it competes with
the private labels. For the private labels, they will do better to keep prices
competitive and provide better quality than cheap price. Latest researches have
indicated that the demand for private labels may not be particularly sensitive to (i)
Absolute level of the price of the store brand and (ii) The price gap with the
manufacturer brand. Retailer category revenues may be higher if the retailer charges
higher prices for its private label (Kumar & Jan-Benedict, 2007).
132I11 a a
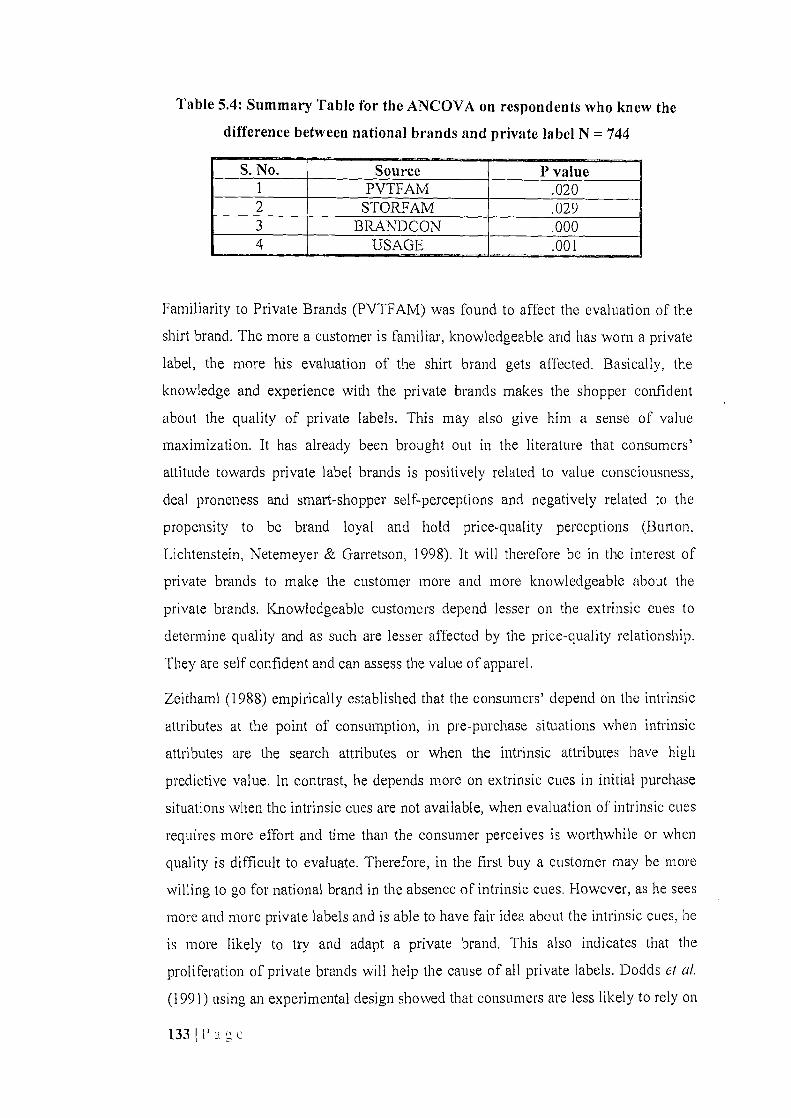
Table 5.4: Summary Table for the ANCOVA on respondents who knew the
difference between national brands and private label N = 744
S. No. Source P value I PVTFAM .020 2 STORFAM .029 3 BRANDCON .000 4 USAGE .001
Familiarity to Private Brands (PVTFAM) was found to affect the evaluation of the
shirt brand. The more a customer is familiar, knowledgeable and has worn a private
label, the more his evaluation of the shirt brand gets affected. Basically, the
knowledge and experience with the private brands makes the shopper confident
about the quality of private labels. This may also give him a sense of value
maximization. It has already been brought out in the literature that consumers'
attitude towards private label brands is positively related to value consciousness,
deal proneness and smart-shopper self-perceptions and negatively related to the
propensity to be brand loyal and hold price-quality perceptions (Burton,
Lichtenstein, Netemeyer & Garretson, 1998). It will therefore be in the interest of
private brands to make the customer more and more knowledgeable about the
private brands. Knowledgeable customers depend lesser on the extrinsic cues to
determine quality and as such are lesser affected by the price-quality relationship.
They are self confident and can assess the value of apparel.
Zeithaml (1988) empirically established that the consumers' depend on the intrinsic
attributes at the point of consumption, in pre-purchase situations when intrinsic
attributes are the search attributes or when the intrinsic attributes have high
predictive value. In contrast, he depends more on extrinsic cues in initial purchase
situations when the intrinsic cues are not available, when evaluation of intrinsic cues
requires more effort and time than the consumer perceives is worthwhile or when
quality is difficult to evaluate. Therefore, in the first buy a customer may be more
willing to go for national brand in the absence of intrinsic cues. However, as he sees
more and more private labels and is able to have fair idea about the intrinsic cues, he
is more likely to try and adapt a private brand. This also indicates that the
proliferation of private brands will help the cause of all private labels. Dodds el al.
(1991) using an experimental design showed that consumers are less likely to rely on
1331Pa,C

the presence of a price quality relationship for a particular product class in order to
rely more on the familiar information cues of brand and store name to assess the
product's worth. Therefore, the private labels should focus more on quality in
comparison to price and strive to educate the customers more. The familiarity of the
stores (STORFAM) is also significant in this case as previous. Dodds et al. (1991)
study indicates the dependency of consumers on store name and brand name to
evaluate a shirt brands worth. In this study, shirt brand wasn't significant but store
familiarity (STORFAM) significantly affects the evaluation of the product. The
private labels have thus an advantage in this finding. The retailers may see and
advantage here because if they increase the awareness about their stores, the chances
of their private labels selling also increases. The results here are somewhat different
from Dodds et al. (1991) because one variable is significant whereas brand name is
not significant. Brand consciousness is significant in people who are aware of the
difference between the national brands and the private label. Surprisingly, the more
specific factor BRAND (National vs. private label) didn't significantly affect the
evaluation of the brands even in this group. This finding is a significant departure
from many studies which indicate an extraordinary influence of the name of the
national brand. For example, the subjects considered brand name information as the
most important cue in forming quality of merchandise impressions. I-Iowever, the
subjects relied on different sets of objective cues to infer different image aspects
(Mazursky & Jacoby, 1986).
Dawar and Parker (1994) studied the importance of different types of signals in
assessing the quality of the product through a multicultural study. They found that
brand name signals are relied more heavily than price or physical appearance, which
is in turn relied on more heavily than retailer reputation for judging product quality.
In this study, both these cues, i.e. the brand name of the shirt and the brand name of
the store are found not to be significant. The customers are more influenced by the
knowledge that they have and their own attributes like brand consciousness
(BRANDCON). Interestingly, brand consciousness has come out to be significantly
affecting the evaluation of the brand but the actual brand of the cloth (either national
or private label) is not significant. One reason might be that the customers are
interested in brands but may be the brands within themselves are not so
differentiable. The usage also has come out to be significant. This is the first
134 P c

individual affect of a variable which was manipulated and found significant. The
usage had two levels, daily usage and special occasion. The explanation of this
factor coming out to be significant is simple. Consumers evaluate the shirt brands
differently according to the occasion. They may be evaluating more cautiously the
brands for special occasion than for regular use.
Table 5.5: Summary Table for the ANCOVA on Respondents who Differentiated between National Brands and Private Labels with Income as
Random Factor (N = 744)
S. No. Source P value 1 STORFAM .041 2 SHOPPING .035 3 BRANDCON .000 4 USAGE .003
The store familiarity (STORFAM), brand consciousness (BRANDCON) and usage
(USAGE) were found to be significant. Shopping (SHOPPING) is the construct
explaining the shopping related behaviour of an individual. Shopping involvement,
importance of clothing image, fashion commitment, quality conscious and fashion
aversion are the important five factors related to fashion and shopping perceptions
(Summers, Belleau & Wozniak, 1992). The differences in shopping orientation are
greatly affected by the gender. For the fairer sex, shopping is often a favorite
pastime and they are more likely to buy impulsively than their male counterparts.
Males have more goal directed behaviour and browsing time and volume is often
less as compared to females. In case of apparel products, Female Consumers choose
apparel products that fit specific roles in their lifestyle (Cassill & Drake, 1987).
However, no such differences were found among the males and females in this
study.
5.3 GENERALIZATION FROM FINDINGS
If we look at the factor which have come out to be significant and compare them
with factors which are not significant, certain findings can be generalized. The
classification that we are going to make here is the internal factors and external
factors. This classification is according to the consumers. Internal factors are those
1351 l a «e

factors which are in the control of the consumer or on which the retailer/marketer
has little control. They can be usage (USAGE), shopping (SHOPPING), fashion
consciousness (FASHIONQ) etc. The external factors for consumers are those which
are largely in the control of the retailer/marketer and the customer doesn't have any
direct control over them. These can be price (PRICE), brand name (BRAND), class
(CLASS) etc. If we present the significant results according to this classification, it
would reveal some important findings.
Table 5.6: Significance of Internal and External Factors.
Factor/Covariate/ Interaction
Number of times significant in the 3
Analysis
Classification (Internal / External to the customer)
Usage 2 Internal Class 0 External Private Percentage 0 External Price 0 External Shirt Brand 0 External Gender 0 Internal NATFAM 0 Internal PVTFAM I Internal STORFAM 3 Internal SHOPPING 2 Internal FASHIONQ 0 Internal PRANDCON 3 Internal Age 0 Internal Income 0 Internal Class*Price I External A =e 0 Internal Income I Internal Education I Internal Living in NCR 0 Internal Class*Price 1 External
It is evident from the table that none of the factors which are manipulated by the
retailer/marketer as a part of its strategy are really significant. The only significant
external factor is the interaction of class with price. On the other hand, a lot of
internal factors have come out to be significant. Except for NATFAM and
FASIIIONQ, all other internal factors have come out to be significant in one or the
other analysis. Overall, this indicates that the Indian consumer comes across as self
confident and to some extent self centered also.
Literature indicates that the attitude towards private label is positively correlated
with smart-shopper self-perceptions and negatively related to the propensity to be
136 Pa`c

brand loyal and hold price-quality perceptions (Burton, Lichtenstein, Netemeyer &
Garretson, 1998). The Indian consumer in this study seems to be having a good self
consciousness and is looking out to be smart shopper. The class*price interaction
sums up the Indian consumer very well. He is trying to strike a balance between the
price and the class. He is not giving undue importance to price without considering
the class and vice versa. One striking feature is the lack of effect of private
percentage, shirt brand etc. which indicates that the differentiation between the
brands (national versus private label) is fast disappearing. The potential of private
labels seem promising in this background. The customers however still evaluate the
national brands better than the private labels. If one has the choice (other things
being equal), one is most likely to buy a national brand over the private label, The
unaided recall of national brands in this study was approximately three times than
the private labels indicating the same. However, in subsequent unaided recalls the
percentage of national brands decreased.
Table 5.7: Summary of Percentages for Unaided Brand Recall of Shirts in Three Instances
Shirt Brand % first recall % in second recall % in third recall National 73.5.- 72.2 t 70.5
Private Label 26,51 27.8T 29.5
As can be seen from the table 5.5, the percentage of national brand has dropped
continuously form first to second and then to third recall. Consequently, the private
label recall goes on increasing from first to second and then to third recall. The drop
of national brand recall percentage is tested for significance and the results
summarized in table 5.7 below.
Table 5.8: Results of Hypotheses Testing for Drop in Percentage of National Brand Recall in Unaided Recall
Hypotheses Result Decline of national brand percentage from first to second recall is not significant
Accepted
Decline of national brand percentage from second to third recall is not significant
Accepted
Decline of national percentage from first to third recall is not significant Rejected
The results are an indication that private label's share of mind is increasing from
first to third recall. This leads us to believe that if recall can be a substitute of
purchase intention or purchase itself, then private labels have a bright future. It
13711' a a a

might also indicate that the difference between the private label and national brands
is decreasing. This result can also be interpreted in another way. One reason for the
third recall being significantly higher than the first recall can be that a few leading
national brands have a very high brand recall. However, as we go on asking for more
options, the national brands start giving way to private labels. This may be owing to
the fact that some private labels have become very close to the national brands,
especially, little lower national brands. The national brands may not be unduly
perturbed because the recall still is very high (almost three times as compared to
private labels). More precise conclusion can be drawn from the next unaided recall
analysis of the brand purchased.
Table 5.9: Summary of Percentages for Unaided Brand Recall of Purchased Shirts in Three Instances
Shirt Brand % in first recall % in second recall '% in third recall National 73.5T 74.11- 72.1 Private Label 26.5 1 25.9 T 27.9
As opposed to the clear drop in percentage of respondents recalling the national shirt
brands in three subsequent recalls, no clear trend emerges in this analysis. The
percentage of respondents recalling the purchase of national brands first rose from
73.5 per cent to 74.1 per cent and then dropped to 72.1 per cent. The absence of a
clear trend makes it very difficult to infer clearly. The hypothesis of a change in the
percentage of respondents recalling the purchase of national brands can give us
some conclusions.
Table 5.10: Results of Hypotheses Testing for Drop in Percentage of National Brand Recall in Unaided Recall
Hypotheses Result There is no significant change in the percentage of respondents recalling the Accepted purchase of national brands from first to second recall There is no significant change in the percentage of respondents recalling the Accepted purchase of national brands from second to third recall There is no significant change in the percentage of respondents recalling the Accepted purchase of national brands from first to third recall
Since none of the hypothesis could be rejected, we will have to conclude that the
percentage of respondents recalling the national brands remained same in the three
recalls. Looking at the tables, we cannot say conclusively that the private label is
taking away the share of mind from national brands. At best, it is a tentative
138111a~,c

conclusion. However, from secondary reports it can be deducted that private label
seems to be growing faster than the national brands and there is scope for the growth
to continue in future. Recent articles in the Indian context are suggestive of robust
growth of private labels and increase in the share of private labels at the cost of
national brands (Kaushik, 2010).
Table 5.11: Estimates of Growth Trends in Private Label by Top Executives with respect to their Companies
Industry Executive Desig. Company Private label Contribution Contribution supplier to of Pvt. label of Pvt. Label
to total to total
turnover turnover by 2012
Apparel Mr. Neeraj Director Asian Reliance 30% 40% Poddar Lakto Retail, Future
Industries Group, More, Bharti
Walmart, vishal
Apparel Mr. Rahul MD Creative Shopper's 10% 20% Mehta Garments Stop, Future
Group, Lifestyle,
Vishal Retail FMCG Mr. President KCL Foods Future Group 25% at total 15% at total
Sanjeev of 24 crore of 100 crore Khemka
FMCG Mr. Nikhil MD JHS Spencer's, 5% 20% Nanda Svendgaard Bharti Wal-
Mart, Rel Agro
Source: Will the Fizz last? Kaushik, Man it. Business Today, April 4, 2010.
According to Saloni Nangia, Vice President (Retail and Consumer Products),
Technopak Advisors (Kaushik, 2010), mentions that the private label growth (30 —
35 %) in the last year has outpaced the organized retail market (25 %). She also
opines that the growth in private label will continue to remain the same in future. An
estimate of senior executives about future of private label in percentage terms is
given in Table 5.11. As per a KPMG Report, private labels account for 10 — 12 per
cent of the organized retail product mix in India, against 17 — 18 per cent globally
(KPMG Report, 2009). It can be deduced from these secondary reports that private
label seems to be growing faster than the national brands and there is scope for the
growth to continue in future. Some data on Menswear shirt is given in Table 5.12.
1391Pa. ,~

Table 5.12 Menswear: (Vol. in 000 units) (Value in [NR crores) (Avg. MRP in [NR)
2006 2007 2008 2009
Value Avg. MRP Vol Value
Avg. Mid' Vol Value
Avg. MRP Vol Value
Avg. MRP
225 1821 1426 301 2112 1505 350 2323 1731 442 2555 1393 1257 12356 1740 1408 12801 1892 1478 14337 2215 1545 2578 775 36448 3078 845 38119 3348 878 41931 3794 905
L u IIu,«y OJ i 3482 419 88674 3939 444 95500 4369 457 103140 4837 469
Low 250709 7142 285 254634 7834 308 261284 8279 317 282187 9188 326 Total 379407 14820 393538 16892 409209 18238 443326 20476
Source: IMAGES F&-R Research Report (2009). Indian apparel market. Vol. 7, No. 1, p. 36.
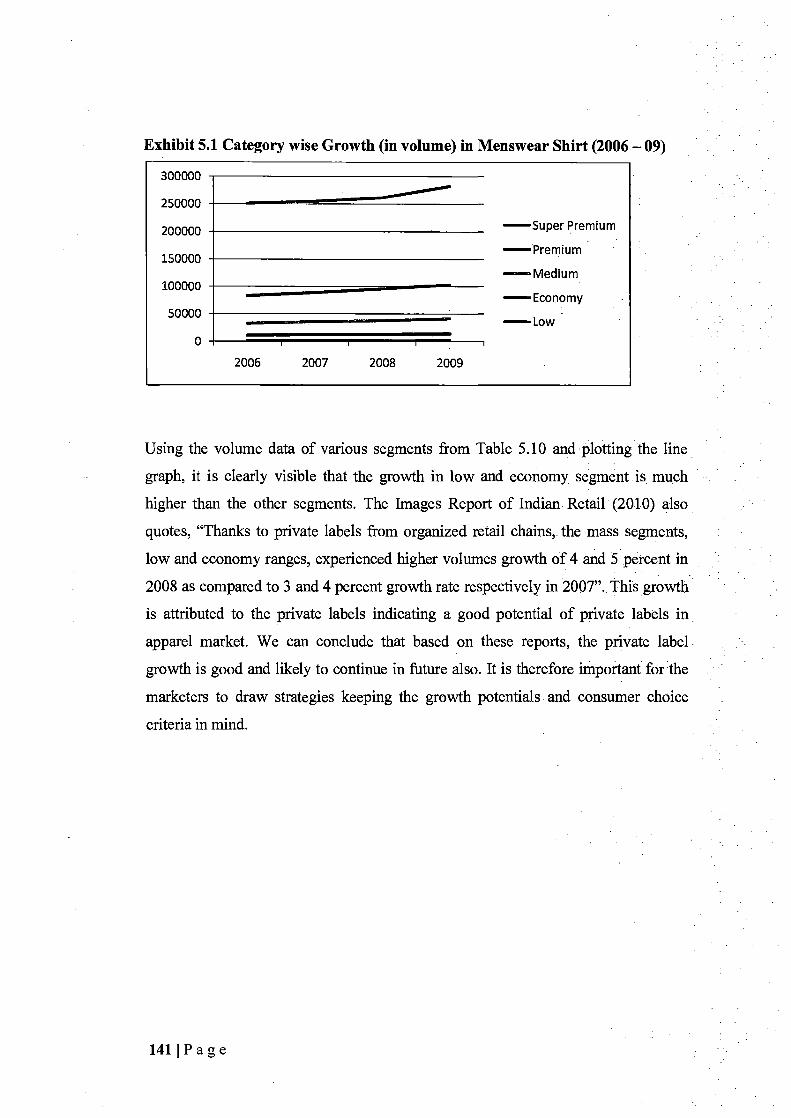
Exhibit 5.1 Category wise Growth (in volume) in Menswear Shirt (2006 — 09)
300000
250000
200000
150000
100000
50000
0
2006 2007 2008 2009
—Super Premium
—Premium
Medium
—Economy
Low
Using the volume data of various segments from Table 5.10 and -plotting the line
graph, it is clearly visible that the growth in low and economy segment . is. much
higher than the other segments. The Images Report of Indian Retail (201.0) also
quotes, "Thanks to private labels from organized retail chains,, the mass segments,
low and economy ranges, experienced higher volumes growth of 4 and 5 .percent in
2008 as compared to 3 and 4 percent growth rate respectively in 2007'.- This growth
is attributed to the private labels indicating a good potential of private labels in
apparel market. We can conclude that based on these reports, the private label
growth is good and likely to continue in future also. It is therefore important for the .
marketers to draw strategies keeping the growth potentials - and consumer choice
criteria in mind.
141IPage

CHAPTER 6 : MANAGERIAL IMPLICATIONS & FUTURE RESEARCH DIRECTIONS 6.1 Introduction 6.2 Perspectives for National Brands and Private Label Brands 6.3 Key Managerial Implications and Recommendations 6.4 Factors Responsible for Brand Evaluation 6.5 Future Research Directions

CHAPTER 6: MANAGERIAL IMPLICATIONS OF THE STUDY
CHAPTER OVERVIEW
This chapter discusses in detail the deductions from the study and then the
managerial implications are presented from the perspectives of national brands and
private brands. A comparison of the findings of the present research is undertaken in
light of previous researchers, thereafter mentioning the recommendation. This
chapter further discusses the directions for future researchers.
6.1 INTRODUCTION
While private labels in retailing has been in the limelight till now, we try to
understand the implications of this study in terms of apparel organized retailing. The
deductions show that one of most important factors viz, price, is not very significant
for consumers. The study also shows the consciousness level of Indian urban
consumers, where image more than demographics seem to dominate a purchase
intention of a shirt, which can be further generalized for branded apparels. The recall
for private labels is definitely on the rise and the quality of private labels in apparels
is also becoming better. With further liberalization by Government to boost retail,
the strategies adopted by National brand managers and those by private label brand
managers have to be different to gain market share in growing market.
The current research establishes the relationship between evaluation of a shirt brand
with change in factors like brand name, price, class of stores and others. More than
demographic segmentation, psychographic segmentation seems to have more
influence on evaluation of a shirt brand. Future researchers should aim towards
removing the limitations of the current research and include more constructs and
employ better research design to improve the generalizability of results.
142 Pa~-~

6.2 PERSPECTIVES FOR NATIONAL BRAND AND PRIVATE LABEL
BRANDS
We can look at the managerial implications from two perspectives. The first will be
for the managers of national brands and the second the managers of private labels.
The effect of the shirt brand not coming out to be significant has a major implication
for national brands. In line with many studies, this shows that the private labels are
no longer considered as the cheap low quality imitations of national brands. They
have become comparable to national brands in many aspects especially the quality.
The differentiation of the brands might become even more difficult with the
proliferation of brands. It therefore becomes important for the national brands to
remain ahead of the competition by demonstrating the finesse of their products. The
apparel shouldn't be of a class but should look like one also.
Available literature demonstrates use of cues in determining quality. Extrinsic cues
are similar for both private label and national brands. It is therefore very important
that the intrinsic cues are differentiated. The major factors which were manipulated
didn't come out to be significant. Price not coming significant has a major
implication for managers of national brand. It shows that the Indian consumers have
now got the capability and willingness to spend. The strategy advocated by
Nirmalya Kumar in 2007 of not lowering the price of national brands is supported
by findings of the present study. In fact, increasing the price might be a better option
because it will also be a differentiation. The class of the store and the percentage of
the private label kept in the store haven't actually affected the results. The Indian
consumers may be unique in this context because it shows stores are considered to
be similar irrespective of the percentage of private labels kept in it. Managers of
national brands, therefore, can decide to be present in all possible organized retail
chains. However, this can be a risky strategy because it might be the dilution of their
exclusivity. However, results strongly indicate that even if the private label
percentage is very low in some store, it still is considered pretty much similar to the
one having a large percentage of national brands. Usage has come out to be
significant factor in the study. National brand managers should indicate special
occasions in their communication for better evaluation and differentiation of their
brands. Since, a lot of internal factors of consumers like usage situation, proximity
143 Page

to private brands, store awareness, etc., have come out to be significant, the national
brand managers need to take them into account.
The managerial implication is that the customer needs to be informed of the
differentiation in a better manner. The more the customer knows about the various
stores, private brands etc. the better he is able to evaluate the brand. The biggest
learning for national brand managers is. the significance of the demographic
variables like income and education and insignificant role of gender. Also,
knowledge about the stores, private labels, and brand consciousness come out to be
significant. These variables can be clubbed as psychographic variables. In fashion, it
was always the image that the consumer wants to create and it seems that income
and education too affect the evaluation of the shirt brands.
Various factors determine store image, such as product mix, pricing, store location,
physical facilities and customer service (Mazursky & Jacoby, 1986). Among these
factors, product mix and customers beliefs about brand assortment quality are
especially important (Simonson, 1999). To many retailers, product mix is the corner
stone for building a unique store image (Sheinin & Wager, 2003). For example,
Victoria's Secret's position as a modern woman's fashion store demands an
extensive assortment of women's lingerie, fashion-inspired clothing, fragrances, and
cosmetics (www.victoriasecret.com); Petsmart's position as a one-stop shop for pet-
related products and services demands a wide range of foods, supplies and
veterinary services for most household pets (www.petsmart.com) and GNC's
devotion "to helping its customers improve their quality of life through nutritional
science" demands a mix of nutritional supplements and health products
(www.gnc.com). Such distinctive product mixes clearly are pivotal to the images of
these specialty stores (Lee & Hyman, 2008).
There is more good news for private labels than the bad ones. Literature reveals that
the consumer attitudes toward private labels is positively related to value
consciousness, smart-shopper self-perceptions, and negatively related to the
propensity to be brand loyal and hold price-quality perceptions (Burton,
Lichtenstein, Netemeyer & Garretson, 1998). The findings of this research indicate
that Indian consumer is a smart-shopper whose self perception too matters. This can
be surmised as the internal factors were overwhelmingly dominating the external
factors. As price sensitivity is also not that much (Kumar & Jan-Benedict, 2007), the
144 Pa«r

private brands managers need to offer value for money, and not necessarily cheap
quality product. As quality is a significant aspect, private labels need to be close to
national brands in quality. They should be better than a minimum acceptable
standard if they can't be of comparable quality with national brands.
6.3 KEY MANAGERIAL IMPLICATIONS AND RECOMMENDATIONS
Store image concerns influence product positioning strategy. In the United States,
the introduction of image-congruent Private Label Brands (PLBs) — such as
appliances for Sears, leisure clothing for Target and fashion apparel for Dillard's —
was meant to reinforce current store image. In contrast, the introduction of image-
incongruent PLBs — such as fashion apparel for Sears and designer home furnishings
for Target — was meant to shift store image in a strategically preferred direction. As
anyone familiar with either scheme or cognitive consistency theory might suspect
image-congruent PLBs are generally successful and image-incongruent PLBs are
often unsuccessful (Hyman, Kopf & Lee, 2010).
Based on the findings, in this context, key managerial implications of this study are
listed below:
Firstly, findings of present research can be of immense help to practitioners
in apparel retail sector as there are very few studies that have attempted to
explore the importance of various factors considered to such depth in the
Indian context.
> The study clearly demonstrates that brands mangers of private labels and
national brands need to embrace different strategies. If national brands are
suffering from proliferation of brands and better quality of private labels, the
private labels are gaining ground because of customers having a lot smart
shopper self perception. This means national brands have to carefully craft
their strategies to negate the threat posed by private labels. Private labels
have a very encouraging response but the competition is getting tough among
private labels also.
The study confirms that significant differences do not exist in the evaluation
of the brands between customers who knew the difference between private
labels and national brands and those who were unaware of the same. This
1451Pag_e

means national brands need to bring this more clearly in their advertising.
The exclusive stores of national brands help this cause but national brand
managers should think again on the strategy of having their brands in
multibrand retail outlets along with private label of the retailer. By being
present with the other national and private labels, they might themselves be
reducing the differentiation between them and the private labels.
The strategy to trust multibrand retailers is inherently flawed. Simply,
because the retailer had very good margins on the private labels as compared
to national brands. The national brand managers need to increase the
differentiation and exclusivity is the key to sustainability in the long run.
The national brand managers also need to be aware of the growing clout of
retailers' bargaining power because of the presence of private labels. The
case of Big Bazaar pulling out Kellogg's cereals from its shelves over a
margin dispute is a glaring example. Therefore, national brand managers
need to carefully find a direct link between the customer and the brand. For
FMCG, the key is to have a very strong distribution channel through
unorganized retail outlets to counter the bargaining power of retailers.
However, in apparel retail this has not been done by national players and
may not be possible also because of the nature of shopping behaviour. Still,
the national brand managers need to find a direct link (may be through web),
and have to make the customer feel special.
The present study indicates that the income and education variables
significantly affect the evaluation of the shirt brands. This can help the brand
managers to give importance to these variables along with psychological
variables in segmenting the markets.
The study envisages customer evaluation of both national as well as private
label shirt brands. Both types of brands need to understand that the usage of
the shirt has significant affects on its evaluation and can be relied upon by
practitioners to streamline their retail business strategy in general and
customer related strategies in particular.
The findings of awareness have implications for both the managers of
national as well as private labels. The national brand managers need not be
1461Pa~~e

unduly perturbed of the private labels. Around 3/4 h̀' of the respondents
named national brands in unaided recalls. This is a very healthy percentage
and indicates that national brands have a very large mind share of customers.
However, even 25 per cent recalling private labels as their first recall can be
a cause for concern in the future. The national brands consider themselves
very high on quality and to maintain their leadership position they may have
to increase the gap between the national brand and private label.
➢ The private brands also can feel happy about the 25 per cent brand recall in
spite of the fact that private labels account for 10-12 per cent of the
organized retail product mix in India (KPMG Report, 2009). Another
interesting fact that emerged was significant increase in the recall of private
labels from first to the third recall. The managers of private labels need to
increase the brand recall even more. The private labels get undue advantage
in the shelf space but are most often not advertised or even if advertised then
at much lower decibels. The private labels, especially the ones who have a
very comparable quality to national brands, have to decrease the gap with
national brands. This can be achieved with appropriate branding and
advertising.
Despite a Private Label Brand (PLB) market share greater than 30 percent, in
a study it was found that German consumers failed to recognize PLBs,
possibly owing to under-investment in PLB packaging and naming. The PLB
Monitor reports that 40 percent of study participants were unable to recall
any PLBs, the most mentioned PLB was REWE's Ja, with 17 percent recall.
The study has implications for Indian marketers. The low awareness is most
likely an artifact of efforts to reduce costs by minimizing marketing
expenditures. Insights from such studies may help in identifying best PLB
related strategies for firms in countries with nascent PLB markets (Hyman,
Kopf & Lee, 2010) like India.
> The present study demonstrates that growth in the apparel industry in India is
very encouraging. For the national brands, it means they need not be too
worried about the threat from private labels. If they maintain their
differentiation (even though many private labels are getting closer in
quality), they have a good potential for growth.
14711'a.}C

The private label managers have an opportunity to take a bigger pie of the
growing apparel market. The trend is also indicative that they may have an
edge over their national brand counterparts. For example, in menswear
apparel segment, the mass segments, low and economy ranges, experienced
higher volumes growth of 4 and 5 percent in 2008 as compared to 3 and 4
percent growth rate respectively in 2007. They will have to follow the
current strategy of being good in quality yet lesser in price as compared to
national brands. This research also indicates that quality is more important
than price.
Thus, the findings of the present study validate a lot of long held beliefs like quality
is more importance than price in apparel retail. However, it also negates certain
beliefs like shirt brands were found to have no significant impact on the evaluation
of shirt.
6.4 FACTORS RESPONSIBLE FOR BRAND EVALUATION
As evidenced by the literature review, research on consumer behaviour regarding the
apparel brands and private labels has grown considerably in the past and has
provided many insights to researchers, practitioners, and policy makers alike. While
this research has made significant contributions towards highlighting the process and
factors responsible for brand evaluation, it has addressed this matter primarily from
a descriptive point of view. As it is evident from the study, a clear relationship
emerges between variables in a causal research design. This is in line with previous
research (Kumar et al., 2007). This research dealt with the private brand potential
issue in an indirect manner. It is understood that sales figures are difficult to get
from most retailers. It's even more difficult to get this breakup in terms of private
label and national brands sales but such a study can throw clear light on the trends
and future potential of private labels.
Exploring the relationship between the shelf space and sale of private labels can be
of great importance. An experimental design related to changing of shelf space and
measuring the effect on sales can provide the private label brand managers a tool to
optimize the shelf space. A relationship between percentage of private labels to
overall product mix and the volume of sales of private labels as a percentage of
148111 a c

overall sales is also a good area of concern. This can give retailers an idea of the
quantum of private labels to keep as a percentage of overall product mix. There will
be decreasing returns to scale as a retailer goes on increasing the percentage of
private labels in his product mix. The right percentages of private labels thus
become very important for the retailer wishing to maximize profits. More
quantitative research can be carried out to measure the performance of private labels
as against the national brands.
Private Label related research on consumers has focused on ascertaining what causes
them to buy Private Label Brands (PLBs) instead of National Brands (NBs). Such
research often probes the demographic and / or psychographic characteristics of
typical PLB users as well as the (intrinsic and extrinsic) product and / or store-
related cues important to buying decisions. Just as previous research scholars have
explored the causes and inter-category differences in the NB price premium, studies
on inter-country differences in PLB usage are needed; for example, the effect of
national culture on PLB market share. Although market concentration is critical to
PLB development, uncertainty, avoidance and high in collectivism seem to favor
credible and consistent brands (Hyman, Kopf & Lee, 2010).
The current research contributes towards understanding the relationship between
evaluation of a shirt brand with the change in factors like brand name of shirts, price,
store class etc. This is a little deviation from the empirical findings reported earlier.
Considering the factors affecting the evaluation of shirt brands, both national as well
as private label managers can draw customer centric strategies. The private labels
following a strategy of giving comparable quality and lower price than national
brands has got affirmation in this research. It is in line with many empirical findings.
The private labels are finding greater acceptance in the society. The customers,
especially, the smart shoppers are more prone to the private labels. This research
also found that the internal factors were affecting the customer more as compared to
the marketing mix factors. The research traditionally has focused more on marketing
mix variables which the marketer changes in order to influence the decision making
of the consumer. In the wake of the above finding, more focused research should be
carried out on the lines of internal factors of the consumers. These factors should be
more targeted towards the psychographic segmentation rather than demographic
ones because we found that demographic factors had lesser influence on the
149 1 c

evaluation of the brands. Thus, the findings of the present research lend credibility to
previous researches on strategies of national brands (Kumar, 2007).
Some national players have tried to reduce the prices or introduced new brands
comparable to the private labels. This strategy may not yield results and may
actually be detrimental to the national brand in the long run. The finding that price
wasn't a significant influence in any analysis and was only significant with
interaction of class is a testimony to this. The customers are no longer price sensitive
and care more for their own evaluation and quality of the products. Research on
price sensitivity in different segments of apparel retail can be carried out. However,
most researches on price have been conducted using either a descriptive or causal
approach. Even in causal approach, research have taken only two price levels, (like
in our case) regular and discounted. A causal research with price being changed
metrically can give a very good idea about the relationship between price and
evaluation of the garment. This research would gain more meaning in the present
context because price — quality relationship hasn't come out very strongly in this
research. Except for one interaction, this relationship wasn't significant in other two
hypotheses.
6.5 FUTURE RESEARCH DIRECTIONS
Though a number of precautions have been taken to increase the reliability of the
present study, yet the researcher feels that there are certain limitations which may be
given due consideration.
> A larger sample and more representative sample needs to be collected for better
generalizability of results.
As the present study was conducted in only Delhi and NCR, data needs to be
collected on a pan India basis possibly employing cluster sampling method.
Cluster sampling is more suited for such studies because otherwise the
respondents can be highly scattered in a random sampling method. For e.g.
Questions like whether the evaluation of the attitude is dependent upon cities (A,
B or C class), states, rural and urban is unanswered in present study. A
comparison between rural and urban may also be interesting because many
organized retailers like Hariyali Kisan etc. are targeting rural consumers.
150

The design used in research is causal. This design has a very high internal
validity but generalization of the results (external validity) is always a question.
Future researches can be conducted using descriptive designs which are more
generalizable.
> The scale used in this research was primarily a borrowed scale used in previous
studies conducted in foreign countries. Although, certain modifications were
done and scale tested for validity and reliability but still the basic scale is that of
the western countries. Future researches can start afresh and adapt exploratory
methods to develop a scale and test it for validity and reliability. Such scale may
be better suited for Indian respondents as it would take into account the mindset
of Indian consumer right from the beginning.
The research was limited to apparels and within apparels only shirt brands.
Literature reveals that a high involvement purchase like shirt is very different
from a low involvement product like soaps. Therefore, the generalization of the
results could be done for high involvement purchase decisions only. However, a
larger canvass study that carefully selects some complex buying items, some
variety seeking items and some habitual buying items may be able to better
decipher the attitude towards private labels.
The research was intended to check behavior but evaluation of the shirt brand
was used as a proxy to the behavioral intention. The real behavior can be very
different from the evaluation through a vignette. Ethnographic studies can be
undertaken recording the behavior of subjects in the real life conditions. A
behavioral study, although very costly, will clearly indicate the buying patterns
and will be most valid to draw correct conclusions.
With new private and foreign players entering the Indian organized retail sector,
the attitude of customers vis-a-vis newer brands needs to be studied.
> Research is needed that examines the national brand strategy of keeping their
brands in multibrand organized retail outlets. It is evident from literature that
retailers have a vested interest in promoting their private labels as against
national brands. Research should focus on issues related to how national brands
should create their exclusivity and be differentiated from private labels.
1511Pa«r

REFERENCES

REFERENCES
A.C. Nielsen (2003). The power of private labels. (Report from www.acnielsen.ca/insightswww.acnielsen.ca/insights)
A.C. Nielsen (2005), The power of private labels. (Report from www.acnielsen.calinsightswww.acnielsen.ea/insiglits)
Aaker, D., Kumar, V. & Day, G. (2006) Marketing Research, Seventh edition, Wiley India, Delhi, 41.
Aaker, David A. (1996), Measuring brand equity across products and markets, California Management Review, 38(3), 102-120.
Aaker, Jennifer L. (1997). Dimensions of Brand Personality. Journal of Marketing Research, 34 (3), 347 — 356.
Abdi, H., Edelman, B., Valentin, D. & Dowling, W. (2009). Experinnentcd Design and Analysis for Psychology, First Edition, Oxford University Press, India, 291.
Agarwal, S. & Teas, R.K. (2001). Perceived Vvalue : Mediating role of perceived risk. Journal of Marketing Theory and Practice, 9 (4), 1 — 14.
Ailawadi, K.L. & Harlam, B.A. (2004). An Empirical empirical analysis of the determinants of Retail Margins: The Role of Store Brand Share. Journal of Marketing, January, 147-165.
Ailawadi, K.L. & Keller, K.1. (2004) Understanding retail branding: Conceptual insights and research priorities, Journal of Retailing, 80 (4): 331 —342.
Ailawadi, Kusum L., Neslin, Scott A. & Gedenk, Karen (2001). Pursuing the value — conscious consumer. Journal of !MIarkethzg, 65 (1), 71 — 89.
Anselmsson, J., Johansson, U., Maranon, A. & Persson, N. (2008). The penetration of retailer brands and the impact on consumer prices — a study based on household expenditures for 35 grocery categories. Journal of Retailing and Consumer Services, 15 (1), 42-51.
Appelbaum, R. & Gereffi, G. (1994). Power and Profits in the Apparel Commodity Chain. In E. Bonacich et al., eds., Global Production: The Apparel Industry in the Pacific Rim. Philadelphia, PA: Temple University Press.
Argo, Jennifer J., Dahl, Darren W., Morales, Andrea, C. (2008). Positive consumer Contaminationcontamination: Responses to attractive others in a retail context. Journal of Marketing Research, 45 (6), 690 — 701.
Ariely, D. & Levan, J. (2000). Sequential Choice choice in group settings. Taking the road less travelled and less enjoyed. Journal of Consumer Research, 27 (3), 279-290.
Arndt, Johan (1967). Role of product related conversations in the diffusion of a new product. Journal of Marketing Research, 4 (3), 291 — 295.
152~..i~.

Ashforth, Blake E., & Mael Fred (1989), Social identity theory and the organization, Academy of Management Review, 14(1), 20-39.
Ashley, S. (1998). How to effectively compete against private label brands? Journal of Advertising Research, 38(1), 75 — 82.
Badrinarayanan, Vishay & Laverie, Debra A. (2011). Brand advocacy and sales effort by retail sales people: aAntecedents and influence of identification with manufacturer's. Journal of Personal Sellings, Sales Management, Vol. XXXI, No. 2, Spring, 123 — 140.
Baker, J., Levy, Michael & Grewal, Dhruv (1992). An experimental approach to making Retail retail Store store environmental decisions. Journal of Retailing, 68 (4), 445 —460.
Balasubrarnanian, S., Raghunathan, R. & Maharaj, V. (2005). Consumers in a multichannel environment : product Product utility, process utility and channel choice. Journal of Interactive Marketing, 19, 12 — 30.
Baltas, G. (1997). Determinants of store brand choice: A behavioral analysis. Journal of Product & Brand Management, 6 (5), 315 — 324.
Bapat, Dhananjay & Panwar, J.S. (2009). Consumer evaluation of brand extensions: An empirical assessment in the indian context. Vision, 13 (2), 47 — 52.
Barbin, Barry J., Darden, William R. & Griffin, Mithc (1994). Work and / or Funfun: Measuring Hedonic hedonic and utilitarian shopping value. Journal of Consumer Research, 20 (4), 644 — 656.
Batra, Rajeev & Sinha, I. (2000), Consumer-level factors moderating the success of private label brands, Journal of Retailing, 76 (2), 175-191.
Bauer, R.A. (1960). Risk taking and information handling in consumer behavior. Harvard University Press, Boston, M.A., 23 — 33.
Baumgartner, H., & Jan-Benedict, Steenkamp, E.M. (1996) Exploratory consumer buying behavior: Conceptualization and Measurementmeasurement. International Journal of Research in Marketing, 13, 121 — 137.
Beaudoin, Pierre, Moore, Mary & Goldsmith, R.E. (2000). Fashion leaders' and followers' attitudes toward buying domestic and imported apparel. Clothing and Textiles Research Journal, 18, 56-64.
Belch, George E., Belch, Michael A. & Villarreal, Angelina (1987). Effects of advertising communications: Review of Research research. in Research in Marketing, J. Sheth Ed. New York: JAI Press, 59 — 117.
Beri, G.C. (2008). Marketing Researchresearch, Fourth edition, Tata McGraw Hill, Delhi, 67-68.
Bharadwaj, V.T., Swaroop, Gautam M. & Vittal, Ireena (2005). Winning the Indian consumer. McKinsey Quarterly, Special Edition, 42 — 51.
153111aac

Bhattacharya, C.B., Rao, H. & Glynn, M.A. (1995). Understanding the Bond bond of Identificationidentification: An Investigation investigation of its correlates among art museum members, Journal of Marketing, 59 (October), 45-57.
Biel, A.I. (1992). How brand image drives brand equity? Journal of Advertising Research 32 (6): 6 —12.
Birtwistle, G., Clarke, I & Freathy, P. (1999). Customer segmentation in fashion retailing: aA conjoint study. Journal of Fashion Marketing & Management, 3 (3), 245 -254.
Bitner, Mary J. (1992). Servicescapes: The impact of physical surrounding on customer and employee, Journal of Marketing, 56 (April), 57-71.
Biyani, Kishore (2007). It happened in India. Rupa & Co., India, 45.
Boconni University et al. (2007). Business Relations relations in the EU clothing chain: From industry to retail and distribution. Brussels: Report for the European Commission, Boconni University Press.
Bolton R.N., Kannan, P.K. & Bramlet, M.D. (2000). Implications of loyalty program membership and service experiences for customer retention and value. Journal of the Academy of Marketing Science, 28, 95 — 108.
Bolton, R.N. & Lemnon, K.N. (1999). A dynamic model of customer's usage of services: usage Usage as an antecedent and consequence of satisfaction. Journal of Marketing Research, Vol. 36, 171 — 186.
Bonachich E., Cheng L., Chinchilla N., Hamilton N. & Ong P., eds. Global Productions productions : The apparel industry in the pacific rim. Philadelphia, PA : Temple University Press, 42 — 62.
Borna, Shaheen, Stearns, J.M., Smith, B.N. & Emamalizadeh, Kian(2008), Retail store image, bonafide occupational qualifications and job discrimination: establishing Establishing the essence of the business for retail organizations. The Marketing Management Journal, Vol. 18, Issue 1,54-62.
Boston Consulting Group (2011). Navigating the New Consumer realities, Consumer Sentiment 2011. (Httphttp://www.bcgperspectives.com/content/ articles/consumper products_retail_navigating_new_consumer—reaIi ties.11tmI) (accessed on Dec. 13, 2011).
Burns, A. & Bush, F. (2007). Marketing Research, Fifth Edition, Pearson Education, Delhi, 467.
Burton, Scot, Lichtensen, D.R., Netemeyer, R.R., & Garretson, A.J. (1998). A scale for measuring attitude toward private label products and an examination of its psychological and behavioral correlates. Journal of the Academy of Marketing Science, 26 (4), 293 — 306.
Business India Intelligence (2005). Spreading their Salessales. Business India, 12 (13), 2.
Calder, Bobby J., Phillips, Lynn W. & Tybout, Alice M. (1981). Designing research for application. Journal of Consumer Research, 8 (2), 197 — 207.
15411 aje

Campbell, Margaret C. & Goodstein, Ronald C. (2001). The moderating effect of perceived risk on consumers' evaluation of product incongruity: Preference For the norm. Journal of Consumer Research, 28 (3), 439 —449.
Campbell, Richard M. Jr., Aiken, Damon & Kent, Aubrey (2004). Beyond birging and corfing: Continuing the exploration of fan behavior, Sport Marketing Quarterly, 13 (2), 151-157.
Cassill, Nancy L. & Drake, Frances Mary (1987). Apparel selection criteria related to female consumers' lifestyle. Clothing & Textiles Research Journal, 6 (1), 20 — 28.
Celmer, Lynn (2011). The ABCs of reaching GenX and GenY with private label'. Private Label Buyer (www.privatelabelbuyer.cozn).
Chaudhuri, Arjun & Holbrook, Morris B. (2001). The chain of effects from brand trust and brand affects to brand performance: The role of brand loyalty. Journal to Marketing, 65 (2), 81 — 93.
Chavadi, C. & Kokatnur, S (2008). Do private brands result in store loyalty. An empirical study in Bangalore. ICFAI Journal of Marketing Management, Vol. 7 (3), 6 -33..
Chawla, D & Sondhi, N. (2011) Research Methodology— Concepts and Cases. First edition, Vikas Publishing House, New Delhi, 31.
Child, Peter N., Heywood, Suzanne & Kliger, Michael (2002). Do retail brands travel? Mckinsey Quarterly, No. 1.
Childers, T., Christopher, L. Carr, Joann Peck, & Carson, Stephen (2001). Hedonic and functional motivations for online retail shopping behavior. Journal of Retailing, 177 (4), 511-535.
Choi, J., Kim, B.K., Chor, L. & Yi, Y. (2006). Variety seeking tendency in choice for others: Interpersonal and intrapersonal causes. Journal of'Consumer Research, 32 (4), 590-595.
Churchill, Jr. & Gilbert, A. (1979). A Paradigm for developing better measures of marketing. Journal of Marketing Research, 16 (1), 64 — 73.
Churchill, Jr. & Iacobucci, D. (2005). Marketing Research — Methodological Foundations, Ninth Edition, Cengage Learning, Delhi, 74.
Churchill, Jr., [acobucci, D. & Israel, D. (2009). Marketing Research — A South Asian Perspective, Cengage Learning, Delhi, 462.
Cohen, Marshal (2007). The power of private label. License Global, 10(7), 24.
Cooper D.R. & Schindler, P.S. (1998). Business Research Methods, Irwin, 6th Edition.
Cordell, Victor V. (1992). Effects of consumer preferences for foreign sourced products. Journal of International Business Studies, 23 (2), 251 — 269.
Corstjens, Marcel & Lal, Rajiv (2000). Building store loyalty through store brands. Journal of Marketing Research, 38 (3), 281 —291.
1551 la c

Cronbach, L.J. (1 951). Coefficient alpha and the internal structure of tests & Psychometrika, 16 (3), 297-334.
Crotty, Michael (1998). The foundations of social research: Meaning and perspective in the research process. Sage Publications (London and Thousand Oaks, California).
CSI Insights Flash (2010). Report: India's fast-growing apparel market. McKinsey & Co.
Cunningham, R.M. (1961). Consumer loyalty to store and brand. Harvard Business Review, 39 : 127 - 137.
d'Astous, Alan & Saint - Louis, Odile (2005). National versus store brand effects on consumer evaluation of a garment. Journal of Fashion Marketing & Management, 9 (3), 305 - 317.
Dawar, Niraj & Parker, Philip (1994). Marketing universals: Consumers' use of brand name, price, physical appearance and retailer. Journal ofMarketing, 58(2), 15 - 81.
De Wulf, K., Odekerken - Sebroder, G., Goederti, F. & Van, Ossel G. (2002). Consumer perception of store brands versus national brands. Journal of Consumer Marketing, 22 (4), 223 - 232.
Deleersnyder, B., Dekimpe, M. G., Jan- Bendict, Steenkamp, E. M. & Koll, O. (2007). Will - Win strategies at discount stores. Journal of Retailing and Consumer Service, 14(5),309-318.
Delvecchio, D.S. (2001). Consumer perceptions of private label quality: The role of product category characteristics and consumer use of heuristics. Journal of Retailing and Consumer Services, 8 (5), 239 - 249.
Dhar, R. & Klaus, W. (2000). Consumer choice between hedonic and functional goods. Journal of Marketing Research, 37 (1), 60 -71.
Dhar, Sanjay K. & Hoch, Stephen J. (1997). Why store brand penetration varies by retailer. McrrketingScience, 16 (3), 208.
Dodds, William B. & Monroe, Kent. B. (1985). The effect of brand and price information on subjective product evaluations. Advances in Consumer Research, 12 (1), 85 -90.
Dodds, William B., Monroe, Kent B. & Grewal, Dhruv (1991). Effects of price, brand and store information on buyers' product evaluations. Journal of Marketing Research, 28 (3), 307-3 19.
Dowling, G.R. (1986). Perceived risk: The concept and its measurement. Psychology and Marketing, 3 (3), 193 -21 0.
Dowling, Grahame R. & Staelin, Richard (1994). A model of perceived risk and intended risk handling activity. Journal of Consumer Research, 21 (1), 119 - 134.
Doyle, Peter & Fenwick, Ian (1974). How store image affects shopping habits in grocery chains. Journal of Retailing, 50 (4), 14- 39.
Dunne, David & Narasimhan C. (1999). The new apparel of private labels. Harvard Business Review, 26.
1561 Pa c

Easwaran, S. & Singh, S. (2006). Marketing research — concepts, practices and cases, Oxford University Press, India, 74-75.
Eckman, M., Damhorst, M. L., & Kandolph, S. J. (1990). Toward a model of the in-store purchase decision process: Consumer use of criteria for evaluating women's apparel. Clothing and Textiles Research Journal, 8, 13-22.
Economic Times (2011, November 25), Hello Walmart, goodbye inertia.
Economic Times (2012, February 06), Private Label label Share share in Private private SegmentSegment.
Feinberg, R.A. Mataorl, L. & Burroughs, W.J. (1992). Clothing and social identity. Clothing and Textiles Research Journal, 1 1 (1), 18 — 23.
Field, Alan M. (2006). Rise of private labels. Gulf Shipper, Vol. 17, Issue 9, 10— 11.
Forsythe, Sandra M. (1991). Effect of private, designer and national brand names on shoppers' perception of apparel quality and price. Clothing and Textiles Research Journal, 9 (2), 1 — 16.
Freedman, D. A. (2005). Statistical models: Theory & practice. Cambridge University Press.
Fromkin, H.L. (1970). Effects of experimentally aroused feelings of indistinctiveness upon valuation of scare and novel experiences. Journal of Personality and Social Psychology: 16: 521 — 529.
Gardner, B.B. & Levy, S.J. (1955). The product and the brand. Harvard Business Review, 33 (2); 33-39.
Gay, L.R. & Diehl, P.L. (1992). Research methods for business and management. Macmillan, New York, 679.
Geumunden, H.G. (1985). Perceived risk and information search: A systematic meta-analysis of the empirical evidence. International Journal of Research in Marketing, 2, 79-100.
Ghosh, P., Tripathi, V., & Kumar A. (2010). Customer expectations of store attributes : A study of organized retail outlets in India. Journal of Retail & Leisure Property, 9(1), 75 — 87.
Goodwin, L. D. (1997). Changing conceptions of measurement validity. Journal of Nursing Education, 36 (March), 102-107.
Gorusch , R. L. (1983). Common factor analysis versus component analysis: Some well and little known facts. Multivariate Behavioral Research, International Journal of Market Research, 23.
Green, Paul E., Tull, Donald S. & Albaum, Gerald (1988). Research for Marketing Decisions. Englewood Cliffs, NJ : Prentice Hall.
Greenberg, Barnett A., Lumpkin, James R. & Bruner, Gordon C. (1982). Opinion leadership and innovativeness in Fashion diffusion. In American Institute of Decision Sciences Proceedings, 240 — 242.
157 Paae
Grewal, D., Krishnan, R., Baker, J. & Borin, N. (1998). The effect of store name, brand name and price discounts on consumers' evaluations and purchase intentions. Journal of Retailing, 74 (3), 331 — 352.
Gronhaug, K., Hem, L. & Lines, R. (2002) Exploring the impact of product category risk and consumer knowledge in brand extensions. Journal of Brand Management, 9 (6), 463 — 476.
Groznik, A. & Sebastian, H. (2010). Supply chain conflict due to store brands: The value of wholesale price commitment in a retail supply chain. Decision Sciences, Vol. 41, No. 2.
Guenzi, P., Johnson, Michael D. & Castaldo, S. (2009). A comprehensive model of customer trust in two retail stores. Journal of Service Management, Vol. 20, No. 3,290-316.
Hair, J., Bush, R. Sc Ortinau, D. (2006). Marketing Research — within a Changing Information Environment. Third Edition, Tata McGraw Hill, Delhi, 340-341
Hakansson, P. (2000). Beyond Private Label — the strategic view on distributor own brands. Doctoral Dissertation. Stockholm School of Economics, Stockholm.
Hartman, Katherine B. & Spiro, Rosann L. (2005). Recapturing store image in customer-based store equity: a construct conceptualization. Journal of Business Research, August, Vol. 58 Issue 8, 1112-1120.
Haubl G. (1996). A cross-national investigation of the effects of country of origin and brand name on the evaluation of a new car. International Marketing Review: 13 (5), 76-97.
Henricks, Mark (1998). Private labeling: Who said the stores would get tired. Apparel Industry, 59 (3), 5 — 20.
Hildebrandt, Lutz (1988). store Store image and the prediction of performance on retailing. Journal of Business Research, 17, 91 — 100,
Hill, Alexander J., Hogg, Margaret K. & Bruce, Margaret (1998). Fashion brand preferences among young consumers. International Journal of Retail cnzd Distrihution Management, 26 (8), 293 — 300.
Hirschman, Elizabeth C. & Holbrook, Morris B. (1982). Hedonic consumption: Emerging Concepts, Methods and Propositions. Journal of Marketing, 46 (3), 92 — 101.
I-loch, Stephen J., & Banerji S. (1993). Why do private labels succeed? Sloan Management Review, 34 (4), 57 — 67.
Holbrook, Morris B. & Hirschman, Elizabeth C. (1982). The Experiential experiential aspects of consumption: Consumer fantasies, feelings and fun. Journal of Consumer Research, 9 (2), 132 — 140.
Hussey, J. & Hussey, R. (1997). Business Research: A Practical Guide for Undergraduates and Postgraduate Students, Macmillan, London.
1581Papc

I-lyman, Michael R., Kopf, Dennis A. & Lee, Dongdae (2010). Review of Literature literature — Future research suggestions : Private Label label brands : Benefits, success factors and future research. Brand Management, Vol. 17(5), 368-389.
Images Year Book (2011), New Delhi.
India Retail Report (2009). Complied by Images, F&R Research, New Delhi.
Jacoby, J. & Mazursky, D. (1984) Linking brand and retailer images — Do the potential risks outweigh the potential benefits? Journal of Retailing 60 (2), l 05 — 122.
Jaffe E.D. & Martinez C.R.(1995). Mexican consumer attitudes towards domestic and foreign made products. Journal of International Consumer Marketing, 7(3); 7 -27.
Jain, Arun K. & Etgar, Michael (1976). Measuring store image through multi-dimensional scaling of free response data. Journal of Retailing, 52 (4), 12 — 61.
James, Don L., Durand, Richard M., & Drives, Robert A. (1976). The use of a multi-attribute attitude model in a store image study. Journal of Retailing, 52 (2), 23 -32.
Jan-Benedict, Steenkamp E.M., & Baumgartner, H. (1995). Development and Crosscross-cultural validation of a short form of CSI as a measure of optimum stimulation level. International Journal of Research in Marketing, 12, 97 — 104.
Jan-Benedict, Steenkamp, E.M., & Dekimpe, M.G. (1997). The increment power of store brands, longe range planning, 6, 917— 930.
Jihun, Kim & Hyun-Hwa, Lee. (2008). Consumer product search and purchase behavior using various retail channels: The role of perceived retail usefulness. International Journal of Consumer Studies, 32, 619-627.
Juhl, H.J., Esbjerg, L., Grunert, K.G. Bech-Larsen, T. & Brunso, K. (2006). The Fight fight between store brands and national brands — what's the score? Journal of Retailing and Consumer service, 13(5), 331 — 330.
Kaiser, S.B. (1990). The Social Psychology of Clothing. Macmillan: New York, 2e.
Kapoor, A. & Kulshreshtha, C. (2010). Marketing Research. Excel Books, Delhi, 30.
Kaushik, M. (2004). Will the fizz last? Business Today.
Keller, K.L. (2003). Building, Measuring and Managing Brand Equity. Prentice 1-fall, Upper Saddle River (N), 2°d edition.
Kempf, DeAnna S. (1999). Attitude formation from Product Trial: Distinct roles of cognition and affect for hedonic and functional products. Psychology and Marketing, 16 (1), 35-50.
Kent, Robert J. & Allen, Chris T. (1994). Competitive interference effects in consumer memory for advertising, Journal of Marketing, 58(3), 97.
Keppel, Geoffrey & Wickens, Thomas D. (2004). Design and Analysis: A Research Handbook, Englewood Cliffs, NJ : Prentice-Hall, 4e, ISBN] 0:0135159415.
159 Pa_c

Kinra, Neelam (2006). The effect of country of origin on foreign brand names in the indian market, Marketing Intelligence & Planning, Vol. 24 (1), 15 — 30.
Kotler, Phillip, Keller, Lane Kevin, Koshy, Abraham, Jha, Mithileswar (2008). Marketing Management: A South Asian Perspective, Pearson Education, 13e.
KPMG Report (2009). India Retail - Time to Change Lanes, IMF, Cushman & Wakefield Report.
Kron, J. (1983). The Social Psychology of Home and Decoration. Potter: New York.
Kumar, Archana, Lee, Hyun-Joo & Kim, Yong-kyung (2010). Indian Consumers' Purchase intention towards United States Vs. Local Brand. Journal of Business Research, Vol. 62, Pgp. 522.
Kumar, Archana, Lee, Hyun-Joo & Kim, Yong-kyung, (2010). Indian consumers' brand equity towards a us and local apparel brand. Journal of Business Research, 62, 522-530.
Kumar, Nirmalaya & Jan—Benedict Steenkamp, E.M.(2007). Private Label Strategy. Harvard Business School Publishing.
Kunkel, J.H. & Berry, L.L. (1968). A behavioral conception of Retail retail image, Journal of Marketing, 32(Oct.), 21 — 27.
Labeaga, J.M., Lado, N. & Martos, N. (2007). Behavioral loyalty towards store brands. Journal of Retailing and Consumer Services, 14 (5), 347 —356.
Lee, Dongdae & Hyman, Michael R.(2008). Hedonic / functional congruity between stores and private label brands. Journal of Marketing Theory and Practice, Vol. 16, No. 3, Summer, 219-232.
Lee, H.H. & Kim, J. (2008). The effect of shopping orientation on consumer satisfaction toward information search and purchasing behavior in multi-channel environment, Journal of Fashion Marketing and Management, 12 (1), 37-40.
Legwear Trends & Fashions (2003). Private label versus national brands: are proprietary brands the key to consumer apparel dollars? Legwear Trends and Fashions, 45 (2), (from: www.legsource.eorn/wtf feb2003/index.htm)
Leopold, E. & Fine, B. (1993). The World of Consumption. London : Routeledge.
Leuba, C. (1955). Toward some integration of learning theories: the concept of optimal stimulation. Psychological Reports (1), 27-33.
Leung, V. & Oppewal, H. (1999) Effects of brand and store names on consumer store choice, (from: htip://smib.vuw.ac.nzhttp://smib.vuw.ac.nz 8081/www/ANZMAC 1999/site/L/Leung.pdO
Li, Wai-Kwang & Moore, Kent B. (1994). The effects of country of origin, brand and price information: a cognitive — affective model of buying intentions. Advances in Consumer Research, 21 (1), 449 — 457.
160113 a`jc

Liljander, V., Polsa, P. & Van Riel, Allard (2009). Modelling consumer responses to an apparel store brand : store image as a risk reducer. Journal of Retailing and Consumer Services, 10 (16), 1 — 10.
Lindquist, J.D. (1979). Meaning of Image, a survey of empirical and hypothetical evidence. Journal of Retailing, 50 (4), 29 —38.
Lisant L., Toni (2002). Retailer too needs to build a brand image. Drug Store Netiwws, June 17, 27.
Liu, T.C., & Wang, C.Y. (2008). Factors affecting attitudes towards private labels and promoted brands. Journal of Marketing Management. 24(3-4), 283-298.
Louviere, J.J. & Johnson, R.D. (1999) Reliability and validity of the brand anchored conjoint approach to measuring retailer images. Journal of Retailing 66 (4): 359 —382.
Luck, D. & Rubin, R. (2010). Marketing Research, Seventh Edition, Prentice Hall of India, Delhi, 100.
Mael, F. & Ashforth B.E. (1992). Alumni and their Alma Mater: A partial test of the Reformulated Model of Organizational Identification. Journal of Organizational Behaviour, 13 (2), 103 — 123.
Malhotra, Naresh K. (2005). Basic Marketing Research: A Decision Making Approach. Prentice Hall, New Delhi, 2e.
Malviya, S. (2012). Private labels owned by retailers such as Bharti Retail, Future Group outsell national brands in own stores. The Economic Times, February 06, New Delhi.
Mano, Haim & Oliver, Richard I. (1993). Assessing the dimensionality and structure of the consumption experience: Evaluation, feeling and satisfaction. Journal of Consumer Research, 20 (3), 451-466.
Martineau, Pierre (1958). The personality of the retail store. Harvard Business Review, 36 (1), 47 — 55.
Mason, Sara (2011). Joining the innovation game: The changed nature of private label, GCI Magazine, May.
Mazursky, David & Jacoby, Jacob (1986). Exploring the development of store images, Journal of Retailing, 62 (2), 145 — 165.
McAlister, L. & Pessemier, E. (1982). Variety seeking behavior: An interdisciplinary review. Journal of Customer Research, 9 (3), 31 1 — 322.
McAlister, L. (1982). A dynamic attribute satiation model of variety seeking behavior. Journal of Consumer Research, 9, 141 — 150.
McConnell, J. Douglas (1968). The Development development of Brand brand Loyaltyloyalty: An Experimental experimental Studystudy. Journal of Marketing Research, 5 (1), 13 — 19.
161IPa-c

McDaniel, C. and Gates, R. (2011). Marketing Research. Eighth Edition, Wiley Publications, Delhi, Pg 309-10.
Meder, C. & Robert, C. (2001). Changes in the global insurance market. Insurance chronicleChronicle, 23(August), 26-28.
Mendez, J.L., Oubina, J. & Rubio, N. (2008). Expert quality evaluation and price of store vs. manufacturer brands: aAn analysis of the Spanish mass market. Journal of Retailing and Consumer Services, 15 (3), 144 - 155.
Menon, Sharif S. (2006). Garment lifestyle retailing stores vis-a-vis impact of private labels - a paradigm shift, The ICFAI Journal of Marketing Management, Vol. No. 3.
Mitchell, V.W. (2001). Re-conceptualizing consumer store image processing using perceived risk. Journal of Consumer Research, 54 (2), 167 - 172.
Mittal, K.C. & Prashar A. (2010). A Study of diversity in retail purchase behavior in food and grocery in Punjab: An aid to formulate retail strategy by Vision - The Journal of Business Perspective, Vol. 14, No. 4, October - December.
Monroe, Kent B. (1976). The influence of price differences and brand familiarity on brand preferences. Journal of Consumer Research, 3(1), 42 - 49.
Moore, C.M. (1995). From rage to riches - creating and benefit from the fashion own-brand. Journal of Retail and Distribution Management, 23 (9), 19 - 27.
Morgan, R.M. & Hunt, S. (1994), "The commitment trust theory of relationship marketing", Journal of Marketing, Vol. 58, 20 - 38.
Morgansky, M.A. (1990). Store and brand type influences on the perception of apparel quality: A congruity theory approach. Clothing and Textiles Research Journal, 9(1),45-49.
Morton, Fiona S. & Zeltelmyer, Florian (2000). The strategic positioning of store brands in retailer - Manufacturer Bargainingbargaining. Working Paper 7712, National Bureau of Economic Research, Cambridge, MA.
Narasiinhan, C. & Wilcox, R.T. (1998). Private labels and the channel relationship : A cross category analysis. Journal of Business, 71 (4), 573 - 600.
NDP Group (2003). Private label apparel sales up in a down market. NDP Report, (From www.npd.com/dynamic/releases/press 030708.htrn)
Nijssen, E., Singh, J., Sirdeshmukh, D. and Holzmuller, H. (2003). Investigating Industry context effects on customer firm relationships: preliminary Preliminary results from a dispositional approach. Journal of the Academy of Marketing Science, Vol. 31, 46-60.
Noreen, O'Leary (2007). New and imported private label brands. Ac/week, Vol. 48, Issue 38.
Nunally, J.C. (1978). Psychometric Theory, McGraw-1-fill, New York, 2e.
Okada, Erica Mina (2005). Justification effects on consumer choice of hedonic and utilitarian goods. Journal of Marketing Research, 42 (1), 43 -53.
1621PagL'

Osman, M.Z. (1993). A Conceptual Model model of retail image influences on loyalty patronage behavior. The International Review of Retail, Distribution and Consumer Research, 31, 146-149.
Pandya, Amit R. & Joshi, Monarch A. (2011). A Comparative comparative study on consumers' attitude towards private labels. A special focus on Ahmedabad and Surat, 2011. The IUP Journal of Brand Management, Vol. III, No. 1 Pg. 36 -47.
Paxton, J. Gregan & John, Deborah R. (1995). Are children adaptive decision — makers? A study of age differences in information search behavior", Journal of Consumer Research (21), March 04, 567 — 580.
Percy, Larry & Rossiter, John R. (1992), Advertising Sstimulus Eeffects: A Reviewreview. Journal of Current Issues and Research in Advertising, 14 (Spring), 75 — 90.
Peter, J.P. & Ryan, M.J. (1976). An investigation of perceived risk at the brand level. .Journal of Marketing Research, 13 (2), 184 — 188.
Petty, Richard E., Cacioppo, John T., & Schumann, David (1983), Central and peripheral router to advertising effectiveness: Tthe moderating role of involvement. Journal of Consumer Research, 10 (2), 135 — 146.
Polegato, R. & Wall, M. (1980). Information seeking by fashion opinion leaders and followers. Home Economics Research Journal, 8 (5), 327 —338.
Quelch, John A. & Harding, David (1996). Brands versus Private private Labelslabels: Fighting to win. Harvard Business Review, 74 (1), 99 — 109.
Rajagopal (2008). Point of Sales sales promotion and buying stimulation in retail stores. Database Marketing and Customer Strategy Management, Vol. 15, 4, 249 -266, Palgrave Macmillan.
Raju, Jarnohan S., Raj, Sethuravam & Sanjay, K. Dhar (1995). The Introduction and Performance performance of Store store Brandsbrands. Management Science, 241 (6), 5.
Rao, Akshay R. & Monroe, Kent B. (1989). The effect of price, brand name and store name on buyers' perceptions of product quality — an An integrative review. Journal of Marketing Research, 26 (3), 351 — 357.
Reinecke, Gerhard (2010. Upgrading or decline? globalization, retail structure and labour in the Cchilean textile and clothing industry. Competition and Change, Vol. 14 (1), March, 23-47.
Remenyi, D., Williams, B., Money, A. & Swartz, E. (1998). Doing Research in Business & Management: An Introduction to Process & Method. London: Sage Publications.
Richardson, Paul S. & Jain, Arun K. (1996). Household store brand proneness. Journal of Retailing, 72 (2), 159— 185.
Richardson, Paul S., Dick, Alan S. & Jain, Arun K.(1994). Extrinsic and Intrinsic intrinsic cue effects on perceptions of store brand quality. Journal of Marketing, 58 (4), 9-28.
1631Pag'
Richins, Marsh L. (1997). Measuring emotions in the consumption experience. Journal of Consumer Research, 24 (2), 127 — 146.
Roper, S. & Parker, Cathy (2006). Evolution of Branding branding Theory theory and its relevance to the independent Retail Sector. The Marketing Review, 6, 155 -171.
Rosenthal, R. & Rosnow, R. L. (1984). Applying Hamlet's question to the ethical conduct of research. American Psychologist, 39, 561-563.
Roy, Abhik (1994). Correlates of Mall mall visit frequency. Journal of Retailing, 70 (2), 139— 161.
Ryan, Thomas J. (2003). Private Labelslabels: Strong, strategic & growing. Apparel Magazine, 44 (10), 7-32.
Ryan, Thomas J. (2004). The right mix: brands Brands vs. private labels. Apparel Magazine, 45 (6), 30-33.
Salmon, Walter J. & Cmar, Karen A. (1987). Private Labels are back in fashion. Harvard Business Review, 65 (3), 99 — 106.
Salmon, Walter J., Bell, David E., & Lal, Rajiv (2004). The Global Market: Developing a Strategy to Manage across borders. Edited by John A. Quelch and Rohit Deshpande, San Francisco, California : Jossey. Bass.
Sasinandini, S. & Lysander, M.H. (2010). Apparel private label brands and store patronage. Advances in Management, Vol. 3 (6), June, 33 — 40.
Sayman, Serdar, Hoch, Stephen J. & Raju, Jagmohan S. (2002). Positioning of Store store Brandsbrands. Marketing Science 21 (4), 378 — 397.
Schiffman, L.G. & Kanuk, L.L. (2007), Consumer Behavior, 9th Ninth edition, Upper Saddle River, N.J.: Pearson Prentice Hall.
Schrank, H.L., & Gilmore, L. (1973). Correlates of Fashion fashion Leadershipleadership: Implications for Fashion fashion Process process Theorytheory. The Sociological Quarterly, 14 (4), 534 — 543.
Schutte, T.F. (1969). The sensation of branding, Journal of Marketing, Vol. 33, pp. 5 — 11.
Scott — Morton, Fiona & Florian, Zettelmeyer (2001). The strategic positioning of store brands in retailer — manufacturer negotiations. Working paper (From http://faculty.liaas.berkelay.edu/florian/)
Secoeijn, J., Van Riel, A.C.R. & Ambrosini, A.B. (2004). Consumer evaluations of store brands: Effects of Store Image and Product attributes, 1 1 (4), 247 — 258.
Sethuraman, R. (2003). Measuring national brands' equity over store brands. Review of Marketing Science, 1 (1), Article 2.
Sethuraman, Raj & Cole, Catterine (1999). Factors influencing the price premiums that consumers pay for national brands over store brands. Journal of Product and Brand Management, 8 (4), 340 — 351.
164IPa a

Sharma, Piyush, Bharadwaj, Sivakumaran & Roger, Marshall (2010). Exploring impulse buying and variety seeking by retail shoppers toward a common conceptual framework. Journal of Marketing Management, Vol. 26, May, 5 — 6.
Sheinin, Daniel A., & Wager, Janet (2003). Pricing store brands across categories and retailers. Journal of Product and Brand Management, 12 (4), 201 — 219.
Shim, Soyeon & Gehrt, Kenneth C. (1996). Hispanic and Native American adolescents: An Exploratory Study of their Approach to shopping. Journal of Retailing, 72 (3), 307-324.
Shim, Soyeon, Morris, Nancy J. & Morgan, George A. (1989). Attitudes toward imported and domestic apparel among college students: The Fishbein model and external variables. Clothing and Textiles Research Journal, 7 (4), 8 — 18.
Shimp, Terence A. & Bearden, William 0. (1982). Warranty and other extrinsic cue effects on Consumers, Journal of Research, 9 (1), 38 — 46.
Shimp, Terence A. & Sharma, Subhash (1987). Consumer ethnocentrism: construction and validation of the CETSCALE. Journal of Marketing Research, 24 (3), 280 -289.
Sierra, Jeremy J., Heiser, Robers S., Williams, Jerome D. & Taute, Harry A. (2010). Consumer racial profiling in retail environments: A longitudinal analysis of the impact on brand image, Brand Management, Vol. 18, 1, 79 — 96, Macmillan Publishers Ltd.
Simonson, Itamar (1999). The Effect of product assortment on buyer preference. Journal of Retailing, 75 (3), 347-370.
Sinha, L. & Batra, R. (1999). The effect of consumer price consciousness on private label purchase. International Journal of Research in Marketing, 16 (3), 237 — 251.
Sinha, Piyush Kumar (2003). Shopping orientation in the evolving indian market. Vikalpa, 28 (2), 13-22,
Sirohi, N., Mcalughlin, E.W., & Wittink, D.R. (1998). A model consumer perception and store loyalty intentions for a supermarket retailer, Journal of Retailing, Vol. 74, 223-245.
Stone, R.N. & Gronhaug, K. (1993). Perceived Risk risk : Further consideration for the marketing discipline. European Journal of Marketing, 27 (3), 39 — 50.
Summers, Teresa A., Belleau, Bonnie D. & Wozniak, Patricia J. (1992). Fashion and shopping perceptions, demographics and store patronage. Clothing and Textiles Research Journal, 11(1), 83-91.
Sweeney, Jillian C. & Soutar, Geoffrey N. (2001). Consumer perceived value: The development of a multiple item scale. Journal of Retailing, 77 (2), 203.
Sweeney, Jillian C., Soutar, Geoffrey N. & Johnson, Lester W. (1999). The role of perceived risk in the quality — value relationship. : a A study in retail environment. Journal of Retailing, 75 (1), 5 — 6.
165 1 P- agc

Szybillo, G.J. & Jacoby, J. (1974). Intrinsic versus E-extrinsic cues as determinant of perceived product quality. Journal of Applied Psychology, 59 (1), 74-78.
Tabachnick, B. G. & Fidell, L.S. (1996). Using Multivariate Statistics. Harper-Collins, New York.
Taifel, Henri & Turner, John C. (1985). The Social Identity Theory of Intergroup Behavior, Psychology of Intergroup Relations, Steven Worchel & William G. Austin, Eds., Chicago, Nelson Hall, 6-24.
Ticehurst, G. W. & Veal, A. J. (2000). Business Research Methods: A Managerial Approach. Longman, Pearson Education Pty Limited.
Tien, Kelly Tepper, Bearden, William O. & Hunter, Gary L. (2001), Consumers' need for uniqueness : Scale development and validation. Journal of Consumer Research, 9(2),123-131.
Times of India (2011). It is time for states to ensure FDI in multi-brand retail. New Delhi Edition, 25 x̀' November, 26.
Tsung-Chi, Liu & Chung — Yu, Wang (2008). Factors affecting attitudes towards Private Labels. Journal of Marketing Management, 24 (3/4), 283 — 298.
Turnbull, P.W. & Wilson, D.T. (1989). Developing and Protecting protecting profitable customer relationship. Industrial Marketing Management, 18 (August), 233 -238.
Vackie, A. & Paswan, A. (2006). Private Label brand image: Iits relationship with store image and national brand. International Journal of Retail and Distribution Management, 34 (1), 67 — 84.
Van Riel, A.C.R., Lemmink, J. & Ouwersloot, H. (2001). Consumer evaluations of brand extensions: differences between goods and services. Journal of Service Research, 3 (3), 220 —23 1.
Veal, A.J. (2005). Business Research Methods: A Managerial Approach. Pearson : Addison Wesley.
Vellis, R. (1991). Marketing Research : Planning and Design. New Jersey: Prentice Hall.
Viera, Valter (2004). Conquering consumers pace: Marketing Strategies strategies for a Branded branded Worldworld. Journal of Consumer Behavior, 4 (2), 152 — 153.
Visser, E., Preez, R. & Norswy, K.H. (2006). Importance of apparel store image attributes: Perceptions of female consumers. South African Journal of Industrial Psychology 32 (3), 49 — 62.
Voss, Kevin E., Spangenberg, E.R., & Grohmann, B. (2003). Measuring the hedonic and functional dimensions of consumer attitude. Journal of Marketing Research, 40 (3), 310-320.
Vrechopoulos, Adam P., O'keefe, R.M., Doukidids, G.1., & Siomkos, G.J. (2004), Virtual Store layout: An experimental comparison in the context of grocery retail. Journal of Retailing, 80 (1), 13 — 22.
166 I 1' a``t•

Wakefield, Kirk L. & Julie, Baker (1998), Excitement at the mall: Ddeterminants and effects on shopping response. Journal of Retailing, 74 (4), 515-539.
Wakefield, Kirk L., & James, H. Barnes (1996). Retailing Hhedonic consumption: a model of sales promotion of a leisure service. Journal of Retailing, 72 (4), 409-427.
Ward, J., Loken, B., Ross, 1. & Hasapopoulos, T. (1986). The influence of physical similarity on generalization of affect and attribute perceptions from national brands to private brands. AMA's Educators Proceedings, American Marketing Association, Chicago, II.
Wells, William D. & Prensky, David (1996). Consumer Behavior. Wiley, ISBN-10:0471596418
Zaichkowsky, Judith Lynne (1985). Measuring the involvement construct. Journal of Consumer Research, 12 (3), 341 — 352.
Zajonc, Robert B. & Markus, Hazel (1982). Affective and cognitive factors in preferences. Journal of Consumer Research, 9 (2), 123 — 131.
Zeithaml, V.A., Berry, L.L. & Parasuraman, A. (1996). The behavioral consequences of service quality, Journal of Marketing, 60, 31 — 46.
Zeithaml, Valarie A (1988). Consumer perceptions of price, quality and value: A means — end model and synthesis of evidence. Journal of Marketing, 52 (3), 2 — 22.
Zigmund, W. & Babin, B. (2007). Essentials of Marketing Research, 3 d̀ Third Edition, Cengage Learning, India, 398.
Zigmund, W. G.(1995). Business Research Methods. (5th Edition)Fifth Edition.Port Worth,TX : The Dryden Press.
Zimmer, Mary R. & Golden, Linda L. (1988) Impressions of Retail retail Stores: A content analysis of consumer images, Journal of Retailing, 64 (3), 265.
Websites Referred
Economic Times : (www.economictimes,indiatimes.coni) llttp://www.authorstream.com/presentation/hatterdude-1 19694-private-label-dr-gaur-hit.
Private Label Manufacturers' Association (PLMA), available at (www.gclmagazine.com)
Private Label Manufacturers' Association (PLMA), available at http://www.plmainternational.cons/plt/wpl_web_2k5_PLTen.html (accessed on Nov. 14, 2010).
Store Brands Achieving New Heights of Consumer Accessed September 15, llttp://plena.com/storebrands/sbtO9.htnl l
www.authorstream.com www.fibre2fashion.conl www.victoriasecret.com www. pets mart. corn WWw.gllc.colll
Popularity and Growth (2009). 2009. Available at
167 1-1aga

APPENDIX Appendix 1: Questionnaire Appendix 2 : Result of Hypothesis Testing

APPENDIX — 1
Name of Respondent: j Age
( Address:
1 STATE 1 PIN: I I I I Fixed Phone (Office): STD Code: Office Fax Mobile No.
Interviewer: Date of the interview:
Quality Check: Accompanied Back Scrutinized checked
Supervisor (initials) I 1 Field Executive/ Regional Field Head I I1
Dear Customer,
Kindly allow us five minutes to get your responses against the questions mentioned below. Your valued responses will help us in our research on apparel retailing. The study is purely academic in nature.
1. Kindly name a few lifestyle stores that you have visited in recent times. A. B. C.
2. Kindly name a few brand names of shirts that you know. A. B. C.
3. Kindly name a few brand names of shirts that you have purchased. A. B. C.
4. Do you know the difference of national brand and store brand? (Aided question with names of two national and store brands prompted). Yes. No.
(If respondent is ignorant of all the above, then the balance is not administered)
5. The brands of Louis Phillipe / Peter England / Arrow / Zodiac are Unfamiliar to me 0 L fl 0 0 Familiar to me
1 2 3 4 5 Not worn by me Worn by me
1 2 3 4 5 No knowledge Knowledgeable
1 2 3 4 5
168 Pau.e

6. The brands of Stop / First Class / Westside / Knighthood are: Unfamiliar to me 0 0 = 0 0 Familiar to me
1 2 3 4 5 Not worn by me = 0 = 0 0 Worn by me
1 2 3 4 5 No knowledge 0 L 0 0 0 Knowledgeable
1 2 3 4 5
7. The Stores of Shoppers' Stop / Big Bazaar / Reliance Retail / Westside are: Unfamiliar to me 0 = 0 0 L Familiar to me
1 2 3 4 5 Have not purchased from 0 = = 0 = Have purchased from
these stores 1 2 3 4 5 these stores No knowledge 0 0 0 0 0 Knowledgeable
1 2 3 4 5
8. Shopping for me is Unimportant 0 0 Important
1 2 3 4 5 Irrelevant Activity 0 E [ E 0 Relevant Activity
1 2 3 4 5 Low Involvement = 0 El El [l High Involvement
1 2 3 4 5
9. I am very interested in fashion. Totally Disagree El 0 0 El 0 Totally Agree
1 2 3 4 5
10. I keep myself up to date on latest fashion trends. Totally Disagree 0 El 0 El 0 Totally Agree
1 2 3 4 5
11. My peers consider me fashionable Totally Disagree 0 0 0 El 0 Totally Agree
1 2 3 4 5
12. When making a purchase, I always pay attention to the brand. Not at all L [1111 0 L El Always
1 2 3 4 5
13. The Brand name of a garment is a very important information to me Not at all El El El 0 El Always
1 23 4 5
14. In general, a garments' brand tells a lot about its quality. Totally Disagree 0 [l El 0 0 Totally Agree
1 2 3 4 5
169IPaL,c

15. Assume you are looking for a 100% cotton shirt to wear everyday at home. You visit an upper class Shopper's Stop store where you find a shirt whose style, cut, fit and materials please you. This 100% cotton white shirt is sold at a regular price. It is a shirt carrying the Louis Phillipe brand. • It is a good quality shirt
Totally Disagree = 0 0 LI 0 Totally Agree 1 2 3 4 5
• It is a shirt which makes me think I'm etti my money's worth Totally Disagree 0 = 0 = " 'Totally Agree
1 2 3 4 5
• It is a shirt that I would buy Totally Disagree = 0 0 LI 0 Totally Agree
1 2 3 4 5
• It is a shirt I would like to wear Totally Disagree LI LI 0 0 0 Totally Agree
1 2 3 4 5
• It is a shirt which should make a d im ression. = [~ 0 Totally Agree Totally Disagree = 0
1 2 3 4 5
16. Assume you are looking for a 100% cotton shirt to wear everyday at home. You visit a middle class Reliance Retail store where you find a shirt whose style, cut, fit and materials please you. This 100% cotton white shirt is sold at a regular price. It is a shirt carrying the Peter England brand.
• It is a good quality shirt Totally Disagree 0 0 0 0 [II] Totally Agree
1 2 3 4 5
• It is a shirt which makes me think I'mettin my money's worth Totally Disagree LI 0 L F9 Totally Agree
1 2 3 4 5
• It is a shirt that I would buy Totally Disagree 0 0 LI 0 LI Totally Agree
1 2 3 4 5
• It is a shirt I would like to wear Totally Disagree LI LI 0 0 LI Totally Agree
1 2 3 4 5
e It is a shirt which should make a ood im ression. Totally Disagree LI L [ LI Totally Agree
1 2 3 4 5
170IPaa

17. Assume you are looking for a 100% cotton shirt to wear everyday at home. You visit a upper class Westside store where you find a shirt whose style, cut, fit and materials please you. This 100% cotton white shirt is sold at a regular price. It is a shirt carrying the Arrow brand.
• It is a good quality shirt Totally Disagree 0 = = 0 0 Totally Agree
1 2 3 4 5
• It is a shirt which makes me think I'm ettin my money's worth Totally Disagree 0 = = ]] Totally Agree
1 2 3 4 5
• It is a shirt that I would buy Totally Disagree 0 = 0 0 0 Totally Agree
1 2 3 4 5
• It is a shirt I would like to wear Totally Disagree = = 0 = 0 Totally Agree
1 2 3 4 5
• It is a shirt which should make a ood imression. [~ = Totally Agree Totally Disagree 0]
1 2 3 4 5
18. Assume you are looking for a 100% cotton shirt to wear everyday at home. You visit a tipper class Shopper's Stop store where you find a shirt whose style, cut, fit and materials please you. This 100% cotton white shirt is sold at a discount price. It is a shirt carrying the Louis Phillipe brand.
• It is a good quality shirt Totally Disagree 0 0 0 0 0 Totally Agree
1 2 3 4 5
• It is a shirt which makes me think I'metti my money's worth Totally Disagree = 0 0 = " Totally Agree
1 2 3 4 5
• It is a shirt that I would buy Totally Disagree = 0 0 = 0 Totally Agree
1 2 3 4 5
o It is a shirt I would like to wear Totally Disagree = = 0 0 = Totally Agree
1 2 3 4 5
e It is a shirt which should make a ood im cession. Totally Disagree 0 0 Totally Agree
1 2 3 4 5
1711Pa`_c

19. Assume you are looking for a 100% cotton shirt to wear everyday at home. You visit a upper class Shopper's Stop store where you find a shirt whose style, cut, fit and materials please you. This 100% cotton white shirt is sold at a regular price. It is a shirt carrying the STOP brand.
• It is a good quality shirt Totally Disagree = = 0 0 0 Totally Agree
1 2 3 4 5
• It is a shirt which makes me think I'm ettin my money's worth Totally Disagree Totally Agree
1 2 3 4 5 • It is a shirt that I would buy
Totally Disagree Totally Agree 1 2 3 4 5
• It is a shirt I would like to wear Totally Disagree f = 0 0 0 Totally Agree
1 2 3 4 5
o It is a shirt which should make a ood im cession. Totally Disagree 0 0 Totally Agree
1 2 3 4 5
20. Assume you are looking for a 100% cotton shirt to wear everyday at home. You visit a middle class Big Bazaar store where you find a shirt whose style, cut, fit and materials please you. This 100% cotton white shirt is sold at a regular price. It is a shirt carrying the Zodiac brand.
• It is a good quality shirt Totally Disagree = 0 L 0 0 Totally Agree
1 2 3 4 5
• It is a shirt which makes me think I'm ettin my money's worth Totally Disagree = = 0] Totally Agree
1 2 3 4 5 ® It is a shirt that I would buy Totally Disagree 0 = = = = Totally Agree
1 2 3 4 5
• It is a shirt I would like to wear Totally Disagree = 0 0 f 0 Totally Agree
1 2 3 4 5
e It is a shirt which should make aood im ression. Totally Disagree 0 0 L] [7 0 Totally Agree
1 2 3 4 5
1721Pa5,c

21
Assume you are looking for a 100% cotton shirt to wear everyday at home. You visit a upper class Westside store where you find a shirt whose style, cut, fit and materials please you. This 100% cotton white shirt is sold at a discount price. It is a shirt cal Tying the Arrow brand.
• It is a good quality shirt Totally Disagree = = 0 = = Totally Agree
1 2 3 4 5
o It is a shirt which makes me think I'm ettin my money's worth Totally Disagree 0 0 = Totally Agree
1 2 3 4 5
• It is a shirt that I would buy Totally Disagree 0 0 = 0 = Totally Agree
1 2 3 4 5
• It is a shirt I would like to wear Totally Disagree 0 0 = = 0 Totally Agree
1 2 3 4 5
• It is a shirt which should make a oodim ression. Totally Disagree = 0 = Totally Agree
1 2 3 4 5
22. Assume you are looking for a 100% cotton shirt to wear everyday at home. You visit a upper class Shopper's Stop store where you find a shirt whose style, cut, fit and materials please you. This 100% cotton white shirt is sold at a discount price. It is a shirt carrying the STOP brand.
• It is a good quality shirt Totally Disagree = 0 = = 0 Totally Agree
1 2 3 4 5
• It is a shirt which makes me think I'm ettin my money's worth Totally Disagree 0 0 Totally Agree
1 2 3 4 5
• It is a shirt that I would buy Totally Disagree 0 0 0 0 0 Totally Agree
1 2 3 4 5
• It is a shirt I would like to wear Totally Disagree 0 = = 0 0 Totally Agree
1 2 3 4 5
• It is a shirt which should make ad im ression. Totally Disagree = 0 19 E 0 Totally Agree
1 2 3 4 5
173j1'a-c

23
Assume you are looking for a 100% cotton shirt to wear everyday at home. You visit a middle class Reliance Retail store where you find a shirt whose style, cut, fit and materials please you. This 100% cotton white shirt is sold at a discount price. It is a shirt carrying the Peter England brand.
• It is a good quality shirt Totally Disagree = 0 0 0 = Totally Agree
1 2 3 4 5
• It is a shirt which makes me think I'm etti my money's worth Totally Disagree = = 0 = = Totally Agree
1 2 3 4 5
• It is a shirt that I would buy Totally Disagree = 0 = 0 0 Totally Agree
1 2 3 4 5
o It is a shirt I would like to wear Totally Disagree 0 = = 0 0 Totally Agree
1 2 3 4 5
• It is a shirt which should make a d = im ression. Totally Disagree = 0 0 Totally Agree
1 2 3 4 5
24. Assume you are looking for a 100% cotton shirt to wear everyday at home. You visit a middle class Reliance Retail store where you find a shirt whose style, cut, fit and materials please you. This 100% cotton white shirt is sold at a regular price. It is a shirt carrying the First Class brand.
• It is a good quality shirt Totally Disagree 0 0 0 0 0 Totally Agree
1 2 3 4 5
• It is a shirt which makes me think I'm ettin my money's worth Totally Disagree 0 0 Totally Agree
1 2 3 4 5
• It is a shirt that I would buy Totally Disagree 0 = 0 0 0 Totally Agree
1 2 3 4 5
• It is a shirt I would like to wear Totally Disagree 0 LI 0 LI LI Totally Agree
1 2 3 4 5
• It is a shirt which should make a oodim ression. 17 Totally Disagree 0 0 0 Totally Agree
1 2 3 4 5
174111 a !,e

25. Assume you are looking for a 100% cotton shirt to wear everyday at hone. You visit a upper class Westside store where you find a shirt whose style, cut, fit and materials please you. This 100% cotton white shirt is sold at a regular price. It is a shirt carrying the Westside brand.
• It is a good quality shirt Totally Disagree = = 0 = 0 Totally Agree
1 2 3 4 5
• It is a shirt which makes me think I'm etti my money's worth Totally Disagree 0 0 0 = = Totally Agree
1 2 3 4 5
• It is a shirt that I would buy Totally Disagree = 0 0 0 = Totally Agree
1 2 3 4 5
e It is a shirt I would like to wear Totally Disagree 0 = 0 0 0 Totally Agree
1 2 3 4 5
It is a shirt which should make ad im ression. Totally Disagree 0 0 = 0 Totally Agree
1 2 3 4 5
26. Assume you are looking for a 100% cotton shirt to wear everyday at home. You visit a middle class Big Bazaar store where you find a shirt whose style, cut, fit and materials please you. This 100% cotton white shirt is sold at a discount price. It is a shirt carrying the Zodiac brand.
• It is a good quality shirt Totally Disagree 0 = 0 0 = Totally Agree
1 2 3 4 5
• It is a shirt which makes me think I'm ettin my money's worth Totally Disagree 0 0 0 Totally Agree
1 2 3 4 5
e It is a shirt that I would buy Totally Disagree = 0 0 0 0 Totally Agree
1 2 3 4 5
• It is a shirt I would like to wear Totally Disagree 0 = = 0 0 Totally Agree
1 2 3 4 5
• It is a shirt which should make a ood im cession. Totally Disagree 0 0 = Totally Agree
1 2 3 4 5
175 Pa e

27. Assume you are looking for a 100% cotton shirt to wear everyday at home. You visit a upper class Westside store where you find a shirt whose style, cut, fit and materials please you. This 100% cotton white shirt is sold at a discount price. It is a shirt carrying the Westside brand.
• It is a good quality shirt Totally Disagree = 0 0 = 0 Totally Agree
1 2 3 4 5
• It is a shirt which makes me think I'm ettin my money's worth Totally Disagree 0 0 =] Totally Agree
1 2 3 4 5
• It is a shirt that I would buy Totally Disagree 0 = 0 0 = Totally Agree
1 2 3 4 5
e It is a shirt I would like to wear Totally Disagree 0 = 0 0 = Totally Agree
1 2 3 4 5
® It is a shirt which should make aood im ression. = ~] Totally Disagree = L 0 Totally Agree
1 2 3 4 5
28. Assume you are looking for a 100% cotton shirt to wear everyday at home. You visit a middle class Reliance Retail store where you find a shirt whose style, cut, fit and materials please you. This 100% cotton white shirt is sold at a discount price. It is a shirt carrying the First Class brand.
• It is a good quality shirt Totally Disagree = 0 0 = 0 Totally Agree
1 2 3 4 5
• It is a shirt which makes me think I'm ettft my money's worth Totally Disagree = 0 0 ] " Totally Agree
1 2 3 4 5
• It is a shirt that I would buy Totally Disagree 0 0 0 [III] 0 Totally Agree
1 2 3 4 5
• It is a shirt I would like to wear Totally Disagree = = 0 0 0 Totally Agree
1 2 3 4 5
• It is a shirt which should make a ood im ression. Totally Disagree 0 0 0 Totally Agree
1 2 3 4 5
1761Pagi

29
Assume you are looking for a 100% cotton shirt to wear everyday at home. You visit a middle class Big Bazaar store where you find a shirt whose style, cut, fit and materials please you. This 100% cotton white shirt is sold at a regular price. It is a shirt carrying the Knighthood brand.
• It is a good quality shirt Totally Disagree FE E 0 FE 0 Totally Agree
1 2 3 4 5
• It is a shirt which makes me think I'metti my money's worth Totally Disagree FE 0 0 = = Totally Agree
1 2 3 4 5
• It is a shirt that I would buy Totally Disagree FE 0 0 0 0 Totally Agree
1 2 3 4 5
• It is a shirt I would like to wear Totally Disagree 0 0 0 0 0 Totally Agree
1 2 3 4 5
• It is a shirt which should make a ood im ression. Totally Disagree El 0 0 Totally Agree
1 2 3 4 5
30. Assume you are looking for a 100% cotton shirt to wear everyday at home. You visit a middle class Big Bazaar store where you find a shirt whose style, cut, fit and materials please you. This 100% cotton white shirt is sold at a discount price. It is a shirt carrying the Knighthood brand.
• It is a good quality shirt Totally Disagree FE 0 0 0 0 Totally Agree
1 2 3 4 5
• It is a shirt which makes me think I'mettin my money's worth Totally Disagree FE 0 0 rI Totally Agree
1 2 3 4 5
• It is a shirt that I would buy Totally Disagree 0 FE FE 0 0 Totally Agree
1 2 3 4 5
• It is a shirt I would like to wear Totally Disagree FE FE 0 0 FE Totally Agree
1 2 3 4 5
• It is a shirt which should make ad im ression. Totally Disagree FE F = FE Totally Agree
1 2 3 4 5
17711'a ,c

31. Assume you are looking for a 100% cotton shirt to wear for a special occasion. You visit a upper class Shopper's Stop store where you find a shirt whose style, cut, fit and materials please you. This 100% cotton white shirt is sold at a regular price. It is a shirt carrying the Louis Phillipe brand.
• It is a good quality shirt Totally Disagree 0 = = 0 = Totally Agree
1 2 3 4 5 • It is a shirt which makes me think I'm ettin my money's worth
Totally Disagree 0 0 0]] Totally Agree 1 2 3 4 5
• It is a shirt that I would buy Totally Disagree 0 0 0 = 0 Totally Agree
1 2 3 4 5
• It is a shirt I would like to wear Totally Disagree 0 0 0 0 = Totally Agree
1 2 3 4 5
• It is a shirt which should make a ood im ression. Totally Disagree 0] 0 Totally Agree
1 2 3 4 5
32. Assume you are looking for a 100% cotton shirt to wear for a special occasion. You visit a middle class Reliance Retail store where you find a shirt whose style, cut, fit and materials please you. This 100% cotton white shirt is sold at a regular price. It is a shirt carrying the Peter England brand.
• It is a good quality shirt Totally Disagree 0 L 0 = 0 Totally Agree
1 2 3 4 5
• It is a shirt which makes me think I'm etti my money's worth Totally Disagree = = = = = Totally Agree
1 2 3 4 5
• It is a shirt that I would buy Totally Disagree 0 = 0 = 0 Totally Agree
1 2 3 4 5
• It is a shirt I would like to wear Totally Disagree 0 [ 0 [II] [II] Totally Agree
1 2 3 4 5
• It is a shirt which should make a ood im ression. Totally Disagree 0 = Totally Agree
1 2 3 4 5
1781Pa;,c

33. Assume you are looking for a 100% cotton shirt to wear for a special occasion. You visit a zipper class Westside store where you find a shirt whose style, cut, fit and materials please you. This 100% cotton white shirt is sold at a regular price. It is a shirt carrying the Arrow brand.
• It is a good quality shirt Totally Disagree 0 0 0 [ 0 Totally Agree
1 2 3 4 5
• It is a shirt which makes me think I'm ettin my money's worth Totally Disagree = 0 Totally Agree
1 2 3 4 5
• It is a shirt that I would buy Totally Disagree 0 = = 0 = Totally Agree
1 2 3 4 5
• It is a shirt I would like to wear Totally Disagree 0 = = = 0 Totally Agree
1 2 3 4 5
e It is a shirt which should make a oodim ression. Totally Disagree = 0] = = Totally Agree
1 2 3 4 5
34. Assume you are looking for a 100% cotton shirt to wear for a special occasion. You visit a zipper class Shopper's Stop where you find a shirt whose style, cut, fit and materials please you. This 100% cotton white shirt is sold at a discount price. It is a shirt carrying the Louis Phillipe brand.
• It is a good quality shirt Totally Disagree = = I = 0 Totally Agree
1 2 3 4 5
• It is a shirt which makes me think I'm ettin my money's worth Totally Disagree 0 Totally Agree
1 2 3 4 5
• It is a shirt that I would buy Totally Disagree = = = 0 0 Totally Agree
1 2 3 4 5
• It is a shirt I would like to wear Totally Disagree 0 0 0 = 0 Totally Agree
1 2 3 4 5
o It is a shirt which should make a ood im ression. Totally Disagree 0 Totally Agree
1 2 3 4 5
179IPage

35. Assume you are looking for a 100% cotton shirt to wear for a special occasion. You visit a zapper class Shopper's Stop where you find a shirt whose style, cut, fit and materials please you. This 100% cotton white shirt is sold at a regular price. It is a shirt carrying the STOP brand.
• It is a good quality shirt Totally Disagree E 0 E 0 0 Totally Agree
1 2 3 4 5
• It is a shirt which makes me think I'metti my money's worth Totally Disagree = 0 = = = Totally Agree
1 2 3 4 5
• It is a shirt that I would buy Totally Disagree 0 0 0 0 = Totally Agree
1 2 3 4 5
• It is a shirt I would like to wear Totally Disagree 0 = 0 0 0 Totally Agree
1 2 3 4 5
o It is a shirt which should make a oodim ression. Totally Disagree LIII 0 ] 0 Totally Agree
1 2 3 4 5
36. Assume you are looking for a 100% cotton shirt to wear for a special occasion. You visit a middle class Big Bazaar store where you find a shirt whose style, cut, fit and materials please you. This 100% cotton white shirt is sold at a regular price. It is a shirt carrying the Zodiac brand.
• It is a good quality shirt Totally Disagree 0 0 0 0 = Totally Agree
1 2 3 4 5
• It is a shirt which makes me think I'm etti 7 my money's worth Totally Disagree 0 0 0 F9 E Totally Agree
1 2 3 4 5
• It is a shirt that I would buy Totally Disagree = 0 0 = 0 Totally Agree
1 2 3 4 5
• It is a shirt I would like to wear Totally Disagree 0 0 = 0 0 Totally Agree
1 2 3 4 5
• It is a shirt which should make a ood im ression. Totally Disagree 0 0 0 Totally Agree
1 2 3 4 5
1801Page

37. Assume you are looking for a 100% -cotton shirt to wear for a special occasion. You visit a upper class Westside store where you find a shirt whose style, cut, fit and materials please you. This 100% cotton white shirt is sold at a discount price. It is a shirt carrying the Arrow brand.
• It is a good quality shirt Totally Disagree 0 0 0 0 Totally Agree
1 2 3 4 5
o It is a shirt which makes me think I'm ettin my money's worth Totally Disagree = 0 =] Totally Agree
1 2 3 4 5
• It is a shirt that I would buy Totally Disagree = 0 = = 0 Totally Agree
1 2 3 4 5
• It is a shirt I would like to wear Totally Disagree = = = 0 = Totally Agree
1 2 3 4 5
• It is a shirt which should make aood im ression. Totally Disagree = = L] 0 Totally Agree
1 2 3 4 5
38. Assume you are looking for a 100% cotton shirt to wear for a special occasion. You visit a upper class Shopper's Stop store where you find a shirt whose style, cut, fit and materials please you. This 100% cotton white shirt is sold at a discount price. It is a shirt carrying the STOP brand.
• It is a good quality shirt Totally Disagree 0 0 = 0 = Totally Agree
1 2 3 4 5
• It is a shirt which makes me think I'm ettin my money's worth Totally Disagree 0 0]] Totally Agree
1 2 3 4 5
• It is a shirt that I would buy Totally Disagree = = = = 0 Totally Agree
1 2 3 4 5
• It is a shirt I would like to wear Totally Disagree 0 = = 0 = Totally Agree
1 2 3 4 5
• It is a shirt which should make a ood im ression. Totally Disagree 11111 0 0 Totally Agree
1 2 3 4 5
181IPa:ac

39. Assume you are looking for a 100% cotton shirt to wear for a special occasion. You visit a middle class Reliance Retail store where you find a shirt whose style, cut, fit and materials please you. This 100% cotton white shirt is sold at a discount price. It is a shirt carrying the Peter England brand.
• It is a good quality shirt Totally Disagree 0 0 = 0 0 Totally Agree
1 2 3 4 5
• It is a shirt which makes me think I'm ettin my money's worth Totally Disagree = 0 = F] = Totally Agree
1 2 3 4 5
• It is a shirt that I would buy Totally Disagree 0 0 0 0 = Totally Agree
1 2 3 4 5
• It is a shirt I would like to wear Totally Disagree 0 0 0 [] [] Totally Agree
1 2 3 4 5
• It is a shirt which should make ad im ression. 19 = Totally Disagree = 0 = Totally Agree
1 2 3 4 5
40. Assume you are looking for a 100% cotton shirt to wear for a special occasion. You visit a middle class Reliance Retail store where you find a shirt whose style, cut, fit and materials please you. This 100% cotton white shirt is sold at a regular price. It is a shirt carrying the First Class brand.
• It is a good quality shirt Totally Disagree 0 0 0 0 = Totally Agree
1 2 3 4 5
• It is a shirt which makes me think I'metti my money's worth Totally Disagree 0 0 0 = II Totally Agree
1 2 3 4 5
• It is a shirt that I would buy Totally Disagree 0 0 0 0 0 Totally Agree
1 2 3 4 5
• It is a shirt I would like to wear Totally Disagree [ 0 El 0 El Totally Agree
1 2 3 4 5
• It is a shirt which should make a oodim ression. Totally Disagree El E ] = 0 Totally Agree
1 2 3 4 5
182IPa{-~c

41. Assume you are looking for a 100% cotton shirt to wear for a special occasion. You visit a upper class Westside store where you find a shirt whose style, cut, fit and materials please you. This 100% cotton white shirt is sold at a regular price. It is a shirt carrying the Westside brand.
• It is a good quality shirt Totally Disagree 0 0 0 0 = Totally Agree
1 2 3 4 5
• It is a shirt which makes me think I'm etti my money's worth Totally Disagree 1 L = ] " Totally Agree
1 2 3 4 5
• It is a shirt that I would buy Totally Disagree 0 = = 0 0 Totally Agree
1 2 3 4 5
• It is a shirt I would like to wear Totally Disagree 0 [1111 0 0 = Totally Agree
1 2 3 4 5
• It is a shirt which should make a d im ression. = Totally Disagree 0 = 0 Totally Agree 1 2 3 4 5
42. Assume you are looking for a 100% cotton shirt to wear for a special occasion. You visit a middle class Big Bazaar store where you find a shirt whose style, cut, fit and materials please you. This 100% cotton white shirt is sold at a discount price. It is a shirt carrying the Zodiac brand.
• It is a good quality shirt Totally Disagree 0 0 0 = 0 Totally Agree
1 2 3 4 5
• It is a shirt which makes me think I'm ettin my money's worth Totally Disagree = = = Totally Agree
1 2 3 4 5
• It is a shirt that I would buy Totally Disagree 0 0 0 0 = Totally Agree
1 2 3 4 5
a It is a shirt I would like to wear Totally Disagree = = 0 = 0 Totally Agree
1 2 3 4 5
• It is a shirt which should make a oodim ression. Totally Disagree = = ] = = Totally Agree
1 2 3 4 5
183 1 Page

43. Assume you are looking for a 100% cotton shirt to wear for a special occasion. You visit a upper class Westside store where you find a shirt whose style, cut, fit and materials please you. This 100% cotton white shirt is sold at a discount price. It is a shirt carrying the Westside brand.
• It is a good quality shirt Totally Disagree 0 0 = 0 = Totally Agree
1 2 3 4 5
• It is a shirt which makes me think I'm ettin my money's worth Totally Disagree 0 0 0 ] ] Totally Agree
1 2 3 4 5
• It is a shirt that I would buy Totally Disagree 0 L = 0 0 Totally Agree
1 2 3 4 5
It is a shirt I would like to wear Totally Disagree = 0 0 0 = Totally Agree
1 2 3 4 5
• It is a shirt which should make a ood im ression. Totally Disagree 0 = ] [~ = Totally Agree
1 2 3 4 5
44. Assume you are looking for a 100% cotton shirt to wear for a special occasion. You visit a middle class Reliance Retail store where you find a shirt whose style, cut, fit and materials please you. This 100% cotton white shirt is sold at a discount price. It is a shirt carrying the First Class brand.
• It is a good quality shirt Totally Disagree = L 0 LI 0 Totally Agree
1 2 3 4 5
• It is a shirt which makes me think I'm etti my money's worth Totally Disagree LI 0 E = = Totally Agree
1 2 3 4 5
• It is a shirt that I would buy Totally Disagree 0 LI LI 0 0 Totally Agree
1 2 3 4 5
• It is a shirt I would like to wear Totally Disagree L] LI 0 LI LI Totally Agree
1 2 3 4 5
• It is a shirt which should make ad im ress ion. Totally Disagree 0 0 = [~ 0 Totally Agree
1 2 3 4 5
184II'a-c

45. Assume you are looking for a 100% cotton shirt to wear for a special occasion. You visit a middle class Big Bazaar store where you find a shirt whose style, cut, fit and materials please you. This 100% cotton white shirt is sold at a regular price. It is a shirt carrying the Knighthood brand.
• It is a good quality shirt Totally Disagree = = 0 0 = Totally Agree
1 2 3 4 5
• It is a shirt which makes me think I'm ettin my money's worth Totally Disagree Totally Agree
1 2 3 4 5
• It is a shirt that I would buy Totally Disagree = = = 0 = Totally Agree
1 2 3 4 5 • It is a shirt I would like to wear
Totally Disagree 0 = = = = Totally Agree 1 2 3 4 5
• It is a shirt which should make a ood im ression. Totally Disagree 0 0 L Totally Agree
1 2 3 4 5
46. Assume you are looking for a 100% cotton shirt to wear for a special occasion. You visit a middle class Big Bazaar store where you find a shirt whose style, cut, fit and materials please you. This 100% cotton white shirt is sold at a discount price. It is a shirt carrying the Knighthood brand.
• It is a good quality shirt Totally Disagree 0 0 0 Totally Agree
1 2 3 4 5
• It is a shirt which makes inc think I'm ettin J my money's worth Totally Disagree L 0 0 Totally Agree
1 2 3 4 5
• It is a shirt that I would buy Totally Disagree 0 0 E E] 0 Totally Agree
1 2 3 4 5
• It is a shirt I would like to wear Totally Disagree 0 0 = = = Totally Agree
1 2 3 4 5
• It is a shirt which should make a ood im cession. Totally Disagree = Totally Agree
1 2 3 4 5 47. Gender: 0 Male _ Female 48. Age (in years): 0 18-25 0 26-35 0 36-45 0 45 - 60 49. Annual Family Income :0< 1.6 0 1.60 — 3.00 0 3.00-5.00 0 >5.00
(in fats)
50. Education : 0 Undergraduate =Graduate =Post Graduate =Professional 51. How long have you been staying in NCR. ______j> 1 year < 1 year [~
[85 1 e

APPENDIX-2
Result of Hypotheses Testing - 1
Dependent Variable: Evaluation of shirt brand
Source Type III Sum of
Squares df Mean
S uare F Si g . CORRECTED MODEL 188.828a 22 8.583 12.063 .000 INTERCEPT .190 1 .190 .267 .605 NATPROX 1.469 1 1.469 2.064 .151 PVTPROX 2.459 1 2.459 3.456 .063 STORAWRN .787 1 .787 1.107 .293 SHOPPINGEXP .525 1 .525 .737 .391 FAS14IONQUOTIENT 1.260 1 1.260 1.771 .184 BRANDCONSCIOUNESS 15.372 1 15.372 21.604 .000 USAGE 115.287 1 115.287 162.027 .000 CLASS .374 1 .374 .525 .469 PVTPERCN .092 1 .092 .129 .720 PRICING .365 1 .365 .514 .474 SI-IIRTBRN .008 1 .008 .011 .917 GENDER 1.108 1 1.108 1.557 .212 AGESLAB .41! 3 .137 .192 .902 INCOME 13.857 3 4.619 6.492 .000 EDUCATON 5.978 3 1.993 2.800 .039 STAYNCR .461 1 .461 .648 .421 ERROR 577.764 812 .712 TOTAL 768.891 835 CORRECTED TOTAL 766.591 834
a. 1Z Squared = .246 (Adjusted R Squared = .226)
Result of Hypotheses Testing - 1
Source Type HI Sum of
Squares df Mean
Square F i Sig. Intercept Hypothesis 1.054 1 1.054 1.177 .289
Error 20.408 22.777 .896(a) NATFAM Hypothesis 2.755 1 2.755 3.577 , .059
Error 683.185 887 .770(b) PVTFAM Hypothesis 1.208 1 1.208 1.569 .211
Error 683.185 887 .770(b) STORFAM Hypothesis 3.962 1 3.962 5.144 .024
Error 683.185 887 .770(b)
SHOPPING Hypothesis 3.618 1 3.618 4.698 .030 Error 683.185 887 .770(b)
FASHIONQ Hypothesis 1.997 1 1.997 2.592 .108
Error 683.185 887 .770(b) BRANDCON Hypothesis 23.854 1 23.854 30.970 .000
Error 683.185 887 .770(b)
AGE Hypothesis .710 1 .710 .922 .337
Error 683.185 887 .770(b)
1861Page

USAGE Hypothesis 107.493 1 107.493 Error .818 .988 .828(c)
CLASS Hypothesis .065 1 .065 Error .183 1.036 .177(d)
PVTPERCN Hypothesis .083 1 .083 Error .343 .992 .346(e)
PRICING Hypothesis 1.411 1 1.411 Error 2.383 .999 2.386(f)
SHIRTBRN Hypothesis .172 1 .172 Error .664 1.001 .663(g)
GENDER Hypothesis 2.372 1 2.372 Error .023 .023 1.001(h)
USAGE * CLASS Hypothesis .042 1 .042 Error .366 .987 .371(1)
USAGE * PVTPERCN Hypothesis .563 1 .563 Error .986 .997 .990(j)
CLASS * PVTPERCN Hypothesis .001 1 .001 Error .049 .906 .054(k)
USAGE * CLASS * Hypothesis 1.441 1 1.441 PVTPERCN
Error 3.035 .999 3.039(l)
USAGE * PRICING Hypothesis 3.766 1 3.766 Error .719 1.000 .719(m)
CLASS * PRICING Hypothesis .561 1 .561
Error .014 1.719 .008(n)
USAGE * CLASS * Hypothesis .377 1 .377 PRICING
Error .529 1.009 .524(o)
PVTPERCN * PRICING Hypothesis .119 1 .119 Error .158 .953 .166(p)
USAGE * PVTPERCN * Hypothesis .080 1 .080 PRICING
Error .130 .904 .144(q)
CLASS * PVTPERCN * Hypothesis .029 1 .029 PRICING
Error .058 .858 .068(x)
USAGE * CLASS * Hypothesis .037 1 .037 PVTPERCN * PRICING
Error .000 .154 .002(s)
USAGE * SHIRTBRN Hypothesis 2.524 1 2.524
Error .911 1.003 .908(t)
CLASS * SHIRTBRN Hypothesis .335 1 .335 Error .273 1.015 .269(u)
USAGE * CLASS * Hypothesis .011 1 .011 SHIRTBRN
Error .084 .859 .097(v)
PVTPERCN * SHIRTBRN Hypothesis .085 1 .085 Error 4.449 1.000 4.451(w)
USAGE * PVTPERCN * Hypothesis .090 1 .090 SHIRTBRN
Error .021 .754 .028(x)
CLASS * PVTPERCN * Hypothesis 1.473 1 1.473 SHIRTBRN
129.770 .057
.370 .649
.240 .711
.591 l .583
.259 .700
2.371 I .934
.113 .794
.568 .589
.015 .923
.474 I .616
5.238 .262
67.615 .022
.719 .551
.717 1 .558
.555 .603
.434 .643
18.963 .626
2.778 .343 i
1.247 .463
.116 I .798
.019 .912
3.250 .378
8.780 ,216
187IPaL,e

Error .160 .956 .168(y) SAGE * •CLASS * Hypothesis .196 1 .196 VTPERCN * SHIRTBRN
Error 1.738 1.001 1.737(z) RICING * SHIRTBRN Hypothesis .619 1 .619
Error .264 .983 .269(aa) SAGE * PRICING * Hypothesis .171 1 .171 HIRTBRN
Error .027 .865 .031(bb) LASS * PRICING * Hypothesis 1.144 1 1.144 HIRTBRN
Error 1.112 1.001 1.1 1 1(cc) (SAGE * CLASS * Hypothesis .397 1 .397 RICING * SHIRTBRN
Error .056 1.009 .056(dd) VTPERCN * PRICING * Hypothesis .143 1 .143 HIRTBRN
Error 1.244 .995 1.251(ee) JSAGE * PVTPERCN * Hypothesis 1.269 1 1.269 RICING * SHIRTBRN
Error .045 .962 .047(ff) ;LASS * PVTPERCN * Hypothesis 1.320 1 1.320 RICING * SHIRTBRN
Error .562 .987 .569(gg) ]SAGE * CLASS * Hypothesis .831 1 .831 'VTPERCN * PRICING HIRTBRN
Error 683.185 887 .770(b)
JSAGE * GENDER Hypothesis .828 1 .828 Error .000 .002 .1 80(hh)
:LASS *GENDER Hypothesis .174 1 Error .(ii)
JSAGE * CLASS * Hypothesis .372 1 .372 LENDER
Error 1.460 .555 2.629(jj) 'VTPERCN * GENDER Hypothesis .347 1 .347
Error .483 .188 2.571(kk)
JSAGE * PVTPERCN * Hypothesis .989 1 .989 SENDER
Error .861 .390 2.209(11) 'LASS * PVTPERCN * Hypothesis .057 1 .057 SENDER
Error .408 .235 1.733(rnrn) JSAGE * CLASS * Hypothesis 3.033 1 3.033 'VTPERCN * GENDER
Error .305 .313 .974(nn)
'RICING * GENDER Hypothesis 2.383 1 Error .(ii)
JSAGE * PRICING * Hypothesis .719 1 .719 SENDER
Error 8.452 6.186 i 1.366(00)
LASS * PRICING * Hypothesis .006 1 .006 SENDER
Error 3.406 1.849 1.842(pp)
USAGE * CLASS * Hypothesis .523 1
.113 .794
2.307 .374
5.509 .286
1.030 .495
7.080 .227
.115 .792
26.983 1 .128
2.318 .372
1.079 i .299
4.595 .990
.142 .803
.135 .874
.448 .724
.033 .926
3.114 .575
526 !.495
.003 1 .959
188111 a a a
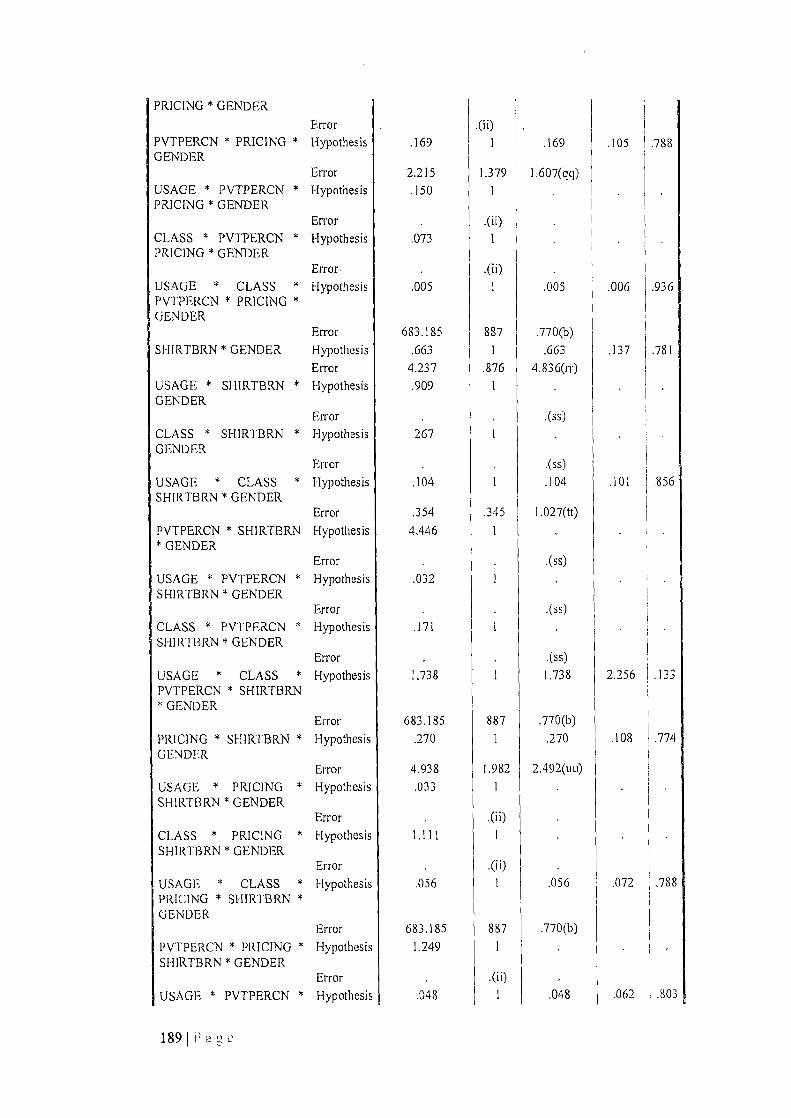
RICING * GENDER Error .(ii)
VTPERCN * PRICING * Hypothesis .169 1 .169 .105 .788 TENDER
Error 2.215 1.379 1.607(qq) [SAGE * PVTPERCN * Hypothesis .150 1 RICING * GENDER
Error .(ii) ,LASS * PVTPERCN * Hypothesis .073 1 RICING * GENDER
Error (ii) ]SAGE * CLASS * Hypothesis .005 1 .005 .006 .936 VTPERCN * PRICING * ;ENDER
Error 683.185 887 .770(b) HIRTBRN * GENDER Hypothesis ,663 1 .663 .137 .781
Error 4.237 .876 4.836(rr) JSAGE * SHIRTBRN * Hypothesis .909 1 . iENDER
Error .(ss) ;LASS * SHIRTBRN * Hypothesis .267 1 TENDER
Error .(ss) JSAGE * CLASS * Hypothesis .104 1 .104 .101 1.856 HIRTBRN * GENDER
Error .354 .345 1.027(tt) 'VTPERCN * SHIRTBRN Hypothesis 4.446 1 . GENDER
Error .(ss) JSAGE * PVTPERCN * Hypothesis .032 1 ;HIRTBRN * GENDER
Error .(ss) ,LASS * PVTPERCN * Hypothesis .171 1 ;HIRTBRN * GENDER
Error .(ss) JSAGE * CLASS * Hypothesis 1.738 1 1.738 2.256 .133 'VTPERCN * SHIRTBRN 'GENDER
Error 683.185 887 .770(b) 'RICING * SHIRTBRN * Hypothesis .270 1 .270 .108 .774 SENDER f
Error 4.938 1.982 2.492(uu) JSAGE * PRICING * Hypothesis .033 1 ;HIRTBRN * GENDER
Error (ii) 'LASS * PRICING * Hypothesis 1.111 1 . 3HIRTBRN * GENDER
Error JSAGE * CLASS * Hypothesis .056
.(ii) 1 .056 .072 .788
?RICING * SHIRTBRN * GENDER
Error 683.185 887 .770(b) PVTPERCN * PRICING * Hypothesis 1.249 1 SHIRTBRN * GENDER
Error .(ii) USAGE * PVTPERCN * Hypothesis .048 1 .048 .062 j .803
189 1 P a -)

PRICING * SHIRTBRN * GENDER
Error 683.185 887 .770(b) CLASS * PVTPERCN * Hypothesis .570 1 .570 PRICING * SHIRTBRN GENDER
Error 683.185 887 .770(b)
a .078 MS(GENDER) + .922 MS(Error)
b MS(Error)
c 1.007 MS(USAGE * GENDER) - .007 MS(Error)
d .996 MS(CLASS * GENDER) + .004 MS(Error)
e 1.002 MS(PVTPERCN * GENDER) - .002 MS(Error)
f 1.002 MS(PRICING * GENDER) - .002 MS(Error)
g 1.000 MS(SHIRTBRN * GENDER) + .000 MS(Error)
h .977 MS(USAGE * GENDER) + .983 MS(CLASS * GENDER) - .991 MS(USAGE * CLASS * GENDER) + .986 MS(PVTPERCN * GENDER) - .978 MS(USAGE * PVTPERCN * GENDER) - .981 MS(CLASS * PVTPERCN * GENDER) + .988 MS(USAGE * CLASS * PVTPERCN * GENDER) + .991 MS(PRICING * GENDER) - .986 MS(USAGE * PRICING * GENDER) - .987 MS(CLASS * PRICING * GENDER) + .982 MS(USAGE * CLASS * PRICING * GENDER) - .992 MS(PVTPERCN * PRICING * GENDER) + .988 MS(USAGE * PVTPERCN * PRICING * GENDER) + .993 MS(CLASS * PVTPERCN * PRICING * GENDER) - .987 MS(USAGE * CLASS * PVTPERCN * PRICING * GENDER) + .994 MS(SHIRTBRN * GENDER) - .988 MS(USAGE * SHIRTBRN * GENDER) - .985 MS(CLASS * S1-IIRTBRN * GENDER) + .983 MS(USAGE * CLASS * SHIRTBRN * GENDER) - .991 MS(PVTPERCN * SHIRTBRN * GENDER) + .987 MS(USAGE * PVTPERCN * SHIRTBRN * GENDER) + .993 MS(CLASS * PVTPERCN * SHIRTBRN * GENDER) - .989 MS(USAGE * CLASS * PVTPERCN * SHIRTBRN * GENDER) - .981 MS(PRICING * SHIRTBRN * GENDER) + .992 MS(USAGE * PRICING * SHIRTBRN GENDER) + .984 MS(CLASS * PRICING * SHIRTBRN * GENDER) - .986 MS(USAGE * CLASS * PRICING * SHIRTBRN * GENDER) + .978 MS(PVTPERCN * PRICING * SHIRTBRN * GENDER) - .988 MS(USAGE * PVTPERCN * PRICING * SHIRTBRN * GENDER) - .992 MS(CLASS PVTPERCN * PRICING * SHIRTBRN * GENDER) + 1.001 MS(Error)
i 1.003 MS(USAGE * CLASS * GENDER) - .003 MS(Error)
j 1.002 MS(USAGE * PVTPERCN * GENDER) - .002 MS(Error)
k 1.004 MS(CLASS * PVTPERCN * GENDER) - .004 MS(Error)
1 1.003 MS(USAGE * CLASS * PVTPERCN * GENDER) - .003 MS(Error)
m 1.000 MS(USAGE * PRICING * GENDER) + .000 MS(Error)
n .997 MS(CLASS * PRICING * GENDER) + .003 MS(Error)
o .997 MS(USAGE * CLASS * PRICING * GENDER) + .003 MS(Error)
p 1.005 MS(PVTPERCN * PRICING * GENDER) - .005 MS(Error)
740 .390
1901Pa e

q 1.010 MS(USAGE * PVTPERCN * PRICING * GENDER) - .010 MS(Error)
r 1.007 MS(CLASS * PVTPERCN * PRICING * GENDER) - .007 MS(Error)
s 1.004 MS(USAGE * CLASS * PVTPERCN * PRICING * GENDER) - .004 MS(Error)
t .998 MS(USAGE * SHIRTBRN * GENDER) + .002 MS(Error)
u .997 MS(CLASS * SHIRTBRN * GENDER) + .003 MS(Error)
v 1.010 MS(USAGE * CLASS * SHIRTBRN * GENDER) - .010 MS(Error)
w 1.001 MS(PVTPERCN * SHIRTBRN * GENDER) - .001 MS(Error)
x 1.005 MS(USAGE * PVTPERCN * SHIRTBRN * GENDER) - .005 MS(Error)
y 1.005 MS(CLASS * PVTPERCN * SHIRTBRN * GENDER) - .005 MS(Error)
z .999 MS(USAGE * CLASS * PVTPERCN * SHIRTBRN * GENDER) + .001 MS(Error)
as 1.003 MS(PRICING * SHIRTBRN * GENDER) - .003 MS(Error)
bb 1.003 MS(USAGE * PRICING * SHIRTBRN * GENDER) - .003 MS(Error)
cc .999 MS(CLASS * PRICING * SHIRTBRN * GENDER) + .001 MS(Error)
dd 1.000 MS(USAGE * CLASS * PRICING * SHIRTBRN * GENDER) + .000 MS(Error)
ee 1.004 MS(PVTPERCN * PRICING * SHIRTBRN * GENDER) - .004 MS(Error)
ff 1.001 MS(USAGE * PVTPERCN * PRICING * SHIRTBRN * GENDER) - .001 MS(Error)
gg 1.005 MS(CLASS * PVTPERCN * PRICING * SHIRTBRN * GENDER) - .005 MS(Error)
hh 1.014 MS(USAGE * CLASS * GENDER) + 1.001 MS(USAGE * PVTPERCN * GENDER) - 1.012 MS(USAGE * CLASS * PVTPERCN * GENDER) + 1.009 MS(USAGE * PRICING * GENDER) - 1.006 MS(USAGE * CLASS * PRICING * GENDER) - 1.011 MS(USAGE * PVTPERCN * PRICING * GENDER) + 1.011 MS(USAGE 4' CLASS * PVTPERCN * PRICING * GENDER) + 1.012 MS(USAGE * SHIRTBRN * GENDER) - 1.007 MS(USAGE * CLASS * SIIIRTBRN * GENDER) - 1.011 MS(USAGE * PVTPERCN * SHIRTBRN * GENDER) + 1.013 MS(USAGE * CLASS * PVTPERCN * SHIRTBRN * GENDER) - 1.015 MS(USAGE * PRICING * SHIRTBRN * GENDER) + 1.009 MS(USAGE * CLASS * PRICING * SHIRTBRN * GENDER) + 1.011 MS(USAGE * PVTPERCN * PRICING * SHIRTBRN * GENDER) - 1.019 MS(Error)
ii Cannot compute the error degrees of freedom using Satterthwaite's method.
jj .998 MS(USAGE * CLASS * PVTPERCN * GENDER) + .992 MS(USAGE CLASS * PRICING * GENDER) - .997 MS(USAGE * CLASS * PVTPERCN * PRICING * GENDER) + .993 MS(USAGE * CLASS * SHIRTBRN * GENDER) -.999 MS(USAGE * CLASS * PVTPERCN * SHIRTBRN * GENDER) - .995 MS(USAGE * CLASS * PRICING * SHIRTBRN * GENDER) + 1.009 MS(Error)
1911P c

kk .992 MS(USAGE * PVTPERCN * GENDER) + .996 MS(CLASS * PVTPERCN * GENDER) - 1.003 MS(USAGE * CLASS * PVTPERCN * GENDER) + 1.006 MS(PVTPERCN * PRICING * GENDER) - 1.002 MS(USAGE * PVTPERCN * PRICING * GENDER) - 1.008 MS(CLASS * PVTPERCN * PRICING * GENDER) + 1.002 MS(USAGE * CLASS * PVTPERCN `k PRICING * GENDER) + 1.005 MS(PVTPERCN * SHIRTBRN * GENDER) - 1.002 MS(USAGE * PVTPERCN * SHIRTBRN * GENDER) - 1.007 MS(CLASS * PVTPERCN * SHIRTBRN * GENDER) + 1.004 MS(USAGE * CLASS * PVTPERCN * SHIRTBRN * GENDER) - .993 MS(PVTPERCN * PRICING * SHIRTBRN * GENDER) + 1.002 MS(USAGE * PVTPERCN * PRICING * SHIRTBRN * GENDER) + 1.006 MS(CLASS * PVTPERCN * PRICING * SI-IIRTBRN * GENDER) - .999 MS(Error)
11 1.011 MS(USAGE * CLASS * PVTPERCN * GENDER) + 1.010 MS(USAGE * PVTPERCN * PRICING * GENDER) - 1.010 MS(USAGE * CLASS * PVTPERCN * PRICING * GENDER) + 1.010 MS(USAGE * PVTPERCN * SHIRTBRN * GENDER) - 1.012 MS(USAGE * CLASS * PVTPERCN * SHIRTBRN * GENDER) - 1.011 MS(USAGE * PVTPERCN * PRICING * SHIRTBRN * GENDER) + 1.001 MS(Error)
mm 1.007 MS(USAGE * CLASS * PVTPERCN * GENDER) + 1.012 MS(CLASS * PVTPERCN * PRICING * GENDER) - 1.006 MS(USAGE * CLASS * PVTPERCN * PRICING * GENDER) + 1.012 MS(CLASS * PVTPERCN * SHIRTBRN * GENDER) - 1.008 MS(USAGE * CLASS * PVTPERCN * SHIRTBRN * GENDER) - 1.011 MS(CLASS * PVTPERCN * PRICING SHIRTBRN * GENDER) + .994 MS(Error)
nn .999 MS(USAGE * CLASS * PVTPERCN * PRICING * GENDER) + 1.001 MS(USAGE * CLASS * PVTPERCN * SHIRTBRN * GENDER) - 1.000 MS(Error)
00 .997 MS(USAGE * CLASS * PRICING * GENDER) + 1.002 MS(USAGE * PVTPERCN * PRICING * GENDER) - 1.002 MS(USAGE * CLASS * PVTPERCN * PRICING * GENDER) + 1.006 MS(USAGE * PRICING SHIRTBRN * GENDER) - 1.000 MS(USAGE * CLASS * PRICING * SHIRTBRN * GENDER) - 1.002 MS(USAGE * PVTPERCN * PRICING * SHIRTBRN * GENDER) + 1,000 MS(Error)
pp .995 MS(USAGE * CLASS * PRICING * GENDER) -+- 1.006 MS(CLASS * PVTPERCN * PRICING * GENDER) - 1.001 MS(USAGE * CLASS * PVTPERCN * PRICING * GENDER) + .997 MS(CLASS * PRICING * SHIRTBRN * GENDER) - .999 MS(USAGE * CLASS * PRICING * SI-ZIRTBRN * GENDER) - 1.005 MS(CLASS * PVTPERCN * PRICING * SMIRTBRN * GENDER) + 1.006 MS(Error)
qq .996 MS(USAGE * PVTPERCN * PRICING * GENDER) + 1.001 MS(CLASS * PVTPERCN * PRICING * GENDER) - .995 MS(USAGE * CLASS * PVTPERCN * PRICING * GENDER) + .986 MS(PVTPERCN * PRICING * SI-IIRTBRN * GENDER) - .996 MS(USAGE * PVTPERCN * PRICING SHIRTBRN * GENDER) - 1.000 MS(CLASS * PVTPERCN * PRICING SHIRTBRN * GENDER) + 1.008 MS(Error)
rr .994 MS(USAGE * SHIRTBRN * GENDER) + .991 MS(CLASS * SHIRTBRN * GENDER) - .989 MS(USAGE * CLASS * SHIRTBRN * GENDER) + .997
1921Pa`ya

MS(PVTPERCN * SHIRTBRN * GENDER) - .993 MS(USAGE * PVTPERCN * SHIRTBRN * GENDER) - .999 MS(CLASS * PVTPERCN * SHIRTBRN * GENDER) + .995. MS(USAGE * CLASS * PVTPERCN * SHIRTBRN * GENDER) + .987 MS(PRICING * SHIRTBRN * GENDER) - .998 MS(USAGE * PRICING * SHIRTBRN * GENDER) - .990 MS(CLASS * PRICING * SHIRTBRN * GENDER) + .992 MS(USAGE * CLASS * PRICING * SHIRTBRN * GENDER) - .985 MS(PVTPERCN * PRICING * SHIRTBRN * GENDER) + .994 MS(USAGE * PVTPERCN * PRICING * SHIRTBRN * GENDER) + .998 MS(CLASS PVTPERCN * PRICING * SHIRTBRN * GENDER) - .994 MS(Error)
ss Cannot compute the appropriate error term using Satterthwaite's method.
tt 1.006 MS(USAGE * CLASS * PVTPERCN * SHIRTBRN * GENDER) + 1.003 MS(USAGE * CLASS * PRICING * SHIRTBRN * GENDER) - 1.009 MS(Error)
uu 1.011 MS(USAGE * PRICING * SHIRTBRN * GENDER) + 1.003 MS(CLASS * PRICING * SHIRTBRN * GENDER) - 1.005 MS(USAGE * CLASS * PRICING * SHIRTBRN * GENDER) + .997 MS(PVTPERCN * PRICING * SHIRTBRN * GENDER) - 1.007 MS(USAGE * PVTPERCN * PRICING * SHIRTBRN GENDER) - 1.011 MS(CLASS * PVTPERCN * PRICING * SHIRTBRN GENDER) + 1.011 MS(Error)
1931Pa<ge

Result of Hypotheses Testing - 2
Source Type III Sum
of Squares Df Mean
Square F Intercept Hypothesis .097 1 .097 .151 .697
Error 361.458 563.194 .642(a) PVTFAM Hypothesis 3.720 1 3.720 5,454 .020
Error 459.700 674 .682(b) STORFAM Hypothesis 3.276 1 3.276 4.804 .029
Error 459.700 674 .682(b) SHOPPING Hypothesis .519 1 .519 .761 .383
Error 459.700 674 .682(b) FASHIONQ Hypothesis .355 1 .355 .520 .471
Error 459.700 674 I .682(b) BRANDCON Hypothesis 12,844 1 12.844 18.832 .000
Error 459.700 674 .682(b) AGE Hypothesis .015 1 .015 .022 .882
Error 459.700 674 .682(b) NATFAM Hypothesis .011 1 .011 .016 .900
Error 459.700 674 .682(b) USAGE Hypothesis 57.900 1 57.900 8511.8 .001
64 Error .010 1.410 .007(c)
CLASS Hypothesis .011 1 .011 28.955 .161 Error .000 .800 .000(d)
PVTPERCN Hypothesis .244 1 .244 .180 .745 Error 1.357 .999 1.358(e)
PRICING Hypothesis 2.223 1 2.223 1.021 .497 Error 2.171 .997 2.177(f) 1
SHIRTBRN Hypothesis 1.458 1 1.458 .927 .512 Error 1.574 1.001 1.572(g)
GENDER Hypothesis .156 1 .156 .143 ,957 Error .031 .028 1.095(h)
USAGE * CLASS Hypothesis .993 1 .993 2.948 .342 Error .326 .969 .337(i)
USAGE * PVTPERCN Hypothesis 2.586 1 2.586 .720 .552 Error 3.587 .999 3.590(j)
CLASS * PVTPERCN Hypothesis .003 1 .003 .046 .868
Error .071 .940 .076(k) USAGE * CLASS * Hypothesis 2.183 1 2.183 1.549 .432 PVTPERCN
Error 1.404 .996 1 1.410(l) USAGE * PRICING Hypothesis 1.348 1 1.348 1.166 .475
Error 1.164 1.006 1.156(m) CLASS * PRICING Hypothesis .124 1 .124 12.285 .053
Error .025 2.489 .010(n) USAGE * CLASS * Hypothesis .191 1 .191 1.776 .405 PRICING
Error .1 1 1 1.032 .107(o) PVTPERCN * Hypothesis .691 1 1 .691 76.913 .265 PRICING
Error .004 .419 .009(p)
1941Paaae

SAGE * PVTPERCN Hypothesis .013 1 .013 PRICING
Error .957 .991 .966(q) LASS * PVTPERCN Hypothesis .172 1 .172 PRICING
Error .070 .846 .083(r) SAGE * CLASS * Hypothesis .033 1 .033 VTPERCN RICING
Error 6.234E-05 .031 .002(s) SAGE * SHIRTBRN Hypothesis 1.384 1 1.384
Error .109 1.013 .108(t) LASS * SHIRTBRN Hypothesis .037 1 .037
Error .058 1.644 .035(u) SAGE * CLASS * Hypothesis .010 1 .010 HIRTBRN
Error .477 .978 .487(v) VTPERCN * Hypothesis 1.086 1 1.086 HIRTBRN
Error 2.654 .996 2.664(w)
[SAGE * PVTPERCN Hypothesis .903 1 .903 SHIRTBRN
Error .030 .956 .032(x)
'LASS * PVTPERCN Hypothesis .979 1 .979 SHIRTBRN
Error .012 .963 .013(y)
(SAGE * CLASS * Hypothesis .130 1 .130 VTPERCN HIRTBRN
Error .736 1.010 .729(z) 'RICING * Hypothesis .058 1 .058 -HIRTBRN
Error 1.614 .999 1.616(aa)
JSAGE * PRICING * Hypothesis 1.220 1 HIRTBRN
Error .(bb) :LASS * PRICING * Hypothesis 2.849 1 2.849 ;HIRTBRN
Error 1.756 1.000 1.757(cc)
JSAGE * CLASS * Hypothesis 1.187 1 1.187 'RICING ;HIRTBRN
Error .139 .981 .141(dd)
'VTPERCN * Hypothesis .001 1 .001 'RILING ;HIRTBRN
Error 1.527 .993 1.538(ee)
JSAGE * PVTPERCN Hypothesis .534 1 .534 PRICING
3HIRTBRN Error .044 .834 .053 (ff)
LASS * PVTPERCN Hypothesis .335 1 .335 PRICING
SHIRTBRN Error .575 .988 .582(gg)
USAGE * CLASS * Hypothesis .087 1 .087 PVTPERCN
.013 ,927
2.066 .416
16.313 .889
12.818 .171
1.043 .434
.021 .908
.408 .639
28.513 .126
76.872 .078
.179 .745
.036 .881
1.621 .424
8.394 .216
.001 .984
10.132 .232
.575 588
127 1 .722
195JPa g e

1.109
.383
.019
.802
.870
.926
PRICING SHIRTBRN
Error 459.700 674 .682(b)
USAGE * GENDER Hypothesis .006 1 .006
Error .787 .324 2.424(hh)
CLASS * GENDER Hypothesis .000 1 Error .(bb)
USAGE * CLASS * Hypothesis .340 1 .340 GENDER
Error 2.142 1.185 1.808(ii)
PVTPERCN * Hypothesis 1.358 1 1.358 GENDER
Error 1.029 .343 2.996(jj)
USAGE * PVTPERCN Hypothesis 3.584 1 3.584 * GENDER
Error 3.538 1.532 2.309(kk)
CLASS * PVTPERCN Hypothesis .078 1 .078 * GENDER
Error .226 .261 .868(11)
USAGE * CLASS * Hypothesis 1.407 1 1.407 PVTPERCN GENDER
Error .000 .005 .051(mm)
PRICING * GENDER Hypothesis 2.170 1 Error .(bb)
USAGE * PRICING * Hypothesis 1.159 1 1.159 GENDER
Error 3.905 2.504 1.559(nn)
CLASS * PRICING * Hypothesis .006 1 .006 GENDER
Error 1.981 1.046 1.894(oo) USAGE * CLASS * Hypothesis .106 1 PRICING * GENDER
Error .(bb) PVTPERCN * Hypothesis .014 1 .014 PRICING * GENDER
Error 4.953 1.895 2.614(pp) USAGE * PVTPERCN Hypothesis .964 1 * PRICING * GENDER
Error .(bb) CLASS * PVTPERCN Hypothesis .090 1 * PRICING * GENDER
Error .(bb)
USAGE * CLASS * Hypothesis .011 1 .011 PVTPERCN PRICING * GENDER
Error 459.700 674 .682(b)
SHIRTBRN * Hypothesis 1.574 1 1.574 GENDER
Error .177 .124 1.419(qq)
USAGE * SHIRTBRN Hypothesis .107 1 .107 * GENDER I
Error .028 .100 .280(rr)
CLASS * SHIRTBRN * Hypothesis .028 1 .028 GENDER
Error .776 .524 1.480(ss)
.002 .977 1
.188 .730
.45= .737
1.55 .370
.09( .878
27.6: .976
.74. .463
.00 .963
.005 1 .949
.017 .897
196 1) age

USAGE * CLASS * Hypothesis .489 1 SHIRTBRN GENDER
Error .012 .065 PVTPERCN * Hypothesis 2.650 1 SHIRTBRN GENDER
Error .225 .252 USAGE * PVTPERCN Hypothesis .032 1
SHIRTBRN GENDER
Error .002 .019 CLASS * PVTPERCN Hypothesis .013 1 * SHIRTBRN GENDER
Error .289 .459 USAGE * CLASS * Hypothesis .729 1 PVTPERCN SHIRTBRN GENDER
Error 459.700 674 PRICING * Hypothesis 1.615 1 SHIRTBRN GENDER
Error 5.623 1.756 USAGE * PRICING * Hypothesis .002 1 SHIRTBRN GENDER
Error .(bb) CLASS * PRICING * Hypothesis 1.757 1 SHIRTBRN GENDER
Error .000 .005 USAGE * CLASS * Hypothesis .143 1 PRICING SHIRTBRN GENDER
Error 459.700 674 PVTPERCN * Hypothesis 1.531 1 PRICING SHIRTBRN GENDER
Error .(bb)
USAGE * PVTPERCN Hypothesis .057 1 * PRICING SHIRTBRN GENDER
Error 459.700 674
CLASS * PVTPERCN Hypothesis .582 1 * PRICING SHIRTBRN GENDER
Error 459.700 674
a .077 MS(GENDER) + .923 MS(Error)
b MS(Error)
c .998 MS(USAGE * GENDER) + .002 MS(Error)
1971 P e
.489
2.591 .850
.189(tt) 2.650 2.972 .625
.891(uu) .032 .324 .961
100(vv) .013 .021 .925
.629(ww) .729
1.069 .302
.682(b) 1.615 .504 .560 1
3.202(xx)
1.757 42.926 1 .976
.041(yy)
.143 .209 .648
.682(b)
.057 .084 .772
682(b)
.582 .854 .356
.682(b)

d 1.000 MS(CLASS * GENDER) - 6.373E-05 MS(Error)
e 1.001 MS(PVTPERCN * GENDER) - .001 MS(Error)
f 1.004 MS(PRICING * GENDER) - .004 MS(Error)
g .998 MS(SHIRTBRN * GENDER) + .002 MS(Error)
h .990 MS(USAGE * GENDER) + .998 MS(CLASS * GENDER) - 1.001 MS(USAGE * CLASS * GENDER) + .995 MS(PVTPERCN * GENDER) - .991 MS(USAGE * PVTPERCN * GENDER) - .991 MS(CLASS * PVTPERCN * GENDER) + .998 MS(USAGE * CLASS * PVTPERCN * GENDER) + 1.002 MS(PRICING * GENDER) - .993 MS(USAGE * PRICING * GENDER) - .999 MS(CLASS * PRICING * GENDER) + .992 MS(USAGE * CLASS * PRICING * GENDER) - 1.000 MS(PVTPERCN * PRICING * GENDER) + .995 MS(USAGE * PVTPERCN * PRICING * GENDER) + 1.011 MS(CLASS * PVTPERCN * PRICING * GENDER) - 1.009 MS(USAGE * CLASS * PVTPERCN * PRICING * GENDER) + 1.001 MS(SHIRTBRN * GENDER) - 1.000 MS(USAGE * SHIRTBRN * GENDER) - .998 MS(CLASS * SHIRTBRN * GENDER) + .995 MS(USAGE * CLASS * SHIRTBRN * GENDER) - 1.009 MS(PVTPERCN * SHIRTBRN * GENDER) + .996 MS(USAGE * PVTPERCN * SHIRTBRN * GENDER) + .999 MS(CLASS * PVTPERCN * SHIRTBRN * GENDER) - .993 MS(USAGE * CLASS * PVTPERCN * SHIRTBRN * GENDER) - .992 MS(PRICING * SHIRTBRN * GENDER) + .999 MS(USAGE * PRICING * SHIRTBRN * GENDER) + .993 MS(CLASS * PRICING * SHIRTBRN * GENDER) - .996 MS(USAGE * CLASS * PRICING * SHIRTBRN * GENDER) + .999 MS(PVTPERCN * PRICING * SHIRTBRN * GENDER) - 1.003 MS(USAGE * PVTPERCN * PRICING * SHIRTBRN * GENDER) - .996 MS(CLASS * PVTPERCN * PRICING * SHIRTBRN * GENDER) + 1.005 MS(Error)
i 1.008 MS(USAGE * CLASS * GENDER) - .008 MS(Error)
j 1.002 MS(USAGE * PVTPERCN * GENDER) - .002 MS(Error)
k 1.003 MS(CLASS * PVTPERCN * GENDER) - .003 MS(Error)
1 1.004 MS(USAGE * CLASS * PVTPERCN * GENDER) - .004 MS(Error)
m .995 MS(USAGE * PRICING * GENDER) + .005 MS(Error)
n .995 MS(CLASS * PRICING * GENDER) + .005 MS(Error)
o .998 MS(USAGE * CLASS * PRICING * GENDER) + .002 MS(Error)
p 1.007 MS(PVTPERCN * PRICING * GENDER) - .007 MS(Error)
q 1.006 MS(USAGE * PVTPERCN * PRICING * GENDER) - .006 MS(Error)
r 1.011 MS(CLASS * PVTPERCN * PRICING * GENDER) - .011 MS(Error)
s 1.014 MS(USAGE * CLASS * PVTPERCN * PRICING * GENDER) - .014 MS(Error)
t .999 MS(USAGE * SHIRTBRN * GENDER) + .001 MS(Error)
u .989 MS(CLASS * SHIRTBRN * GENDER) + .011 MS(Error)
v 1.008 MS(USAGE * CLASS * SHIRTBRN * GENDER) - .008 MS(Error)
w 1.007 MS(PVTPERCN * SHIRTBRN * GENDER) - .007 MS(Error)
19811' a }c

x 1.001 MS(USAGE * PVTPERCN * SHIRTBRN * GENDER) - .001 MS(Error)
y 1.000 MS(CLASS * PVTPERCN * SHIRTBRN * GENDER) - .000 MS(Error)
z .995 MS(USAGE * CLASS * PVTPERCN * SHIRTBRN * GENDER) + .005 MS(Er (Error)
as 1.001 MS(PRICING * SHIRTBRN * GENDER) - .001 MS(Error)
bb Cannot compute the error degrees of freedom using Satterthwaite's method.
cc 1.001 MS(CLASS * PRICING * SHIRTBRN * GENDER) - .001 MS(Error)
dd 1.002 MS(USAGE * CLASS * PRICING * SHIRTBRN * GENDER) - .002 MS(Error)
ee 1.008 MS(PVTPERCN * PRICING * SHIRTBRN * GENDER) - .008 MS(Error)
ff 1.007 MS(USAGE * PVTPERCN * PRICING * SHIRTBRN * GENDER) - .007 MS(Error)
gg 1.005 MS(CLASS * PVTPERCN * PRICING * SHIRTBRN * GENDER) - .005 MS(Error)
hh 1.011 MS(USAGE * CLASS * GENDER) + 1.001 MS(USAGE * PVTPERCN * GENDER) - 1.008 MS(USAGE * CLASS * PVTPERCN * GENDER) + 1.002 MS(USAGE * PRICING * GENDER) - 1.001 MS(USAGE * CLASS * PRICING * GENDER) - 1.005 MS(USAGE * PVTPERCN * PRICING * GENDER) + 1.019 MS(USAGE * CLASS * PVTPERCN * PRICING * GENDER) + 1.009 MS(USAGE * SIIIRTBRN * GENDER) - 1.005 MS(USAGE * CLASS * SHIRTBRN * GENDER) - 1.006 MS(USAGE * PVTPERCN * SHIRTBRN * GENDER) + 1.003 MS(USAGE * CLASS * PVTPERCN * SHIRTBRN * GENDER) - 1.009 MS(USAGE * PRICING * SHIRTBRN * GENDER) + 1.006 MS(USAGE * CLASS * PRICING * SHIRTBRN * GENDER) + 1.013 MS(USAGE * PVTPERCN * PRICING * SHIRTBRN * GENDER) - 1.030 MS(Error)
ii .997 MS(USAGE * CLASS * PVTPERCN * GENDER) + .991 MS(USAGE * CLASS * PRICING * GENDER) - 1.008 MS(USAGE * CLASS * PVTPERCN * PRICING * GENDER) + .994 MS(USAGE * CLASS * SI-IIRTBRN * GENDER) -.992 MS(USAGE * CLASS * PVTPERCN * SHIRTBRN * GENDER) - .996 MS(USAGE * CLASS * PRICING * SHIRTBRN * GENDER) + 1.014 MS(Error)
jj .997 MS(USAGE * PVTPERCN * GENDER) + .996 MS(CLASS * PVTPERCN * GENDER) - 1.003 MS(USAGE * CLASS * PVTPERCN * GENDER) -F 1.005 MS(PVTPERCN * PRICING * GENDER) - 1.001 MS(USAGE '~ PVTPERCN * PRICING * GENDER) - 1.017 MS(CLASS * PVTPERCN * PRICING * GENDER) + 1.014 MS(USAGE * CLASS * PVTPERCN * PRICING * GENDER) + 1.014 MS(PVTPERCN * SHIRTBRN * GENDER) - 1.001 MS(USAGE PVTPERCN * SHIRTBRN * GENDER) - 1.005 MS(CLASS * PVTPERCN SHIRTBRN * GENDER) + .998 MS(USAGE * CLASS * PVTPERCN * SHIRTBRN * GENDER) - 1.004 MS(PVTPERCN * PRICING * SHIRTBRN * GENDER) + 1.008 MS(USAGE * PVTPERCN * PRICING * SI-IIRTBRN 'k GENDER) + 1.001 MS(CLASS * PVTPERCN * PRICING * SHIRTBRN * GENDER) - 1.003 MS(Error)
1991)'1

kk 1.007 MS(USAGE * CLASS * PVTPERCN * GENDER) + 1.004 MS(USAGE * PVTPERCN * PRICING * GENDER) - 1,018 MS(USAGE * CLASS * PVTPERCN * PRICING * GENDER) + 1.005 MS(USAGE * PVTPERCN * SHIRTBRN * GENDER) - 1.002 MS(USAGE * CLASS * PVTPERCN * SHIRTBRN * GENDER) - 1.012 MS(USAGE * PVTPERCN * PRICING * SHIRTBRN * GENDER) + 1.016 MS(Error)
11 1.007 MS(USAGE * CLASS * PVTPERCN * GENDER) + 1.021 MS(CLASS * PVTPERCN * PRICING * GENDER) - 1.018 MS(USAGE * CLASS * PVTPERCN * PRICING * GENDER) + 1.009 MS(CLASS * PVTPERCN * SHIRTBRN * GENDER) - 1.003 MS(USAGE * CLASS * PVTPERCN * SI-IIRTBRN * GENDER) - 1.005 MS(CLASS * PVTPERCN * PRICING * SI-IIRTBRN * GENDER) + .989 MS(Error)
mm 1.011 MS(USAGE * CLASS * PVTPERCN * PRICING * GENDER) + .995 MS(USAGE * CLASS * PVTPERCN * SHIRTBRN * GENDER) - 1.006 MS(Error)
nn .999 MS(USAGE * CLASS * PRICING * GENDER) + 1.003 MS(USAGE * PVTPERCN * PRICING * GENDER) - 1.016 MS(USAGE * CLASS * PVTPERCN * PRICING * GENDER) + 1.007 MS(USAGE * PRICING * SHIRTBRN * GENDER) - 1.004 MS(USAGE * CLASS * PRICING * SI-IIRTBRN * GENDER) - 1.011 MS(USAGE * PVTPERCN * PRICING * SHIRhBRN * GENDER) + 1.022 MS(Error)
00 .993 MS(USAGE * CLASS * PRICING * GENDER) + 1.013 MS(CLASS * PVTPERCN * PRICING * GENDER) - 1.010 MS(USAGE * CLASS * PVTPERCN * PRICING * GENDER) + .995 MS(CLASS * PRICING SHIRTBRN * GENDER) - .998 MS(USAGE * CLASS * PRICING * SI-IIRTI3RN * GENDER) - .997 MS(CLASS * PVTPERCN * PRICING * SI-IIRTBRN * GENDER) + 1.005 MS(Error)
pp .995 MS(USAGE * PVTPERCN * PRICING * GENDER) + 1.011 MS(CLASS * PVTPERCN * PRICING * GENDER) - 1.009 MS(USAGE * CLASS * PVTPERCN * PRICING * GENDER) + .998 MS(PVTPERCN * PRICING * S1-IIRTBRN * GENDER) - 1.003 MS(USAGE * PVTPERCN * PRICING * SHIRTBRN * GENDER) - .996 MS(CLASS * PVTPERCN * PRICING * SI-IIRTBRN * GENDER) + 1.002 MS(Error)
qq .998 MS(USAGE * SHIRTBRN * GENDER) + .996 MS(CLASS * SHIRTBRN ' GENDER) - .994 MS(USAGE * CLASS * SIIIRTBRN * GENDER) + 1.007 MS(PVTPERCN * SHIRTBRN * GENDER) - .995 MS(USAGE * PVTPERCN SIIIRTBRN * GENDER) - .998 MS(CLASS * PVTPERCN * SIIIRTBRN GENDER) + .992 MS(USAGE * CLASS * PVTPERCN * SHIRTBRN * GENDER) + .991 MS(PRICING * SHIRTBRN * GENDER) - .998 MS(USAGE PRICING * SHIRTBRN * GENDER) - .992 MS(CLASS * PRICING * SHIRTBRN * GENDER) + .995 MS(USAGE * CLASS * PRICING * SHIRTBRN * GENDER)
.997 MS(PVTPERCN * PRICING * SHIRTBRN * GENDER) + 1.002 MS(USAGE * PVTPERCN * PRICING * SHIRTBRN * GENDER) + .994 MS(CLASS * PVTPERCN * PRICING * SHIRTBRN * GENDER) - 1.002 MS(Error) rr .995 MS(USAGE * CLASS * SHIRTBRN * GENDER) + .997 MS(USAGE * PVTPERCN * SHIRTBRN * GENDER) - .994 MS(USAGE * CLASS
2001Pa a

PVTPERCN * SHIRTBRN * GENDER) + .999 MS(USAGE * PRICING * SHIRTBRN * GENDER) - .997 MS(USAGE * CLASS * PRICING * SHIRTBRN * GENDER) - 1.003 MS(USAGE * PVTPERCN * PRICING * SHIRTBRN * GENDER) + 1.002 MS(Error)
ss .997 MS(USAGE * CLASS * SHIRTBRN * GENDER) + 1.002 MS(CLASS * PVTPERCN * SHIRTBRN * GENDER) - .995 MS(USAGE * CLASS * PVTPERCN * SHIRTBRN * GENDER) + .995 MS(CLASS * PRICING * SHIRTBRN * GENDER) - .998 MS(USAGE * CLASS * PRICING * SHIRTBRN * GENDER) - .998 MS(CLASS * PVTPERCN * PRICING * SHIRTBRN * GENDER) + .998 MS(Error)
tt .998 MS(USAGE * CLASS * PVTPERCN * SHIRTBRN * GENDER) + 1.001 MS(USAGE * CLASS * PRICING * SHIRTBRN * GENDER) - 1.000 MS(Error)
uu .988 MS(USAGE * PVTPERCN * SHIRTBRN * GENDER) + .991 MS(CLASS * PVTPERCN * SHIRTBRN * GENDER) - .985 MS(USAGE * CLASS * PVTPERCN * SHIRTBRN * GENDER) + .990 MS(PVTPERCN * PRICING * SHIRTBRN * GENDER) - .994 MS(USAGE * PVTPERCN * PRICING * SHIRTBRN * GENDER) - .987 MS(CLASS * PVTPERCN * PRICING * SHIRTBRN * GENDER) + .998 MS(Error)
vv .997 MS(USAGE * CLASS * PVTPERCN * SHIRTBRN * GENDER) + 1.007 MS(USAGE * PVTPERCN * PRICING * SHIRTBRN * GENDER) - 1.004 MS(Error)
ww .994 MS(USAGE * CLASS * PVTPERCN * SHIRTBRN * GENDER) + .996 MS(CLASS * PVTPERCN * PRICING * SHIRTBRN * GENDER) - .990 MS(Error)
xx 1.007 MS(USAGE * PRICING * SHIRTBRN * GENDER) + 1.001 MS(CLASS * PRICING * SHIRTBRN * GENDER) - 1.004 MS(USAGE * CLASS * PRICING * SHIRTBRN * GENDER) + 1.007 MS(PVTPERCN * PRICING * SHIRTBRN * GENDER) - 1.011 MS(USAGE * PVTPERCN * PRICING * SHIRTBRN GENDER) - 1.004 MS(CLASS * PVTPERCN * PRICING * SHIRTBRN * GENDER) + 1.004 MS(Error)
yy 1.003 MS(USAGE * CLASS * PRICING * SHIRTBRN * GENDER) + 1.002 MS(CLASS * PVTPERCN * PRICING * SHIRTBRN * GENDER) - 1.005 MS(Error)
201 Yaae

Result of Hypotheses Testing - 3
Source Type III Sum
of Squares df Mean Square F j Sig. Intercept Hypothesis 1.259 1 1.259 1.338 .254
Error 40.553 43.120 .940(a) NATFAM Hypothesis 2.497 1 2.497 3.373 .067
Error 593.666 802 .740(b) PVTFAM Hypothesis 2.165 1 2.165 2.925 .088
Error 593.666 802 .740(b) STORFAM Hypothesis 3.114 1 3.114 4.206 .041
Error 593.666 802 .740(b) SHOPPING Hypothesis 3.305 1 3.305 4,465 .035
Error 593.666 802 .740(b) FASHIONQ Hypothesis 1.415 1 1.415 1.912 .167
Error 593.666 802 .740(b) BRANDCON Hypothesis 19.866 1 19.866 26.837 .000
Error 593.666 802 .740(b) AGE Hypothesis 1.470 1 1,470 1.985 .159
Error 593.666 802 .740(b) USAGE Hypothesis 34.315 1 34.315 24.262 .003
Error 8.572 6.061 1.414(c) CLASS Hypothesis 2.674 1 2.674 2.722 .137
Error 7.874 8.017 .982(d) PVTPERCN Hypothesis .810 1 .810 .963 .350
Error 8.372 9.953 .841(e)
PRICING Hypothesis .479 1 .479 .426 .533 Error 8.540 7.596 1.124(f)
SHIRTBRN Hypothesis .461 1 .461 .967 .328
Error 47.079 98.754 .477(g) INCOME Hypothesis 12.294 3 4.098 .766 .602
Error 11.939 2.233 5.347(h) USAGE * CLASS Hypothesis .943 1 .943 1.394 .249
Error 17.041 25.208 .676(i) USAGE * Hypothesis .590 1 .590 .869 i .363 PVTPERCN
Error 13.053 19.216 .679(j)
CLASS * PVTPERCN Hypothesis .126 1 .126 .186 .671 Error 13.605 19.984 .681(k)
USAGE * CLASS * Hypothesis .405 1 .405 .328 .587 PVTPERCN
Error 7.695 6.240 1.233(1)
USAGE * PRICING Hypothesis .137 1 .137 .134 .724
Error 8.040 7.906 1.017(m)
CLASS * PRICING Hypothesis .034 1 .034 .051 .823
Error 14.592 22.061 .661(n)
USAGE * CLASS * Hypothesis 2.678 1 2.678 4.357 .048 PRICING
Error 14.371 23.385 .615(o)
PVTPERCN * Hypothesis 1.095 1 1.095 1.741 .200 PRICING
Error 14.603 23.212 .629(p)
20211)a-,c

JSAGE * Hypothesis .075 1 .075 3VTPERCN PRICING
Error 15.403 25.945 .594(q) LASS * PVTPERCN Hypothesis 1.410 1 1.410 PRICING
Error 8.683 9.753 .890(r) JSAGE * CLASS * Hypothesis .349 1 .349 PVTPERCN PRICING
Error 9.274 10.480 .885(s) USAGE * Hypothesis 3.664 1 3.664 SHIRTBRN
Error 10.376 13.038 .796(t) CLASS * SHIRTBRN Hypothesis 2.317 1 2.317
Error 13.097 18.834 .695(u) USAGE * CLASS * Hypothesis 1.923 1 1 1.923 SHIRTBRN
Error 8.703 9.397 .926(v) PVTPERCN * Hypothesis .108 1 .108 SHIRTBRN
Error 7.502 5.319 1.411(w)
USAGE * Hypothesis .133 1 .133 PVTPERCN SHIRTBRN
Error 16.886 27.445 .615.(x)
CLASS * PVTPERCN Hypothesis 4.153 1 4.153 SI-IIRTBRN
Error 8.816 5.235 1.684(y)
USAGE * CLASS * Hypothesis .660 1 .660 PVTPERCN SI-IIRTBRN
Error 9.104 j 10.856 .839(z)
PRICING * Hypothesis 1.818 1 1.818 SHIRTBRN
Error 65.718 137.717 .477(aa)
USAGE * PRICING * Hypothesis .068 1 .068 SHIRTBRN
Error 8.308 7.276 1.142(bb)
CLASS * PRICING * Hypothesis .328 1 .328 SHIRTBRN
Error 23.914 42.402 .564(cc)
USAGE * CLASS * Hypothesis 2.697 1 2.697 PRICING S I-I I RTB RN
Error 8.766 9.083 .965(dd)
PVTPERCN * Hypothesis 2.756 I 2.756 PRICING SHIRTBRN
Error 10.459 15.520 .674(ee)
USAGE * Hypothesis .429 1 .429 PVTPERCN PRICING SI-I I RTB RN
Error 10.169 12.951 .785(fI)
CLASS * PVTPERCN Hypothesis .405 1 .405 * PRICING
203If'<<q,c
.127 .725
1.584 .238
.394 ! .544
4.604 I .051
3.332 .084
2.076 .182
.076 .793
.215 .646
2.466 .175
787 I .394
3.810 .053
.060 .814
582 .450
2.795 I .129
4,089 I .061
.547 .473
.691 ! .411
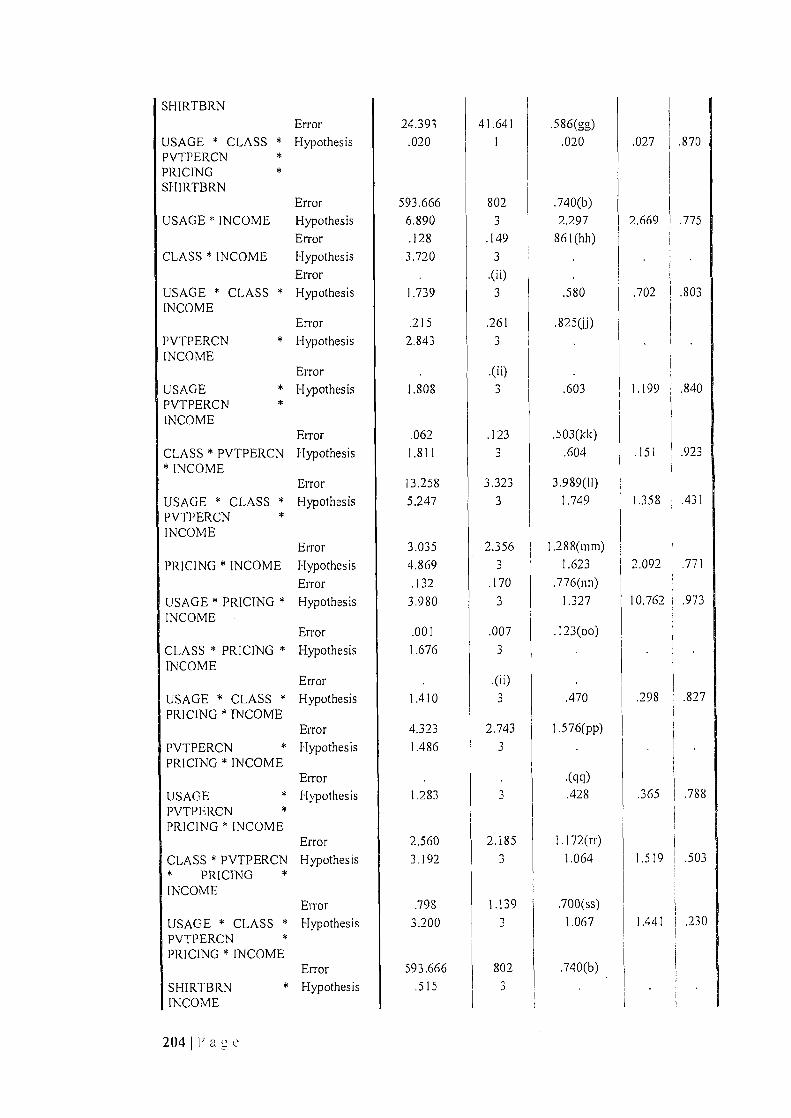
SHIRTBRN Error 24.393 41.641 .586(gg)
USAGE * CLASS * Hypothesis .020 1 .020 PVTPERCN PRICING SHIRTBRN
Error 593.666 802 .740(b) USAGE * INCOME Hypothesis 6.890 3 2.297
Error .128 .149 .861(hh) CLASS * INCOME Hypothesis 3.720 3
Error (ii) USAGE * CLASS * Hypothesis 1.739 3 .580 INCOME
Error .215 .261 .825(jj) PVTPERCN * Hypothesis 2.843 3 INCOME
Error .(ii) USAGE * Hypothesis 1.808 3 .603 PVTPERCN INCOME
Error .062 .123 .503(kk) CLASS * PVTPERCN Hypothesis 1.811 3 .604 * INCOME
Error 13.258 3.323 3.989(11) USAGE * CLASS * Hypothesis 5.247 3 1.749 PVTPERCN INCOME
Error 3.035 2.356 1.288(mm)
PRICING * INCOME Hypothesis 4.869 3 1.623 Error .132 .170 .776(nn)
USAGE * PRICING * Hypothesis 3.980 3 1.327 INCOME
Error .001 .007 .123(oo)
CLASS * PRICING * Hypothesis 1.676 3 INCOME
Error .(ii) USAGE * CLASS * Hypothesis 1.410 3 .470 PRICING * INCOME
Error 4.323 2.743 1.576(pp)
PVTPERCN * Hypothesis 1.486 3 PRICING * INCOME
Error .(qq) USAGE * Hypothesis 1.283 3 .428 PVTPERCN * PRICING * INCOME
Error 2.560 2.185 1.172(rr)
CLASS * PVTPERCN Hypothesis 3.192 3 1.064 PRICING
INCOME Error .798 1.139 .700(ss)
USAGE * CLASS * Hypothesis 3.200 3 1.067 PVTPERCN PRICING * INCOME
Error 593,666 802 .740(b)
SHIRTBRN * Hypothesis .515 3
.027 ( .870
2.669 I .775
.702 ! .803
1.199 1 .840 1
.151 .923
1.358 .431
2.092 .771
10.762 .973
.298 .827
.365 j .788
1.519 .503
{
1.441 .230
INCOME
2041Pa

3
1.558 3
2.579 3
1.752 3
2.048 3
.976 3
802 3
3
2.403 3
1.373 3
802 3
.(qq) .637
2.480(tt) 1.149
I.462(uu) 2.016
2.534(vv) .457
I.055(ww) 2.853
.585(xx) .953
.740(b)
.(qq) 1.638
1.346(yy .338
.878(zz', 1.246
.740(b)
2.601
1.911
3.864 3.446
3.772 6.049
4.441 1.372
2.160 8.558
.571 2.860
593.666 .444
4.913
3.236 1.013
1.205 3.738
593.666 1.813
.257 .854
.786 .585
.796 .608
.434 j .752
4.875 ! .324
1.288 .277
1.216 .461
.385 ; .786
1.683 .169
Error JSAGE * Hypothesis SHIRTBRN INCOME
Error LASS * SHIRTBRN Hypothesis INCOME
Error USAGE * CLASS * Hypothesis S1-IIRTBRN INCOME
Error PVTPERCN * Hypothesis SHIRTBRN INCOME
Error USAGE * Hypothesis PVTPERCN SHIRTBRN INCOME
Error CLASS * PVTPERCN Hypothesis * SHIRTBRN INCOME
Error USAGE * CLASS * Hypothesis PVTPERCN S 1-I I RTB RN INCOME
Error PRICING * Hypothesis SHIRTBRN INCOME
Error USAGE * PRICING * Hypothesis SHIRTBRN INCOME
Error CLASS * PRICING * Hypothesis SHIRTBRN INCOME
Error USAGE * CLASS * Hypothesis PRICING SHIRTBRN INCOME
Error PVTPERCN * Hypothesis PRICING * SHIRTBRN INCOME
Error USAGE * Hypothesis PVTPERCN PRICING SHIRTBRN INCOME
Error
205 I 1' g c
.(qq) 2.521 3
,(Q9)

CLASS * PVTPERCN Hypothesis 1.112 3 * PRICING SHIRTBRN INCOME
Error I I .(qq)
a .060 MS(INCOME) + .940 MS(Error)
b MS(Error)
c .433 MS(USAGE * INCOME) + .567 MS(Error)
d .484 MS(CLASS * INCOME) + .516 MS(Error)
e .487 MS(PVTPERCN * INCOME) + .513 MS(Error)
f .435 MS(PRICING * INCOME) + .565 MS(Error)
g .463 MS(SHIRTBRN * INCOME) + .537 MS(Error)
h .979 MS(USAGE * INCOME) + .965 MS(CLASS * INCOME) - .991 MS(USAGE * CLASS * INCOME) + .960 MS(PVTPERCN * INCOME) - .972 MS(USAGE * PVTPERCN * INCOME) - .975 MS(CLASS * PVTPERCN * INCOME) + .962 MS(USAGE * CLASS * PVTPERCN * INCOME) + .972 MS(PRICING * INCOME) - .973 MS(USAGE * PRICING * INCOME) - .986 MS(CLASS * PRICING * INCOME) + .971 MS(USAGE * CLASS * PRICING INCOME) - .971 MS(PVTPERCN * PRICING * INCOME) + .967 MS(USAGE PVTPERCN * PRICING * INCOME) + .972 MS(CLASS * PVTPERCN * PRICING * INCOME) - .979 MS(USAGE * CLASS * PVTPERCN * PRICING INCOME) + .971 MS(SHIRTBRN * INCOME) - .973 MS(USAGE * SHIRTBRN * INCOME) - .985 MS(CLASS * SHIRTBRN * INCOME) + .969 MS(USAGE CLASS * SHIRTBRN * INCOME) - .948 MS(PVTPERCN * SHIRTBRN * INCOME) + .970 MS(USAGE * PVTPERCN * SHIRTBRN * INCOME) + .971 MS(CLASS * PVTPERCN * SHIRTBRN * INCOME) - .974 MS(USAGE * CLASS * PVTPERCN * SHIRTBRN * INCOME) - .963 MS(PRICING * SHIRTBRN * INCOME) + .973 MS(USAGE * PRICING * SHIRTBRN * INCOME) + .975 MS(CLASS * PRICING * SHIRTBRN * INCOME) - .973 MS(USAGE * CLASS * PRICING * SHIRTBRN * INCOME) + .960 MS(PVTPERCN * PRICING * SHIRTBRN * INCOME) - .974 MS(USAGE * PVTPERCN * PRICING * SHIRTBRN * INCOME) - .969 MS(CLASS PVTPERCN * PRICING * SHIRTBRN * INCOME) + 1.071 MS(Error)
i .400 MS(USAGE * CLASS * INCOME) + .600 MS(Error)
j .443 MS(USAGE * PVTPERCN * INCOME) + .557 MS(Error)
k .435 MS(CLASS * PVTPERCN * INCOME) + .565 MS(Error)
1 .489 MS(USAGE * CLASS * PVTPERCN * INCOME) + .511 MS(Error)
m .472 MS(USAGE * PRICING * INCOME) + .528 MS(Error)
n .434 MS(CLASS * PRICING * INCOME) + .566 MS (Error)
o .465 MS(USAGE * CLASS * PRICING * INCOME) + .535 MS(Error)
p .454 MS(PVTPERCN * PRICING * INCOME) + .546 MS(Error)
q .469 MS(USAGE * PVTPERCN * PRICING * INCOME) + .531 MS(Error)
r .464 MS(CLASS * PVTPERCN * PRICING * INCOME) + .536 MS(Error)
206IPa`}c

s .443 MS(USAGE * CLASS * PVTPERCN * PRICING * INCOME) + .557 MS(Error)
t .439 MS(USAGE * SHIRTBRN * INCOME) + .561 MS(Error)
u .434 MS(CLASS * SHIRTBRN * INCOME) + .566 MS(Error)
v .455 MS(USAGE * CLASS * SHIRTBRN * INCOME) + .545 MS(Error)
w .525 MS(PVTPERCN * SHIRTBRN * INCOME) + .475 MS(Error)
x .442 MS(USAGE * PVTPERCN * SHIRTBRN * INCOME) + .558 MS(Error)
y .447 MS(CLASS * PVTPERCN * SHIRTBRN * INCOME) + .553 MS(Error)
z .462 MS(USAGE * CLASS * PVTPERCN * SHIRTBRN * INCOME) + .538 MS(Error)
as .444 MS(PRICING * SHIRTBRN * INCOME) + .556 MS(Error)
bb .447 MS(USAGE * PRICING * SHIRTBRN * INCOME) + .553 MS(Error)
cc .438 MS(CLASS * PRICING * SHIRTBRN * INCOME) + .562 MS(Error)
dd .445 MS(USAGE * CLASS * PRICING * SHIRTBRN * INCOME) + .555 MS(Error)
ee .489 MS(PVTPERCN * PRICING * SHIRTBRN * INCOME).+ .511 MS(Error)
ff .449 MS(USAGE * PVTPERCN * PRICING * SHIRTBRN * INCOME) + .551 MS(Error)
gg .418 MS(CLASS * PVTPERCN * PRICING * SHIRTBRN * INCOME) + .582 MS(Error)
hh 1.013 MS(USAGE * CLASS * INCOME) + .994 MS(USAGE * PVTPERCN * INCOME) - .983 MS(USAGE * CLASS * PVTPERCN * INCOME) + .995 MS(USAGE * PRICING * INCOME) - .993 MS(USAGE * CLASS * PRICING * INCOME) - .988 MS(USAGE * PVTPERCN * PRICING * INCOME) + 1.000 MS(USAGE * CLASS * PVTPERCN * PRICING * INCOME) -+- .994 MS(USAGE * SHIRTBRN * INCOME) - .990 MS(USAGE * CLASS * SHIRTBRN * INCOME) - .991 MS(USAGE * PVTPERCN * SHIRTBRN * INCOME) + .995 MS(USAGE * CLASS * PVTPERCN * SHIRTBRN * INCOME) - .994 MS(USAGE * PRICING * SHIRTBRN * INCOME) + .995 MS(USAGE * CLASS * PRICING * SHIRTBRN * INCOME) + .995 MS(USAGE * PVTPERCN PRICING * SHIRTBRN * INCOME) - 1.042 MS(Error)
ii Cannot compute the error degrees of freedom using Satterthwaite's method.
jj .970 MS(USAGE * CLASS * PVTPERCN * INCOME) + .980 MS(USAGE * CLASS * PRICING * INCOME) - .987 MS(USAGE * CLASS * PVTPERCN PRICING * INCOME) + .977 MS(USAGE * CLASS * SHIRTBRN * INCOME) -.982 MS(USAGE * CLASS * PVTPERCN * SHIRTBRN * INCOME) - .982 MS(USAGE * CLASS * PRICING * SHIRTBRN * INCOME) + 1.024 MS(Error)
kk .989 MS(USAGE * CLASS * PVTPERCN * INCOME) + .994 MS(USAGE * PVTPERCN * PRICING * INCOME) - 1.006 MS(USAGE * CLASS * PVTPERCN * PRICING * INCOME) + .998 MS(USAGE * PVTPERCN * SHIRTBRN * INCOME) - 1.001 MS(USAGE * CLASS * PVTPERCN *
207 1 P L e

SHIRTBRN * INCOME) - 1.001 MS(USAGE * PVTPERCN * PRICING * SHIRTBRN * INCOME) + 1.028 MS(Error)
11 .986 MS(USAGE * CLASS * PVTPERCN * INCOME) + .997 MS(CLASS * PVTPERCN * PRICING * INCOME) - 1.004 MS(USAGE * CLASS * PVTPERCN * PRICING * INCOME) + .996 MS(CLASS * PVTPERCN SHIRTBRN * INCOME) - .999 MS(USAGE * CLASS * PVTPERCN * SHIRTBRN * INCOME) - .994 MS(CLASS * PVTPERCN * PRICING * SHIRTBRN * INCOME) + 1.017 MS(Error)
mm 1.018 MS(USAGE * CLASS * PVTPERCN * PRICING * INCOME) -+- 1.013 MS(USAGE * CLASS * PVTPERCN * SHIRTBRN * INCOME) - 1.030 MS(Error)
nn 1.002 MS(USAGE * PRICING * INCOME) + 1.014 MS(CLASS * PRICING INCOME) - .999 MS(USAGE * CLASS * PRICING * INCOME) + .999 MS(PVTPERCN * PRICING * INCOME) - .995 MS(USAGE * PVTPERCN * PRICING * INCOME) - 1.000 MS(CLASS * PVTPERCN * PRICING * INCOME) + 1.007 MS(USAGE * CLASS * PVTPERCN * PRICING * INCOME) + .991 MS(PRICING * SHIRTBRN * INCOME) - 1.001 MS(USAGE * PRICING * SHIRTBRN * INCOME) - 1.004 MS(CLASS * PRICING * SHIRTBRN * INCOME) + 1.001 MS(USAGE * CLASS * PRICING * SHIRTBRN * INCOME) - .987 MS(PVTPERCN * PRICING * SHIRTBRN * INCOME) + 1.002 MS(USAGE * PVTPERCN * PRICING * SHIRTBRN * INCOME) -F .997 MS(CLASS * PVTPERCN * PRICING * SHIRTBRN * INCOME) - 1.027 MS(Error)
00 .998 MS(USAGE * CLASS * PRICING * INCOME) -F .993 MS(USAGE PVTPERCN * PRICING * INCOME) - 1.005 MS(USAGE * CLASS PVTPERCN * PRICING * INCOME) + .999 MS(USAGE * PRICING SHIRTBRN * INCOME) - 1.000 MS(USAGE * CLASS * PRICING * SI-IIRTBRN * INCOME) - 1.000 MS(USAGE * PVTPERCN * PRICING * SHIRTBRN INCOME) + 1.015 MS(Error)
pp 1.008 MS(USAGE * CLASS * PVTPERCN * PRICING * INCOME) + 1.002 MS(USAGE * CLASS * PRICING * SHIRTBRN * INCOME) - 1.010 MS(Error)
qq Cannot compute the appropriate error term using Satterthwaite's method.
rr 1.012 MS(USAGE * CLASS * PVTPERCN * PRICING * INCOME) -+- 1.007 MS(USAGE * PVTPERCN * PRICING * SHIRTBRN * INCOME) - 1.020 MS(Error)
ss 1.007 MS(USAGE * CLASS * PVTPERCN * PRICING * INCOME) + .997 MS(CLASS * PVTPERCN * PRICING * SHIRTBRN * INCOME) - 1.004 MS(Error)
tt .984 MS(USAGE * CLASS * SHIRTBRN * INCOME) + .986 MS(CLASS * PVTPERCN * SHIRTBRN * INCOME) - .989 MS(USAGE * CLASS k
PVTPERCN * SHIRTBRN * INCOME) + .990 MS(CLASS * PRICING SHIRTBRN * INCOME) - .988 MS(USAGE * CLASS * PRICING * SHIRTBRN * INCOME) - .984 MS(CLASS * PVTPERCN * PRICING * SHIRTBRN * INCOME) + 1.001 MS(Error)
uu 1.005 MS(USAGE * CLASS * PVTPERCN * SHIRTBRN * INCOME) + 1.005 MS(USAGE * CLASS * PRICING * SHIRTBRN * INCOME) - 1.010 MS(Error)
208 1

vv 1.024 MS(USAGE * PVTPERCN * SHIRTBRN * INCOME) + 1.025 MS(CLASS * PVTPERCN * SHIRTBRN * INCOME) - 1.028 MS(USAGE * CLASS * PVTPERCN * SHIRTBRN * INCOME) + 1.013 MS(PVTPERCN * PRICING * SHIRTBRN * INCOME) - 1.027 MS(USAGE * PVTPERCN * PRICING * SHIRTBRN * INCOME) - 1.023 MS(CLASS * PVTPERCN * PRICING * SHIRTBRN * INCOME) + 1.016 MS(Error)
ww 1.004 MS(USAGE * CLASS * PVTPERCN * SHIRTBRN * INCOME) + 1.004 MS(USAGE * PVTPERCN * PRICING * SHIRTBRN * INCOME) - 1.007 MS(Error)
xx 1.002 MS(USAGE * CLASS * PVTPERCN * SHIRTBRN * INCOME) + .998 MS(CLASS * PVTPERCN * PRICING * SHIRTBRN * INCOME) - 1.000 MS(Error)
yy 1.000 MS(USAGE * CLASS * PRICING * SHIRTBRN * INCOME) + 1.001 MS(USAGE * PVTPERCN * PRICING * SHIRTBRN * INCOME) - 1.001 MS(Error)
zz .998 MS(USAGE * CLASS * PRICING * SHIRTBRN * INCOME) + .994 MS(CLASS * PVTPERCN * PRICING * SHIRTBRN * INCOME) - .991 MS(Error)


![IJALEL, Vol.1 No.5 (2012) [Special Issue]](https://static.fdokumen.com/doc/165x107/631edf43097e038f7c093337/ijalel-vol1-no5-2012-special-issue.jpg)