Citations (5/5) - Open Journal Systems
20
12/28/2015 SafeAssign Originality Report https://safeassign.blackboard.com/B2Http/originalityReport?paperId=109356902 1/20 JEDEP 15 (4/2015) PROF. UNIV. DR. MANUELA EPURE Prof. univ. dr. Manuela Epure on Mon, Dec 28 2015, 6:33 PM 5% match Submission ID: 88849275 Citations (5/5) Select Sources & Resubmit Cancel Resubmit Uncheck any citation sources you want SafeAssign to ignore during reprocessing (online) = ISSN 2285 – 3642 ISSNL = 2285 – 3642 Journal of Economic Development, Environment and People Volume 3, Issue 3, 2014 URL: http://jedep.spiruharet.ro email: [email protected] Word Count: 6,098 Attachment ID: 109356902 JEDEP15_7Majid_p6575.docx 5% 1 http://www.fs.fed.us/rm/value/researchrecfee_bibliog.html 2 Another student's paper 3 Another student's paper 4 ProQuest Document 5 http://docslide.us/documents/2012gbatareadingsbook.html Plagiarism attempt possible SafeAssign found that some of the words in this submission contain characters from different languages, or character sets. Mixing character sets does not always mean plagiarism has occurred, but it can be used to avoid automatic detection. You may want to review this document manually to verify its originality.
-
Upload
khangminh22 -
Category
Documents
-
view
1 -
download
0
Transcript of Citations (5/5) - Open Journal Systems
12/28/2015 SafeAssign Originality Report
https://safeassign.blackboard.com/B2Http/originalityReport?paperId=109356902 1/20
JEDEP 15 (4/2015) PROF. UNIV. DR. MANUELA EPURE
Prof. univ. dr. Manuela Epure on Mon, Dec 28 2015, 6:33 PM 5% match
Submission ID: 88849275
Citations (5/5)
Select Sources & Resubmit Cancel Resubmit
Uncheck any citation sources you want SafeAssign to ignore during reprocessing
(online) = ISSN 2285 – 3642 ISSNL = 2285 – 3642 Journal of Economic
Development, Environment and People Volume 3, Issue 3, 2014
URL: http://jedep.spiruharet.ro email: [email protected]
Word Count: 6,098
Attachment ID: 109356902
JEDEP15_7Majid_p6575.docx
5%
1 http://www.fs.fed.us/rm/value/researchrecfee_bibliog.html
2 Another student's paper
3 Another student's paper
4 ProQuest Document
5 http://docslide.us/documents/2012gbatareadingsbook.html
Plagiarism attempt possible
SafeAssign found that some of the words in this submission contain characters from differentlanguages, or character sets. Mixing character sets does not always mean plagiarism hasoccurred, but it can be used to avoid automatic detection. You may want to review thisdocument manually to verify its originality.
12/28/2015 SafeAssign Originality Report
https://safeassign.blackboard.com/B2Http/originalityReport?paperId=109356902 2/20
(online) = ISSN 2285 – 3642 ISSNL = 2285 – 3642 Journal of Economic
Development, Environment and People Volume 4, Issue 4, 2015
URL: http://jedep.spiruharet.ro email: [email protected]
Estimating the Outdoor Recreational Value of Chitgar Forestial Park of Tehran
with the Use of Contingent Valuation Method (CV)
Majid Kholuzini Sharahi1, Mohamad Hosein Mohamadi2, Azam Abedini3 1,3
University of Allame Tabataei, Tehran 2University of Ashrafi Isfahani, Isfahan
Abstract. Among issues related to the environment, one of the most important
issues is pricing the environment. In the present study, the outdoor recreational
value of Chitgar Jungle Park of Tehran and its visitors' willingness to pay per visit
(WTP) were estimated by using Contingent Valuation method (CV) and 140
questionnaires based on dichotomous choice. The results revealed that 30 percent
of the surveyed people were willing to pay an entrance fee and the mean
willingness to pay for each visitor was estimated at 3076 Rials and its total annual
recreational value was estimated at 5 billion Rials. Among the effective variables
on individuals' visit of this park, recommendation, income, pervisit cost, family
size, and visits during a year were 1% significant; park facilities and quality were
5% significant; 1 AND THE VISITORS' use of personal vehicles, education,
type of house, as well as job were 10% significant.
Keywords: Environment, Contingent Valuation (CV), Willingness to pay, Logit
model JEL Codes: Q51, C25, Q29 Introduction Jungle ecosystems have a number
of tangible and intangible economic benefits for human beings, which can be
classified into four groups, namely, direct values, indirect values, select values,
and existence values. Direct values are referred to direct use of resources which, in
the case of jungles, include not only timber trade but also resin, sap and aliments
such as walnuts, hazelnuts and Recreational and tourist incomes are also direct
values. Indirect values are referred to the benefits which people can gain
indirectly. Environmental and ecological benefits such as absorption of carbon
dioxide, preventing soil erosion, controlling floods, modifying the weather and
12/28/2015 SafeAssign Originality Report
https://safeassign.blackboard.com/B2Http/originalityReport?paperId=109356902 3/20
biodiversity are examples of indirect values. Select values include all direct and
indirect values which are realizable in future or the values attributed to the ability
to use the products and services in future such as future medical and agricultural
discoveries concerning plants and new ecological resources. Existence values
include the intrinsic value of a resource such as jungle and the value which people
consider solely for the existence of that resource and its environmental activities.
Therefore, recreational and tourist values are direct values of jungles and parks
and include recreation, spending leisure time, walking and aesthetics (Hamid
Amir Nejad, 1385 (2006)).
Statement of the Problem Contributions Capitals related to nature and
environments are very important in sustainable development and so far many
attempts have been made to estimate and appraise the financial value of
ecosystems' services. On a micro level, researches regarding valuation will lead us
to the data related to the ecosystem's function and its pivotal role in human
welfare; moreover on a macro level, ecosystem valuation can participate in
creating and modifying the indices of welfare and sustainable development
(Howarth & Farber, 2002).
Most of environmental products and services can be placed in public goods
category because they frequently have no price tag and there are doubts about
their actual price (Karimzadegan, 1372 (1993)).
Valuation can be defined as the process of evaluating a particular object or
function. The valuation of nonmarket functions and services of environment is of
great importance due to many reasons such as exploring environmental and
ecological benefits by humans, presenting the environmental issues to authorities,
making connection between economical policies and natural incomes, measuring
the role and importance of environmental resources in human welfare and
sustainable development, modifying national accounts such as GDP, as well as
preventing the destruction and overuse of natural resources (Vaze 1998, Ashim
2000, Guo et al. 2001).
12/28/2015 SafeAssign Originality Report
https://safeassign.blackboard.com/B2Http/originalityReport?paperId=109356902 4/20
In this study, we attempt to estimate the outdoor recreational value of Chitgar
Jungle Park of Tehran by using contingent valuation method. We will determine
the factors influencing the payers’ willingness to visit as well.
Theoretical Pricing Model The value of natural resources in environmental
economics includes use value and nonuse value. The use value is the value gained
from using products and services and is related to consumer's surplus in
recreational use of natural resources. The use value includes the following: 1)
Current use value, which is gained from the present use; 2) Expected use value,
which is related to the use value in near future; 3) Probable use value, which is
employed for use value in far future. The nonuse value is the utility gained while
we have not actually used any products. It includes existence value, friendship
value, heritage value, and preservation value. In addition, urban parks and green
areas have several more functions as well. Nature always attracts people with its
beauties. Green vegetation with fountains, resorts and purlieu is a proper means
to lower stress and is a good opportunity for exchanging ideas among families.
Now the main question is that how valuable the environment is for people and
how much they are willing to pay to enter parks. Although natural attractions have
remarkable benefits, they have limited financial resources. Charging entrance fee
can be the best method to raise funds and there are two views regarding this issue:
1. Publicgood View: In this view, income taxes are the only valid resource for
raising funds because they are national and belong to every individual and
maximize the welfare of all society; therefore, they should be free for everyone.
2. Users' payments View: The supporters of this view believe that profits belong to
those who use the environment because a small population of general public
constantly visits these areas. Therefore, charging entrance fee is a suitable policy
and can be a way of making money from international tourists because they pay
taxes where they come from. It is stated that this policy may be detrimental to the
lowincome parts of the society and may decrease their use, but the answer is that
with various entrance fees, this problem can be resolved to some extent.
12/28/2015 SafeAssign Originality Report
https://safeassign.blackboard.com/B2Http/originalityReport?paperId=109356902 5/20
Evaluating environmental goods is highly difficult because they have some of the
public goods features such as being indivisible and not possessable; therefore,
they have no market and it is difficult to price them because when there is no
market, allocations are not effective.
Demand function: In consumers' preferences is one of the basics of economics
and the most usual method is demand function. The demand function shows the
amount of commodity which a person with a certain income and by considering a
certain range of prices demands. In fact, demand graph is one of the methods to
summarize the importance of a product for a person; moreover by summarizing a
person's preferences for a product, we can calculate its total consumption via
demand curve. There are a number of problems in calculating demand function of
environmental goods, and the main problem is lack of market for environmental
goods. However, we know that people value environmental goods and are ready to
pay some money to preserve them. Therefore, we use the indirect method to
calculate the demand function.
Indirect Methods for Calculating Environmental Goods Demand:
There are two simple methods: 1) Revealed preference method; 2) Expressed
preference method.
1. Revealed preference method: This method is based on people's actual
preferences in the market and extracting the demand through exchanging money
and goods.
2. Expressed preference method: It refers to expressing the use value or nonuse
value of environmental goods by people. In this method, no goods is exchanged
and choices are hypothetical and it includes asking people questions.
Revealed preference includes two methods:
1. Hedonic method: In case of lack of market, the value of an environmental
phenomenon is calculated according to the market value of similar goods. Any
difference between prices is the result of environmental conditions difference
12/28/2015 SafeAssign Originality Report
https://safeassign.blackboard.com/B2Http/originalityReport?paperId=109356902 6/20
which affects the quality of products. For example, if other conditions are
identical, it is expected that a property in an area with good weather has a higher
price compared to a property in an area with polluted weather.
2. Household production method: Consumers combine private goods with
environmental goods and use them so that they can obtain other desired goods.
For example, if a house is located near a street and noise pollution annoys the
households, it can be reduced by doubleglazing the windows; in other words, we
can obtain environmental goods (peace and quiet) by spending money on a
private goods. Therefore, the expense that the family undergoes is equal to the
value of environmental goods.
The approach of expressed preference is dominant method of contingent
valuation, that is, if there was a market, how much a person would pay for
environmental goods. In other words, the consumer is asked how much he is
willing to pay to obtain environmental goods, or how much he is willing to receive
to decide not to use environmental goods. In fact, this method is based on a
hypothetical market which is used as an indirect method of demand estimation for
environmental valuations.
Methods for Estimating Outdoor Recreational Value of Jungle Parks and
Choosing Contingent Valuation Method Travel cost method: This method is based
on the evaluation of environmental sceneries and transportation projects, that is,
if an individual goes to a recreational location with the entrance fee of zero, the
minimum cost for that place equals to his access cost and we must add other costs
to it as well. Since it varies from one person to another, we can find a demand
function for that recreational place and by using that function we can calculate the
consumer surplus as well. This method has some flaws as well; for instance: 1) It
can only be used for certain locations (recreational attractions). 2) If an individual
intends to visit several recreational places, it will be difficult to separate them. 3)
The use of some places is seasonal and this method is not a shortterm method
and the valuation may become biased. 4) Since the distance between the place and
people's houses varies, the value estimation may become unreal.
12/28/2015 SafeAssign Originality Report
https://safeassign.blackboard.com/B2Http/originalityReport?paperId=109356902 7/20
Considering these limitations, contingent valuation method is frequently used.
The contingent valuation method was primarily proposed in theory by S.V.
CiriacyWantrup (1947) and the first practical application of the method was
applied in 1963 by Davis. This method includes surveying people directly
regarding how much they value recreational or relaxing utilities. In fact, the
researcher's goal is to influence the degree of people's willingness to pay by
explaining market conditions in a hypothetical market so that he can inform
people why financial resources are necessary and in what parts, they will be spent.
This method can be applied via two approaches:
1. Experimental approach based on simulation 2. Collecting data through
questionnaires or survey techniques.
2 WILLINGNESS TO PAY: The willingness to pay is a criterion for measuring
a consumer's benefits from a change in price or amount of a merchandisewhich
most of it is related to outdoor recreational utilities and natural attractions since a
natural attraction with free access is a nonmarket goods. The willingness to pay
(WTP) is the amount a person would be willing to pay in order to obtain an
increase in his welfare or to avoid a decrease in his welfare. Estimation of WTP for
natural attractions is the basis of social costbenefit analysis which is based on
KaldorHicks criterion. In general, when there is no market, the ultimate
willingness to pay for a goods or service is considered as its shadow price, which
depends on distribution of income, wealth and resource allocation in the entire
economy and society.
Effective Factors on Willingness to Pay The value that people consider for visiting
and using recreational areas belongs to these places and people can show that by
the amount of money they are willing to pay. The difference in people's
willingness to pay comes from demographical, economical, social, and other
related factors.
According to Ajzen Model (1966), behavioral variables such as willingness to pay
are a function of attitudes influenced by individuals’ behavioral experiences. The
12/28/2015 SafeAssign Originality Report
https://safeassign.blackboard.com/B2Http/originalityReport?paperId=109356902 8/20
findings of Manfredo and Ker (1991) indicate that people’s past behavior is
effective in willingness to pay. Knetsch (1984) showed that the demand for natural
attractions with unique sceneries and remarkable recreational facilities is inelastic
to price.
Variables such as income, visitor’s overall satisfaction, using a guide while
visiting, group tour, and economicpolitical stability have positive influence and
the number of previous visits has negative influence on willingness to pay
(Reynisdottir & Song & Ayrusa, 2008).
Advantages and Ddisadvantages of this Method Criticism: The results of surveys
are based on hypothetical assumptions; therefore, they are biased (Hausman,
1993), which can be as a result of choosing incorrect samples, low ratio of
answers, and other related factors.
According to Arrow (1993), the identified bias in this method is: Design bias,
which includes the subjectivity for setting the asking price with payment tools.
Operational bias is referred to lack of knowledge concerning the goods which we
will evaluate. Hypothetical bias suggests that the force to pay may not really
happen in near future. Strategic bias recommends that people's willingness does
not reveal their actual preference, that is, general public tend to influence the
future pay by overstating or understating their real willingness to pay. In fact, the
aforementioned bias is categorized in four main categories.
Hypothetical bias: The main reason for hypothetical bias, according to
researchers, is that respondents are asked to express their willingness to pay for
changes. Moreover, they are frequently hypothetical and the responses may be
unreliable. The best studies are those closer to reality.
Information bias: It originates from the information provided to the respondents
in such a way that the primary prices offered to people are effective in forming
their paying. In payment vehicle bias, it is stated that reasonable behavior can
explain the reason for the relation between willingness to pay and payment tools.
Evidence suggests that the amount of asking price can be sensitive to payment
12/28/2015 SafeAssign Originality Report
https://safeassign.blackboard.com/B2Http/originalityReport?paperId=109356902 9/20
method.
Strategic bias: it is caused by respondent’s personal tendency to influence the
results of the study. This bias is one of the clear examples of hitchhiking
phenomenon in which the respondent, while answering the question, considers if
he will really be asked to pay the asking price in the future; subsequently, he
expresses the amount of his willingness to pay based on that problem.
Although bias cannot be completely eliminated, careful design of the
questionnaire and statistical process of survey can control the bias of respondents
and minimize them.
This method has several advantages such as widespread use, reliable valuation of
travels without considering if the aforementioned place is the first destination or
the second, ability to estimate both use value and nonuse value and the possibility
to study the surveys which lack market data. These have made this technique a
highly practical tool in economic analyses.
Payment vehicle: It is very important to choose an appropriate payment vehicle
because the type of payment vehicle can greatly affect the results. In general, the
common vehicle for recreational values charges an entrance fee and other vehicles
pertaining to preservation and security are usually in the forms of taxes, entrance
fees, or cash donations.
The most important ways of collecting data are: Direct interviews, questionnaires
and telephone surveys. The direct interviews for being expensive, surveying via
letters for the low number of received responses, and telephone surveys for
limiting the information are not usually used. In most surveys pertaining to
contingent, valuation questionnaires are used. According to aforementioned
points, in order to let respondents know about the hypothetical market, a DDC
questionnaire was designed for interviews and finding out visitors’ WTP for
estimating the outdoor recreational value of Chitgar jungle park of Tehran. This
questionnaire consists of two parts. The first part includes the socioeconomic
status of respondents in a way that it surveys regarding their education, number
12/28/2015 SafeAssign Originality Report
https://safeassign.blackboard.com/B2Http/originalityReport?paperId=109356902 10/20
of family members, income and other characteristics. The second part is related to
their willingness to pay. In this part, three offers of 3000 Rials, 5000 Rials and
7000 Rials, which were obtained by using Gauss software, were prepared in the
form of three related questions. In the first question, we asked about the average
price (5000 Rials) which by this means: Chitgar Park has provided an opportunity
of recreation and relaxation for you; are you willing to pay 5000 Rials as an
entrance fee to use them? In case of negative answers, the lower price (3000
Rials) was asked and in case of positive answer, the higher price (7000 Rials) was
asked. The respondents could respond either positive or negative answer and if
they were not willing to pay anything, they were able to give no answer. To
estimate the adequate number of samples, Cochran Formula and simple random
sampling were used in this study. The adequate number of samples was obtained
based on analysis of mean and variance of the statistical population resulted from
filling 30 questionnaires. At the end, 145 questionnaires were filled and 19 of them
were placed aside because they were incomplete or the questions were not
understood by respondents. The other 126 questionnaires were analyzed.
Questionnaires were completed in two weeks in summer 1391 (summer 2012).
Methodology In our methodology for estimating the willingness to pay, we assume
that the person accepts the offered entrance fee provided that he maximizes his
utility (John Asafu, 2008). The utility that a person gains by using environmental
resources is more than the time that they do not use environmental resources.
U(1,YA;S)+ε_(1 )≥U(0,Y;S)+ε_0 The difference of utility because of using
environmental resources is calculated as follows (John Asafu, 2008):
U=U(1,YA;S)U(0,Y;S)+(ε_1ε_0)∆ 1 represents acceptance of paying entrance
fee, 0 is designated as refusal of paying entrance fee. A is assigned as the offered
entrance fee, Y stands for the person’s income and S is other characteristics. ε_1
〖and ε〗_0 are random variables with the mean of zero which have been
distributed equally and independently.
(P_i), the possibility that the person will accept the price A, is as follows (based on
12/28/2015 SafeAssign Originality Report
https://safeassign.blackboard.com/B2Http/originalityReport?paperId=109356902 11/20
logit model). It is an indirect utility that the visitor gains.
represents a cumulative distribution function with a standard logistic difference.
Y stands for the person's income, A is the offered price and S is other
characteristics.
Introducing Chitgar Park Chitgar Park, with an area of 950 hectares, has always
been an attractive resort for Tehran's residents to spend their leisure time.
However, due to different problems including lack of appropriate recreational
services and security, its permanent use has not been possible. Geographically, the
park is located between Tehran and Karaj and it is surrounded by small towns.
From south, it is limited to TehranKaraj highway and railway and from north, it
is limited to Resalat highway and from west, it is limited to Peykan Shahr town
and the Botanical Garden. It is predicted that the foresight of a central lake in the
reorganization plan of Zone 22 of Tehran, with an area of about 355 hectares (the
lake basin is less than 100 hectares) and capacity of 35 million m2 of water,
located adjacent to Chitgar Jungle Park can make it the largest recreational facility
in Tehran. The land of park has many ups and downs; therefore, it has many steep
slopes ranging from 0 % to 80%.The park is mainly stretched from east to west
and the ups and downs are mostly formed by small hills. Chitgar water course
divides the park into western and eastern parts. The eastern part has an area of
about 253 hectares and the western parts covers an area of nearly 658 hectares.
The lowest and highest altitudes of the park are respectively 1225 and 1313 meters
(the difference between highest and lowest points is 88 meters). The trees
covering the park include an area of about 734 hectares. Approximately, 53
percent of these trees are acicularleaved trees. In total, acicularleaved trees
cover about 390 hectares of the park (about 48% of the park's total area). Broad
leaved trees cover 47 percent of the park.
The current facilities of Chitgar Park include culturalsports complex,
playgrounds, conference hall, storehouse, bicycle station and cycling track, fire
station, restaurants and cafes, office buildings, parking, gazebos and tents.
12/28/2015 SafeAssign Originality Report
https://safeassign.blackboard.com/B2Http/originalityReport?paperId=109356902 12/20
Most of these facilities are located in the eastern part of the park and the western
part has fewer facilities and is remained intact and wild.
Review of Literature Many efforts have been made to estimate the amount of
benefits gained from recreational forest and national parks. Such activities are an
important part of benefitcost analysis for management plans of jungle parks. In
addition, a number of researches have been made regarding environmental
preservation using contingent valuation method. The outdoor recreational value
of Madagascar Jungles was estimated $360 to $468 using travel cost method
(Maille& Menderlsohn 1991). The value of jungles of Montana State of America,
according to contingent valuation method, was $108 for each travel and for
eastern jungles of America, this amount was $10.43 a year for each household
(Krieger, 2001). The outdoor recreational value for five Korean national parks
using CV method was an average of $10.45 a year for each household (Lee Shan,
2002). 2 ECHEVERRIA, ET AL. (1995) estimated the existence value of Costa
Rican jungles $238 per hectare a year. Tomas, et al. (1997), using CV method,
found out that people were willing to pay between $5 to $325 a year in the United
States of America in order to protect groundwater from chemical pollutants.
Pajiola (2001), using CV method, estimated that locals and tourists were willing to
pay $170 and $70, respectively in order to repair the Roman Palace in the ancient
city of Split, Croatia. Togrido, et al. (2006) estimated visitors' WTP for Alonnisos
Marine Park, Greece 120 and 30 BWP for locals and tourists, respectively. 2
COSTANZA, ET AL. (1997) studied the total value of environmental and
ecological services of 17 different ecosystems around the world and reported the
outdoor recreational value of $112 for tropical jungles as well as $36 per hectare
for temperate jungles. The outdoor recreational value of Malaysian jungles, using
CV method, was estimated at $740 per hectare. Amigues, et al. (2002) estimated
the preservation value of Garonne river bank ecosystem in France, using CV
method with Tobit linear model, semilogarithmic model and Heckman twostage
model respectively at 67 FF, 66.13 FF and 133 FF. Whitehead and Finney (2003)
valued the North CarolinaCoast, US, using CV method. The mean WTP for each
visitor was $36 and the annual benefit gained from historical shipwreck park was
12/28/2015 SafeAssign Originality Report
https://safeassign.blackboard.com/B2Http/originalityReport?paperId=109356902 13/20
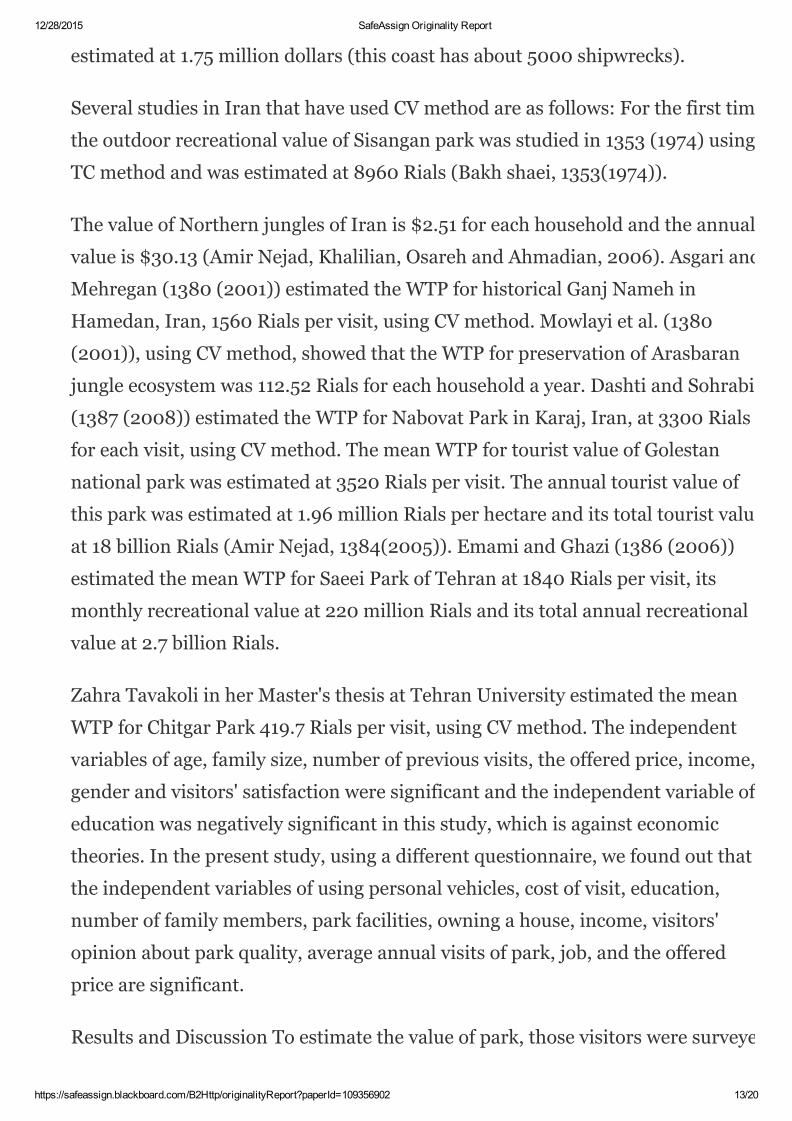
estimated at 1.75 million dollars (this coast has about 5000 shipwrecks).
Several studies in Iran that have used CV method are as follows: For the first time,
the outdoor recreational value of Sisangan park was studied in 1353 (1974) using
TC method and was estimated at 8960 Rials (Bakh shaei, 1353(1974)).
The value of Northern jungles of Iran is $2.51 for each household and the annual
value is $30.13 (Amir Nejad, Khalilian, Osareh and Ahmadian, 2006). Asgari and
Mehregan (1380 (2001)) estimated the WTP for historical Ganj Nameh in
Hamedan, Iran, 1560 Rials per visit, using CV method. Mowlayi et al. (1380
(2001)), using CV method, showed that the WTP for preservation of Arasbaran
jungle ecosystem was 112.52 Rials for each household a year. Dashti and Sohrabi
(1387 (2008)) estimated the WTP for Nabovat Park in Karaj, Iran, at 3300 Rials
for each visit, using CV method. The mean WTP for tourist value of Golestan
national park was estimated at 3520 Rials per visit. The annual tourist value of
this park was estimated at 1.96 million Rials per hectare and its total tourist value
at 18 billion Rials (Amir Nejad, 1384(2005)). Emami and Ghazi (1386 (2006))
estimated the mean WTP for Saeei Park of Tehran at 1840 Rials per visit, its
monthly recreational value at 220 million Rials and its total annual recreational
value at 2.7 billion Rials.
Zahra Tavakoli in her Master's thesis at Tehran University estimated the mean
WTP for Chitgar Park 419.7 Rials per visit, using CV method. The independent
variables of age, family size, number of previous visits, the offered price, income,
gender and visitors' satisfaction were significant and the independent variable of
education was negatively significant in this study, which is against economic
theories. In the present study, using a different questionnaire, we found out that
the independent variables of using personal vehicles, cost of visit, education,
number of family members, park facilities, owning a house, income, visitors'
opinion about park quality, average annual visits of park, job, and the offered
price are significant.
Results and Discussion To estimate the value of park, those visitors were surveyed
12/28/2015 SafeAssign Originality Report
https://safeassign.blackboard.com/B2Http/originalityReport?paperId=109356902 14/20
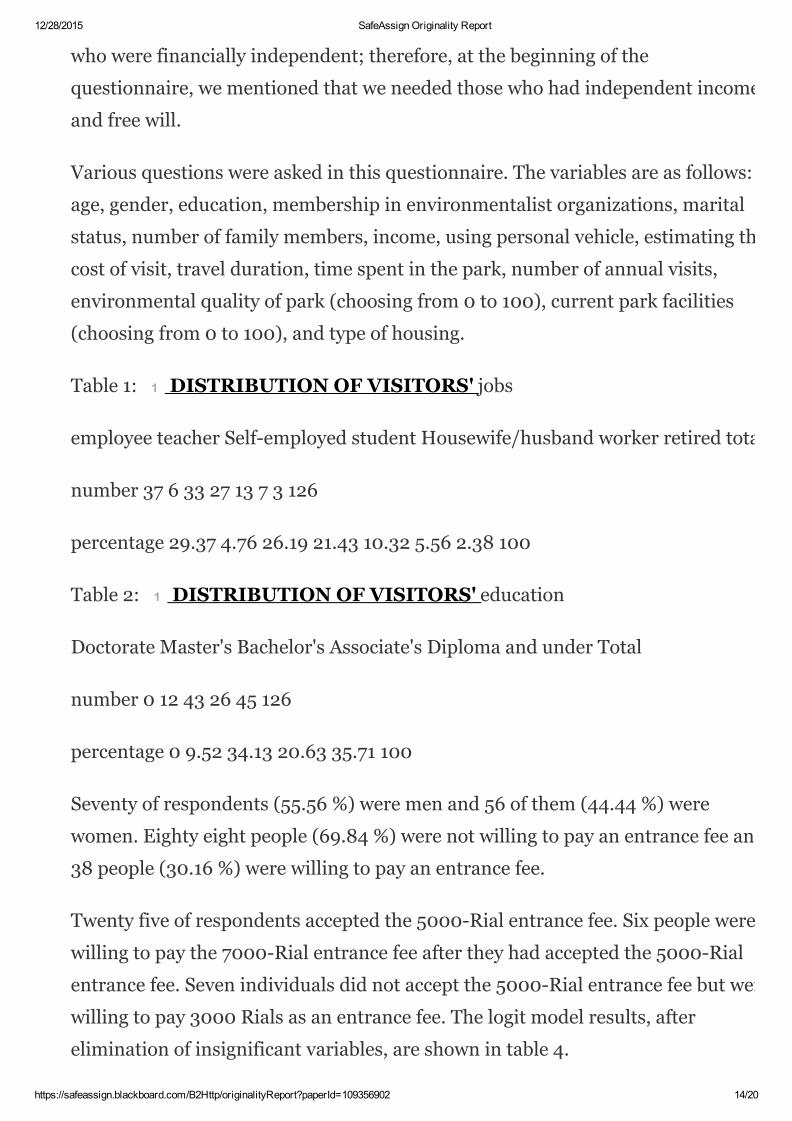
who were financially independent; therefore, at the beginning of the
questionnaire, we mentioned that we needed those who had independent income
and free will.
Various questions were asked in this questionnaire. The variables are as follows:
age, gender, education, membership in environmentalist organizations, marital
status, number of family members, income, using personal vehicle, estimating the
cost of visit, travel duration, time spent in the park, number of annual visits,
environmental quality of park (choosing from 0 to 100), current park facilities
(choosing from 0 to 100), and type of housing.
Table 1: 1 DISTRIBUTION OF VISITORS' jobs
employee teacher Selfemployed student Housewife/husband worker retired total
number 37 6 33 27 13 7 3 126
percentage 29.37 4.76 26.19 21.43 10.32 5.56 2.38 100
Table 2: 1 DISTRIBUTION OF VISITORS' education
Doctorate Master's Bachelor's Associate's Diploma and under Total
number 0 12 43 26 45 126
percentage 0 9.52 34.13 20.63 35.71 100
Seventy of respondents (55.56 %) were men and 56 of them (44.44 %) were
women. Eighty eight people (69.84 %) were not willing to pay an entrance fee and
38 people (30.16 %) were willing to pay an entrance fee.
Twenty five of respondents accepted the 5000Rial entrance fee. Six people were
willing to pay the 7000Rial entrance fee after they had accepted the 5000Rial
entrance fee. Seven individuals did not accept the 5000Rial entrance fee but were
willing to pay 3000 Rials as an entrance fee. The logit model results, after
elimination of insignificant variables, are shown in table 4.
12/28/2015 SafeAssign Originality Report
https://safeassign.blackboard.com/B2Http/originalityReport?paperId=109356902 15/20
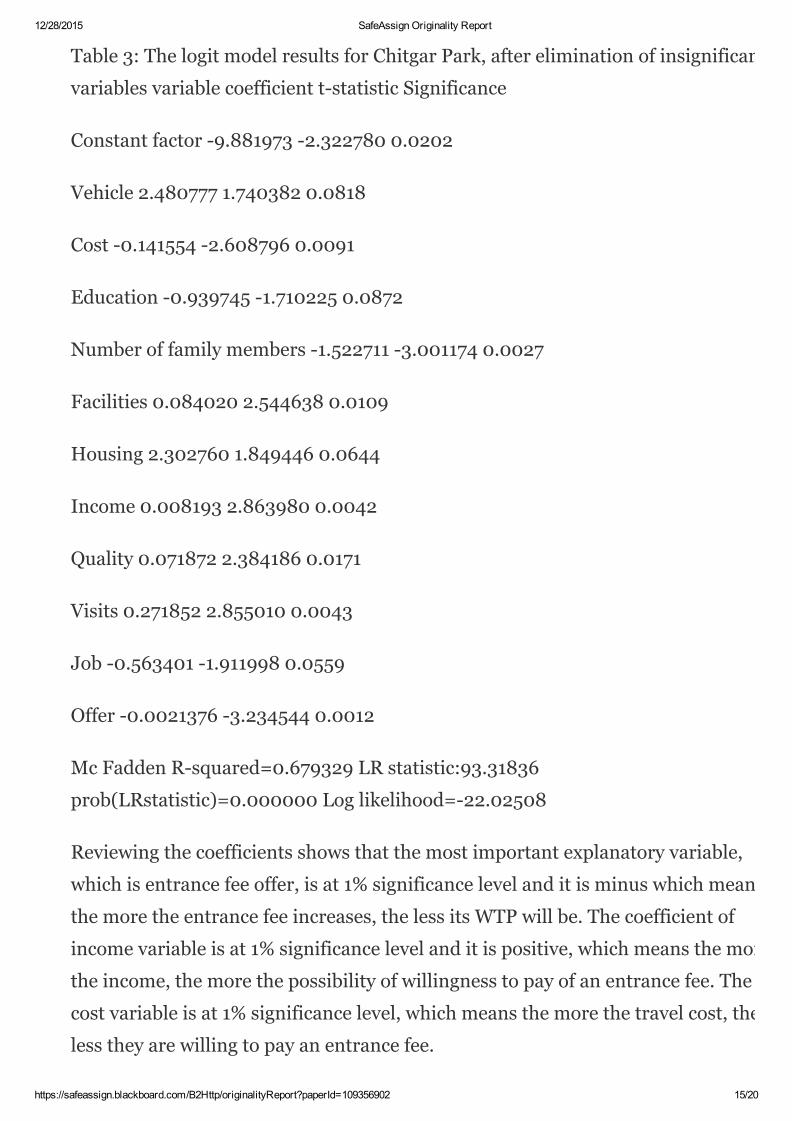
Table 3: The logit model results for Chitgar Park, after elimination of insignificant
variables variable coefficient tstatistic Significance
Constant factor 9.881973 2.322780 0.0202
Vehicle 2.480777 1.740382 0.0818
Cost 0.141554 2.608796 0.0091
Education 0.939745 1.710225 0.0872
Number of family members 1.522711 3.001174 0.0027
Facilities 0.084020 2.544638 0.0109
Housing 2.302760 1.849446 0.0644
Income 0.008193 2.863980 0.0042
Quality 0.071872 2.384186 0.0171
Visits 0.271852 2.855010 0.0043
Job 0.563401 1.911998 0.0559
Offer 0.0021376 3.234544 0.0012
Mc Fadden Rsquared=0.679329 LR statistic:93.31836
prob(LRstatistic)=0.000000 Log likelihood=22.02508
Reviewing the coefficients shows that the most important explanatory variable,
which is entrance fee offer, is at 1% significance level and it is minus which means
the more the entrance fee increases, the less its WTP will be. The coefficient of
income variable is at 1% significance level and it is positive, which means the more
the income, the more the possibility of willingness to pay of an entrance fee. The
cost variable is at 1% significance level, which means the more the travel cost, the
less they are willing to pay an entrance fee.
12/28/2015 SafeAssign Originality Report
https://safeassign.blackboard.com/B2Http/originalityReport?paperId=109356902 16/20
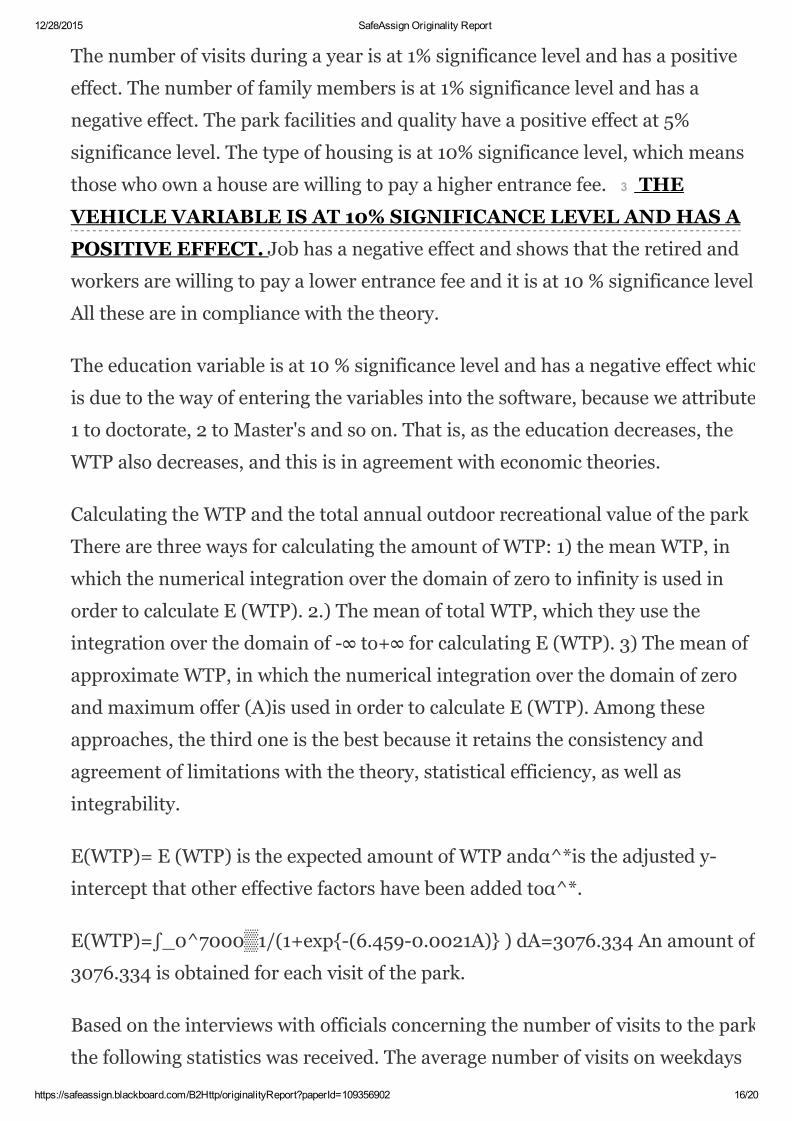
The number of visits during a year is at 1% significance level and has a positive
effect. The number of family members is at 1% significance level and has a
negative effect. The park facilities and quality have a positive effect at 5%
significance level. The type of housing is at 10% significance level, which means
those who own a house are willing to pay a higher entrance fee. 3 THE
VEHICLE VARIABLE IS AT 10% SIGNIFICANCE LEVEL AND HAS A
POSITIVE EFFECT. Job has a negative effect and shows that the retired and
workers are willing to pay a lower entrance fee and it is at 10 % significance level.
All these are in compliance with the theory.
The education variable is at 10 % significance level and has a negative effect which
is due to the way of entering the variables into the software, because we attributed
1 to doctorate, 2 to Master's and so on. That is, as the education decreases, the
WTP also decreases, and this is in agreement with economic theories.
Calculating the WTP and the total annual outdoor recreational value of the park
There are three ways for calculating the amount of WTP: 1) the mean WTP, in
which the numerical integration over the domain of zero to infinity is used in
order to calculate E (WTP). 2.) The mean of total WTP, which they use the
integration over the domain of ∞ to+∞ for calculating E (WTP). 3) The mean of
approximate WTP, in which the numerical integration over the domain of zero
and maximum offer (A)is used in order to calculate E (WTP). Among these
approaches, the third one is the best because it retains the consistency and
agreement of limitations with the theory, statistical efficiency, as well as
integrability.
E(WTP)= E (WTP) is the expected amount of WTP andα^*is the adjusted y
intercept that other effective factors have been added toα^*.
E(WTP)=∫_0^70001/(1+exp(6.4590.0021A) ) dA=3076.334 An amount of
3076.334 is obtained for each visit of the park.
Based on the interviews with officials concerning the number of visits to the park,
the following statistics was received. The average number of visits on weekdays
12/28/2015 SafeAssign Originality Report
https://safeassign.blackboard.com/B2Http/originalityReport?paperId=109356902 17/20
was 5500; on Thursdays, it was 9000 people; on Fridays, it was 12000 people and
on national Nature Day (April 2nd), it was 250,000 people. Therefore, the
number of total annual visits is 1,654,500 individuals and the total outdoor
recreational value is calculated through the following equation:
Total value of park= the mean WTP * the number of total annual visits Total value
of park= 3076.334 * 1654500= 5089794600 Thus the total outdoor recreational
value of the park is 507,327,442.05.
Conclusion In this research, we studied the outdoor recreational value of Chitgar
Park and determined whether people were willing to pay an entrance fee. We used
the CV method and dichotomouschoice questionnaires because people can
choose their criteria based on monetary measures. Given that Iran is a developing
country, only 30 % of people are willing to pay an entrance fee. In this study, the
mean WTP was 3076.334 Rials and its maximum amount was 7000 Rials. The
total outdoor recreational value of the park was estimated at 5,089,794,600 Rials,
which shows the value users allocate for the environment. The results reveal that
the amount of entrance fee, income, number of visits during a year, number of
family members and cost are the most influential factors on willingness to pay and
they are at 1 % significance level and park facilities and quality are the variables
which are at 5 % significance level. Using a personal vehicle, education, owning a
house and job are the variables that are at 10 % significance level. Since park
quality and facilities are variables influential on accepting an entrance fee, we can
attract more people to parks by creating suitable places for families and improving
the facilities including public restrooms and playgrounds. Considering the air
pollution in Tehran, attracting more people to parks can be an effective step to
increase users' psychological comfort and peace.
References Ajzen I,Brown TC,Rosenthal LH.Information bias in contingent
valuation:effects of personal relevance, quality of information, and motivational
orientation.Journal of Environmental ECONOMICS AND MANAGEMENT
1996;30;4357.
12/28/2015 SafeAssign Originality Report
https://safeassign.blackboard.com/B2Http/originalityReport?paperId=109356902 18/20
Amigues, j.,Boulatoff,C.andDesaigues, B. 2002.The benefits and costs of riparian
analysis habitat preservation: a willingness to accept / willingness to pay
contingent valuation approach.Ecological Economics.43(1):1731.
4 AMIRNEJAD, H., KHALILIAN, S.AND ASSAREH,
M.H.2006.ESTIMATING THE EXISTENCE VALUE OF NORTH
FORESTS OF IRAN BY USING A CONTINGENT VALUATION
METHOD. ECOLOGICAL ECONOMICS.58(4):665675.
Amirnejad, H.2007.Estimating the preservation value of Golestan National Park
of Iran by using individuals willing to pay.Journal of Agricultural
Economics.1(3):175188 Arrow,K.,R.Solow, R. Portney, E.Learner,R.Rander and
H.Schuman.(1993).Report of NOAA Panel on contingent valuation: Report to the
National oceanic and Atmospheric Administration.Federal Register,Vol.48,4601
4614.
Asafu JohnAdjaye and SoradaTapsuwan, “A Contingent Valuation Study of Scuba
Diving Benefits:Case Study in Mu KO Similan Marine National
Park,Thailand”,Tourism Management,29(2008),11221130.
Asgari,A.and Mehregan,N.2001.Estimating of Individuals willingness to pay of
cultural historic bequest using a contingent valuation method. 5
AHAMEDANGANJNAME CASE STUDY. Journal of Economical
Researches,1(2):93115.
Ashim,G.B. 200. Green national accounting:Why and How? Environment and
Development Economics.5(1):2548.
Bakh shaei, A.1353.Introduction of National parks and Forests.Tehran
Universitypress.
5 DASHTI,GH .AND SOHRABI, F .2009.RECREATIONAL VALUE OF
NABOVAT PARK OF KARAJ BASED ON CONTINGENT
VALUATION.JOURNAL OF THE IRANIAN NATURAL
RESOURCES.61(4):6977.
12/28/2015 SafeAssign Originality Report
https://safeassign.blackboard.com/B2Http/originalityReport?paperId=109356902 19/20
2 ECHEVERRIA, J., HANRAHAN, M.AND SOLORZANO, R.1995.
VALUATION OF NONPRICED AMENITIES PROVIDED BY THE
BIOLOGICAL RESOURCES WITHIN THE MONTERVERDE CLOUD
FOREST PRESERVE, COSTA RICA. ECOLOGICAL ECONOMICS.13:43
52.
EmamiMeybodi, A., and Ghazi, M. 2008. 5 ESTIMATION OF ECONOMIC
RECREATIONAL VALUE OF THE SAEE PARK OF TEHRAN, IRAN BY
USING THE CONTINGENT VALUATION METHOD. 2 JOURNAL OF
ECONOMIC RESEARCH. 36: 187220 Guo, Z., Xiao, X. Gan , Y. and Zheng ,
Y.2001.Ecosystem functions ,services and their values a case study in Xingshan
country of china. Ecological Economics.38(1):141145.
Howarth, B.R., and S.Farber.2002.Accounting for the value of ecosystem services.
Ecological Economics.41(3):421429.
Knesth JL, Sinden JA.Willingness to pay and compensation
demanded:experimental evidence of an unexpected disparity in measures of
values.Quarterly Journal of Economics1984;99:57021.
Krieger, D. J. (2001). 2 ECONOMIC VALUE OF FOREST ECOSYSTEM
SERVICES: A review. The wilderness society,Washington, D.C.,U.S.A.
Lee, C. & Han,S (2002).Estimating the Use and Preservation Values of National
Parks Tourism Resources Using a Contingent Valuation Method, Tourism
Management,23:pp531540.
Maille, P.& R. Mendelsohn, (1991).Valuing Ecotourism in Madagascar,New
Haven:Yale school of forestry,Mimeo.
Molaei, M., Yazdani, S. and Sharzehi,Gh.2009.Estimating preservation value of
Arasbaran forest ecosystem using contingent valuation. 1 JOURNAL OF
AGRICULTURAL ECONOMICS. 3(2):3764.
Pagiola, S. 2001. Valuing the Benefits of investments in cultural heritage: The
12/28/2015 SafeAssign Originality Report
https://safeassign.blackboard.com/B2Http/originalityReport?paperId=109356902 20/20
historic core of split. In Paper presented at the international conference on
economic valuation of cultural heritage, Cagliari, 1920.
Tavakoli Kermani, Zahra. 2009. An Estimation of Economic_Recreational Value
of Chitgar Forest Park, Using the Contingent Valuation Method, a thesis
submitted to the Graduate Studies Office in particular fulfillment of the
requirement for the degree of Master of Arts in Environmental Economics.
Thomas, H. and Christopher, B. 1997. Conjonint analysis of groundwater
protection programs. 1 AMERICAN JOURNAL OF AGRICULTURAL
ECONOMICS.26(2):229236.
Togridou, A., Hovardas,T. and Pantis, J.D.2006.Determinantes of visitors’
willingness to pay for the National Marine Park of Zakynthos, Greece.
Vaze, P.1998.System of environment and economic accounting(SEEA).Chapter
13,London:ONS,UK.
Whitehead, J. C .and Finney, S.2003 .Willingness to pay for submerged maritime
cultural resources. Journal of Cultural Economics.27 (4):231240.
12
11