2008 Annual Report - RenaissanceRe Holdings
230
2008 Annual Report
-
Upload
khangminh22 -
Category
Documents
-
view
3 -
download
0
Transcript of 2008 Annual Report - RenaissanceRe Holdings

2008 Annual Report

Financial Highlights - 1 Letter to Shareholders - 2 Message from the Chairman - 11 Executive Committee - 12Opportunities in Agribusiness and Crop Insurance Risk - 14 Board of Directors - 18 Senior Officers - 19Comments on Regulation G - 21 Form 10-K - 23 Financial and Investor Information - Inside Back Cover
RenaissanceRe is a leading provider of property catastrophe
reinsurance and insurance worldwide. Founded in Bermuda in 1993, the
Company has gained recognition for excellence in the industry through
disciplined underwriting, capital management expertise, sophisticated risk
modeling and responsive client service. RenaissanceRe is traded on the
New York Stock Exchange under the ticker symbol ‘RNR’.
Company Overview
Property Catastrophe and Specialty Reinsurance
We underwrite our Reinsurance businessprincipally through RenaissanceReinsurance Ltd. and DaVinciReinsurance Ltd., two of the world’sleading reinsurers, specializing in proper-ty catastrophe and specialty reinsuranceproducts. We have been a pioneer in theuse of sophisticated computer modelingfor risk analysis and management. Usingproprietary technology, our seasonedteam of underwriters seeks to construct asuperior risk portfolio, while cultivatinglong-term relationships with clients who appreciate our problem-solvingcapabilities. In addition to our expertisein property catastrophe reinsurance, our coverages include casualty clash,medical malpractice, terrorism, suretyand catastrophe-exposed workers’ compensation reinsurance.
RenaissanceRe’s Ventures unit creates joint ventures and other strategic relationships that leverage the Company’sunderwriting expertise and experience. We manage several property catastrophejoint ventures that provide additional high quality capacity to our clients andgenerate fee income for RenaissanceRe.Our principal joint ventures include Top Layer Reinsurance Ltd. and DaVinciReinsurance Ltd., and we structure otherjoint ventures when market opportunitiesarise. We make strategic investments toprovide capital to existing clients in formsother than reinsurance. We also structure new ventures in partnership with othermarket participants in non-catastropheclasses of risk.
RenaissanceRe’s Individual Risk businessis written by the Glencoe Group throughits operating subsidiaries. Individual Riskproducts primarily include commercialand homeowners’ property coveragesincluding catastrophe-exposed products,multi-peril crop, commercial liability coverages including general, automobile,professional and various specialty products, and reinsurance of other insurers on a quota share basis. IndividualRisk business is produced through four distribution channels: a whollyowned program manager, third-party program managers, quota share partnersand brokers.
Individual Risk Ventures

1
(In thousands of United States dollars, exceptper share amounts and percentages) 2008 2007 2006 2005 2004
Gross premiums written . . . . . . . . . . $1,736,028 $1,809,637 $ 1,943,647 $ 1,809,128 $ 1,544,157
Operating income (loss)(1) . . . . . . . . . . 193,034 735,453 796,099 (274,451) 109,666
Net (loss) income (attributable)
available to common shareholders . . . (13,280) 569,575 761,635 (281,413) 133,108
Total assets . . . . . . . . . . . . . . . . . . . . $ 7,984,051 $ 8,286,355 $7,769,026 $ 6,871,261 $ 5,526,318
Total shareholders’ equity . . . . . . . . . $3,032,743 $ 3,477,503 $3,280,497 $2,253,840 $2,644,042
Per common share amounts
Operating income (loss) - diluted(1)(2) . . . $ 3.04 $ 10.24 $ 11.05 $ (3.89) $ 1.53
Net (loss) income - diluted(2) . . . . . . . $ (0.21) $ 7.93 $ 10.57 $ (3.99) $ 1.85
Tangible book value
per common share(1) . . . . . . . . . . . . $ 36.73 $ 40.94 $ 34.30 $ 24.52 $ 30.19
Dividends per common share . . . . . . . $ 0.92 $ 0.88 $ 0.84 $ 0.80 $ 0.76
Operating ratios
Operating return on average
common equity (1) . . . . . . . . . . . . . . 7.4% 27.0% 37.9% (13.3%) 5.1%
Net claims and claim expense ratio . . . 54.8% 33.6% 29.2% 116.6% 81.9%
Underwriting expense ratio . . . . . . . . 24.2% 25.7% 25.5% 23.1% 22.5%
Combined ratio . . . . . . . . . . . . . . . . . 79.0% 59.3% 54.7% 139.7% 104.4%
Financial HighlightsRenaissanceRe Holdings Ltd. and Subsidiaries
(1) In this Annual Report, we refer to various non-GAAP measures, which are explained in the Comments on Regulation G on page 21.(2) In accordance with FAS 128, earnings per share calculations use average common shares outstanding - basic, when in a net loss position.
Tangible Book Value per Common Share plus Accumulated Dividends(1)
($)
60
45
30
15
0 ’04 ’05 ’06 ’07 ’08
Tangible Book Value
Accumulated Dividends
Gross Managed Premiums Written by Line(1)
($) millions
2,000
1,500
1,000
500
0 ’04 ’05 ’06 ’07 ’08
Individual Risk
Specialty
Managed Catastrophe
2
In many ways, 2008 was an excellent year for RenaissanceRe. While our results
were below our targeted outcome, our Company performed well
considering the forces impacting the world economy. We upheld our principles
of maintaining flexibility, focusing on prudent capital management
and careful risk selection, we were there for our customers and we positioned
ourselves for the future. As it happened, the future came upon us faster
than anticipated, and we find ourselves well prepared to execute on
potential opportunities emerging from the financial
and market dislocations of today.
Letter toShareholders
At the time of writing last year’s
Letter to Shareholders, I mentioned
potential turmoil in the financial
markets as one of the major challenges
we would likely have to face in 2008.
Few of us, however, foresaw just how
precipitous the financial market
downturn would be, or the extent
of the credit crisis. The second half
of the year saw the collapse or
near-collapse of some of the most
established financial services
institutions. To compound matters,
there were notable large natural
catastrophes, resulting in 2008 being
the third most costly year for insured
catastrophe losses.
Performing in a ToughMarket
For the year, operating income
came in at $193 million, the
result of strong underwriting profits
despite losses of $276 million from
Hurricanes Gustav and Ike. Our oper-
ating results were impacted by a total
return of negative 2.5% from our
investment portfolio, largely due to
the financial market downturn. Our
operating return on equity was 7.4%.
For the year, we suffered a net loss of

3
Neill A. CurriePresident and Chief Executive Officer
$13 million or $0.21 per fully diluted
common share reflecting the impact
of unrealized and realized losses in
our investment portfolio.
One of the weakest segments of
our portfolio was in alternative invest-
ments, our allocation to hedge funds
and private equity funds. We expect
the results of these allocations to be
more volatile than our fixed income
investments, but we also expect them
to perform well over time. As we saw
the economic environment deteriorate
we actively managed our fixed income
portfolio to seek to reduce risk in our
portfolio, for example reducing our
exposure to non-Agency securitized
assets such as Alt-A, prime mortgages
and commercial mortgages. We expect
this period of uncertainty to continue
and will actively monitor events and
their impact on our portfolio.

4
In 2008, we did not achieve the
growth in book value that we strive
for. Our tangible book value per share,
plus accumulated dividends, decreased
this year by 6.9%. The share repur-
chases we effected, principally in the
first half of the year, accounted for
approximately five points of that
decline. One tenet of our capital
management is to return excess capital
to our shareholders, and we did so this
year by buying back our stock at prices
we found attractive at the time. As the
credit markets turned, we suspended
our share buyback program in order to
better position our balance sheet for
attractive underwriting opportunities.
We have always managed our Company
for long-term results; our financial
objective is to build tangible book value
per share, plus accumulated dividends,
in excess of 15% per year over time. This
year we celebrated our 15th
anniversary and since our founding,
RenaissanceRe has generated an
average annual growth in tangible
book value per share plus accumulated
dividends of 21%.
Despite the year’s challenges, our
financial strength ratings remain high.
A.M. Best and Standard & Poor’s
affirmed the ratings of our operating
entities, highlighting our superior
risk-based level of capitalization,
excellent underwriting track record
and outstanding risk management. I
was pleased that A.M. Best upgraded
Tangible Book Value per Common Share plus Accumulated Dividends(1)
($)
60
45
30
15
0 ’99 ’00 ’01 ’02 ’03 ’04 ’05 ’06 ’07 ’08
10-Year Compounded Growth in
Tangible Book Value per Common Share
plus Accumulated Dividends 15.9%
Tangible Book Value
Accumulated Dividends
(1) In this Annual Report, we refer to various non-GAAP measures,
which are explained in the Comments on Regulation G on page 21.
Credit RatingsA.M. Best S&P Moody’s Fitch
Reinsurance Segment1
Renaissance Reinsurance A+ AA- A2 A
DaVinci A+ A+ - -
Top Layer Re A+ AA - -
Renaissance Reinsurance of Europe A+ AA- - -
Individual Risk Segment1
Glencoe A - - -
Stonington A - - -
Stonington Lloyds A - - -
Lantana A - - -
RenaissanceRe2 a- A Baa1 BBB+
1 The A.M. Best, S&P, Moody’s and Fitch ratings for the companies in
the Reinsurance and Individual Risk segments reflect the insurer’s
financial strength rating.
2 The A.M. Best, S&P, Moody’s and Fitch ratings for RenaissanceRe
represent the credit ratings on its senior unsecured debt.

5
Despite the year’s challenges, our financialstrength ratings remain high.
the financial strength rating of the
Glencoe Group and its operating sub-
sidiaries to A. We remain among a
select group of reinsurance firms with
a “Very Strong” rating from Standard
& Poor’s, and once again, we main-
tained our “Excellent” rating for
Enterprise Risk Management, which is
achieved by only a handful of compa-
nies. This year’s market turmoil makes
this rating particularly meaningful.
Capital and Service
The year ended quite differently
from the way it began. At its
outset, we encountered relatively soft
market conditions but by summer-
time, credit markets had turned
abruptly and capital, which had been
so abundant, was suddenly dear and
almost inaccessible. Debt and equity
markets virtually closed. Our
Company, though, remains financially
robust and in a strong capital position.
We were particularly active, once
again, in the Florida marketplace,
where Atlantic hurricane risk attracts
the preponderance of catastrophe
reinsurance dollars. We maintained
our long-standing leadership position
in that market and our well-earned
reputation for supporting our clients.
At the same time, we maintained our
underwriting discipline, assuming only
those risks for which we believed we
were being adequately compensated.
The year’s major catastrophe
highlight in the U.S. was Hurricane
Ike, which unleashed substantial dam-
age upon property in Texas, as well as
through Kentucky and Ohio and
other parts of the Midwest. Together
with Hurricane Gustav, these events
resulted in a large industry loss for
2008, but the outcomes were within
our expectations for events of this
magnitude, and we were adequately
prepared. We excelled once again
at rapid claims payment in the after-
math of Hurricanes Gustav and Ike, a
point on which we take great pride.

6
As the credit crisis took hold,
financial market turmoil – and not
natural catastrophic events – became
the major force driving reinsurance
pricing. As we headed into the January
2009 renewal season, we found
insurers feeling the effects of losses
from both a high-catastrophe year
and the investment markets, with
limited options of raising capital in
the debt and equity markets, shifting
relative appetites to shed, rather than
absorb, risk. We believe these dynam-
ics contributed to increased demand
for traditional reinsurance and the
balance sheet protection it affords.
At RenaissanceRe, as always, we were able
to offer capital in the form of reinsurance
to our customers when they needed it.
In our Specialty Reinsurance
business, which tends toward a few
large transactions that are likely to
change from year to year, 2008 was
not a standout year and premiums
were substantially lower than in the
prior year. But back in 2007, we
felt that sub-prime credits were likely
to develop into a major insurance
issue and so we determined to
reduce writing further reinsurance
that exposed us to that risk. Our disci-
plined approach especially affected
our casualty clash business, which
provides coverage for exposure to risk
on multiple policies from one event.
We worked with customers to provide
them with a road map for coverage.
With the market potentially poised
to turn, and with our track record of
service and consistency well estab-
lished, our specialty non-catastrophe
reinsurance lines are well positioned
for the coming period.
Building Our Franchise,Our People, Our Tools
Early in the year, as is our philoso-
phy in relatively soft market
conditions, we focused on improving
our operations and strengthening our
franchise. We expanded our specialty
reinsurance expertise with excellent
recruits and are now looking forward
We excelled once again at rapid claims payment in the aftermath of HurricanesGustav and Ike …

7
cost-effective structure, and the fact
that it is an intensively data-driven
business, to which we can bring our
superior analytical and technological
strengths in risk selection. This acqui-
sition reflected our strategy to balance
greater control over our operating
capabilities and working in partner-
ship with our program managers. We
continue to have strong relationships
with our external program managers,
who are important to us.
Another important acquisition
was that of the assets of Claims
Management Services, a claims
administrator based in Roswell,
Georgia. Our Individual Risk segment
had worked with this firm since 2005,
and found their services to be excel-
lent and their claims adjusters some of
to benefiting from their considerable
skills as attractive opportunities arise
out of the current climate. In a similar
vein, we hired noted industry talent to
expand specific Individual Risk busi-
ness areas, such as a highly respected
commercial lines specialty insurance
writer to build a team in mid-size
commercial complex risk, comple-
menting our current work in
commercial property insurance.
Also for our Individual Risk
business, which writes both primary
insurance and quota share reinsurance,
the year was highlighted by significant
acquisitions and new hires. While
many other companies were retrench-
ing, we chose instead to build up
our capabilities.
Our largest acquisition was of
the assets of Agro National, a premier
managing general underwriter of crop
insurance serving the agricultural
community. Since 2004, Agro National
had worked closely with our Individual
Risk operations as a program manager,
and we decided to strengthen our
multi-peril crop franchise. We were
particularly attracted to Agro National
for its excellent client relationships,
… for our Individual Risk business … the year was highlighted by significant acquisitions and new hires.
Gross Managed Premiums Written by Line(1)
($) millions
2,000
1,500
1,000
500
0 ’04 ’05 ’06 ’07 ’08
Individual Risk
Specialty
Managed Catastrophe
(1) In this Annual Report, we refer to various non-GAAP measures, which
are explained in the Comments on Regulation G on page 21.

8
Our joint ventures group
focuses on providing the market
with needed reinsurance capacity in
innovative ways. DaVinci, with $1.2
billion of capital, is our 38%-owned
joint venture, which enables our
partners to invest alongside us in
natural catastrophe risk through a
separate vehicle with its own balance
sheet. In 2008, DaVinci provided
a return of 7.5% despite the year’s
hurricanes, offering our partners
a sound investment with sound
underwriting results. Top Layer Re,
50%-owned by the Company, provides
higher layers of reinsurance coverage
for catastrophe-exposed regions outside
the United States. At the start of
2009, Top Layer celebrated its 10th
anniversary of profitability and an
unbroken record of no claims.
We also completed the life cycle
of Starbound II, a fully-collateralized
joint venture launched in 2007 to pro-
vide additional catastrophe reinsurance
the best in the business. Again,
this development brought a better
balance to the mix of assets we own
versus those we rent.
During the year, our
WeatherPredict Consulting affiliate
acquired Special Sensory Microwave/
Imagery technology that monitors the
wetness and temperature of global sur-
faces. This will add another dimension
to our understanding of complex natural
peril risks, particularly as it relates to our
Agro National crop insurance business.
Leveraging OurExpertise
Our Ventures unit, which offers
clients a variety of capital
provision alternatives and leverages
the Company’s core expertise into
additional avenues of revenue, had a
busy and rewarding year.
Our joint ventures group focuses on providing the market with needed reinsurance capacity in innovative ways.

9
We also increased our professional
staffing at RenRe Investment Managers
Ltd., which provides weather- and
energy-related hedging tools and risk
management products which leverage
the research of our core business units
and of WeatherPredict Consulting.
Risk MitigationOutreach
RenaissanceRe believes that
science-based loss mitigation
and safety initiatives represent the
most promising means to minimize
the physical and economic impact
of severe weather events. Along with
saving lives and reducing the costs
of catastrophes, risk mitigation can
play an important role in addressing
the issues of the availability and
capacity. The investors in Starbound
II, as well as Starbound I and
Timicuan Re, two of our previous
fully-collateralized joint ventures, have
enjoyed attractive returns, showing
that we can deliver for our partners
while increasing our ability to service
our valued reinsurance customer base.
WeatherPredict Consulting, with
its expanding team of meteorologists,
engineers, oceanographers and physi-
cists, continued to affirm its value to
the Company. With advisory services
available to outside clients as well
as to RenaissanceRe, WeatherPredict
Consulting has become a valuable
contributor to our understanding of
hurricanes and other weather-related
phenomena. For example, we were
able to place personnel on location as
Hurricane Ike made landfall, who
were able to monitor and evaluate the
impact and severity of the storm in
real time, as well as create a unique
footprint of Ike and of the accom-
panying storm surge. This helped our
underwriters to make rapid, informed
decisions and to share key information
with clients as the storm unfolded.
487665 RenRe TEXT.q6.qxd 3/11/09 6:53 PM Page 9

10
affordability of insurance in storm-
vulnerable communities. Last year, I
mentioned our partnership with the
Federal Alliance for Safe Homes, Inc.
(FLASH®), State Farm® and Simpson
Strong-Tie, to inform the population
at large about storm preparedness
through “StormStruck: A Tale of Two
Homes™”. This new exhibit opened
this summer at INNOVENTIONS
at Epcot® at the Walt Disney World®
Resort and has attracted large and
enthusiastic crowds since its launch.
In addition, this year, together
with WeatherPredict Consulting,
FLASH® and the Institute for
Business and Home Safety (IBHS),
we led a series of hurricane risk
mitigation leadership forums,
bringing together top scientists,
academics, environmentalists, first
responders and policy-makers to
advance the search for solutions and
hurricane risk mitigation awareness.
We have been encouraged by the
tremendous feedback and recognition
these forums have generated.
Looking Ahead
As we look ahead, financial
markets are still unsettled,
and we can expect to encounter a
multitude of challenges. We will
need to focus on optimally managing
our assets and allocating our available
capital most effectively to support
our clients and grow our business.
We will have to respond quickly to
market opportunities. We will have
to continue to monitor political and
regulatory activities. And we will
have to keep improving our infrastruc-
ture to continue operating at the
very highest level.
This will demand exceptional
execution, to build on the foundation
that we have worked so hard to put
in place. But I am confident that
we will rise to these challenges. We
are well positioned to continue to
serve our customers in timely,
innovative ways, to seize attractive
opportunities when they arise, and
to build our Company’s value for
shareholders in the year ahead
and beyond.
… science-based initiatives represent themost promising means to minimize thephysical and economic impact of severeweather events.

11
As a result of the excellent
relationships we have established,
based upon our quality of service and
the above-average financial security
we offer, many of our customers con-
tinue to prefer doing business with
RenaissanceRe, irrespective of market
conditions. This helped us through a
challenging year and stands us in good
stead for the future. We have worked
hard to gain such customer loyalty.
And we will never take it for granted.
Sincerely,
Neill A. CurriePresident and Chief Executive Officer
On behalf of our Board of
Directors, I would like to thank the
global RenaissanceRe team for their
contributions towards helping our clients
and our Company navigate this year’s
challenges. Events this year underscored
the importance of vigilant risk manage-
ment to the basic welfare of any business
enterprise. At our Company, robust,
ever-evolving risk management
is at our very core. Our management
team continually seeks to improve and
refine its approach to risk management,
and our Board of Directors is likewise
committed to effective, collaborative
oversight of the Company’s risk-related
policies and practices. I believe this
conscientious, collective effort has
been a key factor in RenaissanceRe’s
historical success and underpins our
plans for the future.
We believe that our Company is
well positioned to support its clients in the
challenging, and also potentially exciting,
period before us, that RenaissanceRe’s strat-
egy and financial position are sound, and
that our management team is equipped to
undertake the ambitious tasks set before
them. Sound corporate governance is also
important to achieving these goals, and we
Directors will strive to continue to provide
both strategic value and effective oversight.
Together with Neill and our fellow
Board members, I would like to thank our
customers, partners, shareholders and
employees for their continued support.
We look forward to the continued honor
of serving you in the years to come.
W. James MacGinnitieChairman of the Board
Message from the Chairman

“We upheld our principles of maintaining flexibility, focusing on prudent capital management
and careful risk selection, and we positioned ourselves for the future.”
Neill A. CurriePresident &
Chief Executive Officer,RenaissanceRe Holdings Ltd.
“Top Layer Re celebrated its 10th anniversary of profitable operation without a loss or claim.DaVinci, despite the stresses in the financial marketsand the third-largest insured losses in history, still generated strong returns for its shareholders.”John D. (Jay) Nichols, Jr.Executive Vice President,RenaissanceRe Holdings Ltd.,President,RenaissanceRe Ventures Ltd.
“The landscape to grow our business is as good as it has ever been and we are ready: we have astrong balance sheet and our ability to efficientlymanage our capital is one of our strengths.”Fred R. DonnerExecutive Vice President & Chief Financial Officer,RenaissanceRe Holdings Ltd.
“The agricultural business is intensely data-driven and requires judicious risk selection. We believe we
can leverage our analytical expertise to our competitiveadvantage in this business.”
William J. AshleySenior Vice President,
RenaissanceRe Holdings Ltd.,President & CEO,
Glencoe Group Holdings Ltd.
Executive Committee

“Our clients have experienced increasing costs ofcapital and challenging credit markets. Reinsurance
is a form of capital and we continue to providecapacity – this is probably more important today
than it has ever been.”Kevin J. O’Donnell
Senior Vice President, RenaissanceRe Holdings Ltd.,
President, Renaissance Reinsurance Ltd.
“As we assimilate new capabilities and new people, we are focusing on perpetuating the
same culture and principles that have been at the core of our success since our inception.”
Peter C. DurhagerSenior Vice President,
Chief Administrative Officer,RenaissanceRe Holdings Ltd.,
President,RenaissanceRe Services Ltd.
“2008 was probably the most challenging year we have had in investments. On an absolutebasis, our results were disappointing; on a relative basis, we managed our portfolio well in extraordinary circumstances.”Todd R. FonnerSenior Vice President,Chief Investment Officer,RenaissanceRe Holdings Ltd.
“The reinsurance industry in general and theBermuda market in particular have historicallyworked with the U.S. to find solutions to managing catastrophic natural peril risk.”Stephen H. WeinsteinSenior Vice President,Chief Compliance Officer,General Counsel & Secretary,RenaissanceRe Holdings Ltd.

14
Despite recent turmoil in world financial markets,
we believe that the demand for agricultural products and the
management of that risk will likely continue to grow over time.
Our acquisition of Agro National, our long-term production partner,
greatly strengthened our operating platform in the
marketplace for U.S. agricultural risk.
Opportunities in Agribusiness andCrop Insurance Risk
In terms of total industry
premium, the multi-peril crop insur-
ance (MPCI) product we offer
through Agro National is the largest
form of crop risk protection offered
in the United States. MPCI provides
broad-based protection against
unavoidable adverse weather condi-
tions, such as drought, excessive
moisture, flooding, excess heat, hail,
wind, frost, freeze, tornado, lightning,
insects, plant disease, wildlife damage,
fire and earthquake. MPCI policies
are often sold in combination with
crop hail cover and other named
peril products. Total MPCI premium
in the U.S. has grown over tenfold
since 1989 as illustrated in Figure 1.
The MPCI program is regulated
by the Risk Management Agency of
the U.S. Department of Agriculture.
Although over 100 different crops and
22 different insurance plans can be
insured in various counties across
the United States, five main crops
form the bulk of premium volume.
Figure 1 Total U.S. MPCI Premium
($) in billions
12
9
6
3
0 ’89 ’90 ’91 ’92 ’93’94 ’95 ’96’97 ’98’99’00 ’01 ’02’03 ’04’05’06’07 ’08
15
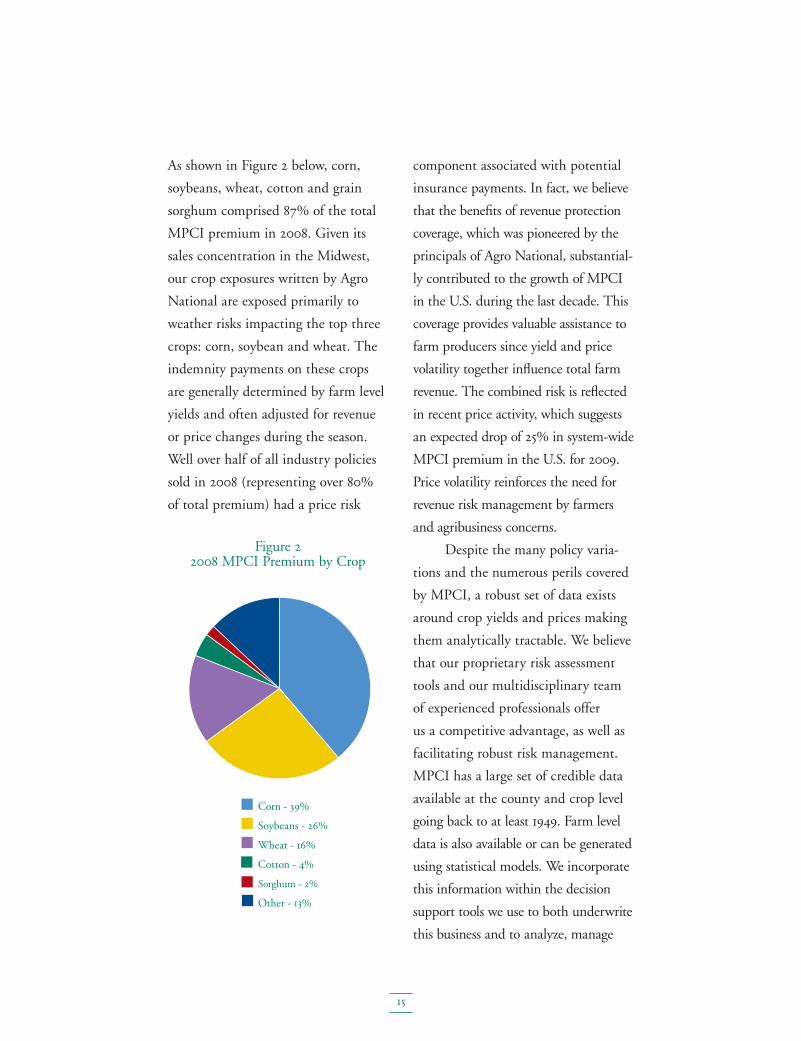
As shown in Figure 2 below, corn,
soybeans, wheat, cotton and grain
sorghum comprised 87% of the total
MPCI premium in 2008. Given its
sales concentration in the Midwest,
our crop exposures written by Agro
National are exposed primarily to
weather risks impacting the top three
crops: corn, soybean and wheat. The
indemnity payments on these crops
are generally determined by farm level
yields and often adjusted for revenue
or price changes during the season.
Well over half of all industry policies
sold in 2008 (representing over 80%
of total premium) had a price risk
component associated with potential
insurance payments. In fact, we believe
that the benefits of revenue protection
coverage, which was pioneered by the
principals of Agro National, substantial-
ly contributed to the growth of MPCI
in the U.S. during the last decade. This
coverage provides valuable assistance to
farm producers since yield and price
volatility together influence total farm
revenue. The combined risk is reflected
in recent price activity, which suggests
an expected drop of 25% in system-wide
MPCI premium in the U.S. for 2009.
Price volatility reinforces the need for
revenue risk management by farmers
and agribusiness concerns.
Despite the many policy varia-
tions and the numerous perils covered
by MPCI, a robust set of data exists
around crop yields and prices making
them analytically tractable. We believe
that our proprietary risk assessment
tools and our multidisciplinary team
of experienced professionals offer
us a competitive advantage, as well as
facilitating robust risk management.
MPCI has a large set of credible data
available at the county and crop level
going back to at least 1949. Farm level
data is also available or can be generated
using statistical models. We incorporate
this information within the decision
support tools we use to both underwrite
this business and to analyze, manage
Corn - 39%
Soybeans - 26%
Wheat - 16%
Cotton - 4%
Sorghum - 2%
Other - 13%
Figure 22008 MPCI Premium by Crop

16
and cede out the risk we assume within
our portfolio. We also use this data to
help us analyze prospective risks and
develop new products for producers
and agribusiness concerns.
We believe our proprietary
technology and research personnel at
WeatherPredict Consulting enhance
our ability to provide added value for
agricultural clients as well as the robust-
ness of our crop-related risk assessment.
One such technology, owned and uti-
lized by WeatherPredict Consulting,
measures temperature and precipitation
anomalies, which are among the pri-
mary factors influencing crop yields.
This remote-sensing technology uses
Special Sensory Microwave/Imager
(SSM/I) data from satellites to monitor
crop conditions almost anywhere on the
planet. Conditions in one part of the
world have an impact on crops globally,
and such information is an important
factor in assessing yield and price risks.
Figure 3, for example, illustrates
dryness emerging in Argentina and
southern Brazil during January 2009, a
key risk period for corn tasseling and
soybean pod-filling in the Southern
Hemisphere. When combined with
temperature anomalies and forecasts
from WeatherPredict Consulting, a
parametric assessment of yield and
price risks may be generated in a
consistent manner. Furthermore,
comparisons with historical SSM/I data
(available back to 1988) permit crop
risk assessment and relative insurance
pricing in regions where credible yield
data are difficult to obtain or even where
crops were not planted in years past.
We believe that agricultural risk
provides RenaissanceRe with some
benefits of diversification. On an
historical basis, major hurricane (and
earthquake) events appear somewhat
independent from aggregate crop
Figure 3Brazil & Argentina
Corn Wetness Anomalies
Percentile positions on distribution of SSMI wetness, from driest to wettest.
17
insurance losses. An illustrative review
of years in which large wind events
occurred, such as Andrew (1992),
Katrina (2005) and Ike (2008), shows
that large MPCI loss years did not
coincide with these catastrophe losses.
Although some crop damage may
occur along the coast, the vast
majority of industry MPCI premiums
reside in the Midwest. In the fall of
2004, for instance, when Hurricanes
Charley, Frances and Jeanne criss-
crossed Florida, about $106 million of
state-wide MPCI premium in Florida
experienced a 315% loss ratio. In that
same crop year, nationwide MPCI
premiums of approximately $4 billion
averaged a profitable 60% loss ratio. In
years in which there were large crop
losses, such as 1983, 1988, 1993 and
2002, lower-than-average major hurri-
cane activity was observed. In some
cases, the remnants of a hurricane
may actually bring beneficial rainfall
to crops in the interior United States
as did Hurricane Dennis in 2005.
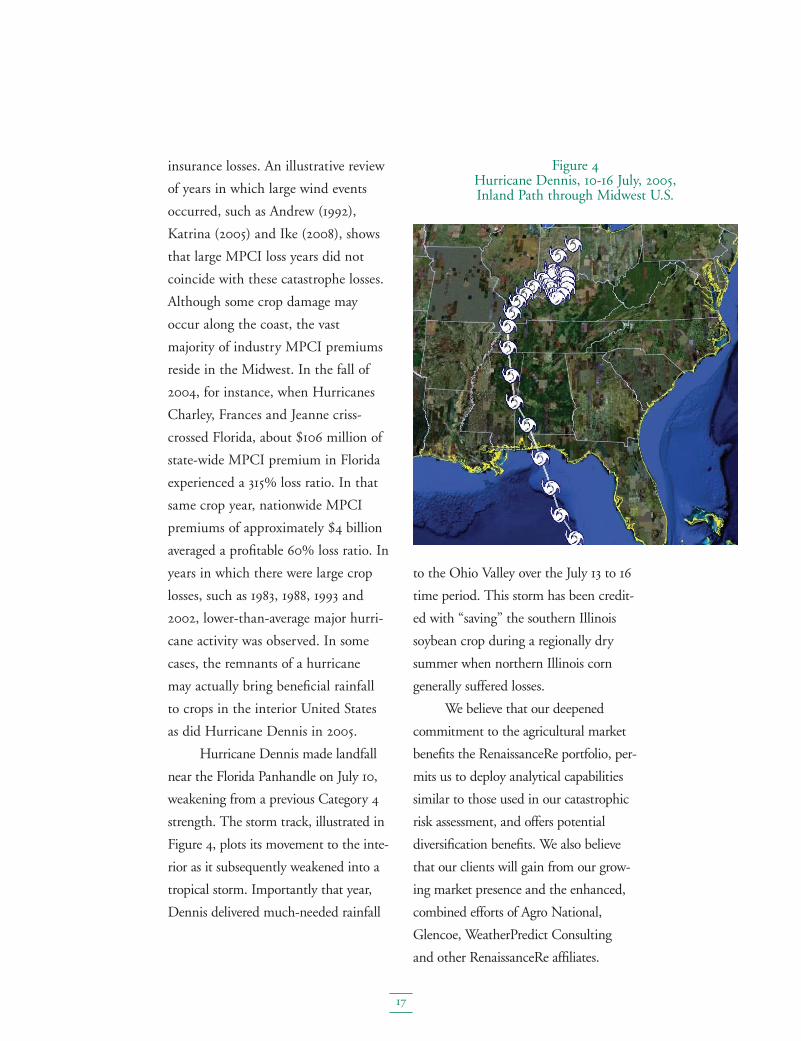
Hurricane Dennis made landfall
near the Florida Panhandle on July 10,
weakening from a previous Category 4
strength. The storm track, illustrated in
Figure 4, plots its movement to the inte-
rior as it subsequently weakened into a
tropical storm. Importantly that year,
Dennis delivered much-needed rainfall
to the Ohio Valley over the July 13 to 16
time period. This storm has been credit-
ed with “saving” the southern Illinois
soybean crop during a regionally dry
summer when northern Illinois corn
generally suffered losses.
We believe that our deepened
commitment to the agricultural market
benefits the RenaissanceRe portfolio, per-
mits us to deploy analytical capabilities
similar to those used in our catastrophic
risk assessment, and offers potential
diversification benefits. We also believe
that our clients will gain from our grow-
ing market presence and the enhanced,
combined efforts of Agro National,
Glencoe, WeatherPredict Consulting
and other RenaissanceRe affiliates.
Figure 4Hurricane Dennis, 10-16 July, 2005, Inland Path through Midwest U.S.

18
Board of DirectorsRenaissanceRe Holdings Ltd.
(Front from left)Neill A. CurriePresident and Chief Executive OfficerRenaissanceRe Holdings Ltd.
W. James MacGinnitieChairmanRenaissanceRe Holdings Ltd.
(Behind from left)Nicholas L. TrivisonnoRetired Chairman and CEOACNielsen Corporation
Jean D. HamiltonPrivate InvestorMember of Brock Capital Group LLC
Ralph B. LevySenior PartnerKing & Spalding LLP
Anthony M. SantomeroFormer President of the Federal ReserveBank of Philadelphia
David C. BushnellRetired Chief Administrative OfficerCitigroup Inc.
William F. HechtRetired Chairman, President and CEOPPL Corporation
Henry Klehm IIIPartnerJones Day
James L. GibbonsPresident and CEO CAPITAL G LimitedChairman of CAPITAL G Bank Limited
Thomas A. CooperChief Executive OfficerTAC Associates

19
Senior OfficersRenaissanceRe Holdings Ltd. and Subsidiaries
Bermuda
Currie, Neill A.President & Chief Executive Officer,RenaissanceRe Holdings Ltd.
Donner, Fred R.Executive Vice President & Chief Financial Officer, RenaissanceRe Holdings Ltd.
Nichols, John D. Executive Vice President,RenaissanceRe Holdings Ltd.,President, RenaissanceRe Ventures Ltd.
Ashley, William J. Senior Vice President, RenaissanceRe Holdings Ltd., President & CEO, Glencoe Group Holdings Ltd.
O’Donnell, Kevin J. Senior Vice President, RenaissanceRe Holdings Ltd.,President, Renaissance Reinsurance Ltd.
Branagan, Ian D. Senior Vice President, Chief Risk Officer, RenaissanceRe Holdings Ltd.
Durhager, Peter C. Senior Vice President, Chief Administrative Officer,RenaissanceRe Holdings Ltd.,President, RenaissanceRe Services Ltd.
Fonner, Todd R. Senior Vice President, Chief Investment Officer, RenaissanceRe Holdings Ltd.
Weinstein, Stephen H. Senior Vice President, Chief Compliance Officer, General Counsel & Secretary,RenaissanceRe Holdings Ltd.
Curtis, Ross A. Senior Vice President, International Underwriting,Renaissance Reinsurance Ltd.
Dutt, Aditya K. Senior Vice President, RenaissanceRe Ventures Ltd.
Lamendola, Robert J. Senior Vice President, Renaissance Reinsurance Ltd.
Moore, Sean M. Senior Vice President, RenaissanceRe Services Ltd.
Paradine, Jonathan D. Senior Vice President, Renaissance Reinsurance Ltd.
Prado, Juan I.Senior Vice President, RenaissanceRe Ventures Ltd.
Richardson, Laurence B. Senior Vice President, RenaissanceRe Ventures Ltd.
Wilcox, Mark A. Senior Vice President, Chief Accounting Officer, CorporateController, RenaissanceRe Holdings Ltd.
Bonanno, LauraVice President, RenaissanceRe Holdings Ltd.
Brewer, Barry Vice President, RenaissanceRe Services Ltd.
Brookes, Trevor A. Vice President, Internal Audit,RenaissanceRe Holdings Ltd.
Dalton, Bryan M.Vice President, Renaissance Reinsurance Ltd.
Da Silva, Anne-Marie Vice President, RenaissanceRe Services Ltd.
Illston, Peter A. Vice President, RenaissanceRe Services Ltd.
James, Helen L. Vice President, RenaissanceRe Ventures Ltd.
Komposch, Caroline M. Vice President, RenaissanceRe Services Ltd.
Lewis, James R.Vice President, Renaissance Reinsurance Ltd.
Marra, David A. Vice President, Renaissance Reinsurance Ltd.
Matusiak, James J. Vice President,Renaissance Reinsurance Ltd.
McCue, Keith A. Vice President, Renaissance Reinsurance Ltd.
Montpellier, Peter R. Vice President, RenaissanceRe Services Ltd.
Morgenstern, Kai H. Vice President, RenaissanceRe Ventures Ltd.
Nusum, Maureen B. Vice President, RenaissanceRe Services Ltd.
O’Keefe, Justin D. Vice President, Renaissance Reinsurance Ltd.
Oswald, Apryle L. Vice President, Glenco Insurance Ltd.
Roberts, Rebecca J. Vice President, Renaissance Reinsurance Ltd.
Smith, Josephine A. Vice President, RenaissanceRe Services Ltd.
Tucker, Dion A. Vice President, RenaissanceRe Services Ltd.
Council Bluffs
Gibson, Kim R. President, Chief Operating OfficerAgro National Inc.
Watson, Thomas F. Vice President, Chief Financial Officer,Agro National Inc.
Grimsley, Gene R. Vice President,Agro National Inc.
Janicek, Kenneth P. Vice President,Agro National Inc.
Connealy, Donald F. Vice President,Agro National Inc.
Rhodes, Randy L. Vice President,Agro National Inc.
Wilson, William C. Vice President,Agro National Inc.
Holl, Monte R. Vice President,Agro National Inc.
Dallas
Heatherly, David A. President, Glencoe Specialty Services Inc.
Bowden, Tracy H. Senior Vice President, General Counsel & ChiefCompliance Officer, Glencoe Specialty Services Inc.
Eudy, Dan R. Senior Vice President,Glencoe Specialty Services Inc.
Graff, Timothy J. Senior Vice President, Glencoe Specialty Services Inc.
Lewis, Travis L. Senior Vice President, Chief Operating Officer, Glencoe Group Holdings Ltd.
Brockman, Robert W. Vice President, Glencoe Specialty Services Inc.
Hockersmith, Jeffrey S. Vice President, Glencoe Specialty Services Inc.
Kanan, Aileen P. Vice President, Glencoe Specialty Services Inc.
Kozuch, Walter J. Vice President, Glencoe Specialty Services Inc.
Meehan, Patricia M. Vice President, Glencoe Specialty Services Inc.
Primerano, Richard B. Senior Vice President, CFO,Glencoe Specialty Services Inc.
Radford, Kellam A. Vice President, Glencoe Specialty Services Inc.
Regan, Michael E. Vice President, Glencoe Group Services Inc.
Schlaegel, Woldemar W. Vice President, Glencoe Specialty Services Inc.
Scholl, David C. Vice President, Chief Actuary, Glencoe Specialty Services Inc.
Stahl, Brian C. Senior Vice President, Glencoe Specialty Services Inc.
Taylor, Rod N.Vice President, Glencoe Specialty Services Inc.
Ireland
Britchfield, Ian Managing Director, Renaissance Reinsurance of Europe
Brosnan, Sean G. Managing Director of Investments, Renaissance Reinsurance of Europe
Burnett-Herkes, James Managing Director Risk Modeling, Renaissance Reinsurance of Europe
Houston
Cole, Joseph B. President, RenRe Investment Managers Ltd.
Kaplan, Paul E. Vice President & Secretary, RenRe Investment Managers Ltd.
Tawney, Mark R. Managing Director, RenRe Investment Managers Ltd.
Windle, William W. Vice President, RenRe Investment Managers Ltd.
Raleigh
Tillman, Craig W. President,WeatherPredict Consulting Inc.
Lin, Jason J. Vice President, WeatherPredict Consulting Inc.
Bachiocci, David R. Senior Scientist, WeatherPredict Consulting Inc.
Williford, Eric C. Senior Scientist, WeatherPredict Consulting Inc.
Rhode Island
Ginis, Isaac Principal Scientist, WeatherPredict Consulting Inc.
Rothstein, Lewis M. Principal Scientist, WeatherPredict Consulting Inc.
Rowe, Dail Senior Scientist, WeatherPredict Consulting Inc.
Roswell, GA
Jones, Gene L. Vice President,Glencoe Group Claims Management Inc.


Year Ended
(In thousands of United States dollars, except per share amountsand percentages) 2008 2007 2006 2005 2004
Net (loss) income (attributable) available to common shareholders $ (13,280) $569,575 $761,635 $(281,413) $133,108
Adjustment for net realized losses (gains)on investments 206,314 (1,293) 34,464 6,962 (23,442)
Adjustment for net unrealized losses on credit derivatives issued by entities included in investments in other ventures, under equity method - 167,171 - - -
Adjustment for cumulative effect of a change in accounting principle - FAS 142 - Goodwill - - - - -
Operating income (loss) available (attributable) to common shareholders $193,034 $735,453 $796,099 $(274,451) $109,666
Net (loss) income (attributable) available to common shareholders per common share (1) $(0.21) $ 7.93 $10.57 $(3.99) $1.85
Adjustment for net realized losses (gains) on investments 3.25 (0.02) 0.48 0.10 (0.32)
Adjustment for net unrealized losses on credit derivatives issued by entities included in investments in other ventures, under equity method - 2.33 - - -
Adjustment for cumulative effect of a change in accounting principle - FAS 142 - Goodwill - - - - -
Operating income (loss) available (attributable) to common shareholders per common share - diluted (1) $3.04 $10.24 $11.05 $(3.89) $1.53
Return on average common equity (0.5%) 20.9% 36.3% (13.6%) 6.2%
Adjustment for net realized losses (gains) on investments 7.9% (0.1%) 1.6% 0.3% (1.1%)
Adjustment for net unrealized losses on credit derivatives issued by entities included in investments in other ventures, under equity method - 6.2% - - -
Adjustment for cumulative effect of a change in accounting principle - FAS 142 - Goodwill - - - - -
Operating return on average common equity 7.4% 27.0% 37.9% (13.3%) 5.1%
(1) In accordance with FAS 128, earnings per share calculations use average common shares outstanding - basic,when in a net loss position.
COMMENTS ON REGULATION G
In addition to the financial measures set forth in this Annual Report prepared in accordance with accounting principles generally accepted in the United States (“GAAP”), the Company has included certain non-GAAP financial measures in thisAnnual Report within the meaning of Regulation G. The Company has consistently provided these financial measurements inprevious annual reports and the Company’s management believes that these measurements are important to investors andother interested persons, and that investors and such other persons benefit from having a consistent basis for comparisonbetween years and for the comparison with other companies within the industry. These measures may not, however, be comparable to similarly titled measures used by companies outside of the insurance industry. Investors are cautioned not toplace undue reliance on these non-GAAP measures in assessing the Company’s overall financial performance.
The Company uses “operating income (loss)” as a measure to evaluate the underlying fundamentals of its operations andbelieves it to be a useful measure of its corporate performance. “Operating income (loss)” as used herein differs from “net(loss) income (attributable) available to common shareholders”, which the Company believes is the most directly comparableGAAP measure, by the exclusion of net realized gains and losses on investments and net unrealized gains and losses oncredit derivatives issued by entities included in investments in other ventures, under equity method and the cumulative effectof a change in accounting principle – goodwill. In the presentation below, the only adjustments in respect of unrealized gainsand losses on credit derivatives reflect unrealized mark-to-market losses on credit derivatives and other credit-related prod-ucts issued by ChannelRe Holdings Ltd. (“ChannelRe”), a financial guarantee reinsurer whose investment is accounted forby the Company under the equity method. The Company believes that the prevailing convention among financial guarantee insurers, reinsurers and other market participants, such as ChannelRe, is to exclude from “operating income (loss)” suchunrealized gains and losses attributable to credit derivatives and other credit-related products. The Company’s managementbelieves that “operating income (loss)” is useful to investors because it more accurately measures and predicts theCompany’s results of operations by removing the variability arising from the fluctuations in the Company’s investment portfolio and credit derivatives issued by entities included in investments in other ventures, under equity method, which are not considered by management to be relevant indicators of business operations. The Company also uses “operatingincome (loss)” to calculate “operating income (loss) per common share – diluted” and “operating return on average commonequity”. The following is a reconciliation of 1) net (loss) income (attributable) available to common shareholders to operatingincome (loss) available (attributable) to common shareholders; 2) net (loss) income (attributable) available to common shareholders per common share – diluted to operating income (loss) available (attributable) to common shareholders per common share – diluted; and 3) return on average common equity to operating return on average common equity:

Year Ended
(In thousands of U.S. dollars) 2008 2007 2006 2005 2004
Total catastrophe premiums $ 994,621 $1,003,104 $1,099,114 $ 775,573 $ 702,010
Catastrophe premiums assumed from the Individual Risk segment (5,672) (36,968) (64,573) (43,594) (18,831)
Catastrophe premiums written by Top Layer Re 55,370 66,436 51,244 59,908 70,242
Managed catastrophe premiums $1,044,319 $1,032,572 $1,085,785 $ 791,887 $ 753,421
Gross premiums written $1,736,028 $1,809,637 $1,943,647 $1,809,128 $1,544,157
Premiums written by Top Layer Re 55,370 66,436 51,244 59,908 70,242
Gross managed premiums written $1,791,398 $1,876,073 $1,994,891 $1,869,036 $1,614,399
Year Ended
2008 2007 2006 2005 2004 2003 2002 2001 2000 1999
Book value per common share $38.74 $41.03 $34.38 $24.52 $30.19 $29.61 $21.37 $16.14 $11.91 $10.17
Adjustment for goodwill and other intangibles(1) (2.01) (0.09) (0.08) - - - - (0.14) (0.17) (0.11)
Tangible book value per common share $36.73 $40.94 $34.30 $24.52 $30.19 $29.61 $21.37 $16.00 $11.74 $10.06
Adjustment for accumulated dividends 7.92 7.00 6.12 5.28 4.48 3.72 3.12 2.55 2.05 1.53
Tangible book value per common share plus accumulated dividends $44.65 $47.94 $40.42 $29.80 $34.67 $33.33 $24.49 $18.55 $13.79 $11.59
(1) For 2008, goodwill and other intangibles includes $49.8 million of goodwill and other intangibles included in investments in other ventures, under equity method.
The Company has also included in this Annual Report “gross managed premiums written” and “managed catastrophepremiums”. “Gross managed premiums written” differs from gross premiums written, which the Company believes is themost directly comparable GAAP measure, due to the inclusion of premiums written on behalf of our joint venture Top LayerRe, which is accounted for under the equity method of accounting. “Managed catastrophe premiums” is defined as grosscatastrophe premiums written by Renaissance Reinsurance and its related joint ventures. “Managed catastrophe premiums”differs from total catastrophe premiums, which the Company believes is the most directly comparable GAAP measure, due to the inclusion of catastrophe premiums written on behalf of the Company’s joint venture Top Layer Re, which isaccounted for under the equity method of accounting, and the exclusion of catastrophe premiums assumed from theCompany’s Individual Risk segment. The Company’s management believes “gross managed premiums written” and “managed catastrophe premiums” are useful to investors and other interested parties because they each provide a measure of total premiums assumed by the Company through its consolidated subsidiaries and related joint ventures. The following is a reconciliation of 1) total catastrophe premiums to managed catastrophe premiums and 2) gross premiums written to gross managed premiums written:
The Company has also included in this Annual Report “tangible book value per common share plus accumulated dividends”,which is defined as book value per common share excluding goodwill and other intangibles, plus accumulated dividends.“Tangible book value per common share plus accumulated dividends” differs from book value per common share, which theCompany believes is the most directly comparable GAAP measure, due to the exclusion of goodwill and other intangibles andthe inclusion of accumulated dividends. The following is a reconciliation of book value per common share to tangible book valueper common share plus accumulated dividends:

UNITED STATESSECURITIES AND EXCHANGE COMMISSION
WASHINGTON, D.C. 20549
FORM 10-KÈ ANNUAL REPORT PURSUANT TO SECTION 13 OR 15(d) OF
THE SECURITIES EXCHANGE ACT OF 1934
For The Fiscal Year Ended December 31, 2008
OR
‘ TRANSITION REPORT PURSUANT TO SECTION 13 OR 15(d) OFTHE SECURITIES EXCHANGE ACT OF 1934
For the transition period from to
Commission File No. 001-14428
RENAISSANCERE HOLDINGS LTD.(Exact Name Of Registrant As Specified In Its Charter)
Bermuda 98-014-1974(State or Other Jurisdiction of (I.R.S. EmployerIncorporation or Organization) Identification Number)
Renaissance House, 8-20 East Broadway, Pembroke HM 19 Bermuda(Address of Principal Executive Offices)
(441) 295-4513(Registrant’s telephone number)
Securities registered pursuant to Section 12(b) of the Act:Title of each class Name of each exchange on which registered
Common Shares, Par Value $1.00 per share New York Stock Exchange, Inc.Series B 7.30% Preference Shares, Par Value $1.00 per share New York Stock Exchange, Inc.Series C 6.08% Preference Shares, Par Value $1.00 per share New York Stock Exchange, Inc.Series D 6.60% Preference Shares, Par Value $1.00 per share New York Stock Exchange, Inc.
Securities registered pursuant to Section 12(g) of the Act: None
Indicate by check mark if the registrant is a well-known seasoned issuer (as defined in Rule 405 of the Act).Yes È No ‘
Indicate by check mark if the registrant is not required to file reports pursuant to Section 13 or Section 15(d) of the Act.Yes ‘ No È
Indicate by check mark whether the registrant (1) has filed all reports required to be filed by Section 13 or 15(d) of theSecurities Exchange Act of 1934 during the preceding 12 months (or for such shorter period that the registrant was requiredto file such reports), and (2) has been subject to such filing requirements for the past 90 days.Yes È No ‘
Indicate by check mark if disclosure of delinquent filers pursuant to Item 405 of Regulation S-K is not contained herein, andwill not be contained, to the best of registrant’s knowledge, in definitive proxy or information statements incorporated byreference in Part III of this Form 10-K or any amendment to this Form 10-K. ‘
Indicate by check mark whether the registrant is a large accelerated filer, an accelerated filer, a non-accelerated filer, or asmaller reporting company, as defined in Rule 12b-2 of the Act. Large accelerated filer È, Accelerated filer ‘,Non-accelerated filer ‘, Smaller reporting company ‘
Indicate by check mark whether the registrant is a shell company (as defined in Rule 12b-2 of the Act).Yes ‘ No È
The aggregate market value of Common Shares held by nonaffiliates of the registrant at June 30, 2008 was $2,677.0 millionbased on the closing sale price of the Common Shares on the New York Stock Exchange on that date.
The number of Common Shares outstanding at February 11, 2009 was 61,500,840.
The information required by Part III of this report, to the extent not set forth herein, is incorporated by reference to theregistrant’s Definitive Proxy Statement to be filed in respect of our 2009 Annual General Meeting of Shareholders.

RENAISSANCERE HOLDINGS LTD.TABLE OF CONTENTS
Page
PART I. . . . . . . . . . . . . . . . . . . . . . . . . . . . . . . . . . . . . . . . . . . . . . . . . . . . . . . . . . . . . . . . . . . . . . . . . . . 3ITEM 1. BUSINESS . . . . . . . . . . . . . . . . . . . . . . . . . . . . . . . . . . . . . . . . . . . . . . . . . . . . . . . . . . 7ITEM 1A. RISK FACTORS . . . . . . . . . . . . . . . . . . . . . . . . . . . . . . . . . . . . . . . . . . . . . . . . . . . . . . 38ITEM 1B. UNRESOLVED STAFF COMMENTS . . . . . . . . . . . . . . . . . . . . . . . . . . . . . . . . . . . . . . . 53ITEM 2. PROPERTIES . . . . . . . . . . . . . . . . . . . . . . . . . . . . . . . . . . . . . . . . . . . . . . . . . . . . . . . . 61ITEM 3. LEGAL PROCEEDINGS . . . . . . . . . . . . . . . . . . . . . . . . . . . . . . . . . . . . . . . . . . . . . . . . . 61ITEM 4. SUBMISSION OF MATTERS TO A VOTE OF SECURITY HOLDERS . . . . . . . . . . . . . . 62
PART II. . . . . . . . . . . . . . . . . . . . . . . . . . . . . . . . . . . . . . . . . . . . . . . . . . . . . . . . . . . . . . . . . . . . . . . . . . 62ITEM 5. MARKET FOR REGISTRANT’S COMMON EQUITY, RELATED SHAREHOLDER
MATTERS AND ISSUER REPURCHASES OF EQUITY SECURITIES . . . . . . . . . . . . 62ITEM 6. SELECTED CONSOLIDATED FINANCIAL DATA . . . . . . . . . . . . . . . . . . . . . . . . . . . . . . 65ITEM 7. MANAGEMENT’S DISCUSSION AND ANALYSIS OF FINANCIAL CONDITION AND
RESULTS OF OPERATIONS . . . . . . . . . . . . . . . . . . . . . . . . . . . . . . . . . . . . . . . . . . . 67ITEM 7A. QUANTITATIVE AND QUALITATIVE DISCLOSURES ABOUT MARKET RISK . . . . . . . 129ITEM 8. FINANCIAL STATEMENTS AND SUPPLEMENTARY DATA . . . . . . . . . . . . . . . . . . . . . 131ITEM 9. CHANGES IN AND DISAGREEMENTS WITH ACCOUNTANTS ON ACCOUNTING
AND FINANCIAL DISCLOSURE . . . . . . . . . . . . . . . . . . . . . . . . . . . . . . . . . . . . . . . . 131ITEM 9A. CONTROLS AND PROCEDURES . . . . . . . . . . . . . . . . . . . . . . . . . . . . . . . . . . . . . . . . . 132ITEM 9B. OTHER INFORMATION . . . . . . . . . . . . . . . . . . . . . . . . . . . . . . . . . . . . . . . . . . . . . . . . 132
PART III. . . . . . . . . . . . . . . . . . . . . . . . . . . . . . . . . . . . . . . . . . . . . . . . . . . . . . . . . . . . . . . . . . . . . . . . . . 133ITEM 10. DIRECTORS, EXECUTIVE OFFICERS AND CORPORATE GOVERNANCE . . . . . . . . . . 133ITEM 11. EXECUTIVE COMPENSATION . . . . . . . . . . . . . . . . . . . . . . . . . . . . . . . . . . . . . . . . . . . 133ITEM 12. SECURITY OWNERSHIP OF CERTAIN BENEFICIAL OWNERS AND MANAGEMENT
AND RELATED SHAREHOLDER MATTERS . . . . . . . . . . . . . . . . . . . . . . . . . . . . . . . 133ITEM 13. CERTAIN RELATIONSHIPS AND RELATED TRANSACTIONS, AND DIRECTOR
INDEPENDENCE . . . . . . . . . . . . . . . . . . . . . . . . . . . . . . . . . . . . . . . . . . . . . . . . . . . 133ITEM 14. PRINCIPAL ACCOUNTANT FEES AND SERVICES . . . . . . . . . . . . . . . . . . . . . . . . . . . 133
PART IV. . . . . . . . . . . . . . . . . . . . . . . . . . . . . . . . . . . . . . . . . . . . . . . . . . . . . . . . . . . . . . . . . . . . . . . . . . 134ITEM 15. EXHIBITS AND FINANCIAL STATEMENT SCHEDULES . . . . . . . . . . . . . . . . . . . . . . . 134
SIGNATURES . . . . . . . . . . . . . . . . . . . . . . . . . . . . . . . . . . . . . . . . . . . . . . . . . . . . . . . . . . . . . . . . . . . . . 138

PART I
Unless the context otherwise requires, references in this Form 10-K to “RenaissanceRe” or the “Company”mean RenaissanceRe Holdings Ltd. and its subsidiaries, which include, but are not limited to, the followingentities named herein.
Agro National Inc. (“Agro National”)Accurate Environmental Forecasting Inc. (“AEF”)Glencoe Group Claims Management Inc. (“Glencoe Claims”)Glencoe Group Holdings Ltd. (“Glencoe Group”)Glencoe Insurance Ltd. (“Glencoe”)Glencoe Specialty Holdings Inc. (“Glencoe Holdings”)Glencoe Specialty Services Inc. (“Glencoe Specialty Services”)Glencoe U.S. Holdings Inc. (“Glencoe U.S.”)Lantana Insurance Ltd. (“Lantana”)Renaissance Investment Holdings Ltd. (“RIHL”)Renaissance Investment Management Company Limited. (“RIMCO”)Renaissance Other Investments Holdings Ltd. (“ROIHL”)Renaissance Reinsurance Ltd. (“Renaissance Reinsurance”)Renaissance Reinsurance of Europe (“Renaissance Europe”)Renaissance Trading Ltd. (“RTL”)Renaissance Underwriting Managers, Ltd. (“RUM”)RenaissanceRe Capital Trust (“Capital Trust”)RenaissanceRe Services Ltd. (“Renaissance Services”)RenaissanceRe Ventures Ltd. (“Ventures”)RenRe Investment Managers Ltd. (“RIM”)RenTech U.S. Holdings Inc. (“RenTech”)Starbound Reinsurance Ltd. (“Starbound Re”)Starbound Reinsurance II Ltd. (“Starbound II”)Stonington Insurance Company (“Stonington”)Timicuan Reinsurance Ltd. (“Tim Re”)Weather Predict Inc. (“Weather Predict”)WeatherPredict Consulting Inc. (“WP Consulting”)
We also underwrite reinsurance on behalf of joint ventures, principally including Top Layer Reinsurance Ltd.(“Top Layer Re”), recorded under the equity method of accounting, and DaVinci Reinsurance Ltd.(“DaVinci”). The financial results of DaVinci and DaVinci’s parent company, DaVinciRe Holdings Ltd.(“DaVinciRe”), are consolidated in our financial statements. For your convenience, we have included aglossary beginning on page 54 of selected insurance and reinsurance terms. All dollar amounts referred toin this Form 10-K are in U.S. dollars unless otherwise indicated. Any discrepancies in the tables includedherein between the amounts listed and the totals thereof are due to rounding.
NOTE ON FORWARD-LOOKING STATEMENTS
This Form 10-K contains forward-looking statements within the meaning of Section 27A of the SecuritiesAct of 1933, as amended, and Section 21E of the Securities Exchange Act of 1934, as amended (the“Exchange Act”). Forward-looking statements are necessarily based on estimates and assumptions that areinherently subject to significant business, economic and competitive uncertainties and contingencies, manyof which, with respect to future business decisions, are subject to change. These uncertainties andcontingencies can affect actual results and could cause actual results to differ materially from thoseexpressed in any forward-looking statements made by, or on behalf of, us.
In particular, statements using words such as “may”, “should”, “estimate”, “expect”, “anticipate”,“intends”, “believe”, “predict”, “potential”, or words of similar import generally involve forward-lookingstatements. For example, we may include certain forward-looking statements in “Management’s Discussionand Analysis of Financial Condition and Results of Operations” with regard to trends in results, prices,volumes, operations, investment results, margins, combined ratios, reserves, overall market trends, riskmanagement and exchange rates. This Form 10-K also contains forward-looking statements with respect to
3

our business and industry, such as those relating to our strategy and management objectives, trends inmarket conditions, market standing and product volumes, investment results, government initiatives andregulatory matters, and pricing conditions in the reinsurance and insurance industries.
In light of the risks and uncertainties inherent in all future projections, the inclusion of forward-lookingstatements in this report should not be considered as a representation by us or any other person that ourobjectives or plans will be achieved. Numerous factors could cause our actual results to differ materiallyfrom those addressed by the forward-looking statements, including the following:
• we are exposed to significant losses from catastrophic events and other exposures that we cover,which we expect to cause significant volatility in our financial results from time to time;
• the frequency and severity of catastrophic events or other events which we cover could exceedour estimates and cause losses greater than we expect;
• risks associated with implementing our business strategies and initiatives, including risks relatedto developing or enhancing the operations, controls and other infrastructure necessary in respectof our more recent, new or proposed initiatives;
• risks relating to adverse legislative developments including, the risk of new legislation in Floridacontinuing to expand the reinsurance coverages offered by the Florida Hurricane CatastropheFund (“FHCF”) and the insurance policies written by the state-sponsored Citizens PropertyInsurance Corporation (“Citizens”); failing to reduce such coverages or implementing newprograms which reduce the size of the private market; and the risk that new, state based orfederal legislation will be enacted and adversely impact us;
• the risk of the lowering or loss of any of the ratings of RenaissanceRe or of one or more of oursubsidiaries or changes in the policies or practices of the rating agencies;
• risks relating to our strategy of relying on third party program managers, third party administrators,and other vendors to support our Individual Risk operations;
• risks due to our dependence on a few insurance and reinsurance brokers for a large portion of ourrevenue, a risk we believe is increasing as a larger portion of our business is provided by a smallnumber of these brokers, a trend which we believe has been accelerated by the recent merger ofAON Corporation (“AON”) and Benfield Group Limited (“Benfield”);
• the risk we might be bound to policyholder obligations beyond our underwriting intent, and therisk that our third party program managers or agents may elect not to continue or renew theirprograms with us;
• the inherent uncertainties in our reserving process, including those related to the 2005 and 2008catastrophes, which uncertainties we believe are increasing as we diversify into new productclasses;
• failures of our reinsurers, brokers, third party program managers or other counterparties to honortheir obligations to us, including their obligations to make third party payments for which we mightbe liable, the risk of which may be heightened during the current period of financial marketdislocation;
• risks resulting from the fact that our portfolio of business continues to be increasinglycharacterized by a relatively small number of relatively large transactions with reinsurance clients,third party program managers or companies with whom we do business;
• risks associated with appropriately modeling, pricing for, and contractually addressing new orpotential factors in loss emergence, such as the trend toward potentially significant global warmingand other aspects of climate change which have the potential to adversely affect our business, orthe ongoing financial crisis, which could cause us to underestimate our exposures and potentiallyadversely impact our financial results;
• risks associated with a sustained weakness or weakening in business and economic conditions,specifically in the principal markets in which we do business, which may adversely affect thedemand for our products and ultimately our business and operating results;
4

• risks relating to continuing deterioration in the investment markets and current economicconditions which could adversely affect our net investment income and lead to investment losses,particularly with respect to our illiquid investments in asset classes experiencing significantvolatility;
• risks associated with highly subjective judgments, such as valuing our more illiquid assets, anddetermining the impairments taken on our investments, which could impact our financial positionor operating results;
• risks associated with our investment portfolio, including the risk that investment managers maybreach our investment guidelines, or the inability of such guidelines to mitigate risks arising out ofthe ongoing financial crisis;
• changes in economic conditions, including interest rate, currency, equity and credit conditionswhich could affect our investment portfolio or declines in our investment returns for other reasonswhich could reduce our profitability and hinder our ability to pay claims promptly in accordancewith our strategy, which risks we believe are currently enhanced in light of the ongoing financialcrisis, both globally and in the U.S.;
• we are exposed to counterparty credit risk, including with respect to reinsurance brokers, clients,agents, retrocessionaires, capital providers and parties associated with our investment portfolio,which risks we believe to be currently heightened as a result of the global economic downturn;
• risks relating to the availability and collectability of third party reinsurance and other coveragespurchased by our Reinsurance and Individual Risk operations;
• emerging claims and coverage issues, which could expand our obligations beyond the amount weintend to underwrite;
• loss of services of any one of our key executive officers, or difficulties associated with the transitionof new members of our senior management team;
• a contention by the U.S. Internal Revenue Service that Renaissance Reinsurance, or any of ourother Bermuda subsidiaries, is subject to U.S. taxation;
• the passage of federal or state legislation subjecting Renaissance Reinsurance or our otherBermuda subsidiaries to supervision, regulation or taxation in the U.S. or other jurisdictions inwhich we operate;
• changes in insurance regulations in the U.S. or other jurisdictions in which we operate, includingthe risks that U.S. federal or state governments will take actions to diminish the size of the privatemarkets in respect of the coverages we offer, the risk of potential challenges to the Company’sclaim of exemption from insurance regulation under current laws and the risk of increased globalregulation of the insurance and reinsurance industry;
• operational risks, including system or human failures;
• risks that we may require additional capital in the future, particularly after a catastrophic event orto support potential growth opportunities in our business, which may not be available or may beavailable only on unfavorable terms, risks which we believe to be heightened during the ongoingfinancial market crisis;
• risks relating to failure to comply with covenants in our debt agreements;
• risks relating to the inability of our operating subsidiaries to declare and pay dividends to theCompany;
• acquisitions or strategic investments that we have made or may make could turn out to beunsuccessful;
• the risk that ongoing or future industry regulatory developments will disrupt our business, or thatof our business partners, or mandate changes in industry practices in ways that increase ourcosts, decrease our revenues or require us to alter aspects of the way we do business;
5

• we operate in a highly competitive environment, which we expect to increase over time, includingfrom the relatively new entrants formed following hurricane Katrina, from new competition fromnon-traditional participants as capital markets products provide alternatives and replacements forour more traditional reinsurance and insurance products and as a result of consolidation in the(re)insurance industry;
• risks arising out of possible changes in the distribution or placement of risks due to increasedconsolidation of clients or insurance and reinsurance brokers, or third party program managers, orfrom potential changes in their business practices which may be required by future regulatorychanges;
• the risk that there could be regulations or legislative changes adversely impacting us, as aBermuda-based company, relative to our competitors, or actions taken by multinationalorganizations having such an impact;
• extraordinary events affecting our clients or brokers, such as bankruptcies and liquidations, andthe risk that we may not retain or replace our large clients, the risk of which may be heightenedduring the ongoing financial market crisis;
• acts of terrorism, war or political unrest;
• risks relating to changes in regulatory regimes and/or accounting rules, such as the roadmap toInternational Financial Reporting Standards (“IFRS”), which could result in significant changes toour financial results; and
• the risk that we could be deemed to have failed to comply with the terms of the Company’ssettlement agreement, or otherwise to have cooperated, with the Securities and ExchangeCommission (“SEC”).
The factors listed above should not be construed as exhaustive. Certain of these risk factors and others aredescribed in more detail in “Item 1A. Risk Factors” below. We undertake no obligation to release publiclythe results of any future revisions we may make to forward-looking statements to reflect events orcircumstances after the date hereof or to reflect the occurrence of unanticipated events.
6

ITEM 1. BUSINESS
GENERAL
RenaissanceRe, established in Bermuda in 1993 to write principally property catastrophe reinsurance, istoday a leading global provider of reinsurance and insurance coverages and related services. Through ouroperating subsidiaries, we seek to obtain a portfolio of reinsurance, insurance and financial risks in each ofour businesses that are significantly better than the market average and produce an attractive return onequity. We accomplish this by leveraging our core capabilities of risk assessment and informationmanagement, and by investing in our capabilities to serve our customers across the cycles that havehistorically characterized our markets. Overall, our strategy focuses on superior risk selection, marketing,capital management and joint ventures. We provide value to our clients and joint venture partners in theform of financial security, innovative products, and responsive service. We are known as a leader in payingvalid reinsurance claims promptly. We principally measure our financial success through long-term growthin tangible book value per common share plus accumulated dividends, which we believe is the mostappropriate measure of our Company’s performance, and believe we have delivered superior performancein respect of this measure over time.
Our core products include property catastrophe reinsurance, which we write through our principal operatingsubsidiary Renaissance Reinsurance and joint ventures, principally DaVinci and Top Layer Re; specialtyreinsurance risks written through Renaissance Reinsurance and DaVinci; and primary insurance and quotashare reinsurance, which we write through the operating subsidiaries of the Glencoe Group. We believe thatwe are one of the world’s leading providers of property catastrophe reinsurance. We also believe we have astrong position in certain specialty reinsurance lines of business and are building a unique franchise in theU.S. program business. Our reinsurance and insurance products are principally distributed throughintermediaries, with whom we seek to cultivate strong relationships.
We conduct our business through two reportable segments, Reinsurance and Individual Risk. For the yearended December 31, 2008, our Reinsurance and Individual Risk segments accounted for approximately66% and 34%, respectively, of our total consolidated gross premiums written. Our segments are more fullydescribed in “Business Segments” below.
CORPORATE STRATEGY
We seek to generate long-term growth in tangible book value per common share plus accumulateddividends for our shareholders by pursuing the following strategic objectives:
• Superior Risk Selection. We seek to underwrite our reinsurance, insurance and financial risksthrough the use of sophisticated risk selection techniques, including computer models anddatabases, such as the Renaissance Exposure Management System (“REMS©”) and the ProgramAnalysis Central Repository (“PACeR”). We pursue a disciplined approach to underwriting andonly select those risks that we believe will produce an attractive return on equity, subject toprudent risk constraints.
• Superior Marketing. We believe our modeling and technical expertise, and the risk managementadvice that we provide to our clients, has enabled us to become a provider of first choice in manylines of business to our customers worldwide. We seek to offer stable, predictable and consistentrisk-based pricing and a prompt turnaround on our claims.
• Superior Capital Management. We generally seek to write as much attractively priced businessas is available to us and then manage our capital accordingly. Accordingly, we generally seek toraise capital when we forecast an increased demand in the market, at times by accessing capitalthrough joint ventures or other structures and seek to return capital to our shareholders or jointventure investors when the demand for our coverages appears to decline, and we believe a returnof capital would be beneficial to our shareholders or joint venture investors.
• Superior Joint Ventures. Building upon our relationships and expertise in risk selection,marketing and capital management, we seek to pursue and execute on joint venture andinvestment opportunities, which include new partners and diversifying classes of business. Webelieve our focus on our joint ventures allows us to leverage our access to business and our
7

underwriting capabilities on an efficient capital base, develop fee income, and diversify ourportfolio. We routinely evaluate and expect that we may in the future pursue additional jointventure opportunities and strategic investments.
We believe we are well positioned to fulfill these objectives by virtue of the experience and skill of ourmanagement team, our significant financial strength, and our strong relationships with brokers and clients.In addition, we believe our superior service, our proprietary modeling technology, and our extensivebusiness relationships, which have enabled us to become a leader in the property catastrophe reinsurancemarket, will be instrumental in allowing us to achieve our strategic objectives. In particular, we believe ourstrategy, high performance and ethical culture, and commitment to our clients and joint venture partnerspermit us to differentiate ourselves by offering specialized services and products at times and in marketswhere capacity and alternatives may be limited.
BUSINESS SEGMENTS
We conduct our business through two reportable segments, Reinsurance and Individual Risk. Financialdata relating to our two segments is included in “Item 7. Management’s Discussion and Analysis ofFinancial Condition and Results of Operations.”
Reinsurance Segment
Our Reinsurance operations are comprised of three units: 1) property catastrophe reinsurance, primarilywritten through Renaissance Reinsurance and DaVinci; 2) specialty reinsurance, primarily written throughRenaissance Reinsurance and DaVinci; and 3) certain other activities of ventures as described herein. OurReinsurance operations are managed by the President of Renaissance Reinsurance, who leads a team ofunderwriters, risk modelers and other industry professionals, who have access to our proprietary riskmanagement, underwriting and modeling resources and tools. We believe the expertise of our underwritingand modeling team and our proprietary analytic tools, together with superior customer service, provide uswith a significant competitive advantage.
Our portfolio of business has continued to be increasingly characterized by relatively large transactions withceding companies with whom we do business, although no current relationship exceeds 15% of our grosspremiums written. Accordingly, our gross premiums written are subject to significant fluctuations dependingon our success in maintaining or expanding our relationships with these large customers. We believe thatrecent market dynamics, and trends in our industry in respect of potential future consolidation, haveincreased our exposure to the risks of broker, client and counterparty concentration.
The following table shows our total catastrophe and specialty reinsurance gross premiums written:
Year ended December 31, 2008 2007 2006(in thousands)
Renaissance catastrophe premiums $ 633,611 $ 662,987 $ 773,638Renaissance specialty premiums 153,701 277,882 198,111
Total Renaissance premiums 787,312 940,869 971,749
DaVinci catastrophe premiums 361,010 340,117 325,476DaVinci specialty premiums 6,069 9,434 23,938
Total DaVinci premiums 367,079 349,551 349,414
Total Reinsurance premiums $1,154,391 $1,290,420 $1,321,163
Total specialty premiums (1) $ 159,770 $ 287,316 $ 222,049
Total catastrophe premiums (2) $ 994,621 $1,003,104 $1,099,114
8

(1) Total specialty premiums written includes $nil, $0.4 million and $2.3 million of premiums assumedfrom our Individual Risk segment for the years ended December 31, 2008, 2007 and 2006,respectively.
(2) Total catastrophe premiums written includes $5.7 million, $37.0 million and $64.6 million of premiumsassumed from our Individual Risk segment for the years ended December 31, 2008, 2007 and 2006,respectively.
Property Catastrophe Reinsurance
We believe we are one of the largest providers of property catastrophe reinsurance in the world, based onour total catastrophe premium. Our principal property catastrophe reinsurance products includecatastrophe excess of loss reinsurance and excess of loss retrocessional reinsurance as described below:
Catastrophe Excess of Loss Reinsurance. We principally write catastrophe reinsurance on an excess ofloss basis, which means we provide coverage to our insureds when aggregate claims and claim expensesfrom a single occurrence of a covered peril exceed the attachment point specified in a particular contract.Under these contracts we indemnify an insurer for a portion of the losses on insurance policies in excess ofa specified loss amount, and up to an amount per loss specified in the contract. The coverage providedunder excess of loss reinsurance contracts may be on a worldwide basis or limited in scope to selectedgeographic areas. Coverage can also vary from “all property” perils to limited coverage on selected perils,such as “earthquake only” coverage.
Excess of Loss Retrocessional Reinsurance. We also write retrocessional reinsurance contracts thatprovide property catastrophe coverage to other reinsurers or retrocedants. In providing retrocessionalreinsurance, we focus on property catastrophe retrocessional reinsurance which covers the retrocedant onan excess of loss basis when aggregate claims and claim expenses from a single occurrence of a coveredperil and from a multiple number of reinsureds exceed a specified attachment point. The coverage providedunder excess of loss retrocessional contracts may be on a worldwide basis or limited in scope to selectedgeographic areas. Coverage can also vary from “all property” perils to limited coverage on selected perils,such as “earthquake only” coverage. The information available to retrocessional underwriters concerningthe original primary risk can be less precise than the information received from primary companies directly.Moreover, exposures from retrocessional business can change within a contract term as the underwriters ofa retrocedant alter their book of business after retrocessional coverage has been bound.
Our property catastrophe reinsurance contracts are generally “all risk” in nature. Our most significantexposure is to losses from earthquakes and hurricanes and other windstorms, although we are also exposedto claims arising from other catastrophes, such as tsunamis, freezes, floods, fires, tornadoes, explosionsand acts of terrorism in connection with the coverages we provide. Our predominant exposure under suchcoverage is to property damage. However, other risks, including business interruption and othernon-property losses, may also be covered under our property reinsurance contracts when arising from acovered peril. We offer our coverages on a worldwide basis.
Because of the wide range of possible catastrophic events to which we are exposed, including the size ofsuch events and because of the potential for multiple events to occur in the same time period, ourcatastrophe reinsurance business is volatile and our results of operations reflect this volatility. Further, ourfinancial condition may be impacted by this volatility over time or at any point in time. The effects of claimsfrom one or a number of severe catastrophic events could have a material adverse effect on us. We expectthat increases in the values and concentrations of insured property and the effects of inflation will increasethe severity of such occurrences in the future.
Catastrophe-Linked Securities. We also invest in catastrophe-linked securities (“cat-linked securities”).Cat-linked securities are generally privately placed fixed income securities as to which all or a portion of therepayment of the principal is linked to catastrophic events; for example, the occurrence of one or morehurricanes or earthquakes producing industry losses exceeding certain specified thresholds. We underwrite,model, evaluate and monitor these securities using the same tools and techniques used to evaluate ourmore traditional property catastrophe reinsurance business assumed. In addition, we may enter intoderivative transactions, such as total return swaps, that are based on or referenced to underlying cat-linkedsecurities. Based on an evaluation of the specific features of each cat-linked security, we account for these
9

securities as reinsurance or at fair value, as applicable, in accordance with U.S. generally acceptedaccounting principles (“GAAP”). In addition, in future periods we may utilize the growing market forcat-linked securities to expand our ceded reinsurance buying if we find the pricing and terms of suchcoverage attractive.
We seek to moderate the volatility of our risk portfolio through superior risk selection, diversification and thepurchase of retrocessional coverages and other protections. In furtherance of our strategy, we may increaseor decrease our presence in the catastrophe reinsurance business based on market conditions and ourassessment of risk-adjusted pricing adequacy. We frequently seek to purchase reinsurance or otherprotection for our own account to further reduce the financial impact that a large catastrophe or a series ofcatastrophes could have on our results.
As a result of our position in the market and reputation for superior customer service, we believe we havesuperior access to business we view as desirable compared to the market as a whole. As described above,we use our proprietary underwriting tools and guidelines to attempt to construct an attractive portfolio fromthese opportunities. We dynamically model policy submissions against our current in-force underwritingportfolio, comparing our estimate of the modeled expected returns of the contract against the amount ofcapital that we allocate to the contract, based on our estimate of its marginal impact on our overall riskportfolio. At times, our approach to portfolio management has resulted and may result in the future in ourhaving a relatively large market share of catastrophe reinsurance exposure in a particular geographic region,such as Florida, or to a particular peril, such as U.S. hurricane risk, where we believe supply and demandcharacteristics promote our providing significant capacity, or where the risks or class of risks otherwise addsefficiency to our portfolio. Conversely, from time to time we may have a disproportionately low market sharein certain regions or perils where we believe our capital would be less effectively deployed.
Specialty Reinsurance
We write a number of lines of reinsurance other than property catastrophe, such as catastrophe exposedworkers’ compensation, surety, terrorism, medical malpractice, catastrophe exposed personal lines property,casualty clash, certain other casualty lines and other specialty lines of reinsurance, which we collectively referto as specialty reinsurance. As with our catastrophe business, our team of experienced professionals seek tounderwrite these lines using a disciplined underwriting approach and sophisticated analytical tools.
We generally target lines of business where we believe we can adequately quantify the risks assumed andwhere potential losses could be characterized as low frequency and high severity, similar to our catastrophereinsurance coverages. We also seek to identify market dislocations and write new lines of business whoserisk and return characteristics are estimated to exceed our hurdle rates. We also seek to manage thecorrelations of this business with our overall portfolio, including our aggregate exposure to single andaggregated catastrophe events. We believe that our underwriting and analytical capabilities have positionedus well to manage this business.
We offer our specialty reinsurance products principally on an excess of loss basis, as described above withrespect to our catastrophe reinsurance products, and also provide some proportional coverage. In aproportional reinsurance arrangement (also referred to as quota share reinsurance and pro-ratareinsurance), the reinsurer shares a proportional part of the original premiums and losses of the reinsured.The reinsurer pays the cedant a commission which is generally based on the cedant’s cost of acquiring thebusiness being reinsured (including commissions, premium taxes, assessments and miscellaneousadministrative expenses) and may also include a profit factor. Our products generally include tailoredfeatures such as limits or sub-limits which we believe help us manage our exposures. Any liabilityexceeding, or otherwise not subject to, such limits reverts to the cedant. As with our catastrophereinsurance business, our specialty reinsurance frequently provides coverage for relatively large limits orexposures, and thus we are subject to potential significant claims volatility.
We generally seek to write significant lines on our specialty reinsurance treaties. As a result of our financialstrength, we have the ability to offer significant capacity and, for select risks, we have made availablesignificant limits. We believe these capabilities, the strength of our specialty reinsurance underwriting team,and our demonstrated ability and willingness to pay valid claims are competitive advantages of our specialtyreinsurance business.
10

Ventures
We pursue a number of other opportunities through our ventures unit, which has responsibility formanaging our joint venture relationships, executing customized reinsurance transactions to assume or cederisk and managing certain investments directed at classes of risk other than catastrophe reinsurance.
Property Catastrophe Managed Joint Ventures. We actively manage property catastrophe-oriented jointventures, which provide us with an additional presence in the market, enhance client relationships andgenerate fee income. These joint ventures allow us to leverage our access to business and our underwritingcapabilities on a larger capital base. Currently, our joint ventures include Top Layer Re and DaVinci. RUM,a wholly owned subsidiary of the Company, acts as the exclusive underwriting manager for each of thesejoint ventures.
DaVinci was established in 2001 and principally writes property catastrophe reinsurance and certain lowfrequency, high severity specialty reinsurance lines of business on a global basis. In general, we seek toconstruct for DaVinci a property catastrophe reinsurance portfolio with risk characteristics similar to those ofRenaissance Reinsurance’s property catastrophe reinsurance portfolio and certain lines of specialtyreinsurance such as terrorism and catastrophe exposed workers’ compensation. In accordance withDaVinci’s underwriting guidelines, it can only participate in business that is underwritten by RenaissanceReinsurance. We maintain majority voting control of DaVinciRe and, accordingly, consolidate the results ofDaVinciRe into our consolidated results of operations and financial position. We seek to manage DaVinci’scapital efficiently over time in light of the market opportunities and needs we perceive and believe we areable to serve. Our ownership in DaVinciRe was 22.8% and 20.5% at December 31, 2008 and 2007,respectively. On January 30, 2009, we purchased the shares of certain third party DaVinciRe shareholdersfor $145.5 million, less a $21.8 million reserve holdback. The purchase price was based on GAAP bookvalue as of December 31, 2008. As a result of these purchases, our ownership interest in DaVinciReincreased to 37.6%. We expect our ownership in DaVinciRe to fluctuate over time.
Top Layer Re writes high excess non-U.S. property catastrophe reinsurance. Top Layer Re is owned 50%by State Farm Mutual Automobile Insurance Company (“State Farm”) and 50% by ROIHL, a wholly ownedsubsidiary of the Company. State Farm provides $3.9 billion of stop loss reinsurance coverage to Top LayerRe. We account for our equity ownership in Top Layer Re under the equity method of accounting and ourproportionate share of its results are reflected in equity in (losses) earnings of other ventures in ourconsolidated statements of operations.
During 2007 and 2006, we participated in the formation of Starbound II and Starbound Re, respectively.These joint ventures provided capacity to the U.S. property catastrophe market, primarily for the 2007 and2006 U.S. hurricane seasons, respectively. While these joint ventures were active we owned a minorityinterest share of the entities and accounted for them as investments in other ventures, under equitymethod. These joint ventures have subsequently terminated and have returned capital to the joint ventureshareholders. Effective July 31, 2008 and August 31, 2007 we repurchased all of the issued andoutstanding share capital of Starbound II and Starbound Re, respectively. We now account for these entitiesas consolidated subsidiaries.
In addition, in May 2006, the Company sold third-party capital in Tim Re, currently a wholly ownedsubsidiary, to provide additional capacity to accept property catastrophe excess of loss reinsurancebusiness for the 2006 hurricane season, in return for a profit commission. In January 2007, the Companypurchased all of the issued and outstanding equity securities of Tim Re. The Company accounts for Tim Reas a consolidated subsidiary.
Ventures works on a range of other customized reinsurance transactions. For example, we haveparticipated, and continuously analyze other attractive opportunities to participate, in the market forcat-linked securities and derivatives. We also offer products through which we cede participations in theperformance of our catastrophe reinsurance portfolio. We believe our products contain a number ofcustomized features designed to fit the needs of our partners, as well as our risk management objectives.
11

Strategic Investments. Ventures also pursues strategic investments where, rather than assuming exclusivemanagement responsibilities ourselves, we instead partner with other market participants. Theseinvestments are directed at classes of risk other than catastrophe, and at times may also be directed atnon-insurance risks. We find these investments attractive both for their expected returns, and also becausethey provide us diversification benefits and information and exposure to other aspects of the market.
An example of these investments includes our investment in Tower Hill Insurance Group, LLC (“THIG”),Tower Hill Claims Services, LLC (“THCS”) and Tower Hill Claims Management, LLC (“THCM”) (collectively,the “Tower Hill Companies”), which operate primarily in the State of Florida. THIG is a managing generalagency specializing in insurance coverage for site built and manufactured homes. THCS and THCM provideclaim adjustment services through exclusive agreements with THIG. During the third quarter of 2008, weinvested $50.0 million in the Tower Hill Companies, representing a 25.0% ownership interest, to expandour core platforms by obtaining ownership in an additional distribution channel for the Florida homeownersmarket and to enhance our relationships with other stakeholders.
Weather-Related Activities. We undertake weather-related consulting and trading activities through ouroperating companies including Weather Predict, WP Consulting, AEF, RIM and RTL. Weather Predict, WPConsulting and AEF provide fee-based consulting services, sell weather-related information and forecasts,and engage in education, research and development, and loss mitigation activities, such as theRenaissanceRe Wall of Wind research facility located in southern Florida and the Stormstruck® interactiveweather experience at the Walt Disney World® Resort in Florida. RTL sells certain financial productsprimarily to address weather risks, and engages in certain weather, energy and commodity derivativestrading activities. Principally through RTL, we expect that our participation will increase in the tradingmarkets for securities and derivatives linked to energy, commodities, weather, other natural phenomena,and/or products or indices linked in part to such phenomena. As this unit grows, we are seeking to developclient and customer relationships, continuing to invest in operating and control environment systems andprocedures, hire staff and develop and install management information and other systems. We are alsotaking numerous other steps to implement our strategies. Success in executing our strategies in respect ofthis unit requires us to develop new expertise in certain areas.
Business activities that appear in our consolidated underwriting results, such as DaVinci and certainreinsurance transactions, are included in our Reinsurance segment results; the results of our investments,such as Top Layer Re, ChannelRe Holdings Ltd. (“ChannelRe”), Starbound II, Platinum UnderwritersHoldings Ltd. (“Platinum”), our weather-related activities and other ventures are included in the “Other”category of our segment results.
Competition
The markets in which we operate are highly competitive, and we believe that competition is increasing andbecoming more robust. With respect to our Reinsurance operations, we believe that our principalcompetitors include other companies active in the Bermuda market including Ace Limited (“Ace”), AlliedWorld Assurance Company Ltd. (“Allied World”), Arch Capital Group (“Arch”), Axis Capital Holdings(“Axis”), Endurance Specialty Holdings Ltd. (“Endurance”), Everest Re Group Ltd. (“Everest Re”), IPCHoldings, Ltd. (“IPC”), Montpelier Re Holdings Ltd. (“Montpelier Re”), PartnerRe Ltd. (“Partner Re”),Platinum, Transatlantic Holdings Inc. (“Transatlantic”), Validus Holdings, Ltd. (“Validus”), White MountainsInsurance Group Ltd. (“White Mountains”) and XL Capital Ltd. (“XL”) We also compete with certain Lloyd’ssyndicates active in the London market, as well as with a number of other industry participants, such asAmerican International Group, Inc. (“AIG”), Berkshire Hathaway (“Berkshire”), Hannover Re, Munich ReGroup and Swiss Re. As our business evolves over time we expect our competitors to change as well.
While their participation in the reinsurance market may be decreasing somewhat due to the current issuesfacing the capital and credit markets, hedge funds, investment banks, exchanges and other capital marketparticipants have also shown increasing interest over the past several years in entering the reinsurancemarket. For example, over the last several years there has been substantial growth in financial productssuch as exchange traded catastrophe options, cat-linked securities, catastrophe-linked derivativeagreements and other financial products, intended to compete with traditional reinsurance. We believe thatcompetition from non-traditional sources such as these will continue to increase in the future. Many of
12

these new competitors have greater financial, marketing and management resources than we do. Inaddition, the tax policies of the countries where our clients operate, as well as government sponsored orbacked catastrophe funds, affect demand for reinsurance. We are unable to predict the extent to which theforegoing new, proposed or potential initiatives may affect the demand for our products or the risks whichmay be available for us when providing coverage.
Individual Risk Segment
We define our Individual Risk segment to include underwriting that involves understanding thecharacteristics of the original underlying insurance policy. Our Individual Risk segment is managed by theChief Executive Officer of the Glencoe Group. Our Individual Risk operations seek to identify and writeclasses of business which are attractively priced relative to the risk exposure and, particularly in the case ofcatastrophe-exposed risks, where our expertise in modeling, analytical tools and information systems mayprovide a competitive advantage.
The following table shows our Individual Risk gross premiums written by major type of business:
2008 2007 2006
Year ended December 31,
GrossPremiumsWritten
Percentageof Gross
PremiumsWritten
GrossPremiumsWritten
Percentageof Gross
PremiumsWritten
GrossPremiumsWritten
Percentageof Gross
PremiumsWritten
(in thousands, except percentages)
Individual Risk grosspremiums writtenMulti-peril crop $272,559 46.4% $178,728 32.1% $129,908 18.9%Commercial property 134,601 23.0 164,438 29.5 226,205 32.8Commercial multi-line 119,987 20.4 162,422 29.2 229,079 33.2Personal lines property 60,162 10.2 51,006 9.2 104,200 15.1
Total Individual Risk grosspremiums written $587,309 100.0% $556,594 100.0% $689,392 100.0%
Our Individual Risk business is written by the Glencoe Group through its principal operating subsidiaries:
• Agro National – a managing general underwriter of multi-peril crop insurance that participates inthe U.S. Federal government’s Multi-Peril Crop Insurance Program;
• Glencoe – a Bermuda-domiciled excess and surplus lines insurance company that is currentlyeligible to do business on an excess and surplus lines basis in 51 U.S. jurisdictions;
• Lantana – a Bermuda-domiciled insurance company currently eligible as an excess and surpluslines carrier in 49 U.S. jurisdictions;
• Stonington – a Texas domiciled insurance company that is licensed on an admitted basis in all 50states and the District of Columbia; and
• Stonington Lloyds Insurance Company (“Stonington Lloyds”) – a Texas domiciled Lloyds planinsurer.
Our principal contracts include insurance policies and quota share reinsurance with respect to risks including: 1)multi-peril crop, which includes multi-peril crop insurance, crop hail and other named peril agriculture riskmanagement products; 2) commercial property, which principally includes catastrophe-exposed commercialproperty products; 3) commercial multi-line, which includes commercial property and liability coverage, such asgeneral liability, automobile liability and physical damage, building and contents, professional liability and variousspecialty products; and 4) personal lines property, which principally includes homeowners personal linesproperty coverage and catastrophe exposed personal lines property coverage.
13

Our Individual Risk business is produced primarily through four distribution channels:
1) Wholly owned program manager – We write specialty lines primary insurance through a whollyowned specialized program manager;
2) Third party program managers – We write specialty lines primary insurance through third partyspecialized program managers, who produce business pursuant to agreed-upon underwritingguidelines and provide related back-office functions;
3) Quota share reinsurance – We write quota share reinsurance with primary insurers who producebusiness pursuant to agreed-upon underwriting guidelines and provide most back-officefunctions; and
4) Broker-produced business – We write primary insurance produced through brokers on arisk-by-risk basis.
The following table shows the percentage of our Individual Risk gross premiums written by distributionchannel:
2008 2007 2006
Year ended December 31,
GrossPremiumsWritten
Percentageof Gross
PremiumsWritten
GrossPremiumsWritten
Percentageof Gross
PremiumsWritten
GrossPremiumsWritten
Percentageof Gross
PremiumsWritten
(in thousands, except percentages)
Individual Risk gross premiumswrittenProgram manager – wholly
owned (1) $272,559 46.4% $178,728 32.1% $129,908 18.9%Program managers – third
party 216,880 36.9 235,849 42.4 305,299 44.3Quota share reinsurance 97,444 16.6 139,952 25.1 238,066 34.5Broker-produced business 426 0.1 2,065 0.4 16,119 2.3
Total Individual Risk grosspremiums written $587,309 100.0% $556,594 100.0% $689,392 100.0%
(1) Program manager – wholly owned represents Agro National which we acquired in an asset purchase onJune 2, 2008. The table above is presented as if Agro National has been a wholly-owned subsidiarysince the first period presented.
We seek to identify and do business with third party program managers and quota share reinsurancecedants whom we believe utilize superior underwriting methodologies. We rely on these third parties forservices including policy issuance, premium collection, claims processing, and compliance with variousstate laws and regulations including licensing. We seek to work closely with these partners, attempting toemploy our analytical methodologies and, where appropriate, our expertise in catastrophe risk, to arrive atadequate pricing for the risks being underwritten. We seek to structure these relationships to provide valueto both parties and meaningful protections to us. Historically, our strategy relating to program managerrelationships has been to pursue a relatively small number of relatively large relationships. Currently, we areinvesting in initiatives to strengthen our operating platform, enhance our internal capabilities, and expandthe resources we commit to our Individual Risk operations. In furtherance of these initiatives, in 2008 wecompleted the acquisition of substantially all the net assets of Agro National, LLC and Claims ManagementServices, Inc. (“CMS”).
We actively oversee our third party relationships through an operations review team at Glencoe SpecialtyServices and through the use of proprietary tools such as PACeR. Our operations review team includesprofessionals from diverse disciplines including actuarial science, accounting, claims management, law,regulatory compliance and underwriting. This group assists with the initial due diligence as well as theongoing monitoring of these third parties. Our ongoing monitoring includes periodic audits of our third partyprogram managers and third party administrators. In addition, for our large third party program managers
14

we maintain an employee in an underwriting capacity on-site at the program manager to oversee theprogram manager’s compliance with our prescribed underwriting guidelines. We generally seek to havecontractual performance standards for each of our programs and third party administrators whosecompensation is subject to adjustment based on meeting these standards. The program operations teamaudits compliance with our underwriting guidelines and contractually agreed operating guidelines andperformance standards. The program operations team also seeks to ensure corrective action is takenquickly to resolve issues identified during the audit process.
Competition
In our Individual Risk business, we face competition from independent insurance companies, subsidiariesor affiliates of major worldwide companies and others, some of which have greater financial and otherresources than we do. Primary insurers compete on the basis of various factors including distributionchannels, product, price, service, financial strength and reputation. Many of our Reinsurance segmentcompetitors listed above also compete for the program business and quota share reinsurance we writewithin our Individual Risk segment. We believe that our principal competitors in the program business ofour Individual Risk segment include operating subsidiaries of AIG, Arch, WR Berkley Corp. (“Berkley”),Berkshire, Endurance, Hannover Re and Zurich Financial Services Group (“Zurich”). In our Individual Riskbusiness, we compete not only in respect of the insurance and reinsurance products we offer, but inrespect of the contractual relationships with the third party program managers with whom we seek topartner. Increased competition in respect of our products could result in decreased premium rates, lessattractive terms and conditions, and a decrease in our share of attractive programs. Increased competitionin respect of our program manager partners, as to whom we are extremely selective and whose relationshipwe seek to tightly manage in a disciplined, consistent fashion, could result in less favorable terms andconditions in respect of our contractual arrangements with our partners, the loss of existing programmanager relationships, or constrain our ability to add new relationships to our operations. In addition, therehas been a growing trend of insurance and reinsurance companies acquiring third party programmanagers. Acquisitions of third party program managers with whom we do business by other insurance orreinsurance companies could result in us losing that program manager relationship. Any of the foregoingcould adversely impact the growth and profitability of our Individual Risk segment.
RATINGS
Financial strength ratings are an important factor in respect of the competitive position of reinsurance andinsurance companies. Rating organizations continually review the financial positions of our reinsurers andinsurers. Over the last five years, we have received high claims-paying and financial strength ratings fromA.M. Best Co. (“A.M. Best”), Standard & Poor’s Rating Agency (“S&P”), Moody’s and Fitch. These ratingsrepresent independent opinions of an insurer’s financial strength, operating performance and ability to meetpolicyholder obligations, and are not an evaluation directed toward the protection of investors or arecommendation to buy, sell or hold any of our securities.
15

Presented below are the ratings of our principal operating subsidiaries and joint ventures by segment andthe senior debt ratings of RenaissanceRe as of February 11, 2009. See “Management’s Discussion andAnalysis of Financial Condition and Results of Operations – Capital Resources – Credit Ratings” forinformation about recent ratings actions.
At February 11, 2009 A.M. Best
A.M. BestFinancial Size
Category S&P Moody’s Fitch
REINSURANCE SEGMENT (1)Renaissance Reinsurance A+ XIV AA- A2 ADaVinci A XII A+ — —Top Layer Re A+ VII AA — —Renaissance Europe A+ XIV AA- — —
INDIVIDUAL RISK SEGMENT (1)Glencoe A XI — — —Stonington A XI — — —Stonington Lloyds A XI — — —Lantana A XI — — —
RENAISSANCERE (2) a- — A Baa1 BBB+
(1) The A.M. Best, S&P, Moody’s and Fitch ratings for the companies in the Reinsurance and IndividualRisk segments reflect the insurer’s financial strength rating (see explanation of the rating levels below).
(2) The A.M. Best, S&P, Moody’s and Fitch ratings for RenaissanceRe represent the credit ratings on itssenior unsecured debt.
A.M. Best. “A+” is the second highest designation of A.M. Best’s sixteen rating levels. “A+” ratedinsurance companies are defined as “Superior” companies and are considered by A.M. Best to have a verystrong ability to meet their obligations to policyholders. “A” is the third highest designation assigned by A.M.Best, representing A.M. Best’s opinion that the insurer has an excellent ability to meet its ongoingobligations to policyholders.
A.M. Best also assigns a financial size category to each of the insurance companies rated. “VII” representsa company with $50.0 – $100.0 million in capital, “XI” represents a company with $750.0 million – $1.0billion in capital, “XII” represents a company with $1.0 – $1.25 billion in capital and “XIV” represents acompany with $1.5 – $2.0 billion in capital. The outlooks for all companies rated by A.M. Best are stable.
In addition, A.M. Best assigns an issuer credit rating (“ICR”) to an entity which is an opinion on the ability ofan entity to meet its senior obligations. RenaissanceRe has been assigned “a-” which is defined as“Excellent” by A.M. Best and the outlook is considered stable.
S&P. The “AA” range (“AA+”, “AA”, AA-”), which has been assigned by S&P to RenaissanceReinsurance, Renaissance Europe and Top Layer Re, is the second highest rating assigned by S&P, andindicates that S&P believes the insurers have very strong financial security characteristics, differing onlyslightly from those rated higher. DaVinci has been assigned a rating of “A+” by S&P, indicating the insurerhas strong financial security characteristics but is somewhat more likely to be affected by adverse businessconditions than are insurers with higher ratings.
S&P also assigns an issuer credit rating to an entity which is an opinion on the credit worthiness of obligorwith respect to a specific financial obligation. RenaissanceRe has been assigned an ICR of “A”, which is thethird highest rating assigned by S&P.
Moody’s. Moody’s Insurance Financial Strength Ratings and Moody’s Credit Ratings represent its opinionsof the ability of insurance companies to pay punctually policyholder claims and obligations and seniorunsecured debt instruments. Moody’s believes that insurance companies rated A2, such as RenaissanceReinsurance, and companies rated Baa1, such as RenaissanceRe, offer good financial security. However,Moody’s believes that elements may be present which suggest a susceptibility to impairment sometime inthe future.
16

Fitch. Fitch Ratings Ltd. Issuer Financial Strength ratings provide an assessment of the financial strengthof an insurance organization. Fitch believes that insurance companies rated “A”, such as RenaissanceReinsurance, have “Strong” capacity to meet policyholders and contract obligations on a timely basis with alow expectation of ceased or interrupted payments. Fitch also provides Long-Term Credit Ratings, used as abenchmark measure of probability of default; these were formerly described as Issuer Default Ratings.RenaissanceRe has been rated “BBB+”, meaning there are currently expectations of low credit risk.
While the ratings of our principal operating subsidiaries and joint ventures within our Reinsurance segmentremain among the highest in our business, adverse ratings actions could have a negative effect on ourability to fully realize current or future market opportunities. In addition, it is common for our reinsurancecontracts to contain provisions permitting our clients to cancel coverage pro-rata if our relevant operatingsubsidiary is downgraded below a certain rating level. Whether a client would exercise this right woulddepend, among other factors, on the reason for such a downgrade, the extent of the downgrade, theprevailing market conditions and the pricing and availability of replacement reinsurance coverage.Therefore, in the event of a downgrade, it is not possible to predict in advance the extent to which thiscancellation right would be exercised, if at all, or what effect such cancellations would have on the financialcondition or future operations, but such effect potentially could be material. To date we are not aware thatwe have experienced such a cancellation. Our ratings are subject to periodic review and may be revised orrevoked by the agencies which issue them.
UNDERWRITING AND ENTERPRISE RISK MANAGEMENT
Underwriting
Our primary underwriting goal is to construct a portfolio of reinsurance and insurance contracts and otherfinancial risks that maximizes our return on shareholders’ equity, subject to prudent risk constraints, and togenerate long-term growth in tangible book value per common share plus accumulated dividends. Weassess each new (re)insurance contract on the basis of the expected incremental return relative to theincremental contribution to portfolio risk.
Reinsurance
We have developed a proprietary, computer-based pricing and exposure management system, REMS©.Since inception, we have continued to invest in and improve REMS©, incorporating our underwritingexperience, additional proprietary software and a significant amount of new industry data. REMS© hasanalytic and modeling capabilities that help us to assess the risk and return of each incrementalreinsurance contract in relation to our overall portfolio of reinsurance contracts. We combine the analysesgenerated by REMS© with other information available to us, including our own knowledge of the clientsubmitting the proposed program, to assess the premium offered against the risk of loss which the programpresents. We have licensed and integrated into REMS© a number of third party catastrophe computermodels in addition to our base model, which we use to validate and stress test our base REMS© results.REMS© is most developed in analyzing catastrophe risks. We believe that our tools for assessingnon-catastrophe risks are much less sophisticated and much less well developed than those for catastropherisks. We continuously strive to improve our analytical techniques relating to non-catastrophe risks.
We believe that REMS© is a more robust underwriting and risk management system than is currentlycommercially available elsewhere in the reinsurance industry. Before we bind a reinsurance risk, exposuredata is typically gathered from clients and this exposure data is input into the REMS© modeling system. Webelieve that the REMS© modeling system helps us to analyze each policy on a consistent basis, assistingour determination of what we believe to be an appropriate price to charge for each policy based upon therisk that is assumed. REMS© combines computer-generated statistical simulations that estimate eventprobabilities with exposure and coverage information on each client’s reinsurance contract to produceexpected claims for reinsurance programs submitted to us. Our models employ simulation techniques togenerate 40,000 years of loss activity, including events causing in excess of $600 billion in insured losses.From this simulation, we generate a probability distribution of potential outcomes for each policy in ourportfolio and for our total portfolio. In part through the utilization of REMS© we seek to compare ourestimate of the expected returns in respect of a contract with the amount of capital that we notionally
17

allocate to the contract based on our estimate of its marginal impact on our portfolio of risks. We have alsocustomized REMS© by including additional perils, risks and geographic areas that may not be captured inthe commercially available models.
We periodically review the estimates and assumptions that are reflected in REMS© and our other tools. Forexample, in the second half of 2005 we revised our assumptions relating to Atlantic basin hurricanefrequency and severity. While many commercial catastrophe models base their frequency and severitydistributions on the last 100 years of hurricane activity, assuming that this time frame is an appropriateframework on which to base estimates of the hurricane risk to which the insurance industry is exposed, wecurrently do not believe, based on our review of the scientific literature, private research, and discussionswith climatologists, meteorologists and other weather scientists, including those at Weather Predict, that thepast 100 years of data is reflective of current climatological risks. In particular, we believe there has beenan increase in the frequency and severity of hurricanes that have the potential to make landfall in the U.S.,potentially as a result of decadal ocean water temperature cyclical trends, a longer-term trend towardsglobal warming, or both or other factors. We started using these revised assumptions in REMS© to modeland evaluate our portfolio of risk in the latter part of 2005. The process of updating all of the underlying riskmodels is continuous, and many of the assumptions involve significant judgment on our part, and furtherexperience or scientific research may lead us to further adjust these assumptions. Changes in our modeledassumptions may impact from time to time the amount of capacity we are prepared to offer.
Our catastrophe reinsurance underwriters use REMS© in their pricing decisions, which we believe providesthem with several competitive advantages. These include the ability:
• to simulate a greater number of years of catastrophic event activity compared to a much smallersample in generally available models, allowing us to analyze exposure to a greater number andcombination of potential events;
• to analyze the incremental impact of an individual reinsurance contract on our overall portfolio;
• to better assess the underlying exposures associated with assumed retrocessional business;
• to price contracts within a short time frame;
• to capture various classes of risk, including catastrophe and other insurance risks;
• to assess risk across multiple entities (including our various joint ventures) and across differentcomponents of our capital structure; and
• to provide consistent pricing information.
As part of our risk management process, we also use REMS© to assist us with the purchase of reinsurancecoverage for our own account.
We have developed underwriting guidelines, to be used in conjunction with REMS©, that seek to limit theexposure to claims from any single catastrophic event and the exposure to losses from a series ofcatastrophic events. As part of our pricing and underwriting process, we also assess a variety of otherfactors, including:
• the reputation of the proposed cedant and the likelihood of establishing a long-term relationshipwith the cedant;
• the geographic area in which the cedant does business and its market share;
• historical loss data for the cedant and, where available, for the industry as a whole in the relevantregions, in order to compare the cedant’s historical catastrophe loss experience to industryaverages;
• the cedant’s pricing strategies; and
• the perceived financial strength of the cedant.
18

In order to estimate the risk profile of each line of specialty reinsurance, we establish probabilitydistributions and assess the correlations with the rest of our portfolio. In lines with catastrophe risk, such asexcess workers’ compensation and terrorism, we are leveraging directly off our skill in modeling for ourproperty catastrophe reinsurance risks, and seek to appropriately estimate and manage the correlationsbetween these specialty lines and our catastrophe reinsurance portfolio. For other classes of business, inwhich we believe we have little or no natural catastrophe exposure, and hence estimate we will havesignificantly less correlation with our property catastrophe reinsurance coverages, we derive probabilitydistributions from a variety of underlying information sources, including recent historical experience, butwith the application of judgment as appropriate. The nature of some of these businesses lends itself less tothe analysis that we use for our property catastrophe reinsurance coverages, reflecting both the nature ofavailable exposure information, and the impact of human factors such as tort exposure. We produceprobability distributions to represent our estimates of the related underlying risks which our products cover,which we believe helps us to make consistent underwriting decisions and to manage our total risk portfolio.Overall, we undertake to construct conservative representations of the risks within our models, althoughthere can be no assurance that this has occurred or will occur in the future.
Individual Risk
For our catastrophe-exposed business in our Individual Risk segment, we utilize proprietary modeling toolsthat have been developed in conjunction with the modeling and other resources utilized in our Reinsuranceoperations, as described above. We also combine these analyses with those of our Reinsurance segment tomonitor our aggregate group catastrophic exposures. In general, we believe our techniques for evaluatingcatastrophe risk are better developed than those for other classes of risk.
For the business produced through third party program managers, we seek to carefully identify andevaluate potential third party program managers. When evaluating a potential new program manager, weconsider numerous factors including: (i) whether the program manager can provide and help us analyzehistoric loss and other business data; (ii) whether the program manager will agree to accept a portion oftheir compensation based on the underwriting performance of their program and provide us with the otherterms and conditions we require; (iii) our assessment of the integrity and experience of the programmanager’s management team; (iv) the potential profitability of the program to us; and (v) the availability ofour internal resources to appropriately conduct due diligence, negotiate and execute transaction terms, andprovide the ongoing monitoring we require. In considering pricing for the products to be offered by theprogram manager, we evaluate the expected frequency and severity of losses, the costs of providing thenecessary coverage (including the cost of administering policy benefits, sales and other administrative andoverhead costs), the necessity of third party reinsurance, the estimated costs thereof and an anticipatedmargin for profit.
In addition to utilizing REMS©, within our Individual Risk operations we have developed a proprietaryinformation management and analytical database, PACeR, within which our data related to substantially allour business is maintained. With the use and development of PACeR, we are seeking to develop statisticaland analytical techniques to evaluate the U.S. program lines of business we write within this segment andwhich over time we hope will create a competitive advantage. We believe that PACeR helps our clientsbetter understand their business, thus creating value for them and us. For example, we believe that PACeRenables us to better identify and estimate the expected loss experience of particular products and PACeR isemployed in the design of our products and the establishment of rates. We also seek to monitor pricingadequacy on our products by region, risk and producer. Subject to regulatory considerations, we seek tomake timely premium and coverage modifications where we determine them to be appropriate.
We provide our third party program managers with written underwriting guidelines and monitor theircompliance with our guidelines on a regular basis. Also, our contracts generally provide that a portion of thecommission payable to our third party program managers will be on a retrospective basis, which is intendedto permit us to adjust commissions based on our profitability and claims experience once an underwritingyear is reasonably mature. We rely on our third party program managers to perform underwriting pursuantto these contractual guidelines, and believe we benefit from their superior local information and expertise inniche areas.
19

Enterprise Risk Management
We have sought to develop and utilize a series of tools and processes that support a robust system ofenterprise risk management (“ERM”) within our organization. We consider ERM to be a key process,overseen by our senior management team under the supervision of our Board of Directors, andimplemented by personnel from across our organization. We believe that ERM helps us to identify potentialevents that may affect us, to quantify, evaluate and manage the risks to which we are exposed, and toprovide reasonable assurance regarding the achievement of our objectives. We believe that effective ERMcan provide us with a significant competitive advantage. We also believe that effective ERM assists ourefforts to minimize the likelihood of suffering financial outcomes in excess of the ranges which we haveestimated in respect of specific investments, underwriting decisions, or other operating or businessactivities. We believe that our risk management tools support our strategy of pursuing opportunities createdby dislocated markets and help us to identify opportunities that we believe to be the most attractive. Ourrisk management tools allow us to monitor our capital position, on a consolidated basis and for each of ourmajor operating subsidiaries, and these tools help us determine the appropriate amount of capital tosupport the risks that we have assumed in the aggregate and for each of our major operating subsidiaries.We believe that our risk management efforts are essential to our corporate strategy and our goal ofachieving long-term growth in tangible book value per share plus accumulated dividends for ourshareholders.
Our ERM framework comprises four key activities, as set forth below:
Underwriting and Other Quantifiable Risks. We believe that our operations are subject to a number of keyrisks, including underwriting risk, credit risk and interest rate risk as they relate to investments, cededreinsurance credit risk and strategic investment risk, each of which can be analyzed in substantial partthrough quantitative tools and techniques. Of these, we believe underwriting risk to be the most material tous. In order to understand, monitor, quantify and proactively assess underwriting risk, we seek to developand deploy appropriate tools to, among other things, estimate the comparable expected returns on potentialbusiness opportunities, and estimate the impact that such incremental business could have on our overallrisk profile. We use the tools and methods described above in “Underwriting” to seek to achieve theseobjectives.
Aggregate Risk Profile. In part through the utilization of REMS© and our other systems and procedures,we seek to analyze our in-force aggregate underwriting portfolio on a daily basis. We believe this capability,not only helps us to manage our aggregate exposures, but assists our efforts to rigorously analyze individualproposed transactions and evaluate them in the context of our in-force portfolio. This aggregation processcaptures line of business, segment and corporate risk profiles, calculates internal and external capital testsand explicitly models ceded reinsurance. Generally, additional data is added quarterly to our aggregate riskframework to reflect updated or new information or estimates relating to matters such as interest rate risk,credit risk, capital adequacy and liquidity. This information is used in day-to-day decision making forunderwriting, investments and operations and is also reviewed quarterly from both a unit level and inrespect of our consolidated financial position.
Operational Risk. We believe we are subject to a number of additional risks arising out of operational,regulatory, and other matters, which we also seek to actively monitor and manage. This effort is coordinatedby senior personnel including our Chief Financial Officer (“CFO”), General Counsel and Chief ComplianceOfficer (“CCO”), Corporate Controller and Chief Accounting Officer (“CAO”), Chief Administrative Officer,Chief Risk Officer (“CRO”) and Internal Audit, utilizing resources within the Company.
In an effort to identify and reduce operational and regulatory risk, we have significantly enhanced ourcontrol environment and have added additional finance, legal and back-office resources, to keep pace withthe rate of growth experienced by the Company and will continue to do so in the future as appropriate. Forexample:
• we have developed and expanded the compliance and internal audit functions;
• the accounting function has been strengthened by the addition of a significant number ofprofessionals;
20

• accounting, legal and/or compliance resources have been placed in our business units to monitor,identify and resolve potential accounting, legal and compliance needs at the operational level; and
• we have documented accounting guidelines for the review of all non-standard reinsurancecontracts and other structured and/or complex financial transactions.
Although financial reporting is a key area of our focus, other operational risks are addressed through ourdisaster recovery program, human resource practices such as motivating and retaining top talent, and ourstrict compliance, legal and tax protocols.
Controls and Compliance Committee. As part of monitoring our risks, we have instituted a Controls andCompliance Committee. The Controls and Compliance Committee is comprised of our CFO, CCO, CAO,Chief Administrative Officer, CRO, staff compliance function and representatives from our business units.The Controls and Compliance Committee meets periodically to review and address corporate compliancepolicies and is charged with monitoring, implementing and educating the Company on control andcompliance topics and initiatives. In addition, the Controls and Compliance Committee is charged withreviewing certain transactions that potentially contain complex and/or significant underwriting, tax, legal,accounting, regulatory, reputational or compliance issues.
Ongoing Development and Enhancement. We frequently seek to increase the number of risks we monitorin part through quantitative risk distributions, even where we believe that such quantitative analysis is not asrobust or well developed as our tools and models for measuring and evaluating other risks, such ascatastrophe and market risks. We also seek to improve the methods by which we measure risks. We believeeffective risk management is a continual process that requires ongoing improvement and development. Weseek from time to time to identify new best practices or additional developments both from within ourindustry and from other sectors. We believe that our ongoing efforts to embed ERM throughout ourorganization are important to our efforts to produce and maintain a competitive advantage to achieve ourcorporate goals.
Our ERM is currently rated “excellent” by S&P which is S&P’s highest ERM rating.
GEOGRAPHIC BREAKDOWN
Our exposures are generally diversified across geographic zones, but are also a function of marketconditions and opportunities. The Company’s largest exposure has historically been to the U.S. andCaribbean property catastrophe market, which represented 42.9% of the Company’s gross premiumswritten for the year ended December 31, 2008. A significant amount of our U.S. and Caribbean premiumprovides coverage against windstorms, mainly U.S. Atlantic hurricanes, as well as earthquakes and othernatural and man-made catastrophes. The following table sets forth the percentage of our gross premiumswritten allocated to the territory of coverage exposure:
Year ended December 31,
2008 2007 2006
GrossPremiumsWritten
Percentageof Gross
PremiumsWritten
GrossPremiumsWritten
Percentageof Gross
PremiumsWritten
GrossPremiumsWritten
Percentageof Gross
PremiumsWritten
(in thousands, except percentages)
Property catastrophe reinsuranceUnited States and Caribbean $ 745,016 42.9% $ 735,322 40.6% $ 792,311 40.8%Worldwide (excluding U.S) (1) 75,489 4.3 66,392 3.7 71,116 3.7Europe 72,153 4.2 111,702 6.2 73,500 3.8Worldwide 67,371 3.9 27,577 1.5 68,575 3.5Australia and New Zealand 5,455 0.3 4,360 0.2 2,732 0.1Other 23,465 1.4 20,374 1.1 23,972 1.2
Specialty reinsurance (2) 159,770 9.2 287,316 15.9 222,049 11.4
Total reinsurance (3) 1,148,719 66.2 1,253,043 69.2 1,254,255 64.5Individual Risk (4) 587,309 33.8 556,594 30.8 689,392 35.5
Total gross premiums written $1,736,028 100.0% $1,809,637 100.0% $1,943,647 100.0%
21

(1) The category “Worldwide (excluding U.S.)” consists of contracts that cover more than one geographicregion (other than the U.S.). The exposure in this category for gross premiums written to date ispredominantly from Europe and Japan.
(2) The category Specialty reinsurance consists of contracts that are predominantly exposed to U.S. andworldwide risks.
(3) Excludes $5.7 million, $37.4 million and $66.9 million of premium assumed from our Individual Risksegment in 2008, 2007 and 2006, respectively.
(4) The category Individual Risk consists of contracts that are primarily exposed to U.S. risks.
RESERVES FOR CLAIMS AND CLAIM EXPENSES
Claims and claim expense reserves represent estimates, including actuarial and statistical projections at agiven point in time, of the ultimate settlement and administration costs for unpaid claims and claimexpenses arising from the insurance and reinsurance contracts we sell. We establish our claims and claimexpense reserves by taking claims reported to us by insureds and ceding companies, but which have notyet been paid (“case reserves”), adding the costs for additional case reserves (“additional case reserves”)which represent our estimates for claims previously reported to us which we believe may not be adequatelyreserved as of that date, and adding estimates for the anticipated cost of claims incurred but not yetreported to us (“IBNR”).
The following table summarizes our claims and claim expense reserves by line of business and splitbetween case reserves, additional case reserves and IBNR at December 31, 2008 and 2007:
At December 31, 2008Case
ReservesAdditional Case
Reserves IBNR Total(in thousands)
Property catastrophe reinsurance $312,944 $297,279 $ 250,946 $ 861,169Specialty reinsurance 113,953 135,345 387,352 636,650
Total Reinsurance 426,897 432,624 638,298 1,497,819Individual Risk 253,327 14,591 394,875 662,793
Total $680,224 $447,215 $1,033,173 $2,160,612
At December 31, 2007(in thousands)
Property catastrophe reinsurance $275,436 $287,201 $ 204,487 $ 767,124Specialty reinsurance 109,567 93,280 448,756 651,603
Total Reinsurance 385,003 380,481 653,243 1,418,727Individual Risk 237,747 10,359 361,663 609,769
Total $622,750 $390,840 $1,014,906 $2,028,496
The increase in the total amount of claims and claim expense reserves from December 31, 2007 toDecember 31, 2008, as shown in the table above, was principally a result of net claims and claim expensesincurred relating to current and prior years of $760.5 million, including hurricanes Gustav and Ike whichmade landfall during the third quarter of 2008, and partially offset by the net payment of claims in respectof current year losses of $346.8 million, relating primarily to hurricanes Gustav and Ike and our multi-perilcrop insurance line of business, and the payment of prior year losses of $397.8 million, in particular theprior year losses resulting from the large hurricanes of 2005, European windstorm Kyrill (“Kyrill”), theUnited Kingdom (“U.K.”) flood losses and our specialty unit and Individual Risk segment losses. Ourestimates of claims and claim expense reserves are not precise in that, among other matters, they arebased on predictions of future developments and estimates of future trends and other variable factors.Some, but not all, of our reserves are further subject to the uncertainty inherent in actuarial methodologiesand estimates. Because a reserve estimate is simply an insurer’s estimate at a point in time of its ultimateliability, and because there are numerous factors which affect reserves and claims payments but cannot bedetermined with certainty in advance, our ultimate payments will vary, perhaps materially, from our
22

estimates of reserves. If we determine in a subsequent period that adjustments to our previouslyestablished reserves are appropriate, such adjustments are recorded in the period in which they areidentified. During the twelve months ended December 31, 2008, changes to prior year estimated claimsreserves increased our net income or reduced our net loss by $234.8 million (2007 – $233.2 million, 2006– $136.6 million), excluding the consideration of changes in reinstatement premium, profit commissions,minority interest and income tax expense.
Our reserving methodology for each line of business uses a loss reserving process that calculates a pointestimate for the Company’s ultimate settlement and administration costs for claims and claim expenses. Wedo not calculate a range of estimates. We use this point estimate, along with paid claims and case reserves,to record our best estimate of additional case reserves and IBNR in our financial statements. Under GAAP,we are not permitted to establish estimates for catastrophe claims and claim expense reserves until anevent occurs that gives rise to a loss.
Reserving for our reinsurance claims involves other uncertainties, such as the dependence on informationfrom ceding companies, which among other matters, includes the time lag inherent in reporting informationfrom the primary insurer to us or to our ceding companies and differing reserving practices among cedingcompanies. The information received from ceding companies is typically in the form of bordereaux, brokernotifications of loss and/or discussions with ceding companies or their brokers. This information can bereceived on a monthly, quarterly or transactional basis and normally includes estimates of paid claims andcase reserves. We sometimes also receive an estimate or provision for IBNR. This information is oftenupdated and adjusted from time-to-time during the loss settlement period as new data or facts in respect ofinitial claims, client accounts, industry or event trends may be reported or emerge in addition to changes inapplicable statutory and case laws.
Included in our results for 2008 are $468.0 million of net claims and claim expenses incurred as a result oflosses arising from hurricanes Gustav and Ike which struck the United States in the third quarter of 2008.Our estimates of losses from hurricanes Gustav and Ike, as well as other 2008 catastrophe events, arebased on factors including currently available information derived from the Company’s preliminary claimsinformation from certain clients and brokers, industry assessments of losses from the events, proprietarymodels, and the terms and conditions of our contracts. Given the magnitude and recent occurrence ofthese events, meaningful uncertainty remains regarding total covered losses for the insurance industry and,accordingly, several of the key assumptions underlying our loss estimates. In addition, actual losses fromthese events may increase if our reinsurers or other obligors fail to meet their obligations. Our actual lossesfrom these events will likely vary, perhaps materially, from these current estimates due to the inherentuncertainties in reserving for such losses, including the preliminary nature of the available information, thepotential inaccuracies and inadequacies in the data provided by clients and brokers, the inherentuncertainty of modeling techniques and the application of such techniques, the effects of any demandsurge on claims activity and complex coverage and other legal issues.
Included in our results for 2007 are $157.5 million of net claims and claim expenses from Kyrill and theU.K. flood losses which occurred in 2007, as well as $60.0 million in estimated net losses associated withexposure to sub-prime related casualty losses. Estimates of these losses are based on a review of potentiallyexposed contracts, information reported by and discussions with counterparties, and the Company’sestimate of losses related to those contracts and are subject to change as more information is reported andbecomes available. Such information is frequently reported more slowly, and with less initial accuracy, withrespect to non-U.S. events such as Kyrill and the U.K. floods than with large U.S. catastrophe losses. Inaddition, the sub-prime related casualty net claims and claim expenses are based on underlying liabilitycontracts which are considered “long-tail” business, and will therefore take many years before the actuallosses are known and reported, which increases the uncertainty with respect to the estimate for ultimatelosses for this event. The net claims and claim expenses from Kyrill, the U.K. floods and sub-prime relatedcasualty losses are all attributable to the Company’s Reinsurance segment.
During 2005, we incurred significant losses from hurricanes Katrina, Rita and Wilma. Our estimates of theselosses are based on factors including currently available information derived from claims information fromour clients and brokers, industry assessments of losses from the events, proprietary models and the termsand conditions of our contracts. In particular, due to the size and unusual complexity of certain legal and
23

claims issues, particularly but not exclusively relating to hurricane Katrina, meaningful uncertainty remainsregarding total covered losses for the insurance industry and, accordingly, our loss estimates. Our actuallosses from these events will likely vary, perhaps materially, from our current estimates due to the inherentuncertainties in reserving for such losses, the potential inaccuracies and inadequacies in the data providedby clients and brokers, the inherent uncertainty of modeling techniques and the application of suchtechniques, and complex coverage and other legal issues.
Because of the inherent uncertainties discussed above, we have developed a reserving philosophy whichattempts to incorporate prudent assumptions and estimates, and we have generally experienced favorabledevelopment on prior year reserves in the last several years. However, there is no assurance that this willoccur in future periods.
Our reserving techniques, assumptions and processes differ between our Reinsurance and Individual Risksegments, as well as between our property catastrophe reinsurance and specialty reinsurance businesseswithin our Reinsurance segment. Refer to our “Claims and Claim Expense Reserves Critical AccountingEstimates” discussion in “Item 7. Management’s Discussion and Analysis of Financial Condition andResults of Operations” for more information on the risks we insure and reinsure, the reserving techniques,assumptions and processes we follow to estimate our claims and claim expense reserves, and our currentestimates versus our initial estimates of our claims reserves, for each of these units.
The following table represents the development of our GAAP balance sheet reserves for December 31,1998 through December 31, 2008. This table does not present accident or policy year development data.The top line of the table shows the gross reserves for claims and claim expenses at the balance sheet datefor each of the indicated years. This represents the estimated amounts of claims and claim expensesarising in the current year and all prior years that are unpaid at the balance sheet date, including additionalcase reserves and IBNR reserves. The table also shows the re-estimated amount of the previously recordedreserves based on experience as of the end of each succeeding year. The estimate changes as moreinformation becomes known about the frequency and severity of claims for individual years. The“cumulative redundancy (deficiency) on net reserves” represents the aggregate change to date from theindicated estimate of the gross reserve for claims and claim expenses, net of losses recoverable on thesecond line of the table. The table also shows the cumulative net paid amounts as of successive years withrespect to the net reserve liability. At the bottom of the table is a reconciliation of the gross reserve forclaims and claim expenses to the net reserve for claims and claim expenses, the gross re-estimated liabilityto the net re-estimated liability for claims and claim expenses, and the cumulative redundancy (deficiency)on gross reserves.
24

With respect to the information in the table below, it should be noted that each amount includes the effectsof all changes in amounts for prior periods, including the effect of foreign exchange rates.
Year ended December 31, 1998 1999 2000 2001 2002 2003 2004 2005 2006 2007 2008(in millions)
Gross reserve for claims andclaim expenses $298.8 $478.6 $403.6 $572.9 $804.8 $977.9 $1,459.4 $2,614.6 $2,098.2 $2,028.5 $2,160.6
Reserve for claims and claimexpenses, net of lossesrecoverable $197.5 $174.9 $237.0 $355.3 $605.3 $828.7 $1,241.6 $1,941.4 $1,796.3 $1,845.2 $1,861.1
1 Year Later 149.5 196.8 221.0 378.3 511.6 688.4 1,000.2 1,804.8 1,563.2 1,610.4 —2 Years Later 149.9 168.4 168.4 344.7 470.5 403.5 963.6 1,633.5 1,403.5 — —3 Years Later 141.3 121.7 138.6 308.0 294.4 384.6 869.8 1,493.0 — — —4 Years Later 118.6 111.1 107.7 214.1 282.1 357.5 819.1 — — — —5 Years Later 117.8 81.9 54.4 209.2 269.7 332.6 — — — — —6 Years Later 111.4 38.7 52.3 199.3 243.8 — — — — — —7 Years Later 99.0 36.8 45.8 182.7 — — — — — — —8 Years Later 97.1 30.8 46.9 — — — — — — — —9 Years Later 98.1 32.2 — — — — — — — — —10 Years Later 100.8 — — — — — — — — — —
Cumulative redundancy(deficiency) on netreserves $ 96.7 $142.7 $190.1 $172.6 $361.5 $496.1 $ 422.5 $ 448.4 $ 392.8 $ 234.8 $ —
Cumulative Net Paid Losses1 Year Later $ 54.8 $ 24.6 $ 11.1 $ 88.1 $ 81.9 $ 64.1 $ 338.9 $ 452.0 $ 304.5 $ 397.8 $ —2 Years Later 80.1 16.0 0.3 152.0 90.2 119.1 437.2 684.0 532.0 — —3 Years Later 69.6 1.2 3.2 111.6 122.6 134.0 488.3 873.8 — — —4 Years Later 69.1 2.7 (7.9) 128.0 101.6 129.7 541.1 — — — —5 Years Later 69.5 (9.0) (0.6) 107.0 96.6 164.7 — — — — —6 Years Later 72.5 3.3 2.6 111.7 114.0 — — — — — —7 Years Later 78.4 4.7 9.0 123.3 — — — — — — —8 Years Later 78.5 6.3 15.1 — — — — — — — —9 Years Later 78.5 12.5 — — — — — — — — —10 Years Later 81.5 — — — — — — — — — —
Gross reserve for claims andclaim expenses $298.8 $478.6 $403.6 $572.9 $804.8 $977.9 $1,459.4 $2,614.6 $2,098.2 $2,028.5 $2,160.6
Reinsurance recoverable onunpaid losses 101.3 303.7 166.6 217.6 199.5 149.2 217.8 673.2 301.9 183.3 299.5
Net reserve for claims andclaim expenses $197.5 $174.9 $237.0 $355.3 $605.3 $828.7 $1,241.6 $1,941.4 $1,796.3 $1,845.2 $1,861.1
Gross liability re-estimated $287.0 $379.0 $230.5 $362.0 $411.4 $476.4 $1,041.5 $2,134.8 $1,661.8 $1,757.0 $ —Reinsurance recoverable on
unpaid losses re-estimated 186.2 346.8 183.6 179.3 167.6 143.8 222.4 641.8 258.3 146.6 —
Net liability re-estimated $100.8 $ 32.2 $ 46.9 $182.7 $243.8 $332.6 $ 819.1 $1,493.0 $1,403.5 $1,610.4 $ —
Cumulative redundancy(deficiency) on grossreserves $ 11.8 $ 99.6 $173.1 $210.9 $393.4 $501.5 $ 417.9 $ 479.8 $ 436.4 $ 271.5 $ —
25

The following table presents an analysis of our paid, unpaid and incurred losses and loss expenses and areconciliation of beginning and ending reserves for claims and claim expenses for the years indicated:
Year ended December 31, 2008 2007 2006(in thousands)
Net reserves as of January 1 $1,845,221 $1,796,301 $1,941,361Net incurred related to:
Current year 995,316 712,424 582,788Prior years (234,827) (233,150) (136,558)
Total net incurred 760,489 479,274 446,230
Net paid related to:Current year 346,845 125,816 139,268Prior years 397,787 304,538 452,022
Total net paid 744,632 430,354 591,290
Total net reserves as of December 31 1,861,078 1,845,221 1,796,301Losses recoverable as of December 31 299,534 183,275 301,854
Total gross reserves as of December 31 $2,160,612 $2,028,496 $2,098,155
For the year ended December 31, 2008, the prior year favorable development of $234.8 million included$188.1 million attributable to our Reinsurance segment and $46.7 million attributable to our Individual Risksegment. Within our Reinsurance segment, the catastrophe reinsurance unit experienced $131.6 million offavorable development on prior years’ estimated ultimate claim reserves, principally as a result of acomprehensive review of our expected ultimate net losses associated with the 2005 hurricanes, Katrina,Rita and Wilma. Our specialty reinsurance unit, within the Reinsurance segment, and our Individual Risksegment experienced $56.5 million and $46.7 million, respectively, of favorable development in 2008. Thefavorable development within our specialty reinsurance unit and Individual Risk segment was principallydriven by the application of our formulaic actuarial reserving methodology for these books of business withthe reductions being due to actual paid and reported loss activity being more favorable to date than whatwas originally anticipated when setting the initial IBNR reserves.
For the year ended December 31, 2007, the prior year favorable development of $233.2 million included$194.4 million attributable to our Reinsurance segment and $38.8 million attributable to our Individual Risksegment. Within our Reinsurance segment, the catastrophe reinsurance unit experienced $93.1 million offavorable development on prior years’ estimated ultimate claim reserves, principally as a result of areduction of the ultimate losses for the 2006 and 2005 accident years as reported claims have been, todate, less than expected. Included in the 2005 accident year is a $19.2 million reduction in net claims andclaim expenses associated with hurricanes Katrina, Rita and Wilma. Our specialty reinsurance unitexperienced $101.3 million of favorable development in 2007. The favorable development within ourspecialty reinsurance unit and Individual Risk segment was principally driven by the application of ourformulaic actuarial reserving methodology for these books of business with the reductions being due toactual paid and reported loss activity being more favorable to date than what was originally anticipatedwhen setting the initial IBNR reserves.
For the year ended December 31, 2006, the prior year favorable development of $136.6 million included$125.2 million attributable to our Reinsurance segment and $11.3 million attributable to our Individual Risksegment. The reduction in prior years’ estimated ultimate claims reserves in our Reinsurance segment wasprimarily due to lower than expected claims emergence within our specialty reinsurance unit. Our specialtyreinsurance unit experienced $139.2 million of favorable development in 2006 while our catastrophereinsurance unit experienced $13.9 million of adverse development. The reductions in our reserves for ourspecialty reinsurance unit and Individual Risk segment were principally driven by the application of ourformulaic reserving methodology used for these books of business with the reductions being due to actualpaid and reported loss activity being better than what was anticipated when setting the initial IBNRreserves. In addition, within our specialty reinsurance unit, $46.0 million of the favorable development was
26

driven by a reduction in carried reserves due to commutations. The adverse development in ourcatastrophe reinsurance unit was principally driven by an increase in our ultimate losses for a U.K.industrial property loss. This loss occurred at the end of 2005 and both the estimate of insured industrylosses for this event and our estimate of our client’s losses from this event increased in 2006.
Net claims and claim expenses incurred were reduced by $1.9 million during 2008 (2007 – $3.3 million,2006 – $5.5 million) related to income earned on assumed reinsurance contracts that were classified asdeposit contracts with underwriting risk only. Other income was reduced by $1.9 million during 2008 (2007– $1.4 million, 2006 – $1.0 million) related to premiums and losses incurred on assumed reinsurancecontracts that were classified as deposit contracts with timing risk only. Aggregate deposit liabilities of $73.6million are included in reinsurance balances payable at December 31, 2008 (2007 – $84.1 million) andaggregate deposit assets of $nil are included in other assets at December 31, 2008 (2007 – $nil) associatedwith these contracts.
INVESTMENTS
Our investment guidelines stress preservation of capital, market liquidity, and diversification of risk. Thelarge majority of our investments consist of highly rated fixed income securities. We also hold a significantamount of short term investments. Short term investments are managed as part of our investment portfolioand have a maturity of one year or less when purchased. In addition, we have an allocation to otherinvestments, including hedge funds, private equity partnerships, bank loan funds and other investments.Our investments are subject to market-wide risks and fluctuations, as well as to risks inherent in particularsecurities.
The table below summarizes our portfolio of invested assets:
At December 31, 2008 2007(in thousands, except percentages)
U.S. treasuries $ 467,480 7.8% $ 767,785 11.5%Agencies 448,521 7.4 290,194 4.4Non-U.S. government 57,058 0.9 66,496 1.0Corporate 747,210 12.4 937,289 14.1Mortgage-backed 1,110,594 18.4 1,251,582 18.9Asset-backed 166,022 2.7 601,017 9.1
Fixed maturity investments available for sale, at fairvalue 2,996,885 49.6 3,914,363 59.0
Short term investments, at fair value 2,172,343 36.0 1,821,549 27.4Other investments, at fair value 773,475 12.8 807,864 12.2
Total managed investment portfolio 5,942,703 98.4 6,543,776 98.6Investments in other ventures, under equity method 99,879 1.6 90,572 1.4
Total investments $6,042,582 100.0% $6,634,348 100.0%
For additional information regarding the investment portfolio, refer to “Item 7. Management’s Discussionand Analysis of Financial Condition and Results of Operations – Summary of Results of Operations for 2008,2007 and 2006 – Investments”.
Impact of Recent Economic and Market Conditions
Global financial markets experienced significant stress commencing in the third and fourth quarters of2007. This continued through most of 2008, accelerated in the fourth quarter of 2008 and has continuedinto 2009. Initially driven in the third and fourth quarters of 2007 by challenging conditions in marketsrelated to U.S. sub-prime mortgages (including CDOs based on sub-prime collateral), and in the markets for
27

loans and bonds related to leveraged finance transactions (collectively referred to as “sub-prime”),additional dislocations developed further during 2008 and impacted the global credit and capital relatedmarkets, including, but not limited to:
• a significant diminishment in the liquidity of credit markets, resulting in significantly decreasedavailability for many companies to sources of liquidity such as the commercial paper market, theasset securitization market and commercial and corporate lending by banks;
• the failure of financial institutions, most notably, Lehman Brothers Holdings Inc. (“LehmanBrothers”), and government interventions in others such as the Federal National MortgageAssociation (“Fannie Mae”), the Federal Home Loan Mortgage Corporation (“Freddie Mac”) andAIG;
• the Bernard L. Madoff Investment Securities LLC (“Madoff”) matter; and
• the continuing decline in securities markets, depressed asset values and deteriorated economicstrength of many companies and industries.
The resulting adverse market environment has been characterized by significant credit spread widening,prolonged illiquidity, reduced price transparency and increased volatility. As conditions in these marketsdeteriorated, other areas such as the asset-backed commercial paper market also experienced decreasedliquidity and the equity markets experienced short-term weakness and increased volatility. In response andin an effort to stabilize market conditions generally, the Federal Reserve and other central banks injectedsignificant liquidity into the markets and lowered benchmark interest rates. On October 3, 2008, then-President Bush signed into law the Emergency Economic Stabilization Act of 2008 (the “EESA”), giving theU.S. Treasury the authority to, among other things, purchase up to $700 billion of mortgage-backed andother securities from financial institutions for the purpose of stabilizing the financial markets. Subsequently,on February 17, 2009, President Obama signed into law the American Recovery and Reinvestment Act of2009 (the “ARRA”), a $787 billion stimulus bill for the purpose of stabilizing the economy by, among otherthings, creating jobs.
It is possible that the continued deterioration in the credit and capital markets noted above will continue tosignificantly adversely impact the overall economy, which could directly or indirectly give rise to adverseimpacts on us, potentially including impacts we cannot currently reasonably foresee. In addition, there canbe no assurance that any of the governmental or private sector initiatives designed to address such creditdeterioration in the markets will be implemented, or that if implemented would be successful.
We believe that the Company is currently principally exposed to credit and capital market dislocations notedabove, through its investment portfolio and underwriting portfolio, and through its investments in venturesaccounted for under the equity method. Following is a summary of our current estimates relating to theseexposures.
Investments. At December 31, 2008, the Company had $nil positions in fixed income securities backed bysub-prime loan collateral within its portfolio of fixed maturity investments available for sale and short terminvestments. The Company’s investment guidelines and/or standing orders prohibit our fixed incomeinvestment managers from investing in securities supported by sub-prime collateral. In addition, our guidelinesrequire that all securitized assets in our portfolio of fixed maturity investments available for sale be AAA ratedand prohibit investments in CDOs, collateralized loan obligations (“CLOs”) and home equity loans as well asfixed income investments where the credit rating is backed by a financial guaranty company.
At December 31, 2008, we had $258.9 million in private equity investments and $105.8 million in hedgefund investments. Our private equity and hedge funds investments are generally managed by diversifiedmanagers who we currently do not believe are over-exposed to any one sector. Within our private equityportfolio, we may have exposure to sub-prime through underlying portfolio investments, such as financialinstitutions, which have been impacted by sub-prime. Our hedge fund managers independently direct andcontrol the underlying investments and positions of such funds, and it is possible that through these fundswe have more indirect exposure to sub-prime developments than we have currently estimated, or that suchexposure may increase in future periods. Overall, we estimate that our exposure to sub-prime in ourportfolio of hedge funds and private equity investments is minimal as of December 31, 2008.
28

While our current positions in sub-prime within our portfolio of fixed maturity investments available for saleis $nil, and we believe our exposure within our hedge fund and private equity portfolio is limited, we mayamend our investment guidelines in future periods and may elect to assume exposure to these or othermore risky asset classes if we believe the potential return sufficiently compensate us for the risk beingassumed, and our overall capital and liquidity position supports such actions.
During the year ended December 31, 2008, the Company recorded $217.0 million (2007 – $25.5 million,2006 – $46.4 million) in other than temporary impairment charges including credit-related impairmentcharges of $8.3 million (2007 – $nil, 2006 – $0.1 million). The significant increase in other than temporaryimpairment charges is primarily the result of widening credit spreads during 2008 due to the turmoil in thecredit and capital markets noted above. The credit-related other than temporary impairment charges during2008 of $8.3 million include impairments for which the Company believes it will not be able to recover thefull principal amount if the impaired security is held to maturity, and were principally driven by theCompany’s direct holdings of fixed maturity securities issued by Lehman Brothers. As of December 31,2008, the Company had essentially no fixed maturity investments available for sale in an unrealized lossposition.
Underwriting Portfolio. The Company’s reinsurance portfolio is exposed to risks relating to claims againstfinancial institutions and other organizations involved in the underwriting, soliciting, documentation,collateralization, brokering, marketing, rating or purchase of, among other things, sub-prime mortgages(including through derivative instruments). We believe that the ongoing market turmoil in the U.S., originallymanifested in perceived potential losses arising out of sub-prime exposures, will likely have an effect onother lines in the insurance industry, such as directors & officers (“D&O”), errors & omissions (“E&O”) andother professional lines coverage. Shareholder actions have been filed in the marketplace relating to, amongother things, omitting disclosure of investment exposure to failing institutions such as Lehman Brothers;breach of fiduciary duties of care in hastily agreeing to the acquisitions of The Bear Stearns Companies Inc.(“Bear Stearns”), Merrill Lynch & Co. Inc. and Wachovia Corporation; and allegedly grossly imprudent risktaking in the subprime lending market by AIG. In addition, several entities, including Fannie Mae, FreddieMac, Lehman Brothers, AIG, Countrywide Financial Corporation, UBS AG, Bear Stearns and others are thesubject of one or more investigations by the SEC, the Federal Bureau of Investigations and/or various otherregulatory bodies or enforcement agencies. Moreover, in the fourth quarter of 2008, it was purported thatMadoff was a part of the largest ponzi scheme in history. We expect there to be further actions with varyingtheories of liability in the foreseeable future. It appears that a large number of professional service firmscould be affected across the lines noted above. Our casualty clash book of business, within the specialtyunit of our Reinsurance segment, has, or could have, exposure under various purported theories of liability,particularly arising from the D&O and E&O market. Our estimate of these losses at December 31, 2008 is$77.5 million, an increase of $17.5 million from our December 31, 2007 estimate, with the majority of theincrease relating to potential exposures arising out of the Madoff matter which was discovered in the fourthquarter of 2008. These losses are included in our Reinsurance segment results. In addition, our specialtyunit has exposure to risks relating to the decrease in home demand through our surety book of business,which could lead to delays and defaults in projects, and could cause additional losses, although wecurrently believe we have no sub-prime related losses in our surety book of business.
Investments in other ventures under equity method. During 2007, ChannelRe suffered a significant netloss which reduced ChannelRe’s GAAP shareholders’ equity below $nil. The net loss was driven byunrealized mark-to-market losses related to financial guaranty contracts accounted for as derivatives underGAAP. As a result, the Company reduced its carried value in ChannelRe to $nil which negatively impactedour net income by $151.8 million in 2007. As a result of reducing our carried value in ChannelRe to $nil,combined with the fact that we have no further contractual obligations to provide capital or other support toChannelRe, we believe we currently have no further negative economic exposure to ChannelRe. SinceChannelRe remained in a negative shareholders’ equity position during 2008, our investment in ChannelRecontinues to be carried at $nil. It is possible that with the adoption of FASB Statement No. 157, Fair ValueMeasurements (“FAS 157”) by ChannelRe in 2008, that in future periods the nonperformance risk or owncredit risk portion of ChannelRe’s mark-to-market on its financial guaranty contracts accounted for asderivatives under GAAP may increase, or that the underlying mark-to-market on ChannelRe’s financialguaranty contracts accounted for as derivatives under GAAP may decrease, or both, which could result in
29

ChannelRe returning to a positive equity position, at which time we would then record our share ofChannelRe’s net income, subject to impairment, or our share of ChannelRe’s net loss.
During the fourth quarter of 2007, we invested $25.5 million in the preferred equity of Aladdin CreditProducts Ltd. (“Aladdin”). Aladdin was established to provide credit protection on fixed income securities inreturn for a premium. Due to adverse market conditions, Aladdin elected to not write any business andsubsequently announced during the fourth quarter of 2008 that it would wind-up its operations and returnthe residual capital to shareholders. The Company expects to receive the majority of its original investment,less certain administrative expenses incurred. At December 31, 2008, the Company recorded a receivableof $24.4 million in other assets for the expected liquidation value of Aladdin. During January 2009, theCompany received an initial payout of $24.2 million with the final distribution expected to be receivedduring the second quarter of 2009.
MARKETING
Reinsurance
We believe that our modeling and technical expertise, the risk management advice that we provide to ourclients, and our reputation for paying claims promptly has enabled us to become a provider of first choice inmany lines of business to our customers worldwide. We market our Reinsurance products worldwideexclusively through reinsurance brokers and we focus our marketing efforts on targeted brokers. We believethat our existing portfolio of business is a valuable asset and, therefore, we attempt to continually strengthenrelationships with our existing brokers and clients. We target prospects that are capable of supplyingdetailed and accurate underwriting data and that potentially add further diversification to our book ofbusiness.
We believe that primary insurers’ and brokers’ willingness to use a particular reinsurer is based not just onpricing, but also on the financial security of the reinsurer, its claim paying ability ratings and demonstratedwillingness to promptly pay valid claims, the quality of a reinsurer’s service, the reinsurer’s willingness andability to design customized programs, its long-term stability and its commitment to provide reinsurancecapacity. We believe we have established a reputation with our brokers and clients for prompt response onunderwriting submissions, fast claims payments and a reputation for providing creative solutions to ourcustomers’ needs. Since we selectively write large lines on a limited number of property catastrophereinsurance contracts, we can establish reinsurance terms and conditions on those contracts that areattractive in our judgment, make large commitments to the most attractive programs and provide superiorclient responsiveness. We believe that our willingness and ability to design customized programs and toprovide advice on catastrophe risk management has helped us to develop long-term relationships withbrokers and clients.
30

Our reinsurance brokers assess client needs and perform data collection, contract preparation and otheradministrative tasks, enabling us to market our reinsurance products cost effectively by maintaining asmaller staff. We believe that by maintaining close relationships with brokers, we are able to obtain accessto a broad range of potential reinsureds. In recent years, our distribution has become increasingly reliant ona small number of such relationships, a trend which we believe has been accelerated by the merger of AONand Benfield. We expect this concentration to continue and perhaps increase. The following table shows thepercentage of our Reinsurance segment gross premiums written generated through our largest brokers forthe years ended December 31, 2008, 2007 and 2006:
Year ended December 31, 2008 2007 2006
Percentage of gross premiums writtenBenfield Group Limited (1) 48.3% 50.0% 40.6%AON Corporation (1) 13.2 10.4 9.8
Total Benfield Group Limited and AON Corporation (1) 61.5 60.4 50.4Marsh Inc. 18.2 19.6 25.4Willis Group 8.9 11.8 14.3
Total of largest brokers 88.6 91.8 90.1All others 11.4 8.2 9.9
Total percentage of gross premiums written 100.0% 100.0% 100.0%
(1) On November 11, 2008, AON Corporation completed its acquisition of Benfield Group Limited. Thetable above shows the gross premiums written brokered by these entities on a stand alone andconsolidated basis.
During 2008, our Reinsurance segment issued authorization for coverage on programs submitted by 40brokers worldwide (2007 – 39 brokers). We received approximately 2,791 program submissions during2008 (2007 – approximately 2,483). Of these submissions, we issued authorizations for coverage forapproximately 828 programs, or approximately 30% of the program submissions received (2007 –approximately 790 programs, or approximately 32%).
Individual Risk
Our Individual Risk business is produced primarily through four distribution channels as per the tablebelow:
Year ended December 31, 2008 2007 2006
Individual Risk gross premiums writtenProgram manager – wholly owned (1) 46.4% 32.1% 18.9%Program managers – third party 36.9 42.4 44.3Quota share reinsurance 16.6 25.1 34.5Broker-produced business 0.1 0.4 2.3
Total Individual Risk gross premiums written 100.0% 100.0% 100.0%
(1) Program manager – wholly owned represents Agro National which we acquired in an asset purchase onJune 2, 2008. The table above is presented as if Agro National has been a wholly-owned subsidiarysince the first period presented.
The business produced through third party program managers, quota share reinsurance and broker-produced business principally comes to us through intermediaries. Our financial security ratings, combinedwith our reputation in the reinsurance marketplace, including the long-standing relationships we havedeveloped with our reinsurance intermediaries, have enhanced our presence in our Individual Riskmarkets.
With respect to our program business, we believe that our strategy of establishing strong relationships andassisting our partners with modeling, risk analysis and other expertise has helped us to develop a favorable
31
reputation in this market. We believe that our existing third party program managers are an importantsource of referrals and endorsements of our approach to this business. In addition, we acquired the netassets of Agro National, LLC in June 2008, a managing general underwriter of multi-peril crop insurance,which is now a wholly owned program manager presenting additional opportunities in our Individual Riskmarkets.
Our broker-produced business is principally written on an excess and surplus lines basis by Glencoe andLantana on a risk-by-risk basis. This business is generally submitted to us through licensed surplus linesbrokers who are generally responsible for regulatory compliance, premium tax collection and certain othermatters associated with policy placement.
New Business
For information related to New Business, refer to “Item 7. Management’s Discussion and Analysis ofFinancial Condition and Results of Operations – Overview”.
EMPLOYEES
At February 11, 2009, we and our subsidiaries employed approximately 400 people worldwide (February12, 2008 – 236 people, February 12, 2007 – 218 people). We believe our strong employee relations areamong our most significant strengths. None of our employees are subject to collective bargainingagreements. We are not aware of any current efforts to implement such agreements at any of oursubsidiaries. Historically, the Company has looked for opportunities to strengthen its operations duringperiods of softening markets in preparation for improving market conditions.
As noted above, the Company added approximately 164 employees year over year, primarily driven by itsasset acquisitions of Agro National, LLC and CMS. In addition, the Company added resources in, amongothers, its accounting and legal functions, as well as certain of its current and expected future businessunits. We believe that our employee headcount is likely to continue to increase over time as the Companyexpands geographically, and seeks to enter new lines of business. We expect that our employee growth inthe U.S. and other highly regulated markets will increase our operating and compliance complexity andexpenses, although we do not expect these increases to be material to the Company as a whole.
INFORMATION TECHNOLOGY
Our information technology infrastructure is important to our business. Our information technology platform,supported by a team of professionals, is currently principally located in our corporate headquarters andprincipal corporate offices in Bermuda. Additional information technology assets are maintained at theoffice locations of our operating subsidiaries. We have implemented backup procedures that seek to ensurethat our key business systems and data are backed up, generally on a daily basis, and can be restoredpromptly if and as needed. In addition, we generally store backup information at off-site locations, in orderto seek to minimize our risk of loss of key data in the event of a disaster.
We have implemented and periodically test our disaster recovery plans with respect to our informationtechnology infrastructure. Among other things, our recovery plans involve arrangements with off-site, securedata centers in alternative locations. We believe we will be able to access our systems from these facilities inthe event that our primary systems are unavailable due to a scenario such as a natural disaster.
REGULATION
U.S. Regulation
Reinsurance Regulation. Our Bermuda-domiciled insurance operations and joint ventures principallyconsist of Renaissance Reinsurance, DaVinci, Glencoe and Lantana. Renaissance Reinsurance, DaVinciand Top Layer Re are Bermuda-based companies that operate as reinsurers. Although none of thesecompanies is admitted to transact the business of insurance in any jurisdiction except Bermuda, theinsurance laws of each state of the U.S. regulate the sale of reinsurance to ceding insurers authorized in thestate by non-admitted alien reinsurers, such as Renaissance Reinsurance or DaVinci, acting from locationsoutside the state. Rates, contract terms and conditions of reinsurance agreements generally are not subject
32

to regulation by any governmental authority. A primary insurer ordinarily will enter into a reinsuranceagreement, however, only if it can obtain credit for the reinsurance ceded on its statutory financialstatements. In general, regulators permit ceding insurers to take credit for reinsurance under the followingcircumstances if the contract contains certain minimum provisions: if the reinsurer is licensed oraccredited, if the reinsurer is domiciled in a state with substantially similar regulatory requirements as theprimary insurer’s domiciliary jurisdiction and meets certain financial requirements, or if the reinsuranceobligations are collateralized appropriately.
As alien companies, our Bermuda subsidiaries collateralize their reinsurance obligations to U.S. insurancecompanies. With some exceptions, the sale of insurance or reinsurance within a jurisdiction where theinsurer is not admitted to do business is prohibited. Neither Renaissance Reinsurance nor DaVinci intendsto maintain an office or to solicit, advertise, settle claims or conduct other insurance activities in anyjurisdiction, other than Bermuda, where the conduct of such activities would require that each company beso admitted.
The National Association of Insurance Commissioners (“NAIC”) adopted a framework to modernize thecurrent U.S. reinsurance regulatory framework, with implementation details to follow. The frameworkcontemplates the creation of the NAIC Reinsurance Supervision Review Department (“RSRD”) to analyzeforeign regulatory regimes for functional equivalence with U.S. jurisdictions and a “port of entry”certification process to allow a non-U.S. reinsurer from an RSRD approved jurisdiction to enter the U.S.reinsurance market through a single state. The framework contemplates credit for reinsurance collaterallevels from 0% to 100% based on the ratings assigned to reinsurers. Accordingly, the framework may leadto a reduction of the collateral requirements for non-U.S. reinsurers, which could be beneficial to ourBermuda subsidiaries. Certain individual states have moved forward with initiatives for similar revisedcollateral requirements as well. At this time, we are unable to determine how such changes in the U.S.reinsurance regulatory framework will be implemented and the effect, if any, such changes would have onour operations or financial condition.
Excess and Surplus Lines Regulation. Glencoe and Lantana, domiciled in Bermuda, are not licensed inthe U.S. but are eligible to offer coverage in the U.S. exclusively in the surplus lines market. Glencoe andLantana are eligible to write surplus lines primary insurance in 51 and 49 jurisdictions of the U.S.,respectively, and each is subject to the surplus lines regulation and reporting requirements of thejurisdictions in which it is eligible to write surplus lines primary insurance. In accordance with certainprovisions of the NAIC Nonadmitted Insurance Model Act, which provisions have been adopted by anumber of states, Glencoe and Lantana have each established, and are required to maintain, a trust fundedto a minimum amount as a condition of its status as an eligible, non-admitted insurer in the U.S. Althoughsurplus lines business is generally less regulated than the admitted market, strict regulations apply tosurplus lines placements under the laws of every state, and the regulation of surplus lines insurance mayundergo changes in the future. Federal and/or state measures may be introduced and promulgated thatwould result in increased oversight and regulation of surplus lines insurance. Additionally, some recent andpending cases in Florida and California courts have raised potentially significant questions regarding surpluslines insurance in those states such as whether surplus lines insurers will be subject to policy form content,filing and approval requirements or additional taxes. These cases also could foreshadow more extensiveoversight of surplus lines insurance by other jurisdictions. Any increase in our regulatory burden mayimpact our operations and ultimately could impact our financial condition as well.
Admitted Market Regulation. Our admitted U.S. insurance company operations currently consist ofStonington and Stonington Lloyds, both Texas domiciled insurers. Stonington is licensed to write primaryinsurance in 50 states and the District of Columbia. Stonington Lloyds is a Texas Lloyds’ company licensedto write primary insurance in Texas. Stonington acts as an attorney-in-fact for Stonington Lloyds. Aslicensed insurers operating in the “admitted” market, these companies are subject to extensive regulation.The extent of regulation varies from state to state but generally has its source in statutes that delegateregulatory, supervisory and administrative authority to a department of insurance in each state. Amongother things, state insurance statutes require insurance companies to file financial statements, conductperiodic examinations of the affairs of insurance companies and regulate insurer solvency standards,insurer licensing, authorized investments, premium rates, restrictions on the size of risks that may beinsured under a single policy, loss and expense reserves and provisions for unearned premiums, deposits of
33

securities for the benefit of policyholders, policy form approval, policy renewals and non-renewals, andmarket conduct regulation including both underwriting and claims practices.
Licensed U.S. insurers are required to participate in various state residual market mechanisms whose goalis to provide affordability and availability of insurance to those consumers who may not otherwise be able toobtain insurance. The mechanics of how each state’s residual markets operate may differ, but generally,risks are either assigned to various private carriers or the state manages the risk through a poolingarrangement. If losses exceed the funds the pool has available to pay those losses, the pools have the abilityto assess insurers to provide additional funds to the pool. The amounts of the assessment for eachcompany are normally based upon the proportion of each insurer’s (and in some cases the insurer’s and itsaffiliates’) written premium for coverages similar to those provided by the pool, and are frequentlyuncapped. State guaranty associations also have the ability to assess licensed U.S. insurers in order toprovide funds for payment of losses for insurers which have become insolvent. In many cases, but not all,assessed insurers may recoup the amount of these guaranty fund and state pool assessments bysurcharging future policyholders.
Holding Company Regulation. We and our U.S. insurance company subsidiaries are subject to regulationunder the insurance holding company laws of various jurisdictions. The insurance holding company lawsand regulations vary from jurisdiction to jurisdiction, but generally require an insurance holding company,and insurers that are subsidiaries of insurance holding companies, to register with state regulatoryauthorities and to file with those authorities certain reports, including information concerning their capitalstructure, ownership, financial condition, certain intercompany transactions and general businessoperations. In addition, under the terms of applicable state statutes, any person or entity obtainingbeneficial ownership of 10% (with certain limited exceptions) or more of our outstanding voting securities isrequired to apply for and receive prior regulatory approval for such acquisition, and our U.S. insurancecompany subsidiaries are required to report ownership changes to their domiciliary regulator. Further, inorder to protect insurance company solvency, state insurance statutes typically place limitations on theamount of dividends or other distributions payable to affiliates by insurance companies.
NAIC Ratios. The NAIC has established 11 financial ratios to assist state insurance departments in theiroversight of the financial condition of licensed U.S. insurance companies operating in their respectivestates. The NAIC’s Insurance Regulatory Information System (“IRIS”) calculates these ratios based oninformation submitted by insurers on an annual basis and shares the information with the applicable stateinsurance departments. Each ratio has an established “usual range” of results and assists state insurancedepartments in executing their statutory mandate to oversee the financial condition of insurancecompanies. A ratio result falling outside the usual range of IRIS ratios is not considered a failing result;rather unusual values are viewed as part of the regulatory early monitoring system. Furthermore, in someyears, it may not be unusual for financially sound companies to have several ratios with results outside theusual ranges. An insurance company may fall out of the usual range for one or more ratios because ofspecific transactions that are in themselves immaterial. Generally, an insurance company will be subject toincreased regulatory scrutiny if it falls outside the usual ranges with respect to four or more of the ratios.
Risk-Based Capital. The NAIC has implemented a risk-based capital (“RBC”) formula and model lawapplicable to all licensed U.S. property/casualty insurance companies. The RBC formula is designed tomeasure the adequacy of an insurer’s statutory surplus in relation to the risks inherent in its business. Suchanalysis permits regulators to identify inadequately capitalized insurers. The RBC formula develops a riskadjusted target level of statutory capital by applying certain factors to insurers’ business risks such as assetrisk, underwriting risk, credit risk and off-balance sheet risk. The target level of statutory surplus varies notonly as a result of the insurer’s size, but also on the risk profile of the insurer’s operations. Insurers thathave less statutory capital than the RBC calculation requires are considered to have inadequate capital andare subject to varying degrees of regulatory action depending upon the level of capital inadequacy. TheRBC formulas have not been designed to differentiate among adequately capitalized companies thatoperate with higher levels of capital. Therefore, it is inappropriate and ineffective to use the formulas to rateor to rank such companies.
Legislative and Regulatory Proposals. Government intervention in the insurance and reinsurance marketsin the U.S. continues to evolve. Although U.S. state regulation is the primary form of regulation of insurance
34
and reinsurance, Congress has considered over the past year various proposals relating to potential surpluslines regulation, reinsurance regulation, the creation of an optional federal charter, the creation of asystemic risk regulator, and tax law changes, including changes to increase the taxation of reinsurancepremiums paid to affiliates with respect to U.S. risks. None of these proposals were adopted by the 110thCongress before it adjourned. Additionally, some members of the U.S. House of Representatives havecalled for the recently appointed Treasury Secretary unilaterally to create an insurance oversight officewithin the Treasury Department or assign a high level Treasury Department appointee with insurance dutiesto provide oversight and expertise at the federal level and provide policymakers with insight into issuesregarding the insurance market as reform is contemplated. Although we are unable to predict what newlaws and regulations will be proposed in the 111th Congress, whether any such proposed laws andregulations will be adopted, or the form in which any such laws and regulations would be adopted, webelieve it is more likely than at times in the past that the current Congress will adopt laws and/or regulationswith respect to insurance, and we anticipate that these developments will impact our operations and alsocould impact our financial condition.
In addition to potential new insurance industry regulation, the Obama administration and Congress are alsoconsidering various regulatory reforms for the financial markets, including potentially as it pertains to the(re)insurance industry. We are unable to predict what reforms will be proposed or adopted or the effect, ifany, that such reforms would have on our operations and financial condition. We are carefully monitoringsuch developments.
In 2007, Florida enacted legislation which enabled the Florida Hurricane Catastrophe Fund to offerincreased amounts of coverage in addition to the mandatory coverage amount, at below-market rates.Further, the legislation expanded the ability of the state-sponsored insurer, Citizens, to compete with privateinsurance companies, such as ours and other companies that cede business to us. This legislation reducedthe role of the private insurance and reinsurance markets in Florida, a key target market of ours. Efforts in2008 to partially reduce this expansion of state participation in the market did not succeed. The propertyinsurance market in Florida remains unstable, with participants, both public and private, continuing toevaluate and seek a variety of possible initiatives. Due to our position as one of the largest providers ofcatastrophe-exposed coverage, both on a global basis, and in respect to the Florida market, recent andfuture legislative and regulatory changes in Florida may have a disproportionate impact on us compared toother market participants.
It is also possible that other states, particularly those with Atlantic or Gulf Coast exposures, may enact newor expanded legislation based on some version of the Florida precedent, which would further diminishaggregate private market demand for our products. Moreover, there were several federal bills proposed inthe 110th Congress which included a federal reinsurance backstop mechanism for catastrophic typenatural disasters which were too large for state catastrophe funds to absorb. We believe these bills, or someversion of them, are likely to be proposed in the 111th Congress. Although we believe such legislation willbe vigorously opposed, if enacted, these bills would likely further erode the role of private marketcatastrophe reinsurers.
The potential for further expansion into additional insurance markets, could expose us or our subsidiaries toincreasing regulatory oversight, including the oversight of countries other than Bermuda and the U.S.However, we intend to continue to conduct our operations so as to minimize the likelihood that RenaissanceReinsurance, DaVinci, Top Layer Re, Glencoe, Lantana, or any of our other Bermudian subsidiaries willbecome subject to direct U.S. regulation. In addition, as discussed above, RIM and RTL are involved incertain commodities trading activities relating to weather, natural gas, heating oil, power, crude oil,agricultural commodities and cross-commodity structures. While RIM’s and RTL’s operations currently arenot subject to significant federal oversight, we are monitoring carefully new or revised legislation orregulation in the United States or otherwise, which could increase the regulatory burden and operatingexpenses of these operations.
Bermuda Regulation
All Bermuda companies must comply with the provisions of the Companies Act 1981. In addition, theInsurance Act 1978 (“Insurance Act”) regulates the business of our Bermuda insurance and managementcompany subsidiaries.
35

As a holding company, RenaissanceRe is not subject to the Insurance Act. However, the Insurance Actregulates the insurance and reinsurance business of our operating insurance companies. The Company’smost significant operating subsidiaries include Renaissance Reinsurance and DaVinci which are registeredas Class 4 insurers and Glencoe, Lantana, and Top Layer Re which are registered as Class 3 insurers. RUMis registered as an insurance manager.
The Insurance Act imposes solvency and liquidity standards as well as auditing and reporting requirements andconfers on the Bermuda Monetary Authority (“BMA”) powers to supervise, investigate and intervene in the affairsof insurance companies. Significant requirements of the Insurance Act include the appointment of anindependent auditor and loss reserve specialist (both of whom must be approved by the BMA), the filing of anannual financial return and provisions relating to the payment of distributions and dividends. In particular:
• An insurer must prepare annual statutory financial statements which must be submitted as part ofits statutory financial return no later than four months after the insurer’s financial year end (unlessspecifically extended). The annual statutory financial statements give detailed information andanalyses regarding premiums, claims, reinsurance, reserves and investments. The statutoryfinancial return includes, among other items, a report of the approved independent auditor on thestatutory financial statements; a declaration of statutory ratios; a solvency certificate; the statutoryfinancial statements themselves; the opinion of the approved loss reserve specialist and, in thecase of Class 4 insurers, details concerning ceded reinsurance. The statutory financial statementsand the statutory financial return do not form part of the public records maintained by the BMA.
• In addition to preparing statutory financial statements, effective December 31, 2008, all Class 4insurers must prepare financial statements in respect of their insurance business in accordancewith generally accepted insurance principles or international financial reporting standards.
• An insurer’s statutory assets must exceed its statutory liabilities by an amount greater than theprescribed minimum solvency margin which varies with the category of its registration and netpremiums written and loss reserves posted (“Minimum Solvency Margin”). The MinimumSolvency Margin that must be maintained by a Class 4 insurer is the greater of (i) $100 million, or(ii) 50% of net premiums written (with a credit for reinsurance ceded not exceeding 25% of grosspremiums) or (iii) 15% of net discounted aggregate loss and loss expense provisions and otherinsurance reserves. The Minimum Solvency Margin for a Class 3 insurer is the greater of (i) $1million, or (ii) 20% of the first $6 million of net premiums written; if in excess of $6 million, thefigure is $1.2 million plus 15% of net premiums written in excess of $6 million, or (iii) 15% of netdiscounted aggregate loss and loss expense provisions and other insurance reserves.
• An insurer engaged in general business is required to maintain the value of its relevant assets atnot less than 75% of the amount of its relevant liabilities (“Minimum Liquidity Ratio”).
• Both Class 3 and Class 4 insurers are prohibited from declaring or paying any dividends if inbreach of the required Minimum Solvency Margin or Minimum Liquidity Ratio (the “RelevantMargins”) or if the declaration or payment of such dividend would cause the insurer to fail to meetthe Relevant Margins. Where an insurer fails to meet its Relevant Margins on the last day of anyfinancial year, it is prohibited from declaring or paying any dividends during the next financial yearwithout the prior approval of the BMA. Further, a Class 4 insurer is prohibited from declaring orpaying in any financial year dividends of more than 25% of its total statutory capital and surplus(as shown on its previous financial year’s statutory balance sheet) unless it files (at least sevendays before payment of such dividends) with the BMA an affidavit stating that it will continue tomeet its Relevant Margins. Class 3 and Class 4 insurers must obtain the BMA’s prior approval fora reduction by 15% or more of the total statutory capital as set forth in its previous year’s financialstatements. These restrictions on declaring or paying dividends and distributions under theInsurance Act are in addition to the solvency requirements under the Companies Act which applyto all Bermuda companies.
• If the BMA believes that an investigation is required in the interests of an insurer’s policyholders orpersons who may become policyholders, it may appoint an inspector who has extensive powers ofinvestigation. If it appears to the BMA to be desirable in the interests of policyholders, the BMA mayalso exercise these powers in relation to holding companies, subsidiaries and other affiliates of insurers.
36

If it appears to the BMA that there is a risk of an insurer becoming insolvent, or that insurer is in breachof the Insurance Act or any conditions of its registration, the BMA may exercise extensive powers ofintervention including directing the insurer not to take on any new insurance business or prohibitingthe company from declaring and paying dividends or other distributions.
• Any person who, directly or indirectly, becomes a holder of at least 10%, 20%, 33% or 50% of thevoting shares of an insurer must notify the BMA of its holdings.
• Where it appears to the BMA that a person who is a controller of any description of a registeredperson is not or is no longer a fit and proper person to be such a controller, it may serve him witha written notice of objection to his being such a controller of the registered person.
• Under the provisions of the Insurance Act, the BMA may, from time to time, conduct “on site”visits at the offices of insurers it regulates.
The Insurance Act was amended in 2008 by the introduction, among other things, of the BermudaSolvency Capital Requirement (the “BSCR”) which is a standard mathematical model designed to give theBMA more advanced methods for determining an insurer’s capital adequacy. Where insurers applyin-house models that deal more effectively with their own particular risks and where such models satisfy thestandards established by the BMA, such insurers may apply to the BMA to use such models in lieu of theBSCR. Underlying the BSCR is the belief that all insurers should operate on an ongoing basis with a view tomaintaining their capital at a prudent level in excess of the Minimum Solvency Margin otherwise prescribedunder the Insurance Act.
Effective December 31, 2008, all Class 4 insurers must maintain their capital at a target level which is set at120% of the minimum amount calculated in accordance with the BSCR or the company’s approvedin-house model (the “Enhanced Capital Requirement” or “ECR”). In circumstances where the BMAconcludes that the company’s risk profile deviates significantly from the assumptions underlying the ECR orthe company’s assessment of its management policies and practices, it may issue an order requiring thatthe company adjust its ECR.
In addition to introducing the BSCR, the legislation referenced above also provided that all Class 3 insurerssubmit a re-classification application to the BMA by December 31, 2008. Under the new classificationcriteria, all Class 3 companies are now classified as a Class 3, a Class 3A (Small Commercial) insurer or aClass 3B (Large Commercial) insurer. Of the Company’s Class 3 insurers, Glencoe, Lantana and Top LayerRe have applied to be re-classified as Class 3A’s.
It is anticipated that a number of the regulatory and supervisory requirements currently applicable to Class4 insurers (including the BSCR discussed above) will ultimately be extended to the new Class 3B’s. Theregulatory regime applicable to the new Class 3A’s and Class 3’s is expected to remain largely unchanged.
AVAILABLE INFORMATION
We maintain a website at http://www.renre.com. The information on our website is not incorporated byreference in this Form 10-K.
We make available, free of charge through our website, our financial information, including the informationcontained in our Annual Reports on Form 10-K, Quarterly Reports on Form 10-Q, Current Reports on Form8-K and amendments to those reports filed or furnished pursuant to Section 13(a) or 15(d) of the ExchangeAct as soon as reasonably practicable after we electronically file such material with, or furnish such materialto, the SEC. We also make available, free of charge from our website, our Audit Committee Charter,Compensation/Governance Committee Charter, Corporate Governance Guidelines and Statement ofPolicies, and Code of Ethics and Conduct (“Code of Ethics”). Such information is also available in print forany shareholder who sends a request to RenaissanceRe Holdings Ltd., Attn: Office of the CorporateSecretary, P.O. Box HM 2527, Hamilton, HMGX, Bermuda. Reports filed with the SEC may also be viewedor obtained at the SEC Public Reference Room at 100 F Street, N.E., Washington, DC 20549. Informationon the operation of the SEC Public Reference Room may be obtained by calling the SEC at1-800-SEC-0330. The SEC maintains an internet site that contains reports, proxy and informationstatements, and other information regarding issuers, including the Company, that file electronically with theSEC. The address of the SEC’s website is http://www.sec.gov.
37
ITEM 1A. RISK FACTORS
Factors that could cause our actual results to differ materially from those in the forward-looking statementscontained in this Form 10-K and other documents we file with the SEC include the following:
RISKS RELATED TO OUR COMPANY
Our exposure to catastrophic events and other exposures that we cover could cause our financial results tovary significantly from one period to the next.
Our largest product based on total gross premiums written is property catastrophe reinsurance. We also selllines of specialty reinsurance and certain Individual Risk products that are exposed to catastrophe risk. Wetherefore have a large overall exposure to natural and man-made disasters, such as earthquakes,hurricanes, tsunamis, winter storms, freezes, floods, fires, tornados, hailstorms, drought and other naturalor man-made disasters, such as acts of terrorism. As a result, our operating results have historically been,and we expect will continue to be, significantly affected by relatively few events of large magnitude.
We expect claims from catastrophic events to cause substantial volatility in our financial results for any fiscalquarter or year; moreover, catastrophic claims could adversely affect our financial condition, results ofoperations and cash flows. Our ability to write new business could also be affected. We believe thatincreases in the value and geographic concentration of insured property, particularly along coastal regions,and the effects of inflation may continue to increase the severity of claims from catastrophic events in thefuture.
From time to time, we expect to have greater exposures in one or more specific geographic areas than ouroverall share of the worldwide market would unilaterally suggest. Accordingly, when and if catastrophesoccur in these areas, we may experience relatively more severe net negative impacts from such events thanour competitors. In particular, the Company has historically had a relatively large percentage of its coverageexposures concentrated in the state of Florida.
We may fail to execute our strategy, which would impair our future financial results.
Historically, our principal product has been property catastrophe reinsurance. As we have expanded andcontinue to expand into other lines of business, we have been and will be presented with new andexpanded challenges and risks which we may not manage successfully. Businesses in early stages ofdevelopment present substantial business, financial and operational risks and may suffer significant losses.For example, our current and potential future expansion may require us to develop new client and customerrelationships, supplement existing or build new operating procedures, hire staff, develop and installmanagement information and other systems, as well as take numerous other steps to implement ourstrategies. If we fail to continue to develop the necessary infrastructure, or otherwise fail to execute ourstrategy, our results from these newer lines of business will likely suffer, perhaps substantially, and ourfuture financial results may be adversely affected.
In addition, our expansion into newer lines of business may place increased demands on our financial,managerial and human resources. For example, we may need to attract additional professionals, and to theextent we are unable to attract such additional professionals, our existing financial, managerial and humanresources may be strained. Our future profitability depends in part on our ability to further develop ourresources and effectively manage expansion, and our inability to do so may impair our future financialresults.
A decline in the ratings assigned to our financial strength may adversely impact our business, perhapsmaterially so.
Third party rating agencies assess and rate the financial strength of reinsurers and insurers, such asRenaissance Reinsurance and certain of our other operating subsidiaries and joint ventures. These ratingsare based upon criteria established by the rating agencies. Periodically, the rating agencies evaluate us andmay downgrade or withdraw their financial strength ratings in the future if we do not continue to meet thecriteria of the ratings previously assigned to us. The financial strength ratings assigned by rating agencies toreinsurance or insurance companies are based upon factors relevant to policyholders and are not directedtoward the protection of investors.
38

These ratings are subject to periodic review and may be revised or revoked, by the agencies which issuethem. In addition, from time to time one or more ratings agencies have effected changes in their capitalmodels and rating methodologies, which have generally served to increase the amounts of capital requiredto support the ratings, and it is possible that legislation arising as a result of the ongoing financial crisis mayresult in additional changes.
Negative ratings actions in the future could have an adverse effect on our ability to fully realize the marketopportunities we currently expect to participate in. In addition, it is increasingly common for our reinsurancecontracts to contain provisions permitting our clients to cancel coverage pro-rata if our relevant operatingsubsidiary is downgraded below a certain rating level. Whether a client would exercise this right woulddepend, among other factors, on the reason for such a downgrade, the extent of the downgrade, theprevailing market conditions and the pricing and availability of replacement reinsurance coverage.Therefore, in the event of a downgrade, it is not possible to predict in advance the extent to which thiscancellation right would be exercised, if at all, or what effect such cancellations would have on our financialcondition or future operations, but such effect potentially could be material. To date, we are not aware thatwe have experienced such a cancellation.
Our ability to compete with other reinsurers and insurers, and our results of operations, could be materiallyadversely affected by any such ratings downgrade. For example, following a ratings downgrade we mightlose clients to more highly rated competitors or retain a lower share of the business of our clients.
For the current ratings of certain of our subsidiaries and joint ventures, refer to “Item 1. Business – Ratings”.
Because we depend on a few insurance and reinsurance brokers in our Reinsurance segment and severalthird party program managers in our Individual Risk segment for a large portion of revenue, loss of businessprovided by them could adversely affect us.
Our Reinsurance business markets insurance and reinsurance products worldwide exclusively throughinsurance and reinsurance brokers. Four brokerage firms accounted for 88.6% of our Reinsurancesegment gross premiums written for the year ended December 31, 2008. Subsidiaries and affiliates of theBenfield, Marsh Inc., AON and the Willis Group accounted for approximately 48.3%, 18.2%, 13.2% and8.9%, respectively, of our Reinsurance segment gross premiums written in 2008. As noted above, in 2008AON acquired Benfield resulting in the combined entity accounting for 61.5% of our Reinsurance segmentgross premiums written in 2008.
Our Individual Risk business markets a significant portion of its insurance and reinsurance productsthrough third party program managers. In recent years, our Individual Risk and reinsurance segments haveexperienced increased concentration of production from a smaller number of intermediaries. Third partyprogram managers accounted for 36.9% of our Individual Risk segment gross premiums written for theyear ended December 31, 2008.
The loss of a substantial portion of the business provided by our brokers and/or third party programmanagers would have a material adverse effect on us. Our ability to market our products could decline as aresult of any loss of the business provided by these brokers and/or third party program managers and it ispossible that our premiums written would decrease.
Our utilization of brokers, third party program managers and other third parties to support our businessexposes us to operational and financial risks.
Our Individual Risk operations rely on third party program managers, and other agents and brokersparticipating in our programs, to produce and service a substantial portion of our operations in thissegment. In these arrangements, we typically grant the program manager the right to bind us to newlyissued and renewal insurance policies, subject to underwriting guidelines we provide and other contractualrestrictions and obligations. Should our third party program managers issue policies that contravene theseguidelines, restrictions or obligations, we could nonetheless be deemed liable for such policies. Although wewould intend to resist claims that exceed or expand on our underwriting intention, it is possible that wewould not prevail in such an action, or that our program manager would be unable to substantiallyindemnify us for their contractual breach. We also rely on our third party program managers, third party
39

administrators or other third parties we retain, to collect premiums and to pay valid claims. We could alsobe exposed to the program manager’s or their producer’s operational risk, for example, but not limited to,contract wording errors, technological and staffing deficiencies and inadequate disaster recovery plans.
We could also be exposed to potential liabilities relating to the claims practices of the third partyadministrators we have retained to manage substantially all of the claims activity that we expect to arise inour Individual Risk operations. Although we have implemented monitoring and other oversight protocols, wecannot assure you that these measures will be sufficient to mitigate all of these exposures.
We are also subject to the risk that our successful third party program managers will not renew theirprograms with us. Although our contracts are generally not for defined terms, generally, either party cancancel the contract in a relatively short period of time. While we believe our arrangements offer numerousbenefits to our program participants, we cannot assure you we will retain the programs that produceprofitable business or that our insureds will renew with us. Failure to retain or replace the third partyprogram managers, or the program manager’s failure to retain or replace their producers, would impair ourability to execute our growth strategy, and our financial results could be adversely affected.
With respect to our Reinsurance operations we do not separately evaluate each of the individual risksassumed under our reinsurance contracts and, accordingly, like other reinsurers, are heavily dependent onthe original underwriting decisions made by our ceding companies. We are therefore subject to the risk thatour clients may not have adequately evaluated the risks to be reinsured, or that the premiums ceded to uswill not adequately compensate us for the risks we assume, perhaps materially so.
Our claims and claim expense reserves are subject to inherent uncertainties.
Our claims and claim expense reserves reflect our estimates using actuarial and statistical projections at agiven point in time of our expectations of the ultimate settlement and administration costs of claimsincurred. Although we use actuarial and computer models as well as historical reinsurance and insuranceindustry loss statistics, we also rely heavily on management’s experience and judgment to assist in theestablishment of appropriate claims and claim expense reserves. However, because of the manyassumptions and estimates involved in establishing reserves, the reserving process is inherently uncertain.Our estimates and judgments are based on numerous factors, and may be revised as additional experienceand other data become available and are reviewed, as new or improved methodologies are developed, asloss trends and claims inflation impact future payments, or as current laws or interpretations thereofchange.
Our specialty reinsurance and Individual Risk operations are expected to produce claims which at timescan only be resolved through lengthy and unpredictable litigation. The measures required to resolve suchclaims, including the adjudication process, present more reserve challenges than property losses (whichtend to be reported comparatively more promptly and to be settled within a relatively shorter period of time).Actual net claims and claim expenses paid may deviate, perhaps substantially, from the reserve estimatesreflected in our financial statements.
We expect that some of our assumptions or estimates will prove to be inaccurate, and that our actual netclaims and claim expenses paid will differ, perhaps substantially, from the reserve estimates reflected in ourfinancial statements. To the extent that our actual claims and claim expenses exceed our expectations, wewould be required to increase claims and claim expense reserves. This would reduce our net income by acorresponding amount in the period in which the deficiency is identified. To the extent that our actualclaims and claim expenses are lower than our expectations, we would be required to decrease claims andclaim expense reserves and this would increase our net income.
Estimates of losses are based on a review of potentially exposed contracts, information reported by anddiscussions with counterparties, and our estimate of losses related to those contracts and are subject tochange as more information is reported and becomes available.
As an example, included in our results for 2008 are $468.0 million of net claims and claim expenses arisingfrom hurricanes Gustav and Ike which struck the United States in the third quarter of 2008. Our estimatesof losses from catastrophic events, such as hurricanes Gustav and Ike, and the 2005 hurricanes Katrina,Rita and Wilma, are based on factors including currently available information derived from the Company’s
40

preliminary claims information from certain clients and brokers, industry assessments of losses from theevents, proprietary models, and the terms and conditions of our contracts. Due to the size and unusualcomplexity of the legal and claims issues relating to these events, particularly hurricanes Katrina and Ike,meaningful uncertainty remains regarding total covered losses for the insurance industry and, accordingly,several of the key assumptions underlying our loss estimates. In addition, actual losses from these eventsmay increase if our reinsurers or other obligors fail to meet their obligations to us. Our actual losses fromthese events will likely vary, perhaps materially, from these current estimates due to the inherentuncertainties in reserving for such losses, including the nature of the available information, the potentialinaccuracies and inadequacies in the data provided by clients and brokers, the inherent uncertainty ofmodeling techniques and the application of such techniques, the effects of any demand surge on claimsactivity and complex coverage and other legal issues.
Unlike the loss reserves of U.S. insurers, the loss reserves of our Bermuda-licensed insurers, includingRenaissance Reinsurance, DaVinci and Glencoe, are not regularly examined by insurance regulators,although, as registered Bermuda insurers, we are required to submit opinions of our approved loss reservespecialist with the annual statutory financial returns of our Bermuda-licensed insurers with regard to theirrespective loss and loss expenses provisions. The loss reserve specialist, who will normally be a qualifiedactuary, must be approved by the BMA.
The emergence of matters which may impact certain of our coverages, such as the asserted trend towardpotentially significant global warming and the ongoing financial crisis, could cause us to underestimate ourexposures and potentially adversely impact our financial results, perhaps significantly.
In our Reinsurance business, we use analytic and modeling capabilities that help us to assess the risk andreturn of each reinsurance contract in relation to our overall portfolio of reinsurance contracts. Forcatastrophe-exposed business in our Individual Risk segment, we also seek to utilize proprietary modelingtools that have been developed in conjunction with the modeling and other resources utilized in ourReinsurance operations. See “Item 1. Business – Underwriting and Enterprise Risk Management.”
In general, our techniques for evaluating catastrophe risk are much better developed than those for otherclasses of risk in businesses that we have entered into recently or may enter into in the future. Our modelsand databases may not accurately address the emergence of a variety of matters which might be deemedto impact certain of our coverages. Accordingly, our models may understate the exposures we are assumingand our financial results may be adversely impacted, perhaps significantly.
We believe, and recent scientific studies have indicated, that climate conditions, primarily globaltemperatures, may be increasing, which may in the future increase the frequency and severity of naturalcatastrophes relative to the historical experience over the past 100 years as well as the losses resultingthere from. We continuously monitor and adjust, as we believe appropriate, our risk management models toreflect our judgment of how to interpret current developments and information, such as these studies.However, it is possible that, even after these adjustments, we have underestimated the frequency orseverity of hurricanes or other catastrophes.
Changing weather patterns and climatic conditions, such as global warming, may have added to theunpredictability and frequency of natural disasters in some parts of the world and created additionaluncertainty as to future trends and exposures.
Our specialty reinsurance portfolio is also exposed to emerging risks arising from the ongoing financialcrisis, including with respect to a potential increase of claims in D&O, E&O, mortgage valuation, surety,casualty clash and other lines of business.
A sustained weakness or weakening in business and economic conditions generally or specifically in theprincipal markets in which we do business could adversely affect our business and operating results.
The United States and other markets around the world have been experiencing deteriorating economicconditions, including substantial and continuing financial market disruptions. Continued adversedevelopment in economic conditions could adversely affect the business environment in our principalmarkets, and accordingly could adversely affect demand for the products sold by us or our clients. Inaddition, during an economic downturn, our consolidated credit risk, reflecting our counterparty dealings
41
with agents, brokers, customers, retrocessionaires, capital providers, parties associated with our investmentportfolio, and others, would likely be increased, due to the increase in the number of counterparties whobecome delinquent, file for protection under bankruptcy laws, or default on their obligations to us.Moreover, our markets may experience increased inflationary conditions which could cause loss costs toincrease.
Deterioration in the investment markets and economic conditions could lead to additional investment losses.
Ongoing conditions in the investment markets, the current interest rate environment and general economicconditions have and could continue to adversely affect our net investment income on our fixed incomeinvestments and our other invested assets. For the year ended December 31, 2008, we incurred significantrealized and unrealized investment losses, as described in “Item 7. Management’s Discussion and Analysisof Financial Condition and Results of Operations – Investments.” Subsequent to year end, through the dateof this report, economic conditions have continued to decline. In addition to impacting our reported netloss, potential future losses on our investment portfolio, including potential future mark-to-market results,would adversely impact our equity capital. Net investment income is an important contributor to theCompany’s results of operations, and we currently expect the investment environment to remain challengingfor some time. We expect volatile financial markets and challenging economic conditions to persist for sometime and we are unable to predict at what time conditions might improve, or the pace or scale of any suchimprovement. Depending on market conditions, we could incur additional realized and unrealized losses infuture periods, which could have a material adverse effect on the Company’s results of operations, financialcondition and business.
Some of our investments are relatively illiquid and are in asset classes that have been experiencingsignificant market valuation fluctuations.
Although we invest primarily in highly liquid securities in order to ensure our ability to pay valid claims in aprompt manner, we do hold certain investments that may lack liquidity, such as our alternative investments.If we require significant amounts of cash on short notice in excess of our normal cash requirements or arerequired to post or return collateral in connection with our investment portfolio, we may have difficultyselling these investments in a timely manner, be forced to sell them for less than we otherwise would havebeen able to realize, or both.
At times, the reported value of our liquid and relatively illiquid types of investments and, our high quality,generally liquid asset classes, do not necessarily reflect the lowest current market price for the asset. If wewere forced to sell certain of our assets in the current market, there can be no assurance that we will beable to sell them for the prices at which we have recorded them and we may be forced to sell them atsignificantly lower prices.
The reduction in market liquidity has also made it difficult to value certain of our securities as trading hasbecome less frequent. As such, valuations may include assumptions or estimates that may be moresusceptible to significant period-to-period changes which could have a material adverse effect on ourconsolidated results of operations or financial condition.
The determination of the impairments taken on our investments is highly subjective and could materiallyimpact our financial position or results of operations.
The determination of the impairments taken on our investments vary by investment type and is based uponour periodic evaluation and assessment of known and inherent risks associated with the respective assetclass. Such evaluations and assessments are revised as conditions change and new information becomesavailable. Management updates its evaluations regularly and reflects impairments in operations as suchevaluations are revised. There can be no assurance that our management has accurately assessed the levelof impairments taken in our financial statements. Furthermore, additional impairments may need to betaken in the future, which could materially impact our financial position or results of operations. Historicaltrends may not be indicative of future impairments.
42

We are unable to predict the effect that governmental actions for the purpose of stabilizing the financialmarkets will have on such markets generally or on the Company in particular.
In response to the financial crises affecting the banking system and financial markets and going concernthreats to investment banks and other financial institutions, on October 3, 2008, then-President Bushsigned the EESA into law. Pursuant to the EESA, the U.S. Treasury has the authority to, among other things,purchase up to $700 billion of mortgage-backed and other securities from financial institutions for thepurpose of stabilizing the financial markets. Subsequently, on February 17, 2009, President Obama signedinto law the American Recovery and Reinvestment Act of 2009 (the “ARRA”), a $787 billion stimulus bill forthe purpose of stabilizing the economy by, among other things, creating jobs. The U.S. Federal Governmentand other governmental and regulatory bodies have taken or are considering taking other actions to addressthe financial crisis. It is possible that competitors of the Company, such as companies that engage in bothlife and property casualty insurance lines of business, may participate in some or all of the ARRA programs.We are unable to predict the effect that any such governmental actions will have on the financial marketsgenerally or on the Company’s competitive position, business and financial condition in particular, thoughwe are carefully monitoring the situation as it evolves.
A decline in our investment performance could reduce our profitability and hinder our ability to pay claimspromptly in accordance with our strategy.
We have historically derived a significant portion of our income from our invested assets, which arecomprised of, among other things, fixed maturity securities, such as bonds, asset-backed securities,mortgage-backed securities and investments in bank loan funds, hedge funds and private equitypartnerships. Accordingly, our financial results are subject to a variety of investment risks, including risksrelating to general economic conditions, market volatility, interest rate fluctuations, foreign currency risk,liquidity risk and credit and default risk. Additionally, with respect to certain of our investments, we aresubject to pre-payment or reinvestment risk.
Our invested assets have grown over the years and have come to effect a comparably greater contributionto our financial results. Accordingly, a failure to successfully execute our investment strategy could have amaterial adverse effect on our overall results. In the event of a significant or total loss in our investmentportfolio, the Company’s ability to pay any claims promptly in accordance with our strategy could beadversely affected.
The market value of our fixed maturity investments is subject to fluctuation depending on changes invarious factors, including prevailing interest rates and widening credit spreads.
Increases in interest rates could cause the market value of our investment portfolio to decrease, perhapssubstantially. Conversely, a decline in interest rates could reduce our investment yield, which would reduceour overall profitability. Interest rates are highly sensitive to many factors, including governmental monetarypolicies, domestic and international economic and political conditions and other factors beyond our control.Any measures we take that are intended to manage the risks of operating in a changing interest rateenvironment may not effectively mitigate such interest rate sensitivity.
A portion of our investment portfolio is allocated to other investments which we expect to have different riskcharacteristics than our investments in traditional fixed maturity securities and short term investments.These other investments include private equity partnerships, hedge fund investments, senior secured bankloan funds and catastrophe bonds and are recorded on our consolidated balance sheet at fair value. Thefair value of certain of these investments is generally established on the basis of the net valuation criteriaestablished by the managers of such investments. These net valuations are determined based upon thevaluation criteria established by the governing documents of the investments. Such valuations may differsignificantly from the values that would have been used had ready markets existed for the shares,partnership interests or notes of the investments. Many of the investments are subject to restrictions onredemptions and sales which are determined by the governing documents and limit our ability to liquidatethese investments in the short term. These investments expose us to market risks including interest raterisk, foreign currency risk, equity price risk and credit risk. In addition, we typically do not hold theunderlying securities of these investments in our custody accounts, as a result, we generally do not havethe ability to quantify the risks associated with these investments in the same manner for which we have for
43

our fixed maturity securities. The performance of these investments is also dependent on the individualinvestment managers and the investment strategies. It is possible that the investment managers will leaveand/or the investment strategies will become ineffective or that such managers will fail to follow ourinvestment guidelines. Any of the foregoing could result in a material adverse change to our investmentperformance, and accordingly adversely affect our financial results.
We are exposed to counterparty credit risk, including with respect to reinsurance brokers.
In accordance with industry practice, we pay virtually all amounts owed on claims under our policies toreinsurance brokers, and these brokers, in turn, pay these amounts over to the insurers that have reinsured aportion of their liabilities with us (we refer to these insurers as ceding insurers). Likewise, premiums due to us byceding insurers are virtually all paid to brokers, who then pass such amounts on to us. In many jurisdictions, if abroker were to fail to make such a payment to a ceding insurer, we would remain liable to the ceding insurer forthe deficiency. Conversely, in many jurisdictions, when the ceding insurer pays premiums for these policies toreinsurance brokers for payment over to us, these premiums are considered to have been paid by the cedantsand the ceding insurer will no longer be liable to us for those amounts, whether or not we have actually receivedthe premiums. Consequently, in connection with the settlement of reinsurance balances, we assume asubstantial degree of credit risk associated with brokers around the world.
We are also exposed to the credit risk of our clients, who, pursuant to their contracts with us, frequently payus over time. Our premiums receivable at December 31, 2008 totaled $565.6 million, and these amountsare generally not collateralized. To the extent such clients become unable to pay future premiums, wewould be required to recognize a downward adjustment to our premiums receivable in our financialstatements.
As a result of the global economic downturn, our consolidated credit risk, reflecting our counterpartydealings with agents, brokers, customers, retrocessionaires, capital providers, parties associated with ourinvestment portfolio and others has increased, perhaps materially so.
Retrocessional reinsurance may become unavailable on acceptable terms.
As part of our risk management, we buy reinsurance for our own account. This type of insurance whenpurchased to protect reinsurance companies is known as “retrocessional reinsurance.” Our primaryinsurance companies also buy reinsurance from third parties.
From time to time, market conditions (including the ongoing financial crisis) have limited, and in somecases have prevented, insurers and reinsurers from obtaining reinsurance. Accordingly, we may not be ableto obtain our desired amounts of retrocessional reinsurance. In addition, even if we are able to obtain suchretrocessional reinsurance, we may not be able to negotiate terms as favorable to us as in the past. Thiscould limit the amount of business we are willing to write, or decrease the protection available to us as aresult of large loss events.
When we purchase reinsurance or retrocessional reinsurance for our own account, the insolvency, inabilityor reluctance of any of our reinsurers to make timely payments to us under the terms of our reinsuranceagreements could have a material adverse effect on us. Generally, we believe that the “willingness to pay”of some reinsurers and retrocessionaires is declining, and that the overall industry ability to pay has alsodeclined due to the ongoing financial crisis and other factors. This risk may be more significant to us atpresent than at most times in the past. At December 31, 2008, we had recorded $299.5 million ofreinsurance recoverables, net of a valuation allowance of $8.7 million for uncollectible recoverables. A largeportion of our reinsurance recoverables are concentrated with a relatively small number of reinsurers. Therisk of such concentration of retrocessional coverage may be increased by recent and future consolidationwithin the industry.
Emerging claim and coverage issues, or other litigation, could adversely affect us.
Unanticipated developments in the law as well as changes in social and environmental conditions couldpotentially result in unexpected claims for coverage under our insurance and reinsurance contracts. Thesedevelopments and changes may adversely affect us, perhaps materially so. For example, we could besubject to developments that impose additional coverage obligations on us beyond our underwriting intent,
44

or to increases in the number or size of claims to which we are subject. With respect to our specialtyreinsurance and Individual Risk operations, these legal, social and environmental changes may not becomeapparent until some point in time after their occurrence. For example, we could be deemed liable for lossesarising out of a matter, such as the potential for industry losses arising out of an avian flu pandemic, that wehad not anticipated or had attempted to contractually exclude. Moreover, irrespective of the clarity andinclusiveness of policy language, there can be no assurance that a court or arbitration panel will limitenforceability of policy language or not issue a ruling adverse to us. Our exposure to these uncertaintiescould be exacerbated by the increased willingness of some market participants to dispute insurance andreinsurance contract and policy wordings. Alternatively, potential efforts by us to exclude such exposurescould, if successful, reduce the market’s acceptance of our related products. The full effects of these andother unforeseen emerging claim and coverage issues are extremely hard to predict. As a result, the fullextent of our liability under our coverages may not be known for many years after a contract is issued. Ourexposure to this uncertainty will grow as our “long-tail” casualty businesses grow, because in these linesclaims can typically be made for many years, making them more susceptible to these trends than ourtraditional catastrophe business, which is typically more “short-tail.” In addition, we could be adverselyaffected by the growing trend of plaintiffs targeting participants in the property-liability insurance industry inpurported class action litigation relating to claim handling and other practices. Although we are seeking toadd professional staff and systems to improve our contracts and claims capabilities, we may fail to mitigateour exposure to these growing uncertainties.
The loss of key senior members of management could adversely affect us.
Our success has depended, and will continue to depend, in substantial part upon our ability to attract andretain our executive officers. The loss of services of members of senior management in the future, and theuncertain transition of new members of our senior management team, may strain our ability to execute ourgrowth initiatives. The loss of one or more of our executive officers could adversely impact our business, by,for example, making it more difficult to retain clients or other business contacts whose relationship dependsin part on the service of the departing executives. In general, the loss of the services of any members of ourcurrent senior management team may adversely affect our business, perhaps materially so. We do notcurrently maintain key man life insurance policies with respect to any of our employees.
In addition, our ability to execute our business strategy is dependent on our ability to attract and retain astaff of qualified underwriters and service personnel. The location of our global headquarters in Bermudamay impede our ability to recruit and retain highly skilled employees. Under Bermuda law, non-Bermudians(other than spouses of Bermudians, holders of Permanent Residents’ Certificates and holders of WorkingResidents’ Certificates) may not engage in any gainful occupation in Bermuda without a valid governmentwork permit. Substantially all of our officers are working in Bermuda under work permits that will expire overthe next three years. The Bermuda government could refuse to extend these work permits, which wouldadversely impact us. In addition, a Bermuda government policy limits the duration of work permits to a totalof six years, which is subject to certain exemptions only for key employees. A work permit is issued with anexpiry date (up to five years) and no assurances can be given that any work permit will be issued or, ifissued, renewed upon the expiration of the relevant term. If any of our senior executive officers were notpermitted to remain in Bermuda, our operations could be disrupted and our financial performance could beadversely affected as a result.
U.S. taxing authorities could contend that one or more of our Bermuda subsidiaries are subject to U.S.corporate income tax, as a result of changes in law or regulations, or otherwise.
If the U.S. Internal Revenue Service (the “IRS”) were to contend successfully that one or more of ourBermuda subsidiaries is engaged in a trade or business in the U.S., such subsidiary would, to the extent notexempted from tax by the U.S.-Bermuda income tax treaty, be subject to U.S. corporate income tax on thatportion of its net income treated as effectively connected with a U.S. trade or business, as well as the U.S.corporate branch profits tax. Although we would vigorously resist such a contention, if we were ultimatelyheld to be subject to taxation, our earnings would correspondingly decline.
45
In addition, benefits of the U.S.-Bermuda income tax treaty which may limit any such tax to incomeattributable to a permanent establishment maintained by one or more of our Bermuda subsidiaries in theU.S. are only available to any of such subsidiaries if more than 50% of its shares are beneficially owned,directly or indirectly, by individuals who are Bermuda residents or U.S. citizens or residents. Our Bermudasubsidiaries may not be able to continually satisfy such beneficial ownership test or be able to establish it tothe satisfaction of the IRS. Finally, it is unclear whether the income tax treaty (assuming satisfaction of thebeneficial ownership test) applies to income other than premium income, such as investment income.
Congress has recently conducted hearings relating to the tax treatment of offshore insurance and isreported to be considering legislation that would adversely affect reinsurance between affiliates and offshoreinsurance and reinsurance more generally. On September 18, 2008, U.S. Rep. Richard Neal introducedone such proposal, H.R. 6969, a bill which provides that foreign insurers and reinsurers would be cappedin deducting reinsurance premiums ceded from U.S. units to offshore affiliates. The bill, which has beenreferred to the House Ways and Means Committee, would limit deductions for related party reinsurancecessions to the average percentage of premium ceded to unrelated reinsurers (determined in reference toindividual business lines). Other proposals relating to cross-border transactions, intangible products, ornon-U.S. jurisdictions generally have been introduced in a number of Congressional committees.Enactment of such legislation, depending on the specific details, could adversely affect our financial results.
Regulatory challenges in the U.S. or elsewhere to our Bermuda operations’ claims of exemption frominsurance regulation could restrict our ability to operate, increase our costs, or otherwise adverselyimpact us.
Renaissance Reinsurance, DaVinci and Top Layer Re are not licensed or admitted in any jurisdiction exceptBermuda. Renaissance Reinsurance, Glencoe, DaVinci and Top Layer Re each conduct business only fromtheir principal offices in Bermuda and do not maintain an office in the U.S. The insurance and reinsuranceregulatory framework continues to be subject to increased scrutiny in many jurisdictions, including the U.S.and various states within the U.S. If our Bermuda insurance or reinsurance operations become subject tothe insurance laws of any state in the U.S., we could face inquiries or challenges to the future operations ofthese companies.
Moreover, we could be put at a competitive disadvantage in the future with respect to competitors that arelicensed and admitted in U.S. jurisdictions. Among other things, jurisdictions in the U.S. do not permitinsurance companies to take credit for reinsurance obtained from unlicensed or non-admitted insurers ontheir statutory financial statements unless security is posted. Our contracts generally require us to post aletter of credit or provide other security after a reinsured reports a claim. In order to post these letters ofcredit, issuing banks generally require collateral. It is possible that the European Union or other countriesmight adopt a similar regime in the future, or that U.S. rules could be altered in a way that treats Bermuda-based companies disproportionately. Any such development, or if we are unable to post security in the formof letters of credit or trust funds when required, could significantly and negatively affect our operations.
Glencoe and Lantana are currently eligible, non-admitted excess and surplus lines insurers in, respectively,51 and 49 states and territories of the U.S. and are each subject to certain regulatory and reportingrequirements of these states. However, neither Glencoe nor Lantana is admitted or licensed in any U.S.jurisdiction; moreover, Glencoe only conducts business from Bermuda. Accordingly, the scope of Glencoe’sand Lantana’s activities in the U.S. is limited, which could adversely affect their ability to compete. Althoughsurplus lines business is generally less regulated than the admitted market, the regulation of surplus linesinsurance may undergo changes in the future. Federal and/or state measures may be introduced andpromulgated that could result in increased oversight and regulation of surplus lines insurance. Additionally,some recent and pending cases in Florida and California courts have raised potentially significant questionsregarding surplus lines insurance in those states such as whether surplus lines insurers will be subject topolicy form content, filing and approval requirements or additional taxes. These cases also couldforeshadow more extensive oversight of surplus lines insurance by other jurisdictions.
Stonington, which writes insurance in all 50 states and the District of Columbia on an admitted basis, issubject to extensive regulation under state statutes which confer regulatory, supervisory and administrativepowers on state insurance commissioners. Such regulation generally is designed to protect policyholdersrather than investors or shareholders of the insurer.
46

Our current or future business strategy could cause one or more of our currently unregulatednon-insurance subsidiaries to become subject to some form of regulation. Any failure to comply withapplicable laws could result in the imposition of significant restrictions on our ability to do business, andcould also result in fines and other sanctions, any or all of which could adversely affect our financial resultsand operations.
We could be required to allocate considerable time and resources to comply with any new or additionalregulatory requirements, and any such requirements may impact the operations of our insurancenon-insurance subsidiaries and ultimately could impact our financial condition as well. In addition, we couldbe adversely affected if a regulatory authority believed we had failed to comply with applicable law orregulation.
Operational risks, including systems or human failures, are inherent in business, including ours.
We are subject to operational risks including fraud, employee errors, failure to document transactionsproperly or to obtain proper internal authorization, failure to comply with regulatory requirements orobligations under our agreements, information technology failures, or external events. Losses from theserisks may occur from time to time and may be significant. As our business and operations grow morecomplex we are exposed to more risk in these areas.
Our modeling, underwriting and information technology and application systems are critical to our success.Moreover, our proprietary technology and application systems have been an important part of ourunderwriting strategy and our ability to compete successfully. We have also licensed certain systems anddata from third parties. We cannot be certain that we will have access to these, or comparable, serviceproviders, or that our information technology or application systems will continue to operate as intended.While we have implemented disaster recovery and other business contingency plans, a defect or failure inour internal controls or information technology and application systems could result in reduced or delayedrevenue growth, higher than expected losses, management distraction, or harm to our reputation. Webelieve appropriate controls and mitigation procedures are in place to prevent significant risk of defect inour internal controls, information technology and application systems, but internal controls provide onlyreasonable, not absolute, assurance as to the absence of errors or irregularities and any ineffectiveness ofsuch controls and procedures could have a material adverse effect on our business.
We may be adversely affected by foreign currency fluctuations.
Our functional currency is the U.S. dollar; however, as we expand geographically, an increasing portion ofour premium is, and likely will be, written in currencies other than the U.S. dollar and a portion of ourclaims and claim expense reserves is also in non-dollar currencies. Moreover, we maintain a portion of ourcash and investments in currencies other than the U.S. dollar. Although we generally seek to hedgesignificant non-U.S. dollar positions, we may, from time to time, experience losses resulting solely fromfluctuations in the values of these foreign currencies, which could cause our consolidated earnings todecrease. In addition, failure to manage our foreign currency exposures could cause our results ofoperations to be more volatile.
We may require additional capital in the future, which may not be available or only available on unfavorableterms.
We monitor our capital adequacy on a regular basis. The capital requirements of our business depend onmany factors, including our ability to write new business successfully and to establish premium rates andreserves at levels sufficient to cover losses. Our ability to sell our reinsurance and insurance products islargely dependent upon the quality of our claims paying and financial strength ratings as evaluated byindependent rating agencies. To the extent that our existing capital is insufficient to support our futureoperating requirements, we may need to raise additional funds through financings or limit our growth. Anyfurther equity or debt financing, or capacity needed for letters of credit, if available at all, may be on termsthat are unfavorable to us, particularly in light of the recent disruptions, uncertainty and volatility in thecapital and credit markets. Our ability to raise such capital successfully would depend upon the facts andcircumstances at the time, including our financial position and operating results, market conditions, and
47

applicable legal issues. Access to capital on attractive terms has been challenging for many companiesduring the ongoing global credit crisis. If we are unable to obtain adequate capital if and when needed, ourbusiness, results of operations and financial condition would be adversely affected.
In August 2009 the term of our $500 million committed revolving credit facility will expire. We may notsucceed in renewing this facility on terms attractive to us or at all. Our ability to renew or replace this creditfacility is subject to many factors beyond our control, such as more stringent credit criteria and/orconditions emanating from or as a result of the currently difficult conditions in the global capital and creditmarkets, the effect of which may be to make a renewal or replacement so onerous as to make us consideralternate sources of such liquidity or limit our ability to write business for our clients.
The covenants in our debt agreements limit our financial and operational flexibility, which could have anadverse effect on our financial condition.
We have incurred indebtedness, and may incur additional indebtedness in the future. At December 31,2008, we had an aggregate of $450.0 million of indebtedness outstanding. Our indebtedness primarilyconsists of publicly traded notes and letter of credit and revolving credit facilities. For more details on ourindebtedness, see “Item 7. Management’s Discussion and Analysis of Financial Condition and Results ofOperations – Capital Resources”.
The agreements covering our indebtedness, particularly our bank loans, contain covenants that limit ourability, among other things, to borrow money, make particular types of investments or other restrictedpayments, sell assets, merge or consolidate. These agreements also require us to maintain specific financialratios. If we fail to comply with these covenants or meet these financial ratios, the lenders under our creditfacilities could declare a default and demand immediate repayment of all amounts owed to them, canceltheir commitments to lend or issue letters of credit, or both, and require us to pledge additional or adifferent type of collateral.
Because we are a holding company, we are dependent on dividends and payments from our subsidiaries.
As a holding company with no direct operations, we rely on investment income, cash dividends and otherpermitted payments from our subsidiaries to make principal and interest payments on our debt and to paydividends to our shareholders. The holding company does not have any operations and from time to timemay not have significant liquid assets. Bermuda law and various U.S. insurance regulations may limit theability of our subsidiaries to pay dividends. If our subsidiaries are restricted from paying dividends to us, wemay be unable to pay dividends or to repay our indebtedness. For example, since our U.S. insurancesubsidiaries may only pay dividends out of earned surplus, and as these subsidiaries’ earned surplus isnegative, they cannot currently pay dividends without the applicable state insurance department approval.For a more detailed discussion of these regulations, see “Item 1. Business – Regulation”.
Acquisitions or strategic investments that we made or may make could turn out to be unsuccessful.
As part of our strategy, we frequently monitor and analyze opportunities to acquire or make a strategicinvestment in new or other businesses that will not detract from our core Reinsurance and Individual Riskoperations. The negotiation of potential acquisitions or strategic investments as well as the integration of anacquired business or new personnel could result in a substantial diversion of management resources.Acquisitions could involve numerous additional risks such as potential losses from unanticipated litigation orlevels of claims and inability to generate sufficient revenue to offset acquisition costs. Any failure by us toeffectively limit such risks or implement our acquisitions or strategic investment strategies could have amaterial adverse effect on our business, financial condition or results of operations.
Results in certain of our newer or potentially expanding business lines could cause significant volatility inour consolidated financial statements.
As we continue to grow and diversify our operations, certain of our new or potentially expanding businesslines could have a significant negative impact on our financial results or cause significant volatility in ourresults for any fiscal quarter or year. For example, we may experience losses or experience significantvolatility in our financial results with respect to our multi-peril crop business as a result of volatility in
48

commodity prices and weather events, such as flooding, drought, hail, windstorms and other naturalphenomena, all of which impacts the profitability of this line of business. In addition, our weather andenergy products and trading business is accounted for at fair value and the value of our positions canchange significantly which could have a significant negative impact on our financial results, or causesignificant volatility in our result for any fiscal quarter or year.
We could be adversely impacted by a failure to comply with the terms of the Company’s settlementagreement with the SEC.
On March 20, 2007, the United States District Court for the Southern District of New York signed the finaljudgment approving our settlement with the SEC arising from the restatement of our financial statements forthe fiscal years ended December 31, 2003, 2002 and 2001. In accordance with the terms of the settlementagreement, we previously retained an independent consultant to review certain of our internal controls,policies and procedures as well as the design and implementation of the review conducted by independentcounsel reporting to the non-executive members of our Board of Directors and certain additionalprocedures performed by our auditors in connection with their audit of our financial statements for the fiscalyear ended December 31, 2004. While we will strive to fully comply with the settlement agreement with theSEC, it is possible that the enforcement staff of the SEC and/or the independent consultant may take issuewith our cooperation despite our efforts. Any such failure to comply with the settlement agreement or anysuch perception that we have failed to comply, could adversely affect us, perhaps materially so.
Some aspects of our corporate structure may discourage third party takeovers and other transactions orprevent the removal of our current board of directors and management.
Some provisions of our Amended and Restated Bye-Laws have the effect of making more difficult ordiscouraging unsolicited takeover bids from third parties or preventing the removal of our current board ofdirectors and management. In particular, our Bye-Laws prohibit transfers of our capital shares if the transferwould result in a person owning or controlling shares that constitute 9.9% or more of any class or series ofour shares. In addition, our Byelaws reduce the total voting power of any shareholder owning, directly orindirectly, beneficially or otherwise, as described in our Bye-laws, more than 9.9% of our common shares tonot more than 9.9% of the total voting power of our capital stock unless otherwise waived at the discretionof the Board. The primary purpose of these provisions is to reduce the likelihood that we will be deemed a“controlled foreign corporation” within the meaning of the Internal Revenue Code for U.S. federal taxpurposes. However, these provisions may also have the effect of deterring purchases of large blocks ofcommon shares or proposals to acquire us, even if some or a majority of our shareholders might deemthese purchases or acquisition proposals to be in their best interests.
In addition, our Bye-Laws provide for, among other things:
• a classified Board, whose size is fixed and whose members may be removed by the shareholdersonly for cause upon a 662⁄3% vote;
• restrictions on the ability of shareholders to nominate persons to serve as directors, submitresolutions to a shareholder vote and requisition special general meetings;
• a large number of authorized but unissued shares which may be issued by the Board withoutfurther shareholder action; and
• a 662⁄3% shareholder vote to amend, repeal or adopt any provision inconsistent with severalprovisions of the Bye-Laws.
These Bye-Law provisions make it more difficult to acquire control of us by means of a tender offer, openmarket purchase, proxy contest or otherwise. These provisions are designed to encourage persons seekingto acquire control of us to negotiate with our directors, which we believe would generally best serve theinterests of our shareholders. However, these provisions could have the effect of discouraging a prospectiveacquirer from making a tender offer or otherwise attempting to obtain control of us. In addition, theseBye-Law provisions could prevent the removal of our current board of directors and management. To theextent these provisions discourage takeover attempts, they could deprive shareholders of opportunities torealize takeover premiums for their shares or could depress the market price of the shares.
49
We indirectly own certain U.S. based insurance subsidiaries. Our ownership of a U.S. insurance companycan, under applicable state insurance company laws and regulations, delay or impede a change of controlof RenaissanceRe. It is possible that we will form, acquire or invest in other U.S. domestic insurancecompanies in the future, which could make this risk more severe. Under applicable state insuranceregulations, any proposed purchase of 10% or more of our voting securities would require the prior approvalof the relevant insurance regulatory authorities.
Investors may have difficulties in serving process or enforcing judgments against us in the U.S.
We are a Bermuda company. In addition, certain of our officers and directors reside in countries outside theU.S. All or a substantial portion of our assets and the assets of these officers and directors are or may belocated outside the U.S. Investors may have difficulty effecting service of process within the U.S. on ourdirectors and officers who reside outside the U.S. or recovering against us or these directors and officers onjudgments of U.S. courts based on civil liabilities provisions of the U.S. federal securities laws whether ornot we appoint an agent in the U.S. to receive service of process.
RISKS RELATED TO OUR INDUSTRY
The reinsurance business is historically cyclical and the pricing and terms for our products may decline,which could affect our profitability.
The reinsurance and insurance industries have historically been cyclical, characterized by periods ofdecreasing prices followed by periods of increasing prices. Reinsurers have experienced significantfluctuations in their results of operations due to numerous factors, including the frequency and severity ofcatastrophic events, perceptions of risk, levels of capacity, general economic conditions and underwritingresults of other insurers and reinsurers. All of these factors fluctuate and may contribute to price declinesgenerally in the reinsurance and insurance industries. For example, an increase in capital in our industryafter the 2005 catastrophe events, and the Florida legislation, described below, helped create a softeningmarket where pricing decreased in certain lines and became less attractive in the past few years.
The catastrophe-exposed lines in which we are a market leader are affected significantly by volatile andunpredictable developments, including natural and man-made disasters. The occurrence, ornonoccurrence, of catastrophic events, the frequency and severity of which are inherently unpredictable,affects both industry results and consequently prevailing market prices of our products.
We expect premium rates and other terms and conditions of trade to vary in the future. If demand for ourproducts falls or the supply of competing capacity rises, our growth and our profitability could, due in partto our disciplined approach to underwriting, be adversely affected. In particular, we might lose existingcustomers or decline business, which we might not regain when industry conditions improve.
In recent years, hedge funds and investment banks have been increasingly active in the reinsurance marketand markets for related risks. While this trend has slowed during the current financial dislocation, wegenerally expect increased competition from a wider range of entrants over time. It is possible that suchnew or alternative capital could cause reductions in prices of our products. To the extent that industrypricing of our products does not meet our hurdle rate, we would generally expect to reduce our futureunderwriting activities thus resulting in reduced premiums and a reduction in expected earnings.
Recent or future legislation may decrease the demand for our property catastrophe reinsurance productsand adversely affect our business and results of operations.
In January 2007, the State of Florida enacted legislation known as Bill No. CS/HB-1A (the “Bill”), whichincreased the access of primary Florida insurers to the FHCF. Through the FHCF, the State of Floridacurrently provides below market rate reinsurance of up to $28.0 billion per season, an increase from theprevious cap of $16.0 billion, with the State able to further increase the limits up to an additional $4.0billion per season. In addition, the legislation allows Florida insurers to choose a lower retention level forFHCF reinsurance coverage, at specified rates for specified layers of coverage. Further, the legislationexpanded the ability of Citizens, a state-sponsored entity, to compete with private insurance andreinsurance companies, such as ours, by, for example, authorizing Citizens to write multi-peril policies in
50

high-risk account coverage areas. Moreover, the legislation mandated the reduction of Citizens’ in forcerates by an average of 23%, repealed a 56% rate increase that was to be effective March 1, 2007, andfroze any additional rate increases for the remainder of 2007. Also, Citizens’ premium rates are no longerrequired to be non-competitive with the voluntary, private market and are no longer required to be based onthe highest rate offered by the top 20 insurers in a given area. In sum, the legislation reduced the role of theprivate markets in providing support for Florida-based risks, a market in which we have establishedsubstantial market share. Efforts in 2008 to reduce the scale of the 2008 state involvement in the privatemarkets were not successful.
While we have sought and intend to continue to seek to utilize our strong relationships, record of superiorservice and financial strength to mitigate the impact of the legislation, we believe the Bill caused asubstantial decline in the private reinsurance and insurance markets in and relating to Florida, andcontributed to the decline in our property catastrophe gross premiums written in 2008 and 2007 ascompared to 2006. Because of our position as one of the largest providers of catastrophe-exposedcoverage, both on a global basis and in respect of the Florida market, the Bill may have had adisproportionate adverse impact on us compared to other market participants. Proposals to reduce theexpansion of the FHCF introduced in 2008 never materialized and there can be no assurance thatadditional legislation reducing the size of the private markets relating to Florida will not be enacted.
It is also possible that other states, particularly those with Atlantic or Gulf Coast exposures, may enact newor expanded legislation based on the Florida precedent, or may otherwise enact legislation, which wouldfurther diminish aggregate private market demand for our products. Alternatively, legislation adverselyimpacting the private markets could be enacted on a regional or at the federal level. Moreover, we believethat numerous modeled potential catastrophes could exceed the actual or politically acceptable bondedcapacity of the FHCF, which could lead either to a severe dislocation or the necessity of Federal interventionin the Florida market, either of which would adversely impact the private insurance and reinsuranceindustry.
Other political, regulatory and industry initiatives could adversely affect our business.
The insurance and reinsurance regulatory framework is subject to heavy scrutiny by the U.S. and individualstate governments as well as an increasing number of international authorities. Government regulators aregenerally concerned with the protection of policyholders to the exclusion of other constituencies, includingshareholders. Governmental authorities in both the U.S. and worldwide seem increasingly interested in thepotential risks posed by the reinsurance industry as a whole, and to commercial and financial systems ingeneral. While we do not believe these inquiries have identified meaningful new risks posed by thereinsurance industry, and we cannot predict the exact nature, timing or scope of possible governmentalinitiatives, we believe it is likely there will be increased regulatory intervention in our industry in the future.For example, the U.S. federal government has increased its scrutiny of the insurance regulatory frameworkin recent years, and some state legislators have considered or enacted laws that will alter and likely increasestate regulation of insurance and reinsurance companies and holding companies. Moreover, the NAIC,which is an association of the insurance commissioners of all 50 states and the District of Columbia andstate insurance regulators, regularly reexamine existing laws and regulations.
For example, we could be adversely affected by proposals to:
• provide insurance and reinsurance capacity in markets and to consumers that we target, such asthe legislation enacted in Florida in early 2007 described above;
• require our participation in industry pools and guaranty associations;
• expand the scope of coverage under existing policies for matters such as hurricanes Katrina, Ritaand Wilma, and the New Orleans flood, or such as a pandemic flu outbreak;
• increasingly mandate the terms of insurance and reinsurance policies;
• establish a new federal insurance regulator or financial industry systemic risk regulator;
• revise laws or regulations under which we operate, such as the 2008 Farm Bill; or
• disproportionately benefit the companies of one country over those of another.
51

The growth of our primary insurance business, which is regulated more comprehensively than reinsurance,increases our exposure to adverse political, judicial and legal developments.
We are incorporated in Bermuda and are therefore subject to changes in Bermuda law and regulation that mayhave an adverse impact on our operations, including imposition of tax liability or increased regulatory supervisionor change in regulation. In addition, we are subject to changes in the political environment in Bermuda, whichcould make it difficult to operate in, or attract talent to, Bermuda. The Bermuda insurance and reinsuranceregulatory framework recently has become subject to increased scrutiny in many jurisdictions, including in theUnited States and in various states within the United States. We are unable to predict the future impact on ouroperations of changes in the laws and regulations to which we are or may become subject. Moreover, ourexposure to potential regulatory initiatives could be heightened by the fact that our principal operating companiesare domiciled in, and operate exclusively from, Bermuda. For example, Bermuda, a small jurisdiction, may bedisadvantaged in participating in global or cross border regulatory matters as compared with larger jurisdictionssuch as the U.S. or the leading European Union countries. In addition, Bermuda, which is currently an overseasterritory of the United Kingdom, may consider changes to its relationship with the United Kingdom in the future.These changes could adversely affect Bermuda’s position in respect of its regulatory initiatives, which couldadversely impact us commercially.
We operate in a highly competitive environment.
The reinsurance industry is highly competitive. We compete, and will continue to compete, with major U.S.and non-U.S. insurers and property catastrophe reinsurers, including other Bermuda-based reinsurers.Many of our competitors have greater financial, marketing and management resources than we do.Historically, periods of increased capacity levels in our industry generally have led to increased competition,and decreased prices for our products.
We believe that our principal competitors in the property catastrophe reinsurance market include othercompanies active in the Bermuda market, including Ace, Allied World, Arch, Axis, Endurance, Everest Re,IPC, Montpelier Re, Partner Re, Platinum, Transatlantic, Validus, White Mountains and XL. We alsocompete with certain Lloyd’s syndicates active in the London market, as well as with a number of otherindustry participants, such as AIG, Berkshire, Hannover Re, Munich Re Group and Swiss Re. As ourbusiness evolves over time, we expect our competitors to change as well. For example, following hurricaneKatrina in August 2005, a significant number of new reinsurance companies were formed in Bermudawhich have resulted in new competition, which may well continue in subsequent periods. Also, hedge fundsand investment banks have shown an interest in entering the reinsurance market, either through theformation of reinsurance companies, or through the use of other financial products, such as catastrophebonds and other cat-linked securities. In addition, we may not be aware of other companies that may beplanning to enter the reinsurance market or of existing companies that may be planning to raise additionalcapital. We cannot predict what effect any of these developments may have on our businesses.
The markets in which our Individual Risk unit operates are also highly competitive. Primary insurerscompete on the basis of factors including distribution channels, product, price, service and financialstrength. Many of our primary insurance competitors, especially in jurisdictions in which we have recentlyexpanded, or may expand in the future, are larger and more established than we are and have greaterfinancial resources and consumer recognition. We seek primary insurance pricing that will result inadequate returns on the capital allocated to our primary insurance business. We may lose primaryinsurance business to competitors offering competitive insurance products at lower prices or on moreadvantageous terms.
Consolidation in the (re) insurance industry could adversely impact us.
We believe that several (re)insurance industry participants are seeking to consolidate. These consolidatedentities may try to use their enhanced market power to negotiate price reductions for our products andservices. If competitive pressures reduce our prices, we would expect to write less business. As theinsurance industry consolidates, competition for customers will become more intense and the importance ofacquiring and properly servicing each customer will become greater. We could incur greater expensesrelating to customer acquisition and retention, further reducing our operating margins. In addition,insurance companies that merge may be able to spread their risks across a consolidated, larger capital
52

base so that they require less reinsurance. The number of companies offering retrocessional reinsurancemay decline. Reinsurance intermediaries could also consolidate, potentially adversely impacting our abilityto access business and distribute our products. We could also experience more robust competition fromlarger, better capitalized competitors. Any of the foregoing could adversely affect our business or our resultsof operation.
The Organization for Economic Cooperation and Development (“OECD”) and the European Union areconsidering measures that might increase our taxes and reduce our net income.
The OECD has published reports and launched a global dialogue among member and non-membercountries on measures to limit harmful tax competition. These measures are largely directed atcounteracting the effects of tax havens and preferential tax regimes in countries around the world. In theOECD’s report dated April 18, 2002 and updated as of June 2004 and November 2005 via a “GlobalForum,” Bermuda was not listed as an uncooperative tax haven jurisdiction because it had previouslycommitted to eliminate harmful tax practices and to embrace international tax standards for transparency,exchange of information and the elimination of any aspects of the regimes for financial and other servicesthat attract business with no substantial domestic activity. We are not able to predict what changes will arisefrom the commitment or whether such changes will subject us to additional taxes.
Regulatory regimes and changes to accounting rules may adversely impact financial results irrespective ofbusiness operations.
Accounting standards and regulatory changes may require modifications to our accounting principles, bothprospectively and for prior periods and such changes could have an adverse impact on our financial results.In particular, the SEC has formally proposed a plan to first allow and then require companies to file financialstatements in accordance with IFRS rather than GAAP. Such changes could have a significant impact onour financial reporting, impacting key matters such as our loss reserving policies and premium and expenserecognition. For example, the International Accounting Standards Board is considering adopting anaccounting standard that would require all reinsurance and insurance contracts to be accounted for undera new measurement basis, current exit value, which is considered to be closely related to fair value. We arecurrently evaluating how the SEC’s initiatives will impact us, including as respects to our loss reservingpolicy or the effect it might have on recognizing premium revenue and policy acquisition costs. Requiredmodification of our existing principles, either with respect to these issues or other issues in the future, couldhave an impact on our results of operations, including changing the timing of the recognition ofunderwriting income, increasing the volatility of our reported earnings and changing our overall financialstatement presentation.
Heightened scrutiny of issues and practices in the insurance industry may adversely affect our business.
We believe that certain government authorities, including state officials in Florida, are continuing toscrutinize and investigate a number of issues and practices within the insurance industry. While we havenot been named in any actions or proceedings, it is possible such scrutiny could expand to include us inthe future, and it is also possible that these investigations or related regulatory developments will mandateor otherwise give rise to changes in industry practices in a fashion that increases our costs or requires us toalter how we conduct our business.
We cannot predict the ultimate effect that these investigations, and any changes in industry practice,including future legislation or regulations that may become applicable to us, will have on the insuranceindustry, the regulatory framework, or our business.
As noted above, because we frequently assume the credit risk of the counterparties with whom we dobusiness throughout our insurance and reinsurance operations, our results of operations could be adverselyaffected if the credit quality of these counterparties is severely impacted by the current investigations in theinsurance industry or by changes to industry practices.
ITEM 1B. UNRESOLVED STAFF COMMENTS
None.
53

Glossary of Selected Insurance and Reinsurance Terms
Accident year . . . . . . . . . . . . . . . . . . Year of occurrence of a loss. Claim payments and reserves forclaims and claim expenses are allocated to the year in which theloss occurred for losses occurring contracts and in the year the losswas reported for claims made contracts.
Acquisition expenses . . . . . . . . . . . . The aggregate expenses incurred by a company acquiring newbusiness, including commissions, underwriting expenses, premiumtaxes and administrative expenses.
Additional case reserves . . . . . . . . . . Additional case reserves represent management’s estimate ofreserves for claims and claim expenses that are allocated to specificcontracts, less paid and reported losses by the client.
Attachment point . . . . . . . . . . . . . . . The dollar amount of loss (per occurrence or in the aggregate, asthe case may be) above which excess of loss reinsurance becomesoperative.
Backup premiums written . . . . . . . . The premiums written for additional reinsurance coveragepurchased after a series of catastrophic events has exhausted orsignificantly reduced the initial and reinstatement limits availableunder the original coverages purchased.
Bordereau . . . . . . . . . . . . . . . . . . . . . A report providing premium or loss data with respect to identifiedspecific risks. This report is periodically furnished to a reinsurer bythe ceding insurers or reinsurers.
Bound . . . . . . . . . . . . . . . . . . . . . . . . A (re)insurance policy is considered bound, and the (re)insurerresponsible for the risks of the policy, when both parties agree tothe terms and conditions set forth in the policy.
Broker . . . . . . . . . . . . . . . . . . . . . . . . An intermediary who negotiates contracts of insurance orreinsurance, receiving a commission for placement and otherservices rendered, between (1) a policy holder and a primaryinsurer, on behalf of the insured party, (2) a primary insurer andreinsurer, on behalf of the primary insurer, or (3) a reinsurer and aretrocessionaire, on behalf of the reinsurer.
Capacity . . . . . . . . . . . . . . . . . . . . . . The percentage of surplus, or the dollar amount of exposure, thatan insurer or reinsurer is willing or able to place at risk. Capacitymay apply to a single risk, a program, a line of business or an entirebook of business. Capacity may be constrained by legal restrictions,corporate restrictions or indirect restrictions.
Case reserves . . . . . . . . . . . . . . . . . . Loss reserves, established with respect to specific, individualreported claims.
Casualty insurance orreinsurance . . . . . . . . . . . . . . . . . . . . Insurance or reinsurance that is primarily concerned with the losses
caused by injuries to third persons and their property (in otherwords, persons other than the policyholder) and the legal liabilityimposed on the insured resulting there from. Also referred to asliability insurance.
54

Catastrophe . . . . . . . . . . . . . . . . . . . A severe loss, typically involving multiple claimants. Common perilsinclude earthquakes, hurricanes, hailstorms, severe winter weather,floods, fires, tornadoes, explosions and other natural or man-madedisasters. Catastrophe losses may also arise from acts of war, actsof terrorism and political instability.
Catastrophe excess of lossreinsurance . . . . . . . . . . . . . . . . . . . . A form of excess of loss reinsurance that, subject to a specified
limit, indemnifies the ceding company for the amount of loss inexcess of a specified retention with respect to an accumulation oflosses resulting from a “catastrophe.”
Catastrophe-linked securities;cat-linked securities . . . . . . . . . . . . . Cat-linked securities are generally privately placed fixed income
securities where all or a portion of the repayment of the principal islinked to catastrophic events. This includes securities where therepayment is linked to the occurrence and/or size of, for example,one or more hurricanes or earthquakes, or other industry lossesassociated with these catastrophic events.
Cede; cedant; ceding company . . . . When a party reinsures its liability with another, it “cedes” businessand is referred to as the “cedant” or “ceding company.”
Claim . . . . . . . . . . . . . . . . . . . . . . . . Request by an insured or reinsured for indemnification by aninsurance company or a reinsurance company for losses incurredfrom an insured peril or event.
Claims made contracts . . . . . . . . . . . Contracts that cover claims for losses occurring during a specifiedperiod that are reported during the term of the contract.
Claims and claim expense ratio,net . . . . . . . . . . . . . . . . . . . . . . . . . . The ratio of net claims and claim expenses to net premiums earned
determined in accordance with either SAP or GAAP.
Claim reserves . . . . . . . . . . . . . . . . . Liabilities established by insurers and reinsurers to reflect theestimated costs of claim payments and the related expenses thatthe insurer or reinsurer will ultimately be required to pay in respectof insurance or reinsurance policies it has issued. Claims reservesconsist of case reserves, established with respect to individualreported claims, additional case reserves and “IBNR” reserves. Forreinsurers, loss expense reserves are generally not significantbecause substantially all of the loss expenses associated withparticular claims are incurred by the primary insurer and reportedto reinsurers as losses.
Combined ratio . . . . . . . . . . . . . . . . . The combined ratio is the sum of the net claims and claim expenseratio and the underwriting expense ratio. A combined ratio below100% generally indicates profitable underwriting prior to theconsideration of investment income. A combined ratio over 100%generally indicates unprofitable underwriting prior to theconsideration of investment income.
Decadal . . . . . . . . . . . . . . . . . . . . . . Refers to events occurring over a 10-year period, such as anoscillation whose period is roughly 10 years.
55

Deemed inuring reinsurance . . . . . . A designation of other reinsurances which are first applied pursuantto the terms of the reinsurance agreement to reduce the losssubject to a particular reinsurance agreement. If the otherreinsurances are to be disregarded as respects loss to thatparticular agreement, they are said to inure only to the benefit of thereinsured.
Earned premium . . . . . . . . . . . . . . . . (1) That part of the premium applicable to the expired part of thepolicy period, including the short-rate premium on cancellation, theentire premium on the amount of loss paid under some contracts,and the entire premium on the contract on the expiration of thepolicy, which is recognized as income during the period.
(2) That portion of the reinsurance premium calculated on amonthly, quarterly or annual basis which is to be retained by thereinsurer and recognized as income in the period should theircession be canceled.
(3) When a premium is paid in advance for a certain time, thecompany is said to “earn” the premium as the time advances. Forexample, a policy written for three years and paid for in advancewould be one-third earned at the end of the first year.
Excess and surplus linesreinsurance . . . . . . . . . . . . . . . . . . . . Any type of coverage that cannot be placed with an insurer
admitted to do business in a certain jurisdiction. Risks placed inexcess and surplus lines markets are often substandard as respectsadverse loss experience, unusual, or unable to be placed inconventional markets due to a shortage of capacity.
Excess of loss . . . . . . . . . . . . . . . . . . Reinsurance or insurance that indemnifies the reinsured or insuredagainst all or a specified portion of losses on underlying insurancepolicies in excess of a specified amount, which is called a “level” or“retention.” Also known as non-proportional reinsurance. Excess ofloss reinsurance is written in layers. A reinsurer or group ofreinsurers accepts a layer of coverage up to a specified amount.The total coverage purchased by the cedant is referred to as a“program” and will typically be placed with predeterminedreinsurers in pre-negotiated layers. Any liability exceeding the outerlimit of the program reverts to the ceding company, which alsobears the credit risk of a reinsurer’s insolvency.
Exclusions . . . . . . . . . . . . . . . . . . . . . Those risk, perils, or classes of insurance with respect to which thereinsurer will not pay loss or provide reinsurance, notwithstandingthe other terms and conditions of reinsurance.
Frequency . . . . . . . . . . . . . . . . . . . . The number of claims occurring during a given coverage period.
Generally Accepted AccountingPrinciples in the United States . . . . . Also referred to as GAAP. Accounting principles as set forth in
opinions of the Accounting Principles Board of the AmericanInstitute of Certified Public Accountants and/or statements of theFinancial Accounting Standards Board and/or their respectivesuccessors and which are applicable in the circumstances as of thedate in question.
56

Gross premiums written . . . . . . . . . . Total premiums for insurance written and assumed reinsuranceduring a given period.
Incurred but not reported(“IBNR”) . . . . . . . . . . . . . . . . . . . . . . Reserves for estimated losses that have been incurred by insureds
and reinsureds but not yet reported to the insurer or reinsurer,including unknown future developments on losses that are known tothe insurer or reinsurer.
International Financial ReportingStandards . . . . . . . . . . . . . . . . . . . . . Also referred to as IFRS. Accounting principles, standards and
interpretations as set forth in opinions of the InternationalAccounting Standards Board which are applicable in thecircumstances as of the date in question.
Layer . . . . . . . . . . . . . . . . . . . . . . . . . The interval between the retention or attachment point and themaximum limit of indemnity for which a reinsurer is responsible.
Line . . . . . . . . . . . . . . . . . . . . . . . . . . The amount of excess of loss reinsurance protection provided to aninsurer or another reinsurer, often referred to as limit.
Line of business . . . . . . . . . . . . . . . . The general classification of insurance written by insurers andreinsurers, e.g. fire, allied lines, homeowners and surety, amongothers.
Loss; losses . . . . . . . . . . . . . . . . . . . An occurrence that is the basis for submission and/or payment of aclaim. Whether losses are covered, limited or excluded fromcoverage is dependent on the terms of the policy.
Losses occurring contracts . . . . . . . . Contracts that cover claims arising from loss events that occurduring the term of the reinsurance contract, although notnecessarily reported during the term of the contract.
Loss ratio . . . . . . . . . . . . . . . . . . . . . Net claims incurred expressed as a percentage of net earnedpremiums.
Loss reserve . . . . . . . . . . . . . . . . . . . For an individual loss, an estimate of the amount the insurerexpects to pay for the reported claim. For total losses, estimates ofexpected payments for reported and unreported claims. These mayinclude amounts for claims expenses.
Net claims and claim expenses . . . . The expenses of settling claims net of recoveries, including legaland other fees and the portion of general expenses allocated toclaim settlement costs (also known as claim adjustment expenses)plus losses incurred with respect to net claims.
Net premiums earned . . . . . . . . . . . The portion of net premiums written during or prior to a givenperiod that was actually recognized as income during such period.
Net premiums written . . . . . . . . . . . . Gross premiums written for a given period less premiums ceded toreinsurers and retrocessionaires during such period.
No claims bonus . . . . . . . . . . . . . . . . A reduction of premiums assumed or ceded if no claims have beenmade within a specified period.
Non-proportional reinsurance . . . . . See “Excess of loss.”
57

Perils . . . . . . . . . . . . . . . . . . . . . . . . . This term refers to the causes of possible loss in the property field,such as fire, windstorm, collision, hail, etc. In the casualty field, theterm “hazard” is more frequently used.
Premiums; written, earned andunearned . . . . . . . . . . . . . . . . . . . . . The amount charged during the term on policies and contracts
issued, renewed or reinsured by an insurance company orreinsurance company. Written premium is premium registered onthe books of an issuer or reinsurer at the time a policy is issued andpaid for. Unearned premium is premium for a future exposureperiod. Earned premium is written premium minus unearnedpremium for an individual policy.
Property insurance orreinsurance . . . . . . . . . . . . . . . . . . . . Insurance or reinsurance that provides coverage to a person with an
insurable interest in tangible property for that person’s propertyloss, damage or loss of use.
Property per risk treatyreinsurance . . . . . . . . . . . . . . . . . . . . Reinsurance on a treaty basis of individual property risks insured by
a ceding company.
Proportional reinsurance . . . . . . . . . A generic term describing all forms of reinsurance in which thereinsurer shares a proportional part of the original premiums and lossesof the reinsured. (Also known as pro-rata reinsurance, quota sharereinsurance or participating reinsurance.) In proportional reinsurancethe reinsurer generally pays the ceding company a ceding commission.The ceding commission generally is based on the ceding company’scost of acquiring the business being reinsured (including commissions,premium taxes, assessments and miscellaneous administrativeexpense) and also may include a profit factor. See also “Quota ShareReinsurance” and “Surplus Share Reinsurance.”
Quota share reinsurance . . . . . . . . . A form of proportional reinsurance in which the reinsurer assumesan agreed percentage of each insurance being reinsured andshares all premiums and losses according with the reinsured. Seealso “Proportional Reinsurance” and “Surplus Share Reinsurance.”
Reinstatement premium . . . . . . . . . . The premium charged for the restoration of the reinsurance limit ofa catastrophe contract to its full amount after payment by thereinsurer of losses as a result of an occurrence.
Reinsurance . . . . . . . . . . . . . . . . . . . An arrangement in which an insurance company, the reinsurer,agrees to indemnify another insurance or reinsurance company, theceding company, against all or a portion of the insurance orreinsurance risks underwritten by the ceding company under one ormore policies. Reinsurance can provide a ceding company withseveral benefits, including a reduction in net liability on individualrisks and catastrophe protection from large or multiple losses.Reinsurance also provides a ceding company with additionalunderwriting capacity by permitting it to accept larger risks andwrite more business than would be possible without a concomitantincrease in capital and surplus, and facilitates the maintenance ofacceptable financial ratios by the ceding company. Reinsurancedoes not legally discharge the primary insurer from its liability withrespect to its obligations to the insured.
58

Retention . . . . . . . . . . . . . . . . . . . . . The amount or portion of risk that an insurer retains for its ownaccount. Losses in excess of the retention level are paid by thereinsurer. In proportional treaties, the retention may be apercentage of the original policy’s limit. In excess of loss business,the retention is a dollar amount of loss, a loss ratio or a percentage.
Retrocessional reinsurance;Retrocessionaire . . . . . . . . . . . . . . . . A transaction whereby a reinsurer cedes to another reinsurer, the
retrocessionaire, all or part of the reinsurance that the first reinsurerhas assumed. Retrocessional reinsurance does not legally dischargethe ceding reinsurer from its liability with respect to its obligations tothe reinsured. Reinsurance companies cede risks toretrocessionaires for reasons similar to those that cause primaryinsurers to purchase reinsurance: to reduce net liability onindividual risks, to protect against catastrophic losses, to stabilizefinancial ratios and to obtain additional underwriting capacity.
Risk excess of loss reinsurance . . . . A form of excess of loss reinsurance that covers a loss of thereinsured on a single “risk” in excess of its retention level of thetype reinsured, rather than to aggregate losses for all covered risks,as does catastrophe excess of loss reinsurance. A “risk” in thiscontext might mean the insurance coverage on one building or agroup of buildings or the insurance coverage under a single policy,which the reinsured treats as a single risk.
Risks . . . . . . . . . . . . . . . . . . . . . . . . . A term used to denote the physical units of property at risk or theobject of insurance protection that are not perils or hazards. Alsodefined as chance of loss or uncertainty of loss.
Risks attaching contracts . . . . . . . . . Contracts that cover claims that arise on underlying insurancepolicies that incept during the term of the reinsurance contract.
Specialty lines . . . . . . . . . . . . . . . . . . Lines of insurance and reinsurance that provide coverage for risksthat are often unusual or difficult to place and do not fit theunderwriting criteria of standard commercial products carriers.
Statutory accounting principles(“SAP”) . . . . . . . . . . . . . . . . . . . . . . . Recording transactions and preparing financial statements in
accordance with the rules and procedures prescribed or permittedby Bermuda and/or the U.S. state insurance regulatory authoritiesincluding the NAIC, which in general reflect a liquidating, ratherthan going concern, concept of accounting.
Stop loss . . . . . . . . . . . . . . . . . . . . . . A form of reinsurance under which the reinsurer pays some or all ofa cedant’s aggregate retained losses in excess of a predetermineddollar amount or in excess of a percentage of premium.
Submission . . . . . . . . . . . . . . . . . . . . An unprocessed application for (i) insurance coverage forwarded toa primary insurer by a prospective policyholder or by a broker onbehalf of such prospective policyholder, (ii) reinsurance coverageforwarded to a reinsurer by a prospective ceding insurer or by abroker or intermediary on behalf of such prospective ceding insureror (iii) retrocessional coverage forwarded to a retrocessionaire by aprospective ceding reinsurer or by a broker or intermediary onbehalf of such prospective ceding reinsurer.
59

Surplus share reinsurance . . . . . . . . A form of pro-rata reinsurance (proportional) indemnifying theceding company against loss to the extent of the surplus insuranceliability ceded, on a share basis similar to quota share. See also“Proportional Reinsurance” and “Quota Share Reinsurance.”
Treaty . . . . . . . . . . . . . . . . . . . . . . . . A reinsurance agreement covering a book or class of business thatis automatically accepted on a bulk basis by a reinsurer. A treatycontains common contract terms along with a specific riskdefinition, data on limit and retention, and provisions for premiumand duration.
Underwriting . . . . . . . . . . . . . . . . . . . The insurer’s or reinsurer’s process of reviewing applicationssubmitted for insurance coverage, deciding whether to accept all orpart of the coverage requested and determining the applicablepremiums.
Underwriting capacity . . . . . . . . . . . . The maximum amount that an insurance company can underwrite.The limit is generally determined by a company’s retained earningsand investment capital. Reinsurance serves to increase acompany’s underwriting capacity by reducing its exposure fromparticular risks.
Underwriting expense ratio . . . . . . . . The ratio of the sum of the acquisition expenses and operationalexpenses to net premiums earned, determined in accordance withGAAP.
Underwriting expenses . . . . . . . . . . . The aggregate of policy acquisition costs, including commissions,and the portion of administrative, general and other expensesattributable to underwriting operations.
Unearned premium . . . . . . . . . . . . . The portion of premiums written representing the unexpiredportions of the policies or contracts that the insurer or reinsurer hason its books as of a certain date.
60

ITEM 2. PROPERTIES
We lease office space in Bermuda, which houses our executive offices and operations for both ourReinsurance and Individual Risk segments. In addition, our Individual Risk segment and other U.S. basedsubsidiaries lease office space in a number of U.S. states. Our Reinsurance segment also leases officespace in Dublin, Ireland. While we believe that for the foreseeable future our current office space issufficient for us to conduct our operations, it is likely that we will expand into additional facilities andperhaps new locations to accommodate future growth. To date, the cost of acquiring and maintaining ouroffice space has not been material to us as a whole.
ITEM 3. LEGAL PROCEEDINGS
As previously disclosed, we received a subpoena from the SEC in February 2005, a subpoena from theOffice of the Attorney General of the State of New York (the “NYAG”) in March 2005, and a subpoena fromthe United States Attorney’s Office for the Southern District of New York in June 2005, each of whichrelated to industry-wide investigations into non-traditional, or loss mitigation, (re)insurance products.
On February 6, 2007, we announced that the SEC had accepted our offer of settlement to the SEC toresolve the SEC’s investigation. The settlement was approved by the United States District Court for theSouthern District of New York pursuant to a final judgment entered on March 20, 2007, and we have madepayment on all financial penalties agreed to under the settlement. Pursuant to the settlement, we were alsorequired to retain an independent consultant to review certain of our internal controls, policies andprocedures as well as the design and implementation of the review conducted by independent counselreporting to the non-executive members of our Board of Directors and certain additional proceduresperformed by our auditors in connection with their audit of our financial statements for the fiscal year endedDecember 31, 2004. While we continue to strive to fully comply with the terms of the settlement agreementwith the SEC, it is possible we will fail to do so, or that the enforcement staff of the SEC and/or theindependent consultant may take issue with our cooperation despite our efforts. Any such failure to complywith the settlement agreement or any such perception that we have failed to comply could adversely affectus, perhaps materially so.
As previously disclosed, in September 2006, the SEC filed an enforcement action in the United StatesDistrict Court for the Southern District of New York (the “Court”) against certain of our former officers,including James N. Stanard, our former Chairman and Chief Executive Officer, charging such individualswith violations of federal securities laws, including securities fraud, and seeking permanent injunctive relief,disgorgement of ill-gotten gains, if any, plus prejudgment interest, civil money penalties, and orders barringeach defendant from acting as an officer or director of any public company. The civil litigation between theSEC and Mr. Stanard, to which the Company was not a party, went to trial in September 2008. OnJanuary 27, 2009, the Court issued an opinion and order finding Mr. Stanard liable for securities fraud andother violations of Federal securities laws. The Court permanently enjoined Mr. Stanard from futuresecurities violations and ordered Mr. Stanard to pay a $100 thousand civil penalty. The Court denied theSEC’s request for an order barring Mr. Stanard from serving as an officer or director of a public company.This ongoing matter, including whether or not an appeal is taken, could give rise to additional costs,distractions, or impacts to our reputation.
Our operating subsidiaries are subject to claims litigation involving disputed interpretations of policycoverages. Generally, our primary insurance operations are subject to greater frequency and diversity ofclaims and claims-related litigation and, in some jurisdictions, may be subject to direct actions by allegedlyinjured persons or entities seeking damages from policyholders. These lawsuits, involving claims on policiesissued by our subsidiaries which are typical to the insurance industry in general and in the normal course ofbusiness, are considered in our loss and loss expense reserves which are discussed in its loss reservesdiscussion. In addition to claims litigation, we and our subsidiaries are subject to lawsuits and regulatoryactions in the normal course of business that do not arise from or directly relate to claims on insurancepolicies. This category of business litigation may involve allegations of underwriting or claims-handling errorsor misconduct, employment claims, regulatory activity or disputes arising from our business ventures. Anysuch litigation or arbitration contains an element of uncertainty, and we believe the inherent uncertainty insuch matters may have increased recently and will likely continue to increase. Currently, we believe that no
61

individual, normal course litigation or arbitration to which we are presently a party is likely to have a materialadverse effect on its financial condition, business or operations.
ITEM 4. SUBMISSION OF MATTERS TO A VOTE OF SECURITY HOLDERS
None.
PART II
ITEM 5. MARKET FOR REGISTRANT’S COMMON EQUITY, RELATED SHAREHOLDER MATTERS AND ISSUERREPURCHASES OF EQUITY SECURITIES
PRICE RANGE OF COMMON SHARES
Our common shares began publicly trading on June 27, 1995 on the New York Stock Exchange under thesymbol “RNR.” The following table sets forth, for the periods indicated, the high and low prices per share ofour common shares as reported in composite New York Stock Exchange trading:
Price Rangeof Common Shares
Period High Low
2008First Quarter $60.34 $49.54Second Quarter 55.40 44.59Third Quarter 56.95 43.92Fourth Quarter 52.25 31.50
2007First Quarter $60.69 $49.35Second Quarter 62.39 49.52Third Quarter 66.53 52.58Fourth Quarter 66.75 55.02
On February 11, 2009, the last reported sale price for our common shares was $43.57 per share. AtFebruary 11, 2009, there were 230 holders of record of our common shares.
62

PERFORMANCE GRAPH
The following graph compares the cumulative return on our common shares including reinvestment of ourdividends on our common shares to such return for the Standard & Poor’s (“S&P”) 500 Composite StockPrice Index (“S&P 500”) and S&P’s Property-Casualty Industry Group Stock Price Index (“S&P P/C”), forthe five-year period commencing January 1, 2004 and ending December 31, 2008, assuming $100 wasinvested on January 1, 2004. Each measurement point on the graph below represents the cumulativeshareholder return as measured by the last sale price at the end of each calendar year during the periodfrom January 1, 2004 through December 31, 2008. As depicted in the graph below, during this period, thecumulative return was (1) 14.2% on our common shares; (2) negative 10.5% for the S&P 500; and(3) negative 12.1% for the S&P P/C.
Comparison of Five Year Cumulative Total Return
S&P 500
RNR
S&P P/C
$0.00
$20.00
$40.00
$60.00
$80.00
$100.00
$120.00
$140.00
$160.00
Jan. 1,2004
Dec. 31,2004
Dec. 31,2005
Dec. 31,2006
Dec. 31,2007
Dec. 31,2008
DIVIDEND POLICY
Historically, we have paid dividends on our common shares every quarter, and have increased our dividendduring each of the twelve years since our initial public offering. The Board of Directors of RenaissanceRedeclared regular quarterly dividends of $0.23 per share during 2008 with dividend record dates of March14, June 13, September 15 and December 15, 2008. The Board of Directors declared regular quarterlydividends of $0.22 per share during 2007 with dividend record dates of March 15, June 15, September 14and December 14, 2007. On February 18, 2009, the Board of Directors approved an increased dividend of$0.24 per common share, payable on March 31, 2009, to shareholders of record on March 13, 2009. Thedeclaration and payment of dividends are subject to the discretion of the Board and depend on, amongother things, our financial condition, general business conditions, legal, contractual and regulatoryrestrictions regarding the payment of dividends by us and our subsidiaries and other factors which theBoard may in the future consider to be relevant.
63

ISSUER REPURCHASES OF EQUITY SECURITIES
The Company’s share repurchase program may be effected from time to time, depending on marketconditions and other factors, through open market purchases and privately negotiated transactions. On May20, 2008, the Board of Directors publicly announced an increase in the Company’s authorized sharerepurchase program to $500.0 million. Unless terminated earlier by resolution of the Company’s Board ofDirectors, the program will expire when the Company has repurchased the full value of the sharesauthorized. During the three months ended December 31, 2008, no shares were repurchased under thisprogram. The repurchases reflected below during the three months ended December 31, 2008 exclusivelyrepresent withholdings from employees surrendered in respect of withholding tax obligations on the vestingof restricted stock, or in lieu of cash payments for the exercise price of employee stock options.
Total shares purchasedOther sharespurchased
Shares purchased underrepurchase program
Dollaramount stillavailable
underrepurchase
programShares
purchased
Averageprice per
shareShares
purchased
Averageprice per
shareShares
purchased
Averageprice per
share(in millions)
Beginning dollar amountavailable to berepurchased $ 377.3
January 1 – 31, 2008 2,789,003 $57.23 1,603 $58.11 2,787,400 $57.23 (159.6)February 1 – 29, 2008 509,611 $58.23 711 $53.19 508,900 $58.24 (29.6)March 1 – 31, 2008 1,009,149 $51.75 37,449 $51.15 971,700 $51.77 (50.4)April 1 – 30, 2008 482,759 $52.92 59 $54.47 482,700 $52.92 (25.5)May 1 – 20, 2008 901,050 $51.58 15,750 $52.23 885,300 $51.57 (45.7)May 20, 2008 – increase
authorized sharerepurchase program to$500.0 million 433.5
Dollar amount available to berepurchased 500.0
May 21 – 31, 2008 716,100 $52.22 — $ — 716,100 $52.22 (37.4)June 1 – 30, 2008 83,636 $52.38 36 $52.37 83,600 $52.38 (4.4)July 1 – 31, 2008 1,644,872 $46.56 16,972 $46.62 1,627,900 $46.56 (75.8)August 1 – 31, 2008 703 $50.92 703 $50.92 — $ — —September 1 – 30, 2008 7,301 $51.07 7,301 $51.07 — $ — —October 1 – 31, 2008 646 $45.29 646 $45.29 — $ — —November 1 – 30, 2008 4,638 $44.90 4,638 $44.90 — $ — —December 1 – 31, 2008 443 $44.36 443 $44.36 — $ — —
Total 8,149,911 $53.08 86,311 $50.18 8,063,600 $53.11 $ 382.4
In the future, the Company may adopt additional trading plans or authorize purchase activities under theremaining authorization, which the Board may increase in the future. See Note 13 of our Notes toConsolidated Financial Statements for information regarding our stock repurchase program.
64

ITEM 6. SELECTED CONSOLIDATED FINANCIAL DATA
The following tables set forth our selected financial data and other financial information at the end of and foreach of the years in the five-year period ended December 31, 2008. This historical financial informationwas prepared in accordance with GAAP. The consolidated statement of operations data for the years endedDecember 31, 2008, 2007, 2006, 2005 and 2004 and the balance sheet data at December 31, 2008,2007, 2006, 2005 and 2004 were derived from our consolidated financial statements. You should read theselected financial data in conjunction with our consolidated financial statements and related notes theretoand “Management’s Discussion and Analysis of Financial Condition and Results of Operations” included inthis filing and all other information appearing elsewhere or incorporated into this filing by reference.
Year ended December 31, 2008 2007 2006 2005 2004(in thousands, except share andper share data and percentages)
Statement of Operations Data:Gross premiums written $1,736,028 $1,809,637 $1,943,647 $1,809,128 $1,544,157Net premiums written 1,353,620 1,435,335 1,529,620 1,543,287 1,349,287Net premiums earned 1,386,824 1,424,369 1,529,777 1,402,709 1,338,227Net investment income 24,231 402,463 318,106 217,252 162,722Net realized (losses) gains on sales of
investments (206,314) 1,293 (34,464) (6,962) 23,442Net claims and claim expenses incurred 760,489 479,274 446,230 1,635,656 1,096,299Acquisition costs 213,553 254,930 280,697 237,594 244,930Operational expenses 122,165 110,464 109,586 85,838 56,361Underwriting income (loss) 290,617 579,701 693,264 (556,379) (59,363)Income (loss) before taxes 29,588 594,004 798,045 (246,763) 168,245Net (loss) income (attributable) available
to common shareholders (13,280) 569,575 761,635 (281,413) 133,108(Loss) earnings per common share –
diluted (1) (0.21) 7.93 10.57 (3.99) 1.85Dividends per common share 0.92 0.88 0.84 0.80 0.76Weighted average common shares
outstanding – diluted (1) 62,531 71,825 72,073 70,592 71,774Return on average common equity (0.5%) 20.9% 36.3% (13.6%) 6.2%Combined ratio 79.0% 59.3% 54.7% 139.7% 104.4%
At December 31, 2008 2007 2006 2005 2004
Balance Sheet Data:Total investments $6,042,582 $6,634,348 $6,342,805 $5,291,153 $4,826,249Total assets 7,984,051 8,286,355 7,769,026 6,871,261 5,526,318Reserve for claims and claim expenses 2,160,612 2,028,496 2,098,155 2,614,551 1,459,398Reserve for unearned premiums 510,235 563,336 578,424 501,744 365,335Debt 450,000 451,951 450,000 500,000 350,000Capital leases 26,292 2,533 2,742 2,931 —Subordinated obligation to capital trust — — 103,093 103,093 103,093Preferred shares 650,000 650,000 800,000 500,000 500,000Total shareholders’ equity attributable to
common shareholders 2,382,743 2,827,503 2,480,497 1,753,840 2,144,042Total shareholders’ equity 3,032,743 3,477,503 3,280,497 2,253,840 2,644,042Common shares outstanding 61,503 68,920 72,140 71,523 71,029
Book value per common share $ 38.74 $ 41.03 $ 34.38 $ 24.52 $ 30.19Accumulated dividends 7.92 7.00 6.12 5.28 4.48
Book value per common share plusaccumulated dividends $ 46.66 $ 48.03 $ 40.50 $ 29.80 $ 34.67
Change in book value per common shareplus accumulated dividends (2.9%) 18.6% 35.9% (14.0%) 4.0%
(1) (Loss) earnings per common share – diluted was calculated by dividing net (loss) income (attributable) available tocommon shareholders by the number of weighted average common shares and common share equivalentsoutstanding. Common share equivalents are calculated on the basis of the treasury stock method. In accordancewith FAS 128, diluted (loss) earnings per share calculations use weighted average common shares outstanding –basic, when in a net loss position.
65

Years ended December 31, 2008 2007 2006 2005 2004(in thousands, except ratios)
Segment Information:
ReinsuranceGross premiums written (1) $1,154,391 $1,290,420 $1,321,163 $1,202,975 $1,084,896Net premiums written 871,893 1,024,493 1,039,103 1,024,010 930,946Underwriting income (loss) 281,625 528,659 636,236 (461,540) 46,389Net claims and claim expense
ratio 48.5% 25.2% 15.2% 132.2% 79.0%Underwriting expense ratio 20.5% 19.6% 19.3% 16.5% 16.1%
Combined ratio 69.0% 44.8% 34.5% 148.7% 95.1%
Individual RiskGross premiums written $ 587,309 $ 556,594 $ 689,392 $ 651,430 $ 478,092Net premiums written 481,727 410,842 490,517 519,277 418,341Underwriting income (loss) 8,992 51,042 57,028 (94,839) (105,752)Net claims and claim expense
ratio 67.0% 51.0% 53.5% 84.1% 89.0%Underwriting expense ratio 31.1% 38.1% 36.3% 36.7% 37.9%
Combined ratio 98.1% 89.1% 89.8% 120.8% 126.9%
TotalGross premiums written $1,736,028 $1,809,637 $1,943,647 $1,809,128 $1,544,157Net premiums written 1,353,620 1,435,335 1,529,620 1,543,287 1,349,287Underwriting income (loss) 290,617 579,701 693,264 (556,379) (59,363)Net claims and claim expense
ratio 54.8% 33.6% 29.2% 116.6% 81.9%Underwriting expense ratio 24.2% 25.7% 25.5% 23.1% 22.5%
Combined ratio 79.0% 59.3% 54.7% 139.7% 104.4%
(1) Includes $5.7 million, $37.4 million, $66.9 million, $45.3 million and $18.8 million of premiumassumed from our Individual Risk segment in the years ended December 31, 2008, 2007, 2006, 2005and 2004, respectively.
66

ITEM 7. MANAGEMENT’S DISCUSSION AND ANALYSIS OF FINANCIAL CONDITION AND RESULTS OFOPERATIONS
The following is a discussion and analysis of our results of operations for the year ended December 31,2008, compared with the years ended December 31, 2007 and 2006. The following also includes adiscussion of our liquidity and capital resources at December 31, 2008. This discussion and analysisshould be read in conjunction with the audited consolidated financial statements and related notes includedin this filing. This filing contains forward-looking statements that involve risks and uncertainties. Actualresults may differ materially from the results described or implied by these forward-looking statements. See“Note on Forward-Looking Statements.”
OVERVIEW
RenaissanceRe, established in Bermuda in 1993 to write principally property catastrophe reinsurance, istoday a leading global provider of reinsurance and insurance coverages and related services. Through ouroperating subsidiaries, we seek to obtain a portfolio of reinsurance, insurance and financial risks in each ofour businesses that are significantly better than the market average and produce an attractive return onequity. We accomplish this by leveraging our core capabilities of risk assessment and informationmanagement, and by investing in our capabilities to serve our customers across the cycles that havehistorically characterized our markets. Overall, our strategy focuses on superior risk selection, marketing,capital management and joint ventures. We provide value to our clients and joint venture partners in theform of financial security, innovative products, and responsive service. We are known as a leader in payingvalid reinsurance claims promptly. We principally measure our financial success through long-term growthin tangible book value per common share plus accumulated dividends, which we believe is the mostappropriate measure of our Company’s performance, and believe we have delivered superior performancein respect of this measure over time.
Since a substantial portion of the reinsurance and insurance we write provides protection from damagesrelating to natural and man-made catastrophes, our results depend to a large extent on the frequency andseverity of such catastrophic events, and the coverages we offer to clients affected by these events. We areexposed to significant losses from these catastrophic events and other exposures that we cover.Accordingly, we expect a significant degree of volatility in our financial results and our financial results mayvary significantly from quarter-to-quarter or from year-to-year, based on the level of insured catastrophiclosses occurring around the world.
Our revenues are principally derived from three sources: 1) net premiums earned from the reinsurance andinsurance policies we sell; 2) net investment income and realized gains from the investment of our capitalfunds and the investment of the cash we receive on the policies which we sell; and 3) other incomereceived from our joint ventures, advisory services, weather-trading activities and various other items.
Our expenses primarily consist of: 1) net claims and claim expenses incurred on the policies of reinsuranceand insurance we sell; 2) acquisition costs which typically represent a percentage of the premiums wewrite; 3) operating expenses which primarily consist of personnel expenses, rent and other operatingexpenses; 4) corporate expenses which include certain executive, legal and consulting expenses, costs forresearch and development, and other miscellaneous costs associated with operating as a publicly tradedcompany; 5) minority interest, which represents the interest of third parties with respect to the net incomeof DaVinciRe; and 6) interest and dividend costs related to our debt, preference shares and subordinatedobligation to our capital trust. We are also subject to taxes in certain jurisdictions in which we operate;however, since the majority of our income is currently earned in Bermuda, a non-taxable jurisdiction, thetax impact to our operations has historically been minimal. We currently expect our growth outside ofBermuda to result in a higher effective tax rate in future periods.
The operating results, also known as the underwriting results, of an insurance or reinsurance company arediscussed frequently by reference to its net claims and claim expense ratio, underwriting expense ratio, andcombined ratio. The net claims and claim expense ratio is calculated by dividing net claims and claimexpenses incurred by net premiums earned. The underwriting expense ratio is calculated by dividingunderwriting expenses (acquisition expenses and operational expenses) by net premiums earned. Thecombined ratio is the sum of the net claims and claim expense ratio and the underwriting expense ratio. A
67

combined ratio below 100% generally indicates profitable underwriting prior to the consideration ofinvestment income. A combined ratio over 100% generally indicates unprofitable underwriting prior to theconsideration of investment income. We also discuss our net claims and claim expense ratio on an accidentyear basis. This ratio is calculated by taking net claims and claim expenses, excluding development on netclaims and claim expenses from events that took place in prior fiscal years, divided by net premiumsearned.
We conduct our business through two reportable segments, Reinsurance and Individual Risk. Thosesegments are more fully described as follows:
Reinsurance
Our Reinsurance segment has three main units:
1) Property catastrophe reinsurance, written for our own account and for DaVinci, is our traditionalcore business. We believe we are one of the world’s leading providers of this coverage, based oncatastrophe gross premiums written. This coverage protects against large natural catastrophes,such as earthquakes, hurricanes and tsunamis, as well as claims arising from other natural andman-made catastrophes such as winter storms, freezes, floods, fires, wind storms, tornadoes,explosions and acts of terrorism. We offer this coverage to insurance companies and otherreinsurers primarily on an excess of loss basis. This means that we begin paying when ourcustomers’ claims from a catastrophe exceed a certain retained amount.
2) Specialty reinsurance, written for our own account and for DaVinci, covering certain targetedclasses of business where we believe we have a sound basis for underwriting and pricing the riskthat we assume. Our portfolio includes various classes of business, such as catastrophe exposedworkers’ compensation, surety, terrorism, medical malpractice, catastrophe exposed personallines property, casualty clash, catastrophe exposed personal lines property, certain other casualtylines and other specialty lines of reinsurance that we collectively refer to as specialty reinsurance.We believe that we are seen as a market leader in certain of these classes of business, such ascasualty clash, surety, catastrophe-exposed workers’ compensation and terrorism.
3) Through our ventures unit, we pursue joint ventures and other strategic relationships. Our fourprincipal business activities in this area are: 1) property catastrophe joint ventures which wemanage, such as Top Layer Re and DaVinci; 2) strategic investments in other market participants,such as our investments in ChannelRe, Platinum and the Tower Hill Companies, where, ratherthan assuming exclusive management responsibilities ourselves, we partner with other marketparticipants; 3) weather and energy products and trading activities; and 4) fee-based consultingservices, research and development and loss and mitigation activities. Only business activities thatappear in our consolidated underwriting results, such as DaVinci and certain reinsurancetransactions, are included in our Reinsurance segment results; our share of the results of ourinvestments in other ventures, accounted for under the equity method and our weather-relatedactivities are included in the “Other” category of our segment results.
Individual Risk
We define our Individual Risk segment to include underwriting that involves understanding thecharacteristics of the original underlying insurance policy. Our principal contracts include insurance policiesand quota share reinsurance with respect to risks including: 1) multi-peril crop, which includes multi-perilcrop insurance, crop hail and other named peril agriculture risk management products; 2) commercialproperty, which principally includes catastrophe-exposed commercial property products; 3) commercialmulti-line, which includes commercial property and liability coverage, such as general liability, automobileliability and physical damage, building and contents, professional liability and various specialty products;and 4) personal lines property, which principally includes homeowners personal lines property coverageand catastrophe exposed personal lines property coverage.
Our Individual Risk business is primarily produced through four distribution channels: 1) a wholly ownedprogram manager – where we write primary insurance through our own subsidiary; 2) third party programmanagers – where we write primary insurance through third party program managers, who produce
68

business pursuant to agreed-upon underwriting guidelines and provide related back-office functions; 3)quota share reinsurance – where we write quota share reinsurance with primary insurers who, similar to ourthird party program managers, provide most of the back-office and support functions; and 4) brokers andagents – where we write primary insurance produced through licensed intermediaries on a risk-by-riskbasis.
Our Individual Risk business is written by the Glencoe Group through its principal operating subsidiariesGlencoe and Lantana, which write on an excess and surplus lines basis, and through Stonington andStonington Lloyds, which write on an admitted basis. Since the inception of our Individual Risk business, wehave substantially relied on third parties for services including the generation of premium, the issuance ofpolicies and the processing of claims. We actively oversee our third party partners through an operationsreview team at Glencoe Specialty Services, which conducts initial due diligence as well as ongoingmonitoring. We have been investing in initiatives to strengthen our operating platform, enhance our internalcapabilities, and expand the resources we commit to our Individual Risk operations. In furtherance of theseinitiatives, we completed the acquisition of substantially all the net assets of Agro National, LLC and CMS in2008, as further described below.
Acquisitions
On June 2, 2008, the Company acquired substantially all the assets and assumed certain liabilities of AgroNational, LLC. Agro National is based in Council Bluffs, Iowa and is a managing general underwriter ofmulti-peril crop insurance. Agro National offers high quality risk protection products and services to theagricultural community throughout the U.S. Agro National participates in the U.S. Federal government’sMulti-Peril Crop Insurance Program and has been writing business on behalf of Stonington, a wholly ownedsubsidiary of the Company, since 2004. The base purchase price paid by the Company was $80.5 million,plus additional amounts as determined in accordance with the terms of the asset purchase agreement. Inconnection with the purchase, the Company recorded $46.3 million of intangible assets and $20.4 millionof goodwill. The acquisition was undertaken to purchase the distribution channel for the Company’s multi-peril crop insurance business which was previously conducted through a managing general agencycontractual relationship with Agro National, LLC. Other factors that added to the value of Agro National, LLCincluded its agent relationships, systems and technology, brand name and workforce. These factorsresulted in a purchase price greater than the fair value of the net assets acquired and the recognition ofgoodwill and intangible assets. The acquisition of the net assets was accounted for using the purchasemethod in accordance with FASB Statement No. 141, Business Combinations (“FAS 141”).
Effective April 1, 2008, the Company purchased substantially all the assets of CMS. CMS was subsequentlyrenamed Glencoe Claims. Glencoe Claims is based in Roswell, Georgia and is a privately held companyspecializing in claims administration, adjusting and consulting services for insurance companies, managinggeneral agents, self-insured clients, fronted programs and clients with substantial retentions or deductibles.Glencoe Claims has a proprietary network of licensed adjusters and offers services on a national basis. TheCompany uses Glencoe Claims for claims services solely for its own business and Glencoe Claims is notcurrently providing claims services to third parties. The base purchase price paid by the Company was $3.8million, plus additional amounts as determined in accordance with the terms of the asset purchaseagreement. In connection with the purchase, the Company acquired net assets with a fair value of $0.5million and recorded $3.3 million of goodwill. Goodwill is estimated to have an indefinite life and is recordedentirely in the Company’s Individual Risk segment.
In addition to the Company’s $10.0 million investment in Tower Hill during 2005, the Company invested$50.0 million on July 1, 2008, representing a 25.0% equity interest, in the Tower Hill Companies. TheTower Hill Companies operate primarily in the State of Florida. THIG is a managing general agencyspecializing in insurance coverage for site built and manufactured homes. THCS and THCM provide claimadjustment services through exclusive agreements with THIG. The investment in the Tower Hill Companieswas undertaken to expand the Company’s core platforms by obtaining ownership in an additionaldistribution channel for the Florida homeowners market and to enhance relationships with otherstakeholders. Other factors that added to the value of the Tower Hill Companies included its reputation,agent relationships, systems and technology. These factors resulted in an investment greater than the fair
69

value of the net assets acquired and the recognition of goodwill and intangible assets. In connection withthe investment, the Company recorded $40.0 million of intangible assets and $7.8 million of goodwill on theJuly 1, 2008 effective date. The investment in the Tower Hill Companies was accounted for using the equitymethod in accordance with Accounting Principles Board Opinion 18, The Equity Method of Accounting forInvestments in Common Stock (“APB 18”) and as such, the goodwill and intangible assets are recordedunder “Investments in other ventures, under equity method” in the Company’s consolidated balance sheetat December 31, 2008.
New Business
In addition to the potential growth of our existing reinsurance and insurance businesses, from time to timewe consider diversification into new ventures, either through organic growth, the formation of new jointventures, or the acquisition of or the investment in other companies or books of business of othercompanies. This potential diversification includes opportunities to write targeted, additional classes of risk-exposed business, both directly for our own account and through possible new joint venture opportunities.We also regularly evaluate opportunities to grow our business by utilizing our skills, capabilities, proprietarytechnology and relationships to expand into further risk-related coverages, services and products. Generally,we focus on underwriting or trading risks where reasonably sufficient data may be available, and where ouranalytical abilities may provide us a competitive advantage, in order for us to seek to model estimatedprobabilities of losses and returns in accordance with our approach in respect of our current portfolio ofrisks. We also regularly review potential new investments, in both operating entities and financialinstruments. We believe the current period of market dislocation may have increased the prospects that wecan deploy capital in such initiatives at attractive expected rates of return.
In evaluating potential new ventures or investments, we generally seek an attractive return on equity, theability to develop or capitalize on a competitive advantage, and opportunities which we believe will notdetract from our core Reinsurance and Individual Risk operations. Accordingly, we regularly review strategicopportunities and periodically engage in discussions regarding possible transactions, although there can beno assurance that we will complete any such transactions or that any such transaction would be successfulor contribute materially to our results of operations or financial condition. We believe that our ability topotentially attract investment and operational opportunities is supported by our strong reputation andfinancial resources, and by the capabilities and track record of our ventures unit.
Summary of Critical Accounting Estimates
Claims and Claim Expense Reserves
General Description
We believe the most significant accounting judgment made by management is our estimate of claims andclaim expense reserves. Claims and claim expense reserves represent estimates, including actuarial andstatistical projections at a given point in time, of the ultimate settlement and administration costs for unpaidclaims and claim expenses arising from the insurance and reinsurance contracts we sell. We establish ourclaims and claim expense reserves by taking claims reported to us by insureds and ceding companies, butwhich have not yet been paid (“case reserves”), adding the costs for additional case reserves (“additionalcase reserves”) which represent our estimates for claims previously reported to us which we believe maynot be adequately reserved as of that date, and adding estimates for the anticipated cost of claims incurredbut not yet reported to us (“IBNR”).
70

The following table summarizes our claims and claim expense reserves by line of business and splitbetween case reserves, additional case reserves and IBNR at December 31, 2008 and 2007:
At December 31, 2008Case
ReservesAdditional Case
Reserves IBNR Total(in thousands)
Property catastrophe reinsurance $312,944 $297,279 $ 250,946 $ 861,169Specialty reinsurance 113,953 135,345 387,352 636,650
Total Reinsurance 426,897 432,624 638,298 1,497,819Individual Risk 253,327 14,591 394,875 662,793
Total $680,224 $447,215 $1,033,173 $2,160,612
At December 31, 2007(in thousands)
Property catastrophe reinsurance $275,436 $287,201 $ 204,487 $ 767,124Specialty reinsurance 109,567 93,280 448,756 651,603
Total Reinsurance 385,003 380,481 653,243 1,418,727Individual Risk 237,747 10,359 361,663 609,769
Total $622,750 $390,840 $1,014,906 $2,028,496
Our estimates of claims and claim expense reserves are not precise in that, among other matters, they arebased on predictions of future developments and estimates of future trends and other variable factors.Some, but not all, of our reserves are further subject to the uncertainty inherent in actuarial methodologiesand estimates. Because a reserve estimate is simply an insurer’s estimate at a point in time of its ultimateliability, and because there are numerous factors which affect reserves and claims payments but cannot bedetermined with certainty in advance, our ultimate payments will vary, perhaps materially, from ourestimates of reserves. If we determine in a subsequent period that adjustments to our previouslyestablished reserves are appropriate, such adjustments are recorded in the period in which they areidentified. During the twelve months ended December 31, 2008, 2007 and 2006, changes to prior yearestimated claims reserves increased our net income by $234.8 million, $233.2 million and $136.6 million,respectively, excluding the consideration of changes in reinstatement premium, profit commissions,DaVinciRe minority interest and income tax expense.
Our reserving methodology for each line of business uses a loss reserving process that calculates a pointestimate for the Company’s ultimate settlement and administration costs for claims and claim expenses. Wedo not calculate a range of estimates. We use this point estimate, along with paid claims and case reserves,to record our best estimate of additional case reserves and IBNR in our financial statements. Under GAAP,we are not permitted to establish estimates for catastrophe claims and claim expense reserves until anevent occurs that gives rise to a loss.
Reserving for our reinsurance claims involves other uncertainties, such as the dependence on informationfrom ceding companies, which among other matters, includes the time lag inherent in reporting informationfrom the primary insurer to us or to our ceding companies and differing reserving practices among cedingcompanies. The information received from ceding companies is typically in the form of bordereaux, brokernotifications of loss and/or discussions with ceding companies or their brokers. This information can bereceived on a monthly, quarterly or transactional basis and normally includes estimates of paid claims andcase reserves. We sometimes also receive an estimate or provision for IBNR. This information is oftenupdated and adjusted from time-to-time during the loss settlement period as new data or facts in respect ofinitial claims, client accounts, industry or event trends may be reported or emerge in addition to changes inapplicable statutory and case laws.
Included in our results for 2008 are $468.0 million of net claims and claim expenses incurred as a result oflosses arising from hurricanes Gustav and Ike which struck the United States in the third quarter of 2008.Our estimates of losses from hurricanes Gustav and Ike are based on factors including currently availableinformation derived from the Company’s preliminary claims information from certain clients and brokers,
71

industry assessments of losses from the events, proprietary models, and the terms and conditions of ourcontracts. Given the magnitude and recent occurrence of these events, meaningful uncertainty remainsregarding total covered losses for the insurance industry and, accordingly, several of the key assumptionsunderlying our loss estimates. In addition, actual losses from these events may increase if our reinsurers orother obligors fail to meet their obligations. Our actual losses from these events will likely vary, perhapsmaterially, from these current estimates due to the inherent uncertainties in reserving for such losses,including the preliminary nature of the available information, the potential inaccuracies and inadequacies inthe data provided by clients and brokers, the inherent uncertainty of modeling techniques and theapplication of such techniques, the effects of any demand surge on claims activity and complex coverageand other legal issues.
Included in our results for 2007 are $157.5 million of net claims and claim expenses from Kyrill and theU.K. flood losses which occurred in 2007, as well as $60.0 million in estimated losses associated withexposure to sub-prime related casualty losses. Estimates of these losses are based on a review of potentiallyexposed contracts, information reported by and discussions with counterparties, and the Company’sestimate of losses related to those contracts and are subject to change as more information is reported andbecomes available. Such information is frequently reported more slowly, and with less initial accuracy, withrespect to non-U.S. events such as Kyrill and the U.K. floods than with large U.S. catastrophe losses. Inaddition, the sub-prime related casualty net claims and claim expenses are based on underlying liabilitycontracts which are considered “long-tail” business, and will therefore take many years before the actuallosses are known and reported, which increases the uncertainty with respect to the estimate for ultimatelosses for this event. The net claims and claim expenses from Kyrill, the U.K. floods and sub-prime relatedcasualty losses are all attributable to the Company’s Reinsurance segment.
During 2005, we incurred significant losses from hurricanes Katrina, Rita and Wilma. Our estimates of theselosses are based on factors including currently available information derived from claims information fromour clients and brokers, industry assessments of losses from the events, proprietary models and the termsand conditions of our contracts. In particular, due to the size and unusual complexity of certain legal andclaims issues, particularly but not exclusively relating to hurricane Katrina, meaningful uncertainty remainsregarding total covered losses for the insurance industry and, accordingly, our loss estimates. Our actuallosses from these events will likely vary, perhaps materially, from our current estimates due to the inherentuncertainties in reserving for such losses, the potential inaccuracies and inadequacies in the data providedby clients and brokers, the inherent uncertainty of modeling techniques and the application of suchtechniques, and complex coverage and other legal issues.
Because of the inherent uncertainties discussed above, we have developed a reserving philosophy whichattempts to incorporate prudent assumptions and estimates, and we have generally experienced favorabledevelopment on prior year reserves in the last several years. However, there is no assurance that this willoccur in future periods.
Our reserving techniques, assumptions and processes differ between our Reinsurance and Individual Risksegments, as well as between our property catastrophe reinsurance and specialty reinsurance businesseswithin our Reinsurance segment. Following is a discussion of the risks we insure and reinsure, the reservingtechniques, assumptions and processes we follow to estimate our claims and claim expense reserves, andour current estimates versus our initial estimates of our claims reserves, for each of these units.
Reinsurance Segment
Property Catastrophe Reinsurance
Within our property catastrophe reinsurance unit, we principally write property catastrophe excess of lossreinsurance contracts to insure insurance and reinsurance companies against natural and man-madecatastrophes. Under these contracts, we indemnify an insurer or reinsurer when its aggregate paid claimsand claim expenses from a single occurrence of a covered peril exceed the attachment point specified inthe contract, up to an amount per loss specified in the contract. Our most significant exposure is to lossesfrom earthquakes and hurricanes and other windstorms, although we are also exposed to claims arisingfrom other catastrophes, such as tsunamis, freezes, floods, fires, tornadoes, explosions and acts of
72

terrorism. Our predominant exposure under such coverage is to property damage. However, other risks,including business interruption and other non-property losses, may also be covered under our propertycatastrophe reinsurance contracts when arising from a covered peril. Our coverages are offered on either aworldwide basis or are limited to selected geographic areas.
Coverage can also vary from “all property” perils to limited coverage on selected perils, such as “earthquakeonly” coverage. We also enter into retrocessional contracts that provide property catastrophe coverage toother reinsurers or retrocedants. This coverage is generally in the form of excess of loss retrocessionalcontracts and may cover all perils and exposures on a worldwide basis or be limited in scope to selectedgeographic areas, perils and/or exposures. The exposures we assume from retrocessional business canchange within a contract term as the underwriters of a retrocedant may alter their book of business after theretrocessional coverage has been bound. We also offer dual trigger reinsurance contracts which require usto pay claims based on claims incurred by insurers and reinsurers in addition to the estimate of insuredindustry losses as reported by referenced statistical reporting agencies.
Our property catastrophe reinsurance business is generally characterized by loss events of low frequencyand high severity. Initial reporting of paid and incurred claims in general, tends to be relatively prompt. Weconsider this business “short-tail” as compared to the reporting of claims for “long-tail” products, whichtends to be slower. However, the timing of claims payment and reporting also varies depending on variousfactors, including: whether the claims arise under reinsurance of primary insurance companies orreinsurance of other reinsurance companies; the nature of the events (e.g., hurricanes, earthquakes orterrorism); the geographic area involved; post-event inflation which may cause the cost to repair damagedproperty to increase significantly from current estimates, or for property claims to remain open for a longerperiod of time, due to limitations on the supply of building materials, labor and other resources; and thequality of each client’s claims management and reserving practices. Management’s judgments regardingthese factors are reflected in our claims reserve estimates.
Reserving for substantially all of our property catastrophe reinsurance business does not involve the use oftraditional actuarial techniques. Rather, claims and claim expense reserves are estimated by managementafter a catastrophe occurs by completing an in-depth analysis of the individual contracts which maypotentially be impacted by the catastrophic event. The in-depth analysis generally involves: 1) estimatingthe size of insured industry losses from the catastrophic event; 2) reviewing our portfolio of reinsurancecontracts to identify those contracts which are exposed to the catastrophic event; 3) reviewing informationreported by clients and brokers; 4) discussing the event with our clients and brokers; and 5) estimating theultimate expected cost to settle all claims and administrative costs arising from the catastrophic event on acontract-by-contract basis and in aggregate for the event. Once an event has occurred, during the thencurrent reporting period we record our best estimate of the ultimate expected cost to settle all claims arisingfrom the event. Our estimate of claims and claim expense reserves is then determined by deductingcumulative paid losses from our estimate of the ultimate expected loss for an event and our estimate ofIBNR is determined by deducting cumulative paid losses, case reserves and additional case reserves fromour estimate of the ultimate expected loss for an event. Once we receive a notice of loss or payment requestunder a catastrophe reinsurance contract, we are generally able to process and pay such claims promptly.
Because the events from which claims arise under policies written by our property catastrophe reinsurancebusiness are typically prominent, public occurrences such as hurricanes and earthquakes, we are oftenable to use independent reports as part of our loss reserve estimation process. We also review catastrophebulletins published by various statistical reporting agencies to assist us in determining the size of theindustry loss, although these reports may not be available for some time after an event. In addition to theloss information and estimates communicated by cedants and brokers, we also use industry informationwhich we gather and retain in our REMS© modeling system. The information stored in our REMS© modelingsystem enables us to analyze each of our policies in relation to a loss and compare our estimate of the losswith those reported by our policyholders. The REMS© modeling system also allows us to compare andanalyze individual losses reported by policyholders affected by the same loss event. Although the REMS©
modeling system assists with the analysis of the underlying loss and provides us with the information andability to perform increased analysis, the estimation of claims resulting from catastrophic events isinherently difficult because of the variability and uncertainty associated with property catastrophe claimsand the unique characteristics of each loss.
73

For smaller events including localized severe weather events such as windstorms, hail, ice, snow, flooding,freezing and tornadoes, which are not necessarily prominent, public occurrences, we initially place greaterreliance on catastrophe bulletins published by statistical reporting agencies to assist us in determining whatevents occurred during the reporting period than we do for large events. This includes reviewingCatastrophe Bulletins published by Property Claim Services for U.S. catastrophes. We set our initialestimates of reserves for claims and claim expenses for these smaller events based on a combination of ourhistorical market share for these types of losses and the estimate of the total insured industry propertylosses as reported by statistical reporting agencies, although we generally make significant adjustmentsbased on our current exposure to the geographic region involved as well as the size of the loss and the perilinvolved. This approach supplements our approach for estimating losses for larger catastrophes, which asdiscussed above, includes discussions with brokers and ceding companies, reviewing individual contractsimpacted by the event, and modeling the loss in our REMS© system.
In general, our property catastrophe reinsurance reserves for our more recent reinsured catastrophic eventsare subject to greater uncertainty and, therefore, greater potential variability, and are likely to experiencematerial changes from one period to the next. This is due to the uncertainty as to the size of the industrylosses from the event, uncertainty as to which contracts have been exposed to the catastrophic event,uncertainty due to complex legal and coverage issues that can arise out of large or complex catastrophicevents such as the events of September 11, 2001 and hurricane Katrina, and uncertainty as to themagnitude of claims incurred by our clients. As our property catastrophe reinsurance claims age, moreinformation becomes available and we believe our estimates become more certain, although there is noassurance this trend will continue in the future. As seen in the Actual vs. Initial Estimated PropertyCatastrophe Reinsurance Claims and Claim Expense Reserve Analysis table below, 68.8% of our inceptionto date claims and claim expenses in our property catastrophe reinsurance unit were incurred in the 2004,2005 and 2008 accident years, due principally to the losses from hurricanes Charley, Frances, Ivan,Jeanne, Katrina, Rita, Wilma, Gustav and Ike. Due to the size and complexity of the losses in these accidentyears, there still remains significant uncertainty as to the ultimate settlement costs associated with theseaccident years.
Within our property catastrophe reinsurance business, we seek to review substantially all of our claims andclaim expense reserves quarterly. Our quarterly review procedures include identifying events that haveoccurred up to the latest balance sheet date, determining our best estimate of the ultimate expected cost tosettle all claims and administrative costs associated with those new events which have arisen during thereporting period, and reviewing the ultimate expected cost to settle claims and administrative costsassociated with those events which occurred during previous periods. This process is judgmental in that itinvolves reviewing changes in paid and reported losses each period and adjusting our estimates of theultimate expected losses for each event if there are developments that are different from our previousexpectations. If we determine that adjustments to an earlier estimate are appropriate, such adjustments arerecorded in the period in which they are identified. During the twelve months ended December 31, 2008,2007 and 2006, changes to our prior year estimated claims reserves in our property catastrophereinsurance unit increased our net income by $131.6 million, increased our net income $93.1 million, anddecreased our net income by $13.9 million, respectively, excluding the consideration of changes inreinstatement premium, profit commissions, minority interest and income tax expense.
Actual Results vs. Initial Estimates
The table below summarizes our initial assumptions and changes in those assumptions for claims andclaim expense reserves within our property catastrophe reinsurance unit. As discussed above, the keyassumption in estimating reserves for our property catastrophe reinsurance unit is our estimate of ultimateclaims and claim expenses. The table shows our initial estimates of ultimate claims and claim expenses foreach accident year and how these initial estimates have developed over time. The initial estimate ofaccident year claims and claim expenses represents our estimate of the ultimate settlement andadministration costs for claims incurred from catastrophic events occurring during a particular accidentyear, and as reported as of December 31 of that year. The re-estimated ultimate claims and claim expensesas of December 31, 2006, 2007 and 2008, represent our revised estimates as reported as of those dates.The cumulative favorable (adverse) development shows how our most recent estimates as reported at
74

December 31, 2008 differ from our initial accident year estimates. Favorable development implies that ourcurrent estimates are lower than our initial estimates while adverse development implies that our currentestimates are higher than our original estimates. Total reserves as of December 31, 2008 reflect the unpaidportion of our estimates of ultimate claims and claim expenses. The table is presented on a gross basis andtherefore does not include the benefit of reinsurance recoveries. It also does not consider the impact of lossrelated premium or DaVinciRe minority interest.
Actual vs. Initial Estimated Property Catastrophe Reinsurance Claims and Claim Expense Reserve Analysis
(in thousands,except percentages)
Accident Year
InitialEstimate ofAccident
Year Claimsand ClaimExpenses
Re-estimated Claims andClaim Expenses
as of December 31,
CumulativeFavorable(Adverse)
Development
% Decrease(Increase) of
CurrentUltimate
Claims andClaim
ExpenseReserves as ofDecember 31,
2008
% of Claimsand ClaimExpenses
Unpaid as ofDecember 31,
20082006 2007 2008
1994 $ 100,816 $ 137,623 $ 137,491 $ 137,396 $(36,580) (36.3)% $ 2,624 1.9%1995 72,561 64,236 64,234 64,086 8,475 11.7 489 0.81996 67,671 45,955 45,868 45,855 21,816 32.2 4 0.01997 43,050 7,213 7,200 7,203 35,847 83.3 21 0.31998 129,171 154,943 154,797 154,701 (25,530) (19.8) 3,251 2.11999 267,981 215,420 209,540 207,884 60,097 22.4 10,827 5.22000 54,600 19,334 19,118 18,793 35,807 65.6 683 3.62001 257,285 226,261 225,486 220,220 37,065 14.4 28,747 13.12002 155,573 75,967 74,589 73,353 82,220 52.8 9,805 13.42003 126,312 79,099 77,042 76,736 49,576 39.2 9,513 12.42004 762,392 857,537 851,586 846,652 (84,260) (11.1) 46,445 5.52005 1,473,974 1,501,226 1,461,140 1,380,484 93,490 6.3 180,279 13.12006 121,754 121,754 77,093 63,153 58,601 48.1 3,561 5.62007 245,892 — 245,892 210,447 35,445 14.4 121,503 57.72008 599,481 — — 599,481 — — 443,417 74.0
$4,478,513 $3,506,568 $3,651,076 $4,106,444 $372,069 9.6% $861,169 21.0%
As quantified in the table above, since the inception of the Company in 1993 we have experienced $372.1million of cumulative favorable development on the run-off of our gross reserves within our propertycatastrophe reinsurance unit. This represents 9.6% of our initial estimated gross claims and claim expensesfor accident years 2007 and prior of $3.9 billion and is calculated based on our estimates of claims andclaim expense reserves as of December 31, 2008, compared to our initial estimates of ultimate claims andclaim expenses, as of the end of each accident year. As described above, given the complexity in reservingfor claims and claims expenses associated with catastrophe losses for property catastrophe excess of lossreinsurance contracts, we have experienced development, both favorable and unfavorable, in any givenaccident year in amounts that exceed our inception to date percentage of 9.6%. For example, our 1997accident year developed favorably by $35.8 million, which is 83.3% better than our initial estimates ofclaims and claim expenses for the 1997 accident year as estimated as of December 31, 1997, while our1994 accident year developed unfavorably by $36.6 million, or 36.3%. On a net basis our cumulativefavorable or unfavorable development is generally reduced by offsetting changes in our reinsurancerecoverables, as well as changes to loss related premiums such as reinstatement premiums, and minorityinterest for changes in claims and claim expenses that impact DaVinciRe, all of which generally move in theopposite direction to changes in our ultimate claims and claim expenses.
The percentage of claims unpaid at December 31, 2008 for each accident year reflects both the speed atwhich claims and claim expenses for each accident year have been paid and our estimate of claims andclaim expenses for that accident year. As seen above, claims and claim expenses for the 2004 accidentyear have to date been paid quickly compared to prior accident years. This is due to the fact thathurricanes Charley, Frances, Ivan and Jeanne which occurred in 2004 have been rapid claims payingevents. This is driven in part by the mix of our business in Florida, which primarily includes propertycatastrophe excess of loss reinsurance for personal lines property coverage, rather than commercial
75

property coverage or retrocessional coverage, and the speed of the settlement and payment of claims byour underlying cedants. In contrast, our 2001 accident year, which includes losses from the events ofSeptember 11, 2001, and our 2005 accident year, which includes significant losses from hurricane Katrina,includes a higher mix of commercial business and retrocessional coverage where the underlying claims ofour cedants tend to be settled and paid more slowly. In addition, claims from our underlying cedants for the2001 and 2005 accident years are subject to more complex coverage and legal matters due to thecomplexity of the catastrophic events taking place in those years.
Sensitivity Analysis
The table below shows the impact on our ultimate claims and claim expenses, net income andshareholders’ equity as of and for the year ended December 31, 2008 of reasonably likely changes to ourestimates of ultimate losses for claims and claim expenses incurred from catastrophic events within ourproperty catastrophe reinsurance business unit. The reasonably likely changes are based on an historicalanalysis of the period-to-period variability of our ultimate costs to settle claims from catastrophic events,giving due consideration to changes in our reserving practices over time. In general, our claim reserves forour more recent catastrophic events are subject to greater uncertainty and, therefore, greater variability andare likely to experience material changes from one period to the next. This is due to the uncertainty as tothe size of the industry losses from the event, uncertainty as to which contracts have been exposed to thecatastrophic event, and uncertainty as to the magnitude of claims incurred by our clients. As our claimreserves age, more information becomes available and we believe our estimates become more certain,although there is no assurance this trend will continue in the future. As a result, the sensitivity analysisbelow is based on the age of each accident year, our current estimated ultimate claims and claim expensesfor the catastrophic events occurring in each accident year, and the reasonably likely variability of ourcurrent estimates of claims and claim expenses by accident year. The impact on net income andshareholders’ equity assumes no increase or decrease in reinsurance recoveries, loss related premium orDaVinciRe minority interest.
Property Catastrophe Reinsurance Claims and Claim Expense Reserve Sensitivity Analysis
(in thousands, except percentages)
UltimateClaims and
ClaimExpenses as ofDecember 31,
2008
$ Impact ofChange inUltimate
Claims andClaim
Expensesas of
December 31,2008
% Impact ofChange inUltimate
Claims andClaim
Expensesas of
December 31,2008
% Impact ofChange onNet Incomefor the Year
EndedDecember 31,
2008
% Impact ofChange on
Shareholders’Equity as of
December 31,2008
Higher $4,457,413 $ 350,969 8.5% (1209.4%) (11.6%)Recorded 4,106,444 — — — —Lower $3,755,475 $(350,969) (8.5%) 1209.4% 11.6%
We believe the changes we made to our estimated ultimate claims and claim expenses representreasonably likely outcomes. While we believe these are reasonably likely outcomes, we do not believe thereader should consider the above sensitivity analysis an actuarial reserve range. In addition, the sensitivityanalysis only reflects reasonably likely changes in our underlying assumptions. It is possible that ourestimated ultimate claims and claim expenses could be significantly higher or lower than the sensitivityanalysis described above. For example, we could be liable for events for which we have not estimatedclaims and claim expenses or for exposures we do not currently believe are covered under our policies.These changes could result in significantly larger changes to our estimated ultimate claims and claimexpenses, net income and shareholders’ equity than those noted above. We also caution the reader that theabove sensitivity analysis is not used by management in developing our reserve estimates and is also notused by management in managing the business.
76

Specialty Reinsurance
Within our specialty reinsurance business unit we write a number of reinsurance lines such as catastropheexposed workers’ compensation, surety, terrorism, medical malpractice, catastrophe exposed personal linesproperty, casualty clash, property per risk, catastrophe exposed personal lines property and other specialtylines of reinsurance, which we collectively refer to as specialty reinsurance. We offer our specialtyreinsurance products principally on an excess of loss basis, as described above with respect to our propertycatastrophe reinsurance products, and we also provide some proportional coverage. In a proportionalreinsurance arrangement (also referred to as quota share reinsurance or pro-rata reinsurance), thereinsurer shares a proportional part of the original premiums and losses of the reinsured. We offer ourspecialty reinsurance products to insurance companies and other reinsurance companies and providecoverage for specific geographic regions or on a worldwide basis. We expanded our specialty reinsurancebusiness in 2002 and have increased our presence in the specialty reinsurance market since that time.
Our specialty reinsurance business can generally be characterized as providing coverage for low frequencyand high severity losses, similar to our property catastrophe reinsurance business. As with our propertycatastrophe reinsurance business, our specialty reinsurance contracts frequently provide coverage forrelatively large limits or exposures. As a result of the foregoing, our specialty reinsurance business is subjectto significant claims volatility. In periods of low claims frequency or severity, our results will generally befavorably impacted while in periods of high claims frequency or severity our results will generally benegatively impacted.
Our processes and methodologies in respect of loss estimation for the coverages we offer through ourspecialty reinsurance operation differ from those used for our property catastrophe-oriented coverages. Forexample, our specialty reinsurance coverages are more likely to be impacted by factors such as long-terminflation and changes in the social and legal environment, which we believe gives rise to greater uncertaintyin our claims reserves. Moreover, in reserving for our specialty reinsurance coverages we do not have thebenefit of a significant amount of our own historical experience in these lines. We believe this makes ourspecialty reinsurance reserving subject to greater uncertainty than our property catastrophe reinsuranceunit.
When initially developing our reserving techniques for our specialty reinsurance coverages, we consideredestimating reserves utilizing several actuarial techniques such as paid and incurred development methods.We elected to use the Bornhuetter-Ferguson actuarial technique because this method is appropriate forlines of business, such as our specialty reinsurance business, where there is a lack of historical claimsexperience. This method allows for greater weight to be applied to expected results in periods where little orno actual experience is available, and, hence, is less susceptible to the potential pitfall of being excessivelyswayed by one year or one quarter of actual paid and/or reported loss data. This method uses initialexpected loss ratio expectations to the extent that losses are not paid or reported, and it assumes that pastexperience is not fully representative of the future. As the Company’s reserves for claims and claimexpenses age, and actual claims experience becomes available, this method places less weight on expectedexperience and places more weight on actual experience. We reevaluate our actuarial reserving techniqueson a periodic basis.
The utilization of the Bornhuetter-Ferguson actuarial technique requires us to estimate an expected ultimateclaims and claim expense ratio and select an expected loss reporting pattern. We select our estimates ofthe expected ultimate claims and claim expense ratios and expected loss reporting patterns by reviewingindustry standards and adjusting these standards based upon the terms of the coverages we offer. Theestimated expected claims and claim expense ratio may be modified to the extent that reported losses at agiven point in time differ from what would be expected based on the selected loss reporting pattern. Ourestimate of IBNR is the product of the premium we have earned, the initial expected ultimate claims andclaim expense ratio and the percentage of estimated unreported losses. In addition, certain of our specialtyreinsurance coverages may be impacted by natural and man-made catastrophes. We estimate claimreserves for these losses after the event giving rise to these losses occur, following a process that is similarto our property catastrophe reinsurance unit described above.
77

Within our specialty reinsurance business, we seek to review substantially all of our claims and claimexpense reserves quarterly. Typically, our quarterly review procedures include reviewing paid and reportedclaims in the most recent reporting period, reviewing the development of paid and reported claims fromprior periods, and reviewing our overall experience by underwriting year and in the aggregate. We monitorour expected ultimate claims and claim expense ratios and expected loss reporting assumptions on aquarterly basis and compare them to our actual experience. These actuarial assumptions are generallyreviewed annually, based on input from our actuaries, underwriters, claims personnel and financeprofessionals, although adjustments may be made more frequently if needed. Assumption changes aremade to adjust for changes in the pricing and terms of coverage we provide, changes in industry standards,as well as our actual experience, to the extent we have enough data to rely on our own experience. If wedetermine that adjustments to an earlier estimate are appropriate, such adjustments are recorded in theperiod in which they are identified. During the twelve months ended December 31, 2008, 2007 and 2006,changes to our prior year estimated claims reserves in our specialty reinsurance unit increased our netincome by $56.5 million, $101.3 million and $139.2 million, respectively, excluding the consideration ofchanges in reinstatement premium, profit commissions, DaVinciRe minority interest and income taxexpense.
Actual Results vs. Initial Estimates
The Actual vs. Initial Estimated Ultimate Claims and Claim Expense Ratio table below summarizes our keyactuarial assumptions in reserving for our specialty reinsurance business. As noted above, the key actuarialassumptions include the estimated ultimate claims and claim expense ratios and the estimated lossreporting patterns. The table shows our initial estimates of the ultimate claims and claim expense ratio byunderwriting year. The table shows how our initial estimates of these ratios have developed over time, withthe re-estimated ratios reflecting a combination of the amount and timing of paid and reported lossescompared to our initial estimates. The initial estimate is based on the actuarial assumptions that were inplace at the end of that year. A decrease in the ultimate claims and claim expense ratio implies that ourcurrent estimates are lower than our initial estimates while an increase in the ultimate claims and claimexpense ratio implies that our current estimates are higher than our initial estimates. The result would be acorresponding favorable impact on shareholders’ equity and net income or a corresponding unfavorableimpact on shareholders’ equity and net income, respectively. The table also shows how our initial estimatedultimate claims and claim expense ratios have changed from one underwriting year to the next. The tablebelow reflects a summary of the weighted average assumptions for all classes of business written within ourspecialty reinsurance unit. The table is presented on a gross loss basis and therefore does not include thebenefit of reinsurance recoveries or loss related premium.
Actual vs. Initial Estimated Specialty Reinsurance Claims and Claim Expense Reserve Analysis—EstimatedUltimate Claims and Claim Expense Ratio
Estimated Ultimate Claims and Claim Expenses Ratio
Underwriting Year Initial EstimateRe-estimate as of
December 31, 2006 December 31, 2007 December 31, 2008
2002 77.2% 29.7% 24.4% 24.7%2003 76.8 31.1 28.5 30.32004 78.2 58.7 49.8 46.12005 78.2 55.4 49.3 42.42006 76.6 57.6 59.5 55.12007 62.9 — 91.9 73.92008 57.9 — — 89.4
The table above shows our initial estimated ultimate claims and claim expense ratios for attritional losses foreach new underwriting year within our specialty reinsurance unit as of the end of each calendar year. Until2007, our initial estimated ultimate remained relatively constant between 76.6% in 2006 and 78.2% in2004 and 2005. This reflects the fact that management had not made significant changes to its initialestimates of expected ultimate claims and claim expense ratios from one underwriting year to the next. Theprincipal reason for the modest changes from one underwriting year to the next is that the mix of business
78

has changed. For example, the mix of business for the 2007 and 2008 underwriting years have a lowerinitial expected ultimate claims and claim expense ratio than in prior years as it is more heavily weighted tobusiness that is expected to produce a lower level of losses. The decrease in the initial estimated ultimateclaims and claim expense ratio from 2006 to 2008 also reflects assumption changes made for certainclasses of business where our experience, and the industry experience in general, has been better thanexpected and, as a result, we decreased our initial estimated ultimate claims and claim expense ratio forthese classes of business.
As each underwriting year has developed, our re-estimated expected ultimate claims and claim expense ratioshave changed. In particular, our re-estimated ultimate claims and claim expense ratios have decreasedsignificantly from the initial estimates for the 2002 through 2005 underwriting years. This was principally due toour 2005 reserve review. During our 2005 reserve review, we further segmented the specialty business with theaim of grouping risks into more homogeneous categories which respond to the evolution of actual exposures.This became possible as the volume of this business increased over the three preceding years. This furthersegmentation required the selection of loss reporting patterns to be applied to these new groups. We alsoupdated our assumptions for our original loss reporting patterns based on a combination of new industryinformation and actual experience accumulated over the three preceding years. The assumptions for the newloss reporting patterns were applied to all prior underwriting years. In addition, we made explicit allowances forcommuted contracts whereas previously these were considered in the overall reserving assumptions. We alsoreviewed substantially all of our case reserves and additional case reserves. The result of the foregoing was adecrease in our specialty reinsurance re-estimated ultimate claims and claim expense reserves in 2005.Subsequent to this reserve review, the results of our specialty book of business have been mixed. The 2006underwriting year includes favorable development as actual paid and reported losses during 2006 have beenless than expected, which has resulted in a reduction in our expected ultimate claims and claim expense ratio forthis year. However, the 2008 and 2007 underwriting years have performed worse than expected and our currentestimates are significantly higher than our initial estimates. This is due in part to the losses in our casualty clashline of business in 2008 and 2007, associated with exposure to the deterioration of the credit and capital marketsin 2008 as well the Madoff matter discovered in the fourth quarter of 2008 and with sub-prime exposure in2007. As noted above, our specialty reinsurance business is characterized by events of low frequency and highseverity which results in actual experience that can be significantly better or worse than long term trends orindustry standards may imply.
As noted above, some of our specialty reinsurance contracts are exposed to net claims and claim expensesfrom large natural and man-made catastrophes. Net claims and claim expenses from these largecatastrophes are reserved for after the events which gave rise to the claims in a manner which is consistentwith our property catastrophe reinsurance reserving practices as discussed above. The large catastrophesoccurring during the period from 2003 to 2008 impacting our specialty unit principally include hurricanesKatrina, Rita and Wilma, which occurred in 2005. Our estimate of ultimate net claims and claim expensesfrom hurricanes Katrina, Rita and Wilma, within our specialty reinsurance unit, net of reinsurancerecoveries and assumed and ceded loss related premium, totaled $98.8 million, $77.1 million, $73.1million and $73.1 million at December 31, 2005, 2006, 2007 and 2008, respectively.
Sensitivity Analysis
The table below quantifies the impact on our reserves for claims and claim expenses, net income andshareholders’ equity as of and for the year ended December 31, 2008 of reasonably likely changes to theactuarial assumptions used to estimate our December 31, 2008 claims and claim expense reserves withinour specialty reinsurance business unit. The table quantifies reasonably likely changes in our initialestimated ultimate claims and claim expense ratios and estimated loss reporting patterns. The changes tothe initial estimated ultimate claims and claim expense ratios represent percentage increases or decreasesto our current estimated ultimate claims and claim expense ratios. The change to the reporting patternsrepresent claims reporting that is both faster and slower than our current estimated claims reportingpatterns. The impact on net income and shareholders’ equity assumes no increase or decrease inreinsurance recoveries, loss related premium or DaVinciRe minority interest.
79

Specialty Reinsurance Claims and Claim Expense Reserve Sensitivity Analysis
(in thousands, except percentages)
Estimated Ultimate Claims and ClaimExpense Ratio
Estimated LossReporting Pattern
$ Impact ofChange in
Reserves forClaims and
ClaimExpenses as ofDecember 31,
2008
% Impact ofChange in
Reserves forClaims and
ClaimExpenses as
ofDecember 31,
2008
% Impact ofChange in Net
Income forthe YearEnded
December 31,2008
% Impact ofChange in
Shareholders’Equity as of
December 31,2008
Increase expected claims andclaim expense ratio by 25% Slower reporting $ 229,588 36.1% (791.1%) (7.6%)
Increase expected claims andclaim expense ratio by 25% Expected reporting 96,837 15.2% (333.7%) (3.2%)
Increase expected claims andclaim expense ratio by 25% Faster reporting (14,578) (2.3%) 50.2% 0.5%
Expected claims and claimexpense ratio Slower reporting 106,201 16.7% (366.0%) (3.5%)
Expected claims and claimexpense ratio Expected reporting — — — —
Expected claims and claimexpense ratio Faster reporting (89,132) (14.0%) 307.1% 2.9%
Decrease expected claims andclaim expense ratio by 25% Slower reporting (17,187) (2.7%) 59.2% .6%
Decrease expected claims andclaim expense ratio by 25% Expected reporting (96,837) (15.2%) 333.7% 3.2%
Decrease expected claims andclaim expense ratio by 25% Faster reporting $(163,686) (25.7%) 564.0% 5.4%
We believe that ultimate claims and claim expense ratios 25.0% above or below our estimated assumptionsconstitute reasonably likely changes. In addition, we believe that the adjustments that we made to speed upor slow down our estimated loss reporting patterns are reasonably likely changes. While we believe theseare reasonably likely changes, we do not believe the reader should consider the above sensitivity analysis anactuarial reserve range. In addition, we caution the reader that the above sensitivity analysis only reflectsreasonably likely changes. It is possible that our initial estimated claims and claim expense ratios and lossreporting patterns could be significantly different from the sensitivity analysis described above. For example,we could be liable for events which we have not estimated reserves for or for exposures we do not currentlythink are covered under our contracts. These changes could result in significantly larger changes toreserves for claims and claim expenses, net income and shareholders’ equity than those noted above. Wealso caution the reader that the above sensitivity analysis is not used by management in developing ourreserve estimates and is also not used by management in managing the business.
Individual Risk Segment
We define our Individual Risk segment to include underwriting that involves understanding thecharacteristics of the underlying insurance policy. Our principal contracts include insurance policies andquota share reinsurance with respect to risks including: 1) multi-peril crop, which includes multi-peril cropinsurance, crop hail and other named peril agriculture risk management products; 2) commercial property,which principally includes catastrophe-exposed commercial property products; 3) commercial multi-line,which includes commercial property and liability coverage, such as general liability, automobile liability andphysical damage, building and contents, professional liability and various specialty products; and 4)personal lines property, which principally includes homeowners personal lines property coverage andcatastrophe exposed personal lines property coverage.
80

We use the Bornhuetter-Ferguson actuarial technique to estimate claims and claim expenses within ourIndividual Risk segment. The comments discussed above relating to our reserving techniques andprocesses for our specialty reinsurance unit also apply to our Individual Risk segment. In addition, certain ofour coverages may be impacted by natural and man-made catastrophes. We estimate claim reserves forthese losses after the event giving rise to these losses occurs, following a process that is similar to ourproperty catastrophe reinsurance unit described above.
During the twelve months ended December 31, 2008, 2007 and 2006, changes to our prior year estimatedclaims reserves in our Individual Risk unit increased our net income by $46.7 million, $38.8 million and$11.3 million, respectively, excluding the consideration of changes in reinstatement premium, profitcommissions and income tax expense.
Actual Results vs. Initial Estimates
The Actual vs. Initial Estimated Ultimate Claims and Claim Expense Ratio table below summarizes our keyactuarial assumptions in reserving for our Individual Risk segment. As noted above, the key actuarialassumptions include the estimated ultimate claims and claim expense ratios and the estimated lossreporting patterns. The table shows our initial estimates of the ultimate claims and claim expense ratios byaccident year. The table shows how our initial estimates of these ratios have developed over time with there-estimated ratios reflecting a combination of the amount and timing of paid and reported losses comparedto our initial estimates. The initial estimate is based on the actuarial assumptions that were in place at theend of that year. A decrease in the ultimate claims and claim expense ratio implies that our currentestimates are lower than our initial estimates while an increase in the ultimate claims and claim expenseratio implies that our current estimates are higher than our initial estimates. The result would be acorresponding favorable impact on shareholders’ equity and net income or a corresponding unfavorableimpact on shareholders’ equity and net income, respectively. The table also shows how our initial estimatedultimate claims and claim expense ratios have changed from one accident year to the next. The table belowreflects a summary of the weighted average assumptions for all classes of business written within ourIndividual Risk segment. The table is presented on a gross loss basis and therefore does not include thebenefit of reinsurance recoveries or loss related premium.
Actual vs. Initial Estimated Individual Risk Segment Claims and Claim Expense Reserve Analysis—Estimated Ultimate Claims and Claim Expense Ratio
Estimated Expected Ultimate Claims and Claim Expense Ratio
AccidentYear Initial Estimate
Re-estimate as ofDecember 31, 2006 December 31, 2007 December 31, 2008
2003 55.3% 38.2% 38.0% 37.3%2004 59.2 48.9 48.1 46.32005 51.9 49.5 49.1 48.42006 55.8 54.1 51.8 50.22007 55.9 — 50.9 43.72008 68.5 — — 66.2
The table above shows that our initial estimated ultimate claims and claim expense ratios for attritionallosses for each new accident year within our Individual Risk segment as of the end of each calendar year,have historically stayed relatively constant between 2003 and 2007. This reflects the fact that managementhas not made significant changes to its estimated initial expected ultimate claims and claim expense ratiofrom one period to the next. The principal reason for the changes from one year to the next is that the mixof business has changed. For example, during 2008, our initial estimated ultimate claims and claimexpense ratio increased relative to the preceding five years, as a result of the increase in our multi-peril cropinsurance line of business which has a higher net claims and claim expenses ratio relative to the other linesof business within the Individual Risk segment and comprises a larger percentage of our overall IndividualRisk premiums. As each accident year has developed, our re-estimated ultimate claims and claim expenseratios have generally been reduced. This reflects the impact of actual experience in our Individual Risk
81

business where actual paid and reported losses to date for attritional losses are less than originallyexpected. As described above, under the Bornhuetter-Ferguson actuarial technique less weight is placedon initial estimates and more weight is placed on actual experience as our claims and claim expensereserves age.
As noted above, some of our Individual Risk contracts are exposed to net claims and claim expenses fromlarge natural and man-made catastrophes. Net claims and claim expenses from these large catastrophesare reserved for after the event which gave rise to the claims in a manner which is consistent with ourproperty catastrophe reinsurance reserving practices as discussed above. The large catastrophes occurringduring the period from 2004 to 2008 principally include hurricanes Charley, Frances, Ivan and Jeanne in2004, hurricanes Katrina, Rita and Wilma in 2005, and hurricanes Gustav and Ike in 2008. Our ultimatenet claims and claim expenses from these events within our Individual Risk segment, net of reinsurancerecoveries and assumed and ceded loss related premium, are shown in the table below.
Estimated Net Claims and Claim Expenses
EventsDecember 31,
2004December 31,
2005December 31,
2006December 31,
2007December 31,
2008(in thousands)
Charley, Frances, Ivan and Jeanne $158,303 $182,327 $184,593 $185,829 $189,863Katrina, Rita and Wilma — 140,080 134,953 131,620 127,874Gustav and Ike $ — $ — $ — $ — $ 40,298
Sensitivity Analysis
The table below quantifies the impact on our reserves for claims and claim expenses, net income andshareholders’ equity as of and for the year ended December 31, 2008 of reasonably likely changes to theactuarial assumptions used to estimate our December 31, 2008 claims and claim expense reserves withinour Individual Risk segment. The table quantifies reasonably likely changes in our initial estimated ultimateclaims and claim expense ratios and estimated loss reporting patterns. The changes to the initial estimatedultimate claims and claim expense ratios represent percentage increases or decreases to our currentestimated ultimate claims and claim expense ratios. The change to the reporting patterns represent claimsreporting that is both faster and slower than our current estimated reporting patterns. The impact on netincome and shareholders’ equity assumes no increase or decrease in reinsurance recoveries or loss relatedpremium and is before tax.
82

Individual Risk Claims and Claim Expense Reserve Sensitivity Analysis
(in thousands, except percentages)
Estimated Ultimate Claims and ClaimExpense Ratio
Estimated LossReporting Pattern
$ Impact ofChange in
Reserves forClaims and
ClaimExpenses as ofDecember 31,
2008
% Impact ofChange in
Reserves forClaims and
ClaimExpenses as
ofDecember 31,
2008
% Impact ofChange in Net
Income forthe YearEnded
December 31,2008
% Impact ofChange in
Shareholders’Equity as of
December 31,2008
Increase expected claims andclaim expense ratio by 10% Slower reporting $113,126 17.1% (389.8%) (3.7%)
Increase expected claims andclaim expense ratio by 10% Expected reporting 39,488 6.0% (136.1%) (1.3%)
Increase expected claims andclaim expense ratio by 10% Faster reporting (21,053) (3.2%) 72.5% 0.7%
Expected claims and claimexpense ratio Slower reporting 67,676 10.2% (233.2%) (2.2%)
Expected claims and claimexpense ratio Expected reporting — — — —
Expected claims and claimexpense ratio Faster reporting (55,037) (8.3%) 189.7% 1.8%
Decrease expected claims andclaim expense ratio by 10% Slower reporting 22,441 3.4% (77.3%) (0.7%)
Decrease expected claims andclaim expense ratio by 10% Expected reporting (39,488) (6.0%) 136.1% 1.3%
Decrease expected claims andclaim expense ratio by 10% Faster reporting $ (89,021) (13.4%) 306.8% 2.9%
We believe that ultimate claims and claim expense ratios 10.0% above or below our estimated assumptionsconstitute reasonably likely changes. In addition, we believe that the adjustments that we made to speed upor slow down our estimated loss reporting patterns are reasonably likely changes. While we believe theseare reasonably likely changes, we do not believe the reader should consider the above sensitivity analysis anactuarial reserve range. In addition, we caution the reader that the above sensitivity analysis only reflectsreasonably likely changes. It is possible that our initial estimated claims and claim expense ratios and lossreporting patterns could be significantly different from the sensitivity analysis described above. For example,we could be liable for events which we have not estimated reserves for or for exposures we do not currentlythink are covered under our contracts. These changes could result in significantly larger changes to ourreserves for claims and claim expenses, net income and shareholders’ equity than those noted above. Wealso caution the reader that the above sensitivity analysis is not used by management in developing ourreserve estimates and is also not used by management in managing the business.
Losses Recoverable
We enter into reinsurance agreements in order to help reduce our exposure to large losses and to helpmanage our risk portfolio. Amounts recoverable from reinsurers are estimated in a manner consistent withthe claims and claim expense reserves associated with the related assumed reinsurance. For multi-yearretrospectively rated contracts, we accrue amounts (either assets or liabilities) that are due to or fromassuming companies based on estimated contract experience. If we determine that adjustments to earlierestimates are appropriate, such adjustments are recorded in the period in which they are determined.
The estimate of losses recoverable can be more subjective than estimating the underlying claims and claimexpense reserves as discussed under the heading “Claims and Claim Expense Reserves” above. Inparticular, losses recoverable may be affected by deemed inuring reinsurance, industry losses reported byvarious statistical reporting services, and other factors. Losses recoverable on dual trigger reinsurancecontracts require us to estimate our ultimate losses applicable to these contracts as well as estimate the
83

ultimate amount of insured losses for the industry as a whole that will be reported by the applicablestatistical reporting agency, as per the contract terms. In addition, the level of our additional case reservesand IBNR reserves has a significant impact on losses recoverable. These factors can impact the amountand timing of the losses recoverable to be recorded.
The majority of the balance we have accrued as recoverable will not be due for collection until some point inthe future. The amounts recoverable ultimately collected are open to uncertainty due to the ultimate abilityand willingness of reinsurers to pay our claims, for reasons including insolvency and elective run-off,contractual dispute and various other reasons. In addition, because the majority of the balances recoverablewill not be collected for some time, economic conditions as well as the financial and operationalperformance of a particular reinsurer may change, and these changes may affect the reinsurer’s willingnessand ability to meet their contractual obligations to us. To reflect these uncertainties, we estimate and recorda valuation allowance for potential uncollectible losses recoverable which reduces losses recoverable andnet earnings.
We estimate our valuation allowance by applying specific percentages against each recovery based on ourcounterparty’s credit rating. The percentages applied are based on historical industry default statisticsdeveloped by major rating agencies and are then adjusted by us based on industry knowledge and ourjudgment and estimates. We also apply case-specific valuation allowances against certain recoveries thatwe deem unlikely to be collected in full. We then evaluate the overall adequacy of the valuation allowancebased on other qualitative and judgmental factors. The valuation allowance recorded against lossesrecoverable was $8.7 million at December 31, 2008 (2007 – $8.9 million). The reinsurers with the threelargest balances accounted for 26.6%, 18.2% and 8.1%, respectively, of our losses recoverable balance atDecember 31, 2008 (2007 – 19.5%, 17.7% and 10.0%, respectively). The three largest company-specificcomponents of the valuation allowance represented 40.5%, 23.0% and 9.6% of our total valuationallowance at December 31, 2008 (2007 – 39.4%, 22.5% and 10.5%).
Fair Value Measurements and Impairments
Fair Value
The use of fair value to measure certain assets and liabilities with resulting unrealized gains or losses, ispervasive within our financial statements, and is a critical accounting policy and estimate for us. Fair valueis the price that would be received upon the sale of an asset or paid to transfer a liability in an orderlytransaction between open market participants at the measurement date. We recognize unrealized gains andlosses arising from changes in fair value in our statements of operations, with the exception of unrealizedgains and losses on our fixed maturity investments available for sale, which currently are recognized as acomponent of accumulated other comprehensive income in shareholders’ equity.
The degree of judgment used in measuring the fair value of financial instruments generally correlates withthe level of observable pricing inputs. Financial instruments with quoted prices in active markets requireless judgment in measuring fair value. Conversely, financial instruments traded in other-than-active marketsor that do not have quoted prices have less observability and are measured at fair value using valuationmodels or other pricing techniques that require more judgment. Observable pricing inputs are affected by anumber of factors, including the type of financial instrument, whether the financial instrument is new to themarket and not yet established, and the characteristics specific to the transaction and general marketconditions.
Under FAS 157, assets and liabilities recorded at fair value in the consolidated balance sheet are classifiedin a hierarchy for disclosure purposes consisting of three “levels” based on the observability of inputsavailable to measure the fair value. The three levels of the fair value hierarchy under FAS 157 are describedbelow:
• Fair values determined by Level 1 inputs utilize unadjusted quoted prices obtained from activemarkets for identical assets or liabilities that the Company has access to. The fair value isdetermined by multiplying the quoted price by the quantity held by the Company;
84

• Fair values determined by Level 2 inputs utilize inputs other than quoted prices included in Level1 that are observable for the asset or liability, either directly or indirectly. Level 2 inputs includequoted prices for similar assets and liabilities in active markets, and inputs other than quotedprices that are observable for the asset or liability, such as interest rates and yield curves that areobservable at commonly quoted intervals, broker quotes and certain pricing indices; and
• Level 3 inputs are based on unobservable inputs for the asset or liability, and include situationswhere there is little, if any, market activity for the asset or liability. In these cases, significantmanagement assumptions can be used to establish management’s best estimate of theassumptions used by other market participants in determining the fair value of the asset orliability.
See “Note 6. Fair Value Measurements in the Notes to the Consolidated Financial Statements” for additionalinformation about fair value measurements.
Below is a summary of the assets and liabilities that are measured at fair value on a recurring basis:
At December 31, 2008 Total
Quoted Prices inActive Markets
for IdenticalAssets (Level 1)
Significant OtherObservable
Inputs (Level 2)
SignificantUnobservable
Inputs (Level 3)(in thousands)
AssetsFixed maturity investments available for sale $2,996,885 $467,480 $2,529,405 $ —Short term investments 2,172,343 — 2,172,343 —Other investments 773,475 — 391,395 382,080Other secured assets 76,424 — 76,424 —Other (liabilities) and assets (1) (8,714) 31,167 2,631 (42,512)
$6,010,413 $498,647 $5,172,198 $339,568
Percentage of total fair value assets andliabilities 100.0% 8.3% 86.1% 5.6%
(1) Other assets of $34.3 million, $29.9 million and $10.3 million are included in Level 1, Level 2 and Level3, respectively. Other liabilities of $3.1 million, $27.3 million and $52.8 million are included in Level 1,Level 2 and Level 3, respectively.
As at December 31, 2008, we classified $392.4 million and $52.8 million of assets and liabilities,respectively, at fair value on a recurring basis using Level 3 inputs. This represented 4.9% and 1.3% of ourtotal assets and liabilities, respectively. Level 3 fair value measurements are based on valuation techniquesthat use at least one significant input that is unobservable. These measurements are made undercircumstances in which there is little, if any, market activity for the asset or liability. We use valuationmodels or other pricing techniques that require a variety of inputs including contractual terms, marketprices and rates, yield curves, credit curves, measures of volatility, prepayment rates and correlations ofsuch inputs, some of which may be unobservable, to value these Level 3 assets and liabilities. Ourassessment of the significance of a particular input to the fair value measurement in its entirety requiresjudgment. In making the assessment, we considered factors specific to the asset or liability. In certaincases, the inputs used to measure fair value of an asset or a liability may fall into different levels of the fairvalue hierarchy. In such cases, the level in the fair value hierarchy within which the fair value measurementin its entirety is classified is determined based on the lowest level input that is significant to the fair valuemeasurement of the asset or liability.
Impairments
Fixed Maturity Investments Available For Sale
On a quarterly basis we assess whether declines in the fair value of our fixed maturity investments availablefor sale represent impairments that are other than temporary. There are several factors that we consider inthe assessment of a security, which include (i) the time period during which there has been a significant
85

decline below cost, (ii) the extent of the decline below cost, (iii) our intent and ability to hold the security,(iv) the potential for the security to recover in value, (v) an analysis of the financial condition of the issuerand (vi) an analysis of the collateral structure and credit support of the security, if applicable. Where wehave determined that there is an other than temporary decline in the fair value of the security, the cost ofthe security is written down to its fair value and the unrealized loss at the time of determination is reflectedin the consolidated statements of operations. After recording the other than temporary impairment charges,we then must determine which investments are impaired due to issuer credit risk. For investments whichwe do not expect to collect the full principal amount of the investment at maturity, we do not accrete thediscount to par of these investments. For those impairments which are driven by other factors, such aschanges in interest rates, we accrete the discount to par over the remaining expected average life of theinvestment as we expect to collect our principal if such investment is held to maturity.
The majority of our fixed maturity investments available for sale are currently managed by externalinvestment managers in accordance with specific investment mandates and guidelines. The investmentmanagers are currently directed to manage our investments to maximize total investment return inaccordance with these investment mandates and guidelines. While we have adequate capital and liquidityto support our operations and to hold our fixed maturity investments available for sale which are in anunrealized loss position until they recover in value, we have not prohibited or restricted our investmentmanagers from selling these investments and our investment managers actively trade our investments. Weare therefore unable to represent or certify that we have the intent or ability to hold these investments untilthey recover in value. As a consequence, we have impaired principally all of our fixed maturity investmentsavailable for sale that were in an unrealized loss position at each quarterly reporting date throughout thethree years presented. During the year ended December 31, 2008, the Company recorded $217.0 millionin other than temporary impairment charges (2007 – $25.5 million, 2006 – $46.4 million) includingimpairment charges for which we believe we will not be able to recover the full principal amount if theimpaired security is held to maturity, of $8.3 million (2007 – $nil, 2006 – $0.1 million). As of December 31,2008 and 2007, the Company had essentially no fixed maturity investments available for sale in anunrealized loss position.
Investments in Other Ventures, Under Equity Method
Investments in which we have significant influence over the operating and financial policies of the investeeare classified as investments in other ventures, under equity method, and are accounted for under theequity method of accounting. Under this method, the Company records its proportionate share of income orloss from such investments in its results for the period. Any decline in the value of investments in otherventures, under equity method, including goodwill and other intangible assets arising upon acquisition ofthe investee, considered by management to be other than temporary, is impaired and is reflected in ourconsolidated statements of operations in the period in which it is determined. As of December 31, 2008,the Company had $99.9 million (2007 – $90.6 million) in investments in other ventures, under equitymethod on its consolidated balance sheets, including $8.5 million of goodwill and $41.3 million of otherintangible assets (2007 – $nil and $nil).
In determining whether an equity method investment is impaired, we look at a variety of factors includingthe operating and financial performance of the investee, the investee’s future business plans andprojections, recent transactions and market valuations of publicly traded companies where available, andour intent and ability to hold the investment until it recovers in value. In doing this, we make assumptionsand estimates in assessing whether an impairment has occurred and if, in the future, our assumptions andestimates made in assessing the fair value of these investments change, this could result in a materialdecrease in the carrying value of these investments. This would cause us to write-down the carrying value ofthese investments and could have a material adverse effect on our results of operations in the period theimpairment charge is taken. During the year ended December 31, 2008, the Company recorded $1.0million (2007 – $nil, 2006 – $nil) in other than temporary impairment charges related to investments inother ventures, under the equity method.
86
Goodwill and Other Intangible Assets
Goodwill and other intangible assets acquired are initially recorded at fair value. Subsequent to initialrecognition, finite lived other intangible assets are amortized over their estimated useful life, subject toimpairment, and goodwill and indefinite lived other intangible assets are carried at the lower of cost or fairvalue. If goodwill or other intangible assets are impaired, they are written down to their estimated fair valueswith a corresponding expense reflected in our consolidated statements of operations.
We test goodwill and other intangible assets for impairment in the fourth quarter of each year, or morefrequently if events or changes in circumstances indicate that the carrying amount may not be recoverable.For purposes of the annual impairment evaluation, goodwill is assigned to the applicable reporting unit ofthe acquired entities giving rise to the goodwill and other intangible assets are tested based on the cashflows they produce. There are many assumptions and estimates underlying the fair value calculation.Principally, we identify the reporting unit or business entity that the goodwill or other intangible asset isattributed to, and review historical and forecasted operating and financial performance and other underlyingfactors affecting such analysis, including market conditions. Other assumptions used could producesignificantly different results which may result in a change in the value of goodwill or our other intangibleassets and related charge in our consolidated statements of operations. An impairment charge could berecognized in the event of a significant decline in the implied fair value of those operations where thegoodwill or other intangible assets are applicable. As at December 31, 2008, our consolidated balancesheets include $26.0 million of goodwill (2007 – $2.3 million) and $48.2 million of other intangible assets(2007 – $3.9 million). Impairment charges were $nil during 2008 (2007 – $nil, 2006 – $nil).
Premiums
We recognize premiums as revenue over the terms of the related contracts and policies. Our writtenpremiums are based on policy and contract terms and include estimates based on information receivedfrom both insureds and ceding companies. The information received is typically in the form of bordereaux,broker notifications and/or discussions with ceding companies or their broker. This information can bereceived on a monthly, quarterly or transactional basis and normally includes estimates of written premium(including adjustment and reinstatement premium), earned premium, acquisition costs and cedingcommissions.
We generally recognize premium on the date the contract is bound, even if the contract provides for aneffective date prior to the date the contract is bound, thus preventing premature revenue recognition. Thedate the contract is bound is usually the date we are on risk for the policy and this is generally the date onwhich the reinsurance slip is signed. The signing of the reinsurance contract normally occurs after the datethe slip is signed.
We book premiums on non-proportional contracts in accordance with the contract terms. Premiums writtenon losses occurring contracts are typically earned over the contract period. Premiums on risks attachingcontracts are either estimated or earned as reported by the cedants, which may be over a period more thantwice as long as the contract period. For multi-year policies, only the initial annual premium is included aswritten at policy inception. The remaining annual premiums are included as written at each successiveanniversary date within the multi-year term. Management is required to make estimates based on judgmentand historical experience for periods during which information has not yet been received.
In our Individual Risk business, it is often necessary to estimate portions of premiums written from quota-share contracts and by third party program managers and the related commission expense. Managementestimates these amounts based on discussions with ceding companies and third party program managers,together with historical experience and judgment. Total premiums written estimated in our Individual Riskbusiness at December 31, 2008, 2007 and 2006 were $12.9 million, $6.5 million and $16.2 million,respectively, and total estimated premiums earned were $2.5 million, $0.9 million and $6.8 million,respectively. Total earned commissions estimated at December 31, 2008, 2007 and 2006 were $2.4million, $0.2 million and $3.4 million, respectively. Management tracks the actual premium received andcommissions incurred and compares this to the estimates previously booked. Such estimates are subject toadjustment in subsequent periods when actual figures are recorded. To date such subsequent adjustmentshave not been material.
87

Since premiums for our Reinsurance segment are contractually driven and the reporting lag for suchpremiums is minimal, estimates for premiums written for this segment are usually not significant. Theminimum and deposit premiums on excess policies are usually set forth in the language of the contract andare used to record premiums on these policies. Actual premiums are determined in subsequent periodsbased on actual exposures and any adjustments are recorded in the period in which they are identified.
Reinstatement premiums are estimated after the occurrence of a significant loss and are recorded inaccordance with the contract terms based upon paid losses and case reserves. Reinstatement premiumsare earned when written.
Ceded premiums are also recognized on the date the contract is bound and are deducted from grosspremiums written, to arrive at net premiums written. Ceded premiums are earned over the terms of therelated contracts and policies, and are reflected as a reduction to gross premiums earned to arrive at netpremiums earned.
Income Taxes
Income taxes have been provided in accordance with the provisions of FASB Statement No. 109,Accounting for Income Taxes (“FAS 109”), on those operations which are subject to income tax. Deferredtax assets and liabilities result from temporary differences between the amounts recorded in ourconsolidated financial statements and the tax basis of the Company’s assets and liabilities. Such temporarydifferences are primarily due to the tax basis discount on unpaid losses and loss expenses, unearnedpremium reserves, net operating loss carryforwards, intangible assets, accrued expenses, deferred policyacquisition costs and certain investments. The effect on deferred tax assets and liabilities of a change in taxrates is recognized in income in the period that includes the enactment date. A valuation allowance againstdeferred tax assets is recorded if it is more likely than not that all, or some portion, of the benefits related todeferred tax assets will not be realized.
At December 31, 2008, our net deferred tax asset and valuation allowance were $17.0 million (2007 –$18.7 million) and $1.4 million (2007 – $3.1 million), respectively (see Note 17 of the consolidatedfinancial statements for more information). At each balance sheet date, we assess the need to establish avaluation allowance that reduces the net deferred tax asset when it is more likely than not that all, or someportion, of the deferred tax assets will not be realized. The valuation allowance is based on all availableinformation including projections of future taxable income from each tax-paying component in each taxjurisdiction. In 2008, 2007 and 2006, we generated cumulative taxable income in our U.S. tax-payingsubsidiaries which was offset by the utilization of a net operating loss carryforward. During 2008 and 2007,our valuation allowance was reassessed and we now believe that it is more likely than not that we willcontinue to generate taxable income in our U.S. tax-paying subsidiaries and therefore be able to recover allof our U.S. net deferred tax asset. As a result, we reduced our valuation allowance for the years endingDecember 31, 2008 and December 31, 2007 by $1.7 million and $25.8 million, respectively. This resultedin a corresponding increase to net income in 2008 and 2007, respectively. Projections of future taxableincome incorporate several assumptions of future business and operations that are likely to differ fromactual experience.
In June 2006, the FASB issued FASB Interpretation No. 48, Accounting for Uncertainty in Income Taxes(“FIN 48”). FIN 48 prescribes guidance for the financial statement recognition, measurement anddisclosure of uncertain tax positions recognized in an enterprise’s financial statements in accordance withFASB Statement No. 109, Accounting for Income Taxes. Tax positions must meet a more-likely-than-notrecognition threshold at the effective date to be recognized upon the adoption of FIN 48 and in subsequentperiods. FIN 48 became effective for us on January 1, 2007. The Company had no unrecognized taxbenefits upon adoption of FIN 48 and through the period ended December 31, 2008. Tax years endingDecember 31, 2005 through December 31, 2007 are open for examination by the Internal RevenueService.
88
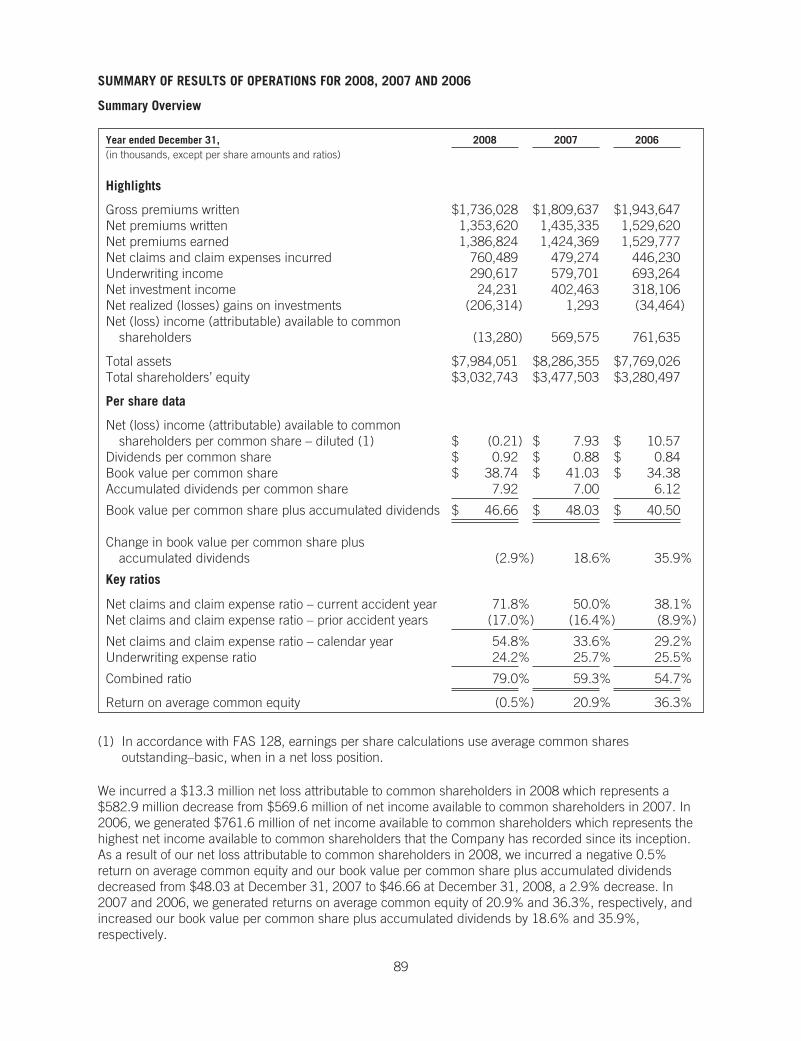
SUMMARY OF RESULTS OF OPERATIONS FOR 2008, 2007 AND 2006
Summary Overview
Year ended December 31, 2008 2007 2006(in thousands, except per share amounts and ratios)
Highlights
Gross premiums written $1,736,028 $1,809,637 $1,943,647Net premiums written 1,353,620 1,435,335 1,529,620Net premiums earned 1,386,824 1,424,369 1,529,777Net claims and claim expenses incurred 760,489 479,274 446,230Underwriting income 290,617 579,701 693,264Net investment income 24,231 402,463 318,106Net realized (losses) gains on investments (206,314) 1,293 (34,464)Net (loss) income (attributable) available to common
shareholders (13,280) 569,575 761,635
Total assets $7,984,051 $8,286,355 $7,769,026Total shareholders’ equity $3,032,743 $3,477,503 $3,280,497
Per share data
Net (loss) income (attributable) available to commonshareholders per common share – diluted (1) $ (0.21) $ 7.93 $ 10.57
Dividends per common share $ 0.92 $ 0.88 $ 0.84Book value per common share $ 38.74 $ 41.03 $ 34.38Accumulated dividends per common share 7.92 7.00 6.12
Book value per common share plus accumulated dividends $ 46.66 $ 48.03 $ 40.50
Change in book value per common share plusaccumulated dividends (2.9%) 18.6% 35.9%
Key ratios
Net claims and claim expense ratio – current accident year 71.8% 50.0% 38.1%Net claims and claim expense ratio – prior accident years (17.0%) (16.4%) (8.9%)
Net claims and claim expense ratio – calendar year 54.8% 33.6% 29.2%Underwriting expense ratio 24.2% 25.7% 25.5%
Combined ratio 79.0% 59.3% 54.7%
Return on average common equity (0.5%) 20.9% 36.3%
(1) In accordance with FAS 128, earnings per share calculations use average common sharesoutstanding–basic, when in a net loss position.
We incurred a $13.3 million net loss attributable to common shareholders in 2008 which represents a$582.9 million decrease from $569.6 million of net income available to common shareholders in 2007. In2006, we generated $761.6 million of net income available to common shareholders which represents thehighest net income available to common shareholders that the Company has recorded since its inception.As a result of our net loss attributable to common shareholders in 2008, we incurred a negative 0.5%return on average common equity and our book value per common share plus accumulated dividendsdecreased from $48.03 at December 31, 2007 to $46.66 at December 31, 2008, a 2.9% decrease. In2007 and 2006, we generated returns on average common equity of 20.9% and 36.3%, respectively, andincreased our book value per common share plus accumulated dividends by 18.6% and 35.9%,respectively.
89

During 2008, the most significant events affecting our financial performance on a comparative basis to2007 include:
• Lower Investment Results – our net investment income decreased $378.2 million to $24.2 millionin 2008 from $402.5 million in 2007, driven by $219.6 million of net investment losses within ourother investments, principally private equity partnerships, hedge funds and bank loan funds,which represents a $325.1 million decrease from $105.5 million of net investment income onthese investments in 2007. In addition, net investment income from our short term investmentsdecreased $70.0 million to $48.4 million in 2008 from $118.5 million in 2007, as a result of areduction in short term interest rates and lower average balances for these investments. Inaddition, other than temporary impairments in our portfolio of fixed maturity investments availablefor sale increased by $191.5 million in 2008 to $217.0 million, compared to $25.5 million in2007, primarily due to widening credit spreads as a result of the turmoil in the financial markets;
• Lower Underwriting Income – our underwriting income decreased $289.1 million to $290.6 millionin 2008 and our combined ratio increased 19.7 percentage points to 79.0% for the year,compared to $579.7 million of underwriting income and a combined ratio of 59.3% in 2007. Thedecrease in our underwriting income was principally driven by hurricanes Gustav and Ike, whichas described in more detail below, generated underwriting losses of $419.1 million and increasedour combined ratio by 32.3 percentage points; and
• Lower Minority Interest – our minority interest expense decreased $109.3 million to $55.1 millionin 2008, compared to $164.4 million in 2007, principally due to the reduction in net investmentincome and underwriting income as noted above which also impacted DaVinciRe and decreasedits net income in 2008 and consequently decreased our minority interest expense.
Following is supplemental financial data regarding the net financial statement impact on our results for2008 due to hurricanes Gustav and Ike:
Year ended December 31, 2008 Gustav Ike Total(in thousands, except ratios)
Net claims and claim expenses incurred $(77,013) $(391,018) $(468,031)Net reinstatement premiums earned 8,821 44,784 53,605Lost profit commissions (1,901) (2,789) (4,690)
Net impact on underwriting result (70,093) (349,023) (419,116)Minority interest–DaVinciRe 22,607 120,275 142,882
Net negative impact $(47,486) $(228,748) $(276,234)
Impact on combined ratio 5.2% 26.7% 32.3%
The net negative impact from hurricanes Gustav and Ike includes the sum of net claims and claim expensesincurred, assumed and ceded reinstatement premiums earned, lost profit commissions, assessment relatedlosses and expenses, and minority interest. Net negative impact is based on management’s estimatesfollowing a review of our potential exposures and discussions with our counterparties. Given the magnitudeand recent occurrence of these events, meaningful uncertainty remains regarding total covered losses for theinsurance industry and, accordingly, several of the key assumptions underlying our loss estimates. In addition,actual losses from these events may increase if the Company’s reinsurers or other obligors fail to meet theirobligations. Actual losses from these events will likely vary, perhaps materially, from these current estimatesdue to the inherent uncertainties in reserving for such losses, including the preliminary nature of the availableinformation, the potential inaccuracies and inadequacies in the data provided by clients and brokers, theinherent uncertainty of modeling techniques and the application of such techniques, the effects of anydemand surge on claims activity and complex coverage and other legal issues. Changes to these estimates willbe recorded in the periods in which they occur.
90

During 2007, the most significant events affecting our financial performance on a comparative basis to2006 include:
• Declining Premium Volume – a $105.4 million decrease in net premiums earned, due principallyto a softening of premium rates in the property and casualty market which resulted in a $134.0million, or 6.9% decrease, in the Company’s gross premiums written;
• Higher Current Accident Year Claims – a $129.6 million increase in current accident year netclaims and claims expenses, which was principally driven by $217.5 million of net claims andclaim expenses from Kyrill, flooding in the U.K. and sub-prime related casualty losses in ourReinsurance segment and partially offset by a $32.6 million decrease in current accident year netclaims and claim expenses within our Individual Risk segment as a result of lower premiumvolumes and therefore a lower level of attritional losses;
• ChannelRe Losses – a $167.2 million loss as a result of the reduction in the Company’s carriedvalue of ChannelRe to $nil due to estimated losses at ChannelRe which were driven by netunrealized mark-to-market losses in ChannelRe’s portfolio of financial guaranty contractsaccounted for as derivatives under GAAP;
• Prior Year Favorable Development – $233.2 million of favorable development on prior yearreserves, an increase of $96.6 million from 2006, including $93.1 million attributable to ourcatastrophe unit driven by a reduction in ultimate losses in the 2006 and 2005 accident years,and $101.3 million and $38.8 million attributable to our specialty unit and Individual Risksegment, respectively, principally due to lower than expected claims emergence; and
• Higher Net Investment Income – an $84.4 million increase in net investment income, inclusive ofa $39.8 million increase in net investment income from our other investments, due to higheraverage invested assets due to the generation of cash flow from operations during the last threeyears that has been invested in our investment portfolio, combined with higher average yields onour portfolio of fixed maturity investments available for sale, short term investments and otherinvestments.
The three most significant items impacting our 2006 financial performance on a comparative basis to 2005include:
• Higher Premium Volume – an increase in our net premiums earned, principally due to growth ingross premiums written in our catastrophe reinsurance unit where we found pricing and termsmore favorable in 2006 compared with 2005 and we chose to write more business in that unit in2006;
• Declining Claims – a significant decrease in net claims and claim expenses as a result of lightinsured catastrophe loss activity for 2006; our net claims and claims expenses were significantlyimpacted by hurricanes Katrina, Rita and Wilma in 2005, and losses of that magnitude did notoccur in 2006; and
• Higher Net Investment Income – a significant increase in net investment income due to higheraverage invested assets due to the generation of cash flow from operations during the year thatwas invested in our investment portfolio, combined with higher average yields on our portfolio offixed maturity investments available for sale and short term investments.
91

Underwriting Results by Segment
Reinsurance Segment
Below is a summary of the underwriting results and ratios for our Reinsurance segment followed by ananalysis of our property catastrophe reinsurance unit and specialty reinsurance unit underwriting resultsand ratios for the years ended December 31, 2008, 2007 and 2006:
Reinsurance segment overview
Year ended December 31, 2008 2007 2006(in thousands)
Gross premiums written (1) $1,154,391 $1,290,420 $1,321,163
Net premiums written $ 871,893 $1,024,493 $1,039,103
Net premiums earned 909,759 957,661 972,017Net claims and claim expenses incurred 440,900 241,118 148,052Acquisition expenses 105,437 119,915 115,324Operational expenses 81,797 67,969 72,405
Underwriting income $ 281,625 $ 528,659 $ 636,236
Net claims and claim expenses incurred – current accident year $ 629,022 $ 435,495 $ 273,286Net claims and claim expenses incurred – prior accident years (188,122) (194,377) (125,234)
Net claims and claim expenses incurred – total $ 440,900 $ 241,118 $ 148,052
Net claims and claim expense ratio – current accident year 69.1% 45.5% 28.1%Net claims and claim expense ratio – prior accident years (20.6%) (20.3%) (12.9%)
Net claims and claim expense ratio – calendar year 48.5% 25.2% 15.2%Underwriting expense ratio 20.5% 19.6% 19.3%
Combined ratio 69.0% 44.8% 34.5%
(1) Includes gross premiums ceded from the Individual Risk segment to the Reinsurance segment of $5.7million, $37.4 million and $66.9 million for the years ended December 31, 2008, 2007 and 2006,respectively.
Reinsurance Segment Gross Premiums Written – Gross premiums written in our Reinsurance segmentdecreased $136.0 million, or 10.5%, to $1,154.4 million in 2008, compared to $1,290.4 million in 2007,primarily due to the then softening market conditions in 2008 which resulted in lower premium rates and areduction in business that met our underwriting standards and partially offset by $58.4 million ofreinstatement premiums written following hurricanes Gustav and Ike. As discussed below, in 2007 weentered into a large transaction in our specialty reinsurance unit that renewed at a lower participation rateand on a smaller premium base in 2008, resulting in a $66.4 million decrease in gross premiums writtenfrom this contract in our Reinsurance segment, compared to 2007.
For 2007, our gross premiums written in our Reinsurance segment decreased by $30.7 million to $1,290.4million primarily due to softening market conditions in 2007 where the pricing for property catastrophereinsurance decreased from 2006. In addition, we believe that legislation passed in Florida in early 2007,expanding the size of its State-funded reinsurance and insurance facilities, caused a substantial decline inthe private reinsurance and insurance markets in and relating to Florida, and contributed to the decline inprivate industry property catastrophe gross premiums written in 2007 as compared to 2006. As discussedin more detail below, in 2007 we entered into a large transaction in our specialty reinsurance unit thatresulted in $98.8 million of gross premium written. In the absence of this contract, the Company’sReinsurance segment gross premiums written would have decreased further, compared to 2006.
For 2006, our gross premiums written in our Reinsurance segment increased by $118.2 million to $1,321.2million, compared to 2005, primarily due to the favorable pricing and terms experienced during our 2006catastrophe reinsurance renewals. The improved pricing and terms for our 2006 catastrophe reinsurance
92

renewals was principally driven by a hardening property catastrophe reinsurance market following the largecatastrophes occurring during 2005. In 2006, we also wrote $114.0 million of gross premiums on behalf oftwo new fully-collateralized joint ventures which were established to take advantage of the favorable pricingand terms in 2006. The increase in our catastrophe gross premiums written more than offset a significantdecline in our specialty reinsurance premium in 2006.
Gross Premiums Written by Geographic Region
The following is a summary of our gross reinsurance premiums written, excluding premiums assumed fromour Individual Risk segment, allocated to the territory of coverage exposure:
Reinsurance segment gross premiums written
2008 2007 2006
Year ended December 31,
GrossPremiumsWritten
Percentageof Gross
PremiumsWritten
GrossPremiumsWritten
Percentageof Gross
PremiumsWritten
GrossPremiumsWritten
Percentageof Gross
PremiumsWritten
(in thousands, except percentages)
Property catastrophe reinsuranceUnited States and Caribbean $ 745,016 64.8% $ 735,322 58.7% $ 792,311 63.1%Worldwide (excluding U.S) (1) 75,489 6.6 66,392 5.3 71,116 5.7Europe 72,153 6.3 111,702 8.9 73,500 5.9Worldwide 67,371 5.9 27,577 2.2 68,575 5.5Australia and New Zealand 5,455 0.5 4,360 0.3 2,732 0.2Other 23,465 2.0 20,374 1.6 23,972 1.9
Specialty reinsurance (2) 159,770 13.9 287,316 23.0 222,049 17.7
Total Reinsurance grosspremiums written (3) $1,148,719 100.0% $1,253,043 100.0% $1,254,255 100.0%
(1) The category “Worldwide (excluding U.S.)” consists of contracts that cover more than one geographicregion (other than the U.S.). The exposure in this category for gross written premiums written to date ispredominantly from Europe and Japan.
(2) The category Specialty reinsurance consists of contracts that are predominantly exposed to U.S. andworldwide risks.
(3) Reinsurance segment gross premiums written excludes $5.7 million, $37.4 million and $66.9 million ofpremiums assumed from the Individual Risk segment in 2008, 2007 and 2006, respectively.
Our property catastrophe reinsurance gross premiums written continues to be characterized by a largepercentage of U.S. and Caribbean premium as we have found business derived from exposures in Europeand the rest of the world to be, in general, less attractive on a risk-adjusted basis during recent periods. Asignificant amount of our U.S. and Caribbean premium provides coverage against windstorms, mainly U.S.Atlantic hurricanes, as well as earthquakes and other natural and man-made catastrophes.
Ceded Premiums Written
Year ended December 31, 2008 2007 2006(in thousands)
Ceded premiums written – Reinsurance segment $282,498 $265,927 $282,060
93

Due to the potential volatility of the property catastrophe reinsurance contracts which we sell, we purchasereinsurance to reduce our exposure to large losses and to help manage our risk portfolio. We use our REMS©
modeling system to evaluate how each purchase interacts with our portfolio of reinsurance contracts we write,and with the other ceded reinsurance contracts we purchase, to determine the appropriateness of the pricingof each contract and whether or not it helps us to balance our portfolio of risks.
Ceded premiums written increased by $16.6 million in 2008, primarily as a result of the Company electingto purchase additional reinsurance protection due to appropriately priced coverage being available during2008 and partially offset by the Company electing to not participate in a fully-collateralized joint venture dueto a decrease in demand for these vehicles in 2008 compared to 2007.
Ceded premiums written decreased by $16.1 million in 2007, primarily as a result of the Company’sdecreased utilization of fully-collateralized joint ventures during 2007. In 2007, the Company assumed$59.4 million of catastrophe reinsurance premium which was fully ceded to its fully-collateralized jointventures, primarily Starbound II, compared to 2006, where $114.0 million of assumed catastrophereinsurance premium was fully ceded to Starbound Re and Tim Re. The decrease in premium ceded tofully-collateralized joint ventures was due to a decrease in demand for these vehicles in 2007 compared to2006.
Ceded premiums written increased by $103.1 million in 2006, primarily as a result of the utilization in the2006 U.S. hurricane season of two fully-collateralized joint ventures, Starbound Re and Tim Re, pursuant towhich $114.0 million of assumed catastrophe reinsurance premium was fully ceded to those entities.
To the extent that appropriately priced coverage is available, we anticipate continued use of reinsurance toreduce the impact of large losses on our financial results and to manage our portfolio of risk; however, thebuying of ceded reinsurance in our Reinsurance segment is based on market opportunities and is notbased on placing a specific reinsurance program each year. In addition, in future periods we may utilize thegrowing market for cat-linked securities to expand our ceded reinsurance buying if we find the pricing andterms of such coverages attractive.
Reinsurance Segment Underwriting Results – Our Reinsurance segment generated $281.6 million ofunderwriting income and a combined ratio of 69.0% in 2008, representing a $247.0 million decrease inunderwriting income and a 24.2 percentage point increase in our combined ratio compared to 2007. Thedecrease in underwriting income in 2008 was principally driven by a $199.8 million increase in net claimsand claim expenses, principally driven by losses associated with hurricanes Gustav and Ike, combined witha $47.9 million decrease in net premiums earned due to the decrease in gross premiums written notedabove. Hurricanes Gustav and Ike resulted in $378.8 million in underwriting losses and increased theReinsurance segment’s combined ratio by 46.6 percentage points, as detailed in the table below. The mostsignificant losses in 2007 were from Kyrill, the U.K. floods and sub-prime related casualty losses whichcollectively resulted in $217.5 million of net claims and claim expenses.
ReinsuranceYear ended December 31, 2008 Gustav Ike Total(in thousands, except ratios)
Net claims and claim expenses incurred $(65,753) $(366,771) $(432,524)Net reinstatement premiums earned 8,821 49,575 58,396Lost profit commissions (1,901) (2,789) (4,690)
Net impact on underwriting result $(58,833) $(319,985) $(378,818)
Impact on combined ratio 6.8% 39.0% 46.6%
In 2007, we generated underwriting income of $528.7 million and recorded a net claims and claim expenseratio of 25.2%, an expense ratio of 19.6%, and a combined ratio of 44.8%, compared to $636.2 million ofunderwriting income, a net claims and claim expense ratio of 15.2%, an expense ratio of 19.3% and acombined ratio of 34.5%, in 2006. The decrease in underwriting income in 2007 was principally driven byan increase in net claims and claims expenses which was primarily due to $217.5 million of net claims and
94

claim expenses from Kyrill, the U.K. floods and sub-prime related casualty losses and partially offset by a$69.1 million increase in favorable development on prior year reserves. Hurricanes Katrina, Rita and Wilmaresulted in $1,076.1 million of net claims and claim expenses in 2005 and added 113.6 percentage pointsto our net claims and claim expense ratio in 2005. There was an absence of large, land falling hurricanesand other catastrophes impacting the insurance industry in 2007 and 2006, which substantially contributedto the significant improvement in our underwriting profits in 2007 and 2006, compared to 2005.
Our underwriting results over the last three years have been, and may well continue to be, impacted byprior year reserve development. Our prior year reserves experienced $188.1 million, $194.4 million and$125.2 million of net favorable development in 2008, 2007 and 2006, respectively. For 2008, the favorableprior year reserve development was principally the result of a reduction in ultimate net losses associatedwith the 2005 hurricanes, Katrina, Rita and Wilma. The favorable prior year reserve development in 2007was principally attributable to a reduction in our catastrophe unit ultimate losses related to the 2006 and2005 accident years, combined with continued lower than expected claims emergence in our specialty unit.The favorable prior year reserve development in 2006 was principally driven by our specialty reinsuranceunit as a result of the application of our formulaic reserving methodology for this book of business with thereductions being due to actual paid and reported loss activity being better than what we anticipated whensetting the initial IBNR reserves. In addition, within our specialty reinsurance unit, $46.0 million of thefavorable development in 2006 was driven by a reduction in carried reserves due to commutations.
Losses from our property catastrophe reinsurance and specialty reinsurance policies can be infrequent, butsevere, as demonstrated by our 2008 results compared to 2007 and 2006. During periods with low levels ofproperty catastrophe loss activity, such as 2007 and 2006, we have the potential to produce a low level oflosses and a related increase in underwriting income. As described above, we believe there has been anincrease in the frequency and severity of hurricanes that have the potential to make landfall in the U.S.,potentially as a result of decadal ocean water temperature cyclical trends, a longer-term trend towardsglobal warming, or both or other factors.
Our underwriting expenses consist of acquisition expenses and operational expenses. Acquisition expensesconsist of the costs to acquire premiums and are principally comprised of broker commissions and excisetaxes. Acquisition expenses are driven by contract terms and are normally a set percentage of premiumsand, accordingly, these costs will normally move in line with the fluctuation in gross premiums earned. In2008, the acquisition expense ratio of 11.6% was slightly lower than the 12.5% recorded in 2007. In 2006,the acquisition expense ratio was 11.9%.
Operating expenses consist of salaries and other general and administrative expenses. In 2008, operatingexpenses increased $13.8 million to $81.8 million primarily as a result of increased headcount and therelated increase in compensation, general and administrative expenses. Operating expenses decreased by$4.4 million to $68.0 million in 2007 when compared to 2006, principally due to the Company reviewingand updating its methodology for allocating certain operating expenses combined with an increase in feeincome as discussed below. Our operating expense ratio may increase over time, as a result of factorsincluding the absolute and comparative growth of our operating expenses, further refinements to internalexpense allocations, and market trends and dynamics.
We have entered into joint ventures and specialized quota share cessions of our book of business. Inaccordance with the joint venture and quota share agreements, we are entitled to certain fee income andprofit commissions. We record these fees and profit commissions as a reduction in acquisition andoperating expenses and, accordingly, these fees have reduced our underwriting expense ratios. These feestotaled $47.8 million, $29.5 million and $10.5 million in 2008, 2007 and 2006, respectively and resulted ina corresponding decrease to the underwriting expense ratio of 5.3%, 3.1% and 1.1% for the years endedDecember 31, 2008, 2007 and 2006, respectively. In addition, we are entitled to certain fee income andprofit commissions from DaVinci. Because the results of DaVinci, and its parent DaVinciRe, areconsolidated in our results of operations, these fees and profit commissions are eliminated in ourconsolidated financial statements and are principally reflected in minority interest. The net impact of all feesand profit commissions related to these joint ventures and specialized quota share cessions within ourReinsurance segment were $77.3 million, $80.6 million and $55.4 million for the years endingDecember 31, 2008, 2007 and 2006, respectively.
95

Catastrophe
Catastrophe overview
Year ended December 31, 2008 2007 2006
(in thousands, except percentages)
Property catastrophe gross premiums writtenRenaissance $ 633,611 $ 662,987 $ 773,638DaVinci 361,010 340,117 325,476
Total property catastrophe gross premiums written (1) $ 994,621 $1,003,104 $1,099,114
Net premiums written $ 712,341 $ 737,177 $ 817,054
Net premiums earned 717,570 726,265 733,777Net claims and claim expenses incurred 372,760 128,573 131,475Acquisition expenses 62,038 77,089 82,936Operational expenses 62,626 49,370 47,364
Underwriting income $ 220,146 $ 471,233 $ 472,002
Net claims and claim expenses incurred – current accidentyear $ 504,351 $ 221,662 $ 117,528
Net claims and claim expenses incurred – prior accidentyears (131,591) (93,089) 13,947
Net claims and claim expenses incurred – total $ 372,760 $ 128,573 $ 131,475
Net claims and claim expense ratio – current accident year 70.3% 30.5% 16.0%Net claims and claim expense ratio – prior accident years (18.4%) (12.8%) 1.9%
Net claims and claim expense ratio – calendar year 51.9% 17.7% 17.9%Underwriting expense ratio 17.4% 17.4% 17.8%
Combined ratio 69.3% 35.1% 35.7%
(1) Includes gross premiums written ceded from the Individual Risk segment to the catastrophe unit of$5.7 million, $37.0 million and $64.6 million for the years ended December 31, 2008, 2007 and 2006,respectively.
Catastrophe Reinsurance Gross Premiums Written – In 2008, our catastrophe reinsurance gross premiumswritten decreased $8.5 million, or 0.8%, to $994.6 million, compared to $1,003.1 million in 2007,principally due to the then softening market conditions in 2008 resulting in lower premium rates and areduction in business that met the Company’s underwriting standards, combined with a $31.3 milliondecrease in gross premiums written assumed from our Individual Risk segment. Offsetting these decreaseswas $58.4 million of reinstatement premiums written and earned as a result of hurricanes Gustav and Ikeduring 2008. In the absence of this loss related premium our catastrophe gross premiums written wouldhave decreased 6.7% in 2008 compared to the 0.8% decrease noted above.
Our catastrophe reinsurance gross premiums written decreased $96.0 million to $1,003.1 million in 2007,principally as a result of softening market conditions in 2007 where the pricing for property catastrophereinsurance decreased from 2006. In addition, we believe that legislation passed in Florida in early 2007,expanding the size of its State-funded reinsurance and insurance facilities, caused a substantial decline inthe private reinsurance and insurance markets in and relating to Florida, and contributed to the decline inprivate industry property catastrophe gross premiums written in 2007 as compared to 2006. Excludinggross premiums written assumed from our Individual Risk segment, our catastrophe gross premiumswritten decreased $68.4 million, or 6.6%, in 2007 compared to 2006.
96

During 2007, we wrote $59.4 million of gross premiums on behalf of Starbound II, a fully-collateralized jointventure, compared to 2006, when we wrote $114.0 million of gross premiums on behalf of two fully-collateralized joint ventures, Starbound Re and Tim Re, which were established to provide capacity to ourclients and take advantage of the favorable pricing and terms that were available. These premiums are fullyceded to the fully-collateralized joint ventures in return for a profit commission and expense override. Due tomarket conditions, the Company elected not to participate in a new fully-collateralized joint venture in 2008.
Our property catastrophe reinsurance gross premiums written continues to be characterized by a largepercentage of U.S. and Caribbean premium, as we have found business derived from exposures in Europeor the rest of the world to be, in general, less attractive on a risk-adjusted basis during recent periods. Asignificant amount of our U.S. and Caribbean premium provides coverage against windstorms, mainly U.S.Atlantic hurricanes, as well as earthquakes and other natural and man-made catastrophes.
Catastrophe Reinsurance Underwriting Results – Our 2008 catastrophe reinsurance unit underwritingresults were negatively impacted from losses associated with hurricanes Gustav and Ike. We generated$220.1 million of underwriting income and recorded a net claims and claims expense ratio of 51.9%,underwriting expense ratio of 17.4% and combined ratio of 69.3% in 2008, compared to $471.2 million ofunderwriting income, a net claims and claim expense ratio of 17.7%, underwriting expense ratio of 17.4%and a combined ratio of 35.1% in 2007. Our 2008 accident year net claims and claim expenses of $504.4million were $282.7 million higher than 2007, primarily as a result of losses associated with hurricanesGustav and Ike. Hurricanes Gustav and Ike added 60.2 percentage points to the catastrophe unit’scombined ratio as detailed in the table below.
Catastrophe
Year ended December 31, 2008 Gustav Ike Total(in thousands, except ratios)
Net claims and claim expenses incurred $(65,753) $(366,771) $(432,524)Net reinstatement premiums earned 8,821 49,575 58,396Lost profit commissions (1,901) (2,789) (4,690)
Net impact on underwriting result $(58,833) $(319,985) $(378,818)
Impact on combined ratio 8.7% 50.2% 60.2%
In 2007, our catastrophe reinsurance underwriting results benefited from a low level of insured U.S. landfalling hurricanes and were negatively impacted from losses associated with the U.K. flooding and Kyrill. Wegenerated $471.2 million of underwriting income and recorded a net claims and claims expense ratio of17.7%, underwriting expense ratio of 17.4% and combined ratio of 35.1%, compared to $472.0 million ofunderwriting income, a net claims and claims expense ratio of 17.9%, an underwriting expense ratio of17.8% and a combined ratio of 35.7%, in 2006. Our 2007 accident year net claims and claim expenses of$221.7 million were $104.1 million higher than 2006, primarily as a result of losses related to the U.K.floods and Kyrill, in the amounts of $72.2 million and $85.2 million, respectively. Our 2006 underwritingresults benefited by the low level of insured catastrophe losses in 2006, compared to 2005.
Our catastrophe reinsurance unit experienced $131.6 million of favorable development in 2008 principallyas a result of a reduction in ultimate net losses associated with the 2005 hurricanes, Katrina, Rita andWilma. In 2007, we experienced $93.1 million of favorable development which improved our calendar yearloss ratio by 12.8 percentage points, principally as a result of a reduction of ultimate losses for the 2006and 2005 accident years, due to lower than expected reported claims. In 2006, we experienced $13.9million of adverse development on prior year reserves, which increased our calendar year net claims andclaims expenses ratio by 1.9 percentage points. We cannot provide assurance that favorable reservereleases will continue, or that we will not experience unfavorable reserve development in the future.
97

Specialty
Specialty overview
Year ended December 31, 2008 2007 2006(in thousands, except percentages)
Specialty gross premiums writtenRenaissance $153,701 $ 277,882 $ 198,111DaVinci 6,069 9,434 23,938
Total specialty gross premiums written (1) $159,770 $ 287,316 $ 222,049
Net premiums written $159,552 $ 287,316 $ 222,049
Net premiums earned 192,189 231,396 238,240Net claims and claim expenses incurred 68,140 112,545 16,577Acquisition expenses 43,399 42,826 32,388Operational expenses 19,171 18,599 25,041
Underwriting income $ 61,479 $ 57,426 $ 164,234
Net claims and claim expenses incurred – current accidentyear $124,671 $ 213,833 $ 155,758
Net claims and claim expenses incurred – prior accident years (56,531) (101,288) (139,181)
Net claims and claim expenses incurred – total $ 68,140 $ 112,545 $ 16,577
Net claims and claim expense ratio – current accident year 64.9% 92.4% 65.4%Net claims and claim expense ratio – prior accident years (29.4%) (43.8%) (58.4%)
Net claims and claim expense ratio – calendar year 35.5% 48.6% 7.0%Underwriting expense ratio 32.5% 26.6% 24.1%
Combined ratio 68.0% 75.2% 31.1%
(1) Includes gross premiums written ceded from the Individual Risk segment to the Specialty unit of $nil,$0.4 million and $2.3 million for the years ended December 31, 2008, 2007 and 2006, respectively.
Specialty Reinsurance Gross Premiums Written – In 2008, our specialty reinsurance gross premiumswritten decreased $127.5 million, or 44.4%, to $159.8 million, compared to $287.3 million of grosspremiums written in 2007. The decrease is principally due to one new large contract in 2007 that renewedin 2008 at a lower participation rate and on a smaller premium base than in 2007, resulting in a $66.4million decrease in gross premiums written from this contract, combined with the then softening marketconditions experienced in 2008, compared to 2007, which impacted principally all lines of business.
Our specialty reinsurance gross premiums written increased by $65.3 million, or 29.4%, to $287.3 millionin 2007, primarily due to one large transaction that resulted in $98.8 million of gross premiums written. Inthe absence of this contract, our specialty reinsurance gross premiums written would have declined in2007, compared to 2006.
The decrease in our specialty reinsurance gross premiums written in 2006 was due to several factorsincluding the non-renewal of contracts due to clients in general retaining more risk, and our underwritersnon-renewing certain programs where the pricing and terms deteriorated to a point where we no longerfound the programs attractive enough for us to write. In addition, our 2006 specialty reinsurance grosspremiums written were negatively impacted by $28.3 million of return premium on contracts that werecommuted in 2006 which resulted in a corresponding decrease in gross premiums written.
Specialty Reinsurance Underwriting Results – In 2008, our specialty reinsurance unit generatedunderwriting income of $61.5 million, a net claims and claim expense ratio of 35.5%, underwriting expenseratio of 32.5% and a combined ratio of 68.0%, compared to $57.4 million of underwriting income, a netclaims and claim expense ratio of 48.6%, underwriting expense ratio of 26.6% and a combined ratio of
98

75.2% in 2007. The increase in underwriting income and decrease in the combined ratio in 2008 wasprimarily due to a decrease in net claims and claim expenses as a result of a $60.0 million reserve forcasualty clash losses related to sub-prime events being established in the fourth quarter of 2007. Netunderwriting losses in 2008 associated with sub-prime related losses as well as the Madoff matter, botharising out of exposures within our casualty clash line of business, were $2.5 million and $15.0 million,respectively, with the 2008 sub-prime related losses decreasing significantly from 2007. The decrease innet claims and claim expenses was partially offset by a decrease in net premiums earned as a result of thedecrease in gross premiums written, as noted above.
During 2007, our specialty reinsurance unit generated underwriting income of $57.4 million, a net claimsand claim expense ratio of 48.6%, underwriting expense ratio of 26.6% and combined ratio of 75.2%,compared to $164.2 million of underwriting income, a net claims and claim expense ratio of 7.0%, anunderwriting expense ratio of 24.1% and a combined ratio of 31.1%, in 2006. The decrease in underwritingincome was primarily due to a higher level of loss activity in the 2007 accident year compared with 2006,specifically, $60.0 million of net claims and claim expenses as a result of sub-prime related casualty lossesarising in our casualty clash book of business, which added 25.9 percentage points to our 2007 net claimsand claim expense ratio.
Our specialty reinsurance unit experienced favorable development on prior year reserves of $56.5 million,$101.3 million and $139.2 million, in 2008, 2007 and 2006, respectively. The favorable development onprior year reserves in 2008 was due to reported claim activity being less than expected. The reductions inour prior year reserves in 2007 and 2006 were principally driven by the application of our formulaicreserving methodology used for this book of business with the decrease being due to actual paid andreported loss activity coming in better than what we anticipated when setting the initial reserve estimates.Our 2007 accident year was also favorably impacted by a reduction to our initial expected loss ratios for twolines of business. In addition, during 2006, $46.0 million of the $139.2 million favorable development in ourspecialty reinsurance unit was driven by a reduction in carried reserves due to commutations. Sinceestablishing the specialty reinsurance business unit in 2002, reported claim activity has been less thanexpected and therefore we have adjusted our estimated loss reporting patterns to reflect this experience.We cannot provide assurance that favorable reserve releases will continue, or that we will not experienceunfavorable reserve development in the future.
99

Individual Risk Segment
Below is a summary of the underwriting results and ratios for the years ended December 31, 2008, 2007and 2006 for our Individual Risk segment:
Individual Risk segment overview
Year ended December 31, 2008 2007 2006(in thousands, except percentages)
Gross premiums written $587,309 $556,594 $689,392
Net premiums written $481,727 $410,842 $490,517
Net premiums earned $477,065 $466,708 $557,760Net claims and claim expenses incurred 319,589 238,156 298,178Acquisition expenses 108,116 135,015 165,373Operational expenses 40,368 42,495 37,181
Underwriting income $ 8,992 $ 51,042 $ 57,028
Net claims and claim expenses incurred – current accidentyear $366,294 $276,929 $309,502
Net claims and claim expenses incurred – prior accidentyears (46,705) (38,773) (11,324)
Net claims and claim expenses incurred – total $319,589 $238,156 $298,178
Net claims and claim expense ratio – current accident year 76.8% 59.3% 55.5%Net claims and claim expense ratio – prior accident years (9.8%) (8.3%) (2.0%)
Net claims and claim expense ratio – calendar year 67.0% 51.0% 53.5%Underwriting expense ratio 31.1% 38.1% 36.3%
Combined ratio 98.1% 89.1% 89.8%
Individual Risk Segment Gross Premiums Written – The following table shows our Individual Risk grosspremiums written by major type of business for the years ended December 31, 2008, 2007 and 2006:
2008 2007 2006
Year ended December 31,
GrossPremiumsWritten
Percentageof Gross
PremiumsWritten
GrossPremiumsWritten
Percentageof Gross
PremiumsWritten
GrossPremiumsWritten
Percentageof Gross
PremiumsWritten
(in thousands, except percentages)
Individual Risk gross premiums writtenMulti-peril crop $272,559 46.4% $178,728 32.1% $129,908 18.9%Commercial property 134,601 23.0 164,438 29.5 226,205 32.8Commercial multi-line 119,987 20.4 162,422 29.2 229,079 33.2Personal lines property 60,162 10.2 51,006 9.2 104,200 15.1
Total Individual Risk gross premiumswritten $587,309 100.0% $556,594 100.0% $689,392 100.0%
Gross premiums written for our Individual Risk segment increased $30.7 million, or 5.5%, to $587.3 millionin 2008, compared to $556.6 million in 2007. The increase in gross premiums written for our IndividualRisk segment is primarily due to a $93.8 million increase in the multi-peril crop insurance line of businessdue principally to higher commodity prices and in part due to more insured acres, and partially offset byreductions in the commercial property and commercial multi-line businesses where managementmaintained underwriting discipline in the then increasingly softening U.S. property and casualty market.
100

Our Individual Risk gross premiums written decreased by $132.8 million to $556.6 million in 2007,compared to 2006. Our Individual Risk segment’s commercial multi-line, commercial property and personallines property lines of business all experienced declines in gross premiums written compared to the sameperiod in 2006. The $61.8 million decrease in commercial property gross premiums written was due to theCompany terminating one large commercial property quota share contract in the second quarter of 2007combined with softening rates in the California earthquake commercial property market resulting in adecrease in business that met the Company’s return hurdles. In addition, the personal lines property grosspremiums written experienced a $53.2 million decrease principally due to the Company’s decision in 2007to reduce its exposure to this market and redeploy its capacity within the property catastrophe excess ofloss reinsurance market within the Company’s Reinsurance segment where the Company found pricing andterms more attractive.
Business obtained through our third party program managers was surpassed by business obtained througha wholly owned program manager in 2008 as the largest portion of our Individual Risk segment grosspremiums written as detailed in the table below.
2008 2007 2006
Year ended December 31,
GrossPremiumsWritten
Percentageof Gross
PremiumsWritten
GrossPremiumsWritten
Percentageof Gross
PremiumsWritten
GrossPremiumsWritten
Percentageof Gross
PremiumsWritten
(in thousands, except percentages)
Individual Risk gross premiums writtenProgram managers – wholly
owned (1) $272,559 46.4% $178,728 32.1% $129,908 18.9%Program managers – third party 216,880 36.9 235,849 42.4 305,299 44.3Quota share reinsurance 97,444 16.6 139,952 25.1 238,066 34.5Broker-produced business 426 0.1 2,065 0.4 16,119 2.3
Total Individual Risk gross premiumswritten $587,309 100.0% $556,594 100.0% $689,392 100.0%
(1) Program managers – wholly owned represents Agro National which we acquired in an asset purchaseon June 2, 2008. The table above is presented as if Agro National has been a wholly-owned subsidiarysince the first period presented.
On June 2, 2008, the Company acquired substantially all the assets and assumed certain liabilities of AgroNational, LLC for $80.5 million. Agro National is based in Council Bluffs, Iowa and is a managing generalunderwriter of multi-peril crop insurance. Agro National offers high quality risk protection products andservices to the agricultural community throughout the U.S. Agro National participates in the U.S. Federalgovernment’s Multi-Peril Crop Insurance Program and has been writing business on behalf of Stonington, awholly owned subsidiary of the Company, since 2004. The acquisition was undertaken to purchase thedistribution channel for the Company’s multi-peril crop insurance business which was previously conductedthrough a managing general agency contractual relationship with Agro National, LLC. With the acquisition ofthe net assets of Agro National, LLC in 2008 we intend to invest in this line of business and plan to continueto increase our gross premiums written for this business, subject to market conditions. The premium andunderwriting results associated with this business can be volatile, driven principally by changes incommodity prices and weather events in the U.S. which impacts the price and yield of the insured cropsand correspondingly also impacts the premium charged for the policies issued and the net claims andclaim expenses incurred. Due to the growing proportion of this line of business within our Individual Riskresults, we expect this potential volatility to increase.
101

Ceded Premiums Written
Year ended December 31, 2008 2007 2006(in thousands)
Ceded premiums written – Individual Risk segment (1) $105,582 $145,752 $198,875
(1) Includes $5.7 million, $37.4 million and $66.9 million of premium ceded to our Reinsurance segmentin 2008, 2007 and 2006, respectively.
We purchase reinsurance to reduce our exposure to large losses and to help manage our portfolio of risks.Ceded premiums written in our Individual Risk segment during 2008 decreased by $40.2 million to $105.6million, principally due to a $31.7 million decrease in intercompany ceded premiums written from ourIndividual Risk segment to our Reinsurance segment, as discussed below. The decrease in cededpremiums written in 2007 compared with 2006 was principally due to the termination of one program thatwas fully ceded in prior years.
Individual Risk Segment Underwriting Results – Our Individual Risk segment generated $9.0 million ofunderwriting income and recorded a net claims and claim expense ratio of 67.0%, an expense ratio of31.1% and a combined ratio of 98.1%, compared to $51.0 million of underwriting income, a net claims andclaim expense ratio of 51.0%, an expense ratio of 38.1% and a combined ratio of 89.1%, in 2007. Thedecrease in our Individual Risk segment underwriting income in 2008 was principally driven by an increasein net claims and claim expenses incurred of $81.4 million, principally due to $35.4 million of net incurredlosses associated with hurricanes Gustav and Ike, and a higher level of attritional losses in our multi-perilcrop insurance line of business. Hurricanes Gustav and Ike resulted in $40.2 million of underwriting losses,inclusive of $4.8 million of ceded reinstatement premiums earned, and added 8.4 percentage points to ourIndividual Risk segment’s 2008 combined ratio, as detailed in the table below.
Individual Risk
Year ended December 31, 2008 Gustav Ike Total(in thousands, except ratios)
Net claims and claim expenses incurred $(11,260) $(24,247) $(35,507)Net reinstatement premiums earned — (4,791) (4,791)Lost profit commissions — — —
Net impact on underwriting result $(11,260) $(29,038) $(40,298)
Impact on combined ratio 2.3% 6.0% 8.4%
In 2007 and 2006, the Individual Risk current accident year net claims and claim expense ratios werepositively impacted by the absence of large losses as a result of minimal catastrophe loss activity in the U.S.
102

Our Individual Risk segment purchases reinsurance from our Reinsurance segment. As detailed in the tablebelow, our Individual Risk segment ceded $5.7 million, $37.4 million and $66.9 million of premiums to theReinsurance segment in 2008, 2007 and 2006, respectively. In addition, our Individual Risksegment ceded losses to our Reinsurance segment of $7.1 million, negative $0.3 million and $8.6 million in2008, 2007 and 2006, respectively. The net result of these transactions to the Individual Risk segment wasan underwriting loss of $9.2 million, $42.6 million and $42.1 million in 2008, 2007 and 2006,respectively. There was a corresponding opposite effect on our Reinsurance segment underwriting resultsas a result of this reinsurance. We believe the terms of such cessions are on an arm’s length basis.
Year ended December 31, 2008 2007 2006(in thousands)
Premiums ceded to Reinsurance segment $ (5,672) $(37,377) $(66,907)
Ceded premiums earned $(16,338) $(42,230) $(50,681)Claims and claim expenses incurred 7,121 (324) 8,629
Underwriting loss $ (9,217) $(42,554) $(42,052)
Also impacting the underwriting result in 2008, 2007 and 2006 were reductions of prior years’ estimatedultimate net claims reserves of $46.7 million, $38.8 million and $11.3 million, respectively. The reduction inprior years’ estimated ultimate net claims reserves was principally driven by the application of our formulaicreserving methodology used for the Individual Risk book of business and is primarily due to actual paid andreported loss activity being better than what we had anticipated when estimating the initial ultimate claimsand claims expense ratios and the initial loss reporting patterns. In addition, during 2008 we revised ourreported loss development patterns for several of our liability lines of business to reflect the Company’sactual experience to date with these lines. The impact of this was a $7.8 million reduction in prior yearreserves.
Our underwriting expenses consist of acquisition expenses and operational expenses. Acquisition expensesconsist of costs to acquire premiums and are comprised of fees and expenses paid to: 1) third partyprogram managers, who source primary insurance premiums for us through specialized programs; 2)primary insurers, for whom we write quota share reinsurance; and 3) broker commissions and excise taxespaid to brokers, who source insurance for us on a risk-by-risk basis. Acquisition expenses are driven bycontract terms and are generally determined based on a set percentage of premiums. Acquisition expensesas a percentage of net premiums earned decreased in 2008 to 22.7%, compared to 28.9% and 29.6% in2007 and 2006, respectively. The decrease in the acquisition expense ratio is principally a result of ourmulti-peril crop line of business having a relatively lower expense ratio when compared to other lines ofbusiness and increasing as a percentage of gross premiums written by our Individual Risk segment. Inaddition, certain components of underwriting expenses that were incurred in 2007 with respect to the multi-peril crop business are no longer reflected due to our acquisition of substantially all of the assets of AgroNational, LLC, the agency that produces this business, in the second quarter of 2008. Operating expensesconsist of compensation and other general and administrative expenses. Our Individual Risk businesshistorically operated with a relatively small number of employees and, accordingly, we have outsourcedmuch of the administration in our Individual Risk business to third party program managers and third partyadministrators, however we continuously monitor and analyze opportunities to internalize such services,such as with Glencoe Claims. Operating expenses in our Individual Risk segment remained relatively flat at$40.4 million in 2008 compared to $42.5 million in 2007, and $37.2 million in 2006. As noted above, wehave been investing in our multi-peril crop insurance business as well as certain other lines of business andwe currently expect our operating expenses to increase, both on an absolute basis and as a percentage ofnet premiums earned, in 2009.
103

Net Investment Income
Year ended December 31, 2008 2007 2006(in thousands)
Fixed maturity investments available for sale $ 201,220 $176,785 $158,516Short term investments 48,437 118,483 92,818Other investments
Hedge funds and private equity investments (101,779) 87,985 50,333Other (117,867) 17,469 15,335
Cash and cash equivalents 7,452 11,026 8,552Dividends on equity investment in reinsurance company — — 317
37,463 411,748 325,871Investment expenses (13,232) (9,285) (7,765)
Net investment income $ 24,231 $402,463 $318,106
Net investment income for 2008 was $24.2 million, compared to $402.5 million during 2007, a decrease of$378.2 million, as a result of lower returns in our investment portfolio mainly driven by our otherinvestments. Other investments incurred a net investment loss of $219.6 million in 2008 compared with$105.5 million of net investment income in 2007, a decrease of $325.1 million. Included in the netinvestment loss from other investments is a $101.8 million loss from hedge funds and private equityinvestments in 2008 compared to $88.0 million of net investment income from these funds in 2007, adecrease of $189.8 million. Also included in net investment loss from other investments in 2008 is a$117.9 million loss related primarily to senior secured bank loan funds and non-U.S. fixed income fundscompared to $17.5 million of net investment income from these funds in 2007, a decrease of $135.3million. The results from the Company’s other investments described above include net unrealized losses of$259.4 million in 2008, compared to net unrealized gains of $47.3 million in 2007.
The fair value of certain of our other investments, which principally include hedge funds, private equitypartnerships, senior secured bank loan funds and non-U.S. fixed income funds, is generally established onthe basis of the net valuation criteria established by the managers of such investments, if applicable. Thesenet valuations are determined based upon the valuation criteria established by the governing documents ofsuch investments. Such valuations may differ significantly from the values that would have been used hadready markets existed for the shares, partnership interests or notes. Many of our fund investments aresubject to restrictions on redemptions and sales which are determined by the governing documents andlimit our ability to liquidate these investments in the short term. In addition, due to a lag in reporting, someof our fund managers, fund administrators, or both, are unable to provide final fund valuations as of ourcurrent reporting date. In these circumstances, we estimate the fair value of these funds by starting with theprior month’s or quarter’s fund valuation, adjusting these valuations for capital calls, redemptions ordistributions and the impact of changes in foreign currency exchange rates, and then estimating the returnfor the current period. In circumstances in which we estimate the return for the current period, we use allcredible information available to us. This principally includes preliminary estimates reported to us by ourfund managers, obtaining the valuation of underlying portfolio investments where such underlyinginvestments are publicly traded and therefore have a readily observable price, using information that isavailable to us with respect to the underlying investments, reviewing various indices for similar investmentsor asset classes, as well as estimating returns based on the results of similar types of investments for whichwe have reported results, or other valuation methods, as necessary. Actual final fund valuations may differfrom our estimates, perhaps materially so, and these differences are recorded in the period they becomeknown as a change in estimate. Our estimate of the fair value of catastrophe bonds are based on quotedmarket prices, or when such prices are not available, by reference to broker or underwriter bid indications.
104

Net investment income from fixed maturity investments available for sale increased $24.4 million to $201.2million in 2008 compared to $176.8 million in 2007 due to higher returns on these investments due in partto a widening of credit spreads. Net investment income from short term investments decreased $70.0million in 2008 to $48.4 million from $118.5 million in 2007, principally due to a decrease in short terminterest rates as well as a decrease in average balances for these investments as a result of our sharerepurchases during 2008.
Net investment income increased by $84.4 million to $402.5 million in 2007, compared to $318.1 millionin 2006. The increase in net investment income in 2007 and 2006 was a result of both higher investmentreturns and an increasing level of average invested assets in 2007 and 2006. The increase in investedassets is due to the positive cash flow generated from our operating activities which we generated in 2007and 2006, and which we have deployed into our invested assets. Our other investments, which includehedge funds, private equity funds and other alternative investments, generated $105.5 million of netinvestment income in 2007 compared to $65.7 million in 2006.
The recent reduction in the Federal Funds rate by the Board of Governors of the Federal Reserve Boardand corresponding decline in interest rates as well as the overall poor economic conditions and turmoil inthe financial and investment markets will likely continue to put downward pressure on our net investmentincome for the foreseeable future.
Net Realized (Losses) Gains on Investments
Year ended December 31, 2008 2007 2006(in thousands)
Gross realized gains $ 99,634 $ 35,923 $ 21,034Gross realized losses (88,934) (9,117) (9,097)Other than temporary impairments (217,014) (25,513) (46,401)
Net realized (losses) gains on investments $(206,314) $ 1,293 $(34,464)
Our investment portfolio is structured to preserve capital and provide us with a high level of liquidity. A largemajority of our investments are invested in the fixed income markets and, therefore, our realized holdinggains and losses on investments are highly correlated to fluctuations in interest rates. Therefore, as interestrates decline, we will tend to have realized gains from the turnover of our investment portfolio, and asinterest rates rise, we will tend to have realized losses from the turnover of our investment portfolio.
Net realized investment gains and losses totaled $99.6 million and $88.9 million, respectively, during 2008,compared to $35.9 million and $9.1 million, respectively, in 2007. Included in net realized (losses) gainsare $217.0 million and $25.5 million of other than temporary impairment charges related to fixed maturityinvestments available for sale in 2008 and 2007, respectively. Other than temporary impairments in 2008were driven by the turmoil in the financial markets and widening credit spreads. During 2007, our $25.5million of other than temporary impairment charges was a result of a falling interest rate environment duringthe year which resulted in lower unrealized losses on our fixed maturity securities, prior to the recognition ofother than temporary impairment losses on such securities. Credit-related other than temporary impairmentcharges totaled $8.3 million and $nil for 2008 and 2007, respectively. The credit-related other thantemporary impairment charges in 2008, which includes impairments for which the Company believes it willnot be able to recover the full principal amount if held to maturity, were principally driven by our directholdings of fixed maturity securities issued by Lehman Brothers. The Company had essentially no fixedmaturity investments available for sale in an unrealized loss position at December 31, 2008.
105

Equity in Earnings (Losses) of Other Ventures
Year ended December 31, 2008 2007 2006(in thousands)
Top Layer Re $11,377 $ 14,949 $12,703Starbound II 3,202 2,472 —Tower Hill and Tower Hill Companies 545 3,432 602ChannelRe — (151,751) 19,097Other (1,521) 2,289 2,126
Total equity in earnings (losses) of other ventures $13,603 $(128,609) $34,528
Equity in earnings (losses) of other ventures primarily represents our pro-rata share of the net income (loss)from our investments in Top Layer Re, Starbound II, Tower Hill, ChannelRe and Starbound for 2007 andalso includes the Tower Hill Companies for 2008.
On July 1, 2008, the Company invested $50.0 million in the Tower Hill Companies representing a 25.0%equity ownership. Included in the purchase price was $40.0 million of other intangibles and $7.8 million ofgoodwill and in accordance with GAAP, these items are recorded as “Investments in other ventures, underequity method” rather than “Goodwill and other intangibles” on the Company’s consolidated balance sheet.The Company’s share of the equity in earnings of the Tower Hill Companies is recorded one quarter inarrears.
Equity in earnings (losses) of other ventures generated $13.6 million in income in 2008, compared to a lossof $128.6 million in 2007. The increase is primarily due to the absence of any additional losses related toChannelRe, since ChannelRe is in a negative shareholders’ equity position, and consequently, ourinvestment in ChannelRe continued to be carried at $nil during 2008. Until such time as ChannelRe’sshareholders’ equity is positive, we will not record any equity in earnings in our investment in ChannelRe. Itis possible that with the adoption of FAS 157 by ChannelRe in 2008, that in future periods thenonperformance risk or own credit risk portion of ChannelRe’s mark-to-market on its financial guarantycontracts accounted for as derivatives under GAAP may increase, or that the underlying mark-to-market onChannelRe’s financial guaranty contracts accounted for as derivatives under GAAP may decrease, or both,which could result in ChannelRe returning to a positive equity position, at which time we would then recordour share of ChannelRe’s net income, subject to impairment, or our share of ChannelRe’s net loss. Theequity pick-up for our earnings in ChannelRe and Tower Hill is recorded one quarter in arrears. Due tomarket conditions, the Company elected not to participate in a new fully collateralized joint venture in 2008,such as Starbound II in 2007 and Starbound in 2006.
Following is a summary of our equity in earnings (losses) of ChannelRe.
Year ended December 31, 2008 2007 2006(in thousands)
Equity in earnings of ChannelRe excluding unrealized mark-to-marketlosses $ — $ 15,420 $19,097
Equity in ChannelRe unrealized mark-to-market losses — (167,171) —
Total equity in (losses) earnings of ChannelRe $ — $(151,751) $19,097
As discussed above, we reduced the carried value of our investment in ChannelRe to $nil in 2007 and untilsuch time as ChannelRe’s shareholders’ equity is positive, we will not record any equity in earnings in ourinvestment in ChannelRe. In 2007, our share of ChannelRe’s earnings was impacted by $167.2 million ofnegative mark-to-market losses. These mark-to-market losses were primarily driven by a widening of creditspreads and a lack of liquidity in 2007 which was primarily driven by issues related to the sub-primemarket.
106

Other Income (Loss)
Year ended December 31, 2008 2007 2006(in thousands)
Weather and energy products and trading $25,122 $ (8,781) $(2,196)Catastrophe-linked securities 2,176 1,988 —Fee income 15 8,468 8,072Mark-to-market on Platinum warrant (538) 5,468 (1,687)Weather-related and loss mitigation (9,072) (11,405) (4,972)Assumed and ceded reinsurance contracts accounted for as derivatives
and deposits (9,739) (35,453) (6,816)Other 2,288 1,785 3,682
Total other income (loss) $10,252 $(37,930) $(3,917)
In 2008, we generated $10.3 million of other income compared to a loss of $37.9 million in 2007. The$48.2 million increase in other income was primarily due to a $33.9 million increase in our weather andenergy products and trading activities and a $25.7 million decrease in other loss from our assumed andceded reinsurance contracts accounted for at fair value or deposits, principally due to the expiration andnon-renewal of several of these contracts. We have expanded our weather and energy products and tradingactivities in the last three years to include products such as weather derivatives and energy derivatives. Theweather and energy products and trading results include net realized and unrealized gains and losses onagreements with end users and net realized and unrealized gains and losses on hedging and tradingactivities. The end users contracts we enter into and our trading activities are based in part on proprietaryweather forecasts provided to us by our Weather Predict subsidiary. The weather products and tradingactivities in which we engage are both seasonal and volatile, and there is no assurance that ourperformance to date will be indicative of future periods. Partially offsetting these items was a decrease in feeincome due to the September 30, 2007 expiration of our services agreement with Platinum and a $6.0million decrease in the fair value on our warrant to purchase 2.5 million shares of Platinum common stockas a result of a decrease in the common share price of Platinum.
Corporate Expenses
Year ended December 31, 2008 2007 2006(in thousands)
Other corporate expenses $21,668 $23,173 $19,091Internal review and external investigation related expenses 3,967 5,687 5,327
Total corporate expenses $25,635 $28,860 $24,418
Corporate expenses include certain executive, legal and consulting expenses, costs for research anddevelopment, and other miscellaneous costs associated with operating as a publicly traded company.Corporate expenses decreased $3.2 million in 2008, compared to 2007, primarily due to a $1.7 milliondecrease in internal review and external investigation related expenses and a $1.5 million decrease in othercorporate expenses.
107

Interest, Capital Securities and Preferred Share Dividends
Year ended December 31, 2008 2007 2006(in thousands)
Interest – DaVinciRe revolving credit facility $ 8,678 $12,167 $ 8,549Interest – RenaissanceRe revolving credit facility 3,050 — 5,165Interest – $150 million 7.0% Senior Notes 5,688 10,500 10,500Interest – $100 million 5.875% Senior Notes 5,875 5,875 5,875Interest – $103.1 million subordinated obligation to Capital Trust — 4,818 7,227Other 1,342 266 286
Total interest expense 24,633 33,626 37,602
Dividends – $150 million 8.10% Series A Preference Shares — 561 12,150Dividends – $100 million 7.30% Series B Preference Shares 7,300 7,300 7,300Dividends – $250 million 6.08% Series C Preference Shares 15,200 15,200 15,200Dividends – $300 million 6.60% Series D Preference Shares 19,800 19,800 825
Total preferred share dividends 42,300 42,861 35,475
Total interest expense and preferred share dividends $66,933 $76,487 $73,077
During 2008, our interest expense decreased $9.0 million to $24.6 million compared to $33.6 million in2007 primarily as a result of the repayment at maturity of our 7.0% Senior Notes, which came due July 15,2008, combined with the 2007 extinguishment of the subordinated obligation to Capital Trust, as detailedbelow, which resulted in the Company not having any further interest expense under this agreement during2008. Offsetting these decreases was an increase in interest expense on our revolving credit facility as weborrowed $150.0 million under this facility to repay the 7.0% Senior Notes, described above. The averageinterest rate on this borrowing was 4.2%, therefore lower than the 7.0% coupon rate on the Senior Notes.Preferred share dividends remained relatively constant in 2008, when compared to 2007.
During 2007, our interest expense decreased primarily as a result of not having any balances outstandingunder our $500.0 million revolving credit facility during the year, offset with the drawdown of $100.0 millionin 2006, on the revolving credit facility of DaVinciRe. In addition, interest on these facilities is based on avariable base rate which increased in 2007, compared to 2006. The subordinated obligation to Capital Trustwas extinguished during the year, resulting in a decrease of $2.4 million in interest expense. Preferreddividends increased by $7.4 million due to the issuance of $300.0 million of Series D Preference Shares inDecember 2006. We redeemed our Series A Preference Shares and our $103.1 million subordinatedobligation to the Capital Trust on January 16, 2007 and March 1, 2007, respectively.
During 2006, our interest expense increased primarily as a result of $150.0 million outstanding under our$500.0 million revolving line credit facility for a portion of the year, combined with the drawdown of $60.0million and $40.0 million in April 2006 and December 2006, respectively, on the revolving credit facility ofDaVinciRe. In addition, interest on these facilities is based on a variable base rate which increased in 2006,compared to 2005. Preferred dividends increased by $0.8 million due to the issuance of $300.0 million ofSeries D Preference Shares in December 2006.
Minority Interest – DaVinciRe
Year ended December 31, 2008 2007 2006(in thousands)
Minority interest – DaVinciRe $(55,133) $(164,396) $(144,159)
In October 2001, we formed DaVinciRe and DaVinci with other equity investors. The Company owns aminority economic interest in DaVinciRe; however, because the Company controls a majority of DaVinciRe’soutstanding voting rights, the consolidated financial statements of DaVinciRe are included in theconsolidated financial statements of the Company. Minority interest represents the portion of DaVinciRe’s
108

earnings owned by third parties for the years ended December 31, 2008, 2007 and 2006. In 2008, 2007and 2006, DaVinciRe generated net income which resulted in a minority interest expense to the Company.Our economic ownership interest in DaVinciRe at December 31, 2008, 2007 and 2006 was approximately22.8%, 20.5% and 20.5%, respectively.
On January 30, 2009, the Company purchased the shares of certain third party DaVinciRe shareholders for$145.5 million, less a $21.8 million reserve holdback. The purchase price is based on GAAP book value asof December 31, 2008. As a result of these purchases, the Company’s ownership interest in DaVinciReincreased to 37.6%. The Company expects its ownership in DaVinciRe to fluctuate over time.
Income Tax (Expense) Benefit
Year ended December 31, 2008 2007 2006(in thousands)
Income tax (expense) benefit $(568) $18,432 $(935)
We are subject to income taxes in certain jurisdictions in which we operate; however, since the majority ofour income is currently earned in Bermuda, a non-taxable jurisdiction, the tax impact to our operations hashistorically been minimal. In 2008, 2007 and 2006, we generated cumulative taxable income in our U.S.tax-paying subsidiaries. This taxable income was offset by the utilization of a net operating losscarryforward. During 2008 and 2007, our valuation allowance was reassessed and we now believe that it ismore likely than not that we will continue to generate taxable income in our U.S. tax-paying insurancesubsidiaries and therefore be able to recover all of our U.S. net deferred tax asset. As a result, our valuationallowance was reduced by $1.7 million and $25.8 million in 2008 and 2007, respectively, and there was acorresponding decrease to income tax expense and increase to our net income. This resulted in an incometax benefit in 2007. Our valuation allowance totaled $1.4 million and $3.1 million at December 31, 2008and 2007, respectively. The remaining valuation allowance as of December 31, 2008 relates exclusively toour operations in Ireland. The income tax expense in 2006 primarily relates to alternative minimum taxesincurred by our U.S. subsidiaries. We expect our consolidated effective tax rate to increase in the future, asour global operations expand.
LIQUIDITY AND CAPITAL RESOURCES
Financial Condition
RenaissanceRe is a holding company, and we therefore rely on dividends from our subsidiaries andinvestment income to make principal and interest payments on our debt and to make dividend payments toour preference and common shareholders.
The payment of dividends by our U.S. and Bermuda subsidiaries is, under certain circumstances, limitedunder U.S. statutory regulations and Bermuda insurance law, which require our U.S. and Bermudainsurance subsidiaries to maintain certain measures of solvency and liquidity. In addition, Bermudaregulations require approval from the BMA for any reduction of capital in excess of 15% of statutory capital,as defined in the Insurance Act. At December 31, 2008, the statutory capital and surplus of our Bermudainsurance subsidiaries was $3.2 billion (2007 – $3.3 billion), and the amount of capital and surplusrequired to be maintained was $525.5 million (2007 – $578.3 million). During 2008, RenaissanceReinsurance, DaVinciRe and Glencoe Group returned capital, which included dividends declared andreturn of capital, net of capital contributions received of $73.6 million, $100.0 million and $63.8 million,respectively, compared with $547.8 million, $nil and a net capital contribution of $31.2 million,respectively, in 2007. We did not participate in DaVinciRe’s return of capital in 2008.
Our principal U.S. insurance subsidiary Stonington is also required to maintain certain measures ofsolvency and liquidity. Restrictions with respect to dividends are based on state statutes. In addition, thereare restrictions based on risk based capital tests which is the threshold that constitutes the authorizedcontrol level. If Stonington’s statutory capital and surplus falls below the authorized control level, the TexasDepartment of Insurance (“TDI”) is authorized to take whatever regulatory actions are considered necessary
109

to protect policyholders and creditors. At December 31, 2008, the consolidated statutory capital andsurplus of Stonington was $128.6 million (2007 – $124.8 million). Because of an accumulated deficit inearned surplus from prior operations, Stonington cannot currently pay an ordinary dividend without TDIapproval.
In the aggregate, our operating subsidiaries have historically produced sufficient cash flows to meet theirexpected claims payments and operational expenses and to provide dividend payments to us. Oursubsidiaries also maintain a concentration of investments in high quality liquid securities, whichmanagement believes will provide additional liquidity for extraordinary claims payments should the needarise. Additionally, we maintain a $500.0 million revolving credit facility to meet additional liquidity andcapital requirements. At December 31, 2008, the $150.0 million borrowed under this facility, which weused to pay at maturity our 7.0% Senior Notes which came due July 15, 2008, remains outstanding. See“Capital Resources” section below.
Cash Flows and Liquidity
Cash flows from operating activities for 2008 were $544.0 million, which principally consisted of our netincome of $29.0 million (prior to dividends on preference shares), a $55.1 million increase in the minorityinterest in the undistributed net income of DaVinciRe, unrealized losses included in net investment incomeof $259.4 million related to our other investments and realized investment losses of $206.3 million. Our2008 cash flows from operations were primarily used to repurchase our common shares, pay our commonand preferred share dividends and pay claims and claim expenses.
We have generated cash flows from operations over the three year period between 2006 and 2008significantly in excess of our operating commitments. Because a large portion of the coverages we providetypically can produce losses of high severity and low frequency, it is not possible to accurately predict ourfuture cash flows from operating activities. As a consequence, our cash flow from operating activities mayfluctuate, perhaps significantly, between individual quarters and years. Due to the magnitude and recentoccurrence of hurricanes Gustav and Ike during the third quarter of 2008 meaningful uncertainty remainsregarding losses from these events and our actual ultimate net losses from these events may vary materiallyfrom preliminary estimates. As a result, our cash flows from operations will be impacted accordingly. Inaddition, given the severity of losses incurred in 2005 from the large catastrophes, many of which remainunpaid at December 31, 2008, it is likely that we will experience a significant amount of paid claims in2009 which could result in us having reduced or negative cash flows from operations.
Reserves for Claims and Claim Expenses
We believe the most significant accounting judgment made by management is our estimate of claims andclaim expense reserves. Claims and claim expense reserves represent estimates, including actuarial andstatistical projections at a given point in time, of the ultimate settlement and administration costs for unpaidclaims and claim expenses arising from the insurance and reinsurance contracts we sell. We establish ourclaims and claim expense reserves by taking claims reported to us by insureds and ceding companies, butwhich have not yet been paid (“case reserves”), adding the costs for additional case reserves (“additionalcase reserves”) which represent our estimates for claims previously reported to us which we believe maynot be adequately reserved as of that date, and adding estimates for the anticipated cost of claims incurredbut not yet reported to us (“IBNR”).
110

The following table summarizes our claims and claim expense reserves by line of business and splitbetween case reserves, additional case reserves and IBNR at December 31, 2008 and 2007:
At December 31, 2008 Case ReservesAdditional Case
Reserves IBNR Total(in thousands)
Property catastrophe reinsurance $312,944 $297,279 $ 250,946 $ 861,169Specialty reinsurance 113,953 135,345 387,352 636,650
Total Reinsurance 426,897 432,624 638,298 1,497,819Individual Risk 253,327 14,591 394,875 662,793
Total $680,224 $447,215 $1,033,173 $2,160,612
At December 31, 2007
(in thousands)
Property catastrophe reinsurance $275,436 $287,201 $ 204,487 $ 767,124Specialty reinsurance 109,567 93,280 448,756 651,603
Total Reinsurance 385,003 380,481 653,243 1,418,727Individual Risk 237,747 10,359 361,663 609,769
Total $622,750 $390,840 $1,014,906 $2,028,496
Our estimates of claims and claim expense reserves are not precise in that, among other matters, they arebased on predictions of future developments and estimates of future trends and other variable factors.Some, but not all, of our reserves are further subject to the uncertainty inherent in actuarial methodologiesand estimates. Because a reserve estimate is simply an insurer’s estimate at a point in time of its ultimateliability, and because there are numerous factors which affect reserves and claims payments but cannot bedetermined with certainty in advance, our ultimate payments will vary, perhaps materially, from ourestimates of reserves. If we determine in a subsequent period that adjustments to our previouslyestablished reserves are appropriate, such adjustments are recorded in the period in which they areidentified. During the twelve months ended December 31, 2008, 2007 and 2006, changes to prior yearestimated claims reserves increased our net income by $234.8 million, $233.2 million and $136.6 million,respectively, excluding the consideration of changes in reinstatement premium, profit commissions,DaVinciRe minority interest and income tax expense.
Our reserving methodology for each line of business uses a loss reserving process that calculates a pointestimate for the Company’s ultimate settlement and administration costs for claims and claim expenses. Wedo not calculate a range of estimates. We use this point estimate, along with paid claims and case reserves,to record our best estimate of additional case reserves and IBNR in our financial statements. Under GAAP,we are not permitted to establish estimates for catastrophe claims and claim expense reserves until anevent occurs that gives rise to a loss.
Reserving for our reinsurance claims involves other uncertainties, such as the dependence on informationfrom ceding companies, which among other matters, includes the time lag inherent in reporting informationfrom the primary insurer to us or to our ceding companies and differing reserving practices among cedingcompanies. The information received from ceding companies is typically in the form of bordereaux, brokernotifications of loss and/or discussions with ceding companies or their brokers. This information can bereceived on a monthly, quarterly or transactional basis and normally includes estimates of paid claims andcase reserves. We sometimes also receive an estimate or provision for IBNR. This information is oftenupdated and adjusted from time-to-time during the loss settlement period as new data or facts in respect ofinitial claims, client accounts, industry or event trends may be reported or emerge in addition to changes inapplicable statutory and case laws.
111

We recorded $468.0 million of net claims and claim expenses incurred in 2008 as a result of losses arisingfrom hurricanes Gustav and Ike which struck the United States in the third quarter of 2008. Our estimatesof losses from hurricanes Gustav and Ike are based on factors including currently available informationderived from the Company’s preliminary claims information from certain clients and brokers, industryassessments of losses from the events, proprietary models, and the terms and conditions of our contracts.Given the magnitude and recent occurrence of these events, meaningful uncertainty remains regarding totalcovered losses for the insurance industry and, accordingly, several of the key assumptions underlying ourloss estimates. In addition, actual losses from these events may increase if our reinsurers or other obligorsfail to meet their obligations. Our actual losses from these events will likely vary, perhaps materially, fromthese current estimates due to the inherent uncertainties in reserving for such losses, including thepreliminary nature of the available information, the potential inaccuracies and inadequacies in the dataprovided by clients and brokers, the inherent uncertainty of modeling techniques and the application ofsuch techniques, the effects of any demand surge on claims activity and complex coverage and other legalissues.
Included in our results for 2007 are $157.5 million of net claims and claim expenses from Kyrill and theU.K. flood losses which occurred in 2007, as well as $60.0 million in estimated losses associated withexposure to sub-prime related casualty losses. Estimates of these losses are based on a review of potentiallyexposed contracts, information reported by and discussions with counterparties, and the Company’sestimate of losses related to those contracts and is subject to change as more information is reported andbecomes available. Such information is frequently reported more slowly, and with less initial accuracy, withrespect to non-U.S. events such as Kyrill and the U.K. floods than with large U.S. catastrophe losses. Inaddition, the sub-prime related casualty net claims and claim expenses are based on underlying liabilitycontracts which are considered “long-tail” business, and will therefore take many years before the actuallosses are known and reported, which increases the uncertainty with respect to the estimate for ultimatelosses for this event. The net claims and claim expenses from Kyrill, the U.K. floods and sub-prime relatedcasualty losses are all attributable to the Company’s Reinsurance segment.
During 2005, we incurred significant losses from hurricanes Katrina, Rita and Wilma. Our estimates of theselosses are based on factors including currently available information derived from claims information fromour clients and brokers, industry assessments of losses from the events, proprietary models and the termsand conditions of our contracts. In particular, due to the size and unusual complexity of certain legal andclaims issues, particularly but not exclusively relating to hurricane Katrina, meaningful uncertainty remainsregarding total covered losses for the insurance industry and, accordingly, our loss estimates. Our actuallosses from these events will likely vary, perhaps materially, from our current estimates due to the inherentuncertainties in reserving for such losses, the potential inaccuracies and inadequacies in the data providedby clients and brokers, the inherent uncertainty of modeling techniques and the application of suchtechniques, and complex coverage and other legal issues.
Because of the inherent uncertainties discussed above, we have developed a reserving philosophy whichattempts to incorporate prudent assumptions and estimates, and we have generally experienced favorabledevelopment on prior year reserves in the last several years. However, there is no assurance that this willoccur in future periods.
Our reserving techniques, assumptions and processes differ between our Reinsurance and Individual Risksegments, as well as between our property catastrophe reinsurance and specialty reinsurance businesseswithin our Reinsurance segment. Refer to our “Claims and Claim Expense Reserves Critical AccountingEstimates” discussion in “Item 7. Management’s Discussion and Analysis of Financial Condition andResults of Operations” for more information on the risks we insure and reinsure, the reserving techniques,assumptions and processes we follow to estimate our claims and claim expense reserves, and our currentestimates versus our initial estimates of our claims reserves, for each of these units.
112
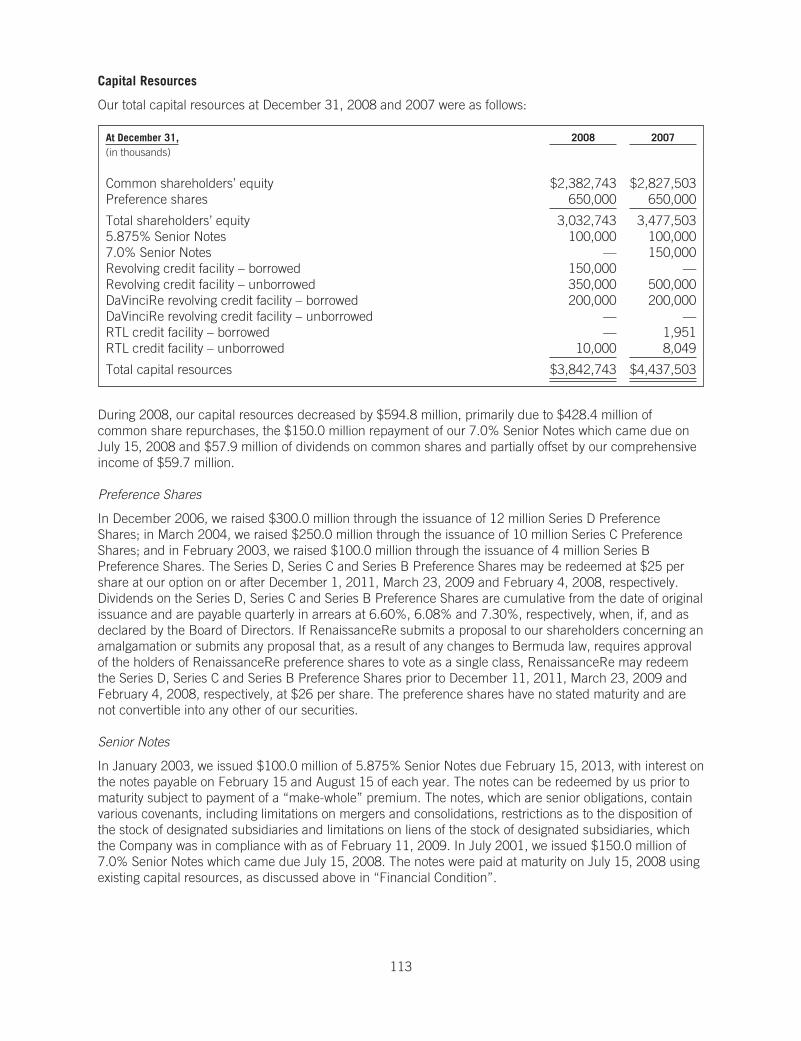
Capital Resources
Our total capital resources at December 31, 2008 and 2007 were as follows:
At December 31, 2008 2007(in thousands)
Common shareholders’ equity $2,382,743 $2,827,503Preference shares 650,000 650,000
Total shareholders’ equity 3,032,743 3,477,5035.875% Senior Notes 100,000 100,0007.0% Senior Notes — 150,000Revolving credit facility – borrowed 150,000 —Revolving credit facility – unborrowed 350,000 500,000DaVinciRe revolving credit facility – borrowed 200,000 200,000DaVinciRe revolving credit facility – unborrowed — —RTL credit facility – borrowed — 1,951RTL credit facility – unborrowed 10,000 8,049
Total capital resources $3,842,743 $4,437,503
During 2008, our capital resources decreased by $594.8 million, primarily due to $428.4 million ofcommon share repurchases, the $150.0 million repayment of our 7.0% Senior Notes which came due onJuly 15, 2008 and $57.9 million of dividends on common shares and partially offset by our comprehensiveincome of $59.7 million.
Preference Shares
In December 2006, we raised $300.0 million through the issuance of 12 million Series D PreferenceShares; in March 2004, we raised $250.0 million through the issuance of 10 million Series C PreferenceShares; and in February 2003, we raised $100.0 million through the issuance of 4 million Series BPreference Shares. The Series D, Series C and Series B Preference Shares may be redeemed at $25 pershare at our option on or after December 1, 2011, March 23, 2009 and February 4, 2008, respectively.Dividends on the Series D, Series C and Series B Preference Shares are cumulative from the date of originalissuance and are payable quarterly in arrears at 6.60%, 6.08% and 7.30%, respectively, when, if, and asdeclared by the Board of Directors. If RenaissanceRe submits a proposal to our shareholders concerning anamalgamation or submits any proposal that, as a result of any changes to Bermuda law, requires approvalof the holders of RenaissanceRe preference shares to vote as a single class, RenaissanceRe may redeemthe Series D, Series C and Series B Preference Shares prior to December 11, 2011, March 23, 2009 andFebruary 4, 2008, respectively, at $26 per share. The preference shares have no stated maturity and arenot convertible into any other of our securities.
Senior Notes
In January 2003, we issued $100.0 million of 5.875% Senior Notes due February 15, 2013, with interest onthe notes payable on February 15 and August 15 of each year. The notes can be redeemed by us prior tomaturity subject to payment of a “make-whole” premium. The notes, which are senior obligations, containvarious covenants, including limitations on mergers and consolidations, restrictions as to the disposition ofthe stock of designated subsidiaries and limitations on liens of the stock of designated subsidiaries, whichthe Company was in compliance with as of February 11, 2009. In July 2001, we issued $150.0 million of7.0% Senior Notes which came due July 15, 2008. The notes were paid at maturity on July 15, 2008 usingexisting capital resources, as discussed above in “Financial Condition”.
113

RenaissanceRe Revolving Credit Facility
During August 2004, we amended and restated our committed revolving credit agreement to (i) increasethe facility from $400.0 million to $500.0 million, (ii) extend the term to August 6, 2009 and (iii) makecertain other changes. On July 10, 2008, we borrowed $150.0 million available under this facility to pay atmaturity our 7.0% Senior Notes which came due on July 15, 2008. At December 31, 2008, the $150.0million borrowed under this facility remains outstanding. Interest rates on the facility are based on a spreadabove LIBOR, and averaged 4.2% during 2008. As amended, the agreement contains certain covenants,including financial covenants, which the Company was in compliance with as of February 11, 2009. Thefinancial covenants generally provide that consolidated debt to capital shall not exceed the ratio (the “Debtto Capital Ratio”) of 0.35:1 and that the consolidated net worth (the “Net Worth Requirements”) ofRenaissanceRe and Renaissance Reinsurance shall equal or exceed $1.0 billion and $500.0 million,respectively, subject to certain adjustments under certain circumstances in the case of the Debt to CapitalRatio and certain grace periods in the case of the Net Worth Requirements, all as more fully set forth in theagreement. We have the right, subject to certain conditions, to increase the size of this facility to $600.0million. The Company may desire to enter into a revised or new facility to replace this facility which expiresin August 2009, however we cannot assure you that we will be able to do so on terms that are favorable tothe Company or at all.
DaVinciRe Revolving Credit Facility
During April 2006, DaVinciRe amended and restated its credit agreement to, among other things, (i) extendthe termination date of the revolving credit facility established thereunder from May 25, 2010 to April 5,2011; (ii) increase the borrowing capacity to $200.0 million; and (iii) increase the minimum net worthrequirement with respect to DaVinciRe and DaVinci by $100.0 million to $350.0 million and $450.0 million,respectively. All other material terms and conditions in the credit agreement remained the same, includingthe requirement that DaVinciRe maintain a debt to capital ratio of 30% or below. At December 31, 2008,$200.0 million remained outstanding. Interest rates on the facility are based on a spread above LIBOR, andaveraged approximately 4.3% during 2008 (2007 – 6.0%). The term of the credit facility may be furtherextended and the size of the facility may be increased to $250.0 million if certain conditions are met.DaVinciRe was in compliance with the related financial covenants as of February 11, 2009. NeitherRenaissanceRe nor Renaissance Reinsurance is a guarantor of this facility and the lenders have norecourse against us or our subsidiaries other than DaVinciRe and DaVinci under the DaVinciRe facility.Pursuant to the terms of the $500.0 million revolving credit facility maintained by RenaissanceRe, a defaultby DaVinciRe on its obligations will not result in a default under the RenaissanceRe facility.
RTL Credit Facility
RTL maintains a brokerage facility with a leading prime broker, which has an associated margin facility. Thismargin facility, which we believe allows RTL to prudently manage its cash position related to its exchangetraded products, is supported by a $10.0 million guarantee issued by RenaissanceRe. Interest on amountsoutstanding under this facility is at overnight LIBOR plus 75 basis points. At December 31, 2008, $nil wasoutstanding under the facility.
In addition, at December 31, 2008, the Company provided $105.1 million of guarantees to support theweather and energy trading operations of RTL.
Letter of Credit Facility
Under the terms of certain reinsurance contracts, our insurance and reinsurance subsidiaries and jointventures may be required to provide letters of credit to reinsureds in respect of reported claims and/orunearned premiums. Our principal letter of credit facility is a syndicated secured facility which accepts ascollateral shares issued by our subsidiary RIHL and also contains certain financial covenants which we werein compliance with as of February 11, 2009. Our participating operating subsidiaries and our managed jointventures have pledged (and must maintain as pledged) RIHL shares issued to them with a sufficientcollateral value to support their respective obligations under the facility, including reimbursementobligations for outstanding letters of credit. The participating subsidiaries and joint ventures have the optionto post alternative forms of collateral. In addition, for liquidity purposes, in order to be permitted to pledge
114

RIHL shares as collateral, each participating subsidiary and joint venture must maintain additionalunpledged RIHL shares that have a net asset value at least equal to 15% of its facility usage, and RIHLshares having an aggregate net asset value equal to at least 15% of the net asset value of all outstandingRIHL shares must remain unencumbered. In the case of a default under the facility, or in othercircumstances in which the rights of our lenders to collect on their collateral may be impaired, the lendersmay exercise certain remedies under the facility agreement, in accordance with and subject to its terms,including redemption of pledged shares and conversion of the collateral into cash or eligible marketablesecurities. The redemption of shares by the collateral agent takes priority over any pending redemption ofunpledged shares by us or other holders. On April 27, 2007, the reimbursement agreement was amendedand restated to, among other things: (i) extend the term of the agreement to April 27, 2010; (ii) change thetotal commitment thereunder from $1.725 billion to $1.4 billion; (iii) provide for the potential increase of thetotal commitment to up to $1.8 billion if certain conditions are met; and (iv) increase the minimum networth requirement with respect to DaVinci by $150.0 million to $300.0 million. At February 11, 2009, wehad $1,019.1 million of letters of credit with effective dates on or before December 31, 2008 outstandingunder the facility and total letters of credit outstanding under all facilities of $1,024.1 million.
Our subsidiary, Stonington, has provided letters of credit in the amount of $13.1 million to twocounterparties which are secured by cash and eligible marketable securities. In connection with our TopLayer Re joint venture, we have committed $37.5 million of collateral to support a letter of credit and areobligated to make a mandatory capital contribution of up to $50.0 million in the event that a loss reducesTop Layer Re’s capital below a specified level.
Transaction Under DaVinciRe’s Shareholders Agreement
The second amended and restated shareholders agreement (the “shareholders agreement”) providesDaVinciRe shareholders, excluding us, with certain redemption rights, which allow each shareholder tonotify DaVinciRe of such shareholder’s desire for DaVinciRe to repurchase up to half of such shareholder’saggregate number of shares held. Any share repurchases are subject to certain limitations, as described inthe shareholders agreement, such as limiting the aggregate of all share repurchase requests to 25% ofDaVinciRe’s capital in any given year and subject to ensuring all applicable regulatory requirements aremet. If the total shareholder requests exceed 25% of DaVinciRe’s capital, the number of sharesrepurchased will be reduced among the requesting shareholders pro-rata, based on the amounts desired tobe repurchased. Shareholders must notify DaVinciRe before March 1 of each year, if they desire to haveDaVinciRe repurchase shares. The repurchase price will be based on GAAP book value as of the end of theyear in which the shareholder notice is given, and the repurchase will be effective as of such date. Paymentwill be made by April 1 of the following year, following delivery of the audited financial statements for theyear in which the repurchase was effective. The repurchase price is subject to a true-up for development onoutstanding loss reserves after settlement of all claims relating to the applicable years. Certain shareholdershad put in repurchase notices on or before the March 1, 2008 repurchase notice date. The repurchasenotice was for shares with a GAAP book value of $145.5 million at December 31, 2008. On January 30,2009, the Company on behalf of DaVinciRe purchased the shares for $145.5 million, less a $21.8 millionreserve holdback. As a result of these purchases, our ownership interest in DaVinciRe increased to 37.6%.We expect our ownership in DaVinciRe to fluctuate over time.
Credit Ratings
Our ratings continue to be among the highest in our industry and continue to be supported by our strongfinancial position. Our ratings are also supported by our prudent ERM practices which are rated “excellent”by S&P.
On January 29, 2009, A.M. Best affirmed the financial strength rating (“FSR”) of “A+” (Superior) ofRenaissance Reinsurance and Renaissance Europe. A.M. Best also affirmed the issuer credit rating (“ICR”)of “a-” on the Company’s senior notes. Concurrently, A.M. Best upgraded the FSR to “A” (Excellent) from“A-” (Excellent) for Glencoe, Lantana, Stonington and Stonington Lloyds. Additionally, the FSR of DaVinciwas affirmed at “A” (Excellent). The outlook for all our ratings is stable.
On January 21, 2009, S&P initiated coverage of Renaissance Europe, assigning a rating of “AA-” for both itscounterparty credit rating (“CCR”) and FSR. The outlook on Renaissance Europe is stable.
115

On December 13, 2007, Standard & Poor’s raised its CCR on RenaissanceRe “A” from “A-”. At the sametime, Standard & Poor’s raised its CCR and FSR on Renaissance Reinsurance to “AA-” from “A+”. Inaddition, Standard & Poor’s raised its CCR on DaVinci to “A+” from “A”. The outlook on all thesecompanies is stable.
While the ratings of Renaissance Reinsurance are among the highest in our business, adverse ratingsactions could have a negative effect on our ability to fully realize current or future market opportunities.Moreover, if our ratings are reduced from their current levels by A.M. Best, Standard & Poor’s, Moody’s orFitch, we believe our competitive position in the insurance industry would suffer and it would be moredifficult for us to market our products. A significant downgrade could result in a substantial loss of businessas ceding companies and brokers that place such business move to other reinsurers with higher ratings. Wecannot give any assurance regarding whether or to what extent the rating agencies may downgrade ourratings. In addition, it is increasingly common for our reinsurance contracts to contain provisions permittingour clients to cancel coverage pro-rata if our relevant operating subsidiary is downgraded below a certainrating level. Whether a client would exercise this right would depend, among other factors, on the reason forsuch a downgrade, the extent of the downgrade, the prevailing market conditions and the pricing andavailability of replacement reinsurance coverage. Therefore, in the event of a downgrade, it is not possible topredict in advance the extent to which this cancellation right would be exercised, if at all, or what effectsuch cancellations would have on our financial condition or future operations, but such effect potentiallycould be material. To date, we are not aware that we have experienced such a cancellation.
Shareholders’ Equity
Shareholders’ equity decreased $444.8 million to $3.0 billion at December 31, 2008 from $3.5 billion atDecember 31, 2007. The significant components of the decrease in shareholders’ equity includes therepurchase of $428.4 million of our common shares during 2008 as discussed above in “Capital Resources”,dividends to our common shareholders of $57.9 million, our net loss attributable to common shareholders of$13.3 million, and partially offset by an increase in accumulated other comprehensive income of $30.7 million.
Investments
The table below shows our portfolio of invested assets:
At December 31, 2008 2007(in thousands, except percentages)
U.S. treasuries $ 467,480 7.8% $ 767,785 11.5%Agencies 448,521 7.4 290,194 4.4Non-U.S. government 57,058 0.9 66,496 1.0Corporate 747,210 12.4 937,289 14.1Mortgage-backed 1,110,594 18.4 1,251,582 18.9Asset-backed 166,022 2.7 601,017 9.1
Fixed maturity investments available for sale, at fair value 2,996,885 49.6 3,914,363 59.0Short term investments, at fair value 2,172,343 36.0 1,821,549 27.4Other investments, at fair value 773,475 12.8 807,864 12.2
Total managed investment portfolio 5,942,703 98.4 6,543,776 98.6Investments in other ventures, under equity method 99,879 1.6 90,572 1.4
Total investments $6,042,582 100% $6,634,348 100%
At December 31, 2008, we held investments totaling $6.0 billion, compared to $6.6 billion at December 31,2007, with net unrealized appreciation included in accumulated other comprehensive income of $75.4million at December 31, 2008, compared to $44.7 million at December 31, 2007. Our investmentguidelines stress preservation of capital, market liquidity, and diversification of risk. Notwithstanding theforegoing, our investments are subject to market-wide risks and fluctuations, as well as to risks inherent inparticular securities.
116

The large majority of our investments consist of highly rated fixed income securities. We also have anallocation to other investments, including hedge funds, private equity partnerships, senior secured bankloan funds and other investments. At December 31, 2008, these other investments totaled $773.5 million,or 12.8%, of our total investments (2007 – $807.9 million or 12.2%).
At December 31, 2008, our fixed maturities available for sale and short term investment portfolio had adollar-weighted average credit quality rating of AA (2007 – AA). At December 31, 2008, our average yield tomaturity on our fixed maturity investments available for sale and our short term investment portfolio was2.8% (2007 – 4.5%), before investment expenses. At December 31, 2008, our non-investment grade fixedmaturity investments available for sale totaled $58.5 million or 2.0% of our fixed maturity investmentsavailable for sale (2007 – $73.7 million or 1.9%, respectively). In addition, within our other investmentscategory we have several funds that invest in non-investment grade fixed income securities andnon-investment grade cat-linked securities. At December 31, 2008, the funds that invest in non-investmentgrade fixed income securities and non-investment grade cat-linked securities totaled $317.1 million (2007 –$283.4 million).
We hold a significant amount of short term investments. Short term investments are managed as part of ourinvestment portfolio and have a maturity of one year or less when purchased. Short term investments arecarried at fair value. As of December 31, 2008, we had $2,172.3 million of short term investments (2007 –$1,821.5 million).
Our target benchmark portfolio for our fixed maturities and short term investments currently has a 2.6 yearduration. Our duration at December 31, 2008 was 1.5 years (2007 – 1.8 years), reflecting our view that thecurrent level of rates affords inadequate compensation for the assumption of additional interest rate riskassociated with longer duration. From time to time, we may reevaluate the duration of our portfolio in light ofthe duration of our liabilities and market conditions.
As with other fixed income investments, the value of our fixed maturity investments will fluctuate withchanges in the interest rate environment and when changes occur in the overall investment market and inoverall economic conditions. Additionally, our differing asset classes expose us to other risks which couldcause a reduction in the value of our investments. Examples of some of these risks include:
• Changes in the overall interest rate environment can expose us to “prepayment risk” on ourmortgage-backed investments. When interest rates decline, consumers will generally makeprepayments on their mortgages and, as a result, our investments in mortgage-backed securitieswill be repaid to us more quickly than we might have originally anticipated. When we receive theseprepayments, our opportunities to reinvest these proceeds back into the investment markets willlikely be at reduced interest rates. Conversely, when interest rates increase, consumers willgenerally make fewer prepayments on their mortgages and, as a result, our investments inmortgage-backed securities will be repaid to us less quickly than we might have originallyanticipated. This will increase the duration of our portfolio, which is disadvantageous to us in arising interest rate environment.
• Our investments in mortgage-backed securities are also subject to default risk. This risk is due inpart to defaults on the underlying securitized mortgages, which would decrease the market valueof the investment and be disadvantageous to us.
• Our investments in debt securities of other corporations are exposed to losses from insolvencies ofthese corporations, and our investment portfolio can also deteriorate based on reduced creditquality of these corporations. We are also exposed to widening credit spreads even if specificsecurities are not downgraded.
• Our investments in asset-backed securities are subject to prepayment risks, as noted above, andto the structural risks of these securities. The structural risks primarily emanate from the priority ofeach security in the issuer’s overall capital structure. We are also exposed to widening creditspreads.
• Within our other investments category, we have several funds that invest in non-investment gradefixed income securities as well as securities denominated in foreign currencies. These investments
117

expose us to losses from insolvencies and other credit-related issues. We are also exposed tofluctuations in foreign exchange rates that may result in realized losses to us if our exposures arenot hedged or if our hedging strategies are not effective and also to widening of credit spreads.
The following table summarizes the fair value by contractual maturity of our fixed maturity investmentportfolio available for sale at the dates indicated. Actual maturities may differ from contractual maturitiesbecause borrowers may have the right to call or prepay obligations with or without penalty.
At December 31, 2008 2007(in thousands, except percentages)
Due in less than one year $ 115,316 3.8% $ 385,497 9.8%Due after one through five years 1,327,837 44.4 1,323,586 33.8Due after five through ten years 183,396 6.1 267,579 6.8Due after ten years 93,720 3.1 85,102 2.2Mortgage-backed securities 1,110,594 37.1 1,251,582 32.0Asset-backed securities 166,022 5.5 601,017 15.4
Total fixed maturities available for sale, at fair value $2,996,885 100.0% $3,914,363 100.0%
The following table summarizes the composition of the fair value of our fixed maturity investments availablefor sale at the dates indicated by ratings as assigned by S&P, or Moody’s and/or other rating agencies whenS&P ratings were not available.
At December 31, 2008 2007(in thousands, except percentages)
AAA $2,524,500 84.2% $3,130,143 80.0%AA 147,405 4.9 404,173 10.3A 200,318 6.7 182,780 4.7BBB 66,123 2.2 123,529 3.1Non-investment grade 58,539 2.0 73,738 1.9
Total fixed maturities available for sale, at fair value $2,996,885 100.0% $3,914,363 100.0%
The Company’s fixed maturity investments are classified as available for sale and are reported at fair value.The net unrealized appreciation or depreciation on these investments is included in accumulated othercomprehensive income. Net investment income includes interest income together with amortization ofmarket premiums and discounts and is net of investment management and custody fees. The amortizationof premium and accretion of discount for fixed maturity investments is computed using the effective yieldmethod. The fair values of our fixed maturity investments are based on quoted market prices, or when suchprices are not available, by reference to broker or trader bid indications and/or internal pricing valuationtechniques.
Realized gains or losses on the sale of fixed maturity investments are determined using the first in first outcost method and include adjustments to the cost for declines in value that are considered to be other thantemporary. The Company routinely assesses whether declines in the fair value of its fixed maturityinvestments below cost represent impairments that are considered other than temporary. There are severalfactors that are considered in the assessment of impairment of a security, which include (i) the time periodduring which there has been a significant decline below cost, (ii) the extent of the decline below cost,(iii) the Company’s intent and ability to hold the security, (iv) the potential for the security to recover invalue, (v) an analysis of the financial condition of the issuer and (vi) an analysis of the collateral structureand credit support of the security, if applicable. Where the Company has determined that there is an otherthan temporary decline in the fair value of the security, the cost of the security is written down to its fairvalue and the unrealized loss at the time of the determination is charged to income.
118
During 2008, the Company recorded $217.0 million (2007 – $25.5 million, 2006 – $46.4 million) in otherthan temporary impairment charges. The other than temporary impairment charges in 2008 were primarilydue to widening credit spreads during 2008 as a result of the turmoil in the financial and capital marketsand the other than temporary impairment charges in 2007 and 2006 were due to rising interest rates. Werecognized impairment charges for principally all of our fixed maturity investments available for sale thatwere in an unrealized loss position at the end of each quarter for the years ending December 31, 2008,2007 and 2006 as we do not currently have the intent to hold them until they fully recover in value. Credit-related impairment charges were $8.3 million, $nil, and $0.1 million in 2008, 2007 and 2006, respectively,and relate to impaired securities which the Company believes it will not be able to recover the full principalamount if held to maturity. The Company had essentially no fixed maturity investments which were carriedat an unrealized loss as of December 31, 2008, 2007 and 2006.
119

Credit Rating and Yield to Maturity
The following table summarizes the composition of the amortized cost and fair value of our fixed maturity investmentsavailable for sale, short term investments and other investments at the date indicated by ratings as assigned by S&P, orMoody’s and/or other rating agencies when S&P ratings were not available and the respective yield to maturity.
At December 31, 2008
Credit Rating (1)
AmortizedCost
FairValue
% of TotalManaged
InvestmentPortfolio
Yield toMaturity AAA AA A BBB
Non-Investment
Grade Not Rated(in thousands)Short term investments $2,172,343 $2,172,343 36.6% 0.3% $2,071,671 $ 39,397 $ 59,059 $ 1,022 $ 1,194 $ —
100.0% 95.4% 1.8% 2.7% 0.0% 0.1% 0.0%Fixed maturity investments
available for sale
U.S. treasuries and agenciesU.S. treasuries 462,489 467,480 7.9% 1.5% 467,480 — — — — —Agency debt Fannie
Mae & Freddie Mac 370,519 385,229 6.4% 1.9% 385,229 — — — — —Other agencies 61,008 63,292 1.1% 1.9% 63,292 — — — — —
Total agency debt 431,527 448,521 7.5% 1.9% 448,521 — — — — —
Total U.S. treasuries andagencies 894,016 916,001 15.4% 1.7% 916,001 — — — — —
Non U.S. government 53,592 57,058 1.0% 5.9% 27,483 8,520 226 11,022 9,807 —
Corporate 719,234 747,210 12.6% 5.1% 305,546 138,885 200,092 54,362 48,325 —
Mortgage-backed securitiesResidential mortgage-
backed securitiesAgency securities 731,679 756,902 12.7% 4.0% 756,902 — — — — —Non-agency securities 70,629 70,916 1.2% 11.9% 70,374 — — 542 — —Non-agency securities –
Alt A 27,475 27,756 0.5% 15.6% 27,152 — — 197 407 —Non-agency securities –
Sub-prime — — 0.0% 0.0% — — — — — —
Total residential mortgage-backed securities 829,783 855,574 14.4% 5.0% 854,428 — — 739 407 —
Commercial MortgageBacked Securities 254,373 255,020 4.3% 10.5% 255,020 — — — — —
Total mortgage-backedsecurities 1,084,156 1,110,594 18.7% 6.3% 1,109,448 — — 739 407 —
Asset-backed securitiesAuto 95,798 95,812 1.6% 8.5% 95,812 — — — — —Credit cards 12,053 12,056 0.2% 6.5% 12,056 — — — — —Other – Stranded cost 7,638 7,639 0.1% 5.3% 7,639 — — — — —Other 50,504 50,515 0.8% 8.2% 50,515 — — — — —
Total asset-backed securities 165,993 166,022 2.7% 8.1% 166,022 — — — — —
Total securitized assets 1,250,149 1,276,616 21.4% 6.2% 1,275,470 — — 739 407 —
Total fixed maturityinvestments available forsale 2,916,991 2,996,885 50.4% 4.7% 2,524,500 147,405 200,318 66,123 58,539 —
100.0% 84.2% 4.9% 6.7% 2.2% 2.0% 0.0%Other investments
Private equity partnerships 258,901 4.3% — — — — — 258,901Senior secured bank loan
funds 215,870 3.6% — — — — 215,870 —Hedge funds 105,838 1.8% — — — — — 105,838Catastrophe bonds 93,085 1.6% — 23,430 — — 68,356 1,299Non-U.S. fixed income
funds 81,719 1.4% — — — 59,343 22,376 —Miscellaneous other
investments 18,062 0.3% — — — 8,880 — 9,182
Total other investments 773,475 13.0% — 23,430 — 68,223 306,602 375,220Total managed investment
portfolio $5,942,703 100.0% $4,596,171 $210,232 $259,377 $135,368 $366,335 $375,220100.0% 77.3% 3.5% 4.4% 2.3% 6.2% 6.3%
(1) The credit ratings included in this table are those assigned by Standard & Poor’s Corporation. The Company has grouped short term investments withan A-1+ and A-1 short-term issue credit rating as AAA, short term investments with A-2 short-term issue credit rating as AA and short term investmentswith an A-3 short-term issue credit rating as A.
120

The following table summarizes the composition of the fair value of our corporate fixed maturity investmentsavailable for sale at the date indicated by ratings as assigned by S&P, or Moody’s and/or other ratingagencies when S&P ratings were not available.
At December 31, 2008
Sector Total AAA AA A BBBNon-Investment
Grade(in thousands)
Financials $546,493 $301,366 $117,367 $107,720 $ 9,775 $10,265Industrial, utilities and energy 68,675 2,644 3,546 31,316 16,897 14,272Consumer 67,566 1,536 17,972 25,247 9,290 13,521Communications and
technology 56,943 — — 32,586 16,330 8,027Basic materials 7,533 — — 3,223 2,070 2,240
Total corporate fixed maturityinvestments available forsale $747,210 $305,546 $138,885 $200,092 $54,362 $48,325
The following table summarizes the composition of the fair value of the fixed maturity investments availablefor sale and short term investments of our top ten corporate issuers at the date indicated.
At December 31, 2008
Issuer TotalShort term
investments
Fixed maturityinvestments
available for sale(in thousands)
General Electric Company $134,576 $ — $134,576JPMorgan Chase & Co. 66,200 35,952 30,248Sovereign Bancorp Inc. 51,491 — 51,491Wells Fargo & Company 44,965 — 44,965U.S. Bancorp 28,829 7,998 20,831New York Community Bancorp, Inc. 25,770 — 25,770PNC Financial Service 21,292 12,897 8,395Regions Financial Corporation 20,331 — 20,331SunTrust Banks Inc. 19,016 — 19,016Bank of America Corporation 18,059 — 18,059
Total $430,529 $56,847 $373,682
Other Investments
The table below shows our portfolio of other investments:
At December 31, 2008 2007(in thousands)
Private equity partnerships $258,901 $301,446Senior secured bank loan funds 215,870 158,203Hedge funds 105,838 126,417Catastrophe bonds 93,085 95,535Non-U.S. fixed income funds 81,719 126,252Miscellaneous other investments 18,062 11
Total other investments $773,475 $807,864
121
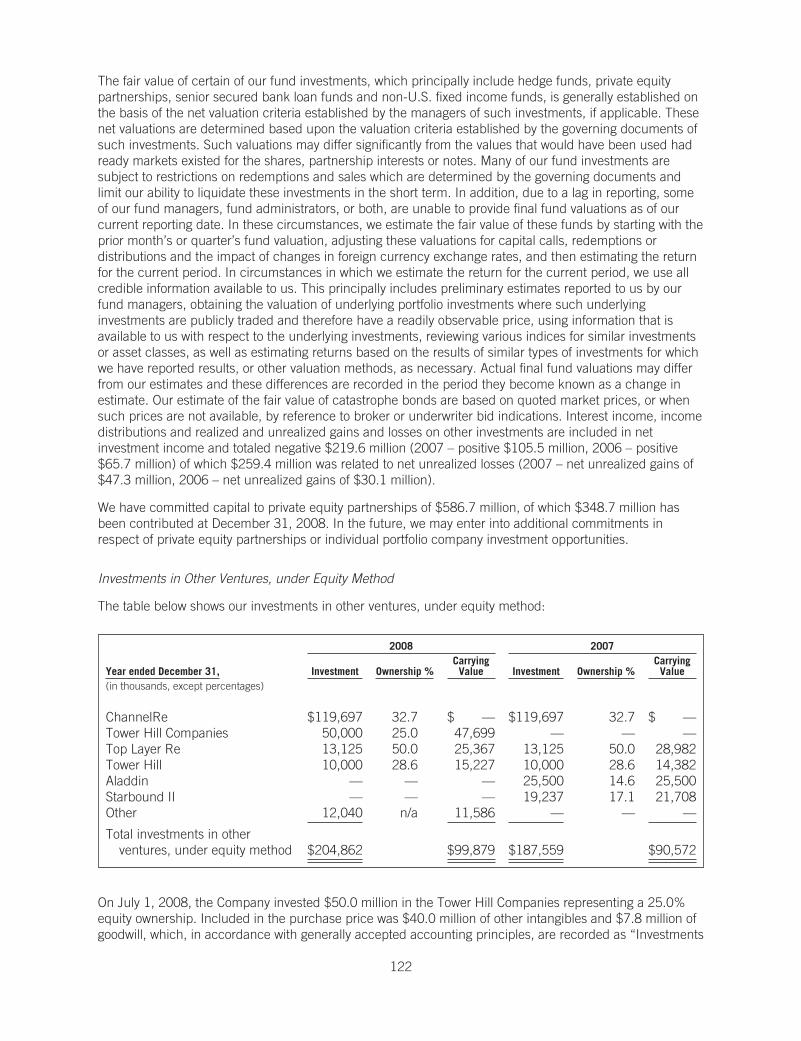
The fair value of certain of our fund investments, which principally include hedge funds, private equitypartnerships, senior secured bank loan funds and non-U.S. fixed income funds, is generally established onthe basis of the net valuation criteria established by the managers of such investments, if applicable. Thesenet valuations are determined based upon the valuation criteria established by the governing documents ofsuch investments. Such valuations may differ significantly from the values that would have been used hadready markets existed for the shares, partnership interests or notes. Many of our fund investments aresubject to restrictions on redemptions and sales which are determined by the governing documents andlimit our ability to liquidate these investments in the short term. In addition, due to a lag in reporting, someof our fund managers, fund administrators, or both, are unable to provide final fund valuations as of ourcurrent reporting date. In these circumstances, we estimate the fair value of these funds by starting with theprior month’s or quarter’s fund valuation, adjusting these valuations for capital calls, redemptions ordistributions and the impact of changes in foreign currency exchange rates, and then estimating the returnfor the current period. In circumstances in which we estimate the return for the current period, we use allcredible information available to us. This principally includes preliminary estimates reported to us by ourfund managers, obtaining the valuation of underlying portfolio investments where such underlyinginvestments are publicly traded and therefore have a readily observable price, using information that isavailable to us with respect to the underlying investments, reviewing various indices for similar investmentsor asset classes, as well as estimating returns based on the results of similar types of investments for whichwe have reported results, or other valuation methods, as necessary. Actual final fund valuations may differfrom our estimates and these differences are recorded in the period they become known as a change inestimate. Our estimate of the fair value of catastrophe bonds are based on quoted market prices, or whensuch prices are not available, by reference to broker or underwriter bid indications. Interest income, incomedistributions and realized and unrealized gains and losses on other investments are included in netinvestment income and totaled negative $219.6 million (2007 – positive $105.5 million, 2006 – positive$65.7 million) of which $259.4 million was related to net unrealized losses (2007 – net unrealized gains of$47.3 million, 2006 – net unrealized gains of $30.1 million).
We have committed capital to private equity partnerships of $586.7 million, of which $348.7 million hasbeen contributed at December 31, 2008. In the future, we may enter into additional commitments inrespect of private equity partnerships or individual portfolio company investment opportunities.
Investments in Other Ventures, under Equity Method
The table below shows our investments in other ventures, under equity method:
2008 2007
Year ended December 31, Investment Ownership %CarryingValue Investment Ownership %
CarryingValue
(in thousands, except percentages)
ChannelRe $119,697 32.7 $ — $119,697 32.7 $ —Tower Hill Companies 50,000 25.0 47,699 — — —Top Layer Re 13,125 50.0 25,367 13,125 50.0 28,982Tower Hill 10,000 28.6 15,227 10,000 28.6 14,382Aladdin — — — 25,500 14.6 25,500Starbound II — — — 19,237 17.1 21,708Other 12,040 n/a 11,586 — — —
Total investments in otherventures, under equity method $204,862 $99,879 $187,559 $90,572
On July 1, 2008, the Company invested $50.0 million in the Tower Hill Companies representing a 25.0%equity ownership. Included in the purchase price was $40.0 million of other intangibles and $7.8 million ofgoodwill, which, in accordance with generally accepted accounting principles, are recorded as “Investments
122

in other ventures, under equity method” rather than “Goodwill and other intangibles” on the Company’sconsolidated balance sheet. The Company’s share of the equity in earnings of the Tower Hill Companies isrecorded one quarter in arrears.
Investments in other ventures, under equity method includes the Company’s investment in ChannelRe of$nil (2007 – $nil). During 2007, ChannelRe, suffered a significant net loss which reduced ChannelRe’sGAAP shareholders’ equity below $nil. The net loss was driven by unrealized mark-to-market losses relatedto financial guaranty contracts accounted for as derivatives under GAAP. As a result, the Company reducedits carried value in ChannelRe to $nil which negatively impacted our net income by $167.2 million in 2007.As a result of reducing the Company’s carried value in ChannelRe to $nil, combined with the fact that theCompany has no further contractual obligations to provide capital or other support to ChannelRe, theCompany believes it currently has no further negative economic exposure to ChannelRe. Since ChannelReremained in a negative shareholders’ equity position during 2008, the Company’s investment in ChannelRecontinues to be carried at $nil. It is possible that with the adoption of FAS 157 by ChannelRe in 2008, thatin future periods the nonperformance risk or own credit risk portion of ChannelRe’s mark-to-market on itsfinancial guaranty contracts accounted for as derivatives under GAAP may increase, or that the underlyingmark-to-market on ChannelRe’s financial guaranty contracts accounted for as derivatives under GAAP maydecrease, or both, which could result in ChannelRe returning to a positive equity position, at which time theCompany would then record its share of ChannelRe’s net income, subject to impairment, or the Company’sshare of ChannelRe’s net loss.
During the fourth quarter of 2007, the Company invested $25.5 million in the preferred equity of Aladdin,representing a 14.6% ownership interest. Due to adverse market conditions, Aladdin elected to not writeany business and subsequently announced during the fourth quarter of 2008, that it would wind-up itsoperations and return the residual capital to shareholders. The Company expects to receive the majority ofits original investment, less administrative expenses incurred. At December 31, 2008, the Company hadrecorded a receivable of $24.4 million in other assets for the expected liquidation value of Aladdin. DuringJanuary 2009, the Company received an initial payout of $24.2 million with the final distribution expected tobe received during 2009.
Investments in other ventures, under equity method also includes an investment in Top Layer Re of $25.4million (2007 – $29.0 million) and in Tower Hill Holdings Inc. (“Tower Hill”) of $15.2 million (2007 – $14.4million). We originally invested $13.1 million and $10.0 million in Top Layer Re and Tower Hill, respectively,representing a 50.0% and 28.6% ownership, respectively.
In May 2007, the Company invested $10.0 million in Starbound II, which represents a 9.8% equityownership interest in Starbound II and in December 2007 the Company invested an additional $9.2 millionin Starbound II which increased the Company’s investment and ownership percentage to $19.2 million and17.1%, respectively. Effective July 31, 2008, Starbound II repurchased the outstanding shares of itsinvestors at book value; as a result, the Company now owns 100% of Starbound II and consequently,Starbound II became a consolidated entity effective August 1, 2008.
The equity in earnings (losses) of ChannelRe, Tower Hill and Tower Hill Companies are reported onequarter in arrears, except that our 2007 results reflect the estimated fourth quarter charge from ChannelReas it relates to unrealized mark-to-market losses in ChannelRe’s portfolio of financial guaranty contractsaccounted for as derivatives under GAAP.
RIHL
RIHL, a wholly owned subsidiary of the Company, holds investment grade fixed income securities and shortterm investments and was formed to enhance administrative efficiency and take advantage of the increasedbenefits and reduced costs ordinarily associated with the management of large investment portfolios ofdifferent subsidiaries in the same group. In addition, the administrative efficiency afforded by the use ofRIHL facilitates the establishment of our collateralized letter of credit facility on advantageous terms that webelieve would otherwise not be available. Through RIHL, certain of our operating subsidiaries invest in adiversified portfolio of highly liquid debt securities which are recorded at fair value. RIHL has been assigned
123

a rating of AAAf/S2 by S&P and 100% of the securities held through RIHL have been assigned a rating ofAA or higher by nationally recognized rating agencies. We may redeem our interests in RIHL at the currentnet asset value no more frequently than monthly. Third party service providers perform custodial functionsin respect of RIHL, including valuation of the investment assets held through RIHL. Currently, externalinvestment managers manage the assets held through RIHL, pursuant to written investment guidelines.
Under the terms of certain reinsurance contracts, certain of our subsidiaries and joint ventures are requiredto provide letters of credit to reinsureds in respect of reported claims and/or unearned premiums. Wemaintain a facility which, as of December 31, 2008, makes available to our operating subsidiaries and jointventures letters of credit having an aggregate face amount not to exceed $1.4 billion. To support the facility,our participating operating subsidiaries and joint ventures have pledged RIHL shares and other securitiesowned by them as collateral. At February 11, 2009, we had $1,019.1 million of letters of credit witheffective dates on or before December 31, 2008 outstanding under our $1.4 billion letter of credit facilityand $1,024.1 million of total letters of credit outstanding under all facilities.
Effects of Inflation
The potential exists, after a catastrophe loss, for the development of inflationary pressures in a localeconomy. The anticipated effects on us are considered in our catastrophe loss models. The effects ofinflation are also considered in pricing and in estimating reserves for unpaid claims and claim expenses.The actual effects of this post-event inflation on our results cannot be accurately known until claims areultimately settled.
Off-Balance Sheet and Special Purpose Entity Arrangements
At December 31, 2008, we have not entered into any off-balance sheet arrangements, as defined byItem 303(a)(4) of Regulation S-K.
New Accounting Pronouncements
Fair Value Measurements
In September 2006, the FASB issued FAS 157. FAS 157 clarifies the definition of fair value, establishes aframework for measuring fair value and expands disclosures about fair value measurements. FAS 157clarifies that fair value is a market-based measurement, not an entity-specific measurement, and sets out afair value hierarchy with the highest priority being quoted prices in active markets and the lowest priority tounobservable data. Further, FAS 157 requires tabular disclosures of the fair value measurements by levelwithin the fair value hierarchy. FAS 157 became effective for us on January 1, 2008. The adoption of FAS157 did not have a material impact on the Company’s statements of operations and financial conditionwhen adopted.
In order to address the application of FAS 157 in a market that is not active, the FASB issued FASB StaffPosition 157-3 (“FSP 157-3”) in October 2008. FSP 157-3 clarifies the application of FAS 157 in a marketthat is not active and provides examples to illustrate key considerations to determine the fair value of afinancial asset when the market for that financial asset is not active. FSP 157-3 applies to financial assetswithin the scope of accounting pronouncements that require or permit fair value measurements inaccordance with FAS 157 and became effective upon issuance, including prior periods for which financialstatements have not been issued. The application of FSP 157-3 did not have a material impact on theCompany’s statements of operations and financial condition.
The Fair Value Option for Financial Assets and Financial Liabilities
In February 2007, the FASB issued FASB Statement No. 159, The Fair Value Option for Financial Assetsand Financial Liabilities (“FAS 159”). FAS 159 permits an entity to choose, at specified election dates, tomeasure eligible financial instruments and certain other items at fair value that are not currently required tobe measured at fair value. An entity shall report unrealized gains and losses on items for which the fairvalue option has been elected in earnings at each subsequent reporting date. Upfront costs and feesrelated to items for which the fair value option is elected shall be recognized in earnings as incurred and not
124

deferred. FAS 159 also establishes presentation and disclosure requirements designed to facilitatecomparisons between entities that choose different measurement attributes for similar types of assets andliabilities. FAS 159 became effective for us on January 1, 2008 and we elected the fair value option forcertain financial assets and financial liabilities. An entity shall report the effect of the first remeasurement tofair value as a cumulative-effect adjustment to the opening balance of retained earnings. The adoption ofFAS 159 did not have a material impact on the Company’s statements of operations and financial conditionwhen adopted.
Business Combinations and Accounting and Reporting of Noncontrolling Interest in Consolidated FinancialStatements
On December 4, 2007, the FASB issued Statement No. 141(R), Business Combinations (“FAS 141(R)”)and Statement No. 160, Accounting and Reporting of Noncontrolling Interest in Consolidated FinancialStatements, an amendment of ARB No. 51 (“FAS 160”). These new standards will significantly change theaccounting for and reporting of business combination transactions and noncontrolling (minority) interests inconsolidated financial statements. FAS 141(R) expands the scope of acquisition accounting to alltransactions and circumstances under which control of a business is obtained. Under FAS 160,noncontrolling interests are classified as a component of consolidated shareholders’ equity and ‘minorityinterest’ accounting is eliminated such that earnings attributable to noncontrolling interests are reported aspart of consolidated earnings and not as a separate component of income or expense. FAS 141(R) and FAS160 are required to be adopted simultaneously and are effective for the first annual reporting periodbeginning on or after December 15, 2008. Earlier adoption is prohibited. We are currently evaluating thepotential impacts of the adoption of FAS 141(R) and FAS 160 on the Company’s statements of operationsand financial condition when adopted.
Disclosures about Derivative Instruments and Hedging Activities
In March 2008, the FASB issued Statement No. 161, Disclosures about Derivative Instruments andHedging Activities – an amendment of FASB Statement No. 133 (“FAS 161”). FAS 161 requires entities toprovide enhanced disclosures about (a) how and why an entity uses derivative instruments, (b) howderivative instruments and related hedged items are accounted for under FASB Statement No. 133,Accounting for Derivative Instruments and Hedging Activities and its related interpretations and (c) howderivative instruments and related hedged items affect an entity’s financial position, results of operationsand cash flows. FAS 161 requires qualitative disclosures about objectives and strategies for usingderivatives, quantitative disclosures about fair value amounts of gains and losses on derivative instrumentsand credit-risk related contingent features in derivative instruments. FAS 161 is to be applied prospectivelyand is effective for financial statements issued for fiscal years and interim periods beginning afterNovember 15, 2008, with early application encouraged. In years after initial adoption, FAS 161 requirescomparative disclosures only for periods subsequent to initial adoption. FAS 161 is a disclosure standardand as such is not expected to impact the Company’s consolidated statements of operations and financialcondition when adopted.
Determining Whether Instruments Granted in Share-Based Payment Transactions Are Participating Securities
In June 2008, the FASB issued Emerging Issues Task Force 03-6-1, Determining Whether InstrumentsGranted in Share-Based Payment Transactions Are Participating Securities (“EITF 03-6-1”). EITF 03-6-1addresses whether instruments granted in share-based payment transactions are participating securitiesprior to vesting and, therefore, need to be included in the earnings allocation in computing earnings pershare under Statement No. 128, Earnings per Share. EITF 03-6-1 provides guidance on the calculation ofearnings per share for share-based payment awards with rights to dividends or dividend equivalents. EITF03-6-1 is effective for financial statements issued for fiscal years beginning after December 15, 2008, andinterim periods within those years. The adoption of EITF 03-6-1 is not expected to have a material effect onthe Company’s consolidated statements of operations and financial condition when adopted.
125

Contractual Obligations
At December 31, 2008 TotalLess than
1 year 1-3 years 3-5 yearsMore than5 years
(in thousands)
Long term debt obligations (1)5.875% Senior Notes $ 124,240 $ 5,875 $ 11,750 $106,615 $ —RenaissanceRe revolving credit facility (2) 157,650 157,650 — — —DaVinciRe revolving credit facility (2) 213,973 10,000 203,973 — —
Private equity and investment fundcommitments (3) 239,122 239,122 — — —
Operating lease obligations 44,723 6,782 12,605 11,042 14,294Capital lease obligations 50,289 2,893 5,112 4,834 37,450Other secured liabilities 77,420 77,420 — — —Obligations under credit derivative contracts 215 43 86 86 —Reverse repurchase obligation 50,128 50,128 — — —Payable for investments purchased 378,111 378,111 — — —Reserve for claims and claim expenses (4) 2,160,612 745,348 611,235 351,701 452,328
Total contractual obligations $3,496,483 $1,673,372 $844,761 $474,278 $504,072
(1) Includes contractual interest and dividend payments.
(2) The interest on this facility is based on a spread above LIBOR. We have reflected the interest due in2009 through 2011 based upon the current interest rate on the facility.
(3) The private equity commitments and bank loan fund do not have a defined contractual commitmentdate and we have therefore included them in the less than one year category.
(4) We caution the reader that the information provided above related to estimated future payment dates ofour reserves for claims and claim expenses is not prepared or utilized for internal purposes and that wecurrently do not estimate the future payment dates of claims and claim expenses. Because of thenature of the coverages that we provide, the amount and timing of the cash flows associated with ourpolicy liabilities will fluctuate, perhaps significantly, and therefore are highly uncertain. We have basedour estimates of future claim payments upon benchmark industry payment patterns, drawing uponavailable relevant sources of loss and allocated loss adjustment expense development data. Thesebenchmarks are revised periodically as new trends emerge. We believe that it is likely that thisbenchmark data will not be predictive of our future claim payments and that material fluctuations canoccur due to the nature of the losses which we insure and the coverages which we provide.
In certain circumstances, many of our contractual obligations may be accelerated to dates other than thosereflected in the table, due to defaults under the agreements governing those obligations (including pursuantto cross-default provisions in such agreements) or in connection with certain changes in control of theCompany, if applicable. In addition, in connection with any such default under the agreement governingthese obligations, in certain circumstances, these obligations may bear an increased interest rate or besubject to penalties as a result of such a default.
Current Outlook
General Economic Conditions
The United States and other markets around the world have been experiencing deteriorating economicconditions, including substantial and continuing financial market disruptions. If this trend in economicconditions continues or deteriorates further through 2009, we believe it would adversely affect the businessenvironment in our principal markets, and accordingly could adversely affect demand for the products soldby us or our clients. In addition, during an economic downturn, our consolidated credit risk, reflecting our
126

counterparty dealings with agents, brokers, customers, retrocessionaires, capital providers, partiesassociated with our investment portfolio, and others, would likely be increased. Moreover, our markets mayexperience increased inflationary conditions which would cause loss costs to increase.
While the Company continuously monitors the financial markets for opportunities to raise capital orrefinance existing obligations on attractive terms, the Company does not currently believe that it requiresadditional capital in the near term due to its strong current financial position. However, due to the everpresent potential for significant volatility in excess capital due primarily to our exposure to potentiallysignificant catastrophic events and if the current financial market disruption should continue, it could provedifficult to raise capital, when needed, on attractive terms or at all. For example, as noted under “Liquidityand Capital Resources”, the Company’s $500.0 million revolving credit facility expires in August 2009 andwhile the Company may desire to amend this facility or enter into a new facility, we are unable to assure youthat we will be able to do so on terms favorable to the Company or at all.
Current conditions in the investment markets, the current interest rate environment and general economicconditions could continue to adversely affect our net investment income on our fixed income investmentsand our other invested assets. In addition to impacting our reported net income, potential future losses onour investment portfolio, including potential future mark-to-market results, would adversely impact ourequity capital. Net investment income is an important contributor to the Company’s results of operations,and we currently expect the investment environment to remain challenging for the foreseeable future. Weexpect the current volatile financial markets and challenging economic conditions to persist for some timeand we are unable to predict with certainty when conditions might improve, or the pace or scale of any suchimprovement.
Market Conditions and Competition
The 2008 hurricane season proved to be an active year meteorologically, with the occurrence of twosignificant hurricanes, Gustav and Ike, as well as a number of smaller storms such as Dolly, Fay andHanna, making landfall in the United States. In addition, the dislocations in the investment markets haveeroded the capital and surplus of many market participants. We believe these factors have contributed tochanges in market conditions by increasing demand for insurance and reinsurance protection, particularlywith respect to the U.S. property catastrophe business, and other risk mitigation products, at a time whenthe supply of new capacity is constrained. We currently expect this increased demand to continue through2009, and to potentially give rise to increased opportunity for new business, although we also expectcompetition for this business to remain robust. We are unable to predict how long this situation may persist,although we expect it would be relatively temporary. While the pricing environment has improvedsomewhat, particularly in property catastrophe lines, as a result of these and other factors, our markets mayalso experience increased loss costs, decreased pricing flexibility and potentially reduced consumerpurchasing power, which could result in somewhat reduced underwriting profitability for the industryoverall. We believe that our strong relationships, and track record of superior claims paying and other clientservice, has and will continue to enable us to compete robustly for the business we find attractive.
The market for our catastrophe reinsurance products is generally dynamic and volatile. The marketdynamics noted above, increased or decreased catastrophe loss activity, and changes in the amount ofcapital in the industry can result in significant changes to the pricing, policy terms and demand for ourcatastrophe reinsurance contracts over a relatively short period of time. In addition, changes in state-sponsored catastrophe funds such as the FHCF, or the implementation of new government-subsidized orsponsored programs, can dramatically alter market conditions. We believe that the overall trend ofincreased frequency and severity of catastrophic Gulf and Atlantic Coast storms experienced in recent yearsmay continue for the foreseeable future. Increased understanding of the potential increase in frequencyand severity of storms may contribute to increased demand for protection in respect of coastal risks whichcould impact pricing and terms and conditions in coastal areas over time.
With respect to our Individual Risk segment, prior to recent developments in the financial markets and inour industry, we had expected to experience increasing competition for attractive new programs, and for theretention of our current programs. At this time, we believe it is possible that the increased pricing pressureswe had been experiencing across many of the lines of individual risk business we write have begun tomoderate as a result of the factors noted above, as well as the prospects for increased fragmentation
127

amongst certain competitors and other market participants. Market conditions are fluid and evolving and wecannot assure you that pricing conditions in these markets will improve or that we will succeed in growingour business if they do. While we are seeing attractive new opportunities in our multi-peril crop insuranceline of business, which now accounts for almost half of our gross premiums written in our Individual Risksegment, premiums in this line of business are inherently volatile as they are driven in part by commodityprices, which are subject to significant short and long term price changes. We plan to continue ourdisciplined underwriting approach with respect to both the products which we underwrite and the programsas to which we form partnerships. While we continuously and actively consider new or expandedrelationships and seek to respond quickly to potential growth opportunities, our in-depth due diligenceprocess means that growth opportunities within this segment take time. We believe that we have establishedourselves as an effective and creative, though disciplined, partner, and as a result we are presented withmany of the more attractive opportunities to analyze and compete for.
In addition, we continue to expand the capabilities of our ventures unit to explore potential strategicinvestments and other opportunities. In evaluating such new ventures, we seek an attractive return onequity, the ability to develop or capitalize on a competitive advantage, and opportunities that will not detractfrom our core operations. We currently expect the ongoing dislocation in the capital and credit markets maypresent additional, potentially attractive investment and operational opportunities, particularly given ourstrong reputation, financial resources, and track record of effectively structuring investments and jointventures.
Legislative and Regulatory Update
In January 2007, the State of Florida enacted legislation which increased the access of primary Floridainsurers to the FHCF. Through the FHCF, the State of Florida currently provides below market ratereinsurance of up to $28.0 billion per season, an increase from the previous cap of $16.0 billion, with theState able to further increase the limits up to an additional $4.0 billion per season. Further, the legislationexpanded the ability of Citizens Property Insurance Corporation (“Citizens”), a state-sponsored entity, tocompete with private insurance companies, such as ours. In 2008, the Florida legislature considered butdid not pass a bill that would reduce the coverage currently provided by the FHCF. In addition, the Floridalegislature did pass legislation (the “Florida Bill”) that, among other things, continued the freeze of Citizens’rates until at least July 1, 2009 and capped increases for three years thereafter, revised aspects of the sizeand allocation of assessments and allowed Citizens to continue to insure homes worth over $1.0 million. InOctober 2008, the Advisory Council to the FHCF received a report analyzing the significant challenges theFHCF would face, in part in light of the ongoing global financial market dislocation, if required to fund asignificant amount of its total potential financial obligations. A failure of the FHCF to honor its obligationswould adversely impact the Florida market, and would pose meaningful challenges to the insurers who havepurchased coverage from the FHCF, including many of our clients. In light of these issues, Floridastakeholders and policymakers are considering a number of reform initiatives, including a possiblereduction in the current limits offered by the FHCF or possible increases in the premiums charged by theFHCF to Citizens and to private insurers. At this time, we cannot estimate the likelihood that any reforms willbe enacted into law, or the impact on existing participants in the Florida market, including our clients andinvestees, on us directly, or on the private Florida insurance market generally, if they are not.
In 2007, the U.S. House of Representatives passed legislation, H.R. 3121, the Flood Insurance Reform andModernization Act, which would renew, expand and alter the National Flood Insurance Program (“NFIP”).The NFIP, which is operated by the Federal Emergency Management Agency (“FEMA”), providessubsidized flood insurance in identified flood plain zones. H.R. 3121 includes a provision that wouldexpand the NFIP to cover damage to or loss of real or related personal property located in the U.S. arisingfrom any windstorm (any hurricane, tornado, cyclone, typhoon, or other wind event). This amendment, asapproved by the House, would provide coverage up to $0.5 million for a single-family dwelling, $0.5 millionfor a dwelling unit within a multiple-dwelling structure, approximately $0.2 million for the contents of adwelling unit, $1.0 million for non-residential properties, and approximately $0.8 million for the contents ofa non-residential property.
128

Also in 2007, the U.S. House of Representatives approved another proposed bill, H.R. 3355, the“Homeowners’ Defense Act of 2007” comprised of two titles, one that would create a National CatastropheRisk Consortium and one that would require the U.S. Treasury Department to establish a nationalhomeowner’s insurance stabilization program. The National Catastrophe Risk Consortium program wouldallow multiple participating states to pool their respective catastrophic risk insurance or reinsurance windpools or other residual markets amongst each other. The stabilization program would allow the TreasuryDepartment to make below-cost loans to participating states or their reinsurance pools and/or residualmarkets.
In 2008, Congress conducted hearings relating to the tax treatment of offshore insurance and is reported tobe considering legislation that would adversely affect reinsurance between affiliates and offshore insuranceand reinsurance more generally. On September 18, 2008, U.S. Rep. Richard Neal introduced one suchproposal, H.R. 6969 (the “Neal Bill”), a bill which provides that foreign insurers and reinsurers would becapped in deducting reinsurance premiums ceded from U.S. units to offshore affiliates. The bill, which hasbeen referred to the House Ways and Means Committee, would limit deductions for related partyreinsurance cessions to the average percentage of premium ceded to unrelated reinsurers (determined inreference to individual business lines). In the fourth quarter of 2008, the Senate Finance Committeereleased a staff discussion draft, which was substantively similar to the Neal Bill.
To date, none of the above legislation has been approved by the Senate, although their respective sponsorshave announced plans to reintroduce these bills in 2009. We can provide no assurance that this legislationor similar legislation will not be adopted. We believe that passage of such legislation would adversely affectus, perhaps materially.
ITEM 7A. QUANTITATIVE AND QUALITATIVE DISCLOSURES ABOUT MARKET RISK
We are principally exposed to five types of market risk: interest rate risk; foreign currency risk; equity pricerisk; credit risk; and energy and weather-related risk. The Company’s investment guidelines permit, subjectto approval, investments in derivative instruments such as futures, options, forward contracts and swapagreements, which may be used to assume risks or for hedging purposes.
Interest Rate Risk
Our investment portfolio includes fixed maturity investments available for sale and short term investments,whose fair values will fluctuate with changes in interest rates. We attempt to maintain adequate liquidity inour fixed maturity investments portfolio to fund operations, pay reinsurance and insurance liabilities andclaims and provide funding for unexpected events. We seek to manage our interest rate risk in part bymonitoring the duration and structure of our investment portfolio.
The aggregate hypothetical loss generated from an immediate adverse parallel shift in the treasury yieldcurve of 100 basis points would cause a decrease in market value of 1.5%, which equated to a decrease inmarket value of approximately $77.5 million on a portfolio valued at $5.2 billion at December 31, 2008. Theforegoing reflects the use of an immediate time horizon, since this presents the worst-case scenario. Creditspreads are assumed to remain constant in these hypothetical examples.
We use interest rate futures within our portfolio of fixed maturity investments available for sale to manageour exposure to interest rate risk, which can include increasing or decreasing our exposure to this risk. AtDecember 31, 2008, we had $1.6 billion of notional long positions and $134.0 million of notional shortpositions of Eurodollar, U.S. Treasury and non-U.S. dollar futures contracts. We account for these futurescontracts at fair value and record them in our consolidated balance sheet as other assets or other liabilitiesdepending on the rights or obligations. The fair value of these derivatives as recognized in other assets andliabilities in our consolidated balance sheet at December 31, 2008, was $0.1 million (2007 – $0.3 million)and $0.1 million (2007 – $0.3 million), respectively. During 2008, we recorded gains of $12.4 million (2007– losses of $1.9 million) in our consolidated statement of operations related to these derivatives. The fairvalue of these derivatives is determined using exchange traded closing prices. The aggregate hypotheticalloss generated from an immediate adverse parallel shift in the treasury yield curve of 100 basis points wouldcause a decrease in market value of our net position in these derivatives of approximately $4.1 million atDecember 31, 2008. The foregoing reflects the use of an immediate time horizon, since this presents theworst-case scenario. Credit spreads are assumed to remain constant in these hypothetical examples.
129

Foreign Currency Risk
Our functional currency is the U.S. dollar. We write a portion of our business in currencies other than U.S.dollars and may, from time to time, experience foreign exchange gains and losses and incur underwritinglosses in currencies other than U.S. dollars, which will in turn affect our consolidated financial statements.All changes in exchange rates, with the exception of non-U.S. dollar denominated investments classified asavailable for sale, are recognized currently in our statements of operations.
Our foreign currency policy with regard to our underwriting operations is generally to hold foreign currencyassets, including cash, investments and receivables that approximate the foreign currency liabilities,including claims and claim expense reserves and reinsurance balances payable. From time to time, theCompany will use foreign currency forward and option contracts to minimize the effect of fluctuating foreigncurrencies on the value of non-U.S. dollar denominated assets and liabilities associated with ourunderwriting operations. At December 31, 2008, the Company had notional exposure of $133.0 million(2007 – $222.5 million) related to foreign currency forward and option contracts purchased. Our foreigncurrency and option contracts are recorded at fair value, which is determined principally by obtainingquotes from independent dealers and counterparties. During 2008, we incurred a loss of $21.4 million(2007 – gain of $3.6 million), on our foreign currency forward and option contracts related to ourunderwriting operations.
For our investment operations, we are exposed to currency fluctuations through our investments innon-U.S. dollar fixed maturity investments, short term investments and other investments. At December 31,2008, our combined investment in these non-U.S. dollar investments was $141.1 million (2007 – $183.0million). To economically hedge our exposure to currency fluctuations from these investments, we haveentered into foreign currency forward contracts with net notional exposure of $103.6 million (2007 – $123.4million). In the future, we may choose to increase our exposure to non-U.S. dollar investments. Unrealizedforeign exchange gains or losses arising from non-U.S. dollar investments classified as available for sale arerecorded in accumulated other comprehensive income. Realized foreign exchange gains or losses from thesale of our non-U.S. dollar available for sale investments, realized and unrealized foreign exchange gains orlosses from the sale of our non-U.S. dollar other investments, and foreign exchange gains (losses)associated with our hedging of these non-U.S. dollar investments are recorded in net foreign exchangegains (losses) in our statements of operations. During 2008, we recorded a gain of $5.8 million (2007 – lossof $15.1 million) on our foreign currency forward contracts related to hedging our non-U.S. dollarinvestments. This was offset by a loss of $4.9 million (2007 – gain of $20.9 million) on our non-U.S. dollardenominated investments. In addition, we recorded a loss of $3.3 million in accumulated othercomprehensive income (2007 – $0.4 million) related to the change in unrealized foreign exchange gains(losses) on non-U.S. dollar investments which are classified as available for sale.
Equity Price Risk
We are exposed to equity price risk due to our investment in a warrant to purchase common shares ofPlatinum, which we carry on our balance sheet at fair value, as well as to our investments in hedge funds,private equity funds and other investments as described below. The risk to the Platinum warrant is thepotential for loss in fair value resulting from adverse changes in the price of Platinum’s common stock. Theaggregate fair value of this investment in Platinum was $29.9 million at December 31, 2008. A hypothetical10 percent decline in the price of Platinum stock, holding all other factors constant, would have resulted ina $6.9 million decline in the fair value of the warrant (assuming no other changes to the inputs to the Black-Scholes option valuation model that we use). The decline in the fair value of the warrant would be recordedin other loss.
We are also indirectly exposed to equity market risk through our investments in: 1) some hedge funds thathave net long equity positions; 2) private equity partnerships whose exit strategies often depend on theequity markets; such investments totaled $364.7 million at December 31, 2008 (2007 – $427.9 million);and 3) our investments in other ventures, under equity method, which totaled $99.9 million atDecember 31, 2008 (2007 – $90.6 million). A hypothetical 10 percent decline in the prices of these hedgefunds, private equity partnerships and investments in other ventures, under equity method, holding all otherfactors constant, would have resulted in a $46.5 million decline in the fair value of these investments atDecember 31, 2008.
130
Credit Risk
Our exposure to credit risk is primarily due to our fixed maturity investments available for sale, short terminvestments, premiums receivable and ceded reinsurance balances. At December 31, 2008 and 2007, ourinvested asset portfolio had a dollar weighted average rating of AA. From time to time, we purchase creditderivatives to hedge our exposures in the insurance industry and to assist in managing the credit riskassociated with ceded reinsurance. At December 31, 2008, the maximum payments we were obligated tomake under credit default swaps was $0.2 million (2007 – $1.0 million). The fair value of these creditderivatives, as recognized in other liabilities in our balance sheet at December 31, 2008, was $0.9 million(2007 – $0.1 million). During 2008, we recorded gains of $1.1 million (2007 – $0.5 million) in ourconsolidated statement of operations. We account for credit derivatives at fair value and record them on ourconsolidated balance sheet as other assets or other liabilities depending on the rights or obligations. The fairvalue of the credit derivatives are determined using industry valuation models. The fair value of these creditderivatives can change based on a variety of factors including changes in credit spreads, default rates andrecovery rates, the correlation of credit risk between the referenced credit and the counterparty, and marketrate inputs such as interest rates.
We are exposed to credit risk through our equity investment in ChannelRe, a privately held financialguaranty reinsurance company. Our investment in ChannelRe is subject to potentially significant variability,resulting from mark-to-market changes, due to changes in credit market conditions. While the Companyhas no further negative economic exposure to ChannelRe, it is possible that the mark-to-market willfluctuate, perhaps increasing or decreasing over time, and it is possible that as the underlying securitiesnear maturity, if there are no defaults on the underlying securities for which ChannelRe is obligated, themark-to-market adjustment could reverse, perhaps materially.
Energy and Weather-Related Derivative Risk
We purchase and sell certain derivative financial products primarily to address weather risks and engage inhedging and trading activities related to these risks. The trading markets for the instruments in which weparticipate are generally linked to weather, other natural phenomena, or products or indices linked in part tosuch phenomena, such as heating and cooling degree days, precipitation, energy production and prices,and commodity prices. The fair value of these contracts is obtained through the use of quoted marketprices, or in the absence of such quoted prices, industry or internal valuation models. These contracts arerecorded on our balance sheet at December 31, 2008, in other assets and other liabilities and totaled $41.7million and $38.8 million, respectively (2007 – $15.9 million and $21.1 million, respectively). During 2008,the Company generated income related to these derivatives of $33.7 million (2007 – incurred losses of $1.1million) which are included in other income (loss) and represents net settlements and changes in the fairvalue of these contracts.
In addition, we have entered into a credit derivatives agreement with respect to cat-linked securitieswhereby we have sold cat-linked securities with a par amount of $77.4 million at December 31, 2008 (2007– $88.9 million) to a bank, while retaining the underlying risk. The agreement allows us to repurchase thesesecurities at par and obligates us to repurchase the securities under certain circumstances includingcatastrophe triggering events and events of default. As a result of this transaction, we are receiving thespread over LIBOR for each of the cat-link securities subject to the credit derivatives agreement, less afinancing fee. The credit derivatives agreement is accounted for at fair value with changes in fair valuerecognized in other loss. We recognized $2.2 million (2007 – $2.0 million) of other income in ourconsolidated statements of operations in 2008 from this transaction. A 10% change decrease in the valueof securities underlying the credit derivatives agreement would negatively impact our results by $7.7 million.
ITEM 8. FINANCIAL STATEMENTS AND SUPPLEMENTARY DATA
Reference is made to Item 15(a) of this Report for the Consolidated Financial Statements of RenaissanceReand the Notes thereto, as well as the Schedules to the Consolidated Financial Statements.
ITEM 9. CHANGES IN AND DISAGREEMENTS WITH ACCOUNTANTS ON ACCOUNTING AND FINANCIALDISCLOSURE
None.
131

ITEM 9A. CONTROLS AND PROCEDURES
Disclosure Controls and Internal Controls: We have designed various disclosure controls and procedures(as defined in Rules 13a-15(e) and Rule 15d-15(e) under the Exchange Act), to help ensure thatinformation required to be disclosed in our periodic Exchange Act reports, such as this report, is recorded,processed, summarized and reported on a timely and accurate basis. Our disclosure controls andprocedures are also designed with the objective of ensuring that such information is accumulated andcommunicated to our senior management, including our Chief Executive Officer and Chief Financial Officer,as appropriate to allow timely decisions regarding required disclosure. Our internal control over financialreporting is a process designed to provide reasonable assurance regarding the reliability of financialreporting and the preparation of financial statements for external purposes in accordance with generallyaccepted accounting principles and includes those policies and procedures that: (1) pertain to themaintenance of records that in reasonable detail accurately and fairly reflect the transactions anddispositions of the assets of the issuer; (2) provide reasonable assurance that transactions are recorded asnecessary to permit preparation of financial statements in accordance with generally accepted accountingprinciples, and that receipts and expenditures of the issuer are being made only in accordance withauthorizations of management and directors of the issuer; and (3) provide reasonable assurance regardingprevention or timely detection of unauthorized acquisition, use or disposition of the issuer’s assets thatcould have a material effect on financial statements.
Limitations on the effectiveness of controls: Our Board of Directors and management, including our ChiefExecutive Officer and Chief Financial Officer, do not expect that our disclosure controls and procedures orinternal control over financial reporting will prevent all errors and all fraud. Controls, no matter how wellconceived and operated, can provide only reasonable, not absolute, assurance that the objectives of thecontrols are met. Further, we believe that the design of prudent controls must reflect appropriate resourceconstraints, such that the benefits of controls must be considered relative to their costs. Because of theinherent limitations in all controls, there can be no absolute assurance that all control issues and instancesof fraud, if any, applicable to us have been or will be detected. These inherent limitations include therealities that judgments in decision-making can be faulty, and that breakdowns can occur because ofsimple errors or mistakes. Additionally, controls can be circumvented by the individual acts of someindividuals, by collusion of more than one person, or by management override of the control. The design ofany system of controls also is based in part upon certain assumptions about the likelihood of future events,and there can be no assurance that any design will succeed in achieving its stated goals under all potentialfuture conditions; over time, controls may become inadequate because of changes in conditions, or thedegree of compliance with the policies or procedures may deteriorate. Because of the inherent limitations ina cost-effective control system, misstatements due to error or fraud may occur and not be detected.
Evaluation: An evaluation was performed under the supervision and with the participation of theCompany’s management, including our Chief Executive Officer and Chief Financial Officer, of theeffectiveness of the design and operation of the Company’s disclosure controls and procedures as requiredby Rules 13a-15(b) and 15d-15(b) of the Exchange Act. Based upon that evaluation, the Company’smanagement, including our Chief Executive Officer and Chief Financial Officer, concluded that, atDecember 31, 2008, the Company’s disclosure controls and procedures were effective at the reasonableassurance level in ensuring that information required to be disclosed in Company reports filed under theExchange Act is (i) recorded, processed, summarized and reported within the time periods specified in theSEC rules and forms and (ii) accumulated and communicated to management, including the Company’sChief Executive Officer and Chief Financial Officer, as appropriate to allow timely decisions regardingrequired disclosure. There has been no change in the Company’s internal control over financial reportingduring the quarter ended December 31, 2008 that has materially affected, or is reasonably likely tomaterially affect, the Company’s internal control over financial reporting.
ITEM 9B. OTHER INFORMATION
None.
132

PART III
ITEM 10. DIRECTORS, EXECUTIVE OFFICERS AND CORPORATE GOVERNANCE
This item is omitted because a definitive proxy statement that involves the election of directors will be filedwith the Securities and Exchange Commission not later than 120 days after the close of the fiscal yearpursuant to Regulation 14A, which proxy statement is incorporated by reference.
RenaissanceRe has adopted a Code of Ethics that applies to its directors and executive officers. The Codeof Ethics is available free of charge on our website http://www.renre.com. We intend to disclose anyamendments to our Code of Ethics by posting such information on our website, as well as disclosing anywaivers of our code applicable to our principal executive officer, principal financial officer, principalaccounting officer or controller and other executive officers who perform similar functions through suchmeans or by filing a Form 8-K.
ITEM 11. EXECUTIVE COMPENSATION
This item is omitted because a definitive proxy statement that involves the election of directors will be filedwith the Securities and Exchange Commission not later than 120 days after the close of the fiscal yearpursuant to Regulation 14A, which proxy statement is incorporated by reference.
ITEM 12. SECURITY OWNERSHIP OF CERTAIN BENEFICIAL OWNERS AND MANAGEMENT AND RELATEDSHAREHOLDER MATTERS
This item is omitted because a definitive proxy statement that involves the election of directors will be filedwith the Securities and Exchange Commission not later than 120 days after the close of the fiscal yearpursuant to Regulation 14A, which proxy statement is incorporated by reference.
ITEM 13. CERTAIN RELATIONSHIPS AND RELATED TRANSACTIONS, AND DIRECTOR INDEPENDENCE
This item is omitted because a definitive proxy statement that involves the election of directors will be filedwith the Securities and Exchange Commission not later than 120 days after the close of the fiscal yearpursuant to Regulation 14A, which proxy statement is incorporated by reference.
ITEM 14. PRINCIPAL ACCOUNTANT FEES AND SERVICES
This item is omitted because a definitive proxy statement that involves the election of directors will be filedwith the Securities and Exchange Commission not later than 120 days after the close of the fiscal yearpursuant to Regulation 14A, which proxy statement is incorporated by reference.
133

PART IV
ITEM 15. EXHIBITS AND FINANCIAL STATEMENT SCHEDULES
(a) Financial Statements, Financial Statement Schedules and Exhibits.
1. Financial Statements
The Consolidated Financial Statements of RenaissanceRe Holdings Ltd. and related Notes thereto are listedin the accompanying Index to Consolidated Financial Statements and are filed as part of this Form 10-K.
2. Financial Statement Schedules
The Schedules to the Consolidated Financial Statements of RenaissanceRe Holdings Ltd. are listed in theaccompanying Index to Schedules to Consolidated Financial Statements and are filed as a part of this Form10-K.
3. Exhibits
3.1 Memorandum of Association. (1)
3.2 Amended and Restated Bye-Laws. (2)
3.3 Memorandum of Increase in Share Capital of RenaissanceRe Holdings Ltd. (3)
3.4 Specimen Common Share certificate. (1)
10.1 Form of Director Retention Agreement, dated as of November 8, 2002, entered into by each ofthe non-employee directors of RenaissanceRe Holdings Ltd. (4)
10.2 Amended and Restated Employment Agreement, dated as of February 22, 2006, betweenRenaissanceRe Holdings Ltd. and Neill A. Currie. (5)
10.3 Amendment No. 1, dated as of March 1, 2007, to the Employment Agreement, dated as ofFebruary 22, 2006 by and between RenaissanceRe Holdings Ltd. and Neill A. Currie. (6)
10.4 Amendment No. 2, dated as of November 19, 2008, between RenaissanceRe Holdings Ltd. andNeill A. Currie. (7)
10.5 Employment Agreement, dated as of July 19, 2006, between RenaissanceRe Holdings Ltd. andFred R. Donner. (8)
10.6 Amended and Restated Employment Agreement, dated as of July 19, 2006, betweenRenaissanceRe Holdings Ltd. and William I. Riker. (8)
10.7 Transition Services Agreement dated as of July 18, 2007 between RenaissanceRe Holdings Ltd.and William I. Riker. (9)
10.8 Amended and Restated Employment Agreement, dated as of July 19, 2006, betweenRenaissanceRe Holdings Ltd. and John D. Nichols, Jr. (8)
10.9 Sublease Agreement, dated as of July 19, 2006, between Renaissance Reinsurance Ltd. andJohn D. Nichols, Jr. (8)
10.10 Form of Employment Agreement for Executive Officers. (8)
10.11 Form of Amendment to Employment Agreement for Executive Officers. (10)
10.12 Form of Amendment to Employment Agreement for Executive Officers. (7)
10.13 Sixth Amended and Restated Employment Agreement, dated as of May 19, 2004, betweenRenaissanceRe Holdings Ltd. and James N. Stanard. (11)
10.14 Second Amended and Restated Credit Agreement, dated as of August 6, 2004, amongRenaissanceRe Holdings Ltd., the Lenders named therein, Deutsche Bank AG New York Branch,as LC Issuer and Co-Documentation Agent, HSBC Bank U.S., National Association, as Co-Documentation Agent, Citibank, N.A. and Wachovia Bank, National Association, as Co-Syndication Agents, Bank of America, N.A., as Administrative Agent and Bank of AmericaSecurities LLC, as Sole Lead Arranger and Sole Book Manager. (12)
134

10.15 First Amendment Agreement, dated as of August 11, 2005, among RenaissanceRe HoldingsLtd., the Lenders named therein, Deutsche Bank AG New York Branch, as LC Issuer and Bankof America, National Association, as Administrative Agent for the Lenders. (13)
10.16 Second Amendment Agreement to Second Amended and Restated Credit Agreement, dated asof May 19, 2006, among RenaissanceRe Holdings Ltd., the lenders named therein, DeutscheBank AG New York Branch, as LC Issuer and Bank of America, National Association, asAdministrative Agent for the Lenders. (14)
10.17 Third Amendment, dated as of June 18, 2007, to Second Amended and Restated CreditAgreement, dated as of August 6, 2004, among RenaissanceRe Holdings Ltd., the lendersnamed therein, Deutsche Bank AG New York Branch, as LC Issuer and Bank of America,National Association as Administrative Agent for the Lenders. (15)
10.18 Fourth Amendment, dated as of September 6, 2007, to Second Amended and Restated CreditAgreement, dated as of August 6, 2004, among RenaissanceRe Holdings Ltd., the lendersnamed therein, Deutsche Bank AG New York Branch, as LC Issuer and Bank of America,National Association as Administrative Agent for the Lenders. (16)
10.19 Third Amended and Restated Credit Agreement, dated as of April 5, 2006, by and amongDaVinciRe Holdings Ltd., the banks, financial institutions and other institutional lenders listedthereto (the “Lenders”), Citigroup Global Markets Inc., as sole lead arranger, book manager andsyndication agent, and Citibank, N.A. as administrative agent for the Lenders. (17)
10.20 RenaissanceRe Holdings Ltd. Second Amended and Restated 1993 Stock Incentive Plan. (18)
10.21 RenaissanceRe Holdings Ltd. 2001 Stock Incentive Plan. (19)
10.22 Amendment No. 1 to the RenaissanceRe Holdings Ltd. 2001 Stock Incentive Plan. (20)
10.23 Amendment No. 2 to the RenaissanceRe Holdings Ltd. 2001 Stock Incentive Plan. (20)
10.24 Form of Option Grant Notice and Agreement pursuant to which option grants are made under theRenaissanceRe Holdings Ltd. 2001 Stock Incentive Plan. (12)
10.25 Form of Restricted Stock Grant Notice and Agreement pursuant to which Restricted Stock grantsare made under the RenaissanceRe Holdings Ltd. 2001 Stock Incentive Plan. (12)
10.26 RenaissanceRe Holdings Ltd. 2004 Stock Option Incentive Plan. (21)
10.27 Amendment No. 1 to the RenaissanceRe Holdings Ltd. 2004 Stock Option Incentive Plan. (22)
10.28 Form of Option Agreement pursuant to which option grants are made under the RenaissanceReHoldings 2004 Stock Option Incentive Plan to executive officers. (21)
10.29 Amended and Restated RenaissanceRe Holdings Ltd. Non-Employee Director Stock Plan. (23)
10.30 Amendment No. 1 to the RenaissanceRe Holdings Ltd. Non-Employee Director Stock Plan. (24)
10.31 Amendment No. 2 to the RenaissanceRe Holdings Ltd. Non-Employee Director Stock Plan. (25)
10.32 Amendment No. 3 to the RenaissanceRe Holdings Ltd. Non-Employee Director Stock Plan.
10.33 Form of Restricted Stock Grant Agreement for Directors. (5)
10.34 Form of Option Grant Agreement for Directors. (5)
10.35 Master Standby Letter of Credit Reimbursement Agreement, dated as of November 2, 2001,between Renaissance Reinsurance Ltd. and Fleet National Bank. Glencoe Insurance Ltd. andTimicuan Reinsurance Ltd. have each become a party to this agreement pursuant to anaccession agreement, and DaVinci Reinsurance Ltd. has entered in a substantially similaragreement with Fleet National Bank. (26)
10.36 Certificate of Designation, Preferences and Rights of 7.30% Series B Preference Shares. (27)
135

10.37 Certificate of Designation, Preferences and Rights of 6.08% Series C Preference Shares. (28)
10.38 Certificate of Designation, Preferences and Rights of 6.60% Series D Preference Shares. (29)
10.39 Senior Indenture, dated as of July 1, 2001, between RenaissanceRe Holdings Ltd., as Issuer,and Bankers Trust Company, as Trustee. (30)
10.40 Second Supplemental Indenture, by and between RenaissanceRe Holdings Ltd. and DeutscheBank Trust Company Americas (f/k/a Bankers Trust Company), dated as of January 31, 2003.(31)
10.41 Second Amended and Restated Reimbursement Agreement, dated as of April 27, 2007, by andamong Renaissance Reinsurance Ltd., Renaissance Reinsurance of Europe, Glencoe InsuranceLtd., DaVinci Reinsurance Ltd., RenaissanceRe Holdings Ltd., Wachovia Bank, NationalAssociation, as Issuing Bank, Administrative Agent, and Collateral Agent for the Lenders, certainCo-Syndication Agents, ING Bank N.V., as Documentation Agent, and certain Lenders partythereto. (32)
21.1 List of Subsidiaries of the Registrant.
23.1 Consent of Ernst & Young Ltd.
31.1 Certification of Neill A. Currie, Chief Executive Officer of RenaissanceRe Holdings Ltd., pursuantto Rule 13a-14(a) or Rule 15d-14(a) of the Securities Exchange Act of 1934, as amended.
31.2 Certification of Fred R. Donner, Chief Financial Officer of RenaissanceRe Holdings Ltd., pursuantto Rule 13a-14(a) or Rule 15d-14(a) of the Securities Exchange Act of 1934, as amended.
32.1 Certification of Neill A. Currie, Chief Executive Officer of RenaissanceRe Holdings Ltd., pursuantto 18 U.S.C. Section 1350, as adopted pursuant to Section 906 of the Sarbanes-Oxley Act of2002.
32.2 Certification of Fred R. Donner, Chief Financial Officer of RenaissanceRe Holdings Ltd., pursuantto 18 U.S.C. Section 1350, as adopted pursuant to Section 906 of the Sarbanes-Oxley Act of2002.
(1) Incorporated by reference to the Registration Statement on Form S-1 of RenaissanceRe Holdings Ltd.(Registration No. 33-70008) which was declared effective by the SEC on July 26, 1995.
(2) Incorporated by reference to RenaissanceRe Holdings Ltd.’s Quarterly Report on Form 10-Q for theperiod ended June 30, 2002, filed with the SEC on August 14, 2002.
(3) Incorporated by reference to RenaissanceRe Holdings Ltd.’s Quarterly Report on Form 10-Q for theperiod ended March 31, 1998, filed with the SEC on May 14, 1998 (SEC File Number 000-26512)
(4) Incorporated by reference to RenaissanceRe Holdings Ltd.’s Annual Report on Form 10-K for the yearended December 31, 2002, filed with the SEC on March 31, 2003 (SEC File Number 001-14428)
(5) Incorporated by reference to RenaissanceRe Holdings Ltd.’s Current Report on Form 8-K, filed withthe SEC on February 27, 2006
(6) Incorporated by reference to RenaissanceRe Holdings Ltd.’s Quarterly Report on Form 10-Q for theperiod ended March 31, 2007, filed with the SEC on May 2, 2007.
(7) Incorporated by reference to RenaissanceRe Holdings Ltd.’s Current Report on Form 8-K, filed withthe SEC on November 25, 2008.
(8) Incorporated by reference to RenaissanceRe Holdings Ltd.’s Current Report on Form 8-K, filed withthe SEC on July 21, 2006, relating to certain events which occurred on July 19, 2006. Other than withrespect to the Percent and Lump Sum Percent (as defined and disclosed in the Form 8-K) andmatters such as names and titles, the employment agreements for Messrs. O’Donnell and Ashley areidentical to the form filed as Exhibit 10.9.
(9) Incorporated by reference to RenaissanceRe Holdings Ltd.’s Current Report on Form 8-K, filed withthe SEC on July 20, 2007.
136

(10) Incorporated by reference to RenaissanceRe Holdings Ltd.’s Quarterly Report on Form 10-Q for theperiod ended March 31, 2008, filed with the SEC on May 2, 2008.
(11) Incorporated by reference to RenaissanceRe Holdings Ltd.’s Quarterly Report on Form 10-Q for theperiod ended June 30, 2004, filed with the SEC on August 9, 2004
(12) Incorporated by reference to RenaissanceRe Holdings Ltd.’s Quarterly Report on Form 10-Q for theperiod ended September 30, 2004, filed with the SEC on November 9, 2004.
(13) Incorporated by reference to RenaissanceRe Holdings Ltd.’s Annual Report on Form 10-K for the yearended December 31, 2005, filed with the SEC on March 3, 2006 (SEC File Number 001-14428).
(14) Incorporated by reference to RenaissanceRe Holdings Ltd.’s Quarterly Report on Form 10-Q for theperiod ended June 30, 2006, filed with the SEC on August 2, 2006 (SEC File Number 001-14428).
(15) Incorporated by reference to RenaissanceRe Holdings Ltd.’s Current Report on Form 8-K, filed withthe SEC on June 29, 2007.
(16) Incorporated by reference to RenaissanceRe Holdings Ltd.’s Quarterly Report on Form 10-Q for the periodended September 30, 2007, filed with the SEC on October 31, 2007 (SEC File Number 001-14428).
(17) Incorporated by reference to RenaissanceRe Holdings Ltd.’s Current Report on Form 8-K, filed withthe SEC on April 11, 2006, relating to certain events which occurred on April 5, 2006.
(18) Incorporated by reference to Exhibit 99.3 to the Registration Statement on Form S-8 (RegistrationNo. 333-90758) dated June 19, 2002.
(19) Incorporated by reference to Exhibit 99.2 to the Registration Statement on Form S-8 (RegistrationNo. 333-90758) dated June 19, 2002.
(20) Incorporated by reference to RenaissanceRe Holdings Ltd.’s Quarterly Report on Form 10-Q for theperiod ended March 31, 2007, filed with the SEC on May 2, 2007.
(21) Incorporated by reference to RenaissanceRe Holdings Ltd.’s Current Report on Form 8-K, filed withthe SEC on September 2, 2004.
(22) Incorporated by reference to RenaissanceRe Holdings Ltd.’s Annual Report on Form 10-K for the yearended December 31, 2004, filed with the SEC on March 31, 2005 (SEC File Number 001-14428).
(23) Incorporated by reference to Exhibit 99.1 to the Registration Statement on Form S-8 (RegistrationNo. 333-90758) dated June 19, 2002.
(24) Incorporated by reference to RenaissanceRe Holdings Ltd.’s Quarterly Report on Form 10-Q for theperiod ended March 31, 2007, filed with the SEC on May 2, 2007.
(25) Incorporated by reference to RenaissanceRe Holdings Ltd.’s Quarterly Report on Form 10-Q for theperiod ended September 30, 2008, filed with the SEC on October 30, 2008.
(26) Incorporated by reference to RenaissanceRe Holdings Ltd.’s Annual Report on Form 10-K for the yearended December 31, 2001 filed with the SEC on April 1, 2002.
(27) Incorporated by reference to RenaissanceRe Holdings Ltd.’s Current Report on Form 8-K, filed withthe SEC on February 4, 2003, relating to certain events which occurred on January 30, 2003.
(28) Incorporated by reference to RenaissanceRe Holdings Ltd.’s Current Report on Form 8-K, filed withthe SEC on March 18, 2004.
(29) Incorporated by reference to RenaissanceRe Holdings Ltd.’s Form 8-A, filed with the SEC onDecember 14, 2006.
(30) Incorporated by reference to RenaissanceRe Holdings Ltd.’s Current Report on Form 8-K, filed withthe SEC on July 17, 2001, relating to certain events which occurred on July 12, 2001.
(31) Incorporated by reference to RenaissanceRe Holdings Ltd.’s Current Report on Form 8-K, filed withthe SEC on January 31, 2003, relating to certain events which occurred on January 28, 2003.
(32) Incorporated by reference to RenaissanceRe Holdings Ltd.’s Current Report on Form 8-K, filed withthe SEC on May 3, 2007.
137

SIGNATURES
Pursuant to the requirements of Section 13 or 15(d) of the Securities Exchange Act of 1934, the Registranthas duly caused this report to be signed on its behalf by the undersigned, thereunto duly authorized, inHamilton, Bermuda on February 19, 2009.
RENAISSANCERE HOLDINGS LTD.
/s/ Neill A. Currie
Neill A. CurriePresident, Chief Executive Officer,Director
Signature Title Date
/s/ Neill A. Currie
Neill A. Currie
President, Chief ExecutiveOfficer, Director
February 19, 2009
/s/ Fred R. Donner
Fred R. Donner
Executive Vice President, ChiefFinancial Officer
February 19, 2009
/s/ Mark A. Wilcox
Mark A. Wilcox
Senior Vice President, CorporateController and Chief AccountingOfficer
February 19, 2009
/s/ W. James MacGinnitie
W. James MacGinnitie
Chairman of the Board ofDirectors
February 19, 2009
/s/ Thomas A. Cooper
Thomas A. Cooper
Director February 19, 2009
/s/ David C. Bushnell
David C. Bushnell
Director February 19, 2009
/s/ James L. Gibbons
James L. Gibbons
Director February 19, 2009
/s/ Jean D. Hamilton
Jean D. Hamilton
Director February 19, 2009
/s/ William F. Hecht
William F. Hecht
Director February 19, 2009
/s/ Henry Klehm, III
Henry Klehm, III
Director February 19, 2009
/s/ Ralph B. Levy
Ralph B. Levy
Director February 19, 2009
/s/ Anthony M. Santomero
Anthony M. Santomero
Director February 19, 2009
/s/ Nicholas L. Trivisonno
Nicholas L. Trivisonno
Director February 19, 2009
138

INDEX TO CONSOLIDATED FINANCIAL STATEMENTS
Page
Management’s Report on Internal Control Over Financial Reporting . . . . . . . . . . . . . . . . . . . . . . . . . . . F-2
Report of Independent Registered Public Accounting Firm . . . . . . . . . . . . . . . . . . . . . . . . . . . . . . . . . . F-3
Report of Independent Registered Public Accounting Firm . . . . . . . . . . . . . . . . . . . . . . . . . . . . . . . . . . F-4
Consolidated Balance Sheets at December 31, 2008 and 2007 . . . . . . . . . . . . . . . . . . . . . . . . . . . . . . F-5
Consolidated Statements of Operations for the Years Ended December 31, 2008, 2007 and 2006 . . . F-6
Consolidated Statements of Changes in Shareholders’ Equity for the Years Ended December 31,2008, 2007 and 2006 . . . . . . . . . . . . . . . . . . . . . . . . . . . . . . . . . . . . . . . . . . . . . . . . . . . . . . . . . . . . . F-7
Consolidated Statements of Cash Flows for the Years Ended December 31, 2008, 2007 and 2006 . . . F-8
Notes to the Consolidated Financial Statements . . . . . . . . . . . . . . . . . . . . . . . . . . . . . . . . . . . . . . . . . . . F-9
F-1

MANAGEMENT’S REPORT ON INTERNAL CONTROL OVER FINANCIAL REPORTING
Management at RenaissanceRe Holdings Ltd. (the “Company”) is responsible for establishing andmaintaining effective internal control over financial reporting as defined in Rules 13a-15(f) and 15d-15(f)under the Securities Exchange Act of 1934, as amended. The Company’s internal control over financialreporting was designed to provide reasonable assurance regarding the reliability of financial reporting andthe preparation of financial statements for external purposes in accordance with U.S. generally acceptedaccounting principles and to reflect management’s judgments and estimates concerning effects of eventsand transactions that are accounted for or disclosed. There are inherent limitations to the effectiveness ofany controls. Controls, no matter how well conceived and operated, can provide only reasonable assurancethat its objectives are met. No evaluation of controls can provide absolute assurance that all control issuesand instances of fraud, if any, within the Company have been detected.
Management, with the participation of the Chief Executive Officer and Chief Financial Officer, assessed itsinternal control over financial reporting as of December 31, 2008. In making this assessment, managementused the criteria set forth by the Committee of Sponsoring Organizations of the Treadway Commission(COSO) in Internal Control-Integrated Framework. Based on this assessment, management believes that theCompany maintained effective internal control over financial reporting as of December 31, 2008.
The Company’s effectiveness of internal control over financial reporting as of December 31, 2008, has beenaudited by Ernst & Young Ltd., the Independent Registered Public Accountants who also audited theCompany’s consolidated financial statements. Ernst & Young Ltd.’s attestation report on the effectiveness ofthe Company’s internal control over financial reporting appears on page F-4.
F-2

REPORT OF INDEPENDENT REGISTERED PUBLIC ACCOUNTING FIRM
TO THE BOARD OF DIRECTORS AND SHAREHOLDERS OF RENAISSANCERE HOLDINGS LTD.
We have audited the accompanying consolidated balance sheets of RenaissanceRe Holdings Ltd. andSubsidiaries as of December 31, 2008 and 2007, and the related consolidated statements of operations,changes in shareholders’ equity, and cash flows for each of the three years in the period endedDecember 31, 2008. These financial statements are the responsibility of the Company’s management. Ourresponsibility is to express an opinion on these financial statements based on our audits.
We conducted our audits in accordance with the standards of the Public Company Accounting OversightBoard (United States). Those standards require that we plan and perform the audit to obtain reasonableassurance about whether the financial statements are free of material misstatement. An audit includesexamining, on a test basis, evidence supporting the amounts and disclosures in the financial statements.An audit also includes assessing the accounting principles used and significant estimates made bymanagement, as well as evaluating the overall financial statement presentation. We believe that our auditsprovide a reasonable basis for our opinion.
In our opinion, the financial statements referred to above present fairly, in all material respects, theconsolidated financial position of RenaissanceRe Holdings Ltd. and Subsidiaries at December 31, 2008 and2007, and the consolidated results of their operations and their cash flows for each of the three years in theperiod ended December 31, 2008, in conformity with U.S. generally accepted accounting principles.
We also have audited, in accordance with the standards of the Public Company Accounting OversightBoard (United States), RenaissanceRe Holdings Ltd.’s internal control over financial reporting as ofDecember 31, 2008, based on criteria established in Internal Control-Integrated Framework issued by theCommittee of Sponsoring Organizations of the Treadway Commission and our report dated February 19,2009 expressed an unqualified opinion thereon.
/s/ Ernst & Young Ltd.
Hamilton, BermudaFebruary 19, 2009
F-3
REPORT OF INDEPENDENT REGISTERED PUBLIC ACCOUNTING FIRM
TO THE BOARD OF DIRECTORS AND SHAREHOLDERS OF RENAISSANCERE HOLDINGS LTD.
We have audited RenaissanceRe Holdings Ltd.’s internal control over financial reporting as ofDecember 31, 2008, based on criteria established in Internal Control – Integrated Framework issued by theCommittee of Sponsoring Organizations of the Treadway Commission (the COSO criteria). RenaissanceReHoldings Ltd.’s management is responsible for maintaining effective internal control over financial reporting,and for its assessment of the effectiveness of internal control over financial reporting included in theaccompanying Management’s Report on Internal Control over Financial Reporting. Our responsibility is toexpress an opinion on the Company’s internal control over financial reporting based on our audit.
We conducted our audit in accordance with the standards of the Public Company Accounting OversightBoard (United States). Those standards require that we plan and perform the audit to obtain reasonableassurance about whether effective internal control over financial reporting was maintained in all materialrespects. Our audit included obtaining an understanding of internal control over financial reporting,assessing the risk that a material weakness exists, testing and evaluating the design and operatingeffectiveness of internal control based on the assessed risk, and performing such other procedures as weconsidered necessary in the circumstances. We believe that our audit provides a reasonable basis for ouropinion.
A company’s internal control over financial reporting is a process designed to provide reasonable assuranceregarding the reliability of financial reporting and the preparation of financial statements for externalpurposes in accordance with generally accepted accounting principles. A company’s internal control overfinancial reporting includes those policies and procedures that (1) pertain to the maintenance of recordsthat, in reasonable detail, accurately and fairly reflect the transactions and dispositions of the assets of thecompany; (2) provide reasonable assurance that transactions are recorded as necessary to permitpreparation of financial statements in accordance with generally accepted accounting principles, and thatreceipts and expenditures of the company are being made only in accordance with authorizations ofmanagement and directors of the company; and (3) provide reasonable assurance regarding prevention ortimely detection of unauthorized acquisition, use, or disposition of the company’s assets that could have amaterial effect on the financial statements.
Because of its inherent limitations, internal control over financial reporting may not prevent or detectmisstatements. Also, projections of any evaluation of effectiveness to future periods are subject to the riskthat controls may become inadequate because of changes in conditions, or that the degree of compliancewith the policies or procedures may deteriorate.
In our opinion, RenaissanceRe Holdings Ltd. maintained, in all material respects, effective internal controlover financial reporting as of December 31, 2008, based on the COSO criteria.
We also have audited, in accordance with the standards of the Public Company Accounting OversightBoard (United States), the consolidated balance sheets of RenaissanceRe Holdings Ltd. as ofDecember 31, 2008 and 2007, and the related consolidated statements of operations, changes inshareholders’ equity, and cash flows for each of the three years in the period ended December 31, 2008and our report dated February 19, 2009 expressed an unqualified opinion thereon.
/s/ Ernst & Young Ltd.
Hamilton, BermudaFebruary 19, 2009
F-4

RenaissanceRe Holdings Ltd. and SubsidiariesConsolidated Balance Sheets
At December 31, 2008 and 2007(in thousands of United States Dollars, except per share amounts)
December 31, 2008 December 31, 2007
AssetsFixed maturity investments available for sale, at fair value $ 2,996,885 $ 3,914,363
(Amortized cost $2,916,991 and $3,863,902 at December 31,2008 and 2007, respectively) (Note 5)
Short term investments, at fair value (Note 5) 2,172,343 1,821,549Other investments, at fair value (Note 5) 773,475 807,864Investments in other ventures, under equity method (Note 5) 99,879 90,572
Total investments 6,042,582 6,634,348Cash and cash equivalents 274,692 330,226Premiums receivable 565,630 475,075Ceded reinsurance balances (Note 7) 88,019 107,916Losses recoverable (Note 7) 299,534 183,275Accrued investment income 26,614 39,084Deferred acquisition costs 81,904 104,212Receivable for investments sold 236,485 144,037Other secured assets (Note 8) 76,424 90,488Other assets 217,986 171,457Goodwill and other intangibles (Note 4) 74,181 6,237
Total assets $ 7,984,051 $ 8,286,355
Liabilities, Minority Interest and Shareholders’ EquityLiabilitiesReserve for claims and claim expenses (Note 9) $ 2,160,612 $ 2,028,496Reserve for unearned premiums 510,235 563,336Debt (Note 10) 450,000 451,951Reinsurance balances payable 315,401 275,430Payable for investments purchased 378,111 422,974Other secured liabilities (Note 8) 77,420 88,920Other liabilities 290,998 162,294
Total liabilities 4,182,777 3,993,401
Commitments and Contingencies
Minority Interest – DaVinciRe (Note 12) 768,531 815,451
Shareholders’ Equity (Note 13)Preference Shares: $1.00 par value – 26,000,000 shares issued
and outstanding at December 31, 2008 (2007 – 26,000,000shares) 650,000 650,000
Common shares: $1.00 par value – 61,503,333 shares issued andoutstanding at December 31, 2008 (2007 – 68,920,319 shares) 61,503 68,920
Additional paid-in capital — 107,867Accumulated other comprehensive income 75,387 44,719Retained earnings 2,245,853 2,605,997
Total shareholders’ equity 3,032,743 3,477,503
Total liabilities, minority interest and shareholders’ equity $ 7,984,051 $ 8,286,355
See accompanying notes to the consolidated financial statements
F-5

RenaissanceRe Holdings Ltd. and SubsidiariesConsolidated Statements of Operations
For the years ended December 31, 2008, 2007 and 2006(in thousands of United States Dollars, except per share amounts)
2008 2007 2006
RevenuesGross premiums written $1,736,028 $1,809,637 $1,943,647
Net premiums written (Note 7) $1,353,620 $1,435,335 $1,529,620Decrease (increase) in unearned premiums 33,204 (10,966) 157
Net premiums earned (Note 7) 1,386,824 1,424,369 1,529,777Net investment income (Note 5) 24,231 402,463 318,106Net foreign exchange gains (losses) 2,600 3,968 (3,293)Equity in earnings (losses) of other ventures (Note 5) 13,603 (128,609) 34,528Other income (loss) 10,252 (37,930) (3,917)Net realized (losses) gains on investments (Note 5) (206,314) 1,293 (34,464)
Total revenues 1,231,196 1,665,554 1,840,737
ExpensesNet claims and claim expenses incurred (Note 9) 760,489 479,274 446,230Acquisition expenses 213,553 254,930 280,697Operational expenses 122,165 110,464 109,586Corporate expenses 25,635 28,860 24,418Interest expense (Note 10) 24,633 33,626 37,602
Total expenses 1,146,475 907,154 898,533
Income before minority interests and taxes 84,721 758,400 942,204Minority interest – DaVinciRe (Note 12) (55,133) (164,396) (144,159)
Income before taxes 29,588 594,004 798,045Income tax (expense) benefit (Note 17) (568) 18,432 (935)
Net income 29,020 612,436 797,110Dividends on preference shares (Note 13) (42,300) (42,861) (35,475)
Net (loss) income (attributable) available to commonshareholders $ (13,280) $ 569,575 $ 761,635
Net (loss) income (attributable) available to commonshareholders per common share – basic (Note 14) $ (0.21) $ 8.08 $ 10.72
Net (loss) income (attributable) available to commonshareholders per common share – diluted (Note 14) (1) $ (0.21) $ 7.93 $ 10.57
Dividends per common share (Note 16) $ 0.92 $ 0.88 $ 0.84
(1) In accordance with FAS 128, earnings per share calculations use average common shares outstanding– basic, when in a net loss position.
See accompanying notes to the consolidated financial statements
F-6

RenaissanceRe Holdings Ltd. and SubsidiariesConsolidated Statements of Changes in Shareholders’ EquityFor the years ended December 31, 2008, 2007 and 2006
(in thousands of United States Dollars)
2008 2007 2006
Preference sharesBalance – January 1 $ 650,000 $ 800,000 $ 500,000Repurchase of shares — (150,000) —Issuance of shares — — 300,000
Balance – December 31 650,000 650,000 800,000
Common sharesBalance – January 1 68,920 72,140 71,523Repurchase of shares (8,064) (3,588) —Exercise of options and issuance of restricted stock
awards (Note 20) 647 368 617
Balance – December 31 61,503 68,920 72,140
Additional paid-in capitalBalance – January 1 107,867 284,123 279,762Repurchase of shares (131,328) (196,583) —Exercise of options and issuance of restricted stock
awards (Note 20) 23,461 20,327 13,811Offering expenses — — (9,450)
Balance – December 31 — 107,867 284,123
Accumulated other comprehensive incomeBalance – January 1 44,719 25,217 4,760Net unrealized gains on securities, net of adjustment
(see disclosure below) 30,668 19,502 20,457
Balance – December 31 75,387 44,719 25,217
Retained earningsBalance – January 1 2,605,997 2,099,017 1,397,795Net income 29,020 612,436 797,110Repurchase of shares (289,014) — —Dividends on common shares (57,850) (62,595) (60,413)Dividends on preference shares (42,300) (42,861) (35,475)
Balance – December 31 2,245,853 2,605,997 2,099,017
Total Shareholders’ Equity $3,032,743 $3,477,503 $3,280,497
Comprehensive incomeNet income $ 29,020 $ 612,436 $ 797,110Other comprehensive income 30,668 19,502 20,457
Comprehensive income $ 59,688 $ 631,938 $ 817,567
Disclosure regarding net unrealized gainsNet unrealized holding (losses) gains arising during the
year $ (175,646) $ 20,795 $ (14,007)Net realized losses (gains) included in net income 206,314 (1,293) 34,464
Net unrealized gains on securities $ 30,668 $ 19,502 $ 20,457
See accompanying notes to the consolidated financial statements
F-7
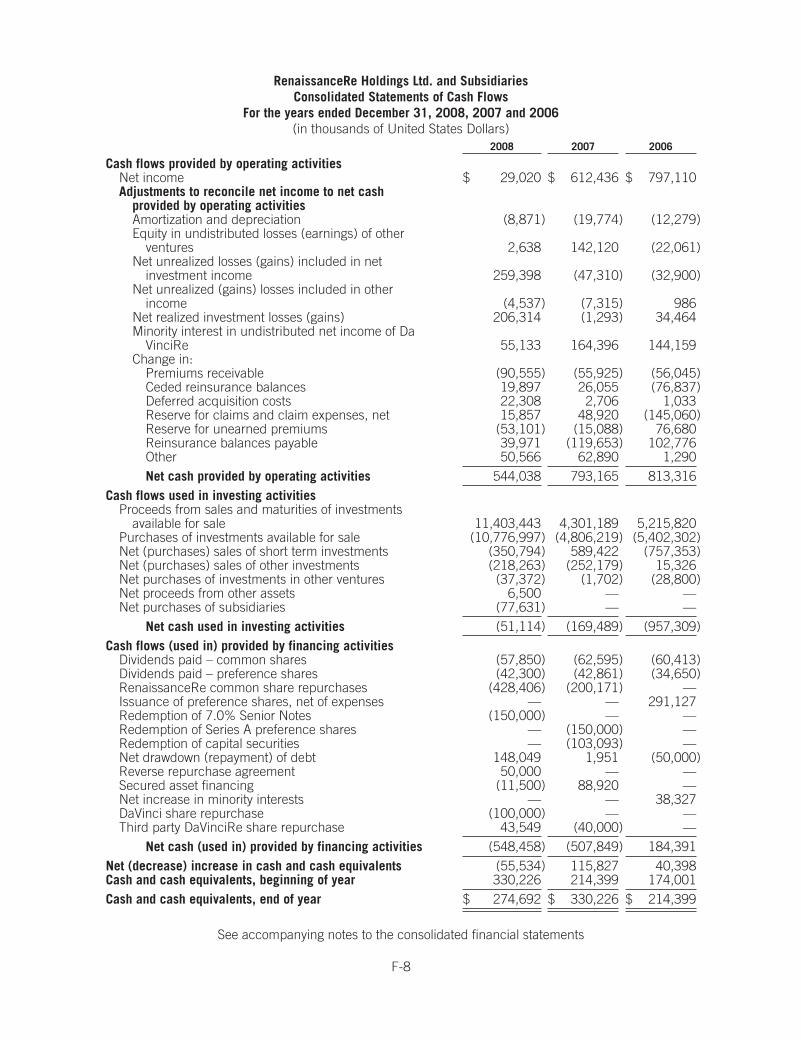
RenaissanceRe Holdings Ltd. and SubsidiariesConsolidated Statements of Cash Flows
For the years ended December 31, 2008, 2007 and 2006(in thousands of United States Dollars)
2008 2007 2006
Cash flows provided by operating activitiesNet income $ 29,020 $ 612,436 $ 797,110Adjustments to reconcile net income to net cash
provided by operating activitiesAmortization and depreciation (8,871) (19,774) (12,279)Equity in undistributed losses (earnings) of other
ventures 2,638 142,120 (22,061)Net unrealized losses (gains) included in net
investment income 259,398 (47,310) (32,900)Net unrealized (gains) losses included in other
income (4,537) (7,315) 986Net realized investment losses (gains) 206,314 (1,293) 34,464Minority interest in undistributed net income of Da
VinciRe 55,133 164,396 144,159Change in:
Premiums receivable (90,555) (55,925) (56,045)Ceded reinsurance balances 19,897 26,055 (76,837)Deferred acquisition costs 22,308 2,706 1,033Reserve for claims and claim expenses, net 15,857 48,920 (145,060)Reserve for unearned premiums (53,101) (15,088) 76,680Reinsurance balances payable 39,971 (119,653) 102,776Other 50,566 62,890 1,290Net cash provided by operating activities 544,038 793,165 813,316
Cash flows used in investing activitiesProceeds from sales and maturities of investments
available for sale 11,403,443 4,301,189 5,215,820Purchases of investments available for sale (10,776,997) (4,806,219) (5,402,302)Net (purchases) sales of short term investments (350,794) 589,422 (757,353)Net (purchases) sales of other investments (218,263) (252,179) 15,326Net purchases of investments in other ventures (37,372) (1,702) (28,800)Net proceeds from other assets 6,500 — —Net purchases of subsidiaries (77,631) — —
Net cash used in investing activities (51,114) (169,489) (957,309)Cash flows (used in) provided by financing activities
Dividends paid – common shares (57,850) (62,595) (60,413)Dividends paid – preference shares (42,300) (42,861) (34,650)RenaissanceRe common share repurchases (428,406) (200,171) —Issuance of preference shares, net of expenses — — 291,127Redemption of 7.0% Senior Notes (150,000) — —Redemption of Series A preference shares — (150,000) —Redemption of capital securities — (103,093) —Net drawdown (repayment) of debt 148,049 1,951 (50,000)Reverse repurchase agreement 50,000 — —Secured asset financing (11,500) 88,920 —Net increase in minority interests — — 38,327DaVinci share repurchase (100,000) — —Third party DaVinciRe share repurchase 43,549 (40,000) —
Net cash (used in) provided by financing activities (548,458) (507,849) 184,391Net (decrease) increase in cash and cash equivalents (55,534) 115,827 40,398Cash and cash equivalents, beginning of year 330,226 214,399 174,001Cash and cash equivalents, end of year $ 274,692 $ 330,226 $ 214,399
See accompanying notes to the consolidated financial statements
F-8

NOTES TO THE CONSOLIDATED FINANCIAL STATEMENTS
December 31, 2008 (amounts in tables expressed in thousands of United States dollars, except per shareamounts)
NOTE 1. ORGANIZATION
RenaissanceRe Holdings Ltd. (“RenaissanceRe”, or the “Company”), was formed under the laws ofBermuda on June 7, 1993. Through its subsidiaries, the Company provides reinsurance and insurance to abroad range of customers.
• Renaissance Reinsurance Ltd. (“Renaissance Reinsurance”), the Company’s principalreinsurance subsidiary, provides property catastrophe and specialty reinsurance coverages toinsurers and reinsurers on a worldwide basis.
• The Company also manages property catastrophe and specialty reinsurance business written onbehalf of joint ventures, which principally include Top Layer Reinsurance Ltd. (“Top Layer Re”),recorded under the equity method of accounting, and DaVinci Reinsurance Ltd. (“DaVinci”).Because the Company owns a minority equity interest in, but controls a majority of the outstandingvoting power of DaVinci’s parent, DaVinciRe Holdings Ltd. (“DaVinciRe”), the results of DaVinciand DaVinciRe are consolidated in the Company’s financial statements. Minority interestrepresents the interests of external parties with respect to the net income and shareholders’ equityof DaVinciRe. Renaissance Underwriting Managers Ltd. (“RUM”), a wholly owned subsidiary, actsas exclusive underwriting manager for these joint ventures in return for fee-based income andprofit participation.
• The Company’s Individual Risk operations include direct insurance and quota share reinsurancewritten through the operating subsidiaries of Glencoe Group Holdings Ltd. (“Glencoe Group”).These operating subsidiaries principally include Stonington Insurance Company (“Stonington”),which writes business in the United States on an admitted basis, and Glencoe Insurance Ltd.(“Glencoe”) and Lantana Insurance Ltd. (“Lantana”), which write business in the United States onan excess and surplus lines basis, and also provide reinsurance coverage, principally throughquota share contracts, which are analyzed on an individual risk basis. The Individual Riskoperations also includes the results of Agro National Inc. (“Agro National”), a managing generalunderwriter of multi-peril crop insurance, which the Company acquired substantially all of theassets of on June 2, 2008.
NOTE 2. SIGNIFICANT ACCOUNTING POLICIES
BASIS OF PRESENTATION
The consolidated financial statements have been prepared in accordance with accounting principlesgenerally accepted in the United States (“GAAP”) and include the accounts of RenaissanceRe and itswholly owned and majority-owned subsidiaries and DaVinciRe, which are collectively referred to herein asthe “Company”. All significant intercompany transactions and balances have been eliminated onconsolidation. Certain prior year comparatives have been reclassified to conform to the current yearpresentation.
USE OF ESTIMATES IN FINANCIAL STATEMENTS
The preparation of financial statements in conformity with GAAP requires management to make estimatesand assumptions that affect the reported and disclosed amounts of assets and liabilities and disclosure ofcontingent assets and liabilities at the date of the financial statements and the reported amounts ofrevenues and expenses during the reporting period. Actual results could differ materially from thoseestimates. The major estimates reflected in the Company’s consolidated financial statements include, butare not limited to, the reserve for claims and claim expenses, losses recoverable, including allowances forlosses recoverable deemed uncollectible, estimates of written and earned premiums, fair value, includingthe fair value of investments, financial instruments and derivatives, impairment charges and the Company’snet deferred tax asset.
F-9

PREMIUMS AND RELATED EXPENSES
Premiums are recognized as income, net of any applicable reinsurance or retrocessional coveragepurchased, over the terms of the related contracts and policies. Premiums written are based on contractand policy terms and include estimates based on information received from both insureds and cedingcompanies. Subsequent differences arising on such estimates are recorded in the period in which they aredetermined. Reserve for unearned premiums represents the portion of premiums written that relate to theunexpired terms of contracts and policies in force. Such reserves are computed by pro-rata methods basedon statistical data or reports received from ceding companies. Reinstatement premiums are estimated afterthe occurrence of a significant loss and are recorded in accordance with the contract terms based uponpaid losses and case reserves. Reinstatement premiums are earned when written.
Acquisition costs, consisting principally of commissions, brokerage and premium tax expenses incurred atthe time a contract or policy is issued, are deferred and amortized over the period in which the relatedpremiums are earned. Deferred policy acquisition costs are limited to their estimated realizable value basedon the related unearned premiums. Anticipated claims and claim expenses, based on historical and currentexperience, and anticipated investment income related to those premiums are considered in determiningthe recoverability of deferred acquisition costs.
CLAIMS AND CLAIM EXPENSES
The reserve for claims and claim expenses includes estimates for unpaid claims and claim expenses onreported losses as well as an estimate of losses incurred but not reported. The reserve is based onindividual claims, case reserves and other reserve estimates reported by insureds and ceding companies aswell as management estimates of ultimate losses. Inherent in the estimates of ultimate losses are expectedtrends in claim severity and frequency and other factors which could vary significantly as claims are settled.Also, during the past few years, the Company has increased its specialty reinsurance and Individual Riskpremiums, but does not have the benefit of a significant amount of its own historical experience in theselines of business. Accordingly, the setting and reserving for incurred losses in these lines of business couldbe subject to greater variability.
Ultimate losses may vary materially from the amounts provided in the consolidated financial statements.These estimates are reviewed regularly and, as experience develops and new information becomes known,the reserves are adjusted as necessary. Such adjustments, if any, are reflected in the consolidatedstatements of operations in the period in which they become known and are accounted for as changes inestimates.
REINSURANCE
Amounts recoverable from reinsurers are estimated in a manner consistent with the claim liabilityassociated with the reinsured policies. For multi-year retrospectively rated contracts, the Company accruesamounts (either assets or liabilities) that are due to or from assuming companies based on estimatedcontract experience. If the Company determines that adjustments to earlier estimates are appropriate, suchadjustments are recorded in the period in which they are determined. Losses recoverable on dual triggerreinsurance contracts require the Company to estimate its ultimate losses applicable to these contracts aswell as estimate the ultimate amount of insured industry losses that will be reported by the applicablestatistical reporting agency, as per the contract terms. Amounts recoverable from reinsurers are recordednet of a valuation allowance for estimated uncollectible recoveries.
Assumed and ceded reinsurance contracts that lack a significant transfer of risk are treated as deposits.
INVESTMENTS, CASH AND CASH EQUIVALENTS
Investments in fixed maturities are classified as available for sale and are reported at fair value. Investmenttransactions are recorded on the trade date with balances pending settlement reflected in the balance sheetas a receivable for investments sold or a payable for investments purchased. Net investment incomeincludes interest and dividend income together with amortization of market premiums and discounts and isnet of investment management and custody fees. The amortization of premium and accretion of discount
F-10
for fixed maturity securities is computed using the effective yield method. For mortgage-backed securitiesand other holdings for which there is prepayment risk, prepayment assumptions are evaluated quarterlyand revised as necessary. Any adjustments required due to the change in effective yields and maturities arerecognized on a prospective basis through yield adjustments. Fair values of investments are based onquoted market prices, or when such prices are not available, by reference to broker or underwriter bidindications and/or internal pricing valuation techniques. The net unrealized appreciation or depreciation onthese investments is included in accumulated other comprehensive income.
Realized gains or losses on the sale of investments are determined on the basis of the first in first out costmethod and include adjustments to the cost basis of investments for declines in value that are consideredto be other than temporary. The Company routinely assesses whether declines in the fair value of itsavailable for sale investments represent impairments that are other than temporary. There are severalfactors that are considered in the assessment of a security, which include (i) the time period during whichthere has been a significant decline below cost, (ii) the extent of the decline below cost, (iii) the Company’sintent and ability to hold the security, (iv) the potential for the security to recover in value, (v) an analysis ofthe financial condition of the issuer and (vi) an analysis of the collateral structure and credit support of thesecurity, if applicable. Where the Company has determined that there is an other than temporary decline inthe fair value of the security, the cost of the security is written down to its fair value and the unrealized lossat the time of determination is charged to income.
Short term investments, which are managed as part of the Company’s investment portfolio and have amaturity of one year or less when purchased, are carried at fair value. Cash equivalents include moneymarket instruments with a maturity of ninety days or less when purchased.
Other investments are carried at fair value with interest and dividend income, income distributions andrealized and unrealized gains and losses included in net investment income. The fair value of otherinvestments is generally established on the basis of the net valuation criteria established by the managers ofthe investments. These net valuations are determined based upon the valuation criteria established by thegoverning documents of such investments. Many of the Company’s other investments are subject torestrictions on redemptions or sales which are determined by the governing documents and limit theCompany’s ability to liquidate these investments in the short term. In addition, due to a lag in reporting,some of the Company’s fund managers, fund administrators, or both, are unable to provide final fundvaluations as of the Company’s current reporting date. In these circumstances, the Company estimates thefair value of these funds by starting with the prior month’s or quarter’s fund valuation, adjusting thesevaluations for capital calls, redemptions or distributions and the impact of changes in foreign currencyexchange rates, and then estimating the return for the current period. In circumstances in which theCompany estimates the return for the current period, it uses all credible information available. Thisprincipally includes preliminary estimates reported by its fund managers, obtaining the valuation ofunderlying portfolio investments where such underlying investments are publicly traded and therefore havea readily observable price, using information that is available to the Company with respect to the underlyinginvestments, reviewing various indices for similar investments or asset classes, as well as estimating returnsbased on the results of similar types of investments for which the Company has reported results, or othervaluation methods, as necessary. Actual final fund valuations may differ, perhaps materially so, from theCompany’s estimates and these differences are recorded in the period they become known as a change inestimate. The Company’s estimate of the fair value of catastrophe bonds are based on quoted marketprices, or when such prices are not available, by reference to broker or underwriter bid indications.
Investments in which the Company has significant influence over the operating and financial policies of theinvestee are classified as investments in other ventures, under equity method, and are accounted for underthe equity method of accounting. Under this method, the Company records its proportionate share ofincome or loss from such investments in its results for the period. Any decline in value of investments inother ventures, under equity method considered by management to be other than temporary is charged toincome in the period in which it is determined.
F-11

DERIVATIVES
The Company enters into derivative instruments such as futures, options, swaps, forward contracts andother derivative contracts in order to manage its foreign currency exposure, obtain exposure to a particularfinancial market, for yield enhancement, or for trading and speculation. The Company accounts for itsderivatives in accordance with FASB Statement No. 133, Accounting for Derivative Instruments andHedging Activities (“FAS 133”), which requires all derivatives to be recorded at fair value on the Company’sbalance sheet as either assets or liabilities, depending on their rights or obligations, with changes in fairvalue reflected in current earnings. The Company does not currently apply hedge accounting. The fair valueof the Company’s derivatives are estimated by reference to quoted prices or broker quotes, where available,or in the absence of quoted prices or broker quotes, the use of industry or internal valuation models.
FAIR VALUE
The Company accounts for certain of its assets and liabilities at fair value in accordance with FASBStatement No. 157, Fair Value Measurements (“FAS 157”). FAS 157 clarifies the definition of fair value,establishes a framework for measuring fair value and expands disclosures about fair valuemeasurements. FAS 157 clarifies that fair value is a market-based measurement, not an entity-specificmeasurement, and sets out a fair value hierarchy with the highest priority being quoted prices in activemarkets and the lowest priority to unobservable data. Fair value is the price that would be received upon thesale of an asset or paid to transfer a liability in an orderly transaction between open market participants atthe measurement date. The Company recognizes the change in unrealized gains and losses arising fromchanges in fair value in its statements of operation, with the exception of changes in unrealized gains andlosses on its fixed maturity investments available for sale, which are recognized as a component ofaccumulated other comprehensive income in shareholders’ equity. Further, FAS 157 requires tabulardisclosures of the fair value measurements by level within the fair value hierarchy.
BUSINESS COMBINATIONS, GOODWILL AND OTHER INTANGIBLE ASSETS
The Company accounts for business combinations in accordance with FASB Statement No. 141, BusinessCombinations (“FAS 141”), and goodwill and other intangible assets that arise from business combinationsin accordance with FASB Statement No. 142, Goodwill and Other Intangible Assets (“FAS 142”). Apurchase price that is in excess of the fair value of the net assets acquired arising from a businesscombination is recorded as goodwill, and is not amortized. Other intangible assets with a finite life areamortized over the estimated useful life of the asset. Other intangible assets with an indefinite useful life arenot amortized.
Goodwill and other intangible assets are tested for impairment on an annual basis or more frequently ifevents or changes in circumstances indicate that the carrying amount may not be recoverable. Forpurposes of annual impairment evaluation, goodwill is assigned to the applicable reporting unit of theacquired entities giving rise to the goodwill. Goodwill and other intangible assets recorded in connectionwith investments accounted for under the equity method, are recorded as “Investments in other ventures,under equity method” on the Company’s consolidated balance sheets.
The Company has established September 30 as the date for performing its annual impairment tests. Ifgoodwill or other intangible assets are impaired, they are written down to their estimated fair values with acorresponding expense reflected in the Company’s consolidated statements of operations.
EARNINGS PER SHARE
Basic earnings per share are based on weighted average common shares and exclude any dilutive effects ofoptions and restricted stock. Diluted earnings per share assume the exercise of all dilutive stock options andrestricted stock grants.
FOREIGN EXCHANGE
The Company’s functional currency is the United States dollar. Revenues and expenses denominated inforeign currencies are translated at the prevailing exchange rate at the transaction date. Monetary assets
F-12
and liabilities denominated in foreign currencies are translated at exchange rates in effect at the balancesheet date, which may result in the recognition of exchange gains or losses which are included in thedetermination of net income.
TAXATION
Income taxes have been provided in accordance with the provisions of FASB Statement No. 109,Accounting for Income Taxes, on those operations which are subject to income taxes. Deferred tax assetsand liabilities result from temporary differences between the amounts recorded in the consolidated financialstatements and the tax basis of the Company’s assets and liabilities. Such temporary differences areprimarily due to the tax basis discount on unpaid losses and loss expenses, unearned premium reserves,net operating loss carryforwards, intangible assets, accrued expenses, deferred policy acquisition costs andcertain investments. The effect on deferred tax assets and liabilities of a change in tax rates is recognized inincome in the period that includes the enactment date. A valuation allowance against deferred tax assets isrecorded if it is more likely than not that all, or some portion, of the benefits related to deferred tax assetswill not be realized.
Uncertain tax positions are accounted for in accordance with FASB Interpretation No. 48, Accounting forUncertainty in Income Taxes (“FIN 48”). Uncertain tax positions must meet a more-likely-than-notrecognition threshold to be recognized.
VARIABLE INTEREST ENTITIES
The Company accounts for variable interest entities (“VIE”) in accordance with FASB Interpretation No. 46,Consolidation of Variable Interest Entities – an Interpretation of ARB No. 51, as revised (“FIN 46(R)”),which requires the consolidation of all VIE’s by the investor that will absorb a majority of the VIE’s expectedlosses or residual returns. Refer to “Note 11. Variable Interest Entities”, for more information.
STOCK INCENTIVE COMPENSATION PLANS
Effective January 1, 2006, the Company adopted FASB Statement No. 123 (revised 2004), Share-BasedPayment (“FAS 123(R)”), using the modified prospective transition method. Under the modifiedprospective transition method, compensation cost recognized for the twelve months ending December 31,2007 and 2006 includes: (a) compensation cost for all share-based payments granted prior to, but not yetvested, as of January 1, 2006 based on the grant date fair value estimated in accordance with the originalprovisions of FASB Statement No. 123, Accounting for Stock-Based Compensation (“FAS 123”) and(b) compensation cost for all share-based payments granted subsequent to January 1, 2006, based on thegrant date fair value estimated in accordance with the provisions of FAS 123(R). The adoption of FAS123(R) did not have a material impact on the Company.
Prior to adopting FAS 123(R), the Company accounted for stock-based compensation under the fair valuerecognition provisions of FAS 123 with effect from January 1, 2003 for all stock-based employeecompensation granted, modified or settled after January 1, 2003 under the prospective method describedin FASB Statement No. 148, Accounting for Stock-Based Compensation – Transition and Disclosure (“FAS148”). Prior to January 1, 2003, the Company accounted for stock-based employee compensation underthe recognition and measurement provisions of APB Opinion Number 25, Accounting for Stock Issued toEmployees, and related interpretations.
RECENTLY ISSUED ACCOUNTING PRONOUNCEMENTS
Fair Value Measurements
In September 2006, the FASB issued FASB Statement No. 157, Fair Value Measurements (“FAS157”). FAS 157 clarifies the definition of fair value, establishes a framework for measuring fair value andexpands disclosures about fair value measurements. FAS 157 clarifies that fair value is a market-basedmeasurement, not an entity-specific measurement, and sets out a fair value hierarchy with the highestpriority being quoted prices in active markets and the lowest priority to unobservable data. Further, FAS 157
F-13

requires tabular disclosures of the fair value measurements by level within the fair value hierarchy. FAS 157became effective for the Company on January 1, 2008 and the adoption of FAS 157 did not have a materialimpact on the Company’s statements of operations and financial condition when adopted.
In order to address the application of FAS 157 in a market that is not active, the FASB issued FASB StaffPosition 157-3 (“FSP 157-3”) in October 2008. FSP 157-3 clarifies the application of FAS 157 in a marketthat is not active and provides examples to illustrate key considerations in determining the fair value of afinancial asset when the market for that financial asset is not active. FSP 157-3 applies to financial assetswithin the scope of accounting pronouncements that require or permit fair value measurements inaccordance with FAS 157 and became effective upon issuance, including prior periods for which financialstatements have not been issued. The application of FSP 157-3 did not have a material impact on theCompany’s statements of operations and financial condition.
The Fair Value Option for Financial Assets and Financial Liabilities
In February 2007, the FASB issued FASB Statement No. 159, The Fair Value Option for Financial Assetsand Financial Liabilities (“FAS 159”). FAS 159 permits an entity to choose, at specified election dates, tomeasure eligible financial instruments and certain other items at fair value that are not currently required tobe measured at fair value. An entity shall report unrealized gains and losses on items for which the fairvalue option has been elected in earnings at each subsequent reporting date. Upfront costs and feesrelated to items for which the fair value option is elected shall be recognized in earnings as incurred and notdeferred. FAS 159 also establishes presentation and disclosure requirements designed to facilitatecomparisons between entities that choose different measurement attributes for similar types of assets andliabilities. FAS 159 became effective for the Company on January 1, 2008 and the Company elected the fairvalue option for certain financial assets and financial liabilities. An entity shall report the effect of the firstremeasurement to fair value as a cumulative-effect adjustment to the opening balance of retainedearnings. The adoption of FAS 159 did not have a material impact on the Company’s statements ofoperations and financial condition when adopted.
Business Combinations and Accounting and Reporting of Noncontrolling Interest in Consolidated FinancialStatements
On December 4, 2007, the FASB issued Statement No. 141(R), Business Combinations (“FAS 141(R)”)and Statement No. 160, Accounting and Reporting of Noncontrolling Interest in Consolidated FinancialStatements, an amendment of ARB No. 51 (“FAS 160”). These new standards will significantly change theaccounting for and reporting of business combination transactions and noncontrolling (minority) interests inconsolidated financial statements. FAS 141(R) expands the scope of acquisition accounting to alltransactions and circumstances under which control of a business is obtained. Under FAS 160,noncontrolling interests are classified as a component of consolidated shareholders’ equity and ‘minorityinterest’ accounting is eliminated such that earnings attributable to noncontrolling interests are reported aspart of consolidated earnings and not as a separate component of income or expense. FAS 141(R) and FAS160 are required to be adopted simultaneously and are effective for the first annual reporting periodbeginning on or after December 15, 2008. Earlier adoption is prohibited. The Company is currentlyevaluating the potential impacts of the adoption of FAS 141(R) and FAS 160 on the Company’s statementsof operations and financial condition when adopted.
Disclosures about Derivative Instruments and Hedging Activities
In March 2008, the FASB issued Statement No. 161, Disclosures about Derivative Instruments andHedging Activities – an amendment of FASB Statement No. 133 (“FAS 161”). FAS 161 requires entities toprovide enhanced disclosures about (a) how and why an entity uses derivative instruments, (b) howderivative instruments and related hedged items are accounted for under FASB Statement No. 133,Accounting for Derivative Instruments and Hedging Activities and its related interpretations and (c) howderivative instruments and related hedged items affect an entity’s financial position, results of operationsand cash flows. FAS 161 requires qualitative disclosures about objectives and strategies for usingderivatives, quantitative disclosures about fair value amounts of gains and losses on derivative instrumentsand credit-risk related contingent features in derivative instruments. FAS 161 is to be applied prospectivelyand is effective for financial statements issued for fiscal years and interim periods beginning after
F-14
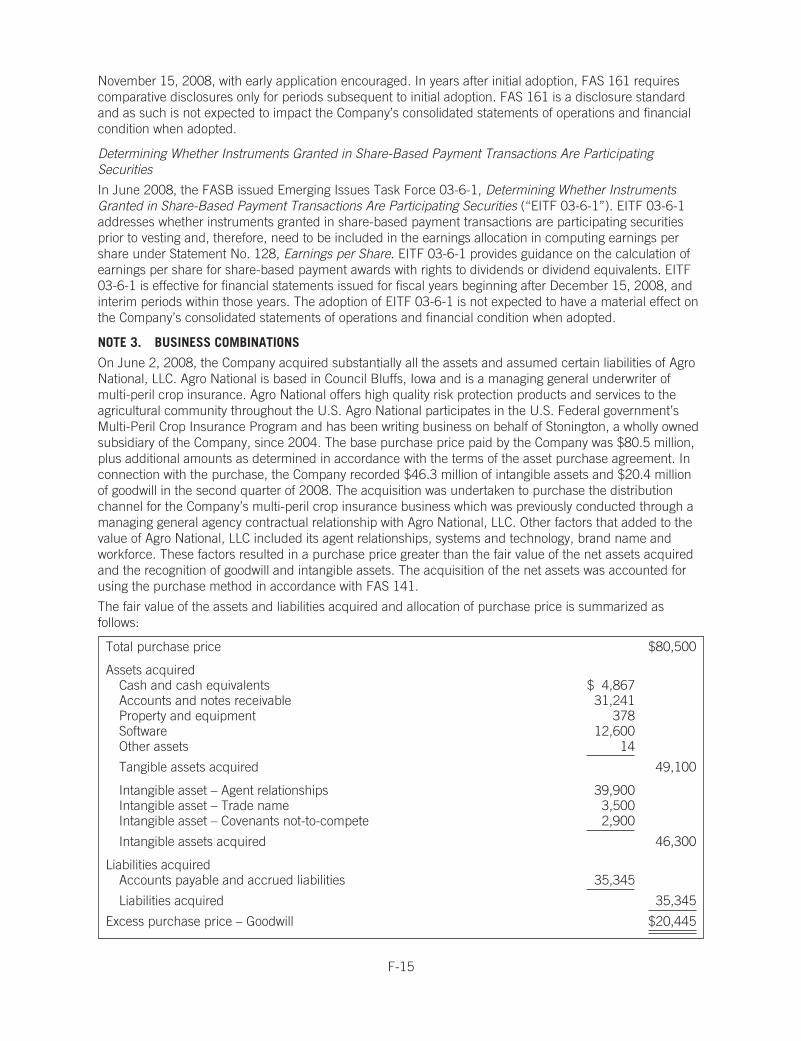
November 15, 2008, with early application encouraged. In years after initial adoption, FAS 161 requirescomparative disclosures only for periods subsequent to initial adoption. FAS 161 is a disclosure standardand as such is not expected to impact the Company’s consolidated statements of operations and financialcondition when adopted.
Determining Whether Instruments Granted in Share-Based Payment Transactions Are ParticipatingSecurities
In June 2008, the FASB issued Emerging Issues Task Force 03-6-1, Determining Whether InstrumentsGranted in Share-Based Payment Transactions Are Participating Securities (“EITF 03-6-1”). EITF 03-6-1addresses whether instruments granted in share-based payment transactions are participating securitiesprior to vesting and, therefore, need to be included in the earnings allocation in computing earnings pershare under Statement No. 128, Earnings per Share. EITF 03-6-1 provides guidance on the calculation ofearnings per share for share-based payment awards with rights to dividends or dividend equivalents. EITF03-6-1 is effective for financial statements issued for fiscal years beginning after December 15, 2008, andinterim periods within those years. The adoption of EITF 03-6-1 is not expected to have a material effect onthe Company’s consolidated statements of operations and financial condition when adopted.
NOTE 3. BUSINESS COMBINATIONS
On June 2, 2008, the Company acquired substantially all the assets and assumed certain liabilities of AgroNational, LLC. Agro National is based in Council Bluffs, Iowa and is a managing general underwriter ofmulti-peril crop insurance. Agro National offers high quality risk protection products and services to theagricultural community throughout the U.S. Agro National participates in the U.S. Federal government’sMulti-Peril Crop Insurance Program and has been writing business on behalf of Stonington, a wholly ownedsubsidiary of the Company, since 2004. The base purchase price paid by the Company was $80.5 million,plus additional amounts as determined in accordance with the terms of the asset purchase agreement. Inconnection with the purchase, the Company recorded $46.3 million of intangible assets and $20.4 millionof goodwill in the second quarter of 2008. The acquisition was undertaken to purchase the distributionchannel for the Company’s multi-peril crop insurance business which was previously conducted through amanaging general agency contractual relationship with Agro National, LLC. Other factors that added to thevalue of Agro National, LLC included its agent relationships, systems and technology, brand name andworkforce. These factors resulted in a purchase price greater than the fair value of the net assets acquiredand the recognition of goodwill and intangible assets. The acquisition of the net assets was accounted forusing the purchase method in accordance with FAS 141.
The fair value of the assets and liabilities acquired and allocation of purchase price is summarized asfollows:
Total purchase price $80,500
Assets acquiredCash and cash equivalents $ 4,867Accounts and notes receivable 31,241Property and equipment 378Software 12,600Other assets 14
Tangible assets acquired 49,100
Intangible asset – Agent relationships 39,900Intangible asset – Trade name 3,500Intangible asset – Covenants not-to-compete 2,900
Intangible assets acquired 46,300
Liabilities acquiredAccounts payable and accrued liabilities 35,345
Liabilities acquired 35,345
Excess purchase price – Goodwill $20,445
F-15

Agent relationships represent the value of the existing non-contractual relationships Agro National, LLC hadwith its insurance agents. Agent relationships have a finite estimated useful life of approximately 20 years andare being amortized in proportion to their expected cash flows. The trade name represents the value of theAgro National, LLC brand and is estimated to have a useful life of 25 years. The trade name is being amortizedstraight line over 25 years. Covenants not-to-compete represent non-compete agreements with key employeesof Agro National, LLC. These agreements are being amortized straight line over their contractual life which hasa weighted average life of approximately four years. Goodwill is estimated to have an indefinite life. Thegoodwill and intangible assets are recorded entirely in the Company’s Individual Risk segment. During 2008,the Company recorded $4.2 million of intangible asset amortization related to these intangibles.
The estimated remaining amortization expense for the intangible assets is as follows:
2009 $ 4,4762010 4,3492011 4,2052012 3,6232013 and thereafter 25,496
Total $42,149
Operating results of Agro National have been included in the consolidated financial statements from June 2,2008, the date of acquisition. FAS 141 requires the following selected unaudited pro-forma information beprovided to present a summary of the combined results of the Company and Agro National assuming thetransaction had been effective January 1, 2007 and 2008, respectively. The unaudited pro-forma data is forinformational purposes only and does not necessarily represent results that would have occurred if thetransaction had taken place on the basis assumed above.
Year ended December 31, 2008 2007(unaudited) (unaudited)
Gross premiums written $1,736,028 $1,809,637Net premiums earned $1,386,824 $1,424,369Total revenue $1,231,196 $1,665,554Total expenses $1,137,584 $ 899,640Net (loss) income (attributable) available to common shareholders $ (4,389) $ 577,089Net (loss) income (attributable) available to common shareholders per
common share – basic $ (0.07) $ 8.18Net (loss) income (attributable) available to common shareholders per
common share – diluted (1) $ (0.07) $ 8.03
(1) In accordance with FAS 128, earnings per share calculations use average common shares outstanding– basic, when in a net loss position.
The pro-forma net (loss) income (attributable) available to common shareholders per common share –diluted for the year ended December 31, 2008 and 2007 of $(0.07) and $8.03, respectively, compares toactual results of $(0.21) and $7.93 for the year ended December 31, 2008 and 2007, respectively.
Effective April 1, 2008, the Company purchased substantially all the assets of Claims ManagementServices, Inc. (“CMS”). CMS was subsequently renamed Glencoe Group Claims Management Inc.(“Glencoe Claims”). Glencoe Claims is based in Roswell, Georgia and is a privately held companyspecializing in claims administration, adjusting and consulting services for insurance companies, managinggeneral agents, self-insured clients, fronted programs and clients with substantial retentions or deductibles.Glencoe Claims has a proprietary network of licensed adjusters and offers services on a national basis. TheCompany uses Glencoe Claims for claims services solely for its own business and Glencoe Claims is notcurrently providing claims services to third parties. The base purchase price paid by the Company was $3.8million, plus additional amounts as determined in accordance with the terms of the asset purchaseagreement. In connection with the purchase, the Company acquired net assets with a fair value of $0.5million and recorded $3.3 million of goodwill. Goodwill is estimated to have an indefinite life and is recordedentirely in the Company’s Individual Risk segment.
F-16

NOTE 4. GOODWILL AND OTHER INTANGIBLE ASSETS
The following table shows an analysis of goodwill and other intangibles assets for the years endedDecember 31, 2008 and 2007:
Goodwill and other intangibles
GoodwillOther
intangible assets Total
Balance as of December 31, 2006 $ 1,452 $ 2,603 $ 4,055Acquired during the year 846 3,129 3,975Amortization — (1,793) (1,793)Impairment losses — — —
Balance as of December 31, 2007 2,298 3,939 6,237Acquired during the year $23,710 $50,910 $74,620Amortization — (6,676) (6,676)Impairment losses — — —
Balance as of December 31, 2008 $26,008 $48,173 $74,181
The majority of the increase in goodwill and other intangible assets in 2008, relates to the asset acquisitionsof Agro National, LLC and CMS as described in “Note 3. Business Combinations”. In addition, the Companyacquired other intangible assets of $4.6 million relating to a small acquisition and the purchase of patents.
The following table shows an analysis of goodwill and other intangibles assets included in investments inother ventures, under equity method for the years ended December 31, 2008 and 2007:
Goodwill and other intangible assets included ininvestments in other ventures, under equity method
Goodwill
Otherintangible
assets Total
Balance as of December 31, 2006 $ — $ — $ —Acquired during the year — — —Amortization — — —Impairment losses — — —
Balance as of December 31, 2007 — — —Acquired during the year $8,477 $44,323 $52,800Amortization — (2,980) (2,980)Impairment losses — — —
Balance as of December 31, 2008 $8,477 $41,343 $49,820
The useful life of intangible assets with finite lives ranges from 1 to 25 years, with a weighted-averageamortization period of 16 years. Expected amortization of the intangible assets, including intangible assetsrecorded in investments in other ventures, under equity method is shown below:
2009 $12,4472010 10,4252011 9,7722012 8,6812013 and thereafter 48,191
Total $89,516
F-17
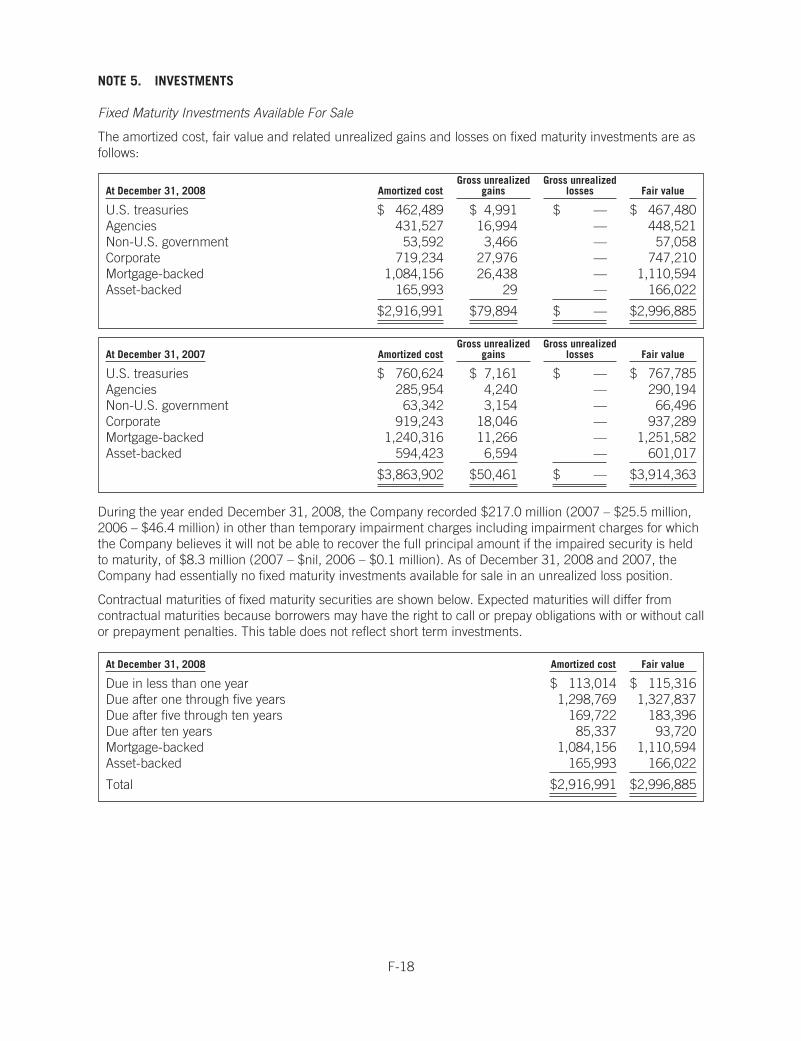
NOTE 5. INVESTMENTS
Fixed Maturity Investments Available For Sale
The amortized cost, fair value and related unrealized gains and losses on fixed maturity investments are asfollows:
At December 31, 2008 Amortized costGross unrealized
gainsGross unrealized
losses Fair value
U.S. treasuries $ 462,489 $ 4,991 $ — $ 467,480Agencies 431,527 16,994 — 448,521Non-U.S. government 53,592 3,466 — 57,058Corporate 719,234 27,976 — 747,210Mortgage-backed 1,084,156 26,438 — 1,110,594Asset-backed 165,993 29 — 166,022
$2,916,991 $79,894 $ — $2,996,885
At December 31, 2007 Amortized costGross unrealized
gainsGross unrealized
losses Fair value
U.S. treasuries $ 760,624 $ 7,161 $ — $ 767,785Agencies 285,954 4,240 — 290,194Non-U.S. government 63,342 3,154 — 66,496Corporate 919,243 18,046 — 937,289Mortgage-backed 1,240,316 11,266 — 1,251,582Asset-backed 594,423 6,594 — 601,017
$3,863,902 $50,461 $ — $3,914,363
During the year ended December 31, 2008, the Company recorded $217.0 million (2007 – $25.5 million,2006 – $46.4 million) in other than temporary impairment charges including impairment charges for whichthe Company believes it will not be able to recover the full principal amount if the impaired security is heldto maturity, of $8.3 million (2007 – $nil, 2006 – $0.1 million). As of December 31, 2008 and 2007, theCompany had essentially no fixed maturity investments available for sale in an unrealized loss position.
Contractual maturities of fixed maturity securities are shown below. Expected maturities will differ fromcontractual maturities because borrowers may have the right to call or prepay obligations with or without callor prepayment penalties. This table does not reflect short term investments.
At December 31, 2008 Amortized cost Fair value
Due in less than one year $ 113,014 $ 115,316Due after one through five years 1,298,769 1,327,837Due after five through ten years 169,722 183,396Due after ten years 85,337 93,720Mortgage-backed 1,084,156 1,110,594Asset-backed 165,993 166,022
Total $2,916,991 $2,996,885
F-18

Net Investment Income
The components of net investment income are as follows:
Year ended December 31, 2008 2007 2006
Fixed maturity investments available for sale $ 201,220 $176,785 $158,516Short term investments 48,437 118,483 92,818Other investments
Hedge funds and private equity investments (101,779) 87,985 50,333Other (117,867) 17,469 15,335
Cash and cash equivalents 7,452 11,026 8,552Dividends on equity investment in reinsurance company — — 317
37,463 411,748 325,871Investment expenses (13,232) (9,285) (7,765)
Net investment income $ 24,231 $402,463 $318,106
The analysis of realized (losses) gains and the change in unrealized gains on investments is as follows:
Year ended December 31, 2008 2007 2006
Gross realized gains $ 99,634 $ 35,923 $ 21,034Gross realized losses (88,934) (9,117) (9,097)Other than temporary impairments (217,014) (25,513) (46,401)
Net realized (losses) gains on investments (206,314) 1,293 (34,464)Change in unrealized gains 29,433 19,502 20,457
Total realized and change in unrealized (losses) gains oninvestments $(176,881) $ 20,795 $(14,007)
At December 31, 2008, $147.4 million of cash and investments at fair value were on deposit with, or intrust accounts for the benefit of various counterparties, including $53.2 million associated with a $50.0million reverse repurchase agreement.
Under the terms of certain reinsurance contracts, certain of the Company’s subsidiaries and joint venturesmay be required to provide letters of credit to reinsureds in respect of reported claims and/or unearnedpremiums. To support the Company’s letters of credit, participating operating subsidiaries and jointventures have pledged shares of Renaissance Investment Holdings Ltd. (“RIHL”) and other securitiesowned by them as collateral. At December 31, 2008, the Company had pledged RIHL shares and othersecurities in the amount of $1,148.1 million to support its letters of credit.
Other Investments
The table below shows the Company’s portfolio of other investments:
At December 31, 2008 2007
Private equity partnerships $258,901 $301,446Senior secured bank loan funds 215,870 158,203Hedge funds 105,838 126,417Catastrophe bonds 93,085 95,535Non-U.S. fixed income funds 81,719 126,252Miscellaneous other investments 18,062 11
Total other investments $773,475 $807,864
Interest income, income distributions and realized and unrealized gains and losses on other investmentsare included in net investment loss and totaled $219.6 million (2007 – income of $105.5 million, 2006 –income of $65.7 million) of which $259.4 million was related to net unrealized losses (2007 – netunrealized gains of $47.3 million, 2006 – net unrealized gains of $30.1 million).
F-19

As of December 31, 2008, the Company has committed capital to private equity partnerships of $586.7million, of which $348.7 million has been contributed.
Investments in Other Ventures, under Equity Method
The table below shows the Company’s portfolio of investments in other ventures, under equity method:
Year ended December 31,
2008 2007
Investment Ownership %CarryingValue Investment Ownership %
CarryingValue
ChannelRe $119,697 32.7 $ — $119,697 32.7 $ —Tower Hill Companies 50,000 25.0 47,699 — — —Top Layer Re 13,125 50.0 25,367 13,125 50.0 28,982Tower Hill 10,000 28.6 15,227 10,000 28.6 14,382Aladdin — — — 25,500 14.6 25,500Starbound II — — — 19,237 17.1 21,708Other 12,040 n/a 11,586 — — —
Total investments in other ventures,under equity method $204,862 $99,879 $187,559 $90,572
In addition to the Company’s $10.0 million investment in Tower Hill Holdings Inc. (“Tower Hill”) during 2005,representing a 28.6% equity interest, on July 1, 2008, the Company invested $50.0 million, representing a25.0% equity interest, in Tower Hill Insurance Group, LLC (“THIG”), Tower Hill Claims Services, LLC (“THCS”)and Tower Hill Claims Management, LLC (“THCM”) (collectively the “Tower Hill Companies”). THIG is amanaging general agency specializing in insurance coverage for site built and manufactured homes. TheCompany’s investment was greater than the fair value of the net assets acquired and therefore resulted in therecognition of goodwill and intangible assets. In connection with the investment, the Company recorded $40.0million of intangible assets and $7.8 million of goodwill on the July 1, 2008 effective date. The investment inthe Tower Hill Companies was accounted for using the equity method in accordance with AccountingPrinciples Board Opinion 18, The Equity Method of Accounting for Investments in Common Stock (“APB 18”)and as such, the goodwill and intangible assets are recorded under “Investments in other ventures, underequity method” in the Company’s consolidated balance sheet at December 31, 2008.
Investments in other ventures, under equity method includes the Company’s investment in ChannelRe of$nil (2007 – $nil). During the fourth quarter of 2007, ChannelRe estimated unrealized mark-to-marketlosses in its portfolio of financial guaranty contracts accounted for as derivatives under GAAP, were inexcess of its shareholders’ equity. As a result of these mark-to-market losses, the Company reduced itscarried value of ChannelRe to $nil at December 31, 2007 and until such time as ChannelRe’s shareholders’equity is positive, the Company will not record any equity in earnings in its investment in ChannelRe. As aresult, the carried value of ChannelRe at December 31, 2008 continues to be $nil. It is possible that withthe adoption of FAS 157, that in future periods the nonperformance risk or own credit risk portion ofChannelRe’s mark-to-market on its financial guaranty contracts accounted for as derivatives under GAAPmay increase, or that the underlying mark-to-market on ChannelRe’s financial guaranty contractsaccounted for as derivatives under GAAP may decrease, or both, which could result in ChannelRe returningto a positive equity position, at which time the Company would then record its share of ChannelRe’s netincome, subject to impairment, or its share of ChannelRe’s net loss.
During the fourth quarter of 2007, the Company invested $25.5 million in the preferred equity ofAladdin, representing a 14.6% ownership interest. Aladdin was established to provide creditprotection on fixed income securities in return for a premium. Due to adverse market conditions,Aladdin elected to not write any business and subsequently announced during the fourth quarterof 2008, that it would wind-up its operations and return the residual capital to shareholders. TheCompany expects to receive the majority of its original investment, less administrative expensesincurred. At December 31, 2008, the Company had recorded a receivable of $24.4 million inother assets for the expected liquidation value of Aladdin. During January 2009, the Companyreceived an initial payout of $24.2 million with the final distribution expected to be received duringthe second quarter of 2009.
F-20

Investments in other ventures, under equity method also includes an original investment of $13.1 million inTop Layer Re, representing a 50.0% ownership.
In May 2007, the Company invested $10.0 million in Starbound II, which represents a 9.8% equityownership interest in Starbound II and in December 2007 the Company invested an additional $9.2 millionin Starbound II which increased the Company’s investment and ownership percentage to $19.2 million and17.1%, respectively. Effective July 31, 2008, Starbound II repurchased the outstanding shares of itsinvestors at book value; as a result, the Company now owns 100% of Starbound II and consequently,Starbound II became a consolidated entity effective August 1, 2008.
The table below shows the Company’s equity in earnings (losses) of other ventures, under equity method:
Year ended December 31, 2008 2007 2006
Top Layer Re $11,377 $ 14,949 $12,703Starbound II 3,202 2,472 —Tower Hill and Tower Hill Companies 545 3,432 602Channel Re — (151,751) 19,097Other (1,521) 2,289 2,126
Total equity in earnings (losses) of other ventures $13,603 $(128,609) $34,528
The equity in earnings (losses) of ChannelRe, Tower Hill and Tower Hill Companies are reported onequarter in arrears, except that the Company’s 2007 results reflect the estimated fourth quarter charge fromChannelRe as it relates to unrealized mark-to-market losses in ChannelRe’s portfolio of financial guarantycontracts accounted for as derivatives under GAAP.
Undistributed losses in the Company’s investments in other ventures were $102.1 million at December 31,2008 (2007 – $97.0 million).
Refer to “Note 25. Summarized Financial Information of ChannelRe Holdings Ltd.”, for more information onChannelRe.
NOTE 6. FAIR VALUE MEASUREMENTS
The use of fair value to measure certain assets and liabilities with resulting unrealized gains orlosses, is pervasive within the Company’s financial statements, and is a critical accounting policyand estimate for the Company. Fair value is the price that would be received upon the sale of anasset or paid to transfer a liability in an orderly transaction between open market participants at themeasurement date. The Company recognizes the change in unrealized gains and losses arisingfrom changes in fair value in its statements of operation, with the exception of changes in unrealizedgains and losses on its fixed maturity investments available for sale, which are recognized as acomponent of accumulated other comprehensive income in shareholders’ equity.
FAS 157 establishes a fair value hierarchy that prioritizes the inputs to the respective valuation techniquesused to measure fair value. The hierarchy gives the highest priority to unadjusted quoted prices in activemarkets for identical assets or liabilities (Level 1) and the lowest priority to unobservable inputs (Level 3).The three levels of the fair value hierarchy under FAS 157 are described below:
• Fair values determined by Level 1 inputs utilize unadjusted quoted prices obtained from activemarkets for identical assets or liabilities that the Company has access to. The fair value isdetermined by multiplying the quoted price by the quantity held by the Company;
• Fair values determined by Level 2 inputs utilize inputs other than quoted prices included in Level1 that are observable for the asset or liability, either directly or indirectly. Level 2 inputs includequoted prices for similar assets and liabilities in active markets, and inputs other than quotedprices that are observable for the asset or liability, such as interest rates and yield curves that areobservable at commonly quoted intervals, broker quotes and certain pricing indices; and
• Level 3 inputs are based on unobservable inputs for the asset or liability, and include situationswhere there is little, if any, market activity for the asset or liability. In these cases, significant
F-21

management assumptions can be used to establish management’s best estimate of theassumptions used by other market participants in determining the fair value of the asset orliability.
In certain cases, the inputs used to measure fair value may fall into different levels of the fair valuehierarchy. In such cases, the level in the fair value hierarchy within which the fair value measurement in itsentirety falls has been determined based on the lowest level input that is significant to the fair valuemeasurement of the asset or liability. The Company’s assessment of the significance of a particular input tothe fair value measurement in its entirety requires judgment, and the Company considers factors specific tothe asset or liability.
There have been no material changes in the Company’s valuation techniques since the adoption of FAS157 effective January 1, 2008.
Below is a summary of the assets and liabilities that are measured at fair value on a recurring basis:
At December 31, 2008 Total
Quoted Prices inActive Markets
for IdenticalAssets (Level 1)
Significant OtherObservable
Inputs (Level 2)
SignificantUnobservable
Inputs (Level 3)
AssetsFixed maturity investments available for sale $2,996,885 $467,480 $2,529,405 $ —Short term investments 2,172,343 — 2,172,343 —Other investments 773,475 — 391,395 382,080Other secured assets 76,424 — 76,424 —Other assets and liabilities (1) (8,714) 31,167 2,631 (42,512)
$6,010,413 $498,647 $5,172,198 $339,568
(1) Other assets of $34.3 million, $29.9 million and $10.3 million are included in Level 1, Level 2 and Level3, respectively. Other liabilities of $3.1 million, $27.3 million and $52.8 million are included in Level 1,Level 2 and Level 3, respectively.
Fixed maturity investments available for sale included in Level 1 consist of the Company’s investments inU.S. treasuries. Included in Level 2 are U.S. agencies, non-U.S. government, corporate, mortgage-backedand asset-backed fixed maturity investments available for sale.
The Company’s fixed maturity investments available for sale portfolio is priced using broker quotations andpricing services, such as index providers and pricing vendors. The pricing vendors provide pricing for a highvolume of liquid securities that are actively traded. For securities that do not trade on an exchange, thepricing services utilize market data and other observable inputs in matrix pricing models to determineprices. Prices are generally verified using third party data. Prices obtained from broker quotations areconsidered non-binding, however they are based on observable inputs and by observing secondary tradingof similar securities obtained from active, non-distressed markets. The Company considers these Level 2inputs as they are corroborated with other externally obtained information.
Short term investments are considered Level 2 and fair values are generally determined using amortizedcost which approximates fair value and, in certain cases, in a manner similar to the Company’s fixedmaturity investments available for sale noted above.
Other investments included in Level 2 are the Company’s investments in hedge funds, catastrophe bonds, anon-U.S. dollar fixed income fund and a highly liquid bank loan fund. Included in Level 3 are theCompany’s private equity partnership investments and a senior secured bank loan fund. The majority of theCompany’s other investments included in Level 2 use net asset valuations provided by the investmentmanager, third party administrator, recent financial information or available market data to estimate fairvalue. In certain cases, management’s judgment may also be required to estimate fair value. The fair valueof private equity partnership investments is based on net asset values obtained from the investment
F-22
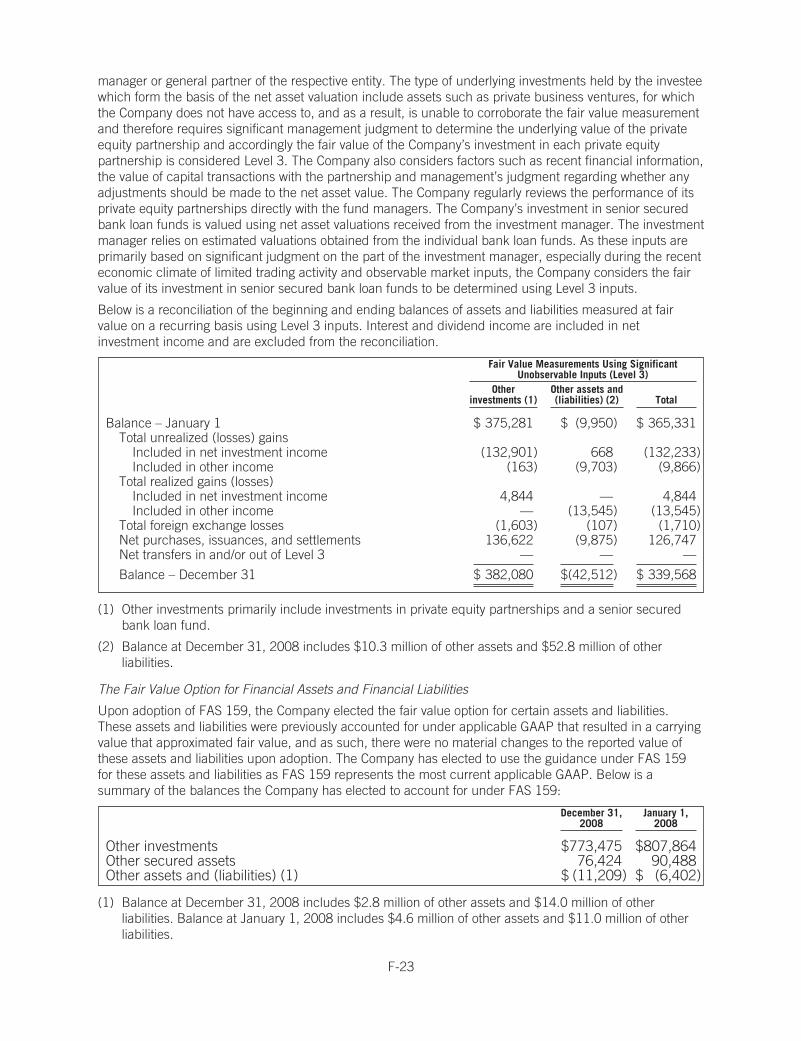
manager or general partner of the respective entity. The type of underlying investments held by the investeewhich form the basis of the net asset valuation include assets such as private business ventures, for whichthe Company does not have access to, and as a result, is unable to corroborate the fair value measurementand therefore requires significant management judgment to determine the underlying value of the privateequity partnership and accordingly the fair value of the Company’s investment in each private equitypartnership is considered Level 3. The Company also considers factors such as recent financial information,the value of capital transactions with the partnership and management’s judgment regarding whether anyadjustments should be made to the net asset value. The Company regularly reviews the performance of itsprivate equity partnerships directly with the fund managers. The Company’s investment in senior securedbank loan funds is valued using net asset valuations received from the investment manager. The investmentmanager relies on estimated valuations obtained from the individual bank loan funds. As these inputs areprimarily based on significant judgment on the part of the investment manager, especially during the recenteconomic climate of limited trading activity and observable market inputs, the Company considers the fairvalue of its investment in senior secured bank loan funds to be determined using Level 3 inputs.
Below is a reconciliation of the beginning and ending balances of assets and liabilities measured at fairvalue on a recurring basis using Level 3 inputs. Interest and dividend income are included in netinvestment income and are excluded from the reconciliation.
Fair Value Measurements Using SignificantUnobservable Inputs (Level 3)
Otherinvestments (1)
Other assets and(liabilities) (2) Total
Balance – January 1 $ 375,281 $ (9,950) $ 365,331Total unrealized (losses) gains
Included in net investment income (132,901) 668 (132,233)Included in other income (163) (9,703) (9,866)
Total realized gains (losses)Included in net investment income 4,844 — 4,844Included in other income — (13,545) (13,545)
Total foreign exchange losses (1,603) (107) (1,710)Net purchases, issuances, and settlements 136,622 (9,875) 126,747Net transfers in and/or out of Level 3 — — —
Balance – December 31 $ 382,080 $(42,512) $ 339,568
(1) Other investments primarily include investments in private equity partnerships and a senior securedbank loan fund.
(2) Balance at December 31, 2008 includes $10.3 million of other assets and $52.8 million of otherliabilities.
The Fair Value Option for Financial Assets and Financial Liabilities
Upon adoption of FAS 159, the Company elected the fair value option for certain assets and liabilities.These assets and liabilities were previously accounted for under applicable GAAP that resulted in a carryingvalue that approximated fair value, and as such, there were no material changes to the reported value ofthese assets and liabilities upon adoption. The Company has elected to use the guidance under FAS 159for these assets and liabilities as FAS 159 represents the most current applicable GAAP. Below is asummary of the balances the Company has elected to account for under FAS 159:
December 31,2008
January 1,2008
Other investments $773,475 $807,864Other secured assets 76,424 90,488Other assets and (liabilities) (1) $ (11,209) $ (6,402)
(1) Balance at December 31, 2008 includes $2.8 million of other assets and $14.0 million of otherliabilities. Balance at January 1, 2008 includes $4.6 million of other assets and $11.0 million of otherliabilities.
F-23

Included in net investment income for the year ended December 31, 2008 is $259.4 million of netunrealized losses related to the changes in fair value of other investments. Net unrealized gains (losses)related to the changes in the fair value of other secured assets and other assets and liabilities recorded inother income was $(2.5) million and $(0.1) million, respectively, for the year ended December 31, 2008.
Reinsurance Contracts Accounted for at Fair Value
The Company assumes and cedes reinsurance contracts that are accounted for at fair value. The fair valueof these contracts is obtained through the use of internal valuation models. These contracts are recorded onthe Company’s balance sheet in other assets and other liabilities and totaled $2.8 million and $nil,respectively (2007 – $4.6 million and $0.6 million, respectively). During 2008, the Company recordedlosses of $9.3 million (2007 – $36.8 million, 2006 – $6.0 million) which are included in other loss andrepresents net settlements and changes in the fair value of these contracts.
NOTE 7. CEDED REINSURANCE
The Company has used reinsurance to manage its risk portfolio. The Company currently has in placecontracts that provide for recovery from reinsurers of a portion of certain claims and claim expenses inexcess of various retentions. Other than loss recoveries, certain of the Company’s ceded reinsurancecontracts also provide for recoveries of additional premiums, reinstatement premiums and lost no claimsbonuses, which are incurred when losses are ceded to reinsurance contracts. The Company remains liableto the extent that any reinsurance company fails to meet its obligations.
The effect of reinsurance and retrocessional activity on premiums written and earned and on net claims andclaim expenses incurred for the years ended December 31, 2008, 2007 and 2006 was as follows:
Year ended December 31, 2008 2007 2006
Premiums writtenDirect $ 489,866 $ 416,642 $ 451,325Assumed 1,246,162 1,392,995 1,492,322Ceded (382,408) (374,302) (414,027)
Net $1,353,620 $1,435,335 $1,529,620
Premiums earnedDirect $ 487,223 $ 453,729 $ 464,858Assumed 1,301,906 1,370,997 1,402,109Ceded (402,305) (400,357) (337,190)
Net $1,386,824 $1,424,369 $1,529,777
Claims and claim expensesGross claims and claim expenses incurred $ 928,263 $ 563,758 $ 504,110Claims and claim expenses recovered (167,774) (84,484) (57,880)
Net claims and claim expenses incurred $ 760,489 $ 479,274 $ 446,230
The reinsurers with the three largest balances accounted for 26.6%, 18.2% and 8.1%, respectively, of theCompany’s losses recoverable balance at December 31, 2008 (2007 – 19.5%, 17.7% and 10.0%,respectively). At December 31, 2008, the Company had an $8.7 million valuation allowance against lossesrecoverable (2007 – $8.9 million). The three largest company-specific components of the valuationallowance represented 40.5%, 23.0% and 9.6%, respectively, of the Company’s total valuation allowance atDecember 31, 2008 (2007 – 39.4%, 22.5% and 10.5%).
F-24

NOTE 8. OTHER SECURED ASSETS AND OTHER SECURED LIABILITIES
Other secured assets and other secured liabilities represent contractual rights and obligations under apurchase agreement, contingent purchase agreement and credit derivatives agreement (collectively, the“Agreements”) with a major bank to sell certain securities within the Company’s catastrophe-linkedsecurities portfolio (“Cat-Linked Securities”). Under the terms of the Agreements, the Company sold itsownership interest in Cat-Linked Securities with a par amount of $77.4 million to the bank for $77.4 million.The Agreements allow the Company to repurchase these securities at par and obligate the Company torepurchase the securities under certain circumstances including catastrophe triggering events and eventsof default. As a result of this transaction, the Company is receiving the spread over LIBOR on the $77.4million of Cat-Linked Securities, less a financing fee.
The Company accounted for the sale of the Cat-Linked Securities under the Agreements as a securedborrowing with a pledge of collateral under the provisions of FASB Statement No. 140, Accounting forTransfers and Servicing of Financial Assets and Extinguishments of Liabilities (“FAS 140”), and accordinglyrecognized no gain or loss upon the transaction date. The credit derivatives agreement is accounted for atfair value with changes in fair value recognized in other income. As a result of the Agreements, theCompany reclassified its previously recorded Cat-Linked Securities, recognized an asset which totaled$76.4 million at December 31, 2008, representing the fair value of the pledged collateral and creditderivatives agreement, and recognized a $77.4 million liability, representing its obligation to repurchase theCat-Linked Securities at par. The Company recognized $2.2 million (2007 – $2.0 million) of other income inits consolidated statements of operations in 2008 from this transaction, representing the spread over LIBORless the financing fee on the Cat-Linked Securities for the year ended December 31, 2008, inclusive of thechange in the fair value of the credit derivatives agreement.
Under the terms of the Agreements, the Company may sell other catastrophe-linked securities.
NOTE 9. RESERVE FOR CLAIMS AND CLAIM EXPENSES
The Company uses statistical and actuarial methods to estimate ultimate expected claims and claimexpenses. The period of time from the reporting of a loss to the Company and the settlement of theCompany’s liability may be many years. During this period, additional facts and trends will be revealed. Asthese factors become apparent, case reserves will be adjusted, sometimes requiring an increase ordecrease in the overall reserves of the Company, and at other times requiring a reallocation of incurred butnot reported (“IBNR”) reserves to specific case reserves or additional case reserves. These estimates arereviewed regularly, and such adjustments, if any, are reflected in the results of operations in the period inwhich they become known and are accounted for as changes in estimates. Adjustments to the Company’sclaims and claim expense reserves can impact current year net income by increasing net income if theestimates of prior year claims and claim expense reserves prove to be overstated or by decreasing netincome if the estimates of prior year claims and claim expense reserves prove to be insufficient.
The Company’s estimates of claims and claim expenses are also based in part upon the estimation ofclaims resulting from natural and man-made disasters such as hurricanes, earthquakes, tsunamis, winterstorms, terrorist attacks and other catastrophic events. Estimation by the Company of claims resulting fromcatastrophic events is inherently difficult because of the potential severity of property catastrophe claims.Additionally, the Company has recently increased its Individual Risk and specialty reinsurance premiumsbut does not have the benefit of a significant amount of its own historical experience in these lines.Therefore, the Company uses both proprietary and commercially available models, as well as historicalreinsurance industry claims experience, for purposes of evaluating future trends and providing an estimateof ultimate claims costs.
F-25

Activity in the liability for unpaid claims and claim expenses is summarized as follows:
Year ended December 31, 2008 2007 2006
Net reserves as of January 1 $1,845,221 $1,796,301 $1,941,361Net incurred related to:
Current year 995,316 712,424 582,788Prior years (234,827) (233,150) (136,558)
Total net incurred 760,489 479,274 446,230
Net paid related to:Current year 346,845 125,816 139,268Prior years 397,787 304,538 452,022
Total net paid 744,632 430,354 591,290
Total net reserves as of December 31 1,861,078 1,845,221 1,796,301Losses recoverable as of December 31 299,534 183,275 301,854
Total gross reserves as of December 31 $2,160,612 $2,028,496 $2,098,155
For the year ended December 31, 2008, the prior year favorable development of $234.8 million included$188.1 million attributable to the Company’s Reinsurance segment and $46.7 million attributable to theCompany’s Individual Risk segment. Within the Company’s Reinsurance segment, the catastrophereinsurance unit experienced $131.6 million of favorable development on prior years’ estimated ultimateclaim reserves, principally as a result of a comprehensive review of the Company’s expected ultimate netlosses associated with the 2005 hurricanes, Katrina, Rita and Wilma. The Company’s specialty reinsuranceunit, within the Reinsurance segment, and its Individual Risk segment experienced $56.5 million and $46.7million, respectively, of favorable development in 2008. The favorable development within the specialtyreinsurance unit and Individual Risk segment was principally driven by the application of formulaic actuarialreserving methodology for these books of business with the reductions being due to actual paid andreported loss activity being more favorable to date than what was originally anticipated when setting theinitial IBNR reserves.
For the year ended December 31, 2007, the prior year favorable development of $233.2 million included$194.4 million attributable to the Company’s Reinsurance segment and $38.8 million attributable to theCompany’s Individual Risk segment. Within the Company’s Reinsurance segment, the catastrophereinsurance unit experienced $93.1 million of favorable development on prior years’ estimated ultimateclaim reserves, principally as a result of a reduction of the ultimate losses for the 2006 and 2005 accidentyears as reported claims have come in less than expected. Included in the 2005 accident year is a $19.2million reduction in net claims and claim expenses associated with hurricanes Katrina, Rita and Wilma. TheCompany’s specialty reinsurance unit experienced $101.3 million of favorable development in 2007. Thefavorable development within the Company’s specialty reinsurance unit and Individual Risk segment wasprincipally driven by the application of the Company’s formulaic actuarial reserving methodology for thesebooks of business with the reductions being due to actual paid and reported loss activity being better thanwhat was anticipated when setting the initial IBNR reserves.
For the year ended December 31, 2006, the prior year favorable development of $136.6 million included$125.2 million attributable to the Company’s Reinsurance segment and $11.3 million attributable to theCompany’s Individual Risk segment. The reduction in prior years’ estimated ultimate claim reserves in theCompany’s Reinsurance segment was primarily due to lower than expected claims emergence within theCompany’s specialty reinsurance unit. The Company’s specialty reinsurance unit experienced $139.2million of favorable development in 2006 while its catastrophe reinsurance unit experienced $13.9 millionof adverse development. The favorable development within the Company’s specialty reinsurance unit andIndividual Risk segment was principally driven by the application of the Company’s formulaic reservingmethodology for these books of business with the reductions being due to actual paid and reported lossactivity being better than what was anticipated when setting the initial IBNR reserves. In addition, within theCompany’s specialty reinsurance unit $46.0 million of the favorable development was driven by a reduction
F-26

in carried reserves due to commutations. The adverse development in the Company’s catastrophereinsurance unit was principally driven by an increase in the Company’s ultimate losses for a U.K. industrialproperty loss. This loss occurred at the end of 2005 and both the estimate of insured industry losses for theevent and the Company’s estimate of its client’s losses from this event increased in 2006.
Net claims and claim expenses incurred were reduced by $1.9 million during 2008 (2007 – $3.3 million,2006 – $5.5 million) related to income earned on assumed reinsurance contracts that were classified asdeposit contracts with underwriting risk only. Other income was decreased by $1.9 million during 2008(2007 – $1.4 million, 2006 – $1.0 million) related to premiums and losses incurred on assumedreinsurance contracts that were classified as deposit contracts with timing risk only. Aggregate depositliabilities of $73.6 million are included in reinsurance balances payable at December 31, 2008 (2007 –$84.1 million) and aggregate deposit assets of $nil are included in other assets at December 31, 2008(2007 – $nil) associated with these contracts.
NOTE 10. DEBT
In January 2003, the Company issued $100.0 million of 5.875% Senior Notes due February 15, 2013, withinterest on the notes payable on February 15 and August 15 of each year. The notes can be redeemed bythe Company prior to maturity subject to payment of a “make-whole” premium. The notes, which are seniorobligations, contain various covenants, including limitations on mergers and consolidations, restrictions asto the disposition of the stock of designated subsidiaries and limitations on liens of the stock of designatedsubsidiaries. In July 2001, the Company issued $150.0 million of 7.0% Senior Notes which came dueJuly 15, 2008. The notes were paid at maturity on July 15, 2008 using existing capital resources, asdiscussed below. At December 31, 2008, the fair value of the 5.875% Senior Notes was $93.3 million(2007 – $101.3 million).
During April 2006, DaVinciRe amended and restated its credit agreement to, among other things, (i) extendthe termination date of the revolving credit facility established thereunder from May 25, 2010 to April 5,2011; (ii) increase the borrowing capacity to $200.0 million; and (iii) increase the minimum net worthrequirement with respect to DaVinciRe and DaVinci by $100.0 million to $350.0 million and $450.0 million,respectively. All other material terms and conditions in the credit agreement remained the same, includingthe requirement that DaVinciRe maintain a debt to capital ratio of 30% or below. At December 31, 2008,$200.0 million remained outstanding. Interest rates on the facility are based on a spread above LIBOR, andaveraged approximately 4.3% during 2008 (2007 – 6.0%). The term of the credit facility may be furtherextended and the size of the facility may be increased to $250.0 million if certain conditions are met.Neither RenaissanceRe nor Renaissance Reinsurance is a guarantor of this facility and the lenders have norecourse against the Company or its subsidiaries other than DaVinciRe and its subsidiary under theDaVinciRe facility. Pursuant to the terms of the $500.0 million revolving credit facility maintained byRenaissanceRe, a default by DaVinciRe on its obligations will not result in a default under theRenaissanceRe facility.
During August 2004, the Company amended and restated its committed revolving credit agreement to(i) increase the facility from $400.0 million to $500.0 million, (ii) extend the term to August 6, 2009 and(iii) make certain other changes. On July 10, 2008, the Company borrowed $150.0 million available underthis facility to pay at maturity its 7.0% Senior Notes which came due on July 15, 2008. At December 31,2008, the $150.0 million borrowed under this facility remains outstanding. Interest rates on the facility arebased on a spread above LIBOR and averaged 4.2% during 2008. As amended, the agreement containscertain covenants, including financial covenants. These covenants generally provide that consolidated debtto capital shall not exceed the ratio (the “Debt to Capital Ratio”) of 0.35:1 and that the consolidated networth (the “Net Worth Requirements”) of RenaissanceRe and Renaissance Reinsurance shall equal orexceed $1.0 billion and $500.0 million, respectively, subject to certain adjustments under certaincircumstances in the case of the Debt to Capital Ratio and certain grace periods in the case of the NetWorth requirements, all as more fully set forth in the agreement. The Company has the right, subject tocertain conditions, to increase the size of this facility to $600.0 million.
F-27

Interest paid on the above debt (and to the Capital Trust in 2007 and 2006) totaled $28.2 million, $35.5million and $36.8 million for the years ended December 31, 2008, 2007 and 2006, respectively.
NOTE 11. VARIABLE INTEREST ENTITIES
Subordinated Obligation to Capital Trust
In March 1997, the Company issued $100.0 million aggregate liquidation amount of mandatorilyredeemable capital securities (“Capital Securities”) through a subsidiary trust holding solely $103.1 millionof the Company’s 8.54% junior subordinated debentures due March 1, 2027. The Capital Securities paidcumulative cash distributions at an annual rate of 8.54%, payable semi-annually. The Capital Trust is awholly owned subsidiary of the Company and was consolidated into the Company’s consolidated financialstatements up until the Company’s adoption of FIN 46(R) at December 31, 2003. The Company’sguarantee of the distributions on the Capital Securities issued by the Capital Trust, when taken together withthe Company’s obligations under an expense reimbursement agreement with the Capital Trust, provided fulland unconditional guarantee of amounts due on the Capital Securities issued by the Capital Trust.
Upon the adoption of FIN 46(R) at December 31, 2003, the Capital Trust was determined to be a variableinterest entity and the Company was determined not to be the primary beneficiary of the Capital Trust.Accordingly, the Capital Trust was deconsolidated from the Company’s consolidated financial statements atDecember 31, 2003. As a result, the balance of the Capital Securities, previously classified as minorityinterest, were classified as a liability. In addition, equity interests in the Capital Trust and purchased CapitalSecurities held by the Company were included in the Company’s investments. These investments included$15.4 million of Capital Securities purchased by the Company and $3.1 million of common stock issued bythe Capital Trust to the Company in March 1997.
On January 25, 2007, the Capital Trust called for redemption, all of the outstanding Capital Securities whichit did not then own, concurrent with the redemption by the Company of the underlying 8.54% juniorsubordinated debentures of the Company, which were the sole asset held by the Capital Trust. Theredemption price for such Capital Securities was $1,042.70 per security plus accrued and unpaid dividendsthereon, up to but excluding, the redemption date. The redemption of the Capital Securities occurred onMarch 1, 2007, the redemption date. The aggregate redemption price was $91.9 million.
Timicuan Reinsurance Ltd.
On June 1, 2006, Tim Re, a wholly owned subsidiary of the Company, sold $49.5 million of non-votingClass B shares to external investors to provide Tim Re with additional capacity to accept propertycatastrophe excess of loss reinsurance business. Tim Re is a Class 3 Bermuda domiciled reinsurer. TheCompany ceded a defined portfolio of property catastrophe excess of loss reinsurance contracts inceptingJune 1, 2006 to Tim Re under a fully-collateralized reinsurance contract in return for an underwriting profitcommission. The Class B shareholders participated in substantially all of the profits or losses of Tim Rewhile the Class B shares remained outstanding. The Class B shares indemnify Tim Re against lossesrelating to insurance risk and therefore these shares have been accounted for as prospective reinsuranceunder FASB Statement No. 113, Accounting and Reporting for Reinsurance of Short-Duration and Long-Duration Contracts. The sale of the Class B shares was considered a reconsideration event under FIN46(R). In accordance with the provisions of FIN 46(R), Tim Re was considered a variable interest entity andthe Company was considered the primary beneficiary. As a result, Tim Re was consolidated by theCompany and all significant inter-company transactions have been eliminated. The Class B share capitalwas invested by Tim Re in short term investments and pledged as collateral to the Company in support ofobligations arising under the reinsurance contract. Tim Re was required to repurchase the Class B sharessubsequent to the end of the exposure period. The Company ceded $27.5 million of premium to Tim Reunder an auto facultative retrocessional excess of loss reinsurance contract through December 31, 2006.Effective January 1, 2007, the Company repurchased all of the outstanding Class B shares for $67.6million, net of a $3.0 million holdback. The $3.0 million holdback has since been settled. Subsequent to therepurchase of the Class B shares by the Company, Tim Re remains a consolidated subsidiary, but is nolonger considered a variable interest entity.
F-28

NOTE 12. MINORITY INTEREST
In October 2001, the Company formed DaVinciRe and DaVinci with other equity investors. RenaissanceReowns a minority economic interest in DaVinciRe; however, because RenaissanceRe controls a majority ofDaVinciRe’s outstanding voting rights, the consolidated financial statements of DaVinciRe are included inthe consolidated financial statements of the Company. The portion of DaVinciRe’s earnings owned by thirdparties for the years ended December 31, 2008, 2007 and 2006 is recorded in the consolidated statementsof operations as minority interest.
Effective December 31, 2005, DaVinciRe raised $320.6 million of equity capital from new and existinginvestors, including $50.0 million contributed by the Company. The Company’s ownership in DaVinciRewas 19.7% at December 31, 2005. Effective January 1, 2006, the Company purchased the shares of one ofDaVinciRe’s original shareholders for $15.4 million, subject to a true-up for development on outstandingloss reserves after the settlement of all claims relating to the applicable years; increasing the Company’seconomic ownership to 22.3%. In addition, on February 1, 2006, DaVinciRe raised an additional $53.9million of equity capital, diluting the Company’s economic ownership interest to 20.5% for the remainder of2006 and 2007. The Company continues to maintain majority voting control of DaVinciRe and, accordingly,will continue consolidating the results of DaVinciRe into the Company’s consolidated results of operationsand financial position.
In conjunction with the capital raise, the Company and other DaVinciRe shareholders entered into thesecond amended and restated shareholders agreement, which provides the shareholders, excluding theCompany, with certain redemption rights such as allowing each shareholder to notify DaVinciRe of theirdesire for DaVinciRe to repurchase up to half of their aggregate number of shares held. Any sharerepurchases are subject to certain limitations such as limiting the aggregate of all share repurchaserequests to 25% of DaVinciRe’s capital in any given year and subject to ensuring all applicable legal andregulatory requirements are met. If the total shareholder requests exceed 25% of DaVinciRe’s capital, thenumber of shares repurchased will be reduced among the requesting shareholders pro-rata, based on theamounts desired to be repurchased. Shareholders must notify DaVinciRe before March 1 of each year,commencing March 1, 2007, if they desire to have DaVinciRe repurchase shares. The redemption rights’repurchase price will be GAAP book value as of the end of the year in which the shareholder notice is given,and the repurchase will be effective as of such date. Payment will be made by April 1 of the following year,following delivery of the audited financial statements for the year in which the repurchase was effective. Therepurchase price will be subject to adjustment in future periods for development on outstanding lossreserves after settlement of all claims relating to the applicable years.
On December 31, 2007, the Company, acting in the capacity of an intermediary, purchased the shares of athird party DaVinciRe shareholder for $43.5 million, at GAAP book value as of December 31, 2007.Subsequently, on January 1, 2008, the Company sold these shares to two existing third party DaVinciReshareholders for $43.5 million. At December 31, 2007, the Company had a receivable and payable of$43.5 million and $3.5 million, respectively, related to this transaction, which are reflected in other assetsand other liabilities, respectively. The Company’s 20.5% ownership interest at December 31, 2007 excludesthe impact of this transaction.
Certain shareholders of DaVinciRe put in repurchase notices on or before the March 1, 2008 repurchasenotice date. The repurchase notice was for shares with a GAAP book value of $145.5 million atDecember 31, 2008. On January 30, 2009, the Company on behalf of DaVinciRe purchased the shares for$145.5 million, less a $21.8 million reserve holdback. The Company’s ownership interest in DaVinciReincreased from 22.8% at December 31, 2008, to 37.6%. as a result of these purchases.
F-29

NOTE 13. SHAREHOLDERS’ EQUITY
The aggregate authorized capital of the Company is 325 million shares consisting of 225 million commonshares and 100 million preference shares.
The following table is a summary of changes in common shares issued and outstanding:
Year ended December 31, 2008 2007 2006(thousands of shares)
Issued and outstanding shares – January 1 68,920 72,140 71,523Shares repurchased (8,064) (3,588) —Exercise of options and issuance of restricted stock awards 647 368 617
Issued and outstanding shares – December 31 61,503 68,920 72,140
On August 7, 2003, the Board authorized a share repurchase program of $150.0 million. On August 15,2007, the Board of Directors increased the Company’s share repurchase program to $500.0 million fromthe original amount authorized on August 7, 2003. On May 20, 2008, the Board of Directors authorized anadditional increase in the Company’s share repurchase program to $500.0 million, which included theremaining amounts available under the August 2007 authorization. The Company’s decision to repurchasecommon shares will depend on, among other matters, the market price of the common shares and thecapital requirements of the Company. During 2008, $428.4 million of shares (2007 – $200.1 million, 2006– $nil) were repurchased under this program. Common shares repurchased by the Company are normallycancelled and retired. At December 31, 2008, $382.4 million remained available for repurchase under theBoard authorized share repurchase program.
In December 2006, the Company raised $300.0 million through the issuance of 12 million Series DPreference Shares at $25 per share; in March 2004, the Company raised $250.0 million through theissuance of 10 million Series C Preference Shares at $25 per share and in February 2003, the Companyraised $100.0 million through the issuance of 4 million Series B Preference Shares at $25 per share; and inNovember 2001, the Company raised $150.0 million through the issuance of 6 million Series A PreferenceShares at $25 per share. The Series D, Series C and Series B Preference Shares may be redeemed at $25per share at the Company’s option on or after December 1, 2011, March 23, 2009 and February 4, 2008,respectively. Dividends on the Series D, Series C and Series B Preference Shares are cumulative from thedate of original issuance and are payable quarterly in arrears at 6.60% 6.08% and 7.30% respectively,when, if, and as declared by the Board of Directors. If the Company submits a proposal to its shareholdersconcerning an amalgamation or submits any proposal that, as a result of any changes to Bermuda law,requires approval of the holders of these preference shares to vote as a single class, the Company mayredeem the Series D, Series C and Series B Preference Shares prior to December 1, 2011, March 23, 2009and February 4, 2008, respectively, at $26 per share. The preference shares have no stated maturity andare not convertible into any other securities of the Company. Generally, the preference shares have novoting rights. Whenever dividends payable on the preference shares are in arrears (whether or not suchdividends have been earned or declared) in an amount equivalent to dividends for six full dividend periods(whether or not consecutive), the holders of the preference shares, voting as a single class regardless ofclass or series, will have the right to elect two directors to the Board of Directors of the Company. During2008, the Company declared and paid $42.3 million in preference share dividends (2007 – $42.9 million,2006 – $34.7 million).
On December 15, 2006, the Company gave redemption notices to the holders of the Series A PreferenceShares to redeem such shares for $25 per share. All of the Series A Preferences Shares were redeemed for$150.0 million plus accrued and unpaid dividends thereon.
F-30

NOTE 14. EARNINGS PER SHARE
The Company accounts for its weighted average shares in accordance with FASB Statement No. 128,Earnings per Share (“FAS 128”). The numerator in both the Company’s basic and diluted earnings pershare calculations is identical. The following table sets forth the reconciliation of the denominator from basicto diluted weighted average shares outstanding:
Year ended December 31, 2008 2007 2006
(thousands of shares)
Weighted average shares – basic 62,531 70,520 71,064Per share equivalents of employee stock options and restricted shares 880 1,305 1,009
Weighted average shares – diluted (1) 63,411 71,825 72,073
(1) In accordance with FAS 128, earnings per share calculations use average common shares outstanding– basic, when in a net loss position.
NOTE 15. RELATED PARTY TRANSACTIONS AND MAJOR CUSTOMERS
The Company has entered into reinsurance agreements with certain subsidiaries and affiliates of Tower Hilland has also entered into reinsurance agreements with respect to business produced by Tower HillInsurance. These reinsurance agreements included excess of loss reinsurance and four net retainedpersonal property quota share agreements for 2008 and 2007. For the year ended December 31, 2008, theCompany recorded $57.3 million (2007 – $118.6 million) of gross premium written assumed from TowerHill and its subsidiaries and affiliates related to the above mentioned contracts. Gross premiums writtenassumed from Tower Hill in 2007 included $65.6 million related to the portfolio transfer of the businessfrom Tower Hill to the Company effective June 1, 2007. Gross premiums earned totaled $78.0 million(2007 – $71.6 million) and expenses incurred were $29.2 million (2007 – $20.3 million) for the year endedDecember 31, 2008 related to these contracts. The Company had a net related outstanding receivablebalance of $17.0 million as of December 31, 2008 (2007 – $17.4 million).
During 2008, the Company purchased $3.5 million of intangible assets from a current employee of theCompany, including rights, title and interest in and to patents and patent technologies, inventions and tradenames. These intangible assets were owned by the employee. As part of the purchase agreement, theCompany paid a set price and agreed to pay additional amounts upon successful licensing, sale, or certainother monetization by the Company of the inventions.
During 2008, the Company invested $6.0 million in Angus Partners LLC (“Angus”), representing a 40%equity interest, which is accounted for under the equity method of accounting. Angus provides weather-centric risk management products, with a particular focus on weather exposed commodity price risk to thirdparty customers. The Company had an outstanding liability position of $38.8 million at December 31, 2008related to certain derivative trades with Angus. For the year ended December 31, 2008, the Companyincurred an other loss of $39.4 million related to these trades.
During 2008, the Company received distributions from Top Layer Re of $15.1 million (2007 – $12.8million), and a management fee of $3.5 million (2007 – $2.6 million). The management fee reimburses theCompany for services it provides to Top Layer Re.
The Company provides ChannelRe with various administrative services. As a result of ChannelRe’s net lossfor 2007 and resulting negative shareholders’ equity position at December 31, 2007, the Company reversedits accrual for profit-based administrative services, resulting in a loss of $2.4 million. For 2008, ChannelRecontinued to have a negative shareholders’ equity position at December 31, 2008 and as a result theCompany recorded profit-based administrative services income of $nil. The Company had an outstandingreceivable from ChannelRe of $nil million as of December 31, 2008 (2007 – $nil) related to theadministrative services noted above.
During the years ended December 31, 2008, 2007 and 2006, the Company received 88.6%, 91.8% and90.1%, respectively, of its Reinsurance segment premium assumed from four brokers. Subsidiaries andaffiliates of the Benfield Group Limited (“Benfield”), Marsh Inc., AON Corporation (“AON”) and the Willis
F-31
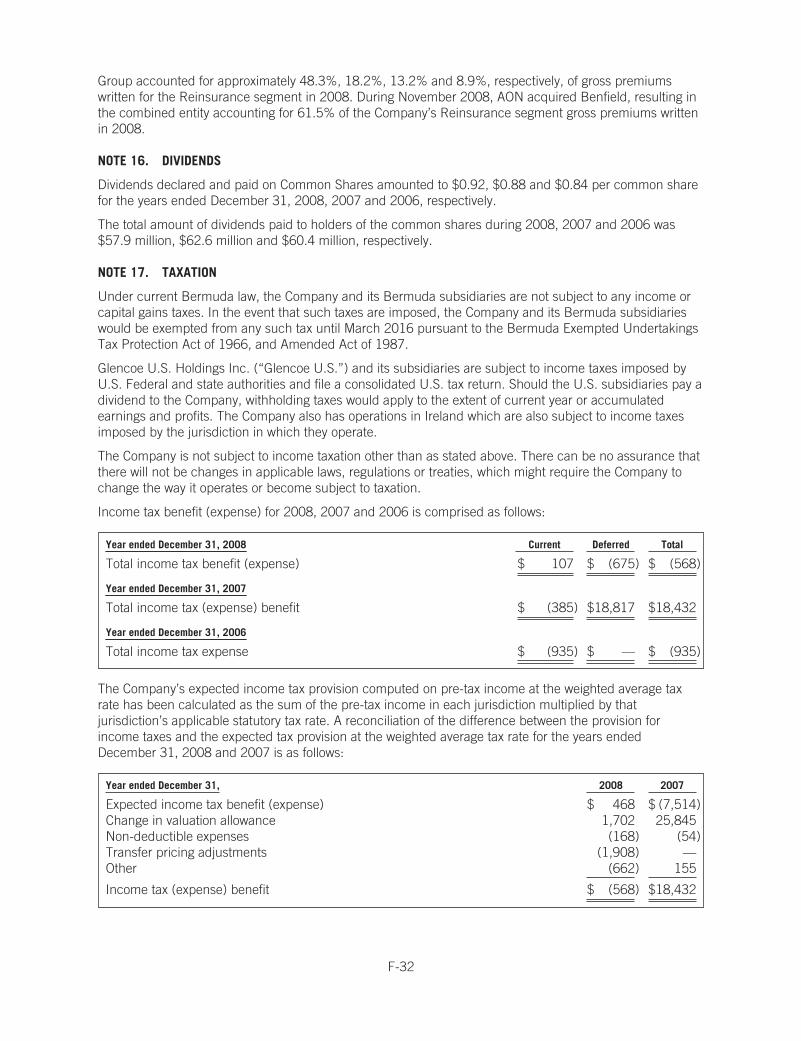
Group accounted for approximately 48.3%, 18.2%, 13.2% and 8.9%, respectively, of gross premiumswritten for the Reinsurance segment in 2008. During November 2008, AON acquired Benfield, resulting inthe combined entity accounting for 61.5% of the Company’s Reinsurance segment gross premiums writtenin 2008.
NOTE 16. DIVIDENDS
Dividends declared and paid on Common Shares amounted to $0.92, $0.88 and $0.84 per common sharefor the years ended December 31, 2008, 2007 and 2006, respectively.
The total amount of dividends paid to holders of the common shares during 2008, 2007 and 2006 was$57.9 million, $62.6 million and $60.4 million, respectively.
NOTE 17. TAXATION
Under current Bermuda law, the Company and its Bermuda subsidiaries are not subject to any income orcapital gains taxes. In the event that such taxes are imposed, the Company and its Bermuda subsidiarieswould be exempted from any such tax until March 2016 pursuant to the Bermuda Exempted UndertakingsTax Protection Act of 1966, and Amended Act of 1987.
Glencoe U.S. Holdings Inc. (“Glencoe U.S.”) and its subsidiaries are subject to income taxes imposed byU.S. Federal and state authorities and file a consolidated U.S. tax return. Should the U.S. subsidiaries pay adividend to the Company, withholding taxes would apply to the extent of current year or accumulatedearnings and profits. The Company also has operations in Ireland which are also subject to income taxesimposed by the jurisdiction in which they operate.
The Company is not subject to income taxation other than as stated above. There can be no assurance thatthere will not be changes in applicable laws, regulations or treaties, which might require the Company tochange the way it operates or become subject to taxation.
Income tax benefit (expense) for 2008, 2007 and 2006 is comprised as follows:
Year ended December 31, 2008 Current Deferred Total
Total income tax benefit (expense) $ 107 $ (675) $ (568)
Year ended December 31, 2007
Total income tax (expense) benefit $ (385) $18,817 $18,432
Year ended December 31, 2006
Total income tax expense $ (935) $ — $ (935)
The Company’s expected income tax provision computed on pre-tax income at the weighted average taxrate has been calculated as the sum of the pre-tax income in each jurisdiction multiplied by thatjurisdiction’s applicable statutory tax rate. A reconciliation of the difference between the provision forincome taxes and the expected tax provision at the weighted average tax rate for the years endedDecember 31, 2008 and 2007 is as follows:
Year ended December 31, 2008 2007
Expected income tax benefit (expense) $ 468 $ (7,514)Change in valuation allowance 1,702 25,845Non-deductible expenses (168) (54)Transfer pricing adjustments (1,908) —Other (662) 155
Income tax (expense) benefit $ (568) $18,432
F-32

The tax effects of temporary differences that give rise to significant portions of the deferred tax assets anddeferred tax liabilities are presented below:
At December 31, 2008 2007
Deferred tax assetsNet operating loss carryforwards $ 15,603 $ 9,026Unearned premium adjustment 4,937 4,240Claims reserves, principally due to discounting for tax 4,567 4,691Intangible assets 2,145 913Accrued expenses 3,347 4,574Investments — 461Other 2,163 2,586
32,762 26,491
Deferred tax liabilitiesDeferred acquisition costs (3,775) (4,741)Investments (10,643) —
(14,418) (4,741)
Net deferred tax asset before valuation allowance 18,344 21,750Valuation allowance (1,383) (3,085)
Net deferred tax asset $ 16,961 $18,665
During 2008, the Company recorded net reductions to the valuation allowance of $1.7 million. TheCompany’s deferred tax asset relates primarily to net operating loss carryforwards and book-tax differencesrelating to unearned premium reserves, loss reserves, accrued expenses and intangible assets. Netoperating loss carryforwards are available to offset future taxes payable by the Company’s U.S. subsidiaries.Although the net operating losses, which gave rise to a deferred tax asset, have a carryforward periodthrough 2027, the Company’s U.S. operations generated cumulative taxable income for the three yearperiod ending December 31, 2008. In addition, the Company expects its U.S. tax-paying subsidiaries willcontinue to generate taxable income in future periods. Accordingly, the Company believes that it is morelikely than not that the U.S. deferred tax asset will be realized and therefore the U.S. valuation allowancewas reduced in its entirety in 2008. The remaining valuation allowance at December 31, 2008 relatesexclusively to net operating loss carryforwards in the Company’s operations in Ireland.
Net operating loss carryforwards of $40.6 million (2007 – $48.9 million) are available to offset regulartaxable U.S. income during the carryforward period. Under applicable law, the U.S. net operating lossesexpire between 2020 and 2027. All net operating losses for tax years prior to 2000 have been fully utilized.In addition, the Company has an alternative minimum tax (“AMT”) credit carryforward of $1.0 million whichcan be carried forward indefinitely. In Ireland, the Company has net operating loss carryforwards of $11.0million. Under applicable law, the Irish net operating losses carryforward for an indefinite period.
The Company paid U.S. federal and Irish income taxes of $0.3 million, $0.7 million and $0.6 million in theyears ended December 31, 2008, 2007 and 2006, respectively.
The Company had no unrecognized tax benefits upon adoption of FIN 48 and has no unrecognized taxbenefits as of December 31, 2008. Tax years ending December 31, 2005 through December 31, 2007 areopen for examination by the Internal Revenue Service.
F-33

NOTE 18. GEOGRAPHIC INFORMATION
The following is a summary of the Company’s gross premiums written allocated to the territory of coverageexposure:
Year ended December 31, 2008 2007 2006
Property catastropheUnited States and Caribbean $ 745,016 $ 735,322 $ 792,311Worldwide (excluding U.S.) (1) 75,489 66,392 71,116Europe 72,153 111,702 73,500Worldwide 67,371 27,577 68,575Australia and New Zealand 5,455 4,360 2,732Other 23,465 20,374 23,972
Specialty reinsurance (2) 159,770 287,316 222,049
Total Reinsurance (3) 1,148,719 1,253,043 1,254,255Individual Risk (4) 587,309 556,594 689,392
Total gross written premium $1,736,028 $1,809,637 $1,943,647
(1) The category Worldwide (excluding U.S.) consists of contracts that cover more than one geographicregion (other than the U.S.). The exposure in this category for gross written premiums to date ispredominantly from Europe and Japan.
(2) The category specialty reinsurance consists of contracts that are predominantly exposed to U.S. risks,with a small portion of the risks being Worldwide.
(3) Excludes $5.7 million, $37.4 million and $66.9 million of premium assumed from the Individual Risksegment for the years ended December 31, 2008, 2007 and 2006, respectively.
(4) The category Individual Risk consists of contracts that are primarily exposed to U.S. risks.
NOTE 19. SEGMENT REPORTING
The Company has two reportable segments: Reinsurance and Individual Risk.
The Reinsurance segment consists of: 1) property catastrophe reinsurance, primarily writtenthrough Renaissance Reinsurance and DaVinci; 2) specialty reinsurance, primarily writtenthrough Renaissance Reinsurance and DaVinci; and 3) certain other activities of ventures asdescribed herein. The Reinsurance segment is managed by the President of RenaissanceReinsurance, who leads a team of underwriters, risk modelers and other industry professionals,who have access to the Company’s proprietary risk management, underwriting and modelingresources and tools.
The Individual Risk segment includes underwriting that involves understanding the characteristicsof the original underlying insurance policy. The Company’s Individual Risk segment is managedby the Chief Executive Officer of the Glencoe Group. The Individual Risk segment currently pro-vides insurance written on both an admitted basis and an excess and surplus lines basis, and alsoprovides reinsurance on a quota share basis.
The Company does not manage its assets by segment and therefore total assets are not allocated to thesegments.
F-34
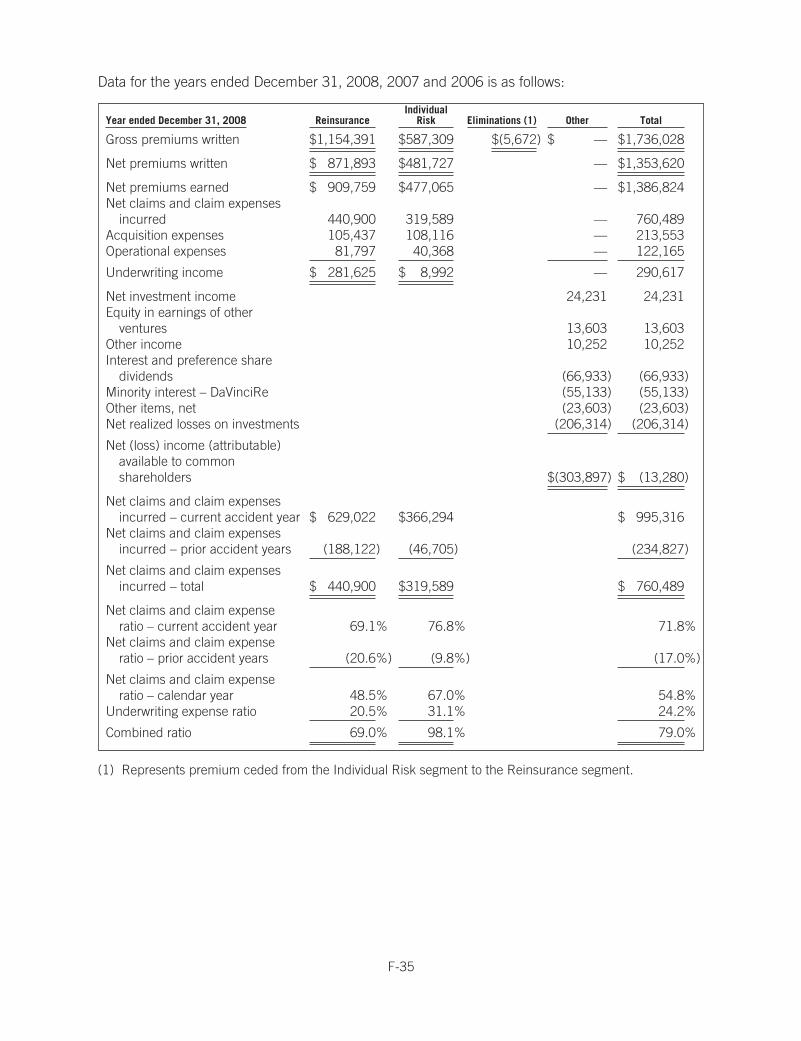
Data for the years ended December 31, 2008, 2007 and 2006 is as follows:
Year ended December 31, 2008 ReinsuranceIndividual
Risk Eliminations (1) Other Total
Gross premiums written $1,154,391 $587,309 $(5,672) $ — $1,736,028
Net premiums written $ 871,893 $481,727 — $1,353,620
Net premiums earned $ 909,759 $477,065 — $1,386,824Net claims and claim expenses
incurred 440,900 319,589 — 760,489Acquisition expenses 105,437 108,116 — 213,553Operational expenses 81,797 40,368 — 122,165
Underwriting income $ 281,625 $ 8,992 — 290,617
Net investment income 24,231 24,231Equity in earnings of other
ventures 13,603 13,603Other income 10,252 10,252Interest and preference share
dividends (66,933) (66,933)Minority interest – DaVinciRe (55,133) (55,133)Other items, net (23,603) (23,603)Net realized losses on investments (206,314) (206,314)
Net (loss) income (attributable)available to commonshareholders $(303,897) $ (13,280)
Net claims and claim expensesincurred – current accident year $ 629,022 $366,294 $ 995,316
Net claims and claim expensesincurred – prior accident years (188,122) (46,705) (234,827)
Net claims and claim expensesincurred – total $ 440,900 $319,589 $ 760,489
Net claims and claim expenseratio – current accident year 69.1% 76.8% 71.8%
Net claims and claim expenseratio – prior accident years (20.6%) (9.8%) (17.0%)
Net claims and claim expenseratio – calendar year 48.5% 67.0% 54.8%
Underwriting expense ratio 20.5% 31.1% 24.2%
Combined ratio 69.0% 98.1% 79.0%
(1) Represents premium ceded from the Individual Risk segment to the Reinsurance segment.
F-35

Year ended December 31, 2007 ReinsuranceIndividual
Risk Eliminations (1) Other Total
Gross premiums written $1,290,420 $556,594 $(37,377) $ — $1,809,637
Net premiums written $1,024,493 $410,842 — $1,435,335
Net premiums earned $ 957,661 $466,708 — $1,424,369Net claims and claim expenses
incurred 241,118 238,156 — 479,274Acquisition expenses 119,915 135,015 — 254,930Operational expenses 67,969 42,495 — 110,464
Underwriting income $ 528,659 $ 51,042 — 579,701
Net investment income 402,463 402,463Equity in losses of other ventures (128,609) (128,609)Other loss (37,930) (37,930)Interest and preference share
dividends (76,487) (76,487)Minority interest – DaVinciRe (164,396) (164,396)Other items, net (6,460) (6,460)Net realized losses on investments 1,293 1,293
Net income available to commonshareholders $ (10,126) $ 569,575
Net claims and claim expensesincurred – current accident year $ 435,495 $276,929 $ 712,424
Net claims and claim expensesincurred – prior accident years (194,377) (38,773) (233,150)
Net claims and claim expensesincurred – total $ 241,118 $238,156 $ 479,274
Net claims and claim expense ratio –current accident year 45.5% 59.3% 50.0%
Net claims and claim expense ratio –prior accident years (20.3%) (8.3%) (16.4%)
Net claims and claim expense ratio –calendar year 25.2% 51.0% 33.6%
Underwriting expense ratio 19.6% 38.1% 25.7%
Combined ratio 44.8% 89.1% 59.3%
(1) Represents premium ceded from the Individual Risk segment to the Reinsurance segment.
F-36

Year ended December 31, 2006 ReinsuranceIndividual
Risk Eliminations (1) Other Total
Gross premiums written $1,321,163 $689,392 $(66,908) $ — $1,943,647
Net premiums written $1,039,103 $490,517 — $1,529,620
Net premiums earned $ 972,017 $557,760 — $1,529,777Net claims and claim expenses
incurred 148,052 298,178 — 446,230Acquisition expenses 115,324 165,373 — 280,697Operational expenses 72,405 37,181 — 109,586
Underwriting income $ 636,236 $ 57,028 — 693,264
Net investment income 318,106 318,106Equity in earnings of other
ventures 34,528 34,528Other loss (3,917) (3,917)Interest and preference share
dividends (73,077) (73,077)Minority interest – DaVinciRe (144,159) (144,159)Other items, net (28,646) (28,646)Net realized losses on investments (34,464) (34,464)
Net income available to commonshareholders $ 68,371 $ 761,635
Net claims and claim expensesincurred – current accident year $ 273,286 $309,502 $ 582,788
Net claims and claim expensesincurred – prior accident years (125,234) (11,324) (136,558)
Net claims and claim expensesincurred – total $ 148,052 $298,178 $ 446,230
Net claims and claim expenseratio – current accident year 28.1% 55.5% 38.1%
Net claims and claim expenseratio – prior accident years (12.9%) (2.0%) (8.9%)
Net claims and claim expenseratio – calendar year 15.2% 53.5% 29.2%
Underwriting expense ratio 19.3% 36.3% 25.5%
Combined ratio 34.5% 89.8% 54.7%
(1) Represents premium ceded from the Individual Risk segment to the Reinsurance segment.
NOTE 20. STOCK INCENTIVE COMPENSATION AND EMPLOYEE BENEFIT PLANS
The Company has a stock incentive plan (the “2001 Stock Incentive Plan”) under which all employees ofthe Company and its subsidiaries may be granted stock options and restricted stock awards. A stock optionaward under the Company’s 2001 Stock Incentive Plan generally allows for the purchase of the Company’scommon shares at a price that is equal to the fair market value of the Company’s common shares as of thegrant effective date. Options to purchase common shares are granted periodically by the Board of Directors,generally vest over four years and generally expire ten years from the date of grant. Restricted commonshares are granted periodically by the Board of Directors and generally vest ratably over a four or five yearperiod. In addition, awards granted under the Company’s prior 1993 stock incentive plan remainoutstanding, with terms similar to the 2001 Stock Incentive Plan. The Company has also established aNon-Employee Director Stock Incentive Plan to issue stock options and shares of restricted stock to theCompany’s non-employee directors.
F-37

The Company’s 2001 Stock Incentive Plan also allows for the issuance of share-based awards, the issuanceof restricted common shares and shares tendered in connection with option exercises. For purposes ofdetermining the number of shares reserved for issuance under the 2001 Stock Plan, shares tendered to orwithheld by the Company in connection with certain option exercises will again be available for issuance.
In August 2004, the Company’s shareholders approved the RenaissanceRe Holdings Ltd. 2004 StockOption Incentive Plan (the “Premium Option Plan”) under which 6.0 million common shares were reservedfor issuance upon the exercise of options granted under the Premium Option Plan. On August 15, 2007,the Company terminated the Premium Option Plan, such that no further option grants will be madethereunder. However, options outstanding at the time of the termination will, unless otherwise subsequentlyamended pursuant to the terms of the Premium Option Plan, remain outstanding and unmodified until theyexpire, subject to the terms of the Premium Option Plan and any applicable award agreement. ThePremium Option Plan provides for, among other things, mandatory premium pricing such that options cangenerally only be issued thereunder with a strike price at a minimum of 150% of the fair market value onthe date of grant, minimum 5-year cliff vesting (subject to waiver by the compensation committee of theBoard of Directors), and no discretionary repricing. The Premium Option Plan includes a dividendprotection feature that reduces the strike price for extraordinary dividends and a change in control featurethat reduces the strike price based on a pre-established formula in the event of a change in control. Otherterms are substantially similar to the 2001 Stock Incentive Plan.
Valuation Assumptions
The fair value of each stock option award is estimated on the date of grant using the Black-Scholes optionpricing model with the following weighted average-assumptions for all awards issued in each respectiveyear:
Option GrantsYear ended December 31, 2008 2007 2006
Expected Volatility 21% 21% 24%Expected Term (in years) 5 5 5Expected Dividend Yield 1.7% 1.7% 1.9%Risk-Free Interest Rate 2.5% 4.5% 4.7%
Expected Volatility: The expected volatility is estimated by the Company based on the Company’s historicalstock volatility.
Expected Term: The expected term is estimated by looking at historical experience of similar awards,giving consideration to the contractual terms of the award, vesting schedules and expectations of futureemployee behavior as influenced by changes to the terms of its stock option awards.
Expected Dividend Yield: The expected dividend yield is estimated by reviewing the most recent dividenddeclared by the Board of Directors.
Risk-Free Interest Rate: The risk free rate is estimated based on the yield on a U.S. Treasury zero-couponissue with a remaining term equal to the expected term of the stock option grants.
The fair value of restricted shares is determined based on the market value of the Company’s shares on thegrant date.
Under the fair value recognition provisions of FAS 123(R), the estimated fair value of employee stockoptions and other share-based payments, net of estimated forfeitures, is amortized as an expense over therequisite service period. When estimating forfeitures, the Company considers its historical forfeitures as wellas expectations about employee behavior. The Company currently uses an 8% forfeiture rate.
F-38
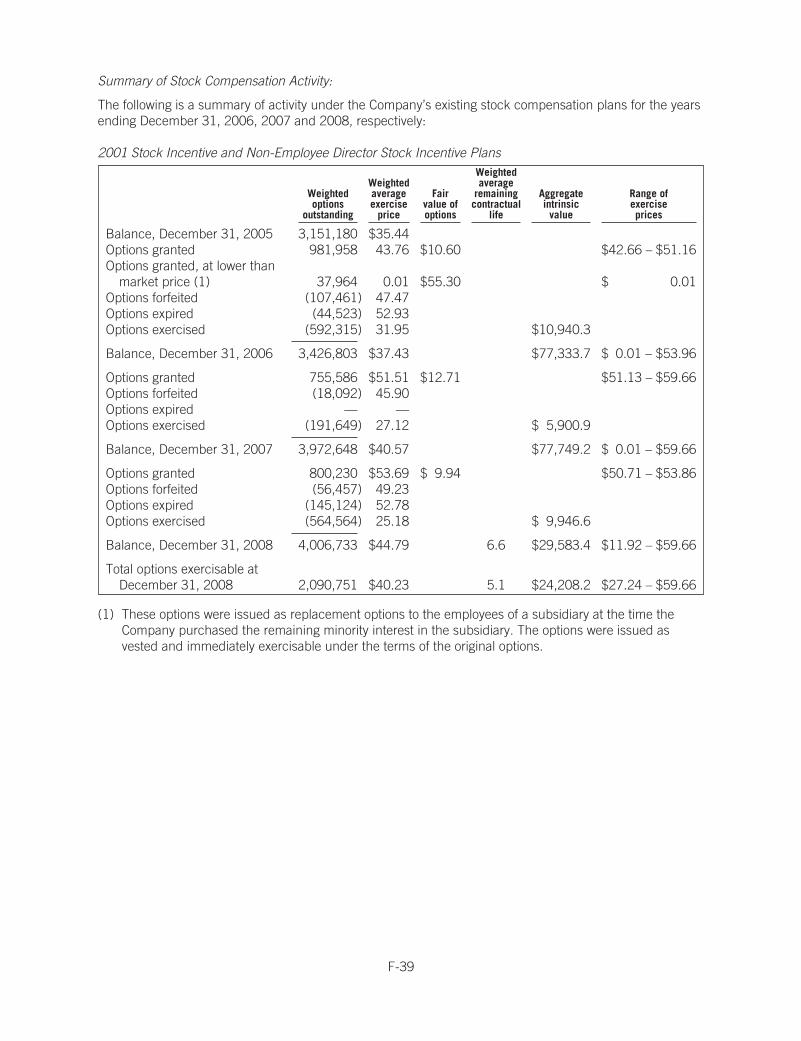
Summary of Stock Compensation Activity:
The following is a summary of activity under the Company’s existing stock compensation plans for the yearsending December 31, 2006, 2007 and 2008, respectively:
2001 Stock Incentive and Non-Employee Director Stock Incentive Plans
Weightedoptions
outstanding
Weightedaverageexercise
price
Fairvalue ofoptions
Weightedaverage
remainingcontractual
life
Aggregateintrinsic
value
Range ofexerciseprices
Balance, December 31, 2005 3,151,180 $35.44Options granted 981,958 43.76 $10.60 $42.66 – $51.16Options granted, at lower than
market price (1) 37,964 0.01 $55.30 $ 0.01Options forfeited (107,461) 47.47Options expired (44,523) 52.93Options exercised (592,315) 31.95 $10,940.3
Balance, December 31, 2006 3,426,803 $37.43 $77,333.7 $ 0.01 – $53.96
Options granted 755,586 $51.51 $12.71 $51.13 – $59.66Options forfeited (18,092) 45.90Options expired — —Options exercised (191,649) 27.12 $ 5,900.9
Balance, December 31, 2007 3,972,648 $40.57 $77,749.2 $ 0.01 – $59.66
Options granted 800,230 $53.69 $ 9.94 $50.71 – $53.86Options forfeited (56,457) 49.23Options expired (145,124) 52.78Options exercised (564,564) 25.18 $ 9,946.6
Balance, December 31, 2008 4,006,733 $44.79 6.6 $29,583.4 $11.92 – $59.66
Total options exercisable atDecember 31, 2008 2,090,751 $40.23 5.1 $24,208.2 $27.24 – $59.66
(1) These options were issued as replacement options to the employees of a subsidiary at the time theCompany purchased the remaining minority interest in the subsidiary. The options were issued asvested and immediately exercisable under the terms of the original options.
F-39

Premium Option Plan
Weightedoptions
outstanding
Weightedaverage
exercise price
Fairvalue ofoptions
Weightedaverage
remainingcontractual life
Aggregateintrinsic
value
Range ofexerciseprices
Balance, December 31, 2005 5,174,000 $80.15 $ —Options granted — —Options forfeited (1,400,000) 74.24Options expired — —Options exercised — —
Balance, December 31, 2006 3,774,000 $82.34 $ — $73.06 – $98.98
Options granted — $ —Options forfeited — —Options expired — —Options exercised — —
Balance, December 31, 2007 (1) 3,774,000 $82.34 $ — $73.06 – $98.98
Options granted — $ —Options forfeited — —Options expired — —Options exercised — —
Balance, December 31, 2008 (1) 3,774,000 $82.34 $ — $73.06 – $98.98Total options exercisable at
December 31, 2008 (1) 2,500,000 $86.61 5.7 $ — $74.24 – $98.98
(1) The Premium Option Plan was terminated at the August 2007 Board of Directors meeting andconsequently, the shares available for grant under the plan is zero.
Restricted Stock
Employeerestricted stock
Non-employee directorrestricted stock
Totalrestricted stock
Number ofshares
Weightedaverage
grant-datedfair value
Number ofshares
Weightedaverage
grant-datedfair value
Number ofshares
Weightedaverage
grant-datedfair value
Nonvested at December 31, 2005 631,592 $44.90 27,523 $48.43 659,115 $45.05
Awards granted 502,234 $44.88 24,625 $44.67 526,859 $44.87Awards vested (207,905) 44.65 (13,157) 48.12 (221,062) 44.86Awards canceled/expired/forfeited (37,165) 46.14 — — (37,165) 46.14
Nonvested at December 31, 2006 888,756 $44.90 38,991 $46.16 927,747 $44.95
Awards granted 307,251 $51.80 23,183 $51.75 330,434 $51.79Awards vested (315,916) 45.55 (16,971) 47.14 (332,887) 45.63Awards canceled/expired/forfeited (16,959) 44.98 — — (16,959) 44.98
Nonvested at December 31, 2007 863,132 $47.11 45,203 $48.65 908,335 $47.19
Awards granted 437,250 $51.19 23,585 $53.00 460,835 $51.28Awards vested (358,745) 46.62 (30,479) 48.65 (389,224) 46.78Awards canceled/expired/forfeited (42,346) 49.61 — — (42,346) 49.61
Nonvested at December 31, 2008 899,291 $49.17 38,309 $51.33 937,600 $49.26
Shares available for issuance under the Company’s 2001 Stock Incentive Plan and Non-Employee DirectorStock Incentive Plan totaled 2.0 million at December 31, 2008. The total fair value of shares vested duringthe year ended December 31, 2008 was $19.8 million (2007 – $17.4 million, 2006 – $10.5 million). Cashin the amount of $3.0 million was received from employees as a result of employee stock option exercises
F-40

during the year ended December 31, 2008 (2007 – $0.5 million, 2006 – $0.5 million). In connection withthese exercises there was no tax benefit realized by the Company. The Company issues new shares uponthe exercise of an option.
As of December 31, 2008, there was $30.7 million of total unrecognized compensation cost related torestricted shares and $13.9 million related to stock options expense which will be recognized duringthe next 2.4 years.
All of the Company’s employees are eligible for defined contribution pension plans. Contributions areprimarily based upon a percentage of eligible compensation. The Company contributed $2.3 million to itsdefined contribution pension plans in 2008 (2007 – $1.7 million, 2006 – $1.7 million).
NOTE 21. STATUTORY REQUIREMENTS
Under the Insurance Act 1978, amendments thereto and Related Regulations of Bermuda (“the Act”),certain subsidiaries of the Company are required to prepare statutory financial statements and to file inBermuda a statutory financial return. The Act also requires these subsidiaries of the Company to maintaincertain measures of solvency and liquidity. At December 31, 2008, the statutory capital and surplus of theBermuda subsidiaries was $3.2 billion (2007 – $3.3 billion) and the amount required to be maintainedunder Bermuda law was $525.5 million (2007 – $578.3 million).
Under the Act, Renaissance Reinsurance and DaVinci are classified as Class 4 insurers, and are thereforerestricted as to the payment of dividends in the amount of 25% of the prior year’s statutory capital andsurplus, unless at least two members of the Board of Directors attest that a dividend in excess of thisamount would not cause the company to fail to meet its relevant margins. During 2008, RenaissanceReinsurance and DaVinci declared aggregate cash dividends of $238.1 million (2007 – $547.8 million) and$6.9 million (2007 – $28.1 million).
Under the Act, Glencoe is classified as a Class 3 insurer and Glencoe is also eligible as an excess andsurplus lines insurer in a number of states in the U.S. Under the various capital and surplus requirementsin Bermuda and in these states, Glencoe is required to maintain a minimum amount of capital and surplus.In this regard, the declaration of dividends from retained earnings and distributions from additional paid-incapital are limited to the extent that the above requirement is met. During 2008, Glencoe declaredaggregate cash dividends of $40.0 million (2007 – $nil).
In 2008, new statutory legislation was enacted in Bermuda, which included, among other things, theBermuda Solvency Capital Requirement (“BSCR”) which is a standard mathematical model designed togive the BMA more advanced methods for determining an insurer’s capital adequacy. Underlying the BSCRis the belief that all insurers should operate on an ongoing basis with a view to maintaining their capital at aprudent level in excess of the minimum solvency margin otherwise prescribed under the Insurance Act.Effective December 31 2008, the BMA will require all Class 4 insurers to maintain their capital at a targetlevel which is set at 120% of the minimum amount calculated in accordance with the BSCR or an approvedin-house model. The Company is currently completing the 2008 BSCR for its Class 4 insurers, RenaissanceReinsurance and DaVinci, and at this time believes both companies will exceed the target level of capital.
The Company’s principal U.S. insurance subsidiary Stonington is also required to maintain certainmeasures of solvency and liquidity. Restrictions with respect to dividends are based on state statutes. Inaddition, there are restrictions based on risk based capital tests which is the threshold that constitutes theauthorized control level. If Stonington’s statutory capital and surplus falls below the authorized control level,the commissioner is authorized to take whatever regulatory actions are considered necessary to protectpolicyholders and creditors. At December 31, 2008, the consolidated statutory capital and surplus ofStonington was $128.6 million (2007 – $124.8 million). Because of an accumulated deficit in earnedsurplus from prior operations, Stonington cannot currently pay an ordinary dividend without commissionerapproval.
F-41

The differences between statutory basis financial statements and financial statements prepared inaccordance with U.S. GAAP vary between domestic and foreign jurisdictions. The principal differences inBermuda are that statutory financial statements do not reflect deferred acquisition costs, prepaid assets, orfixed assets. Also, reinsurance assets and liabilities are presented net of retrocessional reinsurance andthere is no cash flow statement. The principal differences in the United States are that statutory financialstatements do not reflect deferred acquisition costs, bonds are carried at amortized cost, deferred incometax is charged or credited directly to equity, subject to limitations, and reinsurance assets and liabilities arepresented net of retrocessional reinsurance. The Company has not used any statutory accounting practicesthat are not prescribed.
NOTE 22. DERIVATIVE INSTRUMENTS
Under FAS 133, companies are required to recognize all derivative instruments as either assets or liabilitieson its balance sheet at fair value. The accounting for changes in fair value (i.e. gains or losses) of aderivative instrument depends on whether it has been designated and qualifies as part of a hedgingrelationship. The Company does not hold any derivatives designated as hedging instruments under FAS133.
The Company’s guidelines permit, subject to approval, investments in derivative instruments such asfutures, forward contracts, options, swap agreements and other derivative contracts which may be used toassume risk or for hedging purposes. The Company principally has exposure to derivatives related to thefollowing types of risks: interest rate risk; foreign currency risk; credit risk and energy and weather-relatedrisk.
Interest Rate Futures
The Company uses interest rate futures within its portfolio of fixed maturity investments available for sale tomanage its exposure to interest rate risk, which can include increasing or decreasing its exposure to thisrisk. At December 31, 2008, the Company had $1.6 billion of notional long positions and $134.0 million ofnotional short positions of Eurodollar, U.S. Treasury and non-U.S. dollar futures contracts. The fair value ofthese derivatives as recognized in other assets and liabilities in its consolidated balance sheet atDecember 31, 2008, was $0.1 million (2007 – $0.3 million) and $0.1 million (2007 – $0.3 million),respectively. During 2008, the Company recorded gains of $12.4 million (2007 – losses of $1.9 million) inits consolidated statement of operations related to these derivatives. The fair value of these derivatives isdetermined using exchange traded closing prices.
Foreign Currency Derivatives
The Company’s functional currency is the U.S. dollar. The Company writes a portion of its business incurrencies other than U.S. dollars and may, from time to time, experience foreign exchange gains andlosses and incur underwriting losses in currencies other than U.S. dollars, which will in turn affect theCompany’s consolidated financial statements. All changes in exchange rates, with the exception of non-U.S.dollar denominated investments classified as available for sale, are recognized currently in the Company’sconsolidated statements of operations.
Underwriting Related Foreign Currency Contracts
The Company’s foreign currency policy with regard to its underwriting operations is generally to hold foreigncurrency assets, including cash, investments and receivables that approximate the foreign currencyliabilities, including claims and claim expense reserves and reinsurance balances payable. Whennecessary, the Company will use foreign currency forward and option contracts to minimize the effect offluctuating foreign currencies on the value of non-U.S. dollar denominated assets and liabilities associatedwith its underwriting operations. At December 31, 2008, the total notional amount in United States dollarsof the Company’s underwriting related foreign currency contracts was $133.0 million (2007 – $222.5million). For the year ended December 31, 2008, the company incurred a loss of $21.4 million (2007 –gain of $3.6 million) on its foreign currency forward and option contracts related to its underwritingoperations.
F-42

Investment Portfolio Related Foreign Currency Forward Contracts
The Company’s investment operations are exposed to currency fluctuations through its investments innon-U.S. dollar fixed maturity investments, short term investments and other investments. To economicallyhedge its exposure to currency fluctuations from these investments, the Company has entered into foreigncurrency forward contracts. Foreign exchange gains (losses) associated with the Company’s hedging ofthese non-U.S. dollar investments are recorded in net foreign exchange gains (losses) in its consolidatedstatements of operations. As at December 31, 2008, the Company had outstanding investment portfoliorelated foreign currency contracts of $207.0 million in short positions and $103.4 million in long positions,denominated in U.S. dollars. For the year ended December 31, 2008, the Company recorded a gain of $5.8million (2007 – loss of $15.1 million, 2006 – loss of $13.1 million) related to its foreign currency forwardcontracts entered into to economically hedge the Company’s non-U.S. dollar investments.
Credit Derivatives
The Company’s exposure to credit risk is primarily due to its fixed maturity investments available for sale,short term investments, premiums receivable and ceded reinsurance balances. From time to time, theCompany purchases credit derivatives to hedge its exposures in the insurance industry and to assist inmanaging the credit risk associated with ceded reinsurance. The fair value of the credit derivatives aredetermined using industry valuation models. The fair value of these credit derivatives can change based ona variety of factors including changes in credit spreads, default rates and recovery rates, the correlation ofcredit risk between the referenced credit and the counterparty, and market rate inputs such as interestrates. The fair value of these credit derivatives, as recognized in other liabilities in the Company’s balancesheet, at December 31, 2008 was $0.9 million (2007 – $0.1 million). During 2008, the Company recordedgains of $1.1 million (2007 – gains of $0.5 million, 2006 – loss of $0.6 million), which are included in otherincome (loss) and represents net settlements and changes in the fair value of these credit derivatives.
Energy and Weather-Related Derivatives
The Company sells certain derivative financial products primarily to address weather risks and engages inhedging and trading activities related to these risks. The trading markets for these derivatives is linked toenergy, commodities, weather, other natural phenomena, or products or indices linked in part to suchphenomena, such as heating and cooling degree days, precipitation, energy production and prices, andcommodities. The fair value of these contracts is obtained through the use of quoted market prices, or inthe absence of such quoted prices, industry or internal valuation models. These contracts are recorded onthe Company’s balance sheet in other assets and other liabilities and totaled $41.7 million and $38.8million, respectively (2007 – $15.9 million and $21.1 million, respectively). During 2008, the Companygenerated income related to these derivatives of $33.7 million (2007 – incurred losses of $1.1 million, 2006– incurred losses of $2.2 million) which are included in other income (loss) and represents net settlementsand changes in the fair value of these contracts.
Platinum Warrant
The Company holds a warrant to purchase up to 2.5 million common shares of Platinum UnderwritersHolding Ltd. (“Platinum”) for $27.00 per share. The Company has recorded its investment in the Platinumwarrant at fair value. At December 31, 2008, the fair value of the warrant was $29.9 million (2007 – $30.5million). The fair value of the warrant is estimated using the Black-Scholes option pricing model. For theyear ended December 31, 2008, a loss of $0.5 million (2007 – income of $5.5 million, 2006 – loss of $1.7million) was recorded in other income (loss) representing the change in the fair value of the warrant.
F-43

The table below shows the location on the consolidated balance sheet and fair value of the Company’sderivative instruments:
Derivative Assets Derivative Liabilities
At December 31, 2008 2007 2008 2007BalanceSheet
LocationFair
Value
BalanceSheet
LocationFair
ValueBalance Sheet
LocationFair
ValueBalance Sheet
LocationFair
Value
Interest rate futures Other assets $ 96 Other assets $ 300 Other liabilities $ 148 Other liabilities $ 300Foreign currency forward
contracts * Other assets — Other assets — Other liabilities 26,428 Other liabilities 652Foreign currency forward
contracts ** Other assets — Other assets 2,747 Other liabilities 2,955 Other liabilities 1,476Credit default swaps Other assets — Other assets — Other liabilities 854 Other liabilities 94Energy and weather contracts Other assets 41,668 Other assets 15,914 Other liabilities 38,819 Other liabilities 21,057Platinum warrant Other assets 29,913 Other assets 30,452 Other liabilities — Other liabilities —
Total $71,677 $49,413 $69,204 $23,579
* Contracts used to manage foreign currency risks in underwriting and non-investment operations.** Contracts used to manage foreign currency risks in investment operations.
The location and amount of the gain (loss) recognized in the Company’s consolidated statement ofoperations related to its derivative instruments is shown in the following table:
Year ended December 31,
Location ofgain (loss)
recognized onderivatives
Amount ofgain (loss)
recognized onderivatives
2008 2007
Interest rate futures Net investment income $ 12,391 $ (1,888)Foreign currency forward contracts * Net foreign exchange gains (21,366) 3,611Foreign currency forward contracts ** Net foreign exchange gains 5,784 (15,132)Credit default swaps Other income (loss) 1,148 506Energy and weather contracts Other income (loss) 33,681 (1,112)Platinum warrant Other income (loss) (538) 5,468
Total $ 31,100 $ (8,547)
* Contracts used to manage foreign currency risks in underwriting and non-investment operations.** Contracts used to manage foreign currency risks in investment operations.
The Company is not aware of the existence of any credit-risk related contingent features that could betriggered in its derivative instruments that are in a net liability position at December 31, 2008.
NOTE 23. COMMITMENTS AND CONTINGENCIES
CONCENTRATION OF CREDIT RISK
Financial instruments which potentially subject the Company to concentration of credit risk consistprincipally of investments, including the Company’s equity method investments, cash and reinsurancebalances. The Company limits the amount of credit exposure to any one financial institution and, except forU.S. Government securities, none of the Company’s investments exceeded 10% of shareholders’ equity atDecember 31, 2008. See “Note 7. Ceded Reinsurance”, for information with respect to losses recoverable.
EMPLOYMENT AGREEMENTS
The Board of Directors has authorized the execution of employment agreements between the Company andcertain officers. These agreements provide for, among other things, severance payments under certaincircumstances, as well as accelerated vesting of options and restricted stock grants, upon a change incontrol, as defined therein and by the Company’s 2001 Stock Incentive Plan and Premium Option Plan.
F-44

LETTERS OF CREDIT AND OTHER COMMITMENTS
At December 31, 2008, the Company’s banks have issued letters of credit of approximately $998.9 millionin favor of certain ceding companies. In connection with the Company’s Top Layer Re joint venture, theCompany has committed $37.5 million of collateral to support a letter of credit and is obligated to make amandatory capital contribution of up to $50.0 million in the event that a loss reduces Top Layer Re’s capitaland surplus below a specified level. The letters of credit are secured by cash and investments of similaramounts. The Company’s principal letter of credit facility contains certain financial covenants.
At December 31, 2008, the Company provided $105.1 million of guarantees to support the weather andenergy trading operations of Renaissance Trading Ltd.
PRIVATE EQUITY AND INVESTMENT FUND COMMITMENTS
We have committed capital to private equity partnerships and a bank loan fund of $586.7 million, of which$239.1 million has not yet been contributed at December 31, 2008. These commitments do not have adefined contractual commitment date.
REVERSE REPURCHASE OBLIGATION
At December 31, 2008, included in other liabilities on the Company’s consolidated balance sheet is $50.1million related to a reverse repurchase obligation whereby the Company transferred certain fixed maturityinvestments available for sale in exchange for cash and simultaneously agreed to reacquire these securitiesat an amount equal to the cash received plus an interest payment. The $50.1 million was settled in January2009.
INDEMNIFICATIONS AND WARRANTIES
In the ordinary course of its business, the Company may enter into contracts or agreements that containindemnifications or warranties. Future events could occur that lead to the execution of these provisionsagainst the Company. Based on past experience, management currently believes that the likelihood of suchan event is remote.
OPERATING LEASES
The Company and its subsidiaries lease office space under operating leases which expire at various datesthrough 2019. Future minimum lease payments under existing operating leases are expected to be asfollows:
Year ended December 31, Minimum lease payments
2009 $ 6,7822010 6,5052011 6,1002012 5,5262013 5,516After 2013 14,294
$44,723
CAPITAL LEASES
During the fourth quarter of 2007, the Company entered into a capital lease transaction, committing theCompany to lease additional office space in Bermuda. Upon completion of construction of the building inJuly 2008, the Company commenced making lease payments. The initial lease term is for 20 years, with abargain renewal option for an additional 30 years.
F-45

The future minimum lease payments detailed below, relate principally to the transaction noted above,excluding the bargain renewal option, and are estimated to be $50.3 million in the aggregate.
Year ended December 31, Minimum lease payments
2009 $ 2,8932010 2,6952011 2,4172012 2,4172013 2,417After 2013 37,450
$50,289
LITIGATION
As previously disclosed, the Company received a subpoena from the SEC in February 2005, a subpoenafrom the Office of the Attorney General of the State of New York (the “NYAG”) in March 2005, and asubpoena from the United States Attorney’s Office for the Southern District of New York in June 2005, eachof which related to industry-wide investigations into non-traditional, or loss mitigation, (re)insuranceproducts.
On February 6, 2007, the Company announced that the SEC had accepted its offer of settlement to the SECto resolve the SEC’s investigation. The settlement was approved by the United States District Court for theSouthern District of New York pursuant to a final judgment entered on March 20, 2007 and the Companyhas made payment on all financial penalties agreed to under the settlement. Pursuant to the settlement, theCompany was also obliged to retain an independent consultant to review certain of its internal controls,policies and procedures as well as the design and implementation of the review conducted by independentcounsel reporting to the non-executive members of the Board of Directors and certain additional proceduresperformed by the Company’s auditors in connection with their audit of the Company’s financial statementsfor the fiscal year ended December 31, 2004. While the Company continues to strive to fully comply withthe terms of the settlement agreement with the SEC, it is possible it will fail to do so, or that the enforcementstaff of the SEC and/or the independent consultant may take issue with the Company’s cooperation despiteits efforts. Any such failure to comply with the settlement agreement or any such perception that theCompany has failed to comply could adversely affect it, perhaps materially so.
As previously disclosed, in September 2006, the SEC filed an enforcement action in the United StatesDistrict Court for the Southern District of New York (the “Court”) against certain of the Company’s formerofficers, including James N. Stanard, the Company’s former Chairman and Chief Executive Officer, chargingsuch individuals with violations of federal securities laws, including securities fraud, and seeking permanentinjunctive relief, disgorgement of ill-gotten gains, if any, plus prejudgment interest, civil money penalties,and orders barring each defendant from acting as an officer or director of any public company. The civillitigation between the SEC and Mr. Stanard, to which the Company was not a party, went to trial inSeptember 2008. On January 27, 2009, the Court issued an opinion and order finding Mr. Stanard liable forsecurities fraud and other violations of Federal securities laws. The Court permanently enjoined Mr. Stanardfrom future securities violations and ordered Mr. Stanard to pay a $100 thousand civil penalty. The Courtdenied the SEC’s request for an order barring Mr. Stanard from serving as an officer or director of a publiccompany. The ongoing matter, including whether or not an appeal is taken, could give rise to additionalcosts, distractions, or impacts to the Company’s reputation.
The Company’s operating subsidiaries are subject to claims litigation involving disputed interpretations ofpolicy coverages. Generally, the Company’s primary insurance operations are subject to greater frequencyand diversity of claims and claims-related litigation and, in some jurisdictions, may be subject to directactions by allegedly injured persons or entities seeking damages from policyholders. These lawsuits,involving claims on policies issued by the Company’s subsidiaries which are typical to the insuranceindustry in general and in the normal course of business, are considered in its loss and loss expensereserves which are discussed in its loss reserves discussion. In addition to claims litigation, the Company
F-46

and its subsidiaries are subject to lawsuits and regulatory actions in the normal course of business that donot arise from or directly relate to claims on insurance policies. This category of business litigation mayinvolve allegations of underwriting or claims-handling errors or misconduct, employment claims, regulatoryactivity or disputes arising from the Company’s business ventures. Any such litigation or arbitration containsan element of uncertainty, and the Company believes the inherent uncertainty in such matters may haveincreased recently and will likely continue to increase. Currently, the Company believes that no individual,normal course litigation or arbitration to which it is presently a party is likely to have a material adverseeffect on its financial condition, business or operations.
NOTE 24. QUARTERLY FINANCIAL RESULTS (UNAUDITED)
Quarter EndedMarch 31,
Quarter EndedJune 30,
Quarter EndedSeptember 30,
Quarter EndedDecember 31,
2008 2007 2008 2007 2008 2007 2008 2007
Gross premiums written $527,038 $632,729 $807,575 $845,860 $ 239,806 $208,821 $161,609 $ 122,227
Net premiums written $403,116 $571,027 $614,022 $609,842 $ 194,408 $149,163 $142,074 $ 105,303
Net premiums earned 308,914 362,618 $376,573 $358,454 $ 379,342 $367,057 $321,995 $ 336,240Net investment income (loss) 52,503 108,015 38,685 118,140 15,767 95,594 (82,724) 80,714Net foreign exchange gains (losses) 4,936 5,167 (231) (373) 3,448 (5,424) (5,553) 4,598Equity in earnings (losses) of other
ventures 6,250 10,701 4,872 9,675 2,333 (23,986) 148 (124,999)Other income (loss) 8,012 (2,203) (24) (5,498) 2,258 (10,008) 6 (20,221)Net realized (losses) gains on
investments (10,670) 4,085 (24,161) (11,566) (87,610) 1,592 (83,873) 7,182
Total revenues 369,945 488,383 395,714 468,832 315,538 424,825 149,999 283,514
Net claims and claim expensesincurred 82,156 145,992 114,217 138,854 535,347 131,700 28,769 62,728
Acquisition costs 46,428 63,729 53,613 59,509 54,231 63,719 59,281 67,973Operational expenses 30,113 28,524 33,494 26,527 30,296 27,126 28,262 28,287Corporate expenses 8,703 7,004 7,111 4,927 3,116 7,158 6,705 9,771Interest expense 6,804 11,979 5,937 7,195 5,379 7,226 6,513 7,226
Total expenses 174,204 257,228 214,372 237,012 628,369 236,929 129,530 175,985
Income (loss) before minority interestand taxes 195,741 231,155 181,342 231,820 (312,831) 187,896 20,469 107,529
Minority interest – DaVinciRe (40,315) (29,107) (41,341) (37,399) 91,977 (43,820) (65,454) (54,070)
Income (loss) before taxes 155,426 202,048 140,001 194,421 (220,854) 144,076 (44,985) 53,459Income tax (expense) benefit (7,686) (107) 6,295 (680) 455 (101) 368 19,320
Net income (loss) 147,740 201,941 146,296 193,741 (220,399) 143,975 (44,617) 72,779Dividends on preference shares (10,575) (11,136) (10,575) (10,575) (10,575) (10,575) (10,575) (10,575)
Net income (loss) available(attributable) to commonshareholders $137,165 $190,805 $135,721 $183,166 $(230,974) $133,400 $ (55,192) $ 62,204
Earnings (loss) per common share –basic $ 2.09 $ 2.68 $ 2.16 $ 2.57 $ (3.79) $ 1.89 $ (0.91) $ 0.90
Earnings (loss) per common share –diluted (1) $ 2.05 $ 2.63 $ 2.13 $ 2.53 $ (3.79) $ 1.85 $ (0.91) $ 0.88
Weighted average shares – basic 65,528 71,281 62,921 71,259 60,943 70,575 60,732 68,966Weighted average shares – diluted (1) 66,803 72,514 63,878 72,430 61,694 71,945 61,269 70,413
Claims and claim expense ratio 26.6% 40.2% 30.3% 38.7% 141.1% 35.9% 8.9% 18.7%Underwriting expense ratio 24.8% 25.4% 23.2% 24.0% 22.3% 24.7% 27.2% 28.6%
Combined ratio 51.4% 65.6% 53.5% 62.7% 163.4% 60.6% 36.1% 47.3%
(1) In accordance with FAS 128, diluted earnings per share calculations use average common shares outstanding – basic, when in anet loss position.
F-47

NOTE 25. SUMMARIZED FINANCIAL INFORMATION OF CHANNELRE HOLDINGS LTD.
The following tables provide summarized financial information for ChannelRe, which is accounted for usingthe equity method of accounting, for 2008, 2007 and 2006. The Company calculates its proportionateshare in the equity of ChannelRe one quarter in arrears, except for 2007, which includes ChannelRe’sestimated loss for the fourth quarter of 2007 due to significant net unrealized mark-to-market losses oncredit derivatives and other credit-related products issued by ChannelRe. The summary informationprovided below is for the twelve months ended September 30, 2008, 2007 and 2006, respectively.
As at September 30, 2008 2007 2006
Balance Sheet DataFixed maturity securities, at fair value $ 586,736 $463,250 $519,857Short term investments, at fair value 104,036 174,640 104,532
Total investments 690,772 637,890 624,389Cash and cash equivalents 8,404 18,990 10,052Deferred acquisition costs 31,692 36,994 41,013Derivative assets 86,000 20,000 183Other assets 9,049 10,458 8,330
Total assets $ 825,917 $724,332 $683,967
Deferred premium revenue $ 123,187 $144,478 $160,162Loss and loss adjustment expenses reserves 41,172 28,245 19,317Derivative liabilities 743,167 115,443 4,821Other liabilities 8,620 6,840 7,690
Total liabilities 916,146 295,006 191,990
Minority interest (25,179) 119,815 137,301Deficiency in assets / shareholders’ equity (65,050) 309,511 354,676
Total liabilities, minority interest and shareholders’ equity $ 825,917 $724,332 $683,967
Twelve months ended September 30, 2008 2007 2006
Statement of Operations Data
Premiums earned $ 47,904 $ 45,354 $ 56,153Net investment income 30,246 29,430 24,108
Total revenues 78,150 74,784 80,261
Losses incurred 27,508 11,638 6,945Acquisition costs 12,163 12,362 14,833Other expenses 2,868 4,529 8,013
Total expenses 42,539 28,529 29,791
Realized gains and other settlements on derivatives 18,461 14,493 9,425Unrealized losses on derivatives (560,674) (91,003) (688)
Net change in fair value of derivatives (542,213) (76,510) 8,737Net realized gains (losses) on investments 1 (239) (887)Net gains on foreign exchange 1,271 1,680 93
Net realized and unrealized (losses) gains (540,941) (75,069) 7,943
Minority interest 141,024 8,043 (16,303)
Net (loss) income (attributable) available to common shareholders $(364,306) $ (20,771) $ 42,110
ChannelRe experienced significant unrealized mark-to-market losses arising from financial guarantycontracts accounted for as derivatives under GAAP during 2007, and as a result, ChannelRe’s GAAPshareholders’ equity decreased to below $nil as of December 31, 2007 and remained negative throughout2008. As such, the Company reduced the carried value of its equity investment in ChannelRe to $nil as ofDecember 31, 2007.
Certain amounts have been reclassified in the prior years’ financial information, noted above, to conform tothe current presentation.
F-48

RENAISSANCERE HOLDINGS LTD. AND SUBSIDIARIES
INDEX TO SCHEDULES TO CONSOLIDATED FINANCIAL STATEMENTS
Pages
Report of Independent Registered Public Accounting Firm on Schedules . . . . . . . . . . . . . . . . . . . . . . S-2
I Summary of Investments other than Investments in Related Parties . . . . . . . . . . . . . . . . . . S-3
II Condensed Financial Information of Registrant . . . . . . . . . . . . . . . . . . . . . . . . . . . . . . . . . . S-4
III Supplementary Insurance Information . . . . . . . . . . . . . . . . . . . . . . . . . . . . . . . . . . . . . . . . . S-7
IV Reinsurance . . . . . . . . . . . . . . . . . . . . . . . . . . . . . . . . . . . . . . . . . . . . . . . . . . . . . . . . . . . . . S-8
VI Supplementary Insurance Information Concerning Property-Casualty InsuranceOperations . . . . . . . . . . . . . . . . . . . . . . . . . . . . . . . . . . . . . . . . . . . . . . . . . . . . . . . . . . . . . S-9
Schedules other than those listed above are omitted for the reason that they are not applicable.
S-1

REPORT OF INDEPENDENT REGISTERED PUBLIC ACCOUNTING FIRM
To the Board of Directors and Shareholders of RenaissanceRe Holdings Ltd.
We have audited the consolidated financial statements of RenaissanceRe Holdings Ltd. and Subsidiaries asof December 31, 2008 and 2007, and for each of the three years in the period ended December 31, 2008,and have issued our report thereon dated February 19, 2009; such financial statements and our reportthereon are included elsewhere in this Annual Report on Form 10-K. Our audits also included the financialstatement schedules listed in Item 15(a) (2) of this Annual Report on Form 10-K for the year endedDecember 31, 2008. These schedules are the responsibility of the Company’s management. Ourresponsibility is to express an opinion based on our audits.
In our opinion, the financial statement schedules referred to above, when considered in relation to the basicfinancial statements taken as a whole, present fairly in all material respects the information set forth therein.
/s/ Ernst & Young Ltd.
Hamilton, BermudaFebruary 19, 2009
S-2

SCHEDULE I
RENAISSANCERE HOLDINGS LTD. AND SUBSIDIARIES
SUMMARY OF INVESTMENTSOTHER THAN INVESTMENTS IN RELATED PARTIES
(MILLIONS OF UNITED STATES DOLLARS)
Year ended December 31, 2008
AmortizedCost
MarketValue
Amount atwhich shown
in theBalance Sheet
Type of investment:
Fixed maturity investments available for saleU.S. treasuries $ 462.5 $ 467.5 $ 467.5Agencies 431.5 448.5 448.5Non-U.S. government bonds 53.6 57.1 57.1Corporate securities 719.2 747.2 747.2Mortgage-backed securities 1,084.2 1,110.6 1,110.6Asset-backed securities 166.0 166.0 166.0
Total fixed maturity investments available for sale 2,917.0 2,996.9 2,996.9
Short term investments 2,172.3 2,172.3 2,172.3Other investments 773.5 773.5 773.5Investments in other ventures, under equity method 99.9 99.9 99.9
Total investments $5,962.7 $6,042.6 $6,042.6
S-3

SCHEDULE II
RENAISSANCERE HOLDINGS LTD.CONDENSED FINANCIAL INFORMATION OF REGISTRANT
RENAISSANCERE HOLDINGS LTD.BALANCE SHEETS
AT DECEMBER 31, 2008 AND 2007(PARENT COMPANY)
(THOUSANDS OF UNITED STATES DOLLARS)
At December 31,2008 2007
Assets:Investments and cash
Fixed maturity investments, available for sale, at fair value $ 62,536 $ 60,920Short term investments, at fair value 236,133 377,619Other investments 8,880 —
Total investments 307,549 438,539Cash and cash equivalents 5,122 9,290Investments in subsidiaries 3,059,524 3,049,933Due from subsidiaries 18,123 156,500Accrued investment income 1,214 2,134Other assets 13,745 94,415
Total Assets $ 3,405,277 $3,750,811
Liabilities and Shareholders’ Equity:Liabilities:Notes and bank loans payable $ 250,000 $ 250,000Contributions due to subsidiaries 86,262 275Other liabilities 36,272 23,033
Total Liabilities 372,534 273,308
Shareholders’ Equity:Preference Shares: $1.00 par value – 26,000,000 shares issued and
outstanding at December 31, 2008 (2007 – 26,000,000) 650,000 650,000Common Shares: $1.00 par value – 61,503,333 shares issued and
outstanding at December 31, 2008 (2007 – 68,920,319 shares) 61,503 68,920Additional paid-in capital — 107,867Accumulated other comprehensive income 75,387 44,719Retained earnings 2,245,853 2,605,997
Total Shareholders’ Equity 3,032,743 3,477,503
Total Liabilities and Shareholders’ Equity $ 3,405,277 $3,750,811
S-4

SCHEDULE II
RENAISSANCERE HOLDINGS LTD.CONDENSED FINANCIAL INFORMATION OF REGISTRANT — CONTINUED
RENAISSANCERE HOLDINGS LTD.STATEMENTS OF OPERATIONS
FOR THE YEARS ENDED DECEMBER 31, 2008, 2007 AND 2006(PARENT COMPANY)
(THOUSANDS OF UNITED STATES DOLLARS)
Year ended December 31,2008 2007 2006
RevenuesNet investment (loss) income $ (1,745) $ 23,770 $ 16,455Net foreign exchange loss (38) — —Net realized losses on investments (3,877) (182) —Other (loss) income (4,634) (145,596) 17,997
Total revenues (10,294) (122,008) 34,452
ExpensesInterest expense 14,613 21,193 28,767Operating and corporate expenses 12,152 18,420 37,890
Total expenses 26,765 39,613 66,657
Loss before equity in net income of subsidiaries & taxes (37,059) (161,621) (32,205)Equity in net income of subsidiaries 66,079 774,057 829,315
Net income before taxes 29,020 612,436 797,110Income tax expense — — —
Net income 29,020 612,436 797,110Dividends on preference shares (42,300) (42,861) (35,475)
Net (loss) income (attributable) available to common shareholders $(13,280) $ 569,575 $761,635
S-5

SCHEDULE II
RENAISSANCERE HOLDINGS LTD.CONDENSED FINANCIAL INFORMATION OF REGISTRANT — CONTINUED
RENAISSANCERE HOLDINGS LTD.STATEMENTS OF CASH FLOWS
FOR THE YEARS ENDED DECEMBER 31, 2008, 2007 AND 2006(PARENT COMPANY)
(THOUSANDS OF UNITED STATES DOLLARS)Year ended December 31,
2008 2007 2006
Cash flows provided by (used in) operating activities:Net income $ 29,020 $ 612,436 $ 797,110Less: equity in net income of subsidiaries 66,079 774,057 829,315
(37,059) (161,621) (32,205)Adjustments to reconcile net income to net cash provided by
(used in) operating activitiesNet unrealized losses included in net investment income 17,020 — —Net unrealized losses (gains) included in other income 3,866 (5,780) 1,687Equity in undistributed losses (earnings) of other ventures — 151,751 (19,097)Net realized losses 3,877 182 —Other 51,839 11,096 11,291
Net cash provided by (used in) operating activities 39,543 (4,372) (38,324)
Cash flows provided by (used in) investing activities:Proceeds from maturities and sales of investments available
for sale 511,628 15,370 —Purchase of investments available for sale (494,683) (59,733) —Contributions to subsidiaries (233,560) (63,489) (93,312)Dividends from subsidiaries 403,948 547,785 406,010Net sales (purchases) of short term investments 141,486 169,273 (190,480)Net (purchases) sales of other investments (25,900) 3,093 —Purchase of investments in other ventures — 12,262 —Due from subsidiary 138,377 (24,140) (132,360)
Net cash provided by (used in) investing activities 441,296 600,421 (10,142)
Cash flows (used in) provided by financing activities:Dividends paid – common shares (57,850) (62,595) (60,413)Dividends paid – preference shares (42,300) (42,861) (34,650)RenaissanceRe common share repurchase (428,406) (200,171) —Redemption of 7.0% Senior Notes (150,000) — —Redemption of Series A preference shares — (150,000) —Repayment of debt — — (150,000)Issuance of debt 150,000 — —Repayment of subordinated obligation to Capital Trust — (103,093) —Issuance of Preference Shares, net of expenses — — 291,127Third party DaVinciRe share repurchase 43,549 (40,000) —
Net cash (used in) provided by financing activities (485,007) (598,720) 46,064
Net decrease in cash and cash equivalents (4,168) (2.671) (2,402)Cash and cash equivalents, beginning of year 9,290 11,961 14,363
Cash and cash equivalents, end of year $ 5,122 $ 9,290 $ 11,961
S-6
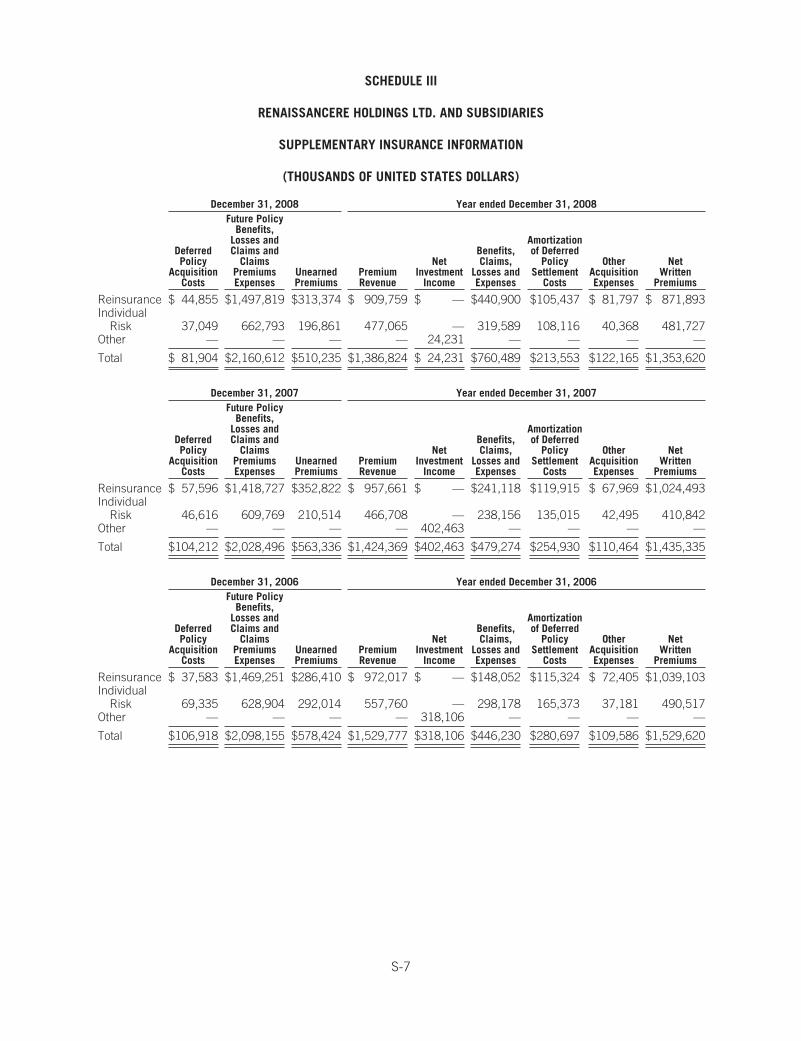
SCHEDULE III
RENAISSANCERE HOLDINGS LTD. AND SUBSIDIARIES
SUPPLEMENTARY INSURANCE INFORMATION
(THOUSANDS OF UNITED STATES DOLLARS)
December 31, 2008 Year ended December 31, 2008
DeferredPolicy
AcquisitionCosts
Future PolicyBenefits,
Losses andClaims and
ClaimsPremiumsExpenses
UnearnedPremiums
PremiumRevenue
NetInvestment
Income
Benefits,Claims,
Losses andExpenses
Amortizationof Deferred
PolicySettlement
Costs
OtherAcquisitionExpenses
NetWritten
Premiums
Reinsurance $ 44,855 $1,497,819 $313,374 $ 909,759 $ — $440,900 $105,437 $ 81,797 $ 871,893Individual
Risk 37,049 662,793 196,861 477,065 — 319,589 108,116 40,368 481,727Other — — — — 24,231 — — — —
Total $ 81,904 $2,160,612 $510,235 $1,386,824 $ 24,231 $760,489 $213,553 $122,165 $1,353,620
December 31, 2007 Year ended December 31, 2007
DeferredPolicy
AcquisitionCosts
Future PolicyBenefits,
Losses andClaims and
ClaimsPremiumsExpenses
UnearnedPremiums
PremiumRevenue
NetInvestment
Income
Benefits,Claims,
Losses andExpenses
Amortizationof Deferred
PolicySettlement
Costs
OtherAcquisitionExpenses
NetWritten
Premiums
Reinsurance $ 57,596 $1,418,727 $352,822 $ 957,661 $ — $241,118 $119,915 $ 67,969 $1,024,493Individual
Risk 46,616 609,769 210,514 466,708 — 238,156 135,015 42,495 410,842Other — — — — 402,463 — — — —
Total $104,212 $2,028,496 $563,336 $1,424,369 $402,463 $479,274 $254,930 $110,464 $1,435,335
December 31, 2006 Year ended December 31, 2006
DeferredPolicy
AcquisitionCosts
Future PolicyBenefits,
Losses andClaims and
ClaimsPremiumsExpenses
UnearnedPremiums
PremiumRevenue
NetInvestment
Income
Benefits,Claims,
Losses andExpenses
Amortizationof Deferred
PolicySettlement
Costs
OtherAcquisitionExpenses
NetWritten
Premiums
Reinsurance $ 37,583 $1,469,251 $286,410 $ 972,017 $ — $148,052 $115,324 $ 72,405 $1,039,103Individual
Risk 69,335 628,904 292,014 557,760 — 298,178 165,373 37,181 490,517Other — — — — 318,106 — — — —
Total $106,918 $2,098,155 $578,424 $1,529,777 $318,106 $446,230 $280,697 $109,586 $1,529,620
S-7

SCHEDULE IV
RENAISSANCERE HOLDINGS LTD. AND SUBSIDIARIES
REINSURANCE
(THOUSANDS OF UNITED STATES DOLLARS)
GrossAmounts
Ceded toOther
Companies
AssumedFrom OtherCompanies Net Amount
Percentageof AmountAssumed
to Net
Year ended December 31, 2008Property and liability premiums written $489,866 $382,408 $1,246,162 $1,353,620 92%
Year ended December 31, 2007Property and liability premiums written $416,642 $374,302 $1,392,995 $1,435,335 97%
Year ended December 31, 2006Property and liability premiums written $451,325 $414,027 $1,492,322 $1,529,620 98%
S-8

SCHEDULE VI
RENAISSANCERE HOLDINGS LTD. AND SUBSIDIARIES
SUPPLEMENTARY INSURANCE INFORMATION CONCERNINGPROPERTY/CASUALTY INSURANCE OPERATIONS
(THOUSANDS OF UNITED STATES DOLLARS)
Affiliation with Registrant
Deferred PolicyAcquisition
Costs
Reserve forUnpaidClaims
and ClaimExpenses
Discount,if any,
deductedUnearnedPremiums
EarnedPremiums
NetInvestment
Income
Consolidated SubsidiariesYear ended December 31, 2008 $ 81,904 $2,160,612 $ — $510,235 $1,386,824 $ 24,231
Year ended December 31, 2007 $104,212 $2,028,496 $ — $563,336 $1,424,369 $402,463
Year ended December 31, 2006 $106,918 $2,098,155 $ — $578,424 $1,529,777 $318,106
Claims and Claim ExpenseIncurred Related to
Amortization ofDeferred Policy
Acquisition Costs
Paid Claimsand ClaimExpenses
NetPremiumsWrittenAffiliation with Registrant Current Year Prior Year
Consolidated SubsidiariesYear ended December 31, 2008 $995,316 $(234,827) $213,553 $744,632 $1,353,620
Year ended December 31, 2007 $712,424 $(233,150) $254,930 $430,354 $1,435,335
Year ended December 31, 2006 $582,788 $(136,558) $280,697 $591,290 $1,529,620
S-9

[THIS PAGE INTENTIONALLY LEFT BLANK]

UNITED STATESSECURITIES AND EXCHANGE COMMISSION
WASHINGTON, D.C. 20549
EXHIBITS
TO
FORM 10-K
Annual Report pursuant to Section 13 or 15(d) of the Securities Exchange Act of 1934 for the fiscal yearended December 31, 2008.
RenaissanceRe Holdings Ltd.

Exhibits
1. The Consolidated Financial Statements of RenaissanceRe Holdings Ltd. and related Notesthereto are listed in the accompanying Index to Consolidated Financial Statements and are filedas part of this Form 10-K.
2. The Schedules to the Consolidated Financial Statements of RenaissanceRe Holdings Ltd. arelisted in the accompanying Index to Schedules to Consolidated Financial Statements and arefiled as a part of this Form 10-K.
3. Exhibits
3.1 Memorandum of Association.(1)
3.2 Amended and Restated Bye-Laws.(2)
3.3 Memorandum of Increase in Share Capital of RenaissanceRe Holdings Ltd.(3)
3.4 Specimen Common Share certificate.(1)
10.1 Form of Director Retention Agreement, dated as of November 8, 2002, entered into by each ofthe non-employee directors of RenaissanceRe Holdings Ltd.(4)
10.2 Amended and Restated Employment Agreement, dated as of February 22, 2006, betweenRenaissanceRe Holdings Ltd. and Neill A. Currie.(5)
10.3 Amendment No. 1, dated as of March 1, 2007, to the Employment Agreement, dated as ofFebruary 22, 2006 by and between RenaissanceRe Holdings Ltd. and Neill A. Currie.(6)
10.4 Amendment No. 2, dated as of November 19, 2008, between RenaissanceRe Holdings Ltd. andNeill A. Currie.(7)
10.5 Employment Agreement, dated as of July 19, 2006, between RenaissanceRe Holdings Ltd. andFred R. Donner.(8)
10.6 Amended and Restated Employment Agreement, dated as of July 19, 2006, betweenRenaissanceRe Holdings Ltd. and William I. Riker.(8)
10.7 Transition Services Agreement dated as of July 18, 2007 between RenaissanceRe Holdings Ltd.and William I. Riker.(9)
10.8 Amended and Restated Employment Agreement, dated as of July 19, 2006, betweenRenaissanceRe Holdings Ltd. and John D. Nichols, Jr.(8)
10.9 Sublease Agreement, dated as of July 19, 2006, between Renaissance Reinsurance Ltd. andJohn D. Nichols, Jr.(8)
10.10 Form of Employment Agreement for Executive Officers.(8)
10.11 Form of Amendment to Employment Agreement for Executive Officers.(10)
10.12 Form of Amendment to Employment Agreement for Executive Officers.(7)
10.13 Sixth Amended and Restated Employment Agreement, dated as of May 19, 2004, betweenRenaissanceRe Holdings Ltd. and James N. Stanard.(11)
10.14 Second Amended and Restated Credit Agreement, dated as of August 6, 2004, amongRenaissanceRe Holdings Ltd., the Lenders named therein, Deutsche Bank AG New YorkBranch, as LC Issuer and Co-Documentation Agent, HSBC Bank U.S., National Association, asCo-Documentation Agent, Citibank, N.A. and Wachovia Bank, National Association, asCo-Syndication Agents, Bank of America, N.A., as Administrative Agent and Bank of AmericaSecurities LLC, as Sole Lead Arranger and Sole Book Manager.(12)
10.15 First Amendment Agreement, dated as of August 11, 2005, among RenaissanceRe HoldingsLtd., the Lenders named therein, Deutsche Bank AG New York Branch, as LC Issuer and Bankof America, National Association, as Administrative Agent for the Lenders.(13)

10.16 Second Amendment Agreement to Second Amended and Restated Credit Agreement, dated asof May 19, 2006, among RenaissanceRe Holdings Ltd., the lenders named therein, DeutscheBank AG New York Branch, as LC Issuer and Bank of America, National Association, asAdministrative Agent for the Lenders.(14)
10.17 Third Amendment, dated as of June 18, 2007, to Second Amended and Restated CreditAgreement, dated as of August 6, 2004, among RenaissanceRe Holdings Ltd., the lendersnamed therein, Deutsche Bank AG New York Branch, as LC Issuer and Bank of America,National Association as Administrative Agent for the Lenders.(15)
10.18 Fourth Amendment, dated as of September 6, 2007, to Second Amended and Restated CreditAgreement, dated as of August 6, 2004, among RenaissanceRe Holdings Ltd., the lendersnamed therein, Deutsche Bank AG New York Branch, as LC Issuer and Bank of America,National Association as Administrative Agent for the Lenders.(16)
10.19 Third Amended and Restated Credit Agreement, dated as of April 5, 2006, by and amongDaVinciRe Holdings Ltd., the banks, financial institutions and other institutional lenders listedthereto (the “Lenders”), Citigroup Global Markets Inc., as sole lead arranger, book manager andsyndication agent, and Citibank, N.A. as administrative agent for the Lenders.(17)
10.20 RenaissanceRe Holdings Ltd. Second Amended and Restated 1993 Stock Incentive Plan.(18)
10.21 RenaissanceRe Holdings Ltd. 2001 Stock Incentive Plan.(19)
10.22 Amendment No. 1 to the RenaissanceRe Holdings Ltd. 2001 Stock Incentive Plan.(20)
10.23 Amendment No. 2 to the RenaissanceRe Holdings Ltd. 2001 Stock Incentive Plan.(20)
10.24 Form of Option Grant Notice and Agreement pursuant to which option grants are made under theRenaissanceRe Holdings Ltd. 2001 Stock Incentive Plan.(12)
10.25 Form of Restricted Stock Grant Notice and Agreement pursuant to which Restricted Stock grantsare made under the RenaissanceRe Holdings Ltd. 2001 Stock Incentive Plan.(12)
10.26 RenaissanceRe Holdings Ltd. 2004 Stock Option Incentive Plan.(21)
10.27 Amendment No. 1 to the RenaissanceRe Holdings Ltd. 2004 Stock Option Incentive Plan.(22)
10.28 Form of Option Agreement pursuant to which option grants are made under the RenaissanceReHoldings 2004 Stock Option Incentive Plan to executive officers.(21)
10.29 Amended and Restated RenaissanceRe Holdings Ltd. Non-Employee Director Stock Plan.(23)
10.30 Amendment No. 1 to the RenaissanceRe Holdings Ltd. Non-Employee Director Stock Plan.(24)
10.31 Amendment No. 2 to the RenaissanceRe Holdings Ltd. Non-Employee Director Stock Plan.(25)
10.32 Amendment No. 3 to the RenaissanceRe Holdings Ltd. Non-Employee Director Stock Plan.
10.33 Form of Restricted Stock Grant Agreement for Directors.(5)
10.34 Form of Option Grant Agreement for Directors.(5)
10.35 Master Standby Letter of Credit Reimbursement Agreement, dated as of November 2, 2001,between Renaissance Reinsurance Ltd. and Fleet National Bank. Glencoe Insurance Ltd. andTimicuan Reinsurance Ltd. have each become a party to this agreement pursuant to anaccession agreement, and DaVinci Reinsurance Ltd. has entered in a substantially similaragreement with Fleet National Bank.(26)
10.36 Certificate of Designation, Preferences and Rights of 7.30% Series B Preference Shares.(27)
10.37 Certificate of Designation, Preferences and Rights of 6.08% Series C Preference Shares.(28)
10.38 Certificate of Designation, Preferences and Rights of 6.60% Series D Preference Shares.(29)
10.39 Senior Indenture, dated as of July 1, 2001, between RenaissanceRe Holdings Ltd., as Issuer,and Bankers Trust Company, as Trustee.(30)

10.40 Second Supplemental Indenture, by and between RenaissanceRe Holdings Ltd. and DeutscheBank Trust Company Americas (f/k/a Bankers Trust Company), dated as of January 31, 2003.(31)
10.41 Second Amended and Restated Reimbursement Agreement, dated as of April 27, 2007, by andamong Renaissance Reinsurance Ltd., Renaissance Reinsurance of Europe, Glencoe InsuranceLtd., DaVinci Reinsurance Ltd., RenaissanceRe Holdings Ltd., Wachovia Bank, NationalAssociation, as Issuing Bank, Administrative Agent, and Collateral Agent for the Lenders, certainCo-Syndication Agents, ING Bank N.V., as Documentation Agent, and certain Lenders partythereto.(32)
21.1 List of Subsidiaries of the Registrant.
23.1 Consent of Ernst & Young Ltd.
31.1 Certification of Neill A. Currie, Chief Executive Officer of RenaissanceRe Holdings Ltd., pursuantto Rule 13a-14(a) or Rule 15d-14(a) of the Securities Exchange Act of 1934, as amended.
31.2 Certification of Fred R. Donner, Chief Financial Officer of RenaissanceRe Holdings Ltd., pursuantto Rule 13a-14(a) or Rule 15d-14(a) of the Securities Exchange Act of 1934, as amended.
32.1 Certification of Neill A. Currie, Chief Executive Officer of RenaissanceRe Holdings Ltd., pursuantto 18 U.S.C. Section 1350, as adopted pursuant to Section 906 of the Sarbanes-Oxley Act of2002.
32.2 Certification of Fred R. Donner, Chief Financial Officer of RenaissanceRe Holdings Ltd., pursuantto 18 U.S.C. Section 1350, as adopted pursuant to Section 906 of the Sarbanes-Oxley Act of2002.
(1) Incorporated by reference to the Registration Statement on Form S-1 of RenaissanceRe Holdings Ltd.(Registration No. 33-70008) which was declared effective by the SEC on July 26, 1995.
(2) Incorporated by reference to RenaissanceRe Holdings Ltd.’s Quarterly Report on Form 10-Q for theperiod ended June 30, 2002, filed with the SEC on August 14, 2002.
(3) Incorporated by reference to RenaissanceRe Holdings Ltd.’s Quarterly Report on Form 10-Q for theperiod ended March 31, 1998, filed with the SEC on May 14, 1998 (SEC File Number 000-26512)
(4) Incorporated by reference to RenaissanceRe Holdings Ltd.’s Annual Report on Form 10-K for the yearended December 31, 2002, filed with the SEC on March 31, 2003 (SEC File Number 001-14428)
(5) Incorporated by reference to RenaissanceRe Holdings Ltd.’s Current Report on Form 8-K, filed withthe SEC on February 27, 2006
(6) Incorporated by reference to RenaissanceRe Holdings Ltd.’s Quarterly Report on Form 10-Q for theperiod ended March 31, 2007, filed with the SEC on May 2, 2007.
(7) Incorporated by reference to RenaissanceRe Holdings Ltd.’s Current Report on Form 8-K, filed withthe SEC on November 25, 2008.
(8) Incorporated by reference to RenaissanceRe Holdings Ltd.’s Current Report on Form 8-K, filed withthe SEC on July 21, 2006, relating to certain events which occurred on July 19, 2006. Other than withrespect to the Percent and Lump Sum Percent (as defined and disclosed in the Form 8-K) andmatters such as names and titles, the employment agreements for Messrs. O’Donnell and Ashley areidentical to the form filed as Exhibit 10.9.
(9) Incorporated by reference to RenaissanceRe Holdings Ltd.’s Current Report on Form 8-K, filed withthe SEC on July 20, 2007.
(10) Incorporated by reference to RenaissanceRe Holdings Ltd.’s Quarterly Report on Form 10-Q for theperiod ended March 31, 2008, filed with the SEC on May 2, 2008.
(11) Incorporated by reference to RenaissanceRe Holdings Ltd.’s Quarterly Report on Form 10-Q for theperiod ended June 30, 2004, filed with the SEC on August 9, 2004.
(12) Incorporated by reference to RenaissanceRe Holdings Ltd.’s Quarterly Report on Form 10-Q for theperiod ended September 30, 2004, filed with the SEC on November 9, 2004.

(13) Incorporated by reference to RenaissanceRe Holdings Ltd.’s Annual Report on Form 10-K for the yearended December 31, 2005, filed with the SEC on March 3, 2006 (SEC File Number 001-14428).
(14) Incorporated by reference to RenaissanceRe Holdings Ltd.’s Quarterly Report on Form 10-Q for theperiod ended June 30, 2006, filed with the SEC on August 2, 2006 (SEC File Number 001-14428).
(15) Incorporated by reference to RenaissanceRe Holdings Ltd.’s Current Report on Form 8-K, filed withthe SEC on June 29, 2007.
(16) Incorporated by reference to RenaissanceRe Holdings Ltd.’s Quarterly Report on Form 10-Q for theperiod ended September 30, 2007, filed with the SEC on October 31, 2007 (SEC File Number001-14428).
(17) Incorporated by reference to RenaissanceRe Holdings Ltd.’s Current Report on Form 8-K, filed withthe SEC on April 11, 2006, relating to certain events which occurred on April 5, 2006.
(18) Incorporated by reference to Exhibit 99.3 to the Registration Statement on Form S-8 (RegistrationNo. 333-90758) dated June 19, 2002.
(19) Incorporated by reference to Exhibit 99.2 to the Registration Statement on Form S-8 (RegistrationNo. 333-90758) dated June 19, 2002.
(20) Incorporated by reference to RenaissanceRe Holdings Ltd.’s Quarterly Report on Form 10-Q for theperiod ended March 31, 2007, filed with the SEC on May 2, 2007.
(21) Incorporated by reference to RenaissanceRe Holdings Ltd.’s Current Report on Form 8-K, filed withthe SEC on September 2, 2004.
(22) Incorporated by reference to RenaissanceRe Holdings Ltd.’s Annual Report on Form 10-K for the yearended December 31, 2004, filed with the SEC on March 31, 2005 (SEC File Number 001-14428).
(23) Incorporated by reference to Exhibit 99.1 to the Registration Statement on Form S-8 (RegistrationNo. 333-90758) dated June 19, 2002.
(24) Incorporated by reference to RenaissanceRe Holdings Ltd.’s Quarterly Report on Form 10-Q for theperiod ended March 31, 2007, filed with the SEC on May 2, 2007.
(25) Incorporated by reference to RenaissanceRe Holdings Ltd.’s Quarterly Report on Form 10-Q for theperiod ended September 30, 2008, filed with the SEC on October 30, 2008.
(26) Incorporated by reference to RenaissanceRe Holdings Ltd.’s Annual Report on Form 10-K for the yearended December 31, 2001 filed with the SEC on April 1, 2002.
(27) Incorporated by reference to RenaissanceRe Holdings Ltd.’s Current Report on Form 8-K, filed withthe SEC on February 4, 2003, relating to certain events which occurred on January 30, 2003.
(28) Incorporated by reference to RenaissanceRe Holdings Ltd.’s Current Report on Form 8-K, filed withthe SEC on March 18, 2004.
(29) Incorporated by reference to RenaissanceRe Holdings Ltd.’s Form 8-A, filed with the SEC onDecember 14, 2006.
(30) Incorporated by reference to RenaissanceRe Holdings Ltd.’s Current Report on Form 8-K, filed withthe SEC on July 17, 2001, relating to certain events which occurred on July 12, 2001.
(31) Incorporated by reference to RenaissanceRe Holdings Ltd.’s Current Report on Form 8-K, filed withthe SEC on January 31, 2003, relating to certain events which occurred on January 28, 2003.
(32) Incorporated by reference to RenaissanceRe Holdings Ltd.’s Current Report on Form 8-K, filed withthe SEC on May 3, 2007.

[THIS PAGE INTENTIONALLY LEFT BLANK]


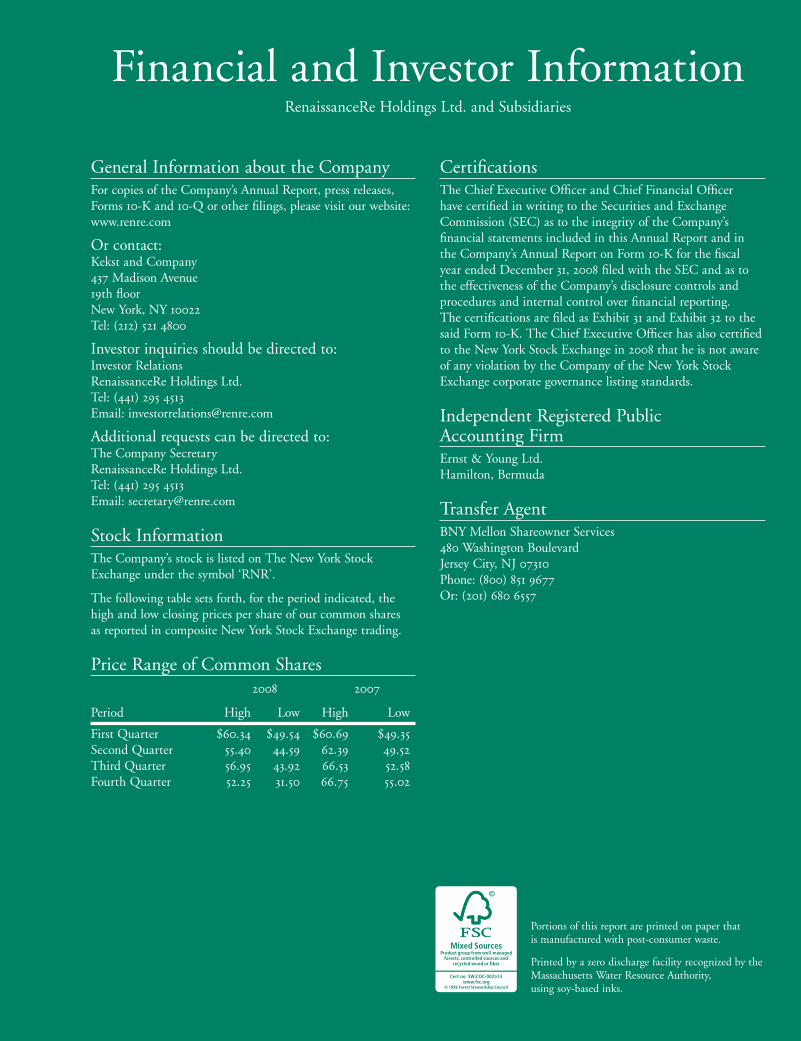
Financial and Investor InformationRenaissanceRe Holdings Ltd. and Subsidiaries
General Information about the CompanyFor copies of the Company’s Annual Report, press releases,Forms 10-K and 10-Q or other filings, please visit our website:www.renre.com
Or contact:Kekst and Company 437 Madison Avenue19th floorNew York, NY 10022Tel: (212) 521 4800
Investor inquiries should be directed to:Investor RelationsRenaissanceRe Holdings Ltd.Tel: (441) 295 4513Email: [email protected]
Additional requests can be directed to:The Company SecretaryRenaissanceRe Holdings Ltd.Tel: (441) 295 4513Email: [email protected]
Stock InformationThe Company’s stock is listed on The New York StockExchange under the symbol ‘RNR’.
The following table sets forth, for the period indicated, thehigh and low closing prices per share of our common sharesas reported in composite New York Stock Exchange trading.
Price Range of Common Shares2008 2007
Period High Low High Low
First Quarter $60.34 $49.54 $60.69 $49.35Second Quarter 55.40 44.59 62.39 49.52Third Quarter 56.95 43.92 66.53 52.58Fourth Quarter 52.25 31.50 66.75 55.02
CertificationsThe Chief Executive Officer and Chief Financial Officer have certified in writing to the Securities and ExchangeCommission (SEC) as to the integrity of the Company’s financial statements included in this Annual Report and in the Company’s Annual Report on Form 10-K for the fiscal year ended December 31, 2008 filed with the SEC and as tothe effectiveness of the Company’s disclosure controls and procedures and internal control over financial reporting. The certifications are filed as Exhibit 31 and Exhibit 32 to thesaid Form 10-K. The Chief Executive Officer has also certifiedto the New York Stock Exchange in 2008 that he is not awareof any violation by the Company of the New York StockExchange corporate governance listing standards.
Independent Registered Public Accounting FirmErnst & Young Ltd.Hamilton, Bermuda
Transfer AgentBNY Mellon Shareowner Services480 Washington BoulevardJersey City, NJ 07310Phone: (800) 851 9677 Or: (201) 680 6557
Portions of this report are printed on paper that is manufactured with post-consumer waste.
Printed by a zero discharge facility recognized by theMassachusetts Water Resource Authority, using soy-based inks.
Cert no. SW-COC-002514

RenaissanceRe Holdings Ltd.Renaissance House8-20 East BroadwayP.O. Box HM2527Hamilton HMGX, BermudaTel: (441) 295 4513Fax: (441) 292 9453www.renre.com


![Lucy v OCC Holdings P/L & Ors [2008] QDC 004](https://static.fdokumen.com/doc/165x107/6336e3d9d63e7c7901058f14/lucy-v-occ-holdings-pl-ors-2008-qdc-004.jpg)