©1998-2006 Mitchell International, Inc. All Rights Reserved.
Upload
khangminh22Category
view
2download
0
NA
MC
O B
AN
DA
I Ho
ldin
gs In
c. An
nu
al Rep
ort 2006
www.bandainamco.co.jp
NAMCO BANDAI Holdings Inc.Annual Report 2006
Printed in Japan

Forward-Looking Statements
The forward-looking statements in this annual report are based on the information currently available to management and include various risks and uncertainties. Accordingly,actual results may differ materially from these projections for a variety of reasons. Major factors that could influence actual results include changes in business environments,market trends, and exchange rate fluctuations relevant to the businesses of the BANDAI NAMCO Group. Notes:1. All figures in this report are rounded to the nearest unit. 2. Fiscal 2006, the year under review, refers to the one-year period ended March 31, 2006.3. Projections and other figures in this annual report are as of May 2006.
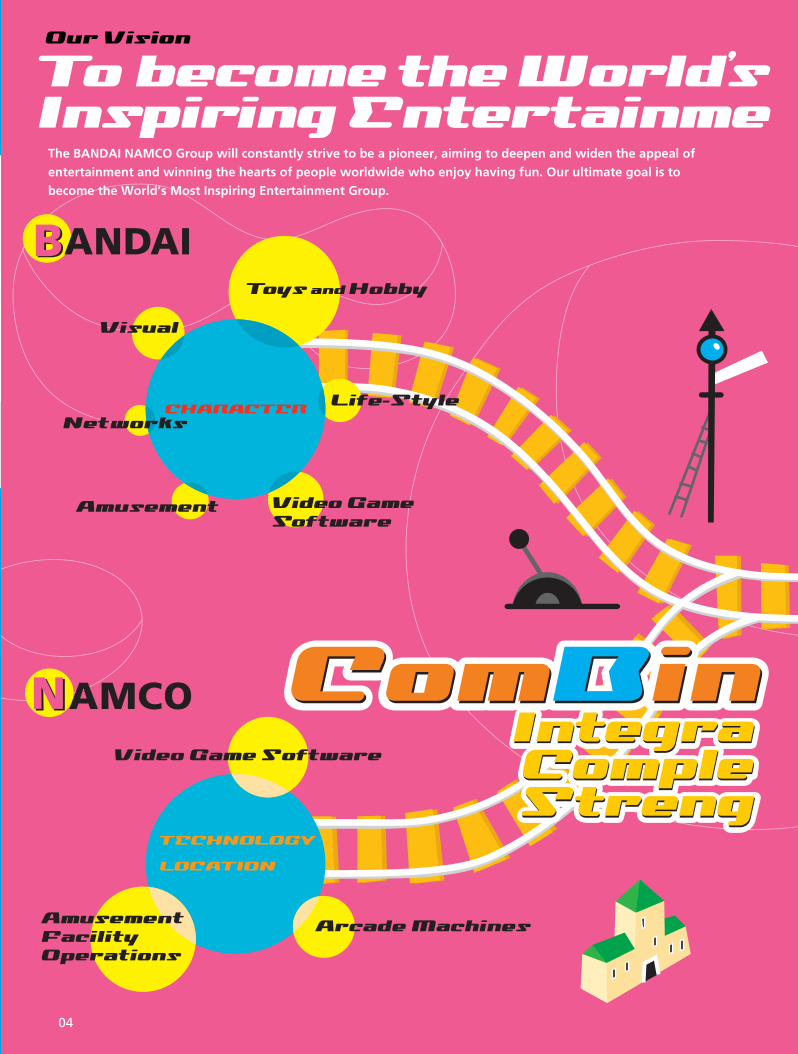
In 1950, Bandai Co., Ltd., was established as amarketer of toys. Since that time, Bandai’s missionhas been to provide dreams, inspiration andexcitement to people around the world throughentertainment businesses, and the company hasalways risen to the challenge of achievingcontinual improvement. Bandai has developed awide range of operations, including not just toysbut also apparel, candy toys, card games, gamesoftware, visual products, and network services,through the active use of its original businessmodel—character merchandising.
In 1955, NAMCO LIMITED was established as a manufacturer and marketer of amusementmachines. Since that time, NAMCO’s overridingmission has been contributing to the realization offun, happy, healthy lifestyles, and the company hasled the way in helping people experience the funthey have always dreamed of. In addition toamusement machine manufacturing andmarketing, NAMCO has expanded its businessfields to a wide array of other areas, includingamusement facility operations and game softwarefor home game consoles, and has developedoriginal technical strengths and facility networks.

TECHNOLOGY
LOCATION
AmusementFacility Operations
Video Game Software
Arcade Machines
CHARACTER
Toys and Hobby
Life-Style
Video Game Software
Amusement
Visual
Networks
0401
T a b l e o f C o n t e n t s
Brand-New PotentialAn introduction to the direction of the BANDAI NAMCO Group,
which has set off on a new journey.Strategic Business Units (SBUs)
An introduction to the Group’s operations and major companies.Consolidated Financial HighlightsA Message from the President
A message from Takeo Takasu.Brand-New Synergies
A special section explaining the Group’s Medium-Term Management Plan.Directors and Corporate AuditorsCorporate GovernanceThe BANDAI NAMCO Group’s CSR InitiativesOverview of Main Group CompaniesFinancial SectionCorporate Information
...................................................................... 02
.................................................... 06
.............................................. 08.................................................... 09
..................................................................... 14
.............................................. 25.................................................................. 26
........................... 28........................................ 30
............................................................................. 32.................................................................. 67
Our Vision
The BANDAI NAMCO Group will constantly strive to be a pioneer, aiming to deepen and widen the appeal ofentertainment and winning the hearts of people worldwide who enjoy having fun. Our ultimate goal is tobecome the World’s Most Inspiring Entertainment Group.
To become the World,s
Inspiring Entertainme

0302
Brand-New PotentialOn September 29, 2005, Bandai Co., Ltd., and NAMCO LIMITED established a joint holding company—NAMCOBANDAI Holdings Inc.—and implemented a management integration. In Japan and overseas, the BANDAI NAMCOGroup is developing operations in a wide range of fields, including toys, amusement facilities, arcade machines,video game software, network services, and visual products. In the future, the Group will make full use of thisbroad range of businesses as it strives to open up new possibilities and achieve further growth.
Dreams, Fun and Inspiration Are the Key to HappinessThe meaning of Dreams, Fun and Inspiration will
essentially change over time, but BANDAI NAMCO holds
one unshakable belief: that Dreams, Fun and Inspiration
will always hold the key to happiness.
BANDAI NAMCO believes that:
Dreams, Fun and InspirationBANDAI NAMCO will continue to provide Dreams,
Fun and Inspiration to people around the world through
entertainment based on creativity and boundless
enthusiasm.
BANDAI NAMCO’s Mission Statement:
More Passion, More Innovation, More Perceptive• Unparalleled curiosity and boundless enthusiasm
• Abundant creativity unrestrained by the status quo
• Open to people’s needs and satisfaction from
giving inspiration
BANDAI NAMCO’s basic ethos is defined by:Corporate PhilosophyThe Group Corporate Philosophy acts as the foundation for the
Group’s decision-making process and a source of inspiration for every
Group employee. In short, it represents the fundamental policy
underpinning all the Group’s activities. The Group Corporate
Philosophy encompasses all of the separate corporate philosophies
formulated by the individual companies in the BANDAI NAMCO
Group.
Anchored by this corporate philosophy, the BANDAI NAMCO
Group respects the independence and autonomy of every Group
company, aiming to boost the corporate value of the entire Group by
maximizing the creativity of these companies and generating new
synergies.
NAMCO BANDAI Holdings Inc.President and Representative DirectorTakeo Takasu
TECHNOLOGY
LOCATION
AmusementFacility Operations
Video Game Software
Arcade Machines
CHARACTER
Toys and Hobby
Life-Style
Video Game Software
Amusement
Visual
Networks
0401
T a b l e o f C o n t e n t s
Brand-New PotentialAn introduction to the direction of the BANDAI NAMCO Group,
which has set off on a new journey.Strategic Business Units (SBUs)
An introduction to the Group’s operations and major companies.Consolidated Financial HighlightsA Message from the President
A message from Takeo Takasu.Brand-New Synergies
A special section explaining the Group’s Medium-Term Management Plan.Directors and Corporate AuditorsCorporate GovernanceThe BANDAI NAMCO Group’s CSR InitiativesOverview of Main Group CompaniesFinancial SectionCorporate Information
...................................................................... 02
.................................................... 06
.............................................. 08.................................................... 09
..................................................................... 14
.............................................. 25.................................................................. 26
........................... 28........................................ 30
............................................................................. 32.................................................................. 67
Our Vision
The BANDAI NAMCO Group will constantly strive to be a pioneer, aiming to deepen and widen the appeal ofentertainment and winning the hearts of people worldwide who enjoy having fun. Our ultimate goal is tobecome the World’s Most Inspiring Entertainment Group.
To become the World,s
Inspiring Entertainme

05
Toys and Hobby
GameContents
AmusementFacility
CHARACTER
TECHNOLOGY
LOCATION
Visual and Music Content
Network
Life-Style
Mostnt Group
The Business Portfolio of the BANDAI NAMCO Group

06
Strategic Business


08
ConsolidatedFinancial Highlights
FY02.3 FY03.3 FY04.3 FY05.3 FY06.3FY02.3 FY03.3 FY04.3 FY05.3 FY06.3FY02.3 FY03.3 FY04.3 FY05.3 FY06.3 FY02.3 FY03.3 FY04.3 FY05.3 FY06.3
BANDAI
NAMCO
NAMCO BANDAI Holdings
(Millions of yen) (Millions of yen) (Millions of yen) (Millions of yen)
227,930
152,136
244,950
154,777
263,175
172,594
269,946
178,552
450,829
0
100,000
200,000
300,000
400,000
500,000
20,764
6,133
25,869
9,470
27,651
15,430
24,398
15,086
35,669
0
20,000
10,000
30,000
40,000
10,644
2,035
12,667
4,116
14,207
7,546
11,225
9,465
14,150
0
9,000
6,000
3,000
12,000
15,000
107,30596,133
116,116
96,647
121,068
101,811
131,750
107,773
243,607
0
150,000
100,000
50,000
200,000
250,000
¥263,175¥172,594
27,65115,43027,22214,42814,207
7,54611,57614,009
7,14911,104
2004*2
¥269,946¥178,552
24,39815,08625,72414,58911,225
9,46511,53913,155
7,94711,173
2005*2 2006
¥228,076¥148,117
121,068101,811
¥240,290¥154,474
131,750107,773
¥142.28¥133.00
22.5040.00
¥111.13¥ 83.63
30.0040.00
12.0%7.6%
12.09.9
8.9%9.0%
11.09.6
$3,837,822
303,643
316,013
120,456
204,478
162,969
$3,291,487
2,073,781
$0.46
0.10
Net sales
Operating income
Recurring income*3
Net income
Capital expenditures
Depreciation
BANDAINAMCOBANDAINAMCOBANDAINAMCOBANDAINAMCOBANDAINAMCOBANDAINAMCO
For the Year
Net income
Cash dividends
BANDAINAMCOBANDAINAMCO
Per Share Data (yen and U.S.dollars*1)*4,5
Return on equity*6
Return on assets*6
BANDAINAMCOBANDAINAMCO
Main Financial Indicators (%)
Total assets
Total shareholders’ equity
BANDAINAMCOBANDAINAMCO
At Year-End
For the years ended March 31
Millions of yen except per share data and main financial indicatorsThousands of U.S. dollars*1
NAMCO BANDAI NAMCO BANDAI
*1 U.S. dollar amounts have been translated, for convenience only, at the rate of ¥117.47=U.S.$1, the approximate exchange rate on March 31, 2006.*2 Figures for 2004 and 2005 are the consolidated figures for Bandai and NAMCO prior to the management integration.*3 Recurring income is a Japanese accounting term denoting income before extraordinary items.*4 Bandai implemented a 2:1 stock split on November 20, 2003. Net income per share in the fiscal year ended March 2004 was calculated as if the stock split had been implemented at the beginning of the fiscal year. Calculated
on the assumption that the stock split was implemented at the beginning of the fiscal year ended March 2004, per share dividends for the fiscal year ended March 2004 would be ¥15.00.*5 Namco implemented a 2:1 stock split on November 19, 2004. Net income per share in the fiscal year ended March 2005 was calculated as if the stock split had been implemented at the beginning of the fiscal year. Calculated
on the assumption that the stock split was implemented at the beginning of the fiscal year ended March 2004, net income per share for the fiscal year ended March 2004 would be ¥66.50, per share dividends for the fiscalyear ended March 2005 would be ¥30.00, and per share dividends for the fiscal year ended March 2004 would be ¥20.00.
*6 Figures for total assets and shareholders’ equity as of March 31, 2006, are used in calculating ROE and ROA for the fiscal year ended March 2006.
NAMCO BANDAI Holdings Inc. and Consolidated Subsidiaries
Net Sales Operating Income Net Income Total Shareholders’ Equity
2006
¥450,829
35,669
37,122
14,150
24,020
19,144
¥386,651
243,607
¥54.39
12.00
5.8%
9.6

09
A Message from the President
NAMCO BANDAI Holdings Inc.President and Representative DirectorTakeo Takasu
In September 2005, Bandai and NAMCO
established a joint holding company, NAMCO
BANDAI Holdings Inc., and made a new start
as the BANDAI NAMCO Group.
The vision of the BANDAI NAMCO Group
is to become the “World’s Most Inspiring
Entertainment Group,” and its mission is to
provide entertainment that offers “Dreams, Fun
and Inspiration” to people around the world. Since
the management integration, we have reorganized
the Group at a pace that exceeded our initial plans,
and a vast array of possibilities is opening up
before us. We’re off to a brand-new future!

10
NAMCO BANDAI Holdings Inc. • Management Strategy Committee
• CSR Committee Social Contribution Committee Environmental Project Committee Crisis Management Committee Compliance Committee
• Internal Control Committee
• Waigaya (weekly meetings)
Groupwide Meetings
Group Business Report Meeting
Strategic Business Units
Character Strategy Meeting
Contents Strategy Meeting
Visual and Music Content & Network SBU Meeting
Shared Service Council
Core CompanyBandai
Amusement Facility
Core CompanyNAMCO
Game Contents
Core CompanyNAMCO BANDAI Games
Network
Core CompanyBandai Networks
Core CompanyBandai Visual
Visual and Music Content
Toys and Hobby
Affiliated Business GroupSupport for Group Businesses
A Message from the President
The BANDAI NAMCO Group is developing businesses in a wide range of entertainment
fields. We have established a holding company, which we believe is the ideal organi-
zational structure for making use of the originality of the brands in each of our
fields while fully leveraging Group synergies. In formulating and implementing
operating strategies for Japan and overseas, a central role is played by our five SBUs—
Toys and Hobby, Amusement Facility, Game Contents, Network, and Visual and Music
Content—which encompass the operating companies in each field. In addition, we
have clarified the lines of responsibility and authority. At the same time, the Affiliated
Business Group provides support for the operations of each SBU.
NAMCO BANDAI Holdings Inc., in accordance with medium to long term
management strategies, determines the overall strategic direction of the Group and
advances Groupwide initiatives while respecting the independence of each SBU.
Focusing Diverse Strengths
Group Organization

11
The key objectives of the management integration were to focus the strengths of
Bandai and NAMCO, to further enhance the breadth and depth of our business
activities in the entertainment industry, which is marked by intense change and
competition, and to maximize the enterprise value of the Group. The management
integration has allowed us, as an entertainment group, to operate in a wide range of
fields—such as toys, amusement facilities, arcade game machines, game software for
home video game consoles, network services, and visual software—in the global
market. We will aim to secure stable growth and to leverage Group synergies that make
full use of these operational fields.
For the fiscal year ended March 2006 (the year under review), strong performances
were recorded by the Toys and Hobby SBU, which benefited from the worldwide
success of the Tamagotchi Plus series, and the Visual and Music Content SBU, where
the Mobile Suit Gundam series enjoyed Group synergies. However, in the Amusement
Facility and Game Contents SBUs, due to the sluggish market conditions and our slow
response to changes in customer needs, our performances did not meet the planned
levels. In addition, with conditions in game markets expected to remain difficult, we
recorded a valuation loss on inventories, such as game software, and, from a
conservative point of view, we recorded a valuation allowance for the deferred tax
assets that were on our books at the beginning of the fiscal year.
Accordingly, our performance did not meet our initial plans. We recorded net
sales of ¥450.8 billion, operating income of ¥35.7 billion, recurring income of ¥37.1
billion, and net income of ¥14.2 billion for the year under review.
On the other hand, in 2006 we have seen favorable signs, such as improving
market conditions in the amusement facility markets. We also plan to launch multiple
products and services that leverage Group synergies. We are determined to work
together to achieve the objectives of the Medium-Term Management Plan.
Enhancing Operational Breadth and Depth, andMaximizing Enterprise Value
Consolidated Performance in the Year under Review
May 2, 2005
September 29, 2005
December 1, 2005
January 2, 2006
January 31, 2006
February 23, 2006
March 31,2006
June 1, 2006
Announcement of management integration of Bandai and NAMCO.
Establishment of NAMCO BANDAI Holdings Inc.NAMCO BANDAI Holdings Inc. listed on the First Section of the Tokyo Stock Exchange.
Transfer of a portion of Bandai and NAMCO’s management of subsidiary and affiliatedcompanies to NAMCO BANDAI Holdings Inc. through corporate separation.
Under the direction of NAMCO BANDAI Holdings (USA) Inc., a U.S. regional holding company, affiliated operating companies restructured, including integration of home console game operations.
Bandai Logipal Inc. made a wholly owned subsidiary through a share-for-share exchange.
BANDAI NAMCO Group’s medium-term management plan announced.
NAMCO’s amusement facility management operations transferred to the newly established NAMCO LIMITED.Domestic game operations integrated under the newly established NAMCO BANDAI Games Inc.
Banpresto Co., Ltd., made a wholly owned subsidiary through a share exchange.
Major Initiatives

12
FY2006.3 FY2009.3 (Target) Progress toward Big Dreams
Sales: ¥450.8 billionOperating Income: ¥35.7 billionOverseas Sales: 19% of total
Sales: ¥550 billionOperating Income: ¥58 billionOverseas Sales: 25% of total
Sales: ¥1 trillionOperating Income: ¥100 billionOverseas Sales: 50% of total
Present
Targeted Position in Three Years, from a
Medium / Long-Term Outlook
Medium / Long-Term Goals
Implementation of Three-Year Plan
450,829
35,669
9.6%
5.8%
470,000
40,000
10.0%
8.0%
500,000
50,000
12.0%
9.5%
550,000
58,000
13.5%
10.0%
A Message from the President
Under the Medium-Term Management Plan that commenced in April 2006, which was
our first plan since the management integration, the key theme is to increase enterprise
value by strengthening, enriching, and expanding the BANDAI NAMCO Group’s
portfolio management. We combine business portfolios, where businesses are
developed in a wide range of fields; content portfolios, with extensive lineups ranging
from established content to new offerings; and regional portfolios, where operations
are developed in regions around the world. In our portfolio management, we use three-
dimensional, multifaceted combinations of these portfolios, thereby striving to achieve
ongoing, stable growth. Under the Medium-Term Management Plan, we will further
strengthen these portfolios, leverage synergies among them, and strengthen, enrich,
and enhance our overall portfolio management. In particular, in strengthening our
business portfolios, we will target the creation of a new SBU. We plan to spin off new
operations from one of the five existing SBUs. In addition, we will aggressively launch
new businesses, including alliances with outside partners and M&A activities, by taking
advantage of the strengths of the holding company organization, which facilitates open
business structure initiatives.
Key Theme of Medium-Term Management Plan: Strengthening, Enriching, and Expanding Portfolio Management
Three-Year Plan Figures (Consolidated)
Medium / Long-Term Goals
FY2006.3 FY2007.3(Target) FY2008.3 (Target) FY2009.3 (Target)
Figures for total assets and shareholders’ equity as of March 31, 2006, are used in calculating ROA and ROE for the fiscal year endedMarch 2006.
(¥ Million)
Net Sales
Operating Income
ROA
ROE

13
The BANDAI NAMCO Group has set long-term goals of ¥1 trillion in net sales and ¥100
billion in operating income. To achieve these goals, we will strive to be an organization
with number one positions in a wide range of entertainment categories. Our Medium-
Term Management Plan is the first step toward realizing this objective, and accordingly
our consolidated performance objectives for the fiscal year ending March 2009, the
final year of the plan, are net sales of ¥550 billion and operating income of ¥58 billion.
The plan’s objectives also include ROA of 13.5% and ROE of 10.0%.
To achieve these targets, we must expand our operations not only in Japan but
also overseas. Over the past 10 years, overseas sales have accounted for about 20%
of Bandai and NAMCO’s combined sales, with minimal changes from year to year.
However, we have already implemented multiple initiatives in all overseas regions,
targeting the leveraging of synergies that have resulted from the management
integration. By raising the percentage of overseas sales to 25% by the fiscal year ending
March 2009 and to 50% in the long term, we will make progress toward achieving our
goal of ¥1 trillion in net sales.
NAMCO BANDAI Holdings Inc. had about 40,000 shareholders as of the end of March
2006, an increase of about 10,000 shareholders, principally made up of individual
shareholders, in just six months after the implemention of the management integration.
We believe that this growth is an indication of the high expectations the investors have
for the new BANDAI NAMCO Group, and we are very grateful for the support. At the
same time, we are committed to achieving strong results from the management
integration in order to meet the expectations of the shareholders who are supporting
the BANDAI NAMCO Group.
The management integration has opened up unlimited possibilities for the
BANDAI NAMCO Group in the creation of new inspirations in entertainment. In the
future, we will maintain a position of leadership by accelerating the integration and
leveraging the synergies of the Group and strive to become the “World’s Most Inspiring
Entertainment Group,” providing “Dreams, Fun and Inspiration” to people of all ages
around the world. Everyone at the BANDAI NAMCO Group is working together with a
sense of confidence and excitement to open the doors to a new future.
Focused on a Bright Future
Unlimited New Potential
August 2006
Takeo TakasuPresident and Representative DirectorNAMCO BANDAI Holdings Inc.

NAMCO BANDAI Holdings Inc.
Strategic Business Units
Brand-New
14
The Medium-Term Management Plan
of the BANDAI NAMCO Group
The BANDAI NAMCO Group is implementing a three-year medium-term management plan that covers the periodfrom April 2006 to March 2009. Under this plan, we will leverage the strengths of the Group and maximize thesynergies, thereby further enhancing our capabilities.

Implemented mainly by the holding company
NAMCO BANDAI Holdings Inc.NAMCO BANDAI Holdings Inc.
Strategic Business UnitsStrategic Business Units
Implemented mainly by
• Strengthening corporate governance• Effectively utilizing human resources• Building the optimal management system Organizational reform Consolidation of indirect operations
• Promoting the “Entertainment Hub Concept” Content strategy Domain strategy Channel strategy• Strengthening overseas businesses
Synergies
15
The key theme of the Medium-Term Management Plan is “strengthening, enriching, and expanding the BANDAI NAMCO
Group’s portfolio management.” Portfolio management is supported by management strategies, which are implemented
mainly by NAMCO BANDAI Holdings Inc., and by business strategies, which are implemented mainly by the SBUs.
Through these strategies, we will further enhance portfolio management, the Group’s greatest strength, and
create a portfolio spiral effect among our wide range of business portfolios, globally oriented regional portfolios,
and abundant content portfolios, thereby increasing the Group’s enterprise value.
Key Theme of the Medium-Term Management Plan

Brand-New Synergies
16
In order to strengthen our corporate governance, we will implement a range of
initiatives in becoming a trusted company that can continually contribute to society.
Specifically, we will improve our corporate brand by introducing corporate brand use
and management standards, strengthening and monitoring our strategy and results
through the introduction of management tools, such as balanced score cards, and
enhance our CSR and compliance systems. In this way, we will increase management
soundness, transparency, and efficiency and, at the same time, build a corporate
governance system that facilitates timely information disclosure.
We believe that our employees are our most important asset and the engine of
our growth. In line with the management integration of Bandai and NAMCO, the
knowledge and competence of Group employees will pave the way for our future.
Accordingly, we will take the necessary steps to enhance the know-how of our
employees through Group exchange programs, such as implementing intra-Group
recruitment systems and transfer programs for our management-level personnel. We
will also strengthen our Group human resources training programs to enhance project
development skills and cultivate leaders. Through the introduction of new employment
rules, which consist of high-level professional contracts and specialist job categories, we
will create a work environment to promote opportunities to enable employees to
demonstrate their strengths.
Expanding operations and increasing efficiency are two key aspects of the management
integration. Our fundamental policy is to restructure operations to achieve the most
efficient and effective Group management system, and accordingly we have created
three principal points of emphasis.
The first is “cooperation,” which will drive our organizational restructuring.
In mature markets, or in markets where we can increase our share through the
application of the Group’s comprehensive strengths, we will focus on increasing
efficiency and leveraging economies of scale, by, for instance, integrating overlapping
departments within SBUs.
Strengthening corporate governance
Effectively utilizing human resources
Under the Medium-Term Management Plan, we have three key management
strategies—strengthening corporate governance, effectively utilizing human
resources, and building the optimal management system. The holding company
is primarily responsible for implementing these strategies.
NAMCO BANDAI Holdings Inc., as the key promoter of the Group’s
management strategies, will formulate and implement medium-term
management plans, provide support for implementing business strategies,
oversee business activities, effectively allocate management resources, and
promote strategic tie-ups with other companies.
Building the optimal management system

17
The second is “competition.” In growth markets, we will compete aggressively
under the current organization, including competition among members of the Group,
aiming to raise Groupwide enterprise value.
The third is “collaboration.” We will integrate the operations of indirect
departments, such as accounting, general affairs, human resources, and IT systems,
thereby reducing indirect costs and strengthening our profit base.
Since the management integration, the Group has implemented a range of
organizational restructuring measures in accordance with these basic policies. In
the Americas, we have established a regional holding company and taken other
restructuring initiatives. In addition, from the viewpoint of “cooperation,” we have
integrated our domestic game operations and made Bandai Logipal and Banpresto
wholly owned subsidiaries. We will continue to implement reorganization measures
to establish a system that will create synergies in the Group. In addition, through
management utilizing Groupwide committees, such as the Management Strategy
Committee and the Group Business Report Meeting, we will bolster Group functions to
facilitate close cooperation among management and the execution and utilization of
synergies among SBUs.
Furthermore, from the viewpoint of “collaboration,” we will increase the
efficiencies in the indirect departments through the introduction of the Shared Service
Center. As the first step, we have consolidated the indirect departments of NAMCO
and NAMCO BANDAI Games. In the future, we plan to integrate these consolidated
departments with the indirect departments of Bandai and establish the Shared Service
Center. By the fiscal year ending March 2009, the final year of the Medium-Term
Management Plan, we are targeting a 15% reduction in the indirect costs of these
three core companies, from the current level of ¥10 billion a year, with the introduction
of shared services.
3 Strategic Business Units
NAMCO BANDAI Holdings Inc.
Revising operations and raising personnel expertise
Group SSC (Shared Service Center) to be launched
April 2009
Part of Group functions to be mergedApril 2008
Back offices of 3 Strategic Business Units to be integrated, Shared Service Center to be established
April 2007
NAMCO and NAMCO BANDAI Gamesback offices consolidated
April 2006
Cost reduction target for 3 maincompanies—15% by FY09.3
Affiliated Business Group
Shared Service Center
Gam
e C
on
ten
ts
Toys
an
d H
ob
by
Am
use
men
t Fa
cili
ty
Building the Optimal Management System—Consolidation of Indirect Operations
18
Brand-New Synergies
Character Merchandising
TechnologyBroad Domain Locations
Create, Obtain, and Cultivate High-Quality Content
Expand Existing Domains through Development of New Categories
Venture into New Domains
Bolster Space Creation Capabilities
Expand Client Contacts
Content Strategy Domain Strategy Channel Strategy
Develop Vertically Develop Horizontally Expand Territory
Strengthen Efforts with Partner Companies
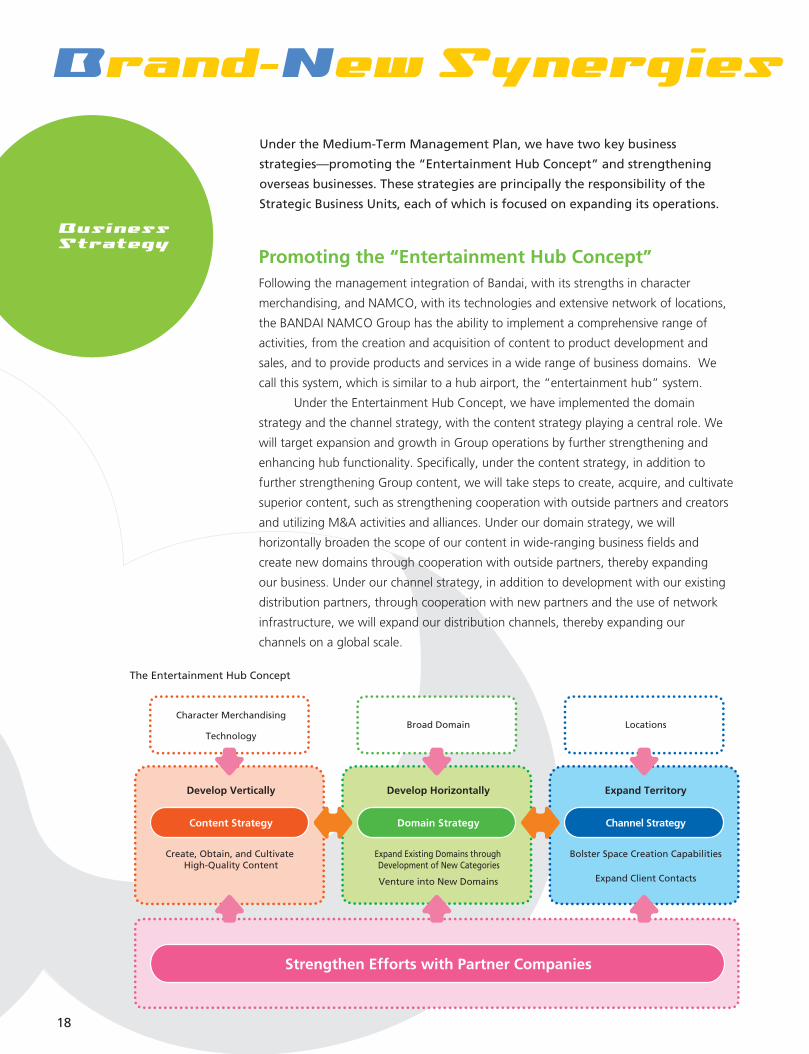
Following the management integration of Bandai, with its strengths in character
merchandising, and NAMCO, with its technologies and extensive network of locations,
the BANDAI NAMCO Group has the ability to implement a comprehensive range of
activities, from the creation and acquisition of content to product development and
sales, and to provide products and services in a wide range of business domains. We
call this system, which is similar to a hub airport, the “entertainment hub” system.
Under the Entertainment Hub Concept, we have implemented the domain
strategy and the channel strategy, with the content strategy playing a central role. We
will target expansion and growth in Group operations by further strengthening and
enhancing hub functionality. Specifically, under the content strategy, in addition to
further strengthening Group content, we will take steps to create, acquire, and cultivate
superior content, such as strengthening cooperation with outside partners and creators
and utilizing M&A activities and alliances. Under our domain strategy, we will
horizontally broaden the scope of our content in wide-ranging business fields and
create new domains through cooperation with outside partners, thereby expanding
our business. Under our channel strategy, in addition to development with our existing
distribution partners, through cooperation with new partners and the use of network
infrastructure, we will expand our distribution channels, thereby expanding our
channels on a global scale.
Promoting the “Entertainment Hub Concept”
Under the Medium-Term Management Plan, we have two key business
strategies—promoting the “Entertainment Hub Concept” and strengthening
overseas businesses. These strategies are principally the responsibility of the
Strategic Business Units, each of which is focused on expanding its operations.
The Entertainment Hub Concept
19
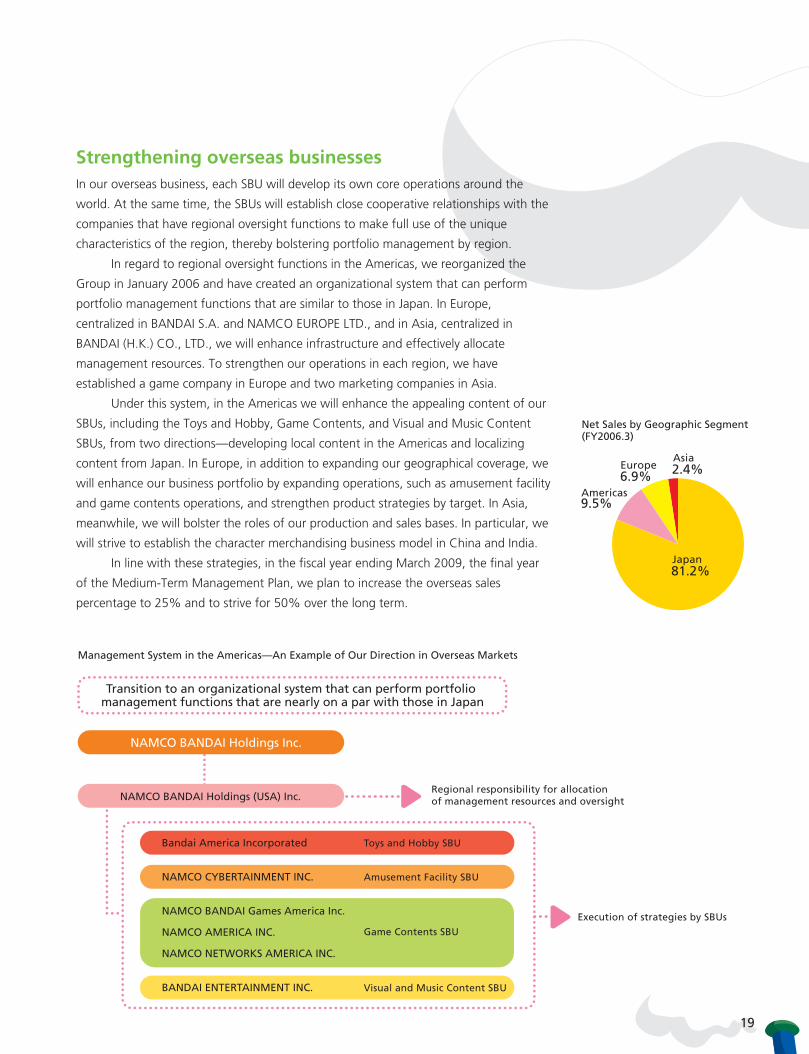
Bandai America Incorporated
NAMCO CYBERTAINMENT INC.
NAMCO BANDAI Games America Inc.
NAMCO AMERICA INC.
NAMCO NETWORKS AMERICA INC.
BANDAI ENTERTAINMENT INC.
NAMCO BANDAI Holdings (USA) Inc.
NAMCO BANDAI Holdings Inc.
Transition to an organizational system that can perform portfolio management functions that are nearly on a par with those in Japan
Regional responsibility for allocation of management resources and oversight
Execution of strategies by SBUs
Toys and Hobby SBU
Amusement Facility SBU
Game Contents SBU
Visual and Music Content SBU
81.2%
9.5%
6.9% 2.4%Asia
Europe
Americas
Japan
In our overseas business, each SBU will develop its own core operations around the
world. At the same time, the SBUs will establish close cooperative relationships with the
companies that have regional oversight functions to make full use of the unique
characteristics of the region, thereby bolstering portfolio management by region.
In regard to regional oversight functions in the Americas, we reorganized the
Group in January 2006 and have created an organizational system that can perform
portfolio management functions that are similar to those in Japan. In Europe,
centralized in BANDAI S.A. and NAMCO EUROPE LTD., and in Asia, centralized in
BANDAI (H.K.) CO., LTD., we will enhance infrastructure and effectively allocate
management resources. To strengthen our operations in each region, we have
established a game company in Europe and two marketing companies in Asia.
Under this system, in the Americas we will enhance the appealing content of our
SBUs, including the Toys and Hobby, Game Contents, and Visual and Music Content
SBUs, from two directions—developing local content in the Americas and localizing
content from Japan. In Europe, in addition to expanding our geographical coverage, we
will enhance our business portfolio by expanding operations, such as amusement facility
and game contents operations, and strengthen product strategies by target. In Asia,
meanwhile, we will bolster the roles of our production and sales bases. In particular, we
will strive to establish the character merchandising business model in China and India.
In line with these strategies, in the fiscal year ending March 2009, the final year
of the Medium-Term Management Plan, we plan to increase the overseas sales
percentage to 25% and to strive for 50% over the long term.
Strengthening overseas businesses
Management System in the Americas—An Example of Our Direction in Overseas Markets
Net Sales by Geographic Segment(FY2006.3)

20
Brand-New Synergies
Vision
Strategy
0
50
100
150
200
250
134.6
181.0 180.0190.0
210.0
46.3
132.5
47.5
137.0
53.0
146.0
64.0
0
5
10
15
20
0
5
10
15
13.5
19.1
15.716.5
19.0
5.5
10.0
5.7
10.0
6.5
11.2
7.8
10.6
8.7 8.7
9.0
2006.3 2007.3 2008.3 2009.32006.3 2007.3 2008.3 2009.3
Japan
Overseas
Japan
Overseas
Operating Income Margin (Right Scale)(Billions of yen)
(Target) (Target)(Target) (Target) (Target)(Target)
(Billions of yen) (%)
In the toys and hobby business, in the midst of industry reorganization, we are facing a
shrinking domestic market due to the falling birthrate, diversifying consumer needs, and
structural change in the industry.
In Japan, in accordance with the “Entertainment Hub Concept,” we will expand
our operations around a core of popular content and reinforce tie-ups with external
partners, aiming to establish the number one position in all of our business categories.
In addition, we will expand our target customer range to include women and senior
citizens and work to create new businesses through the integration of products and
services. Our objective for new businesses is to contribute ¥5 billion of sales in the fiscal
year ending March 2009.
In strengthening our overseas operations, we will strive to further expand
our business in the Americas, where we are working to improve our results by
implementing the principles of selection and concentration in products and content.
In Europe, we will work to expand our product lineup and strengthen our distribution
network. In Asia, meanwhile, we will utilize our character merchandising business
model in growth markets, such as China and India.
Constantly strive to create unique value forcustomers through advances in charactermerchandising
Net Sales Operating Income / Operating Income Margin
Business Strategy by SBU
Since it was launched in March 2004,the Tamagotchi Plus series has soldmore than 20 million units aroundthe world.
The DATA CARDDASS machine,which combines digital data and acard game, established a new cate-gory for the Toys and Hobby Strate-gic Business Unit.
The popular Power Rangers serieshas boasted hit products for morethan 30 years in Japan and morethan 10 years overseas.

21
Vision
Strategy
0
30
60
90
120
66.3
79.4
90.0
104.0114.0
13.0
76.5
13.5
89.0
15.0
98.8
15.2
0
2
4
6
8
0
5
10
15
2.4
2.5
4.8
7.0
8.0
0.1
4.6
0.2
6.6
0.4
7.5
0.5
3.1
5.3
6.7 7.0
2006.3 2007.3 2008.3 2009.32006.3 2007.3 2008.3 2009.3
Japan
Overseas
Japan
Overseas
Operating Income Margin (Right Scale)(Billions of yen) (Billions of yen)
(Target) (Target)(Target) (Target) (Target)(Target)
(%)
In the amusement facility business, with increases in the consumption tax anticipated
in the future, key challenges include changes in the industry’s profit structure and the
diversification of consumer preferences.
In response, we will aggressively open large-scale locations, in addition to
scrapping unprofitable facilities. At the same time, we will work to attract more
customers through synergies based on the full use of the Group’s content. We will also
work to improve profitability by reevaluating our workforce allocation and will take
steps to accommodate new payment systems, such as electronic money. Furthermore,
we will diversify our operations with new business formats for specific customer groups
and expand our customer base by including younger customers, families, and senior
citizens. Our objective for new formats is to contribute ¥30 billion of sales in the fiscal
year ending March 2009.
In our overseas operations, we will scrap unprofitable stores and expand the
number of stores operated on a revenue-sharing basis in the Americas. In Europe, we
will expand operations, centered on hybrid facilities, and we will extend the business
model used in the domestic market to Asia. These strategies will enable us to bolster
our profit foundation in each overseas region.
Diversify entertainment facility operations to strengthen revenue base
Net Sales Operating Income / Operating Income Margin
NAMJATOWN is an indoor themepark with a range of features, includ-ing attractions, a food theme park,and a healing park.
The Spa Resort Liberty, which wasopened in 2005 as the Group’s firstspa resort, is a project of our diverseamusement facility operations.
NAMCO Aso-Base draws on Groupsynergies to enhance the enjoymentof Bandai toys and character apparel.

22
Brand-New Synergies
Vision
Strategy
–2.50
50
100
150
200
105.7
130.4
153.0153.0170.0
24.6
116.0
37.0
106.5
46.5
115.0
55.00
5
10
15
20
25
0
5
10
15
20
11.3
10.513.0
20.0
24.0
– 0.9
11.0
2.0
16.7
3.3
19.6
4.4
8.18.5
13.114.1
2006.3 2007.3 2008.3 2009.32006.3 2007.3 2008.3 2009.3
Japan
Overseas
Japan
Overseas
Operating Income Margin (Right Scale)(Billions of yen) (Billions of yen)
(Target) (Target)(Target) (Target) (Target)(Target)
(%)
In the game contents business, our markets are anticipating the launch of the next generation
of game platforms. In this setting, key challenges include dealing with changing customer needs
and rising content development costs.
Accordingly, we will work to share know-how and technologies among the fields of
arcade game machines, home game software, and mobile content. We will also strive to build
a stable profit base through effective content utilization.
In home game software, we will respond promptly to customer needs with a balanced
mix of titles for each platform. Moreover, we will endeavor to increase efficiency by optimally
allocating creators and reevaluating the development process. We will also work aggressively in
the development of software for next-generation platforms and accumulate technical know-
how. In arcade game machines, we will bolster the content links with home game software and
enhance the development of games that draw on Group synergies, such as Mobile Suit
Gundam: Senjo no Kizuna. Through these initiatives, we will provide machines that better meet
our customer needs. In the distribution of content for mobile phones, we will continue to utilize
the content developed in-house and will expand it through the content links with home game
software and arcade game machines. In addition, we will strive to create content that can be
used around the world and expand overseas revenues.
Become the world’s premier quality game maker,continually providing games that are fun,enjoyable, and satisfying
Net Sales Operating Income (Loss) / Operating Income Margin
The Mobile Suit Gundam: Senjo noKizuna dome-type game machinefeatures team competition and wasdeveloped jointly by Banpresto andNAMCO BANDAI Games.
In addition to existing gamemachines, we provide multiplatformsoftware for next-generation gamemachines that takes advantage ofour planning, development, andtechnical capabilities.
The first version of the TamagotchiConnection: Corner Shop series ofNintendo DS software, which utilizesthe characters’ worldview, sold morethan a million units.

23
Vision
Strategy
0
5
10
15
20
12.513.5
14.516.0
0
0.5
1.0
2.0
1.5
2.5
0
5
10
15
20
25
1.81.9
2.1
2.3
14.4
14.1
14.5 14.4
2006.3 2007.3 2008.3 2009.32006.3 2007.3 2008.3 2009.3
Japan Japan
Operating Income Margin (Right Scale)(Billions of yen) (Billions of yen)
(Target) (Target)(Target) (Target) (Target)(Target)
(%)
In the network business, major challenges include responding to continued progress in
mobile phones—such as larger capacities and more-advanced functionality and the start of
one-segment broadcasts—and responding to the expansion and growth of the network
environment stemming from enhanced infrastructure, such as the broadband environment.
In response, we will make full use of Group assets, including superior content, and
aggressively plan and develop appealing network content. At the same time, we will
strengthen our ability to develop and propose new, industry-leading technologies.
Specifically, we will develop and launch services based on new technologies and aggressively
expand our solutions business for corporations by utilizing system construction and content
utilization capabilities. Also, we have begun to establish new businesses, such as an
entertainment portal site that will incorporate games, music, characters, commerce, and
communication and will be accessible through a range of networks, such as mobile phones
and PCs. Other new businesses include Internet advertising operations that leverage web
sites and content with customer-drawing power. Through these initiatives, we will make a
leap in becoming a comprehensive network company.
Effectively utilize Group content, technicaldevelopment capabilities, and system constructioncapabilities and make a leap forward to become a comprehensive network company
Net Sales Operating Income / Operating Income Margin
Bandai Networks and NAMCOBANDAI Games developed SD Gundam RPG for mobile phones.
In addition to standby screen imagesand games, our content for mobilephones offers abundant variations,such as Internet-based sales.
We are developing a broad range ofproducts sold only over the Internet,such as bike helmets with characterthemes.

24
Brand-New Synergies
Vision
Strategy
0
10
20
30
40
50
42.2
43.3
37.540.0
42.0
1.12006.3 2007.3 2008.3 2009.3
35.5
2.0
37.5
2.5
39.2
2.8
7.6
6.26.4 6.7 7.0
–1.4
2006.3 2007.3 2008.3 2009.3
6.3
0.1 0.1 0.1
6.66.9
Japan
Overseas Japan
Overseas
Operating Income Margin (Right Scale)(Billions of yen) (Billions of yen)
(Target) (Target)(Target) (Target) (Target)(Target)
(%)
0
–2
4
2
8
6
0
15
10
5
20
25
14.3
17.1
16.8 16.7
In the visual and music content business, our challenges include developing content
businesses for new media and responding to new, advanced hardware.
Accordingly, we will build a business model for new media, such as visual and
music content distribution and electronic publishing. At the same time, we will move
quickly to make full use of the Group’s content for new hardware.
In the Medium-Term Management Plan, the Visual and Music Content SBU has
the important role of original content creation in accordance with the “Entertainment
Hub Concept,” and the unit will also strive to enhance its ability to create or acquire
content and will develop content for new media. Further, we will take strategic steps to
bolster our presence as a content holder in such areas as broadband distribution and
the operation of animation portal sites by establishing a new company, thereby
maximizing the value of our content and, in turn, our profits.
Become a content production business group thatcan create quality content and achieve efficientmanagement
Net Sales Operating Income (Loss) / Operating Income Margin
The Mobile Suit Gundam series has maintained its popularity with a broad range of consumers, fromchildren to adults, for more than 20 years.
Three Group companies workedtogether to develop THE WINGS OFREAN, our first original animation forbroadband.
The .hack series is utilizing a mediamix that extends to TV animation,game software, and comics.
25
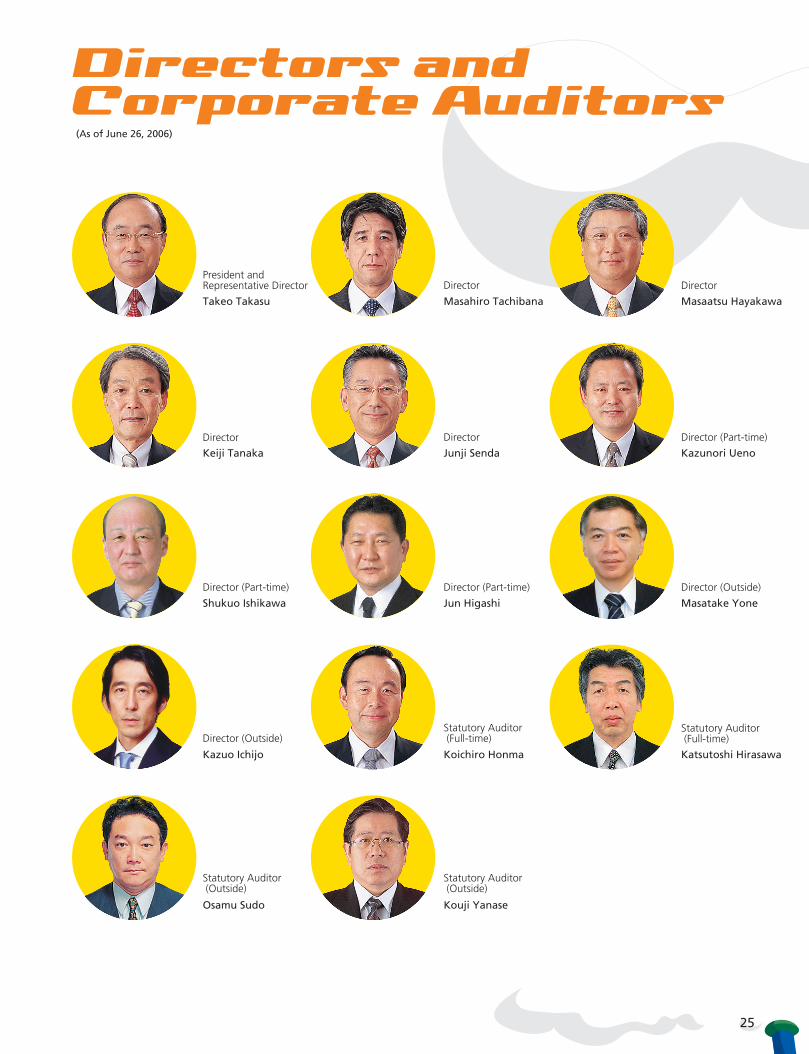
(As of June 26, 2006)
President and Representative Director
Takeo Takasu
Director
Keiji Tanaka
Director (Part-time)
Shukuo Ishikawa
Director (Outside)
Kazuo Ichijo
Statutory Auditor(Outside)
Osamu Sudo
Director
Masahiro Tachibana
Director
Junji Senda
Director (Part-time)
Jun Higashi
Statutory Auditor(Full-time)
Koichiro Honma
Statutory Auditor(Outside)
Kouji Yanase
Director
Masaatsu Hayakawa
Director (Part-time)
Kazunori Ueno
Director (Outside)
Masatake Yone
Statutory Auditor(Full-time)
Katsutoshi Hirasawa
Directors andCorporate Auditors
26
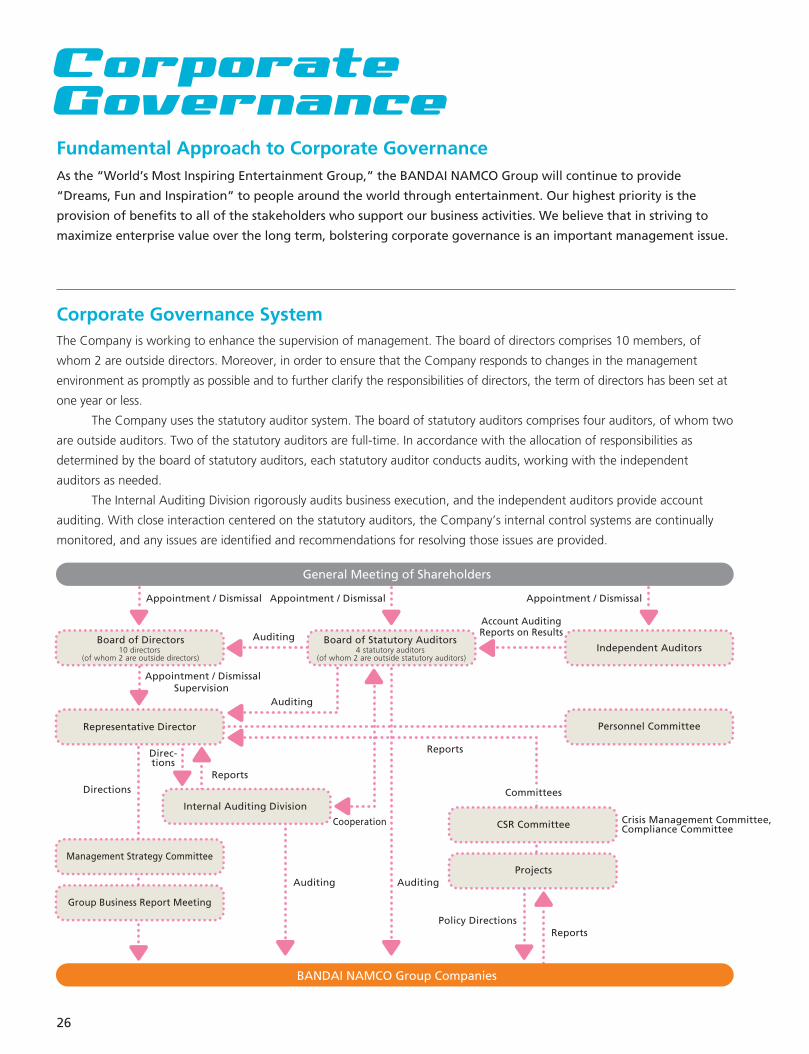
General Meeting of Shareholders
BANDAI NAMCO Group Companies
Board of Statutory Auditors4 statutory auditors
(of whom 2 are outside statutory auditors)
Board of Directors10 directors
(of whom 2 are outside directors)
Internal Auditing Division
Independent Auditors
Personnel Committee
Committees
CSR Committee Crisis Management Committee, Compliance Committee
Projects
Appointment / Dismissal Appointment / DismissalAppointment / Dismissal
Auditing
Account AuditingReports on Results
Auditing
Appointment / DismissalSupervision
Auditing
Cooperation
DirectionsReports
Reports
Reports
Policy Directions
Direc-tions
Auditing
Representative Director
Management Strategy Committee
Group Business Report Meeting
CorporateGovernance
As the “World’s Most Inspiring Entertainment Group,” the BANDAI NAMCO Group will continue to provide
“Dreams, Fun and Inspiration” to people around the world through entertainment. Our highest priority is the
provision of benefits to all of the stakeholders who support our business activities. We believe that in striving to
maximize enterprise value over the long term, bolstering corporate governance is an important management issue.
Fundamental Approach to Corporate Governance
The Company is working to enhance the supervision of management. The board of directors comprises 10 members, of
whom 2 are outside directors. Moreover, in order to ensure that the Company responds to changes in the management
environment as promptly as possible and to further clarify the responsibilities of directors, the term of directors has been set at
one year or less.
The Company uses the statutory auditor system. The board of statutory auditors comprises four auditors, of whom two
are outside auditors. Two of the statutory auditors are full-time. In accordance with the allocation of responsibilities as
determined by the board of statutory auditors, each statutory auditor conducts audits, working with the independent
auditors as needed.
The Internal Auditing Division rigorously audits business execution, and the independent auditors provide account
auditing. With close interaction centered on the statutory auditors, the Company’s internal control systems are continually
monitored, and any issues are identified and recommendations for resolving those issues are provided.
Corporate Governance System

Top management meetings attended by directors and statutory auditors are shown below.
As shown in the table above, the Company holds a variety of top management meetings. With the representative
director, the director with chief responsibility for information-related issues, and other directors attending these meetings,
the BANDAI NAMCO Group has established a system that facilitates timely tracking and responding to Group management
information. Moreover, the Company has established the Personnel Committee. Outside directors represent half of the
members of this committee, which objectively and neutrally considers personnel and compensation issues regarding directors
of the Company as well as other matters that are referred to it.
In addition, we hold regular meetings of the Compliance Committee, which is led by the president. This committee
is in charge of monitoring and supervising important issues related to compliance and has established a system to prevent
violations of laws and regulations and to ensure prompt action in the event of any incidents that could be a legal or
regulatory violation.
In crisis management, the Crisis Management Committee, which is led by a director, meets on an as needed basis and
works on behalf of the BANDAI NAMCO Group to prevent crisis situations and to ensure a prompt response if such situations
do occur.
The Group comprises five Strategic Business Units (SBUs) and an Affiliated Business Group that handle Groupwide
functions. In each SBU, operating strategies are formulated and implemented, centered on that SBU’s core company.
Under the Medium-Term Management Plan that began in April 2006, management strategies are mainly implemented
by the holding company and business strategies are mainly implemented by the SBUs. The key theme of the plan is
“strengthening, enriching, and expanding the BANDAI NAMCO Group’s portfolio management.”
Overall Group strategies are formulated by such committees as the Management Strategy Committee, the Group
Business Report Meeting, and the CSR Committee.
From the fiscal year ending March 2007, to further enhance its internal control systems and to provide a sound foundation
for internal control on a Groupwide basis, the Group has established basic policies in each of the following areas and is
working to bolster its internal control systems.
A system for ensuring that the directors conform to laws, regulations, and the articles of incorporation in the execution
of their duties.
A system for storing and controlling information concerning the execution of the duties of directors.
Regulations concerning the management of the risk of losses and other systems.
A system for ensuring that directors execute their duties efficiently.
A system for ensuring that employees’ duties conform to laws, regulations, and the articles of incorporation.
A system for ensuring that work is carried out appropriately by the Group, comprising the company, its parent
company, and its subsidiaries.
Items concerning employees requested by auditors to assist the auditors in the performance of their duties.
Items concerning the independence of such employees described in the previous section from the directors.
A system for reports by directors and employees to the statutory auditors and a system for other reports to the statutory
auditors.
Other systems for ensuring that the audits performed by the statutory auditors are effective.
27
1.
2.
3.
4.
5.
6.
7.
8.
9.
10.
Internal Control Systems
Meeting Name
Board of Directors
Management Strategy Committee
Group Business Report Meeting
Waigaya Meeting
Schedule
Monthly
Monthly
Monthly
Weekly
Agenda / Purpose
Resolutions and reports on matters prescribed by the Company Law. Resolutions,
deliberations, and reports on matters related to the BANDAI NAMCO Group.
Deliberations on BANDAI NAMCO Group management strategies,
business creation, and business expansion.
Reports on BANDAI NAMCO Group business affairs and deliberations on
business issues and problems.
Weekly reports on divisions supervised by NAMCO BANDAI Holdings’ directors.
Participants
Directors, statutory auditors
Inside directors, full-time statutory
auditors, others depending on
meeting topics
Full-time directors, full-time statutory
auditors, SBU representatives, others
Full-time directors, general managers

In the Group’s broad range of product fields, we follow all legal and industry quality and safety
standards, and we have also established our own more-rigorous in-house standards, which are
updated as needed, such as due to changes in the operating environment.
For example, to verify such characteristics as safety, strength, and durability, Bandai has more
than 300 inspection items. In accordance with product characteristics, appropriate items are selected
for inspections. In addition, for NAMCO BANDAI Games arcade game machines, we design parts and
systems with concern not only for customer safety but also for maintenance in the arcades.
In addition to implementing measures to reduce packaging, such as decreasing packaging space ratios
and developing packaging-free products, we are also working to shift toward the use of lower-
environmental-impact packaging. Furthermore, we are working to reduce waste by taking measures
with the packaging used for the distribution of amusement machines and other products.
28
The BANDAI NAMCOGroup,s CSRInitiatives
Topics
Manufacturing Safe, Reliable Products
The BANDAI NAMCO Group’s corporate philosophy is to provide “Dreams, Fun and Inspiration” to people around
the world through entertainment based on creativity and boundless enthusiasm. To ensure that we can continue
to provide “Dreams, Fun and Inspiration,” we have formulated Groupwide CSR initiatives that include three types
of responsibilities.
In accordance with these basic responsibilities, a range of initiatives are implemented by the CSR Committee
and its sub-committees, the Social Contribution Committee, the Environmental Project Committee, the Crisis
Management Committee, and the Compliance Committee.
Packaging Reduction
Dropping products to test forquality
Packaging-free product fromBandai
Legal and ethical responsibilities (compliance)We have formulated basic compliance standards for Group companies, officers, and employees in Japan and overseas, and we
continually monitor the activities to ensure appropriate observance of legal and ethical standards.
Environmental and social responsibilities(safety / quality, environmental conservation, cultural / social support activities)
Safety / quality initiativesWe follow industry and in-house standards, and we have built a system that facilitates the achievement of higher levels of safety
and quality, so that customers can use our products with confidence.
Environmental conservation initiativesWe are aggressively implementing forward-looking environmental conservation measures to ensure that we can continue to provide
“Dreams, Fun and Inspiration” to people around the world.
Cultural / social support activitiesWe are also active in areas outside the provision of products and services, such as museum operations and volunteer activities.
Economic responsibilitiesWe are continually working to enhance management transparency and monitoring the management plans and conditions of Group
companies. Moreover, we are working to provide maximum returns to society and stakeholders by selecting the optimal operational
fields for Group development and focusing our management resources in these fields.
Legal and ethical responsibilities(compliance)
Environmental and social responsibilities
(safety / quality, environmental
conservation,
cultural / social support activities)
Economic responsibilities

In 1985, we developed TalkingAid, a portable assistance device for people that have difficulty
in speaking, and since that time we have continued to improve this product and enhance its
functionality. We also develop and market rehabilitation-entertainment machines, which are
enhanced versions of arcade game machines that are designed to provide both fun and physical
rehabilitation. In 2005, we used the experience that we have cultivated in these operations to open
Kaikaya, a day-care service center for senior citizens. Through these initiatives, we are
implementing a range of activities that combine entertainment and social welfare.
Bandai Logipal has acquired Green Management Certification, which is given to transportation
companies that implement low-environmental-impact operations. Furthermore, NAMCO
ECOLOTECH is conducting product planning, development, and sales of low-environmental-impact
products, such as waste processing equipment and deodorization equipment.
In addition, we are conducting green procurement in arcade game machine operations and
implementing a range of energy-saving and resource conservation measures at Group work sites.
At the Bandai Hobby Center, a plastic model plant that opened in 2006, we are taking a
range of steps—such as the use of solar power generation and raw material recycling—with the
goal of making it the first plant in the domestic toy industry to receive green certification.
The BANDAI NAMCO Group believes that its employees are its most important asset. Accordingly, we are working to create
systems and environments that help employees to maximize their abilities.
In order to provide a challenging environment to bring out the best in our employees, we recruit for open positions on
a Groupwide basis. In addition, we solicit proposals for new businesses and internal reforms, provide monetary support for
promising plans, and work to implement them. We also have a range of training programs, such as a training program for
next-generation leaders that is attended by Group employees. Moreover, with a range of systems to support a balance
between home and work life, such as maternity and child-care leave, we are working to support our employees.
We are conducting a variety of activities to help children enjoy culture and science, such as
operating the World Toy Museum, which has a collection of antique toys from the 18th to 20th
centuries, and holding events that draw on a collection that includes many items created by the
famous inventor Thomas Edison. In addition, the Group supports the activities of Japan’s Toy
Libraries through such means as donations to the Japan Toy Library Foundation, which provides
children who have physical and mental challenges the chance to play with toys and have fun. We
also provide assistance to the New Technology Foundation, which is active in R&D, promotion, and
support activities in science and technology.
We have made space available in Bandai’s head office for a child-care center that is certified by
Tokyo prefecture. In addition, we are implementing a range of communication activities in local
areas, such as inviting community residents to events at Bandai head office and holding events at
amusement facilities.
29
Social Welfare
Wide-Ranging Environmental Impact Reduction
Human Resources
Social Contribution
Local Community Contribution Activities
NAMCO’s TalkingAid
Bandai Hobby Center (plastic model plant)
Bandai Logipal low-emission truck
Child-care center in Bandai’s headoffice
Bandai’s World Toy Museum

30
Overview of MainGroup Companies
* Companies accounted for by the equity method
(As of July 31, 2006)
Toys and Hobby Strategic Business Unit
Bandai Co., Ltd.
Megahouse Corporation
Popy Co., Ltd.
Seika Co., Ltd.
Seeds Co., Ltd.
Plex Co., Ltd.
Sunlink Co., Ltd.
People Co., Ltd.*
Bandai America Incorporated
BANDAI S.A.
BANDAI U.K. LTD.
BANDAI ESPAÑA S.A.
BANDAI (H.K.) CO., LTD.
BANDAI ASIA CO., LTD.
BANDAI INDUSTRIAL CO., LTD.
BANDAI KOREA CO., LTD.
CREATIVE B WORKS CO., LTD.
Amusement Facility Strategic Business Unit
NAMCO LIMITED
Pleasure Cast Co., Ltd.
Hanayashiki Co., Ltd.
St. Tropez Ltd.
NAMCO SPA RESORT LTD.
Yunokawa Kanko Hotel Co., Ltd.
NAMCO CYBERTAINMENT INC.
NAMCO OPERATIONS EUROPE LTD.
NAMCO OPERATIONS SPAIN S.L.
NAMCO ENTERPRISES ASIA LTD.
SHANGHAI NAMCO LTD.*
Planning, production, and sales of toys, apparel, and vending machine products, etc.
Planning, manufacturing, and sales of toys, etc.
Manufacturing and sales of toys, etc.
Planning, development, and sales of stationery and sundries, etc.
Manufacturing of toys, etc.
Planning and design of character-based products
Operation and sales of vending machine products, etc.
Planning, manufacturing, and sales of toys for infants (JASDAQ)
Sales of toy-related products
Regional management functions; sales of toy-related products
Sales of toy-related products
Sales of toy-related products
Regional management functions; import, export, manufacturing, and sales of toy-related products
Sales of toy-related products
Manufacturing of toy-related products
Manufacturing, import, and sales of toys, etc., and licensing operations
Sales of toy-related products
Management of amusement facilities
Operation of amusement facilities
Operation of Asakusa Hanayashiki amusement park
Management of amusement facilities; real estate leasing operations
Management of spa facilities
Management of tourist hotels
Management of amusement facilities
Management of amusement facilities
Management of amusement facilities
Management of amusement facilities
Management of amusement facilities; manufacturing and sales of amusement machines, etc.
NAMCO BANDAI Holdings Inc.
NAMCO BANDAI Holdings (USA) Inc.
Planning and execution of medium- and long-term management strategies; support for business strategyimplementation by Group companies (Tokyo Stock Exchange, First Section)
Execution of North American regional strategy; management guidance and support for NorthAmerican operating companies

31* Companies accounted for by the equity method
Game Contents Strategic Business Unit
NAMCO BANDAI Games Inc.
Banpresto Co., Ltd.
Bec Co., Ltd.
Banpresto Sales Co., Ltd.
Banpresoft Co., Ltd.
Monolith Software Inc.
NAMCO TALES STUDIO LTD.
BANPRESTO (H.K.) LTD.
NAMCO BANDAI Games America Inc.
NAMCO AMERICA INC.
NAMCO NETWORKS AMERICA INC.
NAMCO EUROPE LTD.
NAMCO BANDAI Games Europe SAS
Network Strategic Business Unit
Bandai Networks Co., Ltd.
VIBE Inc.
Visual and Music Content Strategic Business Unit
Bandai Visual Co., Ltd.
Sunrise Inc.
Bandai Channel Co., Ltd.
Lantis Co., Ltd.
BANDAI ENTERTAINMENT INC.
Affiliated Business Group
Bandai Logipal Inc.
Banalex Corporation
Artpresto Co., Ltd.
NAMCO ECOLOTECH LTD.
NAMCO SUPPORTERS LTD.
NAMCO TRADING LTD.
Happinet Corporation*
Sotsu Agency Co., Ltd.*
Italian Tomato Ltd.*
Planning, development, and sales of game software and arcade machines, etc.
Planning, development, and sales of arcade machines, amusement prizes, and game software
Planning and development of game software
Sales of amusement prizes, etc.
Planning and development of game software
Planning, development, and sales of game software
Planning, development, and sales of game software
Manufacturing and production management of arcade machines and prizes
Planning, development, and sales of game software
Sales of arcade machines
Development and distribution of content for mobile phones
Regional management functions; manufacturing and sales of arcade machines and development and distribution of content for mobile phones
Sales of game software, etc.
Development and provision of network content and network solutions (JASDAQ)
Development and provision of network content and network advertising
Planning, production, and sales of visual software, etc. (Tokyo Stock Exchange, First Section)
Planning and production of animation
On-demand delivery of content, such as animations
Planning, production, sales, and management of music content
Planning, production, sales, and copyright management of visual content
Logistics management, warehousing, and transportation operations
Staffing services, leasing and financial services, and building management
Planning and design of various printed materials
Development and sales of environmental equipment
Building management, real estate, and insurance agency
Vending machine installation and management; distribution of content for mobile phones
Wholesale of toys and video game consoles (Tokyo Stock Exchange, First Section)
Planning and development of advertising and copyright business (JASDAQ)
Management of directly operated restaurants; franchise operations

Financial Section
Contents
Consolidated Six-Year Financial Summary 33
Financial Review 34
Consolidated Balance Sheet 40
Consolidated Statement of Income 42
Consolidated Statement of Shareholders’ Equity 43
Consolidated Statement of Cash Flows 44
Notes to Consolidated Financial Statements 45
Independent Auditors’ Report 66
32

33
Consolidated Six-Year Financial SummaryNAMCO BANDAI Holdings Inc. and Consolidated Subsidiaries
NAMCO BANDAIHoldings Inc.
(Consolidated)
Millions of yen except per share data and main financial indicators
For the years ended March 31 2001*1 2002*1 2003*1 2004*1 2005*1 2006
For the Year:
Net sales BANDAI ¥217,010 ¥227,930 ¥244,950 ¥263,175 ¥269,946 ¥450,829
NAMCO ¥146,554 ¥152,136 ¥154,777 ¥172,594 ¥178,552
Gross profit BANDAI 79,918 90,866 106,801 116,258 116,801 156,565
NAMCO 25,816 34,853 37,529 49,088 47,555
Selling, general and BANDAI 64,102 70,102 80,932 88,607 92,403 120,896administrative expenses NAMCO 28,682 28,720 28,059 33,658 32,469
Operating income (loss) BANDAI 15,816 20,764 25,869 27,651 24,398 35,669
NAMCO (2,866) 6,133 9,470 15,430 15,086
Recurring income (loss)*2 BANDAI 16,346 21,993 26,435 27,222 25,724 37,122
NAMCO (3,477) 4,664 8,777 14,428 14,589
Net income (loss) BANDAI 12,897 10,644 12,667 14,207 11,225 14,150
NAMCO (6,000) 2,035 4,116 7,546 9,465
Capital expenditures BANDAI 7,107 7,212 8,593 11,576 11,539 24,020
NAMCO 16,197 11,943 10,376 14,009 13,155
Depreciation BANDAI 6,362 6,505 6,885 7,149 7,947 19,144
NAMCO 14,623 14,085 11,227 11,104 11,173
Cash flows from operating BANDAI 14,838 26,568 28,009 20,033 14,839 31,809activities NAMCO 12,332 15,368 15,890 12,931 3,172
At Year-End:
Total assets BANDAI ¥205,558 ¥197,424 ¥225,683 ¥228,076 ¥240,290 ¥386,651
NAMCO ¥138,962 ¥144,140 ¥143,214 ¥148,117 ¥154,474
Current assets BANDAI 121,017 126,966 158,782 163,131 173,402 240,635
NAMCO 51,261 61,346 68,089 73,614 82,666
Current liabilities BANDAI 67,409 62,208 67,215 61,319 68,862 107,528
NAMCO 30,275 29,659 35,920 33,860 33,219
Total shareholders’ equity BANDAI 107,217 107,305 116,116 121,068 131,750 243,607
NAMCO 91,646 96,133 96,647 101,811 107,773
Per Share Data (yen):
Net income (loss) per share BANDAI ¥ 265.47 ¥217.62 ¥254.09 ¥142.28 ¥111.13 ¥54.39
NAMCO ¥(109.09) ¥ 36.95 ¥ 72.35 ¥133.00 ¥ 83.63
Cash dividends BANDAI 30.00 30.00 40.00 22.50 30.00 12.00*6
NAMCO 15.00 17.00 30.00 40.00 40.00
Main Financial Indicators (%):
Return on equity (ROE)*3, 5 BANDAI 12.9% 9.9% 11.3% 12.0% 8.9% 5.8%
NAMCO (6.3)% 2.2% 4.3% 7.6% 9.0%
Return on assets (ROA)*4, 5 BANDAI 7.7 10.9 12.5 12.0 11.0 9.6
NAMCO (2.3) 3.3 6.1 9.9 9.6
Selling, general and admini- BANDAI 29.5 30.8 33.0 33.7 34.2 26.8strative expenses to net sales NAMCO 19.6 18.9 18.1 19.5 18.2
Operating income (loss) BANDAI 7.3 9.1 10.6 10.5 9.0 7.9to net sales NAMCO (2.0) 4.0 6.1 8.9 8.4
Net income (loss) to net sales BANDAI 5.9 4.7 5.2 5.4 4.2 3.1
NAMCO (4.1) 1.3 2.7 4.4 5.3
Shareholders’ equity ratio BANDAI 52.2 54.4 51.5 53.1 54.8 63.0
NAMCO 66.0 66.7 67.5 68.7 69.8
Debt/equity ratio BANDAI 33.8 18.1 31.6 21.1 21.4 13.3
NAMCO 19.3 18.6 16.3 6.7 6.7*1 Figures for 2001 to 2005 are the consolidated figures for Bandai and NAMCO prior to the management integration.*2 Recurring income (loss) is a Japanese accounting term denoting income before extraordinary items.*3 ROE = Net income (loss) / Average total shareholders’ equity*4 ROA = Recurring income (loss) / Average total assets*5 Figures for total assets and shareholders’ equity as of March 31, 2006, are used in calculating ROA and ROE for the fiscal year ended March 2006.*6 In lieu of interim dividends, share transfer payments of ¥18 per share were paid to shareholders of Bandai and ¥12 were paid to shareholders of NAMCO.

34
Financial Review
■ Overview of Performance
In the fiscal year ended March 31, 2006, corporate earnings were
strong in Japan and corporate sentiment improved moderately.
In addition, capital investment continued to increase. Although
rising crude oil prices and other factors adversely affected consumer
spending, employees’ wages followed a moderate upward trend,
and consumer spending was firm overall.
In the entertainment industry, global competition intensified
further due to the spread and expansion of network environments
stemming from technological innovation. In Japan, the markets are
characterized by ongoing trends of fewer children per family
household and greater diversity in leisure activities. As a result, to
secure stable revenues, companies must attract customers through
aggressive research and development activities and the creation and
availability of appealing products and services.
In the current environment, on September 29, 2005, Bandai Co.,
Ltd., and NAMCO LIMITED implemented a management integration
to establish NAMCO BANDAI Holdings Inc., thereby broadening
and strengthening their business operations and enhancing
shareholder value.
During the year under review, the Tamagotchi Plus series was
popular around the world, and strong performances were reported
by Tamagotchi Connection: Corner Shop for the Nintendo DS and
Mario Kart Arcade GP, an arcade game machine. The Mobile Suit
Gundam series benefited from Group synergies and made a solid
contribution to the Company’s performance. However, in the home
video game software market, in addition to sluggish market condi-
tions, the Company was unable to respond swiftly to changing
customer preferences, and sales of major titles were weak.
Net Sales:
The Company reported consolidated net sales of ¥450.8 billion. In
the domestic market, sales were ¥374.3 billion. Overseas, sales
were ¥44.1 billion in the Americas, ¥31.2 billion in Europe, and
¥32.1 billion in Asia.
Cost of Sales:
Cost of sales was ¥294.3 billion, and the ratio of cost of sales to net
sales was 65.3%. Gross profit was ¥156.6 billion.
SG&A Expenses:
Selling, general and administrative (SG&A) expenses were ¥120.9
billion, and the ratio of SG&A expenses to net sales was 26.8%.
Major items included advertising and promotion of ¥31.1 billion,
directors’ remuneration and employees’ wages of ¥28.2 billion,
retirement and severance benefits of ¥1.1 billion, and R&D expense
of ¥20.2 billion.
Operating Income:
Operating income was ¥35.7 billion, and the operating income
margin was 7.9%.
Other Income (Loss):
Gain on sales of investment securities was ¥3.1 billion, while loss on
impairment of fixed assets was ¥3.0 billion. As a result, net other
loss was ¥0.1 billion.
Net Income:
With conditions in the game market expected to remain
challenging, the Company strictly assessed inventories, such as
inventories of home video game software, and recorded a valuation
loss. In addition, from a conservative accounting perspective, we
established a valuation allowance against deferred income tax
assets at the beginning of the fiscal year. As a result, net income
was ¥14.2 billion and net income per share was ¥54.39.
■ Business Segment Overview
Toys and Hobby SBUIn Japan, the Tamagotchi Plus series, including related products,
reported extremely strong results. In addition, DATA CARDDASS,
which combines digital data and card games, also performed well,
principally with such characters as Dragon Ball Z. Other popular
products included girls’ toys and children’s apparel based on the
Pretty Cure: Max Heart line, Power Rangers toys for boys, and
children’s apparel and goods based on MUSHIKING: The King of
Beetles.
Overseas, the Company worked to build a stable revenue
platform in the Americas by implementing the principles of
selection and concentration in characters and product categories.
Sales in Europe and Asia remained strong, centered on the Power
Rangers and Tamagotchi series.
As a result, the Toys and Hobby SBU recorded sales of ¥181.0
billion and operating income of ¥19.1 billion.

35
Amusement Facility SBU In Japan, the Company took steps to activate the amusement
facility market, such as launching Mario Kart Arcade GP in the
second half of the fiscal year. We also focused on attracting new
customers with a newly developed food theme park and a full-scale
entry into the spa resort facility business. However, these initiatives
were not sufficient to offset the sluggish market conditions in the
first half of the fiscal year and the declining popularity of prize
game machines. Net sales at existing directly managed locations
and amusement facilities were down 1.5% from the previous year.
Overseas, we continued taking steps to counter challenging
market conditions in the Americas, such as expanding revenue-
sharing locations (where revenues derived from coin-operated game
machines are shared), closing unprofitable sites, and implementing
other cost-cutting measures. Nonetheless, successive hurricanes,
rising gasoline prices, and other factors had a negative effect on
market conditions, which were sluggish overall. Net sales at existing
directly managed locations were down 3.0% from the previous
year. In Europe, sales were strong, particularly at amusement
complexes in the United Kingdom, and in Asia the Company
intensified its product development, based on prize games and
other original products.
As a result, the Amusement Facility SBU recorded net sales of
¥79.4 billion and operating income of ¥2.5 billion. At the end of the
fiscal year, we had a total of 1,683 facilities—464 directly managed
facilities, 1,215 revenue-sharing facilities, and 4 theme parks.
Game Contents SBU In the home video game software market, sales of Tamagotchi
Connection: Corner Shop for the Nintendo DS surpassed one
million units in Japan. Super Robot Wars α 3, Tales of the Abyss,
and Dragon Ball Z Sparking!—all for the PlayStation 2—were also
popular in the domestic market. In general, however, the market
was sluggish, and the Company was unable to respond swiftly to
changing customer preferences, both in Japan and overseas. In
addition, sales of other major game titles were slack, and the
Company recorded valuation losses on inventory. Overall, our
performance was weak in this business.
In the arcade game machines market, sales of Mario Kart Arcade GP,
a game for arcade game machines, were extremely strong worldwide.
In addition, Idol M@ster registered a solid performance in Japan,
and Wangan Midnight MAXIMUM TUNE 2 performed strongly in
the Americas.
NAMCO’s content for mobile phones and other mobile platforms
includes TAIKO: Drum Master and the Tales of . . . series, which
were popular in the domestic market, with the number of
subscribers increasing 2.9%, to 980 thousand subscribers at the
end of the year under review. In the Americas, more mobile carriers
are offering games and the number of subscribers is increasing. In
Europe, however, delays in introducing new services and other
factors resulted in weak results.
As a result, the Game Contents SBU recorded net sales of ¥130.4
billion and operating income of ¥10.5 billion.
Network SBUIn its content distribution services for mobile phones, Bandai
Networks Co., Ltd., recorded a decrease in the number of sub-
scribers for stand-by screens and wallpaper, and as a result the total
number of fee-paying subscribers declined. At the end of the fiscal
year under review, Bandai Networks had 3,960,000 paid
subscribers, a decline of 3.3% from the previous fiscal year-end. In
this setting, the company took steps to reinforce its revenue base
by actively introducing high-value-added content, such as Gundam
Network Online Mobile, a Mobile Suit Gundam simulation game.
As a result, the average revenue per subscriber increased. Strong
contributions to Bandai Network’s performance were also made by
the provision of new technologies—such as 2D Vector Engine,
which enables the display of animation on a mobile phone, and 3D
Engine, which delivers three-dimensional renderings of characters—
as well as by solutions services for corporations and web content.
Moreover, in the fiscal year under review, Bandai Networks
entered a tie-up with VIBE Inc., a provider of music-related content
to a variety of mobile communications companies. VIBE has become
a consolidated subsidiary of NAMCO BANDAI Holdings.
As a result, the Network SBU recorded net sales of ¥12.5 billion
and operating income of ¥1.8 billion.
Visual and Music Content SBU In Japan, the Mobile Suit Gundam series fostered powerful Group
synergies and made a substantial contribution to the SBU’s per-
formance. The Mobile Suit Gundam SEED DESTINY, an animated
television series, Mobile Suit Gundam series of theatrical films, and
packages all garnered strong popularity. Sales of DVD videos for rental
use also performed well, with support from an expanding market.
Overseas, the market in the Americas was sluggish, and returns
of unsold items increased, resulting in a weak performance.
In September 2005, NAMCO LIMITED transferred a portion of
the shares it held in Nikkatsu Corporation to Index Corporation. As
a result of this transaction, Nikkatsu ceased to be a consolidated
subsidiary of the Company.
As a result, the Visual and Music Content SBU recorded net sales
of ¥43.3 billion and operating income of ¥6.2 billion.

36
Other Businesses In logistics and other support services, we have taken steps to
increase efficiency. In social welfare, in consideration of Japan’s
aging population, the Group opened a second Kaikaya day service
center and began sales of TalkingAid Light, a portable commu-
nication support device for people with disabilities and senior
citizens that is lighter in weight compared to the conventional
devices.
As a result, Other Businesses recorded net sales of ¥23.1 billion
and an operating loss of ¥0.2 billion.
■ Geographic Segment Overview
JapanIn the Toys and Hobby SBU, favorable performances were recorded
by the Tamagotchi Plus series, DATA CARDDASS, which integrates
digital data and card games, and girls’ toys and children’s apparel,
centered on Pretty Cure: Max Heart.
In the Amusement Facility SBU, we took steps to activate our
operations with the launch of original products in the second half
of the fiscal year and we worked to acquire new customers.
Nonetheless, these initiatives could not offset weak market
conditions in the first half of the fiscal year and the declining
popularity of coin-operated prize game machines.
In the Game Contents SBU, popular home video game software
titles included Tamagotchi Connection: Corner Shop for the
Nintendo DS and Super Robot Wars α 3 for the PlayStation 2.
However, in addition to sluggish market conditions, we failed to
respond quickly to changes in consumer needs. Sales of other main
titles declined steeply compared with previous versions, resulting in
a weak performance. On the other hand, sales of arcade game
machines, such as Mario Kart Arcade GP, were strong.
In the Network SBU, specifically in content distribution services
for mobile phones and other mobile platforms, we reinforced our
profit foundation by actively launching high-value-added content,
leading to an increase in average revenue per subscriber.
In the Visual and Music Content SBU, the Mobile Suit Gundam
series generated strong synergies and made a substantial
contribution to results.
As a result, net sales in Japan totaled ¥374.3 billion and
operating income was ¥37. 6 billion.
The AmericasIn the Americas, we worked to establish a stable foundation for the
Toys and Hobby SBU through a strategy of selection and
concentration for characters and product categories. The Game
Contents SBU recorded favorable sales of arcade game machines,
such as Mario Kart Arcade GP.
However, in home video game software, sales of main titles
declined substantially in comparison with previous versions, and as
a result overall performance was poor. To counter challenging
market conditions, the Amusement Facility SBU continued to take
such steps as expanding facilities operated under revenue-sharing
arrangements, closing unprofitable establishments, and trimming
costs. Despite these efforts, overall performance was sluggish, as
successive hurricanes, rising gasoline prices, and other factors had
an adverse effect on market conditions. Furthermore, performance
in the Visual and Music Content SBU was poor as slack market
conditions prompted increased product returns.
As a result of these factors, in the Americas we recorded sales of
¥44.1 billion and an operating loss of ¥3.3 billion.
Europe In Europe, the Toys and Hobby SBU recorded a strong performance,
centered on the Power Rangers and Tamagotchi series. In the
Amusement Facility SBU, amusement complexes proved popular in
the United Kingdom, and the Game Contents SBU registered
favorable results with software for home video games, such as
Tekken 5: Dark Resurrection and Dragon Ball Z Budokai 4 (Japanese
product name: Dragon Ball Z Sparking!), both products for the
PlayStation 2. In coin-operated game machines, Mario Kart Arcade
GP turned in a solid performance.
As a result, net sales in Europe were ¥31.2 billion and operating
income was ¥4.3 billion.
Asia (excluding Japan)In Asia, the Toys and Hobby SBU registered solid results, centered
on the Power Rangers and Tamagotchi series. In the Amusement
Facility SBU, we reinforced business development through the use
of prize games and original products.
As a result, net sales in Asia were ¥32.1 billion and operating
income was ¥2.3 billion.

37
■ Financial Position
At the end of the fiscal year, on a consolidated basis, current assets
were ¥240.6 billion, investments and other assets were ¥54.9
billion, property, plant and equipment totaled ¥74.1 billion,
intangible assets were ¥17.0 billion, and total assets were ¥386.7
billion.
Current liabilities were ¥107.5 billion, long-term liabilities were
¥26.9 billion, and total liabilities at year-end were ¥134.4 billion.
Total shareholders’ equity at year-end was ¥243.6 billion, and
the shareholders’ equity ratio was 63.0%. In addition, the current
ratio* was 2.2 times, and the quick ratio* was 1.7 times. The
interest coverage ratio* was 125.4 times.
* Current ratio: Current assets / Current liabilities
Quick ratio: (Cash and time deposits + Short-term investments
+ Trade receivables ) / Current liabilities
Interest coverage ratio: (Operating income + Interest income +
Dividend income ) / Interest expense
■ Cash Flow
Cash and cash equivalents at the end of the fiscal year totaled
¥113.2 billion.
Cash flows from operating activities
Net cash provided by operating activities was ¥31.8 billion, due
primarily to ¥35.6 billion in income before income taxes and
minority interests.
Cash flows from investing activities
Net cash used in investing activities was ¥24.4 billion. Major items
included ¥18.0 billion for the acquisition of shares in consolidated
subsidiaries, net of cash acquired, following the acquisition of
shares in Banpresto Co., Ltd., and ¥9.9 billion in purchases of
property, plant and equipment.
Cash flows from financing activities
Net cash used in financing activities was ¥20.0 billion. Major items
included ¥11.0 billion in redemption of bonds, including bonds of
Bandai, and ¥10.6 billion for purchase of treasury stock.
In the fiscal year ending March 31, 2007, the Company expects
net cash provided by operating activities to increase, reflecting
improved results, while the levels of net cash used in investing
activities and financing activities should remain high due to such
factors as capital investments. The net change in cash and cash
equivalents is expected to remain the same as in the fiscal year
ended March 31, 2006, and as a result, cash and cash equivalents
at the end of March 2007 will remain consistent with the prior year.
■ Basic Policy on the Distribution of Profitsand the Payment of Dividends
The Company places a high priority on the distribution of profits to
shareholders, and its basic policy for the payment of dividends is to
continue to pay dividends and raise enterprise value while further
strengthening the Group’s competitiveness and maintaining a
sound financial position. Specifically, our objectives are to maintain
a base level of annual per share dividend payments of ¥24 and a
consolidated dividend payout ratio of 30%.
Internal reserves will be used for aggressive investment for the
purpose of enhancing enterprise value, such as investment to
develop new operational fields and M&A and alliance initiatives.
In lieu of interim dividends, share transfer payments of ¥18 per
share were paid to shareholders of Bandai and ¥12 were paid to
shareholders of NAMCO. In accordance with the Company’s basic
policy, year-end dividend payments were ¥12 per share.
■ Targets and Management Indicators
The Group uses ROA and ROE for the medium-term management
indicators. The Group believes that it can reinforce and stabilize its
management foundation over the medium to long term by striving to
consistently utilize all of its assets and shareholders’ equity effectively.
In fiscal year ending March 2009, the final year of the Medium-
Term Management Plan that the Group rolled out in April 2006,
our targets, on a consolidated basis, are ROA of 13.5% and ROE of
10.0%. We will strive to further increase management efficiency
and expand operations.
■ Outlook for the Fiscal Year Ending March 2007
Although there are positive signs in employment and consumer
spending, stemming from improved corporate performances and
increased capital investment, there is cause for concern, such as
rising crude oil prices, and the economic outlook remains uncertain.
In this environment, the Group will work to strengthen, enrich,
and expand its portfolio management, based on the three-year
Medium-Term Management Plan launched in April 2006.

38
In the Toys and Hobby SBU, in addition to popular characters
from Power Rangers (Boukenjer), Mobile Suit Gundam, and
Tamagotchi, we will work to create and develop new characters
and to further strengthen content offerings targeting a wide range
of customers. Moreover, in the Americas, we will strive to establish
a stable foundation by implementing the principles of selection and
concentration for characters and product categories.
In the Amusement Facility SBU, we will work to increase sales by
actively opening large facilities and introducing new business
formats. At the same time, we will strive to expand profits by
sharing our experience for low-cost operations. Moreover, in the
Americas, we will continue to increase the number of revenue-
sharing locations and reduce costs.
In the Game Contents SBU, in order to facilitate prompt
responses to rapidly changing operating environments in Japan and
overseas, we will work to meet customer needs and implement a
balanced multiplatform strategy. At the same time, we will strive to
increase the efficiency of sales and development activities.
Furthermore, we will leverage the Group’s strengths to generate
sales of coin-operated game machines, such as Mobile Suit
Gundam: Senjo no Kizuna.
In the Network SBU, we will provide high-value-added content
for mobile platforms, such as SD Gundam RPG, and move ahead
with planning and development targeting our entry into the field of
video distribution. We will also reinforce our solutions operations
and enlarge our mail-order site.
In the Visual and Music Content SBU, we will reinforce our
existing DVD video business, such as through the sale of DVD box
sets of the extremely popular Mobile Suit Gundam TV 23 series. We
will also work to respond to changes in the operating environment,
such as new markets and media, while striving to expand our
operations.
As a result, our consolidated financial forecasts for the fiscal year
ending March 2007 are for net sales of ¥470.0 billion, an increase
of 4.3%; recurring income of ¥40.5 billion, an increase of 9.1%;
and net income of ¥22.0 billion, an increase of 55.5%.
■ Forward-Looking Statements
Forecasts for the next fiscal year and other future projections in this
annual report are based on information available to the Group at the
time they were made and are therefore subject to various risks and
uncertainties. Actual results therefore may differ materially from
projections for a variety of factors. Major factors that could influence
results include changes in the Company and the Group’s operating
environment, market trends, and exchange rate fluctuations.
■ Business Risks
Risk factors related to the BANDAI NAMCO Group’s businesses that
might significantly affect decisions made by the investment
community, include, but are not limited to, those listed below.
These statements on risk are based on information available to the
Group as of May 11, 2006.
1. Risks associated with the core business modelThe Group’s businesses are centered on products and services
based on content, such as characters. Accordingly, the Group’s
operating results might be affected by changes in the popularity of
specific content or related trends. Therefore, the Group is working
to achieve stable earnings by strengthening, enriching, and
expanding its portfolio management through three-dimensional
and multi-lateral business administration. This portfolio manage-
ment comprises business portfolios, in which the Group conducts
operations in a diverse array of business domains; content
portfolios, where many different content lines are developed; and
regional portfolios, where businesses are conducted in regions
around the world. In each business, the Group works to develop
new content and conducts marketing activities designed to cultivate
and develop that content over the long term.
2. Risks associated with overseas businessexpansion
The Group is aggressively expanding its business overseas. This
initiative exposes the Group to a variety of risks, including business
risks associated with regional characteristics, such as local media
and distribution systems; risks associated with intellectual property
rights, such as those related to counterfeit products; and risks
associated with fluctuations in exchange rates. Operationally, the
Group conducts sufficient research to minimize these risks and
formulates countermeasures before proceeding with overseas
business expansion. With respect to intellectual property rights, the
Group cooperates with local government agencies and other
authorities to identify counterfeit products, promote enhanced
recognition of genuine products, etc. In addition, for foreign-
exchange risks, the Group uses forward contracts to lower the risks
from short-term fluctuations in the exchange rates for major
currencies.

39
3. Retaining and developing employees In the fast-changing entertainment industry, it is essential for the
Group to retain and develop employees who can respond
effectively to rapid changes. In addition to developing a
compensation system that will facilitate the retention of these
employees, the Group actively delegates authority. To develop the
next generation of employees, the Group is devoting resources to
training seminars and other development programs.
4. Risk associated with game contents business In the game contents business, titles are a significant cause of
fluctuations in profits, and there is a risk that changes in the timing
of product launches will affect earnings in a given period. The
Group tightly controls software development schedules for every
game while striving to diversify risks by flexibly developing multiple
products with different software characteristics and development
periods. Moreover, with a slowdown in sales associated with the
launch of new game platforms and with customer needs
diversifying, market conditions remain marked by uncertainty. The
Group is therefore working to implement a title composition that is
balanced across individual game platforms and to respond promptly
to customer needs.
5. Risks associated with advances in and newgenerations of platforms
In developing game content, visual content, and network content,
the Group faces the risk of delays in responding to advances in and
new generations of content-provision platforms and the risk of
delays in changing its business models in response to these
developments. The Group conducts research into new technologies
and works to develop competitive content that is in step with the
latest advances. At the same time, the Group actively works to
acquire expertise on new business models. Additionally, the Group
takes steps to further develop the content that it has created and to
acquire rights to new content.
6. Decline in domestic birthrate In the future, an ongoing decline in the domestic birthrate might
affect the financial results of the Group. Accordingly, the Group has
been expanding the scope and target of its business activities in
Japan and is aggressively taking steps to expand its operations in
overseas markets.
7. Concentration of production in China In the Group’s Toys and Hobby SBU, approximately 90% of the toys
are manufactured in China. The Group faces the risk of higher
production costs from the revaluation of the yuan and country risk
stemming from the regional concentration of production. In
response, the Group is working to reduce production costs and to
diversify its production bases into Southeast Asia and other regions.
8. Risks from higher crude oil prices The Group faces the risk that higher crude oil prices could lead to
higher production costs from increased product raw material prices
and to higher transportation costs. Accordingly, the Group is
working to standardize the metal casts and molds used for
character toys marketed worldwide and to reduce costs by
enhancing the efficiency of processes, ranging from production to
distribution.
Additional risks include disasters, such as natural disasters or
accidents, changes in laws and regulations, defective or deficient
products or services, leaks of customer information, and litigation
associated with business activities. The Group maintains risk
management systems and works to strengthen its management
foundation in order to minimize the effects on its results in the
unlikely event that any of these risks should materialize.

40
NAMCO BANDAI Holdings Inc. and Consolidated SubsidiariesAs of March 31, 2006
Thousands ofU.S. dollars
Millions of yen (note 3)
2006 2006
Assets
Current assets:
Cash and time deposits (note 4) ¥ 109,514 $ 932,272
Short-term investments (notes 4 and 5) 5,547 47,221
Trade receivables (note 6) 70,911 603,652
Allowance for doubtful receivables (1,506) (12,820)
Inventories (note 7) 27,530 234,358
Deferred tax assets (note 12) 7,038 59,913
Other current assets 21,601 183,884
Total current assets 240,635 2,048,480
Investments and other assets:
Investment securities (note 5) 22,522 191,726
Guarantee money deposited 24,916 212,105
Deferred tax assets (note 12) 3,901 33,208
Other investments and assets 4,822 41,049
Allowance for doubtful receivables (1,212) (10,318)
Total investments and other assets 54,949 467,770
Property, plant and equipment:
Buildings and structures 32,150 273,687
Amusement facilities and machines 87,048 741,024
Land 22,094 188,082
Other property, plant and equipment 55,141 469,405
Total 196,433 1,672,198
Less accumulated depreciation (122,360) (1,041,628)
Net property, plant and equipment 74,073 630,570
Intangible assets:
Consolidation goodwill 7,668 65,276
Other intangible assets 9,326 79,391
Total intangible assets 16,994 144,667
Total assets ¥ 386,651 $ 3,291,487
See accompanying Notes to Consolidated Financial Statements.
Consolidated Balance Sheet

41
Thousands ofU.S. dollars
Millions of yen (note 3)
2006 2006
Liabilities, minority interests and shareholders’ equity
Current liabilities:
Short-term borrowings (note 9) ¥ 19,888 $ 169,303
Trade payables (note 10) 40,561 345,288
Accrued expenses 32,362 275,492
Accrued income taxes (note 12) 6,827 58,117
Other current liabilities (note 12) 7,890 67,166
Total current liabilities 107,528 915,366
Long-term liabilities:
Long-term debt (note 9) 12,542 106,768
Accrued retirement and severance benefits (note 11) 2,970 25,283
Deferred tax liabilities (note 12) 7,283 61,999
Other long-term liabilities 4,084 34,765
Total long-term liabilities 26,879 228,815
Total liabilities 134,407 1,144,181
Minority interests 8,637 73,525
Shareholders’ equity:
Common stock (note 17)
Authorized 1,000,000,000 shares;
issued 260,580,191 shares 10,000 85,128
Additional paid-in capital (note 17) 95,772 815,289
Retained earnings (note 15) 164,504 1,400,392
Land revaluation difference (notes 12 and 16) (21,460) (182,685)
Other securities valuation difference (notes 5 and 12) 4,145 35,286
Translation adjustment 1,802 15,340
Total 254,763 2,168,750
Treasury stock, at cost; 7,616,892 shares (11,156) (94,969)
Total shareholders’ equity 243,607 2,073,781
Contingencies (note 20)
Total liabilities, minority interests and shareholders’ equity ¥386,651 $3,291,487

42
NAMCO BANDAI Holdings Inc. and Consolidated SubsidiariesYear Ended March 31, 2006
Thousands ofU.S. dollars
Millions of yen (note 3)
2006 2006
Net sales ¥450,829 $3,837,822
Cost of sales 294,264 2,505,014
Gross profit 156,565 1,332,808
Selling, general and administrative expenses (note 13) 120,896 1,029,165
Operating income 35,669 303,643
Other income (loss):
Interest and dividend income 960 8,172
Interest expense (292) (2,486)
Gain on sales of investment securities 3,073 26,160
Loss on valuation of investment securities (260) (2,213)
Gain (loss) on sales and disposal of property, plant and equipment (68) (579)
Loss on impairment of fixed assets (note 8) (3,001) (25,547)
Other (511) (4,349)
(99) (842)
Income before income taxes and minority interests 35,570 302,801
Income taxes (note 12) 19,282 164,145
Minority interests 2,138 18,200
Net income ¥ 14,150 $ 120,456
U.S. dollarsYen (note 3)
Data per common share (note 14):
Net assets at March 31 ¥961.36 $8.18
Net income:
Basic 54.39 0.46
Diluted 54.37 0.46
Dividend applicable to period (note 15) 12.00 0.10
See accompanying Notes to Consolidated Financial Statements.
Consolidated Statement of Income
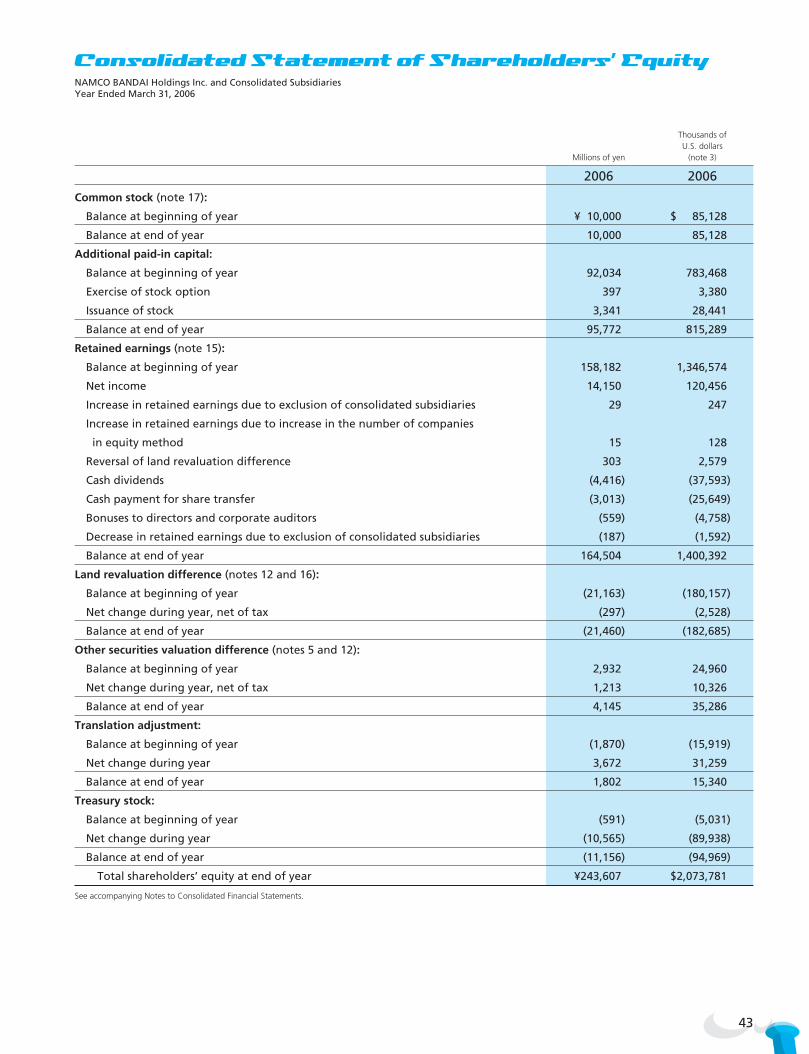
43
NAMCO BANDAI Holdings Inc. and Consolidated SubsidiariesYear Ended March 31, 2006
Thousands ofU.S. dollars
Millions of yen (note 3)
2006 2006
Common stock (note 17):
Balance at beginning of year ¥ 10,000 $ 85,128
Balance at end of year 10,000 85,128
Additional paid-in capital:
Balance at beginning of year 92,034 783,468
Exercise of stock option 397 3,380
Issuance of stock 3,341 28,441
Balance at end of year 95,772 815,289
Retained earnings (note 15):
Balance at beginning of year 158,182 1,346,574
Net income 14,150 120,456
Increase in retained earnings due to exclusion of consolidated subsidiaries 29 247
Increase in retained earnings due to increase in the number of companies
in equity method 15 128
Reversal of land revaluation difference 303 2,579
Cash dividends (4,416) (37,593)
Cash payment for share transfer (3,013) (25,649)
Bonuses to directors and corporate auditors (559) (4,758)
Decrease in retained earnings due to exclusion of consolidated subsidiaries (187) (1,592)
Balance at end of year 164,504 1,400,392
Land revaluation difference (notes 12 and 16):
Balance at beginning of year (21,163) (180,157)
Net change during year, net of tax (297) (2,528)
Balance at end of year (21,460) (182,685)
Other securities valuation difference (notes 5 and 12):
Balance at beginning of year 2,932 24,960
Net change during year, net of tax 1,213 10,326
Balance at end of year 4,145 35,286
Translation adjustment:
Balance at beginning of year (1,870) (15,919)
Net change during year 3,672 31,259
Balance at end of year 1,802 15,340
Treasury stock:
Balance at beginning of year (591) (5,031)
Net change during year (10,565) (89,938)
Balance at end of year (11,156) (94,969)
Total shareholders’ equity at end of year ¥243,607 $2,073,781
See accompanying Notes to Consolidated Financial Statements.
Consolidated Statement of Shareholders’ Equity

44
NAMCO BANDAI Holdings Inc. and Consolidated SubsidiariesYear Ended March 31, 2006
Thousands ofU.S. dollars
Millions of yen (note 3)
2006 2006Cash flows from operating activities:
Income before income taxes and minority interests ¥ 35,570 $ 302,801Depreciation 19,144 162,969 Loss on impairment of fixed assets 3,001 25,547Loss (gain) on sales and disposal of property, plant and equipment 68 579 Loss on disposal of amusement facilities and machines 1,348 11,475 Gain on sales of investment securities (3,073) (26,160)Loss on valuation of investment securities 260 2,213Decrease (increase) in trade receivables 4,455 37,925 Decrease (increase) in inventories 5,842 49,732 Acquisition of amusement facilities and machines (10,892) (92,722)Increase (decrease) in trade payables (2,679) (22,806)Other (5,091) (43,338)
Subtotal 47,953 408,215 Interest and dividends received 1,349 11,484 Interest paid (352) (2,997)Income taxes paid (17,141) (145,918)
Net cash provided by operating activities 31,809 270,784 Cash flows from investing activities:
Decrease (increase) in time deposits (351) (2,988)Purchases of property, plant and equipment (9,924) (84,481)Sales of property, plant and equipment 4,388 37,354Purchases of intangible assets (3,204) (27,275)Purchases of investment securities (2,064) (17,570)Sales of investment securities 783 6,666Acquisition of shares in consolidated subsidiaries, net of cash acquired (18,033) (153,512)Sales of shares in consolidated subsidiaries 349 2,971 Purchase of subsidiary shares affecting the scope of consolidation (1,781) (15,161)Sales of subsidiary shares affecting the scope of consolidation 5,439 46,301Payment of guarantee money deposited (883) (7,517)Collection of guarantee money deposited 1,964 16,719Other (1,090) (9,279)
Net cash used in investing activities (24,407) (207,772)Cash flows from financing activities:
Increase (decrease) in short-term borrowings 10,848 92,347 Proceeds from long-term debt 575 4,895Repayment of long-term debt (13,399) (114,063)Proceeds from issuance of stock 397 3,380Proceeds from capital paid by minority interests 20 170 Purchase of treasury stock (10,551) (89,819)Dividends paid (4,416) (37,593)Dividends paid to minority interests (426) (3,626)Cash payments for share transfer (3,013) (25,649)
Net cash used in financing activities (19,965) (169,958)Effect of exchange rate changes on cash and cash equivalents 1,676 14,267 Net increase (decrease) in cash and cash equivalents (10,887) (92,679)Cash and cash equivalents at beginning of year 124,924 1,063,455 Increase in cash and cash equivalents due to additional consolidation of subsidiaries 10 85 Decrease in cash and cash equivalents due to exclusion of consolidated subsidiaries (861) (7,330)Cash and cash equivalents at end of year (note 4) ¥113,186 $ 963,531
See accompanying Notes to Consolidated Financial Statements.
Consolidated Statement of Cash Flows
45
NAMCO BANDAI Holdings Inc. and Consolidated Subsidiaries
1 Basis of Presentation
NAMCO BANDAI Holdings Inc. (“the Company”) and its
consolidated subsidiaries (collectively, “the Company”) have
prepared their financial statements in accordance with the
provisions set forth in the Japanese Securities and Exchange
Law and its related accounting regulations, and in conformity
with accounting principles generally accepted in Japan, which
are different in certain respects as to application and disclo-
sure requirements of International Financial Reporting Standards.
The accounts of overseas subsidiaries are based on their
accounting records maintained in conformity with generally
accepted accounting principles prevailing in the respective
countries of domicile. The accompanying consolidated
financial statements have been prepared and translated into
English from the consolidated financial statements of the
Company prepared in accordance with Japanese GAAP and
filed with the appropriate Local Finance Bureau of the Ministry
of Finance as required by the Securities and Exchange Law.
Some supplementary information included in the statutory
Japanese language consolidated financial statements that is
not required for fair presentation is not presented in the
accompanying consolidated financial statements.
In preparing the accompanying consolidated financial state-
ments, certain reclassifications have been made to the
consolidated financial statements issued in Japan in order to
present them in a form that is more useful to readers outside
Japan.
2 Summary of Significant Accounting Policies
(a) Principles of Consolidation
The accompanying consolidated financial statements include
the accounts of the Company and its significant subsidiaries.
Consolidation of the remaining subsidiaries would have had
no material effect on the accompanying consolidated financial
statements. Investments in significant affiliates are stated at
the Company’s equity in their underlying net assets.
Investments in unconsolidated subsidiaries and certain
affiliates other than those discussed in the previous paragraph
are stated at cost, and if the equity method had been applied
to the investments in these companies, there would have been
no material effect on the accompanying consolidated financial
statements.
All significant intercompany accounts and transactions have
been eliminated in consolidation. The excess of cost over the
underlying fair value of the net assets of consolidated
subsidiaries from acquisition is being amortized over a five-
year period.
(b) Matters Relating to Capital Consolidation Procedures
Accompanying a Share Transfer
NAMCO BANDAI Holdings Inc. was established in a stock
exchange program as a holding company for Bandai Co., Ltd.,
and NAMCO Limited (currently NAMCO BANDAI Games Inc.).
The consolidation procedures for the business combination
were accounted in accordance with “capital consolidation
procedure for the establishment of the entire parent and
subsidiary relationship use a stock-to-stock exchange and the
stock-transfer method” (Japanese Institute of Certified Public
Accountants (JICPA) Accounting Committee Research Report
No. 6). The consolidation was accounted for under the pooling-
of-interests method.
The Company considered the operations, financial position
and sharing of the risks and rewards of the consolidating
entities and believed that pooling the interest of both entities
was appropriate for the combination.
(c) Cash and Cash Equivalents
In reporting cash flows, the Company considers cash on hand,
demand deposits and all highly liquid investments with
original maturities of three months or less to be cash and cash
equivalents (note 4).
Notes to Consolidated Financial Statements

46
(d) Foreign Currency Translation
Foreign currency transactions are translated into yen at rates
in effect at the dates they are transacted, and the gains or
losses arising from the settlement of the related receivables or
payables are reflected in “Other income (loss)”.
Receivables and payables denominated in foreign currencies
at the balance sheet date are translated at the rates in effect
as of the balance sheet dates, and the unrealized gains or
losses are reflected in “Other income (loss)”.
The assets and liabilities of foreign consolidated subsidiaries
and affiliates are translated into yen at the rates of exchange
in effect at the balance sheet dates. Revenue and expenses of
foreign consolidated subsidiaries and affiliates are translated
into yen at the average rates of exchange during the year.
Gains and losses resulting from foreign currency transactions
are included in “Other income (loss)”, and those resulting
from the translation of financial statements are generally
excluded from the consolidated statements of income and are
included in “Minority interests” and “Translation adjustment”
in “Shareholders’ equity”.
(e) Accounting Standards for Income and Expenses
Accounting procedures for video game software production
expenses:
A distinctive characteristic of video game software is the
production through which the software is combined with the
content that cannot be separated into identifiable components.
The content is considered an important component of each
video game title which combines the game content and
visual / music data. Once management makes a decision to go
forward in distributing the title, the Company records the
software and content development costs to inventory and
advanced payments.
The capitalized production costs (which include inventory
and advanced payments) are amortized to cost of sales based
on projected sales volumes.
(f) Short-Term Investments and Investment Securities
The Company classifies its securities into one of the following
three categories: held-to-maturity securities, investments in
unconsolidated subsidiaries and affiliated companies, or other
securities.
Held-to-maturity securities are amortized to face value over
the period remaining to the maturity date. Investments in
unconsolidated subsidiaries and affiliated companies are
carried at cost. Other securities with a market value are
principally carried at market value. The difference, net of tax,
between the acquisition cost and the carrying amount of
other securities, including unrealized gains and losses, is
recognized in “Other securities valuation difference” in
“Shareholders’ equity” until realized. Other securities without
a market value are principally carried at cost. The cost of other
securities sold is principally computed based on the moving
average method.
(g) Allowance for Doubtful Receivables
The allowance for doubtful receivables is provided for possible
losses on unrecoverable receivables. For ordinary receivables,
the amount of the allowance is based on the historical rate of
loss. For receivables from debtors at risk of bankruptcy and
receivables from debtors in bankruptcy or under reorganiza-
tion, the amount of the allowance is based on individually
estimated unrecoverable amounts.
(h) Inventories
Domestic consolidated subsidiaries:
Inventories are stated at cost determined on an average cost
basis.
Foreign consolidated subsidiaries:
Inventories are stated at the lower of cost, determined
principally by the first-in, first-out method, or market.
However, both domestic and foreign consolidated subsidiaries
state work-in-process of game software by the specific-cost
method.
47
(i) Income Taxes
Current income taxes are accounted for based on income and
deferred income taxes are accounted for under the asset and
liability method. Deferred tax assets and liabilities are
recognized for future tax consequences attributable to dif-
ferences between the financial statement carrying amounts of
existing assets and liabilities and their respective tax bases and
operating loss and tax credit carryforwards. Deferred tax
assets and liabilities are measured using enacted tax rates
expected to apply to taxable income in the years in which
those temporary differences are expected to be recovered or
settled. The effect on deferred tax assets and liabilities of a
change in the tax rate is recognized in income in the period
that includes the enactment date.
(j) Property, Plant and Equipment
The Company and its domestic consolidated subsidiaries:
Depreciation of property, plant and equipment is principally
computed by the declining-balance method based on
estimated useful life. The straight-line method is used for
buildings (except for building fixtures) acquired since April 1,
1998. The estimated useful lives for Buildings and structures
and Amusement facilities and machines are 2-50 years and
3-15 years, respectively.
Foreign consolidated subsidiaries:
Depreciation of property, plant and equipment is principally
computed by the straight-line method based on estimated
useful life. The estimated useful lives for Buildings and
structures and Amusement facilities and machines are 5-50
years and 2-7 years, respectively.
(k) Intangible Assets
Depreciation of intangible assets is computed by the straight-
line method based on estimated useful life. Software for
company use is depreciated over 2-5 years.
Goodwill incurred by domestic subsidiaries is amortized over
5 years using the straight-line method.
Goodwill incurred by foreign subsidiaries is amortized in
conformity with accounting principles and practices generally
accepted in the country of incorporation.
(l) Impairment of Fixed Assets
The Company has applied the Accounting Standard for
Impairment of Fixed Assets (the “Opinion Concerning
Establishment of Accounting Standard for Impairment of Fixed
Assets” (Business Accounting Deliberation Council, August 9,
2002) and the “Implementation Guidance for the Accounting
Standard for Impairment of Fixed Assets” (Guidance on
Corporate Accounting Standard No. 6, October 31, 2003).
The amount of accumulated losses on impairment of fixed
assets is deducted directly from the amount of each asset
pursuant to the Regulations Concerning Financial Statements.
(m) Derivatives and Hedging Activities
The Company and its consolidated subsidiaries use derivative
instruments, such as forward exchange contracts and interest
rate swap contracts, to reduce market risks stemming from
fluctuations in foreign exchange rates and interest rates. The
Company and its consolidated subsidiaries use these derivative
instruments solely for the purpose of reducing the risk of
fluctuations, such as fluctuations in foreign exchange rates
and interest rates, to which it is exposed in the course of its
business activities. Accordingly, the Company does not use
derivative instruments or other financial instruments for
speculative purposes.
Because the Company’s counterparties for derivative
instruments are all highly creditworthy financial institutions,
the Company believes that it is exposed to almost no
counterparty risk. Also, derivative transactions are conducted
in accordance with internal rules that specify transaction
authority and transaction amount limits, within the scope of
the above policies, and for the intended purposes.
As a general rule, companies are required to state derivative
instruments at fair value. For derivative instruments that meet
the standards for hedge accounting, recognition of gains or
losses is deferred. In cases where forward foreign exchange
contracts meet certain hedging criteria, they are accounted for
48
under the allocation method. Interest rate swaps that meet
specific matching criteria are accounted for using special
methods.
As a general rule, the Company assesses the effectiveness of
hedging transactions from the start of the transaction to the
point at which effectiveness is assessed, comparing the
cumulative changes in the fair value or the cumulative
changes in the cash flows of the hedged item with the
cumulative changes in the fair value or the cumulative
changes in the cash flows of the hedging instrument. The
assessment is based on the amounts of those changes. In the
event that important conditions are the same for the hedging
instrument and the hedged assets, liabilities, or scheduled
transaction, it is obvious that the hedge is 100% effective, so
the assessment of effectiveness is not abbreviated. Also, for
interest rate swaps for which the special methods are applied,
the assessment of effectiveness is abbreviated.
In the event that a hedge loses its effectiveness, hedge
accounting is no longer applied and the recognition of the
gains or losses on the hedge transaction is no longer deferred.
(n) Retirement and Severance Benefits
The Company has established a retirement lump-sum grant
system and a defined contribution pension plan. With the
exception of certain companies, domestic consolidated
subsidiaries have established qualified retirement benefit
plans, retirement lump-sum grants, or comprehensive
employee pension funds. At the Company’s discretion,
additional benefits may be paid at retirement. Certain
overseas consolidated subsidiaries have established defined
contribution retirement pension plans.
The allowance for retirement benefits for employees is
provided for based on the estimated values of retirement
benefit obligations and pension plan assets at the end of the
fiscal year. Unrecognized actuarial gain or loss is amortized,
beginning from the fiscal year following the year in which it is
incurred, using the straight-line method over a period that
does not exceed the average remaining years (10 to 17 years)
of service of employees as of the end of the fiscal year in
which it is incurred. Certain domestic consolidated subsidiaries
amortize prior service costs over a fixed period (10 years) that
does not exceed the average remaining years of service of
employees at the point when the costs are incurred, and, to
provide for payment of retirement benefits to directors and
auditors, they record the amount needed at the end of the
fiscal year in accordance with internal regulations.
(o) Leases
Financial leases, except for those where the legal title to the
underlying property is transferred from the lessor to the lessee
at the end of the lease term, are accounted for similar
to operating leases. The Company and its consolidated
subsidiaries do not have any leases where the title is trans-
ferred. However, overseas consolidated subsidiaries account
for finance leases as ordinary purchase or sale transactions in
accordance with local accounting principles.
(p) Issuance of Shares by Consolidated Subsidiaries
The change in the Company’s proportionate share of
consolidated subsidiary equity resulting from issuance of
capital stock by the consolidated subsidiaries is accounted for
in the consolidated statement of income.
(q) Appropriation of Retained Earnings
In Japan, retained earnings with respect to a given financial
period are appropriated by resolution of the shareholders at a
general meeting to be held subsequent to the close of such
financial period. The accounts for that period do not,
therefore, reflect such appropriations.
(r) Data per Common Share
In computing basic net income per common share, the
average number of shares outstanding during each year has
been used.
Diluted net income per share assumes the dilution that
could occur if securities or other contracts to issue common
stock were exercised or converted into common stock, or
resulted into issuance of common stock.
Cash dividends per common share are computed based on
dividends declared with respect to the income for the year.

49
4 Cash and Cash Equivalents
A reconciliation of cash and cash equivalents at March 31, 2006 between the balance sheet and the statement of cash flows is as
follows:
Thousands ofMillions of yen U.S. dollars
2006 2006
Cash and time deposits ¥109,514 $932,272
Short-term investments 5,547 47,221
Time deposits with maturities in excess of three months (1,875) (15,962)
Cash and cash equivalents per consolidated statement of cash flows ¥113,186 $963,531
Cash and time deposits of ¥54 million ($460 thousand) at March 31, 2006 are pledged as collateral for short-term borrowings
of ¥29 million ($247 thousand).
5 Short-Term Investments and Investment Securities
Short-term investments and investment securities at March 31, 2006 are summarized as follows:
Held-to-maturity securities at March 31, 2006 include marketable governmental bond securities with a carrying amount of
¥10 million ($85 thousand), which approximates market value.
Thousands ofMillions of yen U.S. dollars
2006 2006
Held-to-maturity securities ¥ 47 $ 400
Other securities–marketable 11,548 98,307
Other securities–non-marketable 7,190 61,207
Investments in unconsolidated subsidiaries and affiliated companies 9,284 79,033
Total of short-term investments and investment securities ¥28,069 $238,947
The original cost, carrying amount (market value) and gross unrealized holding gain (loss) for marketable other securities at
March 31, 2006 are summarized as follows:
Millions of yen
2006Gross Unrealized Gross Unrealized Carrying Amount
Original Cost Holding Gain Holding Loss (Market Value)
Other securities–marketable:
Equity securities ¥2,971 ¥8,316 ¥(128) ¥11,159
Debt securities 100 — (2) 98
Other 233 62 (4) 291
Total ¥3,304 ¥8,378 ¥(134) ¥11,548
3 Financial Statement Translation
The consolidated financial statements are expressed in yen.
However, solely for the convenience of the reader, the
consolidated financial statements as of and for the year ended
March 31, 2006 have been translated into U.S. dollars at the
rate of ¥117.47=US$1, the approximate exchange rate on the
Tokyo Foreign Exchange Market on March 31, 2006.
This translation should not be construed as an indication
that the amounts shown could be converted into U.S. dollars
at such rate.

50
Thousands of U.S. dollars
2006Gross Unrealized Gross Unrealized Carrying Amount
Original Cost Holding Gain Holding Loss (Market Value)
Other securities–marketable:
Equity securities $25,293 $70,793 $(1,090) $94,996
Debt securities 851 — (17) 834
Other 1,983 528 (34) 2,477
Total $28,127 $71,321 $(1,141) $98,307
Proceeds and gross realized gains and losses from the sale of other securities in the year ended March 31, 2006 are as follows:
Thousands ofMillions of yen U.S. dollars
2006 2006
Proceeds from the sales of other securities ¥783 $6,666
Gross realized gains from the sales of other securities 489 4,163
Gross realized losses from the sales of other securities — —
The following is a summary of non-marketable securities at March 31, 2006:
Thousands ofMillions of yen U.S. dollars
2006 2006Carrying Amount Carrying Amount
Other securities–non-marketable:
Unlisted stock securities ¥1,579 $13,442
Non-listed equity securities money market fund, etc. 5,047 42,964
Other 564 4,801
Total ¥7,190 $61,207
Other securities with specified maturity dates and held-to-maturity securities at March 31, 2006 mature as follows:
Millions of yen
2006Due: Within After 1 After 5
One Year through 5 Years through 10 Years
Debt securities:
Governmental bond securities ¥— ¥10 ¥ —
Corporate bond securities — — 135
Total ¥— ¥10 ¥135
Thousands of U.S. dollars
2006Due: Within After 1 After 5
One Year through 5 Years through 10 Years
Debt securities:
Governmental bond securities $— $85 $ —
Corporate bond securities — — 1,149
Total $— $85 $1,149

51
6 Trade Receivables
Trade receivables at March 31, 2006 are summarized as follows:
Thousands ofMillions of yen U.S. dollars
2006 2006
Notes receivable ¥ 8,218 $ 69,958
Accounts receivable–trade 62,693 533,694
Total ¥70,911 $603,652
7 Inventories
Inventories at March 31, 2006 are summarized as follows:
Thousands ofMillions of yen U.S. dollars
2006 2006
Finished goods ¥ 9,743 $ 82,940
Work in process 14,618 124,441
Raw materials and supplies 3,169 26,977
Total ¥27,530 $234,358
8 Loss on Impairment of Fixed Assets
In order to test for impairment, the Company and its consolidated subsidiaries formed group assets by strategic business unit for
management accounting purposes, excluding important idle assets, assets scheduled for disposal and leased assets.
In order to fairly state the Company’s financial position, the Company reduced the book values of the following assets
scheduled for disposal and intangible assets to recoverable amounts during fiscal 2006 and reported the reduction as an
impairment loss in “Other income (loss)”.
The recoverable amounts for land in the following table have been calculated based on net sales prices, assessed in accordance
with real estate appraisals. In calculating the recoverable values of other assets, the value in use is considered to be zero.
Millions of yen Thousands of U.S. dollars
Location Use Item Impairment Loss
Minato-ku, Tokyo — Consolidation goodwill ¥1,619 $13,783
Matsudo-shi, Chiba Cultural facility Buildings and structures, etc. 825 7,023
Ota-ku, Tokyo Parking Land 531 4,520
Taito-ku, Tokyo Software for internet content business Other intangible assets 26 221
Total ¥3,001 $25,547

52
9 Short-Term Borrowings and Long-Term Debt
Short-term borrowings at March 31, 2006 are summarized as follows:
Thousands ofMillions of yen U.S. dollars
2006 2006
Bank borrowings ¥12,661 $107,781
Long-term debt due within one year 7,227 61,522
Total ¥19,888 $169,303
The weighted average interest rate on bank borrowings outstanding at March 31, 2006 was 0.61%.
Thousands ofMillions of yen U.S. dollars
2006 2006
Loans, principally from banks, maturing in installments through March 31, 2012;
the weighted average interest rates of current installments at March 31, 2006
was 0.96% and non-current installments at March 31, 2006 was 1.14% ¥ 4,769 $ 40,598
0.60% debentures, due Mar. 28, 2007 5,000 42,564
0.69% debentures, due Mar. 28, 2008 10,000 85,128
Total long-term debt 19,769 168,290
Less current installments (7,227) (61,522)
Total ¥12,542 $106,768
The aggregate annual maturities of long-term debt outstanding at March 31, 2006 are as follows:
Thousands ofYears ending March 31 Millions of yen U.S. dollars
2007 ¥ 7,227 $ 61,522
2008 11,408 97,115
2009 596 5,074
2010 346 2,945
2011 96 817
2012 96 817
Total ¥19,769 $168,290
10 Trade Payables
Trade payables at March 31, 2006 are summarized as follows:
Thousands ofMillions of yen U.S. dollars
2006 2006
Notes payable ¥ 7,998 $ 68,085
Accounts payable–trade 32,563 277,203
Total ¥40,561 $345,288
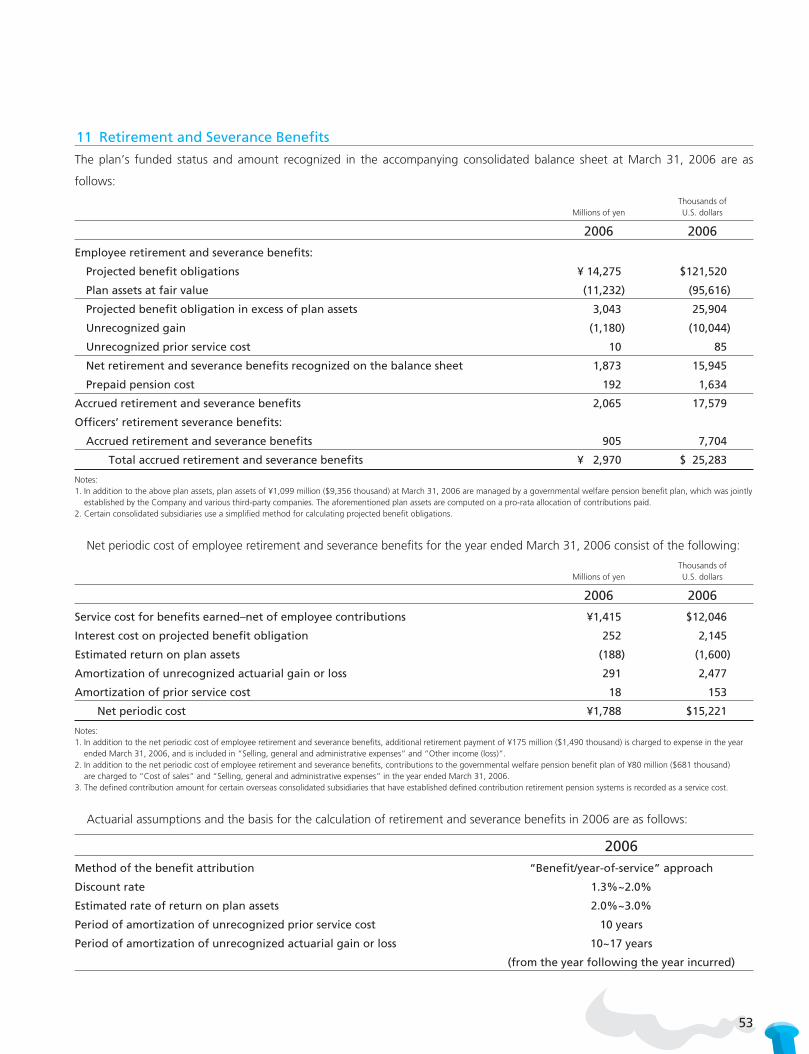
53
11 Retirement and Severance Benefits
The plan’s funded status and amount recognized in the accompanying consolidated balance sheet at March 31, 2006 are as
follows:
Thousands ofMillions of yen U.S. dollars
2006 2006
Employee retirement and severance benefits:
Projected benefit obligations ¥ 14,275 $121,520
Plan assets at fair value (11,232) (95,616)
Projected benefit obligation in excess of plan assets 3,043 25,904
Unrecognized gain (1,180) (10,044)
Unrecognized prior service cost 10 85
Net retirement and severance benefits recognized on the balance sheet 1,873 15,945
Prepaid pension cost 192 1,634
Accrued retirement and severance benefits 2,065 17,579
Officers’ retirement severance benefits:
Accrued retirement and severance benefits 905 7,704
Total accrued retirement and severance benefits ¥ 2,970 $ 25,283
Notes:1. In addition to the above plan assets, plan assets of ¥1,099 million ($9,356 thousand) at March 31, 2006 are managed by a governmental welfare pension benefit plan, which was jointly
established by the Company and various third-party companies. The aforementioned plan assets are computed on a pro-rata allocation of contributions paid.2. Certain consolidated subsidiaries use a simplified method for calculating projected benefit obligations.
Net periodic cost of employee retirement and severance benefits for the year ended March 31, 2006 consist of the following:
Thousands ofMillions of yen U.S. dollars
2006 2006
Service cost for benefits earned–net of employee contributions ¥1,415 $12,046
Interest cost on projected benefit obligation 252 2,145
Estimated return on plan assets (188) (1,600)
Amortization of unrecognized actuarial gain or loss 291 2,477
Amortization of prior service cost 18 153
Net periodic cost ¥1,788 $15,221
Notes:1. In addition to the net periodic cost of employee retirement and severance benefits, additional retirement payment of ¥175 million ($1,490 thousand) is charged to expense in the year
ended March 31, 2006, and is included in “Selling, general and administrative expenses” and “Other income (loss)”.2. In addition to the net periodic cost of employee retirement and severance benefits, contributions to the governmental welfare pension benefit plan of ¥80 million ($681 thousand)
are charged to “Cost of sales” and “Selling, general and administrative expenses” in the year ended March 31, 2006.3. The defined contribution amount for certain overseas consolidated subsidiaries that have established defined contribution retirement pension systems is recorded as a service cost.
Actuarial assumptions and the basis for the calculation of retirement and severance benefits in 2006 are as follows:
2006Method of the benefit attribution “Benefit/year-of-service” approach
Discount rate 1.3%~2.0%
Estimated rate of return on plan assets 2.0%~3.0%
Period of amortization of unrecognized prior service cost 10 years
Period of amortization of unrecognized actuarial gain or loss 10~17 years
(from the year following the year incurred)

54
12 Income Taxes
The Company and its domestic consolidated subsidiaries are subject to Japanese corporate, inhabitant and enterprise taxes based
on income which, in the aggregate, resulted in a normal tax rate of approximately 40.6% in 2006.
Income tax expenses reflected in the accompanying consolidated statement of income for the year ended March 31, 2006
consist of the following:
Thousands ofMillions of yen U.S. dollars
2006 2006
Current ¥14,468 $123,164
Deferred 4,814 40,981
Total ¥19,282 $164,145
Reconciliation of the normal tax rate and the effective tax rate as a percentage of income before income taxes and minority
interests for the year ended March 31, 2006 is as follows:
2006Normal tax rate 40.6%
Increase in valuation allowance related to deferred tax assets 11.3
Entertainment expenses not deductible for tax purposes 1.2
Amortization of consolidation goodwill 0.9
Corporate inhabitant tax on per capita basis 0.7
Other (0.5)
Effective tax rate 54.2%

55
Significant components of deferred tax assets and liabilities at March 31, 2006 are as follows:
Thousands ofMillions of yen U.S. dollars
2006 2006
Deferred tax assets:
Land revaluation difference ¥ 9,323 $ 79,365
Excess depreciation of fixed assets 3,387 28,833
Losses carried forward 3,261 27,760
Loss on valuation of advance payments 1,892 16,106
Inventory valuation losses 1,785 15,195
Accrued employee bonuses 1,526 12,991
Allowance for doubtful receivables 1,357 11,552
Loss on impairment of fixed assets 1,313 11,177
Accrued enterprise taxes, etc. 845 7,193
Retirement and severance benefit accruals 776 6,606
Excess amortization of deferred assets 764 6,504
Research and development costs 497 4,231
Other 4,452 37,899
Total gross deferred tax assets 31,178 265,412
Valuation allowance (18,631) (158,602)
Total deferred tax assets 12,547 106,810
Deferred tax liabilities:
Retained earnings of foreign consolidated subsidiaries (4,511) (38,401)
Other securities valuation difference (3,388) (28,841)
Inventory revaluation (1,199) (10,207)
Land revaluation difference (891) (7,585)
Reserve for deferred income tax (164) (1,396)
Other (39) (332)
Total gross deferred tax liabilities (10,192) (86,762)
Net deferred tax assets ¥ 2,355 $ 20,048
Net deferred tax assets are included in the following line items in the consolidated balance sheet:
Thousands ofMillions of yen U.S. dollars
2006 2006
Current assets–Deferred tax assets ¥ 7,038 $ 59,913
Investments and other assets–Deferred tax assets 3,901 33,208
Current liabilities–Other (deferred tax liabilities) (1,301) (11,074)
Long-term liabilities–Deferred tax liabilities (7,283) (61,999)
Total ¥ 2,355 $ 20,048

56
13 Selling, General and Administrative Expenses
Significant components of selling, general and administrative expenses for the year ended March 31, 2006 are as follows:
Thousands ofMillions of yen U.S. dollars
2006 2006
Marketing ¥ 31,056 $ 264,374
Directors’ remuneration and employees’ wages 28,220 240,232
Retirement and severance benefits 1,125 9,577
Director retirement benefits 187 1,592
Research and development 20,240 172,299
Allowance for doubtful receivables, investments and other assets 798 6,793
Other 39,270 334,298
Total selling, general and administrative expenses ¥120,896 $1,029,165
14 Reconciliation of Differences between Basic and Diluted Net Income per Common Share
The reconciliation of the differences between basic and diluted net income per common share for the year ended March 31,
2006 is as follows:
Thousands ofMillions of yen U.S. dollars
2006 2006
Net income ¥14,150 $120,456
Unappropriated bonuses to directors and corporate auditors (418) (3,558)
Net income available to common stock 13,732 116,898
Effect of dilutive securities:
Stock options in certain consolidated subsidiary (5) (43)
Net income for diluted EPS calculation ¥13,727 $116,855
Thousands of shares
Average number of common shares outstanding 252,488 252,488
Effect of dilutive securities:
Stock options 8 8
Average number of common shares for diluted EPS calculation 252,496 252,496
Yen U.S. dollars
Net income per common share:
Basic ¥54.39 $0.46
Diluted 54.37 0.46

57
15 Retained Earnings and Dividends
In Japan, earnings in an amount equal to at least 10% of
appropriations of retained earnings that are paid in cash, such as
cash dividends, shall be appropriated as a legal reserve until
the aggregate amount of capital surplus and the legal reserve
equals 25% of stated capital.
Certain foreign consolidated subsidiaries are also required to
appropriate their earnings to legal reserves under the laws of
the respective countries.
The Company’s retained earnings includes legal reserves of
¥1,645 million ($14,004 thousand) at March 31, 2006.
Proposed appropriations of retained earnings have not been
reflected in the consolidated financial statements at the end of
the fiscal year. The Company’s approved appropriations of
retained earnings at March 31, 2006 were cash dividends of
¥3,127 million ($26,620 thousand). In addition, a mid-year
dividend may be paid based on approval by the Board of
Directors, which is subject to limitations.
16 Land Revaluation Difference
In accordance with the “Law Concerning Land Revaluation
(Law No. 34, promulgated on March 31, 1998)”, the
Company revalued its land used for business purposes on
March 31, 2002. The write-down in the value of the land
(¥20,769 million), net of related deferred tax assets and
liabilities, was reported as “Land revaluation difference” in
“Shareholders’ equity”.
Revaluation method:
The fair value of land is determined based on official notice
prices that are calculated by the method assessed and published
by the Commissioner of the National Tax Administration. The
Commissioner assesses and publishes the method to calculate
land value that forms the foundation for calculating taxable
value of land value tax prescribed in “Article 16 of Land Value
Tax Law (Law No. 69, promulgated on May 2, 1991)”, as
stipulated in “Article 2-4 of the Ordinance Implementing the
Law Concerning Land Revaluation (Cabinet Order No. 119,
promulgated on March 31, 1998)”. Reasonable adjustments
are made to the official notice prices.
In fiscal 2006, unrealized losses for land of ¥883 million
($7,517 thousand) were calculated based on the difference
between the land carrying amount, which was revalued in
fiscal 2002, and the fair market value of the land as of March
31, 2006.
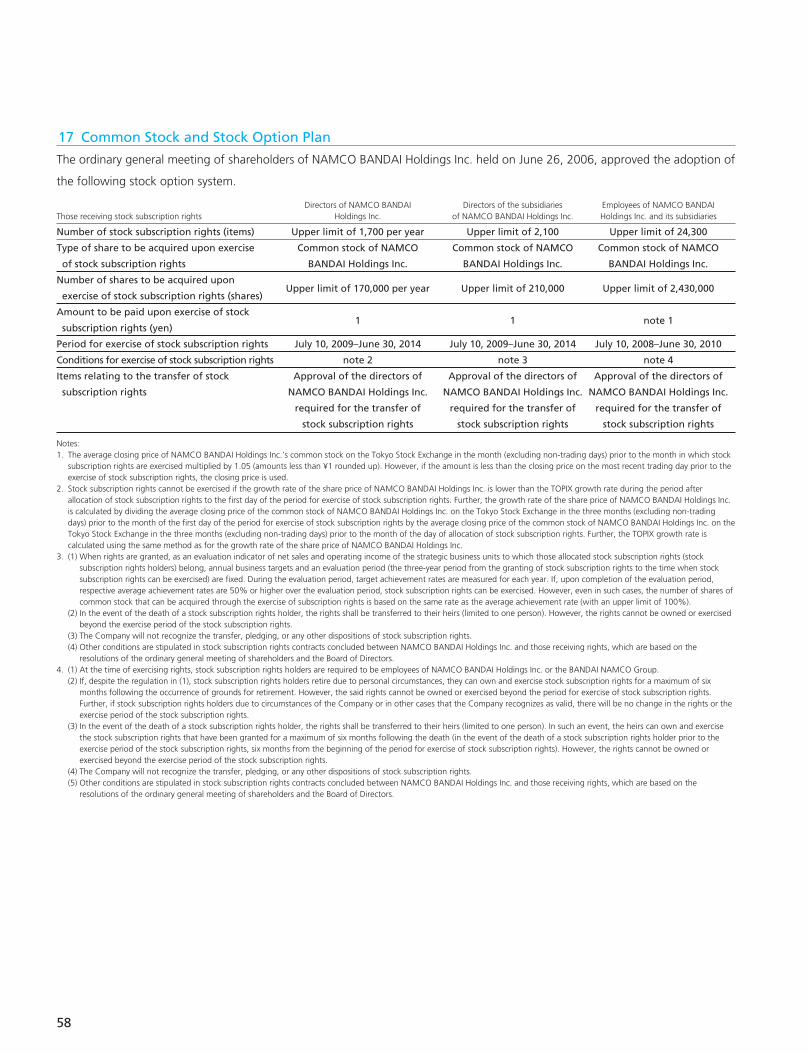
58
17 Common Stock and Stock Option Plan
The ordinary general meeting of shareholders of NAMCO BANDAI Holdings Inc. held on June 26, 2006, approved the adoption of
the following stock option system.
Directors of NAMCO BANDAI Directors of the subsidiaries Employees of NAMCO BANDAIThose receiving stock subscription rights Holdings Inc. of NAMCO BANDAI Holdings Inc. Holdings Inc. and its subsidiaries
Number of stock subscription rights (items) Upper limit of 1,700 per year Upper limit of 2,100 Upper limit of 24,300
Type of share to be acquired upon exercise Common stock of NAMCO Common stock of NAMCO Common stock of NAMCO
of stock subscription rights BANDAI Holdings Inc. BANDAI Holdings Inc. BANDAI Holdings Inc.
Number of shares to be acquired upon
exercise of stock subscription rights (shares)Upper limit of 170,000 per year Upper limit of 210,000 Upper limit of 2,430,000
Amount to be paid upon exercise of stock
subscription rights (yen)1 1 note 1
Period for exercise of stock subscription rights July 10, 2009–June 30, 2014 July 10, 2009–June 30, 2014 July 10, 2008–June 30, 2010
Conditions for exercise of stock subscription rights note 2 note 3 note 4
Items relating to the transfer of stock Approval of the directors of Approval of the directors of Approval of the directors of
subscription rights NAMCO BANDAI Holdings Inc. NAMCO BANDAI Holdings Inc. NAMCO BANDAI Holdings Inc.
required for the transfer of required for the transfer of required for the transfer of
stock subscription rights stock subscription rights stock subscription rights
Notes:1. The average closing price of NAMCO BANDAI Holdings Inc.’s common stock on the Tokyo Stock Exchange in the month (excluding non-trading days) prior to the month in which stock
subscription rights are exercised multiplied by 1.05 (amounts less than ¥1 rounded up). However, if the amount is less than the closing price on the most recent trading day prior to theexercise of stock subscription rights, the closing price is used.
2. Stock subscription rights cannot be exercised if the growth rate of the share price of NAMCO BANDAI Holdings Inc. is lower than the TOPIX growth rate during the period afterallocation of stock subscription rights to the first day of the period for exercise of stock subscription rights. Further, the growth rate of the share price of NAMCO BANDAI Holdings Inc.is calculated by dividing the average closing price of the common stock of NAMCO BANDAI Holdings Inc. on the Tokyo Stock Exchange in the three months (excluding non-tradingdays) prior to the month of the first day of the period for exercise of stock subscription rights by the average closing price of the common stock of NAMCO BANDAI Holdings Inc. on theTokyo Stock Exchange in the three months (excluding non-trading days) prior to the month of the day of allocation of stock subscription rights. Further, the TOPIX growth rate iscalculated using the same method as for the growth rate of the share price of NAMCO BANDAI Holdings Inc.
3. (1) When rights are granted, as an evaluation indicator of net sales and operating income of the strategic business units to which those allocated stock subscription rights (stocksubscription rights holders) belong, annual business targets and an evaluation period (the three-year period from the granting of stock subscription rights to the time when stocksubscription rights can be exercised) are fixed. During the evaluation period, target achievement rates are measured for each year. If, upon completion of the evaluation period,respective average achievement rates are 50% or higher over the evaluation period, stock subscription rights can be exercised. However, even in such cases, the number of shares ofcommon stock that can be acquired through the exercise of subscription rights is based on the same rate as the average achievement rate (with an upper limit of 100%).
(2) In the event of the death of a stock subscription rights holder, the rights shall be transferred to their heirs (limited to one person). However, the rights cannot be owned or exercisedbeyond the exercise period of the stock subscription rights.
(3) The Company will not recognize the transfer, pledging, or any other dispositions of stock subscription rights.(4) Other conditions are stipulated in stock subscription rights contracts concluded between NAMCO BANDAI Holdings Inc. and those receiving rights, which are based on the
resolutions of the ordinary general meeting of shareholders and the Board of Directors.4. (1) At the time of exercising rights, stock subscription rights holders are required to be employees of NAMCO BANDAI Holdings Inc. or the BANDAI NAMCO Group.
(2) If, despite the regulation in (1), stock subscription rights holders retire due to personal circumstances, they can own and exercise stock subscription rights for a maximum of sixmonths following the occurrence of grounds for retirement. However, the said rights cannot be owned or exercised beyond the period for exercise of stock subscription rights.Further, if stock subscription rights holders due to circumstances of the Company or in other cases that the Company recognizes as valid, there will be no change in the rights or theexercise period of the stock subscription rights.
(3) In the event of the death of a stock subscription rights holder, the rights shall be transferred to their heirs (limited to one person). In such an event, the heirs can own and exercisethe stock subscription rights that have been granted for a maximum of six months following the death (in the event of the death of a stock subscription rights holder prior to theexercise period of the stock subscription rights, six months from the beginning of the period for exercise of stock subscription rights). However, the rights cannot be owned orexercised beyond the exercise period of the stock subscription rights.
(4) The Company will not recognize the transfer, pledging, or any other dispositions of stock subscription rights.(5) Other conditions are stipulated in stock subscription rights contracts concluded between NAMCO BANDAI Holdings Inc. and those receiving rights, which are based on the
resolutions of the ordinary general meeting of shareholders and the Board of Directors.

59
18 Leases
1. Lessee
The Company and its subsidiaries occupy offices and other facilities under various finance and operating lease arrangements.
(1) Finance leases
Finance leases, except for those where the legal title to the underlying property is transferred to the lessee, are accounted for
similar to operating leases. The title does not transfer in any of the Company’s leases.
The original cost and accumulated depreciation of assets under such finance leases at March 31, 2006 are as follows:
Thousands ofMillions of yen U.S. dollars
2006 2006
Original cost at inception of leases ¥1,239 $10,548
Less accumulated depreciation (522) (4,444)
Assets under finance lease, net ¥ 717 $ 6,104
Future minimum payments due under finance leases as of March 31, 2006 are as follows:
Thousands ofMillions of yen U.S. dollars
2006 2006
Due within one year ¥237 $2,018
Due after one year 480 4,086
Total ¥717 $6,104
The lease and depreciation expense for such finance leases for the year ended March 31, 2006 are as follows:
Thousands ofMillions of yen U.S. dollars
2006 2006
Lease expense ¥239 $2,035
Depreciation expense 239 2,035
(2) Operating leases
Future minimum payments required under operating leases at March 31, 2006 are as follows:
Thousands ofMillions of yen U.S. dollars
2006 2006
Due within one year ¥1,798 $15,306
Due after one year 6,380 54,312
Total ¥8,178 $69,618

60
2. Lessor
Finance leases
Finance leases, except for those where the legal title to the underlying property is transferred from the lessor to the lessee, are
accounted for similar to operating leases.
The acquisition cost, accumulated depreciation and net value of assets under such finance leases included in fixed assets at
March 31, 2006 are as follows:
Thousands ofMillions of yen U.S. dollars
2006 2006
Acquisition cost ¥1,497 $12,744
Less accumulated depreciation (879) (7,483)
Assets under finance leases, net ¥ 618 $ 5,261
Future minimum payments due under finance leases at March 31, 2006 are as follows:
Thousands ofMillions of yen U.S. dollars
2006 2006
Due within one year ¥294 $2,503
Due after one year 409 3,482
Total ¥703 $5,985
Lease income and depreciation expense for finance leases for the year ended March 31, 2006 are as follows:
Thousands ofMillions of yen U.S. dollars
2006 2006
Lease income ¥357 $3,039
Depreciation expense 320 2,724
19 Foreign Exchange Risk Management and Interest Rate Risk Management
Derivative financial instruments are comprised principally of foreign exchange contracts and interest rate swaps. These
instruments are used to reduce the risks of changes in foreign exchange rates and interest rates; they are not used for
speculation.
The Company is exposed to credit risk related to nonperformance by the counterparties to foreign exchange contracts and
interest rate swaps, but the Company does not expect any problems with nonperformance due to the high credit ratings of the
counterparties.
Contract amounts, market values, and gains or losses from valuation of foreign exchange contracts outstanding at March 31,
2006 are set forth as follows. These contract amounts in themselves should not be considered indicative of the market risk
associated with the derivative financial instruments.
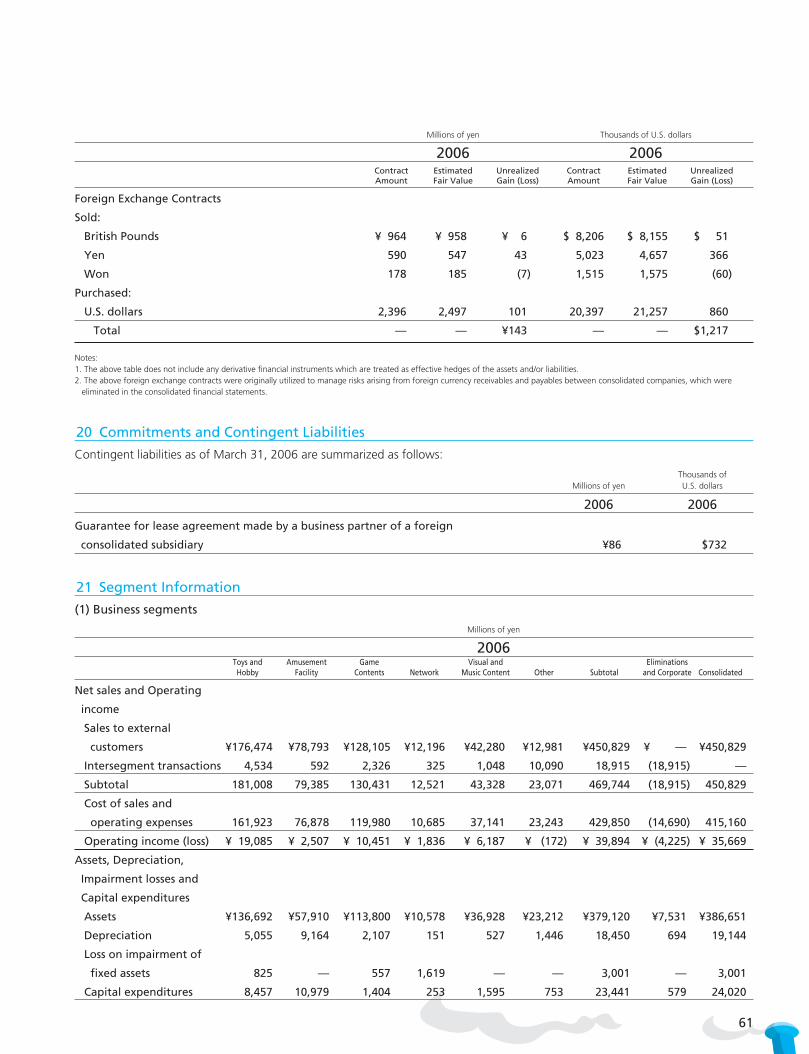
61
Millions of yen Thousands of U.S. dollars
2006 2006Contract Estimated Unrealized Contract Estimated UnrealizedAmount Fair Value Gain (Loss) Amount Fair Value Gain (Loss)
Foreign Exchange Contracts
Sold:
British Pounds ¥ 964 ¥ 958 ¥ 6 $ 8,206 $ 8,155 $ 51
Yen 590 547 43 5,023 4,657 366
Won 178 185 (7) 1,515 1,575 (60)
Purchased:
U.S. dollars 2,396 2,497 101 20,397 21,257 860
Total — — ¥143 — — $1,217
Notes:1. The above table does not include any derivative financial instruments which are treated as effective hedges of the assets and/or liabilities.2. The above foreign exchange contracts were originally utilized to manage risks arising from foreign currency receivables and payables between consolidated companies, which were
eliminated in the consolidated financial statements.
20 Commitments and Contingent Liabilities
Contingent liabilities as of March 31, 2006 are summarized as follows:
Thousands ofMillions of yen U.S. dollars
2006 2006
Guarantee for lease agreement made by a business partner of a foreign
consolidated subsidiary ¥86 $732
21 Segment Information
(1) Business segments
Millions of yen
2006Toys and Amusement Game Visual and EliminationsHobby Facility Contents Network Music Content Other Subtotal and Corporate Consolidated
Net sales and Operating
income
Sales to external
customers ¥176,474 ¥78,793 ¥128,105 ¥12,196 ¥42,280 ¥12,981 ¥450,829 ¥ — ¥450,829
Intersegment transactions 4,534 592 2,326 325 1,048 10,090 18,915 (18,915) —
Subtotal 181,008 79,385 130,431 12,521 43,328 23,071 469,744 (18,915) 450,829
Cost of sales and
operating expenses 161,923 76,878 119,980 10,685 37,141 23,243 429,850 (14,690) 415,160
Operating income (loss) ¥ 19,085 ¥ 2,507 ¥ 10,451 ¥ 1,836 ¥ 6,187 ¥ (172) ¥ 39,894 ¥ (4,225) ¥ 35,669
Assets, Depreciation,
Impairment losses and
Capital expenditures
Assets ¥136,692 ¥57,910 ¥113,800 ¥10,578 ¥36,928 ¥23,212 ¥379,120 ¥7,531 ¥386,651
Depreciation 5,055 9,164 2,107 151 527 1,446 18,450 694 19,144
Loss on impairment of
fixed assets 825 — 557 1,619 — — 3,001 — 3,001
Capital expenditures 8,457 10,979 1,404 253 1,595 753 23,441 579 24,020
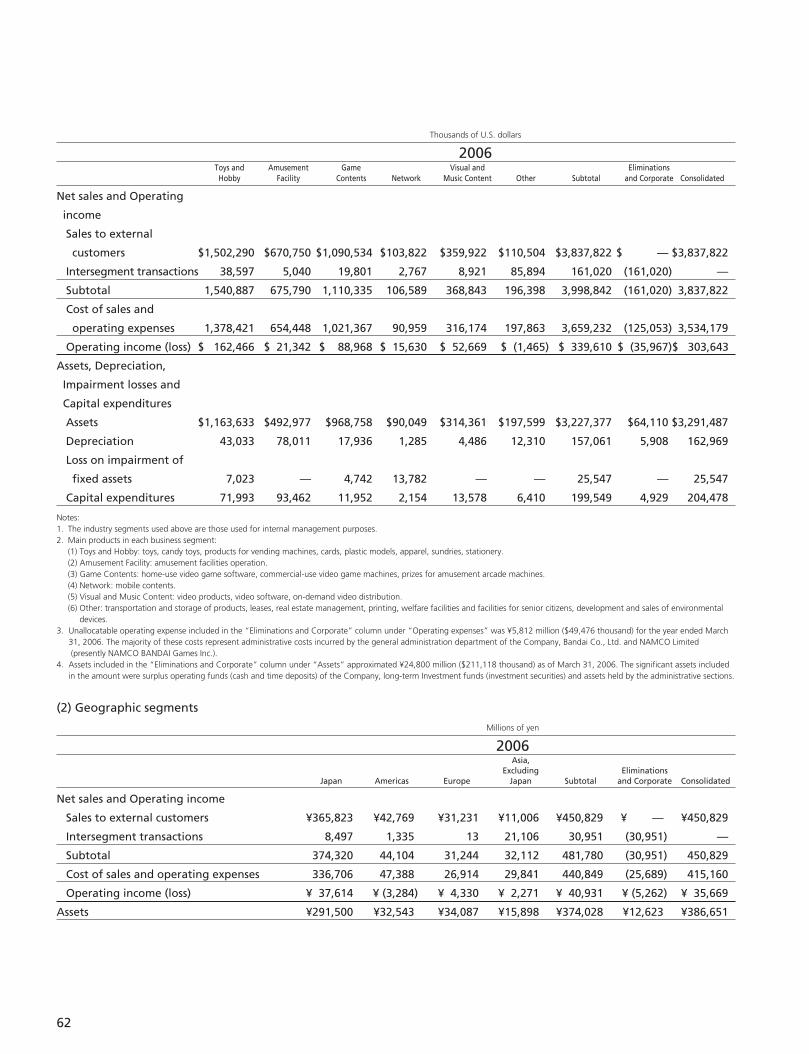
62
Thousands of U.S. dollars
2006Toys and Amusement Game Visual and EliminationsHobby Facility Contents Network Music Content Other Subtotal and Corporate Consolidated
Net sales and Operating
income
Sales to external
customers $1,502,290 $670,750 $1,090,534 $103,822 $359,922 $110,504 $3,837,822 $ — $3,837,822
Intersegment transactions 38,597 5,040 19,801 2,767 8,921 85,894 161,020 (161,020) —
Subtotal 1,540,887 675,790 1,110,335 106,589 368,843 196,398 3,998,842 (161,020) 3,837,822
Cost of sales and
operating expenses 1,378,421 654,448 1,021,367 90,959 316,174 197,863 3,659,232 (125,053) 3,534,179
Operating income (loss) $ 162,466 $ 21,342 $ 88,968 $ 15,630 $ 52,669 $ (1,465) $ 339,610 $ (35,967)$ 303,643
Assets, Depreciation,
Impairment losses and
Capital expenditures
Assets $1,163,633 $492,977 $968,758 $90,049 $314,361 $197,599 $3,227,377 $64,110 $3,291,487
Depreciation 43,033 78,011 17,936 1,285 4,486 12,310 157,061 5,908 162,969
Loss on impairment of
fixed assets 7,023 — 4,742 13,782 — — 25,547 — 25,547
Capital expenditures 71,993 93,462 11,952 2,154 13,578 6,410 199,549 4,929 204,478
Notes:1. The industry segments used above are those used for internal management purposes.2. Main products in each business segment:
(1) Toys and Hobby: toys, candy toys, products for vending machines, cards, plastic models, apparel, sundries, stationery.(2) Amusement Facility: amusement facilities operation.(3) Game Contents: home-use video game software, commercial-use video game machines, prizes for amusement arcade machines.(4) Network: mobile contents.(5) Visual and Music Content: video products, video software, on-demand video distribution.(6) Other: transportation and storage of products, leases, real estate management, printing, welfare facilities and facilities for senior citizens, development and sales of environmental
devices.3. Unallocatable operating expense included in the “Eliminations and Corporate” column under “Operating expenses” was ¥5,812 million ($49,476 thousand) for the year ended March
31, 2006. The majority of these costs represent administrative costs incurred by the general administration department of the Company, Bandai Co., Ltd. and NAMCO Limited(presently NAMCO BANDAI Games Inc.).
4. Assets included in the “Eliminations and Corporate” column under “Assets” approximated ¥24,800 million ($211,118 thousand) as of March 31, 2006. The significant assets includedin the amount were surplus operating funds (cash and time deposits) of the Company, long-term Investment funds (investment securities) and assets held by the administrative sections.
(2) Geographic segments
Millions of yen
2006Asia,
Excluding EliminationsJapan Americas Europe Japan Subtotal and Corporate Consolidated
Net sales and Operating income
Sales to external customers ¥365,823 ¥42,769 ¥31,231 ¥11,006 ¥450,829 ¥ — ¥450,829
Intersegment transactions 8,497 1,335 13 21,106 30,951 (30,951) —
Subtotal 374,320 44,104 31,244 32,112 481,780 (30,951) 450,829
Cost of sales and operating expenses 336,706 47,388 26,914 29,841 440,849 (25,689) 415,160
Operating income (loss) ¥ 37,614 ¥ (3,284) ¥ 4,330 ¥ 2,271 ¥ 40,931 ¥ (5,262) ¥ 35,669
Assets ¥291,500 ¥32,543 ¥34,087 ¥15,898 ¥374,028 ¥12,623 ¥386,651
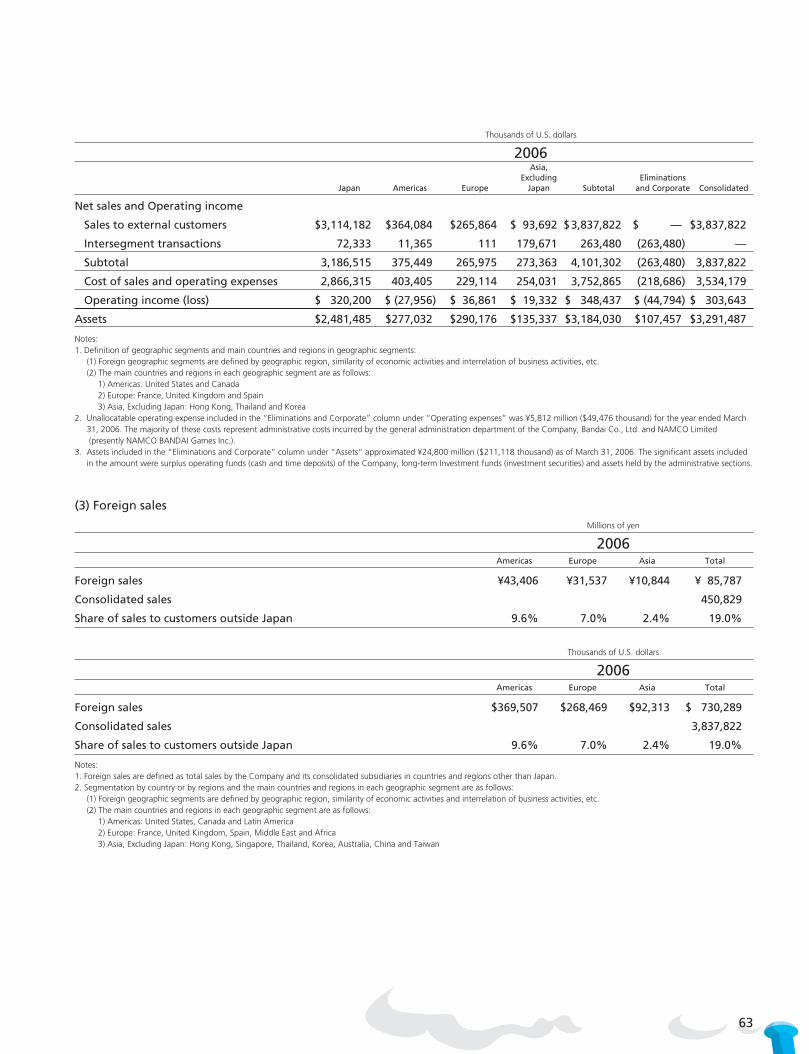
63
Thousands of U.S. dollars
2006Asia,
Excluding EliminationsJapan Americas Europe Japan Subtotal and Corporate Consolidated
Net sales and Operating income
Sales to external customers $3,114,182 $364,084 $265,864 $ 93,692 $3,837,822 $ — $3,837,822
Intersegment transactions 72,333 11,365 111 179,671 263,480 (263,480) —
Subtotal 3,186,515 375,449 265,975 273,363 4,101,302 (263,480) 3,837,822
Cost of sales and operating expenses 2,866,315 403,405 229,114 254,031 3,752,865 (218,686) 3,534,179
Operating income (loss) $ 320,200 $ (27,956) $ 36,861 $ 19,332 $ 348,437 $ (44,794) $ 303,643
Assets $2,481,485 $277,032 $290,176 $135,337 $3,184,030 $107,457 $3,291,487
Notes:1. Definition of geographic segments and main countries and regions in geographic segments:
(1) Foreign geographic segments are defined by geographic region, similarity of economic activities and interrelation of business activities, etc.(2) The main countries and regions in each geographic segment are as follows:
1) Americas: United States and Canada2) Europe: France, United Kingdom and Spain3) Asia, Excluding Japan: Hong Kong, Thailand and Korea
2. Unallocatable operating expense included in the “Eliminations and Corporate” column under “Operating expenses” was ¥5,812 million ($49,476 thousand) for the year ended March31, 2006. The majority of these costs represent administrative costs incurred by the general administration department of the Company, Bandai Co., Ltd. and NAMCO Limited(presently NAMCO BANDAI Games Inc.).
3. Assets included in the “Eliminations and Corporate” column under “Assets” approximated ¥24,800 million ($211,118 thousand) as of March 31, 2006. The significant assets includedin the amount were surplus operating funds (cash and time deposits) of the Company, long-term Investment funds (investment securities) and assets held by the administrative sections.
(3) Foreign sales
Millions of yen
2006Americas Europe Asia Total
Foreign sales ¥43,406 ¥31,537 ¥10,844 ¥ 85,787
Consolidated sales 450,829
Share of sales to customers outside Japan 9.6% 7.0% 2.4% 19.0%
Thousands of U.S. dollars
2006Americas Europe Asia Total
Foreign sales $369,507 $268,469 $92,313 $ 730,289
Consolidated sales 3,837,822
Share of sales to customers outside Japan 9.6% 7.0% 2.4% 19.0%
Notes:1. Foreign sales are defined as total sales by the Company and its consolidated subsidiaries in countries and regions other than Japan.2. Segmentation by country or by regions and the main countries and regions in each geographic segment are as follows:
(1) Foreign geographic segments are defined by geographic region, similarity of economic activities and interrelation of business activities, etc.(2) The main countries and regions in each geographic segment are as follows:
1) Americas: United States, Canada and Latin America2) Europe: France, United Kingdom, Spain, Middle East and Africa3) Asia, Excluding Japan: Hong Kong, Singapore, Thailand, Korea, Australia, China and Taiwan

64
22 Significant Subsequent Events
1. Simplified share exchange with grant
The Company implemented a share exchange which
BANPRESTO Co., Ltd. (BANPRESTO), became a wholly owned
subsidiary on June 1, 2006, based on a decision of the
Company’s Board of Directors held on March 29, 2006, and a
share exchange agreement concluded with BANPRESTO on
that date. In accordance with Article 358, Paragraph 1 of the
former Commercial Code for the Company and in accordance
with Article 12, Paragraph 4, Clause 2 of the Industrial Revitaliza-
tion Law for BANPRESTO, a simplified share exchange was
conducted without obtaining the approval of the general
meetings of shareholders as stipulated in Article 353, Paragraph
1 of the former Commercial Code. The share exchange allows
the Company to acquire the remaining shares for cash in accor-
dance with Article 12-9 of the Industrial Revitalization Law.
(1) Objective of making BANPRESTO a wholly owned
subsidiary through a share exchange
From February 24, 2006, to March 16, 2006, the Company
made a take-over bid for the shares of BANPRESTO with the
objective of making BANPRESTO a wholly owned subsidiary.
The Company acquired 97.01% of the 10.8 million shares of
BANPRESTO. Subsequently, on June 1, 2006, through the
share exchange, the Company achieved its final objective of
making BANPRESTO a wholly owned subsidiary. BANPRESTO
becoming a wholly owned subsidiary was undertaken for the
purpose of creating an organization that responds flexibly to
the Group’s management strategy.
(2) Terms of share exchange agreement
In accordance with the share exchange agreement concluded
on March 29, 2006, the Company will pay ¥3,450 for each
BANPRESTO stock owned by the remaining shareholders of
BANPRESTO, who have entered or otherwise recorded their
shares in the shareholders’ register as of May 31, 2006, which
is the day prior to the effective date of the share exchange.
The share exchange will not apply to those shares held by the
Company.
2. Announcement of Zapf Creation AG take-over bid
On June 13, 2006, the Company decided to make a take-over
bid to acquire the shares of Zapf Creation AG (“Zapf”) of
Germany through Bandai GmbH of Germany. Bandai GmbH is
a subsidiary of BANDAI S.A., a wholly owned subsidiary of the
Company. Zapf’s Supervisory Board and Management Board
have expressed their support for this take-over bid.
(1) Purpose of take-over bid
Under the three-year medium-term management plan (April
2006 to March 2009) being implemented by the BANDAI
NAMCO Group, the key theme is “Strengthening, Enriching,
and Expanding the BANDAI NAMCO Group’s portfolio
management”, and one of the key business strategies is to
strengthen overseas operations. The take-over bid for Zapf will
enable the Company to achieve one of the strategies in the
medium-term management plan.
Zapf is headquartered in Germany and has an extremely high
name recognition in the European markets for large dolls for
infants and girls, with a share of more than 60% in Germany
and more than 40% in the United Kingdom. In Europe, the
BANDAI NAMCO Group’s toys and hobby product portfolio is
centered on products for boys. Zapf’s product portfolio and
the Group’s product portfolio complement each other well.
Zapf has operations not just in Central Europe but also in
Eastern Europe, where the Company does not have a sales
network. Zapf and the Company will also complement each
other well in markets. Accordingly, the Company decided that
a capital tie-up with Zapf will enable the two companies to
synergize their products and markets.

65
(2) Summary of take-over bid
1. Summary of target company
Company name: Zapf Creation AG
Main business: Production and sales of toys
Establishment: 1932
Head office: Rödental, Germany
Representative: Georg Kellinghusen, CFO
Stock exchange listings: Frankfurt, Stuttgart, Munich
Number of shares issued and outstanding:
8,000,000 shares of common stock
Relationship with the Company: There are no capital,
personal, or trading relationships.
Number of employees, consolidated:
408 (as of December 31, 2005)
Net sales: 140.7 million euro
(year ended December 31, 2005)*
Net loss: 27.0 million euro
(year ended December 31, 2005)*
Total assets: 135.6 million euro
(as of December 31, 2005)*
Net assets: 11.0 million euro (as of December 31, 2005)** Figures for the year ended December 31, 2005, are unaudited.
2. Type of shares to be acquired
Shares of common stock
3. Take-over bid period
Approximately a 6-week period from the end of June
2006 is scheduled.
4. Purchase price (per share)
One share of common stock: 10.50 euro
5. Planned total number of shares to be acquired
More than 75% of shares issued and outstanding
Planned total number of shares to be acquired:
6,000,001 or more
6. Movement of shares owned as a result of tender offer bid
Before take-over bid: 0 shares
After take-over bid: 6,000,001 or more
(ownership rate of 75% or more)
7. Public announcement of take-over bid
The take-over bid will be made pursuant to Germany’s
regulations, and accordingly, a local take-over bid
public announcement will be made based on
Germany’s securities exchange laws. There will be no
public announcement in Japan.
8. Take-over bid agent
BNP PARIBAS Securities Services
9. The target company acceptance of the take-over bid
The target company’s Supervisory Board and
Management Board have accepted in principal the
take-over bid.
10. Other
In Germany, BANDAI GmbH has not yet submitted the
notification of the take-over bid to Deutsche
Gesellschaft für Ad-hoc-Publizität mbH, which is
responsible for handling these procedures. There is a
possibility that the application may not be accepted.
If the application is not accepted, the take-over bid will
not commence.

To the Board of Directors of
NAMCO BANDAI Holdings Inc.:
We have audited the accompanying consolidated balance sheet of NAMCO BANDAI Holdings Inc. and consolidated
subsidiaries as of March 31, 2006, and the related consolidated statement of income, shareholders’ equity and cash flows for
the year in the period ended March 31, 2006, expressed in Japanese yen. These consolidated financial statements are the
responsibility of the Company’s management. Our responsibility is to independently express an opinion on these consolidated
financial statements based on our audit.
We conducted our audit in accordance with auditing standards generally accepted in Japan. Those standards require that we
plan and perform the audit to obtain reasonable assurance about whether the financial statements are free of material
misstatement. An audit includes examining, on a test basis, evidence supporting the amounts and disclosures in the financial
statements. An audit also includes assessing the accounting principles used and significant estimates made by management,
as well as evaluating the overall financial statement presentation. We believe that our audit provides a reasonable basis for
our opinion.
In our opinion, the consolidated financial statements referred to above present fairly, in all material respects, the consolidated
financial position of NAMCO BANDAI Holdings Inc. and subsidiaries as of March 31, 2006, and the consolidated results of
their operations and their cash flows for the year in the period ended March 31, 2006, in conformity with accounting
principles generally accepted in Japan.
Without qualifying our opinion, we draw attention to Note 22 to the consolidated financial statements. On June 13, 2006,
the Company decided to make a take-over bid to acquire the shares of Zapf Creation AG (“Zapf”) of Germany through
Bandai GmbH of Germany. Bandai GmbH is a wholly owned subsidiary of BANDAI S.A., of France, which is a subsidiary of the
Company.
The U.S. dollar amounts in the accompanying consolidated financial statements with respect to the year ended March 31,
2006 are presented solely for convenience. Our audit also included the translation of yen amounts into U.S. dollar amounts
and, in our opinion, such translation has been made on the basis described in Note 3 to the consolidated financial statements.
Tokyo, Japan
June 26, 2006
Independent Auditors’ Report
66

Forward-Looking Statements
The forward-looking statements in this annual report are based on the information currently available to management and include various risks and uncertainties. Accordingly,actual results may differ materially from these projections for a variety of reasons. Major factors that could influence actual results include changes in business environments,market trends, and exchange rate fluctuations relevant to the businesses of the BANDAI NAMCO Group. Notes:1. All figures in this report are rounded to the nearest unit. 2. Fiscal 2006, the year under review, refers to the one-year period ended March 31, 2006.3. Projections and other figures in this annual report are as of May 2006.
In 1950, Bandai Co., Ltd., was established as amarketer of toys. Since that time, Bandai’s missionhas been to provide dreams, inspiration andexcitement to people around the world throughentertainment businesses, and the company hasalways risen to the challenge of achievingcontinual improvement. Bandai has developed awide range of operations, including not just toysbut also apparel, candy toys, card games, gamesoftware, visual products, and network services,through the active use of its original businessmodel—character merchandising.
In 1955, NAMCO LIMITED was established as a manufacturer and marketer of amusementmachines. Since that time, NAMCO’s overridingmission has been contributing to the realization offun, happy, healthy lifestyles, and the company hasled the way in helping people experience the funthey have always dreamed of. In addition toamusement machine manufacturing andmarketing, NAMCO has expanded its businessfields to a wide array of other areas, includingamusement facility operations and game softwarefor home game consoles, and has developedoriginal technical strengths and facility networks.
67
NAMCO BANDAI Holdings Inc.9th Floor, Taiyo Seimei Shinagawa Building, 2-16-2, Konan, Minato-ku, Tokyo 108-0075, JapanURL: www.bandainamco.co.jp¥10 billionTokyo Stock Exchange, First Section (Code number: 7832)Planning and execution of medium- and long-term management strategies for theBANDAI NAMCO Group; provision of support for business strategy implementation by Group companies and management of business activities.Number of Shares Authorized: 1,000,000,000 sharesNumber of Shares Issued: 260,580,191 sharesNumber of Shareholders: 39,579Number of Shares per Trading Unit: 100 shares
CorporateInformation
Name
Japan Trustee Services Bank, Ltd. (Trust Account)
Northern Trust Company (AVFC) Sub Account American Client
Masaya Nakamura
The Master Trust Bank of Japan, Ltd. (Trust Account)
MAL Ltd.
Goldman Sachs International
Bandai Co., Ltd.
Sanka Ltd.
The Nomura Trust and Banking Co., Ltd. (Holder in Retirement Benefit Trust for The Bank of Tokyo-Mitsubishi UFJ, Ltd. Account)
Om04 SSB Client Omnibus
% of Total
7.29
5.55
5.51
5.17
4.03
2.79
2.72
1.91
1.76
1.62
27.09%
0.62%
14.51%37.16%
20.62% Financial institutionsIndividuals, etc.
Foreign corporate entities and others
Brokerages
Other corporate entities
(As of March 31, 2006)
Corporate Name:Head Office:
Capital:Stock Exchange Listing:
Main Business:
Stock Information:
Major Shareholders:
Ownership Breakdown:
©2006 TV ASAHI • TOEI AG • TOEI ©BANDAI • WiZ 2004 ©SOTSU AGENCY • SUNRISE ©BIRD STUDIO / SHUEISHA • TOEI ANIMATION ©BANDAI 2006 TM & ©2006 BVSEntertainment, Inc. and BVS International N.V. All Rights Reserved. Used under license by Bandai America Incorporated. ABC logo: TM & ©ABC Inc. All Rights Reserved ©T.YANASE / FROEBELKAN • TMS • NTV ©SOTSU AGENCY • SUNRISE • MBS ©BIRD STUDIO / SHUEISHA • TOEI ANIMATION ©2006 NBGI ©2005 NBGI MARIOKART is a registeredtrademark of Nintendo. Licensed by NINTENDO ©NBGI ©MEGAHOUSE 2005 ©BN/D3P, MD 2005 Othello is registered trademark in Japan ©VICEROY INTERNATIONAL INC.©BANDAI NETWORKS ©SUNRISE • BANDAI VISUAL • BANDAI CHANNEL ©.hack Conglomerate ©SOTSU AGENCY • SUNRISE ©BANDAI NETWORKS ©NBGI ©NOBODYKNOWS production committee All Rights Reserved. ©2006 NBGI ©BANDAI • WiZ 2004 ©2006 NBGI

NA
MC
O B
AN
DA
I Ho
ldin
gs In
c. An
nu
al Rep
ort 2006
www.bandainamco.co.jp
NAMCO BANDAI Holdings Inc.Annual Report 2006
Printed in Japan
Copyright © 2022 FDOKUMEN