2006 Annual Report - Media Corporate IR Net
64
A new era begins Annual Report 2006
-
Upload
khangminh22 -
Category
Documents
-
view
1 -
download
0
Transcript of 2006 Annual Report - Media Corporate IR Net

A new era begins
Annual Report 2006
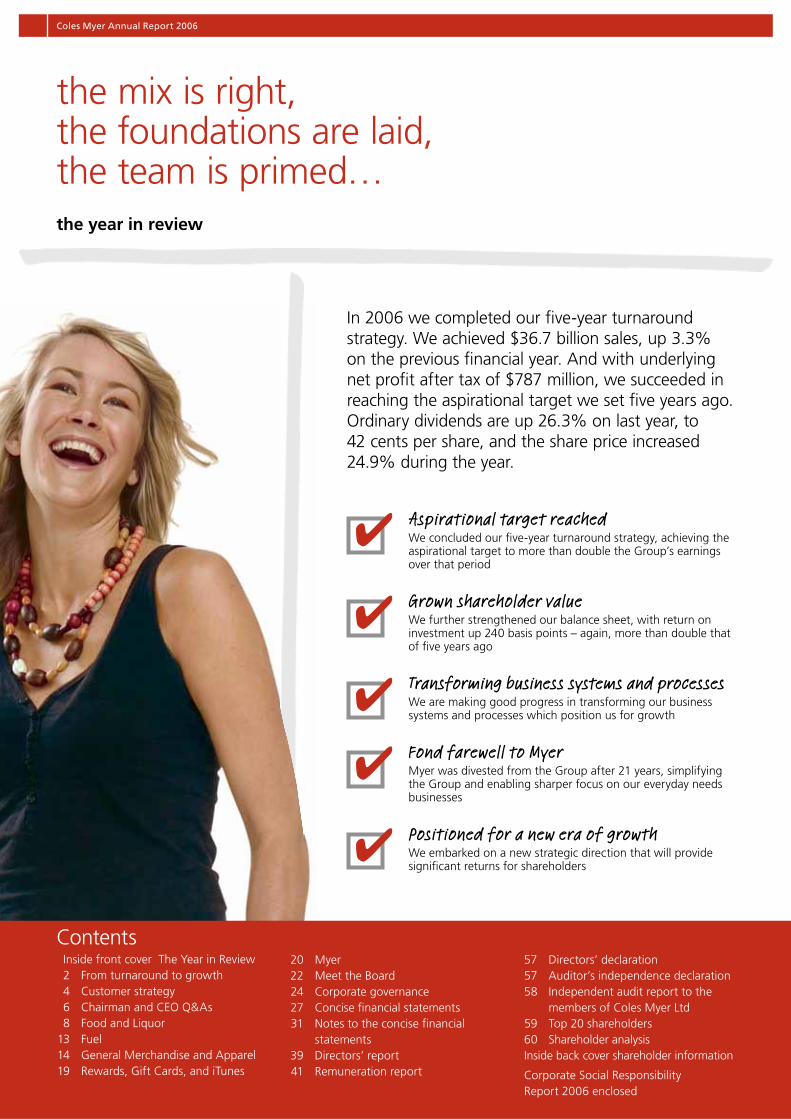
the mix is right,the foundations are laid,the team is primed…the year in review
In 2006 we completed our fi ve-year turnaround strategy. We achieved $36.7 billion sales, up 3.3% on the previous fi nancial year. And with underlying net profi t after tax of $787 million, we succeeded in reaching the aspirational target we set fi ve years ago. Ordinary dividends are up 26.3% on last year, to 42 cents per share, and the share price increased 24.9% during the year.
Aspirational target reachedWe concluded our fi ve-year turnaround strategy, achieving the aspirational target to more than double the Group’s earnings over that period
Grown shareholder valueWe further strengthened our balance sheet, with return on investment up 240 basis points – again, more than double that of fi ve years ago
Transforming business systems and processesWe are making good progress in transforming our business systems and processes which position us for growth
Fond farewell to MyerMyer was divested from the Group after 21 years, simplifying the Group and enabling sharper focus on our everyday needs businesses
Positioned for a new era of growthWe embarked on a new strategic direction that will provide signifi cant returns for shareholders
Contents Inside front cover The Year in Review 2 From turnaround to growth 4 Customer strategy 6 Chairman and CEO Q&As 8 Food and Liquor 13 Fuel 14 General Merchandise and Apparel 19 Rewards, Gift Cards, and iTunes
20 Myer 22 Meet the Board 24 Corporate governance 27 Concise fi nancial statements 31 Notes to the concise fi nancial
statements 39 Directors’ report 41 Remuneration report
57 Directors’ declaration 57 Auditor’s independence declaration 58 Independent audit report to the
members of Coles Myer Ltd 59 Top 20 shareholders 60 Shareholder analysis Inside back cover shareholder information
Corporate Social Responsibility Report 2006 enclosed
Coles Myer Annual Report 2006

0
10,000
20,000
30,000
40,000
06‡05‡04†03†02†01†
3.3%
Sales*
($million)
*Includes discontinued businesses,adjusted for the 53rd week in 2005
†AGAAP ‡AIFRS
$36,698m
0
200
400
600
800
06‡(1)05‡(2)04†03†02†01†
13.9%
Underlying net profit
($million)
(1) Excludes profit on sale of Myer ($583.7m) and strategic initiative costs ($207.4m)
(2) Excludes Megamart divestment costs ($57.1m) and the benefit on re-measurement of Kmart New Zealand onerous lease provision ($3.5m)
Refer prior Annual Reports for an explanation of prior year results†AGAAP ‡AIFRS
$787.3m
0
10
20
30
40
50
06050403020126.3%
Ordinary dividend (cents)
42 cents
70
100
130
160
190
28.07.0601.08.0502.08.0401.08.0301.08.0201.08.01
Coles Myer Ltd
ASX 50 Index
Relative share price growth
24.9%CML shares
1Coles Myer Annual Report 2006

a successful journey, an exciting future
We started our fi ve-year turnaround strategy in 2001 to substantially improve shareholder value by:
fi xing our non-food brands
growing our food and liquor business
replacing the costly shareholder discount card
improving our loyalty program
transforming our culture, supply chain and business systems.
Since then, underlying net profi t after tax has increased from $333 million to $787 million. Underlying earnings per share have risen from 26 cents to 63 cents, and ordinary dividends per share are up from 25.5 cents to 42 cents over the fi ve years.
The performance of our non-food brands has improved dramatically, with underlying earnings before interest and tax up four-fold, from $101 million to $462 million.
Our largest business, food and liquor, has delivered consistent, solid growth, with underlying earnings before interest and tax rising by 55% to $786 million since 2001 and return on investment now over 34%.
Our fuel and convenience business, Coles Express, has been a successful alliance with Shell, supporting a discount fuel offer as a key element of our customer rewards program.
Replacing the costly shareholder discount scheme was an important step in fi xing the fi nancial health of the business and providing all of our customers with rewards.
We have worked hard at building one team, with one performance-based culture in which we reward leaders with incentives based on Group outcomes. We have developed common Groupwide values and behaviours – integrity, respect and recognition, passion for excellence and working together – developed by over 2,000 team members.
We have reduced the number of workplace injuries through a Groupwide safety program.
We have reduced duplication and costs as the platform for further integration and simplifi cation of the Group.
We are making a strategic transition, simplifying our business and getting closer to our customersOur business transformation program commenced in 2003 and is improving the effi ciency of our business for customers, suppliers and shareholders.
We are improving product availability for customers, making life simpler for our store teams and reducing costs.
So far we have made great progress in developing or implementing:
common merchandising and forecasting systems across food, liquor and fuel
shelf-friendly packaging, roll cages and returnable plastic crates
Coles Collect (factory gate pricing process)
one point-of-sale system for the food and liquor business
In the coming year we will be opening fi ve distribution centres and piloting our automatic stock replenishment system.
The fi ve-year transformation program – incorporating procurement, safety, IT and supply chain initiatives – is expected to deliver benefi ts of $425 million in fi nancial year 2008.
Our success begins2002
Moving forward
2003
Well on the way
2004
Maintaining momentum
2005
2 Coles Myer Annual Report 2006

2006 A new era begins
Following the sale of Myer, we have the opportunity to rebrand our business and go forward as a new and simpler business. Subject to the approval of shareholders at our November Annual General Meeting, we will rename the Company ‘Coles Group Limited’.
Over the next few years, we will create a new integrated ‘everyday needs’ business, selling everything our customers need every day under the trusted “Coles” brand. We will invest to further grow our other successful retail businesses, Target and Offi ceworks.
We have adopted an integrated model for our everyday needs business – a model which has proven extremely successful internationally and which we are uniquely positioned to deliver in Australia. Coles, BI-LO, Liquor, Coles Express and Kmart will be progressively integrated with single buying, marketing, operations and support structures.
Our growth strategy will increase the return from our existing store network and create new opportunities to grow our business ahead of the market through reinvigorated stores, the creation of SuperCentres and a differentiated product offer.
The model we are creating will enable us to simplify our business processes and realise very signifi cant cost savings to reward our shareholders while reinvesting in our competitive customer offer.
Thank you to our team members for being the heroes in our turnaround journey. Take a bow as we move towards an exciting future.
“take a bow”
3Coles Myer Annual Report 2006

it’s all about the…
At the heart of our new business strategy is our goal to be customers’ fi rst choice for their everyday shopping needs.
We can now gather information from all our stores at point-of-sale so that we can tailor our offer to the specifi c needs of customers and make sure we have the right products on the shelves every day.
We are also accelerating our store renewal program and increasing customer service levels in our supermarkets to provide a better shopping experience for our customers.
The value and convenience we offer will be enhanced by the further growth of our popular housebrand product range in supermarkets and expansion of direct sourcing of general merchandise across our businesses.
To be customers’ fi rst choice for their everyday shopping needs
4 Coles Myer Annual Report 20064 Coles Myer Annual Report 2006

Better service
Better convenience
Better products
Better rewards
Our new customer initiatives will include the development of SuperCentres – destination shopping locations offering food, general merchandise and apparel under one roof.
At the other end of the store format scale, we are piloting new convenience stores, designed for time-poor customers looking for a top-up shop.
By understanding what customers want to buy, and how they want to shop, we can provide better service, convenience, products and rewards, through a choice of formats which deliver a consistent customer experience.
5Coles Myer Annual Report 2006 5Coles Myer Annual Report 2006

Q. What have been the highlights of the year from a shareholder perspective?
Chairman, Rick Allert: There have been a number. In 2006, we achieved the aspirational earnings goal we set at the beginning of our fi ve-year strategy to turn around the business and build sustainable returns for shareholders.
Since 2001, underlying earnings per share have more than doubled and the share price has increased by 92%. We have returned more than $1.5 billion to shareholders through share buy-backs, and ordinary dividends per share have gone up by 65%.
With the turnaround strategy completed, we have announced our next strategic direction that will create signifi cant value for our shareholders through the creation of an integrated everyday needs business and the further growth of Target and Offi ceworks.
In this context, the Board also took the strategic decision to divest Myer.
Chief Executive Offi cer, John Fletcher: It is easy to forget how far the business has come in the past fi ve years. Net profi t after tax and return on investment have both more than doubled since 2001. Underlying earnings in the non-food brands have increased from $101 million to $462 million over the same period. And, in the food and liquor business, underlying earnings have grown by 55%.
Q. Why did you divest Myer?
RA: Myer is a great business as well as a great Australian icon. In 2005, the Board began a review of ownership options for Myer in the context of the development of the Group’s next strategic direction. We wanted to see if shareholder interests would be better served by the retention or divestment of Myer. The Board’s decision to sell was based on strategic fi t and the opportunity to simplify the Group. We believed that divestment of Myer would enable the Group to grow faster, with sharpened management and fi nancial focus on the core components of the business.
The sale price of $1.4 billion was a great outcome for our shareholders.
JF: This was the right decision for both businesses. We wish Myer well and we thank Dawn Robertson and the Myer management team for doing such a good job in steering the brand successfully through the ownership review and sale process.
Q. How has the food and liquor business performed?
JF: This was the toughest year of the turnaround journey for food and liquor as we reached the peak of implementing projects to transform the way we buy and transport product from suppliers to store shelves. But we have reversed the disappointing sales trend experienced earlier in the year by increasing service at checkouts and enhancing promotional offers.
RA: The food and liquor business is the engine room of the Group, with signifi cant opportunities for further growth. We are continuing to invest in new and refurbished supermarkets and liquor outlets, as well as developing new product initiatives. In the past year, customers have responded very positively to our new housebrand strategy in supermarkets and to the roll out of the 1st Choice Liquor Superstore offer.
“Shareholders can
look forward to an
exciting future of
growth”
made the tough calls,did the hard work,a clear direction forward Chairman and CEO Q&As
6 Coles Myer Annual Report 20066 Coles Myer Annual Report 2006

Q. How have you prepared the business for its next phase of growth?
JF: The transition from turnaround to growth is built on the foundations of our transformation program, which includes developing world class IT and supply chain systems. We will gain tools like common merchandising and forecasting systems, automated stock replenishment to make sure we always have the products our customers want to buy, when they want to buy them, and a new purpose-built distribution centre network.
The transformation program aims to improve product availability for customers, simplify processes for our store teams and suppliers and reduce costs. Transformation is giving us the tools and processes we need to bring our future strategy to life.
RA: A number of signifi cant steps have already been taken to simplify the business. Management layers and duplication have already been removed from our key supermarkets business to make decision-making faster and bring managers closer to the stores.
Q. What will your new strategic direction bring for shareholders and customers?
RA: In developing our new strategic direction, we have looked at the world’s best retailers in terms not only of what they produce for their customers but also for their shareholders. We believe we have a strategy that will generate superior returns for shareholders, through the creation of a new business that will be the fi rst choice for Australians’ everyday shopping needs, and the continuing growth of Target and Offi ceworks. A much simpler business model will enable us to reduce costs to reinvest in sales growth.
JF: The everyday needs business will offer food, liquor, fuel and general merchandise to customers through a range of store formats, from a small convenience store to a large SuperCentre. Customers will be able to choose where they shop according to their needs and know exactly what shopping experience to expect. We will be investing very signifi cantly in new and upgraded supermarkets, as well as enhancing customer service levels. The number of team members working in offi ces will be reduced to enable us to put more team members in store.
Q. Why are you changing the Group’s name?
RA: Following the divestment of Myer, we will take the opportunity to rename and rebrand the Company to ‘Coles Group Limited’. Our new name is simpler, refl ecting the fact that Myer is no longer a part of us and symbolising the signifi cance of our supermarket business to the Group. Shareholders will be asked to approve the new name for the Group at the Annual General Meeting.
JF: Our new name and branding is part of this exciting strategic opportunity for us to simplify our business. Over time, our businesses will use the umbrella Coles brand increasingly, leveraging its strong reputation with
both customers and shareholders.
“We are creating a much
simpler business to better
understand and meet the
needs of customers”
Left to right: Rick Allert, John Fletcher
7Coles Myer Annual Report 2006 7Coles Myer Annual Report 2006

Food andLiquor
at a glance
“My time is precious.
I want the best.
I expect great value.”
we hear you…Our food and liquor business continued to grow sales and earnings during a year of signifi cant investment in transformation projects.
In the past year, we have opened 31 new supermarkets and renewed 36. In liquor, we have opened 17 1st Choice Superstores and renewed 57 Liquorland stores.
Looking forward we will focus on building a business that is closer to customers by simplifying our structure and reducing costs above store to invest more resources into stores – where it matters most.
8 Coles Myer Annual Report 2006

8.5%*
Und
erly
ing
EBIT
($m
)
0
200
400
600
800
06‡(1)05‡(1)04†03†02†01†
Profit
†AGAAP ‡AIFRS
* Adjusted for the 53rd week in 2005
(1) 2006: Excludes strategic initiative costs ($214.4m) and transformation costs ($19.6m)
2005: Excludes restructuring costs ($22.5m)
Refer prior Annual Reports for an explanation of prior year results
$785.9m
We are adding extra team members, providing extra trolleys in supermarkets and renewing stores to make them cleaner, brighter and easier to shop in.
Fresh produce is brought to customers in our new ‘farmer to you’ crates, meaning less handling and even better quality.
We are offering customers greater quality and value with our growing range of innovative housebrands, including ‘You’ll love Coles’ and ‘$mart Buy’.
We now have roll cages in all stores, improving the distribution of stock onto shelves.
1st Choice Liquor Superstores are now in Victoria, New South Wales and Queensland as our roll out gathers momentum. We have 19 1st Choice Superstores and plan at least 15 more next year.
Customer focus
Fresh produce
Innovative housebrands
On-shelf availability
1st Choice roll out
9Coles Myer Annual Report 2006 9Coles Myer Annual Report 2006

“We recently tried a few of
the new ‘You’ll love Coles’
products… now we hunt
for them…”
At Coles, we aim to offer great value and convenience.
Every week we offer over 2000 specials, plus specially-timed ‘mega sales’, to provide even more value to our customers.
We’re proud of the quality and value of our growing housebrand range. Customers doing their weekly shopping can choose ‘$mart Buy’ products for quality at the lowest price, or the ‘You’ll love Coles’ range which offers quality at least equal to the market leader, at a lower price. We work hard to source our housebrand products in Australia and to offer our customers the quality they expect at the prices they demand.
We’re proud of the quality and value of our growing housebrand range
Every year we support Australian growers, purchasing over $2.5 billion of fresh produce and meat. This year we sourced 97% of our fresh food and 85% of our grocery products from Australia.
Safety in our stores, for customers and team members, is very important to us. In the past year we have reduced work-related incidents and hours lost through injury, and also had a 30% reduction in our Lost Time Injury Frequency Rate.
This year, we introduced roll cages to our stores. These cages deliver stock faster and more safely from distribution centres to stores and onto shelves.
10 Coles Myer Annual Report 200610 Coles Myer Annual Report 2006
“With two children, I’m always
on the go… I know I can get
everything I need at Coles in
one easy shop”
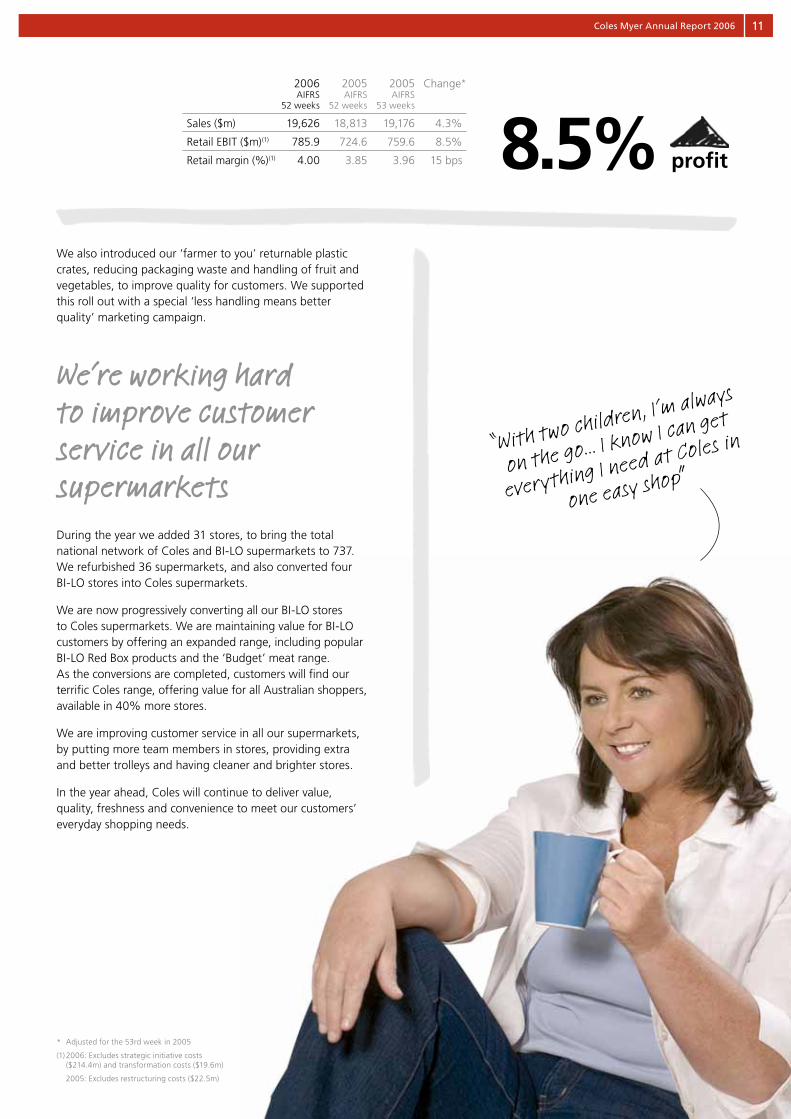
We also introduced our ‘farmer to you’ returnable plastic crates, reducing packaging waste and handling of fruit and vegetables, to improve quality for customers. We supported this roll out with a special ‘less handling means better quality’ marketing campaign.
We’re working hard to improve customer service in all our supermarkets
During the year we added 31 stores, to bring the total national network of Coles and BI-LO supermarkets to 737. We refurbished 36 supermarkets, and also converted four BI-LO stores into Coles supermarkets.
We are now progressively converting all our BI-LO stores to Coles supermarkets. We are maintaining value for BI-LO customers by offering an expanded range, including popular BI-LO Red Box products and the ‘Budget’ meat range. As the conversions are completed, customers will fi nd our terrifi c Coles range, offering value for all Australian shoppers, available in 40% more stores.
We are improving customer service in all our supermarkets, by putting more team members in stores, providing extra and better trolleys and having cleaner and brighter stores.
In the year ahead, Coles will continue to deliver value, quality, freshness and convenience to meet our customers’ everyday shopping needs.
8.5% profi t
2006AIFRS
52 weeks
2005AIFRS
52 weeks
2005AIFRS
53 weeks
Change*
Sales ($m) 19,626 18,813 19,176 4.3%
Retail EBIT ($m)(1) 785.9 724.6 759.6 8.5%
Retail margin (%)(1) 4.00 3.85 3.96 15 bps
* Adjusted for the 53rd week in 2005
(1) 2006: Excludes strategic initiative costs ($214.4m) and transformation costs ($19.6m)
2005: Excludes restructuring costs ($22.5m)
11Coles Myer Annual Report 2006 11Coles Myer Annual Report 2006

“I’ve just discovered 1st
Choice. What a fantastic
store... it has really changed
the way I shop for liquor”
We aim to be Australia’s best value liquor retailer, and we’ve made good progress this year.
This year, we added 148 stores and closed 52 to give a network of 735 liquor stores under our Liquorland, 1st Choice, Vintage Cellars, Theo’s and Hedley brands and had 69 hotels at year end.
Acquiring the Hedley Hotel Group brought us 102 liquor stores, 35 hotels, and potential sites for 17 1st Choice Liquor Superstores in the fast-growing Queensland market. We also entered Far North Queensland with this acquisition, further helping us toward our goal of leadership in the Queensland market.
Our 1st Choice Liquor Superstore roll out has gained momentum
Our 1st Choice Liquor Superstore roll out has gained momentum. Including our fi rst stores in Victoria and New South Wales, at the end of the fi nancial year we had 19 superstores open and plan to open at least 15 more in the year ahead.
Customers have welcomed the refurbishment of 57 of our Liquorland stores. As well as looking smarter, the stores are much easier for customers to ‘grab and go’, with a more tailored range, clear signage, open fridges and easier-to-reach shelves.
As part of the process to simplify our brand network and reduce operating costs, the Theo’s chain in NSW is being
converted to our other liquor formats.
Next year, we will maintain our specialist offer with Vintage Cellars, grow convenience with Liquorland and continue our 1st Choice Liquor Superstore roll out.
12 Coles Myer Annual Report 200612 Coles Myer Annual Report 2006

“I love the convenience of Coles
Express. I can fi ll up the car, grab
a snack, bread and milk and be
on my way!”
This year, we continued our journey to become Australia’s number one fuel and convenience retailer.
We now have almost 600 stores in convenient locations, offering competitive prices and the popular fuel discount scheme.
Convenient locations and popular fuel discount scheme
We partnered with Shell to launch Shell Optimax Extreme, Australia’s fi rst super premium 100 octane, high performance 5% ethanol fuel offered exclusively at over 50 Coles Express sites in eastern Australia.
We also partnered with Shell to introduce ‘Fuel Economy Formula’.
Our convenience stores performed well with a reinvigorated offer to customers and a focus on service. This year we improved our convenience offer with the addition of ‘You’ll love Coles’ milk and bread and new food-to-go ranges.
We were able to improve food freshness and quality and save costs by bringing supply operations within the Coles Myer network.
Next year, we will keep looking for ways to give customers on-the-go better value and quality in fuel and convenience food.
2006AIFRS
52 weeks
2005AIFRS
52 weeks
2005AIFRS
53 weeks
Change*
Sales ($m) 6,187 5,380 5,494 15.0%
Retail EBIT ($m) 30.0 21.6 24.0 38.9%
Fuel
38.9%at a glance
profi t
* Adjusted for the 53rd week in 2005
13Coles Myer Annual Report 2006 13Coles Myer Annual Report 2006

“Surprise me.
Inspire me.
Give me choice.”
GeneralMerchandiseand Apparelat a glance
no problem…Our non-food brands have continued their turnaround path, improving their customer offers and growing sales and earnings in a challenging environment of record fuel prices.
Target is now one of Australia’s most successful retail businesses and Offi ceworks, the leading offi ce supply retailer. The price achieved for the sale of Myer demonstrates the underlying value of this brand.
Kmart has focused on improving its quality of sales and will be an integral component of the new everyday needs business.
14 Coles Myer Annual Report 2006

14.4%*
0
10
20
30
40
50
60
70
80
06‡05‡04†03†02†01†
Und
erly
ing
EBIT
($m
)
16.2%*
-100
50
100
150
200
250
06‡05‡04†03†02†01†
Und
erly
ing
EBIT
($m
)
-3.0%*
0
10
20
30
40
50
60
70
80
90
06‡05‡04†03†02†01†
Und
erly
ing
EBIT
($m
)
*Adjusted for the 53rd week in 2005 †AGAAP ‡AIFRSRefer prior Annual Reports for an explanation of prior year results
$76.0m
$248.3
m
$74.9m
Customers enjoyed our wide range of quality clothing, lifestyle, homewares, entertainment, offi ce and technology products, as well as car maintenance and repair services.
We stayed on the pulse with fashion this year, offering our fashion-conscious customers the latest in apparel, including new brands and exclusive designer ranges.
During the year, we extended our ranges of stylish and affordable womenswear, menswear, children’s clothing, footwear and homewares.
We have streamlined direct sourcing and supply so we can get quality products to our customers faster and more effi ciently.
This year the Myer business was sold. After a 21-year partnership, we farewelled an iconic brand and a great team of people.
Great value
Fashion – on the pulse
Stylish merchandise and apparel
Direct sourcing
Farewell Myer
15Coles Myer Annual Report 2006 15Coles Myer Annual Report 2006

“I live for my weekends!
Camping with the kids or just
kicking the ball around…
If I need something I just
head to Kmart… they have
everything, at prices that
don’t break the bank”
We take pride in helping our customers enjoy their leisure time at affordable prices.
Creating brighter more exciting stores for our customers
This year, we’ve improved our range of products, giving our customers the latest in basic fashion clothing, lifestyle, entertainment and homewares. Our exclusive brands including Living with Deborah Hutton, Patio by Jamie Durie, Jackeroo, Now and Girl Xpress continue to be popular.
Our targeted events, including our Easter, Toy and Home sales, again proved popular with our customers.
Seven new Kmart stores opened this year, bringing the total to 185, and we have plans underway for several more. We also refurbished seven stores. We added 91 new auto stores, including former Shell autoserv sites making us Australia’s largest car servicing network with 275 convenient locations.
Kmart Tyre and Auto Service had a challenging year as higher fuel prices affected customer spending on vehicle maintenance and repair.
Our team is vital to making our stores exciting for customers. We encourage career development, and we reward and recognise our great team members through our
‘Celebrate’ program.
We are getting products into stores and to customers faster and more effi ciently by streamlining our supply chain, from both local and overseas suppliers. We’ve worked especially hard to get imported merchandise into stores faster.
Next year, some of our Kmart stores have the potential to be integrated into SuperCentres, offering customers an easy and convenient destination shopping experience.
Our focus is now on developing a great new range of general merchandise and apparel, combined with brighter stores to ensure we fulfi l customers’ leisure lifestyle needs as part of the Coles everyday needs business.
2006AIFRS
52 weeks
2005AIFRS
52 weeks
2005AIFRS
53 weeks
Change*
Sales ($m) 4,001 3,982 4,023 0.5%
Retail EBIT ($m)(1) 76.0 78.3 85.5 -3.0%
Retail margin (%)(1) 1.90 1.97 2.13 -7 bps -3.0% profi t
* Adjusted for the 53rd week in 2005
(1) 2006: Excludes strategic initiative costs ($12.8m)
2005: Excludes the benefi t on re-measurement of Kmart New Zealand onerous lease provision ($3.5m)
16 Coles Myer Annual Report 200616 Coles Myer Annual Report 2006

“Target has become cool.
It’s pretty much that simple.
They know what’s in and what’s not.
I love it!”
Target provides customers with great style, fashion and value. Our strategy is to be different, not only in the products we sell, but in how our stores look, and how we communicate with our customers.
Giving our customers great style, fashion and value
Our Target and Target Country stores offer customers across Australia a wide range of merchandise. Customers especially love our clothing, footwear and homewares, and we keep building on these strengths.
We again had great success this year with womenswear, menswear, children’s clothing and footwear. Our revitalised intimate apparel range was also very well received by customers. During the year, we extended our womenswear range, introducing ‘free fusion’, a brand for young, fashion-conscious women, and an exclusive limited range by acclaimed designer Gwendolynne.
In homewares, we continued to focus on stylish and affordable products. We used total room concepts to successfully showcase our new ranges to customers and the media. Our ‘jelli deli’ dog accessories were a fun fashion line which proved very popular with our customers.
This year, we streamlined inventory management, bringing Target Country into Target’s merchandise system.
We opened nine new stores, expanded nine stores and closed fi ve smaller stores during the year, taking our network to 259 stores.
Next year, we will keep building on our strengths in clothing, footwear and homewares, giving our customers great style, fashion and value. We also aim to grow sales by accelerating our plans for new store openings, and we will refurbish key stores to display our new, differentiated look.
2006AIFRS
52 weeks
2005AIFRS
52 weeks
2005AIFRS
53 weeks
Change*
Sales ($m) 3,170 3,039 3,089 4.3%
Retail EBIT ($m)(1) 248.3 213.6 218.8 16.2%
Retail margin (%)(1) 7.83 7.03 7.09 80 bps 16.2% profi t
* Adjusted for the 53rd week in 2005
(1) 2006: Excludes strategic initiative costs ($14.6m)
17Coles Myer Annual Report 2006 17Coles Myer Annual Report 2006

“My offi ce has never been
so organised, and the colours
are fantastic! ”
Offi ceworks delivered another year of solid growth, as we improved our quality range of offi ce and technology products for home offi ces and small-to-medium businesses.
We keep improving our quality range of offi ce and technology products
We opened eight new stores this year, taking our Offi ceworks retail network to 95 stores, as well as our eight Harris Technology Business Centres. We also opened our fi rst new, smaller format store in Victoria, giving us greater fl exibility and speed for future growth.
Strong promotional events continued to excite our customers during the year, especially our popular Back-to-School, The Works and Tax Time promotions.
We launched digital photo kiosks, a new contemporary stationery range and children’s educational stationery, and introduced FlyBuys in our retail stores.
We have kept our focus on improving our team with learning and development and attracting talented people with new recruitment branding. We have improved our safety culture and reduced injuries, making Offi ceworks a safer place to work and shop.
We have also had a strong focus on improving stock management this year.
We restructured Harris Technology early this fi nancial year, removing a signifi cant segment of unprofi table sales. While this impacted on our sales growth for the year, it has improved our overall profi tability.
In the year ahead, we will keep building our core range of stationery, copy and print services and technology consumables. We will be expanding
2006AIFRS
52 weeks
2005AIFRS
52 weeks
2005AIFRS
53 weeks
Change*
Sales ($m) 1,229 1,214 1,236 1.2%
Retail EBIT ($m)(1) 74.9 65.5 68.4 14.4%
Retail margin (%)(1) 6.09 5.40 5.53 69 bps 14.4% profi t
* Adjusted for the 53rd week in 2005
(1) 2006: Excludes strategic initiative costs ($1.7m)
18 Coles Myer Annual Report 200618 Coles Myer Annual Report 2006

“I get great shopping offers and
discounts by using my Coles Myer
Source MasterCard… and the regular
fuel discounts help me save every
time I fi ll up”
To reward customers for shopping with us, we have continued to develop our comprehensive rewards program.
Our Gift Cards continue to become more popular
FlyBuys is Australia’s biggest customer loyalty program, with a membership of 2.5 million households. We will further enhance the program’s rewards in the year ahead.
The Coles Myer Source MasterCard program continues to deliver value to over one million Australians, offering a range of benefi ts, including bonus FlyBuys points, interest-free offers and regular savings on petrol, without having to pay an annual fee.
Our Gift Cards have grown in popularity with the introduction of new products including the offi cial AFL-themed cards. We are always looking to introduce new and exciting products. We were the fi rst retailer to introduce iTunes Music Cards in Australia.
Rewards, Gift Cardsand iTunesat a glance
19Coles Myer Annual Report 2006 19Coles Myer Annual Report 2006

A fond farewell
Dear shareholders, team members and customers,
It’s been 21 years since two of Australia’s iconic retailing names, Coles and Myer were joined.
Now we are farewelling the Myer name, 60 stores nationwide, and a great team of people.
When GJ Coles & Coy Limited merged with The Myer Emporium Limited in 1985, they
knew they were acquiring outstanding stores and brands including Myer, Grace Bros,
Target, Fosseys, Country Road, Dynamite and Red Rooster.
Becoming Australia’s largest retail group was only part of the story. Myer is an iconic
Australian business, representing strength, style and great customer service. And the team
of people behind the Myer brand was a huge part of what made acquiring this brand so
attractive, then and now.
Myer, an iconic Australian business
During our 21-year partnership, Myer has continued to expand its impressive offer to
customers, and has cemented its place as Australia’s leading department store, appealing
to fashion enthusiasts as well as families.
The Myer team – including many who were part of the Company before the partnership
with Coles – rightly have great pride in their brand, and have made sure Myer has stayed
true to its unique style during the past 21 years.
Selling Myer was a sensible decision for us, but not an easy one. Many of us have not been
part of this Company without Myer, and we farewell the brand – and especially the Myer
team – with fond memories.
We know the Myer team and Myer customers have much to look forward to in the years
ahead, building on a celebrated history of more than 100 years of retail service.
On behalf of everyone who has been part of the great Coles Myer partnership during the
last 21 years, I thank the Myer team and wish all of them success in the future.
Rick Allert
20 Coles Myer Annual Report 200620 Coles Myer Annual Report 200620 Coles Myer Annual Report 2006

Coles Myer Annual Report 2006 21

Meet the Board Board of Directors
Left to right: Keith Barton, Sandra McPhee, Tony Hodgson,
Martyn Myer, Belinda Hutchinson, John Fletcher, Rick Allert,
Patty Akopiantz, Michael Wemms and Bill Gurry.
Patricia (Patty) E AkopiantzNon-executive DirectorBA (Wellesley), MBA (Harvard), age 42, (appointed Director 2001)
Ms Akopiantz has extensive senior management and consultancy experience in retail and consumer industries both in Australia and overseas. Ms Akopiantz is a Director of Wattyl Limited (from 2005), Energy Australia Limited (from 2006) and AXA Asia Pacifi c Holdings Limited (from 2006). She is a member of the Advisory Council of the Australian Graduate School of Management and Chief Executive Women. She is also a Director of the Foundation for Young Australians and the YWCA-NSW.
Richard (Rick) H Allert, AM ChairmanFCA, age 63, (appointed Director 1995, Chairman from 2002)
Mr Allert has had a distinguished career as a chartered accountant. He is the Chairman of AXA Asia Pacifi c Holdings Limited (a Director from 1995). Mr Allert is a Director of the Australia Business Arts Foundation and Chairman of the Australia Council’s Major Performing Arts Board. He has been a Director of a number of public companies over many years and has also held positions with a number of government instrumentalities and community organisations.
Ronald K (Keith) BartonNon-executive DirectorBSc, PhD (UNSW), FTSE, age 66, (appointed director 2003)
Dr Barton is a former Chief Executive Offi cer and Managing Director of James Hardie Industries Ltd, after holding a variety of executive positions at CSR Ltd. Dr Barton’s current Directorships include Tower Ltd (from 2001), Amcor Ltd (from 1999), Air Liquide Australia Limited and Vision Australia Limited (from 2004). Dr Barton’s previous board appointments include Goodman Fielder Ltd (Chairman), F H Faulding Ltd, Colonial Ltd and Australian Wealth Management Limited (2004-2005) and Citect Corporation Ltd (2001-2006).
John E FletcherManaging Director and Chief Executive Offi cerFCPA, age 55, (appointed Director 2001)
Prior to Coles Myer, Mr Fletcher spent almost all his professional career with Brambles Industries, commencing in 1974, initially in an accounting role and then in a series of operating and senior management positions. He was appointed General Manager of the Transport Division in 1982, Commercial Director Europe in 1984, Managing Director CHEP Australia in 1986, Managing Director Brambles Australia in 1988 and Chief Executive Offi cer of Brambles Industries in 1993. Mr Fletcher retired as CEO of Brambles in 2001. Mr Fletcher was previously a Director of Telstra Corporation Limited (2001-2006).
William (Bill) P Gurry, AO Non-executive DirectorLLB, age 59, (appointed Director 2001)
Mr Gurry is a former Executive Chairman of one of Australia’s foremost investment banks, UBS. He has had a career in the Australian fi nance sector, being a former Managing Director of Capel Court Corporation, National Mutual Royal Bank Limited and Executive Director of Australian Bank Limited. He is currently a Director of Rabobank Australia Limited, Rabo Australia Limited, Cheviot Bridge Limited (from 2004), The Financial Markets Foundation for Children, New Matilda Pty Ltd, Australian Jesuit Foundation and the St Vincent’s and Mercy Private Hospital. Mr Gurry has previously held positions with a number of corporate, government and community entities.
22 Coles Myer Annual Report 2006

Anthony (Tony) G Hodgson Non-executive DirectorFCA, FAICD, age 66, (appointed Director 2003)
Mr Hodgson was a co-founder of the specialist chartered accounting fi rm, Ferrier Hodgson, from which he retired in 2000 after 24 years. His role included the evaluation and implementation of marketing and business strategies to achieve major corporate restructures and turnarounds. Mr Hodgson’s current board appointments include Deputy Chairman (Chairman Audit Committee) Tabcorp Holdings Ltd (Director from 1994) and a Director of Committed Securities Limited. He is a member of the Advisory Council at JP Morgan and of the Advisory Board at VISY Industrial Holdings Limited. Mr Hodgson’s previous directorships include RMG Limited (Chairman), Melbourne Port Corporation (Chairman), Victorian TAB (Chairman), Presidents Club Limited and HSBC Bank Australia Ltd.
Belinda HutchinsonNon-executive DirectorBEc, FCA, age 53, (appointed Director 2005)
Ms Hutchinson has broad experience as a Non-executive Director and as an executive within the banking and fi nancial services sector. Ms Hutchinson is a Director of Telstra Corporation Limited (from 2001) and QBE Insurance Group Ltd (from 1997). She is also a Director of St Vincents and Mater Health Sydney Limited and President of the State Library of New South Wales Council. Ms Hutchinson’s previous appointments include Director of Energy Australia Limited (1997-2005) TAB Limited (1997-2004) and Crane Group Limited (1997-2004).
Sandra V McPhee Non-executive DirectorDipEd, FAICD, age 60, (appointed Director 2003)
Ms McPhee has considerable experience as a Non-executive Director and as a senior executive in international consumer facing industries including aviation, retail and tourism, most recently with Qantas Airways Limited. Ms McPhee is a Director of Perpetual Limited (from 2004). She is also a Director of Australia Post, The Art Gallery of NSW and St Vincents and Mater Health. Ms McPhee’s previous appointments include Deputy Chair South Australia Water, and Director of Primelife Corporation Limited (2003-2005), CARE Australia and Tourism Council Australia.
Martyn K MyerNon-executive DirectorBEng, MESc, MSM (MIT), age 49, (appointed Director 1996)
Mr Myer has extensive experience in fi nancial services, engineering and biotechnology. He is Chairman of Cogstate Ltd (Director from 2000), a software company providing cognitive performance testing software to the pharmaceutical clinical trials market, a Director of Diversifi ed United Investments Ltd (from 1991), the SP Austnet group of companies (from 2005), and from 1994 until 2002 was Managing Director of Merlyn Asset Management Pty Ltd, a boutique funds management company. Prior to his move to the fi nancial services industry, he had experience with some of Australia’s leading manufacturers. Mr Myer has involvement in several philanthropic activities, including President of the Howard Florey Institute at the University of Melbourne and Member of the Board of The Myer Foundation. Previous appointments include Director of The Myer Family Company Pty Ltd and The Myer Family Offi ce Pty Ltd.
Michael WemmsNon-executive DirectorBA, MBA, age 66, (appointed Director 2003)
Mr Wemms has extensive retail and business experience in the United Kingdom. He worked at Tesco from 1972 to 2000 in a range of positions, including Store Manager, Personnel Director and Store Operations Director. He was a Director of Tesco plc from 1989-2000 and a part-time advisor to the company until June 2003. His current Non-executive Directorships include the international automotive group, Inchcape plc (from 2004) and Majid Al Futtaim Group LLC of Dubai. Mr Wemms is also Chairman of House of Fraser plc (Director from 1996) and was previously the Chairman of the British Retail Consortium (2004-2006).
Committee membership
Audit and Risk Committee: Tony Hodgson (Chair), Patty Akopiantz, Rick Allert, Martyn Myer, Michael Wemms
Nomination and Remuneration Committee: Rick Allert (Chair), Keith Barton, Bill Gurry, Belinda Hutchinson, Sandra McPhee,
Corporate Social Responsibility Committee: Rick Allert (Chair), Patty Akopiantz, John Fletcher, Martyn Myer
23Coles Myer Annual Report 2006

24 Coles Myer Annual Report 2006
Corporate governance
Your Directors and management are committed to high standards of corporate governance, which are embodied in the Board Governance Charter. This charter establishes the framework for how the Board oversees the Company and performs its functions on behalf of shareholders.Role of the Board
The Board is responsible to shareholders for the overall strategy, governance and performance of the Company. Under the Board Governance Charter, the Board has reserved certain matters to itself for decision, such as appointing the CEO and approving strategy and annual budgets. All matters not specifi cally reserved to the Board for decision have been delegated to the CEO for decision.
Composition of the Board
The Board is to have a majority of independent Directors so that it can bring quality judgments, which are free of bias, to all issues. An independent Director is one who is free from any interest and any business or other relationship which could, or could reasonably be perceived to, materially interfere with the Director’s ability to act with a view to the best interests of the Company.
The Board has adopted a defi nition of ‘independence’, which is in line with the ASX Corporate Governance Council Best Practice Recommendations. For full details visit www.colesmyer.com. The Chairman of the Board should be an independent Director. The Board currently comprises nine independent Non-executive Directors and one Executive Director, being the Managing Director.
Criteria for Board membership
For Directors appointed by the Board, the Board will consider the range of skills and experience required in light of:
the strategic direction and progress of the Company;
the current composition of the Board; and
the need for independence.
A Director appointed by the Board must stand for election at the next annual general meeting. Apart from the Managing Director, all Directors are subject to re-election by rotation at least once every three years.
Board committees
The Board carries out certain duties by delegation to Board committees. These committees meet regularly and make recommendations to the Board on the issues delegated to them. The committees’ charters may be viewed on the Company’s website.
Audit and Risk CommitteeThe committee assists the Board in relation to the Company’s corporate governance framework, the identifi cation of areas of signifi cant business risks and the monitoring of:
the preparation of the Company’s fi nancial statements;
maintenance of an effective and effi cient internal and external audit;
n
n
n
n
n
effective management of business risks;
compliance with laws and regulations; and
business dealings, in particular related party transactions.
The committee is responsible for the appointment, compensation, retention and oversight of the work of the external auditor. Under the committee’s charter all members must be independent Directors. The committee members are Tony Hodgson (Chair), Patty Akopiantz, Rick Allert, Martyn Myer and Michael Wemms.
Nomination and Remuneration Committee
The principal responsibilities of the committee are:
to advise the Board on directorship appointments, with particular attention to the mix of skills, experience and other qualities of existing Directors;
to advise the Board on the appointment of potential successors to the Chief Executive Offi cer;
to review Board succession plans;
to review independent experts’ advice and then advise the Board annually on:
Chief Executive Offi cer’s remuneration
Non-executive Directors’ remuneration
to annually review the Board’s required mix of skills, experience and other qualities;
to develop and implement a process for the orientation and education of new Directors;
to review and advise the Board annually on the components of remuneration for executives reporting directly to the Chief Executive Offi cer;
review management’s recommendations and advise the Board on:
performance-linked compensation packages for management
executives’ retirement, pension and superannuation schemes
employee equity participation schemes
to review management’s recommendations and advise the Board on succession plans and leadership development plans for key senior positions within the Company;
to review the Company’s industrial relations strategy; and
to review strategic human resources matters.
Committee members are Rick Allert (Chair), Keith Barton, Bill Gurry, Belinda Hutchinson and Sandra McPhee. Subsequent to the end of the fi nancial year, the Board decided to separate this committee into a Nomination Committee and a Remuneration Committee. The members of the Nomination Committee are Rick Allert (Chair), Bill Gurry and Michael Wemms. The members of the Remuneration Committee are Sandra McPhee (Chair), Rick Allert, Keith Barton, Belinda Hutchinson and Michael Wemms.
n
n
n
n
n
n
n
–
–
n
n
n
n
–
–
–
n
n
n

25Coles Myer Annual Report 2006
Corporate Social Responsibility Committee
This committee advises the Board on issues related to the Company’s social and environmental commitments to its stakeholders. Committee members are Rick Allert (Chair), Patty Akopiantz, John Fletcher and Martyn Myer.
Board appraisal process
The Board monitors and evaluates its performance and the performance of the Board committees and individual Directors annually in order to fairly review and actively encourage enhanced Board effectiveness. External consultants are engaged to assist in the evaluation process. The Board also evaluates the performance of each Director standing for re-election before deciding whether to recommend to shareholders that the Director be re-elected.
Fair dealings and related party transactions
Directors, as well as senior management, convey the message to all stakeholders through the relevant policies and our internal review mechanisms, that integrity and effective control cannot be compromised when dealing with suppliers, particularly if a supplier is a related party. The Company has implemented a comprehensive policy regarding related party transactions. A Director, or entities in which a Director has a signifi cant interest and/or infl uence, who enters into a transaction with the Company (other than a transaction involving the payment of compensation), must make full disclosure. If the total value of the transactions for a month exceeds $1 million, details will be reported to the Audit and Risk Committee. Certain contracts with Directors, or entities in which Directors have a signifi cant interest and/or infl uence, must be approved by the Audit and Risk Committee in advance of committing the Company.
Share trading
The Company’s policy and procedures on dealing in the Company’s securities requires that Directors and employees who possess inside information should never deal in the Company’s securities. It also provides that Directors and senior executives are not permitted to trade in the Company’s securities in the three-week period prior to the announcement of the half-year profi t result, the full-year profi t result or a quarterly sales announcement. It also prohibits Directors and senior executives from entering into hedging contracts in relation to their securities without fi rst obtaining the specifi c approval of either the Chairman or the CEO.
Group results and monitoring
The Board has overall responsibility for the appropriate reporting of the CML Group results. In order to effectively carry out this function, the Audit and Risk Committee monitors the effectiveness of the Group’s systems and internal fi nancial controls. The Group’s performance is monitored on a monthly basis through annual operating and capital budgets which have been established by the relevant business heads and approved by the Board. Internal Audit is used extensively to monitor the areas of greatest risk as identifi ed by risk analysis. The external auditor reviews and tests the system of internal control to the extent necessary to form an opinion on the Financial Report.
External auditor independence
The independence and performance of the external auditor is subject to continual review by the Audit and Risk Committee. Audit engagement partners are rotated every fi ve years, with the most recent rotation occurring in the 2002 fi nancial year.
Code of Conduct
A Code of Conduct, based on the fundamental principle that all Company affairs shall be conducted legally, ethically and with strict observance of the highest standards of integrity and propriety, has been adopted by all Directors and employees. It is wide ranging and describes how an individual should act in many different circumstances.
It also provides guidance on how to resolve uncertainties and how to deal with suspected breaches of the Code by others. The Code may be viewed on the Company’s website.
Non-executive Director tenure policy
The Board has adopted a tenure policy for all Non-executive Directors.
The policy provides that Non-executive Directors will hold offi ce for no more than 10 years (normally three full terms) unless there are special circumstances in which the Board considers that the Director should serve longer. The Chairman is expected to serve in that role for at least fi ve years.
Professional advice to Directors
Subject to the approval of the Audit and Risk Committee, Directors may engage an outside professional advisor at the expense of the Company in appropriate circumstances.
Communication with shareholders
The Company is committed to:
ensuring that shareholders and the fi nancial markets are provided with full and timely information about its activities;
complying with continuous disclosure obligations contained in applicable Australian Stock Exchange (ASX) Listing Rules and the Corporations Act; and
ensuring that all stakeholders have equal opportunities to receive externally available information issued by the Company.
The Company has established a Continuous Disclosure Committee which is responsible for monitoring the continuous disclosure practices of the Company, assessing the information provided by the Company’s businesses and considering the appropriate response to any market rumours concerning the Company. Information is communicated to shareholders through the distribution of the Annual Report and whenever there are other signifi cant developments to report. In addition, all signifi cant information is posted on the Company’s website as soon as it is disclosed to the ASX.
The annual general meeting, along with profi t and sales presentations, is also broadcast live on the website. A copy of all the governance policies referred to in this report are also able to be viewed on the Company’s website.
n
n
n
26 Coles Myer Annual Report 2006
Corporate governance(continued)
Donations
The Board’s decision to contribute to the major political parties, federally and in the states, is motivated by its desire to see a strong political system that supports the democratic process in Australia.
Commitments made to political parties at the federal and state levels during the year were:
Australian Labor Party $82,000
Liberal Party of Australia $82,000
National Party of Australia $23,500
ASX corporate governance recommendations
At the date of this report the Company complies with the ASX Principles of Good Corporate Governance and Best Practice Recommendations.
The information required to be disclosed by those recommendations is found both in this Corporate Governance section and in the Directors’ Report on pages 39-40 of this report.

27Coles Myer Annual Report 2006
Concise fi nancial statementsIncome statementFor the 52 weeks ended 30 July 2006 (2005: 53 weeks ended 31 July)
2006 $m 2005(1) $m
Continuing operations
Revenue from sale of goods (excluding goods and services tax) 34,212.0 33,018.2
Other operating revenue (excluding fi nance income) 91.8 71.9
Cost of goods sold (26,160.8) (25,305.3)
Gross profi t 8,143.0 7,784.8
Other income 134.4 68.3
Advertising expenses (358.8) (296.2)
Selling and occupancy expenses (5,662.3) (5,424.7)
Administrative expenses (1,427.3) (1,142.0)
Finance income 25.0 29.0
Finance costs (123.9) (84.2)
Share of profi t of joint venture accounted for using the equity method 21.9 37.0
Profi t before income tax expense 752.0 972.0
Income tax expense (215.6) (285.9)
Profi t from continuing operations 536.4 686.1
Profi t/(loss) from discontinued operations 627.2 (48.2)
Profi t for the year(2) 1,163.6 637.9
Earnings per share for profi t from continuing operations attributable to the ordinary equity holders of the Company
Basic earnings per share 43.0 cents 51.8 cents
Diluted earnings per share 42.6 cents 52.2 cents
Earnings per share for profi t attributable to the ordinary equity holders of the Company
Basic earnings per share 93.4 cents 47.9 cents
Diluted earnings per share 92.4 cents 48.5 cents
(1) The Income Statement for the year ended 31 July 2005 has not been restated as permitted by AASB 132 Financial Instruments: Disclosure and Presentation and AASB 139 Financial Instruments: Recognition and Measurement which have been adopted from 1 August 2005.
(2) The profi t for the year ended 30 July 2006 was $1,163.6 million. After adjusting for the gain on disposal of Myer of $583.7 million and strategic initiative costs of $207.4 million, the profi t for the year would have been $787.3 million.
The profi t for the year ended 31 July 2005 was $637.9 million. After adjusting for the Kmart New Zealand onerous lease provision re-measurement benefi t of $3.5 million and the Megamart divestment costs of $57.1 million, the profi t for the year would have been $691.5 million.
The above income statement should be read in conjunction with the accompanying notes.

28 Coles Myer Annual Report 2006
Concise fi nancial statementsBalance sheetAs at 30 July 2006 (2005: as at 31 July)
2006 $m 2005(1) $m
Current assets
Cash and cash equivalents 485.6 440.9
Trade and other receivables 390.8 557.1
Inventories 2,851.8 3,261.6
Derivative fi nancial instruments 1.4
Assets classifi ed as held for sale 151.7
Total current assets 3,881.3 4,259.6
Non current assets
Receivables 43.7 51.9
Investments 125.0 144.9
Derivative fi nancial instruments 9.4
Property, plant and equipment 3,133.3 3,487.8
Investment properties 7.6 9.6
Deferred tax assets 484.5 449.0
Intangible assets 1,412.2 803.3
Retirement benefi t asset 38.3 17.7
Total non current assets 5,254.0 4,964.2
Total assets 9,135.3 9,223.8
Current liabilities
Trade and other payables 3,080.3 3,018.8
Interest bearing liabilities 30.2 216.0
Derivative fi nancial instruments 24.0
Tax liabilities 66.4 127.3
Provisions 761.9 600.8
Total current liabilities 3,962.8 3,962.9
Non current liabilities
Payables 23.0
Interest bearing liabilities 974.0 1,213.3
Derivative fi nancial instruments 16.1
Deferred tax liabilities 77.6 103.0
Provisions 320.7 317.9
Other 163.1 211.6
Total non current liabilities 1,574.5 1,845.8
Total liabilities 5,537.3 5,808.7
Net assets 3,598.0 3,415.1
Equity
Contributed equity 2,144.2 2,068.6
Reserves 3.9 7.1
Retained profi ts 1,449.9 1,339.4
Total equity 3,598.0 3,415.1
(1) The Balance Sheet for the year ended 31 July 2005 has not been restated as permitted by AASB 132 Financial Instruments: Disclosure and Presentation and AASB 139 Financial Instruments: Recognition and Measurement which were adopted from 1 August 2005.
The above balance sheet should be read in conjunction with the accompanying notes.

29Coles Myer Annual Report 2006
Concise fi nancial statementsStatement of recognised income and expensesFor the 52 weeks ended 30 July 2006 (2005: 53 weeks ended 31 July)
2006 $m 2005(1) $m
Foreign currency translation reserve
Exchange differences on translation of foreign operations (7.3) (0.5)
Cash fl ow hedge reserve
Net hedging losses recognised directly in equity (11.5)
Net hedging gains transferred to fi nancial liabilities –
Net hedging gains transferred to inventory (8.6)
Retained profi ts
Actuarial gain on defi ned benefi t plan 17.4 2.7
(10.0) 2.2
Income tax on equity items 0.8 (0.9)
Net (expenses)/income recognised directly in equity (9.2) 1.3
Profi t for the year 1,163.6 637.9
Total recognised income for the year 1,154.4 639.2
Effects of change in accounting policy – fi nancial instruments
Adjustment on adoption of AASB 132 and AASB 139, net of tax:
– Retained profi ts (20.7)
– Reserves 6.0
(14.7)
(1) The Statement of Recognised Income and Expenses for the year ended 31 July 2005 has not been restated as permitted by AASB 132 Financial Instruments: Disclosure and Presentation and AASB 139 Financial Instruments: Recognition and Measurement which have been adopted from 1 August 2005.
The above statement of recognised income and expenses should be read in conjunction with the accompanying notes.

30 Coles Myer Annual Report 2006
Concise fi nancial statementsCash fl ow statementFor the 52 weeks ended 30 July 2006 (2005: 53 weeks ended 31 July)
Infl ows/(outfl ows)
2006 $m 2005(1) $m
Cash fl ows from operating activities
Receipts from customers (inclusive of goods and services tax) 39,814.5 39,251.4
Payments to suppliers and employees (inclusive of goods and services tax) (38,012.2) (37,659.7)
Distributions received from joint venture partnership 10.2 10.1
Finance income received 23.6 28.9
Finance costs paid (112.8) (71.1)
Income tax paid (422.7) (402.5)
Net cash from operating activities 1,300.6 1,157.1
Cash fl ows from investing activities
Payments for property, plant and equipment and intangible assets (1,043.1) (925.0)
Payments for purchase of businesses and controlled entities, net of cash acquired (202.5) (120.0)
Payments for purchase of other investments (2.0)
Payment for purchase of joint venture (0.9) (1.3)
Proceeds on sale of property, plant and equipment 19.9 23.8
Proceeds on sale of businesses and controlled entities, net of transaction costs 1,309.9 3.9
Proceeds on sale of other investments 13.3
Net cash from investing activities 96.6 (1,020.6)
Cash fl ows from fi nancing activities
Proceeds from contributions to equity 122.5 120.0
Payments for purchases of buy-back shares, including transaction costs (838.2) (704.4)
Proceeds from borrowings 8,309.2 3,171.7
Repayments of borrowings (8,496.9) (2,691.6)
Dividends paid (453.1) (433.2)
Net cash from fi nancing activities (1,356.5) (537.5)
Net increase/(decrease) in cash held 40.7 (401.0)
Cash at the start of the year 440.9 841.9
Cash at the end of the year 481.6 440.9
(1) The Cash Flow Statement for the year ended 31 July 2005 has not been restated as permitted by AASB 132 Financial Instruments: Disclosure and Presentation and AASB 139 Financial Instruments: Recognition and Measurement which were adopted from 1 August 2005.
The above cash fl ow statement should be read in conjunction with the accompanying notes.
31Coles Myer Annual Report 2006
Concise fi nancial statementsNotes to the concise fi nancial statements
Note 1: 2006 concise fi nancial statements
The concise fi nancial statements are an extract of, and have been derived from, Coles Myer Ltd and its controlled entities Financial Report for the year ended 30 July 2006. The concise fi nancial statements cannot be expected to provide as full an understanding of the fi nancial performance, fi nancial position and fi nancing and investing activities of the CML Group as the Financial Report.
A copy of the CML Group’s Financial Report for the year ended 30 July 2006, including independent audit report, is available to all shareholders and will be sent to shareholders without charge upon request. CML share registry contact details are contained on the inside back cover of this report.
The expression ‘CML Group’ refers to Coles Myer Ltd and its controlled entities as a whole.
The fi nancial year is for the 52 weeks ended 30 July 2006 (2005: 53 weeks ended 31 July). Reference in this report to ‘a year’ is to the fi nancial year ended 30 July 2006, unless otherwise stated.
The presentation currency used in this report is Australian Dollars, unless otherwise stated.
Revenues and expenses are recognised net of the amount of goods and services tax. Dollar amounts have been rounded to the nearest tenth of a million dollars unless specifi cally stated otherwise. Where the amount is $50,000 or less, this is indicated by a dash (‘–’).
These are the fi rst CML Group concise fi nancial statements to be prepared in accordance with the Australian equivalents to International Financial Reporting Standards (AIFRS). AASB 1 First-time Adoption of Australian Equivalents to International Financial Reporting Standards has been applied in preparing these fi nancial statements.
The fi nancial statements of Coles Myer Ltd until 31 July 2005, had been prepared in accordance with previous Australian Generally Accepted Accounting Principles (AGAAP). AGAAP differs in certain respects from AIFRS. When preparing the fi nancial statements for the year ended 30 July 2006, management adopted certain changes to the accounting valuation and consolidation methods applied in the previous AGAAP fi nancial statements to comply with AIFRS. With the exception of fi nancial instruments, the comparative fi gures were restated to refl ect these adjustments. The CML Group has taken the exemption available under AASB 1 to only apply AASB 132 Financial Instruments: Disclosure and Presentation and AASB 139 Financial Instruments: Recognition and Measurement from 1 August 2005.
Further detail on the explanation of the transition to AIFRS can be found in note 40 of the Financial Report.

32 Coles Myer Annual Report 2006
Note 2: Signifi cant items
2006 $m 2005 $m
Profi t for the year includes the following items, whose disclosure is relevant in explaining the fi nancial performance of the CML Group
Disposal of Myer
Gain on sale of Myer, net of income tax benefi t of $20.0 million (note 3) 583.7
Strategic initiatives
Refer below for a detailed description of the costs associated with the strategic initiatives, net of income tax benefi t of $88.0 million (207.4)
Megamart divestment costs
Write-down of non current assets and inventory to recoverable amount, and provision for surplus leased space, net of income tax benefi t of $24.4 million (57.1)
376.3 (57.1)
Strategic initiatives
During the year ended 30 July 2006, a number of strategic initiatives were committed to, resulting in signifi cant write-downs and costs. These include:
redundancy expenses of $158.1 million associated with the consolidation of support services, simplifi cation of back offi ce processes and closure of the Somersby and Hampton Park distribution centres;
lease exit costs of $17.0 million associated with the closure of Somersby and Hampton Park distribution centres;
write-down of brand names of $22.6 million as a result of the rebadging of Theo’s liquor stores;
asset write-downs of $35.7 million and costs of $22.8 million associated primarily with the rebadging of BI-LO stores to Coles, and other store rebadging as a result of changes to the format;
accruals of $31.8 million associated with the changes to the existing loyalty program; and
other costs of $7.4 million.
2006 $m Food, Liquor & Fuel
Kmart Offi ceworks Target Property & Unallocated
Total
Provision for redundancies (100.3) (3.5) (11.8) (42.5) (158.1)(1)
Provision for surplus lease space (17.0) (17.0)
Write-down of brand names (intangible assets) (22.6) (22.6)
Asset write-downs (29.6) (2.5) (1.6) (2.0) (35.7)
Provision for restructuring (19.8) (3.0) (22.8)
Accruals – loyalty program (25.1) (3.8) (0.1) (2.8) (31.8)
Other costs (7.4) (7.4)(2)
Total strategic initiatives (214.4) (12.8) (1.7) (14.6) (51.9) (295.4)
(1) Includes $23.3 million paid during the year ended 30 July 2006.(2) Includes $6.8 million paid during the year ended 30 July 2006.
n
n
n
n
n
n
Concise fi nancial statementsNotes to the Concise Financial Statements (continued)

33Coles Myer Annual Report 2006
Note 3: Discontinued operations
A. Description
On 9 November 2005, CML Group announced the divestment of its nine Megamart stores. A pre-tax charge of $81.5 million was recorded in the year ended 31 July 2005, largely comprising the write-down of non current assets and inventory to recoverable amount and the recognition of a provision for surplus lease space. No consideration was received in relation to the divestment.
On 2 June 2006, CML Group disposed of its Myer business for $1,409.0 million. The disposal includes deferred consideration receivable of $19.5 million.
Financial information relating to these discontinued operations for the period to the date of disposal or divestment is set out below. Divestment costs have been included in profi t before income tax expense.
B. Financial performance and cash fl ow information
The fi nancial performance and cash fl ow information for Myer and Megamart are presented for the period to date of disposal or divestment and for the year ended 31 July 2005.
2006 $m 2005 $m
Revenue and other operating income 2,528.9 3,200.8
Expenses (2,466.7) (3,269.6)
Profi t/(loss) before income tax (expense)/benefi t 62.2 (68.8)
Income tax (expense)/benefi t (18.7) 20.6
Profi t/(loss) after income tax expense of discontinued operations 43.5 (48.2)
Gain on the sale of Myer before income tax benefi t 563.7
Income tax benefi t 20.0
Gain on sale of Myer after income tax benefi t 583.7
Profi t/(loss) from discontinued operations 627.2 (48.2)
Net cash from operating activities (51.5) 9.0
Net cash from investing activities (2006 includes an infl ow of $1,298.9 million from the disposal of Myer) 1,218.2 32.4
Net cash from fi nancing activities 121.1 (41.8)
Net cash generated by Myer and Megamart 1,287.8 (0.4)
C. Carrying amount of assets and liabilities
The carrying amounts of assets and liabilities for Myer as at 2 June 2006 and 31 July 2005 are:
2006 $m 2005 $m
Cash and cash equivalents 2.9 27.4
Trade and other receivables 23.3 264.1
Inventories 560.9 525.7
Property, plant and equipment and intangible assets 485.7 401.1
Deferred tax assets 83.2 74.9
Total assets 1,156.0 1,293.2
Trade and other payables (339.3) (305.1)
Provisions (74.1) (74.6)
Other (67.3) (69.9)
Total liabilities (480.7) (449.6)
Net assets 675.3 843.6

34 Coles Myer Annual Report 2006
Note 3: Discontinued operations (continued)
D. Details of the sale of Myer
2006 $m
Consideration received or receivable:
Cash 1,389.5
Deferred consideration receivable 19.5
Total disposal consideration 1,409.0
Carrying amount of net assets sold (675.3)
Divestment costs associated with Myer disposal (170.0)(1)
Gain on sale of Myer before income tax expense 563.7
Income tax benefi t 20.0
Gain on sale of Myer after income tax expense 583.7
(1) Includes $90.6 million of divestment costs settled in cash.
E. Other transactions related to the sale of Myer
As an outcome of the disposal of the Myer business and its related assets, the CML Group has issued options for the disposal of certain other freehold properties. On 31 August 2006 an option was exercised resulting in the disposal of Ocean Keys Shopping Centre for $78.0 million (carrying value $47.9 million). On 31 August 2006 an option for the sale of Casey Central Shopping Centre for $51.0 million (carrying value $50.7 million) was also exercised. The CML Group has also agreed to dispose of its 50% interest in the CMS General Trust for an amount in excess of its carrying value.
In addition, the CML Group entered into a number of contingent lease liabilities relating to the sale of its Myer business, whereby the CML Group has guaranteed the performance of certain leases by Myer Ltd. The guarantees amount to $164.6 million and primarily expire within a maximum of four years.
Note 4: Dividends
2006 $m 2005 $m
Ordinary shares Final dividend for the year ended 31 July 2005 of 17.0 cents (2004 15.0 cents) per fully paid ordinary share paid on 14 November 2005 (8 November 2004). Fully franked at 30% tax rate (2004 30%). 210.0 182.6
Interim dividend for the year ended 30 July 2006 of 19.5 cents (2005 16.25 cents) per fully paid ordinary share paid 15 May 2006 (9 May 2005). Fully franked at 30% tax rate (2005 30%). 243.1 199.9
Non-redeemable reset convertible preference shares (ReCAPS) Dividend of $3.2589 per share paid 30 November 2004. Fully franked at 30% tax rate. 22.8
Dividend of $3.2411 per share paid 31 May 2005. Fully franked at 30% tax rate. 22.7
Final dividend of $0.7479 per share paid 12 July 2005 upon conversion of the ReCAPS into contributed equity. Fully franked at 30% tax rate. 5.2
Total dividends 453.1 433.2
Dividends not recognised at year endIn addition to the above dividends, since year end the Directors have declared a fi nal dividend of 22.5 cents per fully paid ordinary share, fully franked based on tax paid at 30%. The aggregate amount of the proposed ordinary dividend expected to be paid on 13 November 2006 out of retained profi ts at 30 July 2006, but not recognised as a liability at year end, is $267.7 million. The fi nal dividend declared after 30 July 2006 will be fully franked out of existing franking credits or out of franking credits arising from the payment of income tax in the year ending 29 July 2007.
Franking creditsFranking credits of $297.7 million (2005 $411.8 million), at 30%, are available for the CML Group and will enable the payment of franked dividends for at least the next year.
Concise fi nancial statementsNotes to the Concise Financial Statements (continued)

35Coles Myer Annual Report 2006
Note 5: Impact on transition to AIFRS
Reconciliations and descriptions of the effect of transition from previous AGAAP to AIFRS on the CML Group’s equity and profi t for the year are provided in note 40 of the Financial Report. A summary of this information is provided below.
Impact on total equity as at 31 July 2005 reported under previous AGAAP
$m
Total equity as at 31 July 2005 as reported under AGAAP 3,730.0
Consolidation of the Coles Myer Employee Share Plan Trust (18.2)
Asset impairment (76.4)
Defi ned benefi t superannuation plan 12.4
Employee entitlements 4.6
Goodwill amortisation 10.0
Lay-bys and sales returns (40.1)
Leases – fi xed rental and incentives adjustment (108.9)
Reversal of property revaluations (76.1)
Income tax – buildings, gaming licenses and brand names (21.9)
Other (0.3)
Total equity as at 31 July 2005 – restated under AIFRS 3,415.1
Impact on profi t for the year ended 31 July 2005 reported under previous AGAAP
$m
Profi t for the year ended 31 July 2005 as reported under AGAAP 624.5
Consolidation of the Coles Myer Employee Share Plan Trust (3.5)
Asset impairment 8.6
Defi ned benefi t superannuation plan 4.0
Employee entitlements (2.0)
Goodwill amortisation 10.0
Lay-bys and sales returns (6.0)
Leases – fi xed rental and incentives adjustment (8.6)
Revaluation of properties to fair value 15.0
Share-based payments (5.4)
Other 1.3
Profi t for the year ended 31 July 2005 – restated under AIFRS 637.9
Impact on cash fl ow statement for the year ended 31 July 2005
The adoption of AIFRS has not resulted in any material adjustments to the Cash Flow Statement.

36 Coles Myer Annual Report 2006
Note 6: Segments
Primary reporting – business segments 2006 $m
Food, Liquor & Fuel
Kmart Offi ceworks Target Property and Unallocated
Total Continuing Operations
Discontinued Operations
– Myer/ Megamart
Consolidated
Revenue
Sales 25,812.6 4,000.5 1,228.8 3,170.1 34,212.0 2,486.4 36,698.4
Other operating revenue 72.3 0.6 2.3 0.2 16.4 91.8 42.5 134.3
Total segment revenue 25,884.9 4,001.1 1,231.1 3,170.3 16.4 34,303.8 2,528.9 36,832.7
Segment result 581.9(1) 63.2(2) 73.2(3) 233.7(4) (100.0)(5) 852.0 625.9 1,477.9
Net fi nance costs (100.0)
Profi t before income tax 1,377.9
Income tax expense (214.3)
Net profi t 1,163.6*
Segment assets 4,789.3 1,177.4 333.9 894.6 1,455.6 8,650.8 8,650.8
Tax assets 484.5
Total assets 9,135.3
Segment liabilities (2,168.2) (495.9) (158.6) (466.1) (2,104.5) (5,393.3) (5,393.3)
Tax liabilities (144.0)
Total liabilities (5,537.3)
Share of profi t in joint venture 21.9 21.9 21.9
Acquisitions of property, plant and equipment, intangibles and other non current segment assets 942.3 83.2 27.5 71.3 316.1 1,440.4 71.6 1,512.0
Depreciation and amortisation expense 298.7 55.2 16.6 46.4 73.0 489.9 34.8 524.7
Write-downs to recoverable amounts:
Property, plant and equipment (41.8) (7.8) (0.2) (49.8) (1.8) (51.6)
Intangible assets (22.6) (1.5) (24.1) (24.1)
Total write-down (64.4) (7.8) (0.2) (1.5) (73.9) (1.8) (75.7)
Reversal of previous write-downs:
Property, plant and equipment 4.6 6.6 0.6 11.8 36.3 48.1
* The profi t for the year was $1,163.6 million. After adjusting for the profi t on sale of Myer of $583.7 million (note 3) and strategic initiative costs of $207.4 million (note 2), the net profi t would have been $787.3 million.
(1) Includes strategic initiative costs of $214.4 million (note 2) and transformation costs of $19.6 million.(2) Includes strategic initiative costs of $12.8 million (note 2).(3) Includes strategic initiative costs of $1.7 million (note 2).(4) Includes strategic initiative costs of $14.6 million (note 2).(5) Includes strategic initiative costs of $51.9 million (note 2).
Concise fi nancial statementsNotes to the Concise Financial Statements (continued)

37Coles Myer Annual Report 2006
Note 6: Segments (continued)
Primary reporting – business segments 2005 $m
Food, Liquor & Fuel
Kmart Offi ceworks Target Property and Unallocated
Total Continuing Operations
Discontinued Operations
– Myer/ Megamart
Consolidated
Revenue
Sales 24,670.0 4,023.3 1,236.3 3,088.6 33,018.2 3,149.6 36,167.8
Other operating revenue 59.3 0.6 1.5 10.5 71.9 51.2 123.1
Total segment revenue 24,729.3 4,023.9 1,237.8 3,088.6 10.5 33,090.1 3,200.8 36,290.9
Segment result 761.1(1) 89.0(2) 68.4 218.8 (109.1)(3) 1,028.2 (68.8)(4),(5) 959.4
Net fi nance costs (56.2)
Profi t before income tax 903.2
Income tax expense (265.3)
Net profi t 637.9*
Segment assets 4,196.8 1,081.4 321.5 814.2 1,318.5 7,732.4 1,042.4 8,774.8
Tax assets 449.0
Total assets 9,223.8
Segment liabilities (1,916.0) (398.0) (151.7) (402.5) (2,188.5) (5,056.7) (521.7) (5,578.4)
Tax liabilities (230.3)
Total liabilities (5,808.7)
Share of profi t in joint venture 37.0 37.0 37.0
Acquisitions of property, plant and equipment, intangibles and other non current segment assets 470.0 62.4 17.4 50.1 462.6 1,062.5 72.2 1,134.7
Depreciation and amortisation expense 293.2 52.8 16.6 50.0 52.1 464.7 56.4 521.1
Write-downs to recoverable amount:
Property, plant and equipment (5.5) (6.2) (0.8) (13.4) (25.9) (42.0) (67.9)
Investment properties (5.8) (5.8) (5.8)
Intangible assets (2.4) (2.4) (2.4)
Total write-downs (5.5) (6.2) (0.8) (21.6) (34.1) (42.0) (76.1)
Reversal of previous write-downs:
Property, plant and equipment 0.6 1.7 2.3 1.3 3.6
* The profi t for the year was $637.9 million. After adjusting for the Kmart New Zealand onerous lease contract provision re-measurement benefi t of $3.5 million and the Megamart divestment costs of $57.1 million, the profi t for the year would have been $691.5 million.
(1) Includes $22.5 million of restructuring costs.(2) Includes $3.5 million benefi t on re-measurement of the Kmart New Zealand onerous lease provision.(3) Includes supply chain transformation costs of $43.2 million. (4) Includes $5.0 million of lease surrender income and $5.3 million of costs relating to unredeemed gift vouchers.(5) Includes $81.5 million of Megamart divestment costs.

38 Coles Myer Annual Report 2006
Note 6: Segments (continued)
Secondary reporting – geographical segments
Sales to external customers Segment assets Acquisition of property, plant and equipment, intangibles and other non
current segment assets
2006 $m 2005 $m 2006 $m 2005 $m 2006 $m 2005 $m
Australia 36,542.0 35,999.3 8,545.2 8,451.6 1,506.4 1,130.6
New Zealand 156.4 168.5 74.8 291.5 3.2 2.1
Other 30.8 31.7 2.4 2.0
36,698.4 36,167.8 8,650.8 8,774.8 1,512.0 1,134.7
Business segmentsThe CML Group operates predominantly in the retail industry and comprises the following main business segments:
Continuing Operations:Food, Liquor & Fuel Retail of grocery, liquor and fuel products
Kmart Retail of apparel and general merchandise
Offi ceworks Retail of offi ce supplies
Target Retail of apparel and general merchandise
Property and Unallocated Management of the CML property portfolio and unallocated or corporate functions
Discontinued Operations:Myer Retail of apparel and general merchandise
Megamart Retail of furniture and electrical goods
Geographical segmentsIn presenting information on the basis of geographical segments, segment revenue is based on the geographical location of customers. Segment assets are based on the geographical location of the assets.
The CML Group’s business segments operate geographically as follows:
Australia The home country of the parent entity The CML Group undertakes retail operations in all states and territories
New Zealand The CML Group has Kmart retail operations, supplying basically the same ranges of goods as the corresponding business in Australia. These operations are predominantly based in the North Island
Asia Branch offi ces located in China
Intersegment transfersSegment revenues, expenses and results include transfers between segments. Such transfers are principally priced on an arm’s length basis and are eliminated on consolidation.
The CML Group has certain investments in joint ventures and other associates. Segment disclosures relating to these investments have not been included, as they are not considered to be material.
Concise fi nancial statementsNotes to the Concise Financial Statements (continued)

39Coles Myer Annual Report 2006
Directors’ report
Directors’ report
The Directors present their report for the fi nancial year comprising the 52 weeks ended 30 July 2006.
Principal activities
The principal activity of the CML Group during the year was retailing, further details of which are set out from the inside front cover to page 21 of the Annual Report.
Directors
The Directors of CML during the period from 1 August 2005 to the date of this report and particulars of their qualifi cations, experience, special responsibilities and Directorships in other listed companies are set out on pages 22-23 of the Annual Report. Details of the qualifi cations and experience of the Company Secretary are also set out on the inside back cover of the Annual Report.
Board committees
The Board committees during the year were the Audit and Risk Committee, the Nomination and Remuneration Committee, and the Corporate Social Responsibility Committee. The composition of these committees and their functions is set out in the Corporate Governance Statement on pages 24-26 of the Annual Report. Subsequent to year end the Board decided to separate the Nomination and Remuneration Committee into a Nomination Committee and a Remuneration Committee.
Dividends
Details of dividends paid during the fi nancial year and to be paid in respect of the fi nancial year are set out on page 34 of the Annual Report.
Review and results of operations and likely future developments
The consolidated profi t for the year of the CML Group was $1,164 million.
The operations of the CML Group during the fi nancial year, the results of those operations, the fi nancial position of the CML Group and the Group’s business strategies and future prospects are reviewed in:
2006 in Review, see from the inside front cover to page 3
Q&A with the Chairman and CEO, see pages 6-7
Operational Review, see pages 8-21
Further details of likely future developments in the operations of the CML Group are referred to in the Q&A with the Chairman and CEO on pages 6-7 and also pages 4-5 of the Annual Report.
Further information in relation to these likely future developments has been omitted from this Directors’ Report, as to include it would be likely to result in unreasonable prejudice to the CML Group.
State of affairs
Particulars of the signifi cant changes in the state of affairs of the CML Group during the fi nancial year are as follows:
The sale of the Myer business for $1.4 billion;
An off-market share buy-back totalling $837 million was completed;
n
n
n
n
n
The acquisition of the Hedley Hotel Group for $320 million; and
Incurred costs of $295 million in relation to strategic initiatives.
Events after the end of the fi nancial year
On 18 August 2006 the Company received a conditional offer from a leveraged buy-out consortium offering to acquire the Company at an indicative price of $14.50 per share. The Board, after considering the offer and the advice of expert consultants, rejected the offer. The Directors are not aware of any other matter or circumstance that has arisen since the end of the fi nancial year that has signifi cantly affected, or may signifi cantly affect, the operations, results of operations or state of affairs of the CML Group in future fi nancial years.
Environmental
The CML Group is committed to conducting its business activities with respect for the environment while continuing to meet expectations of shareholders, employees, customers and suppliers. The CML Group is committed to achieving a level of environmental performance which meets or exceeds Commonwealth, state or local regulatory requirements, and to improve its use of natural resources and minimise waste where practicable.
The Directors are not aware of any material breaches of environmental regulations during the year. During the period from 1 August 2005 to the date of this report, no particular and signifi cant environmental regulation under a law of the Commonwealth or of a state or territory has applied to the CML Group or its operations.
Indemnity and insurance
CML has entered into a Good Faith Protection and Access Deed in the form approved by shareholders at the 1999 annual general meeting with Non-executive Directors of the Company. The Deed provides for indemnifi cation of the Directors to the maximum extent permitted under law and does not indemnify for any liability involving a lack of good faith. Article 70 of the Company’s constitution also provides an indemnity in favour of offi cers (including the Directors and Company Secretary) of CML (and such other offi cers and former offi cers of the CML Group as the Directors decide) against liabilities incurred while acting as such offi cers to the extent permitted by law.
No Director or offi cer of CML has received the benefi t of an indemnity from the Company during or since the end of the year. CML maintains a Directors’ and Offi cers’ insurance policy. Due to confi dentiality obligations and undertakings of the policy, no further details in respect of the premium or policy can be disclosed.
Rounding
Coles Myer Ltd is a company of the kind referred to in the Australian Securities & Investments Commission Class Order 98/0100 dated 10 July 1998. As a result, amounts in this report and accompanying fi nancial statements have, where applicable, been rounded to the nearest one hundred thousand dollars except where otherwise indicated.
Remuneration Report
As required by the Corporations Act, the Company’s remuneration report is set out on pages 41-56 of the Annual Report.
n
n

40 Coles Myer Annual Report 2006
Directors’ report(continued)
Attendance at meetings
Scheduled Board meetings
Non-Scheduled Board meetings
Audit and Risk Committee
Nomination and Remuneration
Committee
Corporate Social Responsibility
Committee
A B A C A B A B A B
Patty Akopiantz 8 8 6 9 4 4 4 4
Rick Allert 8 8 10 10 4 4 5 5 4 4
Keith Barton 8 8 9 10 5 5
John Fletcher 8 8 8 9 4 4
Bill Gurry 8 8 10 10 5 5
Tony Hodgson 8 8 10 10 4 4
Belinda Hutchinson 5 6 8 8 2 3
Sandra McPhee 8 8 10 10 5 5
Martyn Myer 8 8 4 6 4 4 4 4
Michael Wemms 8 8 7 10 3 4
A = Number of meetings attendedB = Number of meetings held while in offi ceC = Number of meetings held while in offi ce which the Director was eligible to attend.All Directors may attend Board committee meetings if they choose to. Other Board committee meetings held during the year were attended by Rick Allert (5/5), John Fletcher (8/8), Bill Gurry (1/1) and Tony Hodgson (4/4).
Directors’ interests in CML Shares
Ordinary shares in which a Director has a relevant interest
Patty Akopiantz 3,253Rick Allert 25,569Keith Barton 10,200John Fletcher(1) 1,204,458Bill Gurry 140,000Tony Hodgson 6,000Belinda Hutchinson 15,000Sandra McPhee(2) 4,139Martyn Myer 1,537Michael Wemms 208
Notes:(1) John Fletcher also holds a relevant interest in 1,704,500 options over
CML shares.(2) Sandra McPhee also holds a relevant interest in 3,400 endowment warrants
over CML shares.
Details of options on issue at the date of this report and of shares issued as a result of an exercise of an option during or since the end of the fi nancial year are set out in the Financial Report.
Audit and non-audit services
A copy of the auditor’s independence declaration is included on page 57 of the Annual Report.
During the year, the auditor, PricewaterhouseCoopers, was paid the following amounts in relation to non-audit services provided to the CML Group:
$’000U.S. regulatory 2,641Sales certifi cates under leases 636Acquisitions/divestments 903Taxation advice 93Other 211
4,484
The Directors are satisfi ed, based upon the advice of the Audit and Risk committee, that the provision of non-audit services outlined above by the auditor during the year is compatible with the general standard of independence for auditors imposed by the Corporations Act. The reason for forming this opinion is that the Audit and Risk committee has reviewed all non-audit services to ensure they do not affect the impartiality and objectivity of the audit. The unique knowledge of the CML Group possessed by the auditor places the audit fi rm in a position to provide these services in the most effi cient manner.
Signed in accordance with a resolution of the Board of Directors:
Rick AllertChairman
John FletcherManaging Director and Chief Executive Offi cer
21 September 2006

41
Remuneration report
In accordance with the remuneration reporting requirements of the Corporations Act 2001 and Accounting Standard AASB 124 ‘Related Party Disclosures’, this report details the remuneration arrangements for both the Company’s and Consolidated Entity’s Key Management Personnel (KMP).
In accordance with the requirements of AASB 124, KMP include:
The Chairman and Non-executive Directors of Coles Myer Ltd;
Mr John Fletcher, the Managing Director and Chief Executive Offi cer of Coles Myer Ltd; and
Those executives who have the authority and responsibility for planning, directing and controlling the activities of Coles Myer Ltd and the Consolidated Entity. During the 2006 fi nancial year, these individuals included Mr Hani Zayadi, Ms Dawn Robertson, Mr Larry Davis, Mr Tim Hammon, Mr Fraser MacKenzie and Ms Launa Inman. In identifying executives for inclusion in the group of KMP, consideration was given to the following additional criteria: the relative size of the business managed by the individual with relative size assessed on the basis of sales and/or a contribution to the consolidated result, the relative degree of decision making authority or autonomy inherent in an individual’s role and the extent to which the individual’s performance was visible to external stakeholders.
The same group of individuals are regarded as KMP for both Coles Myer Ltd and Consolidated Entity disclosure purposes.
In addition, in accordance with the Corporations Act 2001, this report also details the Company’s and the Consolidated Entity’s fi ve most highly remunerated offi cers during both the 2005 and 2006 fi nancial years.
This report forms part of the Directors’ Report and is set out under the following headings:
Principles applied in the determination of remuneration generally
Group performance and the link with remuneration
Non-executive Director remuneration
Managing Director and Chief Executive Offi cer and other Key Management Personnel remuneration
Summary of employment contracts
Details of Key Management Personnel remuneration
At risk remuneration
Share based remuneration
The information provided under headings A and C through H includes remuneration disclosures that are required under AASB 124. These disclosures have been transferred from the Financial Report and have been audited. The disclosures in section B are additional disclosures required by the Corporations Act 2001 and are not required to be and have not been audited.
n
n
n
A.
B.
C.
D.
E.
F.
G.
H.
Glossary of terms used in this report
CEO – Chief Executive Offi cer
CML – Coles Myer Ltd
CSSG – Comparative store sales growth
EBIT – Earnings before interest and tax
EPS – Earnings per share
KMP – Key Management Personnel
LTI – Long-term incentive
NPAT – Net profi t after tax
ROI – Return on investment
SEOP – Senior Executive Option Plan
SEPSP – Senior Executive Performance Share Plan
STI – Short-term incentive
TFR – Total fi xed remuneration
TSR – Total shareholder return
A. Principles applied in the determination of remuneration generally
The Nomination and Remuneration Committee (the Committee)
The Committee plays a key role in setting the CML Group’s remuneration framework and policy and in the determination of remuneration amounts paid to KMP. The Committee is responsible for:
advising the Board on matters concerning the appointment of new Directors and the CEO;
advising the Board on general matters of succession planning;
annually reviewing independent expert advice on the level of remuneration paid to the CEO and for reporting to the Board accordingly;
annually reviewing and advising the Board on the components of remuneration of those executives who report directly to the CEO;
reviewing management’s recommendations in relation to the CML Group’s remuneration framework generally and specifi cally in relation to the linking of remuneration to performance; and
reviewing the remuneration report.
The Committee comprises at least three Non-executive Directors, with the Committee’s Chairman appointed by the Board. The Committee meets at least three times per year and other Directors, not being members of the Committee, may attend meetings. Other CML executives and/or parties external to the CML Group may attend at the invitation of the Chairman of the Committee. The following independent Non-executive Directors were members of the Committee during 2006: Rick Allert (Chair), Keith Barton, Bill Gurry, Belinda Hutchinson and Sandra McPhee.
n
n
n
n
n
n
Coles Myer Annual Report 2006

42
Remuneration report(continued)
During the 2006 fi nancial year the Committee received independent expert advice from Mercer Human Resources on the level of remuneration paid to KMP. Ernst & Young was also retained to provide advice on how the CML Group’s LTI program could be best structured and operated in the coming years so as to remain consistent with market trends and deliver sustained increases in shareholder value over the longer term.
Amongst others, key activities undertaken by the Committee during the year which had a signifi cant impact on remuneration outcomes, included:
reviewing the calculation of STI entitlements in relation to the 2005 fi nancial year, and thereafter authorising the payment of those entitlements;
authorising the adoption of the LTI entitlement program for 2006; and
consideration of appropriate succession planning strategies in relation to roles occupied by the executive leadership team.
CML’s KMP remuneration framework and policy
The overriding objective of CML’s KMP remuneration framework is to enable CML to attract, retain and motivate top quality individuals and to ensure reward for performance is competitive and appropriate given the results generated. In particular the framework aligns executive remuneration with the achievement of strategic objectives and the creation of value for shareholders. The Board ensures that KMP remuneration satisfi es the following key criteria for good remuneration governance practices:
competitiveness and reasonableness relative to market;
performance linkage and alignment of executive remuneration to outcomes which create shareholder value; and
transparency.
The KMP remuneration framework provides a mix of fi xed and variable remuneration components. Variable remuneration components are at risk and take the form of short-term cash incentives and long-term equity based rewards. The provision of fi xed and at risk remuneration components is expected to generate a market competitive remuneration outcome that aligns remuneration to:
Shareholder interests by:
the inclusion of fi nancial measures such as profi t and earnings targets as a core component of short and long-term incentive programs
focusing on sustained growth in shareholder wealth and the extent to which that growth is comparable to the growth achieved by other signifi cant Australian industrial companies
attracting and retaining high calibre executives
acknowledging and rewarding behaviour which is consistent with the CML Group’s values and behaviours
n
n
n
n
n
n
n
–
–
–
–
KMP’s interests by:
rewarding capability and performance
providing a clear structure for earning remuneration
incentivising them to appropriately manage their teams to generate shareholder value.
B. Group performance and the link with remuneration
The adoption of an appropriate remuneration framework incentivises KMP to work towards the creation of shareholder value. Over the past fi ve years, the success of offering incentives to KMP has generated outcomes which are consistent with an increase in shareholder value including:
a share price, as per Graph 1, which stood at $11.70 at 28 July 2006 – this price represents an increase of $6.30 or 92% relative to the price as at 1 August 2001 and compares favourably to the 39% average share price increase in ASX top fi fty companies over the same time frame;
a $454 million increase in underlying net profi t after tax from $333 million in 2001 to $787 million in 2006 – underlying profi t after tax has more than doubled over the 5 year period, as evidenced in Graph 2;
a sustained increase in earnings per share, as evidenced in Graph 3;
the return of more than $1.5 billion to shareholders through share buy-backs, and dividends have increased as evidenced in Graph 4; and
the divestment of Myer for $1.4 billion during 2006.
As detailed in Section D, the quantum of short-term cash and long-term equity incentives actually received by each individual key management person is dependant, to varying degrees, on both fi nancial and other non-fi nancial measures of performance. In turn, the incentive, if any, actually received by an individual is dependent on the degree of success achieved each year. Year on year improvement in a performance measure in itself does not necessarily result in the payment of a cash reward or the issue of equity to an individual. However, improvement above a minimum level does result in individuals obtaining entitlements to cash and/or equity rewards. Underlying net profi t after tax, being an indicator of CML Group performance, is one measure that is used to determine whether KMP are entitled to an annual cash incentive. Earnings per share is a CML Group performance measure used to determine whether KMP are entitled to equity incentives.
Over the last fi ve years, actual increases in underlying net profi t after tax have been suffi cient to mean that cash incentive amounts referrable to that particular performance measure have generally been payable. Similarly, over that period suffi cient increases in earnings per share have generally resulted in equity-based incentives in the form of options vesting in favour of KMP.
n
–
–
–
n
n
n
n
n
Coles Myer Annual Report 2006

43
Graph 2 The increase in the CML Group’s underlying net profi t from 2001 to 2006
0
200
400
600
800
2006‡2005‡2004*2003*2002*2001*
$ m
illio
n
*AGAAP ‡AIFRS
Graph 4 Dividends from 2001 to 2006
0
10
20
30
40
50
200620052004200320022001
cent
s pe
r sh
are
Graph 3 Movements in underlying EPS over the period from 2001 to 2006
0
10
20
30
40
50
60
70
2006‡2005‡2004*2003*2002*2001*
cent
s
EPS
*AGAAP ‡AIFRS
EPS required for full vesting of options granted in financial year 2002
Graph 1 CML’s share price performance relative to the ASX 50 Index from 1 August 2001 to 28 July 2006
Coles Myer Ltd
ASX 50 Index
70
80
90
100
110
120
130
140
150
160
170
180
190
28.07.0601.08.0502.08.0401.08.0301.08.0201.08.01
Coles Myer Annual Report 2006

44 Coles Myer Annual Report 2006
Remuneration report(continued)
C. Non-executive Director remuneration
The Committee is responsible for reviewing the level of Non-executive Director fees. When undertaking this review and prior to making a recommendation to the Board as to appropriate fee levels, the Committee considers:
the Company’s existing remuneration policies;
independent professional advice;
fees paid by companies of comparable size and complexity;
the general time commitment required from Non-executive Directors and the risks associated with discharging the duties attaching to the role of Director; and
the level of remuneration necessary to attract and retain Directors of a suitable calibre.
After considering the Committee’s recommendation, Non-executive Director fees, including committee fees, are then set by the Board within the maximum aggregate amount of $2 million (2005 $1.5 million) last approved by shareholders in November 2005. In accordance with CML’s constitution, superannuation contributions and retirement benefi ts are not taken into account for the purposes of the maximum aggregate Non-executive Director remuneration approved by shareholders. Table 1 sets out the remuneration levels applicable to the roles undertaken by Non-executive Directors.
The Board has determined that Non-executive Directors’ fees will be increased annually in accordance with increases in the Consumer Price Index (All Groups). In addition, the Board also undertakes to periodically review Non-executive Director fees to ensure they remain consistent with general fee levels paid by comparable companies. As a result of a market review during the year, base fees for Non-executive Directors increased to $160,000 and the Chairman’s fee increased to $480,000. These fee increases became effective on 1 May 2006. The Board will continue to review its approach to Non-executive Director remuneration to ensure it remains in line with general industry practice.
n
n
n
n
n
In addition, Non-executive Directors are reimbursed for business related travel costs and they receive an annual expense allowance of $5,825 (2005 $5,825) to cover costs incurred in maintaining a home offi ce such as telephone, stationery and computer costs.
No element of a Non-executive Director’s remuneration is performance related or at risk. The Board believes that the absence of at risk remuneration components from the Non-executive Director remuneration structure enhances the strength of the Board’s independence and its ability to objectively consider corporate governance issues and other commercial matters.
Retirement benefi ts
The Company ceased to offer retirement benefi ts to Non-executive Directors on 27 March 2003. However, Non-executive Directors who were appointed prior to 27 March 2003 retained their contractual entitlement to a retirement benefi t. Their contracts provided for a retirement benefi t equal to the aggregate of remuneration received by the particular Director over the last three years of service plus 5% of that amount for each year of service in excess of three years, but not exceeding 15 years, with any benefi t paid on retirement, termination or death being reduced by the amount of any superannuation benefi t received. On 18 November 2005 those Directors who were contractually entitled to a retirement benefi t agreed to have their benefi t frozen at that date in exchange for having their base fee increased to the same level as the fee payable to Non-executive Directors who were not entitled to a retirement benefi t. Accrued retirement benefi ts are set out in Table 2. The benefi ts shown are net of superannuation benefi ts payable.
Table 1 – Directors’ base fees (inclusive of superannuation entitlements)
Board Audit and Risk Committee Nomination and Remuneration Committee
Corporate and Social Responsibility Committee
Chairman(2)
$Member
$Chairman
$Member
$Chairman
$Member
$Chairman
$Member
$
2006 Fee(1) 480,000 160,000 40,000 20,000 20,000 10,000 10,200 5,100
2005 Fee 337,900 149,800 30,700 10,200 10,200 5,100 10,200 5,100
(1) Up until 18 November 2005, Directors who were appointed prior to 27 March 2003 received lower annual fees of $112,600 (exclusive of superannuation) to refl ect their entitlement to retirement benefi ts. From 18 November 2005, the retirement benefi ts of these particular Directors were frozen and all Directors now receive fees on the same scale.
(2) The Chairman does not receive additional fees for serving on Board committees.

45Coles Myer Annual Report 2006
D. Managing Director and Chief Executive Offi cer and other Key Management Personnel remuneration
The remuneration of KMP (other than Non-executive Directors) comprises both fi xed and at risk remuneration components. Further, KMP may be entitled to a retirement benefi t on completion of their service to the CML Group pursuant to the terms of their employment contract or otherwise at the discretion of the Board. Each remuneration component is further detailed below.
Total fi xed remuneration (TFR)
The fi xed component of remuneration comprises a base salary amount. Base salary is determined on an individual basis and does not vary over the course of a year. A salary packaging approach is followed whereby base salary may be taken in the form of cash, superannuation contributions, non–monetary fringe benefi ts (including up to two motor vehicles) and other benefi ts. All KMP remuneration is governed by the same salary packaging policy.
Base salary amounts are reviewed annually with revisions to amounts payable taking into account, amongst other things, individual performance during the previous year, changes in the size and scope of the role occupied by the specifi c executive and the continued signifi cance of the role to the CML Group. There are no guaranteed increases in TFR.
At risk remuneration
The at risk remuneration component comprises both short-term and long-term incentive components. These are intended to remunerate relevant KMP for increasing shareholder value via the achievement of fi nancial targets and the implementation of appropriate business strategies. Such strategies include business acquisition and divestment plans, new property acquisitions to enable development of new stores in key geographic areas and capital management initiatives.
Short-term incentives (STI)
The STI program is available to KMP (excluding Non-executive Directors), and involves linking specifi c annual fi nancial and non–fi nancial performance measures with the opportunity to earn cash amounts based on a percentage of TFR. The STI program is designed to reward executives for the successful achievement of specifi ed levels of individual, business unit or Brand and CML Group performance over the fi nancial year.
STI performance measures are determined annually by the Board to refl ect the strategic business objectives of the CML Group. The Board takes advice from the CEO in relation to the STI performance measures applicable to the CEO’s direct reports. The Board also takes advice from independent, external advisers on the level of remuneration that is potentially available to the CEO and the CEO’s direct reports under the STI program. The STI amounts payable vary depending on the degree of achievement – performance above a threshold level is required before any STI is payable. Table 3 summarises the criteria entering into the calculation of each executive’s potential 2006 STI entitlement and the percentage of each executive’s TFR that was available if various performance levels were achieved.
The actual STI paid to eligible KMP with respect to the 2006 and 2005 fi nancial years is detailed in Tables 7 and 8 respectively.
Table 2 – Accrued retirement benefi ts at year end
Non-executive Directors entitled to retirement benefi ts Years of service Accrued retirement benefi t
2006 $ 2005 $
Rick Allert (Chairman) 10 1,140,436 1,078,619
Patty Akopiantz 4 324,196 315,232
Bill Gurry 5 319,769 322,469
Martyn Myer 9 374,114 370,287
Total 2,158,515 2,086,607

46 Coles Myer Annual Report 2006
Remuneration report(continued)
Table 3 – STI performance criteria
KMP STI performance criteria applicable to the calculation of each KMP’s STI
STI potential as a percentage of total fi xed remuneration
(assuming all criteria are met at the relevant level)
NPAT Managed brands ROI People Customer Other Threshold Target Stretch
EBIT CSSG
J. Fletcher • • • • • 39% 66% 120%
H. Zayadi • • • • • 33% 55% 100%
D. Robertson(1) • • • • • • 26% 44% 80%
L. Davis • • • • • 26% 44% 80%
T. Hammon • • • 26% 44% 80%
F. MacKenzie • • • • 25% 50% 100%
L. Inman • • • • • 26% 44% 80%
(1) As set out in the summary of Ms Robertson’s employment contract in Section E, Ms Robertson’s 2006 STI contained special terms that specifi cally related to the completion of the divestment of Myer. In the event that her 2006 STI, as calculated by reference to the criteria and percentages above, was less than 60% of her total fi xed remuneration, then an STI equivalent to 60% of Ms Robertson’s total fi xed remuneration was payable irrespective of whether the divestment was or was not completed during the 2006 fi nancial year.
STI performance criteria
A summary of each STI performance criteria and the methods used to assess whether the performance criteria is satisfi ed are set out below. These criteria have been adopted because they directly align KMP remuneration outcomes to the delivery of increases in shareholder value.
Underlying NPAT, managed brand’s underlying EBIT, CSSG and ROI.
Underlying NPAT is a CML Group performance measure calculated after excluding certain non-recurring items of income and expenditure. Managed brand’s underlying EBIT and underlying CSSG are brand specifi c performance measures that are used to assess the performance of those KMP who have responsibility for managing a CML brand. Underlying EBIT is calculated after excluding certain non-recurring items of income and expenditure from a brand’s result. Underlying CSSG compares relative sales levels on a like-for-like basis between years after adjusting for such things as store closures, new store openings and temporary store closures due to refurbishments and other reasons.
ROI is a CML Group performance measure calculated by dividing the CML Group’s underlying EBIT by average net assets employed.
The performance criteria described above are calculated via reference to the fi gures appearing in the Company’s Annual Report and in management reports prepared for internal purposes. These particular fi nancial performance criteria were chosen in favour of others on the basis that they are readily and objectively determinable, they are capable of being independently verifi ed and because an increase in each is likely to most directly correlate to an increase in shareholder value via an increase in share price and/or an increased capacity to pay dividends in the future. For these reasons, STI potential is generally weighted more heavily towards fi nancial outcomes.
n
Customer
The Customer performance criteria is a brand specifi c performance measure. Performance is assessed based on the results arising from customer surveys and the degree of loyalty customers exhibit to a particular brand as a place to shop. An external third party conducts the survey and the degree of customer loyalty is assessed on a fi ve-point scale. Achievement of a specifi ed level of improvement in customer loyalty relative to the prior year results in an STI entitlement.
People
The People performance measure is used to assess the extent to which an individual executive behaves in a manner consistent with the CML Group’s values and behaviours. At the core of the CML Group’s value and behaviours framework is an expectation that all individuals will focus on delighting our customers, being the best team and growing shareholder value. A 360-degree feedback process is undertaken in July of each year to assess the extent to which individual executives adhere to CML’s values and behaviours. This process involves obtaining feedback on a particular executive from a range of parties including the executive’s peers and direct reports, the CEO and the Board.
Other
Other performance criteria are adopted which are specifi c to the nature of each executive’s role. Such other performance criteria can be linked to cost control targets, the acquisition of new store sites, the delivery of critical strategic business objectives and to an increase in earnings per share.
n
n
n

47Coles Myer Annual Report 2006
STI performance assessment
The Board makes an assessment after the conclusion of the fi nancial year in order to determine whether the individual performance of the CEO and each of the CEO’s direct reports results in an entitlement to an STI, and if so whether their performance entitles them to a threshold, target or stretch STI amount. STI amounts are ordinarily only payable if an executive occupies an eligible position as at the conclusion of each fi nancial year and pro-rata entitlements are ordinarily not payable if an executive leaves the CML Group prior to this date. However, the Board does have discretion to negotiate alternate outcomes in the event of an executive’s termination. When payable, STI are calculated via reference to each individual executive’s TFR, determined as at the end of the fi nancial year.
Long-term incentives (LTI)
LTI are provided via the Senior Executive Performance Share Plan (SEPSP) and the Senior Executive Option Plan (SEOP). LTI are provided in addition to STI in order to motivate executives to adopt strategies and to make decisions which have a positive and enduring impact on the drivers of shareholder value over the longer term.
Senior Executive Performance Share Plan (SEPSP)
The SEPSP, approved by shareholders at the 2004 annual general meeting, is designed to link long-term executive remuneration with the growth in shareholder value. It is also designed to facilitate the retention of strategically important senior executives.
The SEPSP provides for annual grants of performance shares to executives. A performance share is a right to acquire an ordinary share in the Company for no consideration.
The number of performance shares granted to each executive is calculated by reference to the level of responsibility of the executive and the market value of the Company’s share price at the start of each fi nancial year.
Subject to performance hurdles being met, performance shares may vest at the end of the testing period. The testing period is a three year period commencing on the fi rst day of the fi nancial year of the grant. If the performance hurdles are not met at the end of the testing period the performance shares will lapse.
If the performance hurdles are met, then the Company will issue or transfer ordinary shares to the executive. The Company currently intends to undertake on-market share purchases and to subsequently transfer the shares acquired to eligible executives so as to ensure there is no dilution of existing shareholder interests as a result of the operation of the performance share plan. Once transferred to eligible executives, the shares must then be held by the executive for a period of 12 months following which they will be free to deal
with the shares. There are two performance hurdles applicable to the performance shares, namely relative total shareholder return (TSR) and underlying earnings per share (EPS) growth. Each hurdle applies to 50% of the performance shares granted to each participant. For 100% of an executive’s performance shares to vest, both the TSR and EPS hurdles must be satisfi ed to the maximum extent.
TSR measures changes in the market value of the Company’s shares over a three-year test period. In the calculation of the market value of shares, dividends are notionally re-invested. TSR was chosen as a performance measure because it:
ensures an alignment between the return to shareholders and executive remuneration;
provides a comparative, externally focused performance benchmark with which to measure the CML Group’s performance relative to those companies with which the Group competes for capital, customers and talent; and
is a performance measure widely used in long-term incentive plans adopted by comparable Australian companies.
TSR performance is compared with the TSR performance of the largest 50 industrial companies in the S&P/ASX Top 100 index over discrete three-year periods. Calculation of TSR is undertaken independently by Mercer Consulting Group or Link Market Services.
EPS is a measure of earnings or profi ts that accrue to each shareholder and is calculated by dividing the CML Group’s underlying net profi t after tax by the weighted average number of shares on issue during the year. An underlying profi t fi gure is used and refl ects reported profi t after tax excluding certain non-recurring items of income and expenditure.
EPS was chosen as a performance measure because it:
is a fundamental indicator of fi nancial performance, both internally and externally; and
links directly to the CML Group’s long-term objective of growing earnings.
EPS performance is assessed at the end of each discrete three-year period. Performance shares vest if the EPS over the three year period exceeds target EPS.
The TSR and EPS vesting schedules are set out in Tables 4-6. Prior to vesting, performance shares carry no voting or dividend rights.
Performance share vesting schedules
Performance shares subject to the TSR performance hurdle (TSR performance shares) will vest in accordance with Table 4.
n
n
n
n
n
Table 4 – TSR vesting schedule
TSR Target % of TSR performance shares that vest
TSR below 51st percentile Nil
TSR between 51st and 74th percentile (inclusive) Progressive vesting on a straight-line basis from 50% to 99%
TSR at or above 75th percentile 100%

48 Coles Myer Annual Report 2006
Remuneration report(continued)
During the 2006 fi nancial year, the Board undertook a review of the EPS performance hurdle to ensure that it remained market competitive and provided an appropriate and meaningful incentive to senior executives to improve shareholder wealth. The hurdles applicable to the SEOP, determined in 2001, were adopted in the creation of the SEPSP in 2004. In 2001 the CML Group had just reported an underlying net profi t of $333 million and announced a fi ve year turnaround strategy. As the strategy was drawing to a conclusion and its fi nancial goals had been largely achieved, the Board considered that the scope for further compound double-digit increases in EPS growth had diminished and that a review of the EPS hurdles applicable to SEPSP (but not the SEOP) was required. As a result of the review, which considered the LTI programs of other comparable companies, and for SEPSP purposes only, the Board approved a new vesting schedule that is inclusive of modifi ed, more progressive EPS hurdles.
The Board considers that these new hurdles, whilst diffi cult to achieve, provide senior management with a more reasonable degree of incentive potential than would have been the case had the pre-existing hurdles continued to be applied. The new EPS vesting schedule, as set out in Table 5, is applicable when determining whether EPS performance hurdles have been met in the third test year in relation to performance shares issued in the 2005 fi nancial year and in the second and third test years in relation to performance shares issued in the 2006 fi nancial year. The new vesting schedule is also applicable in determining whether performance shares issued in the 2007 fi nancial year and subsequent fi nancial years will vest. The pre-existing vesting schedule, as set out in Table 6, remains applicable for the purposes of determining whether EPS performance hurdles have been met in the fi rst and second test years in relation to performance shares issued during the 2005 fi nancial year and the fi rst test year in relation to performance shares issued during the 2006 fi nancial year.
If a participant ceases to be employed due to death, disability, retrenchment or retirement prior to the three-year testing date, pro-rata vesting will occur, subject to performance hurdles being met. In this situation the performance hurdles will be tested at the next half or full fi nancial year end following cessation of employment.
Senior Executive Option Plan (SEOP)
Prior to the introduction of the SEPSP, the Company operated the SEOP. The SEOP provided for market priced options to be issued to senior executives. The SEOP has now been replaced by the SEPSP. However, as some options granted under the SEOP still remain on issue (including those granted to the CEO), a brief description of the SEOP is set out below.
Subject to performance hurdles being met and the payment of the relevant exercise price, an option confers a right in favour of the executive to purchase ordinary shares in the Company. The exercise price of each option is determined via reference to the weighted average market price of the Company’s shares, as quoted on the ASX, during the 10 trading days prior to the day on which the option is issued.
Executives generally received one grant of options, which, subject to performance hurdles being met, vests progressively over a fi ve-year period. Supplementary grants were given to executives who were promoted. In general there is no vesting during the fi rst two years post issue. After two years, 40% of the options granted may vest, followed by 20% for each of the next three years.
Consistent with the SEPSP, TSR and EPS performance hurdles are also used for the purposes of determining whether options granted under the SEOP actually vest. Except for 1,500,000 options granted to the CEO in 2003, all other options on issue vest subject to the EPS hurdles as detailed in Table 6 and a TSR hurdle which provides progressive vesting of options between the 50th and 65th percentiles.
Table 5 – The new EPS vesting schedule
EPS Target % of EPS performance shares that vest
EPS growth less than 8% pa compound Nil
EPS growth at 8% pa compound 25%
EPS growth between 8% pa and 10% pa compound Progressive vesting on a straight-line basis from 25% to 49%
EPS growth at 10% pa compound 50%
EPS growth between 10% pa and 12% pa compound Progressive vesting on a straight-line basis from 51% to 99%
EPS growth at or above 12% pa compound 100%
Table 6 – The pre-existing EPS vesting schedule
EPS Target % of EPS options and performance shares that vest
EPS growth less than 12.5% pa compound Nil
EPS growth at 12.5% pa compound 50%
EPS growth between 12.5% pa and 15% pa compound Progressive vesting on a straight-line basis from 51% to 99%
EPS growth at or above 15% pa compound 100%

49Coles Myer Annual Report 2006
Other than the 1,500,000 options granted to the CEO, achievement of either EPS or TSR hurdle results in the options vesting.
In respect to the tranche of 1,500,000 options granted to the CEO in November 2003, 50% vest subject to the achievement of the TSR hurdle and 50% vest subject to the achievement of the EPS hurdle. The TSR hurdle for this particular tranche of options is set out in Table 4.
Options ordinarily lapse if performance hurdles are not achieved within the fi ve-year period post grant date or if an executive resigns prior to completion of the required vesting periods. However, the Board, in its discretion, may decide that options will vest notwithstanding that performance targets have not been met or in the instance where an executive resigns prior to the completion of the required vesting period. In addition, where an executive leaves the CML Group as a result of death, disability, retirement or retrenchment, they are, subject to performance hurdles being met, entitled to options on a pro-rata basis to the date of their departure.
Valuation of LTI equity based remuneration
In accordance with the requirements of the Accounting Standards, remuneration as disclosed in Tables 7 and 8 includes a proportion of the notional value of equity instruments, being options and performance shares, granted or outstanding during the fi nancial year. The notional value of these equity instruments is determined as at the grant date and is progressively allocated over the instrument’s vesting period. Amounts included in remuneration are not necessarily indicative of the benefi t (if any) that an individual may ultimately receive should the equity instruments vest. The notional value of performance shares issued in 2005 and 2006 and options issued in earlier years has been determined in accordance with AASB 2 ‘Share-based Payment’. Equity instruments are valued by independent valuers. Performance shares are valued using the Monte-Carlo pricing model, which incorporates market based performance conditions such as TSR. Options are valued using the Black-Scholes pricing model. Where options are subject to performance conditions, a 50% probability has been applied to the Black-Scholes valuation. Performance share and option amounts are expensed over their vesting period and as such enter into the determination of net profi t.
Retirement benefi ts
Where an executive’s employment with the CML Group is terminated, termination entitlements are paid in accordance with contractual obligations or otherwise at the discretion of the Board.
E. Summary of employment contracts
Section E contains a summary of the employment contract for each Key Management Person (excluding Non-executive Directors whose details of employment are set out in section C). Each summary excludes details in relation to an executive’s remuneration and STI arrangements where they are disclosed elsewhere in this report.
Unless otherwise noted, each employment contract is open ended and includes standard termination clauses that provide that the Company may terminate an executive’s employment at any time by providing 12 months notice or payment in lieu of notice.
An executive’s employment may also be terminated without notice or payment in lieu of notice where circumstances warrant summary dismissal. Unless otherwise noted, KMP may resign at any time by providing six months notice. Further, each employment contract provides that each KMP may be entitled to an allocation of performance shares subject to performance hurdles being met and the rules applicable to the long-term incentive plan. The number of performance shares that each may receive is determined annually by the Board. Table 11 sets out the number of performance shares that were allocated to KMP during the year ended 30 July 2006.
John Fletcher – Managing Director and Chief Executive Offi cer
Mr Fletcher’s employment contract was entered into on 3 September 2001 and has been extended such that it is now open ended. It provides an entitlement to:
receive a car allowance of $60,000 per year plus reimbursement for maintenance and fuel costs;
receive 2,500,000 options with such options vesting at a rate of 500,000 per year over the fi ve year period to 3 September 2006 subject always to performance hurdles being met; and
receive a pro-rata entitlement to an STI in the event that Mr Fletcher’s employment ceases in the second half of a fi nancial year. In this instance the amount of an STI payable will be calculated via reference to normal performance criteria. Mr Fletcher is not eligible to receive any STI amount with respect to a fi nancial year if employment ceases in the fi rst half of that fi nancial year.
In addition to the options issued pursuant to the terms of Mr Fletcher’s contract, in November 2003 shareholders approved the grant of an additional 1,500,000 options, exercisable in two equal tranches in September 2005 and 2006. The performance hurdles applying to these particular options were changed during the 2005 fi nancial year to make them consistent with the hurdles applying to performance shares. There was no impact on Mr Fletcher’s remuneration in any year as a result of the change to performance hurdles. Unless the Board decides otherwise, these options expire one year after the date on which Mr Fletcher ceases employment with the Company.
Mr Fletcher may resign from the Company at any time subject to the provision of 12 months notice. However, Mr Fletcher need not provide 12 months notice and may resign immediately in the event of a ‘fundamental change’ to his role (such as ceasing to be the most senior executive of the CML Group or a demonstrable inability to work with the Board).
As a result of Mr Fletcher’s contract being extended, and as approved by shareholders at the 2005 annual general meeting, 170,000 performance shares were allocated under the terms of the SEPSP. These performance shares impact the calculation of Mr Fletcher’s remuneration in the 2006, 2007 and 2008 fi nancial years.
n
n
n

50 Coles Myer Annual Report 2006
Remuneration report(continued)
Hani Zayadi – Group Managing Director Food, Liquor and Fuel (from 22 December 2004 until 20 March 2006)
Mr Zayadi’s current employment contract was entered into on 15 April 2005 and concluded on 31 July 2006 as a result of his departure from the CML Group. Mr Zayadi’s employment contract provided for:
reimbursement of reasonable costs incurred in relocating to Canada in the event of the termination of employment;
an entitlement to an amount of not less than 50% of the annual STI entitlement if employment is terminated by the Company other than for poor performance;
the issue of options that are subject to service hurdles only as a retention mechanism. The inclusion of a service hurdle refl ected the need to replicate terms and conditions ordinarily found in share option plans in North America; and
Mr Zayadi to be restrained from taking up a role with certain competitors for a 12-month period post termination of employment with the Company.
Dawn Robertson – Managing Director Myer (from 4 April 2002 until 31 May 2006)
Ms Robertson’s primary employment contract was entered into on 4 April 2002. In view of the CML Group’s consideration of the future of Myer during 2005, it became necessary for the primary employment contract to be complemented by an ancillary contract which was entered into on 9 November 2005. The ancillary contract became operable and certain terms of the primary contract lapsed upon the execution of a contract to divest the Myer business. In view of the successful divestment of the Myer business, the summary of contractual terms noted below refl ects those that applied in the normal course and those that became operable upon divestment.
The primary employment contract stated that Ms Robertson was:
entitled to a retention payment of $368,459 on 1 June 2007;
eligible to receive a pro-rata STI payment in the event of termination;
entitled to three business class air fares to the United States for herself and each of her dependent children each year until December 2006;
required to give 12 months notice of termination; and
restrained from taking up a role with certain competitors for a 12-month period post termination of employment with the Company.
The ancillary employment contract provided that in the event that the divestment of Myer was completed during the 2006 fi nancial year and provided Ms Robertson did not take up employment with the Myer group then Ms Robertson would:
have an entitlement to a retention bonus of $750,000;
n
n
n
n
n
n
n
n
n
n
cease to be employed by the Company and date of termination would be as at the date the Myer divestment occurred;
retain an entitlement to $368,459 which would otherwise have been due under the terms of the primary contract had employment by the CML Group continued to 1 June 2007;
have a 2006 STI entitlement determined in accordance with the terms in the ancillary contract such that the STI terms in the primary contract would lapse. The STI terms in the ancillary contract provided:
for a pro-rata STI payment calculated under the NPAT, brand EBIT and CSSG components (as detailed in Table 3). For the purposes of determining the eligibility for a NPAT STI component, a forecast of NPAT as at the date of termination was to be used. Eligibility to brand EBIT and CSSG STI components was to be determined on the basis of a comparison of actual to budgeted outcomes assessed as at the date of termination
for an entitlement to an amount determined by the Board in relation to the Customer and People STI components subject only to that amount being at least as much, in percentage terms, as the aggregate entitlement to NPAT, brand EBIT and CSSG STI components bore to the maximum amount available
that in the event that the STI as calculated by reference to the preceding paragraphs was less than 60% of TFR, a further amount was payable to ensure that an STI equivalent to 60% of TFR was paid
for a further bonus of $250,000 if, at the date of the completion of the Myer divestment, Myer’s EBIT for the 2006 fi nancial year was expected to be, in the opinion of the CEO, greater than $80 million
subject to the Board’s discretion, have share option entitlements vest as at the date of termination; and
cease to have any entitlement to performance shares, such that performance shares previously granted would lapse.
Fraser MacKenzie – Chief Financial Offi cer
Mr MacKenzie’s employment contract is for a minimum fi xed term to 30 April 2007. It provides for Mr MacKenzie to be:
eligible to receive a possible annual STI subject to Mr MacKenzie remaining in an eligible position for the full fi nancial year. If employment ceases on 30 April 2007 as a result of his retirement then he will be entitled to a pro-rata STI bonus for the 2007 fi nancial year; and
eligible to receive the balance of the remuneration otherwise payable over the period from the date of notice of termination to 30 April 2007 in the event that the Company terminates his employment prior to that date.
n
n
n
–
–
–
–
n
n
n
n

51Coles Myer Annual Report 2006
Tim Hammon – Chief Offi cer Corporate and Property Services
In addition to contractual outcomes disclosed elsewhere in this report, Mr Hammon’s employment contract provides for an annual STI subject to Mr Hammon remaining in an eligible position for the full fi nancial year and him remaining as an employee of the Company until 1 October following the completion of the annual bonus period which concludes at the end of each fi nancial year.
Larry Davis – Managing Director Kmart
In addition to contractual outcomes disclosed elsewhere in this report, Mr Davis’ employment contract provides for the reimbursement of reasonable costs incurred in relocating to the United States in the event of the termination of employment.
Further, Mr Davis’ options are subject to service hurdles only as a retention mechanism and were based on the need to replicate similar conditions that applied in North America in relation to share option plans.
Launa Inman – Managing Director Target
Ms Inman’s current employment contract was entered into on 12 December 2005 and is open ended. It provides for the:
reimbursement of any costs that may be incurred if Ms Inman were to re-locate to Geelong within a period of two years post 14 February 2005; and
payment of prescribed annual cash amounts and the issue of 22,000 performance shares per year for each year that Ms Inman remains with the Company up to the year ending 31 July 2008. In respect to the years ending July 2007 and 2008 the prescribed cash amounts are $150,000 and $200,000 respectively.
F. Details of Key Management Personnel remunerationThe details of remuneration paid or payable to KMP during the 2006 and 2005 fi nancial years are set out in Tables 7 and 8 respectively. Unless otherwise indicated, the individuals listed were regarded as KMP for the whole of the relevant fi nancial year.
n
n

52 Coles Myer Annual Report 2006
Remuneration report(continued)
Table 7 – Remuneration for the 2006 Financial Year
Key Management Personnel(8)
Short-term Post employment Termination payments
$
Totalcash-based remuner-
ation$
Non-cash, share-based remuneration
Total remuner-
ation$
Salary and fees
$
Short-term incentives
$
Non-monetary benefi ts(1)
$
Other(2) $
Super-annuation(3)
$
Retirement benefi ts
$
Perform-ance Shares
$
Options$
Non-executive Directors
R. Allert 397,201 – – 5,825 35,748 61,817 – 500,591 – – 500,591
P. Akopiantz 120,799 – – 5,825 40,878 8,964 – 176,466 – – 176,466
K. Barton 132,577 – – 5,825 26,099 – – 164,501 – – 164,501
W. Gurry(5) 138,318 – – 5,825 12,449 (2,700) – 153,892 – – 153,892
T. Hodgson 170,069 – – 5,825 15,306 – – 191,200 – – 191,200
S. McPhee 132,577 – – 5,825 26,099 – – 164,501 – – 164,501
M. Myer 120,799 – – 5,825 40,878 3,827 – 171,329 – – 171,329
M. Wemms 97,997 – – 5,825 67,003 – – 170,825 – – 170,825
B. Hutchinson 111,361 – – 4,977 24,189 – – 140,527 – – 140,527
Subtotal 1,421,698 – – 51,577 288,649 71,908 – 1,833,832 – – 1,833,832
Other KMP
J. Fletcher 2,298,864 1,516,858 4,573 – 100,587 – – 3,920,882 334,978 316,348 4,572,208
H. Zayadi(9, 10) 1,785,964 758,160 290,666 – – – 2,631,880 5,466,670 443,434 134,237 6,044,341
D. Robertson(8, 10) 1,244,753 1,144,138 130,050 1,000,000 10,116 – 1,863,321 5,392,378 – 2,822,959 8,215,337
L. Davis(10) 1,271,073 413,100 38,806 – 108,920 – – 1,831,899 337,656 123,633 2,293,188
T. Hammon(7, 10) 799,686 517,080 – 300,000 80,673 – – 1,697,439 165,138 54,868 1,917,445
F. MacKenzie(10) 715,317 560,000 – – 107,606 – – 1,382,923 89,875 60,071 1,532,869
L. Inman 657,606 449,500 29,287 200,425 53,088 – – 1,389,906 186,274 111,283 1,687,463
Subtotal 8,773,263 5,358,836 493,382 1,500,425 460,990 – 4,495,201 21,082,097 1,557,355 3,623,399 26,262,851
Total remuneration 10,194,961 5,358,836 493,382 1,552,002 749,639 71,908 4,495,201 22,915,929 1,557,355 3,623,399 28,096,683
Footnotes in relation to remuneration paid in the 2005 and 2006 fi nancial years (as disclosed in Table 7 and 8).(1) Non-monetary amounts include costs relating to fringe benefi ts which are available as part of normal salary packaging arrangements and may include motor vehicles,
accommodation, travel, insurance and tax planning fees. (2) The other benefi ts fi gures include sign on bonuses and payments for continued service. There will be additional benefi ts in future years if continued service conditions
are fulfi lled. Other benefi ts have been presented on an accruals basis in accordance with Accounting Standard requirements. Where a KMP’s employment is terminated but they nonetheless receive an amount in lieu of a payment for continued service, that amount is included as a component of the KMP’s termination remuneration.
(3) The CML Group is not required to make superannuation contributions in respect to overseas nationals who hold certain business visas.(4) Mr Leibler retired from offi ce on 18 November 2004. The amount of $5,818 shown in the 2005 remuneration table represents the retirement benefi t accrued during
the 2005 fi nancial year through to the date of his retirement. The actual retirement amount received by Mr Leibler on 18 November 2004 was $374,560, having been accrued during Mr Leibler’s tenure as a Director. Mr Leibler’s fees were paid to Arnold Bloch Leibler, a fi rm of which he is a partner. Accordingly, superannuation contributions were not payable.
(5) Mr Gurry previously received fees for acting as Chairman of the Coles Myer Superannuation Fund. His retirement from this position in 2002 resulted in a decrease in his anticipated retirement benefi t compared with the prior year.
(6) Mr Cain, a former Group Managing Director Food, Liquor and Fuel, ceased employment on 3 January 2005. His termination benefi ts included a termination payment of 12 months salary ($1,800,000) in lieu of notice. CML also paid $10,000 for legal fees and $20,350 for fi nancial advice. In addition, Mr Cain received an amount of $282,639 in exchange for agreeing to extend his restraint period from 12 months to 18 months. Mr Cain’s 2005 termination benefi t also includes an amount of $249,395, being the unamortised portion of options vested. Mr Cain ceased acting as Group Managing Director Food, Liquor and Fuel on 22 December 2004 and ceased employment with the Company on 3 January 2005.

53Coles Myer Annual Report 2006
Table 8 – Remuneration for the 2005 Financial Year
Key Management Personnel(8)
Short-term Post employment Terminationpayments
$
Totalcash-based remuner-
ation$
Non-cash, share-based remuneration
Totalremuner-
ation$
Salary and fees
$
Short-term incentives
$
Non-monetary benefi ts(1)
$
Other(2) $
Super-annuation(3)
$
Retirement benefi ts
$
Perform-ance Shares
$
Options$
Non-executive Directors
R. Allert 331,975 – – 5,825 29,878 283,070 – 650,748 – – 650,748
P. Akopiantz 120,700 – – 5,825 10,863 35,047 – 172,435 – – 172,435
K. Barton 139,633 – – 5,825 12,567 – – 158,025 – – 158,025
W. Gurry(5) 115,675 – – 5,825 10,411 (8,227) – 123,684 – – 123,684
T. Hodgson 162,706 – – 5,825 14,644 – – 183,175 – – 183,175
S. McPhee 139,633 – – 5,825 12,567 – – 158,025 – – 158,025
M. Myer 120,700 – – 5,825 10,863 16,012 – 153,400 – – 153,400
M. Wemms 144,243 – – 5,825 12,982 – – 163,050 – – 163,050
M. Leibler(4) 36,000 – – 1,821 – 5,818 – 43,639 – – 43,639
Subtotal 1,311,265 – – 48,421 114,775 331,720 – 1,806,181 – – 1,806,181
Other KMP
J. Fletcher 2,267,357 1,549,218 2,379 – – – – 3,818,954 – 608,481 4,427,435
H. Zayadi(10) 1,637,715 821,690 312,002 146,771 – – – 2,918,178 25,407 293,812 3,237,397
D. Robertson(10) 1,416,807 377,408 252,283 260,992 11,631 – – 2,319,121 – 362,823 2,681,944
L. Davis(10) 1,247,957 800,000 125,015 – – – – 2,172,972 25,407 263,183 2,461,562
T. Hammon(10) 778,849 430,353 – – 11,631 – – 1,220,833 14,509 109,481 1,344,823
F. MacKenzie 778,732 448,826 – – 11,631 – – 1,239,189 – 104,014 1,343,203
L. Inman 548,398 361,671 23,734 – 39,080 – – 972,883 – 89,260 1,062,143
S. Cain(6, 10) 749,518 – – 1,500,000 – – 2,362,384 4,611,902 – – 4,611,902
Subtotal 9,425,333 4,789,166 715,413 1,907,763 73,973 – 2,362,384 19,274,032 65,323 1,831,054 21,170,409
Total remuneration 10,736,598 4,789,166 715,413 1,956,184 188,748 331,720 2,362,384 21,080,213 65,323 1,831,054 22,976,590
(7) Mr Hammon’s other remuneration amount includes a special $300,000 discretionary bonus which was awarded in recognition of Mr Hammon’s signifi cant contribution to the Myer sale process. For the purposes of this report and particularly Tables 9 and 10, the amount is not considered as an STI as it was not contemplated in Mr Hammon’s 2006 incentive plan.
(8) Ms Robertson’s remuneration for the 2006 fi nancial year and up to 31 May 2006 (as disclosed in Table 7) included the following amounts:$1,827,983 in lieu of notice and in lieu of Ms Robertson’s employment not extending beyond 1 June 2007 (of which $30,706 had been accrued as remuneration in the prior year);a $750,000 retention bonus and a $250,000 Myer divestment transaction completion bonus. The aggregate of these amounts is disclosed as other remuneration. For the purposes of this report and particularly Tables 9 and 10, neither of these amounts are considered to be an STI as they were not contemplated in Ms Robertson’s 2006 incentive plan;An STI of $1,144,138;$35,338 as a reasonable allowance to cover Ms Robertson’s relocation to the United States; and$2,822,959 which was attributable to the value of options held by Ms Robertson which the Board, in its discretion, decided would vest in favour of Ms Robertson as part of her termination entitlement (note, the value of the options has been disclosed in Table 7 as a component of share based remuneration). In the ordinary course, these particular options would potentially have vested in the 2007 fi nancial year subject to the achievement of the relevant performance hurdles. The value attributed to these options does not represent a cash cost to CML.
(9) Consistent with Mr Zayadi’s role as Managing Director Food, Liquor and Fuel becoming redundant in March 2006, Mr Zayadi received termination entitlements which included $1,872,000 in lieu of notice, a further amount of $748,800 which was contractually payable on separation of employment and an amount of $11,080 in relation to a reimbursement of taxation adviser fees. In addition, the Board, in its discretion, decided that options that were otherwise due to vest during the 2007 fi nancial year would vest as at the date of Mr Zayadi’s termination. These options were originally subject to a length of service hurdle only and were not subject to TSR or EPS performance hurdles. The value attributed to these options does not represent a cash cost to CML.
(10) In addition to the Chief Executive Offi cer and in accordance with Section 300A(1)(c) of the Corporations Act 2001, these fi ve executives received the highest remuneration amounts in respect to each of the 2005 and 2006 fi nancial years.
n
n
n
n
n

54 Coles Myer Annual Report 2006
Table 9 shows the actual STI payment as a percentage of the payment that would have been due had the stretch STI criteria been met.
Table 9 – Extent of STI entitlement
KMP 2006 2005
Actual STI payment $(2)
Actual STI payment as a
% of stretch STI potential
% of stretch STI potential not
received
Actual STI payment $
Actual STI payment as a
% of stretch STI potential
% of stretch STI potential not
received
J. Fletcher 1,516,858 53% 47% 1,549,218 57% 43%
H. Zayadi 758,160 41% 59% 821,690 58% 42%
D. Robertson(1) 1,144,138 79% 21% 377,408 32% 68%
L. Davis 413,100 38% 62% 800,000 74% 26%
T. Hammon(1) 517,080 78% 22% 430,353 66% 34%
F. MacKenzie 560,000 70% 30% 448,826 59% 41%
L. Inman 449,500 78% 22% 361,671 70% 30%
(1) Ms Robertson’s actual 2006 STI amount excludes $750,000 paid as a retention bonus and $250,000 paid in relation to Ms Robertson’s contribution to the divestment of Myer. Similarly, Mr Hammon’s actual 2006 STI amount excludes $300,000 paid in relation to Mr Hammon’s contribution to the divestment of Myer. These amounts have been excluded on the basis that in each instance, the amounts ultimately paid were not contemplated in the relevant individual’s original potential stretch STI amount (being the maximum STI that was potentially available in the ordinary course of business).
(2) With the exception of respective STI amounts paid at the time when termination entitlements were settled in relation to Ms Robertson and Mr Zayadi, all other STI amounts in respect to the 2006 fi nancial year will be paid subsequent to year end. There is no retesting of the STI entitlement and the unvested portion is forfeited.
G. At risk remuneration
Table 10 details the relative proportion of remuneration paid in 2006 to KMP (other than Non-executive Directors) which was dependent upon the achievement of specifi c performance levels versus that which was not. No component of the remuneration of Non-executive Directors is at risk.
Table 10 – The extent to which remuneration is at risk
KMP Fixed remuneration as at % of total remuneration(1)
Total actual at risk remuneration
as a % of total remuneration(1)
At risk components as a % of total remuneration(1)
STI Options Performance shares
J. Fletcher 53% 47% 33% 7% 7%
H. Zayadi 61% 39% 22% 4% 13%
D. Robertson 61% 39% 33% 6% 0%
L. Davis 62% 38% 18% 5% 15%
T. Hammon 54% 46% 32% 4% 10%
F. MacKenzie 54% 46% 36% 4% 6%
L. Inman 56% 44% 27% 6% 11%
(1) For the purposes of calculating the percentages disclosed in Table 10:Total remuneration excludes amounts payable on termination and the value of options which vest on the termination of KMP. On the same basis, fi xed remuneration excludes amounts referrable to termination remuneration entitlements;At risk remuneration excludes bonus amounts paid to Mr Hammon ($300,000) and Ms Robertson ($250,000), being amounts that were not contemplated in their original 2006 STI plans (respectively); andFixed remuneration includes amounts payable to Ms Robertson ($750,000) and Ms Inman ($200,425). In each instance the payment of the amount was only contingent on service being rendered over a specifi ed period of time and as such is not considered to be at risk.
These adjustments have been made to refl ect total remuneration, fi xed remuneration and at risk remuneration payable in the ordinary course of business excluding the impact of termination events and bonuses awarded at the discretion of the Board and which were not contemplated in original 2006 STI plans.
n
n
n
Remuneration report(continued)

55Coles Myer Annual Report 2006
H. Share-based remuneration
Details of the terms and conditions of each grant of options and performance shares provided to KMP and which enter into the calculation of their remuneration in the current and future reporting periods are detailed in Table 11.
Table 11 – KMP’s option and performance share entitlements
KMP Type Grant date
Exercise price
Expiry date(4)
Balance as at 31 July
2005
Granted during the
year
Exercised during the
year
Lapsed during the
year
Balance as at 30 July
2006
Vested during the
year
Vested andexercisable at 30 July
2006(3)
Future fi nancial years that grant
may vest
J. Fletcher Opt Sep ‘01 $6.33 Cess+1 1,500,000 – 1,000,000 – 500,000 500,000 – 500,000: 2006/07
Opt Nov ‘03 $7.53 Cess+1 1,500,000 – – – 1,500,000 375,000 375,000 1,125,000: 2006/07
PS Nov ‘05 – Sep ‘08 – 170,000 – – 170,000 – – 170,000: 2007/08
H. Zayadi(1) Opt Aug ‘01 $6.21 Cess+1 1,000,000 – 1,000,000 – – 1,000,000 –
PS Jun ‘05 – Sep ‘07 76,000 – – (25,121) 50,879 – – 50,879: 2007/08
PS Dec ‘05 – Sep ‘08 – 76,000 – (50,597) 25,403 – – 25,403: 2007/08
D. Robertson(2) Opt May ‘02 $6.44 Nov ‘07 1,500,000 – 1,500,000 – – 1,500,000 –
PS Dec ‘05 – Sep ‘08 – 76,000 – (76,000) – – –
L. Davis Opt Sep ‘01 $6.28 Cess+1 600,000 – 300,000 – 300,000 300,000 – 300,000: 2006/07
PS Jun ‘05 – Sep ‘07 76,000 – – – 76,000 – – 76,000: 2007/08
PS Dec ‘05 – Sep ‘08 – 76,000 – – 76,000 – – 76,000: 2008/09
T. Hammon Opt Feb ‘02 $7.66 Nov ‘06 745,000 – 500,000 – 245,000 149,000 96,000 149,000: 2006/07
PS Jun ‘05 – Sep ‘07 43,400 – – – 43,400 – – 43,400: 2007/08
PS Dec ‘05 – Sep ‘08 – 28,000 – – 28,000 – – 28,000: 2008/09
F. MacKenzie Opt Sep ‘02 $5.88 Nov ‘07 516,000 – 172,000 – 344,000 172,000 – 172,000:2006/07,
172,000: 2007/08
PS Dec ‘05 – Sep ‘08 – 50,000 – – 50,000 – – 50,000: 2008/09
L. Inman Opt Feb ‘02 $7.66 Nov ‘06 68,000 – 34,000 – 34,000 34,000 – 34,000: 2006/07
Opt Jul ‘04 $8.43 Nov ‘09 210,000 – – – 210,000 42,000 42,000 42,000: 2006/07,
42,000: 2007/08,
42,000: 2008/09,
42,000: 2009/01
PS Jan ‘05 – Sep ‘07 14,000 – – – 14,000 – – 14,000: 2007/08
PS Jun ‘05 – Sep ‘07 6,700 – – – 6,700 – – 6,700: 2007/08
PS Dec ‘05 – Sep ‘08 – 50,000 – – 50,000 – – 50,000: 2008/09
PS Dec ‘05 – Sep ‘09 – 22,000 – – 22,000 – – 22,000: 2009/10
PS Dec ‘05 – Sep ‘10 – 22,000 – – 22,000 – – 22,000: 2010/11
(1) Subsequent to the conclusion of the fi nancial year, and on 31 July 2006, Mr Zayadi’s employment ceased. On 31 July 2006, Mr Zayadi’s entitlement to 152,000 performance shares previously issued to him was reduced on a pro-rata basis such that Mr Zayadi had, as at that date, an entitlement to 76,282 performance shares. The vesting of these performance shares is contingent on performance hurdles being met as at 28 January 2007. In addition, the terms of Mr Zayadi’s termination agreement also resulted in a revision to the terms under which options were held by Mr Zayadi. 500,000 options which were originally due to vest in the 2007 fi nancial year vested unconditionally prior to balance date. The value of performance shares and options enters into the calculation of Mr Zayadi’s 2006 remuneration but only to the extent that value was not previously recognised in remuneration attributed to Mr Zayadi in an earlier year. The value attributed to these options does not represent a cash cost to CML.
(2) Ms Robertson’s employment contract provided that if the sale of Myer was concluded during 2006 and if Ms Robertson did not accept the new Myer Group’s offer of employment, then Ms Robertson’s outstanding share option entitlements would, subject only to the Board’s discretion, vest as at the date of Ms Robertson’s termination. The Board decided that two tranches of 500,000 share options that were otherwise scheduled to vest during both of the 2007 and 2008 fi nancial years would vest early as at the date of Ms Robertson’s termination. Ms Robertson has since exercised these options, and as result acquired 1,000,000 shares in the Company. The value attributed to these options has been included in the determination of Ms Robertson’s termination remuneration amount, as disclosed in Table 7. The value attributed to these options does not represent a cash cost to CML. Ms Robertson’s employment contract also provided that Ms Robertson’s performance shares would lapse as at the date of termination and accordingly do not enter into the calculation of Ms Robertson’s 2006 remuneration.
(3) There are no options on issue which have vested but which are contractually unable to be exercised.(4) Cess +1 denotes that the options expire one year after the cessation of an individual’s employment.

56 Coles Myer Annual Report 2006
Remuneration report(continued)
In accordance with section 300A(1)(e) of the Corporations Act 2001, Table 12 shows the value of performance shares granted during the year as part of certain KMP’s remuneration, the value of any options exercised by KMP during the year (calculated as at the date of exercise) and the value of any options held by those KMP that lapsed during the year (calculated as at the date of lapse). No new options were granted to any KMP during the year.
Table 12 – The value of performance shares and options granted
KMP Equity instrument
Grant date Value of option or performance share
granted(1)
$
Value at date of exercise or acquisition(2)
$
Value at date of lapse(2)
$
Total$
2006
J. Fletcher Option Sep ’01 – 3,490,000 – 3,490,000
Perf’ Share Nov ‘05 1,228,250 – – 1,228,250
H. Zayadi Option Aug ’01 – 4,767,880 – 4,767,880
Perf’ Share Jun ‘05 – – (285,626) (285,626)
Perf’ Share Dec ‘05 546,440 – (575,288) (28,848)
D. Robertson Option May ’02 – 6,879,000 – 6,879,000
Perf’ Share Dec ‘05 546,440 – (864,120) (317,680)
L. Davis Option Sep ’01 – 1,284,000 – 1,284,000
Perf’ Share Dec ‘05 546,440 – – 546,440
T. Hammon Option Feb ’02 – 1,198,000 – 1,198,000
Perf’ Share Dec ‘05 201,320 – – 201,320
F. MacKenzie Option Sep ‘02 – 746,480 – 746,480
Perf’ Share Dec ‘05 359,500 – – 359,500
L. Inman Option Feb ‘02 – 88,400 – 88,400
Perf’ Share Dec ‘05 639,810 – – 639,810
2005
J. Fletcher Option Sep ’01 – 2,990,000 – 2,990,000
H. Zayadi Option Aug ’01 – 1,570,000 – 1,570,000
Perf’ Share Jun ‘05 427,500 – – 427,500
D. Robertson Option May ’02 – 3,318,621 – 3,318,621
L. Davis Option Sep ’01 – 2,994,000 – 2,994,000
Perf’ Share Jun ‘05 427,500 – – 427,500
T. Hammon Option Dec ‘98 – 212,850 – 212,850
Option Oct ‘01 – 473,000 – 473,000
Option Apr ‘00 – – (346,150) (346,150)
Perf’ Share Jun ‘05 244,125 – – 244,125
L. Inman Option Feb ‘02 – 165,920 – 165,920
Option Apr ‘00 – – (150,500) (150,500)
Perf’ Share Jun ‘05 116,438 – – 116,438
F. MacKenzie Option Sep ‘02 – 1,300,320 – 1,300,320
S. Cain Option Aug ‘03 – – (5,530,387) (5,530,387)
(1) The value of each option and performance share granted has been determined in accordance with AASB 2.(2) The value of each option exercised is based on the market price of the Company’s share as at the date of exercise less the exercise price of the option. Where an option
has lapsed out of the money, the value was determined as the difference between the exercise price of the option less the market price of the Company’s shares as at the date the option lapsed. The value of each performance share that vested is equivalent to the market price of the Company’s shares on the date the share was acquired by an executive.

57 Coles Myer Annual Report 2006
Directors’ declaration
The Directors’ declare that in their opinion, the concise fi nancial report of the CML Group for the year ended 30 July 2006 as set out in pages 27 to 38 complies with Australian Accounting Standard AASB 1039 “Concise Financial Reports”. The fi nancial statements and specifi c disclosures included in this concise fi nancial report have been derived from the full fi nancial report for the year ended 30 July 2006. The concise fi nancial report cannot be expected to provide as full an understanding of the fi nancial performance, fi nancial position, and fi nancing and investing activities of the CML Group as the full fi nancial report, which is available on request. This declaration is made in accordance with a resolution of the Directors of Coles Myer Ltd.
Rick AllertChairman
John FletcherManaging Director and Chief Executive Offi cer
Melbourne21 September 2006
Auditor’s independence declaration
As lead auditor for the audit of Coles Myer Ltd for the year ended 30 July 2006, I declare that to the best of my knowledge and belief, there have been:
a) no contraventions of the auditor independence requirements of the Corporations Act 2001 in relation to the audit; and
b) no contraventions of any applicable code of professional conduct in relation to the audit.
This declaration is in respect of Coles Myer Ltd and the entities it controlled during the year.
Dale McKee
PartnerPricewaterhouseCoopers
Melbourne21 September 2006

58 Coles Myer Annual Report 2006
Independent audit report to the members of Coles Myer Ltd
Matters relating to the electronic presentation of the audited fi nancial report
This audit report relates to the concise fi nancial report of Coles Myer Ltd. (the Company) for the fi nancial year ended 30 July 2006 included on the Coles Myer Ltd. web site. The Company’s Directors are responsible for the integrity of the Coles Myer Ltd. web site. We have not been engaged to report on the integrity of this web site. The audit report refers only to the concise fi nancial report identifi ed below. It does not provide an opinion on any other information which may have been hyperlinked to/from the concise fi nancial report. If users of this report are concerned with the inherent risks arising from electronic data communications they are advised to refer to the hard copy of the audited concise fi nancial report to confi rm the information included in the audited concise fi nancial report presented on this web site.
In conducting our audit, we followed applicable independence requirements of Australian professional ethical pronouncements and the Corporations Act 2001.
Audit opinion
In our opinion, the concise fi nancial report of Coles Myer Ltd for the year ended 30 July 2006 complies with Australian Accounting Standard AASB 1039: Concise Financial Reports.
This opinion must be read in conjunction with the rest of our audit report.
Scope
The concise fi nancial report and directors’ responsibilityThe concise fi nancial report comprises the consolidated balance sheet, consolidated income statement, consolidated cash fl ow statement, consolidated statement of recognised income and expenses, notes to the concise fi nancial statements and the Directors’ Declaration for Coles Myer Ltd (the Company) for the year ended 30 July 2006.
The Directors of the Company are responsible for the preparation and presentation of the fi nancial report in accordance with Australian Accounting Standard AASB 1039: Concise Financial Reports.
Audit approachWe conducted an independent audit of the concise fi nancial report in order to express an opinion on it to the members of the Company. Our audit was conducted in accordance with Australian Auditing Standards, in order to provide reasonable assurance as to whether the concise fi nancial report is free of material misstatement. The nature of an audit is infl uenced by factors such as the use of professional judgement, selective testing, the inherent limitations of internal control, and the availability of persuasive rather than conclusive evidence. Therefore, an audit cannot guarantee that all material misstatements have been detected.
We also performed an independent audit of the full fi nancial report of the Company for the fi nancial year ended 30 July 2006. Our audit report on the full fi nancial report was signed on 21 September 2006, and was not subject to any qualifi cation.
In conducting our audit of the concise fi nancial report, we performed procedures to assess whether in all material respects the concise fi nancial report is presented fairly in accordance with Australian Accounting Standard AASB 1039: Concise Financial Reports.
We formed our audit opinion on the basis of these procedures, which included:
testing that the information included in the concise fi nancial report is consistent with the information in the full fi nancial report; and
examining, on a test basis, information to provide evidence supporting the amounts and other disclosures in the concise fi nancial report which were not directly derived from the full fi nancial report.
Our procedures include reading the other information in the Annual Report to determine whether it contains any material inconsistencies with the concise fi nancial report.
Independence
In conducting our audit, we followed applicable independence requirements of Australian professional ethical pronouncements and the Corporations Act 2001.
n
n
PricewaterhouseCoopers Dale McKeePartner
Melbourne21 September 2006

Ordinary shares Number %
1. National Nominees Limited 109,925,390 9.22%
2. Westpac Custodian Nominees Limited 104,186,704 8.74%
3. J. P. Morgan Nominees Australia Limited 100,765,498 8.45%
4. Premier Investments Limited 69,500,000 5.83%
5. Citicorp Nominees Pty Ltd 59,648,149 5.00%
6. ANZ Nominees Limited 53,990,908 4.53%
7. M F Custodians Ltd 30,563,255 2.56%
8. RBC Dexia Investor Services Australia Nominees Pty Limited 22,053,041 1.85%
9. Cogent Nominees Pty Limited 20,950,017 1.76%
10. T.W. Hedley Pty. Ltd. 11,271,200 0.95%
11. Australian Foundation Investment Company Limited 9,849,599 0.83%
12. UBS Nominees Pty Ltd 9,284,762 0.78%
13. Coles Myer Employee Share Plan Ltd. 7,569,430 0.63%
14. Karedis Nominees Pty Limited 7,536,000 0.63%
15. HSBC Custody Nominees (Australia) Limited 6,026,759 0.51%
16. AMP Life Limited 5,628,550 0.47%
17. Australian Reward Investment Alliance (ARIA) 4,860,388 0.41%
18. Queensland Investment Corporation 4,132,388 0.35%
19. Mr Peter Alexander Brown 3,898,635 0.32%
20. Perpetual Trustee Company Limited 3,486,775 0.28%
645,127,448 54.10%
(Number of fully paid ordinary shares: 1,192,473,404)
59Coles Myer Annual Report 2006
Top 20 shareholdersas at 8 September 2006

Substantial shareholders
The names of substantial shareholders in CML and the number of shares in which each has an interest as disclosed in substantial shareholder notices given to CML as at 8 September 2006 were as follows:
S. Lew Custodians Pty. Ltd. and its associates 69,530,160
Distribution of holdings
Number of holders (and number of securities) by size of holding at 8 September 2006 were as follows:
Size of holding
Ordinary sharesExecutive party
paid shares Executive share options Performance shares
Holders Securities Holders Securities Holders Securities Holders Securities
1–1,000* 256,822 151,567,043 2 2,000
1,001–5,000 82,635 166,510,423 2 5,000 25 77,012
5,001–10,000 8,857 61,687,769 1 6,000 201 1,251,727 52 367,267
10,001–100,000 4,959 100,236,344 284 9,050,704 102 2,238,667
100,001 and over 212 712,471,825 17 5,170,200 2 322,000
353,485 1,192,473,404 3 11,000 502 15,472,631 183 3,006,946
*3,396 ordinary shareholders holding a total of 45,584 shares held less than the marketable parcel of $500
60 Coles Myer Annual Report 2006
Shareholder analysis
Coles Myer Annual Report 2006
Shareholder information
Shareholder enquiries
Investors seeking information about their shareholding should contact the Company’s Share Registry. Shareholders should have their Securityholder Reference Number (SRN) or Holder Identifi cation Number (HIN) available when contacting the Share Registry.
Share Registry contact details
Link Market Services LimitedLevel 12, 680 George Street Sydney NSW 2000Locked Bag A14, Sydney South NSW 1235
Telephone (within Australia): 1300 130 278Telephone (outside Australia): +61 2 8280 7768Fax: +61 2 9287 0309Email: [email protected]
Shareholders on-line
www.linkmarketservices.com.au/colesmyer
The Link Market Services website provides CML shareholders with the following information:
balances of current and previous holdings;
your current communication election;
your dividend information; and
whether your TFN or ABN has been quoted.
You can also access dividend statements on-line and update your details.
Voting rights
Fully paid ordinary shares – entitle the holder to one vote, except on a poll where each share is entitled to one vote; and
Executive partly paid ordinary shares – no vote until fully paid.
Dividends
A fully franked fi nal dividend of 22.5 cents per share will be paid on all fully paid ordinary shares on the Share Registry at 20 October 2006 (record date). The dividend is payable on 13 November 2006. Shareholders may have their dividends paid directly into any bank or building society account within Australia by advising their details to the Company’s Share Registry.
Company Secretaries
Tim Hammon, LLB, BComm
Mr Hammon is Chief Offi cer, Corporate and Property Services. Prior to joining CML in 1996 he had 18 years experience with the law fi rm Mallesons Stephen Jaques, including several years as Managing Partner of its Melbourne and Sydney offi ces.
Peter Patterson, LLM, FCIS
Mr Patterson is Deputy Company Secretary. Prior to joining CML in 2003, his previous roles included Company Secretary and General Counsel of Bonlac Foods Limited and Crane Group Limited.
n
n
n
n
n
n
Coles Myer Ltd Registered Offi ce
800 Toorak RoadTooronga Victoria 3146, Australia
Telephone: +61 3 9829 3111Facsimile: +61 3 9829 6787
Website
The Annual, Full Financial and Corporate Social Responsibility Reports are available on our website:
www.colesmyer.com
Coles Myer Investor Relations
800 Toorak RoadTooronga Victoria 3146, Australia.
Email: [email protected]
Telephone: +61 3 9829 4521Facsimile: +61 3 9829 5424
2006 Annual Report
The 2006 Annual Report is a concise summary of our activities and fi nancial position. The Concise Financial Statements are derived from the Financial Report. These statements cannot be expected to provide as full an understanding of the fi nancial performance, fi nancial position and investing activities of the CML Group as the Financial Report. You may obtain a copy of the Financial Report (see above for contact details).
In the Annual Report 2006, the expression ‘CML Group’ or ‘the Company’ refers to Coles Myer Ltd and its controlled entities as a whole.
The fi nancial year is for the 52 weeks ended 30 July 2006. Reference in this report to ‘a year’ is to the fi nancial year ended 30 July 2006 unless otherwise stated. All fi gures are expressed in Australian currency unless otherwise stated.
Revenues and expenses are recognised net of the amount of Goods and Services Tax.
Coles Myer Ltd ABN: 11 004 089 936
Printed on Monza Recycled Art Paper, with 55% recycled content and balance from sustainable plantation timbers. No elemental chlorine was used during paper manufacture
How to contact us